naosite: nagasaki university's academic output...
TRANSCRIPT

This document is downloaded at: 2018-05-13T17:51:56Z
Title Explicit vs. Implicit Instruction: Investigating Backchannel Behavior in theJapanese EFL Classroom
Author(s) Cutrone, Pino
Citation Asian EFL Journal, 18(2), pp.9-88; 2016
Issue Date 2016-06
URL http://hdl.handle.net/10069/37373
Right This is a preprint of an article submitted for consideration in the Asian EFLJournal e 2016 © Asian EFL Journal.
NAOSITE: Nagasaki University's Academic Output SITE
http://naosite.lb.nagasaki-u.ac.jp

Explicit vs. Implicit Instruction:
Investigating Backchannel Behavior in the Japanese EFL Classroom
Pino Cutrone
Nagasaki University, Japan
Bio Data
Pino Cutrone has been teaching in Japan for fifteen years and is currently an Associate
Professor at Nagasaki University. He received his PhD in Applied Linguistics from the
University of Reading and has published widely in his field. His research interests include
intercultural pragmatics, sociolinguistics and EFL pedagogy.
Abstract
This study examined the effect of explicit and implicit instruction on Japanese EFL
learners’ listening behavior over the course of 16 weeks. 30 university student participants
were divided into three groups and given tests at three points in time: at the beginning, at
the eight-week mark, and at the 16-week mark of this study. Each of these tests involved
participating in an intercultural conversation, completing a questionnaire and being
interviewed. In one group, the explanations of rules were given explicitly by a teacher; in
the second, implicit instruction evolved mainly from peer group discussions and
conversational practice with native English speakers. The third group was a control. The
findings demonstrate that both explicit and implicit methods had a positive effect; however,
overall, the Explicit group generally outpaced the Implicit group. These findings, thus,
provide support for the explicit teaching of listening behavior in the Japanese EFL context.
Keywords: EFL pedagogy in the Japanese context, intercultural pragmatics, explicit versus
implicit learning, listenership, backchannel behavior

2
Introduction
Since English is generally regarded as the lingua franca for communication used in such
fields as international politics, academia, business and science, more people around the
world are studying EFL/ESL every day. Few nations have expended greater resources
encouraging their citizens to study English than Japan, yet the results to date have been
largely unsatisfactory (Nikolova, 2008), particularly concerning oral skills (Alun, 2008). A
key aspect of effective oral communication is being able to give effective feedback to one’s
interlocutor (O’Keeffe, McCarthy & Carter, 2007), and this is a specific area in which the
writer contends that Japanese EFL learners (JEFLs hereafter) have experienced problems
(Cutrone, 2005). It is becoming increasingly clear that what constitutes effective feedback
seems opens to interpretation, and there is potential for cross-cultural pragmatic failure and
misunderstanding when listening styles differ. In an attempt to inform language pedagogy
in the JEFL context, the main aim of this article is to determine how to improve this aspect
of JEFLs’ English.
Examining Listening Behavior from a Research Perspective
There exist several terms in the research literature to describe what is meant by listening
behavior. For instance, McCarthy (2002, 2003) uses the term “good listenership” to
describe the active responses that listeners produce in conversations. Other researchers, as
Fujimoto (2007) notes, have used one of the 24 terms on her extensive list to describe
various elements of listening behavior. The term, backchannel, coined by Yngve (1970) is
perhaps the one linguists seem to associate most often with listening behavior and will,
thus, be the focus of the analysis in this paper. Yngve (1970) describes a backchannel as
follows:
When two people are engaged in conversation, they generally take turns...In fact, both the person who has the turn and his partner is simultaneously engaged in both speaking and listening. This is because of the existence of what I call the backchannel, over which the person who has the turn receives short messages such as yes and un-huh without relinquishing the turn. (p. 568)
Although some researchers such as Oreström (1983) continue to follow Yngve’s (1970)

3
original definition, others researchers such as Duncan (1974) and Duncan and Fisk (1977)
extend what is meant by the term backchannel to include sentence completions, requests for
clarification, brief statements, and non-verbal responses such as head nods and headshakes.
In the studies most closely resembling this current project (in terms of research design and
in the use of Japanese participants), Cutrone (2005), Maynard (1997) and White (1989)
differed slightly in their identification of backchannels. White (1989), focusing solely on
non-word vocalizations such as mhm, yeah, uh-huh, oh, and hmm, limited her analysis to
audio recording and thus did not include nonverbal behavior. Cutrone (2005) and Maynard
(1986, 1987, 1989, 1990, 1997), on the other hand, used a broader identification of
backchannels as proposed by Duncan and Fiske (1977) in that they too include sentence
completions, requests for clarification, brief statements, and nonverbal items such as head
nods and laughing. As the researcher agrees that brief utterances and nonverbal behavior by
the listener are indeed backchannels in that they serve as messages to the primary speaker,
this broader definition is used to identify backchannels in this current research project.
Listener Backchannels vis-à-vis Speaking Turns
A major issue in identifying a backchannel is determining whether a particular behavior
constitutes a backchannel or a separate turn. According to Maynard (1986, p. 1084), much
of the confusion may stem from distinguishing between “having a turn” and “having the
floor” and can be attributed to self-contradictions in Yngve’s (1970) definition. Yngve’s
definition of a backchannel is given in terms of “not relinquishing a turn”; however, he
cites the following example as backchannel behavior:
In one case, what looked like backchannel activity consisted of filling in needed personal background so that the person having the floor could continue. This went on for about thirty seconds and involved a number of sentences. It is interesting to note that this extensive backchannel activity was in turn provided with back-back channel activity of the ‘uh-huh’ variety. (p. 568)
In this quote, Yngve appears to be identifying backchannel behavior on the basis of holding
the floor, rather than having the turn. Thus, longer utterances such as You’re ready to go
then in response to the primary speaker’s talk can cause confusion because this utterance
may allow the primary speaker to continue holding the floor, yet it appears to be a speaking

4
turn in itself. Consequently, what starts as a backchannel can actually end up as a turn, if
the primary speaker shows no willingness to continue speaking. To differentiate between
backchannels and turns, this study identifies backchannels in the context of Markel’s
(1975) turn-taking system, which he describes as follows:
A speaking turn begins when one interlocutor starts solo talking. For every speaking turn there is a concurrent listening turn, which is the behavior of one or more nontalking interlocutors present. (p. 190)
Thus, following the work of Cutrone (2005) and Maynard (1997), the position taken
in this study is to identify a brief statement as a backchannel and not a primary turn when it
serves only to react to what the primary speaker is saying (i.e., having a listening function)
and not to add any new information to the conversation (i.e., having a speaking function).
Therefore, brief questions such as Is that right? or Oh really?, which are formed in terms of
requests for clarification, are classified as backchannels. However, a question such as Why
did she do that? would be identified as a full speaking turn because it serves a speaking
function in terms of driving the conversation in a new direction. Further, responses to
questions are not regarded as backchannels because, as Ward and Tsukuhara (2000) have
pointed out, backchannels are unlike responses to questions in that they are optional and not
required. In addition, answers to questions, which are sometimes quite brief and include
ellipsis, would also seem to offer new information that pushes the conversation forward
constituting a change of primary speakership. Finally, researchers have to make decisions
regarding how to deal with pauses and utterances found between turns at talk. Following
the aforementioned studies, this study identifies an utterance as a backchannel only when it
occurs immediately after the primary speaker stops talking (within one second) and is
followed by a substantial pause before the next turn at talk starts (exceeding one second).
This decision was made because it was felt that such backchannels are produced in
response to the primary speaker’s speech, and they occur before a substantial turn
transitional period starts.
Functions of Backchannels
Classifying the functions of backchannels in an organized list is a difficult task for several

5
reasons. First, as Cutrone (2010) has shown, the overlap between form and function is
considerable, and the function that any given backchannel serves is highly dependent on the
context of the conversation as well as the listener’s personality. Although researchers have
proposed a range of functions, there has been little consensus to date, as there appear to be
reliability issues in measuring this aspect of conversation. In many studies, it is not always
clear how analysts reach their conclusions concerning backchannel functions, and it appears
that many based their findings on conversational analyses focusing on the primary
speakers’ interpretations of their interlocutors’ backchannel functions, as shown by how the
conversation unfolded. While the post-hoc examination of conversational transcripts may
offer important clues as to what went on in the conversation, it does not necessarily take
into account what the non-primary speaker meant to convey with their backchannel
utterance. Therefore, this study aims to take into account the observed backchannel
behavior of the participants, the non-primary speakers’ stated backchannel intentions, and
their interlocutors’ perceptions of these backchannels. Classifying the various functions of
backchannels, Maynard (1997) has attempted to sum up the previous work in this area by
identifying the following six categories: continuer, understanding, agreement, support and
empathy, emotive and minor additions. Detailed explanations and hypothetical examples to
demonstrate which forms are used to convey each function are described in Cutrone’s
(2010) article. In this current study however, what is of particular interest to the researcher
is the use of unconventional backchannel behavior by the JEFLs, i.e., forms and functions
that do not seem to correspond. As the section on functions below explains, this includes
the JEFL tendency to send supportive backchannel forms such as those to allow the speaker
to continue, to show understanding, agreement, and/or support and empathy when they do
not understand or agree with what their interlocutor is saying.
Why is Backchannel Behavior Important in the Japanese EFL context?
The primary reason backchannel behavior is becoming such an important topic in language
learning is that more and more people are becoming acutely aware of the great impact it can
have on intercultural communication (IC). As O’Keeffe, Clancy and Adolphs (2011, p. 100)
point out, attempts to move between L1 and L2 pragmatic norms can feel like “a minefield

6
for learners of a language”. Various studies in this area have shown that JEFLs’ listening
behavior differs to that of native English speakers (NESs) in many respects (Clancy,
Thompson, Suzuki & Tao, 1996; Maynard, 1986, 1987, 1990, 1997; White 1989) and these
differences sometimes lead to miscommunication and negative perceptions across cultures
(Blanche, 1987; Boxer, 1993; Cutrone, 2005). This section, thus, outlines some of these
differences in listening behavior and discusses their potential impact on IC. To this end, this
section also serves to provide a general barometer for JEFLs to produce effective listening
behavior.
Frequency of Backchannels
Several intercultural analyses (Clancy et al. 1996; Crawford, 2003; Cutrone, 2005;
Maynard, 1986, 1990, 1997; White, 1989) have observed JEFLs producing backchannels
far more frequently than their NES interlocutors (i.e., Britons, Americans and Australians)
in both their L1 and L2 English. As discussed below, such frequent interjections may be
taken as a sign of impatience and demand for a quick completion of the statement (Cutrone,
2005; Lebra, 1976; Mizutani, 1982).
Variability of Backchannels
In their intercultural analyses, Maynard (1997) and Cutrone (2005) reported that the JEFLs’
backchannels consisted mainly of non-word vocalizations and headnods, whereas the NESs
(American and British respectively) exhibited greater variability in the types of
backchannels they sent. That is, the NESs employed a far greater range of content words in
their backchannels and were also able to produce far more extended and complex
backchannel responses. Lack of variability, as well as repetition, in backchannel form may
be interpreted as a sign of boredom and inattention (McCarthy, 2002, 2003; Cutrone, 2005).
Discourse Contexts Attracting Backchannels
A common finding in the studies to date has been that Japanese discourse contexts
attracting backchannels varied considerably (in both the L1 and L2 English), while
grammatical completion points (i.e., clausal boundaries), especially those coinciding with a

7
pause, were the single most important discourse contexts for NESs (Cutrone, 2005;
Maynard, 1986, 1990, 1997; White, 1989).
Backchannels Creating Simultaneous Speech
A general finding in the research literature is that Japanese people, regardless of whether
they are speaking English or Japanese, tend to backchannel more frequently than NESs, and
a great portion of these backchannels are produced during the primary speakers’ speech,
creating simultaneous speech (Cutrone, 2005; Hayashi, 1988; Maynard, 1997). As Lebra
(1976) and Mizutani (1982) have hypothesized, some listeners may take these frequent
interjections as a sign of the listener’s impatience and demand for a quick completion of the
statement. Hence, in attempt to dig deeper, White (1989) and Cutrone (2005) conducted
correlational analyses to find out what effect Japanese people’s frequent backchannels
might have on their cross-cultural interlocutors perceptions of them. Reporting quite
different results, White (1989) found that the ten Americans perceived more frequent
backchannels by their Japanese interlocutors as a positive trait (i.e., showing signs of
comprehension, encouragement, and interest and concern), whereas Cutrone (2005)
reported that the eight Britons in his intercultural analysis perceived more frequent
backchannels by their JEFL interlocutors as interruptions and signs of impatience.
Backchannel Functions
Although research in this subcategory of listenership is scant, there is some evidence
beginning to emerge suggesting some key functional differences across cultures. For
instance, Blanche (1987) and Cutrone (2005) have provided anecdotal evidence of Japanese
people providing unconventional backchannels in English, such as by employing continuer,
understanding, agreement, and/or empathy/support type backchannels in situations when
they did not understand or disagreed with what their interlocutor was saying at the time. For
instance, in the classroom scenario described by Blanche (2005) and Cutrone (2005), NES
teachers sometimes misinterpret students’ classrooms responses (such as nods coupled with
vocalisations of yeah and uhuh) as displays of understanding, rather than the mere polite
expressions of attending that the students mean to express. When teachers realize much

8
later on that students have not understood them, they may occasionally feel confused and/or
even slightly annoyed by what they perceive to be mixed signals, or in extreme cases,
deceptive messages, resulting in the squandering of valuable class time.
In situations outside the classroom where there may be more at stake, these
misunderstandings can have dire consequences, as was the case in the Hitachi-Mitsubishi
trial (The Japan Times 1983, p. 2). One of the defendants in the case, Mr. Takaya Ishida of
Mitsubishi, maintained that he had not agreed with the undercover FBI agents when they
told him he had to steal some information/documents. His defense counselor argued that
Mr. Ishida’s responses of yeah and uhuh were not to show agreement, but rather to show he
was listening and to allow the other person to continue.
Involvement in the Conversation
A great many intercultural analyses comparing the communicative behaviors of Japanese
L2 English speakers and NESs have shown that the Japanese L2 English speakers in these
studies spoke less than NESs, did not elaborate as much, and were less likely to engage in
small talk (Cutrone, 2005; Hill, 1990; Sato, 2008). Undoubtedly, this is potentially a source
of misunderstanding in an English conversation as the importance of making small talk,
taking the initiative to speak, and elaboration towards making a positive impression have
been documented by several sources (Cutrone, 2005; McCarthy, 2002, 2003; McCroskey,
1992; Sato, 2008; Stubbe, 1998).
Explicit and Implicit Learning
Considering the importance of listenership in IC, and the fact that it is largely neglected in
EFL pedagogy in Japan (Capper, 2000), the primary aim of this study is to determine how
this aspect of pragmatic competence can best be learned in the EFL classroom. The context
of instruction underpinning the examination of JEFL’s acquisition of L2 listenership is a
central issue in this study and touches upon the more general, and oft-debated, issue of how
languages are best learned: explicitly or implicitly (Rose, 2005). The main feature
distinguishing these two instructional approaches is the general provision of metapragmatic

9
information designed to make the target features more salient in the explicit approach.
Explicit instruction commonly involves providing students with explicit metapragmatic
information about L2 rules through explanations, metacognitive discussions and corrective
feedback. Conversely, implicit instruction generally involves presenting learners with
prototypical uses of the target language in meaningful contexts with or without input
enhancement. The underlying assumption here is that the models of language given to
learners should help raise their awareness so that they will be able to induce the rules for
appropriate L2 use on their own.
Following the well-known skills’ acquisition theory known as the Adaptive Control
of Thought (ACT) theory (Anderson & Lebriere, 1998), supporters of an explicit approach
view language learning as progression from declarative/explicit knowledge through
proceduralization to final automatization. Conversely, in line with the tenets of Krashen’s
(1982) Input Hypothesis theory, proponents of a non-interface position believe that explicit
knowledge cannot be converted to implicit knowledge. Drawing on the differences between
L1 and L2 acquisition processes, Ellis (2005, 2006a,b) has made attempts to explain the
dichotomy between explicit and implicit learning. Cognitively, unlike L1 learners who are
thought to acquire language implicitly, L2 learners come to the learning environment with
minds already endowed with knowledge and experience of a prior linguistic system (i.e.,
the L1). This cognitive state seems to act as a constraint and filter in L2 input reception and
output generation, two critical processes of SLA. Goldschneider and DeKeyser (2001) and
Ellis (2005, 2006a,b) have identified factors that enable features of language to be noticed
and hence guide practitioners to what might need explicit instruction. Therefore, explicit
knowledge is thought to contribute to implicit learning. Acording to Ellis (2006a, p. 19),
“the linguistic forms that L2 learners fail to adopt and to use routinely thereafter in their L2
processing are those which, whether available as a result of frequency, recency, or context,
fall short of intake because of one of the following associative learning factors”: (1)
unreliable predictors of outcome, (2) not attended because of low cue salience, (3) not
attended because of low functional outcome in the overall interpretation of the message, (4)
not attended because they are redundant in the immediate understanding of an utterance,

10
being overshadowed or blocked by higher salience cues which have previously been
selected, and (5) ignored because L1 experience of form→meaning contingencies affects
the cues and dimensions that an L2 learner’s language input systems can best distinguish
(perceptual learning), and L1 experience of meaning→form contingencies affects the way a
L2 learner routinely expresses their meanings in language.
While all five of Ellis’ (2006a) factors listed above have the potential to hinder the
acquisition of L2 listenership, factors four and five likely pose the greatest threats. As
previous studies have shown (Crawford, 2003; Maynard, 1997; White, 1989), there is a
great deal of evidence showing the negative transfer of backchannel behavior from L1
Japanese to L2 English, which suggests the possibility of L1-influenced blocking. As
Brozyna (2007) and Takimoto (2009) have pointed out, despite their pervasiveness,
conversational discourse features such as backchannels are largely non-salient and often
pass unnoticed unless attention is drawn to them intentionally and explicitly. Ellis
(2006a,b), thus, advocates explicit and conscious L2 learning as a way of supplementing or
directing frequency-driven learning of patterns. Ellis believes that consciousness is required
to change behavior in SLA, as L2 learners do not seem to be equipped to notice low-salient
cues at a subconscious level, particularly when proficiency levels using the more obvious
cues are already sufficient for everyday communicative survival. These beliefs are in line
with Schmidt’s (1993) Noticing Hypothesis, which stipulates that learners must consciously
notice linguistic input in order for it to become intake.
Can L2 English Listenership Be Learned?
Research has shown that the acquisition of L1 backchannels is a fairly slow developmental
process, stretching into adolescence (Hess & Johnston, 1988). As several studies have
shown evidence of L1 Japanese to L2 English negative transfer and fossilization where
backchannels are concerned (Crawford, 2003; Maynard, 1997; White, 1989), L2
listenership is thought to be an especially difficult skill-set to learn. This seemingly uphill
battle may be one of the reasons why it has been rarely taught and/or studied (Thonus,
2007). While evidence showing the benefits of form-focused-instruction (FFI) on various

11
aspects of SLA such as grammatical development is indeed mounting (Ellis, Rod, 2008),
the effects of FFI on pragmatic development remains unclear. Despite the many calls for
studies examining the teachability of listenership (Cutrone, 2005; O’Keeffe & Adolphs,
2008; McCarthy, 2002, 2003) only a handful of studies in this area have been published to
date, most of which seemed to have been brief and/or focused on other aspects of SLA. For
instance, concerning the latter, Schmidt (1983), in his longitudinal case study reporting on
the English development of a native speaker (NS) of Japanese (whom he called Wes in the
reporting of his study), in an immersion setting, inadvertently noticed a great improvement
in Wes’ listenership after three years abroad, which would seem to provide support for the
implicit learning of this skill-set. Schmidt (1983), however, did not analyze listening
behavior in any systematic way; rather, his inferences seemed to be based mainly on
personal observations and anecdotal evidence.
Ward and Tsukuhara (2000) and Ward, Escalante, Yaffa and Solorio (2007) have
experimented with CALL methods as a means of teaching the timing of backchannels in
English and Arabic respectively. A major issue involving this type of instruction is the
seemingly narrow focus of teaching the appropriate timing of English backchannels without
giving attention to other crucial elements of backchannel behavior such as form, function
and contextual variables. In fact, mastering the skills to produce backchannels at
appropriate times, whether they understand what the primary speaker is saying or not, may
actually reduce learners’ overall L2 communicative ability. That is, there exists evidence of
IC being negatively affected by instances of JEFL speakers producing continuer,
understanding, or agreement type backchannels even when they disagree or did not
understand what the primary speaker was saying (Blanche, 1987; Cutrone, 2005; LoCastro,
1987). A backchannel trainer that focuses solely on timing would, in essence, be helping
learners to fake understanding, which has previously been identified as a potential problem
area that warrants instructional attention to remedy.
In her unpublished Master’s thesis, Brozyna (2007) attempted to assess the
teachability of backchannels in a study that also sought to investigate the effects of

12
instruction on discourse markers functioning as hedges and fillers. Basing her study on the
awareness raising methodology of Illustration-Interaction-Induction (Carter & McCarthy,
1995, 2004) and on the “noticing the gap” (Schmidt & Frota, 1986, p. 311) potential for
learning activation, Brozyna compared the performance of a control group (attending
regular English classes four hours per week), with two treatment groups receiving an
additional two hours of experimental instruction over 12 weeks. One of the experimental
groups was given rich exposure to target features as well as explicit instruction in terms of
metalinguistic information regarding backchannels and discourse markers, whereas the
other experimental group received the same treatment with the addition of opportunities for
intensive and focused practice. Brozyna reported a significant improvement in the group
that received practice opportunities, but not in the group that did not receive practice
opportunities or the control group. Although Brozyna intended this project to be a pilot
study for future research, and the practical constraints of her teaching context certainly
played a role, there are a number of issues associated with the design as well as findings of
her study. First, the six participants in each of the treatment groups consisted of male and
female high school students, whereas the four participants in the control group were all
adult females, aged 24-26, in full-time employment. The fact that age, gender and
socioeconomic status were not controlled makes the results difficult to compare between
groups.
Second, the brevity of the method of analysis, which was limited to counting the
number of backchannels in one two-minute extract pre instruction and another two-minute
extract post instruction, would also seem to bring into question the validity of the results.
There would also appear to be some validity concerns involving the fact that these two-
minute extracts appear to have involved all six participants conversing at once. Considering
the complexities of how group dynamics might influence backchannel behavior, it is easy
to imagine how one or two members of a particular group, with potentially divergent and/or
altered backchannel behavior, could skew the results of such a small scale study. Moreover,
concerning studies that measure the effectiveness of instruction on a particular language

13
feature, it is difficult to give findings any credence without a delayed post-test to
demonstrate whether the treatment had any sustained effects.
Finally, Brozyna appears to have based her evaluation of the efficacy of the
instruction solely on the quantity of backchannels used and did not include other important
aspects of quality such as form and function. That is, the fact that the group that received
full treatment increased the amount of backchannels they uttered from 3 to 12 (or from .012
to .04 / number of primary speaker words) after instruction seems to have provided the
foundation for stating that these participants had improved. In the researcher’s opinion, the
assessment of backchannel behavior is not as straightforward as this. The relationship
between backchannels and discourse is not a linear one; rather, it is complex and
multifaceted, with frequency comprising only one of the many interrelated and overlapping
components in this skill-set. In the case of JEFLs, whose style of frequent backchannels
was found excessive in various intercultural analyses (Cutrone, 2005; LoCastro, 1987), the
goal of instruction would be, conversely, to limit the overall frequency of their
backchannels (especially the minimal and repetitive ones), while increasing their length and
variability at context-specific moments (repair strategies to deal with non-understanding).
Lastly, a study administered by Sardegna and Molle (2010) examined the
learnability of English listener responses in five JEFLs after a two-hour video conference
lesson. Sardegna and Molle claim that this pedagogic intervention had a positive short-term
effect on the production of students’ listener responses; however, it seems difficult to give
too much credence to this finding based on the data presented, as well as the brevity of the
treatment and analysis. Sardegna and Molle seem to be basing their conclusion solely on
the limited amount of data presented in a short post-treatment conversational excerpt
involving the five JEFLs and the teacher. Further, besides the problems associated with
analyzing all the JEFLs together discussed above, the criteria for assessing listening
behavior again appears to be oversimplified as the lone determinant of success was the
observation that the JEFLs used fewer backchannel forms common in Japanese and more
that are common in English. Finally, technological limitations associated with the video

14
conferencing set-up forced the researchers to exclude nonverbal backchannels in their
analyses.
Research Questions (RQs)
While there is evidence to suggest that pedagogical intervention can facilitate some
elements of pragmatic development (Rose, 2005), little is known about how learners
acquire L2 listener responses over time, as well as what effect different types of instruction
might have on development in this area. RQ 1, thus, seeks to answer the more general
question of whether pedagogical intervention addressing conversational discourse features
of language can have a positive effect, while RQ 2, more specifically, seeks to shed light on
the Explicit-Implicit debate where listener responses are concerned.
RQ 1: Will instructional treatment help facilitate the JEFL learners’ backchannel
behavior?
RQ 2: If so, will explicit treatments be more effective than implicit ones (a) in the
short term and (b) in the long term?
Methodology
Participants
Constituting an opportunistic sample, this study involved 46 participants known to the
researcher. First, in the intercultural conversation phase, this study used 30 JEFLs born and
raised in Japan (24 females and six males) and six L1 American English speakers from the
United States (three females and three males). All conversational participants lived in
Nagasaki Prefecture in Japan and were university students ranging in age from 18-20 at the
time of the study. The Americans participating in the conversations (called the NES
interlocutors in this study) of the study were visiting Japan as exchange students. In
addition, ten American participants (called NES observers in this study) who did not
participate in the conversations and/or have any particular affiliation to Japan were used to
provide unbiased assessments of the JEFLs in the conversations (i.e., see Procedural Step 6
below). The NES observers ranged in age from 22-48 and were from various parts of the

15
United States. Participating of their free will and understanding the nature of the study, all
46 participants read and signed a Participation Consent Form and were given explicit
instructions regarding this study and their role in it. All forms were typed in English with
Japanese translations provided to the native Japanese speakers in this study to ensure these
participants had a full understanding of the contents in each form. In referring to
participants in this study, pseudonyms have been given to protect participants’ privacy.
Procedures in Collecting Data
As the RQs were complex and multifaceted in nature, it was thought that using a mixed-
methods approach would not only serve to strengthen the reliability and validity of the data
but also provide for a broader view with multiple perspectives of the researched topic. To
this end, the following methods were used to collect data in this study: observations,
questionnaires and interviews.
Observations
The observation phase involved the video recording of 30 intercultural dyadic
conversations in English between JEFL and NES participants. To control for sociolinguistic
variables, all dyads were paired according to gender, age (within two years) and social
status (i.e., all university students), and participants were not well-acquainted prior to each
conversation. The conversations took place in the researcher’s office in Nagasaki
Prefecture, Japan, and, once brief instructions were given, only the participants were
present in the room. Initial conversational prompts (i.e., involving peer-mentoring) were
offered to help stimulate conversation; however, it was made clear to participants that they
were free to talk about anything they liked. Each conversation was video recorded for a
period of thirty minutes, of which only the middle three minutes of each conversation were
included as data to be transcribed (see Appendix A for sample transcription). It was thought
that the participants would become less conscious of the camera as the conversation
progressed, and that the middle part of the conversation would be the most natural as it
avoids the awkwardness which often occurs at the beginning and end of conversations
between people who do not know each other well. Further, as discussed below, one of the

16
purposes of the interviews was to examine the extent to which the conversational
participants might have changed their behavior due to the presence of the video camera in
the room (known as Observer’s Paradox). Consistent with similar studies (Cutrone, 2005;
Maynard, 1986) that have involved video recorded conversations, Observer’s Paradox did
not seem to be a major issue in this study. Only three of the participants reported to being
aware of the video camera initially, as they looked towards the camera and made
metamessage comments such as we can begin now and I shouldn’t say that in front of the
camera; however, they, along with the rest of the participants, indicated that they were not
conscious of the camera at all once the conversation developed and felt that it did not
influence their behavior in any way.
Lastly, to strengthen the internal reliability of the transcriptions, the researcher
analyzed the video recorded conversation with the assistance of a colleague. The colleague,
who was trained by the researcher to recognize the transcription conventions used in this
study (outlined in Appendix A), which were adopted from the pioneering Conversation
Analysis (CA) research of Sacks, Schegloff and Jefferson (1974), and the revised CA
conventions of Jefferson (2002), assisted in two ways: first, regarding some of the words
and/or gestures that were not clear to the researcher in the conversations, the researcher
sought out the colleague’s opinions so as to make a more informed choice in transcribing
the word(s) or behavior in question; second, the colleague double-checked the researcher’s
initial transcriptions to ensure that the conventions showing the features of language were
accurately presented in the transcriptions. The conversations were conducted in the
researcher’s office. Video recording equipment consisted of a Sony digital video camera,
which was placed unobtrusively in the corner of the room. At the time of the video
recording, only the participants were present in the room when the conversation was taking
place.
Questionnaires
There were three types of questionnaires used in this study. The first two, inventories to
measure WTC (McCroskey, 1992; see Appendix B) and the Extraversion dimension of

17
personality (Oshio, Abe & Cutrone, 2012; see Appendix C), were used to create equally
balanced groups prior to assessment in this study (as Procedural Step 2 below explains).
The third type of questionnaire, Hecht’s (1978) conversational satisfaction inventory, was
used more extensively throughout the study as part of the assessment of the JEFLs’
performance. To this end, slightly modified versions of Hecht’s questionnaire were given to
the participant groups of this study, as shown in Appendix D (i.e., the NES and JEFL
conversational participants and the NES observers). Questionnaires for the conversational
participants consisted of a fifteen-item inventory and one open-response question at the end
in case the participant wanted to add something that had not been addressed in the other
questions. The questions on the fifteen-item inventory were closed-ended, consisting of
statements on a Likert-scale ranging from one to seven. The researcher modified the
questionnaire from Hecht’s (1978) original and the one White (1989) used because pilot
studies revealed that some vocabulary and some of the statements, which contained double
negatives, confused participants. For instance, participants of the pilot study had problems
rating yes or no on the Likert-scale because of negatively worded statements such as He/she
didn’t seem to care and He/she did not interrupt me. Consequently, the negatively worded
statement He/she didn’t seem to care was excluded from the questionnaire because its
positive counterpart He expressed a lot of interest in what I had to say already existed in the
questionnaire, and similarly, the negatively worded statement He/she did not interrupt me
was replaced with the positive statement He/she interrupted me. Moreover, item 15 My
conversation partner seems to want to avoid speaking was added to Hecht’s (1978) original
questionnaire. The JEFL participants’ questionnaires included Japanese translations
underneath each of the items typed in English to ensure comprehension.
Other modifications were made specific to the questionnaire objectives for each of
the two groups. For instance, item 2 on Hecht’s (1978) original questionnaire I felt I was
able to present myself favorably during the conversation was altered for both groups. On
the JEFL participants’ questionnaire, the adverb favorably was changed to fairly as the
focus here was to determine whether these participants felt that they represented themselves

18
adequately, sincerely, and as they had intended (i.e., this need not necessarily be favorably).
To avoid confusion, this was emphasized in the Japanese translation. On the NESs’
questionnaire, the original item 2 was changed in its entirety to The feelings that my partner
expressed by means of listening feedback during the conversation seemed authentic and
sincere. The focus here was to examine whether the NESs could sense their JEFL
interlocutor faking understanding and/or agreement. The post-conversation questionnaires
were given to each participant in the dyad directly after their video recorded conversation
and simultaneously completed in separate rooms.
Subsequently, a slightly modified version of Hecht’s questionnaire was given to a
group of American observers to assess their perceptions of the JEFLs’ performances from
watching the video recorded conversations. First, since the members of the NES observer
group did not participate in the conversations, referent nouns, subject pronouns, object
pronouns and possessive adjectives were changed accordingly. Second, NES observers’
questionnaires included two supplemental items (items 16 and 17) on the Likert-scale
designed to examine specific areas of relevance to the study of JEFLs’ backchannel
behavior that were not covered in the original questionnaire. These consisted of item 16
When the Japanese person did not understand something, they were able to clearly convey
this to their conversational partner with their listening feedback and item 17 The Japanese
person’s listening behavior seemed inadequate in some ways. For participants expressing
disagreement (i.e., 5, 6, or 7 on the Likert-scale) to item 17, an open-item response was
subsequently solicited asking them to explain their answer.
Interviews
The interviews involved the two members of each dyad being interviewed separately and in
succession, with the NES first and the JEFL second. No one else was present at the time of
the interview, as the researcher asked the participant not being interviewed to wait in
another room while the interview was being conducted. None of the interviews took longer
than twenty minutes. The interviews consisted of the researcher playing back a portion of
the video recorded conversation and asking each participant a few questions pertaining to

19
the listening behavior displayed in the conversation. The researcher took field notes and
audio recorded all interviews to refer to in the data analysis. The interviews were semi-
structured in that the researcher had a general plan but did not enter with a predetermined
set of questions, as some of the questions were guided by the circumstances in the video
recorded conversations and the responses of the interviewee. In an effort to help
participants feel more comfortable, questions were sequenced to begin with general
inquiries and gradually move towards more specific and potentially sensitive questions. As
mentioned above, the interviewer began by assessing the extent to which the conversational
participants might have been affected by Observer’s Paradox.
The primary aim in the interviews with the American participants was to learn how
they perceived their Japanese interlocutors’ backchannel behavior. A major part of the
interview involved the playing back the video recording and asking the American
interviewee to comment on the listening behavior of their Japanese interlocutor. In
instances singled out for analysis (where some of the JEFLs’ backchannels occur), the
researcher stopped the video recording and asked specific questions such as What function
do you think that head nod serves?, Do you think s/he understands what you are saying
here?, and follow up questions such as Why do you think so? The researcher made a note of
any data which I thought might be useful in the subsequent interview with the Japanese
participant of the dyad.
Subsequently interviewing the Japanese participant, the researcher had two main
objectives: to gain insights into why JEFLs use backchannels the way they do and to
determine if there were any misunderstandings or miscommunications caused by their use
of backchannels in the video recorded conversations. Regarding the latter, this involved the
interviewer asking the JEFLs to comment on what they were feeling at certain points in the
conversation, as well as the intended functions of their backchannel responses. In particular,
the researcher investigated what the JEFLs were doing when they did not understand and if
they were indeed feigning understanding as various researchers claim is common for
Japanese backchannel behavior. In the successive interviews, the researcher documented

20
any notable differences between the Japanese participants’ backchannel intentions and their
NES interlocutors’ perceptions on a data record sheet (see Appendix E). In the cases where
the JEFL’s backchannel explanation differed greatly from their NES interlocutor’s
interpretation, the interviewer asked the JEFL potentially sensitive follow-up questions
such as Why did you nod if you did not understand what he/she was saying here? and Why
did you say yeah if you disagreed with what he/she was saying? In cases where the
interviewee seemed uncomfortable in answering, the interviewer did not persist with this
line of questioning and instead shifted to a less sensitive area.
Procedural Steps
Step 1: Pre-test
Each JEFL received one pre-test which contained three parts: observations, questionnaires
and interviews (as described above in the Procedures of Collecting Data section). The first
part, observations, refers to the JEFLs participating in a conversation with a NES (which
was video recorded and subsequently watched, transcribed and assessed). The second part
refers to a conversational satisfaction questionnaire filled out by both JEFLs and their NES
interlocutors. The third part refers to retrospective interviews with both JEFLs and their
NES interlocutors regarding their intercultural conversations.
Step 2: Group Formation
The 30 JEFLs in this study were divided into three groups of ten (see member
characteristics of each group in Appendix F). These groups comprised the two experimental
groups (Groups A and B) and one control group (Group Z). The main objective in grouping
the participants was to attempt to create comparable and thus equally balanced groups in
terms of gender, EFL proficiency as based on the Test of English for International
Communication (TOEIC) scores, WTC (see McCroskey, 1992), personality (i.e. based on
the Extraversion dimension, see Oshio, Abe & Cutrone, 2012) and age.
Step 3: Treatment
Group A: Receiving Explicit Instruction

21
Members of Group A received explicit instruction over the course of two months, i.e., one
90-minute lesson a week for eight weeks. This began with a focus of explicitly and
consciously raising learners’ awareness of the use and dimensions of listener responses in
English as compared to Japanese. The following teaching methods were used in the
classroom: (1) the form, function and perception of listener responses, as well as other
communicative behavior thought to be relevant, were compared across languages and
cultures, (2) with input enhancement from the teacher, members of Group A closely
examined intracultural and intercultural conversations and subsequently discussed how
differences in form, frequency, placement and function of backchannels in varying contexts
affect IC, (3) learners were provided with overt descriptions and concrete examples of how
NESs employ backchannels and conversational micro-skills in varying contexts, (4) the
JEFLs in Group A completed exercises and tasks to reinforce the newly learned
conventions of backchannel behavior, and, (5) with a focus on fluency, learners practiced
using listener responses in role-plays. By video recording role-play performances and
watching them afterwards, students were able to analyze their performances and receive
feedback from the teacher and other students.
Group B: Receiving Implicit Instruction
Members of Group B received implicit instruction over the course of two months. While
the overall amount of instruction (and the eight-week time-line) was identical to that
received by Group A, the lesson parameters were altered. The lessons involving classroom
interaction and discussion amongst peers, which took place in Weeks 1, 4 and 8, were each
administered in one 90-minute sitting; however, the sessions in which the JEFLs conversed
with a NES, which occurred in Weeks 2, 3, 5, 6 and 7, took place twice a week and were 45
minutes in duration each. Similar to the aims of the explicit instruction above, raising
learners’ consciousness regarding the use and dimensions of listener responses across
cultures was among the main goals of implicit instruction in this study; however, different
methods were used to achieve this. Unlike the instruction Group A received, learners in
Group B were not given any explicit metapragmatic information about listener responses
through explanations and concrete examples. While the members of Group B were asked

22
initially to consider the general qualities belonging to good conversationalists and listeners
alike, they were not instructed to focus on listening behavior as part of this treatment. The
teacher’s role was limited to that of facilitator in that the JEFLs in Group B were required
to induce rules and meaning on their own based on exposure to prototypical uses of the
target language in meaningful contexts. Members of Group B received the following
pedagogical interventions. First, learners were provided with models of conversations in
three categories: (1) NS-NS discourse in Japanese, (2) NS-NS discourse in English and (3)
NES-JEFL conversations in English. Second, with limited input enhancement from the
teacher, the JEFLs in Group B were asked to reflect upon and discuss their observations of
communicative behavior across languages and cultures in journal-writing entries and small
group discussions. Third, making up the greater part of the treatment Group B received,
learners were given the opportunity to communicate with NESs face-to-face in authentic
contexts on 12 separate occasions. Each conversational session was followed by a brief
period of reflection in which the JEFLs in Group B recorded their thoughts in their
journals. In addition, after every three conversational sessions, learner-led group
discussions took place, affording them the opportunities to further reflect and share their
general observations regarding their own as well as their cross-cultural interlocutor’s
communicative style(s), what they might have learned, and what they hope to change or
modify about their own behavior in future conversations in English.
Group Z: No Treatment
The JEFLs in the control group received no formal treatment regarding listenership.
Step 4: Post-test 1
Post-test 1 was given to all JEFLs within three days of their last treatment, and followed the
same procedure as the Pre-test outlined in Step 1 above.
Step 5: Post-test 2
To assess whether the treatment had any sustained effects, a delayed post-test was given.
Applying identical procedures as those used in the Pre-test and Post-test 1, Post-test 2 was

23
administered approximately eight weeks after Post-test 1.
Step 6: NESs’ Observations
Ten NES observers were instructed to watch each three-minute video recorded conversation
and subsequently provide their impression as to the adequacy of each JEFL’s
conversational performance by completing a modified version of Hecht’s (1978)
conversational satisfaction questionnaire.
Data Analysis and Assessment Criteria
As mentioned above, three data collection methods were used in this study: observations,
questionnaires and interviews. The data produced by these methods combine to inform
judgements within the following assessment categories of backchannel behavior: the
approximation of NES backchannel behavior, Willingness to Communicate (WTC), the
ability to use conversational micro-skills and repair strategies, and Intercultural
Communicative Competence (ICC). This section, thus, presents the methods of data
analysis in each of these assessment categories.
Inferential statistics were included at various points to determine the probability that
an observed difference between means (such as the means involving the same group at two
points in time, as from the Pre-test to Post-test 2) was a significant one or one that might
have happened by chance. Both parametric and non-parametric statistical tests were used
depending on the type of data analysed. Regarding the observational data (i.e., measuring
the approximation of NES backchannel behavior) and the WTC questionnaires, Paired-
Samples t-tests were used because the data in these areas fulfilled the following four
requirements of parametric testing:
(1) The pairs of scores must be related to each other.
(2) The scores must be of at least interval status.
(3) The scores in each group must be normally distributed.
(4) The two sets of scores have equal variances. (Clegg, 1982, p. 167)
Conversely, concerning the data collected from the NES observers’ questionnaires, the non-

24
parametric Wilcoxon Signed Rank test was used because these data were not drawn from a
normal distribution (as shown by an exploratory data analysis that included Q-Q plot
graphs, a normal curve superimposed over histograms of the data and the Shapiro-Wilk
normality test). To analyse the data in this study, the Statistical Package for the Social
Sciences (SPSS), version 14.0, was used. In all inferential statistical tests used in this study,
two-tailed tests were used, and alpha levels (α) were set at 0.05 (p<.05 is marked by a
single asterisk *). Since the groups in this study were small, probability statistics have to be
viewed with caution. Hence, considering the possibility of Type 1 errors (i.e., the false
rejection of the null hypothesis) occurring, probabilities less than the more stringent 0.01
level were also emphasized (p<.01 level =**).
The Approximation of NES Backchannel Behavior
To determine how well the JEFLs were able to approximate NES norms (as presented in
Cutrone, 2010), the researcher carefully analyzed the JEFLs’ performances in the
intercultural conversations. As mentioned above, all of these conversations were transcribed
and, thence, formed the observation part of the tests in this study (sample transcription
shown in Appendix A). To analyze the data of the observation phase of this study, the
transcriptions were closely examined for patterns and tendencies as well as how frequently
certain behaviors occurred in the data.
Frequency
Following the precise definitions of backchannels given above, the researcher determined
the frequency of backchannels produced by a person or group in this study by counting the
number of backchannels in the conversational transcripts. Further, to provide a more
accurate representation of how frequently participants sent backchannels according to the
opportunities they were given (i.e., how much the other conversational participant spoke),
the number of a participant’s backchannels was divided by the number of their
interlocutor’s words.

25
Variability
Similar to the overall Frequency category above, the frequency of various subtypes of
backchannels is based on how frequently the subtype occurred in the data of the transcripts.
While numerous verbal and nonverbal backchannel subtypes have been explored, this paper
presents only the findings of the superordinate groups, minimal vis-à-vis extended
backchannels, because they are thought to have the greatest influence on IC (see Cutrone,
2011; Stubbe, 1998). Minimal responses can be defined here as any brief (non-lexical)
and/or nonverbal backchannel occurring in isolation, which include headnods and/or non-
word vocalizations such as uhuh and mhm, whereas extended responses, conversely, refer
to the lengthier verbal listener feedback consisting of multiple and varied words found in
sentences (irrespective of nonverbal backchannel accompaniment) such as How great that
is or Do you think so?
Discourse Contexts Favoring Backchannels
Upon exploring several subcategories, the primary discourse context favoring backchannels
in English has consistently proven to be the final clausal boundary (see Cutrone, 2005;
Maynard, 1997; White, 1989). In simple terms, a final clause boundary refers to the points
in the primary speaker’s speech where a clause (i.e., containing a subject and predicate) is
completed. It is important to note, however, the distinction between a final clause boundary
and an internal clause boundary. A final clause boundary is one that makes complete sense
(i.e., fully meaningful) and could end the utterance there, whereas an internal clause is one
in which the meaning is not complete, and there is a requirement for the utterance to go on
in order for the meaning to be complete. As shown in Appendix A, two slashes side by side
( // ) mark the points at which final clause boundaries occur in the primary speakers’
speech. Since backchannels in the transcripts are presented in italics below the primary
speakers’ talk at the point they occurred in the talk, the backchannels that occurred at final
clause boundaries in the primary speaker’s speech were clearly discernible. In the findings,
the two main categories relating to this area that will be presented are as follows: (1) the
mean percentage of opportunities (Opps) that final clause boundaries attracted

26
backchannels (with SDs), and (2) the mean percentage of backchannels constituted by final
clause boundaries (with SDs).
Simultaneous Speech
Since Simultaneous Speech Backchannels (SSBs) have the danger of being misconstrued as
interruptions (Cutrone, 2011), this paper includes a separate category for them. SSBs are
recorded when a backchannel is uttered during the primary speaker’s speech, and, hence,
backchannels which occur during pause periods in the primary speaker’s speech are not
considered SSBs. SSBs include laughter; however, as SSB laughter is not thought to
influence communication negatively (i.e., it was doubtful that SSB laughter would be seen
as interruptive), this study limits its reporting in this area to the non-laughter SSB category.
Increase Willingness to Communicate (WTC)
The examination of participants’ WTC is based on two main sources: McCroskey’s (1992)
self-report WTC questionnaires and behavioral observations. Regarding the former,
analyzing JEFL scores in the interpersonal communication sub-category of McCroskey’s
(1992) WTC inventory (see Appendix B) offers a sense of how willing the JEFLs were to
communicate. To determine if the WTC self-ratings were borne out in the conversational
data, the amount that each person spoke (i.e., in terms of how many words they uttered in
the transcriptions) was also included in this analysis. Lastly, since the importance of asking
questions has been widely stated, the researcher included this as another area for analysis.
The Development of Conversational Micro-skills and Repair Strategies
Analysis of this category was delimited to situations when JEFLs did not understand or
agree with their interlocutor. In addition to documenting the number of times JEFLs use
potentially unconventional and/or inappropriate backchannels in these situations, this
analysis also examines the instances in which they use conversational repair strategies.
Conversational repair strategies are divided into two types of listener response: minimal
and extended responses. Minimal responses refer to any brief (non-lexical) backchannel
considered to be a request for clarification and/or a demonstration of non-understanding.

27
The intent of such backchannels was judged in two ways: by asking the participants in the
playback interviews what they meant to convey with their backchannel response, and by
examining the intonation patterns of minimal backchannels. Concerning the latter method,
backchannel repetitions with a rising intonation commonly serve to request clarification;
thus, using the well-known Phonetics software called Praat (Version 5.0.18), minimal
backchannels with pitch contours containing rapid rises of 600 Hertz or more were marked
as conversational repair strategies (i.e., requests for clarification). Extended responses refer
to a specific set of typical conversational phrases and routines such as I beg your pardon or
what does that mean? As a basis for identifying expressions that make up these repair
strategies, this study recognizes text strings that correspond to and are similar to the models
set forth in two language teacher’s resource books that have been entirely based on these
structures: Function in English (Blundell, Higgens & Middlemiss, 1982) and Conversation
and Dialogues in Action (Dörnyei & Thurrell, 1992).
The Development of Intercultural Communicative Competence (ICC)
A basic requirement of ICC is for conversational participants to be seen as competent by
members of the target culture (Byram, 1997, Spitzberg, 2000). To assess this in this study,
the NES interlocutors (i.e., conversational participants) were given post-conversation
questionnaires and interviews (as described above). Further, the NES observer group
completed a modified version of Hecht’s (1978) Interpersonal Communication Satisfaction
Inventory (see third questionnaire in Appendix D). Since the NES observers were based
abroad, did not participate in the conversations and did not have any affiliation to Japan
(and were, thus, unbiased and offered perceptions that were potentially closer to what
JEFLs would encounter abroad), the researcher examined their questionnaire responses in
greater detail.
Results
The results of the JEFL groups’ performances at each of the three points of measurement
(i.e., the Pre-test, Post-test 1 and Post-test 2) are presented quantitatively according to each
group (in the tables below) and collectively (in the figures below) in the following areas of

28
backchannel behavior: frequency, involvement in the conversation, variability, discourse
contexts favoring backchannels, simultaneous speech backchannels, and perceptions of
NES observers. In addition, the interview data, which are presented both quantitatively and
qualitatively, report on how members of each group dealt with situations of non-
understanding and how they perceived their improvements or lack thereof throughout this
study.
Frequency
Tables 1, 2 and 3 report the backchannel frequencies of Group A (Explicit), Group B
(Implicit) and Group Z (Control) respectively at the three points of measurement in this
study.
Table 1 Group A’s backchannel frequencies
N = 10
Total Backchannels
Interlocutor’s Words
Average number of interlocutor’s words
between backchannels
Pre Post 1 Post 2 Pre Post 1 Post 2 Pre Post 1 Post 2
Total 450 290 371 2700 2874 3217 __ __ __
Mean (x̄) 45 29
37.1
270 287.4 321.7 6 9.91**
(p<.001)
8.67**
(p<.001)
SD 15.23 11.12 12.33 21.83 12.39 18.14 1.19 2.45 1.94
(x̄ difference of Pre-test Post-test 1, and Pre-test Post-test 2 significant at p<.05 level = *; significant at p<.01 level =**)
Table 2 Group B’s backchannel frequencies
N = 10
Backchannels
Interlocutor’s Words
Average number of interlocutor’s words
between backchannels
Pre Post 1 Post 2 Pre Post 1
Post 2 Pre Post 1 Post 2

29
Total 370 268 391 2530 2355 3120 __ __ __
Mean (x̄) 37 26.8* 39.1 253 235.5 312 6.84 8.79*
(p<.046)
7.98
SD 10.67 4.83 9.78 15.25 20.16 15.79 1.52 1.87 1.29
(x̄ difference of Pre-test Post-test 1, and Pre-test Post-test 2 significant at p<.05 level = *; significant at p<.01 level =**)
Table 3 Group Z’s backchannel frequencies
N = 10
Backchannels
Interlocutor’s Words
Average number of interlocutor’s words
between backchannels
Pre Post 1 Post 2 Pre Post 1 Post 2 Pre Post 1 Post 2
Total 445 317 474 2914 2381 3408 __ __ __
Mean (x̄) 44.5 31.7 47.4 291.4 238.1 340.8 6.55 7.51 7.19
SD 13.01 9.15 12.93 18.23 10.47 11.24 1.37 1.26 .89
(x̄ difference of Pre-test Post-test 1, and Pre-test Post-test 2 significant at p<.05 level = *; significant at p<.01 level =**)
Examining the three groups’ data collectively, Figure 1 shows that members of the
experimental groups (Groups A and B) sent backchannels (BCs) much less frequently in
Post-test 1 compared to the Pre-test. Subsequently, in Post-test 2, the number of
backchannels the experimental groups sent returned to a level closer to their original Pre-
test level. In comparison, the Control group (Group Z) only showed a slight decrease in the
number of backchannels they sent from the Pre-test to Post-test 1. From the Pre-test to
Post-test 1, the 3.91 backchannel per interlocutor word decrease shown by the Explicit
group was found to be strongly significant (p<.001), and the 1.95 decrease for the Implicit
group was significant at the .05 level (p<.046). Further, while all three groups had reverted
back to providing more frequent backchannels in Post-test 2, there was some variability
between the frequencies in each group. For example, the Control group sent backchannels
only slightly less frequently in the Pre-test than in Post-test 2 (i.e., a difference of only .64

30
backchannels per interlocutor word), whereas the Implicit group sent backchannels
noticeably less frequently in the Pre-test than Post-test 2 (difference of 1.14 backchannels
per interlocutor word). The Explicit group, however, was the only one to maintain
statistically significant changes (p<.001) in frequency from the Pre-test to Post-test 2
(difference of 2.67 backchannels per interlocutor word).
Figure 1 Backchannel frequencies of the three groups over time
Willingness to Communicate
As mentioned above, the JEFLs’ willingness to communicate takes into account their WTC
scores, how much they spoke in the conversations and the number of questions they asked
their interlocutor. Tables 4, 5 and 6 present the results of these features of conversations for
Group A (Explicit), Group B (Implicit) and Group Z (Control) respectively at the three
points of measurement in this study.
Table 4 Group A’s willingness to communicate
N = 10
WTC Words Questions
x̄ SD Total x̄ SD Total x̄ SD

31
Pre 48.4 10.74 583 58.3 32.82 8 .08 .79
Post 1
70**
(p<.001)
6.79 973
97.3**
(p<.007)
35.87
21 2.1**
(p<.001)
.88
Post 2 57.7**
(p<.001)
9.12 567 56.7 26.37 14 1.6*
(p<.011)
.70
(x̄ difference of Pre-test Post-test 1, and Pre-test Post-test 2 significant at p<.05 level = *; significant at p<.01 level =**) Table 5 Group B’s willingness to communicate
N = 10
WTC Words Questions
x̄ SD Total x̄ SD Total x̄ SD
Pre 50.4 8.14 650 65 32.33 12 1.2 .63
Post 1 60.6**
(p<.002)
6.08 901 90.1 31.19 16 1.6 1.17
Post 2 56.6*
(p<.022)
8.21 705 70.5 23.01 11 1.1 1.29
(x̄ difference of Pre-test Post-test 1, and Pre-test Post-test 2 significant at p<.05 level = *; significant at p<.01 level =**)
Table 6 Group Z’s willingness to communicate
N = 10
WTC Words Questions
x̄ SD Total x̄ SD Total x̄ SD
Pre 56.2 7.27 640 64 32 18 1.8 .92
Post 1 57.3 7.42 963 96.3 30.63 14 1.4 .84
Post 2 58.5 7.37 641 64.1 33 9 .9*
(p<.041)
.74
(x̄ difference of Pre-test Post-test 1, and Pre-test Post-test 2 significant at p<.05 level = *; significant at p<.01 level =**)
Presenting the three groups’ data collectively, WTC scores, number of words and

32
number of questions asked at the three tests are compared in Figures 2, 3 and 4 respectively.
First, as Figure 2 demonstrates, the Explicit group showed the greatest increase in average
WTC score from the Pre-test to Post-test 1 (+21.6), as well as the greatest sustained
increase from the Pre-test to Post-test 2 (+9.3). These increases were both found to be
strongly significant (at the .01 level). The path of the Implicit group generally mirrored that
of the Explicit group but without the same range in scores. The 10.2 increase in this group’s
average WTC score from the Pre-test to Post-test 1 was found to be strongly significant (at
the .01 level), and the 6.2 increase from the Pre-test to Post-test 2 was significant at the .05
level or below. For the Control group, the average WTC scores remained fairly constant
over time, only showing minor increases of 1.1 and 2.3 from the Pre-test to Post-tests 1 and
2 respectively.
Figure 2 WTC questionnaire scores of the three groups over time
As Figure 3 illustrates, the three groups followed a similar path in terms of word
output. Similar to the frequency category (see Figure 1), the general trend, regardless of
which group they belonged to, was for the JEFLs to speak much more frequently in Post-
test 1 compared to the Pre-test and then, in Post-test 2, revert to a level closer to their

33
original Pre-test level. The mean increase exhibited by the Explicit group (39 words) was
the only one found to be statistically significant from the Pre-test to Post-test 1 (p<.007);
however, the large differences for the Implicit (25.1) and Control groups (32.3) were also
noticeable.
Figure 3 Number of words of the three groups over time
As shown in Figure 4, the path that each group followed in terms of the average
number of questions posed was different. The Explicit group displayed the greatest initial
increase in questions from the Pre-test to Post-test 1 (+1.3), as well as a sustained increase
from the Pre-test to Post-test 2 (+.8). Paired-samples t-tests found both of these increases to
be statistically significant (p<.001 from Pre-test to Post-test 1, and p<.011 from Pre-test to
Post-test 2). In comparison, the Implicit group showed only a modest initial increase from
the Pre-test to Post-test 1 (+.4), and ultimately a slight decrease overall from the Pre-test to
Post-test 2 (-.1). The Control group was the only group to decrease in both measurements
after the Pre-test, i.e., (-.4) from the Pre-test to Post-test 1 and (-.9) from the Pre-test to
Post-test 2. The latter decrease was found to be statistically significant at the .05 level or
below.

34
Figure 4 Number of questions of the three groups over time
Variability
As discussed above, numerous verbal and nonverbal backchannel subtypes have been
explored; however, this paper presents only the findings of the superordinate groups,
minimal and extended backchannels, because they are thought to have the greatest
influence on IC. Tables 7, 8 and 9 report the results of these features of conversations for
Group A (Explicit), Group B (Implicit) and Group Z (Control) respectively at the three
points of measurement in this study.
Table 7 Group A’s use of minimal versus extended backchannels over time
N = 10 Pre-test Post-test 1 Post-test 2
Type of Backchannel
Total x̄ % of Total BCs
SD Total x̄ % of Total BCs
SD Total x̄ % of Total BCs
SD
Minimal 372 82.1 10.6 182 62.1** 8.49 232 60.4** 13.02

35
Response (p<.003) (p<.002)
Extended Response
29 7 4.37 62 18**
(p<.009)
9.04 78 23**
(p<.004)
13.49
(x̄ difference of Pre-test Post-test 1, and Pre-test Post-test 2 significant at p<.05 level = *; significant at p<.01 level =**)
Table 8 Group B’s use of minimal versus extended backchannels over time
N = 10 Pre-test Post-test 1 Post-test 2
Type of Backchannel
Total x̄ % of
Total BCs
SD Total x̄ % of Total BCs
SD Total x̄ % of Total BCs
SD
Minimal Response
302 79.7 10.87 157 59.1**
(p<.001)
9.09 269 66.9*
(p<.022)
12.87
Extended Response
23 7.1 4.43 47 17.1**
(p<.001)
7.23 51 14.5*
(p<.015)
10.01
(x̄ difference of Pre-test Post-test 1, and Pre-test Post-test 2 significant at p<.05 level = *; significant at p<.01 level =**)
Table 9 Group Z’s use of minimal versus extended backchannels over time
N = 10 Pre-test Post-test 1 Post-test 2
Type of Backchannel
Total x̄ % of
Total BCs
SD Total x̄ % of
Total BCs
SD Total x̄ % of Total BCs
SD
Minimal Response
321 74.4 11.3 241 75.5 10.79 398 82.4 5.6
Extended Response
48 11.2 6.55 27 10.8 5.41 36 7.4*
(p<.04)
3.31
(x̄ difference of Pre-test Post-test 1, and Pre-test Post-test 2 significant at p<.05 level = *; significant at p<.01 level =**)
36
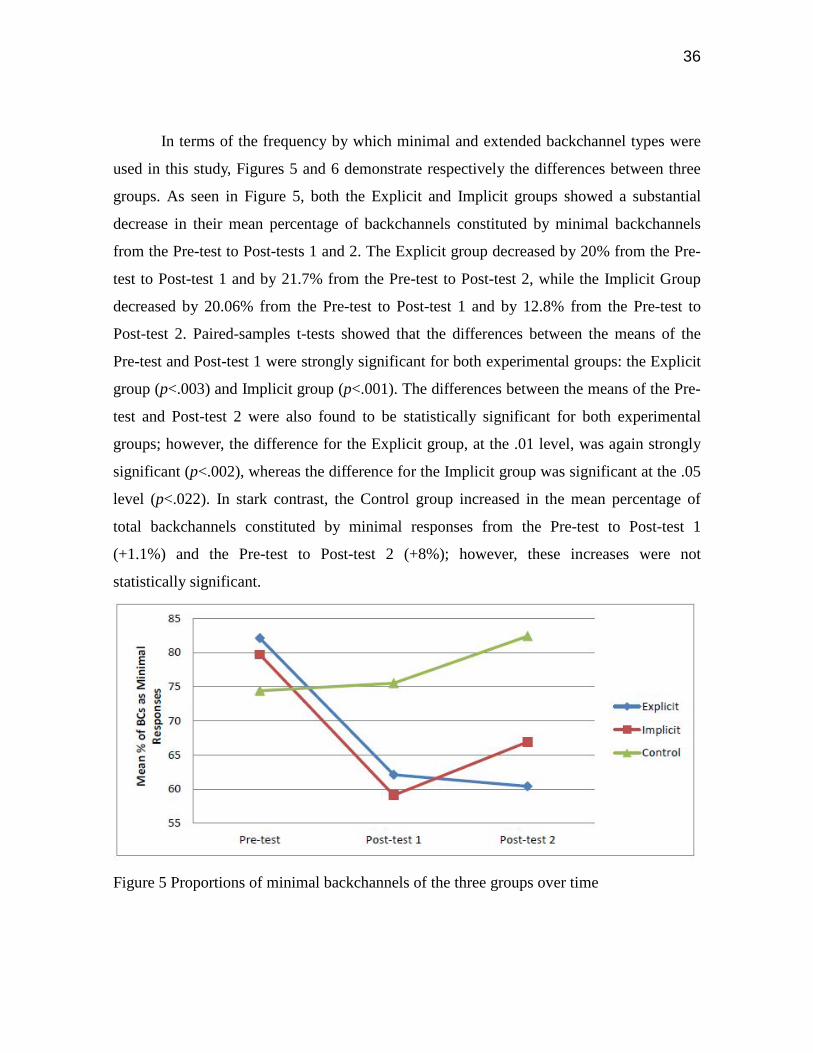
In terms of the frequency by which minimal and extended backchannel types were
used in this study, Figures 5 and 6 demonstrate respectively the differences between three
groups. As seen in Figure 5, both the Explicit and Implicit groups showed a substantial
decrease in their mean percentage of backchannels constituted by minimal backchannels
from the Pre-test to Post-tests 1 and 2. The Explicit group decreased by 20% from the Pre-
test to Post-test 1 and by 21.7% from the Pre-test to Post-test 2, while the Implicit Group
decreased by 20.06% from the Pre-test to Post-test 1 and by 12.8% from the Pre-test to
Post-test 2. Paired-samples t-tests showed that the differences between the means of the
Pre-test and Post-test 1 were strongly significant for both experimental groups: the Explicit
group (p<.003) and Implicit group (p<.001). The differences between the means of the Pre-
test and Post-test 2 were also found to be statistically significant for both experimental
groups; however, the difference for the Explicit group, at the .01 level, was again strongly
significant (p<.002), whereas the difference for the Implicit group was significant at the .05
level (p<.022). In stark contrast, the Control group increased in the mean percentage of
total backchannels constituted by minimal responses from the Pre-test to Post-test 1
(+1.1%) and the Pre-test to Post-test 2 (+8%); however, these increases were not
statistically significant.
Figure 5 Proportions of minimal backchannels of the three groups over time

37
As Figure 6 reports, the Explicit and Implicit groups exhibited a considerable
increase in the mean percentage of backchannels constituted by extended responses from
the Pre-test to Post-tests 1 and 2. The mean percentage of the Explicit Group increased by
11% from the Pre-test to Post-test 1 and by 16% from the Pre-test to Post-test 2, whereas
the Implicit Group increased by 10% from the Pre-test to Post-test 1 and by 7.4% from the
Pre-test to Post-test 2. Paired-samples t-tests showed that the differences between the
means of the Pre-test and Post-test 1 were strongly significant for the Explicit group
(p<.009) and Implicit group (p<.001), and, once again, the difference was strongly
significant for the Explicit group from the Pre-test to Post-test 2 (p<.004), while it was
significant at the .05 level for the Implicit group (p<.015). Contrasting the path of the
experimental groups, the Control group exhibited decreases in the mean percentage of
backchannels constituted by extended responses from the Pre-test to Post-test 1 (-.4%) and
the Pre-test to Post-test 2 (-3.8%). The latter of which was statistically significant at the .05
level (p<.04).
Figure 6 Proportions of extended backchannels of three groups over time
Discourse Contexts Favoring Backchannels
As the primary discourse context attracting backchannel is the final clausal boundary, the

38
results in this section focus on the following areas: the mean percentages of final clause
boundaries (CBs) eliciting backchannels (BCs), and the mean percentages of total
backchannels constituted by backchannels occurring at final clause boundaries.
Accordingly, Tables 10, 11 and 12 present the results of these features of conversations for
Group A (Explicit), Group B (Implicit) and Group Z (Control) respectively at the three
points of measurement in this study.
Table 10 Group A’s backchannels at final clausal boundaries over time
N = 10 Pre-test Post-test 1 Post-test 2
x̄ % of Opps (SD)
x̄ % of BCs (SD)
x̄ % of Opps (SD)
x̄ % of BCs (SD)
x̄ % of Opps (SD)
x̄ % of BCs (SD)
Final Clausal Boundaries
57.8
(17.78)
52.68
(9.15)
45.8*
(17.73)
66.27*
(20)
52.5
(9.47)
58.82
(19.08)
(x̄ difference of Pre-test Post-test 1, and Pre-test Post-test 2 significant at p<.05 level = *; significant at p<.01 level =**)
Table 11 Group B’s backchannels at final clausal boundaries over time
N = 10 Pre-test Post-test 1 Post-test 2
x̄ % of Opps (SD)
x̄ % of BCs (SD)
x̄ % of Opps (SD)
x̄ % of BCs (SD)
x̄ % of Opps (SD)
x̄ % of BCs (SD)
Final Clausal Boundaries
62.1
(12.85)
62.46
(8.58)
42.1*
(8.91)
57.24
(12.44)
50.3*
(10.14)
53.06
(14.69)
(x̄ difference of Pre-test Post-test 1, and Pre-test Post-test 2 significant at p<.05 level = *; significant at p<.01 level =**)
Table 12 Group Z’s backchannels at final clausal boundaries over time
N = 10 Pre-test Post-test 1 Post-test 2
x̄ % of Opps
x̄ % of BCs
x̄ % of Opps
x̄ % of BCs
x̄ % of Opps
x̄ % of BCs

39
(SD) (SD) (SD) (SD) (SD) (SD)
Final Clausal Boundaries
65.6
(14.57)
59.78
(9.8)
44.4**
(14.44)
53.68
(17.47)
55.7
(9.33)
52.24
(8.87)
(x̄ difference of Pre-test Post-test 1, and Pre-test Post-test 2 significant at p<.05 level = *; significant at p<.01 level =**)
Examining the three groups collectively, Figure 7 compares the three groups’ mean
percentages of final clause boundaries (CBs) eliciting backchannels (BCs), and Figure 8
compares the three groups’ mean percentages of total backchannels constituted by
backchannels occurring at final clause boundaries. While there was some variation in the
range of each group, Figure 7 shows that the general trend for all three groups was to send
backchannels much less frequently at final clause boundary opportunities in Post-test 1 as
compared to the Pre-test and then, in Post-test 2, to revert to a level closer to their original.
The decrease in mean percentage from the Pre-test to the Post-test 1 was statistically
significant for all three groups; however, the Implicit group was the only group to record a
statistically significant decrease from the Pre-test to the Post-test 2.
Figure 7 Proportions of final clause boundaries attracting backchannels over time

40
Concerning the proportions of total backchannels constituted by backchannels at
final clause boundaries, Figure 8 demonstrates the disparity between the Explicit group and
the other two groups. The mean percentage of the Explicit Group increased by 13.59%
from the Pre-test to Post-test 1 and by 6.14% from the Pre-test to Post-test 2. In contrast,
the Implicit group decreased from the Pre-test to Post-test 1 by 5.22% and by 9.4% from
the Pre-test to Post-test 2, and the Control group decreased by 6.1% and 7.54%
respectively.
Figure 8 Proportions of BCs constituted by BCs at final clause boundaries over time
Simultaneous Speech Backchannels (SSBs)
Tables 13, 14 and 15 report on the use of Non-laughter simultaneous speech backchannels
(SSBs) for Group A (Explicit), Group B (Implicit) and Group Z (Control) respectively at
the three points of measurement in this study. Mean scores (with standard deviations) and
the mean percentage of backchannels constituted by Non-laughter SSBs (with standard
deviations) are presented.

41
Table 13 Group A’s SSBs over time
N = 10 Pre-test Post test 1 Post test 2 Types
of SSBs
Total x̄ (SD)
x̄ % of BCs (SD)
Total x̄ (SD)
x̄ % of BCs (SD)
Total x̄ (SD)
x̄ % of BCs (SD)
Non-laughter
77 7.7
(3.83)
17.48
(7.21)
55 5.5**
(3.72)
18.69
(8.76)
51 5.1**
(3.14)
14.12*
(7.91)
(x̄ difference of Pre-test Post-test 1, and Pre-test Post-test 2 significant at p<.05 level = *; significant at p<.01 level =**) Table 14 Group B’s SSBs of over time
N = 10 Pre-test Post test 1 Post test 2 Types
of SSBs
Total x̄ (SD)
x̄ % of BCs (SD)
Total x̄ (SD)
x̄ % of BCs (SD)
Total x̄ (SD)
x̄ % of BCs (SD)
Non-laughter
51 5.1
(5.45)
13.08
(9.81)
47 4.7
(3.34)
17.39
(10.83)
58 5.8
(3.01)
15.41
(8.78) (x̄ difference of Pre-test Post-test 1, and Pre-test Post-test 2 significant at p<.05 level = *; significant at p<.01 level =**) Table 15 Group Z’s SSBs over time
N = 10 Pre-test Post test 1 Post test 2 Types
of SSBs
Total x̄ (SD)
x̄ % of BCs (SD)
Total x̄ (SD)
x̄ % of BCs (SD)
Total x̄ (SD)
x̄ % of BCs (SD)
Non-laughter
61 6.1
(3.03)
13.66
(5.68)
61 6.1
(1.45)
19.86**
(4.74)
75 7.5
(2.84)
15.9
(5.99) (x̄ difference of Pre-test Post-test 1, and Pre-test Post-test 2 significant at p<.05 level = *; significant at p<.01 level =**)
Looking at the data concerning Non-laughter SSBs collectively, Figure 9 shows that
the general paths of the Implicit and Control groups mirrored one another by starting
comparatively low, remaining fairly stable from the Pre-test to Post-test 1, and then sharply
increasing from Post-test 1 to Post-test 2 (by 11 and 14 respectively). The Explicit group, in
contrast, showed a sustained decline, of 12 from the Pre-test to Post-test 1, and then another

42
decrease of 4 from Post-test 1 to Post-test 2. These decreases were found to be strongly
significant (p<.001 and p<.001 respectively).
Figure 9 Non-laughter SSBs of the three groups over time
NESs Observers’ Perceptions
Tables 16, 17 and 18 report on the NES observers’ perceptions (according to their ratings
on the modified version of Hecht’s conversational satisfaction questionnaire described
above) of the conversational performances for Group A (Explicit), Group B (Implicit) and
Group Z (Control) respectively at the three points of measurement in this study. To provide
a general idea as to how the overall ratings compared across participant groups at the three
tests, the researcher has divided the 17 items in the questionnaire into two groups
distinguished by the positive and negative connotations associated with each rating (see
Hecht, 1978). For instance, in the items in group one (1, 2, 3, 4, 5, 6, 7, 10, 11, 13 and 16),
a low score would indicate a desirable effect, whereas for the items in group two (8, 9, 12,
14, 15 and 17), a high score would convey a desirable effect. The random presentation of
the video recorded conversations ensured that the NES observers did not have any
knowledge as to the time-line of the conversations or which group each JEFL belonged to.

43
Table 16 NES observers’ perceptions of Group A over time
Items on the Questionnaire N = 10
Rating Scale: 1 (strongly agree) to 7 (strongly disagree)
Pre Post 1 Post 2
x̄ SD x̄ SD x̄ SD
Group 1 items:
1. The JEFL let his/her partner know that the partner was communicating effectively.
2.81 .80 2.23** .66 2.24* .47
2. The JEFL showed his/her partner that they understood what their partner said.
2.81 .84 2.2** .69 2.4 .62
3. The JEFL showed that they were listening attentively to what their partner said.
2.21 .6 1.83 .37 1.93* .38
4. The JEFL expressed a lot of interest in what their partner had to say.
2.64 .71 2.02* .38 2.15* .53
5. The conversation went smoothly. 3.28 1.13 2.2** .57 2.52** .56
6. The JEFL encouraged partner to continue talking.
2.82 .95 2.55 .66 2.5 .61
7. The feelings that the JEFL expressed by means of listening feedback during the conversation seemed authentic ( …).
3.22 .84 2.32** .75 2.46** .48
10. The JEFL was polite. 2.06 .47 1.5* .22 1.44** .26
11. The JEFL appeared warm and friendly. 2.34 .66 1.83* .32 1.81* .42
13. The JEFL appeared interested and concerned. 2.73 .72 2.18* .39 2.13* .34
16. When the JEFL did not understand, they were able to clearly convey this to their conversational partner with their listening feedback.
3.19 .73 2.39* .61 2.36* .39
Group 2 items:
8. The JEFL seemed impatient. 6.1 .38 6.36* .2 6.34 .28
9. The JEFL seemed cold and unfriendly. 6.41 .34 6.46 .22 6.5 .27
12. The JEFL was impolite. 6.52 .29 6.74* .17 6.75* .2
14. The JEFL interrupted their partner at times. 6.18 .29 6.59* .13 6.59** .31
15. The JEFL seemed to want to avoid speaking. 5.14 .86 5.99** .55 5.76* .27

44
17. The JEFL’s listening behavior seemed inadequate in some ways.
5.1 .72 5.89** .54 5.7* .69
(x̄ difference of Pre-test Post-test 1, and Pre-test Post-test 2 significant at p<.05 level = *; significant at p<.01 level =**)
Table 17 NES observers’ perceptions of Group B over time
Items on the Questionnaire N = 10
Rating Scale: 1 (strongly agree) to 7 (strongly disagree)
Pre Post 1 Post 2
x̄ SD x̄ SD x̄ SD
Group 1 items:
1. The JEFL let his/her partner know that the partner was communicating effectively.
3.15 .79 2.49* .49 2.52** .52
2. The JEFL showed his/her partner that they understood what their partner said.
3.1 .81 2.59 .5 2.59* .52
3. The JEFL showed that they were listening attentively to what their partner said.
2.54 .63 2.07 .29 2.12* .31
4. The JEFL expressed a lot of interest in what their partner had to say.
3.06 .7 2.5* .53 2.52* .61
5. The conversation went smoothly. 3.89 .97 2.98** .72 2.89* .73
6. The JEFL encouraged partner to continue talking.
3.12 .65 2.63 .48 2.9 .65
7. The feelings that the JEFL expressed by means of listening feedback during the conversation seemed authentic ( …).
3.5 .84 2.56* .52 2.71** .6
10. The JEFL was polite. 2.06 .24 1.54** .2 1.65* .33
11. The JEFL appeared warm and friendly. 2.4 .58 1.9** .33 1.97 .45
13. The JEFL appeared interested and concerned. 2.94 .68 2.41 .46 2.47 .46
16. When the JEFL did not understand, they were able to clearly convey this to their conversational partner with their listening feedback.
3.84 .82 2.69** .65 2.88** .58
Group 2 items:
8. The JEFL seemed impatient. 5.97 .54 6.31 .39 6.29 .34
9. The JEFL seemed cold and unfriendly. 6.18 .33 6.34 .38 6.45 .2

45
12. The JEFL was impolite. 6.3 .29 6.63 .31 6.53 .35
14. The JEFL interrupted their partner at times. 6.52 .24 6.54 .14 6.56 .17
15. The JEFL seemed to want to avoid speaking. 4.91 .82 5.77* .71 5.66 .57
17. The JEFL’s listening behavior seemed inadequate in some ways.
4.61 .9 5.76* .48 5.59** .51
(x̄ difference of Pre-test Post-test 1, and Pre-test Post-test 2 significant at p<.05 level = *; significant at p<.01 level =**)
Table 18 NES observers’ perceptions of Group Z over time
Items on the Questionnaire N = 10
Rating Scale: 1 (strongly agree) to 7 (strongly disagree)
Pre Post 1 Post 2
x̄ SD x̄ SD x̄ SD
Group 1 items:
1. The JEFL let his/her partner know that the partner was communicating effectively.
2.6 .8 2.19 .57 2.19 .44
2. The JEFL showed his/her partner that they understood what their partner said.
2.71 .79 2.24* .68 2.34* .46
3. The JEFL showed that they were listening attentively to what their partner said.
2.55 1.17 2.04 .44 2.06 .41
4. The JEFL expressed a lot of interest in what their partner had to say.
2.6 .83 2.34 .65 2.47 .57
5. The conversation went smoothly. 3.2 1.01 2.57* .71 2.65* .46
6. The JEFL encouraged partner to continue talking.
2.85 .97 2.45 .73 2.75 .5
7. The feelings that the JEFL expressed by means of listening feedback during the conversation seemed authentic ( …).
3.24 .8 2.55** .67 2.56* .52
10. The JEFL was polite. 2.03 .4 1.59* .24 1.55* .23
11. The JEFL appeared warm and friendly. 2.3 .47 1.98* .33 2.06* .43
13. The JEFL appeared interested and concerned. 2.56 .54 2.34 .51 2.41 .48
16. When the JEFL did not understand, they were able to clearly convey this to their conversational partner with their listening feedback.
3.15 .79 2.66* .82 2.74* .54

46
Group 2 items:
8. The JEFL seemed impatient. 6.06 .5 6.36* .4 6.29 .54
9. The JEFL seemed cold and unfriendly. 6.22 .64 6.47 .26 6.48 .3
12. The JEFL was impolite. 6.44 .25 6.58 .19 6.63* .13
14. The JEFL interrupted their partner at times. 6.15 .42 6.25 .53 6.31 .24
15. The JEFL seemed to want to avoid speaking. 5.33 .67 5.46 .61 5.7 .48
17. The JEFL’s listening behavior seemed inadequate in some ways.
5.35 .74 5.7 .62 5.64 .46
(x̄ difference of Pre-test Post-test 1, and Pre-test Post-test 2 significant at p<.05 level = *; significant at p<.01 level =**)
As the items in the questionnaire have been separated into the two groups described
above, it is possible to compare the sum totals of average responses to items in each group
over time and between participant groups in this study. Figure 10 provides an illustration
comparing the items in group one between participant groups over time. In this line-graph,
the figures on the y-axis represent the sum of the average ratings in response to the group of
items, while the x-axis again shows the differences in performance over time. The line-
graph demonstrates that the general paths of the three participant groups were quite similar
in that the NES observers’ perceptions greatly improved from the Pre-test to Post-test 1,
and then experienced a slight decrease from Post-test 1 to Post-test 2. Whereas the Control
group (Group Z) followed a similar path generally, the experimental groups experienced
considerably greater improvements in ratings from the Pre-test to Post-tests 1 and 2.
Specifically, the average NES observers’ ratings improved by 7.24 from the Pre-test to
Post-test 1 and by 6.39 from the Pre-test to Post-test 2 for the Implicit group, by 6.82 from
the Pre-test to Post-test 1 and by 6.02 from the Pre-test to Post-test 2 for the Explicit group,
and by 4.84 from the Pre-test to Post-test 1 and by 4.01 from the Pre-test to Post-test 2 for
the Control group.

47
Figure 10 NES Observers’ perceptions of three groups: Group 1 items
Figure 11 demonstrates the group differences pertaining to the items in group two
over time. Similar to the findings in group one above, the line-graph below also
demonstrates that the NES observers’ perceptions improved for all three groups from the
Pre-test to Post-test 1. The experimental groups also then showed a slight decrease in
positive perceptions from Post-test 1 to Post-test 2, while the Control group showed a slight
increase. Overall, however, the experimental groups experienced a substantially greater
improvement in ratings from the Pre-test to the Post-tests 1 and 2. That is, the average NES
observers’ ratings improved by 2.86 from the Pre-test to Post-test 1 and by 2.59 from the
Pre-test to Post-test 2 for the Explicit group, by 2.54 from the Pre-test to Post-test 1 and by
2.19 from the Pre-test to Post-test 2 for the Implicit group, and by 1.27 from the Pre-test to
Post-test 1 and by 1.5 from the Pre-test to Post-test 2 for the Control group.

48
Figure 11 NESs Observers’ perceptions of three groups: Group 2 items
Interviews
This section presents the quantitative and qualitative data elicited by the interviews of the
participant groups at three points of measurement in this study (i.e., the Pre-test, Post-test 1
and Post-test 2). These findings are divided into three subsections. The first subsection
reports on the JEFLs’ development in dealing with situations of non-understanding. It
should be noted that disagreement situations were excluded from this analysis because they
occurred only four times in the 90 conversations. Lastly, the final two subsections present
the JEFLs’ opinions regarding their rate of progress at the time of Post-test 1 and 2
respectively.
Dealing with Situations of Non-understanding
Tables 19, 20 and 21 report on the reactions at points of non-understanding for Group A
(Explicit), Group B (Implicit) and Group Z (Control) respectively at the three points of
measurement in this study. Data are presented in two areas: the use of unconventional

49
backchannels and the use of conversational repair strategies (which are further broken
down into minimal versus lengthier conversational repair strategies).
Table 19 Group A’s reactions at points of non-understanding over time
N = 10
NONUs
Unconventional BCs
Conversational Repair Strategies
Minimal BCs Lengthier expressions
Total x̄ % of NONUs
(SD)
Total x̄ % of NONUs
(SD)
Total x̄ % of NONUs
(SD)
Pre 49 36 69.41
(11.66)
13 30.6
(11.66)
0 0
(0)
Post 1 32 10 25.17**
(28.55)
13 44**
(11.2)
9 30.83**
(25.47)
Post 2 30 12 31.38**
(22.95)
11 50.93*
(30.46)
7 17.69*
(19.79)
(x̄ difference of Pre-test Post-test 1, and Pre-test Post-test 2 significant at p<.05 level = *; significant at p<.01 level =**) Table 20 Group B’s reactions at points of non-understanding over time
N = 10
NONUs
Unconventional BCs
Conversational Repair Strategies
Minimal BCs Lengthier expressions
Total x̄ % of NONUs
(SD)
Total x̄ % of NONUs
(SD)
Total x̄ % of NONUs
(SD)
Pre 46 34 73.17
(11.82)
10 23.17
(10.84)
2 3.67
(7.77)
Post 1 31 19 58.83
(31.27)
9 31.17
(19.82)
3 10
(21.08)

50
Post 2 29 20 68.33
(22.5)
8 28.33
(18.92)
2 3.33
(10.54)
(x̄ difference of Pre-test Post-test 1, and Pre-test Post-test 2 significant at p<.05 level = *; significant at p<.01 level =**)
Table 21 Group Z’s reactions at points of non-understanding over time
N = 10
NONUs
Unconventional BCs
Conversational Repair Strategies
Minimal BCs Lengthier expressions
Total x̄ % of NONUs
(SD)
Total x̄ % of NONUs
(SD)
Total x̄ % of NONUs
(SD)
Pre 44 28 62.83
(16.35)
14 33
(15.15)
2 4.17
(9)
Post 1 25 15 59.17
(16.87)
9 37.5
(21.25)
1 3.33
(10.54)
Post 2 27 17 62.5
(22.65)
9 32.5
(24.99)
1 5
(15.81)
(x̄ difference of Pre-test Post-test 1, and Pre-test Post-test 2 significant at p<.05 level = *; significant at p<.01 level =**)
Figures 12 and 13 illustrate the data collectively. First, in describing Figure 12, the
y-axis corresponds to the mean percentage of non-understanding situations (NONUs)
eliciting unconventional responses (i.e., conveying understanding and agreement when, in
fact, they had not understood), while the x-axis demonstrates the differences in
performance longitudinally. Accordingly, it can be seen that the Explicit group displayed
the greatest initial and sustained improvement in this area. The Implicit group exhibited a
moderate decrease initially at Post-test 1, but this level of improvement was not maintained
at Post-test 2. The performance of the Control group, in comparison, remained fairly
constant throughout.

51
Figure 12 NONUs eliciting unconventional backchannels
Second, Figure 13 focuses on the three groups’ ability to use the lengthier
conversational repair strategies (CRSs). Accordingly, the figures on the y-axis represent the
mean percentage of non-understanding situations eliciting lengthier conversational repair
strategies for each group, while the x-axis again demonstrates the differences in
performance longitudinally. Once again, the Explicit group showed the greatest and most
sustained improvement, while the Implicit group showed a modest improvement initially at
Post-test 1 but then a decrease at Post-test 2. The Control group again did not show any
noticeable change over time.

52
Figure 13 NONUs eliciting conversational repair strategies
Perceived Development from the Pre-test to Post-test 1
One common feeling for members of all three groups in the qualitative data of Post-test 1
was a general feeling of increased confidence due to the experience of communicating with
a NES in an authentic setting. Unsurprisingly, responses from members of the Implicit
group reflected that the benefits of their exposure to NESs went beyond the Pre-test and
also occurred as part of the Implicit instruction they received. Concerning this treatment,
the following responses show various members of this group pointing to general areas of
improvement and the methods they used to achieve them:
Kouki: I tried speak more like native speaker style, and give bigger reactions. Meo: I tried to copy natives as much as I could. From first conversation, I know I have to speak more and ask more questions, and I tried to do this. Mayumi: The best thing that helped me was comparing what I did with what the natives did. I learned that making mistakes is not as important as keep talking. Shio: Natives make me feel relaxed and teach me that I must speak more and try to give my opinions sometimes.

53
It appears, then, that several members of the Implicit group were trying to adopt the
conversational style of NESs, which they seemed to equate with speaking more.
When commenting on their Post-test 1 performances, members of the Explicit group
also mentioned the instruction they received as a reason for their perceived improvements.
These members, however, seemed to be able to specify in greater detail and depth the areas
of their development related to what they had learned in class. The following excerpts
demonstrate this group’s awareness in terms of the frequency and placement by which they
sent backchannels, particularly SSBs:
Aria: I tried to give aizuchi (the Japanese laymen’s word for backchannel) mostly only when she finished her main idea like class taught me. Kazuya: In first conversation, I did not even think about it, but now I was thinking how much aizuchi and when I should give. Saya: I knew I shouldn’t aizuchi so much, especially when she is speaking, so I tried to give at the end of sentences.
As demonstrated by the following responses, this group’s learning awareness also extended
to include other areas such as variability and WTC:
Michiko: Before like too passive, I didn’t try to speak enough, and maybe I always give same boring aizuchi. Now, I’m using different aizuchi and sharing my thinking and asking questions.
Takanori: I feel better in second conversation because I can speak more and ask questions to my partner. Miya: I used the FOQ method (Statement + Fact or Opinion or Question as a response strategy) we learned in class. It helped me keep the conversation continue.
Regarding function, several respondents commented that learning how to use
conversational repair strategies facilitated communication, as follows:

54
Chieko: When I didn’t understand before, I did not know what to do, and conversation became broken. Because of lesson, I now had a confidence what to do and what I can say in this situation. Kazuya: I see aizuchi style is different about interrupting. Little aizuchi don’t need to give so much when he speaking, but more important time like when I need help or something, I should speak this feeling. Saya: I never changed my aizuchi at all, but in this conversation, I tried to change this and asked the person to explain more until I understand. Aria: Big thing for my better speaking is I know better what I should say in many different situations, especially when I don’t understand.
Perceived development from Post-test 1 to Post-test 2
Analyzing the qualitative data of the interviews in Post-test 2, a pattern to emerge in the
qualitative data of Post-test 2 was a general belief among the experimental groups that their
communicative competence had decreased since Post-test 1. The following responses
indicate that these members largely attributed their regression to not having had instruction
for a great length of time (i.e., eight weeks).
Explicit group:
Hika: I pretended to understand like before. I should have asked for help, but it was too fast and I was too late. Kazuya: Basically, I was too slow to reaction in conversation, and my aizuchi was too simple like at beginning. I needed more different kinds like my paper I have shows. Akie: I think I probably gave too many aizuchi, maybe even a lot when we was speaking. And, I did not speak enough or ask enough questions. Miya: I can’t have good conversation like before because I did not study for it. I should look at my class papers.
Implicit group:
Meo: I did not have any practice chance for this conversation, so I forget everything

55
from before. Sachi: I forgot the habits of native speakers because I didn’t have a chance to speak to someone. Kouki: It was so long since I talked to native that I became very nervous again and couldn’t focus enough on the conversation.
The responses of members of the Explicit group above again seemed to include greater
depth and understanding in explaining where they went wrong, and many implied that the
information they needed to perform better could be found in one of the many hand-outs
they had received in class. In comparison, members of the Control group did not report any
major changes regarding their conversational performances from Post-test 1 to Post-test 2;
however, the following replies suggested slight improvements in confidence:
Control group:
Tomomi: This was my third conversation, so I get less nervous every time. Akanori: I could speak more because I knew what to do from other conversations.
Discussion: Improvements in L2 English Backchannel Behavior
Approximating the Listenership of NESs
While both experimental groups adopted more native-like listening behavior after
treatment, the Explicit group (Group A) generally outpaced the Implicit group (Group B) in
this area. The Explicit group’s improvements were found to be strongly significant (i.e., at
the .01 level) from the Pre-test to Post-test 1 and also through to Post-test 2 in areas of
frequency, variability and SSBs. In comparison, a statistically significant improvement for
the Implicit group was observed at the .05 level in the area of frequency from the Pre-test to
Post-test 1; however, it was not evident at the time of Post-test 2. In the area of variability,
the Implicit group’s improvements were found to be strongly significant from the Pre-test
to Post-test 1 (at the .01 level) and significant at the .05 level from the Pre-test to Post-test
2. Regarding the Control group (Group Z), no significant improvements were found as
expected; however, in one of the subcategories of variability, the proportion of

56
backchannels constituted by Extended responses, the Control group’s performance
regressed as their mean percentage decreased significantly (at the .05 level) from the Pre-
test to Post-test 2.
Notably, there was one area of analysis in which a statistically significant decline
was found for all three groups: backchannels provided at final clausal boundary
opportunities (see Figure 7). This was unexpected because this discourse context, which has
been identified in the literature as the most common discourse context in English, was
explicitly taught to members of Group A. However, while all three groups sent significantly
less backchannels at final clausal boundaries from the Pre-test to Post-test 1, this decline
was only sustained for the Implicit group in Post-test 2. Although the across-the-board
decline between the Pre-test and Post-test 1 is somewhat difficult to explain, the fact that
Post-test 2 frequencies in this area (i.e., after no subsequent treatment) returned to near
original Pre-test levels for two of the three groups suggests that this discrepancy may have
been an aberration. The fact that the three groups were starting at approximately the same
point and the Explicit group consistently sent the most backchannels at this discourse
context thereafter would seem to suggest that they achieved the highest degree of success in
this area also. This is supported by the fact that the Explicit group showed marked increases
in the proportions of total backchannels constituted by backchannels at final clause
boundaries from the Pre-test to Post-tests 1 and 2, while the Implicit and Control groups
showed a steady decline. Finally, the fact that the Implicit and Control groups’
performances consistently deteriorated in this area (from the Pre-test to Post-tests 1 and 2)
offers another example in which a lack of treatment may be connected with a deterioration
of skills.
The overall findings, which showed that explicit treatment greatly improved JEFLs’
backchannel behavior, seem to go against the conventional wisdom that L2 backchannels
are particularly difficult to learn in a way that is not completely implicit due to their
spontaneity and automaticity in real-time conversations (Cutrone 2005; Ward et al. 2007).
As most JEFLs had never previously even considered their L2 backchannel behavior, it

57
appears that raising their awareness of this all-important feature of language for the first
time was enough to make a dramatic impact on their L2 conversational behavior.
There was also evidence in the JEFLs’ interview data to suggest strong biases
towards the English used by NESs. This is consistent with the observations of Suzuki
(2010), who pointed out that teacher training programmes in Japan still present only
standard American and/or standard British English as a single normative variety of English.
Several JEFLs attributed their perceived improvements in their post-treatment interviews to
noticing differences between their own conversational output and NESs’ output. The fact
that learners consciously perceived the difference between the feature in their target
language and their own can be said to be evidence of “noticing the gap” (Schmidt & Frota,
1986, p. 311). Clearly, the resolution of such an enormous issue as to which model of
English should be used in Japan is beyond the focus of this current investigation; however,
the writer strongly believes that this aspect of the study has touched upon on an important
issue that seems to be in dire need of re-examination in Japan (Jenkins, 2003; Seidlhofer,
2004; Widdowson, 1997).
Conversational Involvement
In terms of conversational involvement, both experimental groups showed benefits of
instruction; however, the Explicit group (Group A) again generally outpaced the Implicit
one (Group B). The Explicit group’s improvements were found to be strongly significant
from the Pre-test to Post-test 1 in all three subcategories of Involvement in Conversation:
WTC scores, amount spoken as primary speaker, and number of follow-up questions asked.
The Explicit group’s initial improvements in this area varied among the sub-skills at the
delayed Post-test 2. That is, from the Pre-test to Post-test 2, the improvement in mean WTC
scores was again found to be significant at the .01 level, while the increase in mean number
of questions was significant at the .05 level, and the difference in mean number of words
was not found to be statistically significant. In comparison, the improvements in mean
WTC scores for the Implicit group were found to be strongly significant from the Pre-test
to Post-test 1 and from the Pre-test to Post-test 2; however, no significant improvements

58
were evident in the other two subcategories. Finally, no significant improvements for the
Control group were found in this area; however, as was the case with the Variability
category, the Control group’s performance significantly regressed (at the .05 level) in one
of the subcategories of this skill-set: mean number of questions asked. This further suggests
that a lack of treatment may eventually lead to skill loss.
Some of the results in this area were predictable. For instance, it was not surprising
at all that the group that received explicit instruction was the only group to show
improvements in the use of conversational management techniques. These improvements
occurred not only because the JEFLs in this group were taught specific expressions to use
in certain situations, but more importantly because they were explicitly made aware of the
negative perceptions that their cross-cultural interlocutors would have of them if they
persisted to speak English with a Japanese mind-set (i.e., negatively transfer their
backchannel behaviour from their L1 to L2 English). As reflected by their WTC scores and
interview responses over time, members of the Explicit group (Group A) seemed to have
been motivated to change their behaviour in order make a good impression across cultures.
This was also demonstrated by the fact that the Explicit group was the only group to ask
significantly more questions from the Pre-test to Post-test 1 and the Pre-test to Post-test 2.
Still, this seems be an area that needs to be constantly reinforced, as suggested by the
decline in number of questions from Post-test 1 to Post-test 2. Another finding that was not
surprising was the fact that the Implicit group’s (Group B) WTC scores significantly
increase over time. The researcher believes that increased confidence (and decreased
language anxiety) exhibited by the Implicit group in this study is mainly due to their
extensive exposure to NESs. At the study’s onset, most students admitted to being
especially nervous because they did not have much, if any, experiencing communicating
with a NES in a social context. The more experience they gained doing so, the less scared
they seemed to feel about it.
Concerning how much participants in each group spoke, the results were largely
inconclusive. Although members of the Explicit group produced significantly more words

59
directly after treatment, their word output in Post-test 2 returned to near its Pre-test level.
Further, the Implicit and Control groups also showed a similar increase in word output from
the Pre-test to Post-test 1 and then a similar decrease from the Pre-test to Post-test 2 (see
Figure 3). Thus, the increase may have had more to do with the JEFLs, collectively, feeling
more confident (and less anxious) in speaking in Post-test 1 because they knew what to
expect from their experience in the Pre-test. Moreover, the fact that the standard deviations
are quite high across groups in this category suggests considerable variability within the
performances of the JEFLs.
Conversational Repair Strategies
Although the success of explicit instruction on the aspects of backchannel production that
are thought to be spontaneous and automatic may be somewhat surprising, it was rather
predictable that the Explicit group was the only group in this study to improve in this area.
In a similar study in which Takahashi (2001) investigated four input enhancement
conditions for Japanese learners acquiring biclausal request forms in English, the students
receiving explicit instruction were much better able to produce the set expressions (i.e.,
formulaic chunks of language) needed to continue the conversation and/or avoid
communication breakdown. As shown in Figures 12 and 13 above, the Explicit group
(Group A) clearly outpaced the other two groups (Groups B and Z) from Pre-test to Post-
test 2 by demonstrating a significant increase in the amount of lengthy conversational
repairs and a significant decrease in unconventional backchannels at situations of non-
understanding employed. This can be explained by the fact that members of the Explicit
group were taught specific linguistic expressions to use to manage a wide array of
conversational situations (i.e., such as when they do not understand) and given practice
opportunities and feedback to help them hone their skills. In comparison, the other groups
(Groups B and Z) did not use a wide range of conversational repair strategies to manage
conversational situations simply because they may have not even been exposed to such
useful phrases and did not receive any training in how and when to use them.
Intercultural Communicative Competence (ICC)

60
The data analysis of this category produced some clear and interesting findings (see Figures
10 and 11). First and foremost, this was another category in which the Explicit group
(group A) outpaced the other two groups by a wide margin. This was demonstrated by the
Explicit group’s statistically significant improvement on 14 of 17 items on Hecht’s (1978)
modified questionnaire from the Pre-test to Post-test 1 (6 of which were significant at
the .01 level), and 13 of 17 items from the Pre-test to Post-test 2 (4 of which were
significant at the .01 level). It was somewhat predictable that the JEFL group that came the
closest to adopting NES norms also received the highest ratings in the NESs’
conversational satisfaction questionnaires. This finding supports the hypotheses that
backchannel conventions that are similar across cultures lead to positive perceptions and
higher degrees of conversational satisfaction, whereas backchannel practices which differ
run a much greater risk of being perceived negatively and/or resulting in
miscommunication across cultures (Cutrone, 2005; White, 1989).
Interestingly, the Implicit group (Group B) and the Control group (Group Z) also registered
several significant improvements in this category. Specifically, the Implicit group showed a
statistically significant improvement on 9 of 17 items from both the Pre-test to Post-test 1
and the Pre-test to Post-test 2 (in both cases, 4 items were significant at the .01 level). The
Control group (Group Z) showed a statistically significant improvement on 7 of 17 items
from both the Pre-test to Post-test 1 and the Pre-test to Post-test 2 (only 1 item from the
Pre-test to Post-test 1was significant at the .01 level). The findings that demonstrated some
level of improvement (i.e., increased ratings) for all three groups in this area were
somewhat unexpected; however, these data may be linked to the NES observers (i.e., the
raters) picking up on the JEFLs’ increased confidence. As mentioned above, the JEFLs
were especially nervous at the study’s onset because they had no idea what to expect (and
many had not even spoken socially with a NES before). However, as the study progressed,
the JEFLs reported higher degrees of confidence and less anxiety across the board because
they were more familiar and comfortable with the study’s process and their role in it.
Relating the Findings to SLA Theory

61
In relation to Schmidt’s (1993) noticing hypothesis and the more general question of how
input becomes intake in the process of SLA, this is a debate that the writer does not expect
to be resolved any time soon. The finding that explicit treatment (i.e., drawing attention to
non-salient features of language such as listener responses) facilitates learning would seem
to offer encouragement for the noticing hypothesis; however, it falls short of providing
conclusive evidence supporting it. There are several issues involving the testability of the
noticing hypothesis, which include an inconsistent and vague interpretation of what it
means to notice in the research literature, the failure to recognize noticing as an internal
process that cannot be observed directly, and the fact that noticing requires a high degree of
inference from observation of behaviour (Cross, 2002; Truscott, 1998). Schmidt (1990,
1993) equates noticing with attention plus awareness, which is operationalized as a
cognitive process that takes place both during and directly after exposure to the input that is
available for self-report. Therefore, as mentioned above, the fact that the Explicit group
(Group A) received explicit input enhancement (i.e., increased opportunities to notice),
subsequently demonstrated a much greater improvement than the other groups (Group B
and Z) in terms of actual conversational performance (and L2 backchannel behaviour) over
time, and then were able to report on specific areas of improvement by referring to what
they had learned in class (i.e., what they had noticed) would seem to offer support for, at
the very least, a mild version of the noticing hypothesis.
Additionally, the findings of this study would also seem to support Ellis’ (2006a)
belief that explicit input enhancement is particularly useful in dealing with acquisition
issues related to lack of salience and L1-influenced blocking. Regarding the lack of salience
issue, non-salient features of language such as backchannels seem to require intentionally
focused attention to facilitate effective L2 learning. Concerning the L1-influenced blocking
problem, the findings of this study suggest that consciously channelling attention to
backchannel behavior may have helped change the cues that learners focused upon in their
language process, which ultimately changed what their implicit learning systems were able
to take in. As the Control group’s lack of progress demonstrated throughout this study, it is
likely that without such a change in the attentional focus of cues, learners would continue to

62
demonstrate a great deal of L1 negative pragmatic transfer where backchannels are
concerned, perhaps only gradually showing glimpses of improvement after substantial L2
experience. Thus, as MacWhinney (2001) asserts, form-focused-instruction (FFI) can be
seen as a way to speed up the learning process.
As reported above, members of the Explicit group clearly showed the most
improvement in their backchannel behavior throughout the course of this study. However, it
is also worthy to note that members of the Implicit group also displayed considerable
improvements in several key areas of backchannel behavior. Schmidt’s (1983) case study
providing evidence of the implicit learning of L2 backchannel behavior in an immersion
setting, and the opinions given by many of the JEFLs, would seem to further support a
mixed approach. Accordingly, a sensible way forward may be a combination of these
methods in which implicit methods are used to supplement an explicit approach. This
would seem to be consistent with Nick Ellis’ (2008) explanation of how Schmidt’s (1993)
noticing hypothesis works:
once a stimulus representation is firmly in existence, that stimulation need never be noticed again; yet as long as it is attended for use in the processing of future input for meaning, its strength will be incremented and its associations will be tallied and implicitly catalogued. (p. 105)
In this description, Ellis also helps us understand how explicit knowledge is converted into
implicit knowledge. Hence, as it relates to the findings of this study, it appears that explicit
input enhancement (i.e., what draws learners attention) may be particularly helpful in
facilitating the learning in the early stages of pragmatic development; however, sustained
and long-term development in this area will likely depend on reinforcement opportunities
and how much the learner is able to use the newly learned skill in authentic settings.
Conclusion
In summarizing the findings of this study, RQs 1 and 2 are addressed in succession below.
First, concerning the effects of instruction on listening behavior, (RQ 1) the findings of this
longitudinal study demonstrate that instructional treatment clearly had a positive effect on
the listening behavior of both experimental groups, and (RQ 2) the group that received

63
explicit treatment, by and large, outpaced the group that received implicit treatment.
Although benefits of FFI in the teaching of L2 backchannel behavior have been shown, it is
difficult to reach any firm conclusions regarding Schmidt’s (1993) noticing hypothesis due
to the issues mentioned above. Noticing appears to be helpful in speeding up the process of
learning L2 backchannels, but it remains unclear as to whether it is actually necessary or
not. While this distinction may be particularly important to theorists, it is far less relevant to
classroom practitioners whose main goal is to help students learn the target language in the
most efficient way possible. Accordingly, the researcher adopts the position taken by Swan
(2005) as follows:
The role of instruction in a typical language classroom is not, surely, to attempt the impossible task of replicating the conditions of natural acquisition, but to compensate for their absence. (p. 393)
In the broader context of language pedagogy, the main value of the present study would be
in the general finding that pedagogical interventions, and most notably explicit input
enhancement, did indeed appear to have a positive effect on L2 backchannel behavior. This
not only provides support for the incorporation of backchannel behavior into the language
classroom and cross-cultural communication training in the JEFL context, but also provides
ELT professionals with some pedagogical suggestions moving forward. The researcher
hopes this study will serve as a platform for future investigation and diagnosis into this
somewhat neglected aspect of pragmatic competence.

64
List of References Alun, R. E. (2008). Teaching the speaking skill to Japanese students part 1: Construct &
practice. The Journal of Kanda University of International Studies, 20, 1-26. Anderson, J. R. & Lebriere, C. (1998). The atomic components of thought. Mahwah, NJ:
Erlbaum.
Blanche, P. (1987). The case for a pedagogy of pragmatics in foreign or second language teaching. RELC Journal, 18, 46-71.
Blundell, J., Higgens, J. & Middlemiss, N. (1982). Function in English. Oxford: Oxford University Press.
Boxer, D. (1993). Complaints as positive strategies: What the learner needs to know. TESOL Quarterly, 27, 277-299.
Brozyna, B. (2007). The teachability of interactional discourse signals in the classroom environment. Unpublished Master’s thesis, University of Reading, Reading.
Byram, M. (1997). Teaching and assessing intercultural communicative competence. Clevedon: Multilingual Matters.
Capper, S. (2000). Nonverbal communication and the second language learner: Some pedagogical considerations. The Language Teacher, 24(5), 19-23.
Clancy, P. M., Thompson, S. A., Suzuki, R. & Tao, H. (1996). The conversational use of reactive tokens in English, Japanese, and Mandarin. Journal of Pragmatics, 26, 355-387.
Clegg, F. (1982). Simple Statistics: A Course Book for the Social Sciences. Cambridge: Cambridge University Press.
Crawford, W. (2003). Back-channel transfer in cross-cultural second language conversation: Do native Japanese transfer more than native English speakers? Journal of Kitakyushu National College of Technology, 36, 155-163.
Cutrone, P. (2005). A case study examining backchannels in conversations between Japanese-British dyads. Multilingua - Journal of Cross-Cultural and Interlanguage Communication, 24, 237-274.
Cutrone, P. (2010). The backchannel norms of native English speakers: A target for Japanese L2 English learners. University of Reading Language Studies Working Papers, 2, 28-37.
Cutrone, P. (2011). Towards the learning of listener responses in the Japanese EFL context. Unpublished doctoral dissertation, University of Reading, Reading, UK.

65
Cross, J. (2002). ‘Noticing’ in SLA: Is it a valid concept? TESL-EJ, 6(3). Retrieved October 25, 2010 from http://www.cc.kyoto-su.ac.jp/information/tesl-ej23/a2.html
Dörnyei, Z. & Thurrell, S. (1992). Conversation and dialogues in action. Hemel Hempstead: Prentice Hall.
Duncan, S. (1974). On the structure of speaker-auditor interaction during speaking turns. Language in Society, 2, 161-180.
Duncan, S. & Fiske, D. (1977). Face to Face Interaction: Research, Methods, and Theory. Hillsdale: Erlabaum.
Ellis, N. C. (2005). At the interface: Dynamic interactions of explicit and implicit language knowledge. Studies in Second Language Acquisition, 27, 305-352.
Ellis, N. C. (2006a). Language acquisition as rational contingency learning. Applied Linguistics, 27, 1-24.
Ellis, N. C. (2006b). Selective attention and transfer phenomena in L2 acquisition: Contingency, cue competition, salience, interference, overshadowing, blocking, and perceptual learning. Applied Linguistics, 27, 164-194.
Ellis, N. C. (2008). Usage-based and form-focused SLA: The implicit and explicit learning of constructions. In A. Tyler, Y. Kim, & M. Takada (Eds.), Language in the context of use: Discourse and cognitive approaches to language (pp. 93-120). Berlin: Mouton de Gruyter.
Ellis, R. (2008). The study of second language acquisition (2nd edition). Oxford: Oxford University Press.
Fujimoto, D. T. (2007). Listener responses in interaction: A case for abandoning the term, backchannel. Journal of Osaka Jogakuin College, 37, 35-54.
Goldschneider, J. M. & DeKeyser, R. M. (2001). Explaining the “natural order of L2 morpheme acquisition” in English: A meta-analysis of multiple determinants. Language Learning, 51, 1-50.
Hecht, M. (1978). The conceptualization and measurement of interpersonal communication satisfaction. Human Communication Research, 4, 253-264.
Hess, L. J. & Johnston, J. R. (1988). Acquisition of back channel listener responses to adequate messages. Discourse Processes, 11, 319-335.
Jefferson, G. (2002). Is “no” an acknowledgment token? Comparing American and British uses of (+)/(-) tokens. Journal of Pragmatics, 34, 1345-1383.
Jenkins, J. (2003). World Englishes. London: Routlege.
Krashen, S. (1982). Principles and practice in second language acquisition. Oxford: Pergamon.

66
Lebra, T. (1976). Japanese Patterns of Behavior. Honolulu: The University of Hawaii Press.
LoCastro, V. (1987). Aizuchi: A Japanese conversational routine. In L. Smith (Ed.), Discourse across cultures: Strategies in world Englishes (pp. 101-113). London: Prentice Hall.
Markel, N. (1975). Coverbal behavior associated with conversation turns. In A. Kendon, R. Harris & M. R. Key (Eds.), Organization of Behavior in Face-to-Face Interaction (pp. 189-197). The Hague: Mouton.
Maynard, S. K. (1986). On back-channel behavior in Japanese and English casual conversation. Linguistics, 24(6), 1079-1108.
Maynard, S. K. (1987). Interactional functions of a noverbal sign: Head movement in Japanese dyadic conversations. Journal of Pragmatics, 11, 589-606.
Maynard, S. K. (1990). Conversation management in contrast: Listener responses in Japanese and American English. Journal of Pragmatics, 14, 397-412.
Maynard, S. K. (1997). Analyzing interactional management in native/non-native English conversation: A case of listener response. IRAL, 35, 37-60.
McCarthy, M. (2002). Good listenership made plain: British and American non-minimal response tokens in everyday conversation. In R. Reppen, S. M. Fitzmaurice & D. Biber (Eds.), Using corpora to explore linguistic variation (pp. 49-72). Philadelphia: John Benjamins.
MacWhinney, B. (2001). The competition model: The input, the context, and the brain. In P. Robinson (Ed.), Cognition and second language instruction (pp. 69-90). New York: Cambridge University Press.
McCarthy, M. (2002). Good listenership made plain: British and American non-minimal response tokens in everyday conversation. In R. Reppen, S. M. Fitzmaurice & D. Biber (Eds.), Using corpora to explore linguistic variation (pp. 49-72). Philadelphia: John Benjamins.
McCarthy, M. (2003). Talking back: “Small” interactional response tokens in everyday conversation. Research on Language and Social Interaction, 36, 33-63.
McCroskey, J. C. (1992). Reliability and validity of willingness to communicate scale. Communication Quarterly, 40, 16-25.
Mizutani, N. (1982). The listener's responses in Japanese conversation. Sociolinguistics News-letter, 13, 33-38.
Nikolova, D. (2008). English teaching in elementary schools in Japan: A review of a current government survey. Asian EFL Journal, 10. Retrieved November 3, 2011 from

67
http://www.asian-efl-journal.com/March_08_dn.php O’Keeffe, A. & Adolphs, S. (2008). Response tokens in British and Irish discourse: Corpus,
context and variational pragmatics. In A. Barron & K. Schneider (Eds.), Variational pragmatics (pp. 69-98). Amsterdam: John Benjamins.
O’Keeffe, A. Clancy, B. & Adolphs, S. (2011). Introducing Pragmatics in Use. Routledge: London.
O’Keeffe, A., McCarthy, M. & Carter, R. (2007). From Corpus to Classroom: Language Use and Language Teaching. Cambridge: Cambridge University Press.
Oreström, B. (1983). Turn-Taking in English Conversation. Lund: Lund University Press. Oshio, A., Abe, S. & Cutrone, P. (2012). Development, reliability, and validity of the
Japanese version of ten item personality inventory (TIPI-J). Japanese Journal of Personality Psychology, 21, 40-52.
Rose, K. R. (2005). On the effects of instruction in second language pragmatics. System, 33, 385-399.
Sacks, H. E., Schegloff, E. & Jefferson, G. (1974). A simple systematics in the organization of turn-taking for conversation. Language, 50, 696-735.
Sardegna, V. G. & Molle, D. (2010). Videoconferencing with strangers: Teaching Japanese EFL students verbal backchannel signals and reactive expressions. Intercultural Pragmatics, 7(2), 279-310.
Sato, Y. (2008). Oral communication problems and strategies of Japanese university EFL learners. Unpublished PhD Thesis, University of Reading, Reading, UK.
Schmidt, R. (1983). Interaction, accultration, and the acquisition of communicative competence: A case study of an adult. In N. Wolfson & E. Judd (Eds.), Sociolinguistics and language acquisition (pp. 137-174). Rowley: Newbury House.
Schmidt, R. (1990). The role of consciousness in second language learning. Applied Linguistics, 11, 129-158.
Schmidt, R. (1993). Consciousness, learning and interlanguage pragmatics. In G. Kasper & S. Blum-Kulka (Eds.), Interlanguage pragmatics (pp. 21-42). Oxford: Oxford University Press.
Schmidt, R. & Frota, S. (1986). Developing basic conversational ability in a second language: A case study of an adult learner of Portuguese. In R. R. Day (Ed.), Talking to learn: Conversation in second language acquisition (pp. 237-326). Rowley, MA: Newbury House.
Seidlhofer, B. (2004). Research perspectives on teaching English as lingua franca. Annual Review of Applied Linguistic, 24(2), 209-239.

68
Spitzberg, B. H. (2000). A model of intercultural communication competence. In L. Samovar & R. Porter (Eds.), Intercultural communication: A reader, 2nd edition (pp. 7-24). Belmont, CA: Wadsworth Publishing.
Stubbe, M. (1998). Are you listening? Cultural influences on the use of supportive verbal feedback in conversation. Journal of Pragmatics, 29(3), 257-289.
Suzuki, A. (2010). Introducing diversity into ELT: Student teacher responses. ELT Journal, 64(3), 1-9.
Swan, M. (2005). Legislation by hypothesis: The case of task-based instruction. Applied Linguistics, 26(3), 376-401.
Takahashi, S. (2001). The role of input enhancement in developing pragmatic competence. In K. R. Rose & G. Kasper (Eds.), Pragmatics in language teaching (pp. 171-199). Cambridge: Cambridge University Press.
Takimoto, M. (2009). The effects of input-based tasks on the development of learners’ pragmatic proficiency. Applied Linguistics, 30, 1-25.
The Japan Times (1983). Japanese mannerism is a key point in IBM case. The Japan Times, 23 January, p. 2.
Thonus, T. (2007). Listener responses as a pragmatic source for learners of English. CATESOL Journal, 19, 132-145.
Truscott, J. (1998). Noticing in second language: A critical review. Second Language Research, 14(2), 103-135.
Ward, N., Escalante, R., Yaffa, A. & Solorio, T. (2007). Learn to show you’re listening. Computer Assisted Language Learning. Retrieved September 8, 2010 from http://www.cs.utep.edu/nigel/papers/call.pdf
Ward, N. & Tsukahara, W. (2000). Prosodic features which cue back-channel responses in English and Japanese. Journal of Pragmatics, 32(8), 1177-1207.
White, S. (1989). Backchannels across cultures: A study of Americans and Japanese. Language in Society, 18, 59-76.
Widdowson, H. G. (1997). EIL, ESL, EFL: Global issues and local interests. World Englishes, 16, 135-146.
Yngve, V. (1970). On getting a word in edgewise. Chicago Linguistic Society, 6, 567-578.

69
List of Appendices Appendix A: An Example of a Transcribed Conversation Used in this Study Transcription Conventions • Listener responses are shown in italics below the primary speaker’s talk at the point
they occurred in the talk. • To protect the identity of the participants, pseudonyms are used in the speaker labels on
the left side of each transcribed line. • To not confuse readers with the colons that are used for a different purpose described
below, the speaker labels will be followed by a semi colon. • To further preserve anonymity, pseudographs (i.e., notations in parentheses) will be
used in instances where participants’ private information such as name, address and/or telephone number has been uttered in the conversation.
• Numbers in parentheses indicate elapsed time in hundredths of seconds of pauses occurring in the conversations. Parentheses with a dot (.) indicate a micropause and/or hesitation under .5 seconds. Pauses are timed using transcription software in this study (Praat Version 5.0.18).
• The equal sign “=” indicates latching - i.e., no interval between the end of a prior piece of talk and the start of a next piece of talk.
• The beginnings of simultaneous speech utterances are marked by placing an opening square bracket at each of the points of overlap, and placing the overlapping talk directly beneath the talk it overlaps.
• Closing square brackets indicate the point at which two simultaneous utterances end.
Metatranscription is shown as follows: • Empty parentheses ( ) indicate part of the transcription that is unintelligible. • Words between parentheses indicate the transcribers’ conjecture at the words or
utterances in the conversation that they are not completely certain of. • Words between double parentheses may indicate comments and/or features of the audio
materials other than actual verbalization. • L stands for laughter. • Other than apostrophes, which are used to show contraction between words,
punctuation symbols in these transcriptions are not used as regular English punctuation markers indicating grammatical category. While other, non-regular, grammatical functions are shown by symbols such as slashes and double slashes, other punctuation symbols such as question marks and colons are used to indicate prosodic features in these transcriptions.
Nonverbal behavior is shown by the symbols indicated below.

70
• h stands for audible breathing. ^ stands for vertical head movement (head nod). > stands for horizontal head movement (head shake). S stands for smile. ” indicates that eyebrows are raised. G indicates body or hand gestures.
• In cases where nonverbal behavior occurs concurrently with speech, symbols are placed directly above the speech with which it co-occurs (instances where two types of nonverbal behavior occur simultaneously are shown by underlining them both). Nonverbal behavior that is continuous and occurs for a period longer than 2 seconds will be noted by signaling the beginning and the end of the behavior in parentheses where it occurs in the conversation. (N.B. The parentheses containing the symbols below are solely used for separation purposes to make them easily identifiable in the specific examples below. Parentheses will not be used in this manner in the transcriptions as they have other specific functions, which have been outlined above.)
• A slash ( / ) marks the grammatical completion point of an internal clausal boundary (i.e., a clause which is continuative).
• Two slashes side by side ( // ) mark the grammatical completion point of a final clause boundary (i.e., a clause which is terminative). N.B. A final clause boundary is one that makes complete sense (i.e., fully meaningful) and could end the utterance there. In contrast, an internal clause is one in which the meaning is not complete, and there is a requirement for the utterance to go on in order for the meaning to be complete.
• A question mark ( ? ) at the end of a word and/or utterance indicates a clear rising vocal pitch or intonation (i.e., one that is clearly heard, and is shown to rise by at least 600 Hz using Praat software).
• An inverted question mark ( ¿ ) at the end of a word and/or utterance indicates a clear falling pitch or intonation (i.e., one that is clearly heard and is shown to fall by at least 600 Hz using Praat software).
• A colon ( : ) as in the word “ye:s” indicates the stretching of the sound it follows (i.e., only marked in cases where the stretching was extended greater than .5 seconds).
• A hyphen at the end of an uncompleted word indicates the disfluency of a truncated word. For instance, if the word “word” were truncated, it may be transcribed as “wor-”.
• A part of a word and/or phrase containing CAPITAL letters indicates that it has been said with increased volume and/or more emphatically than the rest of the phrase (i.e., only marked when the highest point of the stressed part of speech is 10 decibels greater than the lowest part of the surrounding parts of speech).
• The underscore sign ( _ ) indicates that the talk it precedes is low in volume. • ( ~ ) indicates that the talk which follows is consistent with the person’s regular voice
and tone. This symbol is used after low volume talk to indicate the point at which the volume rises back to normal. When a pause occurs after the low volume talk and the talk that follows returns to normal, this symbol is not shown.

71
Sample Transcription
G G 1. Haruna; (1.89) yeah i have tried// (1.27) i had (.70) ( )// (.) and (.) exam// (.) (1.87) ^ uhuh
^ ^ ^ ^ ^ 2. Haruna; maybe (1.36) (it's ok)// _ Lh [( Lh ma)]ybe (.85) ^ L ^ ^ ^ [(yeah maybe it's ok)]
> ((G begins)) ((G ends))
3. Andrea; h (urrr) what [exa]ms do you have// next week// do you have just one// (.65) [( )]
G ^ S 4. Haruna; no: (.) i have (1.67) four¿// (1.10) really? (.68) eee =
G 5. Haruna; = and two reports// (.62) (.) yeah¿ (.77) (.) next (.59) G next week? oh wow
6. Haruna; wednesday and (1.10) tuesday ( ) thursday, (.)
((G begins)) 7. Andrea; ahh (isn't it)// it it's this coming week// (.) [(your)] exam week, (.99) ^ [(yeah)]
8. Andrea; ah at chodai (.) last week, = = was our exam week// = G = last week = = (eeeya) (.62) uu =
9. Andrea; so everyone is finished// (.) so last night, we had a party// (.)

72
S ((G ends)) ^ ^ ^ 10. Andrea; like a (.) like YAAY [( Lh ) ( finished)] party _ Lh (.) ^ ^ ^ S [( Lh ) ( finished )]
^ ^ 11. Andrea; [(so yeah at an izakaya)] (.) so = " [( h _ Lh )] = (wow) (.)
G 12. Haruna; [ where ] = did you go// (.) [ (it was] fun) =
13. Andrea; umm (.) there's an izakaya/ i:n sumiyoshi// (.) that's called (1.38)
((G begins)) 14. Andrea; _ ahh i forget. the name// (.71) ok (.) if there's (1.22) uu:mm (.65)
15. Andrea; if this is chitosepia/ = (.) and here's like the main road// (.) [ (the) ] big road, (.99) ^ ^ = yes [(yeah)]
16. Andrea; and here is an the arcade// entrance to the arcade, (.) _ ( ) (arcade) here, (.) ^
17. Andrea; and there's like a little (.) aah there's a bus stop// (.) and a little park// (.91) (yeah) =
18. Andrea; so go down this road// past chitose-, chitosepia is like here// (.) (.) oh ok

73
19. Andrea; and there's a road. here// = = go down this like the main the big chitospeia, = _ (mm) =
20. Andrea; i think it's (.) showa machi// (.) (.) ummm ( ) yeah yeah yeah yes
21. Andrea; go down that road// (.) and it's it's on the (1.07) it's on the lu lu left side// (.50)
> > (G ends)) G 22. Andrea; i don't remember. the name// (.81) = kind of big though, (.) (.) " _ (mm) = _ (oh)
^ ^ ^ ^ 23. Andrea; _ mm ~ kind of nice, = = cuz we had (1.10) sixteen people// (.) = Lh =
G ^ ^ 24. Andrea; [ so ] it was very big// _ mmm (1.18) izakaya (.91) " [(oh)]
((G begins)) ((G ends)) 25. Haruna; (there is a) (.69) (all) (.76) _ (kenkyussei// no) (.)
26. Andrea; oh [ken]kyussei, = = mm?mm¿mm? (.) umm maybe like (.) [(oh)] = _ kenkyussei =
27. Andrea; about half (.56) japanese students and half (aaa) foreign students, (.) (.) _ (ooh)
G G

74
28. Andrea; but i'm the only _ kenkyussei// ( ) (.56) other students,
^ G 29. Andrea; are like regular ryu gakkussei// (.65) _ i think (1.33) or just (.) japanese _ (college students)// ^ ^
((G begins)) S 30. Andrea; (2.19) so they all had to take the test// (.79) [( ) (so they were all like)] ^ [( wooo Lh )]
((G ends)) > > > S 31. Andrea; oo oo oo we're so tired// oo yay = [(we're finished)]// (.) ^ ^ ^ = ooo[ooooooooooo]
((G begins)) S ((G ends)) 32. Andrea; but i said like (oh ok fine)// = = i didn't do anything// = [ so ] = ok Lh = = Lh [ Lh ] (.) h =
((G begins)) 33. Andrea; ( ) [(not bad)] (.) like a bonenkai, but not a bou nen [(kai, like)] [( )] _ mmm [(bou nen)]
L ((G ends)) ^ ^ ^ 34. Andrea; a (.) (.) [( like a bon shu there you go)]// (.) so (.) (.) ^ ^ [(bou)] [( ) Lh ] _ ( h ) _ ( h )
^ ^ S 35. Andrea; yeah (.) _ (it was fun)// (.99) so (1.02) ^
^ ^ ^ 36. Andrea; did you do anything. fun// yesterday// (.54) = uu uh (1.44) _ (uu) yesterday =
37. Haruna; yesterday (2.40) i (.) i did a part-time job// (.)

75
38. Andrea; oh really what's your (erbaito)// (.)
^ 39. Haruna; yeah (.52) uuu (.) = (.) it's = where (.62) _ ( )
Appendix B: Willingness to Communicate Scale
DIRECTIONS: Below are twenty situations in which a person might choose to communicate or not to communicate in English. Presume that the person in each situation does not speak Japanese but can speak English. Also, presume you have completely free choice. Indicate the percentage of times you would choose to communicate in each type of situation. Indicate in the space at the left what percent of the time you would choose to communicate. 0 = never, 100 = always _____ 1. *Talk with a service station attendant. _____ 2. *Talk with a physician. _____ 3. Present a talk to a group of strangers. _____ 4. Talk with an acquaintance while standing in line. _____ 5. *Talk with a salesperson in a store. _____ 6. Talk in a large meeting of friends. _____ 7. *Talk with a police officer. _____ 8. Talk in a small group of strangers. _____ 9. Talk with a friend while standing in line. _____ 10. *Talk with a waiter/waitress in a restaurant. _____ 11. Talk in a large meeting of acquaintances. _____ 12. Talk with a stranger while standing in line. _____ 13 *Talk with a secretary. _____ 14. Present a talk to a group of friends. _____ 15. Talk in a small group of acquaintances. _____ 16. *Talk with a garbage collector. _____ 17. Talk in a large meeting of strangers. _____ 18. *Talk with a spouse (or girl/boyfriend). _____ 19. Talk in a small group of friends. _____ 20. Present a talk to a group of acquaintances. N.B. JEFLs were provided with Japanese explanations. Further, the asterisk (*) marking the filler items above, as well as the scoring table below, were not included on the questionnaires the JEFLs completed. SCORING: The WTC permits computation of one total score and seven sub-scores. The sub-scores relate to

76
willingness to communicate in each of four common communication contexts and with three types of audiences. To compute your scores, merely add your scores for each item and divide by the number indicated below. Subscore Desired Scoring Formula Group discussion Add scores for items 8,15, and 19; then divide by 3. Meetings Add scores for items 6, 11, and 17; then divide by 3. Interpersonal conversations Add scores for items 4,9, and 12; then divide by 3. Public speaking Add scores for items 3, 14, and 20; then divide by 3. Stranger Add scores for items 3, 8, 12, and 17; then divide by 4. Acquaintance Add scores for items 4, 11, 15, and 20; then divide by 4. Friend Add scores for items 6, 9, 14, and 19; then divide by 4. To compute the total WTC scores, add the sub-scores for stranger, acquaintance, and friend. Then divide by 3.
Appendix C: Ten Item Personality Inventory
Name(名前):_________________ Date(記入日): ___________ Following the scale below, please write a number next to each statement below to indicate the degree to which you agree or disagree with that statement.(下の枠内の1から7まで
のスケールに従って、1から12までの問いに対して、最も自分に当てはまる度
数の数字を、問いの数字横の空欄にそれぞれ入れてください。)
Disagree Strongly
(全く違うと
思う
1
Disagree moderately (あまり そうだとは 思わない)
2
Disagree a little
(少し違う
と思う)
3
Neither agree nor disagree
(どちらでも
ない)
4
Agree a little
(少しそう
思う)
5
Agree moderately
(まあまあそう思
う)
6
Agree strongly
(強くそう思
う)
7
I see myself as(私は自分のことを・・・): 1. _____ Extraverted, enthusiastic. (外向的、社交的、熱心だと思う) 2. _____ Critical, quarrelsome. (批判的、口やかましいと思う) 3. _____ Dependable, self-disciplined. (頼りがいがある、自立していると思う) 4. _____ Anxious, easily upset. (感情が変化しやすい、すぐいらいらすると思う) 5. _____ Open to new experiences, complex. (新しい経験や物事に挑戦する事が好き)

77
6. _____ Reserved, quiet. (遠慮がち、おとなしいと思う) 7. _____ Sympathetic, warm. (思いやりがある、あたたかみがあると思う) 8. _____ Disorganized, careless. (注意ミスが多い、忘れ物が多いと思う) 9. _____ Calm, emotionally stable. (おだやか、感情が安定していると思う) 10. _____ Conventional, uncreative. (新しい物事に保守的、独創性がないと思う) (N.B. The Japanese translation of the TIPI has since been modified and renamed the TIPI-J as presented in the recent works of Oshio, Abe & Cutrone , 2012.) Appendix D: Inventory of Conversational Satisfaction
For NES Interlocutors
Your Name: Partner’s name:
Key: 1 = Yes 7 = No Date: Please score the sentences below based on how often you thought they generally occurred in the conversation. Based on the key shown above, circle the number that best corresponds to your opinion. 1. S/he let me know that I was communicating effectively……………………....…1 2 3 4 5 6 7 2. The feelings that my partner expressed by means of listening feedback during the conversation seemed authentic (i.e., they conveyed what they were truly feeling and were not just agreeing and/or pretending to understand to keep the conversation going smoothly)…………………………..….1 2 3 4 5 6 7 3. S/he showed me that s/he understood what I said…………...……………......….1 2 3 4 5 6 7 4. S/he showed me that s/he listened attentively to what I said………………….......1 2 3 4 5 6 7 5. S/he expressed a lot of interest in what I had to say…………………………........1 2 3 4 5 6 7 6. The conversation went smoothly……………………………..………….…..……1 2 3 4 5 6 7 7. S/he encouraged me to continue talking………………………………....….……1 2 3 4 5 6 7 8. S/he seemed impatient…………………………………………………...…..……1 2 3 4 5 6 7 9. S/he seemed cold and unfriendly……………………………………….…….…..1 2 3 4 5 6 7 10. S/he was polite……………………………………………..………..………..…1 2 3 4 5 6 7 11. S/he appeared warm and friendly………………………..…………...............…1 2 3 4 5 6 7

78
12. S/he was impolite…………………………………………………...……...……1 2 3 4 5 6 7 13. S/he appeared interested and concerned…………………………….……..……1 2 3 4 5 6 7 14. S/he interrupted me……………………………………………….........…….….1 2 3 4 5 6 7 15. My conversation partner seemed to want to avoid speaking…………...…….…1 2 3 4 5 6 7 16. Please include any other comments and/or observations regarding the Japanese participant’s behavior in the conversations. (Feel free to add any comments you have regarding Japanese people’s listening behavior in general.) ________________________________________________________________________________________________________________________________________________________________________________________________________________________________________________________________________________________________________________________________________________________________________________________________________________________________________________________ For JEFLs
Inventory of conversational satisfaction (対話による満足度調査アンケート)
Key: 1 = Yes (最もそう思う)7 = No(全くそう思わない) Name (名前) : Date (記入日): 1. S/he let me know that I was communicating effectively………………...…1 2 3 4 5 6 7 (私との会話を全体的に理解してくれているようだった) 2. I felt I was able to present myself fairly during the conversation…………..1 2 3 4 5 6 7 (私は、自分の気持ちを会話の中できちんと言えたと思う) 3. S/he showed me that s/he understood what I said……...……………...…....1 2 3 4 5 6 7 (相手は、私の話した内容を理解してくれていた) 4. S/he showed me that s/he listened attentively to what I said…………...…...1 2 3 4 5 6 7 (相手は、私の話しに注意深く耳を傾けてくれていた) 5. S/he expressed a lot of interest in what I had to say……………………...…1 2 3 4 5 6 7 (相手は、私の話す内容にとても興味がある様子だった) 6. The conversation went smoothly…………………………………….............1 2 3 4 5 6 7 (この対話はスムーズに進んだ) 7. S/he encouraged me to continue talking……………………………………..1 2 3 4 5 6 7 (相手は、私が話を続けやすいようにサポートしてくれた) 8. S/he seemed impatient……………………………………………….....……1 2 3 4 5 6 7 (相手は、いらいらしている様子だった) 9. S/he seemed cold and unfriendly………………………………………........1 2 3 4 5 6 7 (相手は、冷たい反応で、不親切だった) 10. S/he was polite……………............................................................................1 2 3 4 5 6 7 (相手は、丁寧な対応だった) 11. S/he appeared warm and friendly………………………..………….............1 2 3 4 5 6 7 (相手は、あたたかく、親切な反応だった)

79
12. S/he was impolite……………………………………….……….…...……1 2 3 4 5 6 7 (相手は、失礼な態度だった) 13. S/he appeared interested and concerned……………………………..….…1 2 3 4 5 6 7 (相手は、私の話に興味と関心を示してくれた) 14. S/he interrupted me…………………………………………….…….…....1 2 3 4 5 6 7 (相手は、私の話の邪魔や妨害、さえぎりをした) 15. My conversation partner seemed to want to avoid speaking………….......1 2 3 4 5 6 7 (彼ら自身が絶対話さなくていいように、他の人に話し続けてほしいと思っているという印
象を与えている) 16. Please include any other comments and/or observations regarding the participant’s behavior in the conversations. (上記に無いコメントや意見、感想などがあれば書いてください)________________________________________________________________________________________________________________________________________________________________________________________________________________________________________________________________________________________________________________________________________________
For NES Observers
Date: _________________ Name: ___________________ Key: 1 = Yes 7 = No
Please score the sentences below based on how often you thought they generally occurred in the conversation. Based on the key shown above, circle the number that best corresponds to your opinion. 1. The Japanese person let his/her partner know that the partner was communicating effectively. ……………………………………………………………….……………….……..1 2 3 4 5 6 7 2. The Japanese person showed his/her partner that they understood what their partner said. …………………………………………………….……………….………………..1 2 3 4 5 6 7 3. The Japanese person showed that they were listening attentively to what their partner said. ………………………………………...…………………………………….….……1 2 3 4 5 6 7 4. The Japanese participant expressed a lot of interest in what their partner had to say. …………………………………………………………………………………..…...1 2 3 4 5 6 7 5. The conversation went smoothly……………………………………………….....1 2 3 4 5 6 7 6. The Japanese encouraged his/her partner to continue talking…………………....1 2 3 4 5 6 7 7. The feelings that the Japanese person expressed by means of listening feedback during the conversation seemed authentic (i.e., they conveyed what they were truly feeling and not just agreeing and/or pretending to understand for the sake of harmony and/or to keep the conversation going smoothly)……………………………………………1 2 3 4 5 6 7 8. The Japanese person seemed impatient………………………………….….……1 2 3 4 5 6 7 9. The Japanese person seemed cold and unfriendly……………………….…...…..1 2 3 4 5 6 7

80
10. The Japanese person was polite…………............................................................1 2 3 4 5 6 7 11. The Japanese person appeared warm and friendly……………………..….……1 2 3 4 5 6 7 12. The Japanese person was impolite………………………....................................1 2 3 4 5 6 7 13. The Japanese person appeared interested and concerned………………….……1 2 3 4 5 6 7 14. The Japanese person interrupted their partner at times……………………....…1 2 3 4 5 6 7 15. The Japanese person seemed to want to avoid speaking……………………..…1 2 3 4 5 6 7 16. When the Japanese person did not understand something, they were able to clearly convey this to their conversational partner with their listening feedback…………………………….….1 2 3 4 5 6 7 17. The Japanese person’s listening behavior seemed inadequate in some ways….1 2 3 4 5 6 7 If you answered “yes” (i.e., 1, 2 or 3) to question 17, please explain how and/or why you think their listening behavior seemed inadequate. ________________________________________________________________________________________________________________________________________________________________________________________________________________________________________________________________________ 18. Any other comments and/or observations regarding the Japanese participant’s behavior in the conversation. ________________________________________________________________________________________________________________________________________________________________________________________________________________________________________________________________________
Appendix E: Data Record Sheet to Record Instances of Miscommunication
Data Record Sheet 1. Wanting the speaker to continue = CONT 2. Indicating understanding of content = UND 3. Indicating agreement = AGR 4. Showing empathy and support to the speaker’s evaluative statement = EAS 5. Showing a strong emotional response = SER 6. As a minor addition = MA 7. Asking for clarification = CLAR 8. Indicating non-understanding = NONU 9. Indicating disagreement or dissatisfaction = DOD 10. Other = OTH 11. Indicating boredom and/or disinterest in the conversation = BODI 12. Indicating impatience and a desire for the speaker to finish quickly = IMP 13. Giving the impression that their response was insincere = INSI 14. Giving the impression of not understanding but pretending to = PRET 15. Giving the impression that they want to keep the other person speaking strictly to avoid

81
speaking themselves = AVSP (N.B. More than one function is possible. It also possible for the interviewee to be unsure, which will be demonstrated with a question mark.) Time JEFL BC Intentions
NES BC Perceptions
Analysis (notes)
Time JEFL BI
NES Perceptions
Analysis (notes)
Time JEFL BI
NES Perceptions
Analysis (notes)
Appendix F: Tables Demonstrating Characteristics of Three Groups
Characteristics Pertaining to Members of Group A
Pseudonym Gender TOEIC Scores
L2 WTC (dyadic)
Personality (Extraversion)
Age Year of Study
Michiko F 700 65 6.5 20 3rd Hika F 650 60 6 20 3rd Aria F 625 44 2 19 2nd Haruna F 555 61 6 19 2nd Miya F 500 54 4 19 2nd Saya F 470 45 4.5 19 3rd Chieko F 445 34 3 20 2nd Ayuka F 360 42 5 19 2nd Takanori M 504 40 4 20 3rd Kazuya M 480 39 2.5 19 2nd AVG. 528.9 48.4 4.35 19.4

82
Characteristics Pertaining to Members of Group B
Pseudonym Gender TOEIC Scores
L2 WTC (dyadic)
Personality (Extraversion)
Age Year of Study
Rika F 685 50 5 20 2nd Shio F 630 49 3 20 3rd Mayumi F 585 35 2 20 3rd Meo F 550 52 2.5 20 3rd Madora F 500 60 4.5 19 2nd Sachi F 475 59 5 19 2nd Keiko F 460 39 4.5 19 2nd Mika F 390 51 3.5 19 2nd Taro M 525 58 5 19 2nd Kouki M 450 51 4 20 3rd AVG. 525 50.4 3.9 19.4
Characteristics Pertaining to Members of Group Z
Pseudonym Gender TOEIC Scores
L2 WTC (dyadic)
Personality (Extraversion)
Age Year of Study
Yukari F 695 64 6 20 3rd Mikki F 645 63 4 20 3rd Akie F 595 60 5 20 2nd Yuki F 565 53 4.5 19 2nd Tomomi F 540 61 5.5 20 3rd Yoko F 516 48 5 19 2nd Misako F 485 54 5 19 2nd Yukiko F 445 41 6 19 2nd Akanori M 610 58 1.5 19 2nd Hiro M 560 60 5 20 3rd AVG. 565.6 56.2 4.75 19.6