nap ar 2018 · new african properties limited (“nap”) is a public variable rate loan stock...
TRANSCRIPT

ANNUAL REPORT

Shopping Centres Adjacent To Gaborone Station
CONTENTS>
The Annual Report has been prepared in order to comply, in all material respects, with the requirements of the BotswanaCompanies Act (CH42:01) and requirements of the Botswana Stock Exchange. Accordingly, the Board of Directors andManagement of the Company assume no responsibility for nor warrant compliance of information contained in the AnnualReport with requirements of other legal frameworks or regulatory authorities of other jurisdictions.
Page
INVESTMENT HIGHLIGHTS...................................................... 1 - 2
FIVE YEAR HISTORICAL REVIEW................................................ 3
DIRECTORS................................................................................ 4 - 6
MANAGEMENT........................................................................... 7 - 8
MANAGEMENT REPORT............................................................ 9 - 17
UNITHOLDER ANALYSIS........................................................... 18 - 19
GOVERNANCE AND RISK......................................................... 20 - 29
DIRECTORS' RESPONSIBILITY AND APPROVAL....................... 30
INDEPENDENT AUDITOR'S REPORT........................................ 31 - 35
DIRECTORS' REPORT................................................................. 36 - 37
ANNUAL FINANCIAL STATEMENTS
STATEMENTS OF FINANCIAL POSITION........................ 38
STATEMENTS OF COMPREHENSIVE INCOME................ 39
STATEMENTS OF CHANGES IN EQUITY......................... 40 - 41
STATEMENTS OF CASH FLOWS...................................... 42
NOTES TO THE ANNUAL FINANCIAL STATEMENTS..... 43 - 77
TERMS AND DEFINITIONS.................................................. 78 - 80
NOTICE OF ANNUAL GENERAL MEETING......................... 81 - 82
PROXY FORM...................................................................... 83 - 84
CORPORATE INFORMATION AND ADMINISTRATION....... 85

A N N U A L R E P O R T 2 0 1 8
1
INVESTMENT HIGHLIGHTS>31 July 2018
OVERVIEWNew African Properties Limited (“NAP”) is a public variable rate loan stock company offering investors the opportunity to share in a diversifiedportfolio of 64 well-established, strategically located, primarily retail properties across Botswana as well as a small portfolio of Namibian retailproperties, all underpinned by quality tenants.
NAP has delivered a strong, consistent performance since listing on the Botswana Stock Exchange (BSE) on 28 September 2011, generatingboth distribution and capital growth to investors and with a market capitalisation of P1.94 billion at year end.
While capital growth for investors is based on movement in the unit price it is important to know that there has also been growth in the underlyingproperty value and net asset value.
13
12
11
10
9
8
7
6
26
24
22
20
18
16
14
12
Interim Final TotalHalf yearly distributions annual
distributions
Distributions per unit
2013 2014 20152012 2013 2014 20152012 2013 2014 201520122016 2016 20162017 2017 2017
CAGR: 9.2% CAGR: 8.7% CAGR: 8.9%
2018 2018 2018
1 500
1 400
1 300
1 200
1 100
1 000
900
800
* after deducting interim distribution
Net asset value in Pm
CAGR: 7.0%
Onlistingin 2011
2012interim*
2012yearend
2013interim*
2013yearend
2014interim*
2014yearend
2015interim*
2015yearend
2016yearend
2016interim*
2017yearend
2017interim*
2018final
2018interim*
CAGR = Compound Annual Growth Rate

STRATEGYOur primary objective is to provide returns to investors through income and capital growth superior to alternative risk related investments.
The key strategic goals underlying this are:
- Managing our properties to achieve stable and sustainable growth
• Investing in appropriate properties
• Maintaining our retail focus
• Maintaining our strong tenant profile
• Maximising contractual rentals
• Minimising rental arrears, bad debts and vacancies
• Optimising expenditure- Understanding the environment we operate in- Managing using a sound governance framework- The use of skilled service providers- Distribution certainty and transparency- Diversifying our funding through the introduction of prudent gearing- Diversifying the unitholder base
PROPERTY PORTFOLIOThe portfolio has a diverse geographical footprint covering the main urban areas, with a weighting in Gaborone, the primary economic hub ofthe country.
NATURE OF INVESTMENT AND RETURNSThe ownership of linked units in a variable rate loan stock company is tax efficient as profits are distributed by means of a dividend and a debentureinterest payment which is larger than the dividend. The full amount of interest is deductible from income of the variable rate loan stock companyas an expense incurred in the production thereof.
Dividends paid by the company are subject to withholding tax which is a final tax. Interest payable to residents which are tax paying entities issubject to 10% withholding tax, which can be credited against tax payable by the recipient. Any capital gains on disposal of linked units afterone year of acquisition are exempt from taxation under the current taxation regime as the Company has offered more than 49% of its linkedunits to trade on the Botswana Stock Exchange. In addition to being able to vote on issues that affect them, unitholders' interests are protectedthrough application of a code of governance and appointment of independent directors to the Board.
INVESTMENT HIGHLIGHTS>(continued)
31 July 2018
Maun
Francistown
Letlhakane
Ghanzi Serowe
Molepolole
JwanengGaborone
Mahalapye
Palapye
Selibe Phikwe
Kasane
2

FIVE YEAR HISTORICAL REVIEW>for the year ended 31 July 2018
A N N U A L R E P O R T 2 0 1 8
3
31 July 2018 31 July 2017 31 July 2016 31 July 2015 31 July 2014INCOMEContractual rental * (P000) 177 887 164 733 152 918 141 036 130 793Distributable income (P000) 147 834 137 155 127 315 117 449 109 002Distributable income (tpu) 24.46 22.69 21.06 19.43 18.03Increase in distributable income (%) 8% 8% 8% 8% 7%Distributions (tpu): 24.53 22.67 20.95 19.43 17.99 - interim 12.25 11.21 10.18 9.51 8.93 - final 12.28 11.46 10.77 9.92 9.06Distribution growth (%) 8% 8% 8% 8% 7%Profit (P000) 217 272 199 404 209 762 199 102 211 055Increase in profit (%) 9% -5% 5% -6% 13%
ASSETSInvestment property * (Pm) 1 459 1 385 1 312 1 225 1 135Borrowings (Pm) 22 25 28 30 32Net asset value (Pm) 1 401 1 332 1 268 1 188 1 107Increase in net asset value (%) 5% 5% 7% 7% 10%
GEARINGDebt to property value (%) 1% 2% 2% 2% 3%Debt fixed (%) 0% 0% 0% 0% 0%Interest cover (times) 127 98 76 55 44
UNIT STATISTICSUnits in issue (millions) 604 604 604 604 604Closing price (tpu) 321 322 293 242 206Mkt cap at end of period (Pm) 1 940 1 946 1 771 1 463 1 245Premium to NAV (%) 38% 46% 40% 23% 13%Historic yield (%) 7.6% 7.0% 7.2% 8.0% 8.7%Total return per linked unit (%) 7.3% 17.6% 29.7% 26.9% 4.7%
PROPERTIESNumber of properties 64 64 64 65 65Last valuation * (Pm) 1 459 1 385 1 312 1 225 1 135Increase in property valuation (%) 5% 6% 7% 8% 12%GLA (000m2) 129 129 129 130 130Vacancy (by GLA) 3.8% 3.2% 1.2% 2.8% 3.7%Vacancy (by rental) 1.9% 2.2% 0.7% 1.9% 2.2%
* excludes rental straight lining

Riverwalk Shopping Centre, Gaborone
John Tobias MynhardtNon-Executive Chairman
B.Comm (UCT)Chairman of Board and Investment Committee
After completing his Bachelor of Commerce degree at the University of Cape Townin 1968, Mr Mynhardt started work in the family trading store in Francistown. Hehas remained involved in the Botswana retail industry ever since. During this timehe has developed extensive business interests in Botswana and he is chairman ofall the companies in the CBH Group including Furnmart Limited and the companiesin the group's Tourism and Hospitality Divisions. During his career he has servedas a member on both the Francistown Town Council and the University of BotswanaCouncil. Mr Mynhardt has also served as a Board member of the Botswana HousingCorporation and First National Bank of Botswana.
Tobias Louis John MynhardtManaging Director
Executive Director
B.Comm (Hons - UCT), MSc Econ (LSE)Member of Risk, Audit & Compliance Committee and Investment Committee
Mr Mynhardt is the Deputy Chairman of the CBH Group which has investmentsin a number of industries including property, retail, tourism, hospitality, buildingmanufacturing supply and financial services. He led the 2011 listing of NAP whichrepresented the consolidation of the property interests of the CBH Group. MrMynhardt has assumed responsibility for various CBH Group divisions since beingappointed a director in 2003. He was Managing Director of an associate company,the BSE-listed Furnmart Limited, since 2009 until his appointment as deputy chairmanin 2016. Mr Mynhardt's early career encompassed a broad exposure to the investmentindustry through an investment advisory and Hedge Fund-of-Funds firm in London,following the completion of his Masters degree in Economics from the LondonSchool of Economics. Mr Mynhardt is also a non-executive director of Barclays BankBotswana.
DIRECTORS>as at 31 July 2018
4

DIRECTORS> (continued)
as at 31 July 2018
Lauren Carole TappingChief Financial Officer
Executive Director
B.Compt (Hons), CTA (UNISA), C.A.(S.A.), FCPAMember of the Investment Committee
Attends Risk, Audit & Compliance Committee meetings by invitation
Ms Tapping has 30 years financial experience, with a significant focus on the propertyindustry and specifically the listed real estate sector in South Africa, Namibia andmore recently in Botswana. She joined CBH Group as NAP's Chief Financial Officerin March 2012 and was appointed as a director in July 2014. She is also the CBHGroup Chief Financial Officer. Prior to joining CBH Group she served as FinanceDirector of Marriott Property Services (Proprietary) Limited, JSE listed SA Corporate,director of Namibian listed Oryx Properties Limited and Head of Finance for theListed Real Estate Division at Old Mutual Property Investments. In these capacitiesshe gained experience with the various facets of property from a listed companyand broad property services company perspective, was involved in a number oflistings and corporate transactions and served on various listed company committeesincluding as chairman of Oryx's Remuneration & Nomination Committee. Prior toher commercial experience she spent 6 years in the audit environment.
A N N U A L R E P O R T 2 0 1 8
5
Fact Badzile LebalaExecutive Director
Mr Lebala left the Botswana Police Force after 28 years of service with the rank ofSuperintendent of Police and was awarded the Police Medal for Good Conduct.During this career he was Commanding Officer for many Police Districts in Botswana.He was for many years responsible for identifying sites and their owners as well asconducting negotiations for their acquisition. He also liaised with all the districtcouncils, licensing and land boards to facilitate the development and commissioningof the various developmental properties. He has retiredfrom the CBH Group after serving as a director in theGroup for over 27 years. He continues to be aboard member of Furnmart Ltd and NAP andserves the Group on an ad hoc project basis.

Riverwalk Shopping Centre, Gaborone
Jerome Patrick McLoughlinIndependent, Non-Executive Director
B.Comm, Dip Acc (Natal), C.A.(S.A.)Chairman of Risk, Audit & Compliance Committee
After completing articles with Deloittes (Durban) in 1993 and qualifying as a charteredaccountant, Mr McLoughlin started a career in public audit practice and currentlyserves as a director of a firm of registered auditors known as Hodkinson Inc. Healso serves as a non-executive director to companies and serves as trustee on anumber of trusts. He has substantial experience in an advisory capacity and inproperty investment.
DIRECTORS> (continued)
as at 31 July 2018
Seshadri VenkatakrishnanIndependent, Non-Executive Director
C.A. (India)Member of the Risk, Audit & Compliance Committee
Mr Venkatakrishnan is a Chartered Accountant from India with about 35 years ofwide experience in Finance and General Management, of which about 20 years wasin Botswana. He has held senior roles in different capacities in varied business sectorslike Retail, Manufacturing, Property holdings and Property development, IT, Healthcaresector and Education. He is currently a Management Consultant and holds directorshipsin companies in India.
6

Mafenyatlala Mall, Molepolole
MANAGEMENT>as at 31 July 2018
Odirile Merafhe - CBH Group Executive, B.Sc (Embry Riddle, USA)Mr Merafhe is a member of the Executive Management team of the CBH Group, responsible for business development and special projects.Prior to this he was head of Business Development for Momentum Africa responsible for the growth of Momentum Africa subsidiaries in10 countries and new opportunities in Africa and emerging markets. Before that he was General Manager of Momentum Botswana, theadministrator of Botsogo Health plan, since the inception of the company. He oversaw the growth of the Botswana business to a well-respected and successful medical aid company with over 20,000 lives under administration. Before joining Momentum he was ChiefExecutive Officer of the Hospitality and Tourism Association of Botswana after spending 12 years in the Airline industry in Botswana andSouth Africa. Mr Merafhe is Chairman of Metropolitan Health Botswana and a former Chairman of Junior Achievement Botswana, directorof Botswana Development Corporation, MRI Botswana Limited, Botswana Tourism Board, Botswana Business Coalition on HIV AIDS.He is a Board member of Business Botswana.
A N N U A L R E P O R T 2 0 1 8
7
Odirile Merafhe Colin Stewart Willie Kruger
Jaco Burger
Collin van Wyk
Obed Morebodi Kemo Lebese

MANAGEMENT> (continued)
as at 31 July 2018
Colin Stewart - CBH Group Financial Manager, B.Compt (Hons), CTA (UNISA), C.A.(S.A.), ACPAMr Stewart joined the CBH Group in early 2014. Prior to this he served as Group Financial Controller at Celerant Consulting, a multinationalmanagement consulting firm based in London. Before that his experience includes a number of financial roles in both the UK and SouthAfrica in the manufacturing, telecommunications and banking sectors. Mr Stewart completed his articles with Deloitte in South Africa havingspent 6 years with the firm.
Willie Kruger - Nafprop Chief Executive OfficerMr Kruger's experience in property commenced in 1987 with Sanlam Properties as a Leasing Consultant and assistant Property Manager.From there he moved to Old Mutual Properties in 1989 where he was trained as Property Manager and Property Portfolio Manager. Herehe gained experience in dealing with aspects such as Property Management, Marketing, Facilities Management, Lease Audits and StaffTraining. He accepted a position with RMB Properties in 1995 where he was exposed to Property Asset Management. During 1995 hewas appointed by Broll Property Group as Property Portfolio Manager. He was appointed as Director to their Board in 1996 and to theBoard of Broll Namibia shortly thereafter. After spending 10 years with Broll he established BBA Property Group of which he was appointedManaging Director in 2007. The Property Portfolio under his direct supervision was valued at R2.3 billion in 2012. He joined Nafprop in2012 as Chief Executive Officer which position he still holds. Mr. Kruger has recently been elected as a professional member of the RoyalInstitution of Chartered Surveyors (RICS).
Collin van Wyk - Nafprop Financial Manager, B.Compt (Hons), CTA (UNISA), C.A.(S.A), ACPAMr van Wyk joined Nafprop in early 2017, having served as the Financial Manager at Generator Logic (Proprietary) Ltd in South Africa.Prior to that he was based in Uganda where he served as the Regional Financial Manager at The New Forests Company. Mr van Wykhas also fulfilled managerial roles in the retail sector with a particular focus on high end retail. Preceding his move to commerce he spentfive years in the audit environment.
Jaco Marius Burger - Nafprop General Manager: Property Management, B.A. (Hons) Industrial Psychology (ArmstrongState University, Savannah, Georgia, USA)Mr Burger commenced working in the property management industry on completion of his studies in the USA. His first managementposition was at Old Mutual Properties. Subsequent to that he furthered his career at Shoprite Checkers Properties, Murray & Roberts,Broll Property Group, JHIsaacs and Homenet Commercial Properties. Mr. Burger left the industry after approximately eight years andventured into the restaurant industry where he was a manager and franchisee for roughly thirteen years. He has since decided to returnto the property management field and has been with Nafprop for close to five years. Mr Burger has recently been elected as a professionalmember of the Royal Institution of Chartered Surveyors (RICS).
Obed Morebodi - Nafprop Facilities Manager, MSc (Leeds Metropolitan University, UK): Property Management.Mr Morebodi has experience in several industries. He worked for Bamangwato Concessions Limited (BCL) for 11 years and assumedhis first management position in 2003 when he joined Wurth Solergy, a German based company. In this position he worked as RegionalTechnical and Sales Manager responsible for marketing and business growth. He later joined Pioneer Products where he was responsiblefor manufacturing and sales of concrete products to supply the construction industry. He joined Nafprop as Facilities Manager during 2007and is responsible for facilities management, overseeing the technical and service provider management of the NAP portfolio.
Kemo Lebese - Nafprop Chief Accountant, AAT, ACCAMr Lebese has 9 years experience in the property industry. He joined CBH Group in 2009 and is currently the Chief Accountant ofNafprop. He was previously employed by PricewaterhouseCoopers as a trainee accountant. Mr Lebese is ACCA qualified, and a memberof the Botswana Institute of Chartered Accountants.
8

MANAGEMENT REPORT>for the year ended 31 July 2018
HIGHLIGHTS
• Total distribution for the year 24.53 thebe
• Distribution growth 8.2%
• Total return 7.3%
• Total asset value P1.67 billion
• Asset value growth 5.4%
• Net asset value P1.40 billion
• NAV growth 5.2%
• Market capitalisation P1.94 billion
• Number of leases 462
• Occupancy level (by GLA) 96.2%
• Net tenant arrears P0.3 million
• Tenant retention 76%
RETURNS TO INVESTORSThe total return to investors for the year amounts to 7.3%on the opening price of 322 thebe. This is made up of a7.6% income return comprising distributions paid toinvestors and a 1 thebe reduction in the unit price basedon a closing unit price of 321 thebe.
Since listing in September 2011, the total return to investorsamounts to 129%, with a total income return of 69% anda capital return of 60% on the initial listing price of 200thebe per linked unit. This equates to a compound annualtotal return of 12.6%. These returns and the nature ofNAP are well suited to pension funds, institutional andlong-term investors, offering attractive returns relative tofixed income investments as well as an inflationary hedge.
The relative total returns on an annual basis are impactedby the movement in unit prices each year whereas theabsolute distribution element has increased annually witha compound average growth rate of 8.9% since listing.To date the unit price has tended to remain static for atime and then correct, rather than move in a consistentmanner.
Riverwalk Shopping Centre, Gaborone
A N N U A L R E P O R T 2 0 1 8
9
2018 total returns (tpu)
350
340
330
320
310
300
290
2801-Aug-17 Distribution Capital movement 31-Jul-18
322
24.53 (1) 345.53
Total return per year35%
30%
25%
20%
15%
10%
5%
0%2012 2013 2014 2015 2016 2017 2018

MANAGEMENT REPORT>(continued)
for the year ended 31 July 2018
FINANCIAL RESULTSThe Group's asset base has been able to generate sustained quality earnings since listing, evidenced by the consistent distribution growthover the seven year period.
Total distributions to linked unitholders for the year amounted to 24.53 thebe per unit, 8.2% higher than the 22.67 thebe in 2017.
The final distribution was declared on 25 July based on the Board's estimate of distributable income after utilising P466 000 of retainedincome to fund costs incurred for a transaction not completed. Actual distributable income was P46 000 higher than this forecast andamounted to P147.8 million, a 7.8% increase on the comparative. After the P466 000 utilisation, P148.3 million or 24.54 thebe per linkedunit was available for distribution, 8.1% above 2017's P137.2 million (22.69 thebe).
This increase in distributable income was driven by a 7.8% increase in revenue and an 8.1% increase in net rental income after propertyexpenses.
Distributable income was arrived at as follows: 2018 2017 % change P'000 P'000Revenue before straight line adjustment 188 030 174 363 +7.8%Other income 2 282 1 853Property costs (31 882) (29 700) +7.3%Net rental income 158 430 146 516 +8.1%Portfolio expenses (12 287) (11 081) +10.9%Distributable operating profit 146 143 135 435 +7.9%Net investment income 5 225 4 992Distributable profit before tax 151 368 140 427 +7.8%Taxation relating to distributable income (3 534) (3 272)Distributable income 147 834 137 155 +7.8%Retained income utilised 466 -Available for distribution 148 300 137 155 +8.1%Number of units in issue (in 000's) 604 397 604 397Distributable income in tpu 24.46 22.69 +7.8%Available for distribution in tpu 24.54 22.69 +8.1%
Distributions declared Interim 74 039 67 753 +9.3% Final 74 220 69 264 +7.2%Total distributions 148 259 137 017 +8.2%
Distributions in tpu 24.53 22.67 +8.2%
The current year includes P1.5 million revenue relating to prior years as a result of the finalisation of a contractual rent review early in thefinancial year. Excluding this, revenue growth and net rental income growth would have been 7.0% based on the numbers reported lastyear.
10

Property costs increased by 7.3% and included a marked increase in tenant installations with moves to strengthen both the diversity andquality of the tenant base into the future.
Net investment income has diluted distributable income growth by 0.1% in view of it not being a growing income stream and was furtherimpacted by the decrease in Botswana bank rate during the second quarter of the financial year. Investment income arises from cashavailable for investment as well as net rentals earned and accumulated during each distribution cycle. The investment of existing cash intoproperty with escalating income streams would enhance long term distribution growth.
Portfolio costs increased by 10.9%, of which 6.7% related to normal portfolio costs. The additional costs of P466 000 relates to costsincurred for a transaction not concluded, were funded out of retained income brought forward and have not impacted the distributionsfor the year.
The graph below demonstrates the key line items making up distributable income on an annual basis.
MANAGEMENT REPORT>(continued)
for the year ended 31 July 2018
FINANCIAL RESULTS (continued)Operating profit as a percentage of operating income (revenue and other income) remains constant at 77% and can be analysed as follows:
A N N U A L R E P O R T 2 0 1 8
11
180
160
140
120
100
80
60
Contractual rental incomeNet rental incomeDistributable income
Growth in Pm
2013 2014 20152012 2013 2014 20152012 2013 2014 201520122016 2016 20162017 2017 20172018 2018 2018
Contractual rental income CAGR: 7.71%Net rental income CAGR: 7.90%Distributable income CAGR: 8.78%
Operating profit 77% (2017 : 77%)
Recoverable expenses 7% (2017 : 8%)
Other property costs 9% (2017 : 9%)
Portfolio costs 7% (2017 : 6%)77%
2%
9%7%
7%
CAGR = Compound Annual Growth Rate

2018 2017 P'000 P'000Distributable income is reconciled to profit and total comprehensiveincome for the year as follows:Distributable income 147 834 137 155 +7.8%Fair value adjustments
- Investment property (net of straight lining) 71 936 68 412 - Financial asset 1 146 1 169
Share of associate's profit 8 923 3 766Amortisation of intangible asset (881) (881)Rent straight lining adjustments 1 236 699Deferred tax on
- Investment property (10 187) (8 892)- Share of associate's profit (668) (282)- Rent straight lining (285) (107)- Other non-distributable items (1 782) (1 635)
Net profit after tax 217 272 199 404 +8.9%Foreign exchange currency difference (96) 1 364Comprehensive income 217 176 200 768 +8.2%
Profit for the year amounted to P217.3 million (2017: P199.4 million) reflecting net non-distributable gains of P69.4 million (2017: P62.2million) which, together with other comprehensive income, has the impact of increasing net asset value by 11.40 thebe per linked unit.Net asset value increased by 5.2% for the year to P1.4 billion from P1.3 billion.
The properties were valued by Mr Curtis Matobolo of Knight Frank at P1.64 billion (2017: P1.53 billion) at 31 July 2018. The weightedaverage capitalisation rates applied by the external valuer decreased to 8.93% from 9.25% last year, predominantly attributable to reductionsin the long bond rates in both in Botswana and Namibia. The carrying value of investment property of P1.43 billion (2017: P1.36 billion)is lower as a result of assets reflected elsewhere in the statement of financial position and an adjustment for the nature of title in one ofthe properties.
The revaluation of investment property, net of P1.7 million capital improvements and impact of exchange rate movements, resulted infair value gains of P73.2million (2017: P69.1million) and a 5.4% increase in carrying values before rent straight lining adjustments.
Aggregate fair value gains have increased by 5.0% on the comparative.
MANAGEMENT REPORT>(continued)
for the year ended 31 July 2018
FINANCIAL RESULTS (continued)The remaining items included in profit and comprehensive income are not included in distributable income as they relate to accountingadjustments that are not accompanied by corresponding cash flows and predominantly comprise fair value driven line items with theircorresponding tax consequences. The difference between profit and comprehensive income is the net impact of foreign exchange currencychanges with a slight weakening in the Namibian Dollar relative to the Botswana Pula over the course of the year, with the year end ratemoving from 1.2817 to 1.2874.
12

MANAGEMENT REPORT>(continued)
for the year ended 31 July 2018
Namibia Botswana TotalPm* Pm* Pm* %
Fair value by sector: Retail 47 1 392 1 439 99% Industrial - 20 20 1%Total 47 1 412 1 459 100%% 3% 97% 100%Number of properties 7 57 64GLA (m2) 12 561 116 685 129 246
* Fair value before rent straight line adjustment.
NAP has placed a particular emphasis on properties within urban and semi urban nodes over a wide geographical area within the countries.There remains a significant weighting towards Gaborone within the portfolio, however NAP operates in a number of other areas acrossBotswana including inter alia Molepolole, Kasane, Maun and Tlokweng.
NAP's tax efficient PLS structure results in Botswana-earned net rental income being distributed to investors as debenture interest withoutcompany tax being incurred. This is ideally suited to tax exempt investors who constitute a substantial portion of NAP's unitholders. Thistax efficient structure is diluted where assets are held in other countries due to inter alia respective country taxes and withholding taxes.To offset the tax impact it is necessary to achieve higher property returns and the dilutionary effects of cross border taxes have so faroutweighed the benefits that could be derived from diversifying further.
PROPERTY PORTFOLIOThere has been no change to the portfolio during the year. The 2017 annual report referred to a conditional agreement for the acquisitionof a property, but on the 4th of December 2017 unitholders were advised that the transaction was not proceeding and the cautionarywas withdrawn.
The portfolio comprises predominantly Botswana retail assets which is where most value can be added, and comprises, in total, 64properties occupied by 462 tenants at year end.
The Namibian properties are retail properties and comprise 3% of total value with Botswana industrial properties comprising 1% of theportfolio value. The remaining 96% of property value is Botswana retail focused, with properties categorised based on primary use.
A N N U A L R E P O R T 2 0 1 8
13
Namibia
Botswana
97%
3%
Retail
Industrial
1%
99%
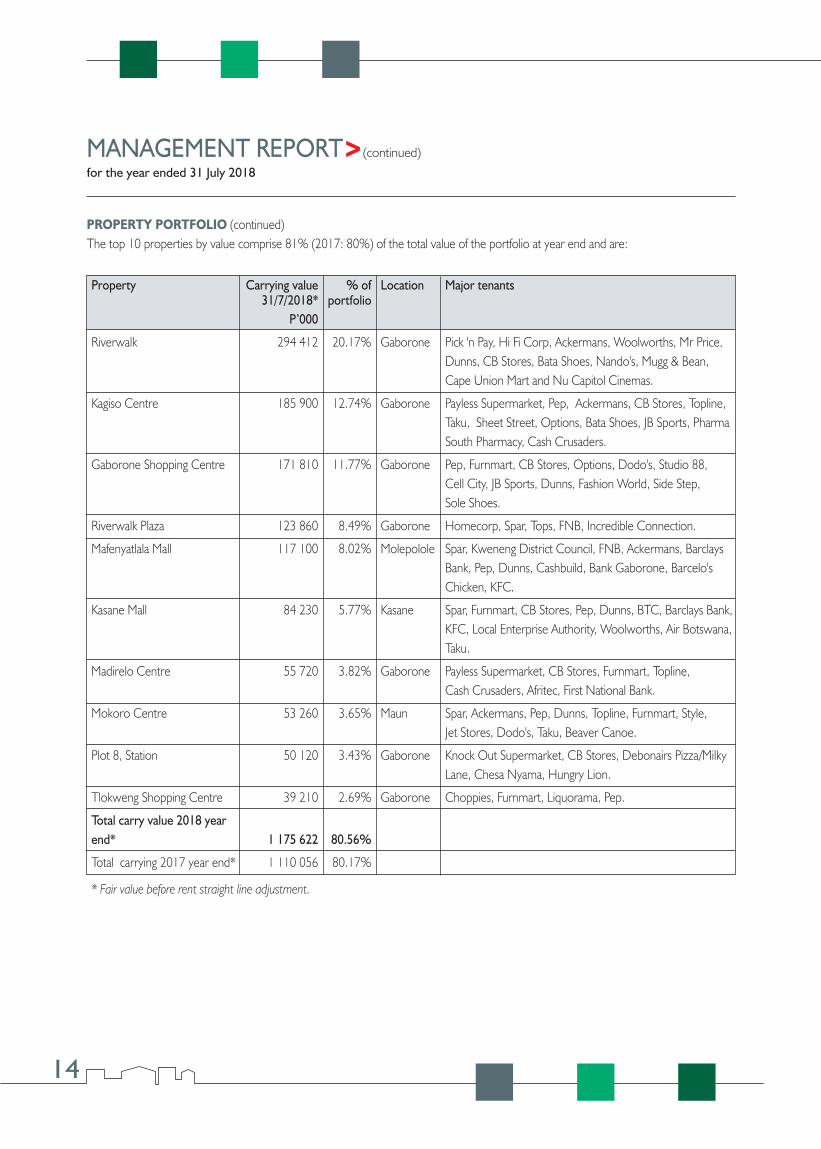
Property Carrying value % of Location Major tenants31/7/2018* portfolio
P’000
Riverwalk 294 412 20.17% Gaborone Pick 'n Pay, Hi Fi Corp, Ackermans, Woolworths, Mr Price,Dunns, CB Stores, Bata Shoes, Nando's, Mugg & Bean,Cape Union Mart and Nu Capitol Cinemas.
Kagiso Centre 185 900 12.74% Gaborone Payless Supermarket, Pep, Ackermans, CB Stores, Topline,Taku, Sheet Street, Options, Bata Shoes, JB Sports, PharmaSouth Pharmacy, Cash Crusaders.
Gaborone Shopping Centre 171 810 11.77% Gaborone Pep, Furnmart, CB Stores, Options, Dodo's, Studio 88,Cell City, JB Sports, Dunns, Fashion World, Side Step, Sole Shoes.
Riverwalk Plaza 123 860 8.49% Gaborone Homecorp, Spar, Tops, FNB, Incredible Connection.
Mafenyatlala Mall 117 100 8.02% Molepolole Spar, Kweneng District Council, FNB, Ackermans, Barclays Bank, Pep, Dunns, Cashbuild, Bank Gaborone, Barcelo's Chicken, KFC.
Kasane Mall 84 230 5.77% Kasane Spar, Furnmart, CB Stores, Pep, Dunns, BTC, Barclays Bank,KFC, Local Enterprise Authority, Woolworths, Air Botswana, Taku.
Madirelo Centre 55 720 3.82% Gaborone Payless Supermarket, CB Stores, Furnmart, Topline,Cash Crusaders, Afritec, First National Bank.
Mokoro Centre 53 260 3.65% Maun Spar, Ackermans, Pep, Dunns, Topline, Furnmart, Style, Jet Stores, Dodo's, Taku, Beaver Canoe.
Plot 8, Station 50 120 3.43% Gaborone Knock Out Supermarket, CB Stores, Debonairs Pizza/MilkyLane, Chesa Nyama, Hungry Lion.
Tlokweng Shopping Centre 39 210 2.69% Gaborone Choppies, Furnmart, Liquorama, Pep.
Total carry value 2018 yearend* 1 175 622 80.56%
Total carrying 2017 year end* 1 110 056 80.17%
* Fair value before rent straight line adjustment.
MANAGEMENT REPORT>(continued)
for the year ended 31 July 2018
PROPERTY PORTFOLIO (continued)The top 10 properties by value comprise 81% (2017: 80%) of the total value of the portfolio at year end and are:
14

Riverwalk Shopping Centre, Gaborone
The top ten tenants contribute approximately 52% of total rental and occupy 54% of gross lettable area. These tenants are all well-knownand established operators and include Pick 'n Pay, Spar, Mr Price, Woolworths, Pepkor, Furnmart, Retail Group, Choppies, Payless, CBStores. The tenant base continues to be strengthened with the introduction of new multi-national brands and the expansion of successfulexisting brands.
MANAGEMENT REPORT>(continued)
for the year ended 31 July 2018
PROPERTY PORTFOLIO (continued)The collection of rentals and leasing activities remain fundamental value drivers within NAP and are reflected in the performance from theproperty portfolio.
The diversity and strength of tenants in occupation has and continues to contribute significantly to NAP's performance. This is reflected inthe fact that 57% of rentals are received from listed and multinational companies, 12% from nationals and a further 7% and 2% fromfranchisees and Government respectively.
A N N U A L R E P O R T 2 0 1 8
15
Listed
Multi-National
National
Franchise
Government
Small
Vacant
2%
20%
2%
7%
12%22%
35%

MANAGEMENT REPORT>(continued)
for the year ended 31 July 2018
Monthly tenancies amounted to 1,684 m2 pending resolution of negotiations with existing tenants. Management also pursued negotiationswith prospective new tenants where ongoing tenancies appeared to be at risk and 19% of this space was relet subsequent to the yearend with only 538m2 remaining as monthly leases at the date of this report.
In the upcoming financial year lease expiries are spread across the property portfolio with no substantial weighting towards any one particularproperty: cyclical renewals at Mafenyatlala do however make up 34% of the expiries in 2020. In 2021 expiries are once again spread overa number of properties. Maintaining a secure and return enhancing tenant mix is key for NAP and as such there has been and still is aconscious drive towards retaining performing tenants and to improve on the existing tenant composition.
Selebi Phikwe accounts for 43% of total vacancies, up from 27% at the prior year end. Management has pursued a policy of tenant retentionwhere possible in an attempt to maintain occupancy levels and mitigate the impact on returns. This had limited success as the broadereconomic conditions remain trying. Selebi Phikwe represents 2.5% of the total property value and 2.7% of total rental at year end. Thelease expiry profile by GLA in this area is 15%, 22%, 48% and 15% in each of the next 4 financial years. The tenant composition as atyear end (based on rental) was 49% listed and multi-national companies, 12% government, 7% nationals and the balance of 32% smallertenants. Gross arrears in this node amount to P0.5 million (2017: P0.5 million).
Total unprovided tenant arrears amount to P0.3 million (2017: P0.4 million) at the end of the year, with a net charge to distributable incomeof P0.4 million (2017: P0.2million). After calculating the potential VAT recovery, arrears are effectively fully provided for.
PROPERTY PORTFOLIO (continued)During the year 26% of leases by GLA expired, comprising 25% of the July 2017 rental. In terms of GLA, 76% of leases were renewedby year end with a further 9% relet. 63% of these renewals were completed at an increase of 8% or more (60% by rental), with moremuted growth in other renewals and Selebi Phikwe rentals softening.
Vacancies increased by 785m2 from 3.2% to 3.8% during the year with a 970m2 increase in Selebi Phikwe and a decrease in vacanciesacross the remainder of the portfolio.
The lease expiry profile as at 31 July 2018 based on gross lettable area and financial years comprises:
16
Vacant Monthly 2019 2020 2021 2022 2023& later
35 000
30 000
25 000
20 000
15 000
10 000
5 000
0
4%1%
18%20%
18%16%
23%
Lease expiry profile by GLA

Kagiso Shopping Centre, Gaborone
MANAGEMENT REPORT>(continued)
for the year ended 31 July 2018
GEARINGNAP has significant gearing capacity available to fund acquisitions which would enhance long term returns. The catalyst for this would besecuring quality property investments at appropriate initial yields.
UNITHOLDER SPREADLiquidity in NAP linked units, particularly over the last few years, has enhanced the diversity of the unitholder base. Over the last threefinancial years 68% of linked units have traded, 17% in 2018, 24% in 2017 and 27% in 2016. This has diversified the unitholder baseand allowed for far wider access to NAP units. It has also demonstrated the demand for NAP linked units.
CONCLUSIONNAP's performance in 2018 is reflective of the sound property portfolio performance in line with the trend since initial listing, all underpinnedby the strength and diversity of the tenant base occupying the well-established portfolio.
The impact of prior period rental income included in the 2018 results will have some impact on comparable growth to be reported inthe short term and is most likely to be evident in the 1st half results of 2019. Management remains confident of achieving real distributiongrowth on an annual basis.
NAP retains the ability to fund developments and acquisitions.
A N N U A L R E P O R T 2 0 1 8
17

UNITHOLDER ANALYSIS>as at 31 July 2018
The following summarises the unitholders:
Category Number of unitholders Number of units held % of units held2018 2017 2018 2017 2018 2017
Unitholders by size of holding:1 - 500 671 678 161 136 163 726 - -500 - 1 000 111 109 88 985 88 108 - -1 001 - 5000 224 227 551 262 544 901 0.1% 0.1%5 001 - 10 000 50 46 384 271 352 355 0.1% 0.1%10 001 - 100 000 107 105 3 190 841 3 040 098 0.5% 0.5%Over 100 000 98 100 600 020 629 600 207 936 99.3% 99.3%Total 1 261 1 265 604 397 124 604 397 124 100.0% 100.0%
Unitholders by classification:Body corporates / Trusts 30 30 97 310 524 184 667 640 16.1% 30.5%Insurance companies, pension / equity funds 100 97 474 540 919 378 723 232 78.5% 62.7%Individuals 1 131 1 138 32 545 681 41 006 252 5.4% 6.8%Total 1 261 1 265 604 397 124 604 397 124 100.0% 100.0%
Public 1 259 1 262 507 822 550 420 105 386 84.0% 69.4%Non-public Directors' interests (including associates)* 2 3 96 574 574 184 291 738 16.0% 30.6%Total 1 261 1 265 604 397 124 604 397 124 100.0% 100.0%
* Some of these holdings are also non-public by virtue of the person holding 10% or more of the linked units
Unitholders holding more than 5% at the respective year end:FNB Nominees (Pty) Ltd RE: AGray BPOPF 1 1 120 067 868 120 067 868 19.9% 19.9%Cash Bazaar Holdings (Pty) Ltd 1 1 96 234 242 183 951 406 15.9% 30.4%Debswana Pension Fund 1 0 87 456 295 - 14.5% -Kgori Capital - BPOPF Equity - 1 - 43 703 735 - 7.2%FNBB Nominees (Pty) Ltd RE: AG BPOPFEquity Port B 1 - 42 966 105 - 7.1% -Stanbic Nominees RE: BIFM - 1 - 30 239 699 - 5.0%Total 4 4 346 724 510 377 962 708 57.4% 62.5%
18

UNITHOLDER ANALYSIS>(continued)
as at 31 July 2018
# the closing value is based on the BSE report for trades that take place on the last day of the month while all other information is based onthe record date per the Transfer Secretary records. At times the closing price is therefore outside the minimum to maximum range for a specificmonth.
2018
Month Closing High Low Closing # Volume Value Number Averagemkt cap traded traded of trades trade value
Pm P P P P PAug-17 1 940 3.22 3.21 3.21 3 412 644 10 954 891 48 228 227Sep-17 1 940 3.21 3.21 3.21 6 986 708 22 427 333 39 575 060Oct-17 1 940 3.21 3.21 3.21 42 750 137 228 14 9 802Nov-17 1 940 3.21 3.21 3.21 915 826 2 939 801 14 209 986Dec-17 1 940 3.22 3.21 3.21 483 510 1 552 067 26 59 695Jan-18 1 940 3.21 3.21 3.21 4 077 13 087 6 2 181Feb-18 1 922 3.21 3.15 3.18 2 672 738 8 503 614 18 472 423Mar-18 1 922 3.18 3.18 3.18 66 271 210 742 14 15 053Apr-18 1 928 3.19 3.19 3.19 66 618 211 881 5 42 376May-18 1 934 3.23 3.20 3.20 30 807 99 061 13 7 620Jun-18 1 940 3.23 3.21 3.21 87 962 799 282 360 922 19 14 861 101Jul-18 1 940 3.21 3.21 3.21 354 330 1 137 399 6 189 567
1 940 3.22 3.15 3.21 102 999 078 330 548 026 222 1 488 955
Number of units traded as a % of total units in issue 17.04%
2017
Month Closing High Low Closing # Volume Value Number Averagemkt cap traded traded of trades trade value
Pm P P P P PAug-16 1 777 2.95 2.93 2.94 80 732 237 358 21 11 303Sep-16 1 777 2.94 2.93 2.94 7 446 21 890 4 5 473Oct-16 1 777 2.94 2.94 2.94 31 642 93 027 12 7 752Nov-16 1 777 2.94 2.94 2.94 468 491 1 377 364 7 196 766Dec-16 1 777 2.94 2.94 2.94 200 095 588 279 12 49 023Jan-17 1 789 2.96 2.94 2.96 363 116 1 071 834 15 71 456Feb-17 1 837 3.04 2.97 3.04 1 489 845 4 470 406 36 124 178Mar-17 1 904 3.15 3.04 3.15 846 560 2 604 059 44 59 183Apr-17 1 910 3.16 3.15 3.16 12 260 38 740 4 9 685May-17 1 940 3.21 3.17 3.21 1 066 643 3 405 468 24 141 894Jun-17 1 940 3.21 3.21 3.21 51 203 164 362 9 18 262Jul-17 1 946 3.21 3.21 3.22 142 239 210 456 588 187 96 4 756 127
1 946 3.21 2.93 3.22 146 857 243 470 660 974 284 1 657 257
Number of units traded as a % of total units in issue 24.30%
A N N U A L R E P O R T 2 0 1 8
19

GOVERNANCE AND RISK>
The directors recognise the need to conduct the business with integrity and in accordance with sound corporate practices.
The Board has accordingly established mechanisms and policies appropriate to the operations, which include a Board Charter, ApprovalFramework, Public Information Policy as well as two sub-committees as detailed below.
BOARD AND ITS SUB-COMMITTEESThe Board consists of 6 directors, 50% of whom are non-executive and 33% independent non-executive. The Board members bringsignificant experience in the property and retail fields which are the primary business sectors relevant to the Group. Non-executive directorsare chosen for their business acumen and skills pertinent to the business of the Company. The Board considers that it is adequatelyconstituted to enable it to carry out its duties and that there is an appropriate balance of skills. 50% of the Board are Batswana. One thirdof directors are required to retire annually at the annual general meeting, based on those longest in office. If, at the date of any ordinarymeeting, any Director has held office for three years since their last election or appointment they shall retire at such meeting, either asone of the one third normal rotation or in addition thereto. Retiring members are eligible for re-election with all motions for appointmentor re-election being considered individually. During the year Mr. J.P. McLoughlin and Mr. S. Venkatakrishnan retired and were re-electedat the annual general meeting held on 18 January 2018.
The Board meets at least three times per annum. While the Board strives to have full attendance at meetings, the quorum is any fourdirectors and board papers are distributed timeously to enable members to be properly briefed prior to meetings. Directors who areunable to attend a meeting receive the relevant documents and are able to communicate with the Chairman and Company executiveson any issue. During the year the Board met three times, Mr J. Mynhardt, did not attend 2 of the meetings but provided input as required.Mr. Venkatakrishnan did not attend 3 meetings however, did attend the subsequent Board meeting in October 2018. Mr J. McLoughlin,as an independent non-executive director chaired those meetings where Mr J. Mynhardt was not in attendance.
Decisions required to be taken between meetings are attended to by the passing of a resolution signed by all directors. These round robinresolutions are subsequently ratified at the following Board meeting.
The primary responsibilities of the Board are:• To exercise leadership, enterprise, integrity and judgment in directing the Company as so to achieve its strategic goals and objectives;• To approve the strategic direction and budgets of the Company and ensure that the goals and objectives are aligned to those set out in the Trust Deed and that the Company is able to continue as a going concern;• To retain full and effective control of the Company, its management and key service providers;• To delegate appropriate matters to its sub-committees, management and key service providers in terms of written mandates and authority, and to amend the terms of reference as well as members of the sub-committees as appropriate;• To consider the Board composition; and• Reporting formally to linked unitholders through the annual report and announcements.
The Board has established two sub-committees, being the Risk, Audit & Compliance Committee (RACC) and the Investment Committee(IC). The terms of reference and composition of these committees are set out below.
The Company has no employees and there is therefore no need for a Remuneration Committee. The Board, excluding the independentdirectors, approves remuneration payable to independent directors, which will then be ratified by unitholders at each annual generalmeeting. Independent directors receive no compensation other than fees approved and disclosed in this manner and fees are based onattendance at meetings.
20

GOVERNANCE AND RISK>(continued)
BOARD AND ITS SUB-COMMITTEES (continued)The Board as a whole considers Board composition and has not formed a separate Nomination Committee. There have been no changesto the Board during the year.
In as far as the Board is aware:• The Company has not engaged in any activities which contravene laws and regulations;• The Directors have declared all material interests in contracts involving the Company;• The Company has made all endeavours to ensure equitable treatment of unitholders;• The RACC has conducted a review of the key internal controls which cover financial, operational and compliance controls and risk management; and• The Board has considered the Company's ability to continue as a going concern and concluded that it is able to.
Risk, Audit & Compliance CommitteeComposition, quorum & frequency
• Chaired by an independent director.• Comprise two independent directors (with sufficient financial literacy) and the Managing Director. The Chief Financial Officer, external
auditors and a Management Company representative attend meetings by invitation.• Meet at least twice per annum and meetings may be held by conference call for logistical reasons.• Quorum of 2 members.
In addition, the external auditors and independent RACC directors are given the opportunity to meet without management being presentif deemed appropriate. Neither the independent directors nor external auditors considered this necessary during the year under review.
Scope and Responsibilities• Review of internal controls and systems;• Monitoring that decisions taken by the board that affect the RACC are followed through;• Monitoring compliance with Trust Deed, BSE Listings Requirements, Companies Act, Corporate Governance and other applicable legislation;• Review the audit management letter;• Recommend letters of representation and other documentation for board approval;• Recommend approval of annual reports and interim results to board;• Recommend approval of BSE announcements to board;• Agree and recommend accounting policies to board;• Reporting to board on proceedings of the committee;• Monitor the corporate risk assessment process;• As regards External Auditors, the RACC:
- confirm their appointment;- consider independence especially where non-audit services are performed;- agree principles for the audits, without limiting their statutory obligations;- confirm the extent of external verification of non-financial information;- decide on the external review of interim results;
• Consider problems identified in the going concern assumption;• Consider the appropriateness and disclosure of related party transactions; and• Recommendation regarding internal audit.
A N N U A L R E P O R T 2 0 1 8
21
BOARD AND ITS SUB-COMMITTEES (continued)Risk, Audit & Compliance Committee (continued)The Committee met formally three times this year. The members of the Committee are J.P. McLoughlin (Chairman of RACC andIndependent non-executive director), S.Venkatakrishnan (Independent non-executive director) and T.L.J. Mynhardt (Managing Director).Mr S. Venkatakrishnan tendered his apologies. All other members, the external audit partner, CFO and relevant Financial Manager attendedall meetings in person.
Investment CommitteeComposition, quorum & frequency
• Chaired by the Chairman.• Comprise the Chairman, Managing Director and Chief Financial Officer.• Meet as required.• Quorum of 2 members.
Scope and Responsibilities• Developing and recommending an investment strategy;• Advising on and/or effecting disposals, acquisitions and developments within the approved investment policy and authority limits;• Recommending disposals, acquisitions and developments to the Board which exceed the authority limits;• Approving the Company's funding facilities, debt fixes and banking arrangements.
The Committee did not formally meet during the year, but interact regularly as required. The members of the Committee are J.T. Mynhardt(Chairman), T.L.J. Mynhardt (Managing Director) and L.C. Tapping (Chief Financial Officer).
ASSET AND PROPERTY MANAGEMENTThe assets and properties of the Company are managed by Nafprop, a wholly owned subsidiary of CBH, in terms of separate propertyand asset management agreements. The key responsibilities and remuneration in terms of these agreements are set out below.
Asset ManagementThe manager is accountable to the Board of Directors of NAP, with the obligation to report regularly as required by the Board of NAP.
Key responsibilities:• Manage the assets and securities owned by the Company, from time to time;• Carry out all treasury and asset management services;• Investigate and prepare recommendations of strategy for the Company including potential acquisitions to or disposals from the Company's portfolio;• Negotiate for and conclude agreements for acquisitions and disposals to and from the portfolio;• Manage cash surpluses and payment of distributions to linked unitholders;• Procure valuations;• Undertake the financial, administrative and secretarial management of the Company;• Prepare or cause to be prepared all financial statements, reports, returns and valuations of the property portfolio;• Ensure compliance by the Company with applicable regulatory requirements; and• Prepare budgets of income and expenditure at the commencement of each financial year.
GOVERNANCE AND RISK>(continued)
22

ASSET AND PROPERTY MANAGEMENT (continued)Asset Management (continued)Remuneration:
The manager is entitled to be reimbursed any expenditure or other amounts reasonably incurred and disbursed by it in respect ofthe management of the Company's assets and is entitled to an annual fee equal to 0.50% (exclusive of VAT) of the value of the averagemarket capitalisation of the Company in the month in question plus debt of the Company, paid monthly.
Property ManagementThe manager is accountable to the Board of Directors of NAP, with the obligation to report regularly as required by the Board of NAP.
Key responsibilities:• Let accommodation in the properties, prepare leases, collect rentals, enforce leases and other contractual arrangements;• Manage the properties, paying all costs, disbursements and expenses related to and arrange and maintain insurance in respect of the
properties;• Recommend to the Board any replacement, repairs, refurbishment or maintenance necessary;• Assist with the preparation of the half yearly and annual financial statements and reports to the Company;• Maintain a separate bank account into which all rental income is paid and from which all expenses in respect of the properties is disbursed;• Keep books and records in accordance with acceptable practices and standards, and report in terms of International Financial Reporting
Standards (IFRS); and• Prepare budgets for each financial year and present same for approval by the Board prior to the commencement of that year.
Remuneration:The manager is entitled to be reimbursed all expenditure and other amounts reasonably incurred by and disbursed by it in respectof the properties, and a fee equal to 4.5% (exclusive of VAT) of the amount of total collections by it, and, in respect of letting, 100%of the first month's gross rental for leases that run up to five years and 150% of the first month's gross rental for leases that run inexcess of five years, and in respect of renewals of such leases procured by the manager itself 50% of the aforesaid fees based onthe period of renewal.
RISK MANAGEMENTThe primary objective of risk management is to find the balance between minimising risk to acceptable levels and the costs and practicalitiesin achieving this. This involves gaining an understanding of the risks the Group is exposed to, establishing acceptable tolerance levels andmanaging the risks to ensure they stay within the tolerable levels.
In the normal course of operations the Group is exposed to strategic and business risk, financial risk, regulatory and compliance risk.
The group's exposure to human resources risk is an indirect risk for the Group as it employs no staff in view of the asset and propertymanagement being outsourced. NAP's executives are consulted in all key employment decisions by the Asset and Property Manager andhave direct access to the relevant managers as required.
GOVERNANCE AND RISK>(continued)
A N N U A L R E P O R T 2 0 1 8
23
RISK MANAGEMENT (continued)The Group's exposure to technology risk is similarly outsourced and the Asset and Property Manager uses a reputable and well supportedproperty management system, the MDA system, for managing the company and its properties. MDA is an interactive and adaptive systemwhich allows Nafprop to generate real time reports for each of the properties and allows for the effective management of the properties.Nafprop can accurately manage and access instant data on the tenancies, leases, occupancies, rental income and expenses through thissystem. The RACC considers the appropriateness of reported back up procedures as advised by the Asset and Property Manager.
The key risks that the Group is exposed to, together with the key controls, are summarised below.
Financial riskFinancial risk comprises market risk (incorporating interest, currency and other price risk), credit risk and liquidity risk. Notes 30.1 and 30.2to the annual financial statements deal with the major elements of financial risk which arise from financial instruments to which the Groupis exposed, during or at the end of the financial reporting period, and the capital risk management.
Strategic and business riskThis is the risk that the Company does not achieve critical objectives such as meeting stakeholder expectations, does not have access tocapital as required, as well as inherent business risks in the property sector.
The review of investment strategy, regular budget and forecasting processes, approval framework and the routine presentation of reportsto Board are the Board's primary method of managing strategic and business risks. The Company has also contracted with competentasset managers who are responsible for advising the Board on strategy and individual property investments.
Portfolio growthThis is the risk that the Group is unable to grow its asset base in order to create new investment opportunities and realise its strategicobjectives. The growth of the portfolio has been challenging in view of the demand for property investment opportunities and limitedavailability of sizeable assets at acceptable returns. Both the Board and Management continue to seek potential opportunities but willonly consider acquisitions or developments that contribute positively to the long term growth in returns to unitholders.
Investment decision riskThis is the risk that inappropriate investment decisions are made. These decisions are made in terms of the approval framework,which delegates limited decisions in this regard to the Investment Committee, while retaining decision making responsibility for allsignificant investment decisions at a Board level. The Board also relies on input from the Asset Manager in this regard.
Capital risk managementThis is the risk that the Group will have inadequate access to capital to meet its needs and its ability to continue as a going concern.The gearing level, relative cost of debt and equity as well as the yield hurdle and breakeven point forms part of the investment strategyreview and is a key part of any investment decision contemplated. The Board also reviews cash flow projections at each meeting.This risk is more fully dealt with in notes 30.1 and 30.2 to the annual financial statements.
Property performance riskThe Asset and Property Manager is responsible for managing the properties on a day to day, and more strategic, basis. The keyconsiderations are the market factors surrounding the property, the continued tenancy, rental levels, collection of rentals andmanagement of operating costs to optimise spend. Nafprop has various systems, controls and procedures in place to manage theseissues and report to RACC and Board in summarised form on all the relevant items at each meeting.
GOVERNANCE AND RISK>(continued)
24

GOVERNANCE AND RISK>(continued)
A N N U A L R E P O R T 2 0 1 8
25
Ethical leadership and corporate citizenship
Effective leadership based on an ethical foundation �
Group is seen as a responsible corporate citizen �
Effective management of company's ethics �
Assurance statement on ethics in integrated report � Note 1
Board and directors
The board is the focal point for and the custodian of corporate governance �
The chairman of the board is an independent non-executive director � Note 2
CEO has been appointed (MD) �
Framework for the delegation of authority has been established �
The board comprises a balance of power, with a majority of non-executive directors the majority of � Note 3
whom are independent
Directors are appointed through a formal process �
Formal induction and ongoing training of directors is conducted x Note 4
The board is assisted by a competent, suitable qualified and experienced company secretary �
RISK MANAGEMENT (continued)Regulatory and compliance riskThis is the risk that the company does not comply with relevant legal requirements.
The risk is managed through the use of competent, skilled and experienced service providers who are required to provide their respectivesystems, controls and procedures to the RACC for review, as well as to confirm their compliance to these.
Executives and management take an active role in reviewing and commenting on relevant legislative and regulatory changes whereappropriate.
KING CODE OF CORPORATE GOVERNANCEThe following abridged checklist has been prepared in terms of the King Report on Governance (King III). This table includes NAP'sapplication of the King III principles highlighting areas of compliance, partial compliance, compliance in progress and non-compliance. Wherecompliance is not fulfilled entirely explanatory notes are included.
The following key is applicable to the checklist:
� = Compliance� = Partial compliance� = In progress x = Non-complianceN/A = Not applicable

GOVERNANCE AND RISK>(continued)
26
KING CODE OF CORPORATE GOVERNANCE (continued)
Board and directors (continued)
Regular performance evaluation of the board, its committees and the individual directors � Note 5
A governance framework has been agreed between the Group and the subsidiary boards � Note 6
Risk, remuneration and nomination committees appointed as standing committees � Note 7
Appointment of well-structured committees and an oversight of key functions �
Directors and executives are remunerated fairly and responsibly �
Remuneration of directors and certain senior executives is disclosed �
The company's remuneration policy is approved by its shareholders � Note 8
Audit Committee
Guided by terms of reference approved by the Board �
Members are to be suitably skilled and experienced independent, non-executive directors � Note 9
Chaired by an independent non-executive director �
Oversees integrated reporting � Note 1
Ensure a combined assurance model is applied to optimise assurance activities. � Note 10
Satisfies itself of the expertise, resources and experience of the company's finance function �
Oversees internal audit x Note 11
Recommends the appointment of the external auditors �
Integral to the risk management process �
Oversees the external audit process �
Reports to the board and shareholders on how it has discharged its duties � Note 12
Governance of risk
The board is responsible for the governance of risk and setting levels of risk tolerance �
The RACC assists the board in carrying out its risk responsibilities �
The board delegates the risk management plan to management (including design, implementation �
& monitoring)
The board ensures that risk assessments and monitoring is performed on a continual basis �
Frameworks and methodologies are implemented to increase the probability of anticipating �
unpredictable risks
Ensure Management considers & implements appropriate risk responses �
Ensure continual risk monitoring by Management �

KING CODE OF CORPORATE GOVERNANCE (continued)
Governance of risk (continued)
The board receives assurance on the effectiveness of the risk management process �
Ensure sufficient, timeously risk disclosure to stakeholders �
Governance of information technology (“IT”)
The board is responsible for IT governance �
IT is aligned with the performance and sustainability objectives of the company �
Management is responsible for the implementation of an IT governance framework �
The board monitors and evaluates significant IT investments and expenditure N/A Note 13
IT is an integral part of the company's risk management �
IT assets are managed effectively N/A Note 13
The Audit and Risk Committee assists the board in carrying out its IT responsibilities �
Compliance with laws, codes, rules and standards
The board ensures that the company complies with applicable laws �
The board and directors have a working understanding of the relevance and implications of �
non-compliance
Compliance risk forms an integral part of the company's risk management process �
The board has delegated to management the implementation of an effective compliance framework �
and processes
Internal audit
Ensure effective risk based internal audit x Note 11
Governing stakeholder relationships
Appreciate that stakeholders' perceptions affect a company's reputation �
Delegate Management to proactively deal with stakeholder relationships �
Strive for an appropriate balance between the various stakeholder groupings �
Ensure equitable treatment of shareholders �
Transparent and effective communication with stakeholders �
Ensure disputes are resolved effectively and timeously �
Integrated reporting and disclosure
Sustainability reporting and disclosure is integrated with the company's financial reporting � Note 1
Board appreciated that strategy, risk, performance and sustainability are inseparable �
GOVERNANCE AND RISK>(continued)
A N N U A L R E P O R T 2 0 1 8
27

GOVERNANCE AND RISK>(continued)
28
KING CODE OF CORPORATE GOVERNANCE (continued)NotesNote 1 = The measures and bases for integrated reporting are currently being considered to incorporate commentary and analysis usefulto all stakeholders for roll out in the upcoming financial year. The board does however, have a formal charter, the foundation of whichrecognises the need to conduct the business with integrity and in accordance with sound corporate practice. NAP has no employeeshowever the Property and Asset Management Company, Nafprop, its employees and the executive directors are subject to a code ofconduct.
Note 2 = Mr John Tobias Mynhardt serves as non-executive Chairman. In terms of King III, he is not an independent director. Mr Mynhardthowever has vast experience in the property and retail sectors with skills and business acumen pertinent to NAP.
Note 3 = The board consists of six members, three of whom are non-executive. The majority of non-executive directors are independent.No lead independent director has been appointed. Directors are appointed by shareholders, unaccompanied by formal appointmentletters, at the AGM.
Note 4 = No new directors have been appointed in the current year. All current directors have served in executive roles for a numberof years and bring a wide range of business relevant experience, and sound knowledge of their fiduciary and corporate responsibilities.While no formal training process is in place, non-executive directors are required to uphold regulatory and good governance criteria andall members have access to the advice of the Company secretary as required.
Note 5 = While performance evaluation is not formalised, all sub-committees and directors are held accountable based on their fiduciaryand ethical duties.
Note 6 = Both directors of the subsidiary, NAP Namibia (Proprietary) Limited are also directors of the holding company. The NAP Board,RACC deal with matters related to both the holding company and subsidiary.
Note 7 = NAP has a risk, audit and compliance committee. No remuneration and nomination committee has been formed as the NAPhas no employees and nominations will be dealt with by the Board. See Note 8 for directors' fees.
Note 8 = NAP has no employees and only pays directors fees to independent directors. These fees are disclosed in the Annual FinancialStatements and ratified by unitholders at the AGM.
Note 9 = Members are suitably skilled and the majority are independent non-executive directors.
Note 10 = Assurance is based on key service provider confirmations to RACC, the oversight of the board and its committees and throughindependent assurance from parties such as the external auditors, valuers, and other professional service providers as required. Refer toNote 11 regarding internal audit.

Riverwalk Shopping Centre, Gaborone
GOVERNANCE AND RISK>(continued)
A N N U A L R E P O R T 2 0 1 8
29
KING CODE OF CORPORATE GOVERNANCE (continued)Notes (continued)Note 11 = There is no formal internal audit function but, in addition to the external audit, independent professionals are requested toreview specific areas. Furthermore, the management of day to day activities is outsourced to Nafprop who report to both RACC and theBoard. Executive directors review and provide input on key and subjective items. The nature of the business allows for strong budgetaryand monitoring controls, primarily through the format of reporting to both RACC and Board. This structure provides risk and governanceoversight and manages key risks that would otherwise be identified through an internal audit function.
Note 12 = The RACC reports to the Board at each meeting and all RACC minutes are distributed to the Board. The scope andresponsibilities of the committee, the meetings held and attendance at meetings is included in the Annual Report.
Note 13 = NAP's exposure to technology lies with Nafprop. Nafprop currently utilises MDA, which is a real-time integrated propertymanagement system. MDA is well supported and used extensively in the property industry. MDA has extensive reporting capabilities whichallows for continuous and accurate management of tenancies, leases, income, expenditure, debt collection and financial reporting. NAP'skey considerations are therefore the suitability of the system and the safeguarding of data which is considered by RACC.

DIRECTORS’>RESPONSIBILITY AND APPROVAL OF THE ANNUAL FINANCIAL STATEMENTS
The directors are required in terms of the Companies Act (CAP 42:01) to maintain adequate accounting records and are responsible forthe content and integrity of the consolidated and separate annual financial statements and related financial information included in this report.It is their responsibility to ensure that the consolidated and separate annual financial statements fairly present the state of affairs of the Groupand the Company as at the end of the financial year and the results of their operations and cash flows for the period then ended, inconformity with International Financial Reporting Standards. The external auditors are engaged to express an independent opinion on theconsolidated and separate annual financial statements.
The consolidated and separate annual financial statements are prepared in accordance with International Financial Reporting Standards andare based upon appropriate accounting policies consistently applied and supported by reasonable and prudent judgments and estimates.
The directors acknowledge that they are ultimately responsible for the system of internal financial control established by the Group andplace considerable importance on maintaining a strong control environment. To enable the directors to meet these responsibilities, theboard sets standards for internal control aimed at reducing the risk of error or loss in a cost effective manner. The standards include theproper delegation of responsibilities within a clearly defined framework, effective accounting procedures and adequate segregation of dutiesto ensure an acceptable level of risk. These controls are implemented by trained and appropriately skilled personnel and are reported tothe Risk, Audit & Compliance Committee. The Board requires adherence to the highest ethical standards in ensuring that the Group'sbusiness is conducted in a manner that in all reasonable circumstances is above reproach. The focus of risk management in the Group ison identifying, assessing, managing and monitoring all known forms of risk across the Group. While risk cannot be fully eliminated, theGroup endeavours to minimise it by ensuring that appropriate infrastructure, controls, systems and ethical behaviour are applied andmanaged within predetermined procedures and constraints.
The directors are of the opinion that based on the information and explanations given by management, the system of internal controlprovides reasonable assurance that the financial records may be relied on for the preparation of the consolidated and separate annualfinancial statements. However, any system of internal financial control can provide only reasonable, and not absolute, assurance againstmaterial misstatement or loss.
The directors have reviewed the Group's cash flow forecast for the year to 31 July 2019 and, in the light of this review and the currentfinancial position, they are satisfied that the Group has access to adequate resources to continue in operational existence for the foreseeablefuture.
The external auditors are responsible for independently reviewing and reporting on the consolidated and separate annual financial statements.The consolidated and separate annual financial statements have been examined by the external auditors and their report is presented onpages 31 to 35.
The consolidated and separate annual financial statements set out on pages 38 to 77, which have been prepared on the going concernbasis, were approved by the board on 29 October 2018 and were signed on its behalf by:
JT Mynhardt TLJ MynhardtChairman Managing Director29 October 2018 29 October 2018
30

INDEPENDENT AUDITOR’S REPORT>to the Unitholders of New African Properties Limited
OUR OPINIONIn our opinion, the consolidated and separate financial statements give a true and fair view of the consolidated and separate financial positionof New African Properties Limited (the “Company”) and its subsidiary (together the “Group”) as at 31 July 2018, and of its consolidatedand separate financial performance and its consolidated and separate cash flows for the year then ended in accordance with InternationalFinancial Reporting Standards (“IFRS”).
What we have auditedNew African Properties Limited's consolidated and separate financial statements set out on pages 38 to 77, which comprise:
• the group and company statements of financial position at 31 July 2018;• the group and company statements of comprehensive income for the year then ended;• the group and company statements of changes in equity for the year then ended;• the group and company statements of cash flows for the year then ended; and• notes to the financial statements, which include a summary of significant accounting policies.
BASIS FOR OPINIONWe conducted our audit in accordance with International Standards on Auditing (ISAs). Our responsibilities under those standards arefurther described in the Auditor's responsibilities for the audit of the consolidated and separate financial statements section of our report.
We believe that the audit evidence we have obtained is sufficient and appropriate to provide a basis for our opinion.
IndependenceWe are independent of the Group in accordance with the Botswana Institute of Chartered Accountants Code of Ethics (the BICA Code) andthe ethical requirements that are relevant to our audit of financial statements in Botswana. We have fulfilled our other ethical responsibilitiesin accordance with these requirements and the BICA Code. The BICA Code is consistent with the International Ethics Standards Boardfor Accountants' Code of Ethics for Professional Accountants (Parts A and B).
OUR AUDIT APPROACHOverview
Materiality
Groupscoping
Key AuditMatters
Overall group materiality• P 14,009,120 which represents 1% of the consolidated net assets
Group audit scope• Our engagement comprised of the statutory audit of New African Properties Limited and the Group's consolidated annual financial statements for the year ended 31 July 2018.• The Group consists of the Company and its operating subsidiary in Namibia. Full scope audits were performed at both of these companies.
Key Audit Matter• Valuation of investment property
A N N U A L R E P O R T 2 0 1 8
31

OUR AUDIT APPROACH (continued)Overview (continued)As part of designing our audit, we determined materiality and assessed the risks of material misstatement in the consolidated and separatefinancial statements. In particular, we considered where the directors made subjective judgements; for example, in respect of significantaccounting estimates that involved making assumptions and considering future events that are inherently uncertain. As in all of our audits,we also addressed the risk of management override of internal controls, including among other matters, consideration of whether therewas evidence of bias that represented a risk of material misstatement due to fraud.
MaterialityThe scope of our audit was influenced by our application of materiality. An audit is designed to obtain reasonable assurance whether thefinancial statements are free from material misstatement. Misstatements may arise due to fraud or error. They are considered material ifindividually or in aggregate, they could reasonably be expected to influence the economic decisions of users taken on the basis of theconsolidated financial statements.
Based on our professional judgement, we determined certain quantitative thresholds for materiality, including the overall group materialityfor the consolidated financial statements as a whole as set out in the table below. These, together with qualitative considerations, helpedus to determine the scope of our audit and the nature, timing and extent of our audit procedures and to evaluate the effect of misstatements,both individually and in aggregate on the financial statements as a whole.
INDEPENDENT AUDITOR’S REPORT>(continued)
to the Unitholders of New African Properties Limited
Overall group materiality P 14,009,120
How we determined it 1% of consolidated net assets
Rationale for the materiality We chose group net assets as the benchmark because, in our view, the net asset value and thebenchmark applied distribution yield, which is distribution divided by the net assets, are the key criteria against which the performance of the Group is most commonly measured by users. We chose 1%, which is consistent
with quantitative materiality thresholds used for similar companies in this sector.
How we tailored our group audit scopeWe tailored the scope of our audit in order to perform sufficient work to enable us to provide an opinion on the consolidated financialstatements as a whole, taking into account the structure of the Group, the accounting processes and controls, and the industry in whichthe Group operates. In doing so, full scope audits were performed at the Company and its Namibian operating subsidiary as - based onmateriality and risk - these could individually or in aggregate have a material impact on the consolidated financial statements.
In establishing the overall approach to the group audit, we determined the type of work that needed to be performed by us, as the groupengagement team, or the component auditor under our instruction. Where the work was performed by the component auditor, wedetermined the level of involvement we needed to have in the audit work at the component to be able to conclude whether sufficientappropriate audit evidence had been obtained as a basis for our opinion on the Group financial statements as a whole.
KEY AUDIT MATTERKey audit matters are those matters that, in our professional judgment, were of most significance in our audit of the consolidated andseparate financial statements of the current period. These matters were addressed in the context of our audit of the consolidated andseparate financial statements as a whole, and in forming our opinion thereon, and we do not provide a separate opinion on these matters.
32

INDEPENDENT AUDITOR’S REPORT>(continued)
to the Unitholders of New African Properties Limited
Key audit matter
Valuation of investment property (Group and Company)(All figures are in P '000)
The Group accounts for investment properties at fair value inboth its consolidated and separate financial statements. Thecarrying values of investment properties for the Group andCompany at 31 July 2018 were P1,430,853 and P1,384,337,respectively (refer Note 5, Investment Property). The fair valueadjustment recorded in net profit before tax in respect of investmentproperties for the Group and Company amounted to P71,936and P70,408, respectively, for the financial year.
At 31 July 2018, the Group's valuation of the portfolio of propertieswas based on valuations carried out by an independent valuerusing the investment method being a discounted cash flowapproach, with the exception of the Riverwalk property, wherethe Group reduced the value determined by the independentvaluer to take account of specific contractual arrangements. Thisalso impacts the equity accounted value of the Group's investmentin associate (refer Note 4, Critical accounting estimates andjudgements, Associate (Page 55)).
Significant judgement is required to determine the fair value ofinvestment properties, especially with respect to the determinationof appropriate capitalisation rates and net cash flows. We consideredthe valuation of these assets to be a matter of most significanceto the current year audit due to the magnitude of the balances,combined with the significant assumptions associated withdetermining the fair values.
How our audit addressed the key audit matter
We assessed the competence and capabilities of the Group'sindependent valuer by verifying his qualifications and pastexperience. We also determined whether there are any mattersthat might have affected the independent valuer's objectivity ormay have imposed scope limitations upon the work performedby the independent valuer.
In addition, we obtained written confirmation from the valuerthat:• all professional staff involved in the valuation process are in good standing with relevant professional bodies;• they are free from any direct or indirect shareholding or financial interest in the Group;• the Group did not place any restrictions on the valuation
process; and• they are not aware of any information relevant to the valuation which had been withheld by the Group.
We found no evidence to suggest that the objectivity of thevaluer in performance of the valuation was compromised.
We compared the valuation approach used by the independentvaluer against IFRS requirements and industry norms to confirmthat the methodology was appropriate under the circumstances. The valuation method was comparable to those typically usedin the market.
We tested a selection of data inputs used in the independentvaluations, including net cash flows, against appropriate supportingdocumentation (such as tenancy schedules, rental agreements,business plans and historical performance) to assess the accuracyand completeness thereof. The data inputs used in theindependent valuations were found to be reasonable and appliedconsistently in comparison to last year.
We compared the capitalisation rates utilised in the valuation tothose generally used in the market, rates used in historicalvaluations, general market factors (such as comparable long-bond yield rates) and property specific risk factors. These inputswere found to be within a reasonable range.
With respect to the Riverwalk property, we tested the Group'scalculation of the downward adjustment in value to ensure that:• the calculations were consistent with existing contractual arrangements which had not been taken into account by
the independent valuer;
KEY AUDIT MATTER (continued)
A N N U A L R E P O R T 2 0 1 8
33

INDEPENDENT AUDITOR’S REPORT>(continued)
to the Unitholders of New African Properties Limited
OTHER INFORMATIONThe directors are responsible for the other information. The other information comprises the information included in the New AfricanProperties 2018 Annual Report. Other information does not include the consolidated and separate financial statements and our auditor'sreports thereon.
Our opinion on the consolidated and separate financial statements does not cover the other information and we do not express an auditopinion or any form of assurance conclusion thereon.
In connection with our audit of the consolidated and separate financial statements, our responsibility is to read the other informationidentified above and, in doing so, consider whether the other information is materially inconsistent with the consolidated and separatefinancial statements or our knowledge obtained in the audit, or otherwise appears to be materially misstated.
If, based on the work we have performed on the other information, we conclude that there is a material misstatement of this otherinformation, we are required to report that fact. We have nothing to report in this regard.
RESPONSIBILITIES OF THE DIRECTORS FOR THE CONSOLIDATED AND SEPARATE FINANCIAL STATEMENTSThe directors are responsible for the preparation of the consolidated and separate financial statements that give a true and fair view inaccordance with International Financial Reporting Standards and for such internal control as the directors determine is necessary to enablethe preparation of consolidated and separate financial statements that are free from material misstatement, whether due to fraud or error.
In preparing the consolidated and separate financial statements, the directors are responsible for assessing the Group and the Company'sability to continue as a going concern, disclosing, as applicable, matters related to going concern and using the going concern basis ofaccounting unless the directors either intend to liquidate the Group and/or the Company or to cease operations, or have no realisticalternative but to do so.
AUDITOR'S RESPONSIBILITIES FOR THE AUDIT OF THE CONSOLIDATED AND SEPARATE FINANCIAL STATEMENTSOur objectives are to obtain reasonable assurance about whether the consolidated and separate financial statements as a whole are freefrom material misstatement, whether due to fraud or error, and to issue an auditor's report that includes our opinion. Reasonable assuranceis a high level of assurance, but is not a guarantee that an audit conducted in accordance with ISAs will always detect a material misstatementwhen it exists. Misstatements can arise from fraud or error and are considered material if, individually or in the aggregate, they couldreasonably be expected to influence the economic decisions of users taken on the basis of these consolidated and separate financialstatements.
34
Key audit matter How our audit addressed the key audit matter
• the data inputs used in the calculation, including future cashflows from net rental income are consistent with supportingdocumentation (such as rental agreements, business plansand historical performance); and
• the discount rate utilised to calculate the present value ofestimated future cash flows was appropriately determinedbased on the discount rate implied by the independent
valuation.
KEY AUDIT MATTER (continued)

INDEPENDENT AUDITOR’S REPORT>(continued)
to the Unitholders of New African Properties Limited
AUDITOR'S RESPONSIBILITIES FOR THE AUDIT OF THE CONSOLIDATED AND SEPARATE FINANCIAL STATEMENTS(continued)As part of an audit in accordance with ISAs, we exercise professional judgement and maintain professional scepticism throughout the audit.We also:
• Identify and assess the risks of material misstatement of the consolidated and separate financial statements, whether due to fraud or error, design and perform audit procedures responsive to those risks, and obtain audit evidence that is sufficient and appropriate to provide a basis for our opinion. The risk of not detecting a material misstatement resulting from fraud is higher than for one resulting
from error, as fraud may involve collusion, forgery, intentional omissions, misrepresentations, or the override of internal control.• Obtain an understanding of internal control relevant to the audit in order to design audit procedures that are appropriate in the circumstances, but not for the purpose of expressing an opinion on the effectiveness of the Group's and the Company's internal control.• Evaluate the appropriateness of accounting policies used and the reasonableness of accounting estimates and related disclosures made
by the directors.• Conclude on the appropriateness of the directors' use of the going concern basis of accounting and, based on the audit evidence obtained, whether a material uncertainty exists related to events or conditions that may cast significant doubt on the Group's and the Company's ability to continue as a going concern. If we conclude that a material uncertainty exists, we are required to draw attention in our auditor's report to the related disclosures in the consolidated and separate financial statements or, if such disclosures
are inadequate, to modify our opinion. Our conclusions are based on the audit evidence obtained up to the date of our auditor's report. However, future events or conditions may cause the Group and / or Company to cease to continue as a going concern.• Evaluate the overall presentation, structure and content of the consolidated and separate financial statements, including the disclosures,
and whether the consolidated and separate financial statements represent the underlying transactions and events in a manner that achieves fair presentation.• in sufficient appropriate audit evidence regarding the financial information of the entities or business activities within the group to express an opinion on the consolidated financial statements. We are responsible for the direction, supervision and performance of the group audit. We remain solely responsible for our audit opinion.
We communicate with the directors regarding, among other matters, the planned scope and timing of the audit and significant audit findings,including any significant deficiencies in internal control that we identify during our audit.
We also provide the directors with a statement that we have complied with relevant ethical requirements regarding independence, andto communicate with them all relationships and other matters that may reasonably be thought to bear on our independence, and whereapplicable, related safeguards.
From the matters communicated with the directors, we determine those matters that were of most significance in the audit of theconsolidated and separate financial statements of the current period and are therefore the key audit matters. We describe these mattersin our auditor's report unless law or regulation precludes public disclosure about the matter or when, in extremely rare circumstances,we determine that a matter should not be communicated in our report because the adverse consequences of doing so would reasonablybe expected to outweigh the public interest benefits of such communication.
Practicing member: Rudi Binedell 29 October 2018Membership number: 20040091 Gaborone
A N N U A L R E P O R T 2 0 1 8
35

DIRECTORS’ REPORT>
The Directors have pleasure in submitting their report for the year ended 31 July 2018.
NATURE OF BUSINESSNew African Properties Limited is a property investment company listed on the Botswana Stock Exchange and is classified as a publicvariable rate loan stock company. The Group derives its income from rental income from a portfolio of predominantly Botswana basedretail properties.
STATED CAPITALAs a loan stock company the equity of the company comprises linked units, where every one ordinary share is indivisibly linked to onevariable rate debenture.
At 31 July 2018 there were 604 397 124 (2017: 604 397 124) linked units in issue with no changes during the year:
2018 2017
Balance at beginning and end of year 604 397 124 604 397 124
DISTRIBUTIONDistributions to linked unitholders comprise dividends on the ordinary shares and interest on debentures. The following distributions weredeclared for the year:
2018 2017P'000 thebe per P'000 thebe per
linked unit linked unit 2018: Number 13 - declared 23 April 2018, paid 25 May 2018(2017: Number 11 - declared 12 April 2017, paid 26 May 2017)
Interest 67 572 11.18 61 951 10.25Dividends 6 467 1.07 5 802 0.96
74 039 12.25 67 753 11.21 2018: Number 14 - declared 25 July 2018, paid 31 August 2018(2017: Number 12 - declared 26 July2017, paid 1 September 2017)
Interest 67 753 11.21 63 220 10.46Dividends 6 467 1.07 6 044 1.00
74 220 12.28 69 264 11.46Total for the year 148 259 24.53 137 017 22.67
SUBSIDIARY COMPANIESDetails of the Group's subsidiary company are set out in note 6 to the financial statements.
36
DIRECTORS’ REPORT>(continued)
DIRECTORS' FEESIndependent directors are paid fees for meetings attended and these fees amounted to P147 000 for the year (2017: P225 000). No otherexecutive or non-executive directors are paid fees by the Company and the Company pays no other compensation to any director.
DIRECTORS' INTERESTSThe aggregate number of linked units held directly by directors at 31 July 2018 was 340 332 (2017: 340 332) linked units. Indirectly,96 234 242 (2017: 184 427 871) linked units were held.
BORROWINGSThe company's borrowing capacity is limited to 70% of the value of the assets of the Company or such other sum as the Company may,by ordinary resolution, in general meeting determine. Directors are authorised to secure the repayment of or raise any such sum bymortgage or charge upon the whole or any part of the property and assets of the Company.
Borrowings amount to P21.8million at 31 July 2018 (2017: P24.8 million).
COMPANY SECRETARYThe company secretary is DPS Consulting Services (Proprietary) Limited.
POST BALANCE SHEET EVENTSThere are no material subsequent events occurring between the year end and the date of these financial statements.
JT Mynhardt TLJ MynhardtChairman Managing Director29 October 2018 29 October 2018
DIRECTORSThe following directors served on the Board during the year:
Name Date of appointment Last reappointed/ ratificationJT Mynhardt (Chairman) 22/02/2008 18/01/2017FB Lebala 22/02/2008 13/01/2016JP McLoughlin 12/08/2011 18/01/2018TLJ Mynhardt (Managing Director) 22/02/2008 13/01/2016LC Tapping (Financial Director) 15/07/2014 18/01/2017 S Venkatakrishnan 12/08/2011 18/01/2018
There have been no changes to the board up to the date of this report.
A N N U A L R E P O R T 2 0 1 8
37

STATEMENTS OF FINANCIAL POSITION>at 31 July 2018
Group Company
Notes 2018 2017 2018 2017 P'000 P'000 P'000 P'000
ASSETS
Non-current assets
Investment property 5 1 430 853 1 357 415 1 384 337 1 312 226
At fair value 1 459 348 1 384 676 1 412 122 1 338 907
Less: Rent straight line adjustment (28 495) (27 261) (27 785) (26 681)
Investment in subsidiary 6 - - 36 650 36 650
Investment in associate 7 39 470 30 547 4 951 4 951
Financial asset receivable 8 25 636 24 490 25 636 24 490
Intangible asset 9 6 907 7 788 6 907 7 788
Rent straight line adjustment 22 481 26 124 21 897 25 739
Total non-current assets 1 525 347 1 446 364 1 480 378 1 411 844
Current assets
Trade and other receivables 10 101 582 96 962 104 104 99 379
Rent straight line adjustment - current portion 6 014 1 137 5 888 942
Tax receivable 25 1 463 972 1 463 972
Cash and cash equivalents 11 39 561 43 170 33 775 38 719
Total current assets 148 620 142 241 145 230 140 012
TOTAL ASSETS 1 673 967 1 588 605 1 625 608 1 551 856
EQUITY AND LIABILITIES
Equity
Linked units 12 871 824 871 824 871 824 871 824
Foreign currency translation reserve (10 862) (10 766) - -
Retained income 539 950 470 937 490 071 431 025
Total equity 1 400 912 1 331 995 1 361 895 1 302 849
Non-current liabilities
Borrowings 13 18 735 21 878 18 735 21 878
Deferred tax liability 14 156 296 143 315 150 111 137 900
Total non-current liabilities 175 031 165 193 168 846 159 778
Current liabilities
Trade and other payables 15 20 316 19 028 17 422 16 891
Distributions payable 24 74 335 69 390 74 335 69 390
Borrowings - current portion 13 3 110 2 948 3 110 2 948
Taxation payable 25 263 51 - -
Total current liabilities 98 024 91 417 94 867 89 229
TOTAL EQUITY AND LIABILITIES 1 673 967 1 588 605 1 625 608 1 551 856
38

STATEMENTS OF COMPREHENSIVE INCOME>for the year ended 31 July 2018
Group Company
Notes 2018 2017 2018 2017 P'000 P'000 P'000 P'000
Revenue 16 189 266 175 062 180 402 167 456
Contractual rental and recoveries 188 030 174 363 179 298 166 287
Rent straight line adjustment 1 236 699 1 104 1 169
Other income 17 2 282 1 853 7 911 7 042
Property costs 18 (31 882) (29 700) (31 361) (29 149)
Net rental income 159 666 147 215 156 952 145 349
Other expenses 19 (12 287) (11 081) (12 214) (11 080)
Operating profit 147 379 136 134 144 738 134 269
Net finance income 5 225 4 992 4 949 4 794
Finance income 20 6 430 6 447 6 154 6 249
Finance expense 21 (1 205) (1 455) (1 205) (1 455)
152 604 141 126 149 687 139 063
Investment property fair value adjustment 5 71 936 68 412 70 408 67 447
At fair value 73 172 69 111 71 512 68 616
Rent straight line adjustment (1 236) (699) (1 104) (1 169)
Financial asset receivable fair value adjustment 8 1 146 1 169 1 146 1 169
Amortisation of intangible asset 9 (881) (881) (881) (881)
224 805 209 826 220 360 206 798
Share of associate's profit 7 8 923 3 766 - -
Profit before taxation 233 728 213 592 220 360 206 798
Taxation 22 (16 456) (14 188) (13 055) (11 585)
Profit for the year attributable to linked unitholders 217 272 199 404 207 305 195 213
Other comprehensive income
Items that may subsequently be reclassified to profit or loss
Currency translation differences (96) 1 364 - -
Comprehensive income for the year attributable to linked
unitholders 217 176 200 768 207 305 195 213
Units in issue at end of year 604 397 124 604 397 124 604 397 124 604 397 124
Thebe Thebe Thebe Thebe
Basic and diluted earnings per unit attributable to linked unitholders 23 35.95 32.99 34.30 32.30
A N N U A L R E P O R T 2 0 1 8
39

STATEMENTS OF CHANGES IN EQUITY>for the year ended 31 July 2018
Foreign Non currency distributable Distributable
Stated Total linked translation retained retained capital Debentures units reserve income income TotalP’000 P’000 P’000 P’000 P’000 P’000 P’000
Group
2017
Balance at beginning of year 8 719 863 105 871 824 (12 130) 406 742 1 808 1 268 244
Transactions with owners
Distributions declared (note 24)
Number 11 - declared 12 April 2017 - - - - - (67 753) (67 753)
Number 12 - declared 26 July 2017 - - - - - (69 264) (69 264)
Total transactions with owners - - - - - (137 017) (137 017)
Comprehensive income
Profit for the year - - - - - 199 404 199 404
Transfer of revaluation gains net of related taxes - - - - 62 249 (62 249) -
Other comprehensive income - - - 1 364 - - 1 364
Total comprehensive income - - - 1 364 62 249 137 155 200 768
Balance at end of year 8 719 863 105 871 824 (10 766) 468 991 1 946 1 331 995
2018
Balance at beginning of year 8 719 863 105 871 824 (10 766) 468 991 1 946 1 331 995
Transactions with owners
Distributions declared (note 24)
Number 13 - declared 23 April 2018 - - - - - (74 039) (74 039)
Number 14 - declared 25 July 2018 - - - - - (74 220) (74 220)
Total transactions with owners - - - - - (148 259) (148 259)
Comprehensive income
Profit for the year - - - - - 217 272 217 272
Transfer of revaluation gains net of related taxes - - - - 69 438 (69 438) -
Other comprehensive income - - - (96) - - (96)
Total comprehensive income - - - (96) 69 438 147 834 217 176
Balance at end of year 8 719 863 105 871 824 (10 862) 538 429 1 521 1 400 912
40

Foreign Non currency distributable Distributable
Stated Total linked translation retained retained capital Debentures units reserve income income TotalP’000 P’000 P’000 P’000 P’000 P’000 P’000
Company
2017
Balance at beginning of year 8 719 863 105 871 824 - 371 144 1 685 1 244 653
Transactions with owners
Distributions declared (note 24)
Number 11 - declared 12 April 2017 - - - - - (67 753) (67 753)
Number 12 - declared 26 July 2017 - - - - - (69 264) (69 264)
Total transactions with owners - - - - - (137 017) (137 017)
Comprehensive income
Profit for the year - - - - - 195 213 195 213
Transfer of revaluation gains net of related taxes - - - - 58 119 (58 119) -
Total comprehensive income - - - - 58 119 137 094 195 213
Balance at end of year 8 719 863 105 871 824 - 429 263 1 762 1 302 849
2018
Balance at beginning of year 8 719 863 105 871 824 - 429 263 1 762 1 302 849
Transactions with owners
Distributions declared (note 24)
Number 13 - declared 23 April 2018 - - - - - (74 039) (74 039)
Number 14 - declared 25 July 2018 - - - - - (74 220) (74 220)
Total transactions with owners - - - - - (148 259) (148 259)
Comprehensive income
Profit for the year - - - - - 207 305 207 305
Transfer of revaluation gains net of related taxes - - - - 59 566 (59 566) -
Total comprehensive income - - - - 59 566 147 739 207 305
Balance at end of year 8 719 863 105 871 824 - 488 829 1 242 1 361 895
STATEMENTS OF CHANGES IN EQUITY>(continued)
for the year ended 31 July 2018
A N N U A L R E P O R T 2 0 1 8
41
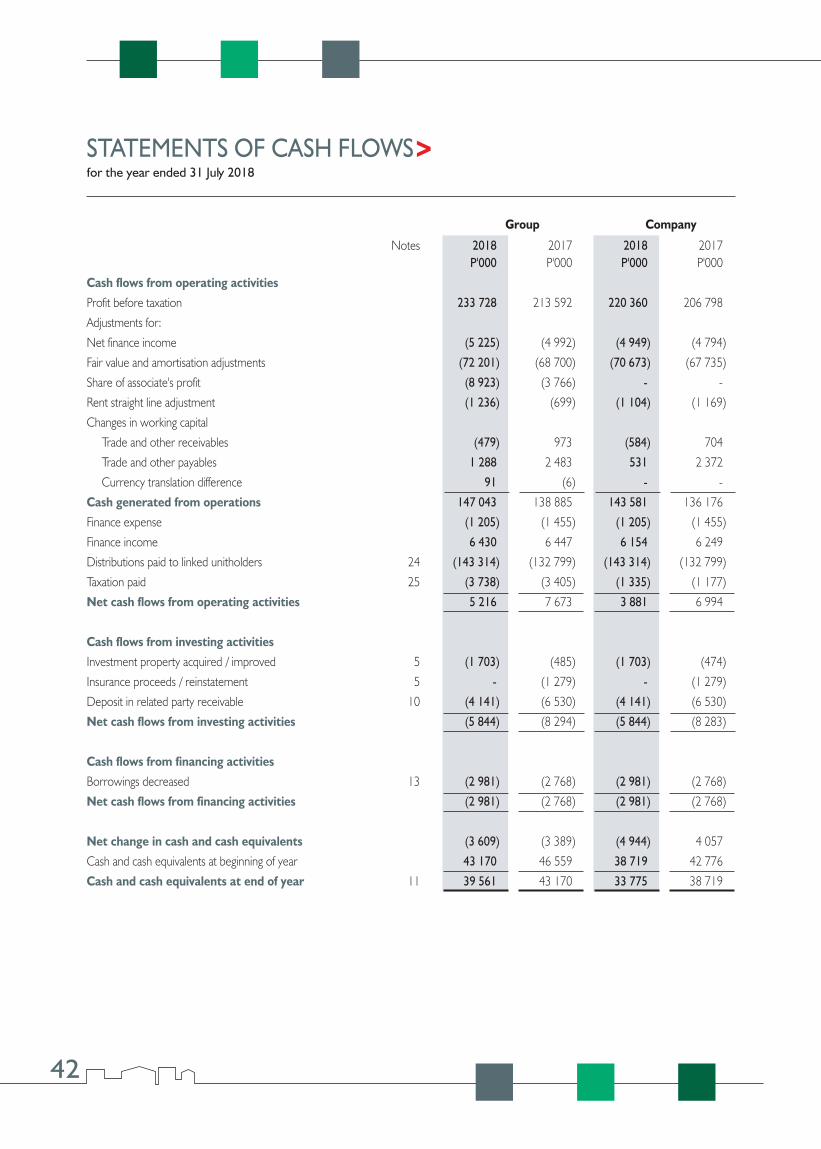
STATEMENTS OF CASH FLOWS>for the year ended 31 July 2018
Group Company
Notes 2018 2017 2018 2017 P'000 P'000 P'000 P'000
Cash flows from operating activities
Profit before taxation 233 728 213 592 220 360 206 798
Adjustments for:
Net finance income (5 225) (4 992) (4 949) (4 794)
Fair value and amortisation adjustments (72 201) (68 700) (70 673) (67 735)
Share of associate's profit (8 923) (3 766) - -
Rent straight line adjustment (1 236) (699) (1 104) (1 169)
Changes in working capital
Trade and other receivables (479) 973 (584) 704
Trade and other payables 1 288 2 483 531 2 372
Currency translation difference 91 (6) - -
Cash generated from operations 147 043 138 885 143 581 136 176
Finance expense (1 205) (1 455) (1 205) (1 455)
Finance income 6 430 6 447 6 154 6 249
Distributions paid to linked unitholders 24 (143 314) (132 799) (143 314) (132 799)
Taxation paid 25 (3 738) (3 405) (1 335) (1 177)
Net cash flows from operating activities 5 216 7 673 3 881 6 994
Cash flows from investing activities
Investment property acquired / improved 5 (1 703) (485) (1 703) (474)
Insurance proceeds / reinstatement 5 - (1 279) - (1 279)
Deposit in related party receivable 10 (4 141) (6 530) (4 141) (6 530)
Net cash flows from investing activities (5 844) (8 294) (5 844) (8 283)
Cash flows from financing activities
Borrowings decreased 13 (2 981) (2 768) (2 981) (2 768)
Net cash flows from financing activities (2 981) (2 768) (2 981) (2 768)
Net change in cash and cash equivalents (3 609) (3 389) (4 944) 4 057
Cash and cash equivalents at beginning of year 43 170 46 559 38 719 42 776
Cash and cash equivalents at end of year 11 39 561 43 170 33 775 38 719
42
NOTES TO THE ANNUAL FINANCIAL STATEMENTS31 July 2018
1. GENERAL INFORMATIONNew African Properties Limited and its subsidiaries (together the Group) own a portfolio of investment property located primarily inBotswana. The company is listed on the Botswana Stock Exchange.
These financial statements have been approved by the Board of Directors on 29 October 2018.
2. PRINCIPAL ACCOUNTING POLICIESThe principal accounting policies applied in the preparation of these Group and Separate annual financial statements are set out belowand are consistent in all material respects with those applied in the previous year.
2.1 Basis of preparationThese annual financial statements have been prepared on a going concern basis, are prepared in accordance with International FinancialReporting Standards (“IFRS”) and IFRIC interpretations and have been prepared under the historical cost convention as modified by themeasurement of investment properties and certain financial assets at fair value. Fair value adjustments do not affect the calculation ofdistributable income but do impact the net asset value per linked unit to the extent that adjustments are made to the carrying value ofassets and liabilities.
2.2 Basis of consolidationSubsidiaries are all entities (including structured entities) over which the Group has control. The Group controls an entity when the Groupis exposed to, or has rights to, variable returns from its involvement with the entity and has the ability to affect those returns through itspower over the entity. Subsidiaries are fully consolidated from the date on which control is transferred to the Group. They are deconsolidatedfrom the date that control ceases.
The Group annual financial statements incorporate the results and financial position of the Company and all subsidiaries, currently onlyNew African Properties (Namibia) (Proprietary) Limited. The results of subsidiaries are included from the effective dates of gaining controland up to the effective dates of relinquishing control.
All Group companies have a 31 July year end and apply uniform accounting policies for like transactions.
Gaborone Shopping Centre, Gaborone
A N N U A L R E P O R T 2 0 1 8
43

2. PRINCIPAL ACCOUNTING POLICIES (continued)2.2 Basis of consolidation (continued)
All intercompany transactions and balances between Group entities are eliminated with the exception of intercompany interest capitalisedto the cost of investment property during construction.
The Company carries its investment in subsidiaries in its separate financial statements at cost less any accumulated impairment.
2.3 Common control transactionsBusiness combinations which result from transactions between the holding company and its subsidiaries or between subsidiaries of theCompany are defined as common control transactions and are accounted for using the predecessor method of accounting.
Under the predecessor method of accounting, the results of the entities or businesses under common control are presented as if thebusiness combination had been effected from the effective date. The assets and liabilities combined are accounted for prospectively, basedon the carrying amounts applying the Company's accounting policies at the date of transfer. On consolidation, the cost of the businesscombination is cancelled with the values of the net assets received. Any resulting differences are classified as equity.
2.4 Business combinationsThe Group may invest in subsidiaries that hold properties but do not constitute a business. These transactions are therefore treated asasset acquisitions rather than business combinations.
For acquisitions meeting the definition of a business combination the acquisition method of accounting is used. The cost of an acquisitionis measured as the aggregate of the fair value of the underlying assets transferred, equity instruments issued and liabilities incurred orassumed at the date of exchange. Costs directly attributable to the acquisition are expensed as incurred. Identifiable assets acquired andliabilities and contingent liabilities assumed in a business combination are measured initially at their fair values at the acquisition date.
The excess of the cost of the acquisition over the fair value of the Group's share of the identifiable net assets acquired is recorded asgoodwill. Goodwill is not amortised but is tested for impairment on an annual basis. An impairment loss recognised for goodwill is notreversed in a subsequent period. On disposal of a subsidiary, attributable goodwill is included in the determination of the profit or losson disposal. If the cost of acquisition is less than the fair value of the net assets acquired, the difference is recognised directly in profit orloss.
2.5 Investment in associateAn associate is an entity over which the Group has significant influence and which is neither a subsidiary nor a joint arrangement. Significantinfluence is the power to participate in the financial and operating policy decisions of the investee but is not control or joint control overthose policies. Currently the only associate is Edco (Proprietary) Limited and the Group's interests are protected in terms of a shareholdersagreement, which includes a pre-emptive right.
An investment in associate is accounted for using the equity method in the consolidated financial statements and at cost in the separatecompany financial statements, except when the investment is classified as held-for-sale in accordance with IFRS 5 Non-current assets held-for-sale and discontinued operations. Under the equity method, investments in associates are carried in the consolidated statement offinancial position at cost adjusted for post-acquisition changes in the Group's share of net assets of the associate, less any impairment losses.
The Group's share of post-acquisition profit or loss is recognised in profit or loss, and its share of post-acquisition movements in othercomprehensive income is recognised in other comprehensive income with a corresponding adjustment to the carrying amount of theinvestment.
Losses in an associate in excess of the Group's interest in that associate are recognised only to the extent that the Group has incurred alegal or constructive obligation to make payments on behalf of the associate.
Any goodwill on acquisition of an associate is included in the carrying amount of the investment, however, a gain on acquisition is recognisedimmediately in profit or loss.
NOTES TO THE ANNUAL FINANCIAL STATEMENTS>(continued)
31 July 2018
44

NOTES TO THE ANNUAL FINANCIAL STATEMENTS>(continued)
31 July 2018
2. PRINCIPAL ACCOUNTING POLICIES (continued)2.5 Investment in associate (continued)
At each reporting date the group determines whether there is any objective evidence that the investment in the associate is impaired. Ifthis is the case, the group calculates the amount of impairment as the difference between the recoverable amount of the associate andits carrying value and recognises the amount adjacent to “share of profit/(loss) of associates” in profit or loss.
Profits or losses on transactions between the Group and an associate are eliminated to the extent of the Group's interest therein. Whenthe Group reduces its level of significant influence or loses significant influence, the Group proportionately reclassifies the related itemswhich were previously accumulated in equity through other comprehensive income to profit or loss as a reclassification adjustment. Insuch cases, if an investment remains, that investment is measured to fair value, with the fair value adjustment being recognised in profitor loss as part of the gain or loss on disposal.
2.6 Investment propertiesInvestment properties are those properties, either owned by the Group or where the Group is a lessee under a finance lease, that areheld either to earn rental income or for capital appreciation, or both, and that is not occupied by companies in the consolidated Group.In addition, properties held under operating leases are accounted for as investment properties when the rest of the definition of aninvestment property is met. In such cases, the operating leases concerned are accounted for as if they were finance leases.
Investment property is measured initially at its cost, including related transaction costs and where applicable borrowing costs.
After initial recognition, investment property is carried at fair value which includes accrued operating lease income and other assets thatare also supported by the same cash flows used in determining the value of investment property. Fair value is based on active marketprices, adjusted, if necessary, for any difference in the nature, location or condition of the specific asset. These valuations are assessed atevery reporting date. Investment property that is being redeveloped for continuing use as investment property or for which the markethas become less active continues to be measured at fair value. The fair value of investment property reflects, among other things, rentalincome from current leases and assumptions about rental income from future leases in the light of current market conditions.
Subsequent expenditure is charged to the asset's carrying amount only when it is probable that future economic benefits associated withthe item will flow to the Group and the cost of the item can be measured reliably. Direct costs relating to major capital projects arecapitalised and are incurred to maintain, upgrade or refurbish properties to preserve or improve capital value. All other repairs andmaintenance costs are charged to the statement of comprehensive income during the financial period in which they are incurred.
Changes in fair values, as well as gains or losses on disposal are recorded in the statement of comprehensive income in the period inwhich they occur. Such gains, losses or fair value adjustments are excluded from the calculation of distributable income and are transferredto non-distributable retained income.
2.7 Intangible assetsIntangible assets other than goodwill are recognised where the entity has acquired or developed identifiable, non-monetary assets thatare expected to generate future economic benefits for the entity and where the cost can be reliably measured. These assets are initiallyrecognised at cost and subsequently carried at cost less accumulated impairment losses and, where the assets have a finite useful life, anyaccumulated amortisation.
Land lease rights have a finite useful life, 2026, based on the underlying contractual agreement and are carried at cost less accumulatedamortisation. Amortisation is calculated using the straight line method to allocate the cost of the lease rights over their estimated usefullives based on the underlying lease period.
2.8 Impairment of non-financial assetsAssets that are subject to amortisation are reviewed for impairment whenever events or changes in circumstances indicate that the carryingvalue may not be recoverable.
A N N U A L R E P O R T 2 0 1 8
45

2. PRINCIPAL ACCOUNTING POLICIES (continued)2.8 Impairment of non-financial assets (continued)
The Group determines whether there is objective evidence that the investment in subsidiaries or associates is impaired at each reportingdate. If this is the case the Group calculates the amount of any impairment and recognises the loss in profit and loss.
An impairment loss is recognised for the amount by which the asset's carrying value exceeds its recoverable amount. The recoverableamount is the higher of an asset's fair value less costs to sell and value in use. For the purposes of assessing impairment, assets are groupedat the lowest levels for which there are separately identifiable cash flows.
Non-financial assets other than goodwill that suffered impairment are reviewed for possible reversal of the impairment at each reportingdate. Impairment losses on goodwill are not reversed.
Such impairments and reversals are excluded from the calculation of distributable income and are transferred to non-distributable retainedincome.
2.9 Financial instrumentsNon-derivative financial instruments recognised on the statement of financial position include cash and cash equivalents, trade and otherreceivables, assets arising from contractual rights to receive cash, interest bearing borrowings and trade and other payables. The groupcurrently has no derivative financial instruments.
(a) Financial assets(i) Initial recognition
Financial assets are initially measured at fair value plus, for instruments not at fair value through profit and loss, any directly attributabletransaction costs. Subsequent to initial recognition, non-derivative financial instruments are measured as described below.Financial assets are classified into the following specific categories: 'at fair value through profit or loss', 'held to maturity investments','available for sale' and 'loans and receivables'. The classification depends on the nature and purpose of the financial assets and isdetermined at the time of initial recognition.
(ii) Financial assets at fair value through profit or lossA financial asset is classified as at fair value through profit or loss if it is held for trading or designated as such upon initial recognition.
A financial asset is classified as held for trading if:- It has been acquired principally for the purpose of selling in the near future; or- It is a part of an identified portfolio of financial instruments that the Group manages together and has a recent actual pattern of short-term profit-taking; or- It is a derivative that is not designated and effective as a hedging instrument.
A financial asset other than a financial asset held for trading may be designated as at fair value through profit or loss upon initialrecognition if:- Such designation eliminates or substantially reduces a measurement or recognition inconsistency that would otherwise arise; or- The financial asset forms part of a group of financial assets or liabilities or both, which is managed and its performance evaluated
on a fair value basis, in accordance with the Group's documented risk management or investment strategy, and information aboutthe grouping is provided internally on that basis; or
- It forms part of a contract containing one or more embedded derivatives, and IAS39 Financial Instruments: Recognition and measurement permits the entire combined contract to be designated as at fair value through profit or loss.
Financial assets at fair value through profit or loss are measured at fair value, and changes therein are recognised in profit or loss.Such changes are excluded from the calculation of distributable income and are transferred to non-distributable retained income.
The financial asset receivable reflected as non-current assets has been designated as at fair value through profit or loss.
NOTES TO THE ANNUAL FINANCIAL STATEMENTS>(continued)
31 July 2018
46

2. PRINCIPAL ACCOUNTING POLICIES (continued)2.9 Financial instruments (continued)
(a) Financial assets (continued)(iii) Held-to-maturity investments
Bills of exchange and other assets with fixed maturity dates that the Group has the positive intent and ability to hold to maturity areclassified as held-to-maturity investments.
Held-to-maturity investments are recorded at amortised cost using the effective interest method less any impairment losses. TheGroup does not currently have any held-to-maturity assets.
(iv) Available for sale financial assetsGains and losses arising from changes in fair value of available for sale financial assets, other than impairment losses, are recogniseddirectly in equity. Where the investment is disposed of the cumulative gain or loss previously recognised in equity is transferred toprofit or loss. Such transfers are excluded from the calculation of distributable income and are transferred to non-distributable retainedincome.
The Group does not currently have any available for sale financial assets.
(v) Loans and receivablesTrade receivables, loans and other receivables that have fixed or determinable payments that are not quoted in an active marketare measured at amortised cost using the effective interest method, less any impairment.
The Group's financial assets classified as loans and receivables, include trade and other receivables and cash and cash equivalents.
(vi) Derecognition of financial assetsThe Group derecognises a financial asset only when the contractual rights to the cash flows from the asset expire; or it transfers thefinancial asset and substantially all the risks and rewards of ownership of the asset to another entity. If the Group neither transfersnor retains substantially all the risks and rewards of ownership and continues to control the asset, the Group recognises its retainedinterest in the asset and an associated liability for amounts it will have to pay. If the Group retains substantially all the risks and rewardsof ownership of a transferred financial asset, the Group continues to recognise the financial asset and also recognises a collateralisedborrowing for the proceeds received.
(b) Financial liabilitiesFinancial liabilities are classified as either financial liabilities at fair value through profit or loss or financial liabilities at amortised cost.
(i) Financial liabilities at fair value through profit or lossFinancial liabilities are classified as at fair value through profit or loss where the financial liability is either held for trading or it is designatedas at fair value through profit or loss. Such changes in fair value are excluded from the calculation of distributable income and aretransferred to non-distributable retained income.
The Group does not currently have any financial liabilities at fair value through profit or loss.
(ii) Financial liabilities at amortised costFinancial liabilities at amortised cost, including borrowings, are initially measured at fair value, net of transaction costs and aresubsequently measured at amortised cost using the effective interest method, with the interest expense recognised on an effectiveyield basis.
The effective interest method is a method of calculating the amortised cost of a financial liability and of allocating the interest expenseover the relevant period. The effective interest rate is the rate which exactly discounts the estimated future cash payments throughthe expected life of the financial liability, or, where appropriate, a shorter period.
NOTES TO THE ANNUAL FINANCIAL STATEMENTS>(continued)
31 July 2018
A N N U A L R E P O R T 2 0 1 8
47

Madirelo Centre, Gaborone
2. PRINCIPAL ACCOUNTING POLICIES (continued)2.9 Financial instruments (continued)
(b) Financial liabilities (continued)(iii) Derecognition of financial liabilities
The Group derecognises financial liabilities when, and only when, the Group's obligations are discharged, cancelled or they expire.
2.10 Trade receivablesTrade receivables are recognised initially at fair value and subsequently measured at amortised cost using the effective interest method,less provision for impairment. A provision for impairment of trade receivables is established when there is objective evidence that theGroup will not be able to collect all amounts due according to the original terms of receivables. Significant financial difficulties of the debtor,probability that the debtor will enter bankruptcy or financial reorganisation, and default or delinquency in payments are considered indicatorsthat the trade receivable is impaired. The amount of the provision is the difference between the asset's carrying amount and the presentvalue of estimated future cash flows, discounted at the effective interest rate. The amount of the provision is recognised in the statementof comprehensive income.
When a trade receivable is uncollectible, it is written off against the allowance account for trade receivables. Subsequent recoveries ofamounts previously written off are credited as other income in the statement of comprehensive income.
2.11 Cash and cash equivalentsCash and cash equivalents includes cash in hand, deposits held at call with banks, other short-term highly liquid investments with originalmaturities of three months or less, and bank overdrafts. Bank overdrafts are shown within borrowings in current liabilities on the statementof financial position.
2.12 BorrowingsBorrowings are recognised initially at fair value, net of transaction costs incurred. Borrowings are subsequently stated at amortised cost;any difference between the proceeds (net of transaction costs) and the redemption value is recognised in the statement of comprehensiveincome over the period of the borrowings using the effective interest method.
Fees paid on the establishment of loan facilities are recognised as transaction costs of the loan to the extent that it is probable that someor all of the facility will be drawn down.
Borrowings are classified as current liabilities unless the Group has an unconditional right to defer settlement of the liability for at least 12months after the balance sheet date.
NOTES TO THE ANNUAL FINANCIAL STATEMENTS>(continued)
31 July 2018
48

2. PRINCIPAL ACCOUNTING POLICIES (continued)2.13 Trade payables
Trade payables are initially recognised at fair value and subsequently measured at amortised cost using the effective interest method.
2.14 ProvisionsProvisions are recognised when the Group has a present legal or constructive obligation as a result of past events, for which it is probablethat an outflow of resources will be required to settle the obligation, and a reliable estimate of the amount can be made. The Grouprecognises a provision for onerous contracts when the expected benefits to be derived from a contract are less than the unavoidablecosts of meeting the obligations under the contract.
2.15 Revenue recognitionRevenue includes rental income from properties.
(a) Rental incomeRental income from operating leases is recognised in income on a straight-line basis over the lease term.
(b) Interest incomeInterest income is recognised on a time proportion basis, taking account of the principal outstanding amount and the effective rateover the period to maturity when it is determined that such income will accrue to the Group.
2.16 Operating lease (Group is the lessor)Leases in which a significant portion of the risks and rewards of ownership are retained by the lessor are classified as operating leases.
When properties are leased out under an operating lease, the properties are included in the statement of financial position as investmentproperties. Lease income is recognised over the term of the lease on a straight-line basis and the adjustments between this and thecontractual rentals are transferred to non-distributable retained income.
2.17 Interest expenseWhere the Group undertakes a major development or refurbishment of its property, interest is capitalised to the cost of the propertyconcerned during the construction period. All other interest expenses for borrowings are recognised within 'finance expense' in thestatement of comprehensive income using the effective interest rate method.
2.18 Current and deferred income taxThe tax expense comprises current and deferred income tax and is recognised in the statement of comprehensive income, except whereit relates to items recognised directly in other comprehensive income or equity. In those cases the tax is also recognised in othercomprehensive income or equity as applicable.
Current tax is determined at current rates on the net income for the year after taking into account income and expenditure which is notsubject to tax, assessed or estimated tax losses brought forward from prior years and the tax effect of credits and charges, includingdepreciation, attributable to periods other than the current year.
Deferred income tax is recognised, using the liability method, on temporary differences arising between the tax bases of assets and liabilitiesand their carrying amounts in the financial statements. Deferred income tax is not accounted for the following temporary differences:- If it arises from initial recognition of an asset or liability in a transaction other than a business combination that at the time of the transaction affects neither accounting or taxable profit or loss;- Goodwill that arises on initial recognition of a business combination;- Differences relating to investments in subsidiaries to the extent that they will not reverse in the foreseeable future.
Deferred income tax is determined using the tax rates that have been enacted as at the balance sheet date and are expected to applywhen the related deferred income tax asset is realised or the deferred income tax liability is settled.
NOTES TO THE ANNUAL FINANCIAL STATEMENTS>(continued)
31 July 2018
A N N U A L R E P O R T 2 0 1 8
49
2. PRINCIPAL ACCOUNTING POLICIES (continued)2.18 Current and deferred income tax (continued)
The carrying value of the combined entity's investment property will generally be realised by capital (the consideration on the sale at theend of use). The capital gains tax rate applied is that which would apply on a direct sale of the property recorded in the statement offinancial position. The deferred tax is then calculated based on the respective temporary differences and tax consequences arising fromrecovery through sale.
Taxation on items that are not distributable is similarly excluded from the calculation of distributable income and is transferred to non-distributable retained income.
Deferred income tax assets are recognised only to the extent that it is probable that future taxable profit will be available, against whichthe temporary differences can be utilised.
Deferred income tax assets and liabilities are offset when there is a legally enforceable right to offset current tax assets against currenttax liabilities and when the deferred income taxes assets and liabilities relate to income taxes levied by the same taxation authority oneither the same taxable entity or different taxable entities where there is an intention to settle the balances on a net basis.
2.19 DistributionsDistributions to linked unitholders are recognised as a liability in the Group's financial statements in the period in which the distributionsare approved by the Board.
2.20 Foreign currency translation(a) Functional and presentation currency
Items included in the financial statements of each of the Group's entities are measured using the currency of the primary economicenvironment in which the entity operates ('the functional currency'). The Group financial statements are presented in Pula, which isthe Company's functional currency and Group's presentation currency.
(b) Transactions and balancesForeign currency transactions are translated into the functional currency using the exchange rates prevailing at the dates of thetransactions or valuation where items are remeasured. Foreign exchange gains and losses resulting from the settlement of suchtransactions and from the translation at year-end exchange rates of monetary assets and liabilities denominated in foreign currenciesare recognised in the statement of comprehensive income, except when deferred in other comprehensive income as qualifying cashflow hedges and qualifying net investment hedges.
Foreign exchange gains and losses that relate to borrowings and cash and cash equivalents are presented in the statement ofcomprehensive income within 'finance income or cost'. All other foreign exchange gains and losses are presented in the statementof comprehensive income.
Changes in the fair value of monetary securities denominated in foreign currency classified as available for sale are analysed betweentranslation differences resulting from changes in the amortised cost of the security and other changes in the carrying amount of thesecurity. Translation differences related to changes in amortised cost are recognised in profit or loss, and other changes in carryingamount are recognised in other comprehensive income.
Translation differences on non-monetary financial assets and liabilities such as equities held at fair value through profit or loss arerecognised in profit or loss as part of the fair value gain or loss. Translation differences on non-monetary financial assets, such asequities classified as available for sale, are included in other comprehensive income.
NOTES TO THE ANNUAL FINANCIAL STATEMENTS>(continued)
31 July 2018
50

3. ADOPTION OF NEW AND REVISED STANDARDS(a) Standards and amendments to existing standards and interpretations effective on or after 1 August 2017 and adopted by the
Group.
Amendment/ Content Applicable for financial yearsStandard/ beginning on/afterinterpretationIFRS 12* 'Disclosure of interests in other entities' on clarification of scope of the
standard 1 January 2017IAS 7 Amendment: 'Statement of cash flows' on disclosure initiative 1 January 2017IAS 12 Amendment: 'Income taxes' on recognition of deferred tax assets for
unrealised losses 1 January 2017
* part of the annual improvements project 2014-2016 issued in December 2016
These standards, interpretations and amendments did not have a material impact on the Group in the current financial year.
(b) New standards, amendments and interpretations issued, but not yet effective and not early adopted.The following new and amended standards and interpretations have been issued and are mandatory for the Group's accountingperiods beginning on or after 1 August 2018 and are expected to be relevant to the Group:
2. PRINCIPAL ACCOUNTING POLICIES (continued)2.20 Foreign currency translation (continued)
(c) Group companiesThe results and financial position of all the Group entities (none of which has the currency of a hyper-inflationary economy) that havea functional currency different from the presentation currency are translated into the presentation currency as follows:
(i) assets and liabilities for each statement of financial position presented are translated at the closing rate at the date of that statementof financial position;
(ii) income and expenses for each statement of comprehensive income are translated at average exchange rates (unless this averageis not a reasonable approximation of the cumulative effect of the rates prevailing on the transaction dates, in which case incomeand expenses are translated at the rate on the dates of the transactions); and
(iii) all resulting exchange differences are recognised in other comprehensive income.
2.21 Operating segmentsAs stated in note 29 no segmental results are reflected. This is consistent with the internal reporting to the Managing Director, the Group'schief operating decision-maker, who reviews the performance of the Group as a single economic entity.
NOTES TO THE ANNUAL FINANCIAL STATEMENTS>(continued)
31 July 2018
A N N U A L R E P O R T 2 0 1 8
51

NOTES TO THE ANNUAL FINANCIAL STATEMENTS>(continued)
31 July 2018
3. ADOPTION OF NEW AND REVISED STANDARDS (continued)(b) New standards, amendments and interpretations issued, but not yet effective and not early adopted. (continued)
Amendment/ Content Applicable for financial yearsStandard/ beginning on/afterinterpretationIFRS 9 'Financial Instruments' (2009&2010) 1 January 2018IFRS 9 Amendment: 'Financial instruments' 1 January 2019IFRS 10 & IAS 28 Amendment: 'Consolidated financial statements' and 'Investments in Postponed
associates and joint ventures' on sale or contribution of assets (initially 1 January 2016)IFRS 15 'Revenue from contracts with customers' 1 January 2018IFRS 15 Amendment to IFRS 15: 'Revenue from contracts with customers' 1 January 2018IFRS 16 'Leases' 1 January 2019IAS 12^ Amendment: 'Income taxes' 1 January 2019IAS 28* 'Investments in associates and joint ventures' on measuring
an associate or joint venture at fair value 1 January 2018IAS 28 Amendment: 'Investments in associates and joint ventures' 1 January 2019IAS 40 Amendment: 'Investment Property' on transfers of investment property 1 January 2018IFRIC 22 'Foreign currency transactions and advance consideration' 1 January 2018IFRIC 23 'Uncertainty over income tax treatments' 1 January 2019
* part of the annual improvements project 2014-2016 issued in December 2016^ part of the annual improvements project 2015-2017 issued in December 2017
- IFRS 9 - 'Financial Instruments' (2009 & 2010)This IFRS is part of the IASB's project to replace IAS 39. IFRS 9 addresses classification and measurement of financial assets andreplaces the multiple classification and measurement models in IAS 39 with a single model that has only two classification categories:amortised cost and fair value. It also includes an expected credit losses model that replaces the current incurred loss impairmentmodel.
- Amendments to IFRS 9 - 'Financial Instruments'The narrow scope amendment covers prepayment features with negative compensation and modification of financial liabilities. Theamendment allows companies to measure particular prepayable financial assets with so-called negative compensation at amortisedcost or at fair value through comprehensive income if a specified condition - instead of at fair value through profit or loss. It alsoexplains how to account for the modification of a financial liability. The amendment confirms that most such modifications will resultin immediate recognition of a gain or loss. This is a change from common practice under IAS 39 today and will affect all kinds ofentities that have renegotiated borrowings.
- Amendments to IFRS 10 - 'Consolidated financial statements' and IAS 28 'Investments in associates and joint ventures' on sale or contribution of assets
The postponement applies to changes introduced by the IASB in 2014 through narrow-scope amendments to IFRS 10 'ConsolidatedFinancial Statements' and IAS 28 'Investments in Associates and Joint Ventures'. Those changes affect how an entity should determineany gain or loss it recognises when assets are sold or contributed between the entity and an associate or joint venture in which itinvests. The changes do not affect other aspects of how entities account for their investments in associates and joint ventures. Thereason for making the decision to postpone the effective date is that the IASB is planning a broader review that may result in thesimplification of accounting for such transactions and of other aspects of accounting for associates and joint ventures.
- IFRS 15 - 'Revenue from contracts with customers'It is a single, comprehensive revenue recognition model for all contracts with customers to achieve greater consistency in therecognition and presentation of revenue. Revenue is recognised based on the satisfaction of performance obligations, which occurswhen control of good or service transfers to a customer.
52

3. ADOPTION OF NEW AND REVISED STANDARDS (continued)(b) New standards, amendments and interpretations issued, but not yet effective and not early adopted. (continued)- Amendment to IFRS 15 - 'Revenue from contracts with customers'
The amendments comprise clarifications of the guidance on identifying performance obligations, accounting for licences of intellectualproperty and the principal versus agent assessment (gross versus net revenue presentation). New and amended illustrative exampleshave been added for each of these areas of guidance. The IASB has also included additional practical expedients related to transitionto the new revenue standard.
- IFRS 16 - 'Leases'This standard replaces the current guidance in IAS 17 and is a far reaching change in accounting by lessees in particular.
Under IAS 17, lessees were required to make a distinction between a finance lease (on balance sheet) and an operating lease (offbalance sheet). IFRS 16 now requires lessees to recognise a lease liability reflecting future lease payments and a 'right-of-use asset'for virtually all lease contracts. The IASB has included an optional exemption for certain short-term leases and leases of low-valueassets; however, this exemption can only be applied by lessees.
For lessors, the accounting stays almost the same. However, as the IASB has updated the guidance on the definition of a lease (aswell as the guidance on the combination and separation of contracts), Lessors will also be affected by the new standard. At the veryleast, the new accounting model for lessees is expected to impact negotiations between lessors and lessees. Under IFRS 16, a contractis, or contains, a lease if the contract conveys the right to control the use of an identified asset for a period of time in exchange forconsideration.
- Amendment to IAS 12 - 'Income taxes'The amendment clarified that the income tax consequences of dividends on financial instruments classified as equity should berecognised according to where the past transactions or events that generated distributable profits were recognised.
- IAS 28 - 'Investments in associates and joint ventures' on measuring an associate or joint venture at fair valueThe standard allows venture capital organisations, mutual funds, unit trusts and similar entities to elect measuring their investmentsin associates or joint ventures at fair value through profit or loss (FVTPL). The Board clarified that this election should be madeseparately for each associate or joint venture at initial recognition.
- Amendment to IAS 28 - 'Investments in associates and joint ventures'The amendments clarified that companies account for long-term interests in an associate or joint venture, to which the equity methodis not applied, using IFRS 9.
- Amendment to IAS 40 - 'Investment Property' on transfers of investment propertyThese amendments clarify that to transfer to, or from, investment properties there must be a change in use. To conclude if a propertyhas changed use there should be an assessment of whether the property meets the definition. This change must be supported byevidence.
- IFRIC 22 - 'Foreign currency transactions and advance consideration'This IFRIC addresses foreign currency transactions or parts of transactions where there is consideration that is denominated or pricedin a foreign currency. The interpretation provides guidance for when a single payment/receipt is made as well as for situations wheremultiple payment/receipts are made. The guidance aims to reduce diversity in practice.
- IFRIC 23 - 'Uncertainty over income tax treatments'This IFRIC provides a framework to consider, recognise and measure the accounting impact of tax uncertainties. The Interpretationprovides specific guidance in several areas where previously IAS 12 was silent. The Interpretation also explains when to reconsiderthe accounting for a tax uncertainty.
The Group is in the process of assessing the impact of these above statements, amendments and interpretations.
NOTES TO THE ANNUAL FINANCIAL STATEMENTS>(continued)
31 July 2018
A N N U A L R E P O R T 2 0 1 8
53

4 CRITICAL ACCOUNTING ESTIMATES AND JUDGEMENTSIn arriving at the amounts at which assets and liabilities are measured in the financial statements, the Group makes estimates and assumptionsconcerning the future. The resulting estimates will, by definition, seldom equal the related actual results. The estimates, assumptions andmanagement judgments that have a significant risk of causing a material adjustment to the carrying amounts of assets and liabilities withinthe next financial year are outlined below.
Investment propertyThe best evidence of fair value is current prices in an active market for similar properties. In the absence of such information the Groupdetermines the estimated fair value and has utilised an independent expert in making this assessment.
The valuation basis used is market value, which is defined as the estimated amount for which a property should exchange on the date ofvaluation between a willing buyer and a willing seller in an arm's-length transaction after proper marketing wherein the parties had eachacted knowledgeably, prudently and without compulsion.
In calculating the market value the investment method has been adopted. The key assumptions underlying the investment method arenet cash flows and the capitalisation rate used. These are unobservable inputs and accordingly result in the valuations being classed aslevel 3 in terms of the fair value hierarchy.
Net cash flows were based on rentals and relevant expenditure taking cognisance of existing tenancies, operating expense budgets andspecific market circumstances relative to these. A 10% change in the net cash flows would have the estimated impact of P164 millionfor the Group and P159million for the Company (2017: P153 million for the Group and P149 million for the Company) on the carryingvalue of the investment property.
The capitalisation rate has been determined based on a relevant long bond yield adjusted for the relevant risks applicable to each propertyincluding asset class, sector, location, building, leasehold / freehold and tenancy. The weighted average capitalisation rate is 8.93% (2017:9.25%) and a 1% upward shift in this rate would reduce the aggregate independent valuation by an estimated P165 million for Groupand P164 million for Company (2017: P150 million for Group and P148 million for Company), while a 1% downward shift in capitalisationrate would increase the valuations by an estimated P207 million for Group and P206 million for Company (2017: P186 million for Groupand P185 million for Company).
3. ADOPTION OF NEW AND REVISED STANDARDS (continued)(b) New standards, amendments and interpretations issued, but not yet effective and not early adopted. (continued)
There are no other IFRSs or IFRIC interpretations that are not yet effective that would be expected to have a material impact onthe Group or Company.
The following new and amended standards and interpretations have been issued and are mandatory for the Group's accountingperiods beginning on or after 1 January 2018 but are not expected to be relevant to the Group:
NOTES TO THE ANNUAL FINANCIAL STATEMENTS>(continued)
31 July 2018
54
Amendment/ Content Applicable for financial yearsStandard/ beginning on/afterinterpretationIFRS 1* Amendment: 'First time adoption of IFRS' 1 January 2018IFRS 2 Amendment: 'Share-based payment' 1 January 2018IFRS 3^ Amendment: 'Business combination' 1 January 2019IFRS 4 Amendment: 'Insurance Contracts' 1 January 2018IFRS 9 Amendment: 'Financial instruments' on general hedge accounting 1 January 2018IFRS 11^ Amendment: 'Joint arrangements' 1 January 2019IFRS 17 'Insurance Contracts' 1 January 2021IAS 23^ Amendment: 'Borrowing costs' 1 January 2019
* part of the annual improvements project 2014-2016 issued in December 2016^ part of the annual improvements project 2015-2017 issued in December 2017

NOTES TO THE ANNUAL FINANCIAL STATEMENTS>(continued)
31 July 2018
4 CRITICAL ACCOUNTING ESTIMATES AND JUDGEMENTS (continued)Investment property (continued)There are inter-relationships between unobservable inputs. To avoid double counting or omitting the effects of risk factors, capitalisationrates reflect assumptions that are consistent with those inherent in the cash flows.
The value of one property has been reduced by the directors to take into account specific contractual arrangements:
• NAP's Associate (Edco) holds the Government lease on part of the Riverwalk property and sub-let this portion to NAP until 2026.The portion of the property occupied by the anchor tenant is held directly by NAP under the Government lease.
• NAP also has the option to increase the holding in the Associate between 2024 and 2029.• NAP obtains an annual independent valuation for Riverwalk, which assumes that standard terms and conditions with respect to title
apply to the property as a whole. Given the specific ownership structure and related contractual arrangements, the directors reducethe value of this property to take account of these factors.
• The resultant fair value of the investment in the Riverwalk property is accounted for in investment property and in investment in associate.• The total value of this investment is calculated by discounting the expected cash flows to NAP from the property, assuming outflows
from the exercise of the option (in 2026) and using the implied discount rate from the independent valuation.• The fair value of Edco's investment in Riverwalk is calculated as the present value of expected cash flows to Edco and using the same
implied discount rate. NAP equity accounts for its 26% interest in this fair value (after allowing for deferred income tax).• The investment property portion of NAP's investment in Riverwalk is represented by the total value of the investment minus the carrying value of the investment in the associate.
The current discount rate used for calculating the value of NAP's investment in Riverwalk is 15.50% (2017: 15.75%). A 1% downwardshift in the discount rate would increase the carrying value by approximately P34 million (2017: P32 million) and a 1% upward shift woulddecrease the carrying value by approximately P28 million (2017: P26 million), while a 10% change in the lump sum payment would havean estimated P9.9 million (2017: P8.2million) impact on the carrying value of investment property.
Financial assetThe financial asset arises from the right to receive 63% of the rental income from an investment property in terms of a cession. The assethas been valued by discounting the projected income streams at 14.25% (2017: 14.5%). These assumptions are unobservable inputsand therefore considered level 3 in terms of the fair value hierarchy.
A 1% downward shift in the discount rate would increase the carrying value by approximately P2.0 million (2017: P2.0 million) and a1% upward shift would decrease the carrying value by approximately at P1.8 million (2017: P1.8 million), while a 10% change in thecash flows would have an estimated P2.6 million (2017: P2.4 million) impact on the carrying value.
AssociateThe Associate's financial statements are prepared on the historical cost basis based on a 30 June year end. To comply with the group'saccounting policies, this investment is equity accounted based on the Directors' fair value of the only underlying asset which has beendetermined by discounting the expected cash flows from operations at the Group's year end using a discount rate of 15.50% (2017:15.75%) and the related deferred tax liability. These assumptions are unobservable inputs and therefore considered level 3 in terms ofthe fair value hierarchy.
A 1% downward shift in the discount rate would increase the carrying value of the investment in the associate by approximately P11.4million (2017: P9.7million) and a 1% upward shift would decrease the carrying value by approximately P8.8 million (2017 P7.5million).
A N N U A L R E P O R T 2 0 1 8
55

Group Company
2018 2017 2018 2017 P'000 P'000 P'000 P'000
5 INVESTMENT PROPERTYOpening balances 1 357 415 1 285 780 1 312 226 1 243 026 At fair value 1 384 676 1 312 314 1 338 907 1 268 538 Rent straight line adjustment (27 261) (26 534) (26 681) (25 512)
Subsequent additions and improvements at cost 1 703 485 1 703 474Insurance proceeds / reinstatement - 1 279 - 1 279
Fair value adjustment 71 936 68 412 70 408 67 447 At fair value 73 172 69 111 71 512 68 616 Rent straight line adjustment (1 236) (699) (1 104) (1 169)
Effect of translation to presentation currency (201) 1 459 - - At fair value (203) 1 487 - - Rent straight line adjustment 2 (28) - -
Total valuation at end of year At fair value 1 459 348 1 384 676 1 412 122 1 338 907 Rent straight line adjustment (28 495) (27 261) (27 785) (26 681)
Net carrying value at end of year 1 430 853 1 357 415 1 384 337 1 312 226
The investment property acquired at listing was settled primarily by the issue of linked units to the vendors.
The investment properties were independently valued at an aggregate P1 642 million for Group and P1 595 million for Company as at31 July 2018 (2017: P1 533 million for Group and P1 487 million for Company) by Curtis Matobolo of Knight Frank (Pty) Ltd. He holdsrecognised relevant professional qualifications, is a member of the Royal Institute of Chartered Surveyors (RICS) and the Real EstateInstitute of Botswana and has relevant experience for the investment properties valued.
NOTES TO THE ANNUAL FINANCIAL STATEMENTS>(continued)
31 July 2018
4 CRITICAL ACCOUNTING ESTIMATES AND JUDGMENTS (continued)Income taxesThe Group is subject to tax in two jurisdictions, Botswana and Namibia. Certain estimates are required in determining the provision forincome taxes and where the final tax is different from the amounts estimated such differences will impact the current and deferred taxationprovisions.
The principal assumption that has a material effect on these financial statements is the tax that will be payable on the future disposal ofinvestment properties. Following the adoption of IAS 12 for investment property, it is assumed that capital gains will be taxed using theapplicable capital gains tax rate and calculations, and not the corporate tax rates. For Botswana properties this is based on normal companytax rates being applied to the difference between the selling price and the indexed adjusted cost, while in Namibia it means that no taxis payable. The Group has provided for tax on fair value gains on this basis. In the event that the tax regulations are amended before thedisposal of properties, the actual liability that would arise could be very different.
56

Group Company
2018 2017 2018 2017 P'000 P'000 P'000 P'000Operating income attributable to the investment property amounts to:Revenue 189 266 175 062 180 402 167 456Rent straight line adjustment (1 236) (699) (1 104) (1 169)Contractual revenue earned from investment property 188 030 174 363 179 298 166 287Other income 2 282 1 853 7 911 7 042Property costs (31 882) (29 700) (31 361) (29 149) Recoverable expenses (14 033) (13 101) (13 688) (12 809) Other property expenses (17 849) (16 599) (17 673) (16 340)
Net rental income excluding rent straight line adjustment 158 430 146 516 155 848 144 180And to reconcile to statement of comprehensive income:Add : Straight line adjustment 1 236 699 1 104 1 169Net rental income per statement of comprehensive income 159 666 147 215 156 952 145 349
6 INVESTMENT IN SUBSIDIARYTotal investment in shares and loans at cost comprise:
Investment Investment Total% holding in shares in loans investment
P'000 P'000 P'000Company2018New African Properties (Namibia) (Proprietary) Limited 100% 36 650 - 36 650
2017New African Properties (Namibia) (Proprietary) Limited 100% 36 650 - 36 650
This wholly owned subsidiary is carried at cost in the company financial statements and its assets, liabilities and results included in theconsolidated financial statements. The subsidiary owns investment properties in Namibia.
The subsidiary is based in Namibia and is accordingly subject to local exchange control regulations which impose certain restrictions ontransferring funds from the country. Normal dividends are however permitted.
NOTES TO THE ANNUAL FINANCIAL STATEMENTS>(continued)
31 July 2018
5 INVESTMENT PROPERTY (continued)The properties were valued in accordance with Statement of Asset Valuation Practice and Guidance Notes prepared by the RICS (TheRed Book) on an open market basis using an adapted discounted cash flow approach at capitalisation rates ranging from 7.25% to 16.5%(2017: 7.50% to 17.0%) and a weighted average rate of 8.93% (2017: 9.25%), assuming that the properties are not subject to anyadverse easements, restrictive covenants or undue provisions that would otherwise depress the values.
The independently determined fair values totalling P1 642 million (2017: P1 533 million) have been reduced by the directors to accountfor the impact of the restrictive lease covenants pertaining to one of the Group's properties.
Investment property valued at P 117 million (2017: P111 million) is used as security for the bank borrowings referred to in note 13.
No interest was capitalised to investment property during the year (2017: nil).
Commitments are set out in note 27.
A N N U A L R E P O R T 2 0 1 8
57

Group Company
2018 2017 2018 2017 % holdings P'000 P'000 P'000 P'000
7 INVESTMENT IN ASSOCIATEAcquired at cost 26% 4 951 4 951 4 951 4 951Share of associate's profit post acquisition 34 519 25 596 - - Opening balance 25 596 21 830 Current period 8 923 3 766
39 470 30 547 4 951 4 951This investment was acquired on 4 June 2012.
The Botswana based associate company holds the unencumberedlease rights to certain plots after the expiry of an existing lease, is notexpected to generate cash flows until that time, has earned no revenuesince acquisition and has no liabilities. No dividends have been declaredor received since acquisition.
A change in the operations of the company would be considered animpairment indicator and there have been no impairment indicatorssince the last impairment test as at 31 July 2012 when it was testedby discounting the projected future income streams at a discount rateof 16.5%. No impairment is considered necessary at this time.
New African Properties Ltd has an option to increase its holding in theAssociate to 80% between 2024 and 2029. Such option is exercisableat open market value.
8 FINANCIAL ASSET RECEIVABLEOpening balance 24 490 23 321 24 490 23 321Fair value adjustment 1 146 1 169 1 146 1 169Carrying value 25 636 24 490 25 636 24 490
This asset comprises the right to receive 63% of the rental incomefrom an investment property comprising a shopping mall in Gaboroneuntil 2037 in terms of a cession agreement with Mynco (Pty) Ltd andis effectively secured over the underlying asset.
The asset is carried at fair value as determined by directors based onthe estimated future cash flows to the company discounted at 14.25%(2017: 14.5%) and is within level 3 of the fair value hierarchy.
9 INTANGIBLE ASSETLand lease rightsAcquired 12 193 12 193 12 193 12 193Amortisation (5 286) (4 405) (5 286) (4 405) Opening balance (4 405) (3 524) (4 405) (3 524) Current period (881) (881) (881) (881)
6 907 7 788 6 907 7 788
The land lease right arises from contractual rights acquired by the Group which allow future cost and operational efficiencies.
NOTES TO THE ANNUAL FINANCIAL STATEMENTS>(continued)
31 July 2018
58

Group Company
2018 2017 2018 2017 P'000 P'000 P'000 P'000
9 INTANGIBLE ASSET (continued)There have been no impairment indicators since the last impairmenttest as at 31 July 2012 when it was tested by discounting the projectedfuture income streams at a discount rate of 16.5%. No impairmentis considered necessary at this time.
10 TRADE AND OTHER RECEIVABLESTrade receivables net of impairment 346 380 339 371 Trade receivables 4 613 4 268 4 432 4 095 Less: impairment (4 267) (3 888) (4 093) (3 724)Prepayments 2 048 1 700 2 048 1 700Related party receivables 98 375 94 234 98 375 94 234Dividends receivable - - 2 530 2 405Other receivables 813 648 812 669
101 582 96 962 104 104 99 379
Age analysis of trade receivables past due and not impaired: 30 days 300 358 293 349 60 days 46 22 46 22
346 380 339 371
Age analysis of impaired trade receivables: 30 days 149 201 136 195 60 days 151 120 145 115 90 days 84 85 78 80 > 90 days 3 883 3 482 3 734 3 334
4 267 3 888 4 093 3 724
The impaired receivables are mainly 90 days and over and relate toa number of individual tenants in various properties. Movements inaccumulated impairment losses are accounted for in the statement ofcomprehensive income under property costs and are summarised asfollows:
Trade receivable impairment:Opening balance 3 888 3 718 3 724 3 553Net movement in impairments charged to the income statement 379 164 369 171 Additional impairment during the year 661 699 649 695 Reversal of previous impairments (282) (535) (280) (524)Effect of translation to presentation currency - 6 - -Balance at end of year 4 267 3 888 4 093 3 724
The impairment provision above excludes VAT which is included inthe arrears amount above. The impairment amount including VAT isset out below.
Impairment 4 267 3 888 4 093 3 724Add: VAT 512 467 491 447Impairment including VAT 4 779 4 355 4 584 4 171
NOTES TO THE ANNUAL FINANCIAL STATEMENTS>(continued)
31 July 2018
A N N U A L R E P O R T 2 0 1 8
59
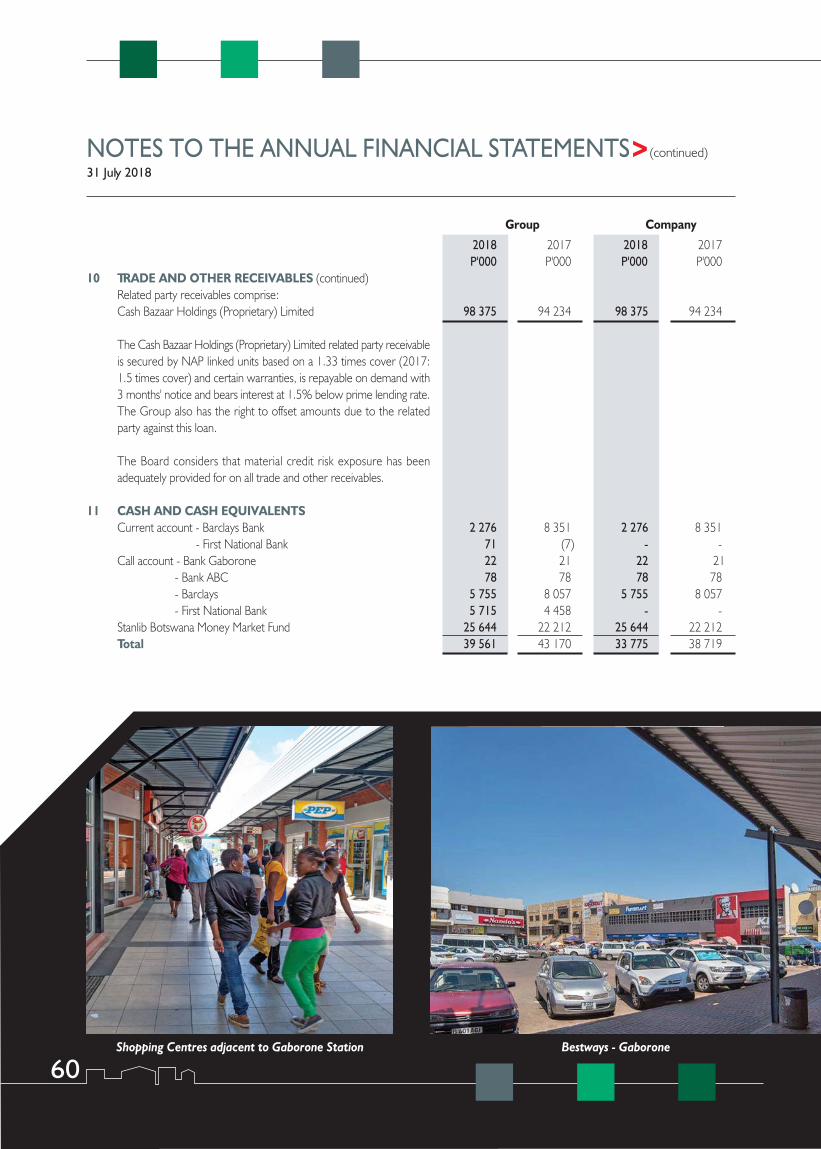
Group Company
2018 2017 2018 2017 P'000 P'000 P'000 P'000
10 TRADE AND OTHER RECEIVABLES (continued)Related party receivables comprise:Cash Bazaar Holdings (Proprietary) Limited 98 375 94 234 98 375 94 234
The Cash Bazaar Holdings (Proprietary) Limited related party receivableis secured by NAP linked units based on a 1.33 times cover (2017:1.5 times cover) and certain warranties, is repayable on demand with3 months' notice and bears interest at 1.5% below prime lending rate.The Group also has the right to offset amounts due to the relatedparty against this loan.
The Board considers that material credit risk exposure has beenadequately provided for on all trade and other receivables.
11 CASH AND CASH EQUIVALENTSCurrent account - Barclays Bank 2 276 8 351 2 276 8 351 - First National Bank 71 (7) - -Call account - Bank Gaborone 22 21 22 21 - Bank ABC 78 78 78 78 - Barclays 5 755 8 057 5 755 8 057 - First National Bank 5 715 4 458 - -Stanlib Botswana Money Market Fund 25 644 22 212 25 644 22 212Total 39 561 43 170 33 775 38 719
NOTES TO THE ANNUAL FINANCIAL STATEMENTS>(continued)
31 July 2018
Bestways - Gaborone
60Shopping Centres adjacent to Gaborone Station
Group Company
2018 2017 2018 2017 P'000 P'000 P'000 P'000
12 LINKED UNITS604 397 124 Linked units in issue 871 824 871 824 871 824 871 824
Each linked unit comprises one ordinary share indivisibly linked to oneunsecured variable rate debenture.
Stated capital comprises 604 397 124 linked units, each comprisingone ordinary share of no par value indivisibly linked to one variablerate unsecured debenture.
Linked units equivalent to 15% of the number of linked units in issueat any time are under the control of the Directors for allotment andissue for the acquisition of immovable property until the next annualgeneral meeting, at which meeting the authority will sought to berenewed until the following annual general meeting.
In terms of the Trust Deed governing the Debentures:- The debentures are only redeemable at the instance of the Company,
after approval by resolution of the Board, and with the written consent of the creditors of the Company or at the discretion of the Trustee following certain events specified in the Trust Deed. In
the event that they are to be redeemed, the amount payable for every debenture shall be the higher of 99/100 of the three month
average weighted traded price of a linked unit on the BSE or the issue price of P1.98.- The interest payable on debentures shall be determined by and in
the sole discretion of the Company's Directors. Notwithstanding this, the Company is obliged to distribute at least 80% of moniesavailable after the payment of approved capital expenditure,
repayment of capital and interest due on third party debt, provisionfor replacement repair and refurbishment of assets and operatingcosts, as interest on the debentures.
13 BORROWINGS
Bank Gaborone Limited, comprising:Non-current portion 18 735 21 878 18 735 21 878Current portion 3 110 2 948 3 110 2 948
21 845 24 826 21 845 24 826
This loan is secured by a mortgage bond for P40 million registered over Tribal Lot 39, Molepolole in the Bakwena Tribal Territory, whichis classified as investment property in note 5 and valued at P117 million at the date of this report (2017: P111 million).
The loan is repayable in monthly installments, currently amounting to 352,818, until August 2024 and incurs interest at 1.5% below primelending rate, currently 5.0% (2017: 5.5%). The capital portion repayable over the next 12 months has been reflected as a current liability.
The Group is exposed to floating interest rates on this liability.
NOTES TO THE ANNUAL FINANCIAL STATEMENTS>(continued)
31 July 2018
A N N U A L R E P O R T 2 0 1 8
61

Group Company
2018 2017 2018 2017 P'000 P'000 P'000 P'000
13 BORROWINGS (continued)The interest on this facility for the next 12 months at the current rateamounts to 1 124 1 292 1 124 1 292A 1% increase in the prime lending rate would have the impact ofincreasing this by 207 238 207 238
Movement in borrowings:Balance at the beginning of the year 24 826 27 594 24 826 27 594Repayment of borrowings (2 981) (2 768) (2 981) (2 768)Balance at the end of the year 21 845 24 826 21 845 24 826
The Group has no other debt facilities in place at this time.
The company's borrowing capacity is limited to 70% of the value ofthe assets of the Company or such other sum as the Company may,by ordinary resolution, in general meeting determine. Directors areauthorised to secure the repayment of or raise any such sum bymortgage or charge upon the whole or any part of the property andassets of the Company.
14 DEFERRED TAX LIABILITYFair value gains on investment property (after indexed costadjustment) 123 052 112 865 123 052 112 865Building allowances claimed 26 069 25 986 22 492 22 492Rent straight line adjustment 6 339 6 055 6 113 5 870Share of associate's profit 2 588 1 920 - -Prepaid expenses/ income received in advance (164) (145) - -Impairment of receivables (42) (39) - -Tax loss utilised (1 546) (3 327) (1 546) (3 327)Total deferred tax liability 156 296 143 315 150 111 137 900 And the movement for the year comprises:Opening balances 143 315 132 223 137 900 127 093Current year charge 12 997 10 975 12 211 10 807Effect of translation to presentation currency (16) 117 - -Balance at end of year 156 296 143 315 150 111 137 900
Estimated tax losses P7.0 million for Group and Company (2017:P15.1 million) have been utilised to reduce deferred tax liabilities.There are no other tax losses in the Group.
15 TRADE AND OTHER PAYABLESTenant deposits 7 714 7 357 7 358 7 016Trade payables 1 635 2 072 1 045 1 535Rent received in advance 2 509 3 467 2 347 3 357Accruals and provisions 6 876 4 543 6 672 4 983Related party payable 1 582 1 589 - -
20 316 19 028 17 422 16 891
NOTES TO THE ANNUAL FINANCIAL STATEMENTS>(continued)
31 July 2018
62

Group Company
2018 2017 2018 2017 P'000 P'000 P'000 P'000
16 REVENUEContractual rental 177 887 164 733 169 242 156 732- Basic 177 802 163 969 169 157 155 968- Turnover 85 764 85 764Rent straight line adjustment 1 236 699 1 104 1 169Rental income 179 123 165 432 170 346 157 901Operating cost recoveries 10 143 9 630 10 056 9 555
189 266 175 062 180 402 167 456
The period of leases under which the Group leases out its investmentproperty generally ranges from three to five years.
The future minimum contractual rentals receivable under non-cancellableoperating leases are as follows:
Within next year 149 887 155 198 147 266 148 426Between 1 and 5 years 322 175 302 715 316 110 290 838Later than 5 years 52 876 28 165 52 876 28 165
524 938 486 078 516 252 467 429
Of this P28.5 million for Group and P27.8 million for Company (2017:P27.3 million for Group and P26.7 million for Company) has beenrecognised as a receivable in view of the adjustment to straight linerentals over the period of leases.
17 OTHER INCOMEDividends from subsidiary companies - - 5 629 5 190Promotion and advertising income 953 950 953 950Tenant contribution to marketing 601 473 601 473Sundry income 728 430 728 429
2 282 1 853 7 911 7 042
18 PROPERTY COSTSRecoverable costs: Cleaning & refuse (3 871) (3 882) (3 793) (3 817) Rates (1 311) (1 527) (1 079) (1 320) Security (2 352) (2 310) (2 352) (2 310) Utilities (6 499) (5 382) (6 464) (5 362)Recoverable expenses (14 033) (13 101) (13 688) (12 809)Other property costs: Impairment of trade receivables (379) (164) (369) (171) Letting commission (2 160) (2 102) (2 160) (2 102) Property management fee (8 978) (8 218) (8 978) (8 218) Repairs and maintenance (1 973) (2 326) (1 941) (2 230) Tenant installations (1 130) (573) (1 130) (573) Other property expenses (3 229) (3 216) (3 095) (3 046)Total property costs (31 882) (29 700) (31 361) (29 149)
NOTES TO THE ANNUAL FINANCIAL STATEMENTS>(continued)
31 July 2018
A N N U A L R E P O R T 2 0 1 8
63

Group Company
2018 2017 2018 2017 P'000 P'000 P'000 P'000
19 OTHER EXPENSESAsset management fee (9 797) (9 325) (9 797) (9 325)Fees paid to auditors (609) (577) (546) (525) Audit fee current year (550) (510) (520) (510) Other services (59) (67) (26) (15)Directors' fees (147) (225) (147) (225)Transaction related costs (466) - (466) -Other portfolio expenses (1 268) (954) (1 258) (1 005)
(12 287) (11 081) (12 214) (11 080)
20 FINANCE INCOMEBanks and money market investments 1 480 1 201 1 215 1 009Tenants 325 319 314 313Related party 4 625 4 927 4 625 4 927
6 430 6 447 6 154 6 249
21 FINANCE EXPENSEBank borrowings (1 205) (1 455) (1 205) (1 455)
22 TAXATIONBotswana current taxation Current year (844) (778) (844) (778)Namibian current taxation Current year (2 615) (2 345) - - Prior year adjustment - (90) - -Total current taxation (3 459) (3 213) (844) (778)
NOTES TO THE ANNUAL FINANCIAL STATEMENTS>(continued)
31 July 2018
Riverwalk Shopping Centre, Gaborone
64

Group Company
2018 2017 2018 2017 P'000 P'000 P'000 P'000
22 TAXATION (continued)Botswana deferred taxation Current year (12 879) (11 090) (12 211) (10 807)Namibia deferred taxation Current year (118) 25 - - Prior year adjustment - 90 - -Total deferred taxation (12 997) (10 975) (12 211) (10 807)
Total taxation (16 456) (14 188) (13 055) (11 585)
Attributable to: Distributable income (3 534) (3 272) (844) (800) Fair value adjustments (10 187) (8 892) (10 187) (8 892) Other capital deductions (1 782) (1 635) (1 782) (1 635) Rental straight line adjustments (285) (107) (242) (258) Share of associate's profit (668) (282) - -
(16 456) (14 188) (13 055) (11 585)
Group Company
2018 2017 2018 2017Reconciliation of the effective and statutory tax rate:Effective tax rate 7.0% 6.6% 5.9% 5.6%Adjusted for: Fair value and other adjustments - net difference 2.4% 2.9% 2.4% 2.9% Interest on debentures allowed for tax purposes 12.5% 12.9% 13.5% 13.3% Share of associate's profit 0.5% - - - Dividend income - - 0.6% 0.6% Tax on dividends - - (0.4%) (0.4%)Effect of difference in country tax rates (0.4%) (0.4%) - -Statutory tax rate in Botswana 22.0% 22.0% 22.0% 22.0%
23 BASIC AND DILUTED EARNINGS PER UNITATTRIBUTABLE TO LINKED UNITHOLDERSThe basic earnings per share is calculated by dividing the net profit bythe weighted number of linked units in issue during the year.Profit for the year attributable to linked unitholders (P'000) 217 272 199 404 207 305 195 213Weighted average number of linked units 604 397 124 604 397 124 604 397 124 604 397 124Earnings per linked unit in thebe 35.95 32.99 34.30 32.30
There are no dilutive ordinary shares and the diluted earnings per linked unit is therefore the same as the earnings per linked unit.
NOTES TO THE ANNUAL FINANCIAL STATEMENTS>(continued)
31 July 2018
A N N U A L R E P O R T 2 0 1 8
65

2018 2017 2018 2017 P'000 P'000 thebe per thebe per
linked unit linked unit24 DISTRIBUTIONS PAID TO LINKED UNITHOLDERS
Distributions per linked unit are based on the linked units in issue onthe respective declaration date.
Group and Company2018: Number 13 - declared 23 April 2018, paid 25 May 2018(2017: Number 11 - declared 12 April 2017, paid 26 May 2017) Interest 67 572 61 951 11.18 10.25 Dividends 6 467 5 802 1.07 0.96
74 039 67 753 12.25 11.212018: Number 14 - declared 25 July 2018, paid 31 August 2018(2017: Number 12 - declared 26 July 2017, paid 1 September 2017) Interest 67 753 63 220 11.21 10.46 Dividends 6 467 6 044 1.07 1.00
74 220 69 264 12.28 11.46 Total distribution declared 148 259 137 017 24.53 22.67Amounts unpaid at beginning of year 69 390 65 172 11.48 10.78Amounts unpaid at end of year (74 335) (69 390) (12.30) (11.48) Not yet payable (74 220) (69 264) (12.28) (11.46) Unclaimed distributions (115) (126) (0.02) (0.02)
Distributions paid to linked unitholders (143 314) (132 799) 23.71 21.97
Group Company
2018 2017 2018 2017 P'000 P'000 P'000 P'000
25 TAXATION PAIDReceivable at beginning of year 972 729 972 573Payable at beginning of year (51) - - -Charged during the year (3 459) (3 213) (844) (778)Receivable at year end (1 463) (972) (1 463) (972)Payable at year end 263 51 - -
(3 738) (3 405) (1 335) (1 177)
26 RELATED PARTY TRANSACTIONSOther related parties with whom transactions have occurred, and their relationships with the Group, are:
Afritec (Proprietary) Limited Related through common directorsCash Bazaar (Proprietary) Limited Related through common directorsCash Bazaar Holdings (Proprietary) Limited Related through common directorsFurnmart Limited Related through common directorsHunters Africa (Proprietary) Limited Related through common directorsMynco (Proprietary) Limited Related through common directorsNafprop (Proprietary) Limited Related through common directorsNew African Properties (Namibia) (Proprietary) Limited NAP subsidiaryDirectors Company officersLinked unitholders Linked unitholders
NOTES TO THE ANNUAL FINANCIAL STATEMENTS>(continued)
31 July 2018
66

Group Company
2018 2017 2018 2017 P'000 P'000 P'000 P'000
26 RELATED PARTY TRANSACTIONS (continued)Nature of transaction and party TermsRental (contractual) 40 245 37 715 37 539 34 388 Afritec (Proprietary) Limited Lease 509 519 509 519 Cash Bazaar (Proprietary) Limited Lease 13 199 12 251 13 199 12 251 Furnmart Limited Lease 23 790 22 418 21 084 19 091 Hunters Africa (Proprietary) Limited Lease 399 366 399 366 Mynco (Proprietary) Limited Cession 2 348 2 161 2 348 2 161
Operating cost recoveries 893 818 842 799 Afritec (Proprietary) Limited Lease 22 23 22 23 Cash Bazaar (Proprietary) Limited Lease 273 232 273 231 Furnmart Limited Lease 588 543 537 525 Hunters Africa (Proprietary) Limited Lease 10 20 10 20 Interest received - Cash Bazaar Holdings(Proprietary) Limited Linked to prime 4 625 4 927 4 625 4 927
Asset management fee - Nafprop(Proprietary) Limited Contract (9 797) (9 325) (9 797) (9 325)
Property management fee - Nafprop(Proprietary) Limited Contract (8 978) (8 218) (8 978) (8 218)
Development fee - Nafprop (Proprietary)Limited Contract - (41) - (41)
Leasing fees - Nafprop (Proprietary) Limited Contract (2 160) (2 102) (2 160) (2 102)
Directors' fees to independent directors Board approved (147) (225) (147) (225)
Distributions - Linked unitholders Board approved (148 259) (137 017) (148 259) (137 017)
Dividends received New African Properties (Namibia) (Proprietary) Limited Board approved - - 5 629 5 190
NOTES TO THE ANNUAL FINANCIAL STATEMENTS>(continued)
31 July 2018
A N N U A L R E P O R T 2 0 1 8
67

Group Company
2018 2017 2018 2017 Notes P'000 P'000 P'000 P'000
26 RELATED PARTY TRANSACTIONS (continued)And the following balances exist at the balance sheet date:
Nature of transaction and partyFinancial asset receivable - Mynco (Proprietary) Limited 8 25 636 24 490 25 636 24 490
Related party receivables Cash Bazaar Holdings (Proprietary) Limited 10 98 375 94 234 98 375 94 234
Dividends receivable New African Properties (Namibia) (Proprietary) Limited - - 2 530 2 405
Trade and other receivables Nafprop (Proprietary) Limited - 7 - 7
Related party payables 15 Cash Bazaar Holdings (Proprietary) Limited (1 582) (1 589) - -
Trade and other payables New African Properties (Namibia) (Proprietary) Limited - - - (662)
Distribution payable - Linked unitholders 24 (74 335) (69 390) (74 335) (69 390)
27 CONTINGENCIES AND COMMITMENTSThere are no material contingent liabilities or commitments at the date of the statement of financial position.
28 SUBSEQUENT EVENTSThere are no material subsequent events occurring between the year end and the date of these financial statements.
29 SEGMENT RESULTSThe portfolio comprises 64 properties, predominantly retail and Botswana based, with a small exposure to Namibian retail (3%) andBotswana industrial (1%). Certain Botswana retail properties have a small office component but properties are categorised based onprimary use.
No segmental results are reflected as the Group's business activities are concentrated on one segment, namely retail property primarilysituated in Botswana, and the Board considers results on an aggregate basis. The Management report elsewhere in this document reflectsthe geographic and sectoral allocation of the portfolio which supports the immaterial nature of the other segments.
NOTES TO THE ANNUAL FINANCIAL STATEMENTS>(continued)
31 July 2018
68
30 FINANCIAL RISK MANAGEMENT, FINANCIAL INSTRUMENTS AND FAIR VALUE HIERARCHYIn the normal course of operations the Group is exposed to strategic and business risk, financial risk, regulatory and compliance risk. Thisnote deals with the major elements of financial risk which arise from financial instruments to which the Group is exposed during or atthe end of the financial reporting period. Financial risk comprises market risk (incorporating interest, currency and other price risk), creditrisk and liquidity risk. The primary objectives of risk management is to gain an understanding of the risk the Group is exposed to, establishacceptable tolerance levels and manage the risks to ensure they stay within the tolerable levels.
30.1 Financials RisksMarket riskThis is the risk that the fair value or future cash flows will fluctuate because of changes in market prices. The Group's market risk onfinancial instruments arises primarily from interest bearing assets and liabilities and foreign exchange movements with respect to theNamibian subsidiary company.
All sensitivities in these financial statements are based on the change of one factor with all others remaining constant which is unlikely tooccur in practice.
(a) Interest rateIn view of the Group's limited interest-bearing assets and liabilities, the operating cash flows are substantially independent of changesin market interest rates.
The Board considers that the current debt level is sufficiently low to allow all debt to be at floating rates and that this would bereconsidered when the external borrowings exceed 10% of the value of investment property. The impact, on Group and Company,of a 1% increase in the interest rate applicable to external borrowings for the next 12 months is P0.2 million (2017: P0.2 million).
Assets on which interest is earned include trade receivables, related party receivables and cash and cash equivalents. The balanceof trade receivables is low and the impact of interest rate changes on these amounts is negligible. The balances on related partyreceivables and cash and cash equivalents at the year end and the impact of a 1% change in interest rate on these balances is setout below:
Impact of 1% change Group Company Group Company
2018 2017 2018 2017 2018 2017 2018 2017 P'000 P'000 P'000 P'000 P'000 P'000 P'000 P'000
Related party receivables 98 375 94 234 98 375 94 234 984 942 984 942Cash and cash equivalents 39 561 43 170 33 775 38 719 396 432 338 387
The Group has no exposure to fixed rate financial instruments (2017: no exposure) and therefore has no exposure to fair valueinterest rate risk (2017: no exposure).
(b) Foreign exchange riskThe Group owns a Namibian subsidiary company which holds investment property in Namibia and the Group is accordingly exposedto foreign exchange translation risk in respect of assets and liabilities that are not in the Group's functional currency which is theBotswana Pula. The relevant exchange rate is the South African Rand and Botswana Pula rate in view of the Namibian Dollar beinglinked to the Rand. In view of the size of these assets relative to the overall portfolio the Board does not consider it necessary toenter into foreign exchange hedges. The Group is not exposed to fair value risk arising from foreign exchange.
The net assets subject to foreign exchange translation risk, converted at a rate of 1.2874 (2017:1.2817) Rand to the Pula, at thereporting date comprise:
NOTES TO THE ANNUAL FINANCIAL STATEMENTS>(continued)
31 July 2018
A N N U A L R E P O R T 2 0 1 8
69

Impact of a 10% increase Group Company Group Company
2018 2017 2018 2017 2018 2017 2018 2017 P'000 P'000 P'000 P'000 P'000 P'000 P'000 P'000
30.1 Financials Risks (continued)Market risk (continued)(b) Foreign exchange risk (continued)
Investment property 46 515 45 189 - - (4 229) (4 108) - -Cash and cash equivalents 5 786 4 451 - - (526) (405) - -All other receivables 716 1 229 - - (65) (112) - -Trade and other payables (5 698) (5 256) - - 518 479 - -Deferred taxation (3 597) (3 494) - - 327 318 - -
43 722 42 119 - - (3 975) (3 828) - -Reconciled to Investment insubsidiary:Net assets per above 43 722 42 119 Less: post acquisition reserves (17 934) (16 235) Add: cumulative foreignexchange translation difference 10 862 10 766
36 650 36 650(c) Price risk
The Group's exposure to price risk is primarily related to non-financial assets, namely its investment in investment property. Referto note 4 in this regard.
Credit riskCredit risk is the risk that a counterparty may cause financial loss to the Group by failing to discharge an obligation. The Group's financialassets that are subject to credit risk are primarily cash and cash equivalents and trade and other receivables. The Group's maximumexposure to credit risk at the year end was:
Group Company2018 2017 2018 2017
P'000 P'000 P'000 P'000Trade and other receivables 101 582 96 962 104 104 99 379Cash and cash equivalents 39 561 43 170 33 775 38 719
141 143 140 132 137 879 138 098Trade and other receivables includes primarily related partyreceivables and comprises:Related party receivables 98 375 94 234 98 375 94 234Prepayments 2 048 1 700 2 048 1 700Dividends receivable - - 2 530 2 405Trade receivables net of impairment 346 380 339 371Other receivables 813 648 812 669
101 582 96 962 104 104 99 379
The Cash Bazaar Holdings (Proprietary) Limited related party receivable is payable on 3 months' notice and is secured by NAP linkedunits based on a 1.33 times cover (2017: 1.5 times cover). The Group also has the right to offset amounts due to the related party againstthe loan and the creditor has provided certain warranties to the Group.
Credit risk with respect to trade receivables is minimised by the diverse tenant base. Credit checks are performed prior to concludingleases and arrear rentals are actively managed. In addition, deposits of P7.7 million for Group and P7.4 million for Company are held(2017: P7.4 million for Group and P7.0 million for Company).
NOTES TO THE ANNUAL FINANCIAL STATEMENTS>(continued)
31 July 2018
70
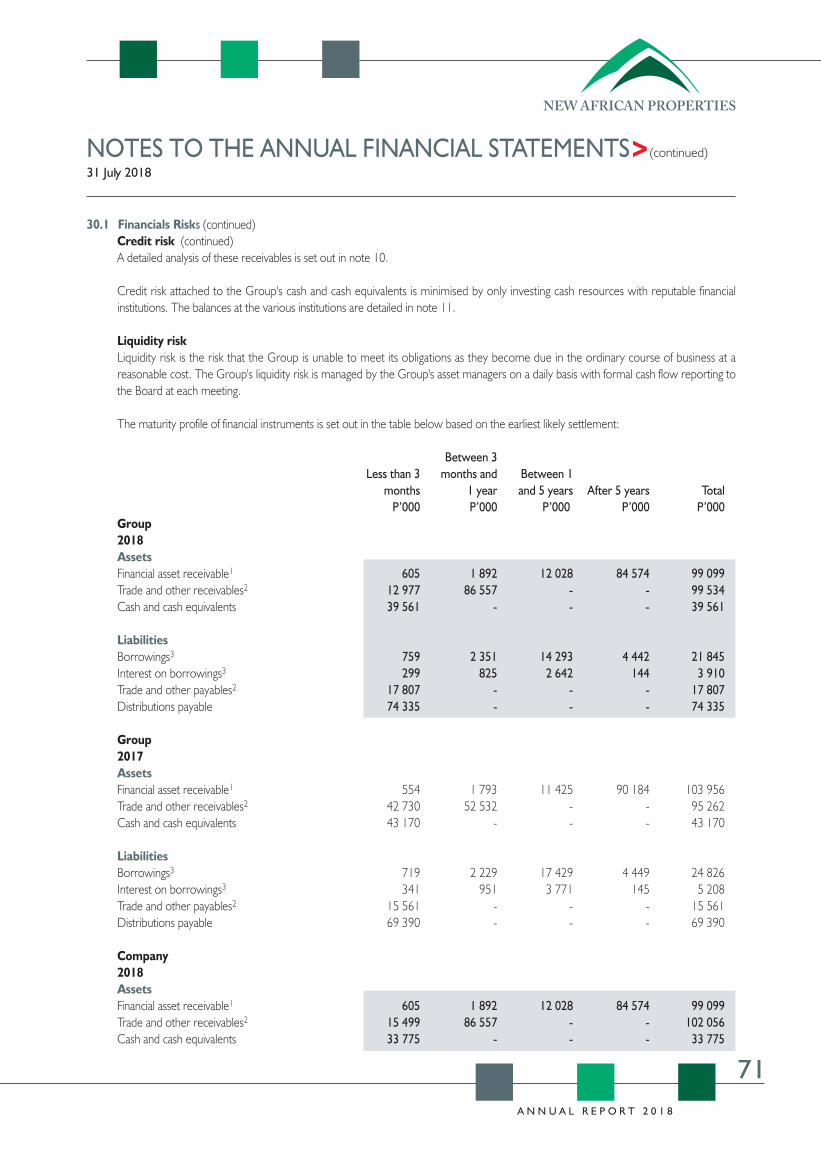
30.1 Financials Risks (continued)Credit risk (continued)A detailed analysis of these receivables is set out in note 10.
Credit risk attached to the Group's cash and cash equivalents is minimised by only investing cash resources with reputable financialinstitutions. The balances at the various institutions are detailed in note 11.
Liquidity riskLiquidity risk is the risk that the Group is unable to meet its obligations as they become due in the ordinary course of business at areasonable cost. The Group's liquidity risk is managed by the Group's asset managers on a daily basis with formal cash flow reporting tothe Board at each meeting.
The maturity profile of financial instruments is set out in the table below based on the earliest likely settlement:
Between 3Less than 3 months and Between 1
months 1 year and 5 years After 5 years TotalP’000 P’000 P’000 P’000 P’000
Group2018AssetsFinancial asset receivable1 605 1 892 12 028 84 574 99 099Trade and other receivables2 12 977 86 557 - - 99 534Cash and cash equivalents 39 561 - - - 39 561
LiabilitiesBorrowings3 759 2 351 14 293 4 442 21 845Interest on borrowings3 299 825 2 642 144 3 910Trade and other payables2 17 807 - - - 17 807Distributions payable 74 335 - - - 74 335
Group2017AssetsFinancial asset receivable1 554 1 793 11 425 90 184 103 956Trade and other receivables2 42 730 52 532 - - 95 262Cash and cash equivalents 43 170 - - - 43 170
LiabilitiesBorrowings3 719 2 229 17 429 4 449 24 826Interest on borrowings3 341 951 3 771 145 5 208Trade and other payables2 15 561 - - - 15 561Distributions payable 69 390 - - - 69 390
Company2018AssetsFinancial asset receivable1 605 1 892 12 028 84 574 99 099Trade and other receivables2 15 499 86 557 - - 102 056Cash and cash equivalents 33 775 - - - 33 775
NOTES TO THE ANNUAL FINANCIAL STATEMENTS>(continued)
31 July 2018
A N N U A L R E P O R T 2 0 1 8
71
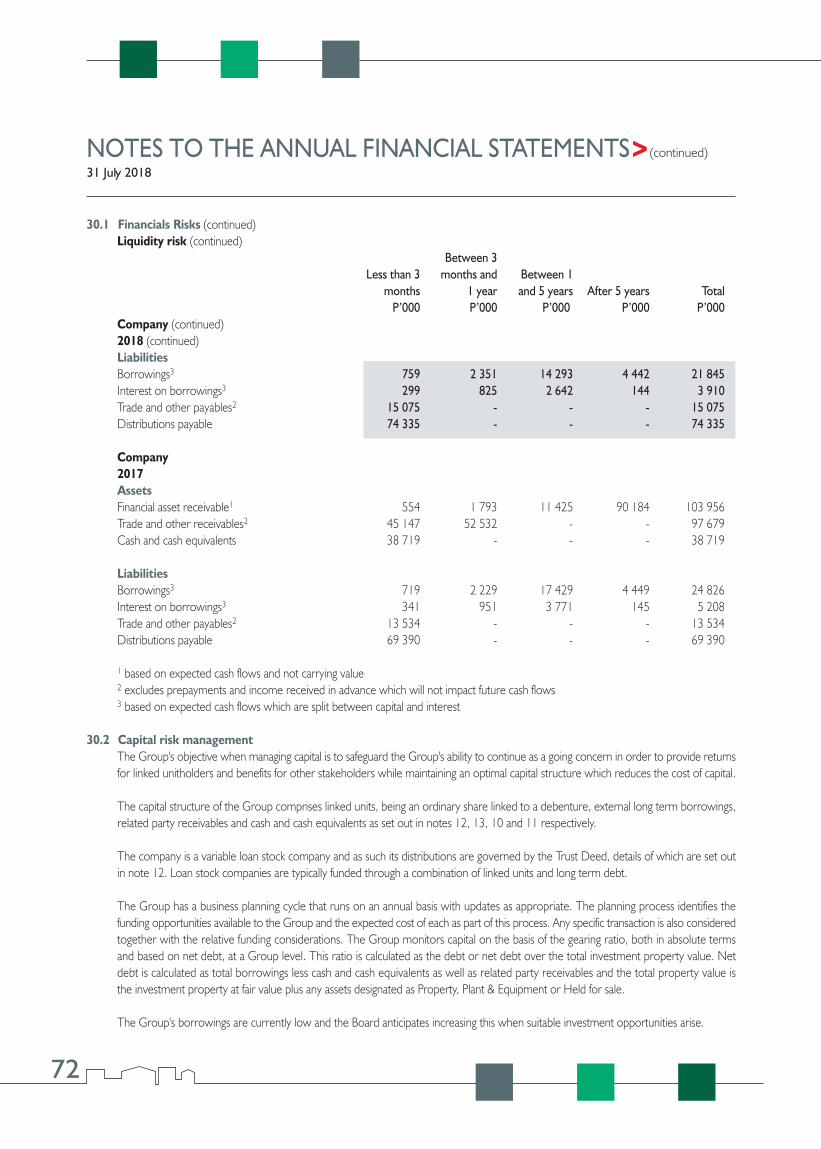
30.1 Financials Risks (continued)Liquidity risk (continued)
Between 3Less than 3 months and Between 1
months 1 year and 5 years After 5 years TotalP’000 P’000 P’000 P’000 P’000
Company (continued)2018 (continued)LiabilitiesBorrowings3 759 2 351 14 293 4 442 21 845Interest on borrowings3 299 825 2 642 144 3 910Trade and other payables2 15 075 - - - 15 075Distributions payable 74 335 - - - 74 335
Company2017AssetsFinancial asset receivable1 554 1 793 11 425 90 184 103 956Trade and other receivables2 45 147 52 532 - - 97 679Cash and cash equivalents 38 719 - - - 38 719
LiabilitiesBorrowings3 719 2 229 17 429 4 449 24 826Interest on borrowings3 341 951 3 771 145 5 208Trade and other payables2 13 534 - - - 13 534Distributions payable 69 390 - - - 69 390
1 based on expected cash flows and not carrying value2 excludes prepayments and income received in advance which will not impact future cash flows3 based on expected cash flows which are split between capital and interest
30.2 Capital risk managementThe Group's objective when managing capital is to safeguard the Group's ability to continue as a going concern in order to provide returnsfor linked unitholders and benefits for other stakeholders while maintaining an optimal capital structure which reduces the cost of capital.
The capital structure of the Group comprises linked units, being an ordinary share linked to a debenture, external long term borrowings,related party receivables and cash and cash equivalents as set out in notes 12, 13, 10 and 11 respectively.
The company is a variable loan stock company and as such its distributions are governed by the Trust Deed, details of which are set outin note 12. Loan stock companies are typically funded through a combination of linked units and long term debt.
The Group has a business planning cycle that runs on an annual basis with updates as appropriate. The planning process identifies thefunding opportunities available to the Group and the expected cost of each as part of this process. Any specific transaction is also consideredtogether with the relative funding considerations. The Group monitors capital on the basis of the gearing ratio, both in absolute termsand based on net debt, at a Group level. This ratio is calculated as the debt or net debt over the total investment property value. Netdebt is calculated as total borrowings less cash and cash equivalents as well as related party receivables and the total property value isthe investment property at fair value plus any assets designated as Property, Plant & Equipment or Held for sale.
The Group's borrowings are currently low and the Board anticipates increasing this when suitable investment opportunities arise.
NOTES TO THE ANNUAL FINANCIAL STATEMENTS>(continued)
31 July 2018
72

NOTES TO THE ANNUAL FINANCIAL STATEMENTS>(continued)
31 July 2018
Group Company
2018 2017 2018 2017 P'000 P'000 P'000 P'000
30.2 Capital risk management (continued)The gearing ratios as at the year end were as follows:Net debt (116 091) (112 578) Borrowings 21 845 24 826 Cash and cash equivalents (39 561) (43 170) Related party receivables (98 375) (94 234) Investment property at fair value 1 459 348 1 384 676
Gearing ratios: Debt to property value 1% 2% Net debt to property value n/a n/a
The company’s borrowing capacity is limited to 70% of the valueof the assets of the Company, or such other sum as the Companymay by ordinary resolution in general meeting determine, in termsof its Constitution.
At the year end the gearing ratio on this basis was: Borrowings 21 845 24 826 21 845 24 826 Total assets 1 673 967 1 588 605 1 625 608 1 551 856 Gearing ratio 1% 2% 1% 2%
30.3 Categories of financial instrumentsThe financial instruments are categorised and reconciled to the statement of financial position as follows:
Total perNon- financial statement of
assets & financialFinancial instruments liabilities position
Financial At fair value liabilities at
through profit Loans & amortised & loss receivables cost P'000 P'000 P'000 P'000 P'000
Group2018AssetsInvestment in property - - - 1 430 853 1 430 853Investment in associate - - - 39 470 39 470Financial asset receivable 25 636 - - - 25 636Intangible asset - - - 6 907 6 907Rent straight line adjustment - - - 28 495 28 495Trade and other receivables - 99 534 - 2 048 101 582Tax receivable - - - 1 463 1 463Cash and cash equivalents - 39 561 - - 39 561Total assets 25 636 139 095 - 1 509 236 1 673 967
A N N U A L R E P O R T 2 0 1 8
73
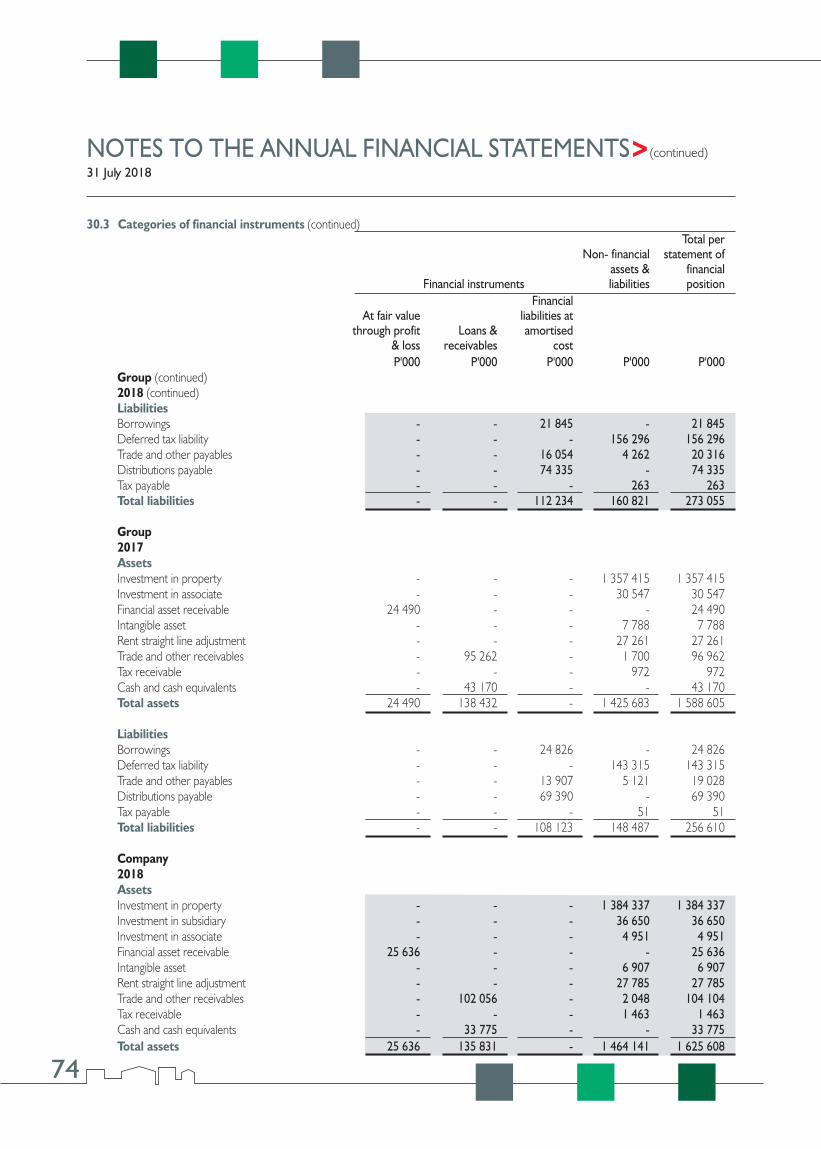
NOTES TO THE ANNUAL FINANCIAL STATEMENTS>(continued)
31 July 2018
30.3 Categories of financial instruments (continued)Total per
Non- financial statement ofassets & financial
Financial instruments liabilities positionFinancial
At fair value liabilities at through profit Loans & amortised
& loss receivables cost P'000 P'000 P'000 P'000 P'000
Group (continued)2018 (continued)LiabilitiesBorrowings - - 21 845 - 21 845Deferred tax liability - - - 156 296 156 296Trade and other payables - - 16 054 4 262 20 316Distributions payable - - 74 335 - 74 335Tax payable - - - 263 263Total liabilities - - 112 234 160 821 273 055
Group2017AssetsInvestment in property - - - 1 357 415 1 357 415Investment in associate - - - 30 547 30 547Financial asset receivable 24 490 - - - 24 490Intangible asset - - - 7 788 7 788Rent straight line adjustment - - - 27 261 27 261Trade and other receivables - 95 262 - 1 700 96 962Tax receivable - - - 972 972Cash and cash equivalents - 43 170 - - 43 170Total assets 24 490 138 432 - 1 425 683 1 588 605
LiabilitiesBorrowings - - 24 826 - 24 826Deferred tax liability - - - 143 315 143 315Trade and other payables - - 13 907 5 121 19 028Distributions payable - - 69 390 - 69 390Tax payable - - - 51 51Total liabilities - - 108 123 148 487 256 610
Company2018AssetsInvestment in property - - - 1 384 337 1 384 337Investment in subsidiary - - - 36 650 36 650Investment in associate - - - 4 951 4 951Financial asset receivable 25 636 - - - 25 636Intangible asset - - - 6 907 6 907Rent straight line adjustment - - - 27 785 27 785Trade and other receivables - 102 056 - 2 048 104 104Tax receivable - - - 1 463 1 463Cash and cash equivalents - 33 775 - - 33 775Total assets 25 636 135 831 - 1 464 141 1 625 608
74

NOTES TO THE ANNUAL FINANCIAL STATEMENTS>(continued)
31 July 2018
30.4 Financial instruments - fair value hierarchyThis analysis categorises the financial instruments carried at fair value into different levels based on the level of subjectivity applied indetermining the inputs used in the determination of fair value. This assessment is determined based on the lowest level of input that issignificant to the fair value measurement in its entirety. Assessing the significance of a particular input into the fair value measurement inits entirety requires judgment, considering the factors specific to the asset or liability. If a fair value uses observable inputs that requiresignificant adjustment based on unobservable inputs or any other significant unobservable inputs, that measurement is a Level 3 measurement.
The fair value hierarchy is measured as follows:Level 1: quoted prices (unadjusted) in active markets for identical assets and liabilities.Level 2: inputs other than quoted prices included in level 1 that are observable for the asset or liability, either directly or indirectly.Level 3: inputs for the asset or liability that are not based on observable market data, that is unobservable inputs.
30.3 Categories of financial instruments (continued)Total per
Non- financial statement ofassets & financial
Financial instruments liabilities positionFinancial
At fair value liabilities at through profit Loans & amortised
& loss receivables cost P'000 P'000 P'000 P'000 P'000
Company (continued)2018 (continued)LiabilitiesBorrowings - - 21 845 - 21 845Deferred tax liability - - - 150 111 150 111Trade and other payables - - 13 531 3 891 17 422Distributions payable - - 74 335 - 74 335Total liabilities - - 109 711 154 002 263 713
Company2017AssetsInvestment in property - - - 1 312 226 1 312 226Investment in subsidiary - - - 36 650 36 650Investment in associate - - - 4 951 4 951Financial asset receivable 24 490 - - - 24 490Intangible asset - - - 7 788 7 788Rent straight line adjustment - - - 26 681 26 681Trade and other receivables - 97 679 - 1 700 99 379Tax receivable - - - 972 972Cash and cash equivalents - 38 719 - - 38 719Total assets 24 490 136 398 - 1 390 968 1 551 856
LiabilitiesBorrowings - - 24 826 - 24 826Deferred tax liability - - - 137 900 137 900Trade and other payables - - 12 086 4 805 16 891Distributions payable - - 69 390 - 69 390Total liabilities - - 106 302 142 705 249 007
A N N U A L R E P O R T 2 0 1 8
75

30.5 Non-financial instruments - fair value hierarchyThis analysis categorises the non-financial instruments carried at fair value into different levels based on the level of subjectivity applied indetermining the inputs used in the determination of fair value. This assessment is determined based on the lowest level of input that issignificant to the fair value measurement in its entirety. Assessing the significance of a particular input into the fair value measurement inits entirety requires judgment, considering the factors specific to the asset or liability. If a fair value uses observable inputs that requiresignificant adjustment based on unobservable inputs or any other significant unobservable inputs, that measurement is a Level 3 measurement.
The fair value hierarchy is measured as follows:Level 1: quoted prices (unadjusted) in active markets for identical assets and liabilities.Level 2: inputs other than quoted prices included in level 1 that are observable for the asset or liability, either directly or indirectly.Level 3: inputs for the asset or liability that are not based on observable market data, that is unobservable inputs.
NOTES TO THE ANNUAL FINANCIAL STATEMENTS>(continued)
31 July 2018
30.4 Financial instruments - fair value hierarchy (continued)The Group's financial assets and liabilities carried at fair value as at the year end were classified as follows:
Group Company
Level 1 Level 2 Level 3 Level 1 Level 2 Level 3P'000 P'000 P'000 P'000 P'000 P'000
2018Financial asset receivable - - 25 636 - - 25 636Cash and cash equivalents 39 561 - - 33 775 - -
2017Financial asset receivable - - 24 490 - - 24 490Cash and cash equivalents 43 170 - - 38 719 - -
There have been no transfers between any of the hierarchy levels during the year (2017: Nil).
Level 1 financial assets include only cash and cash equivalents that are based on actual values invested at the relevant financial institutions.
There are no level 2 financial assets carried at fair value.
Level 3 financial assets comprise the receivable more fully described in note 8. The significant inputs used in determining this value areset out in note 4.
Movements in level 3 financial instruments carried at fair value comprise:
Group Company
2018 2017 2018 2017 P'000 P'000 P'000 P'000Opening balance 24 490 23 321 24 490 23 321Fair value adjustment recognised in profit and loss 1 146 1 169 1 146 1 169Closing balance 25 636 24 490 25 636 24 490
76

NOTES TO THE ANNUAL FINANCIAL STATEMENTS>(continued)
31 July 2018
30.5 Non-financial instruments - fair value hierarchy (continued)The Group's non-financial assets and liabilities carried at fair value as at the year end were classified as follows:
Group Company
Level 1 Level 2 Level 3 Level 1 Level 2 Level 3P'000 P'000 P'000 P'000 P'000 P'000
2018Investment property - - 1 430 853 - - 1 384 337
2017Investment property - - 1 357 415 - - 1 312 226
There have been no transfers between any of the hierarchy levels during the year (2017: Nil).
No non-financial assets carried at fair value are classified as level 1 or 2.
Level 3 non-financial assets comprise the investment property portfolio more fully described in note 5. The significant inputs used indetermining this value are set out in that note and note 4.
Movements in level 3 non-financial instruments carried at fair value comprise:
Group Company2018 2017 2018 2017
P'000 P'000 P'000 P'000Investment propertyOpening balance 1 357 415 1 285 780 1 312 226 1 243 026Fair value adjustment recognised in profit and loss 71 936 68 412 70 408 67 447Capital expenditure 1 703 485 1 703 474Insurance proceeds / reinstatement - 1 279 - 1 279Foreign currency gains / (losses) reflected under othercomprehensive income (201) 1 459 - -Closing balance 1 430 853 1 357 415 1 384 337 1 312 226
In addition to the investment property disclosed as such in these financial statements, the group equity accounts for its associate whichowns an investment property accounted for at fair value. This property asset is also classified as a level 3 hierarchy and is valued basedon a 15.50% (2017: 15.75%) discount rate.
The value of the investment in the associate is based on the Group's share of the net asset value of the company, comprising investmentproperty with a value of P259 million (2017: P215 million) less deferred taxation of P57 million (2017: P47 million). The movement inthis net asset value comprises both profit and total comprehensive income of the associate for the year and has been equity accounted.
A N N U A L R E P O R T 2 0 1 8
77
TERMS AND DEFINITIONS>
AGMAnnual General Meeting of Linked Unitholders.
Amalgamations, acquisitions, assignment, purchase and receivableThe method of acquisition of the portfolio and related assets on listing, which included the short and long form amalgamation of companies,acquisition of properties, purchase of shares, assignment of rights and obligations and cession of the right to receive the income, all witheffect from the effective date of 1 August 2011, and subsequently the amalgamation of wholly owned subsidiary Riverwalk (Proprietary)Limited and NAP on 1 August 2012.
BpsBasis points expressed as a hundredth of a percentage.
BSEThe Botswana Stock Exchange as established by the Botswana Stock Exchange Act Cap 56:08.
Capitalisation (cap) ratesThe rate at which the annual net income from an investment is capitalised to ascertain its capital value at a given date.
CAGRCompound annual growth rate is a useful measure of growth over multiple time periods. It can be thought of as the growth rate fromthe initial value to the ending / current value assuming that the investment has been compounding over the time period at a constant rate.
Capital returnThe movement in unit price as a percentage of the opening unit price.
CBHCash Bazaar Holdings (Proprietary) Limited, a company registered in the Republic of Botswana.
Company, Holding Company or NAPNew African Properties Limited.
CSDBCentral Securities Depository Company of Botswana Limited.
DebenturesVariable rate unsecured debentures in the debenture capital of the Company, each of which is indivisibly linked to an ordinary share,together making up a Linked Unit.
Discount / Premium to NAVThe difference between the price at which units are trading on the BSE and the NAV, divided by the NAV.
Distributable incomeNet income from rentals, after portfolio expenses and net interest, but excluding items of a capital nature (being primarily fair valueadjustments and gains / losses on disposal), other accounting entries such as rent straight line adjustments, and taxes on those excludedamounts.
DistributionPayments to linked unitholders twice per annum based on the distributable income and determined by the Board. These distributionscomprise dividends on shares and interest on debentures. It is the income return on linked units.
78

TERMS AND DEFINITIONS>(continued)
Financial asset receivableThe right to receive a portion of the income derived by Mynco (Pty) Ltd, for a period of 25 years, by way of cession granted by Mynco(Pty) Ltd to the Company.
Financial yearThe financial year ending 31 July annually.
Forward yieldExpected income for the following 12 months divided by the current price / value, expressed as a percentage.
FurnmartFurnmart Limited, a company incorporated in Botswana and listed on the BSE, and a company related to CBH.
GroupNAP and its subsidiary companies, currently New African Properties (Namibia) (Pty) Ltd.
GLAGross Lettable Area.
Historic yieldDistributions for the previous 12 months divided by the current trading price on any given day, expressed as a percentage.
IFRSInternational Financial Reporting Standards
Income / distribution yieldDistributions for a 12 month period divided by the unit price at the start of the 12 month period, expressed as a percentage.
Interest coverThe number of times that distributable earnings before interest paid, tax and distributions covers the interest expense.
Linked unitOne Ordinary share indivisibly linked to one Debenture of the Company, being the equity structure of the Company.
Linked unitholdersHolders, from time to time, of Linked Units.
m2
A unit of measure, the area of a square the sides of which measure exactly one metre.
NafpropNafprop (Proprietary) Limited, a company incorporated in Botswana, a subsidiary of CBH. NAP’s asset and property manager.
Net asset value (NAV)The value of all assets less all liabilities, also equal to total unitholders’ funds. Also expressed as NAV per linked unit by dividing NAV bythe number of linked units.
N$Namibian Dollars, the legal tender of Namibia.
A N N U A L R E P O R T 2 0 1 8
79

TERMS AND DEFINITIONS>(continued)
Ordinary shareOrdinary share of no par value in the stated capital of the Company, which together with one indivisibly linked Debenture make up aLinked Unit in the Company.
PLS / VLS / VRLSProperty loan stock / variable rate loan stock company, being a company registered as such and having a linked unit equity structure andinvesting in immovable property.
Property portfolioThe properties owned by the Company, either directly or indirectly through subsidiary companies.
Pula or PThe legal tender of Botswana, the reporting currency for the Group.
SharesOrdinary shares of no par value in the stated share capital of the Company, each of which is indivisibly linked to one Debenture.
Straight line adjustmentThe accounting adjustment required to smooth escalating income streams from leases over the period of each lease. This adjustment isrequired in terms of IFRS and is included in profit but not in the calculation of distributable income which is based on the cash flows inherentin the leases.
Tenant retentionThe square metres (m2) renewed on expiry expressed as a percentage of the total m2 that expired during the period.
Thebe or tThe legal tender of Botswana, representing one hundredth of a Pula.
Total return/sThe income distribution plus the movement in the linked unit price as a percentage of the opening unit price, ignoring any reinvestmentof income.
tpuThebe per linked unit.
Trust DeedThe trust deed relating to the Debentures entered into between the Company and J Y Stevens, as trustee for Linked Unitholders.
TrusteeParty to the Debenture Trust Deed, and acts on behalf of debenture holders in terms of the Deed.
Vacancy factorUnoccupied space (excluding where vacant due to development) relative to total space, either calculated using GLA or rental income.
WHTWithholding tax, being a tax deducted at the source of an income stream for direct payment to the revenue authority.
80
NEW AFRICAN PROPERTIES LTD“the Company” or “New African Properties” or “NAP”
Incorporated in the Republic of Botswana, Company No. Co 2008/545BSE share code: NAP
ISIN code: BW 000 000 1049
NOTICE TO ALL LINKED UNITHOLDERS
NOTICE IS HEREBY GIVEN THAT the Annual General Meeting of the Company for the 2018 financial year will be held in the NafpropBoardroom, Cash Bazaar Holdings, Plot 20573/4, Block 3, Gaborone, at 08h00 on Thursday, the 17th day of January 2019.
AGENDA
1. Notice convening the meeting
2. Ordinary resolutions:2.1 Resolution number 1 :To consider and adopt the annual financial statements and annual report, including the report of the auditors, for the year ended 31July 2018.
2.2 Resolution number 2:To consider and ratify the distributions declared for the year, comprising:• Number 13 - declared 23 April 2018, paid 25 May 2018 12.25 thebe per unit• Number 14 - declared 25 July 2018, paid 31 August 2018 12.28 thebe per unit
2.3 Resolution number 3:To re-elect retiring directors and confirm new directors in accordance with the Company's Constitution. Motions for re-election willbe moved individually.
NOTICE OF ANNUAL GENERAL MEETING>
In terms of the Constitution all directors shall retire at the first annual general meeting, thereafter at least one-third of the directorsshall retire at each meeting, with all directors who have held office for three years since last election or appointment being requiredto retire. Accordingly, Messrs. F.B. Lebala and T.L.J. Mynhardt retire by rotation but being eligible, offer themselves for re-election.Abridged Curriculum Vitae's of these directors are set out on page 4 to 5 of this annual report.
Should any shareholder wish to propose another candidate for election as director (“the Candidate”), the procedures are governedby clause 20.9.3 of the Company's Constitution. This provides that no person not being a retiring Director shall be eligible for electionto the office of the director at any Annual General Meeting unless the member intending to propose him has, at least five days beforethe meeting, left at the registered office of the Company a notice in writing, duly signed signifying the intention of such member topropose the Candidate and the consent of the Candidate to assume the office of the director.
Mafenyatlala Mall, Molepolole
A N N U A L R E P O R T 2 0 1 8
81

2.4 Resolution number 4:To consider and ratify the directors' fees payable to independent directors for the year ended 31 July 2018 as set out on pages 37and 67 of the annual report.
2.5 Resolution number 5:(a) To reappoint PricewaterhouseCoopers as auditors of the Company for the ensuing year; and(b) to approve their remuneration for the year ended 31 July 2018.These motions will be moved individually.
2.6 Resolution number 6:To place linked units equal to an aggregate of 15% of the number of linked units in issue at any time under the control of the directorsfor allotment and issue for the acquisition of immovable property until the next annual general meeting, at which meeting such authoritywill be sought to be renewed until the next annual general meeting, subject to the following limitations in respect of each of the tworesolutions below. It is specifically recorded that this preamble is applicable to each of the resolutions under 2.6 (a) and (b) and thatthe 15% limit referred to above is the aggregate limit for all issues under these two subsections of resolution 6 which will be votedon individually.
(a) Issue for the acquisition of immovable property:i. The Committee as defined in the BSE listing requirements (“the Committee”) to be consulted and determines that the issue
is for the bona fide purchase of assets.
(b) Issue for the acquisition of immovable property by way of a vendor consideration placing:i. All vendors must have an equal opportunity of participating in the placing;ii. The minimum placing price, unless unitholders specific approval is obtained, is the lower of: a 10% discount to the 30 day weighted average price prior to the directors' authorising the placing or the date of the placing. The Committee to
be consulted for a ruling if the linked units have not traded during this period.
3. To transact any other business which may be transacted at an annual general meeting.
4. To respond to any questions from unitholders.
5. Close the meeting.
NOTE:Any member who is entitled to attend and vote at a general meeting is entitled to appoint one or more persons as a proxy to attend, speakand vote in his / her stead and the proxy so appointed need not be a member of the Company. Proxy forms must be deposited at theregistered office of the Company not less than 24 (twenty-four) hours before the time fixed for the meeting.
By order of the Board Dated this 29 October 2018
DPS Consulting Services (Pty) LtdCompany secretaryRegistered office:Plot 50371, Fairground Office Park, GaboroneFax +267 397 3901
NOTICE OF ANNUAL GENERAL MEETING>(continued)
82

NEW AFRICAN PROPERTIES LIMITED“the Company” or “New African Properties” or “NAP”
I/ We _________________________________________________________________________________________________
Of _______________________________________________________________________________________________________
Being the registered holder/s of ____________________________ linked units in the Company, at the close of business on Monday,14 January 2019, hereby appoint:
____________________________________________________ of __________________________________________________;Or failing him / her
____________________________________________________ of __________________________________________________;Or failing him / herthe Chairman of the meetingas my / our proxy to attend, speak and vote for me / us on my / our behalf at the annual general meeting of the company to be held at08h00 on Thursday, 17th January 2019, and at any adjournment thereof and to vote for or against the resolutions or to abstain from votingin respect of the units registered in my / our name/s, in accordance with the following instructions:
Resolutionnumber Detail In favour Against Abstain
1 Consider and adopt the annual financial statements2 Consider and ratify the distributions declared for the year3 To re-elect retiring directors and confirm new directors
(a) F.B. Lebala(b) T.L.J. Mynhardt
4 Consider and ratify the directors' fees payable to independent directors5 (a) Reappoint PricewaterhouseCoopers as auditors of the Company for
the ensuing year, and(b) Approve their remuneration
6 Place linked units equal to an aggregate of 15% of the number of linkedunits in issue at any time under the control of the directors - all subjectto the full wording in the notice:(a) Issue for the acquisition of immovable property(b) Issue for the acquisition of immovable property by way of a vendor consideration placing
PROXY FORM>
A N N U A L R E P O R T 2 0 1 8
83

Signed this _______________________________________________ day of _________________________________________
Full name:______________________________________________________________________________________________
Signature:______________________________________________________________________________________________
Assisted by (Guardian):____________________________________________________________________________________
A member who is entitled to attend and vote at a general meeting is entitled to appoint one or more persons as a proxy to attend, speak andvote in his / her stead and the proxy so appointed need not be a member of the Company.
Registered office:Plot 50371 Fairground Office Park, GaboroneFax +267 397 3901
INSTRUCTIONS ON SIGNING AND LODGING THIS PROXY FORM1. This must be deposited at the Registered Office of the Company not less than 24 (twenty-four) hours before the time of the scheduled
meeting.2. A deletion of any printed matter and the completion of any blank space(s) need not be signed or initialled. Any alteration or correction
made on this form must be signed, not initialled, by the signatory / signatories.3. The Chairman of the meeting shall be entitled to decline to accept the authority of the signatory:
a. Under a power of attorney; orb. On behalf of a company or any other entity;Unless such power of attorney or authority is deposited at the registered office of the company not less than 24 (twenty-four) hours
before the scheduled time for the meeting.4. The authority of a person signing a Proxy in a representative capacity must be attached to the Proxy form unless the authority has previously been recorded by the Secretary.5. The signatory may insert the name of any person(s) whom the signatory wishes to appoint as his proxy in the blank space(s) provided
for that purpose.6. When there are joint holders of units and if more than one such joint holder is present in person or represented by proxy, then the
person whose name stands first in the register in respect of such units, or his / her Proxy, as the case may be, shall alone be entitledto vote in respect thereof.
7. The completion and lodging of this Proxy shall not preclude the signatory from attending the meeting and speaking and voting in person thereat to the exclusion of any Proxy appointed in terms hereof should such signatory wish to do so.8. The Chairman of the meeting may reject or accept any Proxy form which is completed and/ or submitted other than in accordance
with these instructions, provided that he is satisfied as to the manner in which a member wishes to vote.9. If the unitholding is not indicated on the Proxy form, the Proxy will be deemed to be authorised to vote the total unitholding.10. A minor or any other person under legal incapacity must be assisted by his / her parent or guardian, as applicable, unless relevant documents establishing his / her capacity are produced or have previously been registered.
PROXY FORM>(continued)
84

CORPORATE INFORMATION AND ADMINISTRATION>
NEW AFRICAN PROPERTIES LTD“the Company” or “New African Properties” or “NAP”Incorporated in the Republic of Botswana, Company No. Co 2008/545BSE share code: NAPISIN code: BW 000 000 1049www.newafricanproperties.co.bw
Managing DirectorTobias MynhardtCash Bazaar HoldingsPlot 20573/4, Block 3, GaboronePrivate Bag 115, GaboroneTel: +267 367 0501Fax: +267 397 4734
Company Secretary and registered officeDPS Consulting Services (Pty) LtdPlot 50371, Fairground Office Park, GaboroneP.O. Box 1453, GaboroneTel: +267 395 2011Fax: +267 397 3901
Property and Asset ManagerNafprop (Pty) LtdPlot 20573/4, Block 3, GaboronePrivate Bag 115, GaboroneTel: +267 391 3051Fax: +267 397 2598Email address: [email protected]
AuditorsPricewaterhouseCoopersPlot 50371, Fairground Office Park, GaboroneP.O. Box 294, GaboroneTel: +267 395 2011Fax: +267 397 3901
BankersBarclays Bank of Botswana LimitedPlot 74358, Building 4, Prime Plaza, New CBDP.O. Box 478, GaboroneTel: +267 363 3904Fax: +267 397 1373
Chief Financial OfficerLauren TappingCash Bazaar HoldingsPlot 20573/4, Block 3, GaboronePrivate Bag 115, GaboroneTel: +267 367 0501Fax: +267 397 4734
Transfer SecretariesGrant Thornton Business Services (Pty) LtdPlot 50370 Acumen Park, GaboroneP.O. Box 1157, GaboroneTel: +267 395 2313Fax: +267 397 2357Email: [email protected]
TrusteeJ. Y. StevensPlot 64518, Fairground Office Park,P.O. Box 211008 Bontleng, GaboroneTel: +267 395 2474Fax: +267 395 2478Email: [email protected]
Corporate Law AdvisorNeill ArmstrongP.O. Box 45701, RiverwalkTel: +267 395 2797Email: [email protected]
SponsorsMotswedi Securities (Proprietary) LimitedUnit 30, Plot 113, Kgale Mews, GaboronePrivate Bag 00223, GaboroneTel: +267 318 8627Fax: +267 318 8629Email: [email protected]
Design: Design Insight, Printing: Fishwicks
A N N U A L R E P O R T 2 0 1 8
85

ANNUAL REPORT 2018www.newafricanproperties.co.bw
Tel: +267 367 0501 Fax: +267 397 4734