nap region hydrological model prosser catchment
TRANSCRIPT
Prepared By: HYDRO ELECTRIC CORPORATION ARBN 072 377 158 ABN 48 072 377 158 4 Elizabeth Street, Hobart Tasmania, Australia
Report No:118784 - Report-4 Rev. Status: Final Date Issued: 17-2-2005
NAP Region Hydrological Model
Prosser Catchment
Hydro Tasmania Page ii
DOCUMENT INFORMATION
JOB/PROJECT TITLE:
NAP Region Hydrological Models
TITLE:
Prosser Catchment
CLIENT ORGANISATION:
Department of Primary Industries, Water and Environment
CLIENT CONTACT:
Martin Read
The development of hydrological models for National Action Plan catchments and
accompanying reports have been conducted under the National Action Plan for Salinity
and Water Quality (NAPSWQ) as part of the project "Surface water hydrological models
for the NAP Region" (NAP Project 41542) and was funded by the Australian Government
and the Department of Primary Industries, Water and Environment.
DOCUMENT ID NUMBER: 118783-Report-4
DATE: 17th February 2005
REV/DRAFT NO: Final
JOB/PROJECT MANAGER: Bryce Graham
JOB/PROJECT NUMBER: 118783
REVISION/DRAFT HISTORY:
REV DATE DESCRIPTION PREPARED REVIEWED APPROVED
0 17/2/05 Draft R. Murray B. Graham F. Ling
1 27/4/05 Final R. Murray B. Graham F. Ling
NAP Region Hydrological Models: Prosser Catchment
Hydro Tasmania 118783-Report-4 Page iii
EXECUTIVE SUMMARY
This report is part of a series of reports which present the methodologies and results from the development and calibration of hydrological models for the 13 National Action Plan (NAP) region catchments for both current and natural catchment conditions. The project is a priority action under the National Action Plan for Salinity and Water Quality (NAPSWQ). This report describes the results of the hydrological model developed for the Prosser catchment.
A model was developed for the Prosser catchment that facilitates the modeling of flow data for three scenarios;
• Scenario 1 - Natural Flow
• Scenario 2 - Entitlements (river flows with water entitlements extracted)
• Scenario 3 - Entitlements and Environmental Flows (a scenario modeling environmental flows with all extractions included)
The results from the scenario modeling allow the calculation of indices of hydrological disturbance. These indices include:
• Hydrological Disturbance Index
• Index of Mean Annual Flow
• Index of Flow Duration Curve Difference
• Index of Seasonal Amplitude
• Index of Seasonal Periodicity
The indices were calculated using the formulas stated in the Natural Resource Management (NRM) Monitoring and Evaluation Framework developed by SKM for the Murray-Darling Basin.
A user interface is also provided that allows the user to run the model under varying catchment demand scenarios. It allows the user to add further extractions to catchments and see what effect these additional extractions have on the available water in the catchment of concern. The interface provides sub-catchment summary of flows statistics, duration curves, hydrological indices and water allocation data.

NAP Region Hydrological Models: Prosser Catchment
Hydro Tasmania 118783-Report-4 Page 1
TABLE OF CONTENTS
EXECUTIVE SUMMARY ...................................................................... III
1 INTRODUCTION ......................................................................... 2
2 CATCHMENT CHARACTERISTICS ..................................................... 3
3 DATA COMPILATION ................................................................... 5
3.1 CLIMATE DATA (RAINFALL & EVAPORATION) ......................................................... 5 3.2 ADVANTAGES OF USING CLIMATE DRILL DATA ....................................................... 5 3.3 TRANSPOSITION OF CLIMATE DRILL DATA TO LOCAL CATCHMENT ................................ 5 3.4 STREAMFLOW DATA ..................................................................................... 7 3.5 IRRIGATION AND WATER USAGE ....................................................................... 7
4 MODEL DEVELOPMENT ............................................................... 11
4.1 SUBCATCHMENT DELINEATION ....................................................................... 11 4.2 HYDSTRA MODEL ....................................................................................... 11 4.3 AWBM ROUTINE ........................................................................................ 12 4.4 CHANNEL ROUTING .................................................................................... 14 4.5 MODEL CALIBRATIONS ................................................................................. 15 4.6 MODEL RESULTS ........................................................................................ 17 4.7 INDICES OF HYDROLOGICAL DISTURBANCE ......................................................... 18
5 REFERENCES ........................................................................... 20
LIST OF TABLES
TABLE 3.1 SUB CATCHMENT HIGH AND LOW PRIORITY ENTITLEMENTS .................................. 8 TABLE 4.1 ADOPTED CALIBRATION PARAMETERS.......................................................... 16
TABLE 4.2 MODEL FIT STATISTICS – PROSSER RIVER U/S LOWER DAM.................................. 16 TABLE 4.3 PROSSER RIVER U/S LOWER DAM HYDROLOGICAL DISTURBANCE INDICES ................ 18
LIST OF FIGURES FIGURE 2.1 PROSSER SUB-CATCHMENT BOUNDARIES ....................................................... 4
FIGURE 3.1 PROSSER CLIMATE DRILL SITE LOCATIONS ..................................................... 6 FIGURE 3.2 WATER ALLOCATIONS IN THE PROSSER CATCHMENT ....................................... 10 FIGURE 4.1 HYDSTRA PROSSER MODEL SCHEMATIC ....................................................... 12 FIGURE 4.2 AUSTRALIAN WATER BALANCE MODEL SCHEMATIC ......................................... 14 FIGURE 4.3 TIME SERIES COMPARISONS OF MODELED AND OBSERVED FLOW – PROSSER RIVER U/S
LOWER DAM - MAY TO OCTOBER 1976 ............................................................... 15
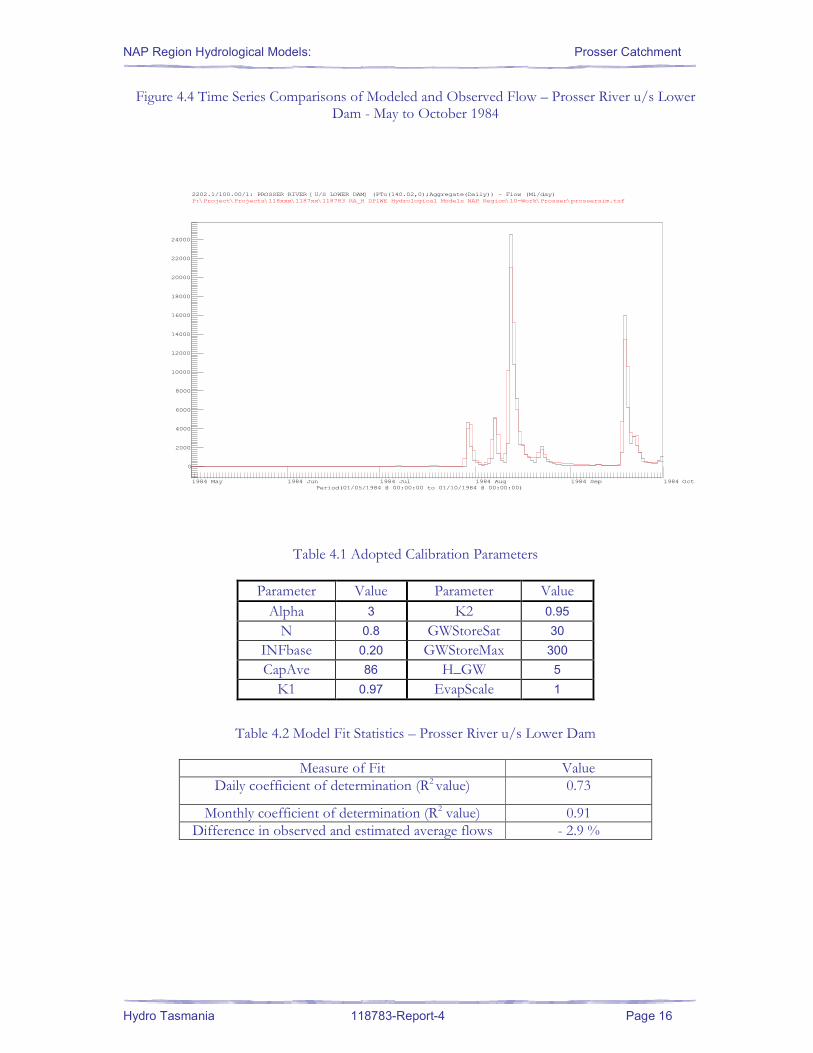
FIGURE 4.4 TIME SERIES COMPARISONS OF MODELED AND OBSERVED FLOW – PROSSER RIVER U/S LOWER DAM - MAY TO OCTOBER 1984 ............................................................... 16
FIGURE 4.5 COMPARISON OF DAILY MODELED AND OBSERVED FLOW – PROSSER RIVER U/S LOWER DAM ....................................................................................................... 17
FIGURE 4.6 PROSSER RIVER U/S LOWER DAM DURATION CURVES ...................................... 18

NAP Region Hydrological Models: Prosser Catchment
Hydro Tasmania 118783-Report-4 Page 2
1 INTRODUCTION
This report forms part of a larger project commissioned by the Department of Primary Industries Water and Environment to provide hydrological models for 13 NAP region catchments.
The main objectives for the individual catchments are:
• To compile relevant data required for the development and calibration of the hydrological model (Australian Water Balance Model, AWBM) for the Prosser catchment;
• To generate over 100 years of daily time-step rainfall and streamflow data for input to the hydrologic model;
• To develop and calibrate the hydrologic model under natural and current catchment conditions;
• To develop a user interface for running the model under varying catchment demand scenarios;
• Prepare a report summarising the methodology adopted, assumptions made, results of calibration and validation and description relating to the use of the developed hydrologic model and associated software.
NAP Region Hydrological Models: Prosser Catchment
Hydro Tasmania 118783-Report-4 Page 3
2 CATCHMENT CHARACTERISTICS
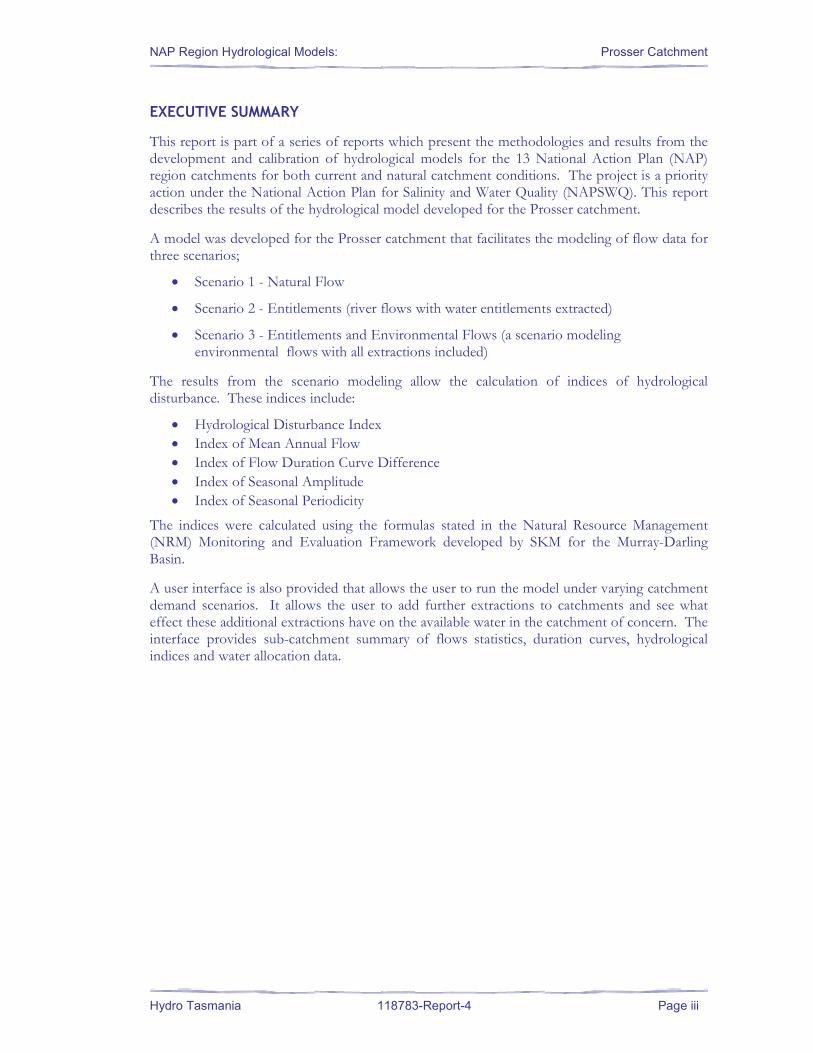
The Prosser catchment is located in the south-east of Tasmania. The Prosser River rises between Mt. Brown and Mt. Hobbs, and flows in an easterly direction before discharging into Prosser Bay at Orford on Tasmania’s east coast. The catchment is bounded by the Bluestone Tier to the north and by Nelsons Tier to the south.
The total NAP catchment area of the Prosser River is 684 km2. The Prosser catchment forms part of the East Coast Basin.
The East Coast Basin water management area covers 6842 square kilometres and occupies an area of the State stretching from the north east corner, along the east coast to a point just north of Hobart. Catchment rainfall varies significantly across the catchment. As a guide to the range of average annual catchment rainfall, the George River catchment receives 1150 mm and the Orielton Rivulet 550 mm. Rivers and streams in the northern half of the catchment generally flow all year round. However quite a few of these get low over the period December to April. A number of watercourses and rivers in the southern half of the catchment either cease to flow or come close to ceasing to flow during the December to April period. Topography for the basin is generally hilly with some low lying areas and mountains on the western side. Some mountains reach a height in excess of 800 m. Major land use consists of natural forest, plantation forest and agriculture. There are no large storages in the catchment. Irrigation is the largest user of water in the area followed by town water supplies. Water resource issues include irrigation expansion and the impact on the water resources of coastal towns caused by the large influx of tourists in the summer. Reliable streamflows over the period December to April are fully committed and do not satisfy all of the areas water demand. Extensive use of farm dams is required to store the generally plentiful winter streamflows for use during summer. Further irrigation expansion in the area will generally only be possible by constructing water storages.
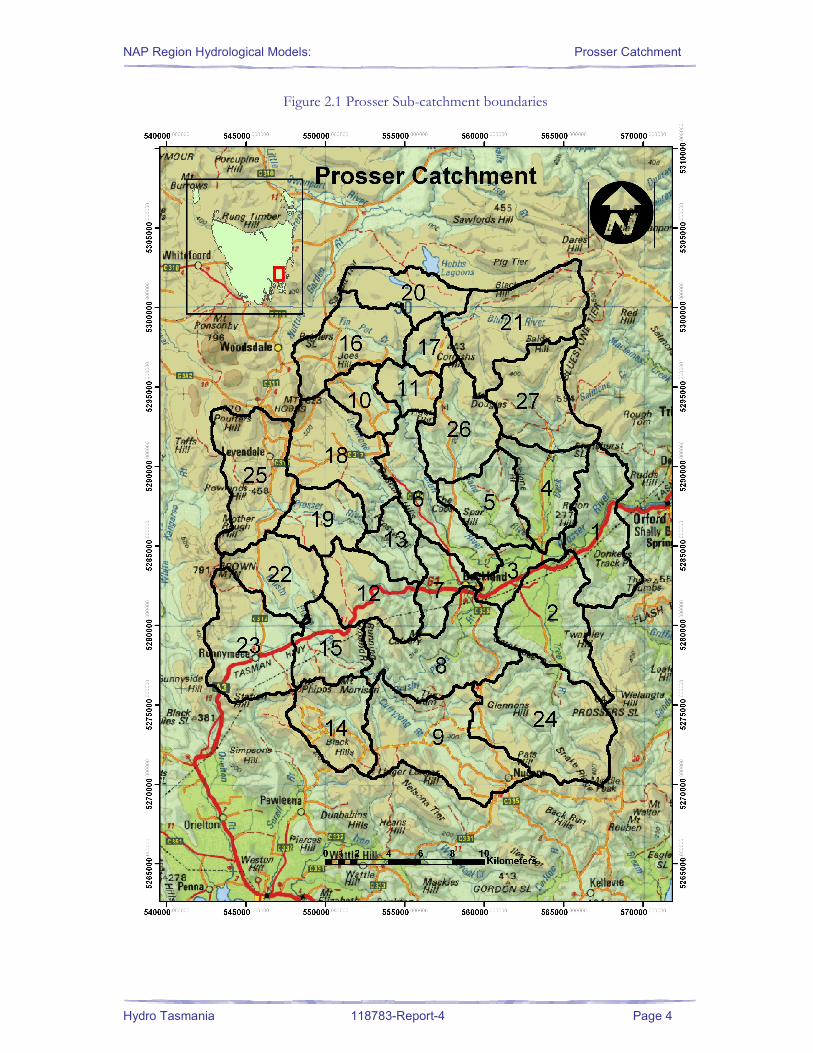
For modelling purposes, the Prosser catchment was sub divided into 27 sub areas. The delineation of these areas is shown in Figure 2.1. There is one major monitoring point in the catchment, on the Prosser River upstream of the lower dam. This point is effectively the bottom of the catchment. The catchment area to the lower dam is 684 km2.
NAP Region Hydrological Models: Prosser Catchment
Hydro Tasmania 118783-Report-4 Page 4
Figure 2.1 Prosser Sub-catchment boundaries
NAP Region Hydrological Models: Prosser Catchment
Hydro Tasmania 118783-Report-4 Page 5
3 DATA COMPILATION
3.1 CLIMATE DATA (RAINFALL & EVAPORATION)
Daily time-step climate data was obtained from the Queensland Department of Natural Resources & Mines (QDNRM).
The Department provides time series climate drill data from 0.05o x 0.05o (about 5 km x 5 km) interpolated grided rainfall and evaporation data based on over 6000 rainfall and evaporation stations in Australia (see www.dnr.qld.gov.au/silo) for further details of climate drill data.
3.2 ADVANTAGES OF USING CLIMATE DRILL DATA
This data has a number of benefits over other sources of rainfall data including:
• Continuous data back to 1889 (however, the further back there are less input sites available and therefore quality is reduced. The makers of the data set state that gauge numbers have been somewhat static since 1957, therefore back to 1957 distribution is considered “good” but prior to 1957 site availability may need to be checked in the study area).
• Evaporation data (along with a number of other climatic variables) is also included which can be used for the AWBM model.
3.3 TRANSPOSITION OF CLIMATE DRILL DATA TO LOCAL CATCHMENT
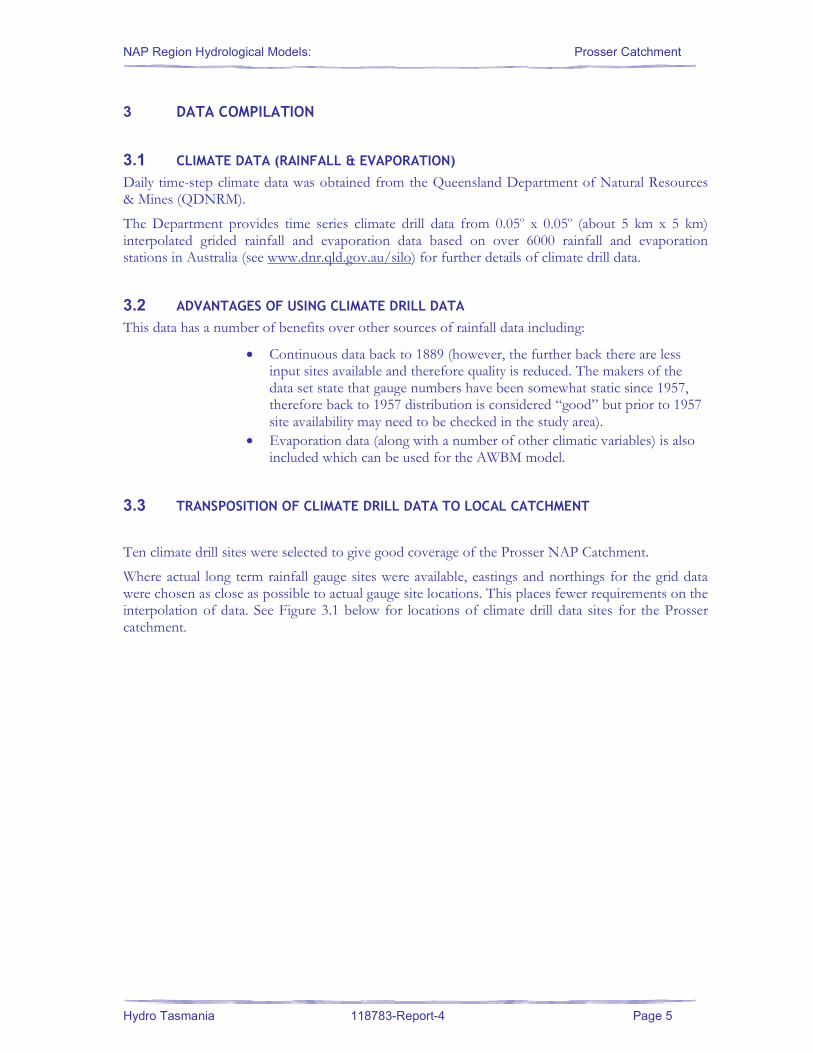
Ten climate drill sites were selected to give good coverage of the Prosser NAP Catchment.
Where actual long term rainfall gauge sites were available, eastings and northings for the grid data were chosen as close as possible to actual gauge site locations. This places fewer requirements on the interpolation of data. See Figure 3.1 below for locations of climate drill data sites for the Prosser catchment.
NAP Region Hydrological Models: Prosser Catchment
Hydro Tasmania 118783-Report-4 Page 6
Figure 3.1 Prosser Climate Drill site locations
NAP Region Hydrological Models: Prosser Catchment
Hydro Tasmania 118783-Report-4 Page 7
3.4 STREAMFLOW DATA
There is one historical streamflow gauge site in the Prosser catchment;
Site Name Period of Record Easting Northing
Prosser River upstream of Lower Dam 11/02/1965 - 11/01/1994 568300 5287800
This site was used for calibration purposes.
3.5 IRRIGATION AND WATER USAGE
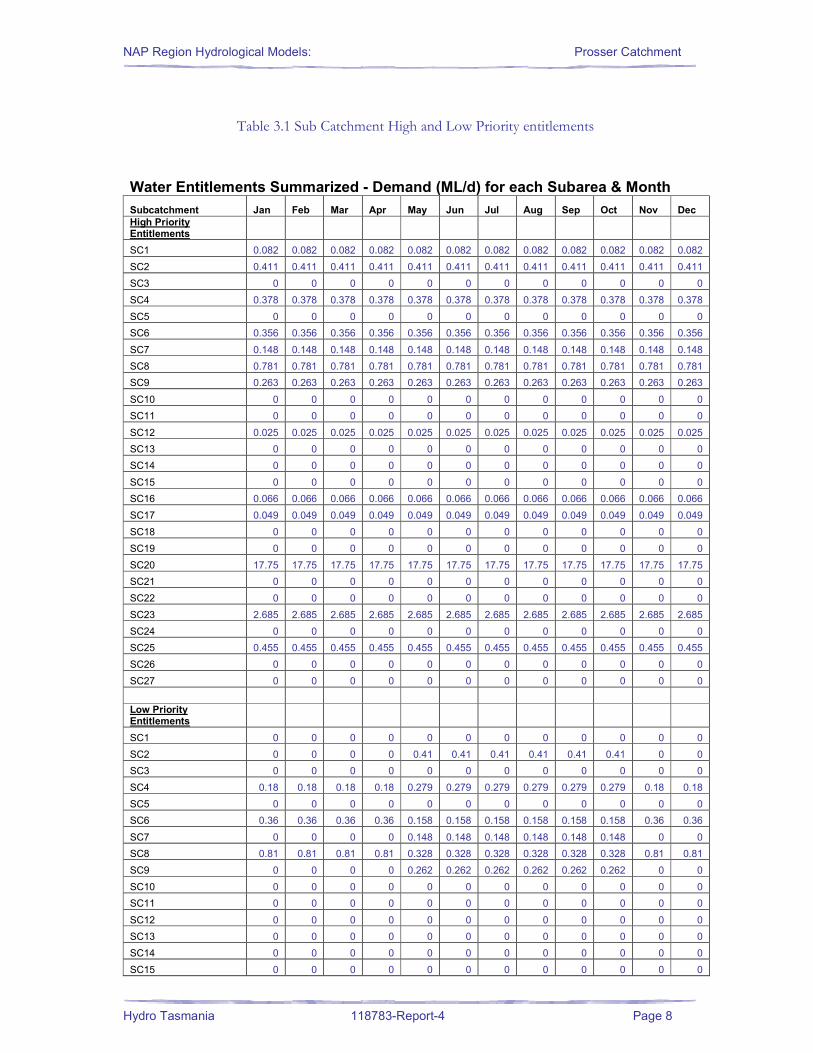
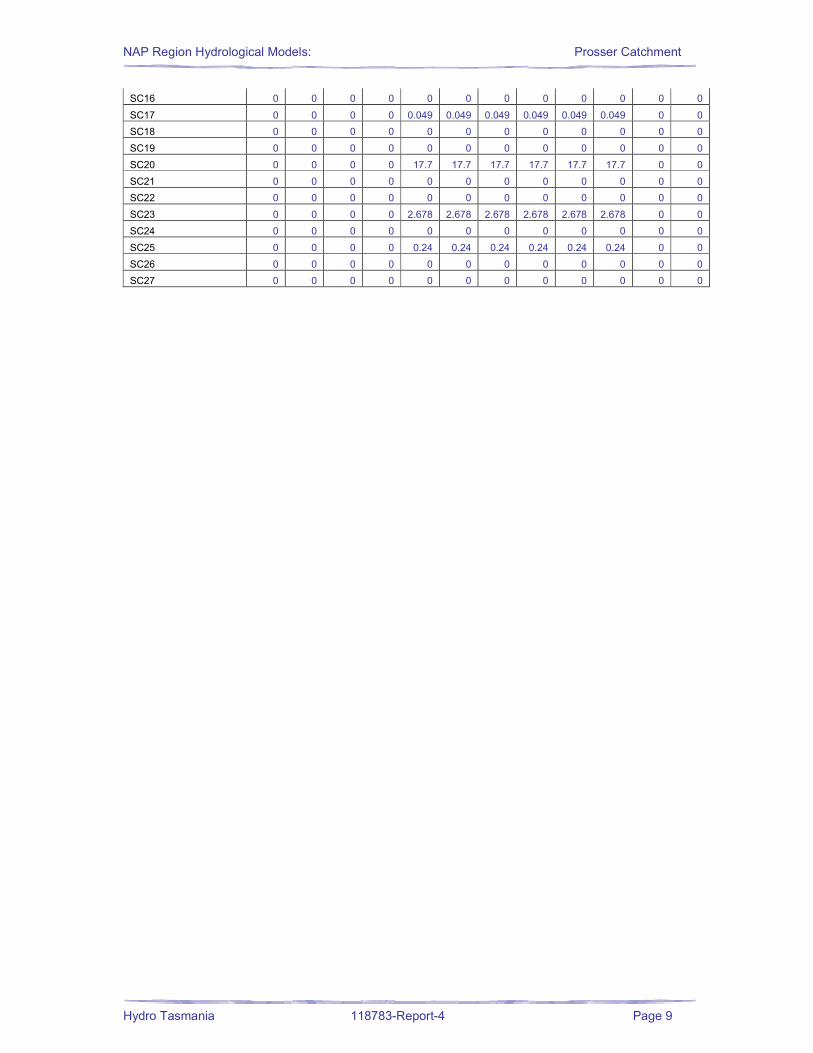
Information on the current water entitlement allocations in the catchment was obtained from DPIWE. The extractions or licenses in the catchment are of a given Surety (from 1 to 5), with Surety 1-2 representing high priority extractions for modeling purposes and Surety 3-5 representing the lowest priority. When modeling scenarios with environmental flows, water will only be available for Low Priority entitlements after environmental flow requirements have been met.
Following communications with DPIWE staff working on the Prosser catchment, unlicensed water extractions were assumed to be twice as large as the total water entitlement allocation for each sub-catchment.
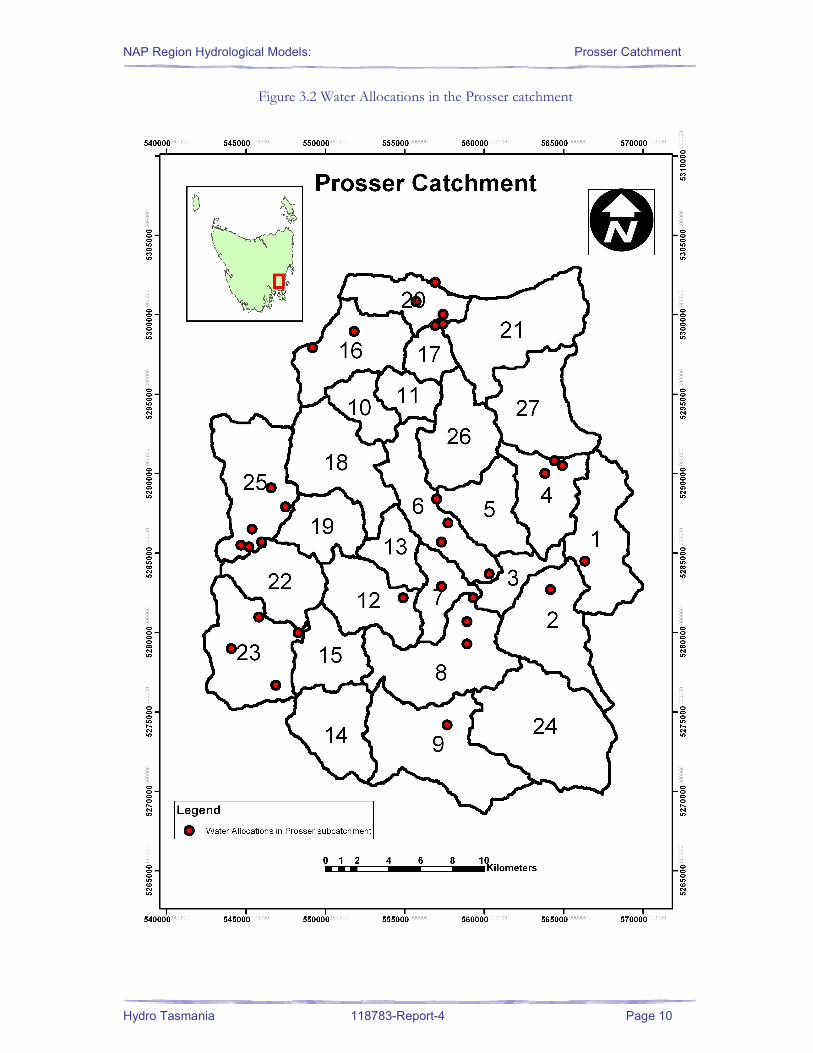
A summary table of total entitlement volumes on a daily breakdown by sub-catchment is provided below in Table 3.1 and in the NAP Catchment User Interface. A map of the water allocations in the catchment is shown in Figure 3.2.
NAP Region Hydrological Models: Prosser Catchment
Hydro Tasmania 118783-Report-4 Page 8
Table 3.1 Sub Catchment High and Low Priority entitlements
Water Entitlements Summarized - Demand (ML/d) for each Subarea & Month
Subcatchment Jan Feb Mar Apr May Jun Jul Aug Sep Oct Nov Dec
High Priority Entitlements
SC1 0.082 0.082 0.082 0.082 0.082 0.082 0.082 0.082 0.082 0.082 0.082 0.082
SC2 0.411 0.411 0.411 0.411 0.411 0.411 0.411 0.411 0.411 0.411 0.411 0.411
SC3 0 0 0 0 0 0 0 0 0 0 0 0
SC4 0.378 0.378 0.378 0.378 0.378 0.378 0.378 0.378 0.378 0.378 0.378 0.378
SC5 0 0 0 0 0 0 0 0 0 0 0 0
SC6 0.356 0.356 0.356 0.356 0.356 0.356 0.356 0.356 0.356 0.356 0.356 0.356
SC7 0.148 0.148 0.148 0.148 0.148 0.148 0.148 0.148 0.148 0.148 0.148 0.148
SC8 0.781 0.781 0.781 0.781 0.781 0.781 0.781 0.781 0.781 0.781 0.781 0.781
SC9 0.263 0.263 0.263 0.263 0.263 0.263 0.263 0.263 0.263 0.263 0.263 0.263
SC10 0 0 0 0 0 0 0 0 0 0 0 0
SC11 0 0 0 0 0 0 0 0 0 0 0 0
SC12 0.025 0.025 0.025 0.025 0.025 0.025 0.025 0.025 0.025 0.025 0.025 0.025
SC13 0 0 0 0 0 0 0 0 0 0 0 0
SC14 0 0 0 0 0 0 0 0 0 0 0 0
SC15 0 0 0 0 0 0 0 0 0 0 0 0
SC16 0.066 0.066 0.066 0.066 0.066 0.066 0.066 0.066 0.066 0.066 0.066 0.066
SC17 0.049 0.049 0.049 0.049 0.049 0.049 0.049 0.049 0.049 0.049 0.049 0.049
SC18 0 0 0 0 0 0 0 0 0 0 0 0
SC19 0 0 0 0 0 0 0 0 0 0 0 0
SC20 17.75 17.75 17.75 17.75 17.75 17.75 17.75 17.75 17.75 17.75 17.75 17.75
SC21 0 0 0 0 0 0 0 0 0 0 0 0
SC22 0 0 0 0 0 0 0 0 0 0 0 0
SC23 2.685 2.685 2.685 2.685 2.685 2.685 2.685 2.685 2.685 2.685 2.685 2.685
SC24 0 0 0 0 0 0 0 0 0 0 0 0
SC25 0.455 0.455 0.455 0.455 0.455 0.455 0.455 0.455 0.455 0.455 0.455 0.455
SC26 0 0 0 0 0 0 0 0 0 0 0 0
SC27 0 0 0 0 0 0 0 0 0 0 0 0
Low Priority Entitlements
SC1 0 0 0 0 0 0 0 0 0 0 0 0
SC2 0 0 0 0 0.41 0.41 0.41 0.41 0.41 0.41 0 0
SC3 0 0 0 0 0 0 0 0 0 0 0 0
SC4 0.18 0.18 0.18 0.18 0.279 0.279 0.279 0.279 0.279 0.279 0.18 0.18
SC5 0 0 0 0 0 0 0 0 0 0 0 0
SC6 0.36 0.36 0.36 0.36 0.158 0.158 0.158 0.158 0.158 0.158 0.36 0.36
SC7 0 0 0 0 0.148 0.148 0.148 0.148 0.148 0.148 0 0
SC8 0.81 0.81 0.81 0.81 0.328 0.328 0.328 0.328 0.328 0.328 0.81 0.81
SC9 0 0 0 0 0.262 0.262 0.262 0.262 0.262 0.262 0 0
SC10 0 0 0 0 0 0 0 0 0 0 0 0
SC11 0 0 0 0 0 0 0 0 0 0 0 0
SC12 0 0 0 0 0 0 0 0 0 0 0 0
SC13 0 0 0 0 0 0 0 0 0 0 0 0
SC14 0 0 0 0 0 0 0 0 0 0 0 0
SC15 0 0 0 0 0 0 0 0 0 0 0 0
NAP Region Hydrological Models: Prosser Catchment
Hydro Tasmania 118783-Report-4 Page 9
SC16 0 0 0 0 0 0 0 0 0 0 0 0
SC17 0 0 0 0 0.049 0.049 0.049 0.049 0.049 0.049 0 0
SC18 0 0 0 0 0 0 0 0 0 0 0 0
SC19 0 0 0 0 0 0 0 0 0 0 0 0
SC20 0 0 0 0 17.7 17.7 17.7 17.7 17.7 17.7 0 0
SC21 0 0 0 0 0 0 0 0 0 0 0 0
SC22 0 0 0 0 0 0 0 0 0 0 0 0
SC23 0 0 0 0 2.678 2.678 2.678 2.678 2.678 2.678 0 0
SC24 0 0 0 0 0 0 0 0 0 0 0 0
SC25 0 0 0 0 0.24 0.24 0.24 0.24 0.24 0.24 0 0
SC26 0 0 0 0 0 0 0 0 0 0 0 0
SC27 0 0 0 0 0 0 0 0 0 0 0 0
NAP Region Hydrological Models: Prosser Catchment
Hydro Tasmania 118783-Report-4 Page 10
Figure 3.2 Water Allocations in the Prosser catchment
NAP Region Hydrological Models: Prosser Catchment
Hydro Tasmania 118783-Report-4 Page 11
4 MODEL DEVELOPMENT
4.1 SUBCATCHMENT DELINEATION
Subcatchment delineation was performed using CatchmentSIM GIS software.
CatchmentSIM is a freely available 3D-GIS topographic parameterisation and hydrologic analysis model. The model automatically delineates watershed and subcatchment boundaries, generalises geophysical parameters and provides in-depth analysis tools to examine and compare the hydrologic properties of subcatchments. The model also includes a flexible result export macro language to allow users to fully couple CatchmentSIM with any hydrologic modelling package that is based on subcatchment networks.
The software is tailored towards full coupling with third party hydrologic models by:
• Firstly, CatchmentSIM is used to delineate a catchment, break it up into numerous subcatchments, determine their areas and spatial topographic attributes and analyse each subcatchment's hydrologic characteristics to provide insight into the rainfall response of various catchments and resultant assignment of hydrologic modelling parameters.
• Following this, the derived subcatchments and their attributes may be directly imported into any third party hydrologic model. This is achieved by a flexible result export macro language with specifically developed macro scripts enabling automatic development on input files (text or binary) for other models.
CatchmentSIM can be thought of as a collection of topographic and hydrologic analysis algorithms that have been purpose built for the process of hydrologic analysis and included in a Windows based user-friendly GIS environment. The program has not been intended to be a 'black box' application and as such, all algorithms are described from a conceptual perspective in the user manual.
For more detailed information on CatchmentSIM see the CatchmentSIM Homepage www.toolkit.net.au/catchsim/
4.2 HYDSTRA MODEL
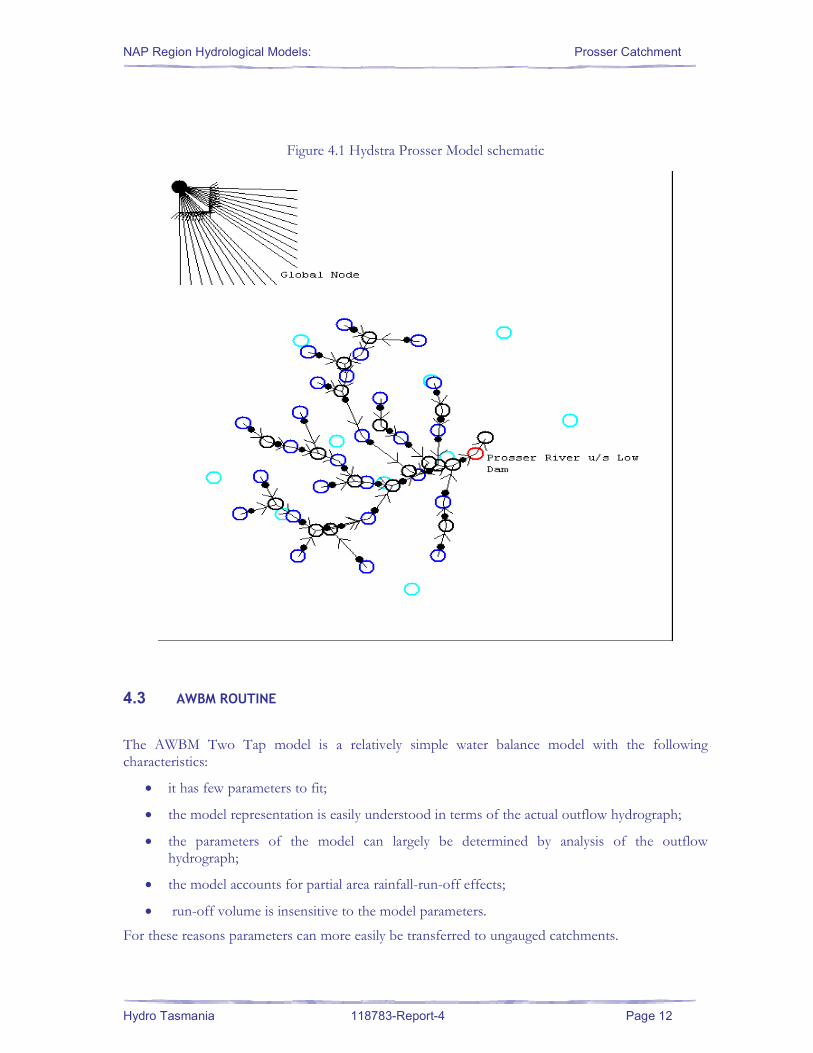
A computer simulation model was developed using Hydstra Modelling. The Prosser sub-catchments, described in Figure 2.1, were represented by model “nodes” and connected together by “links”. A schematic of this model is displayed in Figure 4.1.
The rainfall and evaporation is calculated for each subcatchment using inverse-distance gauge weighting. The gauge weights were automatically calculated at the start of each model run. The weighting is computed for the centroid of the subcatchment. A quadrant system is drawn, centred on the centroid. A weight for the closest gauge in each quadrant is computed as the inverse, squared, distance between the gauge and centroid. For each time step and each node, the gauge weights are applied to the incoming rainfall and evaporation data.
The AWBM Two Tap rainfall/runoff model was used to calculate the runoff for each subcatchment separately. This was chosen over the usual method of a single AWBM model for the whole catchment as it more accurately distributes the runoff and base flow spatially over the catchment.
The flow in each sub-catchment is routed through the catchment via a channel routing function.
NAP Region Hydrological Models: Prosser Catchment
Hydro Tasmania 118783-Report-4 Page 12
Figure 4.1 Hydstra Prosser Model schematic
4.3 AWBM ROUTINE
The AWBM Two Tap model is a relatively simple water balance model with the following characteristics:
• it has few parameters to fit;
• the model representation is easily understood in terms of the actual outflow hydrograph;
• the parameters of the model can largely be determined by analysis of the outflow hydrograph;
• the model accounts for partial area rainfall-run-off effects;
• run-off volume is insensitive to the model parameters.
For these reasons parameters can more easily be transferred to ungauged catchments.
NAP Region Hydrological Models: Prosser Catchment
Hydro Tasmania 118783-Report-4 Page 13
The AWBM routine used in this study is the Boughton Revised AWBM model (Boughton, 2003), which reduces the three partial areas and three surface storage capacities to relationships based on an average surface storage capacity.
Boughton & Chiew (2003) have shown that when using the AWBM model, the total amount of runoff is mainly affected by the average surface storage capacity and much less by how that average is spread among the three surface capacities and their partial areas. Given an average surface storage capacity (Ave), the three partial areas and the three surface storage capacities are found by;
Partial area of smallest store A1=0.134
Partial area of smallest store A2=0.433
Partial area of smallest store A3=0.433
Capacity of smallest store C1=(0.01*Ave/A1)=0.075*Ave
Capacity of smallest store C2=(0.33*Ave/ A2)=0.762*Ave
Capacity of smallest store C3=(0.66*Ave/ A3)=1.524*Ave
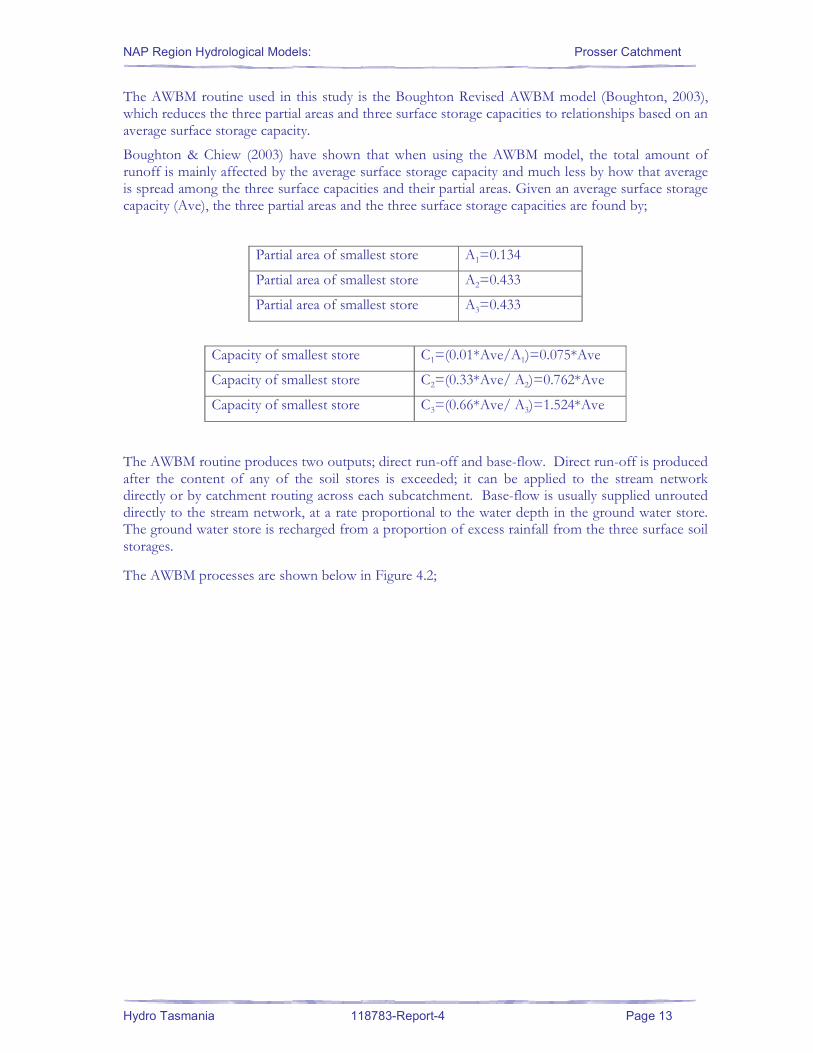
The AWBM routine produces two outputs; direct run-off and base-flow. Direct run-off is produced after the content of any of the soil stores is exceeded; it can be applied to the stream network directly or by catchment routing across each subcatchment. Base-flow is usually supplied unrouted directly to the stream network, at a rate proportional to the water depth in the ground water store. The ground water store is recharged from a proportion of excess rainfall from the three surface soil storages.
The AWBM processes are shown below in Figure 4.2;
NAP Region Hydrological Models: Prosser Catchment
Hydro Tasmania 118783-Report-4 Page 14
Figure 4.2 Australian Water Balance Model schematic
4.4 CHANNEL ROUTING
A common method employed in nonlinear routing models is a power function storage relation. S = K.Qn
K is a dimensional empirical coefficient, the reach lag (time). In the case of Hydstra/TSM Modelling:
α and
Li = Channel length (km)
α = Channel Lag Parameter n = Non-linearity Parameter Q = Outflow from Channel Reach (m3/s)
NAP Region Hydrological Models: Prosser Catchment
Hydro Tasmania 118783-Report-4 Page 15
A reach length factor may be used in the declaration of α to account for varying reach lag for
individual channel reaches. eg. α.fl where fl is a length factor. Parameters required by Hydstra/TSM Modelling and their legal bounds are:
α Channel Lag Parameter Between 0.0 and 5.0
L Channel Length (km) Greater than 0.0 (km)
n Non-linearity Parameter Between 0.0 and 1.0
4.5 MODEL CALIBRATIONS
Calibration was achieved by adjusting catchment parameters so that the modelled data replicated the record at the Prosser River upstream of the Lower Dam site (1965 – 1994). Given that calibration of catchment parameters requires natural flow conditions, it was assumed that there was no water extraction from May to October and only these months were used for calibration. This assumption was made due to the highly seasonal flows in the catchment. The flows are sufficiently large from May to October to effectively dampen out any extraction effects on the natural flows.
This assumption is likely to be inadequate in drier periods, as off stream storages are likely to be filled during these months, but due to the lack of data, no better assumption could be made.
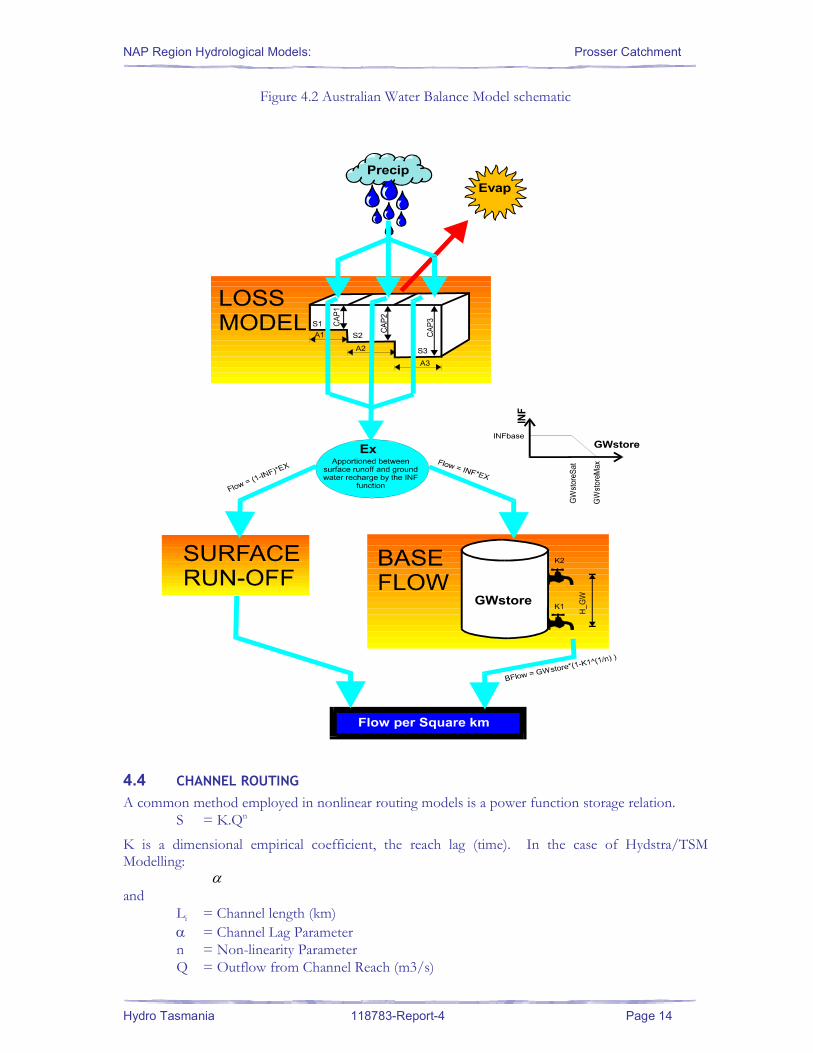
The results of calibration are shown in Figure 4.3 and 4.4 below. Overall the model gives a passable representation of the flows in the Prosser River. Given the uncertainties in the “naturalness” of the gauged data, this was as good an estimate of daily flows as could be expected and it is unlikely that a better fit could have been achieved using other calibration tools.
Figure 4.3 Time Series Comparisons of Modeled and Observed Flow – Prosser River u/s Lower Dam - May to October 1976
1976 May 1976 Jun 1976 Jul 1976 Aug 1976 Sep 1976 Oct0
500
1000
1500
2000
2500
3000
3500
4000
4500
5000
5500
6000
6500
7000
7500
Period(01/05/1976 @ 00:00:00 to 01/10/1976 @ 00:00:00)
2202.1/100.00/1: PROSSER RIVER [U/S LOWER DAM] (PTo(140.02,0);Aggregate(Daily)) - Flow (Ml/day)P:\Project\Projects\118xxx\1187xx\118783 RA_H DPIWE Hydrological Models NAP Region\10-Work\Prosser\prossersim.tsf
NAP Region Hydrological Models: Prosser Catchment
Hydro Tasmania 118783-Report-4 Page 16
Figure 4.4 Time Series Comparisons of Modeled and Observed Flow – Prosser River u/s Lower Dam - May to October 1984
1984 May 1984 Jun 1984 Jul 1984 Aug 1984 Sep 1984 Oct
0
2000
4000
6000
8000
10000
12000
14000
16000
18000
20000
22000
24000
Period(01/05/1984 @ 00:00:00 to 01/10/1984 @ 00:00:00)
2202.1/100.00/1: PROSSER RIVER [U/S LOWER DAM] (PTo(140.02,0);Aggregate(Daily)) - Flow (Ml/day)P:\Project\Projects\118xxx\1187xx\118783 RA_H DPIWE Hydrological Models NAP Region\10-Work\Prosser\prossersim.tsf
Table 4.1 Adopted Calibration Parameters
Parameter Value Parameter Value
Alpha 3 K2 0.95
N 0.8 GWStoreSat 30
INFbase 0.20 GWStoreMax 300
CapAve 86 H_GW 5
K1 0.97 EvapScale 1
Table 4.2 Model Fit Statistics – Prosser River u/s Lower Dam
Measure of Fit Value Daily coefficient of determination (R2 value) 0.73
Monthly coefficient of determination (R2 value) 0.91 Difference in observed and estimated average flows - 2.9 %
NAP Region Hydrological Models: Prosser Catchment
Hydro Tasmania 118783-Report-4 Page 17
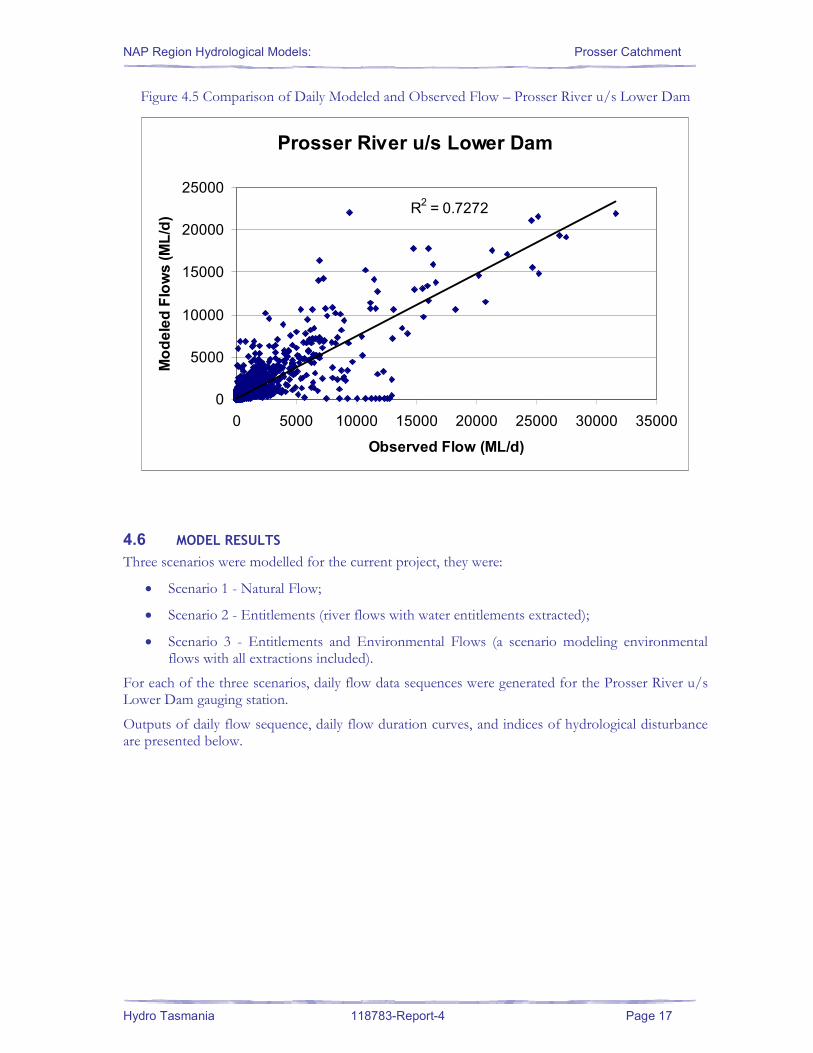
Figure 4.5 Comparison of Daily Modeled and Observed Flow – Prosser River u/s Lower Dam
Prosser River u/s Lower Dam
R2 = 0.7272
0
5000
10000
15000
20000
25000
0 5000 10000 15000 20000 25000 30000 35000
Observed Flow (ML/d)
Modeled Flows (ML/d)
4.6 MODEL RESULTS
Three scenarios were modelled for the current project, they were:
• Scenario 1 - Natural Flow;
• Scenario 2 - Entitlements (river flows with water entitlements extracted);
• Scenario 3 - Entitlements and Environmental Flows (a scenario modeling environmental flows with all extractions included).
For each of the three scenarios, daily flow data sequences were generated for the Prosser River u/s Lower Dam gauging station.
Outputs of daily flow sequence, daily flow duration curves, and indices of hydrological disturbance are presented below.
NAP Region Hydrological Models: Prosser Catchment
Hydro Tasmania 118783-Report-4 Page 18
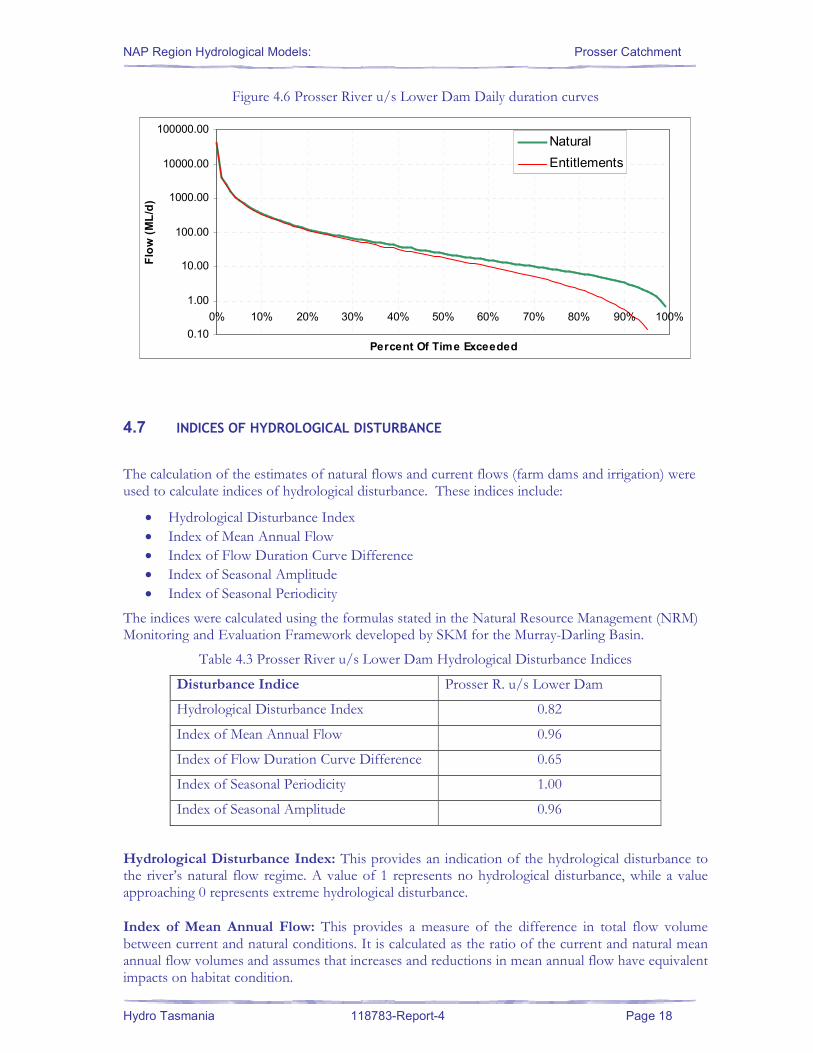
Figure 4.6 Prosser River u/s Lower Dam Daily duration curves
0.10
1.00
10.00
100.00
1000.00
10000.00
100000.00
0% 10% 20% 30% 40% 50% 60% 70% 80% 90% 100%
Percent Of Time Exceeded
Flow (ML/d)
Natural
Entitlements
4.7 INDICES OF HYDROLOGICAL DISTURBANCE
The calculation of the estimates of natural flows and current flows (farm dams and irrigation) were used to calculate indices of hydrological disturbance. These indices include:
• Hydrological Disturbance Index
• Index of Mean Annual Flow
• Index of Flow Duration Curve Difference
• Index of Seasonal Amplitude
• Index of Seasonal Periodicity
The indices were calculated using the formulas stated in the Natural Resource Management (NRM) Monitoring and Evaluation Framework developed by SKM for the Murray-Darling Basin.
Table 4.3 Prosser River u/s Lower Dam Hydrological Disturbance Indices
Disturbance Indice Prosser R. u/s Lower Dam
Hydrological Disturbance Index 0.82
Index of Mean Annual Flow 0.96
Index of Flow Duration Curve Difference 0.65
Index of Seasonal Periodicity 1.00
Index of Seasonal Amplitude 0.96
Hydrological Disturbance Index: This provides an indication of the hydrological disturbance to the river’s natural flow regime. A value of 1 represents no hydrological disturbance, while a value approaching 0 represents extreme hydrological disturbance.
Index of Mean Annual Flow: This provides a measure of the difference in total flow volume between current and natural conditions. It is calculated as the ratio of the current and natural mean annual flow volumes and assumes that increases and reductions in mean annual flow have equivalent impacts on habitat condition.
NAP Region Hydrological Models: Prosser Catchment
Hydro Tasmania 118783-Report-4 Page 19
Index of Flow Duration Curve Difference: The difference from 1 of the proportional flow deviation, averaged over p monthly flow percentile point. A measure of the overall difference between current and natural monthly flow duration curves. All flow diverted would give a score of 0.
Index of Seasonal Periodicity: The change in seasonal timing of flows. It is defined as the difference from 1 of one twelfth of the sum of the absolute values of the differences between current and natural of first, the numerical values of the months with the highest mean monthly flows, and second, the numerical values of the months with the lowest mean monthly flows.
Index of Seasonal Amplitude: The change in amplitude of the seasonal pattern of monthly flows. It is defined as the average of two current: natural ratios, firstly, that of the highest monthly flows, and secondly, that of the lowest monthly flows based on calendar month means.
NAP Region Hydrological Models: Prosser Catchment
Hydro Tasmania 118783-Report-4 Page 20
5 REFERENCES
Boughton, W.C. and Chiew, F.,(2003) Calibrations of the AWBM for use on Ungauged Catchments
CatchmentSIM Homepage www.toolkit.net.au/catchsim/ January 2005.
SKM (2003) Estimating Available Water in Catchments in Catchments Using Sustainable Diversion Limits. Farm Dam Surface Area and Volume relationship, report to DSE, Draft B October 2003
Hydrology Theme Summary of Pilot Audit Technical Report – Sustainable Rivers Audit. MDBC Publication 08/04.
National Land and Water Resources Audit (NLWRA) www.audit.ea.gov.au/anra/water/; January 2005.