napa county groundwater sustainability annual report
TRANSCRIPT

Napa County Groundwater Sustainability
Annual Report – Water Year 2017
By Vicki Kretsinger Grabert and Reid Bryson
March 20, 2018

Overview
• SGMA update
• 2017 Annual Report Highlights
• NE Napa Study & Management Area Amendment to Basin Analysis Report
• Summary and Recommendations
2

Groundwater Basins:SGMA Prioritization
• Napa Sonoma Valley Basin− Napa Valley
Subbasin (Med)− Napa-Sonoma
Lowlands Subbasin (VL)
• Berryessa Valley Basin (VL)
• Pope Valley Basin (VL)
• Suisun-Fairfield Valley Basin (VL)
MediumVery Low
3

SGMA Basin Analysis Report & Annual Report
BAR Submitted to DWR 12/16/2016• Functionally equivalent to a GW Sustainability Plan• For basins operated sustainably for at least 10 years
– Napa Valley Subbasin sustainability analysis 28 yrs• Covers the whole DWR-designated Subbasin• Conditions typical throughout the basin• Report under review by DWR
SGMA sustainability metrics used in Napa County2016 Annual Report
April 1, 2018: First Annual Report due for SGMA 4

GROUNDWATER CONDITIONS:
Highlights Annual Report
Water Year 2017
5

GW Level Monitoring, 2017
Napa Co., 96(including10 SW/GW)DWR, 4GeoTracker, 7
Total Wells= 107 Sites
6

Depth to Groundwater
Feet below groundsurface
7
10 to 15 ft

Spring 2017GW Elevations
8

0102030405060
1950 1960 1970 1980 1990 2000 2010
Pre
cipi
tatio
n (in
.) NAPA PRECIPITATION
Groundwater Conditions:Napa Valley Subbasin Dry Years
9
-30
10
50
90
130
170
Gro
undw
ater
Ele
vatio
n (ft
, msl
)
St. Helena
Yountville
Napa

MST Hydrographs
NapaCounty-2
NapaCounty-20
NapaCounty-13710

Monitoring at 5 Sites• Shallow Monitoring Wells (MWs) each site
– Levels & quality
• Stream gauge each site– Streamflow & quality
Surface Water/Groundwater
5
4
32
111

GW Monitoring Wells Near River
Above GroundLocked Protection
Below Ground “Nested”Monitoring Wells
Looking Downat MWs
2-inch dia.casings
2-inch dia.casings
Sand and Gravel
SandNot to Scale 100 ft Deep
40 ft Deep
12

SW/GW Interaction: Site 5 St. Helena
River Monitoring
GW Monitoring
Recently ActiveSupply Well
13

SW/GW Interaction Indirect Connection Stream Seepage Independent of GW Levels
Direct ConnectionMaintains/Discharges to Stream(Groundwater Baseflow)
Groundwater PumpingStream Loses Water/Recharge to GW
Courtesy TNC
River and Shallow MW not exhibiting short- term pumping effects
St. Helena SW/GW Site
Deep MW:Affected bynearby pumping
Streambed
RiverShallow MW
14

SW/GW Site 4 Compared to Historical GW LevelsNapa County-133(120 ft deep)
Shallow & Deep Site 4MWs Near River
0102030405060
1977 1987 1997 2007 2017
(inch
es) NAPA PRECIPITATION
15

Napa Valley Subbasin Sustainable Groundwater Management
Metrics and Tracking: Sustainability Indicators
16

17
Water Budget:Core Element of Groundwater Sustainability
Inflows – Outflows = S Change in GW Storage

Water Budget ResultsEst. Inflows(1988-2015)
Avg. AnnualAc-Ft/Yr
Upland Runoff 145,000
GW Recharge 69,000
Imported SW Deliveries
17,000
Uplands Subsurface Inflow
5,000
Est.Outflows(1988-2015)
Avg. AnnualAc-Ft/Yr
SW Outflow and Baseflow
176,000
Net GW UseNet SW Use
13,00014,000
GW Subsurface Outflow
19,000
Urban Waste-water Outflow
8,000
=
Net Avg. Annual Change in Subbasin Storage ≈ 6,000 Acre-Ft/Yr(uncertainty in individual budget components; italicized more uncertain) 18
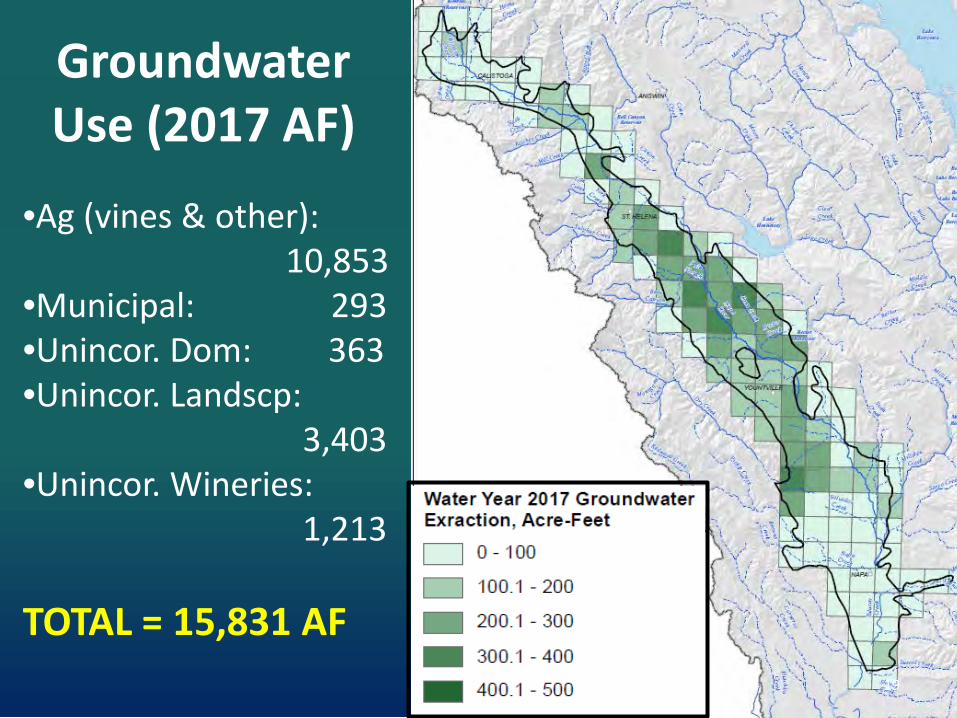
GroundwaterUse (2017 AF)
•Ag (vines & other): 10,853
•Municipal: 293 •Unincor. Dom: 363•Unincor. Landscp:
3,403•Unincor. Wineries:
1,213
TOTAL = 15,831 AF19

Change in Groundwater
Storage• Spr 2016 to Spr 2017:
+4,470 Acre-Feet
• Cumulative 1988 to 2017:+13,702 Acre-Feet;Increase in GW Storage
Napa Valley Subbasin is essentially a “full” basin.
0 to 2acre-feet
20

Groundwater Use and Storage Change
Groundwater Use
DRYDRY DRY
Cumulative Change in GW Storage
21

Sustainable Yield and Related Terms
Sustainable Yield(Definition; Water Code Section 10721(v)):“Maximum quantity of water, calculated over a base period representative of long-term conditions in the basin and including any temporary surplus, that can be withdrawn annually without causing an undesirable result.”
Undesirable ResultA key term linked to accomplishing sustainability.
22

Summary of Groundwater Use and Change in Groundwater Storage
Description Quantity (Acre Feet)Groundwater Extraction 2016 & 2017 17,039 and 15,831 Avg. Annual Recharge (1988-2015) 69,000Sustainable Yield (Estimated Range) 17,000 to 20,0002016 and 2017: Annual Storage Change +6,056 and +4,4701988-2017: Cumulative Storage Change +13,702
…… The County and everyone living and working in the county will integrate stewardship principles and measures in groundwater development, use, and management to protect economic, environmental, and social benefits and maintain groundwater sustainability indefinitely without causing undesirable results, including unacceptable economic, environmental, or social consequences. (Excerpt Napa SGMA Sustainability Goal)
23

Groundwater Sustainability Indicators
Lowering of GW Levels
Reduction of GW Storage
Seawater Intrusion
Water Quality Degradation
Land Subsidence
Depletion of Surface Water
Napa Valley Hydrogeologically Sensitive to this Indicator 24

Minimum Thresholds and Measurable Objectives
• Minimum Threshold (MT)“a numeric value for each sustainability indicator used to define undesirable results” (Sec 351)
• Measurable Objective (MO)“specific, quantifiable goals for the maintenance or improvement of specified groundwater conditions” (Section 351)
Measurable objectives and minimum thresholds are established to ensure GW sustainability or improve GW conditions.
MO
MT
25
(DWR, March 2016)

SGMA Representative Monitoring Sites
• Representative wells to ensure sustainability
• 18 locations• Metrics for each
sustainability indicator, as applicable
26
Ongoing: Other Countywide GWData to be Analyzed, Updated, & Reported(107 wells)
Monitoring Site

Sustainability Indicators: Streamflow
Fire in area
Fire in areaAll above Minimum Threshold
27

Northeast Napa Study
Northeast Napa Study Area
Napa Valley Subbasin
Study and GW Model to Evaluate:• Historical WL declines
local area east ofNapa River
• Mutual well interference• Potential effects
from MST Subarea• Potential effects of
pumping on streamflow
Completed: Sept. 2017
28

Geologic Setting
• Hydrogeologic Conceptualization Napa Valley Subbasin and NE Napa Study Area

NV Subbasin, Northeast Napa Area & MST:Spring 2017
Faults
6N/4W-27L2
NapaCounty-76
NapaCounty-2
30

East
Nap
a Fa
ult Z
one
WEST EAST
WEST EAST
WesternTributaries
EasternTributaries
NapaRiver
RechargeRechargePumping
Pumping
(Not to scale)
Select Average Baseline Water Budget Components (AFY)
125
6453,129
1,308
1,774
7,775712
INFLOW
OUTFLOW

Water Table: Baseline vs. No Pumping
Diff. ~0.048 ftin August
Diff. ~0.057 ftin August
Baseline No Pumping

NE Napa Area: Influence of Water Budget Components on GW-SW Interactions
The small variations between these scenarios indicates the primary role of climate-driven effects.

Report Findings: NE Napa Study Area• Average change in GW storage is about in balance.• Pumping is relatively small part of water budget.• GW discharge into Napa River dominates the GW
budget. Recharge is 2nd largest water budget component.
• Baseline v. No pumping: Very small difference in water table and river stage for wet and dry years (hundredths of a foot)
• Statistical analyses of model recharge, lateral flows and pumping relative to Napa River baseflow show• Climate effects: 87 to 92% of effect on baseflow,• Pumping: 8 to 13% of effect on baseflow.
34

Northeast NapaManagement Area
• 1,960 acres; 4% of NapaValley Subbasin
• Hydrogeologic setting;not typical of overallNapa Valley Subbasin
• Management approaches to ensure continued sustainability in NE Area
• October 2017 Napa BOSsupports NE ManagementArea designation
35
Northeast Management Area

Summary of Recommendations
RECOMMENDATIONS
Management Area
(NE Napa/ East of River)
All Napa Valley
Subbasin
A Add SW/GW Monitoring WellsB Management Area Designation CompletedC Discretionary Projects – Additional
WAA Review (Tier 2)D New Well Tracking in Management
AreaE New Well Pump Testing
(All)(Deeper
formations)
F GW Flow Model DevelopmentG Increase Conservation & Recharge
36

Northeast Napa ManagementArea Amendment
• Amendment to Basin Analysis Report; does not change findings in that Report
• Adds new Northeast Napa Management Area
• Establishes Representative Monitoring Wells in NE Napa Management Area
• Establishes Sustainability Criteria in NE Napa Management Area
37

SGMA Representative
Monitoring Sites Monitoring Site
• 3 Additional Representative Monitoring Wells
• 2 Previously Established SW/GW Sites
38

Northeast Napa Amendment Recommendations
• Incorporates all 7 recommendations from NE Napa Study Report as SGMA Management Actions
• Reflects direction from the Board of Supervisors for updates to the County Groundwater Ordinance- Discretionary project review- Tracking new well construction in Management Area
39

2017 Annual Report: Summary• GW levels stable in majority of wells Napa
Valley Subbasin− Year-to-year declines observed in a few wells
(SE St. Helena area; SW Yountville area; NE Napa area)
− Some response to drought conditions, with subsequent recovery in 2016 and 2017
• GW level declines in MST moderated‒ Some wells stabilized since
2008/2009‒ Some wells stabilized in
more recent years 40

Basin Analysis ReportSGMA Implementation Progress
In addition to 2017 Annual Report, NE Napa Special Study and Amendment to the Basin Analysis Report:• Northeast Napa Management Area Designation• Revised Conditions of Approval for Discretionary Permits• Published Well Owner’s Guide• Do It Yourself (DIY) GW Level Monitoring Program• Napa Valley Subbasin GW Model Dataset Development• Collaborations to Improve Best Available Water Use Data• Coordination with Other Water Management & Planning
Programs– Integrated Regional Water Management Plans– Napa County Watershed Information & Conservation Council
41

Monitoring Well Recruitment
• Areas 1, 2, & 4: Depth Zones; Relatively Shallower Well & Deeper Well
• Areas 3, 5, & 6: Margin of Valley Floor, Mountain Front Recharge
• SW/GW Interaction: NE Napa Area, other sites under consideration SW/GW Priority Areas
Well Recruitment
Areas
Proposed SW/GW
Site

2017 Annual Report: Recommendations• Refine MW Distribution
- Address data gaps- Collaborate with cities & others
• Ongoing WQ Sampling• Improve Data Collection from
Discretionary Permittees• Evaluate Recharge and Water
Conservation Opportunities• Evaluate Groundwater Dependent Ecosystem
Distribution• Groundwater Ordinance Updates
- In response to NE Napa Study & Management Area43
Thank You