naple-final anna x mr - ucl · (italsider, aeritalia, alfaromeo-alfasud, etc.) and a large number...
TRANSCRIPT

14, already 1.09 in 1995, will reach 1.79 in 2020.Because of the differing demographic trends1, the threemajor geographic areas in Italy will remain more or lessstable in terms of total population, but will show verydifferent profiles in terms of age distribution: the Southernpopulation will age more slowly, so that the aging indexwill reach 1.2 in 2020, compared to 2.4 in the Centre and1.9 in the North. The dependency index should thereforebe much lower in the South, where the working-agepopulation will still account for 65% of the total.
Naples numbers third in Italy by population, with 9102inhabitants per km2. It has one of the densest populationin Europe, despite the trends towards an emptying outof the central areas as residents move to outlyingtowns: the Neapolitan hinterland grew by 20% between’61 and ’81 and by 11% in the following decade, whilethe population in the central districts fell by 12% in the‘80s and by a further 6% between 1991 and 1999.Although only a quarter of the population lives in thecentre, about half work there, in addition to the roughly180,000 city users who commute from outlying towns.
Between 1981 and 1996 the birth rate was muchhigher in Naples than in Northern Italy cities and led toa positive growth rate, even if it fell from 6.2% to 3.1%between 1981 and 1996; net migration was negative, -6.4% over the same period. In addition to the counter-urbanization underway, Naples is the least attractive ofthe major cities and, at least until 1988-89, was still feel-ing the negative effects of the terrible earthquake of the
I. INTRODUCTION: THE CITY
A. URBAN CONTEXT
The huge physical and demographic expansion of themajor Italian cities started to slow down in the early ‘70s.Comparison of the 1971 and 1981 Census data show,at first in the North and later in the South, a “deglomer-ative” process, characterized by a drop in the number ofresidents in major cities and the growth of outlyingdistricts.
Residents in the top 12 Italian cities (see Table 1), which made up 18.1% of the Italian populationin 1981, dropped to 15.6% just 15 years later. Thiscounter-urbanization process also affected immigration:of the 860,000 immigrants between 1981 and 1996 just23% settled in the major cities.
As elsewhere in Europe, most of the Italian traditional“100 cities” can no longer be distinguished from thesettlement basin in which they lie and which host alldifferent kinds of activity, even those historically locatedin cities and still considered “central activities”, even iftheir centrality is functional and not spatial. ISTAT,based on the most recent census, aggregated the 8104municipalities into 784 urban systems of this sort.
The Italian birth rate has dropped significantly: from ahigh fertility country, Italy has become the country withthe lowest birth rate in Europe. Since 1993, growth hasbeen negative, compensated by a positive migratorybalance which has guaranteed a tiny overall populationincrease. Demographic predictions are of a stable popu-lation of about 58 million until 2020, with a rapidly agingpopulation: the proportion of those over 65 to those under
The case of
Naples, Italyby Matteo Scaramella
ContactMatteo ScaramellaAbaton S.r.lVia del Monte della Farina 19, Roma I-00186 ItaliaTel. +39 06 6873104Fax. +39 06 6896800E-mail: [email protected]
Sou
rce:
CIA
fact
book

Urban Slums Reports: The case of Naples, Italy
23rd of November 1980. This earthquake killed 53people and injured hundreds, and destroyed muchhousing stock. After 1988, population movement is nolonger towards the nearby periphery but towards othertowns in the province. The population in the area whichthe Campania Region calls the “NeapolitanConurbation” grew by 24% over the 15 year periodabove, compared to 15% in other towns in the province.The higher birth rates seen in some Northern andEastern peripheric quarters, Pianura and Soccavo, andsome central quarters (Montecalvario, Stella, Mercato,Pendino), where the birth rate is double the city aver-age, seem to be due to a higher fertility rate rather thanto the demographic structure of the population.
Throughout the ‘70s, Naples was able to keep astrong industrial presence, thanks to the presence ofnumerous heavy industries, most of them public(Italsider, Aeritalia, Alfaromeo-Alfasud, etc.) and a largenumber of SME’s from many sectors. Naples has beenrapidly deindustrializing over the past 15 years, and thegrowth in the service sector has not been sufficient tocompensate for job losses. SME’s have also not devel-oped much further, probably because of the lack ofadequate infrastructure or services, the presence of anincreasingly bold and aggressive organized crime - aproblem which grew enormously following the publicworks contracts awarded after the earthquake - andbecause of competition of the informal sector.
Key to understanding the deindustrialization process isthe fact that “the Neapolitan industrial system was partic-ularly affected by European Union to reduce iron andsteel production in Europe and its policies protecting faircompetition and thus limiting State aid to industries”2.
Already the number of businesses fell by 11%
between 1971 and 1981, although employment rose by14.7%. The next decade saw Naples lose 36% of itsmanufacturing industries and 27% of its industrialemployment. The only growth sector was constructionwhich, thanks to public works programmes, showed a30% increase in registered employees; unregisteredemployees counted for many more. The service sectoroffered more jobs throughout the ‘70s and ‘80s andstabilized in the ‘90s, but the growth is “is concentratedin less advanced services, i.e. retail commerce andtraditional professional occupations, and in the publicadministration, providing evidence of the difficulties thatthe city has experienced in making the transition towarda service economy”.3 One cannot but notice how unem-ployment rose sharply between 1993 and 1995, whenthe State decided to end its policy of special intervention,closing the legendary Cassa per il Mezzogiorno, onceagain demonstrating how the Southern economy devel-oped overdependent on public funds.
Work opportunities are available above all in the infor-mal sector, if not unregistered or even illegal, yet thebreadth of the informal sector shouldn’t be taken asproof that unemployment is overestimated: “informalwork in Naples is not of the same kind as that found inthe Northeast of Italy. It is unskilled, precarious andpoorly paid. Informal manufacturing activities have trans-formed themselves from traditional crafts – what used tobe an urban subsistence economy – to a sweatshopsystem of production, which is not direct towardsmedium-to-high or innovative sectors of the market, butto residual ones, such as the market for unauthorisedimitations (knock-offs) or second quality goods. In thiscontext, work in the informal economy does not providea substitute for a formal job.”4
Table 1: Socio urbanistic indicators for Italian cities with more than 250,000 inhabitants (1991)
City Residents Density(inhab/km2)
Inhabitant/dwelling
m2 perinhabitant
Averagefamily size
DependencyIndex
Schoolattendance
rate*
Activity rate
Unemploy-ment rate
Rome 2,775,250 1,825 2.7 32.3 2.7 36.6 97.6 43.7 8.9
Milan 1,369,231 7,541 2.4 34.0 2.3 38.2 98.6 44.7 9.5
Naples 1,067,365 9,102 3.4 24.0 3.4 41.8 95.9 39.3 42.7
Turin 962,507 7,394 2.4 32.0 2.3 37.6 98.4 44.7 14.1
Palermo 698,556 4,397 3.2 29.3 3.2 44.7 97.3 37.6 34.8
Genoa 678,771 2,823 2.5 32.6 2.4 44.0 98. 39.9 14.6
Bologna 404,378 2,873 2.4 35.0 2.3 44.9 99.5 45.4 6.5
Florence 403,291 3,938 2.5 35.1 2.4 45.0 98.3 45.5 10.1
Bari 342,309 2,946 3.2 27.8 3.1 38.9 97.9 39. 25.1
Catania 333,075 1,841 3.1 28.7 3.0 46.4 95.5 37.3 33.5
Venice 309,422 676 2.7 32.9 2.6 38.6 98.9 41.842.6 12.1
Verona 255,824 1,285 2.6 35.6 2.5 40.6 99.0 42.6 7.9
Source: Istat, Grandi Comuni, 1994. Our elaboration.* Compulsory schooling (age 6 - 13)
2
kinds of subdivision, but most socio-urbanistic researchis done on the basis of the districts, or on areas whichdo not fit into either classification (e.g., the SpanishQuarters and Sanità). This paper provides data ondistricts, since these better correspond to the slumsidentified. It should be noted that the Naples municipalregisters differ sharply from the census findings; until1981 these differences were not noteworthy, but in 1991reached a difference of 138,647 residents who were notcounted in the census. A chronological series of datashould therefore be considered with some caution.
II. SLUMS AND POVERTY
B EXISTING TYPES OF SLUMS
Research on Naples has, until now, been charac-terised by limited communication between scholars ofsocial issues and scholars of urbanistic aspects; onlyrecently have the two strands started to make contact,thanks to a group of inspired and advancedresearchers.
A recent analysis of Naples5 that takes into accountboth the urbanistic dimension and the socio-economiccondition of the residents has classified the decayingresidential areas into historic residential periphery,recent public city, unauthorised city, new periphery anddecaying central pockets.
1. Historic residential periphery
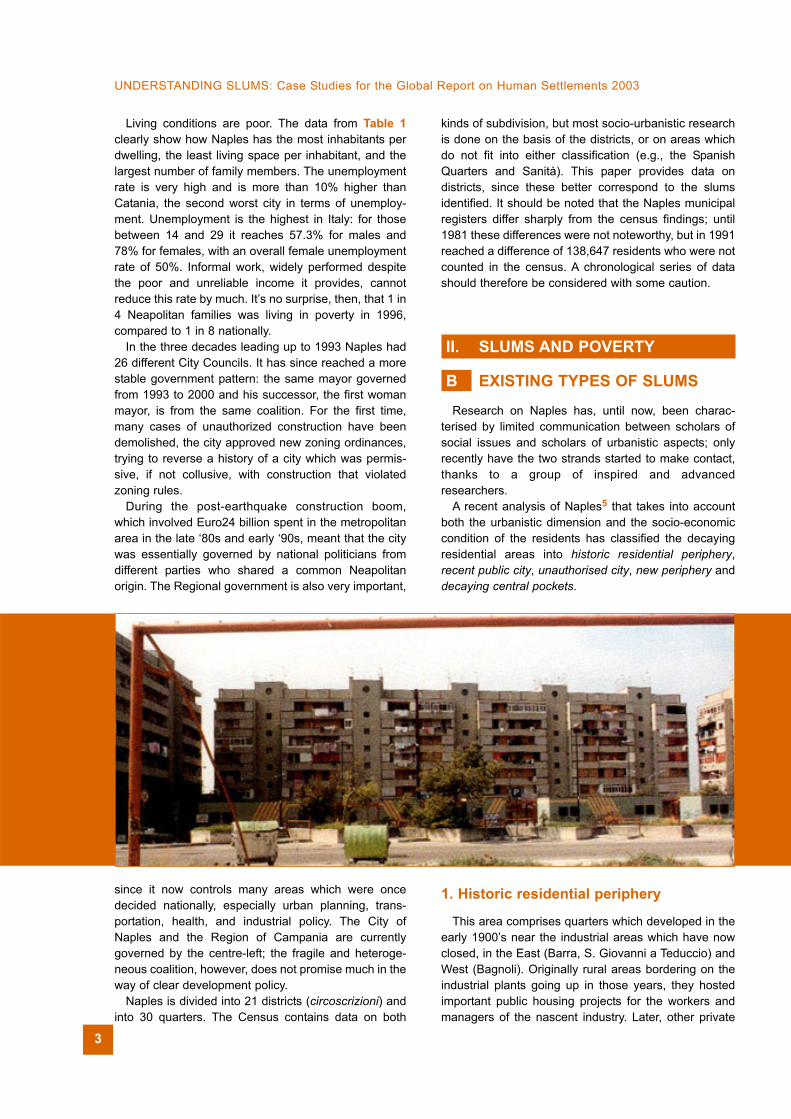
This area comprises quarters which developed in theearly 1900’s near the industrial areas which have nowclosed, in the East (Barra, S. Giovanni a Teduccio) andWest (Bagnoli). Originally rural areas bordering on theindustrial plants going up in those years, they hostedimportant public housing projects for the workers andmanagers of the nascent industry. Later, other private
UNDERSTANDING SLUMS: Case Studies for the Global Report on Human Settlements 2003
Living conditions are poor. The data from Table 1clearly show how Naples has the most inhabitants perdwelling, the least living space per inhabitant, and thelargest number of family members. The unemploymentrate is very high and is more than 10% higher thanCatania, the second worst city in terms of unemploy-ment. Unemployment is the highest in Italy: for thosebetween 14 and 29 it reaches 57.3% for males and78% for females, with an overall female unemploymentrate of 50%. Informal work, widely performed despitethe poor and unreliable income it provides, cannotreduce this rate by much. It’s no surprise, then, that 1 in4 Neapolitan families was living in poverty in 1996,compared to 1 in 8 nationally.
In the three decades leading up to 1993 Naples had26 different City Councils. It has since reached a morestable government pattern: the same mayor governedfrom 1993 to 2000 and his successor, the first womanmayor, is from the same coalition. For the first time,many cases of unauthorized construction have beendemolished, the city approved new zoning ordinances,trying to reverse a history of a city which was permis-sive, if not collusive, with construction that violatedzoning rules.
During the post-earthquake construction boom,which involved Euro24 billion spent in the metropolitanarea in the late ‘80s and early ‘90s, meant that the citywas essentially governed by national politicians fromdifferent parties who shared a common Neapolitanorigin. The Regional government is also very important,
since it now controls many areas which were oncedecided nationally, especially urban planning, trans-portation, health, and industrial policy. The City ofNaples and the Region of Campania are currentlygoverned by the centre-left; the fragile and heteroge-neous coalition, however, does not promise much in theway of clear development policy.
Naples is divided into 21 districts (circoscrizioni) andinto 30 quarters. The Census contains data on both
3

and public housing projects were constructed, such asthose which followed the 1980 earthquake.
Even though the older public housing is in very poorcondition, Bagnoli is considered a desirable areabecause it is close to the sea and to a very good beach,and for its excellent transport links to the centre; sincethe Italsider steel plant, which once employed 12,000people, has been dismantled, the quarter has beenopened to new residential and tourism development. It iscurrently losing its traditional residents, retired workerswhose offspring cannot find work locally, and is awaitingthe start of a long-debated and slow to appear urbanrenewal programme. Its future, however, is one ofgrowth, and property prices have been rising for sometime.
Although the Eastern quarters can also be consideredsemi-central, they are nonetheless perceived and livedas if they were peripheric. Here, too, the older buildingsare in poor condition, while the recent construction is oflow quality. The development of Barra and S. Giovannia Teduccio took place following the creation of industryin the area in 1906; this industrial zone, too close to thecentre, is also now being dismantled, but some of thesmaller businesses remain, amid many abandoned lotsthat have yet to be reused. These two quarters havepublic services of a level expected in the city, thanks tothe post-earthquake public works projects.
Demographically, these areas differ little from thetrend of the entire city, which sees the population agingand moving outwards.
2. Recent Public City
This is made up of two zones planned as part of aprogramme of public housing: Ponticelli in the East andScampia in the North. Entirely made up of public hous-ing, they developed along different lines despite bothhaving been planned in the ‘60s and finished after theearthquake, with additional residential and servicebuildings, and both are currently subject to renewal proj-
ects aimed at transforming them from dormitory quar-ters into normal city neighbourhoods.
These quarters share a bad reputation, both amongtheir residents and all Neapolitans. Socially, the decisionto concentrate large numbers of residents with prob-lems in a single area, depriving them of the social capi-tal they possessed in their original neighbourhoods,turned out to be a serious problem. The “Sails”, hugetwenty-storey housing blocks, turned out to be uninhab-itable and two have already been demolished; theshared spaces have turned out to be abandoned.
The two quarters, and especially Scampia, are poorlylinked to the rest of the city, so that the main problem infinding work, above all for the women, is the distancefrom the centre, where part-time domestic work issought. Organised crime, the Camorra, is deeply rootedin both quarters and opposes any kind of socio-economic development, since this would cause it to loseits grip on the population. The areas are nonethelessgrowing: Scampia grew from 38000 to 44000 inhabi-tants between ’81 and ’91, and Ponticelli from 45,000 to51,700 in the same period.
3. The Unauthorised CityThe best known case of wildcat construction is
Pianura, a neighbourhood which sprung up in the ‘70sand ‘80s, when 5-7 storey buildings were built withoutauthorisation from the city, in an area that the zoningplan had classified as agricultural. They can be calledillegal homes only in the technical sense, since they had
no building permits and violated the zoning plan; theland was legally bought by private developers thatrespected building standards, and were placed on themarket at prices only slightly (15-20%) below the cost oflegal units. With the connivance of the authorities theywere linked to the public water and electric system, andlater to the sewer system. Growth at Pianura is stillstrong – from 38,500 residents in ’81 it rose to 54,000 in’91, with young families, productive (although unde-
Urban Slums Reports: The case of Naples, Italy
4

UNDERSTANDING SLUMS: Case Studies for the Global Report on Human Settlements 2003
clared) businesses, and higher homeownership ratesthan the city average.
Illegal but not informal construction, which charac-terises all of the Pianura neighbourhood, is widespreadoutside the centre of Naples6, even if it is usually limitedto the expansion or construction of single-family homes.There are quite a few areas in the city which appeared“spontaneously”, some of them representing largesettlements, others single episodes, not always and notonly on the edge of the city. An interesting example isCamaldoli, a once-wooded hill, where rapid develop-ment was fuelled by a transit road meant for a largepark but which actually catalysed illegal construction.
The unauthorised city is marked on the one hand bya scarcity or lack of services, and on the other hand bya rich urban landscape which is “both very traditionaland almost experimental (… where) bits of countryside,attempts at suburban sprawl and other successful orfashionable recent residential patterns from differentepochs overlap and stand next to each other (…) anddifferent building types, from the tall building to thesuburban villa, are mixed.”7
4. New peripheryThe most recent metropolitan periphery developed in
the dynamic areas in the Northwest part of the city, andalong the Domitian way, which follows the coastline.These low-density areas, far outside the city centre, arecriss-crossed by highways and covered by unautho-rised housing. The first settlement of this type – devel-oped around the so-called “American Road” in the ‘80sand followed by many other roadways – was sparked bythe placement of a NATO and US Armed Forces basebetween Bagnoli and Pozzuoli. This first population,settled into gated residential enclaves, was followed bythe creation of second homes and later primary resi-dences for those seeking a less urban lifestyle.
Housing generally comprises small or even tinysingle family homes with low-density land use. Thepopulation is mixed and includes farmers and ex-farm-
ers, US or NATO servicemen, the petit bourgeois in thetowns and an upper middle class with American-stylegated communities.
5. Decaying central pocketsSome of the quarters in the historic centre provide
excellent examples of the highly contradictory dimen-sions of Naples. On the one hand there is a very highlevel of decay in terms of housing and social indicators,while at the same time there is a solid urban fabric richin artistic monuments. They lie at the crossroads of themovement patterns in the city, are well linked (both onfoot and using public transportation), have a reasonablelevel of social aggregation and are rich in commercialand small scale artisan businesses, even if these oftenlie at or over the line between the declared and thesubmerged, the legal and the illegal.
These quarters are in crisis because of the ageing ofthe population and the high risk for exclusion due topoor performance along certain parameters, includingeducational level, truancy rates, job qualifications, safehousing and home ownership.
The inner peripheric pockets can be divided into thehistoric centre quarters in serious decline, such asSanità and Mercato Pendino, and those which are recov-ering, such as the Spanish Quarters, which, duringBassolino’s first term as mayor (1993-1997), weresubject to many renewal programmes, of which the ECfinanced Urban programme is one of the most important.The Mercato Pendino neighbourhood, on the otherhand, is the central zone where conditions most continueto worsen. The Spanish Quarters, created during the1500’s to house the Spanish troops, are currently asolidly structured quarter from an urbanistic point of view,although they lack basic facilities, and the buildings arein advanced states of decay, worsened further by the1980 earthquake. In this area, just as in other parts of thecity, a slow and gradual exodus has been taking place,accompanied by an ageing of the population, whichcontributed to the emargination of the zone.
Buildings in NapoliScampia
5

Urban Slums Reports: The case of Naples, Italy
The most vulnerable segments of the population (thevery young and the elderly) now meet in a zone wherethe socio-economic fabric is deeply damaged, with ahigh density of inhabitants, underuse of the housingstock (high rates of vacancy), crumbling apartmentsand buildings. These quarters are further marked bylow rates of home ownership, high truancy rates, loweducational and professional qualifications, high unem-ployment and a high dependency ratio, undeclared andillegal work, and petty crime and juvenile delinquency.The high “risk of exclusion” is added to a certain pres-ence of commercial and artisan activity which are oftenundeclared and discontinuous. On the other hand, theSanità area - affected by the Urban programmetogether with the Spanish Quarters - which lies in theStella-S. Carlo Arena district, is physically moremarginal, and the society is more closed than in theSpanish Quarters. Built during the 1600’s in the Vergininucleus, it has always been on the edge of the historiccentre, a collocation aggravated by the construction ofthe route to the Capodimonte palace, which passesover the neighbourhood on a bridge. For this zone aswell, the main socio-economic variables, similar tothose of the Spanish Quarters, indicate impoverishmentand increasing marginalisation.
Both areas are characterized by physical and socialdecay and poor reputation, yet are quite differentmorphologically, for the role they have in the popularimagination and in their chances for development; thetwo have particularly low educational achievementlevels, very high unemployment, low labour marketactivity with evident cases of discouragement of job-seekers; indicators of housing quality and environmen-tal quality provide further evidence of the state of decaywhich dominates in these areas.
C. OFFICIAL DEFINITIONS OF SLUMS
As in most European cities, the term “slum” can beused in Naples to describe a habitat where housingmaintenance is poor, where secondary city services(health, education, social and cultural facilities) arelacking, where incomes are low and social indicatorsare clearly below the city average. Except for the sixgypsy camps on the edge of the city, there are no casesof informal housing built with precarious materials, norare there areas in which the number of homes withoutpublicly provided services is significant.
Some factors, especially illegal building, which areelsewhere associated with slums, are actually associ-ated with middle class neighbourhoods in Naples.Another typical characteristic of the Neapolitan case isthe mix of social classes and incomes in those quarterswhich developed before the second world war.
Historic quarters of Naples
6

Historically, stratification was horizontal, with the nobilityor wealthy at the first floor – the noble floor – and lesswealthy tenants at the second and third floor, artisans,workers and servants on the upper floors, in the atticsand on the ground floor, which opened onto the court-yard and the street. The latter is typical of the centralquarters of Naples: the “basso” is a ground floordwelling with a door onto the street which serves as theonly source of air and light. Usually there is just oneroom, often divided to create a kitchen and bathroom,and sometimes a mezzanine creates a second room.Terribly unhealthy, the “bassi” have been defined as“spaces not to be used as dwellings” since the MasterPlans of the early 1900’s; nonetheless, there are stillmany of them in the central area. It was precisely thissocial mix that led the English ambassador in the mid-1800’s to call Naples “the only Arab city without aEuropean quarter.”
Early industrialisation and the consequent rise ofzoning in modern urban planning led to a functionalseparation of the urban areas, including residentialareas. Later, with the reconstruction that followed thewar, with public building programmes, with the specialfund for reconstruction after the 1980 earthquake, units inthe new projects were assigned according to the needi-ness of the applicants, creating quarters largely inhabitedby low-income people and those who were least inte-grated into society. The Rione Traiano zone is one of theclearest examples from the ‘60s; it has been followed bythe glaring case of Scampia, where some buildings havealready been demolished less than 20 years after theywere built. In both quarters organised crime almostcompletely controls the neighbourhood, not because thepoor are prone to crime, but because the lack of socialcohesion makes it difficult to combat the infiltration of ille-gal activity (mostly drug and arms trafficking).
No official definition of slum can be found, nor ofspecific decaying areas, even if the debate over thisquestion has been raging for the past century in Naples.In 1865, also following the Haussman’s experience inParis, a Renewal operation ("Risanamento") waslaunched, opening up the central areas following acholera epidemic, and “urban reclamation” later becamea recurrent phrase in city urban planning, but it affectedall of the city centre and all of the social classes wholived there.
D . UNOFFICIAL DEFINITIONS OF SLUMS
The popular perception of a slum or marginal area isquite different, and always refers to a collective andspatial dimension: Neapolitans see as a slum any urbanarea from which “gentlemen”, or the middle class on up,have disappeared, where there are no collective spacesanimated by trade and services. Housing quality doesnot seem to be important in this perception, while acertain consideration is given to the time and meansneeded to get to the centre. This perception coincidesperfectly with that of the middle class, which howeveralso defines a slum in terms of housing quality (light andair, size), giving this latter consideration more weight.
There is not data on the income of slum inhabitants,while there are fairly reliable figures for the social,employment and crime situation. The sectoral nature ofpolicies supporting the vulnerable social segments,largely implemented by national structures through vari-ous ministries, does not allow for data to be comparedeven for the same zone. The increase in the number ofinterventions conducted by NGO’s has led to greaterknowledge of the situation but there has been nocentralisation that might help to share data. The outlook
UNDERSTANDING SLUMS: Case Studies for the Global Report on Human Settlements 2003
Table 2: Relative and absolute povertythresholds (2000), Euro/month
Family size
Threshold of relative
poverty
Threshold of absolute
poverty
1 486.1 363,5
2(standard measure)
810.2 544,9
3 1,077.6 980,1
4 1,320.6 774,0
5 1,539.4 1,235.3
6 1,724.2 1,423.8
7 1,944.5 1,606.7
Source: Istat, 2001A barren street in the district of Scampia
7

seem better for the future, even the immediate future,thanks to the Local Social Plans and to other measuresrequired by the framework law for the creation of anintegrated system of intervention and social services(Act 328/200).
The need to choose certain cases of slums meantcross analysing data on housing stock and on employ-ment with socio-economic data with the perception ofNeapolitans, including those who live in such areas. Thezones identified are Stella-San Carlo Arena, Scampia,Ponticelli and Barra. The first lies in the historic centreof the city (category 5 from Chapter B), Scampia is arecently built public housing neighbourhood (category 2in Chapter B) like Ponticelli, which is older, while Barrais part of the historic residential periphery (category 1 inChapter B). Detailed figures for these quarters areprovided in Chapter H.
E. OFFICIAL DEFINITIONS OF POVERTY
Support actions for the vulnerable segments of theItalian population, at least from the public standpoint, arelaunched at a national, regional and municipal level,through action by the ASL (health district), which is partof the National Health Service. There are different defini-tions of poverty, not always in agreement, at each level.
They are generally based on at least two dimensions:
1. the basic criteria according to which certain people isentitled to receive certain benefits, such as access topublic housing, income support, priority access topublic services, total or partial exemption from healthservice copayments, etc.
2. basic indicators for determining the social compositionin certain urban areas, in order to conduct socialresearch or to create special services or measures,such as opening family assistance services, job orienta-tion services, or drug addiction treatment facilities, etc.
As far as the first category is concerned, the NationalCommission on Social Exclusion of the Prime Minister’sOffice defines as poor those who consume less thanhalf the average Italian consumption rate: the absolutepoverty line is a monetary line based on an index ofgoods and services which are necessary for a family ofa certain size to live at a “socially acceptable” level.Poor families are those whose monthly purchases areat or below the value of the index. By this definition, 2.6million Italian families are poor, for a total of 7.5 millionpeople, or 13% of the population. Along with theconcept of absolute poverty there is also standard rela-tive poverty: for a two-person family, poverty is whenmonthly expenses are less than half the averageexpenses per person. In 2000, the average monthlyexpenditure per capita was € 810.21. The coefficientvaries according to family size.
There are substantial local differences, with most ofthe poor families (66%) and most of the poor individualsliving in the South. Poverty affects mostly single elderlypeople in the North and mostly large families in theSouth. Unfortunately, the risk of sliding into poverty isgrowing even for the families of employed workers,since monthly income is not enough to meet familyneeds, and for the more recent family structures, espe-cially single parent families, and even more so when thehead of household is a woman.
A broader definition of the concept of poverty is that ofthe “vulnerable segments” which takes non-economicvariables into account. The National Health Plan for1998-2000 defines vulnerable persons to be those “whodo not have sufficient social skills and who often bearcomplex needs which require the health system tounderstand their problems and to act accordingly toaddress them. They are those who, when needy, faceespecially difficult situations and are forced into forms ofchronic dependence on assistance,” which is in line withthe indications and objectives of the WHO and of theEuropean Union.
Urban Slums Reports: The case of Naples, Italy
Buildings inPonticelli
8

The Welfare Ministry’s social policy department, indefining its national anti-poverty policy, set the thresholdfor minimum income below which access to servicesand assistance such as minimum pension, welfarepayments, maternity payments, large family contribu-tions, RMI (minimum wage insertion), partial or totalexemption from health copayments. These thresholdsare corrected through the use of scales of equivalencyconsidering the characteristics of the family. Children,single parent families, and disabled family members areconsidered as aggravants (some benefits are availableonly to families with three or more children).
The Report to the Commission of Research on SocialExclusion at the Ministry of Welfare, conducted by theUniversity of Padua, underlines how, in general, there isno coherent and systematic approach to poverty, both indefinition and in policy, which often ends up benefitingpart of the population which is not actually impoverished.
According to this study, the Italian welfare system ishighly selective, weak and secondary compared to thatoffered by the family and by the market, and employ-
ment is the dominant requisite in determining the right tosocial protection measures. The result is to favour theelderly and the employed, or the ex-employed, ratherthan young people, the unemployed and women. “Theabsence of an organic system of national policies cover-ing the many risks and types of poverty creates forms ofinternal inequality within the welfare system (…); ourwelfare system is still confused between insurance andassistance: most of what is being offered depends on
the pension payments made by the applicant. Yetpoverty is closely tied to employment exclusion anddiscontinuity, so that many of those who have economicproblems are automatically excluded from benefitingfrom contributions.”8
At least until RMI was introduced at the national level(even if only in 39 cities), anti-poverty measures variedenormously in terms of how they identified beneficiaries,the duration of support and the means of intervention,which meant that Italy has not been able to comply withthe 1992 European recommendation (1992) concerningthe need to guarantee all citizens a minimum level ofresources and benefits sufficient to live with respect fortheir human dignity.9
The new context provided by the framework law forthe creation of an integrated system of intervention andsocial services (Act 328/200) affirms the concept of“vertical subsidiariety” attributing greater responsibilityto cities, which can then better match data and sectoralindicators to the areas from which they are taken.
From the analysis of the benefits provided in nationallegislation we can identify the categories of beneficiariescorresponding to the different conditions of need: theelderly, families, the disabled, and, only as a final cate-gory, economic vulnerability. Within these categories, anti-poverty policies include means to select those who meetthe official definition – still differing – of the vulnerable orpoor. For almost all assistance benefits, there is a base-line income above which no poverty risk is considered.
UNDERSTANDING SLUMS: Case Studies for the Global Report on Human Settlements 2003
Internal courtyardand to the right,
view of dwellings inthe historical
quarters of Naples;
9

F. UNOFFICIAL DEFINITIONS OF POVERTY
Sociological research on poverty, just like local needsanalysis in order to plan anti-poverty policy, are basedon a battery of indicators which can be called “classic”,in terms of their consideration of immaterial componentssuch as social networks, both at the family and at thecommunity level.
The Socio-economic category of indicators includesincome, the number of dependent children, labour forceparticipation rate, unemployment rate, especially youthand female unemployment, literacy and school achieve-ment, secondary school enrolment, drop out rate, rateof “distance from employment excellence” or thepercentage in low-qualification jobs, drug use, crimerates.
Immaterial components in Naples include the impor-tant indicator of informal work, which is hard to measurebut of great importance in the local context. In addition,other factors such as the rootedness in a solid social
network, which is centred on the family – which is oftenextended in the South – but can also be in a broadercommunity context, and access to public and NGO orreligious institute assistance and benefits.
G. SOCIO-URBANISTIC INDICATIORS OF CITY SLUM
The population decline in Naples between 1981 and1991 was particularly sharp, especially in the historiccentre areas (especially Pendino, Porto and Vicaria),and with the exception of the Scampia, S. Pietro,Pianura, Chiaiano and Ponticelli neighborhoods. Withinthe former central areas, the decay of the ancient hous-ing stock has allowed low-income classes to stay inprivate homes, while those with the means to leavepreferred to go elsewhere. In the latter case, the smallerdrop in population can be explained by the low incomeof the residents of these quarters; in fact, the exodusfrom the city mostly involved young middle class whitecollar families and stably employed blue collar families,and was most evident in middle-class, central and hill-top residential neighborhoods.
As an analysis by the City of Naples10 shows, inFebruary 2001 there were 1.072.890 registered inhabi-tants, which can be compared with census data from1991, although with some caveats11, indicating a stable
population with a growth rate of just0.52%. Looking at the figures bydistrict, the trends of the previousdecade appear to have beenreversed: in Scampia the populationdropped sharply (-11.7%), and to alesser degree in Barra and San Carloall’Arena (-4.3 and -4%). In themunicipal areas of the Northernperiphery, especially Chiaiano,Piscinola and Scampia (district 48),and in the Western area, the aging ofthe population is less evident. Thepopulation over 65 is 15.5% in Naples(less than the 18% Italian average,although it has risen from 12% in1991) and is just 10.8% of the popu-lation in the Scampia district.
If Naples is among the Italian citieswith the youngest populations, quar-ters with more elderly than averagecan by found in the North and East(including Scampia, Barra, S.Giovanni, and Ponticelli). Overall,slum areas have a higher birth ratethan the city average (12%), including
the historic centre, where the percentage of minors is15.2% (Table 3). The gender breakdown of the slumsmirrors that of the city, where females slightly predomi-nate at 52% of the population. Overall, 24% of city resi-dents live in the slum quarters. Nonetheless, even if theindicators for housing, for socio-economic conditionsand poverty allow Scampia, Stella – San Carloall’Arena, the Spanish Quarters, Barra and Ponticelli tobe defined as slums, in a city such as Naples theconcept of ghetto (a completely decayed and impover-
Urban Slums Reports: The case of Naples, Italy
10
ished neighborhood with homogeneous social makeupin terms of income and profession) is not an appropriateone to describe the identified slum areas12.
Each of the areas named contains different situations,the relationship between exclusion and poverty andrelative wealth varies from one quarter to the next: theSpanish Quarters, for example, are being renewed andthere are residents who are decidedly not low-income.In Scampia, on the other hand, although there aremiddle class families present, a great majority of fami-lies are on or below the poverty line: a research onScampia shows how among families with more than 4members the poverty rate is over 90%. Poverty, oftendeep poverty, can even be found in areas which are notincluded among the slums listed, although such casesare not the majority.
Housing is comprised entirely of permanent buildings,even in the most decaying parts of the city, with the singleexception of the gypsy encampment at Secondigliano,where trailers and other barracks are used.
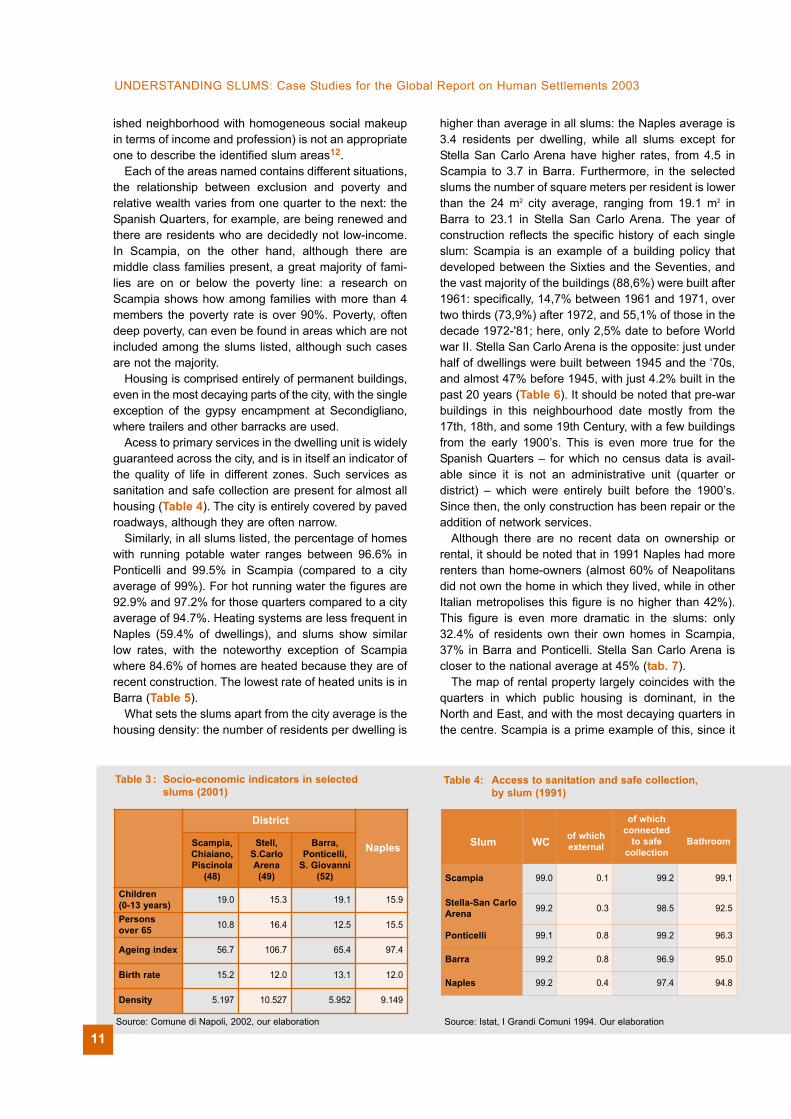
Acess to primary services in the dwelling unit is widelyguaranteed across the city, and is in itself an indicator ofthe quality of life in different zones. Such services assanitation and safe collection are present for almost allhousing (Table 4). The city is entirely covered by pavedroadways, although they are often narrow.
Similarly, in all slums listed, the percentage of homeswith running potable water ranges between 96.6% inPonticelli and 99.5% in Scampia (compared to a cityaverage of 99%). For hot running water the figures are92.9% and 97.2% for those quarters compared to a cityaverage of 94.7%. Heating systems are less frequent inNaples (59.4% of dwellings), and slums show similarlow rates, with the noteworthy exception of Scampiawhere 84.6% of homes are heated because they are ofrecent construction. The lowest rate of heated units is inBarra (Table 5).
What sets the slums apart from the city average is thehousing density: the number of residents per dwelling is
higher than average in all slums: the Naples average is3.4 residents per dwelling, while all slums except forStella San Carlo Arena have higher rates, from 4.5 inScampia to 3.7 in Barra. Furthermore, in the selectedslums the number of square meters per resident is lowerthan the 24 m2 city average, ranging from 19.1 m2 inBarra to 23.1 in Stella San Carlo Arena. The year ofconstruction reflects the specific history of each singleslum: Scampia is an example of a building policy thatdeveloped between the Sixties and the Seventies, andthe vast majority of the buildings (88,6%) were built after1961: specifically, 14,7% between 1961 and 1971, overtwo thirds (73,9%) after 1972, and 55,1% of those in thedecade 1972-'81; here, only 2,5% date to before Worldwar II. Stella San Carlo Arena is the opposite: just underhalf of dwellings were built between 1945 and the ‘70s,and almost 47% before 1945, with just 4.2% built in thepast 20 years (Table 6). It should be noted that pre-warbuildings in this neighbourhood date mostly from the17th, 18th, and some 19th Century, with a few buildingsfrom the early 1900’s. This is even more true for theSpanish Quarters – for which no census data is avail-able since it is not an administrative unit (quarter ordistrict) – which were entirely built before the 1900’s.Since then, the only construction has been repair or theaddition of network services.
Although there are no recent data on ownership orrental, it should be noted that in 1991 Naples had morerenters than home-owners (almost 60% of Neapolitansdid not own the home in which they lived, while in otherItalian metropolises this figure is no higher than 42%).This figure is even more dramatic in the slums: only32.4% of residents own their own homes in Scampia,37% in Barra and Ponticelli. Stella San Carlo Arena iscloser to the national average at 45% (tab. 7).
The map of rental property largely coincides with thequarters in which public housing is dominant, in theNorth and East, and with the most decaying quarters inthe centre. Scampia is a prime example of this, since it
UNDERSTANDING SLUMS: Case Studies for the Global Report on Human Settlements 2003
Table 3 : Socio-economic indicators in selected slums (2001)
District
NaplesScampia,Chiaiano,Piscinola
(48)
Stell,S.Carlo Arena (49)
Barra,Ponticelli,
S. Giovanni (52)
Children (0-13 years) 19.0 15.3 19.1 15.9
Persons over 65 10.8 16.4 12.5 15.5
Ageing index 56.7 106.7 65.4 97.4
Birth rate 15.2 12.0 13.1 12.0
Density 5.197 10.527 5.952 9.149
Source: Comune di Napoli, 2002, our elaboration
Table 4: Access to sanitation and safe collection, by slum (1991)
Slum WC of whichexternal
of whichconnected
to safe collection
Bathroom
Scampia 99.0 0.1 99.2 99.1
Stella-San CarloArena 99.2 0.3 98.5 92.5
Ponticelli 99.1 0.8 99.2 96.3
Barra 99.2 0.8 96.9 95.0
Naples 99.2 0.4 97.4 94.8
Source: Istat, I Grandi Comuni 1994. Our elaboration
11

is made up mostly of public housing. Stella San CarloArena, on the other hand, is closer to the average, sinceit is a more integrated city district, in which an area suchas the Sanità neighborhood, notoriously decayed, existsalongside other less poor ideas.
II. OVERALL POVERTY INDICATORS
It is difficult to get an overall vision of poverty inNaples, since the data on poverty, life style andconsumption are never broken down by subunits of thecity. The most detailed studies on income and consump-tion have been done by retail associations for marketing
purposes. In addition to being by definition of little use,they are also dated, since the Italian law governing theprivacy of personal data, passed in 1996, has made itdifficult to collect data of this type.
The Local Social Plan developed by the City ofNaples represents the main document from which totake data in order to understand the dimensions anddistribution of poverty and malaise. It is based on thedistricts, or basic local units, which reflect subdivisionsof the local Health Authority. The districts examined arenumber 48, which includes Scampia, Piscinola andChiaiano, number 49, which covers Stella - San CarloArena, and 52, which covers Ponticelli and Barra alongwith San Giovanni a Teduccio.
The most direct indicators of poverty are those that
Urban Slums Reports: The case of Naples, Italy
Street in the oldquarters ofNaples
SlumPotable
tap waterHeating system
Hot water
v.a. % v.a. % v.a. %
Scampia 9,676 99.5 8,230 84.6 9,453 97.2
Stella-SanCarlo Arena 32,913 99.3 17,541 52.9 31,128 93.9
Ponticelli 12,950 96.6 9,169 68.4 12,445 92.9
Barra 10,812 97.4 5,075 45.7 10,492 94.5
Naples 308,751 99.0 185,199 59.4 295,281 94.7
Source: Istat, I Grandi Comuni 1994. Our elaboration
Table 5: Access to potable running water, heating system and hot running water, by slum (1991)
SlumYear of construction Average
size (m2)
Rooms /
dwelling
inhabi-tants /
dwellingm2 /
residentBefore1945
1946 /1971
1972 /1991
Scampia 2.5 23.6 79.3 89.9 4.8 4.5 19.9
Stella-SanCarlo Arena 46.8 49.0 4.2 76.5 3.8 3.3 23.1
Ponticelli 13.3 40.9 45.4 77.5 3.9 3.8 20.2
Barra 21.7 53.2 25.1 71.4 3.6 3.7 19.1
Naples 34.4 50.2 15.4 81.7 4.0 3.4 24.0
Table 6 Indicators on houses, by slum (1991)
Source: Istat, Grandi Comuni, 1994. Our elaboration
12

(53%), between 25 and 50 (66%), and men (85%). 40%are unemployed, 17% have lost their job and 40% havea very small income from occasional or undeclared jobs.
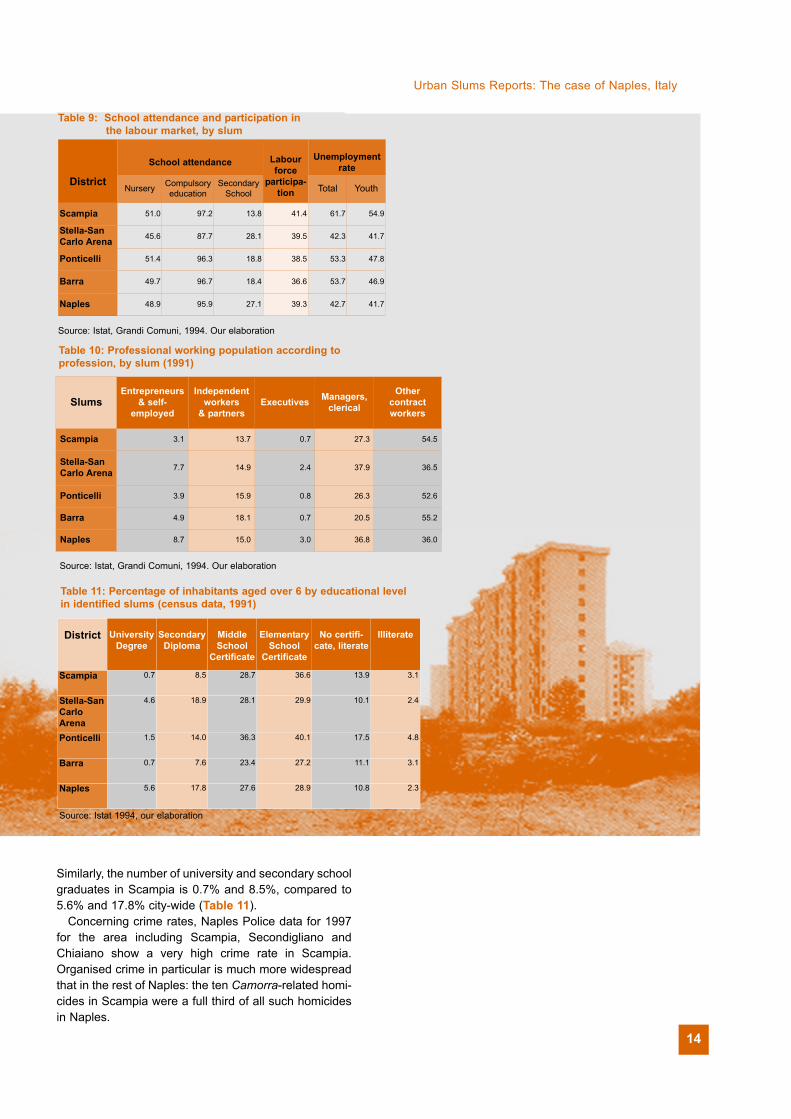
In terms of unemployment and exclusion from thelabour market, Naples leads the country with 42.7% ofthe labour force inactive. This is particularly serious foryoung people; further, women make up 48.4% of theregistered unemployed. Unemployment, however,varies according to the single neighbourhoods. Some,such as the North-East periphery, are hit badly; thedormitory quarters such as Scampia, Miano andPiscinola offer few work opportunities, while others suchas S. Giovanni, Barra and Ponticelli suffer from a de-industrialization process that has not provided any alter-native development. Other areas with high unemploy-ment rates are the central quarters (Stella-S.Carlo,Mercato, Pendino), where the absence of jobs is relatedto the disappearance of artisan and manufacturingactivity and to their migration to areas outside the citylimits. Overall, as shown in Table 9, all the slums – withScampia at one extreme and Stella at the other – havehigher than average unemployment, both in general andfor youth.
The social composition of the slums can be found inthe professional profile of inhabitants. In Naples, 8.7%of the population are professionals or entrepreneurs, yetjust 3.1% of residents in Scampia, where clerical work-ers make up 56% of the population compared to 36%city-wide (Table 10). It is widely held that unemploymentfigures should be adjusted to account for undeclaredemployment. Nonetheless, field work has not revealedmuch in the way of employment opportunities in additionto those declared, and, except for criminal activity, infor-mal work is usually discontinuous and cannot becompared to regular employment, nor considered astepping stone towards a normal job.
The school attendance rate and the educational levelprovide some idea of the gap between the slums identi-fied and the rest of the city, except for Stella, which iscloser to the average: in Naples, 27.1% of potentialstudents attend secondary school, and only 13.8% inScampia, and about 18% in Barra and Ponticelli.
can be found in the City of Naples records of requestsfor minimum wage support (RMI), divided into localsubdistricts. This data cannot alone be considered suffi-cient to define the distribution of poverty in the metropol-itan area, and must be crossed with indicators such asschool attendance, employment and unemployment,mental illness and drug addiction, and especially familystructure. It has been found, in fact, in both specialsurveys and from an analysis of applications for RMI,that poverty is essentially associated with large families,as well as unemployment, rather than other specialconditions of neediness (presence of disabled, handi-capped or ill persons). Among families applying for RMI,more than half (56.5%) include at least one child and12.7% have 3 or more children.
RMI applications come most of all from Barra,Ponticelli and S. Giovanni (district 52), followed bySecondigliano, Miano and S. Pietro a Patierno (district50), the historic centre (district 51) and Soccavo -Pianura (district 46).
The 1991 census showed Naples to be the Italian citywith the highest average number of family members(3.4), with the highest rate of large families (23.7%,almost six times higher than in the Northern cities ofTurin, Milan and Bologna). In 2001, in the slums identi-fied, data on family size and structure clearly show thatthese are areas at risk, in terms of the above criteria:large families, in fact, are most prevalent in the Northern(Scampia, Piscinola, Chiaiano) and in the Eastern(Barra, Ponticelli, S. Giovanni, Miano, S. Pietro) quar-ters. In Naples, an average of 13% of families have 2-4 members, and 1.8% more than 6, compared to figuresof 24.3% and 7.1% in Scampia (Table 8).
The Neapolitan Emergency Social InterventionService recently counted about 1600 homeless peoplein Naples, who represent the most extreme stratum ofpoverty and exclusion. This population, by definition,cannot be assigned to any single area of the city, but itis well known that they are concentrated around themain stations, especially Piazza Garibaldi and CampiFlegrei (in the Northwest of the city). A survey of 150homeless people found that they are mostly Italian
UNDERSTANDING SLUMS: Case Studies for the Global Report on Human Settlements 2003
SlumRental Ownership Other Total
%v.a. % v.a. % v.a. %
Scampia 6.193 63,7 3.152 32,4 378 3,9 100,0
Stella-SanCarlo Arena 17.014 51,3 14.922 45,0 1.224 3,7 100,0
Ponticelli 7.428 55,4 4.971 37,1 1.004 7,5 100,0
Barra 6.151 55,4 4.151 37,4 795 7,2 100,0
Naples 159.236 51,1 138.330 44,4 14.165 4,5 100,0
Table 7: Secure tenure, by slum (1991)
Source: Istat, 1991. Our elaboration
Table 8: Household size, by slum (2001)
Slums1 member 2/4
members5/6
members6 or moremembers
v.a. % v.a. % v.a. % v.a. %
Scampia 1.270 12,3 5.842 56,4 2.514 24,3 732 7,1
Stella - S.Carlo Arena 10.581 26,9 23.892 60,7 4.414 11,2 492 1,2
Barra 2.403 19,4 7.506 60,4 2.208 17,8 301 2,4
Ponticelli 2.545 15,5 9.980 60,6 3.407 20,7 539 3,3
Naples 93.844 25,4 221.374 59,8 47.926 13,0 6.810 1,8
Source: Comune di Napoli 2002. Our elaboration
13
Urban Slums Reports: The case of Naples, Italy
Similarly, the number of university and secondary schoolgraduates in Scampia is 0.7% and 8.5%, compared to5.6% and 17.8% city-wide (Table 11).
Concerning crime rates, Naples Police data for 1997for the area including Scampia, Secondigliano andChiaiano show a very high crime rate in Scampia.Organised crime in particular is much more widespreadthat in the rest of Naples: the ten Camorra-related homi-cides in Scampia were a full third of all such homicidesin Naples.
Table 11: Percentage of inhabitants aged over 6 by educational levelin identified slums (census data, 1991)
District UniversityDegree
SecondaryDiploma
MiddleSchool
Certificate
ElementarySchool
Certificate
No certifi-cate, literate
Illiterate
Scampia 0.7 8.5 28.7 36.6 13.9 3.1
Stella-SanCarloArena
4.6 18.9 28.1 29.9 10.1 2.4
Ponticelli 1.5 14.0 36.3 40.1 17.5 4.8
Barra 0.7 7.6 23.4 27.2 11.1 3.1
Naples 5.6 17.8 27.6 28.9 10.8 2.3
Source: Istat 1994, our elaboration
District
School attendance Labourforce
participa-tion
Unemploymentrate
Nursery Compulsoryeducation
SecondarySchool Total Youth
Scampia 51.0 97.2 13.8 41.4 61.7 54.9
Stella-SanCarlo Arena 45.6 87.7 28.1 39.5 42.3 41.7
Ponticelli 51.4 96.3 18.8 38.5 53.3 47.8
Barra 49.7 96.7 18.4 36.6 53.7 46.9
Naples 48.9 95.9 27.1 39.3 42.7 41.7
Table 9: School attendance and participation in the labour market, by slum
Source: Istat, Grandi Comuni, 1994. Our elaboration
Table 10: Professional working population according toprofession, by slum (1991)
SlumsEntrepreneurs
& self-employed
Independentworkers
& partnersExecutives Managers,
clerical
Other contract workers
Scampia 3.1 13.7 0.7 27.3 54.5
Stella-SanCarlo Arena 7.7 14.9 2.4 37.9 36.5
Ponticelli 3.9 15.9 0.8 26.3 52.6
Barra 4.9 18.1 0.7 20.5 55.2
Naples 8.7 15.0 3.0 36.8 36.0
Source: Istat, Grandi Comuni, 1994. Our elaboration
14
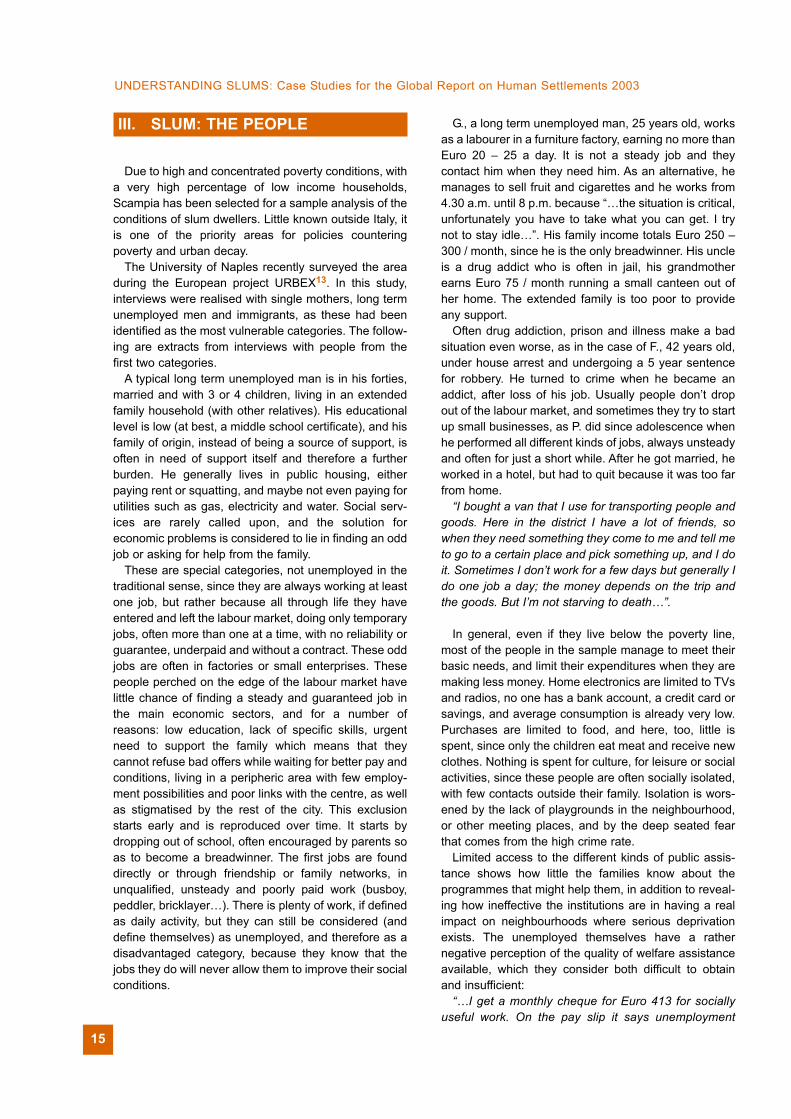
III. SLUM: THE PEOPLE
Due to high and concentrated poverty conditions, witha very high percentage of low income households,Scampia has been selected for a sample analysis of theconditions of slum dwellers. Little known outside Italy, itis one of the priority areas for policies counteringpoverty and urban decay.
The University of Naples recently surveyed the areaduring the European project URBEX13. In this study,interviews were realised with single mothers, long termunemployed men and immigrants, as these had beenidentified as the most vulnerable categories. The follow-ing are extracts from interviews with people from thefirst two categories.
A typical long term unemployed man is in his forties,married and with 3 or 4 children, living in an extendedfamily household (with other relatives). His educationallevel is low (at best, a middle school certificate), and hisfamily of origin, instead of being a source of support, isoften in need of support itself and therefore a furtherburden. He generally lives in public housing, eitherpaying rent or squatting, and maybe not even paying forutilities such as gas, electricity and water. Social serv-ices are rarely called upon, and the solution foreconomic problems is considered to lie in finding an oddjob or asking for help from the family.
These are special categories, not unemployed in thetraditional sense, since they are always working at leastone job, but rather because all through life they haveentered and left the labour market, doing only temporaryjobs, often more than one at a time, with no reliability orguarantee, underpaid and without a contract. These oddjobs are often in factories or small enterprises. Thesepeople perched on the edge of the labour market havelittle chance of finding a steady and guaranteed job inthe main economic sectors, and for a number ofreasons: low education, lack of specific skills, urgentneed to support the family which means that theycannot refuse bad offers while waiting for better pay andconditions, living in a peripheric area with few employ-ment possibilities and poor links with the centre, as wellas stigmatised by the rest of the city. This exclusionstarts early and is reproduced over time. It starts bydropping out of school, often encouraged by parents soas to become a breadwinner. The first jobs are founddirectly or through friendship or family networks, inunqualified, unsteady and poorly paid work (busboy,peddler, bricklayer…). There is plenty of work, if definedas daily activity, but they can still be considered (anddefine themselves) as unemployed, and therefore as adisadvantaged category, because they know that thejobs they do will never allow them to improve their socialconditions.
G., a long term unemployed man, 25 years old, worksas a labourer in a furniture factory, earning no more thanEuro 20 – 25 a day. It is not a steady job and theycontact him when they need him. As an alternative, hemanages to sell fruit and cigarettes and he works from4.30 a.m. until 8 p.m. because “…the situation is critical,unfortunately you have to take what you can get. I trynot to stay idle…”. His family income totals Euro 250 –300 / month, since he is the only breadwinner. His uncleis a drug addict who is often in jail, his grandmotherearns Euro 75 / month running a small canteen out ofher home. The extended family is too poor to provideany support.
Often drug addiction, prison and illness make a badsituation even worse, as in the case of F., 42 years old,under house arrest and undergoing a 5 year sentencefor robbery. He turned to crime when he became anaddict, after loss of his job. Usually people don’t dropout of the labour market, and sometimes they try to startup small businesses, as P. did since adolescence whenhe performed all different kinds of jobs, always unsteadyand often for just a short while. After he got married, heworked in a hotel, but had to quit because it was too farfrom home.
“I bought a van that I use for transporting people andgoods. Here in the district I have a lot of friends, sowhen they need something they come to me and tell meto go to a certain place and pick something up, and I doit. Sometimes I don’t work for a few days but generally Ido one job a day; the money depends on the trip andthe goods. But I’m not starving to death…”.
In general, even if they live below the poverty line,most of the people in the sample manage to meet theirbasic needs, and limit their expenditures when they aremaking less money. Home electronics are limited to TVsand radios, no one has a bank account, a credit card orsavings, and average consumption is already very low.Purchases are limited to food, and here, too, little isspent, since only the children eat meat and receive newclothes. Nothing is spent for culture, for leisure or socialactivities, since these people are often socially isolated,with few contacts outside their family. Isolation is wors-ened by the lack of playgrounds in the neighbourhood,or other meeting places, and by the deep seated fearthat comes from the high crime rate.
Limited access to the different kinds of public assis-tance shows how little the families know about theprogrammes that might help them, in addition to reveal-ing how ineffective the institutions are in having a realimpact on neighbourhoods where serious deprivationexists. The unemployed themselves have a rathernegative perception of the quality of welfare assistanceavailable, which they consider both difficult to obtainand insufficient:
“…I get a monthly cheque for Euro 413 for sociallyuseful work. On the pay slip it says unemployment
15
UNDERSTANDING SLUMS: Case Studies for the Global Report on Human Settlements 2003

benefit; that’s the only time in the month I rememberI’m on assistance – for the rest of the time I just feelthat I’m an exploited worker because they don’t paycontributions…”.
The typical single mother is a widow, 45 years old.Her family of origin is large, with economic difficulties,and her educational level is extremely low (probably shehas not completed primary school), since the culturalpatterns see girls as helpers for their mothers in familycare and housework. The absence of qualification orprofessional skills profoundly affect her position on thejob market, and she is typically employed in home-based work for small factories (footwear, socks, clothes,gloves).
Lack of sufficient income is aggravated in severalcases by other problems (drug addiction, handicaps,imprisonment, alcoholism) which can accumulate tocreate precarious situations of serious social exclusion.The majority has been living in Scampia since theEighties, when they moved into public housing after theearthquake, and they do not pay rent or utility for theapartment. Their condition of poverty is linked to theabsence of their husband (due to either death or sepa-ration), which adds to a pre-existing condition ofeconomic instability.
The family of origin plays an important role, but sinceit is very poor itself, it is unable to provide seriouseconomic help. Local parishes play an even moreimportant role, since they provide food parcels, clothes,etc. and act as intermediaries in the search for work,and for this they are regarded as a reference point. Theattitude towards job seeking is passive, especially forwidows, due to the awareness of being scarcelycompetitive on the labour market.
Help received from the State can consist of a widows’pension, child benefits for those who have more thantwo children under 18, the Minimum SubsistenceBenefit (Euro 500 per month for those with three ormore children), the Minimum Insertion Income (monthlycheques from Euro 250 upwards). The typical singlemother is very pessimistic regarding the possibility offinding a regular job: “I can’t read or write and I can’tleave the house because of the children – what else canI do besides cleaning?”. Usually difficulties are notexperienced as isolated or as an isolating event.
As shown by all the indicators analysed in H and I,Scampia is a very poor area. Couples without childrenrepresent only 12,2% (the city figure is 17,9%), 69,3%are couples with children, 5% are households consistingof a single father with children and 12,2% of singlemother with children. Concerning the household size, inScampia there is the highest concentration in all Naplesof households with 5 or more members (31,4% of thefamilies), and higher birth rates than in the rest ofNaples (15,2 versus 12).
Most dwellings are rental units (ownership rates areas low as 32,4%, whereas the average for Naples is
44,4%), which is explained with the history of the districtbuilt in large part by public housing.
Literacy and occupancy ratios once again depict avery underprivileged neighbourhood: here we can findthe highest concentration of unemployed (61,7%, ascompared to a figure for Naples which is already veryhigh, 42,7%). Truancy rates are within, if not below, thecity average, but 3,1% of the population is illiterate (inNaples, 2,3%) and only 8,5% have finished secondaryschool, very low compared to the city average, 17,8%.
Data on permanence in the households are not avail-able, but since most people live in public housing, it canbe assumed that they tend to keep their houses for along period, unless they change their economic andsocial condition, which is quite infrequent.
Data on Income are not available; the only indicatorthat can measure the economic situation to some extentis the one concerning the attribution of the MinimumInsertion income: in Scampia in 1999, 48 peoplereceived Minimum Insertion Income, which represents12,5% of the city figure (384). As far as density indwellings is concerned, the average size of units is notlower than in Naples, but more people live in them (4,5persons per household instead of 3,4), and floor areaper person is calculated to be 19,9 m2 (24 m2 for Naples).
Scampia’s poor inhabitants suffer from doublediscrimination: from their neighbours belonging tohigher social classes, and from the rest of the town. Theformer finds expression, for example, in the fact thatlower-middle class and middle class inhabitants, wholive in better quality housing built by private co-opera-tives, often tend to live apart from the rest of the district,as is clearly shown by the enclosure of some buildings(protected by iron railings, video cameras and othersecurity systems), or by the distribution of children inschools: the higher classes tend to avoid to close rela-tionship with low income families, which on their partfind difficulty in accessing certain schools due to theirchildren already being branded as deviants or potentialcriminals.
"External" discrimination, i.e. that made by the rest ofthe town, depends principally on the district’s bad repu-tation: research conducted over the past decade14 showhow women from Scampia encountered greater difficul-ties in finding a job, because of prejudice against thedistrict they lived in (employers were afraid that theycould give information to criminals about family move-ments or contents of the house) and because of thegreater difficulty in coming to work on time because ofthe distance and the poor public transit connections.
A third form of discrimination has to be added to theabove two, a sort of "self-discrimination", deriving fromthe widespread practices of social differentiationtowards the other inhabitants of the area, with the effectof increasing the degree of social exclusion:
“…If they ask you where you leave and you say Vialedella Resistenza, then that’s the end of it. I’d act the
16
Urban Slums Reports: The case of Naples, Italy
same if I were in their shoes. There are good people,but unfortunately most of them are negative…”.
Social isolation represents a characteristic ofScampia, due to the history of the neighbourhood:people were mostly relocated here, at first when thepublic housing area (called 167 after the no. of the billthat governed it) went up, and later after the 1980 earth-quake, when many families whose homes had beendestroyed were moved. The latter found themselvesisolated from their previous social context (also becausebefore settling in Scampia they had been living forseveral years in containers or hotels), and faced everweaker contacts with relational and neighbourhoodnetworks. In addition to isolation, a form of segregationcan be seen in the architectural and urban structure ofthe district, with the result that the common spacesintended for social life have been progressively aban-doned to the point of being a real social danger.
Padre Vittorio, parish priest, says: “it was intentional that people shouldn't have any
chance of meeting; just think that in these buildings thathouse 570-600 families - that's 4-5000 people - thereisn't one space where is possible to gather for any sortof community life. There have been no social centres,so living here is like a prison sentence… But they knewall this. It's all part of the politics that […] saw the neces-sity of dismembering grassroots struggles and ‘breakingup the breakouts”.
Crime rate in Scampia is very high (see Table 12),also due to the high presence of prisoners and ex-pris-oners amongst the inhabitants, and makes the area adangerouse one, especially at night.
in spite of the high rate of poverty in the neighbour-hood, Scampia does not represent a ghetto, and the
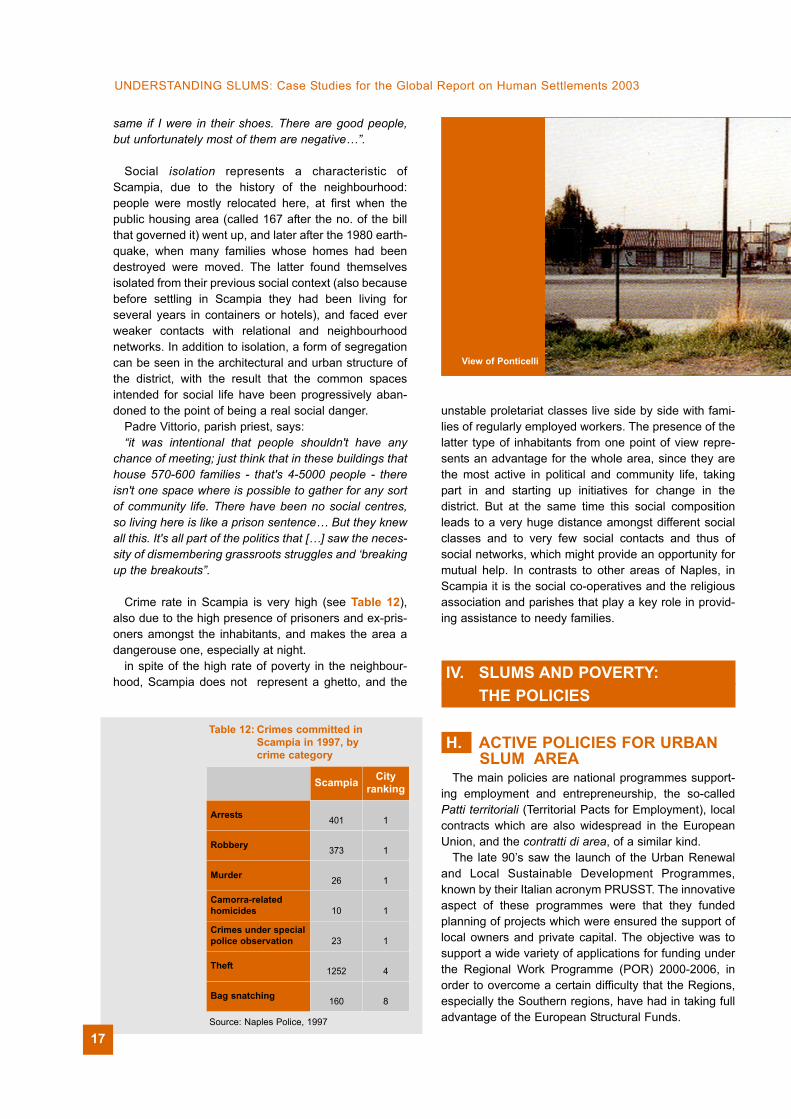
unstable proletariat classes live side by side with fami-lies of regularly employed workers. The presence of thelatter type of inhabitants from one point of view repre-sents an advantage for the whole area, since they arethe most active in political and community life, takingpart in and starting up initiatives for change in thedistrict. But at the same time this social compositionleads to a very huge distance amongst different socialclasses and to very few social contacts and thus ofsocial networks, which might provide an opportunity formutual help. In contrasts to other areas of Naples, inScampia it is the social co-operatives and the religiousassociation and parishes that play a key role in provid-ing assistance to needy families.
IV. SLUMS AND POVERTY: THE POLICIES
H. ACTIVE POLICIES FOR URBAN SLUM AREA
The main policies are national programmes support-ing employment and entrepreneurship, the so-calledPatti territoriali (Territorial Pacts for Employment), localcontracts which are also widespread in the EuropeanUnion, and the contratti di area, of a similar kind.
The late 90’s saw the launch of the Urban Renewaland Local Sustainable Development Programmes,known by their Italian acronym PRUSST. The innovativeaspect of these programmes were that they fundedplanning of projects which were ensured the support oflocal owners and private capital. The objective was tosupport a wide variety of applications for funding underthe Regional Work Programme (POR) 2000-2006, inorder to overcome a certain difficulty that the Regions,especially the Southern regions, have had in taking fulladvantage of the European Structural Funds.
UNDERSTANDING SLUMS: Case Studies for the Global Report on Human Settlements 2003
View of Ponticelli
Table 12: Crimes committed in Scampia in 1997, by crime category
Scampia City ranking
Arrests 401 1
Robbery 373 1
Murder 26 1
Camorra-related homicides 10 1
Crimes under specialpolice observation 23 1
Theft 1252 4
Bag snatching 160 8
Source: Naples Police, 1997
17

In planning these funds, the Campania Region allo-cated Euro 1.5 bn for “promoting the recovery andimprovement of urban aspects of the cities (…) promot-ing social services offered in city slum areas (…)through the creation of the services and infrastructure,recovery, renewal and taking advantage of the urbanlandscape and urbanistic and construction patterns".15
It is still early to judge the outcome that this fundinghas yielded; one can only note that the POR got off to alate start. Some positive experiences – such as with theURBAN programme – may be generalised, and arelisted in the following chapter.
Anti-poverty policy in ItalyIn Italy,16 the main anti-poverty policies are indirect,
and not all the individuals and categories that benefitare in economic difficulty. Although many policies havea significant impact on poverty, there are few real “anti-poverty” policies.
Italian welfare policy does not make a very good
distinction between pensions and assistance; theformer consumes 81.5% of all expenditure. There aretwo approaches to fighting poverty. The first is aconfused and stingy system of welfare payments, whilethe second is more generous and is based on the prin-ciple of insurance, so that only those who have paidinto the pension system can collect. The weak welfaresystem, which reaches only those who have madepension payments, means that the very means to fightemargination are the weakest where they are mostneeded.
Current welfare measures with some impact onpoverty are: the “social wage”, the “social pension”, theminimum pension, disability pension, subsidy forpermanent medical assistance, special disabilitypension, family subsidy, national rental subsidy, taxbreak for renters, services for the disabled, maternitypayments, family subsidies for those with more than 3children, minimum wage integrators (RMI), subsidisedhealth care co-payments.
Most of the welfare measures are insufficient. Eventhe recent rise of the minimum pension to Euro516/month did not affect all those who were entitled toit, and the elderly without pension rights often livebelow the poverty threshold unless they are marriedand can live with relatives. And yet the elderly and thedisabled are the best protected in the Italian welfarestate, since current measures have little to offer formany other categories, such as the homeless, drugaddicts and youth.
The RMI is meant for young people who are unem-ployed and capable of working, who are willing to takeprofessional training courses and to work, as proved bytheir enrolment in the employment office. They areeligible for the RMI if they have no income or if theymeet the requirements indicated in Table 13.
The wage integration multiplier rises by 0.35 for eachadditional family member, by 0.2 for single parents with
Urban Slums Reports: The case of Naples, Italy
Table 13 Income thresholds (Euro) to receive RMI according to family size (1998-2000)
Familymembers Multiplier Threshold
1998Threshold
1999Threshold
2000
1 1.00 258 263 269
2 1.57 405 413 422
3 2.04 526 537 549
4 2.46 635 647 662
5 2.85 735 750 767
Source: Rapporto per la Commissione di Indagine sull’EsclusioneSociale
North Centre South Italy
Social pensions & subsidies 33.1 22.0 44.9 100
Minimum pension integration 42.0 20.3 37.7 100
INPS Disability pension 46.9 23.7 29.4 100
INPS Disability subsidy 31.7 22.3 45.9 100
Subsidies for services for disabled 37.6 19.4 43.0 100
Family welfare payments(pensioners only) 38.8 19.1 42.1 100
Resident population 44.5 19.2 36.3 100
Table 14: Distribution of recipients according to region (1998)
Source: Rapporto per la Commissione di Indagine sull’Esclusione Sociale
18

children, and by 0.5 for each handicapped or severelydisabled family member, and by 0.2 for families withchildren where both parents work.
Welfare payments and those for the handicapped arepitifully small (Euro 204 monthly in 1999), and are avail-able to those who make less than Euro 282 a month.The impact of these payments depends on the benefici-ary: if he or she is married or lives with family members,the sum can be a useful contribution; for the singledisabled they are absolutely insufficient.
Many Italians benefit from the above measures, but it isdifficult to know exactly how many, since a single individ-ual can receive one or more benefits simultaneously,because family subsidies benefit an unknown number offamily members, and because some are of very recentintroduction. Among these benefits, 72.4% are for disabil-ity payments, which means that pensions and disabilitypayments comprise a full 93% of all welfare payments.
Of all anti-poverty measures (Euro 52 bn), 91.3% ofthe funds are spent on just two categories: the elderly(45.5%) and the disabled (45.8%). These two cate-gories also have access to many other benefits (hous-ing subsidies, family subsidies), so that they actuallyreceive an even higher proportion of the funding.
The pension and social benefits are disproportion-ately for women, who make up 71.9% of those whoreceive pensions, 82.8% of social welfare payments,and 74.3% of those who receive minimum wage inte-gration. INPS pensions and disability payments, on theother hand, which are based on the number of yearsthat contributions have been paid, are mostly for men(women are just 21.9% and 30.6% of beneficiaries,respectively).
Table 14 shows the distribution of recipients of differ-ent welfare payments in 1998. It clearly shows how bene-ficiaries are concentrated in the South, except for mini-mum pension integration and INPS disability pensions,which are, not coincidentally, the most generous of allbenefits. Further, the data show how welfare paymentsare less important in the North, where access to workopportunities are greater. Where unemployment is high,other sources of income become more important.
Only in recent years has there been some attempt tofind an alternative to the Italian concentration onpensions and certain categories of beneficiaries. A newand more coherent anti-poverty approach is beginningto appear, which uses a few instruments which aredirectly aimed at supporting individuals and families inconditions of risk for poverty, such as rental subsidies,welfare payments for families with many children, andabove all the RMI. The Economic Situation Index (ISE;calculation mechanism is the one used for attribution ofRMI shown and commented in Table 13) has beenintroduced to provide a uniform criterion for measuringincome in order to determine eligibility for assistancebenefits, although this has only been applied to a fewmeasures so far.
Assistance has been the responsibility of localgovernment since 1977, although the actual devolutiononly took place in 2000, with the publication of theframework law on the integrated system of social inter-vention and services (Act 328/2000). Development inthe sector had been extremely variable until recently,with huge regional and municipal differences, especiallybetween North and South.
This framework law on is the foundation for integrat-ing health and social services and focusing on localdistricts so as to plan for and manage action for a singlecatchment area.
At this local city level, with its new demands for socialand individual protection and security, a new model ofmunicipal mixed welfare is emerging, in which the Stateno longer presides over welfare policy but implementssocial policy based on the development of interchangeand rationalisation of the resources of the state, themarket and “third sector”, the rich variety of volunteer,church and non-profit structures.
The full integration of such non-profit entities, whichare still associated with reciprocity, altruism, charity andsolidarity, is considered rather innovative compared tothe usual characteristics of social and health services.
Policy in NaplesNaples, in its City Social Plan, is trying to make the
shift from government, which is the exclusive provinceof the State, and local governance. This means a
UNDERSTANDING SLUMS: Case Studies for the Global Report on Human Settlements 2003
Table 15: Social spending in the city of Naples by sector (Millions of Euro)
Policy Category2000 2001
Number % Number %
Elderly 26.3 29.68 24.0 28.90
Disabled 8.7 9.83 10.0 12.04
Anti-Poverty 32.1 36.13 27.4 32.98
Prevention, Promotion& Co-operation 0.7 0.82 0.9 1.04
Families 0.9 0.98 0.8 0.94
Immigration 0.7 0.82 0.7 0.85
Addiction 0.1 0.09 0.5 0.56
Youth Support 1.9 2.10 0.7 0.84
Education Support forFamilies 16.9 19.01 17.7 21.29
Family Services /Foster Care 0.5 0.56 0.5 0.56
Total 88.8 100.0 83.2 100.0
Source: Piano Sociale di Zona, Comune di Napoli, 2002
19

commitment to the idea that only locally can the socialwelfare system be effectively arrayed, giving rise to adifferent scenario of city welfare in which a universalistvalue system means attempting the social integration ofthe underprivileged.
The City Social Plan is a serious attempt to define amixed system of local welfare, and has been madepossible by the many legislative changes that tookplace during the centre-left’s years in power,17 duringwhich the State took on a subsidiary role, granting localgovernment broad powers, based on criteria of effec-tiveness, cost, communication and efficiency of thegovernment action.
In terms of its contents, the Social Plan aims mostnotably to support families. In Italy and in Naples, incontrast to many other European countries, plays animportant complementary or even substitute role in thewelfare system. In addition to reducing the burdenplaced on these families, there is also a need to recog-nise the transformation of the traditional models of thefamily: the growing instability of marriages, the rise insingle-parent families with children, the drop in birthrates, the changes in childbearing trends (fewer andlater children), the ageing population, the increasingnumber of women In the labour market, and the doubtscast on the job stability of the segment which hashistorically had the least to worry about, the malebreadwinner.
As shown in the following table, social service expen-ditures in the City of Naples over the past two yearshave included anti-poverty measures among their mainobjectives.
I. THE IMPACT OF POLICIES It is premature to evaluate the results of the Social
Plan. Overall, the changes taking place in Naples showhow deep social and urban decay remains. Consideringthat these conditions are the result of countless inter-playing factors, urban renewal can only take place in acomprehensive plan of urbanistic and environmentalreorganisation matched with measures aimed atincreasing and improving the services needed to attracteconomic activity and to integrate those segments ofthe population currently facing increasingly emargina-tion into the social and economic fabric of the city.
Even so, some positive signs are already visible. Onesuccess story is that of the URBAN Programme in theSpanish Quarters between 1994 and 1999, followed bythat in the Sanità quarter.
The URBAN programme aimed to serve as a catalystfor the small and uncoordinated efforts at urban andsocial renewal underway in the city, and to providesupport in order to focus them in terms of timing, loca-tion and action.
This integrated social and urbanistic approachcommon elsewhere in Europe was an important innova-
tion for Naples. In a single part of the city, the urbanproblems were faced through promoting economicactivity, improving the physical environment, and devel-oping pilot actions for a lasting betterment of the qualityof life.
In the context of the Urban project different interven-tions have been realised:
structural interventions: refurbishment of squaresand main streets, and of façades of private and publicbuildings;
interventions on mobility: car parks for residents,electric buses, creation of pedestrian areas;
intervention for socio-economic development: open-ing of a centre for social and psychological preventionfor adolescents, opening of several information servicesto support the needy, support for existing artisan activi-ties, with the specific objective to help them to legalisetheir activities and favouring their access to credit evenwithout collateral.
J. THE COMMITMENT OF INSTITUTION TO REGULAR MONITORING, FEEDBACK & ADJUSTMENT
POLICIES AND PROGRAMMESIt goes without saying that the procedures used by the
European Commission for awarding grants have helpedto spread a culture of evaluation and, more generally, ofproject management in all its phases. Structural fundsrequire the identification of performance indicators andSWOT (Strengths, Weakness, Opportunities andThreats) analyses. This has meant that hundreds ofbureaucrats from Regions, Provinces and Cities havebecome familiar with these previously alien concepts.
At the same time, Italian government has been rockedby a major debate over the evaluation of almost all itsactivity, especially that involving social policy, fromeducation to health. Even if, unfortunately, concepts ofevaluation and indicators are often seen as synony-mous with budget limitations and cost-cutting decisions,there is no doubt that many capable bureaucrats aremastering logical, if not technical, methods for analysingproblems, defining strategies and designing projects.
The 2000-2006 structural funds impose much morestringent monitoring and evaluation requirements thanin the past, and provide much greater resources forthese tasks. Almost all Italian regions have publishedcalls for tender for technical assistance for their servicesin the execution of these tasks.
All POR-funded urban renewal projects, includingthose limited to social themes, will therefore be moni-tored and evaluated by dedicated staff. It is possible toconfidently assert that monitoring and evaluation prac-tices are spreading deep and wide in the managementof Italian public policy. What is yet to be built is a wide-spread and standard ability to do this. Even more diffi-
Urban Slums Reports: The case of Naples, Italy
20
cult will be the promotion of the effective capacity oflarge organisations and public administration to trans-late their evaluations into changes in their future activity.
The Naples Social Plan is already structured on aconceptual basis, and defines the District as “the area inwhich it is possible to verify not only the effectiveness(in terms of capacity for implementation) and efficiency(in terms of resources used) of social inclusion policies,but also their relevance to the needs of the local popu-lation”. This is based on the guidelines of the NationalAction Plan, which “privileges the adoption of flexibleorganisational models, oriented according to their aimsand results so as to make monitoring, verifying andevaluating the actions more efficient”.
ENDNOTES1 Official figures show that immigration is higher in Northernand Central Italy (50,6% and 31,2% respectively) and is verylow in the South, while birth rate is constantly negative in Northand Central Italy and is positive in South.2 Vicari Haddok, Naples: Urban regeneration and exclusion ina Southern metropolis.3 Cavola e D’Antonio, 1994, in Vicari, cit.4 Vicari Haddok, cit.5 Daniela Lepore, "Napoli" in CRESME, Scenari e strategie diintervento per la riqualificazione delle periferie in Italia, 2001,forthcoming publication.6 This phenomenon of construction in absence of permits andin violation of zoning is called "abusivismo" and was so wide-spread in Italy that, in 1982, the Socialist government approveda "building amnesty" law under which owners could legalisetheir buildings by paying a fine proportional to the size of thebuilding. Other amnesty laws followed. This has meant thatItaly has developed special know-how on building servicenetworks in illegal neighbourhoods after they have been built.7 Lepore, cit.8 Le politiche nazionali contro la povertà in Italia, DavidBenassi (ed.), Università di Padova9 Cfr. Le politiche nazionali contro la povertà in Italia, DavidBenassi (ed.), Università di Padova.10 Piano Sociale di Zona, Comune di Napoli, Gruppo di piano(L. 328/00 - Del. G. R. 1826 del 4/5/01).11 As stated in the cited publication, it is not easy to comparethe data, since the 1991 Census was immediately shown not tocorrespond to residence data. Nonetheless, in the absence ofother data, the analysis of the Zone Social Plan comparesthese available data. 12 As it has been pointed out by E. Morlicchio, professor atUniversity of Naples, during an interview.13 Spatial Dimensions of Urban Social Exclusion andIntegration. The case of Naples, Enrica Morlicchio ed., 2001.The stories and all interviews with inhabitants of Scampia andwith key players and social operators are extracted from thatsurvey.
14 Disoccupati e disoccupate a Napoli, Cerase, Morlicchio,Spanò, 1991, and Oltre le vele. Rapporto su Scampia,Pugliese, 1999.15 Regione Campania, Programma Operativo Regionale 2000-2006, Complementi di Programmazione.16 The most recent and complete analysis of anti-povertypolicy in Italy, from which these figures are taken, is the reportfrom the Commissione di Indagine sull'Esclusione Sociale: Lepolitiche nazionali contro la povertà in Italia, David Benassi(ed.), Università di Padova.17 Local government, with the Bassanini law (Act 50/1999; Act127/1997; Act 191/1998, Bill 112/1998) and with the law on theautonomy of local government (L. 142/1990 e L. 265/1999) andmost recently the new framework law on the integration systemof social intervention and services (L. 328/2000), has becomeone of the main local actors in implementing municipal policiesof development and the promotion of the welfare of residents.
UNDERSTANDING SLUMS: Case Studies for the Global Report on Human Settlements 2003
21