naramata water system · 2013-07-26 · naramata water system j u l y 3 1 , 2 0 1 3 . overview ......
TRANSCRIPT
T W I N N I N G P R O G R A M
COST-BENEFIT DISCUSSION
Naramata Water System
J U L Y 3 1 , 2 0 1 3

Overview
Presentation Purpose
Assignment Objective
Revisit Asset Management
What is Cost-Benefit
Role of Community Infrastructure
Asset Management
Status of Naramata infrastructure
Net Present Value Results
Discussion and Recommendation
2

Presentation Purpose
To Revisit Asset Management Principles and Status in Naramata
12 slides
To Review and Discuss the Cost Benefit of Twinning
10 slides
Recommendations and Discussion
3 slides
3
Assignment Objective
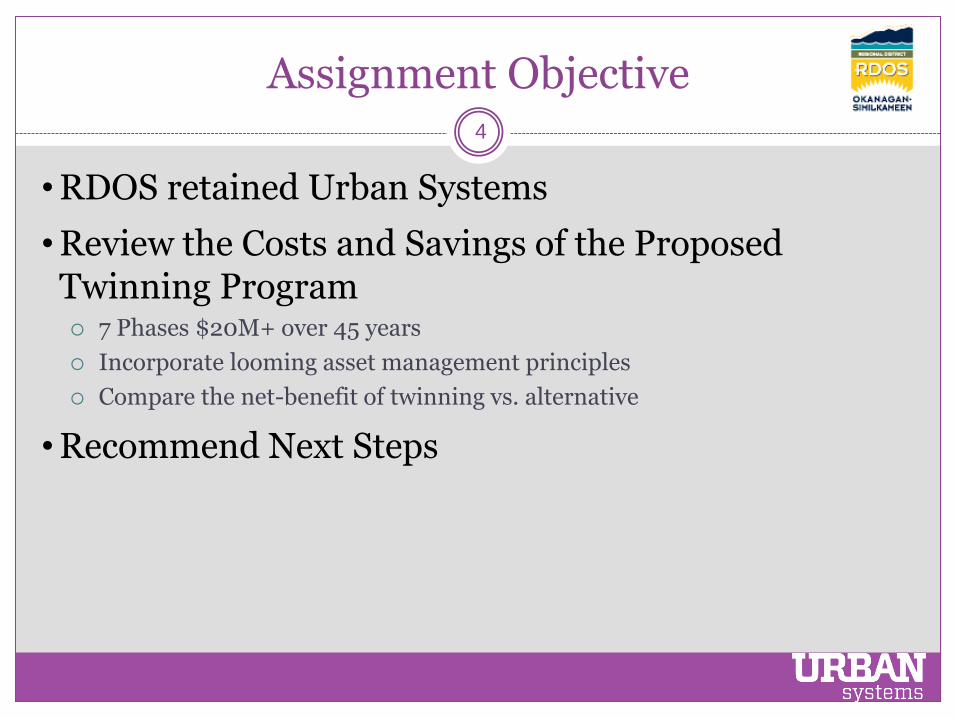
•RDOS retained Urban Systems
•Review the Costs and Savings of the Proposed Twinning Program 7 Phases $20M+ over 45 years
Incorporate looming asset management principles
Compare the net-benefit of twinning vs. alternative
•Recommend Next Steps
4

How Asset Management Helps
Combines all infrastructure needs
Balances infrastructure needs
Links strategic thinking with action-oriented solutions
Identifies affordable levels of service and risk
Basic logic to determine reliable costs and funding
Defensible basis for decision making
Sound basis to engage the public
5

Key Definition
AALCI – Average Annual Life Cycle Investment the funds required to be put away per year to fund the eventual
renewal of assets in a system.
E.g. $1,000/year should be set aside to fund the renewal of a $100,000 asset with a 100 year service life
6
Construction Cost
$100,000 Renewal (Re-Construction)
Cost $100,000
AALCI (Average Annual Life Cycle Investment)
$1,000/year
End of Asset’s Life Cycle Year 0 100 years
Basic Asset
Costs
Analysis Methodology
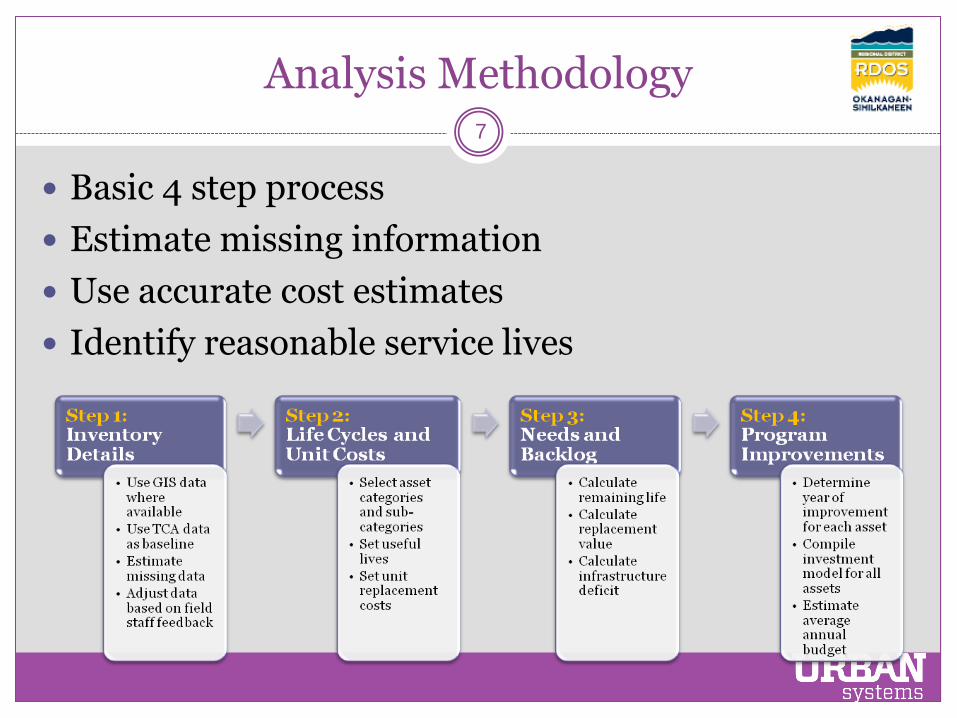
Basic 4 step process
Estimate missing information
Use accurate cost estimates
Identify reasonable service lives
7

Data Level Rationale 8
Asset
Category
100%
Replacement
Value
Loss in
Value
Remaining
Value
Percent
Remaining
Life
2011 2012 2013 2014 2015
Mains $87,428,000 $54,449,000 $32,979,000 38% $0 $976,000 $0 $1,277,000 $135,000
Water Supply $7,890,000 $7,746,000 $144,000 2% $7,730,000 $0 $0 $0 $0
Reservoirs $12,035,000 $3,542,188 $8,492,813 71% $0 $0 $0 $0 $0
Dams $400,000 $225,000 $175,000 44% $0 $0 $0 $0 $0
Pressure Stations $3,960,000 $3,717,333 $242,667 6% $3,700,000 $0 $0 $0 $0
Sub-total Water $111,713,000 $69,679,521 $42,033,479 38% $11,432,500 $978,500 $2,500 $1,279,500 $137,500
Asset
Category
Diameter
(mm)
100%
Replacement
Value
Loss in
Value
Remaining
Value
Percent
Remaining
Life
2011 2012 2013 2014 2015
Mains > 600 $12,780,000 $8,865,000 $3,915,000 31% $0 $0 $0 $0 $0
350 - 600 $11,813,000 $8,266,000 $3,547,000 30% $0 $943,000 $0 $1,181,000 $0
300 $7,609,000 $3,569,000 $4,040,000 53% $0 $0 $0 $63,000 $0
250 $5,451,000 $3,446,000 $2,005,000 37% $0 $33,000 $0 $0 $0
200 $22,746,000 $12,755,000 $9,991,000 44% $0 $0 $0 $33,000 $0
150 $15,302,000 $9,644,000 $5,658,000 37% $0 $0 $0 $0 $0
<= 100 $11,727,000 $7,904,000 $3,823,000 33% $0 $0 $0 $0 $135,000
Subtotal Mains $87,428,000 $54,449,000 $32,979,000 38% $0 $976,000 $0 $1,277,000 $135,000
Asset
Category
Diameter
(mm)Material GIS Length Installed Life
100%
Replacement
Value
Loss in
Value
Remaining
Value
Percent
Remaining
Life
2011 2012 2013 2014 2015
Mains 300 DI WP-1295 1.50 1967 50 $1,132 $1,036 $96 9% $0 $0 $0 $1,132 $0
300 DI WP-1297 7.77 1967 50 $5,832 $5,336 $496 9% $0 $0 $0 $5,832 $0
300 DI WP-1345 213.19 1967 50 $159,897 $146,289 $13,608 9% $0 $0 $0 $159,897 $0
300 DI WP-3609 21.87 1965 50 $16,405 $15,707 $698 4% $0 $16,405 $0 $0 $0
300 DI WP-3613 21.97 1965 50 $16,483 $15,782 $701 4% $0 $16,483 $0 $0 $0
300 DI WP-3614 6.985 1965 50 $5,239 $5,016 $223 4% $0 $5,239 $0 $0 $0
Level 1, Investment level: For strategic planning with mayors, councils, and senior managers
Level 2, Program level: For tactical planning with senior managers and staff
Level 3, Project level: For on-going operations, design and construction

Summary of Asset Value
Replacement value is $41.3 million (2012)
Weighted service life of assets is 60 years
Est. Annual Investment $825,000
Note: Twinning would increase asset value
Treatment and watermains are highest value (80%)
Deficits for $2.2M:
intakes and valve facilities (85%)
water mains (15%)
9
Length 60 km Value $41.3M Deficit $2.2M
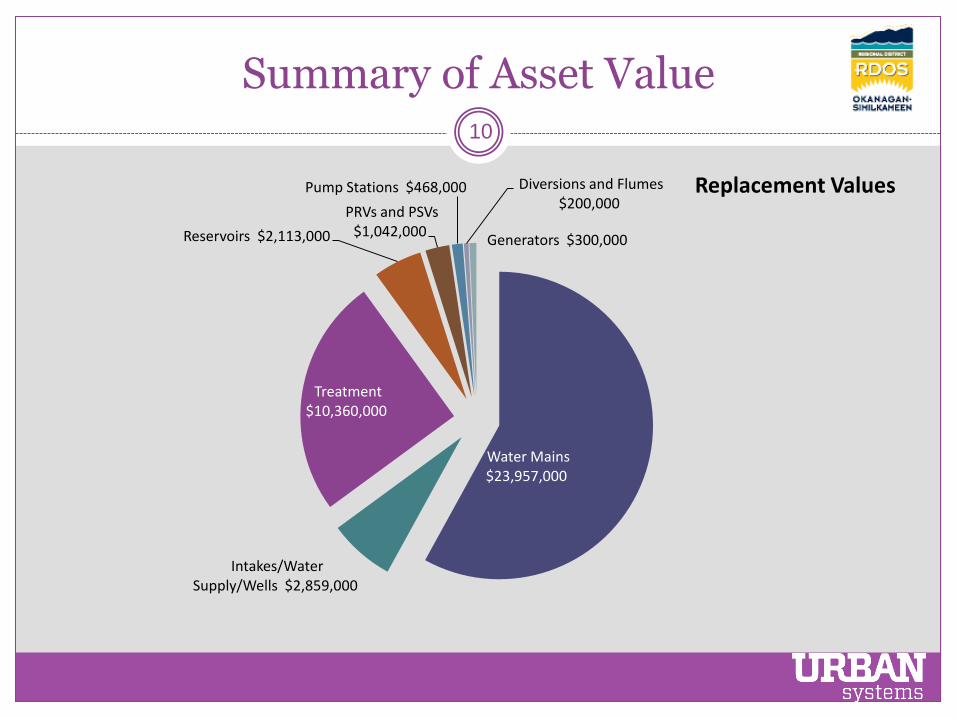
Summary of Asset Value 10
Water Mains $23,957,000
Intakes/Water Supply/Wells $2,859,000
Treatment $10,360,000
Reservoirs $2,113,000
PRVs and PSVs $1,042,000
Pump Stations $468,000 Diversions and Flumes $200,000
Generators $300,000
Replacement Values
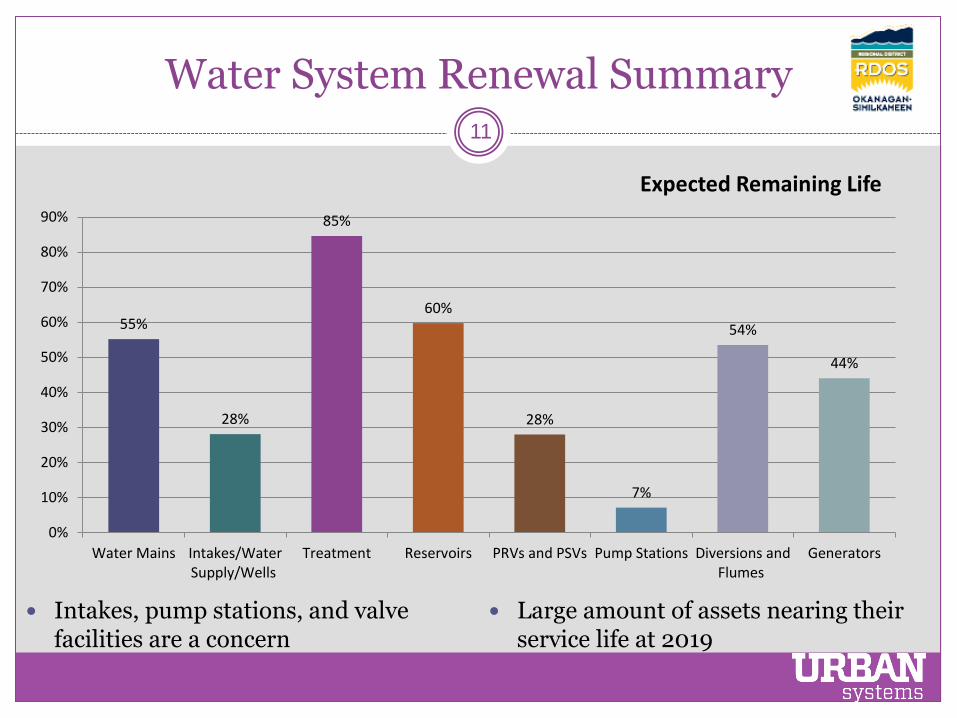
Water System Renewal Summary 11
Intakes, pump stations, and valve facilities are a concern
Large amount of assets nearing their service life at 2019
55%
28%
85%
60%
28%
7%
54%
44%
0%
10%
20%
30%
40%
50%
60%
70%
80%
90%
Water Mains Intakes/WaterSupply/Wells
Treatment Reservoirs PRVs and PSVs Pump Stations Diversions andFlumes
Generators
Expected Remaining Life

Summary of Asset Value 12
A summary of all the AALCI’s
Infrastructure
Deficit
(Backlog)
2012 2013 2014
Existing Water System
Water Mains 23,956,958$ 10,738,472$ 13,218,486$ 55% 327,046$ 1,255$ -$ -$
Intakes/Water Supply/Wells 2,859,028$ 2,056,038$ 802,989$ 28% 1,314,179$ -$ -$ -$
Treatment 10,360,000$ 1,597,333$ 8,762,667$ 85% -$ -$ -$ 120,000$
Reservoirs 2,112,800$ 851,283$ 1,261,517$ 60% -$ -$ -$ -$
PRVs and PSVs 1,042,000$ 750,800$ 291,200$ 28% 602,000$ -$ 80,000$ -$
Pump Stations 467,837$ 434,621$ 33,215$ 7% -$ -$ 105,293$ 362,544$
Diversions and Flumes 200,000$ 93,000$ 107,000$ 54% -$ -$ -$ -$
Generators 300,000$ 168,000$ 132,000$ 44% -$ -$ -$ -$
Sub-Total Water Renewal 41,298,622$ 16,689,548$ 24,609,074$ 60% 2,243,224$ 1,255$ 185,293$ 482,544$
Replacement
Value
Loss in
Value
Investment Year (Current Dollars)
Remaining
Value
Expected
Remaining
Life
Asset
Category 2036 2037
474$ -$ 8,733,370$ 349,335$ 385,577$
-$ -$ 1,939,179$ 77,567$ 73,802$
-$ -$ 360,000$ 14,400$ 236,622$
-$ -$ 1,166,750$ 46,670$ 51,736$
-$ -$ 1,042,000$ 41,680$ 41,086$
-$ -$ 467,837$ 18,713$ 18,713$
-$ -$ 150,000$ 6,000$ 5,000$
-$ -$ 300,000$ 12,000$ 12,000$
474$ -$ 14,159,135$ 566,365$ 824,537$
25 Year
Total
25 Year Average
Annual
Investment
Average Annual
Life Cycle
Investment
(AALCI)

Summary of Asset Value 13
$-
$1,000,000
$2,000,000
$3,000,000
$4,000,000
$5,000,000
$6,000,000
$7,000,000
$8,000,000
InfrastructureDeficit
(Backlog)
2015 2019 2023 2027 2031 2035
Opening Deficit, Renewal Costs and Timing
Total Renewal Program Total Twinning Program
Weighted Existing Asset Service Life = 60.25
$6.1M in water mains up for renewal in 2019

Summary of Asset Value 14
$-
$1,000,000
$2,000,000
$3,000,000
$4,000,000
$5,000,000
$6,000,000
$7,000,000
$8,000,000
InfrastructureDeficit
(Backlog)
2015 2019 2023 2027 2031 2035
Opening Deficit, Renewal Costs and Timing
Total Renewal Program Total Twinning Program
Weighted Existing Asset Service Life = 60.25
$6.1M in water mains up for renewal in 2019
Sustainable investment level

Sustainable Revenues
Asset Renewal Requirements
~$825,000/yr
Current Asset Capital Fund
~$125,000/yr
15
$(9,000,000)
$(8,000,000)
$(7,000,000)
$(6,000,000)
$(5,000,000)
$(4,000,000)
$(3,000,000)
$(2,000,000)
$(1,000,000)
$-
Year 1 Year 2 Year 3 Year 4 Year 5 Year 6 Year 7 Year 8 Year 9 Year 10
Current Deficit Trend

Sustainable Revenues
Asset Renewal Requirements
~$825,000/yr
Current Asset Capital Fund
~$125,000/yr
16
$(9,000,000)
$(8,000,000)
$(7,000,000)
$(6,000,000)
$(5,000,000)
$(4,000,000)
$(3,000,000)
$(2,000,000)
$(1,000,000)
$-
Ye
ar
1
Ye
ar
2
Ye
ar
3
Ye
ar
4
Ye
ar
5
Ye
ar
6
Ye
ar
7
Ye
ar
8
Ye
ar
9
Ye
ar
10
Current Deficit Trend
$(5,000,000)
$(4,500,000)
$(4,000,000)
$(3,500,000)
$(3,000,000)
$(2,500,000)
$(2,000,000)
$(1,500,000)
$(1,000,000)
$(500,000)
$-
Year1
Year2
Year3
Year4
Year5
Year6
Year7
Year8
Year9
Year10
Year11
Year12
Year13
Path to Sustainable Revenues

Twinning
Purpose
Offset pumping and treatment costs by developing both domestic and irrigation systems
“treat only what needs to be treated; pump only what needs to be pumped” -
17
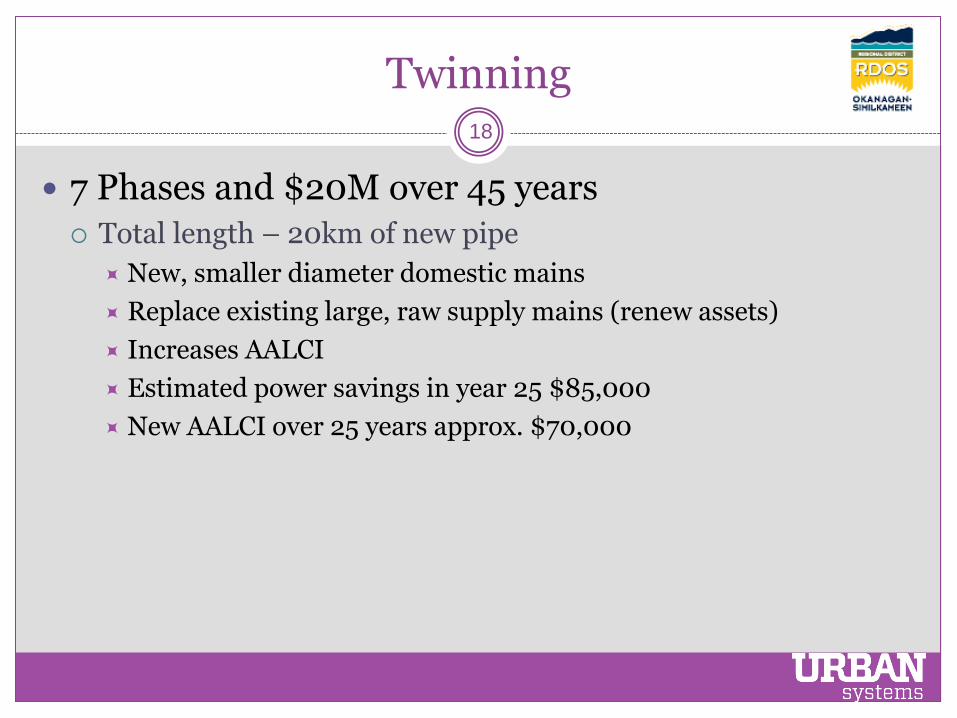
Twinning
7 Phases and $20M over 45 years
Total length – 20km of new pipe
New, smaller diameter domestic mains
Replace existing large, raw supply mains (renew assets)
Increases AALCI
Estimated power savings in year 25 $85,000
New AALCI over 25 years approx. $70,000
18

Net Present Value Analysis
What is NPV?
a form of cost-benefit analysis
Includes:
Initial investment e.g. Phase 1
Annual costs and savings over 45 years
Discount rate – use MFA pooled investment fund @ 1.56%
19

Net Present Value Analysis
What does it reveal?
45 years of costs and savings compressed into one $figure
Decide between alternatives
Implement twinning $XXX
Invest elsewhere $XXX
20
Compare between alternatives

Twinning
Annual Costs Cost savings = power savings
Costs incurred: new AALCI
Periodic Capital Costs Capital costs incurred: new twin-mains
Costs incurred: opportunity cost of early renewal of assets
21

Twinning 22
Opportunity Cost – loss for replacing assets early
E.g. cashing in a Bond
0
20
40
60
80
100
120
1 6 11 16 21 26 31 36 41
Co
nd
itio
n R
atin
g
Year
Condition
Good
Fair
Poor

Net Present Value Analysis
What if:
large positive number = significant returns
Small positive number = marginal returns
Negative number = losing venture
Consider Other Factors
Operations: watershed management, plant reductions, more pipe, system capacity,
Long-term Needs: licenses, farming equipment, asset renewal
Greenhouse gas emissions
23

Twinning 24

Twinning 25

Twinning 26

Net Present Value Analysis
What if:
large positive number = significant returns
Small positive number = marginal returns
Negative number = losing venture
Consider Other Factors
Operations: watershed management, plant reductions, more pipe, system capacity,
Long-term Needs: licenses, farming equipment, asset renewal
Greenhouse gas emissions
27

NPV Results and Recommendation
Results
losing venture
-$3,330,000
Change inputs = change NPV results
E.g. utility rates rise faster than inflation
28

NPV Results and Recommendation
Option to hold the Twinning Project
Negative result of the net-present value analysis
Catch up on asset renewal needs and revisit the twinning
Conservation Ramp-UP
Achieve the targets set out in the current plan
Possible to achieve the intent of twinning without new infrastructure
29

Discussion Suggestions
What are our options for building off of twinning momentum?
How can we build additional revenues to afford the assets we have? What is our financial plan?
How do we extend the life of infrastructure to keep our costs low? Other cost saving techniques?
30
T H A N K Y O U
31

Deficit Explained 32
Back
Asset has failed or in process of failing
Typically results in complaints, claims, breaks, loss of service
Increases renewal costs
0
20
40
60
80
100
120
1 6 11 16 21 26 31 36 41
Co
nd
itio
n R
atin
g
Year
Condition
Good
Fair
Poor