narrandera land use strategy shire profile forms the first part of the narrandera land use strategy,...
TRANSCRIPT

Narrandera Land Use Strategy
PART 1
SHIRE PROFILE & KEY ISSUES
November 2010

Version Control
Version No: Date: Author: Comment
1 October 2010 Anthony Newland Initial draft
2 November 2010 Anthony Newland Review by SPOD
3 November 2010 Anthony Newland Steering Committee review
This report has been prepared by:
Anthony Newland
Town Planner
M: 0428 668 211
W: www.townplanner.com.au
Level 1, 25 Tompson Street, (PO Box 511)
Wagga Wagga, 2650
ABN: 94 467 886 336
This work is Copyright and may not be reproduced without the written permission of the Narrandera Shire Council. The work may be referenced with appropriate acknowledgement.

Shire Profile & Key Issues
Narrandera Shire Council and Newland Planning & Development Page 3 of 101
TABLE OF CONTENTS
1 INTRODUCTION ...................................................................................................................... 8
1.1 Background to the Shire profile ...............................................................................................................8
1.2 Background to the Narrandera Land Use Strategy ................................................................................8
1.3 The Shire at a glance .................................................................................................................................9
2 THE PEOPLE OF NARRANDERA SHIRE ............................................................................. 11
2.1 Shire population and urban locations .................................................................................................. 11
2.2 Profile of Barellan village ....................................................................................................................... 12
2.3 Profile of Grong Grong village .............................................................................................................. 14
2.4 Population mobility – Narrandera Township and Shire...................................................................... 15
2.5 Population age profile – Narrandera Shire and town .......................................................................... 16
2.6 Family & household composition – Narrandera town ........................................................................ 20
2.7 Household structure – Narrandera town .............................................................................................. 21
2.8 Dwelling type – Narrandera Township ................................................................................................. 21
2.9 Housing tenure and landlord type ........................................................................................................ 22
2.10 Housing costs and household income – Narrandera town ................................................................ 22
2.11 Population projections – Narrandera Shire ......................................................................................... 23
2.12 Employment status in Narrandera Township ...................................................................................... 25
2.13 Occupation – Narrandera Township ..................................................................................................... 25
2.14 Industry of employment – Narrandera Township ................................................................................ 26
2.15 Workforce tertiary qualifications – Narrandera Shire ......................................................................... 27

Shire Profile & Key Issues
Newland Planning & Development and Narrandera Shire Council Page 4 of 101
2.16 Workforce dependency ratio ................................................................................................................. 27
3 SOCIO-ECONOMIC INDEXES FOR AREAS (SEIFA) ........................................................... 28
3.1 Relative socio-economic disadvantage ............................................................................................... 28
3.2 Index of economic resources ................................................................................................................ 29
3.3 Index of education and occupation ...................................................................................................... 29
3.4 Narrandera’s relative socio-economic progress since 1986 ............................................................. 30
4 PROFILE OF THE NARRANDERA SHIRE ABORIGINAL POPULATION ............................ 31
4.1 Aboriginal population............................................................................................................................. 31
4.2 Population age distribution ................................................................................................................... 31
4.3 Household and family composition ...................................................................................................... 32
4.4 Housing tenure ....................................................................................................................................... 32
4.5 Housing costs and income .................................................................................................................... 32
4.6 Employment status................................................................................................................................. 33
4.7 Occupation .............................................................................................................................................. 33
4.8 Tertiary qualifications ............................................................................................................................ 33
4.9 Life expectancy ....................................................................................................................................... 34
4.10 What does this tell us? .......................................................................................................................... 34
5 HEALTH, EDUCATION & COMMUNITY FACILITIES ........................................................... 35
5.1 Health infrastructure in the Shire .......................................................................................................... 35
5.2 Hospital services .................................................................................................................................... 35
5.3 General Practitioner services ................................................................................................................ 36
5.4 Community health services ................................................................................................................... 36
5.5 Home and Community Care Services................................................................................................... 36

Shire Profile & Key Issues
Newland Planning & Development and Narrandera Shire Council Page 5 of 101
5.6 Aged care services ................................................................................................................................. 37
5.7 Narrandera Shire Social Plan 2005-2010 .............................................................................................. 37
5.8 Community support services ................................................................................................................ 38
5.9 Community service clubs ...................................................................................................................... 38
5.10 Educational facilities .............................................................................................................................. 38
5.11 Sport & recreation facilities & local attractions .................................................................................. 39
6 CULTURAL ATTRIBUTES OF THE SHIRE ........................................................................... 42
6.1 Built (historic & architectural) heritage ................................................................................................ 42
6.2 Arts community ...................................................................................................................................... 42
6.3 Aboriginal cultural heritage ................................................................................................................... 42
7 THE ECONOMY OF THE SHIRE ........................................................................................... 46
7.1 Employment distribution ....................................................................................................................... 46
7.2 Businesses within the Shire .................................................................................................................. 47
7.3 Main economic drivers in the Shire ...................................................................................................... 48
7.4 Impact of drought on the Narrandera economy .................................................................................. 50
8 SETTLEMENT & LAND USE ................................................................................................. 52
8.1 Urban & village lands ............................................................................................................................. 52
8.2 Agricultural holdings.............................................................................................................................. 52
8.3 Rural small holdings .............................................................................................................................. 54
8.4 General land use in the Shire ................................................................................................................ 54
9 TRANSPORT CORRIDORS .................................................................................................. 56
9.1 Temora to Roto rail corridor .................................................................................................................. 56

Shire Profile & Key Issues
Newland Planning & Development and Narrandera Shire Council Page 6 of 101
9.2 Junee to Hay rail corridor ...................................................................................................................... 56
9.3 Narrandera to Tocumwal rail corridor .................................................................................................. 57
9.4 National highways .................................................................................................................................. 57
9.5 State highways and main roads ............................................................................................................ 57
9.6 Local arterial and other roads ............................................................................................................... 58
9.7 Air transport ............................................................................................................................................ 60
9.8 Private sector coach transport .............................................................................................................. 60
9.9 Heavy freight through the Shire ............................................................................................................ 60
9.10 Trends in freight management .............................................................................................................. 61
10 UTILITIES & INFRASTRUCTURE ......................................................................................... 63
10.1 Major energy corridors .......................................................................................................................... 63
10.2 Utilities ..................................................................................................................................................... 65
10.3 Trends and key issues for infrastructure provision ........................................................................... 67
11 NATURAL FEATURES OF THE SHIRE ................................................................................ 70
11.1 Climate ..................................................................................................................................................... 70
11.2 Physical landscape................................................................................................................................. 70
11.3 Sensitive lands – biodiversity ............................................................................................................... 73
11.4 Sensitive lands – water and groundwater ............................................................................................ 75
11.5 Sensitive lands – land attributes ........................................................................................................... 75
11.6 Threatened species ................................................................................................................................ 78
12 NATURAL RESOURCES ...................................................................................................... 80
12.1 Forests ..................................................................................................................................................... 80
12.2 Mining ...................................................................................................................................................... 80

Shire Profile & Key Issues
Newland Planning & Development and Narrandera Shire Council Page 7 of 101
12.3 Extractive Industry ................................................................................................................................. 80
13 NATURAL HAZARDS ............................................................................................................ 82
13.1 Flooding ................................................................................................................................................... 82
13.2 Bushfire prone land ................................................................................................................................ 84
13.3 Dryland salinity ....................................................................................................................................... 85
13.4 Urban salinity .......................................................................................................................................... 85
13.5 Drought and climate change ................................................................................................................. 85
14 COUNCIL AND AGENCY WORKSHOPS .............................................................................. 87
14.1 Workshop with councillors & senior staff ........................................................................................... 87
14.2 Workshops with government & non-government agencies............................................................... 89
15 KEY ISSUES & OPPORTUNITIES FOR NARRANDERA SHIRE .......................................... 94
15.1 Community and social issues ............................................................................................................... 94
15.2 Infrastructure provision and enhancement ......................................................................................... 96
15.3 Local and regional economy ................................................................................................................. 97
15.4 Key opportunities for the Shire ............................................................................................................. 99
Shire Profile & Key Issues
Narrandera Shire Council and Newland Planning & Development Page 8 of 101
1 INTRODUCTION
1.1 Background to the Shire profile
The Shire profile forms the first part of the Narrandera land use strategy, which in turn will influence the new local environmental plan for Narrandera (the town and Shire plan) The aim of the profile is twofold:
1. to establish the current status of the people, economy, transport, settlement, environment, utilities and resources of the Shire, and
2. to determine the trends which are affecting the Shire and the key issues which may be relevant to the Shire land use and planning strategy.
The identification of the key issues helps to target areas for more detailed review in the land use strategy.
1.2 Background to the Narrandera Land Use Strategy
Narrandera’s last land use strategy and comprehensive Shire plan was prepared in the late 1980’s, and before that the land use plan dated to 1969. This is quite a long time between the preparation of strategic land use plans. The land use strategy will look at Narrandera’s needs over the next 20 years and will provide a planning response to those needs. The strategy will recommend areas that should be rezoned to accommodate changes in development, and will recommend particular land use controls designed to achieve the various aims of the plan. The land use strategy will determine the direction for new and recycled housing, subdivisions, urban consolidation, community facilities, industrial and commercial lands, rural lands use, natural hazards planning and other land use matters within the Shire of Narrandera, particularly within the towns of Narrandera, Barellan and Grong Grong. The land use plan and the future local environmental plan is one tool available to the Council in planning for Narrandera’s future. Other tools include the Community Strategic Plan (CSP), the Council’s Operations plan, and the Development Control Plan (which provides more detailed guidance to town and Shire development). Together these plans and actions will guide the social and economic development of Narrandera. The relationship of the Shire profile to the eventual local environmental plan for the Shire is shown diagrammatically in Chart 1.

Shire Profile & Key Issues
Newland Planning & Development and Narrandera Shire Council Page 9 of 101
Chart 1 Relationship of the Shire profile to the land use strategy and other Council strategies
1.3 The Shire at a glance
The Narrandera Shire is located in the western Riverina area of New South Wales (NSW). The Shire has an area of 4,116.6km2 with the main urban area, the Narrandera Township having an area of 8.4 km2. The Shire is bordered to the west by the local government areas of Murrumbidgee, Leeton, Griffith, to the north by Carrathool and Bland, to the east by Coolamon and Wagga Wagga and to the south by Lockhart and Urana.
Shire profile & key issues
Housing strategy Rural lands strategy Commercial & retail
strategy
Land use strategy for towns and rural area
Local environmental plan for whole Shire
LEP maps and written document
Development Control Plan for housing,
business, industry etc
Community Strategic Plan
Council’s Operational Plan
Industrial land strategy
Other related research & analysis

Shire Profile & Key Issues
Newland Planning & Development and Narrandera Shire Council Page 10 of 101
Figure 1 Narrandera is located in the western Riverina area in the south of NSW
The revised Shire population in 2006, according to the Australian Bureau of Statistics (ABS)1, was 6,267 persons. The Shire population is forecast to decline, and has declined over the past one and a half decades. The Shire has an ageing population, with 18.9% of the population 65 + years old in 2006, which is above the State average of 13.7% but not as high as some rural towns. The Aboriginal population comprises 9.3% of the Shire population (2006), and 12.6% of the Narrandera Township population (2006), which is well above the State average. Broad acre agriculture, dry land farming is a staple of the Shire, with important inputs from the transport, retail and government sectors. The Shire is at the head waters of the Murrumbidgee Irrigation Area. Narrandera Township features the intersection of the National Newell Highway and the State Sturt Highway. Narrandera Township is well known for its peaceful river frontages and its Koala habitat. The Township is known for its beautiful street trees and riverine environment, especially the Lake Talbot area which features a swimming pool complex and caravan park, set against a backdrop of the extensive red gum forest and constructed lake. The next largest township is Barellan, with a population of 364 persons in 2006. Barellan is located to the north of the Shire and the town residents tend to gravitate to Griffith as the service and employment centre. The village of Grong Grong is located in the eastern part of the Shire and has an approximate population of 97 persons. Other small settlement localities include Binya and Corobimilla.
1 ABS Catalogue 3218.0 Regional Population Growth, Australia 2001-2009 (March 2010)

Shire Profile & Key Issues
Newland Planning & Development and Narrandera Shire Council Page 11 of 101
2 THE PEOPLE OF NARRANDERA SHIRE
The Narrandera Shire has urban based populations in the Narrandera Township and the villages of Barellan and Grong Grong. The Narrandera Township provides the majority of the Shire population (two thirds) and has the majority of Aboriginal persons in the Shire (89%). For this reason the people of the Shire will be examined in the following ways.
The village of Barellan will be summary profiled, as it has sufficient population to have urban locality data from the ABS;
The overall Shire will be summary profiled with comparisons to the Narrandera Township where relevant, and
The Aboriginal population of Narrandera Shire will be summary profiled with comparisons made to the non-Aboriginal population of Narrandera Township where relevant.
This will enable the Narrandera Township specific demographics to be examined and conclusions drawn for the key issues facing the town in the future.
2.1 Shire population and urban locations
Note: The following information has been obtained from the ABS 2001 and 2006 Census Basic Community Profile and Time Series Profile for the Narrandera Shire (LGA 15800), the Narrandera urban area (UCL 159400), the Barellan urban area (UCL 104000), the Narrandera Shire Aboriginal Profile (ILOC 0601501), and the ABS Regional Population Growth, Australia March 2010 release, unless otherwise stated. Figures are based on place of usual residence, unless otherwise stated.
Figure 2 Local Government Area of Narrandera. Source: ABS 2007
The revised 2006 Shire population was 6,267 persons. The majority (two thirds) of the population resided in the town of Narrandera- a total of 3,962 persons (2,070 females and 1,892 males). The Aboriginal population of the Narrandera Township was 501 persons (12.6% of the town).

Shire Profile & Key Issues
Newland Planning & Development and Narrandera Shire Council Page 12 of 101
Figure 3 Urban area of Narrandera Township. Source: ABS 2007
According to the ABS the Narrandera urban area is 8.4 km2. The rural areas of the Shire, including the villages of Grong Grong and Barellan had 2,050 persons in 2006.
2.2 Profile of Barellan village
The village of Barellan has sufficient population to qualify as an urban centre or locality and had a 2006 population of 364 persons, with four more females than males. The ABS records Barellan as having an urban area of 4.2 km2. Barellan is located on the Burley Griffin Way, approximately55 km north of Narrandera Township and 53 km east of the city of Griffith.
Figure 4 Urban area of Barellan village. Source is https://six.maps.nsw.gov.au/wps/portal/.

Shire Profile & Key Issues
Newland Planning & Development and Narrandera Shire Council Page 13 of 101
The population age of the village is relatively balanced, with the breakdown as follows. Age 65+ 18% Age 40-64 35% Age 25-39% 16% Age 15-24% 10% Age less than 15 18% The village has approximately 136 developed residential properties, based on the number of individual domestic waste rates paid, however the present residential property vacancy rates are not known. Barellan fulfils a local rural service role and has a significant number of businesses and services/community facilities befitting this role. These include:
Public pool, tennis courts and basketball court complex;
Golf course;
War Memorial Club and Bowls;
Barellan Community Health Centre;
Post Office;
General Store incorporating newsagent and videos;
Café and pizza shop;
Paint and Panel Smash Repairs;
Hairdresser;
Pre-loved clothing;
Gift Shop;
Livestock and Property Agent;
Tyre and fuel centre;
Local Museum;
Art Studio;
Commercial Hotel;
Uniting Church;
St Theresá’s Church;
Masonic Hall.
The village has approximately 17 developed properties paying the business (commercial or industrial) domestic waste charge. There are two closed food premises and one closed auto premises. The village also has a number of significant grain storage facilities. An important feature and business to the town is the Barellan Central School (Kindergarten to Year 12), having approximately 110 students generally originating half from Barellan and half from the surrounding rural area. What does this tell us? Barellan is an important local service centre for the Narrandera and greater district. The Central School is vital to the town and every effort should be made by the Council to support the town as the opportunity arises.

Shire Profile & Key Issues
Newland Planning & Development and Narrandera Shire Council Page 14 of 101
2.3 Profile of Grong Grong village
The village of Grong Grong is located around 20 km east of Narrandera and does not have sufficient population to qualify as an urban centre for ABS purposes. However based on the Census collection district surrounding Grong Grong, the village area had an approximate 2006 population of 97 persons and an area of 1.9 km2. The village is located adjacent to the Newell Highway and has approximately 43 developed residential properties, based on the number of individual domestic waste rates paid, however the present residential property vacancy rates are not known.
Figure 5 Village of Grong Grong. Source is https://six.maps.nsw.gov.au/wps/portal/.
The village has approximately 5 developed properties paying the business (commercial or industrial) domestic waste charge. Village businesses include a general store, Post Office, Royal Hotel, stock and station agent, mechanic/auto repairs, motel with licensed restaurant and PIC Australia. The village also has substantial grain storage facilities. Services and sports groups include the local sports club, the Ganmain Grong Grong Matong AFL Club, Fishing Club, Rodeo and Gymkhana Club, St Matthew’s Church and St Patrick’s Church, Community Hall and Progress Committee. An important part of the village is the Grong Grong primary school, with approximately 15 students A very important industry in the village area and for the Shire is PIC Australia, which is located 3km southeast of the Village. PIC are a specialist pig breeding, growing and genetics company, with approximately 2000 breeding sows and an annual turnover of 30,000 pigs for slaughter, on their site around 3km south east of the village. PIC has 28 on-farm employees and 10 in the village office, making it one of the Shire’s larger employers.

Shire Profile & Key Issues
Newland Planning & Development and Narrandera Shire Council Page 15 of 101
What does this tell us? The village of Grong Grong is a service centre for the surrounding rural area and is the base for one of the Shire’s most important rural industries. Every effort should be made by the Council to support the town as the opportunity arises.
2.4 Population mobility – Narrandera Township and Shire
The ABS provides an indication of population mobility by recording persons who lived in the same usual address one year ago, and five years ago. Mobility is reflected by persons moving within the same town and into the town from within the Shire from elsewhere. Within the period 2001 to 2006, 865 persons moved to another address within the Shire. In that same period 891 persons moved into the Shire from outside the Shire, the majority (668) moving from within NSW. Despite this movement into the Shire, the population dropped from 6,739 in 2001 to 6,627 in 2006 – and births and deaths were more or less equal during this period (see below). In terms of the Narrandera Township, 663 persons moved either within the town or from elsewhere in the Shire between 2001 and 2006. In addition to this internal Township movement, 577 people moved into the town from outside the Shire, the majority (420) from NSW. In total there were 1,271 people (or over 500 average size households) who between 2001 and 2006 changed house in the Township of Narrandera. Despite this movement into the Town, the Township population dropped from 4,119 in 2001 to 3,962 in 2006 with births and deaths more or less equal. By way of comparison to other towns from 2001 to 2006, over that same five year period the 14.6% population movement into the Township of Narrandera from outside the Shire compares with 22% for Wagga Wagga. What does this tell us? The Narrandera and Township are both experiencing strong migration into the Shire, but the overall population of the town and Shire is dropping. This was despite the rate of births and deaths being more or less equal – as an indicator between 2003 and 20072 there were an average of 79 births per annum and an average of 75 deaths per annum - more or less equal. However, notwithstanding the historic migration rate into the town and Shire, Narrandera’s overall Shire population has declined over the period from 1996 to 2006 (based on the ABS census data, and regional population growth figures3). Year
Migration to Shire
Shire pop. % change
Migration to Town
Town pop. % change
2001-2006 891 6,739 to 6,627 - 1.6% 577 4,119 to 3,962 -3.8% Table 1 Migration into Town & Shire vs population change
The figures in Table 1 show that by proportion the town population is declining faster than the Shire population, even though the Town received 577 (65%) out of 891 persons moving into the Shire.
2 ABS Catalogue 3301.0 Births 2003-2007 (Oct 2008) and ABS Catalogue 3302.0 Deaths 2003-2008 (Nov 2009)
3 ABS Catalogue 3218.0 Regional Population Growth, Australia 2001-2009 (March 2010)

Shire Profile & Key Issues
Newland Planning & Development and Narrandera Shire Council Page 16 of 101
There is a general trend for people to move into the Shire, and for the Shire and Town not to hold all of those people or existing residents. Some of those who leave go to Wagga or other larger centres. The challenge for Narrandera, along with many other smaller country towns, is to find ways to hold the existing population and those persons who move here for work, family and lifestyle reasons.
Cultural diversity – Narrandera town
Aboriginal persons
In the 2006 census the Narrandera Township registered 501 persons of Aboriginal status. This represents a not insignificant 12.6% of the town population. Of these persons 332 were 19 years old or less, 332 persons were 29 or under and only 23 (less than 5%) were 65 years or older. The Aboriginal population of the town provides for significant cultural diversity, through beliefs, family connections and age groups. The Aboriginal population is profiled in more detail in section 2.11.
Country of birth
Similar to most rural towns the absolute majority of residents were born in Australia (90%). Persons born in the United Kingdom formed the next largest group (62 persons or 16%) whilst less than 10 residents (respectively) were born in Poland, New Zealand, the Netherlands, Malaysia, Japan, Italy, Ireland, Iraq, Greece, Germany and China. The Narrandera population is relatively homogenous with respect to Australian origin compared to some larger regional centres and metropolitan areas.
Religion
The Christian religions are the dominant grouping for religious affiliation in Narrandera. Around 30% of residents identify as being Catholic, with the same proportion for Anglican. Other Christian religions include Lutheran (0.5%), Pentecostal (1.4%), Presbyterian (4.2%) and Uniting Church (8.6%). Interestingly, 459 persons (11.5%) stated they had no religion and 286 persons (7.2%) did not state their affiliation, when combined around 19% of the population.
2.5 Population age profile – Narrandera Shire and town
Median age comparison
In 2001 the median age of persons in Narrandera Shire was 39 and in 2006 it was 41. This compares with the 2006 median age for persons in NSW of 37. An above State average median age is common for rural towns. By 2031 the median age for Narrandera Shire is expected to be 51, the highest in the Murrumbidgee region.4 In 2006 the median age of persons in Narrandera Township was 42, which indicates that the rural population is slightly younger than that of the town. This is not unusual, as farming families traditionally restructure the holding as the parents grow older. Persons of higher age also may move into town to take advantage of the available medical, housing and social facilities. The relative size of age groups in the town and Shire is also discussed in section 2.6.3.
4 The Essence Consulting Group May 2009, Teloca House Needs Analysis Report

Shire Profile & Key Issues
Newland Planning & Development and Narrandera Shire Council Page 17 of 101
Persons by age
Chart 2 shows the number of persons in each age group in the Shire with a comparison between 2001 and 2006. Between 2001 and 2006 the number of 10-14 year olds increased slightly, as did the number of 45 to 49 year olds and 60 to 64 year olds. A large jump was recorded in the 55-59 year age bracket (increase of 30%). The number of persons over 75 years of age also increased. Between 2001- and 2006 there was a notable drop in the younger age groups – between 0 and 9 years of age and smaller drops in the 15 to 29 year old bracket. There was also a notable drop in the 70 to 74 year old age group.
Chart 2 Narrandera Shire persons by age 2001 - 2006
Relative age groups in the rural area
The population of the Narrandera Township in 2006 was 66% or two thirds of the overall Shire population. This proportion of course does not hold true for all age groups. Chart 3 compares the relative percentage of each age group who live in town versus the rural areas of the Shire.
Narrandera Shire age group comparison 2001-2006
0
200
400
600
Age groups
Nu
mb
er
of
pers
on
s
2001
2006
2001 449 530 499 420 302 325 337 452 496 433 438 330 312 309 327 248 150 120
2006 400 420 520 380 290 320 340 360 420 470 410 430 350 300 270 270 180 150
0-4 5-910-
14
15-
19
20-
24
25-
29
30-
34
35-
39
40-
44
45-
49
50-
54
55-
59
60-
64
65-
69
70-
74
75-
79
80-
8485+

Shire Profile & Key Issues
Newland Planning & Development and Narrandera Shire Council Page 18 of 101
Chart 3 Average town to Shire population percentage versus actual population, by age group
The Chart shows that the rural areas have a higher proportion than the average of 34% in the 10 to 14 and 14 to 19 year age groups, whilst the age brackets of 20 to 24, 25 to 29 and 30 to 34 have a lower proportion than the average in the rural areas. Put simply the rural areas have a significant population of younger school age groups, but following school age up to about age 35 there are less persons than the average in the rural areas. Again from the ages of 40 to 60 there is a higher than the average number of persons in the rural area (the middle ages working group) whilst from the age of 65 and above the above average trend returns back to the town population.
Age profile comparison to Wagga Wagga
Chart 4 compares the proportion of various age groups within the Narrandera Shire to those of the Wagga Wagga City – the largest regional centre of the Riverina. The Chart shows that the age groups up to age 14 are relatively even in proportion, but the large regional centre holds the 15 to 24 age group to a much higher extent. The movement of youth out of smaller rural areas due to work and social preferences is a common occurrence.
Average town to Shire population %
versus actual % by age group
0102030405060708090
0-4
10-1
4
20-2
4
30-3
4
40-4
4
50-5
4
60-6
4
70-7
4
80-8
4
Age groups
Pe
rce
nta
ge
Average % town
population (66%)
Actual % town
population

Shire Profile & Key Issues
Newland Planning & Development and Narrandera Shire Council Page 19 of 101
Chart 4 Comparison of Narrandera to Wagga relative size of age groups
The Chart also reflects the larger proportion of middle age workers in Narrandera (see section 2.6.3 above) and the higher rate of aged persons 65 years plus in the Narrandera Shire.
Projected population age groups
Chart 5 provides population projections by age groups commencing in 2006 and focusing on 2021 and 2036. The information is from the NSW Department of Planning. The Chart shows a significant fall in all age groups between 0 and 24 years in both 2021 and 2036, a moderate fall in the age groups between 25 and 39 years, and significant falls again between the age groups of 40 and 59 years.
Chart 5 Narrandera Shire age projection 2006-2036
Note: The figures in this Chart are sourced from the NSW Department of Planning.
Comparison Narrandera to Wagga relative size of age groups
0
5
10
15
20
25
30
Age groupsPerc
en
tag
e o
f p
op
ula
tio
n
Narrandera Shire
Wagga Wagga City
Narrandera Shire 6.4 15.1 10.6 22.2 26.7 14.6
Wagga Wagga City 7.1 14.9 17.2 25.7 22.7 12.3
0-4 5-14 15-24 25-44 45-64 65+
Narrandera Shire age projections 2006-2036
0
100
200
300
400
500
600
0-4
5-9
10-1
4
15-1
9
20-2
4
25-2
9
30-2
4
35-3
9
40-4
4
45-4
9
50-5
4
55-5
9
60-6
4
65-6
9
70-7
4
75-7
9
80-8
4
85+
Age groups
Nu
mb
er
of
pers
on
s
Year 2006
Year 2021
Year 2036

Shire Profile & Key Issues
Newland Planning & Development and Narrandera Shire Council Page 20 of 101
From the year 2021 the number of 60 to 64 year olds exceeds the 2006 figure and from 2021 onwards the number of persons aged 64 and above exceeds the 2006 figures. In 2036 the age groups of 75 to 79, 80 to 84 and 85 and above peaks at significantly higher figures than in 2006 and 2021. By 2031 the number of persons aged 65+ years will comprise over 32% of the Shire’s population.5 What does this tell us?
The number of young persons aged 0 to 9 dropped significantly between 2001 and 2006, however the Commonwealth Government’s ‘baby bonus’ in the late 2000’s may see an increase in this age group at the next Census. The influence of the baby boomer generation was felt, with a large increase of 30% (by 100 persons) in the 55 to 59 years age group. Given the date of the last Census many persons in this age group would be approaching or at retirement in the next 2-3 years. In the next 15 to 20 years this group of persons will put more pressure on aged care and medical facilities.
Generally the population is ageing and the median age is increasing. As the population ages and the number of young people drops by percentage there will likely be less persons of working age to support those of dependent age or needs.
The rural areas of the Shire have a significant population of school age young people who contribute to the Shire community and require suitable social and recreational outlets.
A challenge for the Shire is to find sufficient work and lifestyle opportunities to hold youth up to age 30 or so in the Narrandera Township, if not the Shire generally.
2.6 Family & household composition – Narrandera town
Family type
2001 2006 Change
Couple family no children
432 432 0
Couple family with/without children or students
427 450 +23
One parent families
178 283 +105
Other families Total family households
18 1,055
19 1,184
+1 +129
Table 2 Family composition Narrandera Township 2001-2006
Table 2 indicates that there was a small rise in couples families generally between 2001 and 2006, whilst there was a large rise in one parent families – in the order of 59%. These figures should be treated with a deal of caution however, as there are discrepancies in the ABS figures for 2006 and the population of the town dropped from 4,119 in 2001 to 3,962 in 2006. These figures will have to be revised through the 2011 Census. See also section 2.8 below.
5 The Essence Consulting Group May 2009, Teloca House Needs Analysis Report

Shire Profile & Key Issues
Newland Planning & Development and Narrandera Shire Council Page 21 of 101
2.7 Household structure – Narrandera town
In 2001 the average household in Narrandera Township had 2.4 persons. In 2006 the figure was 2.3 persons. There is a State-wide trend towards smaller household sizes due to an ageing population and an increasing number of single parent households. This trend is expected to hold true for Narrandera. Table 3 also shows that the number of single person households increased by 27 or 5% between 2001 and 2006 and the number of households with five persons decreased by 25, or 24%. Household structure
2001 2006 Change
Lone person household
490 517 +27
Non-family household (group house)
36 31 -5
Family household 2 persons
502 502 0
Family household 3 persons
200 201 +1
Family household 4 persons
192 186 -6
Family household 5 persons
104 79 -25
Family household 6 persons 44 46 +2 Table 3 Household structure Narrandera Township 2001-2006
What does this tell us? As the population of the Shire and town ages over the next 20-25 years there will be an increasing demand for smaller dwellings with lower maintenance requirements. The increasing number of single parent families and lone person households will also influence this trend. The location and house and land package cost of smaller dwellings will be different from traditional new housing estates with larger size blocks and four bedroom houses. Planning controls will need to change to accommodate opportunities for existing suitable residential areas to accommodate in fill housing.
2.8 Dwelling type – Narrandera Township
Narrandera is a town comprised mostly of single storey separate houses. There are a small number of semi-detached houses or townhouses, and a small number of flats blocks and flats above shops. Table 4 below provides comparative data from 2001 and 2006 on dwelling type. The numbers do not change much, except for a drop in semi-detached housing numbers in 2006. This is probably an error in interpretation, as the town would not have lost 34 dwellings. Dwelling type
2001 2006
Separate house
1,419 1,412
Semi-detached, row or townhouse
68 34
Flat, unit or apartment
99 92
Other dwelling, improvised home House or flat attached to shop, office
23 33
21 21
Table 4 Dwelling type in Narrandera Township 2001 & 2006

Shire Profile & Key Issues
Newland Planning & Development and Narrandera Shire Council Page 22 of 101
What does this tell us? The town’s dominant housing type is the separate detached single storey house, and this is likely to continue into the future as a viable and preferred form of housing. The challenge for the Council, the market and the community is to find the right location and size of these separate houses to suit the needs of the community.
2.9 Housing tenure and landlord type
Housing tenure tells us whether a person is renting, buying their own house, owns their own house or is in some form of subsidised housing. The 2001 and 2006 Census periods differed in the questions asked about type of rental, however some comparisons on tenure are available and are shown in Chart 6 below.
Chart 6 Narrandera Township housing tenure 2001-2006
Between 2001 and 2006 the proportion of properties being rented from either a real estate agent or housing authority was steady. However the number of fully owned properties dropped by 121 and the number of properties being purchased increased by 127. What does this tell us? Between 2001 and 2006 there was a redistribution of property ownership with an average of 24 fully owned dwellings per annum being sold and taken up by owners with a mortgage. The reasons for sale could include the age of the occupants – moving into different premises or moving out of town, to be replaced by younger persons or persons moving into the town.
2.10 Housing costs and household income – Narrandera town
Within the 2001 Census the Basic Community Profile for Narrandera Township provides a median range for attributes such as weekly rent, weekly family and household income and monthly housing loan repayments. The 2006 Census provides an exact single figure median. Nonetheless some comparison is available.
Narrandera township housing tenure 2001-2006
743
326
436
83
11
622
453 436
83
13
0
100
200
300
400
500
600
700
800
Fully owned Being
purchased
Rented Housing
authority
Co-op
schemeYear
Nu
mb
er
2001 2006

Shire Profile & Key Issues
Newland Planning & Development and Narrandera Shire Council Page 23 of 101
Cost or income 2001 median range
2006 median Change?
Monthly housing loan repayments
$600-$799 $758 Within 2001 range
Weekly rent
$100-$149 $110 Within 2001 range
Weekly individual income
$300-$399 $367 Within 2001 range
Weekly family income Weekly household income
$700-$799 $600-$699
$875 $645
Higher than 2001 Within 2001 range
Table 5 Narrandera Township housing & income 201 to 2006
The Narrandera Township’s median price for a separate dwelling (not a unit) for the 12 months to June 2010 was $160,0006. Auction clearance rates were 11% and average days on the market was 105. The average separate dwelling price for the region was $300,000 with an auction clearance rate of 37%. What does this tell us? The ABS statistics indicate that between 2001 and 2006 the median family income increased beyond the median range for 2001, whilst the housing loan repayments for 2006 were within the 2001 range, albeit the high end of the range. Narrandera’s housing market is relatively isolated by its location and doesn’t reflect the demand based price increases that other larger regional centres experience. Housing costs are significantly lower than say Wagga Wagga and Griffith, however the capital growth is also lower.
2.11 Population projections – Narrandera Shire
There are two specific population projections for Narrandera Shire available, one from the NSW Department of Planning7 covering the period 2006 to 2036 and the other from the Commonwealth Department of Health and Ageing8 covering the period 2007-2027. The Health and Ageing projections were prepared for that Department under commission to the Australian Bureau of Statistics, for the purpose of evaluating the ageing of the Australian population. Both projections were prepared to the Statistical Local Area, which in Narrandera’s case is the same as the Local Government Area. The projection from Health and Ageing is quite detailed, and provides the number of persons of each sex from age ‘0’ to age ‘85+’ for each year of the projection to 2027. The Department of Planning projection provides age by sex in 5 yearly age brackets, in 5 yearly date brackets to 2036. A third projection prepared by the ABS9 runs from 2001 to 2009 and provides the total estimated population for the Shire in yearly figures. Verbal advice from the ABS indicates that the most recent (revised) population estimates should be used for research purposes…the revised figures should even be used in place of the actual 2006 Census population figure.10
6 http://www.domain.com.au/Public/SuburbProfile 14/09/2010
7 NSW Department of Planning (2010) New South Wales Statistical Local Area Population Projections 2006-2036
8 Commonwealth Department of Health and Ageing 2008 Customised projections prepared for the Australian Government
Department of Health and Ageing by the Australian Bureau of Statistics 9 ABS Catalogue 3218.0 Regional Population Growth, Australia 2001-2009 (March 2010)
10 Pers com. Guy Jennings Australian Bureau of Statistics 13/09/2010

Shire Profile & Key Issues
Newland Planning & Development and Narrandera Shire Council Page 24 of 101
The available projections are actually quite similar, particularly the two long term projections. The table below provides the projections in summary. The Department of Planning figures have been rounded up or down to the nearest ‘100’. Source
2006 2007 2008 2009 2011 2016 2021 2026 2027 2031 2036
ABS
6,627 6,215 6,208 6,262 - - - - - - -
Ageing
- 6,200 6,159 6,116 6,032 5,808 5,562 5,291 5,230 - -
DoP 6,300 - - - 6,000 5,800 5,600 5,300 - 5,000 4,700
DoP % -1.45 - - - -0.77 -0.80 -0.85 -0.92 - -1.04 -1.18 Table 6 Population projection Narrandera Shire 2006 to 2036
In the Table, ABS refers to the Australian Bureau of Statistics Regional Population Growth SLA estimates 2001-2009. Ageing refers to the Commonwealth Department of Health and Ageing SLA projections 2007-2027 and DoP refers to the NSW Department of Planning SLA Population Projections 2006-2036 and the percentage change in the average annual growth rate (negative for all years). The population projection is also shown in Chart form below, using the Department of Planning statistics.
Chart 7 Population projection Narrandera Shire 2006 to 2036
What does this tell us? Any population projection is just that, a model with a set of assumptions and inputs, fixed over time. The model will only be as good as the inputs and assumptions behind it. However it is useful as a tool to follow trends through to their future conclusion.
Narrandera Shire population projection 2006-2036
6,627
6000 5800 56005300
50004700
0
1,000
2,000
3,000
4,000
5,000
6,000
7,000
Year
Po
pu
lati
on
2006
2011
2016
2021
2026
2031
2036

Shire Profile & Key Issues
Newland Planning & Development and Narrandera Shire Council Page 25 of 101
The projection shows that at the current rate the population of the Shire will decline significantly to the year 2036. The interesting part of the projection (not shown in the Chart) is the relationship between births, deaths and migration and the final population figure. What the background figures show is that births and deaths annually are relatively stable until the year 2021, whereupon there are 100 more deaths per 5 year bracket until 2036. This difference, combined with a steady net migration out of the Shire (200 persons every 5 years) means that the population decline accelerates from 2026 to 2036. Following from the population mobility discussion in section 2.4, the net migration of persons out of the Shire remains the key issue for the community.
2.12 Employment status in Narrandera Township
The 2006 unemployment rate for NSW was 5.9%. In 2006 the Township labour force comprised 1,630 persons (including 965 full time and 426 part-time workers) of whom 111 were unemployed – 6.8%. Within the whole Shire, only 117 people were unemployed. This compares to 2001 where the number of unemployed in the Township was the same but the labour force was slightly higher at 1,700, giving an unemployment rate of 6.5%. With respect to youth unemployment – persons aged between 15 and 24 years of age, in 2001 the youth labour force comprised 301 persons, with 46 persons or 15.3% unemployed. In 2006 the youth labour force was small, comprising 269 persons, but the unemployment rate was lower at 13.7%, or 37 persons.
2.13 Occupation – Narrandera Township
Between the 2001 and 2006 Census’ the categories description of occupation changed, particularly between the clerical and sales categories (which were combined in 2001). However the table below provides for some comparison. Note: The recorded workforce by occupation decreased from 1,592 persons in 2001 to 1,518 persons in 2006. Occupation 2001 2006 Change %
Managers 105 195 + 85%
Professionals 173 172 -
Technicians & trades 208 223 + 7.2%
Community & personal services, clerical, administrative and sales
429 459 + 7.0%
Machinery operators & drivers 158 139 - 12.0%
Labourers 301 296 - 1.6% Table 7 Narrandera Township workforce by occupation
What does this tell us? Within the Narrandera town economy the type of occupations and job descriptions changed significantly between 2001 and 2006. Whilst the occupation category of labourers and professionals remained almost the same, the number of jobs/occupations described as ‘managers’ increased by almost double, the number of technicians and trades increased by around 7%, and the machinery operators and drivers decreased by 12%. The analysis of the community services,
Shire Profile & Key Issues
Newland Planning & Development and Narrandera Shire Council Page 26 of 101
clerical/administration and sales sectors is made difficult by the 2001 combining of categories. The 2011 Census may provide more obvious comparison in this regard.
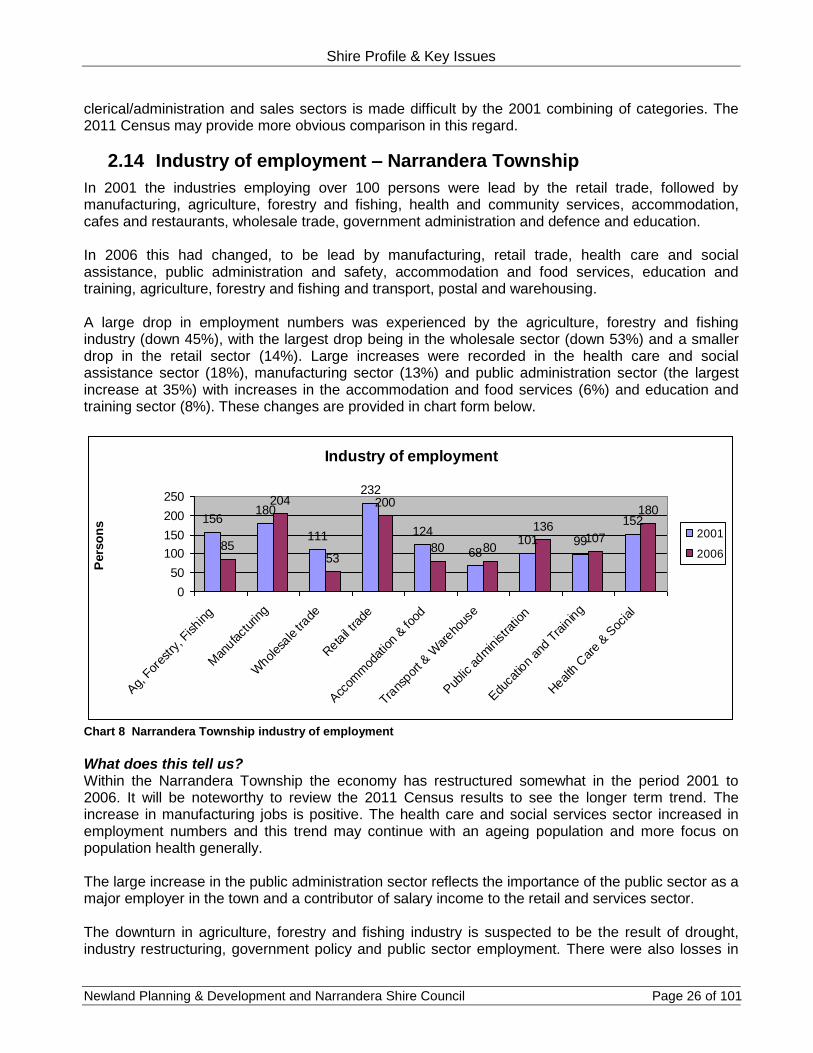
2.14 Industry of employment – Narrandera Township
In 2001 the industries employing over 100 persons were lead by the retail trade, followed by manufacturing, agriculture, forestry and fishing, health and community services, accommodation, cafes and restaurants, wholesale trade, government administration and defence and education. In 2006 this had changed, to be lead by manufacturing, retail trade, health care and social assistance, public administration and safety, accommodation and food services, education and training, agriculture, forestry and fishing and transport, postal and warehousing. A large drop in employment numbers was experienced by the agriculture, forestry and fishing industry (down 45%), with the largest drop being in the wholesale sector (down 53%) and a smaller drop in the retail sector (14%). Large increases were recorded in the health care and social assistance sector (18%), manufacturing sector (13%) and public administration sector (the largest increase at 35%) with increases in the accommodation and food services (6%) and education and training sector (8%). These changes are provided in chart form below.
Chart 8 Narrandera Township industry of employment
What does this tell us? Within the Narrandera Township the economy has restructured somewhat in the period 2001 to 2006. It will be noteworthy to review the 2011 Census results to see the longer term trend. The increase in manufacturing jobs is positive. The health care and social services sector increased in employment numbers and this trend may continue with an ageing population and more focus on population health generally. The large increase in the public administration sector reflects the importance of the public sector as a major employer in the town and a contributor of salary income to the retail and services sector. The downturn in agriculture, forestry and fishing industry is suspected to be the result of drought, industry restructuring, government policy and public sector employment. There were also losses in
Industry of employment
156180
111
232
124
68101 99
152
85
204
53
200
80 80
136107
180
0
50
100
150
200
250
Ag,
For
estry
, Fishin
g
Man
ufact
uring
Whol
esale
trade
Reta
il tra
de
Acc
omm
odat
ion
& fo
od
Trans
port &
War
ehous
e
Pub
lic a
dmin
istra
tion
Edu
catio
n an
d Tra
ining
Heal
th C
are
& S
ocial
Pers
on
s
2001
2006

Shire Profile & Key Issues
Newland Planning & Development and Narrandera Shire Council Page 27 of 101
the retail and accommodation/food sector, a factor of the drought, less income to spend in town and a small decline in population. To a certain extent the industry of employment/employment status of Narrandera residents is dependent on the regional economy. Anecdotal evidence suggests that a considerable number of persons residing in Narrandera actually work outside the Shire in the horticulture, viticulture, food processing and manufacturing industries. These people typically travel to the Leeton and Griffith local government areas.
2.15 Workforce tertiary qualifications – Narrandera Shire
In 2001 there 8 persons in the Township with a Post Graduate Degree, 149 persons with a Bachelor Degree and 25 persons with a Graduate Diploma or Graduate Certificate. Relatively the same were the 2006 figures respectively of 11, 147 and 21. For TAFE level qualifications, the 2001 figures were 98 persons holding an Advanced Diploma or Diploma and 407 persons holding a Certificate. In 2006 the figures were 118 and 529 persons respectively.
2.16 Workforce dependency ratio
The dependency ratio is the number of dependents (under 15 and over 65 years) per 100 of the population aged 15-64. In 2001 the Narrandera dependency ratio was 66.5. In 2031 the ratio is projected to be 92.3. What does this tell us? With respect to TAFE qualifications, the town has seen a significant increase in the number of persons holding Diploma/Advanced Diploma and Certificate level qualifications. This means that the workforce has a higher skill basis than previously. A higher skill base may lead to increases in productivity and pay/conditions. It is interesting to compare the increase in Diploma and Certificate holders with the large increase in Managers (by occupation) from 2001 to 2006. It is possible that the two are related, but perhaps not on a one for one basis, there are probably other workforce/industry restructuring reasons. Of importance is the workforce dependency ratio. The ageing of the population will mean that the working population has to support a great many more people than previously. This point alone is worthy of a specific strategy to buffer this significant change.

Shire Profile & Key Issues
Newland Planning & Development and Narrandera Shire Council Page 28 of 101
3 SOCIO-ECONOMIC INDEXES FOR AREAS (SEIFA)
The Australian Bureau of Statistics produces a product called SEIFA – or Socio-economic Indexes for Areas. Socio-Economic Indexes for Areas is a product developed especially for those interested in the assessment of the welfare of Australian communities. The ABS has developed indexes to allow ranking of regions/areas, providing a method of determining the level of social and economic well-being in each region Each of the indexes summarises different aspects of the socio-economic conditions of people living in an area; each is based upon a different set of social and economic information from the 2006 Census. The indexes provide more general measures of socio-economic status than is given by measuring, for example, income or unemployment alone. SEIFA has a number of applications, including research into the relationship between socio-economic status and various health and educational outcomes, determining areas that require funding and services, and identifying new business opportunities SEIFA uses, among other measures, scores and rank. A lower score indicates that an area is relatively disadvantaged compared to an area with a higher score. To enable easy recognition of high and low scores, the CD index scores have been standardised to have a mean of 1,000 and a standard deviation of 100 across all CDs in Australia. For the ranking within State or Territory, all areas within each State or Territory are ordered from lowest to highest score, then ranks, deciles and percentiles are assigned to each area within that State or Territory. These State/Territory ranks, deciles and percentiles can only be used to compare areas within a single State or Territory.
3.1 Relative socio-economic disadvantage
Table 8 below presents the index of relative socio-economic disadvantage of the Shire when compared to other local government areas. The index is derived from Census variables related to disadvantage, such as low income, low educational attainment, unemployment, and dwellings without motor vehicles. The lowest ranked Shire and highest ranked Shire have been included for context. Narrandera is the 21st most disadvantaged local government area in the State. Lockhart Shire represents the average index score for the State (Index of 1,000), with Wagga Wagga also right on the average. The Index score for Narrandera indicates that the Shire has the most relative socio-economic disadvantage of all Shires it adjoins, followed by Urana and Murrumbidgee Shires. Council Area Index of Relative Socio-
economic disadvantage Rank in NSW
Brewarrina 765 1 Narrandera 932 21 Carrathool 986 92 Bland 983 88 Coolamon 973 75 Leeton 969 70 Lockhart 1,000 108 Urana 945 38

Shire Profile & Key Issues
Newland Planning & Development and Narrandera Shire Council Page 29 of 101
Council Area Index of Relative Socio-economic disadvantage
Rank in NSW
Murrumbidgee 952 43 Wagga Wagga 999 106 Ku-rin-gai 1,143 153
Table 8 Index of relative socio-economic disadvantage including Narrandera Shire
3.2 Index of economic resources
Table 9 below presents the index of economic resources of the Shire when compared to other local government areas. ‘Economic resources’ focuses on Census variables like the income, housing expenditure and assets of households. The lowest ranked Shire and highest ranked Shire have been included for context. Narrandera is the 22nd lowest ranked local government area in the State with regard to economic resources. Lockhart again represents the mean for the State. Narrandera has the least access to economic resources than all surrounding Shires. Council Area Index of Economic
Resources Rank in NSW
Brewarrina 805 1 Narrandera 947 22 Carrathool 1001 97 Bland 995 100 Coolamon 979 83 Leeton 979 80 Lockhart 1,000 106 Urana 965 53 Murrumbidgee 976 72 Wagga Wagga 985 87 Ku-rin-gai
1,178 153
Table 9 Index of economic resources including Narrandera Shire
3.3 Index of education and occupation
Table 10 below presents the index of education and occupation of the Shire when compared to other local government areas. ‘Education and occupation’ includes Census variables relating to the educational and occupational characteristics of communities, like the proportion of people with a higher qualification or those employed in a skilled occupation. Narrandera is the 30th lowest local government area in the State for educational and occupational characteristics. Leeton has a lower State ranking than Narrandera, otherwise the surrounding Shires are ranked than higher than Narrandera for this Index. Council Area Index of Education and
Occupation Rank in NSW
Cessnock 878 1 Narrandera 928 30 Carrathool 967 89 Bland 951 76 Coolamon 946 69 Leeton 923 25

Shire Profile & Key Issues
Newland Planning & Development and Narrandera Shire Council Page 30 of 101
Council Area Index of Education and Occupation
Rank in NSW
Lockhart 978 101 Urana 946 70 Murrumbidgee 935 43 Wagga Wagga 971 94 North Sydney
1,217 153
Table 10 Index of education and occupation including Narrandera Shire
3.4 Narrandera’s relative socio-economic progress since 1986
Through SEIFA we are able to track the progress of the Shire over the last 20 years. The results are provided below in Table 11. Index 1986 1991 1996 2001 2006
Relative disadvantage
985 (highest score)
976 977 965 932 (lowest score)
Economic resources
955 917 (lowest score)
958 (highest score)
943 947
Education & occupation
915 (lowest score)
942 946 (highest score)
922 928
Table 11 Socio-economic progress of Narrandera
The Table provides a mixed result for economic resources, with little change over the past 20 years or so. For and education/occupation the index score has decreased over the past 10 years, although this may increase when the 2011 SEIFA results are released, as the tertiary education statistics for 2006 indicate a notable increase in TAFE certificate qualifications. The Index of Relative Socio-economic disadvantage clearly shows Narrandera decreasing steadily since 1986. Whether this is due to the Shire holding steady whilst other areas of the State move ahead, or whether the disadvantage is continuing to increase is a point for discussion. It must be remembered that the SEIFA data is generalised for the Shire, and is based on collection district data (a collection district covers roughly 200 persons). With regard to the data the ABS notes the following. “The concept of relative socio-economic disadvantage is neither simple, nor well defined. SEIFA uses a broad definition of relative socio-economic disadvantage in terms people's access to material and social resources, and their ability to participate in society. While SEIFA represents an average of all people living in an area, SEIFA does not represent the individual situation of each person. Larger areas are more likely to have greater diversity of people and households.”11
11
ABS Catalogue 2039.0 Information Paper: An Introduction to Socio-Economic Indexes for Areas (SEIFA), 2006 (March
2008)

Shire Profile & Key Issues
Newland Planning & Development and Narrandera Shire Council Page 31 of 101
4 PROFILE OF THE NARRANDERA SHIRE ABORIGINAL POPULATION
Note: The following information is derived from the ABS 2001 and 2006 Census Catalogue 2002.0 Indigenous Location Profile for Narrandera Shire
4.1 Aboriginal population
In 2001 there were 501 persons in the Shire who identified as being of Aboriginal or Torres Strait Islander descent (471 males and 254 females). There were also 264 persons who did not state their ‘Indigenous’ status within the Census. In 2006 there were 562 persons in the Shire who identified as being of Aboriginal or Torres Strait Islander descent (271 males and 291 females). It is possible that the actual number of Aboriginal persons may be significantly higher, as 221 persons did not state their ‘indigenous’ status in the Census. Aboriginal persons comprised 9.3% of the Shire population and 12.6% of the town population. The previous 12% growth rate for Aboriginal persons over five years is expected to continue for the 2006 to 2011 Census period.
4.2 Population age distribution
The Aboriginal population of the Shire is very young, having a median age of just 18, compared to the median age of 43 for non-Aboriginal people. Conversely the Aboriginal population has very few people over 65 years of age, just 4% of the Shire Aboriginal population, compared to 17.6% of the non-Aboriginal population.
Chart 9 Proportion of Aboriginal & non-Aboriginal persons within their own population
The marked difference in youth and the aged population is shown in Chart 9. Within the 5-14 years age group, Aboriginal persons comprised 30.3% of their population group, compared to 11.7% of the non-Aboriginal population in that age group.
Narrandera Shire - Percentage of persons within their own
Aboriginal & non-Aboriginal population
0
5
10
15
20
25
30
35
0-4 5-14 15-24 25-44 45-64 65+
Age groups
Perc
en
tag
e o
f p
op
ula
tio
n
Aboriginal persons as % of all
Aboriginal persons
Non-Aboriginal persons as % of
all non-Aboriginal persons

Shire Profile & Key Issues
Newland Planning & Development and Narrandera Shire Council Page 32 of 101
4.3 Household and family composition
There are some key differences in family and household composition between Aboriginal and non-Aboriginal families. With regard to couples without children, only 11% of Aboriginal couple families had no children, whereas 29% of non-Aboriginal couple families had no children. With regards to one parent families, 34% of the Aboriginal population had one parent families, whereas only 8% of the non-Aboriginal population had one parent families. 39% of Aboriginal one parent families had four or more persons, whereas 20% of non-Aboriginal one parent families had four or more persons. For lone person households the Aboriginal percentage was 14%, whereas the non-Aboriginal percentage was 31%. Generally then Aboriginal families have more children, a significantly higher proportion of one parent families, larger family sizes for one parent families, and a significantly lower proportion of lone person households, compared to non-Aboriginal families.
4.4 Housing tenure
The biggest differences in housing tenure between Aboriginal and non-Aboriginal persons related to fully owned houses and State housing authority rentals. 18% of households with Aboriginal persons fully owned their home, whilst 46% of non-Aboriginal households fully owned their home. 20.6% of Aboriginal persons lived in a household rented from a State housing authority, whereas 1.9% of non-Aboriginal persons lived in a rented housing authority home. Finally a higher percentage of Aboriginal persons lived in housing cooperative homes than non-Aboriginals (15% versus 8.8%). The proportion of Aboriginal and non-Aboriginal households with mortgages and renting their home from a real estate agent were similar.
4.5 Housing costs and income
In 2006 the median (mid-point figure) individual weekly income for Aboriginal persons was 25% lower than the income for non-Aboriginal persons ($288 per week compared to $384 per week). In 2006 the median weekly household income was 7% lower for Aboriginal households than non-Aboriginal households ($655 per week versus $705 per week). In 2006 the median monthly housing loan repayment for Aboriginal households was 9% lower than non-Aboriginal households ($711 per month versus $784 per month). In that same year the median weekly rent paid by Aboriginal households, according to the ABS, was 10% higher than that paid by non-Aboriginal households. Anecdotal advice suggests that the actual figure may be as much as 15%-20% higher per week.

Shire Profile & Key Issues
Newland Planning & Development and Narrandera Shire Council Page 33 of 101
4.6 Employment status
In 2006 there were 34 persons who identified as ‘Indigenous’ and were unemployed, out of an Indigenous workforce of 164 persons. This is an unemployment rate of 20.7%. By comparison the non-Indigenous workforce had an unemployment rate of 4.1%. In 2006 the labour force participation rate for Indigenous persons was 50.3% versus 58% for non-Indigenous persons. The percentage of employment to population for Indigenous persons in 2006 was 39.9% versus 55.6% for non-Indigenous persons. This is part reflects the strong youth population of Aboriginal people in the Shire. In 2001 there were 32 persons who identified as ‘Indigenous’ and were unemployed, out of an Indigenous workforce of 157 persons. This is an unemployment rate of 20.4%. By comparison the non-Indigenous workforce had an unemployment rate of 4.4%. The Indigenous unemployment rate did not improve between 2001 and 2006.
4.7 Occupation
Table 12 below compares by percentage the 2006 occupation of Aboriginal persons versus non-Aboriginal persons within their own workforce, within the Narrandera Shire. Occupation type
Aboriginal persons % Non-Aboriginal persons %
Managers 3.8 24.5 Professionals 8.3 10.6 Technicians & trade workers 10.6 11.9 Community & personal services 22.7 9.4 Clerical & administrative 9.1 9.8 Sales workers 8.3 7.3 Machinery operators/drivers 3.8 7.9 Labourers 28.8 16.6
Table 12 Occupation of Aboriginal persons within their own workforce
Table 12 shows that the Aboriginal population of the Shire has a significantly lower proportion of managers, and a lower proportion of professionals and machinery drivers/ operators than non-Aboriginal persons. The Aboriginal population has a significantly higher proportion of community and personal services workers and labourers than the non-Aboriginal population.
4.8 Tertiary qualifications
Chart 10 shows that Aboriginal persons have a significantly lower proportion of persons within their population with post graduate (University level) qualifications, along with Advanced Diploma and Diploma TAFE qualifications. The educational status evens up somewhat with respect to Certificates from TAFE, where 7.1% of the Aboriginal workforce has a TAFE certificate (with two thirds of Certificates at Level 3 or 4) and 14.4 % of the non-Aboriginal population has a TAFE Certificate.

Shire Profile & Key Issues
Newland Planning & Development and Narrandera Shire Council Page 34 of 101
Chart 10 Comparison of qualifications of Aboriginal persons
Notwithstanding these figures, the number of Indigenous persons with TAFE certificates increased from 14 to 40 between 2001 and 2006. This is a positive result.
4.9 Life expectancy12
Within NSW, the life expectancy for Aboriginal males born between 2005 and 2007 was 69.9 years of age. For Aboriginal females the life expectancy was 75 years of age. Within NSW the life expectancy for non-Aboriginal males born between 2005 and 2007 was 78.7 years of age. For non-Aboriginal females the life expectancy was 82.5 years of age. NSW has the highest life expectancy for Aboriginal persons compared to other States and Territories of Australia.
4.10 What does this tell us?
Whilst there have been gradual improvements in the standard of living, education and life expectancy of Aboriginal persons in NSW/Australia generally, there is still a long way to go. In the Narrandera context the Aboriginal population is growing at an annualised rate of around 2.4%. The population is very young, but falls behind the non-Aboriginal population in areas such as life expectancy, home ownership, individual and household income, skilled occupations, unemployment and tertiary qualifications. Aboriginal persons generally have a greater focus on family and extended family relationships. Aboriginal families generally have more children, and have a significantly higher proportion of one parent families and larger family sizes for one parent families. A positive point is that the Aboriginal population has a significantly lower proportion of lone person households, compared to non-Aboriginal families. Another positive trend is that TAFE qualifications for Aboriginal have increased significantly since 2001.
12
ABS Catalogue 3302.0 Deaths, Australia, 2008 Released November 2009
Tertiary qualifications - Aboriginal population vs non-Aborginal
population
0 0 0.5 0.9
7.1
0.5 0.7
4.4 3.8
14.4
0
2
4
6
8
10
12
14
16
Postgraduate
degree
Graduate
diploma
Bachelor
degree
Advanced
diploma
Certificate
Perc
en
tag
e
Aboriginal
Non-Aboriginal

Shire Profile & Key Issues
Newland Planning & Development and Narrandera Shire Council Page 35 of 101
5 HEALTH, EDUCATION & COMMUNITY FACILITIES
5.1 Health infrastructure in the Shire
Note: The following information is derived from the Golden Cluster Health Service Plan 2006-2011 prepared by the Greater Southern Area Health Service (2007). Narrandera forms part of the ‘Golden’ Cluster, with the Greater Southern Health Service Area under NSW Health. Figure 5 shows the local government areas with the Golden Cluster and the hierarchy of health services within each area. The Narrandera Township has a hospital and community health centre. The Barellan Township has a community health service only.
Figure 6 Golden Cluster group of the Greater Southern Area Health Service.
5.2 Hospital services
Narrandera Hospital is a district acute hospital with high dependency, surgery and obstetrics services and a total of 34 beds. In 2006 the hospital budget was $3,619,000 and there were 46.7 full time equivalent persons employed. In 2006 there were 7 visiting medical officers providing General Practitioner services and specialist services in Psychiatry, Gynaecology, General surgery and Psychogeriatrics. Narrandera has a manned ambulance station with five officers and three vehicles.

Shire Profile & Key Issues
Newland Planning & Development and Narrandera Shire Council Page 36 of 101
5.3 General Practitioner services
Narrandera Shire has one medical centre currently employing four GP’s and two dentists, one of whom is part time and travels in from outside the Shire. The medical centre has recently been granted development approval, and funding through the Commonwealth Government’s GP Super Clinic program, for a major expansion. The intention is to provide capacity for a wide variety of allied health professionals and additional GPs .
5.4 Community health services
Narrandera Shire has a community health service at Narrandera Township and an outreach service at Barellan. Local services are provided for community, child and family nursing, counseling, care coordination and diabetes education. Visiting services (from Leeton) are provided for drug and alcohol education, speech pathology, women’s health and dietetics. Narrandera has a regular school dental health service provided from Griffith. In 2006 the budget for the community health service was $658,000 and there were 10.7 full time equivalent persons employed in total. Narrandera has a Level 3 imaging service and South West Pathology services the town.
5.5 Home and Community Care Services
Narrandera/Leeton Community transport
Narrandera has a community transport system servicing the Shire area. It is shared with Leeton but tends to operate more in the Narrandera Shire area. The community transport relies on volunteer drivers and is available Monday to Friday and weekends depending on the availability of drivers. The service provides service for frail aged, disabled persons and their carers, persons who are transport disadvantaged, and persons with special needs including health related transport. The transport service allows persons to attend medical appointments, social activities, shopping and recreational activities. Charges in each area vary as do places people can go. The Narrandera service includes trips to Wagga Wagga, Albury and Griffith, as well as local transport. The service has eight vehicles, including three mini-buses with wheelchair access. The service is funded by the NSW Government through Transport NSW.
Narrandera Leeton Social Support
Narrandera has a social support service which often operates in conjunction with community transport. The service provides one on one companions to assist the frail aged and disabled with shopping and friendly visits. It is designed to keep people active in the community and utilises paid or volunteer ‘companions’. The service is funded by the NSW Government through the Department of Ageing, Disability and Home Care.
Home and Community Care Respite
Narrandera provides a respite service for carers in the community – essentially a care for the carer service. The service is funded by the NSW Government through the Department of Ageing, Disability and Home Care.

Shire Profile & Key Issues
Newland Planning & Development and Narrandera Shire Council Page 37 of 101
Home modification and maintenance service
The Shire provides a home modification and maintenance service funded by the NSW Government through the Department of Ageing, Disability and Home Care. Home modifications include wheelchair ramps and grab bars within homes. Home maintenance includes one off clean-ups and basic repairs. A small funding pool is also available for lawn mowing.
Meals on Wheels
Meals on wheels operates Monday to Friday including public holidays, and delivers, hot, cold or frozen meals to the frail, aged or persons with a disability (or their carers). Meals and wheels is funded through the HACC program and is staffed by volunteers. There is a separate Meals on Wheels program administered by the local Sandhills Aboriginal Foundation.
Funding changes
From 2012 the funding model for Home and Community Care is proposed to change via Coalition of Australian Government’s (COAG) Agreement. It is proposed that the Commonwealth Government will fund aged care services and the NSW Government will fund disability services.
5.6 Aged care services
Narrandera has a number of aged care services catering for different needs. The Council operates Teloca House, a low care residential facility providing 44 permanent and one respite care bed for the frail and aged. Whilst in the past Teloca house has been a low care facility, there is increasing pressure to provide for medium and high care, and dementia residents, due to the ‘ageing in place’ operation of the facility. Teloca House has been upgraded from its original specification to provide single bed ensuite rooms for residents. ‘Domain Principle’ operates the Narrandera Nursing Home, a full care facility with 80 beds, catering to medium to high care residents in dormitory style rooms with shared bathroom. The Narrandera Wiradjuri Elders Group runs a Community Aged Care Program assisting around 15 Aboriginal persons. Narrandera also has 6 two bedroom independent aged living units known as the Pangarinda Aged Units, run by ‘UnitingCare’ (a branch of the Uniting Church).
5.7 Narrandera Shire Social Plan 2005-2010
The Narrandera Shire Council completed a Social Plan for 2005-2010 in consultation with the community. From this consultation, the following health issues were raised.
Increase awareness of and education about the impact of drug and alcohol abuse
Increase availability of drug and alcohol counsellors;
Increase youth counsellors;
Address issues of violence against women, especially domestic violence, and
Ensure aged care services keep pace with increasing older population.

Shire Profile & Key Issues
Newland Planning & Development and Narrandera Shire Council Page 38 of 101
5.8 Community support services
There are a multitude of community support services and groups within the Shire (with many not Government funded). These include:
Aged Activity Club;
Aero Club;
Alcoholics Anonymous;
Alzheimers Support Group;
Australian Breastfeeding Association;
Cancer Patients Assistance Society and Can Assist;
Carers Support Group;
Community Mental Health Team;
Country Women’s Association
Cypress Centre;
Dementia Tuesday Club;
Disability Advocacy Network;
Friends of Teloca House;
Girls Bigade;
High School P&C;
Home Care Service Support;
Hospital Auxiliary;
Narrandera Over 50’s Club;
Narrandera Suicide Awareness and Prevention Group;
National Heart Foundation;
Northcott Narrandera Auxiliary;
Omni;
Pre-school Committee;
Primary School P&C;
Radar;
Red Cross;
Returned Soldiers League;
Scout Group;
Slim-Ins;
St Joseph’s P&C;
St Vincents de Paul;
Weight Watchers.
5.9 Community service clubs
Narrandera’s community service clubs include the Lions Club, Probus, Rotary and Inner Wheel, and the Soroptimists.
5.10 Educational facilities
Narrandera Shire has a typical complement of primary and secondary education facilities and access to tertiary education. The Shire has four pre-schools/child care centers, the Early Learning Centre, Narrandera Pre School, Narrandera Little Connections Playgroup and the Narrandera TAFE Children’s Centre. Child care centre.

Shire Profile & Key Issues
Newland Planning & Development and Narrandera Shire Council Page 39 of 101
The Narrandera Township has three primary schools, the Narrandera East Infants School, the Narrandera Primary School and St Joseph’s Catholic Primary School. The town of Barellan has a Kindergarten to Year 12 Central School and the villages of Grong Grong and Binya have a Public School. There is one public High School in Narrandera, with Catholic and State High Schools in Leeton. Narrandera Township has a branch of the Riverina TAFE. A variety of TAFE and University courses are available through the various Riverina campuses of TAFE and Charles Sturt University.
5.11 Sport & recreation facilities & local attractions
Narrandera Sport Stadium
The Narrandera Sport Stadium has two full size basketball/netball courts and seating to accommodate large crowds on both sides of the court area. The stadium has change rooms with wheelchair access for disabled persons, a multi-purpose room that can be used by sporting bodies or the public for meetings, a fully operational kiosk supply hot and cold food, and electronic scoring and 24 second shot clocks. The Stadium is set up to provide the following:
two basketball courts; two netball courts; two volleyballs courts; five badminton courts, and indoor soccer and indoor hockey.
The stadium also has the capacity to accommodate a wide range of community functions, travel shows, craft fairs and exhibitions. The stadium will develop two outdoor netball courts in 2010/2011.
Narrandera Sports Ground
The Narrandera Sports Ground is the premier sporting and cultural venue in the Riverina Region. The sports ground has a comfortable capacity of 15,000 for sporting matches and 25,000 for cultural and musical events.
Lake Talbot complex
The Lake Talbot complex consists of three swimming pools, two water slides, a kiosk and BBQ/picnic facilities. The complex is a significant local attraction. The swimming complex forms part of the wider Lake Talbot complex. Lake Talbot is an artificial water body, created through a widening of the Main Canal of the Murrumbidgee Irrigation system. The Lake is well suited to boating and water skiing and hosts regular zone and State water skiing Championships. The complex includes the Lake Talbot Caravan Park and is adjacent to the former State Forest (now part of the Murrumbidgee Regional Park system) and the Narrandera Koala Reserve.

Shire Profile & Key Issues
Newland Planning & Development and Narrandera Shire Council Page 40 of 101
Narrandera Golf Course
The Narrandera Golf Course is built on rolling sand hills, and the fairways are lined with White Cypress pine trees. It is rated inside the top 10 country courses in NSW and the number 1 course in the Riverina. The course is an excellent test of golf on a course with a great reputation.
Narrandera Fisheries Centre & the John Lake Centre
The Narrandera Fisheries Centre (NFC), 6 km East of Narrandera, was opened in 1962 as a research centre to study the breeding biology and ecology of inland aquatic systems. Since then, NFC has been the centre of freshwater fisheries research in New South Wales, and has also developed into a productive hatchery, providing fingerlings of four native fish species (Murray cod, trout cod, golden perch and silver perch) to improve freshwater recreational fisheries and conservation initiatives. The Centre fulfils a number of roles such as breeding, conservation, environmental surveys, NSW rivers management, aquaculture, reporting on illegal activities and community education. It aims to raise public awareness of the state of native fish populations. The Centre also performs important scientific research into all 36 species of fish in the Murray-Darling Basin. These species range from popular recreational species such as Murray cod, golden perch and silver perch, to small forage species like Murray rainbow fish, Australian smelt and the endangered purple spotted gudgeon. The site also incorporates the ‘John Lake Centre’, a facility that acts as an invaluable tool for schools and the general public. Both native and introduced species are on display, including 'Agro', a large Murray cod. Four fishing workshops for children between the ages of 8 and 14 are held annually and cater for people from a diverse range of ages and backgrounds. The John Lake Centre is an educational facility that contains a theatrette and live fish exhibits, set adjacent to beautiful parkland and a small lake.
Sporting, fitness and interest groups
There are numerous sporting, fitness and recreational groups, clubs and activities in the Shire, including:
Tennis Club’s; Narrandera Race Club; Narrandera Bowling & Recreation Club; Aerobics; Aero Club; Aquatic and Ski Club; Australian Rules; Badminton; Basketball; Clay Target Shooting; Cricket; Croquet; Dance Classes; Dart Association; Barellan Golf Club; Narrandera Golf Club; Netball; Pistol Club;

Shire Profile & Key Issues
Newland Planning & Development and Narrandera Shire Council Page 41 of 101
Pony Club; Race Club; Rugby League; Softball; Squash; Gym; Camera Club; Landcare; Masonic Lodge; Presbyterian Craft Group; Rodeo Committee; Show Society; Little Athletics; Garden Club; Country Music Association; Parkside Cottage Museum; Swimming, and Volleyball.

Shire Profile & Key Issues
Newland Planning & Development and Narrandera Shire Council Page 42 of 101
6 CULTURAL ATTRIBUTES OF THE SHIRE
6.1 Built (historic & architectural) heritage
The Narrandera Local Environmental Plan 1991 contains a list of 8 heritage items, all within Narrandera Township or environs, apart from one item in Barellan. The Council has recently completed a Community Based Heritage Study, partly funded by the NSW Heritage Office (State Government). This study has identified over 100 buildings, structures and places within the Shire which are of enough potential architectural, social or cultural significance to be included as heritage items in the next town plan. The next step in the heritage study is to have the Council’s heritage advisor carry out basic research on each proposed item in order to inform a final decision on the item’s inclusion prior to advertising the final list for comment by the building/property owner and the public. It is intended that the heritage item list be developed concurrently with the new town plan.
6.2 Arts community
The Council has recently adopted the Narrandera Local Arts Strategy which identifies the core need for an arts facility in or close to the main street. This plan will integrate with the new and recently funded Western Riverina Regional Arts Board, due to commence in January 2011. Since commencing the arts strategy there has been increased local participation in festival and arts development programs, including increased showcasing of local artists in local hops.
6.3 Aboriginal cultural heritage
The Narrandera Township has a significant Aboriginal population, and the Narrandera and district locality has been home to the Aboriginal people for thousands of years. In his book “Narrandera Shire” by Bill Gammage13, published for the Narrandera Shire Council in 1986, the author presents an excellent chapter on the Wiradjuri people and in particular the “Narrungdera” people of the Narrandera district. The Narrungdera people derived their name from the Jew lizard, Narrung jew lizard, dera place. A very rough approximation of the clan boundary area was from Ganmain to Ardlethan, west along Mirrool Creek then south west across the River west of Darlington Point, east through Morundah and Boree Creek, south around Mount Galore ad north back to Ganmain (not too different from the modern day Shire boundaries). Gammage estimates, based on the extensive number of middens (cooking ovens) around the River, Mirrool Creek and Lake Mejum, that the pre-European Narrangdera population may have been 2,000 persons. The Narrungdera people had extensive trade connections with other Aboriginal peoples, obtaining stone axe heads from the Tumut area, northern NSW, southern Queensland and central Victoria, and their clansmen travelled to the Lachlan River and the Ngunawal people at Yass. The Narrungdera country in normal seasons was rich enough to support the local population, and the usual available food supply, carefully conserved, was such that the Narrungdera people were not fully nomadic. Evidence of this was found in the Bundidgerrry Creek, where a sophisticated fishery
13
Gammage, Bill. 1986 Narrandera Shire

Shire Profile & Key Issues
Newland Planning & Development and Narrandera Shire Council Page 43 of 101
was found, consisting of a labyrinth of artificial channels, dams and reservoirs used for trapping eels and fish. It is probable that the Narrungdera lived by creeks and swamps throughout summer and autumn, and the rest of their country between winter and spring. South of the river, particularly between Old Man Creek and Yanco Creek, there are hundreds of middens, indicating that swamps and hinterland areas, with their rich waterfowl, birdlife, mussels, yabbies, fish and plantlife, were integral to the Narrungdera way of life. The Narrungdera also caught possum, kangaroo and grazing animals and harvested grain and nardoo for flour. The Narrungdera were conscientious land managers, taking land out of production to protect food reserves and using fire skilfully to trap game, clear plains for fattening game and to prevent larger more destructive fires. The Narrungdera were generally a strong and robust people – a Narrungdera warrior in early European days became notorious for his 14 inch footprint, and in 1844 a scientist wrote of Narrungdera men: “The black fellows were the largest and most active that I yet have seen – the greater Portion of them 6 foot and upwards Broad shoulders…”. However despite their mastery of and integral links to the natural environment in which they lived, the Narrungdera people and most of their culture and the Australian Aboriginal generally were unable to weather the foreign ways, land management practices, diseases, weapons and culture of the European settlers. In June 1817 the explorer John Oxley ventured in to the far northwest of the Shire (north of Binya). Oxley went no further but his visit was recounted by the Narrungdera people when the next white men came to that area 12 years later. According to Gammage, between approximately 1789 and 1929 (when Charles Sturt explored and first camped within the Shire, in an area near present day Berembed Homestead), the Wiradjuri and Narrungdera people were struck down by smallpox, affecting particularly the very old or very young and killing perhaps 60% of the Aboriginal people who encountered it. The disease took the older generation who would traditionally pass on the knowledge, customs and tradition of the clan, and the young people who were to learn it. In 1832 the first settler approached the Shire and by 1833 the entire Shire River frontage was occupied by squatters. By the late 1830’s the Narrungdera people and the white frontier settlers were actively in conflict, with the Narrungdera killing the settlers cattle and the settlers searching for Aboriginals to kill. By mid 1839 the Narrungdera people and their allies had cleared over 100km of river of the white man. By late 1839 the white man had been cleared from Narrandera Shire. The Government of the day admitted it was helpless against the Narrungdera. From late 1939 to the early 1840’s the settlers formed posses and killed many Aboriginals, leading to stories of massacres and poisoning waterholes and flour supplies. Gammage notes that the loss of their land and food supplies forced them (the Narrungdera) first to fight between themselves over how they should ‘treat’ with the white man, then into a steadily tightening net of dependence, poverty and despair. By the mid 1850’s the Narrungdera would carry out traditional hunting and gathering in the spring and in the winter they would return to European settlements. At the time a Narrandera correspondent

Shire Profile & Key Issues
Newland Planning & Development and Narrandera Shire Council Page 44 of 101
announced that the Aboriginal would soon be extinct along the whole of the Murrumbidgee. By the late 1860’s only a few Aboriginals lived in the hills, and more and more their lives circled the stations. If they were found in the bush there was a strong chance they would be shot. In the 1870’s most Aboriginals strove for independence, working for the white man and taking government and station owner handouts when necessary, living in groups of three to four related families, keeping to the old ways as much as possible. In about 1878 a big meeting of the clans was held on Tubbo, across the River from Darlington Point. This was to be the last great traditional gathering of the district Wiradjuri people. In 1878 the Reverend John Gribble came on Aboriginals living in ‘wretched’ conditions and in 1880 he bought his wife, family and several Aboriginals to a mission site he had selected in 1879. He later won a 205 hectare reserve, obtained a job as a government teacher and named the mission Warangesda. He scoured the Murrumbidgee for Aboriginal people who would come and with them built a church, school, a girl’s dormitory, a store, his house and their cottages. Gribble hoped to make the Mission self supporting and a refuge for Aborigines. At the time the reserve was the only one in NSW, and in 1883 the reserve was increased to 802 hectares. John Gribble died in 1893 and the Mission was jointly taken over by the Aborigines Protection Association (a private mission body) and the Aborigines Protection Board, a government agency. In 1897 the government formally took control of Warangesda, which became a community unto itself, having around 150 people in 1909. In the 1880’s Warangesda men began competing in Narrandera sport days and in the 1890’s to play Narrandera teams cricket. Also around 1880 the Aboriginal Lands Trust established a reserve of 1280 acres near the Murrumbidgee River at Grong Grong.14 The reserve was later reduced to 310 acres, and a small number of Aboriginal families established there and cultivated crops. By 1915 the reserve was deserted, possibly due to a large bushfire, and the reserve was revoked in 1916, along with many other reserves between 1916 and 1924, including reserves at Warangesda, Cummeragunja, Brewarrina and Burnt Bridge. Whilst Warangesda was the main Aboriginal settlement, other Aborigines camped out at Bindidgerry or near the flat near the scour west of town. There was always a camp at Narranderra, and as late as 1900, corroborees were held at the bottom of East Street. In the early 1900’s the Aborigines Protection Board began expelling people fro Warangesda and in 1915 the Board began an active policy of expulsion. By 1920 all men of working age had been expelled and children were taken without notice from their parents and placed in institutions to grow up ‘thinking white’. Over a third of all Wiradjuri children were eventually taken. Narrandera was considered a safe town and in 1930 about 70 Aborigines lived around the town, a few on the flat and most on the Sandhills – Weir’s Reserve, west of the town. The Sandhills were first settled by the Bamblett’s (Warangesda refugees) on land owned by William (Billy) Weir. Whilst the reserve was a refugee camp the people made it home, constructing shacks made from flattened tins for roofing and flour bags dipped in cement and lined with paper as walls. Billy Weir died in 1938. Prior to Billy Weirs death an Aboriginal family moved from the Sandhills to land known by town residents as Hill 60, overlooking the flat and the scour, about 2km west of town. Once one family left most followed, leaving Sandhills abandoned by 1940. The move to Hill 60 was prompted by the need
14
Kabaila, Peter (x) Wiradjuri Places, The Murrumbidgee River Basin Volume 1

Shire Profile & Key Issues
Newland Planning & Development and Narrandera Shire Council Page 45 of 101
to buy land to dissuade the State welfare authorities from pursuing the families. However there were still instances where the ‘Welfare’ took children away from their families. The community built houses, initially of flattened kerosene tins nailed gum poles. In the mid 1940’s water was laid on to several communal taps and a non-denominational church was built. By the mid 1950’s around 150 people lived there. Around the mid 1950’s the Council began condemning the houses as health risks and once again the people had to move. From 1960 a gradual shift into the town began. This increased during the 1960’s and particularly from 1973 when Federal government assistance for Aboriginal housing became available. By 1984 there were 18 Aboriginal housing homes available. Importantly for Narrandera, and differing to other regional Aboriginal peoples, much of the present day Aboriginal community in Narrandera can be traced back to the Bamblett family at Warrangesda (Kabaila (x), 89). The Aboriginal community remains close and proud of their local heritage.

Shire Profile & Key Issues
Newland Planning & Development and Narrandera Shire Council Page 46 of 101
7 THE ECONOMY OF THE SHIRE
7.1 Employment distribution
In 2006 agriculture, forestry and fishing was the mainstay of the Shire economy, having 490 persons or 20% of the Shire’s employment base. Manufacturing comprised 11% of the employment base with 275 persons. Similar employment numbers were found in the retail trade (258 persons – 10%) and health care and social assistance (241 persons – 9.5%). Education and training, public administration and training and accommodation and food services each employed around 180 persons, or 7% of the employment base. Transport, postal and warehousing employed 139 persons and construction employed 108 persons. Industry of employment
Living in town Living out of town 2006 total 2001 total for comparison
Agriculture, forestry & fishing
85 405 490 (20%) 639 (24%)
Manufacturing
204 71 275 (11%) 244 (9%)
Retail
200 58 258 (10%) 302 (11%)
Health care & social assistance
180 61 241 (9.5%) 211 (8%)
Education & training
107 79 186 (7%) 170 (6%)
Public admin & safety
136 46 182 (7%) 139 (5%)
Accommodation & food
80 94 174 (7%) 164 (6%)
Transport, postal & warehousing
80 59 139 (5%) 105 (4%)
Construction
75 33 108 (4%) 127 (5%)
Total 1,147 906
Table 13 Industry of employment across the Shire of Narrandera
It is interesting to note the distribution of employees between the various industries in relation to those who live in the Narrandera Township and those who don’t. The statistics in Table 13 show that a significant number of persons live outside the town of Narrandera, but are employed within an employment sector located within or outside the town or otherwise outside the Shire. The exact distribution of travel to employment outside the Shire is not known. The exception of course is agriculture, where the majority of workers live outside the town but work in the Shire’s rural area. Similarly those that live in town are not necessarily employed by an industry in town. Many people are understood to work in the Leeton and Griffith local government areas.

Shire Profile & Key Issues
Newland Planning & Development and Narrandera Shire Council Page 47 of 101
7.2 Businesses within the Shire
The Australian Bureau of Statistics periodically records the number of businesses within statistical local areas. In December 2007 relevant data for the Narrandera SLA was released15. The data shows that the majority of the 738 businesses within the Shire (84%) had less than five employees, and 56% of businesses did not employ any other persons. 105 businesses (14%) employed between 5 and 19 persons, 6 businesses employed between 20 and 49 persons and six businesses employed more than 100 staff. The actual number of businesses by industry is provided in more detail in Table 14. Business sector
Number businesses Business sector Number businesses
Agriculture, forestry & fisheries
363 Accommodation & food 30
Mining 0 Transport & storage
48
Manufacturing
21 Communication services
6
Electricity, gas & water supply
0 Finance and insurance 12
Construction
54 Property & business 66
Wholesale trade
15 Education 3
Retail trade
81 Health & community services
15
Cultural & recreational services
6 Personal & other services 18
Table 14 Businesses by employment sector Narrandera Shire
Further analysis of the ABS data and comparison with the industry by employment data above emphasises the small business nature of employment in the Shire. The top five businesses by actual number are agriculture, forestry and fisheries, retail trade, property and business services, transport and storage and construction, whereas only agriculture et al and retail are in the top five for number of employees. Notwithstanding the above, the business by employment sector figures should be treated with some caution as there are some discrepancies between the data behind Table 14 and the Table 13 figures.
15
ABS Catalogue 8165.0 Counts of Australian Businesses 2003-2007, Released 14/12/2007

Shire Profile & Key Issues
Newland Planning & Development and Narrandera Shire Council Page 48 of 101
7.3 Main economic drivers in the Shire
Agriculture
Notwithstanding the fall in employment by 149 persons (490 persons, down from 639) in the agriculture, forestry and fisheries sector between 2001 and 2006, this sector was still by far the most dominant employment sector in the Shire. Agriculture is one of the Shire’s most important economic drivers. In 2006 the total value of agriculture within the Shire was $107.415M. The approximate breakdown of agricultural products was as follows: Agricultural sector
Value in 2006 $M
Pasture, cereal & other crops cut for hay
5.407
Crops excluding hay
72.429
Nurseries, cut flowers and turf
0.232
Vegetables
4.289
Fruit
3.958
Livestock slaughterings
23.263
Livestock products 6.316 Total (note rounding error)
107.415
Table 15 Value of agricultural products Narrandera Shire 2006 From the Table above the value of horticulture was small, as was the production of vegetables and crops cut for hay. Irrigated agriculture within the Shire comprised about 10,000 hectares of land or 2.4% of the Shire area. However the livestock sector (particularly livestock slaughtering) was a large contributor to the Shire with almost $30M of agricultural value. This sector includes the PIC Australia piggery at Grong Grong. The recent sale and proposed reopening of the ‘Swifts’ feedlot (located in the Leeton Shire but generally employing equal numbers of workers from Leeton and Narrandera Shire’s) is a positive move for both Shires.
Manufacturing
Manufacturing employs the second highest number of persons in the Shire – 275 persons or 11% of the labour force (up from 244 persons in 2001). ABS data indicates that in 2007 there were 21 manufacturing businesses in the Shire. Local manufacturing businesses include:
Grants Cypress Mill;
Narrandera Flour Mill;
Hutchins Engineering;

Shire Profile & Key Issues
Newland Planning & Development and Narrandera Shire Council Page 49 of 101
Retail trade
The retail trade was the third highest employer in the Shire in 2006 with 10% of the labour force. The 2007 ABS business counts indicate that the retail sector in Narrandera has the second highest number of individual businesses (81), and that the retail trade was equally the most diverse, with agriculture, when considering the number of businesses and employees per business. Of the 81 retail businesses, 30 were non-employing, 30 had between 1 and 4 employees, 12 had between 5 and 19 employees and three had between 20 and 49 employees. Notwithstanding the above the retail sector in the Narrandera Township contracted somewhat between 2001 and 2006, both in terms of employment numbers and services offered. The viability of the main street of Narrandera (East Street) is assisted by two National supermarkets which are located in the main street, one at the top (north end) and one in the middle, providing important anchors to other retail activities. It will be important to retain their presence in town for the long term.
Health care and social assistance
The health care sector is the fourth highest employer in the Shire and is likely to be a growth sector with an ageing population and an increased focus on Aboriginal and non-Aboriginal health.
Transport sector
The transport sector, employing 139 persons in 2006, is not one of the Shire’s main employers. However this sector has significant unrealised growth potential. Narrandera Township is located at the junction of the Newell Highway (National) and the Sturt Highway (State) and 5700 vehicles pass through Narrandera each day - around 20% of these being heavy vehicles. The Gillenbah commercial area, at the junction of the Highways, is an acknowledged truck rest stop area and is well used by heavy vehicle drivers. The Gillenbah locality has the potential to be used as a B-double, road train and B-triple beak down point and depot for heavy vehicles. The transport industry should be focussed upon to strengthen Narrandera’s position in this sector. Local transport sector businesses include:
Day’s transport;
Hallyer’s transport;
Paterson’s transport
Terry Smith transport;
Bachelor transport, and
Barry transport.
Tourism
In 2006 the accommodation and food sector employed 7% of the workforce in the Shire (174 persons). More persons living out of town were employed in this sector than those living in town, suggesting that at least some of the employment was outside the Shire. Part of this overall employment supports the town and part supports the visitation market. The Narrandera Township has approximately 500 accommodation beds at present through 12 motels and three hotels, B&B’s and other accommodation, with another 200 powered camp sites in caravan parks.

Shire Profile & Key Issues
Newland Planning & Development and Narrandera Shire Council Page 50 of 101
For January 2010 the average takings per night per occupied room was around $82.00, and the average takings per available room was around $29.00. Smaller establishments (less than 15 rooms) generally had lesser average takings per room night available.16 The average length of stay in January 2010 was 1.1 nights, with an average room occupancy rate of 43% for larger establishments and 28.4% for smaller establishments. Again, smaller establishments had lower bed and room occupancy rates. The average length of stay in Narrandera is below the State and National average, as is the average spend per trip17, however the average spend per night is not dissimilar to the State and National averages. Tourism has the potential to be a greater contributor to the local economy, particularly through upgrading of facilities (including accommodation), eco-tourism, recognising the natural riverine assets of the Shire, and through Aboriginal cultural tourism.
7.4 Impact of drought on the Narrandera economy
Narrandera Shire received in October 2010 a draft Input – Output analysis report from consultants ‘AEC group’, as part of funding received from the Commonwealth Strengthening Basin Communities program.18 Their findings in relation to Narrandera Shire and the impact of drought between 2005-06 and 2009-10 are summarised below. The economic impact of drought and low water allocations in the Narrandera regional economy between 2005-06 and 2009-10 is estimated to have resulted in a total loss of:
Approximately $39.6 million in output to the regional economy, comprised of $30.0 million directly, $4.8 million through production induced flow-on activity, and $4.7 million through consumption induced flow-on activity;
Approximately $17.6 million in value added activity, comprised of $12.6 million directly, $2.2 million through production induced flow-on activity, and $2.8 million through consumption induced flow-on activity;
Approximately $4.3 million in wages and salaries, comprised of $2.0 million directly, $1.1 million through production induced flow-on activity, and $1.2 million through consumption induced flow-on activity; and
Approximately 182 FTE employment positions, comprised of 139 FTE positions directly, 19 FTE positions through production induced flow-on activity, and 24 FTE positions through consumption induced flow-on activity.
The effect of the drought then was felt significantly in the grains and milling sector, which is understandable given the dry-land farming nature of the Shire. The real value of production for grains fell $21.6M between 2005-06 and 2009-10 (from $73.2M to $51.6M – 30%), at a direct estimated cost of 83 full time equivalent jobs. The value of production of the milling products and cereals foods sector fell from $11M in 2005-06 to $5.5M in 2009-10 (a major fall of 50%), at a direct estimated cost of 12 jobs to the sector.
16
ABS Catalogue 8635.1.55.001 Tourist Accommodation, Small Area Data March Quarter 2010 17
Sinclair Knight Merz, September 2010 Strengthening Riverina Irrigation Communities, Trends and Drivers of Change Discussion Paper (Draft) 18
AEC group October 2010, Strengthening Basin Communities – Input Output Analysis draft Report Griffith City Council

Shire Profile & Key Issues
Newland Planning & Development and Narrandera Shire Council Page 51 of 101
The production loss to the sheep sector of $2.9M (25%) between 2005-05 and 2009-10 was not as high as the milling sector by percentage, however the direct estimated loss of 41 jobs was significant. Similar to Carrathool and Murrumbidgee, Narrandera relies on larger centres such as Griffith and Leeton to provide a range of industry and household support services. As such, flow-on impacts in Narrandera are relatively small (as a proportion of total impacts) in comparison to service centres such as Griffith and Leeton. Analysis of flow-on impacts by industry shows that the industries of wholesale trade and transport and storage are estimated to have experienced the most significant loss in economic activity as a result of indirect flow-on impacts (both type I - production induced flow-on activity and type II - consumption induced flow-on activity) from the drought and low water allocations. These industries had already dropped in employment numbers between the 2001 and 2006 Census periods. The impacts, on the Narrandera Shire, of the drought and the low water allocations in the irrigation areas, are summarised in Table form below. Note that these Tables are derived from a draft report and are subject to revision by the AEC group in the final document. Industry
Change in output ($M)
Sheep -2.9
Grains -21.6
Beef cattle -0.2
Other agriculture 0.0
Services to agriculture 0.1
Milling products &cereal foods -5.5
Total -$30.0
Table 16 Estimated direct change in output in Narrandera Shire 2005-06 to 209-10
Impact type/sector Output ($M) Value added ($M)
Income ($M)
Employment FTE
Direct -30.0 -12.6 -2.0 -139
Sheep -2.9 -1.6 -0.5 -41
Grains -21.6 -9.9 -1.0 -83
Beef cattle -0.2 -0.1 0.0 -4
Other agriculture 0.0 0.0 0.0 0
Services to agriculture 0.1 0.1 0.0 0
Milling products & cereal foods -5.5 -1.2 -0.5 -12
Indirect impacts Type 1 (Production induced flow-on activity)
-4.8 -2.2 -1.1 -19
Indirect impacts Type 2 (Consumption induced flow on activity)
-4.7 -2.8 -1.2 -24
Total -$39.6M -$17.6 -$4.3 -182
Table 17 Change in economic activity in Narrandera Shire 2005-06 to 2009-10

Shire Profile & Key Issues
Newland Planning & Development and Narrandera Shire Council Page 52 of 101
8 SETTLEMENT & LAND USE
8.1 Urban & village lands
Section 2 of this report provides a profile of the people of the urban and village areas of the Shire. Together the urban and village lands comprise around 2,300 hectares, or 0.6% of the Shire area, but are home to two thirds of the Shire population. The town of Narrandera has approximately 1,653 occupied residential properties (by waste collection figures), and a 2006 population of 3,962 persons. There is a total of 1,726 residential properties in the Township. Outside the immediate urban area there are a further 154 occupied residential properties (by waste collection figures). The town CBD area has 184 developed business properties (available for waste collection under the Local Government Act 1993) which include commercial, retail and industrial properties. A further 13 developed business properties are located outside the CBD. There are other industrial and commercial properties in the Red Hill and Gillenbah areas which are not within the waste pickup area. The village of Barellan has 136 occupied residential properties (by waste collection figures) and a 2006 population of approximately 364 persons. The village of Grong Grong has 43 occupied residential properties (by waste collection figures) and a 2006 population of 97 persons.
8.2 Agricultural holdings
As at the 2006 Census the rural (non-urban) areas of the Shire contained approximately 1,800 persons – one third of the Shire population. The current rural population is spread across approximately 840 rural assessments, with each assessment comprising one or more land parcels. An assessment broadly equates to a ‘landholding’. Figure 7 over is a land parcel profile showing land parcels from 5 hectares to 3000 hectares. An analysis of the parcels indicates the following:
Very few land parcels are over 1500 hectares – only two State Forests;
Only 18 parcels are between 750 and 1500 hectares in area, (note the minimum allotment size for a broad acre rural subdivision with new dwelling under the LEP 1991 is 750 hectares). However it is likely that many farm holdings containing multiple parcels, are over 750 hectares;
The majority of land parcels are between 120.1 and 200 hectares (654) followed closely by land parcels of 201 to 750 hectares (586);
The land adjoining waterways in the mid to southern Shire area, that is the Murrumbidgee River, Sandy Creek, Yanco Creek, Frying Pan Creek, Mirrool Creek and Bundidgerry Creek are the most heavily fragmented with smaller land parcels, of between 10 and 60 hectares;
Former concessional allotments up to 5 hectares in area and other small allotments up to 20 hectares, are clearly shown at the edges of larger parcels, with road access and often located in small clusters. The concessional and other small allotments are more concentrated in the mid Shire area between Grong Grong and Bunganbil State Forest.

Shire Profile & Key Issues
Newland Planning & Development and Narrandera Shire Council Page 53 of 101
Figure 7 Land parcel profile Narrandera Shire

Shire Profile & Key Issues
Newland Planning & Development and Narrandera Shire Council Page 54 of 101
8.3 Rural small holdings
The Shire has one designated rural small holdings estate, known as the Nallabooma Estate, located off Irrigation Way, a short distance north-west of the town. This land is zoned 1 (c) Rural Small Holdings under the Narrandera LEP 1991. The Nallabooma Estate contains 32 allotments raging from 5000m2 to 17.7 hectares in area. A significant portion of the land is within the 1 in100 year ARI flood event of the Murrumbidgee River, and new houses have been elevated to a height of the 1974 flood (a 1 in 65 year ARI flood event) plus a 0.5m freeboard. The Nallabooma Estate is almost fully developed. Within the north of the town of Narrandera next to the Golf Course there is an area of land zoned 2 (v) Village or Urban and known locally as the Bell’s Estate. This estate consists of approximately 36 allotments of land each 3-4 hectares in area. This estate is fully developed. There is a another large area of land zoned for small holdings which occupies the western portion of the village of Barellan, and contains approximately 36 allotments ranging in size from 1.2 hectares to 7.5 hectares. Approximately 15 allotments are developed.
8.4 General land use in the Shire
The Department of Environment, Climate Change and Water carried out land use mapping of the Riverina area in 2009, including the Narrandera Shire. Figure 8 shows that the dominant land uses are cropping – 47.9% of the Shire and grazing – 41.1% of the Shire. When compared with the land parcel profile in Figure 7 above it is evident that mixed farming (dryland cropping and grazing) is undertaken on many rural holdings within the Shire. ‘Conservation areas’, namely the State Forests (which are under license for logging), comprise 3.2% of the Shire area (13,168 hectares). Tree and shrub cover comprises 18,875 hectares (4.6%) with the denser areas located along the Murrumbidgee River, along Yanco Creek, within the Narrandera Ranges and in the far northwest of the Shire above Binya. Urban lands occupy just 0.6% and transport corridors, including the airport occupy 1.2% or 4,800 hectares. It is estimated that irrigation based cropping, grazing and horticulture occupies about 10,000 hectares within the Shire (2.4%). The channel irrigated lands are primarily located in the mid-west of the Shire, using channelled water from Murrumbidgee Irrigation Limited and forming part of the Yanco irrigation area. Other irrigation is in the south west of the Shire in the vicinity of Yanco Creek – utilising ground water through centre pivots, and to the immediate northwest of Narrandera Township (Paynters Siding area) using channelled water from Murrumbidgee Irrigation Limited.
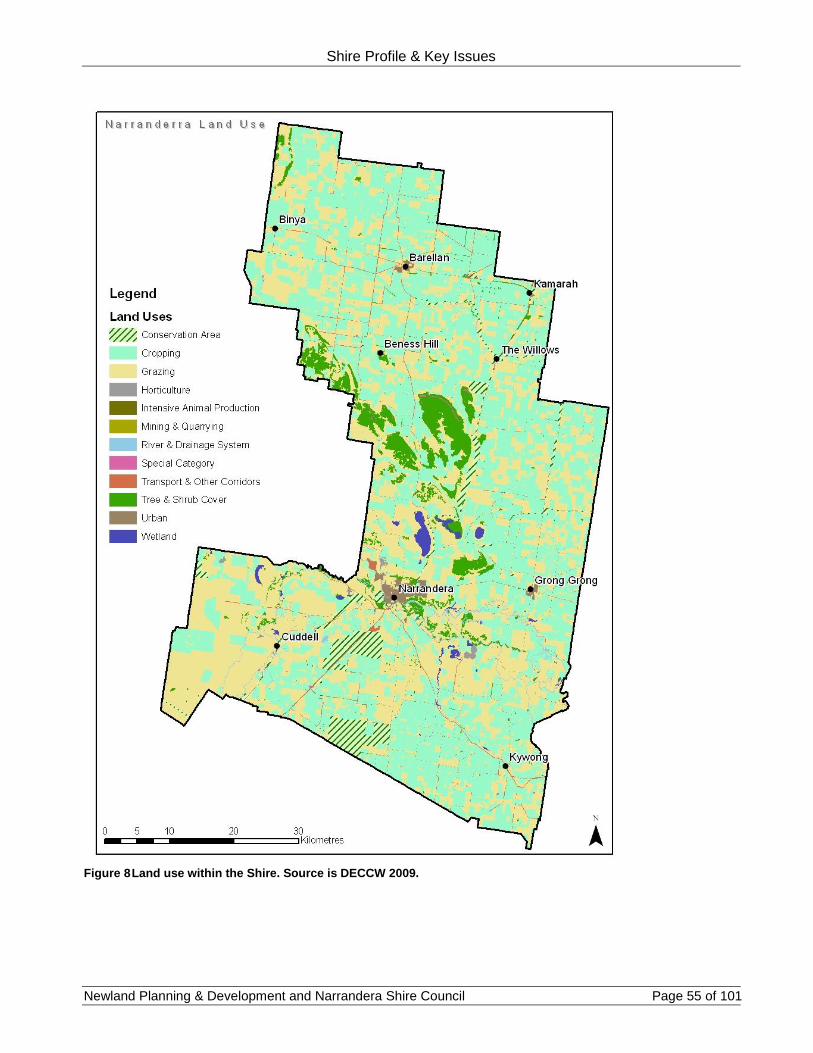
Shire Profile & Key Issues
Newland Planning & Development and Narrandera Shire Council Page 55 of 101
Figure 8 Land use within the Shire. Source is DECCW 2009.

Shire Profile & Key Issues
Newland Planning & Development and Narrandera Shire Council Page 56 of 101
9 TRANSPORT CORRIDORS
The Narrandera Shire has three main rail lines, two of which are active. The Temora to Roto line runs east to west across the north of the Shire and carries freight (grain mainly) between Griffith and Temora and then on to the Main Southern Line. The Junee to Hay line runs east to west across the central area of Narrandera and carries freight (grain, horticultural and viticultural produce) between Griffith and the Junee junction with the Main Southern Line. The Narrandera to Tocumwal line is closed. The main features of the lines (sourced from http://www.nswrail.net) are as follows.
9.1 Temora to Roto rail corridor
Kamarah
Kamarah Station is located in the far north-east of the Shire, opening in 1908 and closing in 1975. The station was originally named ‘Bygee’. The Kamarah station no longer exists but the locality contains a siding with grain silos.
Moombooldool
Moombooldool Station is located in the far north-east of the Shire, opening in 1908 and closing in 1975. The station was originally named ‘Erin’. The Moombooldool station no longer exists but the locality contains a siding with grain shedding.
Barellan
Barellan Station, which closed in 1975, was opened in 1908. There remains a small platform area and shed, along with substantial grain silo and shedding storage.
Garoolgan
Garoolgan Station was opened in 1916 and closed in 1975. The station no longer remains, however there is a grain silo and shedding complex. Garoolgan is located in the north-west of the Shire.
Binya
Binya Station was opened in 1916 and closed in 1985. The station is no longer there however there is a siding leading to a small grain silo complex. Binya is in the far north-west of the Shire adjacent to the Griffith City Council boundary.
9.2 Junee to Hay rail corridor
Grong Grong
Grong Grong Station was opened in 1881 and closed at an unknown date. The remains of the station include a concrete slab and ‘A lever’ frame. Grong Grong’s current and historic purpose is for grain storage and freight.
The Quarry Siding
Approximately four kilometres east of Narrandera is a disused siding known as The Quarry, opened in 1881 and closed in 1928.

Shire Profile & Key Issues
Newland Planning & Development and Narrandera Shire Council Page 57 of 101
Narrandera
The Narrandera Station was opened in 1881 and is in use today. In previous times passenger rail services operated to Tocumwal on the Jerilderie Tocumwal line. The main purpose of the Station today is rail freight between Griffith and Junee. The Manildra Mill has access to the Junee to Hay line. A turntable is still present between the Station and the Mill but is not operational. Countrylink runs coach services from Griffith to Wagga Wagga where passengers can connect with the XPT to Melbourne or Sydney. There is no current, or likely passenger rail service operating out of Narrandera.
Paynters Siding
Paynters Crossing was opened as Paynters Siding in 1930 and closed in 1973.
9.3 Narrandera to Tocumwal rail corridor
Main branch features
The Narrandera to Tocumwal rail line between Narrandera to Jerilderie opened in the mid 1880’s and was extended to Finley in 1898 and Tocumwal in 1929. The line closed in approximately 1975. A siding was located in the Gillenbah locality in but closed in 1895. A siding known as Moon’s Siding opened sometime before 1901 but closed in 1935. An additional siding near to the Shire’s southern border was opened in 1890, as Cuddell, and renamed Corobimilla, closing in 1975 along with the rest of the line.
Proposed inland rail freight line
In relation to the proposed inland rail freight route between Melbourne and Brisbane, there has been discussion as to whether an alternate route incorporating the Tocumwal to Narrandera alignment would bring potential benefits for Narrandera. The present publicised alignment runs through Junee and Parkes and through to Brisbane. There would certainly be synergies between road freight via the two major Highways and a National rail freight route; however the preferred route will rely on economic viability factors larger than the local consideration.
9.4 National highways
The Shire and Narrandera Township is fortunate to have the Newell Highway bringing traffic through the town. The average annual daily traffic (AADT) on the Newell Highway south of Gillenbah in 2003 was 2,395 vehicles. The AADT at Gillenbah in 2003 was 3,448 vehicles. Refer to Figure 9. The AADT on the Highway at the intersection of Audley Street in Narrandera in 2003 was 5,726 vehicles. The Newell Highway is a Class 1 road in the Council’s hierarchy and has a length of 83.33 km within the Shire. The NSW RTA is responsible for the upkeep of this Highway.
9.5 State highways and main roads
The Sturt Highway bisects the Shire east to west and runs immediately south of Narrandera, through Gillenbah and on to Hay. The AADT of the Sturt Highway at the Lockhart turnoff was 3,059 vehicles in 2003 and 1,830 vehicles west of Gillenbah. A significant number of vehicles converge on Narrandera and travel west toward Hay, northwest toward Leeton or north toward Ardlethan.

Shire Profile & Key Issues
Newland Planning & Development and Narrandera Shire Council Page 58 of 101
The Sturt Highway is a Class 2 road in the Council’s hierarchy and has a length of 67.26 km within the Shire. The NSW RTA is responsible for the upkeep of this Highway, through which they contract the maintenance and construction work to the Council. Main Road 80 (Irrigation Way) runs from the Newell Highway toward Leeton and had a 2003 AADT of 3.535 vehicles. Main Road 243 runs east out of the Shire toward Coolamon. Main Road 80 is a Class 2 road in the Council’s hierarchy and has a length of 8.97 km within the Shire. The NSW RTA is responsible for the upkeep of this arterial road, through which they contract the maintenance and construction work to the Council.
9.6 Local arterial and other roads
Class 3 roads
The Shire has 89.1 km of Class 3 road. These roads perform a regional role, linking community centres. The Council owns these roads and the NSW RTA provides annual block grants to assist with maintenance and construction work. Class 3 roads include the Kywong Lockhart Road and the Narrandera Barellan Road.
Class 4 roads
The Shire has 272.32 km of Class 4 roads, performing the role of major local collector or link road. These roads are bitumen sealed and are the full responsibility of the Council. Class 4 roads include the Back Morundah Road, Binya Erigolia Road and Kamarah Road.
Class 5 roads
The Shire has 215.91 km of Class 5 roads, performing the role of minor local collector or link road. These roads are gravel sealed and are the full responsibility of the Council. Class 5 roads include the Sandy Creek Road, Buckinbong Road and Lismoyle Road.
Class 6 roads
The Shire has 331.83 km of Class 6 roads, performing the role of local access roads. These roads are gravel roads and are the full responsibility of the Council. Class 6 roads include Bandys Road and Kangaroo Plains Road.
Class 7 roads
The Shire has 368.2 km of Class 7 roads, performing the role of minor local access roads. These roads are gravel or loam, and are the full responsibility of the Council. Class 7 roads include the Tanswell Park Road and Paynters Siding Road.
Class 8 roads
Class 8 roads are non-formed roads used periodically. The Shire has 198.16 km of these roads, which are the full responsibility of the Council.

Shire Profile & Key Issues
Newland Planning & Development and Narrandera Shire Council Page 59 of 101
Figure 9 AADT figures for arterial roads in Narrandera Shire

Shire Profile & Key Issues
Newland Planning & Development and Narrandera Shire Council Page 60 of 101
9.7 Air transport
The Narrandera and Leeton Council’s work in partnership with Rex – Regional Express Airlines to provide services to Griffith, Mildura and Sydney. Over the past 5 years or so there has been good passenger growth, particularly in the Narrandera to Sydney route. In 2008 an average of 15,500 passengers used this route, and an average of 1,300 passengers used the Narrandera to Mildura route. The partnership approach sees a head tax paid by the airline which assists the Council’s in running the aerodrome. The aerodrome is secure in its current location and has an obstacle height limitation surface to protect the flight path of aircraft. The aerodrome is surrounded by a levy which would be overtopped by the 1 in 100 year flood of the Murrumbidgee River. The recent Floodplain Risk Management Plan prepared for Narrandera Shire recommends that the levy be raised in certain areas to protect against major flood events. The presence of a regional airline offering metropolitan connection is quite vital to the western Riverina region in general, and is a major asset to Narrandera.
9.8 Private sector coach transport
Country link runs a coach service throughout south western and the lower central west of NSW connecting with the major regional centres of Albury, Griffith and Wagga Wagga. There has been significant consolidation in the coach (bus) industry over the past two decades and at present the main coach transport provider is Greyhound/Pioneer (Greyhound Australia). This company provides a Griffith to Wagga Wagga service and then on to capital cities or other destinations through transfer.
9.9 Heavy freight through the Shire
The AADT figures at Audley Street, Narrandera show 5,726 vehicles travelling along the Newell Highway (average annual daily traffic). It is estimated by the NSW Roads and Traffic Authority that approximately 20% of these vehicles are heavy vehicles, around 1,100 per day. Many of these vehicles would have traversed the Sturt or Newell Highways before entering the town (see Figure 9). The Shire has a number of designated B-double routes, including the Newell and Sturt Highways and the Burley Griffin Way. Designated road train routes include the Sturt Highway west of Gillenbah, the Newell Highway south of Narrandera, the Burley Griffin Way generally west of Barellan (but extending to other local roads in the locality) and main road 7608/Kamarah Road below Colinroobie Willows Road. Road train routes do not extend to West Wyalong at present, potentially limiting development opportunities within the Shire. Requests to upgrade roads and bridges to allow road train access could be balanced against likely upgrade and maintenance costs and the benefits that industry will bring.

Shire Profile & Key Issues
Newland Planning & Development and Narrandera Shire Council Page 61 of 101
9.10 Trends in freight management
The NSW Roads and Traffic Authority have in place a road train modernisation program. The difference between a road train and a B-double is the articulation between the trailers. A B-double is defined as a combination consisting of a prime mover towing two semitrailers. The prime mover and the two trailers are combined by two turntable assemblies. The double articulation is the main distinguishing feature of a B-double.
Figure 10 B-double vehicle Source: NSW RTA 2002 Route Assessment Guidelines for Restricted Access Vehicles
A road train is defined as meaning a combination, other than a B-double, consisting of a motor vehicle towing at least two trailers (counting as one trailer a converter dolly supporting a semi-trailer). The illustration below shows the most common road train, the double road train, but other combinations are possible, eg, rigid truck towing two trailers.
Figure 11 Road train vehicle Source: NSW RTA 2002 Route Assessment Guidelines for Restricted Access Vehicles
The benefit of road trains over B-doubles it that road trains are better at manoeuvring than B-doubles, and are much quicker to decouple than B-doubles. Road trains are favoured by landholders and transport operators in the mid-west and western areas of the State for these reasons. B-doubles, however track on the road better than road trains. The purpose of the RTA’s road train modernisation program is to move to more B-double use on State Highways and main roads. It is likely that in the future there will be a more concerted industry push to allow B-triples on the State Highways, on the basis of cost efficiencies, less trucks on the road and the increasing average age of truck drivers. One B-triple truck can replace two conventional articulated vehicles. Cost efficiencies will be required to deal with the rising cost of fuel and the impact of a carbon tax on the transport industry. However this will not occur until the particular road has been assessed for compliance with curve radii, overtaking points, bridge and culvert loadings and other road standards. Narrandera is well placed in respect of road freight due to the confluence of the Newell and Sturt Highways, the current use of Gillenbah as a stop point and rest area for drivers and the potential need for road trains to be broken down before travelling east on the Newell Highway.

Shire Profile & Key Issues
Newland Planning & Development and Narrandera Shire Council Page 62 of 101
Discussions with the RTA have indicated that the RTA believes the Gillenbah locality to be very important to Narrandera and the road transport industry. In the next two years the RTA will upgrade the Gillenbah highway area and it will be important for the Shire to have a consistent vision for Gillenbah which is supported by the local traders and consistent with the likely industry trends. Another industry factor affecting the efficient use of local main roads is the deregulation of the ‘single grain marketing desk’. This may lead to an increase in on-farm silos and new demands in local roads, with a reduction in transport efficiency. Narrandera Shire recently made a submission to the NSW Grain Freight Review in this regard.

Shire Profile & Key Issues
Newland Planning & Development and Narrandera Shire Council Page 63 of 101
10 UTILITIES & INFRASTRUCTURE
10.1 Major energy corridors
9.1.1 Natural gas
The Junee-Griffith natural gas pipeline is a lateral pipeline which runs through the northern end of the Council’s Red Hill industrial estate, north of the town. The pipeline is 164 mm in diameter and forms part of the Moomba to Sydney pipeline, joining this line at an off take near Junee. Within the Red Hill Estate the pipeline is within an easement of 19 metres.
Figure 12 Junee to Griffith off take of APA natural gas pipeline runs through Narrandera Shire
Shire Profile & Key Issues
Newland Planning & Development and Narrandera Shire Council Page 64 of 101
A recent study by Sherpa Consulting19 has indicated that the Council proposed 150 metre buffer zone for industrial structures would meet the requirements of AS2995.20
9.1.2 Electricity
Transgrid is the State owned bulk electricity supplier for NSW. Transgrid has three very high voltage transmission lines running through the Shire. The figure below indicates that two, 132kV lines (in red) run through the Shire parallel and south of the Sturt Highway and one 330kV line runs west through the Shire to Darlington Point. Country Energy has a number of high voltage lines running throughout the Shire, from which they reticulate power to homes and businesses.
9.1.3 Irrigation water management and use
Water management Through the Water Management Act 2000, the commencement of water sharing plans in the Murrumbidgee Valley separated water licenses from land and introduced a number of water dealing (trading) options for both surface water and groundwater. Narrandera Shire forms part of the Murrumbidgee Regulated River Water Source 2003 Water Sharing Plan area. Water use The south eastern portion of the Narrandera Shire forms the effective headwaters of the Murrumbidgee Irrigation Area, one of the most significant agricultural areas in Australia. Murrumbidgee Irrigation Limited buys and manages water on behalf of its irrigator clients. The supply network begins at the Berembed Weir on the Murrumbidgee River, on Narrandera’s south eastern boundary. From the weir, water is diverted into the main canal and then into Bundidgerry Creek. Half way between the Berembed Weir and Narrandera is located the Bundidgerry Storage, with a capacity of 5,220 ML. From this storage the main canal begins again and runs into the Lake Talbot storage at Narrandera, having a capacity of 750 ML. From Lake Talbot the main canal borders the southern edge of the town of Narrandera and runs north west to Yanco and through to Griffith. Within Narrandera Shire there is a limited network of irrigation supply canals running off the main canal. Supply networks are located along the Midwestern boundary of the Shire in the Brobenah locality, forming part of the Yanco supply network. Murrumbidgee Irrigation Limited has advised that in the Narrandera Shire they have 46 customers holding total entitlements of 5,057 ML, comprising 1,496 ML of high security allocation and 3,561 ML of general security allocation.
9.1.4 Groundwater management and use
Water management The Narrandera Township and the south western part of the Shire are at the far eastern edge of the Murrumbidgee Groundwater Management Area (GMA).
19
Sherpa Consulting Pty Ltd March 2010 Red Hill Estate Development Stage 1 Junee-Griffith Lateral Gas Pipeline, AS
2885 and Quantitative Risk Assessment 20
This comment does not obviate the need for independent assessment of risk for new developments adjoining the
pipeline.

Shire Profile & Key Issues
Newland Planning & Development and Narrandera Shire Council Page 65 of 101
Ground water extraction in the GMA is managed under the Lower Murrumbidgee Groundwater Sources Water Sharing Plan 2003 (commenced in 2006). The water sharing plan provides limits for extraction of groundwater based on the calculated sustainable yield for the three aquifers within the GMA. The sustainable yield is almost half the previous licensed extraction within the GMA (pre 2006). The commencement of the water sharing plan required a significant reduction in entitlements for existing license holders. Given that there is an effective cap on groundwater extraction within the GMA, and supplementary water licences are being phased out by 2015/16, it is not possible for new water users to be granted a new extraction license. This means that new users have to purchase water entitlements on the water market. This brings market forces to the fore for new rural or other industries wishing to establish in the Shire. There are also existing landholders who purchase water entitlements year by year for agricultural use. The remainder of the Shire area is within the mid-Murrumbidgee groundwater area. At present there is no water sharing plan for the mid Murrumbidgee. There is also an effective cap on groundwater extraction within the mid Murrumbidgee area, and new users have to purchase water entitlements on the water market. Water use Properties directly adjoining the Murrumbidgee River and its tributaries have ‘stock and domestic rights’ under the Water Management Act 2000 to access water for those purposes. Water is otherwise accessed by license or purchase (water trading). There are various rules about trading within and outside the particular river catchment. There are several licensed groundwater users along the Murrumbidgee River and Yanco Creek within the Shire, typically operating centre pivot irrigation infrastructure. Within the Lower Murrumbidgee GMA, the proportion of water extracted for urban use is quite small, approximately 0.5% of the total water available for use21. Narrandera accesses its town water from groundwater bores (see below).
10.2 Utilities
9.2.1 Natural gas
Local reticulation of natural gas is carried out by Jemena Asset Management. Jemena obtain their gas from a trunk receiver station on the APA pipeline at Racecourse Road. A number of industries in that location are supplied with a bulk gas feed. Jemena supplies reticulated natural gas to Narrandera Township and as far south as the Gillenbah commercial area and as far north as the Nallabooma Estate, King Bee (industry) and Painters Siding Road. All local gas reticulation is at 210kPA in nylon line. Jemena has indicated that there is capacity at the trunk receiver station at Racecource Road to supply another 3,500 standard cubic metres per hour of gas. This is sufficient gas to supply another 3,300 dwellings, or is roughly equivalent to another five moderately high gas user industries.
21
NSW Office of Water (2010) Lower Murrumbidgee Groundwater Sources: Resource Condition Assessment Report 2010

Shire Profile & Key Issues
Newland Planning & Development and Narrandera Shire Council Page 66 of 101
9.2.2 Potable and raw water
Narrandera Shire is the water authority for the Township of Narrandera, whilst Goldenfields Water is the supply authority for the villages of Barellan and Grong Grong. Barellan also benefits from an irrigation channel based raw water supply during some summer months. Narrandera Township obtains its water from a borefield located near Lizard Drive, between the River and the town and west of the Newell Highway. There are five bores, of which two are operational, one has never been operational and two are not operational at present. Narrandera’s water supply undergoes treatment by means of aeration and chlorination at the treatment plant located on Old Brewery Road, again between the town and the river but east of the Newell Highway. The water supply does not have fine filtration and the water is of medium hardness, with the presence of iron and manganese elements. These elements give the water a distinctive taste. The potential peak treatment capacity is approximately 18-19 ML per day. The 2009 peak summer water usage was around 12.5 ML per day, and an average winter usage (with less rain than the 2010 season) would be around 2 ML per day. The water is reticulated via four pump stations and a series of reservoirs, containing around 17 ML of storage. The main pump station is adjacent to the treatment plant. There is around 7 days winter supply of potable water in the reticulation system and around 1.5 days summer supply without water restrictions. The main pump station is located within the 1 in 100 year Average Recurrence Interval (ARI) flood event area. The current potable water treatment facility and network provides sufficient capacity for a significant expansion of the town’s population.
9.2.3 Sewer
Narrandera Shire Council is the sewer treatment authority for the Township of Narrandera. The current sewage treatment facility was commissioned in the 1970’s and is located in the south west of the town at Hankinson Street. The plant is located above the 100 year ARI flood event. The plant utilises intermittent extended aeration through three Pasveer trenches. Each Pasveer trench has four brush/paddle aerators and has the capacity to treat an equivalent sewer load of 2,000 persons, giving the plant a treatment loading equivalent to 6,000 persons. Waste water decanted off the trenches goes to a temporary catch pond, where it is treated with ultra-violet light, and allum (to lower the phosphorus levels). The waste water is then directed to the Murrumbidgee River. The Council’s license enables the discharge of 700 ML of treated water per annum to the River. The current average discharge is around 0.8ML per day. (or less than 300ML per year). During the summer period, for approximately two months, a tertiary pond is used as an evaporation pond for untreated effluent (this effluent has no ultra-violet light treatment ad no alum added). The evaporation process reduces the total annual discharge to the River.

Shire Profile & Key Issues
Newland Planning & Development and Narrandera Shire Council Page 67 of 101
Most of the sewer mains in the town are gravity mains, however there are four pump stations within the town. The main pump station is in Larmer Street has two pumps operating as a primary plus backup. The current sewer treatment facility and network provides sufficient capacity for a significant expansion of the town’s population. At present there are around 100 houses, located in the south-west area of the town which are not sewered. The Gillenbah commercial area and the Council’s new industrial estate at Red Hill should be sewered for environmental reasons.
9.2.4 Electricity
Country Energy supplies electricity to the rural areas of the Shire and the towns and villages. Supply is via a series of 11,000 volt lines and supporting substations. Country Energy has advised that these lines have been installed to primarily service typical farm requirements (only). If a larger rural industry or other industry required additional power it is likely that a feeder line would be required to service that site.
10.3 Trends and key issues for infrastructure provision
9.3.1 Irrigation water
The Murrumbidgee Irrigation Limited (MIL) 2009 Annual Report22 notes that due to the current pace of change and complexity of issues surrounding the water market, the planning horizons go well beyond normal business planning timeframes. MI notes the following main risks and trends in relation to irrigation in the MIA.
The future operating landscape will be one where both water and energy are at a premium. This will require MIL and their customers to consider both water efficiency and the energy/carbon implications of business decisions, with a focus on off farm solutions that complement on farm requirements.
One of the biggest risks and challenges is the loss of significant amounts of water through government buy back schemes whilst still managing the same 660,000 hectares of infrastructure. This will require strategic intervention in the MIA system without threatening the viability of remaining customers.
The 2010-2015 MIL plan will focus on sustainable water management including capital investment in irrigation infrastructure required to drive efficiencies in system performance and address the anticipated landscape change.
These risks and trends would be similar for the administrators and users within the Coleambally Irrigation Area, which is located next to the western boundary of the Shire.
9.3.2 Draft Murray Darling Basin Plan and Guide
During the preparation of this profile the Murray Darling Basin Plan Volume 1 and Guide were released by the Murray Darling Basin Authority. The draft Basin Plan is likely to have major impacts on the western Riverina region through the imposition of a Sustainable Diversion Limit (SDL). This limit is proposed to result in up to 45% cut in entitlement for the Murrumbidgee Valley water users (Murrumbidgee Irrigation (MIL) and Coleambally Irrigation Limited (CIL)) and other surface water users in the Shire.
22
Murrumbidgee Irrigation Limited 2009 Annual Report

Shire Profile & Key Issues
Newland Planning & Development and Narrandera Shire Council Page 68 of 101
Whilst any cuts will have a major impact on Griffith, Leeton and Coleambally, the impact on cuts to Narrandera Shire will be more difficult to define. Narrandera has 46 customers aligned with Murrumbidgee Irrigation Limited, but many more persons have groundwater access and extraction rights from the Murrumbidgee River who are not MIL or CIL customers. The impact of the Basin Plan will require a watching brief.
9.3.3 Potable and raw water provision
The key issue for Narrandera is the security of the water supply through the bore pump system. If one of the bore pumps breaks down the other pump will be put under pressure and there is no redundancy. A related supply security issue is the rising main south of the town which supplies most of the towns reservoirs. If this main is breached or fails the town could run out of water by virtue of gravity drainage loss through the breach. Quick action is required to close the supply valve. The location of the main pumping station and bore pumps adjacent to the River also places much of that infrastructure within the 1 in 100 year flood area. A recent flood plain risk management study has made key recommendations about providing a levee of similar around the treatment plant and raising the bore pumps.23 A secondary issue is the hardness and minerality of the water (water quality). The iron and manganese elements in the water give it the capacity for staining and some corrosion of metal. This raises longer term issue for some of the reservoirs and public and private infrastructure alike. It is possible to filter a significant proportion of the ‘hardness’ from the water. Introducing a fine filtration process and complementary processes will also take the ‘distinct’ taste out of the water. Importantly in relation to the town water supply, the present capital works program is under review. This review is expected to provide some strategic direction for the commissioning or otherwise of a new water treatment plant (including filtration) away from the River, consideration of the rising main and single loop water system and other relevant water infrastructure matters. Lastly, whilst Narrandera is its own town water supply authority, the Shire is likely to come under increasing pressure to increase the cost of water to realise efficiencies in use and to meet the pricing requirements of the NSW Independent Pricing and Regulatory Tribunal. The impact of the draft Basin Plan on town water provision is also yet to be determined. The rising cost of water and move toward greater water efficiency is a trend that will have an impact on the Narrandera Township, and has implications for maintenance of properties, gardens, lawns and allotment size.
9.3.5 Electricity infrastructure
The town of Narrandera is adequately serviced by electricity infrastructure. There have been recent price rises for electricity use which have impacted on the ability of those less well-off to pay their bills. The foreseeable future is likely to see increases in household electricity costs through amplification of trunk infrastructure and the impact of any carbon tax (which big industry is calling for to provide certainty in the market).
23
Sinclair Knight Merz (2009) Narrandera Floodplain Risk Management Study
Shire Profile & Key Issues
Newland Planning & Development and Narrandera Shire Council Page 69 of 101
9.3.6 Gas infrastructure
Gas infrastructure within the Shire is good, however there is not much local growth to assist the provider with a return on investment. There is significant capacity in the Narrandera Township for new industry requiring large gas supplies.

Shire Profile & Key Issues
Newland Planning & Development and Narrandera Shire Council Page 70 of 101
11 NATURAL FEATURES OF THE SHIRE
11.1 Climate
The climate of Narrandera Shire could loosely be described as ‘Mediterranean’, with hot summers and cool to cold winters. The median annual rainfall is 418mm, with the highest rainfall recorded since 1967 of 755mm in 1974, and the lowest since 1967 of 172mm in 1967.24 Wind data for Narrandera Shire is patchy however data for Wagga Wagga indicates a 9am prevalence to easterly winds (30%), north easterly winds (12%) and westerly winds (10%), with calm conditions 24% of the time. Winds at 3pm for Wagga indicate a prevalence for westerlies (25%), south westerlies (15%) and north westerlies (12%), with calm conditions 12% of the time.25 The annual mean maximum temperature is 23.5 degrees and the annual mean minimum temperature is 9.9 degrees. The highest temperature in recent times was 47 degrees in 1982 (with an overall mean highest of 42.1 degrees), with the lowest temperature of -6 degrees in 1970 (and an overall mean lowest of 2.9 degrees.26 According to the NSW Government drought declaration statistics the Shire was officially drought declared from May 2006 to July 2010. In August 2010 the Shire was ‘marginal’ and in September 2010 drought conditions did not prevail, for the first time in many years. Local landholders describe the drought as beginning in 2002. Very good rains have been received between March and November this year, and this years crop is shaping as one of the best in a decade.
11.2 Physical landscape
Note: The following information has been derived from Bill Gammage, author of Narrandera Shire, a history of the Shire commissioned by the Narrandera Shire Council.27 500 million years ago, Narrandera lay under a deep sea. Marine sediment from this sea accumulated to form what is now a sandstone and quartzite bedrock east of New Park (on the south western boundary of the Shire) and generally occupying large areas of the eastern portion of the Shire. Between about 450 and 420 Million years ago earth movement folded this bedrock, pushing back the sea and fusing sand into quartzite and creating granite intrusions such as Mt Arthur (directly outside the Shire’s east boundary above Galore), the hills north of Grong Grong, Bald Hill and around Kamarah. From about 420 to 340 Million years ago the area was again under water, mainly freshwater lakes and large river floodplains. Very deep beds of sediment accumulated as the rivers wore away the land. About 380 Million years ago earth pressure folded the land to form most of the hills north of Narrandera including the crest of Square Knob and much of the bedrock under the Gillenbah Forest
24
Bureau of Meteorology 2010, Narrandera Airport Weather Station 1967-2010 25
Bureau of Meterology 2010, Wagga Wagga Airport Weather Station 1941 to 2004 26
Bureau of Meterology 2010, Narrandera Golf Club Weather Station 1970-2010 27
Gammage, Bill.1986 Narrandera Shire
Shire Profile & Key Issues
Newland Planning & Development and Narrandera Shire Council Page 71 of 101
and the Corobimilla area (south west of the Shire). Crinoid (sea lily) fossils have been found in this rock about five kilometres south of Narrandera. About 340 Million years ago strong earth pressure folded the existing bedrock layer to form a deep east west valley, generally along the current Murrumbidgee River path east of Narrandera. This uplift also contributed to the formation of the Narrandera Range and Colinroobie Hills. These hills have eroded significantly leaving only the current harder remnants. However they do form one of the Shire’s more distinctive features. The fine white clays in the southern part of the Shire were formed one to three Million years ago from very old sediments. The dominant surface soils are sands, loams and clays stained red by iron oxides. They were laid down by a mixture of dust from the red lands west of the well Shire and State, the eastern highlands and from prior streams such as those around the Yanco Creek in the south and the Mirrool and Sandy Creeks in the north. Floods of intermittent size have formed alternating sand/clay layers and the river/prior streams have formed much of the local alluvial soils, ranging from gravel and course sand to grey silt. The physical landscape of the Shire is dominated by:
The hills north of Narrandera, rising between 100 and 200 metres above the plain and forming high points such as Square Knob (386 metres above sea level), Mt Brobenah (360 metres), Mt Barrat (434 metres), Mt Bunganbil (423 metres) and Bent’s Hill (353 metres);
A series of wetlands defined by surrounding hills, such as Lake Coolah and Lake Mejun, and proximity to the river system, such as Dry Lagoon and Goonerah Lagoon; and
The Murrumbidgee River and major tributaries, such as the Yanco Creek, Bundidgerry Creek, Mirrool Creek and Sandy Creek.
These landscape features are shown on the map of the Shire at Figure 13 (adapted from Gammage).
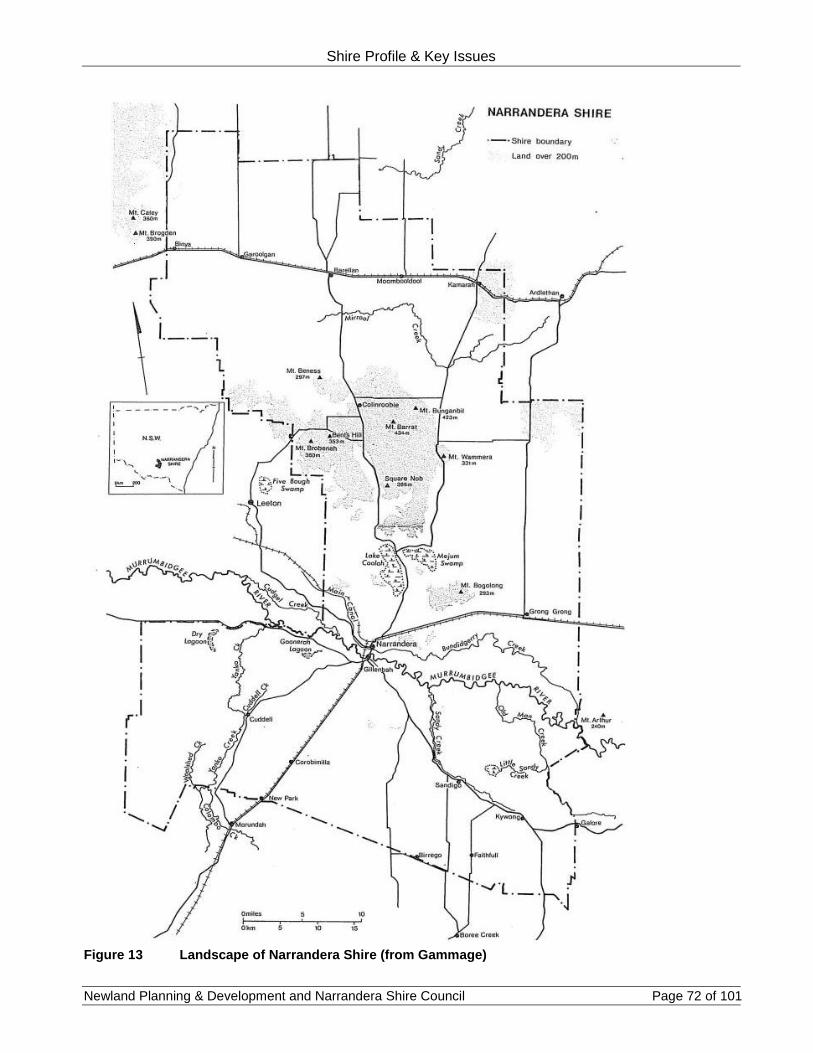
Shire Profile & Key Issues
Newland Planning & Development and Narrandera Shire Council Page 72 of 101
Figure 13 Landscape of Narrandera Shire (from Gammage)

Shire Profile & Key Issues
Newland Planning & Development and Narrandera Shire Council Page 73 of 101
11.3 Sensitive lands – biodiversity
The dominant tree species in the Shire are the White Cypress and the Red Gum. The most prevalent vegetation groupings in the Shire are:
The Bimble Box woodland (Barellan to Binya and generally the Mirrool Creek area);
The Dwyer’s Red Gum, White Cypress Pine and Currawang shrubby bushland (Narrandera Range and Colinroobie Hills);
The River Red Gum forest along the Murrumbidgee River, Yanco Creek and Bundidgerry Creek;
The grey box, White Cypress Pine groups of the State Forests and Yanco Creek, and
The Weeping Myall (Boree) open woodland and Riverina Plains Grasslands complex of the south west of the Shire near Yanco Creek and toward Coleambally.
Though a large portion of the Shire has been cleared of native vegetation there are still many areas of significant vegetation which support native flora and fauna. These sensitive lands (biodiversity and vegetation) have been mapped and grouped by the NSW Department of Environment, Climate Change and Water (DECCW) and are shown collectively at Figure 14. The native vegetation of the Shire is one of its most important features.

Shire Profile & Key Issues
Newland Planning & Development and Narrandera Shire Council Page 74 of 101
Figure 14 Sensitive lands (vegetation and biodiversity) mapping Narrandera Shire

Shire Profile & Key Issues
Newland Planning & Development and Narrandera Shire Council Page 75 of 101
11.4 Sensitive lands – water and groundwater
DECCW have collectively mapped those areas of the Shire where the groundwater is vulnerable to contamination from the surface and where the River and its major tributaries flow. These lands are mainly south of the Narrandera Township, although the Mirrool Creek has been included in this data set. The sensitive lands – water mapping is provided at Figure 15.
11.5 Sensitive lands – land attributes
DECCW have again collectively mapped those areas of the Shire where the soils or landscape features are subject to land based constraints such as wind or water erosion, steep land and dryland salinity. This mapping is provided at Figure 16. The most dominant feature on the map is the Narrandera Range/Colinroobie Hills elevated land features, however there are some distinct areas of dryland salinity within the Shire in the Strontion Road and Cowabbie Creek area – see section 12.3.

Shire Profile & Key Issues
Newland Planning & Development and Narrandera Shire Council Page 76 of 101
Figure 15 Sensitive lands (water and groundwater) mapping Narrandera Shire

Shire Profile & Key Issues
Newland Planning & Development and Narrandera Shire Council Page 77 of 101
Figure 16 Sensitive lands (land attributes) mapping Narrandera Shire
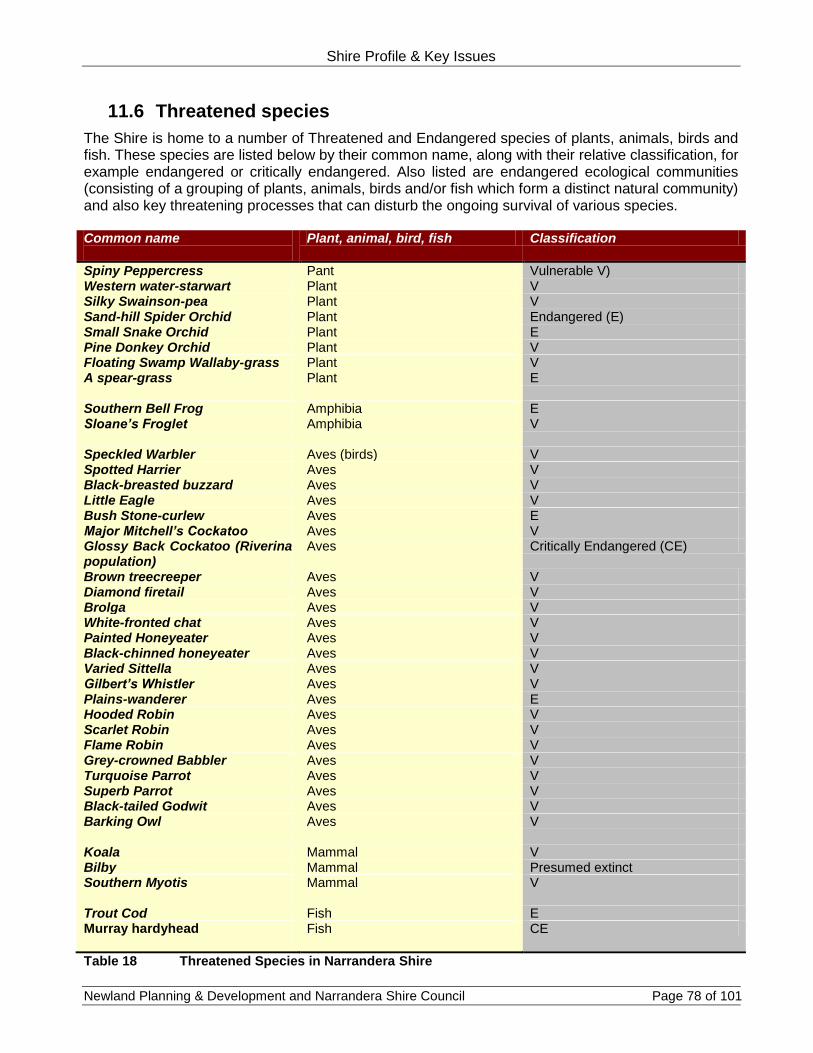
Shire Profile & Key Issues
Newland Planning & Development and Narrandera Shire Council Page 78 of 101
11.6 Threatened species
The Shire is home to a number of Threatened and Endangered species of plants, animals, birds and fish. These species are listed below by their common name, along with their relative classification, for example endangered or critically endangered. Also listed are endangered ecological communities (consisting of a grouping of plants, animals, birds and/or fish which form a distinct natural community) and also key threatening processes that can disturb the ongoing survival of various species. Common name
Plant, animal, bird, fish Classification
Spiny Peppercress Pant Vulnerable V) Western water-starwart Plant V Silky Swainson-pea Plant V Sand-hill Spider Orchid Plant Endangered (E) Small Snake Orchid Plant E Pine Donkey Orchid Plant V Floating Swamp Wallaby-grass Plant V A spear-grass Plant E Southern Bell Frog Amphibia E Sloane’s Froglet Amphibia V Speckled Warbler Aves (birds) V Spotted Harrier Aves V Black-breasted buzzard Aves V Little Eagle Aves V Bush Stone-curlew Aves E Major Mitchell’s Cockatoo Aves V Glossy Back Cockatoo (Riverina population)
Aves Critically Endangered (CE)
Brown treecreeper Aves V Diamond firetail Aves V Brolga Aves V White-fronted chat Aves V Painted Honeyeater Aves V Black-chinned honeyeater Aves V Varied Sittella Aves V Gilbert’s Whistler Aves V Plains-wanderer Aves E Hooded Robin Aves V Scarlet Robin Aves V Flame Robin Aves V Grey-crowned Babbler Aves V Turquoise Parrot Aves V Superb Parrot Aves V Black-tailed Godwit Aves V Barking Owl Aves V Koala Mammal V Bilby Mammal Presumed extinct Southern Myotis Mammal V Trout Cod Fish E Murray hardyhead
Fish CE
Table 18 Threatened Species in Narrandera Shire

Shire Profile & Key Issues
Newland Planning & Development and Narrandera Shire Council Page 79 of 101
The plants, animals and bird species are listed under the Threatened Species Conservation Act 1995 and the fish species are listed under the Fisheries Management Act 1994. Under the Threatened Species Conservation Act 1995 and Fisheries Management Act 1994 there are endangered species recovery plans and also ‘man-made’ processes (called key threatening process) which affect the ability of the species to survive. Within the Shire there is a recovery plan in place for the Bush Stone –curlew and a draft recovery plan in place for the Barking Owl, Plains-wanderer and Southern Bell Frog. There is also a vulnerable species recovery plan in place for the Koala. There are various Key Threatening Processes applicable to Narrandera Shire, as follows:
Installation and operation of in-stream structures and other mechanisms that alter natural flow regimes of rivers and streams;
Removal of large woody debris from New South Wales rivers and streams;
Bush rock removal;
Clearing of native vegetation;
Loss of hollow bearing trees;
Loss of dead wood and dead trees;
Competition and grazing by the feral European rabbit, and
Predation by the European Red fox.
Shire Profile & Key Issues
Newland Planning & Development and Narrandera Shire Council Page 80 of 101
12 NATURAL RESOURCES
12.1 Forests
There have been significant changes in the management of the regions forests over the past 12 months. The NSW Government, through the Natural Resources Commission (NRC) conducted an assessment of the White Cypress and River Red Gum State forests within the Riverina bioregion, and as of July 1, 2010 a significant area of red gum forest in the Murrumbidgee and Murray Valleys is now either National Park or Regional Park. In Narrandera’s case the Narrandera State Forest immediately west of the town is now part of the Murrumbidgee Valley Regional Park system – effectively a National Park in status. Locally the MIA State Forests are now National park. Upon the declaration of the National Park/Regional Park areas the logging of red gum ceased in those areas, with future management to be undertaken by the NSW National Parks and Wildlife Service. Notwithstanding the loss of red gum forestry, the Shire and region’s White Cypress forestry industry continues. The Forest assessment retained 86% of the south western NSW cypress forests as State Forests28 Forests NSW allocates areas within the local White Cypress based State Forests, for sustainable logging activities. A long term contract for logging and sawmilling is held by Grants Sawmilling Co, who operate a Narrandera mill in River Road. The Grants Mill has a 20 year wood supply agreement with Forests NSW and employs in Narrandera loggers, milling and office staff. Local White Cypress forests include:
Banandra State Forest (western Shire boundary);
Gillenbah State Forest;
Buckingbong State Forest (southern Shire boundary), and
Matong State Forest (Wagga City LGA),
12.2 Mining
There is very little actual mining within the Shire. Most ‘mining’ is actually the winning of extractive material. Notwithstanding this, the western part of the Shire is subject to Petroleum Exploration License 472, held by Energetica Resources Pty Ltd.
12.3 Extractive Industry
There are approximately 15 pits within the Shire winning extractive material, including sandstone, colluvium, conglomerate, pebbly sandstone, siltstone, Phyllite and psammite. The material forms mainly crushed aggregate and road base. Figure 19 shows the location of the various pits in the Shire. This is a draft map only and does not represent NSW Government policy. Not appearing on the map at present is an existing sand extraction business located on the Murrumbidgee River west of the Narrandera Township off the Leeton Road.
28
http://www.grantssawmillingco.com.au

Shire Profile & Key Issues
Newland Planning & Development and Narrandera Shire Council Page 81 of 101
Figure 17 Location of extractive material pits Narrandera Shire

Shire Profile & Key Issues
Newland Planning & Development and Narrandera Shire Council Page 82 of 101
13 NATURAL HAZARDS
13.1 Flooding
The Shire is subject to flooding from the Murrumbidgee River and from a broad overland flow from the Mirrool Creek southwest of Barellan. Sinclair Knight Merz recently completed a Floodplain Risk Management Study and Plan for the floodplain in the vicinity of the Narrandera Township. The floodplain map, showing the three hydraulic categories of floodway, flood storage and flood fringe, is provided at Figure 20. Floods passing through the Narrandera reach of the Murrumbidgee River, flow essentially westward over a 15km wide floodplain. The predominant flow paths over the floodplain are the Murrumbidgee River and its overbank sections, Sandy Creek/Poison Waterholes Creek, and Gillenbah Creek. The main obstacles impeding flood flow are the Narrandera River Bridge on the Newell Highway, the Narrandera-Tocumwal Railway viaduct and the banks of the Main Canal. Downstream of the railway viaduct the flood extends northwards to an area in the vicinity of the Narrandera Aerodrome and Cudgill Sandhills. This area is considered predominantly a flood storage area. Serious flooding has been reported in the region since settlement began over 150 years ago. Flood events in the Murrumbidgee Valley described from ‘serious’ to ‘disastrous’ were recorded in 1824, 1832, 1852, 1867, 1875 and 1878 (Sinclair Knight and Partners, 1977). The flood of June 1852 is considered the most severe prior to the commencement of gauging in 1887, mainly because of the 89 lives lost in Gundagai. However, the 1853 flood exceeded this flood in terms of level. Since regular recording of levels in the Murrumbidgee Valley, the most significant floods were identified as having occurred in 1891, 1900, 1925, 1931, 1950, 1952, 1956, 1974 and 1989. The 1974 flood is the highest recorded at Narrandera. It reached a level of 146.36m AHD at the Narrandera gauge (GSN 410005) and had an estimated discharge of 266,000 ML/d. This flood was initially recorded as a 100 year Average Recurrence Interval (ARI) event; however the 2007 review29 determined that the 1974 flood was approximately a 65 year ARI event. The Narrandera Local Environmental Plan 1991 map sheet 1 shows a cross hatched area of land as being flood liable. This flood area corresponds to an 80 year ARI event. This development control plan is based on more recent Sinclair Knight Merz 2007 modelling and therefore supplements and enhances the now out of date information on the LEP map sheet. The Council has prepared a draft development control plan to guide development within the floodplain.
29
Sinclair Knight Merz (2007) Narrandera Flood Study Review
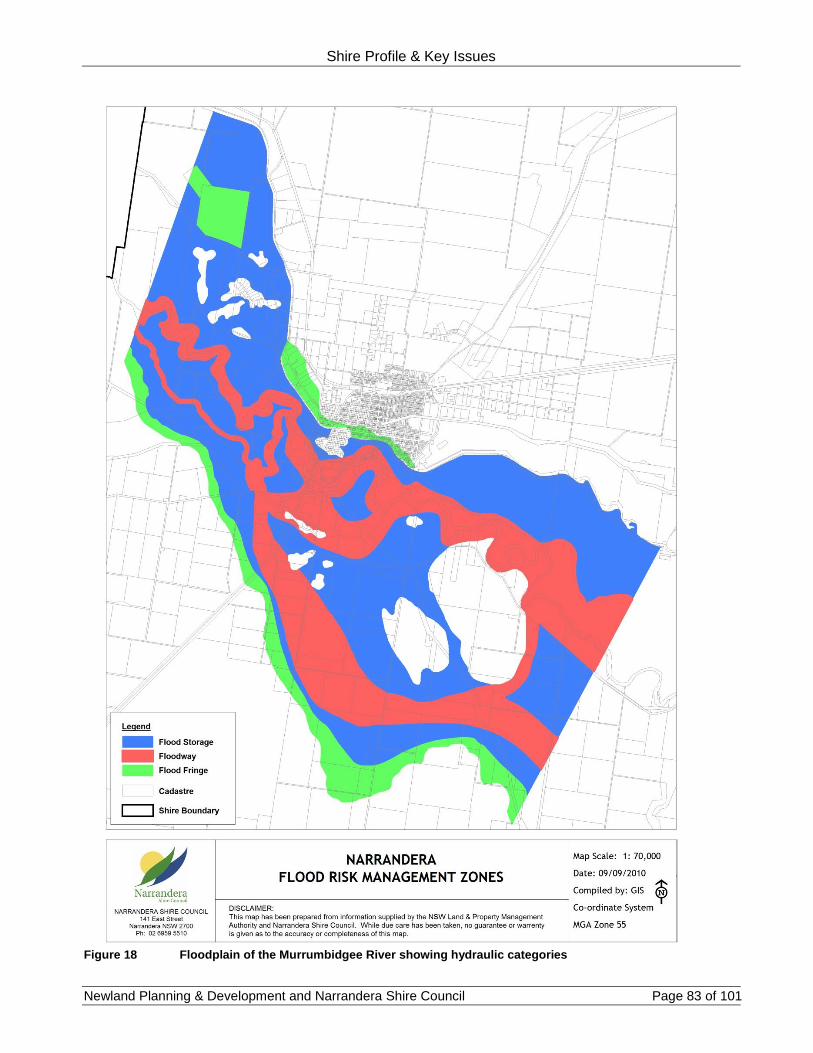
Shire Profile & Key Issues
Newland Planning & Development and Narrandera Shire Council Page 83 of 101
Figure 18 Floodplain of the Murrumbidgee River showing hydraulic categories

Shire Profile & Key Issues
Newland Planning & Development and Narrandera Shire Council Page 84 of 101
13.2 Bushfire prone land
The Commissioner of the NSW Rural Fire Service provides an official map of bush fire prone land (for planning purposes). Land is mapped according to its density and type of vegetation, aspect and slope. The Shire map is provided in Figure 21 below.
Figure 19 Bush fire prone land Narrandera Shire

Shire Profile & Key Issues
Newland Planning & Development and Narrandera Shire Council Page 85 of 101
13.3 Dryland salinity
There are a number of areas of land within the Shire which have been moderately to severley affected by dryland salinity30. The foremost of these is located in the Strontion Road locality, toward the southern Shire boundary with Urana Shire. The Strontion land almost completely bared off in the mid 1980’s due to a naturally salty landscape, clearing of vegetation, its location within a basin which is lower than the Murrumbidgee River and the presence of sand aquifers providing subsurface water flow to that basin. This land is now largely revegetated with Old Man Saltbush due to the efforts of the landowners and the Strontion Road Landcare group. A second area of salt affected land is a two to three kilometre stretch of Cowabbie Creek directly south of Grong Grong Village, thought to be caused by vegetation clearing and a local geological feature which restricts subsurface water flow.31 To the immediate north west of Grong Grong is another small area of salt affected land known anecdotally as ‘Hibbards salt patch’. Notwithstanding the abovementioned areas the Shire is relatively free of dryland and irrigation based salinity, although there have been instances where urban salinity has affected buildings within the Narrandera Township area.
13.4 Urban salinity
Within the Township of Narrandera there are some indicators of urban salinity, such as salt stains and brick mortar being eaten away by rising damp. There are areas of urban salinity around the Narrandera sportsground, which may have arisen through local drainage constraints and watering of the grounds. At this stage the urban salinity problem has not been sufficient to warrant a specific strategy to combat it.
13.5 Drought and climate change
According to the Australian Bureau of Meteorology, Australia has one of the most variable rainfall climates in the world. Over the long term we have about three good years and three bad years out of ten. Research indicates that severe drought affects some part of Australia about once every 18 years. The Bureau’s website notes that Australia and the globe are experiencing rapid climate change. Since the middle of the 20th century, Australian temperatures have, on average, risen by about 1°C with an increase in the frequency of heatwaves and a decrease in the numbers of frosts and cold days. Rainfall patterns have also changed - the northwest has seen an increase in rainfall over the last 50 years while much of eastern Australia and the far southwest have experienced a decline. There has been a great deal written about climate change (or the enhanced greenhouse effect) over the last decade, and particularly in the previous five years, noting the regular reviews of the Inter-government Panel on Climate Change, and the Stern Review on the Economics of Climate Change (2006). Narrandera Shire is presently taking part in the Strengthening Basin Communities Program, through funding provided by the Commonwealth Government and in conjunction with the RAMROC Group 4 cluster and consultants Sinclair Knight Merz. In early October 2010 a draft Discussion Paper on
30
DECCW 2010 Environmentally Sensitive Land mapping 31
Per comm. Peter Beal 27/09/2010

Shire Profile & Key Issues
Newland Planning & Development and Narrandera Shire Council Page 86 of 101
Trends and Drivers of Change for Narrandera Shire was received.32. In relation to climate the Executive Summary reads as follows. “Recent trends in climactic conditions are similar across Cluster Group 4 Councils. The last decade
has been the driest recorded for the southern Murray‐Darling Basin and among the drier epochs in
the past 130 years at Narrandera. Maximum temperatures have also been above historical averages. Rainfall conditions experienced during the last decade have been slightly lower than worst case projections for climate change by 2030, with temperatures similar to the extreme end of projections for that period. Mid-range and worst case projections anticipate further reductions in rainfall and increased temperatures beyond 2030.
Long‐term climate change projections, particularly those at the dry end of the range, are challenging
for the Narrandera area. Capacity for dryland agriculture would be diminished, with rainfall declining to about 393 mm in the worst case. Inflows to Murrumbidgee irrigation storages would also be affected and the volume of water available for diversion for irrigation and other uses might decline by as much as 22%. More extreme temperatures, particularly at critical stages in the crop cycle, could also jeopardise horticultural and grain crop production. Projected future reductions in streamflows and of the frequency and extent of flood events may also adversely affect the health of important environmental assets along the Murrumbidgee River valley.” On the 8th October 2010 the Murray Darling Basin Authority released the draft Basin Plan, which proposed widespread cuts in surface and groundwater allocations, particularly in areas such as the Murrumbidgee Valley - as high as 37-45% under the proposed Sustainable Diversion Limit (SDL). The draft Basin Plan is not finalised and will be subject to intense pressure from lobby groups and all sides of politics. Large cuts in allocation will have an obvious detrimental effect on the economy of Griffith and Coleambally. Directly, Narrandera will be less affected, as less than 15% of the Shire’s agriculture economy is derived from irrigation, however indirect effects will be likely in Narrandera, as part of the Shire’s population works in Griffith and Leeton and Narrandera is situated on Irrigation Way, the main road to Leeton and Griffith. Generally, it would be reasonable for the Shire’s irrigation and dryland farmers to expect cuts in allocation and reduction in rainfall, particularly reductions in growing season rainfall (between April and October).
32
Sinclair Knight Merz 2010, Strengthening Riverina Irrigation Communities, Trends and Drivers of Change Discussion
Paper

Shire Profile & Key Issues
Newland Planning & Development and Narrandera Shire Council Page 87 of 101
14 COUNCIL AND AGENCY WORKSHOPS
14.1 Workshop with councillors & senior staff
A workshop was held with Councillors and senior staff and a number of issues were raised as being of significance to the town and Shire. These issues are listed below with discussion. Minimum size for house blocks in town The current LEP provides a minimum allotment size of 550m2 for a dwelling, which makes it difficult for the Council to be flexible with medium density or small lot housing, particularly as there is apparently some demand for these developments in the town area. Under the new LEP it will be possible to set a lower minimum allotment size, or to set the minimum allotment size in a Development Control Plan (DCP), which is more flexible than the LEP. The town has not experienced much growth The population of the town and Shire has steadily declined since 1996 – see the community profile at the beginning of this report. The Shire’s population is forecast to fall by a further 28% over the next 25 years or so. This is a very significant fall, and will have implications for the Shire economy, workforce, local business sustainability and social sustainability. The aim of the planning review is to give the Council and community some direction for future development and to look for opportunities to strengthen the town. Diversity in larger housing lot size Councillors expressed the view that the Bells Road Estate, having 5000m2 allotments, and the Nallabooma Estate, having an average of 1 hectare allotments, were both successful and are both built out. It was agreed that there is potential to add to the diversity of large lot residential properties adjoining the town area and this would be investigated as part of the forthcoming Housing Study. Rural small holdings At the workshop a view was expressed that the Council should allow development of 20 acre small holdings allotments outside the Narrandera town boundary. The demand for these allotments can be assessed during the Rural Land Study proposed for 2011. Smaller blocks for aged housing Discussion at the workshop indicated the need for flexibility in providing smaller allotments for aged persons, similar to the above point about small lot housing. The forthcoming Housing Study will address this issue. Infill and consolidation or urban land It was agreed at the workshop that there was potential within some of the larger residential blocks in town for new dwellings to be built, particularly on corner blocks or blocks with rear lane access. This matter will be examined in the Housing Study.

Shire Profile & Key Issues
Newland Planning & Development and Narrandera Shire Council Page 88 of 101
Highway commercial zone Most of the existing Newell Highway frontage within Narrandera contains commercial buildings, parkland or dwellings. There is very little land suitable or viable for consolidation for highway related uses, particularly land extensive uses. Councillors have expressed the view that land for a highway commercial zone would assist the Township to attract business investment. Under separate cover the Councillors have also noted that there are some existing land use conflicts in town where industrial businesses are located close to or adjoining residential premises. Irrigation Way (Main Road 80 to Leeton) also features mixed industrial/commercial and residential land uses. Ideally a highway business precinct would be located within a green field’s site where it will have minimal impact on main street retail vitality more sensitive land uses through traffic movement, noise and lighting. This will be investigated in the Industrial Lands Study due in 2011. Better use of the Gillenbah truck stop location Councillors noted that the Gillenbah commercial area was vitally important to the progression of the town. A Master plan was developed for this locality in 2009, however the NSW RTA is due to carry out a major upgrade in 2012 and the Master plan is presently being revised to recognise this work and the expansion plans of the Caltex Service Station. Integral to the efficient use of Gillenbah and the sustainable continuation of commercial uses is the provision of reticulated sewer services. Provision of sewer will enable the Caltex Service Station to provide truck parking and new diesel bowsers in the area of their site presently allocated to on-site sewer disposal. This work in turn will require revision of existing ingress and egress points, which must work effectively with the RTA upgrade. Significant redevelopment of Gillenbah is linked then to the Council provision of sewer, which would have to occur from July 2011. The Council will be able to recoup some costs of sewer provision through connection fees from existing commercial businesses and residents in the precinct. The provision of sewer is also required from an environmental perspective – having numerous septic systems within close proximity to the River and groundwater recharge areas. Provision of retirement home land Councillors have noted the potential need for aged care accommodation over the next one to two decades. Aged care accommodation in section 5.6 of this report and will be addressed in the forthcoming Housing Study. Housing overlooking Lake Talbot There may be opportunity for housing to take advantage of the views of Lake Talbot, in the south eastern section of the Township. This will be addressed in the Housing Study. The key issues regarding housing in this area are likely to be flood affectation, bushfire protection, servicing and visual constraints for ridgeline development.

Shire Profile & Key Issues
Newland Planning & Development and Narrandera Shire Council Page 89 of 101
Preventing inappropriate development A question was raised concerning development which may be inappropriate in certain sections of the town, for example brothels. At the present time the town of Narrandera has two main land use zones, being Village/Urban and Industrial. The preparation of the new LEP will provide the Council with the opportunity to review the towns land use zones and the various land uses which will be permissible within those zones.
14.2 Workshops with government & non-government agencies
A workshop was held with key State Government agencies in late August and individual meetings were held with the NSW RTA, the Sandhills Aboriginal Foundation and the Narrandera Local Aboriginal Land Council. Letters were sent to a large number of adjoining Council’s and other State agencies, and discussions were held with NSW Forests, NSW Agriculture, Minerals NSW, Leeton Shire Council and Murrumbidgee Irrigation Limited. The responses and issues raised by the various agencies and Councils are discussed below.
14.2.1 NSW Rural Fire Service (RFS)
The NSW RFS recently updated the bushfire prone land mapping for the Shire and this information has been placed onto the Council’s GIS. The RFS noted that the greatest fire threat to Narrandera Township was the red gum forest to the west of the town. It was noted that the transfer of the former State Forest to the Regional Park system may have implications for vegetation growth and fire risk, and this would have to be monitored. The RFS also noted that, depending on prevailing conditions, Barellan and Grong Grong can be at risk due to grass fires – although grazing and pasture country is not usually mapped as bushfire prone unless it is of a higher slope. The RFS emphasised compliance with the NSW Government’s Guidelines “Planning for Bushfire Protection”. This document has relevance to strategic planning for new settlement, including large lot or rural residential development.
14.2.2 NSW State Emergency Service (SES)
The NSW SES, through local Controller Wal Lingen, emphasised that there are very few SES personnel within the Narrandera district to worked during the big 1974 floods. In the 1974 flood there was approximately 1 metre of water through the service station at Gillenbah, and the town was cut off from the south for about a fortnight. There is normally about 4-6 days’ notice of Murrumbidgee River flood conditions. There was discussion about the vulnerability of the town’s main water pump station, being within the 1 in 100 year flood area. The SES is looking at the potential cost and feasibility of building a permanent levy around the pump station. The SES noted that the main flood risk in town was the underground drain which crosses East Street in the vicinity of the Chemist ad Café G. This drain has been known to flood after one hours heavy rainfall in the local catchment, with overland flow running west down the lane past the Chemist. The stormwater flooding is difficult to alleviate due to the existing built environment in this area of town. The discussion on River flooding was timely given the recent September low level flooding of the River, and the exhibition of the Council’s draft Flood Development Control Plan.

Shire Profile & Key Issues
Newland Planning & Development and Narrandera Shire Council Page 90 of 101
The SES also noted that the airport water main has low capacity and often fails when they try to draw water from it.
14.2.3 Murrumbidgee Catchment Management Authority (CMA)
The Murrumbidgee CMA assisted with the identification of important local wetlands and areas of land degradation within the Shire. It was noted that the management regime and fire regime may change with the transfer of the Narrandera State Forest west of town to the Regional Park system. The CMA assisted with mapping for this Profile, and they will work with DECCW (see below) to provide mapping to identify threatened species predictive habitat.
14.2.4 NSW Department of Environment, Climate Change and Water (DECCW)
The NSW DECCW have provided land sensitivity mapping for the Shire, including land, water and biodiversity sensitivity maps – see section 10 of this report. The aim of this mapping is to provide an ‘’overlay” to future land use zoning maps. The overlay indicates land that may have some limitations to development, but does not act as an outright zoning prohibition. In this way the flexibility in the zoning is maintained. The use of DECCW sensitivity maps is now standard practice in the NSW planning system, particularly for regional areas where the level of environmental mapping is not detailed enough to make outright zoning decisions. DECCW will also work with the Murrumbidgee CMA and the Narrandera Shire Council to provide an indicative habitat overlay for Threatened Species within the Shire. The aim of this overlay is to provide more certainty for landholders and developers when investigating the use of land, rather than experiencing delays later in the planning or development process.
14.2.5 NSW Roads and Traffic Authority (RTA)
As noted in section 8.9 of this report the RTA is undergoing throughout the State a road train modernisation program, designed to reduce the number of road trains on the highways and major roads and replace them with B-doubles and in some cases B-triples and A-B triples. Notwithstanding this the RTA (Wagga office) has indicated that the Newell Highway route from Narrandera to Forbes is under investigation for road train use. This investigation considers such matters as overtaking lanes and distances, road verge extent, curve radii and other relevant matters. The RTA also has programmed for early-mid 2012 a full reconstruction of the Newell and Sturt Highways at Gillenbah – from the joint Highway intersection at the rail bridge location, to the Sturt southern approach and the Newell south of the River bridge. The RTA Wagga office believes that Gillenbah is an important rest stop and logical breakdown area for road trains and B-double vehicles, and that the locality has significant potential to service the State and interstate trucking industry. The RTA supports redevelopment at Gillenbah. Ideally the proposed highway reconstruction at Gillenbah should coincide with the expansion plans of the Caltex service station and the Council sewering of the locality, to ensure that the best infrastructure and traffic result is achieved. A well planned and comprehensive development of the Gillenbah locality should see dividends for the Narrandera Township.

Shire Profile & Key Issues
Newland Planning & Development and Narrandera Shire Council Page 91 of 101
14.2.6 Narrandera Local Aboriginal Land Council (NLALC)
A workshop was held with the NLALC and elements of the cultural heritage of the local Aboriginal people was discussed. The Land Council indicated that there was a need for additional housing for Aboriginal persons in Narrandera, particularly larger houses with four or more bedrooms. At present there are over 30 families on the waiting list for the two houses owned by the Land Council. Some of this information is contained in section 6.3 of this report. At the workshop the location of sites of cultural importance was discussed and a map was left at the Land Council offices in order for those places to be indicated located. When this process is complete the importance of those sites can be explained and documented. Together with this map the Land Council has undertaken to work with the consultant (author) to develop a predictive model of areas of cultural significance in the Shire (particularly around the Murrumbidgee River). This map will be similar to an environmental overlay in that it will provide some prior notice to proponents that there may be Aboriginal artefacts within that location. The predictive model is based mapping showing high, medium and low thresholds for the likelihood of prior Aboriginal settlement and artefacts.
14.2.7 Sandhills Foundation for Aboriginal Affairs (Aboriginal Corporation)
A workshop was held with the Sandhills Foundation (including local elders) and elements of the cultural heritage of the local Aboriginal people were discussed. Some of this information is contained in section 6.3 of this report.
14.2.8 NSW Department of Planning (DoP)
The DoP is the peak body responsible for the implementation of the Standard Instrument local environmental plan which Narrandera has commenced preparing. The Department has been referred a copy of the methodology for the preparation of the LEP, however at this point has not responded formally to the request for comment. Discussions have been held with the Department concerning use of their resources to assist with various parts of the LEP preparation process, including mapping. The Department’s role in the LEP will include reviewing key strategies, such as the residential strategy, the commercial strategy and the final land use strategy for all Shire areas.
14.2.9 NSW Industry and Investment – Forests NSW
NSW Industry and Investment – Forests NSW were contacted in writing and provided information on the recent changes to the status of State Forests in the region – see section 11.1 of this report.
14.2.10 NSW Industry and Investment – Minerals NSW
NSW Industry and Investment – Minerals NSW were contacted in writing and provided information on the various extractive industries (pits) within the Shire – see section 11.3 of this report. Minerals NSW are presently investigating the placement of buffer areas around the various extraction sites within the Shire and the State. The buffer areas are designed to prevent future urban development from limiting the operation of the relevant extractive industry. The future introduction of buffers in Narrandera Shire would have limited impact due to the rural location of most of Narrandera’s pits.
14.2.11 NSW Industry and Investment – Department of Agriculture
NSW Industry and Investment – the Department of Agriculture was contacted in writing and provided a written response. The Department provided contact details for the various branches of Industry and Investment and noted that land classification mapping was not available for the Shire. The

Shire Profile & Key Issues
Newland Planning & Development and Narrandera Shire Council Page 92 of 101
Department provided some generic material concerning the research and preparation of comprehensive LEPs. If the Council’s prepares a rural lands strategy with the aim of examining and possibly reducing the minimum allotment size for a dwelling in broad acre rural areas, the Department of Agriculture will be a key stakeholder in such a strategy.
14.2.12 NSW Industry and Investment – NSW Fisheries
NSW Industry and Investment - Fisheries was contacted in writing, however at this point a written response has not been received. NSW Fisheries has prepared a key fish habitat map for the Narrandera Shire area. Key fish habitat within the Shire includes the entire Murrumbidgee River, Yanco Creek and Cuddell Creek, Cowabbie Creek, Mirrool Creek, Dry Lagoon, Sandy Creek and Bundidgerry Creek.
14.2.13 NSW Office of Water
The NSW Office of Water was contacted in writing, however at this point a written response has not been received.
14.2.14 Murrumbidgee Irrigation Limited (MIL)
Murrumbidgee Irrigation Limited were contacted in writing and after some discussion were able to provide information on water entitlements held by Narrandera customers – see section 9.1.3.
14.2.15 Civil Aviation Safety Authority (CASA)
CASA were contacted in writing and provided the following points for the Council’s consideration:
The protection of the current and future Obstacle limitation Surface;
Provision of obstacle control policies within the vicinity of the aerodrome, including rising plume issues;
Lighting within the vicinity of the aerodrome;
Bird and animal hazard management, and
The protection of radar and navigational aids. It is noted that the aerodrome’s annual audit by CASA was recently completed and the above issues are satisfactory.
14.2.16 Lockhart Shire Council
The Lockhart Shire Council was contacted in writing and responded that there were no specific issues within the area of the common boundary.
14.2.17 Urana Shire Council
The Urana Shire Council was contacted in writing and responded that a matter that arise in the future is the difference between the rural minimum allotment size for a dwelling along the common Shire boundary. In Urana the minimum allotment size for a dwelling is 100 hectares, and in Narrandera it is 750 hectares. There are a small number of allotments that are located in both Shires, and this should be borne in mind when considering the rural lands strategy.

Shire Profile & Key Issues
Newland Planning & Development and Narrandera Shire Council Page 93 of 101
14.2.18 Murrumbidgee Shire Council
The Murrumbidgee Shire Council was contacted in writing, however at this point a written response has not been received.
14.2.19 Leeton Shire Council
The Leeton Shire Council was contacted in writing and a meeting was held with the Shire’s Manager of Planning. The main issue that arose was that of the differing minimum allotment sizes for dwellings along the common Shire boundary areas (similar issue to Urana Shire – see above). Leeton Shire also discussed the potential adverse economic and social effects of the Murray Darling Basin Authority draft Basin Plan (not then released) and the positive news at the sale and likely reopening of the Swifts feedlot – which benefits both Leeton and Narrandera.
14.2.20 Griffith City Council
The Griffith City Council was contacted in writing, however at this point a written response has not been received.
14.2.21 Carrathool Shire Council
The Carrathool Shire Council was contacted in writing, however at this point a written response has not been received.
14.2.22 Bland Shire Council
The Bland Shire Council was contacted in writing, however at this point a written response has not been received.
14.2.23 Coolamon Shire Council
The Coolamon Shire Council was contacted in writing, however at this point a written response has not been received.
14.2.24 Wagga Wagga City Council
The Wagga Wagga City Council was contacted in writing, however at this point a written response has not been received.

Shire Profile & Key Issues
Newland Planning & Development and Narrandera Shire Council Page 94 of 101
15 KEY ISSUES & OPPORTUNITIES FOR NARRANDERA SHIRE
The key issues below are not placed in order of importance or any hierarchy. They are synthesized from the discussion and research in the previous pages. They have also not been ranked in order of priority or timeframe for implementation – however this can be carried out in conjunction with the Steering Committee. Each issue is important in its own right to a particular sector of the community, and the consideration of each issue may help to strengthen the Narrandera community against future challenges, as they are all related in some way.
15.1 Community and social issues
15.1.1 Population mobility and decline
Population mobility and decline is one of the Shire’s most pressing issues. The ABS statistics show that the Shire loses more people than it gains from migration from outside the Shire, even when births and deaths are steady. When this net loss combines with the peak of ageing and age related deaths in the late 2020’s to mid-2030 the loss of population will have significant implications for the economy, local labour force and the liveability of the Shire.
Rural cities such as Wagga and Griffith have been drawing people away from smaller rural centres for a number of decades, and this trend is expected to continue. It is perhaps inevitable that younger, less skilled persons will leave the Shire for the greater opportunities that larger centres offer. A challenge for the Shire is to find sufficient work, tertiary education and lifestyle opportunities to hold youth up to age 30 or so in the Narrandera Township, if not the Shire generally. Perhaps the trick is to get them to at least return with their family, skills and knowledge. This will require a varied local economy, with a balance of professional, skilled and semi-skilled jobs and opportunity, and an attractive lifestyle.
15.1.2 Maintaining rural communities
The rural areas of the Shire contain a third of the overall population, and contribute significantly to the prosperity of the Shire through the broad acre agricultural, irrigation and intensive livestock sector. It is important that rural communities be supported by the Council at every opportunity, particularly with respect to maintaining the population of the two main villages and the social networks of the rural area.
The rural areas of the Shire have a significant population of school age young people who contribute to the Shire community and require suitable social and recreational outlets. The rural sector generally provides a major proportion of the Shire’s income. The villages of Barellan and Grong Grong provide an important rural centre support role and an alternate living environment for Shire residents.

Shire Profile & Key Issues
Newland Planning & Development and Narrandera Shire Council Page 95 of 101
15.1.3 Ageing population
From the year 2021 the number of 60 to 64 year olds exceeds the 2006 figure and from 2021 onwards the number of all persons aged 64 and above exceeds the 2006 figures. In 2036 the age groups of 75 to 79, 80 to 84 and 85 and above peaks at significantly higher figures than in 2006 and 2021.
Between 2001 and 2006 the influence of the baby boomer generation was felt, with a large increase of 30% (by 100 persons) in the 55 to 59 years age group. Given the date of the last Census many persons in this age group would be approaching or at retirement in the next 2-3 years. In the next 15 to 20 years this group of persons will put more pressure on aged care and medical facilities. Generally the population is ageing and the median age is increasing. As the population ages and the number of young people drops by percentage there will likely be less persons of working age to support those of dependent age or needs. It will be important for the broader community to effectively utilise the wisdom of more elderly people in the Shire and to extend their working life (within reason) to contribute to the labour pool. At the same time every effort should be made to encourage young persons to stay in the Shire through apprenticeships, traineeships, enhanced rural industry opportunity and the like.
15.1.4 Household structure and housing provision
As the population of the Shire and town ages over the next 20-25 years there will be an increasing demand for smaller dwellings with lower maintenance requirements. The increasing number of single parent families and lone person households, along with a rise in active retirees looking to downsize will also influence this trend.
The location and cost of some house and land packages for smaller dwellings will be different from traditional new housing estates with larger size blocks and four bedroom houses, or larger Aboriginal housing suited to extended family arrangements. Planning controls will need to change to accommodate opportunities for existing suitable residential areas to accommodate in fill housing. A balance will have to be struck between affordability and the liveability of smaller detached or attached houses within an in fill or green fields housing area. It is likely that there will be a finite market for persons willing to allow their rear yard to be converted to small detached housing. There will also have to be a gradual cultural change amongst local and new residents to acknowledge that not every new house built should be a four bedroom house in a new subdivision. The need to provide for visiting friends and relatives will be an important consideration for aged persons downsizing their housing.
15.1.5 Aboriginal health and employment
In the Narrandera context the Aboriginal population is growing at an annualised rate of around 2.4%. The population falls behind the non-Aboriginal population in areas such as life expectancy, home ownership, individual and household income, skilled occupations, unemployment and tertiary qualifications.

Shire Profile & Key Issues
Newland Planning & Development and Narrandera Shire Council Page 96 of 101
Aboriginal persons generally have a greater focus on family and extended family relationships. Aboriginal families generally have more children, and have a significantly higher proportion of one parent families and larger family sizes for one parent families than the non-Aboriginal population. There are several government and non-government organisations who support the Aboriginal community within the Shire and the township area, and the Council should support these organisations where possible. The Council has recently supported the excellent riparian restoration initiative. The Aboriginal population is very young in its age spread, and a focus should be on the schooling and health of the current youth population to take them forward as the next generation. Schooling retention, particularly to Year 12 will give the Aboriginal population a better chance at full time employment (the Aboriginal unemployment rate is around 20%) and will assist the balancing of the male Aboriginal workforce from lesser skilled jobs to higher skilled jobs. TAFE qualifications for Aboriginal persons have increased significantly since 2001, and this is a positive trend.
15.2 Infrastructure provision and enhancement
15.2.1 Irrigation infrastructure
The Narrandera Township is at the headwaters of the Murrumbidgee Irrigation Limited canal system. It is vital to the town’s tourism and social economy that Lake Talbot remain operational as part of the region’s irrigation infrastructure.
The current draft Murray Darling Basin Plan proposes significant cuts to the water entitlements of the region’s irrigators. Major cuts in ground and surface water entitlements are likely to have flow on effects in the Narrandera Shire and Township, as a proportion of Narrandera’s residents work outside the Shire in industries either reliant or indirectly reliant or irrigation. Future cuts in allocation may also affect rural industries with high water use. The Council should lobby on behalf of its residents for governments making decisions on water cuts to do so only when the likely true social and economic effects of such cuts have been made public and adequately debated.
15.2.2 Narrandera Leeton Airport
The Narrandera Leeton Airport is a strategic asset to the regional area and of great importance to Narrandera through linkage to Sydney and Griffith. At the present time the airport levy bank does not protect the facility against the 1 in 100 year flood event. It is important to ensure that this asset is able to function during the event all but the highest flood events that may be experienced locally.
15.2.3 Potable water supply
The potable water supply is one of Narrandera Township’s most valuable assets and can be a selling point, or potentially a liability. At present the main pump station for the water supply is not protected from the 1 in 100 year flood event. Of the five bores from which the town draws raw water, one bore runs effectively and the other

Shire Profile & Key Issues
Newland Planning & Development and Narrandera Shire Council Page 97 of 101
bore is not quite deep enough to run effectively. When this second bore fails (as it has in the past) the main bore runs at peak capacity and there is no redundancy for failure. The potable water supply is also on a single loop system with limited protection mechanisms against a break or major fault in the system. The hardness of the water, due to a lack of micro filtration, is a well-known local fact.
The potable water supply needs effective protection against flooding, effective redundancy against line breakage or fault, and effective filtration to minimise the hardness and distinct taste of the water. Good water can be an effective selling point for the Town. Narrandera can have the best water in the State, amidst a beautiful river and wetland environment.
15.2.4 Gillenbah sewer scheme
The Gillenbah locality has been acknowledged by the Council and the NSW RTA as an area vital to the future and presence of Narrandera. Redevelopment of the locality, and particularly the key site of the Caltex Service Station, requires the reticulation of sewer throughout the Sturt/Newell Highway strip between the former Rail bridge and the Murrumbidgee River bridge. The RTA has programmed a full reconstruction of the Gillenbah highway area for early 2012.
In order for the sewering of Gillenbah to coincide with the RTA timetable, and to realise necessary design and services coordination efficiencies, the preliminary sewer design, budget and existing property contribution amount should be determined by March 2011.
15.2.5 Maintenance of bitumen road system
Roading forms the lifeline for the Shire by allowing producers to move their stock to customers. The Shire has a number of roads which allow road train access, which is of benefit to the agricultural and transport sector. However in the past year the allowance of road trains onto particular local roads has resulted in significant unbudgeted road damage, for example on the Binya-Erigolia Road.
A challenge for the Council is to balance the likelihood of increasing pressure to allow heavy vehicle access to local roads with the potentially unbudgeted cost of maintaining and rebuilding those roads.
15.3 Local and regional economy
15.3.1 Support the agricultural sector
Whilst many farming businesses in the Shire employ five or less people there are some rural industries, such as PIC Australia at Grong Grong who employ a significant number of persons. The attraction, retention and expansion of these type of businesses would provide a valuable boost to the Shire’s economy and sustainability. The current debate over the draft Murray Darling Basin Plan is likely to result in more focus and research on the social and economic impacts of lowering water allocations for agriculture. The recently submitted draft Input Output Analysis for the region shows that the impact of the drought and lower water allocations from 2005-06 to 2009-10 cost over $30M in production value and over 180 full time jobs in the Narrandera Shire.

Shire Profile & Key Issues
Newland Planning & Development and Narrandera Shire Council Page 98 of 101
If drought returns, with or without the prospect of reductions in irrigation water allocations, the Council should support the agricultural sector and the villages of Barellan and Grong Grong wherever possible.
15.3.2 Support small business
The agricultural sector provides the greatest number of small businesses in the Shire, followed by the retail sector, the property and business sector and construction. However 84% of Shire businesses have less than five employees, and 56% of businesses do not employ any other persons (according to the 2006 Census). The agricultural sector is obviously very important, however the remaining small business sector located in the Narrandera Township, Barellan and Grong Grong is also vitally important to the Shire’s economy. Indirectly, the Council can support small business and the greater community by providing for growth through good forward planning and budgeting, good town amenity and an effective economic development program.
15.3.3 Strengthen the central business area
In the long run the relative strength of the Narrandera central business area will depend on both the population of the town and its ability to limit as much escape expenditure as possible to other larger centres such as Leeton, Griffith and Wagga. There will always be a demand for local day to day shopping, and in this regard it is vital that the town retain the two current supermarket anchors. The Council is encouraged to develop a specific strategy to evaluate ways strengthen the central business area. In such a study, shop vacancies and turnovers, combined with restrictive floor space and older style buildings, warrants attention. There is also a need to consider heritage controls and incentives for the main street, including provision of heritage appropriate, attractive signage.
One of the more direct ways that the Council can support small business in the Township is to ensure an equitable and timely development application process and to support the business area of towns with adequate amenities. These include an efficient traffic and pedestrian system, adequate parking, an attractive street scene and street amenity (shade, trees, weather protection, public art, parkland, walkway linkages and footway texture). This will strengthen the business area and assist in retaining the two supermarket anchors.
15.3.4 Maintain and enhance manufacturing
In 2006 the manufacturing sector was the second highest employer of Narrandera residents (acknowledging that some of those residents travelled out of the Shire to work in that sector). To a large extent the manufacturing sector is subject to external economic influences, however the Council is able to support the sector through an equitable and timely development application service, the provision of suitably zoned and accessible land for development and the provision of incentives to locate in Narrandera where possible.

Shire Profile & Key Issues
Newland Planning & Development and Narrandera Shire Council Page 99 of 101
15.4 Key opportunities for the Shire
Throughout the preparation of this profile a number of residents, businesspersons and commentators have asked the question…”if Narrandera is located on two major highways, a river and close to Griffith and Wagga why isn’t it moving ahead more?” The answer to this question is not as simple as may first appear. Over the last two decades the agricultural sector has changed to become more capital intensive, with a move toward larger properties and some non-family ownership as margins decrease and commodity prices change. The agricultural sector has seen a significant loss of jobs in this period. The drought for the better part of the last decade has also played a large part – see section 7.4 of this report. The public services sector and the financial services sector have also consolidated somewhat to larger regional centres. At the same time there has been a move of young persons and people generally to large regional centres such as Wagga Wagga. The changes in agriculture and small town demographics have affected many rural centres, and Narrandera is not alone. In fact it is Narrandera’s proximity to larger centres and lack of a clear business catchment that has contributed to the loss of population and services. Provided below are some examples of a list under development of opportunities that may be available to strengthen the Narrandera Shire for the future.
15.4.1 Variety in housing
The commencement of the new LEP process allows the Council to consider where there are shortfalls in popular housing and lifestyle properties. For example the Nallabooma and Bells Road estates have been at or near full development for a number of years. The forthcoming housing study will consider these types of housing developments in relation to town proximity, servicing and natural hazards such as flooding and bushfire affectation. The possibility of housing near Lake Talbot has also been raised and this will be investigated. Other new housing opportunities exist in relation to infill developments on under-utilised residential land.
15.4.2 An expanded Gillenbah precinct
The Gillenbah commercial area is a natural way stop for truck drivers and travellers. For Sturt Highway users it is between Hay and Wagga and for Newell Highway users it is between Jerilderie and Temora. The area is used by many truck drivers for rest purposes, meals and amenities use. Trailers are also broken down and returned to as part of regular transport routes. The area is also used by buses and caravans. A survey of the precinct in March 2009 by the Caltex operator showed that 980 trucks stopped within the precinct in a seven day period. Many more would have passed through the locality. Gillenbah has the capacity to provide better driver amenities/services, parking and rest areas. In the longer term future it could provide a breakdown area for road trains or B-triple vehicles, although more land would probably be required for this activity.

Shire Profile & Key Issues
Newland Planning & Development and Narrandera Shire Council Page 100 of 101
Gillenbah can be an effective gateway for Narrandera with an appropriate urban design treatment.
15.4.3 Highway service/business centre
The Gillenbah precinct is important to Narrandera in a place making sense, however most of the drivers may spend money at Gillenbah, and not in town. A preferred highway based development area would provide for businesses which create sustainable local employment opportunity and potential growth on the site, so that employee income is returned to the Township and Shire economy. Potential business may have some of the following characteristics.
The business may not necessarily rely on revenue from a significant number of vehicles passing the site, however highway visibility would be a must;
The business would take advantage of the geographical position of Narrandera and its highway linkages, for example transport/logistics based businesses;
The business could be a regional or National operator;
Food businesses would partially rely on the travelling public and also the town population for sustainability;
It may be necessary to secure an anchor business to begin the precinct and attract other businesses;
The land would need to be accessible and ready for development, to take opportunities as they arise, and
The business would not detract from the vitality of the retail centre. Research should be carried out into an appropriate area for a highway based business precinct to be established.
15.4.4 Tourism growth
The Narrandera Township has significant tourism growth potential (presently being advanced by a Destination Marketing consultant) through the beauty of the natural environment, the koala reserve, Bundidgerry walking track, Lake Talbot, boating, fishing and water skiing. In the coming years as more focus is placed on the scarcity of water in the landscape and agricultural environment, Narrandera can be pitched as a natural oasis, with excellent opportunity for eco-tourism and water based recreation.
15.4.5 Aboriginal cultural heritage
Narrandera is in a strong position in relation to the size of its Aboriginal population and the close linkage that the Aboriginal elders have with this locality. In 2006 the Aboriginal population comprised 12% of the Narrandera town population, and that percentage is likely to be higher in the 2011 Census. Recently excellent work has been done through the Aboriginal Riparian Restoration Crew in restoring degraded river scapes along the Murrumbidgee River. The local Aboriginal people have a strong affinity with the River and the natural environment, in particular their local totem, the lizard. There is considered excellent potential to begin and build up an Aboriginal cultural heritage festival in Narrandera, showcasing the story and culture of the people, traditional hunting and living techniques, traditional dance, language and ceremony. This is something which is done in very few area of the State, but is being done successfully in other parts of Australia.

Shire Profile & Key Issues
Newland Planning & Development and Narrandera Shire Council Page 101 of 101
Carefully timed and organised, the ‘Narrungdera’ festival could compliment the John O’Brien festival and become a big annual event for Narrandera, giving a boost to the town and recognition of Aboriginal culture.
15.4.6 Rural industry
The Narrandera Shire benefits from excellent infrastructure, specifically the two major highways, a trunk gas main with large spare capacity in the township, an airport, and two active rail lines crossing the mid point and north of the Shire. The Shire has a number of rural based industries, including PIC Australia at Grong Grong, and may be able to capitalise on the existing infrastructure within the Shire. Seeking out further rural industry (for example livestock, energy based or secondary industry) is considered to be an area worthy of resourcing, as the employment and local expenditure benefits can be significant for these types of industries.
15.4.7 Lake Talbot
The lake Talbot complex, including the public pool and artificial lake complex, is a magnificent resource for Narrandera, worthy of a visit in its own right. The Lake is surrounded by walking tracks and there is an excellent undeveloped (as yet) look out area within the Crown Reserve which overlooks the complex. It would be to the Shire’s advantage to develop the Lake area and the lookout area.
15.4.8 Greater control over development
With the drafting of a new local environmental plan for the Town and Shire, the opportunity will arise to determine the mix of land use within various parts of the town. The opportunity will be available to restrict certain land uses to industrial areas, and to restrict certain industrial and commercial land uses within residential areas. The opportunity will also be available to improve the existing housing code, to provide for efficient and practical house design, accommodation for the aged and disadvantaged, to conserve heritage areas and to encourage better living places.