narrow band optimization of a compton gamma-ray source
TRANSCRIPT

NARROW BAND OPTIMIZATION OF A COMPTON GAMMA-RAYSOURCE PRODUCED FROM AN X-BAND LINAC∗
F. Albert † , D.J. Gibson ‡ , S.G. Anderson, R.A. Marsh, S.S, Wu, C.P.J. Barty and F.V. Hartemann,Lawrence Livermore National Laboratory, Livermore, CA, 94550, USA
AbstractNuclear photonics is an emerging field of research that
will require high precision gamma-ray (MeV) sources. In
particular, nuclear resonance fluorescence applications [1-
10] necessitate a low (< 1%) relative gamma-ray spectral
width. Within this context, Compton scattering, where
laser photons are scattered off relativistic electron beams to
produce tunable, collimated gamma rays, will produce the
desired gamma-ray output. This paper presents the spectral
narrowband optimization of such a light source currently
being built at LLNL. In this case, PARMELA and ELE-
GANT simulations of the high-gradient X-band linac pro-
vide the properties of the high brightness electron bunch.
The electron beam simulations are then implemented into
our newly developed weakly nonlinear Compton scattering
code to produce theoretical gamma-ray spectra. The influ-
ence that the electron beam, laser beam and interaction ge-
ometry parameters have on the produced gamma-ray spec-
tra will be shown with our simulations.
ELECTRON BEAM SIMULATIONSThe electron linac, shown in Figure 2, will comprise
an X-band photogun followed by six travelling wave X-
band sections. The photoinjector is based on an earlier
high-gradient (200 MV/m) 5.5 cell X-band photogun de-
sign done by SLAC [10]; it has been implemented to sat-
isfy a high-brightness, narrow bandwidth operation [11].
PARMELA simulations have shown that a longer first half-
cell resulted in a lower final emittance for our setup. Hence,
the rf gun features are: a longer first half cell (0.59 instead
of 0.5), improved mode separation, a dual feed racetrack
coupler, optimized coupling, and elliptical cross-section
irises. A nominal electron beam normalized emittance of
0.35 mm.mrad (including thermal emittance) is expected
at 250 MeV for a beam charge of 250 pC at the interaction
point (see Figure 2). Full emittance compensation is imple-
mented, with an optimum distance from the photocathode
to the first accelerating section of 0.8 m. This photoinjec-
tor is then followed by 6 X-band traveling-wave sections
operating at 70 MeV/m. These are the T53VG3 sections,
designed and built at SLAC. They are made of 53 cells and
∗ This work performed under the auspices of the U.S. Department of
Energy by Lawrence Livermore National Laboratory under Contract DE-
AC52-07NA27344 and supported by the Laboratory Directed Research
and Development program under tracking code 12-ERD-057.† [email protected]‡ presenter
operate with a group velocity corresponding to 3% of c,
the speed of light. The chicane shown on Figure 2 is im-
plemented only for noise reduction purposes (a block can
be placed in the chicane to shield the interaction point from
the on-axis Bremsstrahlung arising from the linac).
We also used PARMELA to generate an electron beam
phase space distribution at the interaction point. An ex-
ample is shown in Figure 1. The code uses macroparti-
cles to represent the electron bunch and time steps to push
particles. In our simulations, two-dimensional maps of
the radio-frequency fields of the accelerator cavities were
modeled with the SUPERFISH code and imported into the
particle tracker. The space-charge forces are computed us-
ing a quasistatic approximation by transforming into a co-
moving reference frame and computing and applying the
Coulomb field on a mesh. For these simulations, 10,000
macroparticles were used. This number was chosen to pro-
vide the required resolution for the Compton scattering cal-
culation and to ensure accurate modeling of the electron
beam propagation through the accelerator, while maintain-
ing reasonable computation times.
�0.10 �0.05 0.00 0.05 0.10 0.15316
317
318
319
320
Phase
Γ
�0.03�0.02�0.01 0.00 0.01 0.02 0.03
�0.03
�0.02
�0.01
0.00
0.01
0.02
0.03
x �mm�
y�mm
�
�0.04 �0.02 0.00 0.02 0.04�0.4
�0.2
0.0
0.2
0.4
x �mm�
u x�mrad�
Figure 1: Electron beam parameters simulated with
PARMELA.
GAMMA-RAY SIMULATIONSTo predict the gamma-ray source performance from the
expected electron beam properties provided by the x-band
linac, we have recently developed a full 3D Compton scat-
tering code [12], which calculates gamma-ray spectra on
axis for the particular case of a 180 degrees collision be-
tween the laser and electron beams. It is valid as long as
the product a20Δφ << 1, where a0 is the normalized vector
potential of the laser and Δφ its normalized pulse duration.
This code, discussed in details in a recent publication [12],
uses the covariant radiation formula which calculates the
number of photons radiated per unit frequency dq and solid
angle dΩ:
MOPPP011 Proceedings of IPAC2012, New Orleans, Louisiana, USA
ISBN 978-3-95450-115-1
592Cop
yrig
htc ○
2012
byIE
EE
–cc
Cre
ativ
eC
omm
onsA
ttri
butio
n3.
0(C
CB
Y3.
0)—
ccC
reat
ive
Com
mon
sAtt
ribu
tion
3.0
(CC
BY
3.0)
02 Synchrotron Light Sources and FELs
A16 Advanced Concepts

Figure 2: 250 MeV electron linac.
d2NdqdΩ
=α
4π2q
∣∣∣∣∣∣∫ +∞−∞πμuμe−iqνxνdτ
∣∣∣∣∣∣2
. (1)
Here, α = 1/137 is the fine structure constant, q is the
scattered photon frequency, πμ is the 4-polarization of the
incident laser beam, uμ is the 4-velocity of the incident
electron beam and xμ its 4-trajectory, obtained by integrat-
ing the 4-velocity. In order to evaluate this expression, one
needs to know the electron trajectories (velocity and posi-
tion) at all times as they interact with the laser electrical
field. The electron trajectories can be obtained with two
different methods: either numerically by solving the dif-
ferential equation of motion with a 4th order Runge-Kutta
algorithm or analytically by using paraxial, ballistic and
slowly varying envelope approximations. Both methods
have shown excellent agreement for weakly nonlinear ps
laser pulses interacting with 100-300 MeV electron beams.
For each particle provided by the PARMELA simulations,
the photon spectra are added incoherently to yield the on-
axis spectrum, using the parameters of Table 1.
Table 1: Laser and Electron Beam Parameters
Parameter Laser Electron Beam
Wavelength/Energy 1064 mm 163 MeV
Energy/Charge 0.15 J 250 pC
Focal Spot 10 μm (FWHM) 7.2 μm (rms)
Norm. emittance N.A. 0.35 mm.mrad
NARROW BAND OPTIMIZATION
Because of the typically large relativistic factor γ ∼ 500
of the electron beam, an electron beam with even a small
angular spread Δε (large emittance or tight electron beam
focus) will considerably broaden the gamma-ray spectrum.
Figure 3 compares two gamma-ray spectra obtained from
an electron beam with a normalized emittance of εn = 0.35
mm.mrad and εn = 1.6 mm.mrad, respectively. All other
laser and electron beam parameters are identical to those
given in Table 1. The bandwidth dramatically increases
from ∼ 0.7% to ∼ 5%. The other important electron beam
parameter resulting in gamma-ray spectral broadening is
the electron beam energy spread. Figure 4 also shows two
gamma-ray spectra obtained from an electron beam with an
energy spread Δγ/γ = 0.16% and Δγ/γ = 0.25%, respec-
tively. We do not expect the electron beam energy spread
to be significantly higher for the X-band linac currently un-
der construction. As it can be seen in Figure 4, the energy
spread will be less detrimental to the gamma-ray bandwidth
in our case.
Figure 3: Comparison of gamma-ray spectra obtained for
electron beams with two different normalized emittances,
0.35 mm.mrad (blue) and 1.6 mm.mrad (red). Other pa-
rameters identical to Table 1.
The final adjustment to the gamma-ray spectral band-
width can be made with the focusing geometry of the laser
and electron beams. For a given normalized emittance, a
tighter electron beam focus means a larger electron beam
angular spread and thus a wider gamma-ray bandwidth.
Similarly, for a given laser energy, a tighter laser focus re-
sults in increased nonlinear effects and thus also a wider
gamma-ray bandwidth. The resulting spectra from three
different focusing geometries are shown in Figure 5, all
other parameters being identical. For each case the laser
focus is matched to the electron beam focus to maximize
the total x-ray flux. The corresponding electron beam fo-
cal spots (rms) and laser focal spots (FWHM) are 7.2 μm,
14.5 μm, 28.9 μm and 10 μm, 15 μm, 18.6 μm respec-
tively. The corresponding laser normalized potentials are
0.06, 0.04 and 0.03. For the tighter focii, the increase
in gamma-ray bandwith is due to both nonlinear effects
[13] and electron angular spread. Although the total x-ray
Proceedings of IPAC2012, New Orleans, Louisiana, USA MOPPP011
02 Synchrotron Light Sources and FELs
A16 Advanced Concepts
ISBN 978-3-95450-115-1
593 Cop
yrig
htc ○
2012
byIE
EE
–cc
Cre
ativ
eC
omm
onsA
ttri
butio
n3.
0(C
CB
Y3.
0)—
ccC
reat
ive
Com
mon
sAtt
ribu
tion
3.0
(CC
BY
3.0)
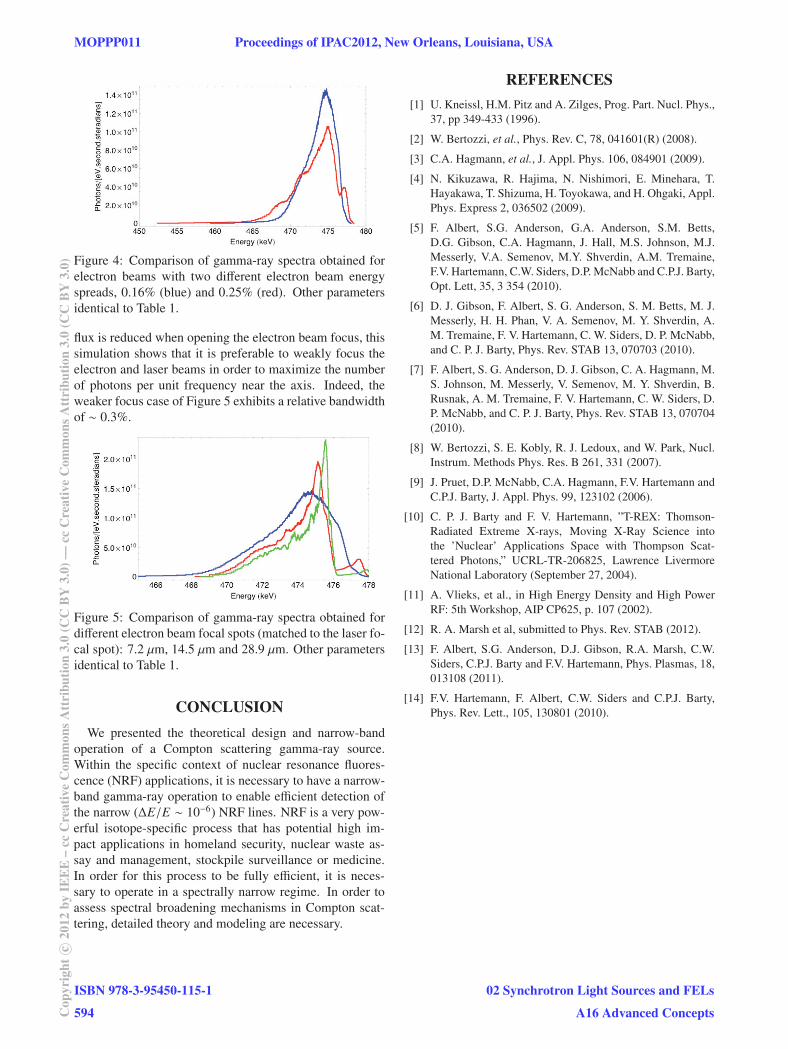
Figure 4: Comparison of gamma-ray spectra obtained for
electron beams with two different electron beam energy
spreads, 0.16% (blue) and 0.25% (red). Other parameters
identical to Table 1.
flux is reduced when opening the electron beam focus, this
simulation shows that it is preferable to weakly focus the
electron and laser beams in order to maximize the number
of photons per unit frequency near the axis. Indeed, the
weaker focus case of Figure 5 exhibits a relative bandwidth
of ∼ 0.3%.
Figure 5: Comparison of gamma-ray spectra obtained for
different electron beam focal spots (matched to the laser fo-
cal spot): 7.2 μm, 14.5 μm and 28.9 μm. Other parameters
identical to Table 1.
CONCLUSIONWe presented the theoretical design and narrow-band
operation of a Compton scattering gamma-ray source.
Within the specific context of nuclear resonance fluores-
cence (NRF) applications, it is necessary to have a narrow-
band gamma-ray operation to enable efficient detection of
the narrow (ΔE/E ∼ 10−6) NRF lines. NRF is a very pow-
erful isotope-specific process that has potential high im-
pact applications in homeland security, nuclear waste as-
say and management, stockpile surveillance or medicine.
In order for this process to be fully efficient, it is neces-
sary to operate in a spectrally narrow regime. In order to
assess spectral broadening mechanisms in Compton scat-
tering, detailed theory and modeling are necessary.
REFERENCES[1] U. Kneissl, H.M. Pitz and A. Zilges, Prog. Part. Nucl. Phys.,
37, pp 349-433 (1996).
[2] W. Bertozzi, et al., Phys. Rev. C, 78, 041601(R) (2008).
[3] C.A. Hagmann, et al., J. Appl. Phys. 106, 084901 (2009).
[4] N. Kikuzawa, R. Hajima, N. Nishimori, E. Minehara, T.
Hayakawa, T. Shizuma, H. Toyokawa, and H. Ohgaki, Appl.
Phys. Express 2, 036502 (2009).
[5] F. Albert, S.G. Anderson, G.A. Anderson, S.M. Betts,
D.G. Gibson, C.A. Hagmann, J. Hall, M.S. Johnson, M.J.
Messerly, V.A. Semenov, M.Y. Shverdin, A.M. Tremaine,
F.V. Hartemann, C.W. Siders, D.P. McNabb and C.P.J. Barty,
Opt. Lett, 35, 3 354 (2010).
[6] D. J. Gibson, F. Albert, S. G. Anderson, S. M. Betts, M. J.
Messerly, H. H. Phan, V. A. Semenov, M. Y. Shverdin, A.
M. Tremaine, F. V. Hartemann, C. W. Siders, D. P. McNabb,
and C. P. J. Barty, Phys. Rev. STAB 13, 070703 (2010).
[7] F. Albert, S. G. Anderson, D. J. Gibson, C. A. Hagmann, M.
S. Johnson, M. Messerly, V. Semenov, M. Y. Shverdin, B.
Rusnak, A. M. Tremaine, F. V. Hartemann, C. W. Siders, D.
P. McNabb, and C. P. J. Barty, Phys. Rev. STAB 13, 070704
(2010).
[8] W. Bertozzi, S. E. Kobly, R. J. Ledoux, and W. Park, Nucl.
Instrum. Methods Phys. Res. B 261, 331 (2007).
[9] J. Pruet, D.P. McNabb, C.A. Hagmann, F.V. Hartemann and
C.P.J. Barty, J. Appl. Phys. 99, 123102 (2006).
[10] C. P. J. Barty and F. V. Hartemann, ”T-REX: Thomson-
Radiated Extreme X-rays, Moving X-Ray Science into
the ’Nuclear’ Applications Space with Thompson Scat-
tered Photons,” UCRL-TR-206825, Lawrence Livermore
National Laboratory (September 27, 2004).
[11] A. Vlieks, et al., in High Energy Density and High Power
RF: 5th Workshop, AIP CP625, p. 107 (2002).
[12] R. A. Marsh et al, submitted to Phys. Rev. STAB (2012).
[13] F. Albert, S.G. Anderson, D.J. Gibson, R.A. Marsh, C.W.
Siders, C.P.J. Barty and F.V. Hartemann, Phys. Plasmas, 18,
013108 (2011).
[14] F.V. Hartemann, F. Albert, C.W. Siders and C.P.J. Barty,
Phys. Rev. Lett., 105, 130801 (2010).
MOPPP011 Proceedings of IPAC2012, New Orleans, Louisiana, USA
ISBN 978-3-95450-115-1
594Cop
yrig
htc ○
2012
byIE
EE
–cc
Cre
ativ
eC
omm
onsA
ttri
butio
n3.
0(C
CB
Y3.
0)—
ccC
reat
ive
Com
mon
sAtt
ribu
tion
3.0
(CC
BY
3.0)
02 Synchrotron Light Sources and FELs
A16 Advanced Concepts