narrowing socioeconomic inequality in child stunting: the ... · brazilian experience, 1974–2007...
TRANSCRIPT

Bull World Health Organ 2010;88:305–311 | doi:10.2471/BLT.09.069195 305
Introduction
Optimal child growth requires adequate energy and nutrient intake, absence of disease and appropriate care. Poor living conditions, including household food insecurity, low parental education, lack of access to quality health care and an unhealthy living environment are among the main determinants of stunted growth. Poverty has a more detrimental effect on linear growth than on body weight.1 Child stunting is associated with higher morbidity and mortality, shorter height in adulthood, lower educational achievement, and reduced productivity in adult-hood. Child growth patterns are therefore strong predictors of future human capital and social progress and of the health of future generations.1–4
Estimates indicate that in 2005, one-third of all children less than 5 years of age (or approximately 178 million children) in low- and middle-income countries were stunted.5 Projections of current trends to 2015 point to declines in the prevalence of both stunting6 and underweight5 among children, although such declines will still fall short of the 50% reduction in undernutri-tion established as an indicator for fulfilling the first Millennium Development Goal (MDG-1),7 to eradicate hunger. Of 70 low- or middle-income countries that conducted two or more surveys between 1971 and 1999, 42 showed a decline in child stunting, 17 showed no major change over the period, and 11 (9 of them in Africa) showed an increase.8 In Brazil, three national health and nutrition surveys conducted between 1974–75 and 1996 have pointed to declining trends in child stunting prevalence.9,10
An analysis of data from 47 low- and middle-income countries showed pronounced within-country socioeconomic inequalities in child stunting, particularly in Latin America and the Caribbean.11 Brazil ranked fifth among these 47 countries in terms of such inequality.11 We are unaware of studies from low- or middle-income countries on how social inequalities in child stunting are evolving over time.
We have taken advantage of a Demographic and Health Survey carried out in Brazil in 2006–07 to assess trends in child stunting and in related socioeconomic disparities over the past three decades. The Brazilian government has prioritized the elimination of hunger and poverty12 since 2003, and recent reports13 suggest that redistributive policies have successfully redressed one of the most skewed income distributions in the world.14 Because child stunting is a sensitive indicator of living conditions, we believe that the effectiveness of redistributive poli-cies can be accurately assessed by studying the social distribution of child stunting over time.
Methods
Data sources
Four national household surveys were carried out in Brazil over a period of 33 years: Estudo Nacional de Despesa Familiar [National Study on Family Expenditures] in 1974–75; Pesquisa Nacional de Saúde e Nutrição [National Health and Nutrition Survey] in 1989; and two Demographic and Health Surveys, in 1996 and 2006–07, respectively. Nationwide probability house-
Une traduction en français de ce résumé figure à la fin de l’article. Al final del artículo se facilita una traducción al español. الرتجمة العربية لهذه الخالصة يف نهاية النص الكامل لهذه املقالة.
Objective To assess trends in the prevalence and social distribution of child stunting in Brazil to evaluate the effect of income and basic service redistribution policies implemented in that country in the recent past.Methods The prevalence of stunting (height-for-age z score below −2 using the Child Growth Standards of the World Health Organization) among children aged less than 5 years was estimated from data collected during national household surveys carried out in Brazil in 1974–75 (n = 34 409), 1989 (n = 7374), 1996 (n = 4149) and 2006–07 (n = 4414). Absolute and relative socioeconomic inequality in stunting was measured by means of the slope index and the concentration index of inequality, respectively.Findings Over a 33-year period, we documented a steady decline in the national prevalence of stunting from 37.1% to 7.1%. Prevalence dropped from 59.0% to 11.2% in the poorest quintile and from 12.1% to 3.3% among the wealthiest quintile. The decline was particularly steep in the last 10 years of the period (1996 to 2007), when the gaps between poor and wealthy families with children under 5 were also reduced in terms of purchasing power; access to education, health care and water and sanitation services; and reproductive health indicators.Conclusion In Brazil, socioeconomic development coupled with equity-oriented public policies have been accompanied by marked improvements in living conditions and a substantial decline in child undernutrition, as well as a reduction of the gap in nutritional status between children in the highest and lowest socioeconomic quintiles. Future studies will show whether these gains will be maintained under the current global economic crisis.
Narrowing socioeconomic inequality in child stunting: the Brazilian experience, 1974–2007Carlos Augusto Monteiro,a Maria Helena D’Aquino Benicio,a Wolney Lisboa Conde,a Silvia Konno,a Ana Lucia Lovadino,a Aluisio JD Barrosb & Cesar Gomes Victorab
a School of Public Health, University of São Paulo, Av. Dr Arnaldo 715, São Paulo, 01246-904, SP, Brazil.b Post-Graduate Program in Epidemiology, Federal University of Pelotas, Pelotas, Brazil.Correspondence to Carlos Augusto Monteiro (e-mail: [email protected]).(Submitted: 30 June 2009 – Revised version received: 29 September 2009 – Accepted: 2 October 2009 – Published online: 8 December 2009 )
Bull World Health Organ 2010;88:305–311 | doi:10.2471/BLT.09.069195306
Carlos Augusto Monteiro et al.Socioeconomic inequality in child stunting in BrazilResearch
hold samples were obtained in each survey using similar census-based, multistage, stratified, cluster sampling procedures. The sampling schemes, variables, and data collection procedures are described elsewhere.15–17
In the four surveys, the height of all children aged 0–59 months living in the sampled households was measured. Children living in the sparsely populated rural areas of the Northern region, who comprise 3% of the country’s child popu-lation, were only included in the most recent survey. Analyses were repeated after removing these children from the 2006–07 sample, but the results were virtually identical to those presented be-low, which apply to the entire sample of children studied in each survey.
In the four surveys, trained person-nel measured the recumbent length of children aged up to 23 months and the standing height of older children. Birth dates were obtained from birth certificates or other official documents. The ques-tionnaires used in 1974–75, 1989 and 2006–07 – but not in 1996 – assessed family income directly by asking about all sources of household income over the prior month. The questionnaires used in 1996 and 2006–07 also assessed household characteristics, including the number and type of assets owned, paren-tal schooling, water supply and sanitation services, maternal antenatal health care, and several reproductive health indica-tors, such as interval between births and maternal use of modern contraceptives.
Statistical analysisWe used the Child Growth Standards of the World Health Organization (WHO)18 to calculate length-for-age and height-for-age z scores (referred to hence-forth as simply “height-for-age z scores”). We classified a child as stunted if his/her height-for-age z score was below −2.3 We calculated the prevalence of stunting and its 95% confidence interval (CI).
To assess trends in socioeconomic inequality we divided children into quin-tiles on the basis of household per capita income. In the 1996 survey, income was not measured directly, but on the basis of household assets and according to a predictive equation based on a 2005 eco-nomic survey which collected both assets and income.19 We created socioeconomic quintiles using both criteria from data for the 2006–07 sample, for which both in-come and household assets were available.
We used the slope index of inequal-ity (SII) to quantify absolute socioeco-nomic disparities in child stunting. The SII, which is based on a weighted linear regression of the observed prevalence of stunting in the quintiles, expresses the absolute difference in outcome between the lowest and the highest quintiles.20 We defined the quintiles using sample weights and employed the absolute number of children in the quintiles as the frequency weights for the regression model. In the model, the dependent variable was the prevalence of stunting in each quintile.
We used two versions of the concen-tration index to measure inequality in child stunting: the original index21 and a modified index suggested by Erreygers.22 The concentration index measures rela-tive inequality and its main advantage over using the ratio of the fifth to the first quintile is that it is based on data on all groups. The concentration index is similar to the Gini coefficient – it ranges from −1 to +1 and a value of 0 indicates complete equality in the distribution of the outcome. Negative values indicate that the outcome is concentrated among the poor, and positive values indicate that it is concentrated among the rich. We calculated the corresponding indices and their CIs using the convenient regres-sion approach recommended for cases in which microdata are available.21 We used both the SII and the concentration indices to describe trends.
To explore the underlying factors associated with recent changes in socio-economic inequalities in child stunting, we examined quintile-specific changes from 1996 to 2006–07 in household assets, maternal education, and mater-nal antenatal health care, water supply and sanitation services, and reproduc-tive health indicators. We tested these changes for statistical significance by fitting an interaction term between the year of the survey and the socioeconomic quintiles. These analyses were not under-taken for the 1974–75 and 1989 surveys due to the absence of a comparable set of variables. All analyses were carried out using the svy prefix commands of Stata version10 (Stata Corporation, College Station, TX, USA), which take into ac-count the complex sample design used by each survey.
Ethics approval was not required for this study. The authors had full access to all the data in the study.
ResultsThe number of sampled households was 55 000 in 1974–75, 14 455 in 1989, 13 283 in 1996, and 13 056 in 2006–07. The corresponding number of children aged less than 5 years was 37 181, 7525, 4818 and 4820, respectively. Non-response rates for height were 6.2% in 1974–75, 1.8% in 1989, 13.2% in 1996, and 8.0% in 2006–07. Children with implausible height values (height-for-age z score below −6 or above +6) represented 1.3% of the sample in 1974–75 and less than 1% in the three other surveys. The final samples with valid values for height included 34 409 children in 1974–75, 7374 in 1989, 4149 in 1996 and 4414 in 2006–07.
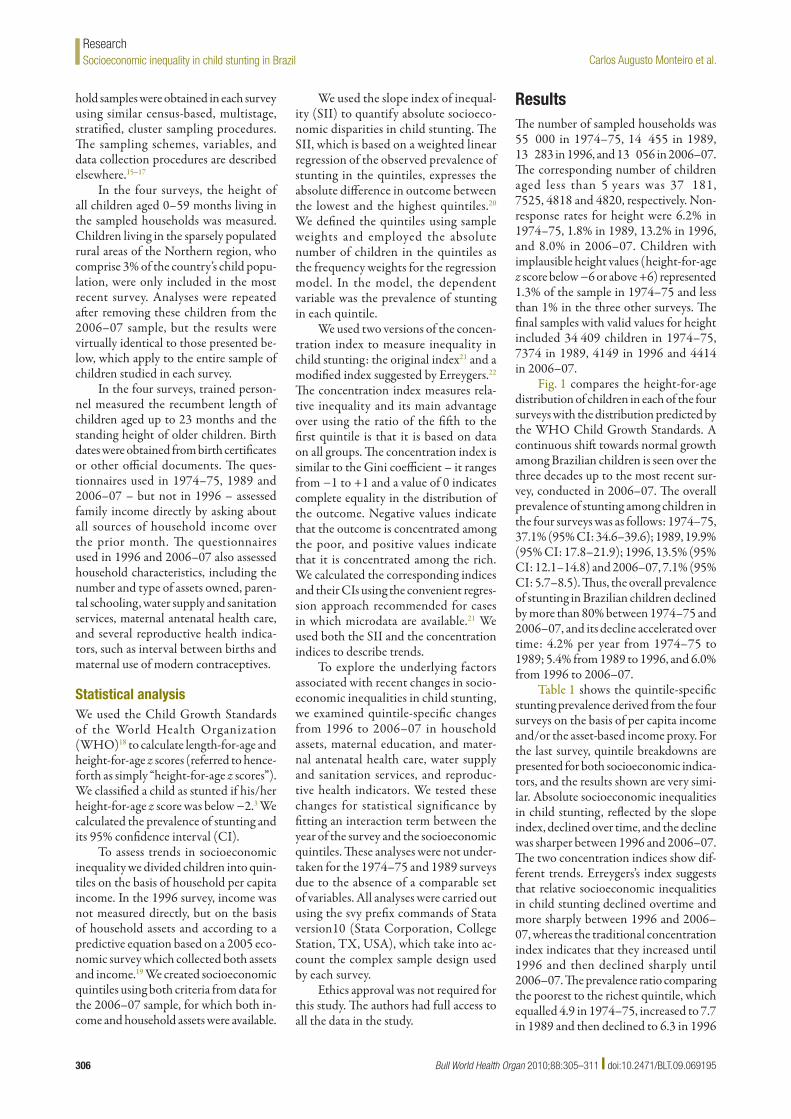
Fig. 1 compares the height-for-age distribution of children in each of the four surveys with the distribution predicted by the WHO Child Growth Standards. A continuous shift towards normal growth among Brazilian children is seen over the three decades up to the most recent sur-vey, conducted in 2006–07. The overall prevalence of stunting among children in the four surveys was as follows: 1974–75, 37.1% (95% CI: 34.6–39.6); 1989, 19.9% (95% CI: 17.8–21.9); 1996, 13.5% (95% CI: 12.1–14.8) and 2006–07, 7.1% (95% CI: 5.7–8.5). Thus, the overall prevalence of stunting in Brazilian children declined by more than 80% between 1974–75 and 2006–07, and its decline accelerated over time: 4.2% per year from 1974–75 to 1989; 5.4% from 1989 to 1996, and 6.0% from 1996 to 2006–07.
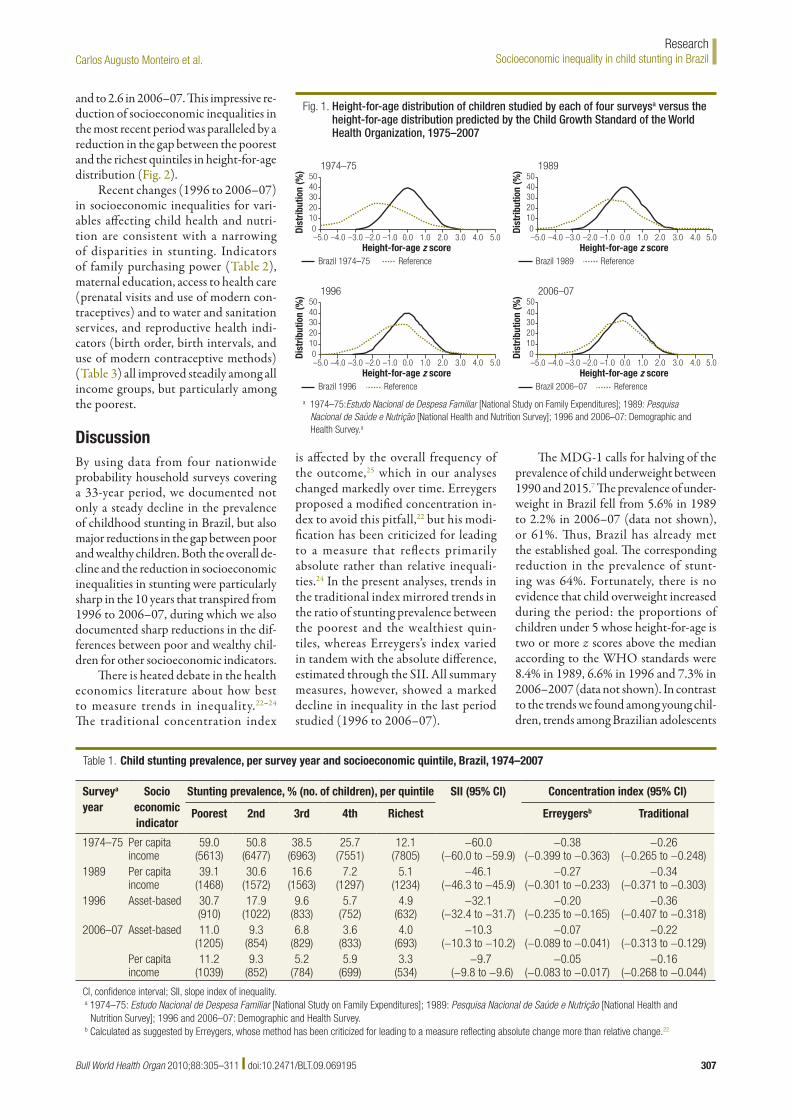
Table 1 shows the quintile-specific stunting prevalence derived from the four surveys on the basis of per capita income and/or the asset-based income proxy. For the last survey, quintile breakdowns are presented for both socioeconomic indica-tors, and the results shown are very simi-lar. Absolute socioeconomic inequalities in child stunting, reflected by the slope index, declined over time, and the decline was sharper between 1996 and 2006–07. The two concentration indices show dif-ferent trends. Erreygers’s index suggests that relative socioeconomic inequalities in child stunting declined overtime and more sharply between 1996 and 2006–07, whereas the traditional concentration index indicates that they increased until 1996 and then declined sharply until 2006–07. The prevalence ratio comparing the poorest to the richest quintile, which equalled 4.9 in 1974–75, increased to 7.7 in 1989 and then declined to 6.3 in 1996
Bull World Health Organ 2010;88:305–311 | doi:10.2471/BLT.09.069195 307
Carlos Augusto Monteiro et al. Socioeconomic inequality in child stunting in BrazilResearch
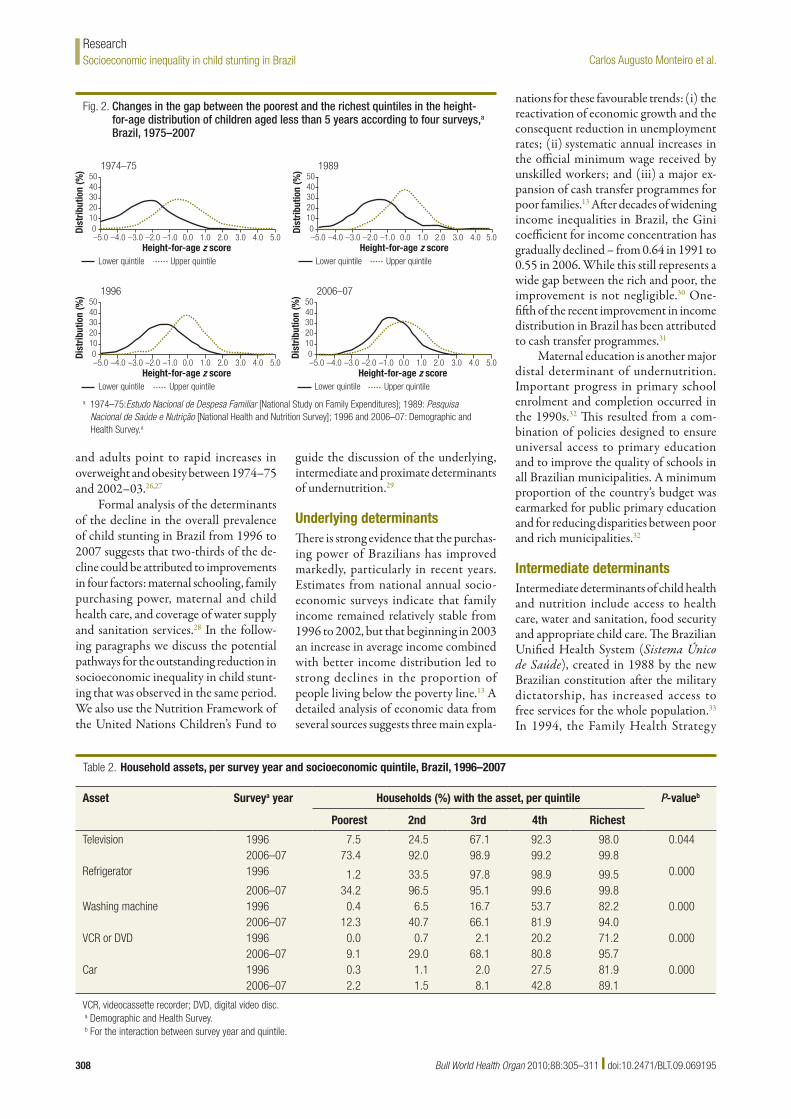
and to 2.6 in 2006–07. This impressive re-duction of socioeconomic inequalities in the most recent period was paralleled by a reduction in the gap between the poorest and the richest quintiles in height-for-age distribution (Fig. 2).
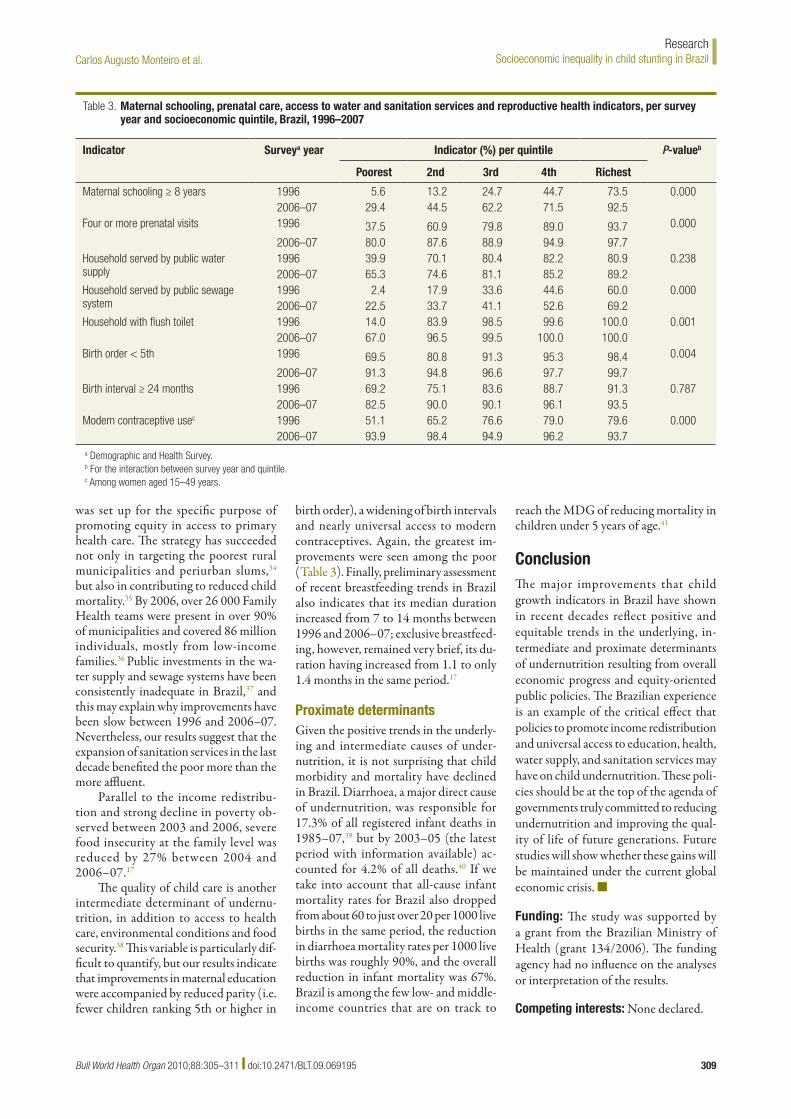
Recent changes (1996 to 2006–07) in socioeconomic inequalities for vari-ables affecting child health and nutri-tion are consistent with a narrowing of disparities in stunting. Indicators of family purchasing power (Table 2), maternal education, access to health care (prenatal visits and use of modern con-traceptives) and to water and sanitation services, and reproductive health indi-cators (birth order, birth intervals, and use of modern contraceptive methods) (Table 3) all improved steadily among all income groups, but particularly among the poorest.
DiscussionBy using data from four nationwide probability household surveys covering a 33-year period, we documented not only a steady decline in the prevalence of childhood stunting in Brazil, but also major reductions in the gap between poor and wealthy children. Both the overall de-cline and the reduction in socioeconomic inequalities in stunting were particularly sharp in the 10 years that transpired from 1996 to 2006–07, during which we also documented sharp reductions in the dif-ferences between poor and wealthy chil-dren for other socioeconomic indicators.
There is heated debate in the health economics literature about how best to measure trends in inequality.22–24 The traditional concentration index
is affected by the overall frequency of the outcome,25 which in our analyses changed markedly over time. Erreygers proposed a modified concentration in-dex to avoid this pitfall,22 but his modi-fication has been criticized for leading to a measure that reflects primarily absolute rather than relative inequali-ties.24 In the present analyses, trends in the traditional index mirrored trends in the ratio of stunting prevalence between the poorest and the wealthiest quin-tiles, whereas Erreygers’s index varied in tandem with the absolute difference, estimated through the SII. All summary measures, however, showed a marked decline in inequality in the last period studied (1996 to 2006–07).
The MDG-1 calls for halving of the prevalence of child underweight between 1990 and 2015.7 The prevalence of under-weight in Brazil fell from 5.6% in 1989 to 2.2% in 2006–07 (data not shown), or 61%. Thus, Brazil has already met the established goal. The corresponding reduction in the prevalence of stunt-ing was 64%. Fortunately, there is no evidence that child overweight increased during the period: the proportions of children under 5 whose height-for-age is two or more z scores above the median according to the WHO standards were 8.4% in 1989, 6.6% in 1996 and 7.3% in 2006–2007 (data not shown). In contrast to the trends we found among young chil-dren, trends among Brazilian adolescents
Fig. 1. Height-for-age distribution of children studied by each of four surveysa versus the height-for-age distribution predicted by the Child Growth Standard of the World Health Organization, 1975–2007
0Dist
ribut
ion
(%)
50
Brazil 1974–75 Reference
40302010
–5.0 –4.0 –3.0 –2.0 –1.0 0.0 1.0 2.0 3.0 4.0 5.0Height-for-age z score
1974–75
0Dist
ribut
ion
(%)
50
Brazil 1989 Reference
40302010
–5.0 –4.0 –3.0 –2.0 –1.0 0.0 1.0 2.0 3.0 4.0 5.0Height-for-age z score
1989
0Dist
ribut
ion
(%)
50
Brazil 1996 Reference
40302010
–5.0 –4.0 –3.0 –2.0 –1.0 0.0 1.0 2.0 3.0 4.0 5.0Height-for-age z score
1996
0Dist
ribut
ion
(%)
50
Brazil 2006–07 Reference
40302010
–5.0 –4.0 –3.0 –2.0 –1.0 0.0 1.0 2.0 3.0 4.0 5.0Height-for-age z score
2006–07
a 1974–75:Estudo Nacional de Despesa Familiar [National Study on Family Expenditures]; 1989: Pesquisa Nacional de Saúde e Nutrição [National Health and Nutrition Survey]; 1996 and 2006–07: Demographic and Health Survey.a
Table 1. Child stunting prevalence, per survey year and socioeconomic quintile, Brazil, 1974–2007
Surveya year
Socio economic indicator
Stunting prevalence, % (no. of children), per quintile SII (95% CI) Concentration index (95% CI)
Poorest 2nd 3rd 4th Richest Erreygersb Traditional
1974–75 Per capita income
59.0 (5613)
50.8 (6477)
38.5 (6963)
25.7 (7551)
12.1 (7805)
−60.0 (−60.0 to −59.9)
−0.38 (−0.399 to −0.363)
−0.26 (−0.265 to −0.248)
1989 Per capita income
39.1 (1468)
30.6 (1572)
16.6 (1563)
7.2 (1297)
5.1 (1234)
−46.1 (−46.3 to −45.9)
−0.27 (−0.301 to −0.233)
−0.34 (−0.371 to −0.303)
1996 Asset-based 30.7 (910)
17.9 (1022)
9.6 (833)
5.7 (752)
4.9 (632)
−32.1 (−32.4 to −31.7)
−0.20 (−0.235 to −0.165)
−0.36 (−0.407 to −0.318)
2006–07 Asset-based 11.0 (1205)
9.3 (854)
6.8 (829)
3.6 (833)
4.0 (693)
−10.3 (−10.3 to −10.2)
−0.07 (−0.089 to −0.041)
−0.22 (−0.313 to −0.129)
Per capita income
11.2 (1039)
9.3 (852)
5.2 (784)
5.9 (699)
3.3 (534)
−9.7 (−9.8 to −9.6)
−0.05 (−0.083 to −0.017)
−0.16 (−0.268 to −0.044)
CI, confidence interval; SII, slope index of inequality.a 1974–75: Estudo Nacional de Despesa Familiar [National Study on Family Expenditures]; 1989: Pesquisa Nacional de Saúde e Nutrição [National Health and
Nutrition Survey]; 1996 and 2006–07: Demographic and Health Survey.b Calculated as suggested by Erreygers, whose method has been criticized for leading to a measure reflecting absolute change more than relative change.22
Bull World Health Organ 2010;88:305–311 | doi:10.2471/BLT.09.069195308
Carlos Augusto Monteiro et al.Socioeconomic inequality in child stunting in BrazilResearch
and adults point to rapid increases in overweight and obesity between 1974–75 and 2002–03.26,27
Formal analysis of the determinants of the decline in the overall prevalence of child stunting in Brazil from 1996 to 2007 suggests that two-thirds of the de-cline could be attributed to improvements in four factors: maternal schooling, family purchasing power, maternal and child health care, and coverage of water supply and sanitation services.28 In the follow-ing paragraphs we discuss the potential pathways for the outstanding reduction in socioeconomic inequality in child stunt-ing that was observed in the same period. We also use the Nutrition Framework of the United Nations Children’s Fund to
guide the discussion of the underlying, intermediate and proximate determinants of undernutrition.29
Underlying determinantsThere is strong evidence that the purchas-ing power of Brazilians has improved markedly, particularly in recent years. Estimates from national annual socio-economic surveys indicate that family income remained relatively stable from 1996 to 2002, but that beginning in 2003 an increase in average income combined with better income distribution led to strong declines in the proportion of people living below the poverty line.13 A detailed analysis of economic data from several sources suggests three main expla-
nations for these favourable trends: (i) the reactivation of economic growth and the consequent reduction in unemployment rates; (ii) systematic annual increases in the official minimum wage received by unskilled workers; and (iii) a major ex-pansion of cash transfer programmes for poor families.13 After decades of widening income inequalities in Brazil, the Gini coefficient for income concentration has gradually declined – from 0.64 in 1991 to 0.55 in 2006. While this still represents a wide gap between the rich and poor, the improvement is not negligible.30 One-fifth of the recent improvement in income distribution in Brazil has been attributed to cash transfer programmes.31
Maternal education is another major distal determinant of undernutrition. Important progress in primary school enrolment and completion occurred in the 1990s.32 This resulted from a com-bination of policies designed to ensure universal access to primary education and to improve the quality of schools in all Brazilian municipalities. A minimum proportion of the country’s budget was earmarked for public primary education and for reducing disparities between poor and rich municipalities.32
Intermediate determinantsIntermediate determinants of child health and nutrition include access to health care, water and sanitation, food security and appropriate child care. The Brazilian Unified Health System (Sistema Único de Saúde), created in 1988 by the new Brazilian constitution after the military dictatorship, has increased access to free services for the whole population.33 In 1994, the Family Health Strategy
Fig. 2. Changes in the gap between the poorest and the richest quintiles in the height-for-age distribution of children aged less than 5 years according to four surveys,a Brazil, 1975–2007
0Dist
ribut
ion
(%)
50
Lower quintile Upper quintile
40302010
–5.0 –4.0 –3.0 –2.0 –1.0 0.0 1.0 2.0 3.0 4.0 5.0Height-for-age z score
1974–75
0Dist
ribut
ion
(%)
50
Lower quintile Upper quintile
40302010
–5.0 –4.0 –3.0 –2.0 –1.0 0.0 1.0 2.0 3.0 4.0 5.0Height-for-age z score
1989
0Dist
ribut
ion
(%)
50
Lower quintile Upper quintile
40302010
–5.0 –4.0 –3.0 –2.0 –1.0 0.0 1.0 2.0 3.0 4.0 5.0Height-for-age z score
1996
0Dist
ribut
ion
(%)
50
Lower quintile Upper quintile
40302010
–5.0 –4.0 –3.0 –2.0 –1.0 0.0 1.0 2.0 3.0 4.0 5.0Height-for-age z score
2006–07
a 1974–75:Estudo Nacional de Despesa Familiar [National Study on Family Expenditures]; 1989: Pesquisa Nacional de Saúde e Nutrição [National Health and Nutrition Survey]; 1996 and 2006–07: Demographic and Health Survey.a
Table 2. Household assets, per survey year and socioeconomic quintile, Brazil, 1996–2007
Asset Surveya year Households (%) with the asset, per quintile P-valueb
Poorest 2nd 3rd 4th Richest
Television 1996 7.5 24.5 67.1 92.3 98.0 0.0442006–07 73.4 92.0 98.9 99.2 99.8
Refrigerator 1996 1.2 33.5 97.8 98.9 99.5 0.000
2006–07 34.2 96.5 95.1 99.6 99.8Washing machine 1996 0.4 6.5 16.7 53.7 82.2 0.000
2006–07 12.3 40.7 66.1 81.9 94.0VCR or DVD 1996 0.0 0.7 2.1 20.2 71.2 0.000
2006–07 9.1 29.0 68.1 80.8 95.7Car 1996 0.3 1.1 2.0 27.5 81.9 0.000
2006–07 2.2 1.5 8.1 42.8 89.1
VCR, videocassette recorder; DVD, digital video disc.a Demographic and Health Survey.b For the interaction between survey year and quintile.
Bull World Health Organ 2010;88:305–311 | doi:10.2471/BLT.09.069195 309
Carlos Augusto Monteiro et al. Socioeconomic inequality in child stunting in BrazilResearch
was set up for the specific purpose of promoting equity in access to primary health care. The strategy has succeeded not only in targeting the poorest rural municipalities and periurban slums,34 but also in contributing to reduced child mortality.35 By 2006, over 26 000 Family Health teams were present in over 90% of municipalities and covered 86 million individuals, mostly from low-income families.36 Public investments in the wa-ter supply and sewage systems have been consistently inadequate in Brazil,37 and this may explain why improvements have been slow between 1996 and 2006–07. Nevertheless, our results suggest that the expansion of sanitation services in the last decade benefited the poor more than the more affluent.
Parallel to the income redistribu-tion and strong decline in poverty ob-served between 2003 and 2006, severe food insecurity at the family level was reduced by 27% between 2004 and 2006–07.17
The quality of child care is another intermediate determinant of undernu-trition, in addition to access to health care, environmental conditions and food security.38 This variable is particularly dif-ficult to quantify, but our results indicate that improvements in maternal education were accompanied by reduced parity (i.e. fewer children ranking 5th or higher in
birth order), a widening of birth intervals and nearly universal access to modern contraceptives. Again, the greatest im-provements were seen among the poor (Table 3). Finally, preliminary assessment of recent breastfeeding trends in Brazil also indicates that its median duration increased from 7 to 14 months between 1996 and 2006–07; exclusive breastfeed-ing, however, remained very brief, its du-ration having increased from 1.1 to only 1.4 months in the same period.17
Proximate determinantsGiven the positive trends in the underly-ing and intermediate causes of under-nutrition, it is not surprising that child morbidity and mortality have declined in Brazil. Diarrhoea, a major direct cause of undernutrition, was responsible for 17.3% of all registered infant deaths in 1985–07,39 but by 2003–05 (the latest period with information available) ac-counted for 4.2% of all deaths.40 If we take into account that all-cause infant mortality rates for Brazil also dropped from about 60 to just over 20 per 1000 live births in the same period, the reduction in diarrhoea mortality rates per 1000 live births was roughly 90%, and the overall reduction in infant mortality was 67%. Brazil is among the few low- and middle-income countries that are on track to
reach the MDG of reducing mortality in children under 5 years of age.41
ConclusionThe major improvements that child growth indicators in Brazil have shown in recent decades reflect positive and equitable trends in the underlying, in-termediate and proximate determinants of undernutrition resulting from overall economic progress and equity-oriented public policies. The Brazilian experience is an example of the critical effect that policies to promote income redistribution and universal access to education, health, water supply, and sanitation services may have on child undernutrition. These poli-cies should be at the top of the agenda of governments truly committed to reducing undernutrition and improving the qual-ity of life of future generations. Future studies will show whether these gains will be maintained under the current global economic crisis. ■
Funding: The study was supported by a grant from the Brazilian Ministry of Health (grant 134/2006). The funding agency had no influence on the analyses or interpretation of the results.
Competing interests: None declared.
Table 3. Maternal schooling, prenatal care, access to water and sanitation services and reproductive health indicators, per survey year and socioeconomic quintile, Brazil, 1996–2007
Indicator Surveya year Indicator (%) per quintile P-valueb
Poorest 2nd 3rd 4th Richest
Maternal schooling ≥ 8 years 1996 5.6 13.2 24.7 44.7 73.5 0.0002006–07 29.4 44.5 62.2 71.5 92.5
Four or more prenatal visits 1996 37.5 60.9 79.8 89.0 93.7 0.000
2006–07 80.0 87.6 88.9 94.9 97.7Household served by public water supply
1996 39.9 70.1 80.4 82.2 80.9 0.2382006–07 65.3 74.6 81.1 85.2 89.2
Household served by public sewage system
1996 2.4 17.9 33.6 44.6 60.0 0.0002006–07 22.5 33.7 41.1 52.6 69.2
Household with flush toilet 1996 14.0 83.9 98.5 99.6 100.0 0.0012006–07 67.0 96.5 99.5 100.0 100.0
Birth order < 5th 1996 69.5 80.8 91.3 95.3 98.4 0.004
2006–07 91.3 94.8 96.6 97.7 99.7Birth interval ≥ 24 months 1996 69.2 75.1 83.6 88.7 91.3 0.787
2006–07 82.5 90.0 90.1 96.1 93.5Modern contraceptive usec 1996 51.1 65.2 76.6 79.0 79.6 0.000
2006–07 93.9 98.4 94.9 96.2 93.7a Demographic and Health Survey.b For the interaction between survey year and quintile.c Among women aged 15–49 years.

Bull World Health Organ 2010;88:305–311 | doi:10.2471/BLT.09.069195310
Carlos Augusto Monteiro et al.Socioeconomic inequality in child stunting in BrazilResearch
يف األطفال لتقزم االجتامعي والتوزيع االنتشار اتجاهات قياس الغرض الربازيل لتقييم تأثري الدخل وتأثري سياسات إعادة توزيع الخدمات األساسية
املطبقة يف هذا البلد يف الفرتة السابقة. 5 عمر من أقل األطفال بني التقزم انتشار بقياس الباحثون قام الطريقة سنوات )الطول بالنسبة للعمر z أقل من 2- باستخدام معايري منو األطفال ملنظمة الصحة العاملية( وذلك من البيانات التي ُجمعت من خالل املسوحات n = املنزلية الوطنية التي أجريت يف الربازيل يف عامي 1974-1975 )العدد ،)n= 4149 (، وعام 1996 )العددn = 7374 34409(، وعام 1989 )العددوعامي 2006-2007 )العدد n= 4414(. وقاس الباحثون اإلجحاف االجتامعي واالقتصادي املطلق والنسبي املسبب للتقزم عن طريق ميل املنسب، ومنسب
تركيز اإلجحاف، بالرتتيب.ثابتاً املوجودات عرب فرتة استمرت أكرث من 33 عاماً، وثق الباحثون تراجعاً انتشار وانخفض 7.1% إىل 37.1% من للتقزم الوطني االنتشار معدل يف
التقزم بني األطفال يف أفقر رشيحة خمسية من %59.0 إىل %11.2، وانخفض يف أغنى رشيحة خمسية من %12.1 إىل%3.3. وكان االنخفاض حاداً خالل الفجوة أيضاً تقلصت حينام ،)2007 إىل 1996 )من املاضية أعوام العرشة بني األرس الفقرية واألرس الغنية التي لديها أطفال أقل من عمر 5 سنوات من حيث القدرة الرشائية؛ والحصول عىل فرص التعليم وخدمات الرعاية الصحية
واملياه واإلصحاح؛ ومن حيث مؤرشات الصحة اإلنجابية.االستنتاج يف الربازيل، أدت التنمية االقتصادية واالجتامعية املقرتنة بالسياسات العامة التي تركز عىل العدالة إىل تحسن ملحوظ يف أحوال املعيشة وانخفاض هائل يف قلة تغذية األطفال، وكذلك إىل تقليص الفجوة الغذائية بني األطفال املنتمني إىل أعىل رشيحة خمسية وأدىن رشيحة خمسية للوضع االجتامعي واالقتصادي. وستظهر الدراسات املستقبلية إذا كانت هذه املكاسب ستستمر
يف ظل األزمة االقتصادية العاملية الراهنة.
Résumé
Réduction des inégalités socioéconomiques en termes de retard de croissance des enfants : expérience du Brésil, 1974-2007Objectif Estimer les tendances de la prévalence et de la répartition sociale du retard de croissance chez l’enfant au Brésil afin d’évaluer les effets des politiques de redistribution des revenus et des services de base mises en œuvre dans ce pays au cours des dernières années. Méthodes La prévalence du retard de croissance (z-score de la taille en fonction de l’âge < -2 si l’on utilise les Normes OMS de croissance de l’enfant) parmi les enfants de moins de 5 ans a été estimée à partir des données recueillies dans le cadre d’enquêtes nationales auprès des ménages menées au Brésil en 1974-1975 (n = 34 409), en 1989 (n = 7374), en 1996 (n = 4149) et en 2006-2007 (n = 4414). Les inégalités socioéconomiques relatives et absolues en matière de retard de croissance ont été mesurées respectivement par l’indice de pente et par l’indice de concentration des inégalités. Résultats Sur une période de 33 ans, nous avons enregistré une baisse régulière de la prévalence nationale du retard de croissance de 37,1 à
7,1 %. La prévalence a chuté de 59,0 à 11,2 % dans le quintile le plus pauvre et de 12,1 à 3,3 % dans le quintile le plus riche. Cette baisse a été particulièrement forte au cours des 10 dernières années de la période (1996 à 2007), pendant que l’écart entre familles pauvres et aisées comprenant des enfants de moins de 5 ans se réduisait aussi en termes de pouvoir d’achat, d’accès à l’éducation, aux soins de santé, à l’eau et aux services d’assainissement et de valeurs des indicateurs de santé génésique. Conclusion Au Brésil, le développement socioéconomique, couplé à des politiques en faveur de l’équité, s’est accompagné d’améliorations marquées des conditions de vie, d’une baisse substantielle de la dénutrition de l’enfant et d’une réduction de l’écart de statut nutritionnel entre les quintiles les plus riches et les plus pauvres. D’autres études permettront de déterminer si ces gains se maintiennent dans le cadre de la crise économique mondiale actuelle.
Resumen
Reducción de la desigualdad socioeconómica en materia de retraso del crecimiento infantil: la experiencia del Brasil, 1974–2007Objetivo Evaluar las tendencias de la prevalencia y la distribución social del retraso del crecimiento infantil en el Brasil a fin de evaluar el efecto de las políticas de redistribución de los ingresos y los servicios básicos aplicadas en ese país en los últimos años.Métodos Se estimó la prevalencia de retraso del crecimiento (puntuación z de la talla para la edad inferior a 2 empleando los patrones de crecimiento infantil de la Organización Mundial de la Salud) entre los menores de 5 años a partir de datos recogidos en encuestas nacionales de hogares realizadas en el Brasil en 1974–75 (n = 34 409), 1989 (n = 7374), 1996 (n = 4149) y 2006–07 (n = 4414). La desigualdad socioeconómica absoluta y relativa en materia de retraso del crecimiento se determinó midiendo el índice de desigualdad de la pendiente y el índice de concentración, respectivamente.Resultados A lo largo de 33 años, hemos documentado una disminución constante de la prevalencia nacional de retraso del crecimiento del 37,1% al 7,1%. La prevalencia se redujo del 59,0% al 11,2% en el quintil
más pobre, y del 12,1% al 3,3% en el quintil más rico. La disminución fue especialmente pronunciada en los últimos 10 años considerados (1996-2007), periodo durante el cual la brecha entre las familias pobres y ricas con menores de 5 años también se redujo en términos de poder adquisitivo; acceso a la educación, la atención sanitaria y los servicios de abastecimiento de agua y saneamiento; e indicadores de salud reproductiva.Conclusión En el Brasil, el desarrollo socioeconómico unido a políticas públicas favorables a la equidad ha ido acompañado de mejoras notables de las condiciones de vida y de una disminución considerable de la desnutrición infantil, así como de una reducción de la brecha observada en lo tocante al estado nutricional entre los niños de los quintiles socioeconómicos superior e inferior. Los nuevos estudios que se hagan en el futuro nos indicarán si esos beneficios se han mantenido o no durante la actual crisis económica mundial.
ملخصتقليص عوامل اإلجحاف االقتصادي واالجتامعي املسببة لتقزم األطفال: التجربة الربازيلية، -1974 2007
Bull World Health Organ 2010;88:305–311 | doi:10.2471/BLT.09.069195 311
Carlos Augusto Monteiro et al. Socioeconomic inequality in child stunting in BrazilResearch
1. Black RE, Allen LH, Bhutta ZA, Caulfield LE, de Onis M, Ezzati M et al.Maternal and child undernutrition: global and regional exposures and health consequences. Lancet 2008;371:243–60. doi:10.1016/S0140-6736(07)61690-0 PMID:18207566
2. Victora CG, Adair L, Fall C, Hallal PC, Martorell R, Richter L et al.Maternal and child undernutrition: consequences for adult health and human capital. Lancet 2008;371:340–57. doi:10.1016/S0140-6736(07)61692-4 PMID:18206223
3. Physical status: the use and interpretation of anthropometry: report of a WHO Expert Committee. Geneva: World Health Organization; 1995.
4. Tanner JM. A history of the study of human growth. Cambridge, New York: Cambridge University Press; 1981.
5. de Onis M. Child undernutrition based on the new WHO growth standards and rates of reduction to 2015. SCN News 2008;36:12–6. Available from: http://www.unscn.org/layout/modules/resources/files/scnnews36.pdf [accessed 12 October 2009]
6. de Onis M, Blossner M, Borghi E, Frongillo EA, Morris R. Estimates of global prevalence of childhood underweight in 1990 and 2015. JAMA 2004;291:2600–6. doi:10.1001/jama.291.21.2600 PMID:15173151
7. United Nations. The Millennium Development Goals. United Nations; 2008. Available from: http://www.un.org/millenniumgoals [accessed 26 June 2009].
8. de Onis M, Frongillo EA, Blossner M. Is malnutrition declining? An analysis of changes in levels of child malnutrition since 1980. Bull World Health Organ 2000;78:1222–33. PMID:11100617
9. Monteiro CA, Benicio MH, Iunes R, Gouveia NC, Taddei JA, Cardoso MA. Nutritional status of Brazilian children: trends from 1975 to 1989. Bull World Health Organ 1992;70:657–66. PMID:1464153
10. Monteiro CA, Conde WL, Popkin BM. Is obesity replacing or adding to undernutrition? Evidence from different social classes in Brazil. Public Health Nutr 2002;5(1A):105–12. PMID:12027272
11. Van de Poel E, Hosseinpoor AR, Speybroeck N, Van Ourti T, Vega J. Socioeconomic inequality in malnutrition in developing countries. Bull World Health Organ 2008;86:282–91. doi:10.2471/BLT.07.044800 PMID:18438517
12. Ananias P. Accelerating the reduction of maternal and child malnutrition: contributions to the debate based on the Brazilian experience. SCN News 2008;36:8–11.
13. Néri M. Miséria, desigualdade e políticas de renda: o real do Lula. Rio de Janeiro: FGV/IBRE/CPS; 2007.
14. Skidmore T, Matter W. Brazil’s persistent income inequality. Lat Am Polit Soc 2004;46:33–50.
15. Instituto Brasileiro de Geografia e Estatística, United Nations Children’s Fund. Perfil estatístico de crianças e mães no Brasil: aspectos nutricionais, 1974-75. Rio de Janeiro: IBGE, UNICEF; 1982.
16. Instituto Brasileiro de Geografia e Estatística, United Nations Children’s Fund. Perfil estatístico de crianças e mães no Brasil: aspectos nutricionais, 1989. Rio de Janeiro: IBGE, UNICEF; 1992.
17. BrazilMinistério da Saúde, Centro Brasileiro de Análise e Planejamento. Dimensões do processo reprodutivo e da saúde da criança: PNDS 2006.Brasília Ministério da Saúde 2009. In press
18. WHO child growth standards: length/height-for-age, weight-for-age, weight-for-length, weight-for-height and body mass index-for-age: methods and development. Geneva: World Health Organization; 2006.
19. Associação Brasileira de Empresas de Pesquisa. Critério de classificação econômica Brasil. São Paulo: ABEP; 2007. Available from: http://www.abep.org/codigosguias/AdocaoCCEB2008.pdf [accessed 27 June 2009].
20. Shaw M, Galobardes B, Lawlor D, Lynch J, Wheeler B, Davey Smith G. The handbook of inequality and socioeconomic position: concepts and measures. Bristol: Policy Press; 2007.
21. O’Donnell O, Van Doorslaer E, Wagstaff A, Lindelow M. Analyzing health equity using household survey data: a guide to techniques and their implementation. Washington, DC: The World Bank; 2008. Available from: http://go.worldbank.org/LVSSZJX9O0 [accessed 27 June 2009].
22. Erreygers G. Correcting the concentration index. J Health Econ 2009;28:504–15. doi:10.1016/j.jhealeco.2008.02.003 PMID:18367273
23. Wagstaff A. Correcting the concentration index: a comment. J Health Econ 2009;28:516–20. doi:10.1016/j.jhealeco.2008.12.003 PMID:19167117
24. Erreygers G. Correcting the concentration index: a reply to Wagstaff. J Health Econ 2009;28:521–4. doi:10.1016/j.jhealeco.2008.12.001
25. Wagstaff A. The bounds of the concentration index when the variable of interest is binary, with an application to immunization inequality. Health Econ 2005;14:429–32. doi:10.1002/hec.953 PMID:15495147
26. Instituto Brasileiro de Geografia e Estatística. Pesquisa de orçamentos familiares 2002-2003. Antropometria e análise do estado nutricional de crianças e adolescentes no Brasil. Rio de Janeiro: IBGE; 2006.
27. Monteiro CA, Conde WL, Popkin BM. Income-specific trends in obesity in Brazil: 1975-2003. Am J Public Health 2007;97:1808–12. doi:10.2105/AJPH.2006.099630 PMID:17761560
28. Monteiro CA, Benicio MH. D’A, Konno SC, Silva ACF, Lima ALL, Conde WL. Causes for the decline in child under-nutrition in Brazil, 1996-2007. Rev Saude Publica 2009;43:35–43. PMID:19169574
29. United Nations Children’s Fund. Strategy for improved nutrition of children and women in developing countries. New York: UNICEF; 1990.
30. Saúde CNsDSd. As causas sociais das iniquidades em saúde no Brasil. Relatório final. Rio de Janeiro: FIOCRUZ; 2008.
31. Centre for Development and Regional Planning, University of Minas Gerais. Sumário executivo. Avaliação de impacto do Programa Bolsa Família. Brasília: Ministério do Desenvolvimento Social; 2007. Available from: http://www.mds.gov.br/institucional/secretarias/secretaria-de-avaliacao-e-gestao-da-informacao-sagi/arquivo-sagi/pesquisas/institucional/secretarias/secretaria-de-avaliacao-e-gestao-da-informacao-sagi/arquivo-sagi/pesquisas/resultados_de_pesquisas/sumario_executivo_aibf.pdf [accessed 26 June 2009].
32. Draibe S. A política social do governo FHC e o sistema de proteção social. Tempo Social 2003;15:63–101.
33. Brazil, Ministério da Saúde. Sistema Único de Saúde [Internet site]. Available from: http://portal.saude.gov.br/portal/saude/visualizar_texto.cfm?idtxt=24627 [accessed 26 June 2009].
34. Aquino R, Barreto ML. The Family Health Program in Brazil and the adequacy of its coverage indicator. Cad Saude Publica 2008;24:905–14. PMID:18392369
35. Aquino R, de Oliveira NF, Barreto ML. Impact of family health program on infant mortality in Brazilian municipalities. Am J Public Health 2009;99:87–93. doi:10.2105/AJPH.2007.127480 PMID:19008516
36. Brazil, Ministério da Saúde. Atenção básica e saúde da família. Brasilia: Ministério da Saúde. Available from: http://dtr2004.saude.gov.br/dab/abnumeros.php. [accessed 26 June 2009].
37. Neri M. Trata Brasil: saneamento, educação, trabalho e turismo. Rio de Janeiro: FGV/IBRE/CPS; 2007.
38. Engle PL, Bentley M, Pelto G. The role of care in nutrition programmes: current research and a research agenda. Proc Nutr Soc 2000;59:25–35. doi:10.1017/S0029665100000045 PMID:10828171
39. Victora CG. Intervenções para reduzir a mortalidade infantil, pré-escolar e materna no Brasil. Rev Bras Epidem 2001;4:63–9.
40. Brazil, Ministério da Saúde, Rede Interagencial de Informações para a Saúde. Indicadores de mortalidade. Available from: http://tabnet.datasus.gov.br/cgi/deftohtm.exe?idb2007/c06.def [accessed 26 June 2009].
41. Bryce J, Daelmans B, Dwivedi A, Fauveau V, Lawn JE, Mason E et al.; Countdown Coverage Writing Group; Countdown to 2015 Core Group. Countdown to 2015 for maternal, newborn, and child survival: the 2008 report on tracking coverage of interventions. Lancet 2008;371:1247–58. doi:10.1016/S0140-6736(08)60559-0 PMID:18406859
References