nasa contractor report 174852 - nist
TRANSCRIPT

NASA Cont rac tor Report 174852
c
A Study o f I n t e r d i f f u s i o n i n t3 + y/y + y ' Ni-Cr-A1 A l l o y s a t 1200 O C
Lawrence A . Caro l
Michigan Technological U n i v e r s i t y Houghton, Michigan
February 1985
Prepared f o r . NATIONAL AERONAUTICS AND SPACE ADMINISTRATION Lewis Research Center Under Cont rac t NAG 3-24.4
.I


TABLE OF CONTENTS Paqe
I.
11.
111.
IV.
V.
INTRODUCTION
Coating Degradation Mechanisms Previous Coating Studies Philosophy and Approach Purpose of this Study
EXPERIMENTAL PROCEDURE
Alloy a:nd Diffusion Couple Preparation
EXPERIMENTAL RESULTS
Series 1. C1, C2, C3, C4/Sl(Ni-7.4Cr-l7.1Al) 1. C1 (Ni-20.0Cr-24.1Al)/Sl 2. C2(Ni-l5.3Cr-23.9Al)/Sl 3. C3 (Ni-15.1Cr-20.3Al) /S1 4. C4/Ni-26.4Cr-17.1Al) /S1 5. Growth Layer Kinetics
Series 2 . C1, C2, C3, C4/S2 (Ni-3.5Cr-17.OAl) 1. Cl/S2 2. c2/s2 3. C3/S2 4. C4/S2 5. Growth Layer Kinetics
Series 3. C1, C2, C3/S3 (Ni-16.2Al) 1, C1/S3 2. C2/S3
4. Growth Layer Kinetics 3 . c3/s3
BULK FLOW ANALYSIS
y-PHASE FLUX ANALYSIS
Possib:te Errors
Flux Analysis
i
1
2 4 7 10
12
12
19
19 19 27 32 36 41 43 43 48 53 58 63 63 63 70 74 79
82
87
92 96

TABLE OF CONTENTS (Continued)
VI DISCUSSION
B+y or y Layer Formation f3 Volume Fraction in the 8+y Growth Layer
y ' Layer Formation B+y and y' Growth Layer Kinetics Sununary Comparison to B+y/y Ni-Cr-A1 Interdiffusion
VI1 CONCLUSIONS
REFERENCES
APPENDICES
Appendix A: Bulk Composition Analysis
Appendix B: Phase Concentration Measurements Measurement Procedure y-Phase Standards y'-Phase Standards @-Phase Standards
Appendix C: Partial NiCrAl Phase Diagram at 1200°C Determination of Homogeneity Cr Segregations Phase Field Determination
1. B+y+a
3 . B+Y+Y
5 - Y+Y
2- B+y , 4 . B+Y;
Appendix D: Diffusion Paths and Liffusion Path Determination
Page
104
104 116 117: 119 122 126
130
132
A- 1
B- 1 B- 1 B- 3 B- 6 B-8
c- 1 c- 1 C-13 c-20 c-21 c-21 c-21 c-21 c-22
D- i
ii . . - . . . .. . - . . . .

I n t r o d u c t i o n
When a m e t a . l o r a l l o y i s exposed t o h i g h t e m p e r a t u r e s ,
r e l a t ive t o i t s m e l t i n g p o i n t , i t w i l l g e n e r a l l y unde rgo some
t y p e o f r e a c t i o n w i t h t h e s u r r o u n d i n g env i ronmen t . I n many
i n s t a n c e s t h i s r e a c t i o n h a s a d e t r i m e n t a l e f f e c t ; t h e end
r e s u l t b e i n g s u r f a c e d e g r a d a t i o n , l o s s of c r i t i c a l a l l o y i n g
e l e m e n t s , and a n overal l r e d u c t i o n i n t h e pe r fo rmance of t h e
a l l o y . I t is i m p o r t a n t i n t h e s e i n s t a n c e s t o p r o v i d e some
means o f s t o p p i r i g o r r e d u c i n g t h i s r e a c t i o n , i n order t o i m -
p r o v e t h e q u a l i t y , pe r fo rmance , and l i f e of t h e a l l o y . Many
t i m e s t h e d e c i s i o n t o p r o v i d e p r o t e c t i o n i s n o t a mat ter o f
c h o i c e , b u t r a t h e r of n e c e s s i t y . Such i s t h e case f o r modern
s u p e r a l l o y s u s e d as t u r b i n e blades and v a n e s i n a i r c r a f t gas
t u r b i n e e n g i n e s (1). The need t o o p e r a t e a t h i g h e r e n g i n e
t e m p e r a t u r e s h a s l e d t o new a l l o y deve lopmen t s w i t h g r e a t l y
improved m e c h a n i c a l p r o p e r t i e s , b u t u s u a l l y t h i s o c c u r s a t
t h e e x p e n s e of o x i d a t i o n r e s i s t a n c e ( 2 ) . T h e r e f o r e i n order
t o a c h i e v e p r a c t i c a l component l i v e s i n h i g h - t e m p e r a t u r e ,
o x i d i z i n g e n v i r o n m e n t s , s u p e r a l l o y s r e q u i r e p r o t e c t i v e
s u r f ace c o a t i n g s .
Pro tec t ive c o a t i n g s are g e n e r a l l y of t w o t y p e s , a lumin-
i d e d i f f u s i o n c o a t i n g s and o v e r l a y c o a t i n g s . ( N i , C o ) C r A l
o v e r l a y c o a t i n g s are b e i n g d e v e l o p e d for u s e i n g a s t u r b i n e
a p p l i c a t i o n s ( 3 - 6 ) b e c a u s e t h e y o f f e r s p e c i f i c a d v a n t a g e s
1

over aluminide coatings (1,7). One of the main advantages of
overlay coatings is the ability to design the coating composi-
tion for maximum oxidation and hot corrosion resistance, and
minimum coating - substrate interaction (1,7). In addition,
overlay coatings offer better oxidation, hot corrosion, and
thermal fatigue protection (7). Typically, overlay coatings
are about twice as thick as diffusional aluminide coatings (81 ,
thus allowing longer protective coating life.
Coating Degradation Mechanisms
The major purpose of a coating is to protect the under-
lying substrate from undergoing high temperature corrosion
processes, thereby increasing the life of the substrate alloy.
Coatings are typically made to contain high amounts of the
element(s) necessary to slow or inhibit the corrosion processes.
Because high temperature corrosion processes are predominantly
ones of oxidation (91, coating degradation involves the selec-
tive oxidation of the less noble elemental species in the
coating. Coating life, therefore, is dictated by the rate of
consumption of the less noble elemental species in the coating.
. In the case of B+Y Ni-or Co-base overlay coatings, the coating
life is dictated by the rate of consumption of Al. High tem-
perature oxidation results in the selective oxidation of A1
2

t o form an a d h e r e n t A 1 0 scale (7 , 1 0 ) . T h i s scale p r o v i d e s
a s a t i s f a c t o r y k i n e t i c barrier f o r c o n t i n u e d r e a c t i o n of t h e
c o a t i n g w i t h t h e o x i d i z i n g env i ronmen t ( 9 , 11-13) . T h e bar-
r ie r i s n o t m a i n t a i n e d , however, b e c a u s e the rma l c y c l i n g re-
s u l t s i n o x i d e s p a l l a t i o n . T h i s s p a l l a t i o n c a n expose f r e s h
m e t a l t o t h e o x i d i z i n g envi ronment , and t h e o x i d e mus t be
re formed t o a f f o r d p r o t e c t i o n . A 1 must , t h e r e f o r e , be con-
t i n u a l l y s u p p l i e d t o t h e o x i d e / m e t a l i n t e r f a c e i n p r o p e r
c o n c e n t r a t i o n to a l l o w s e l e c t i v e A 1 0 f o r m a t i o n . Thus,
one mechanism r e s p o n s i b l e f o r r educed o v e r l a y c o a t i n g l i f e
i s loss o f A 1 t o the A1203 scale ( 2 , 3 ) .
2 3
2 3
Another mechanism r e s p o n s i b l e fo r c o a t i n g d e g r a d a t i o n
is loss of c o r r o s i o n r e s i s t i n g e l e m e n t s t h r o u g h i n t e r d i f f u -
s i o n w i t h t h e s u b s t r a t e a l l o y . C o a t i n g s are t y p i c a l l y made
t o c o n t a i n h i g h e r amounts of c o r r o s i o n r e s i s t i n g e l e m e n t s
t h a n the s u b s t r a t e a l l o y . T h i s creates a chemical po ten -
t i a l g r a d i e n t which d r i v e s t h e d i f f u s i o n p r o c e s s . The m o s t
advanced of t h e ( N i , Co) C r A 1 Y o v e r l a y c o a t i n g s c o n t a i n
nomina l ly 2 2 . 5 a t . % A 1 (8, 1 4 1 , w h i l e t y p i c a l c a s t Ni-base
s u p e r a l l o y s c o n t a i n between 7-12.6 a t . % A1 (15-16). T h i s
, s u b s t a n t i a l d i f f e r e n c e i n b u l k A 1 c o n t e n t c a u s e s A 1 t o d i f -
f u s e from t h e c o a t i n g i n t o t h e s u b s t r a t e . A s A 1 d i f f u s e s
i n t o t h e s u b s t r a t e i t d e p l e t e s t h e c o a t i n g of Al, t h e r e b y
r e d u c i n g t h e amount of A 1 a v a i l a b l e t o s u p p l y o x i d a t i o n
r e s i s t a n c e . Thus, a second mechanism r e s p o n s i b l e f o r re-
duced o v e r l a y c o a t i n g l i f e i s loss of A1 by i n t e r d i f f u s i o n
3

with the substrate (2, 3 , 14).
Both types of coating degradation - i.e., loss of Ai
to the A1203 scale, and loss of A1 by coating/substrate
interdiffusion - involve diffusional transport of A1 (2, 3 ,
8, 13). Because the processes are diffusion controlled,
the loss of A1 from each mechanism increases with increas-
ing temperature ( 8 , 12). Loss of oxide by spallation due
to thermal cycling significantly accelerates the loss of A1
due to oxidation (7, 11, 13). Similarily, increasing the
bulk A1 difference between coating and substrate increases
the driving force for interdiffusion, and hence loss of A1
t;o the substrate (8). Both types of degradation simultane-
ously reduce the A1 content in the coating. This in turn
reduces the time in which the coating can supply the neces-
sary A1 to the oxide/metal interface to form an Al24 scale.
Once the A1 content is depleted to the point where continued
growth of an Ala$ scale cannot occur, less protective
-
oxides of Ni and Cr form (10). This point is referred to as
breakaway oxidation (171, and results in accelerated failure
of the coating/alloy system.
Previous Coating Studies
In order to improve the quality, performance, anL life
of overlay coatings, it is fundamental to study and under-
stand both forms of coating degradation. By reducing the
rate of consumption of A1 -'either by improvements in oxida-
4

tion resistance or reductions in coating/substrate interdiffu-
sion - the life of the coating will be increased, and also, the
life of the underlying substrate alloy (14). The first form of
coating degradation - i.e., loss of A1 to the oxide scale - has been addressed in a study of the cyclic oxidation behavior of
as-cast B+y, Ni-Cr-A1 (with small amounts of Zr) alloys (11,181.
These studies correlated the cyclic-oxidation weight change as
a function of time with the type of oxide formed, the micro-
structure, and the concentration-distance profiles of Ni, Cr,
and A1 near the forming/spalling oxide layer. In these studies
it was found that A1 is supplied to the coating/oxide interface
via dissolution of the Al-rich B phase. As the B phase dis-
solved, a y layer formed adjacent to the oxide. The y layer
thickened by diffusion of A1 from the y/y+B interface to the
y/oxide interface. As the loss of A1 progressed with time, the
A1 concentration at the y/B+y interface increased, while the A1
concentration at the y/oxide interface decreased. These changes
in A1 concentration resulted in a time independent A1 gradient
at the y/oxide int.erface. This time-independent gradient re-
sulted in a consta,nt A1 flux at the y/oxide interface. This
was in accord with the almost constant rate of weight loss of
the sample due to oxide spallation.
It was also found that breakaway oxidation occurred when
the A1 concentration at the y/oxide interface neared zero
(11,181. A numerical model was developed to predict y/y+B
interface positions as well as A1 concentration-distance pro-

F
files in the y phase. The model identified three critical
system parameters for coating life as the A1 content in
the coating, the diffusion coefficient in the Y phase, and
the relative amounts of B and Y in the coating.
The second form of coating degradation - i.e., loss of A1
by coating/substrate interdiffusion-has been addressed in a
study of overlay coating degradation by simultaneous oxida-
tion and coating/substrate interdiffusion (19). Four y phase
(Ni solid solution) Ni-Cr, Ni-A1, and Ni-Cr-A1 alloys were used
as substrates. The overlay was a low-pressure plasma sprayed
6 + Y Ni-Cr-Al-Zr coating. Results of this work showed that
extensive interdiffusion occurred at times as short as 10
hours. Coatings on all substrates underwent complete loss of
the B phase within 5 to 15 hours of oxidation (approximately
5-10% of the failure time of the coating). Although complete
loss of 8 occurred at short times, the A1 that diffused into
the substrate was found to diffuse back out at longer times
and provide oxidation protectiori. Another result of this
study (19) was that as the A1 content in the substrate in-
creased, the amount of A1 interdiffusion decreased. This
result was expected since a reduction in the bulk A1 gra-
dient between coating and substrate would be expected to
redcce the chemical potential gradient driving the diffusion
process. Other results (19) showed that as the rate of A1
. consumption (due to oxide formation/spallation) increased,
the loss of A1 due to coating/substrate interdiffusion also
6

i n c r e a s e d . A s t h e rate o f A 1 consumpt ion d e c r e a s e s , t h e
amount of c o a t i n g / s u b s t r a t e i n t e r d i f f u s i o n i n c r e a s e s , b u t a
l a r g e r f r a c t i o n of t h e A 1 i s a b l e t o d i f f u s e back o u t of t h e
s u b s t r a t e before c o a t i n g f a i l u r e .
A numer ica l model w a s deve loped ( 1 9 ) t o p r e d i c t t h e e f f e c t i v e
l i f e of a c o a t i n g unde rgo ing s i m u l t a n e o u s c o a t i n g / s u b s t r a t e i n -
t e r d i f f u s i o n and o x i d e s p a l l a t i o n a s s o c i a t e d w i t h c y c l i c ox ida -
t i o n . T h i s model was u t i l i z e d t o i d e n t i f y t h e c r i t i c a l sys t em
p a r a m e t e r s a f f e c t i n g c o a t i n g l i f e as b e i n g t h e ra te of A 1 con-
sumption (from o x i d a t i o n / s p a l l a t i o n a n d / o r c o a t i n g / s u b s t r a t e
i n t e r d i f f u s i o n ) arid t h e A 1 c o n t e n t i n t h e s u b s t r a t e . I t w a s
found t h a t t h e A 1 c o n t e n t i n t h e c o a t i n g had a lesser impac t
on c o a t i n g l i f e . L ikewise , t h e C r c o n t e n t i n e i ther t h e coat-
i n g o r t h e s u b s t r a t e had l i t t l e impac t on c o a t i n g l i f e .
Ph i losophy and Approach
S u p e r a l l o y s are d e s i g n e d w i t h c o m p o s i t i o n s and s t r u c t u r e s
t o w i t h s t a n d stress c o n d i t i o n s a t h i g h t e m p e r a t u r e ( 2 0 - 2 1 ) .
Because these a l l o y s must o p e r a t e a t h i g h t e m p e r a t u r e i n
s e v e r e l y c o r r o s i v e env i ronmen t s , p r e c i p i t a t i o n - a l l o y s based on
t h e N i - C r sys tem have been deve loped ( 2 2 ) . While t h e composi-
' t i o n of these a l l o y s i s v e r y complex (15 , 201, t h e s t r u c t u r e i s
q u i t e s i m p l e , c o n s i s t i n g of a : , z t r i x of Ni-base s o l i d s o l u t i o n
(y) dispersed w i t h o rde redy ' p a r t i c l e s up t o 60 v o l . p e r c e n t
( 2 0 ) . The y' is an ordered fcc s t r u c t u r e based on t h e composi-
t i o n ( N i , C O ) ~ (A:L, T i ) (15, 2 2 ) . These a l l o y s d e r i v e t h e i r

high temperature strength and microstructural stability from
the y ' precipitates (15,20-27). In studying the effect of coat-
ing degradation by coating/substrate interdiffusion, a first
choice substrate would be an actual y+y' superalloy. Real
superalloys, however, are compositionally complex, and can eas-
ily contain 3-14 elements (15,28,29). Ternary or higher order
diffusional interactions can complicate and hinder a complete
understanding of coating degradation by coating/substrate inter-
diffusion (19). To this end, simplifications must be made in
order to first understand the basic mechanisms responsible for
coating degradation by coating/substrate interdiffusion.
In considering the compositional complexity of Ni-base
superalloys, it becomes apparent that they are basically Ni-Cr
alloys (15,16,22) with major additions of Co (8.6-13.8 at.%)
and A1 (7.1-12.6 at.%) (15,161. Minor additions of not more
than 5 at.% include Ti, W, Mo, Mn, Si, Fe, as well as trace ad-
ditions of Ta, Hf, Nb, and C (15-16). To simplify the system,
a first choice would be to consider the Ni-Cr-Co-A1 system.
However, because Co and Ni are very similar in atomic number,
weight, and size (301, and are completely miscible at the com-
positions of interest (311, they can be substituted interchan-
geably. Thus, the Ni-Cr-A1 systzm is by far the simFlest to
consider for substrates representing superalloys. This was the
approach taken in previous studies of coating degradation (11,
18,191. Although superalloys are basically two phase y+y'
alloys, the compositions of Ni, Cr, and A1 found in them trans-
8

late to one phase MNi solid solution) alloys in the Ni-Cr-A1
system. This is why Y substrates were Considered in a previous
study of coating diegradation by coating/substrate interdiffu-
sion (19).
To understand coating degradation by coating/substrate in-
terdiffusion in real coating/superalloy systems, choices of
simplified model systems which represent the real system must
be made. The B+y NiCrA1 coating can easily be modeled with
B+y Ni-Cr-A1 alloys of similar composition. In modeling super-
alloy substrates, however, both composition and structure must
be considered. Modeling superalloy substrates with composi-
tionally similar y Ni-Cr-A1 alloys has been performed in a pre-
vious study (19). Because superalloys have y + ~ ' structures, a
natural extension of the previous study (19) is to model super-
alloy substrates with structurally similar Y+Y' Ni-Cr-A1 alloys.
In considering y + y ' Ni-Cr-A1 alloys, two general changes in com-
position make them different from y+y ' superalloys. First, the
bulk A1 composition must be raised from 7-12 at.% to 17-19 at.%
to put the alloys in the y+y ' phase field. Second, the bulk
Cr composition must be lowered from 9-23 at.% Cr to 0-10 at.%
Cr. These changes create larger differences in bulk Cr composi-
tion between @+y alloy and y+y ' alloy than bulk A1 composition.
In real coating/superalloy systems, or B+y/y Ni-Cr-A1 systems,
the bulk A1 composition difference is usually much larger than
the bulk Cr composition difference. In view of this, slightly
different behavior would be expected between B+y alloy inter-
9

diffusion with Ni-Cr-A1 substrates and Ni-Cr-A1 y+y' sub-
strates.
It is the aim of this study to investigate interdiffusion
in B+y/y+y' Ni-Cr-A1 diffusion couples. By using B+y/yty '
Ni-Cr-A1 couples to model real coating/superalloy interdiffu-
sion, the information obtained from the study can be used to
better understand coating/substrate interdiffusion in the real
system. Furthermore, it is the aim of this study to compare
B+y/y+y' (Ni-Cr-Al) interdiffusion to B+y (Ni-Cr-Al-Zr) / y
(Ni-Cr-Al) interdiffusion investigated in a previous study (191,
in order to determine which model system best represents real
coating/superalloy interdiffusion.
Purpose of This Study
The purpose of the present study is twofold:
1. To examine the effect of f3+y alloy composi- tion and v+y' alloy composition on @+y/y+y' (Ni-Cr-All interdiffusion: and
2. To compare these results with interdiffusion in @+y (Ni-Cr-Al-Zr/y (Ni-Cr-Al) diffusion couples.
To accomplish this purpose, several B+ y alloys representative
of coating compositions and several Y+Y' alloys spanning the
y+y' phase field were cast, annealed, and fabricated into dif-
fusion couples. Subsequent analysis including concentration/
-distance profiles in each phase, and measurements of growth
10

layer kinetics provided insight into the diffusional interac-
tion. Determination of the NiCrAl phase diagram at 1200°C
allowed quantitative diffusion paths to be determined which pro-
vided further insight into the interdiffusion process.
The results were utilized to determine the critical para-
meters governing B+y/y+y ' interdiffusion. Variations in B+y
alloy composition and y+y ' alloy composition allowed changes
in diffusion path to occur which affected the amount of Cr and
A1 that diffused into the y+y ' alloy. Using high bulk A1 y+y'
alloys caused diff'erent interdiffusion behavior to occur as com-
pared to y alloys. This behavior, however, could be beneficial,
not detrimental, if made to occur in real coating/superalloy
systems. Finally, these results, as well as previous results
(11,18,19), can be used to better design coating substrate sys-
tems so that the quality, performance, and life of the coating
and substrate can lse improved.
11

Experimental Procedure -
The Ni-Cr-A1 alloys chosen for use in this study consisted
of four B+y alloys, two Y+Y' alloys, and oneY alloy. Alloy des-
ignations and compositions are given in Table 1. The phases pre-
sent and volume fractions are given in Table 2. B + Y alloy C2
was cast to represent the coating alloy used in earlier coating
studies (11,18-19). Alloy C1 contained approximately the same
bulk A1 composition as alloy C2 with a higher bulk Cr composi-
tion. Alloy C3 contained approximately the same bulk Cr compo-
sition as alloy C2 with a lower bulk A1 composition. Alloy C4
was an attempt at obtaining an alloy with the same phase compo-
sitions (on the same tie line) as alloy C1. The y+y' alloys
were chosen to span the y+y' phase field. They were made to con-
tain the same bulk A1 compositions with different bulk Cr
compositions. Alloy S3 was intended to be a y+y ' alloy, but
resulted in a y alloy of slightly lower bulk A1 composition than
alloys S1 and S2.
Alloy and Diffusion Couple Preparation - All alloys used in this study were prepared from pressed
elemental powders. The Ni powder was obtained from International
Nickel Co., type 123, of nominal purity 99.7% Ni. The A1 powder
was obtained form Alcoa, type 1202, of nominal purity 99.99% Al.
The Cr powder was obtained from Alfa Products, type 00077, of
nominal purity 99.95% Cr. After mixing and pressing of the
powders, the alloys were arc melted in an argon atmosphere on a
12

TABLE 1
Compositions of the B+y and y+y' Alloys Used in Diffusion Couples
Alloy Desiqnaticg
8 + y Alloys
c1 c2 c3 c4
y + y A1 loys
s1 s2
Y Alloy
s3
1 Alloy Composition Nominal Bulk EDAX2
Ni-19.8Cr-24.7Al Ni-20.OCr-24.1Al Ni-14.9Cr-24.7Al Ni-15.3Cr-23.9Al Ni-14.9Cr-20.8Al Ni-15.1Cr-20.3Al Ni-26.OCr-16.9Al Ni-26.4Cr-17.1Al
Ni-7.4Cr-18.1Al Ni-7.4Cr-17.1Al Ni-3.7Cr-18.1Al Ni-3.5Cr-17.OAl
Ni-18.1Al 3 Ni-16.5A1
1. All compositions in atomic percent 2 . See Appendix A - Bulk Composition Analysis for details 3 . Ni-16.2A1 by electron microprobe analysis
#
13

14
TABLE 2
Phase Constitution and Measured Volume Fractions For the f3+y and y + y ' Alloys Used in Diffusion Couples
A1 1oy Phases Present Volume Fraction of y or y '
AS Cast
c1 B + Y c2 B + Y c3 B + Y c4 B + Y
s1 Y s2 Y
s3 Y
Homogenized (1200 "C) Mea su red
@ + Y 30.0 5 4 . 0 % ~ B + Y 31.0 + 4.0%~ B + Y 61.0 z 3 . 0 % ~ B + Y 70.0 5 4 . 0 % ~
Y + Y' 26.0 5 3.0%~' Y + Y' 19.0 5 3.0% y'
Calculated 31.0 33.0 59.0 68.0
1. Obtained from measured phase diagram using bulk EDAX compositions
8
14

water cooled copper hearth using a non-consumable tungsten elec-
trode. The first melting step consisted of repeated melting of
the alloy into an approximately 40mm diameter button. The second
melting step consisted of melting the button into a 15mm diameter
rod, 50mm in length. The final melting step consisted of melting
the 15mm diameter rod into a lOmm diameter rod, approximately
9Omm in length.
After melting, the alloys were annealed to obtain a homogen-
eous microstructure. The B+y alloys were annealed at 1250°C for
150 hours followed by a 200 hours anneal at 1200°C. Electron
microprobe analysis showed no composition variations in the B
and y phases that were not within the standard deviation of the
measurements. The y + y ' alloys were annealed at 1250°C for 50
hours followed by a 100 hours anneal at 1200°C. Alloy micro-
structures and their location on the NiCrAl phase diagram (1200°C)
are shown in Figures 1 and 2.
After homogenization, the alloys were sectioned into appro-
ximately lorn diameter by 3.2m thick disks. The disks were
polished through 0.05 alumina and then fabricated into diffusion
couples.
alloys next to one another in a Mo canister. The canister and
contents were annealed at 1200°C (+2"C) in a flowing Ar atmos-
phere for 100, 200, and 300 hours. The lower thermal expansion
of the Mo canister caused a compressive stress to be placed on
The fabrication involved placing the various B+y/y+y '
15
the couples. The compressive stress plus the highly polished
disk surfaces allowed diffusion bonding to occur over approxi-

h - a c
‘(z cu I
0 0
0 01 I
z
L
.- Y
v-
0
‘(z
0
E rd k 0 rd 4 a a, cn rd G a k-4
2 U
z a, 2 4J
c 0
c 0 -4 4 rd e, 0
k -4 Q)- ECJ - 0 0 0 a 0
c m @--I
cn a, k 3 4J e, 7 k 4J cn 0 k e, -4 E h 0
(d
0 c -4 c, rd 0 U
-4
4
v
4 4
.-I
a, k 3 0
c 4 -4
16

n
4 -
Y
01 cn
. _ ’ \
. ‘.I 0 .-
z
I -
17
>

mately 80% of the couple. Following each 100 hours anneal, the
diffusion couples were sectioned for microstructural investiga-
tion, phase growth measurements, and electron microprobe analy-
sis. Microstructural investigation and phase growth measure-
ments involved etching the sample with Marble's Reagent (32).
Electron microprobe analyses were performed on unetched samples.
18

Experimental Results
To investigate coating/substrate interdiffusion using
B+y/y+y ' Ni-Cr-AI. alloys, diffusion couples of homogenized alloys were utilized.
thick so that no diffusion occurred at the outside ends of
the couple. Thusj, all results presented pertain toan
infinite diffusion couple. The series of couples used to in-
vestigate interdiffusion were characterized by a common B+y
or Y+ Y' alloy joined to selected alloys of the other phase
field. Table 3 lists the series of couples studied. Depend-
ing on the composition of the terminal alloys, the couples
developed complex, multiphase diffusion structures with a
variety of interfaces, including: B +Y /y 8 B +Y /y ' , 8 +y /y+y ' 8
y /y+y ' , Y, /y ' , Y'/Y+y', and y + r ' / y . A summary of the inter-
faces developed in each individual couple is presented in
Table 3 . Along with microstructural investigation, phase
growth measurements, concentration/distance profiles at 200
hours in the phases in the diffusion zone, and diffusion
paths were utilized to determine and explain the critical
parameters governing the interdiffusion phenomena. The re-
s u l t s of this work for each series of couples is presented
below.
The alloy sections were sufficiently
Series 1. C1, C2, C3, C4/Sl(Ni-7.4Cr-17.1Al)
I. Cl(Ni-20.0Cr-24.1Al)/Sl. Interdiffusion resulted in growth
of B+y into the y+y ' alloy., (i.e., the B+y structure expanded
19

S e r i e s
1
2
3
TABLE 3
Summary of t h e I n t e r f a c e s Developed - i n t h e
u Couple B+Y/ Y
C l / S l -- c2/s1 -- c 3 /s1 Y C4/S1 Y
c1/s2 -- c 2 / s 2 -- C3/S2 Y C4 /S2 Y
C1/S3 -- C2/S3 -- c 3 / s 3 Y
- D i f f u s i o n Coup les
3 I n t e r f a c e s P r e s e n t B+Y/ B+Y/ Y/ Y '1
y ' y+y ' y+y' y / y ' y+y'
'See Table 1 f o r a l l o y i d e n t i f i c a t i o n .
2 A 1 1 d i f f u s i o n t i m e s w e r e 200 h o u r s .
3~ = i n t e r f a c e w a s p r e s e n t .
20

w i t h t i m e o f i n t . e r d i f f u s i o n ) . The d i f f u s i o n zone, shown i n
F i g u r e 3 , c o n s i s t e d of t h e B + y a l l o y ( C l ) , t h e I;+y growth
l a y e r , and t h e y+y' a l l o y ( S l ) . C o n c e n t r a t i o n / d i s t a n c e (here-
a f t e r referred t.o a s C / D ) p ro f i l e s fo r C r i n t h e B a n d Y
p h a s e s , and t h e c a l c u l a t e d b u l k C r C/D p r o f i l e * a r e shown i n
F i g u r e 4 . L i k e w i s e , C / D p r o f i l e s f o r A 1 i n t h e f3 a n d Y p h a s e s
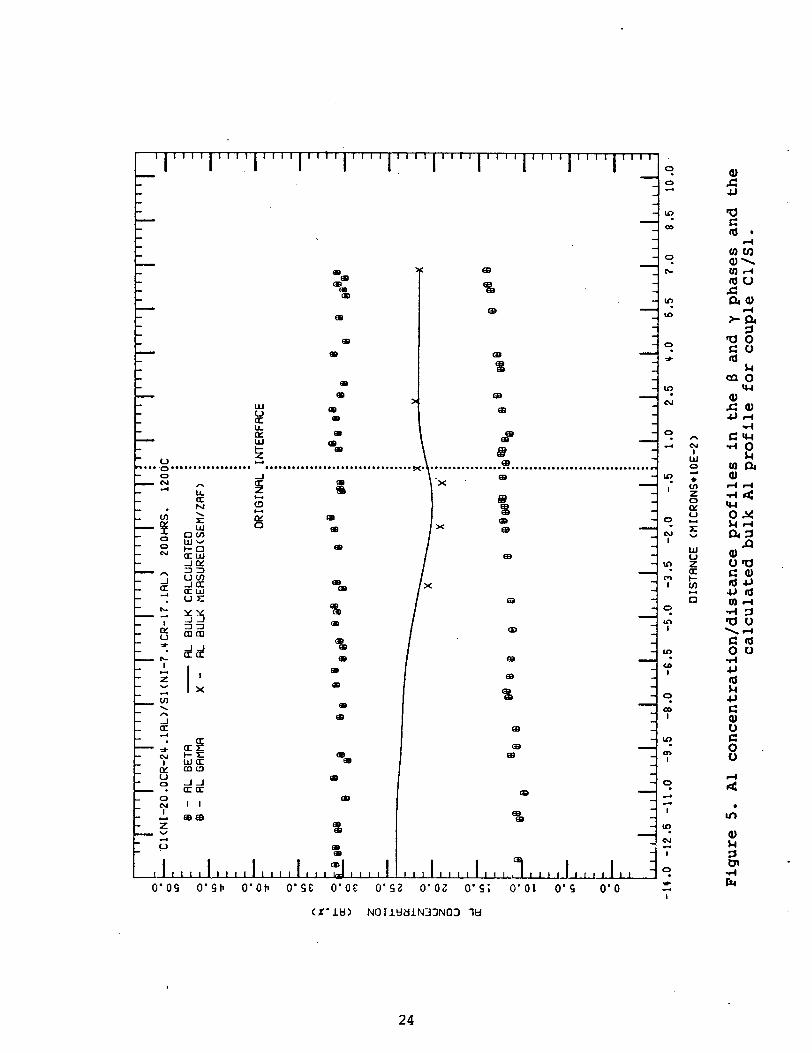
and t h e c a 1 c u l a t . e d b u l k A 1 C / D p r o f i l e are shown i n F i g u r e 5.
C/D p rof i les i n t h e y + y r e g i o n s w e r e n o t measured b e c a u s e t h e
Y and Y ' p h a s e s c o u l d n o t be d i s t i n g u i s h e d u n e t c h e d , a n d t h e
s i z e o f t h e Y ' was on t h e order of t h e e l e c t r o n m i c r o p r o b e
s p o t s i z e (3-5 m. i c rons ) . From F i g u r e 4 it c a n be s e e n t h a t
t h e C r c o n c e n t r a t i o n i n t h e B a n d y p h a s e s b e g i n s to d e c r e a s e
w e l l back ( - -600pm) from t h e o r i g i n a l i n t e r f a c e ( h e r e a f t e r
referred t o as 0.1.). The C r c o n c e n t r a t i o n i n t h e y p h a s e de-
c r e a s e s m u c h m o r e s h a r p l y t h a n t h e C r c o n c e n t r a t i o n i n t h e 8
phase . The b u l k C r d e c r e a s e s v e r y l i t t l e u n t i l n e a r t h e 0.1.
where i t decreases s h a r p l y .
p ro f i l e s i n t h e p h a s e s , and t h e b u l k C r C/D p r o f i l e b e g i n t o
level off ( i . e . t h e change i n c o n c e n t r a t i o n w i t h d i s t a n c e , o r
t h e g r a d i e n t , becomes less s t e e p ) . The A 1 C / D p r o f i l e i n t h e
I n t h e B+y growth l a y e r , t h e C r C / D
p h a s e ( F i g u r e 5 ) is a p p r o x i m a t e l y c o n s t a n t , w h i l e t h e A 1
C/D p r o f i l e i n t h e y p h a s e i n c r e a s e s s l i g h t l y toward t h e 0.1. - i n d i c a t i n g u p h i l l A 1 d i f f u s i o n . T h i s i s n o t s u p r i s i n g , how-
ever, b e c a u s e a l l p h a s e c o n c e n t r a t i o n s i n t h e C / D p r o f i l e s
* See Appendix D - D i f f u s i o n P a t h s and D i f f u s i o n P a t h D e t e r - m i n a t i o n f o r d e t a i l s .
21

c1 I 0.1.
50at .% At
s1
Oat.%
Figure 3. (a) Diffusion zone microstructure ( 2 0 0 hrs.) ; and ( b ) diffusion path for couple C1 (Ni-20.OCr-24.1)Al/
S1 (Ni-7.4Cr-17.1Al)
22

0 4 4
+
9 mu
W t
t CL
3
+
+ + + +
+ + +
+ + +
+ A -? +
4
+
4
.+ + + - / :: + 6 t
4
+ I
4
4 + 4 + 4
+ 4 4
4
4
4
4 +
23
aJ c 4J
A cy
W 0 d
,
1 P
24
were found to lie 0x1 the respective phase boundaries of the
phase diagram, indicating local equilibrium was being maintained.
As the f3ty phase field is transversed toward the Ni-A1 side
of the phase diagram,** the y/B+y phase boundary exhibits a rise
in A1 concentration from approximately 9.0 at.% A1 to 14.5 at.%
Al. The rise in A1 concentration of the y/B+y phase boundary is
reflected in the rise of A1 concentration in the y phase C/D pro-
file. The bulk A1 C/D profile begins to decrease well back in
the B+y alloy (- -1000pm from the 0.1.) and continues to decrease
until the 0.1. at which it increases and then levels to an ap-
proximately constant value. The increase in bulk A1 at the 0.1.
corresponds to the point where the bulk Cr is decreasing sharply.
The diffusion path, shown in Figure 3 , reflects the diffu-
sion zone microstructure and the resulting changes in the C/D
profiles. The A1 decreases sharply at first, as seen by the first
segment of the diffusion path (Cl-a). Over the same pati! seg-
ment, the bulk Cr changes very little. The decrease in bulk A1
composition comes from the fact that the volume fraction of 8
is decreasing from approximately 70% in the alloy (well removed
from the diffusion zone) to approximately 44% near the 0.1.
This reduction in the vol. fraction of 8 is also why the bulk
A1 C/D pzofile decreases toward the 0.1.. Over the same dis-
tance that the bulk. A1 C/D profile is decreasing, the bulk Cr
C/D profile decreases very little. Thus, the diffusion path
**See Figure C-1, pg. c-4.
I
I 25
segment C1-a shows very little change in bulk Cr composition.
Only near the 0.1. does the bulk Cr composition begin to decrease
sharply. The sharp decrease in the bulk Cr C/D profile leads to
an increase in the bulk A1 C/D profile and this is reflected in
the diffusion path by segment a-b. Considering the diffusion
zone microstructure, it becomes apparent why the bulk A1 C/D pro-
file must rise. Transversing from the 0.1. into the B+y growth
layer shows an almost discontinuous change in the volume fraction
of B from 4 4 vol.% near the 0.1. to 4 8 vol.% in the B + y growth
layer. The volume fraction of B remains constant throughout the
growth layer. Because the volume is constant, the bulk A1 C/D
profile is constant in the B+y growth layer. The bulk Cr C/D
profile continues to decrease in this region. These results are
evident in the diffusion path segment b-c where there is little
change in the bulk A1 composition, while the bulk Cr composition
continues to decrease.
At the three-phase interface (B+y/y+y') the diffusion path
enters the B+y+y' triangle on the B+y side at approximately 21
at.% Al. It exits the triangle on the y+y' side at approximately
19 at.% Al. The diffusion path reaches the y+y' alloy (S1) com-
position by cutting tie-lines in the y+y' field - as seen in the diffusion zone microstructure by a gradual reduction in the vol-
ume fraction of y' away from the three-phase interface.
26

2. C2(Ni-15.3Cr-;!3.9Al)/Sl. I n t e r d i f f u s i o n r e s u l t e d i n a s i m i -
l a r d i f f u s i o n zone m i c r o s t r u c t u r e t o c o u p l e C l / S l - c o n s i s t i n g
of fj+y a l l o y ( C 2 ) , B+y growth , and y+y ' a l l o y (S1) as shown i n
F i g u r e 6 . C /D p r o f i l e s f o r C r and A 1 i n t h e B and y p h a s e s and
t h e c a l c u l a t e d b u l k C r and A 1 C / D p r o f i l e s a re shown i n F i g u r e s
27 I
7 and 8 , r e s p e c t i v e l y . The C / D p r o f i l e s were s i m i l a r i n a p p e a r -
a n c e t o t h o s e of c o u p l e C l / S l . The C r c o n c e n t r a t i o n i n t h e y
p h a s e decreased less s h a r p l y t h a n i n c o u p l e C l / S l .
c a u s e t h e e q u i l i b r i u m C r c o n c e n t r a t i o n i n t h e y p h a s e o f a l l o y
C2 is a p p r o x i m a t e l y 24.0 a t . % C r , compared t o 3 4 . 0 a t . % C r i n
t h e p h a s e of a l l o y C 1 . Thus t h e C r c o n c e n t r a t i o n h a s t o de-
crease f r o m 24.0 alt.% C r t o 1 4 . 0 a t . % C r ( a t t h e t h r e e - p h a s e
i n t e r f a c e ) and t h i s r e s u l t s i n a less steep C r g r a d i e n t . S i m i l a r
t o c o u p l e C l / S l , t h e b u l k C r C/D p r o f i l e decreases a t t h e 0.1.
w h i l e t h e b u l k A 1 C / D p r o f i l e i n c r e a s e s . The d e c r e a s e i n b u l k
C r and i n c r e a s e i n b u l k A 1 a t t h e 0.1. i s n o t as s h a r p a s f o r
c o u p l e C l / S l . T h i s would b e e x p e c t e d b e c a u s e a l l o y C2 h a s a
l o w e r b u l k C r c o m p o s i t i o n t h a n a l l o y C1 . Thus, t h e C r c h e m i c a l
p o t e n t i a l g r a d i e n t i n t h e c o u p l e i s less t h a n i n C l / S l , and
t h e r e f o r e , t h e bulls c o m p o s i t i o n g r a d i e n t s i n t h e C / D p r o f i l e s
are smaller.
T h i s i s be-
The d i f f u s i o n p a t h , shown i n F i g u r e 6 , i s s i m i l a r i n a p p e a r -
a n c e i n t h e B+y p h a s e f i e l d t o t h e p a t h of c o u p l e C l / S l . The
b u l k A 1 d e c r e a s e s f i r s t , c o r r e s p o n d i n g t o r e d u c t i o n s i n t h e
volume f r a c t i o n o f B toward t h e 0.1. i n t h e c o u p l e . The b u l k
C r decreases s l i g h t l y over t h i s s e c t i o n o f p a t h . A t t h e 0.1.
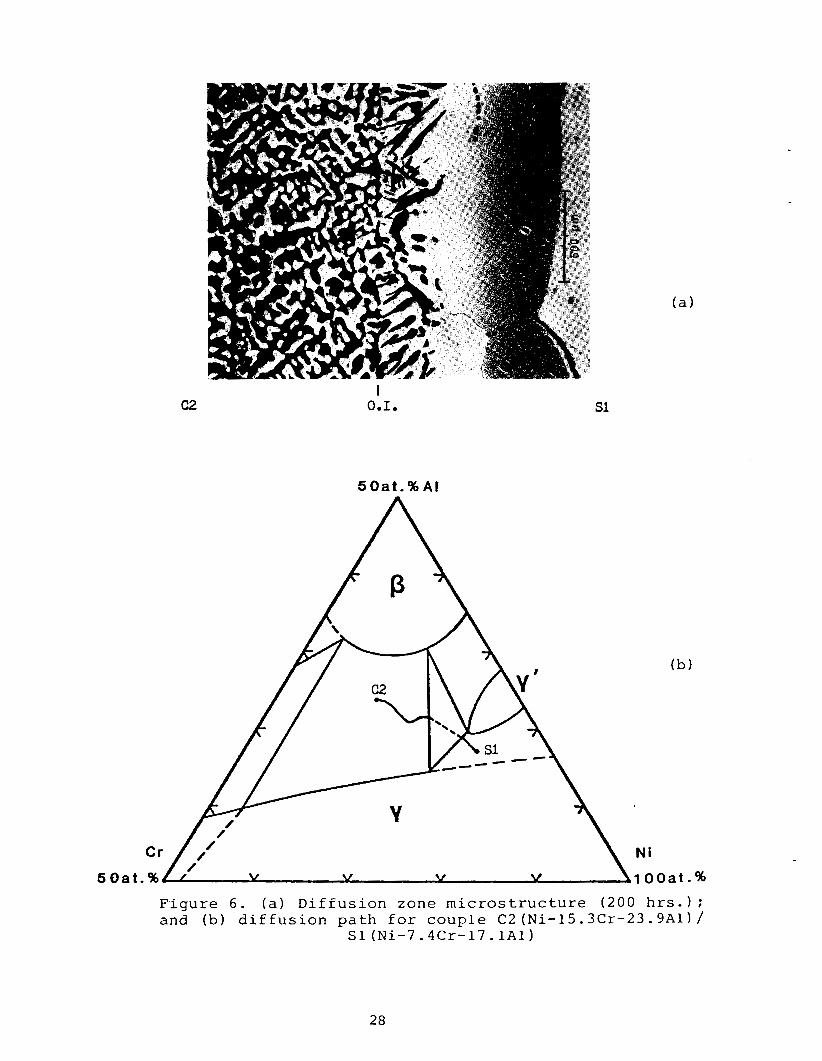
c2 I 0.1.
50at .% A l
s1
Ni
1 O O a t .%
F i g u r e 6 . ( a ) D i f f u s i o n zone m i c r o s t r u c t u r e (200 h r s . ) ; and (b) d i f f u s i o n p a t h f o r c o u p l e C2 (Ni-15.3Cr-23.9Al) /
S1 (Ni-7.4Cr-17.1Al)
28

.
01 I
W 0
& 4
v
W U z E[: t- u) w 0
a, c c,
a c Id
29

I
30

.
t he volume f r a c t i o n rises f r o m a p p r o x i m a t e l y 4 5 vol .% t o 4 8
vo l .% i n t h e B+y growth l a y e r . T h i s d i s c o n t i n u o u s change i n p
volume f r a c t i o n c a u s e s t h e d i f f u s i o n p a t h t o i n f l e c t a n d i n c r e a s e
t o h i g h e r A 1 c o m p o s i t i o n . I n t h e B+y growth l a y e r , t h e volume
f r a c t i o n of r ema ins c o n s t a n t , and t h u s t h e F a t h shows a s t r a i g h t
segment of c o n s t a n t b u l k A 1 c o m p o s i t i o n . The b u l k C r c o m p o s i t i o n
c o n t i n u e s t o d e c r e a s e a l o n g t h i s p a t h segment . A t t h e three p h a s e
i n t e r f a c e , t h e d i f f u s i o n p a t h e n t e r s t h e B+y+y' t r i a n g l e o n t h e
B+y side a t a p p r o x i m a t e l y t h e same A 1 c o m p o s i t i o n as c o u p l e C l / S l .
The p a t h e x i t s t h e t r i a n g l e on t h e y+y ' side a t t h e same p o i n t
where t h e p a t h of c o u p l e C l / S l e x i t s t h e t r i a n g l e , and c u t s t i e
l i n e s u n t i l i t r e a c h e s t h e t e r m i n a l a l l o y (S1) c o m p o s i t i o n .
i -
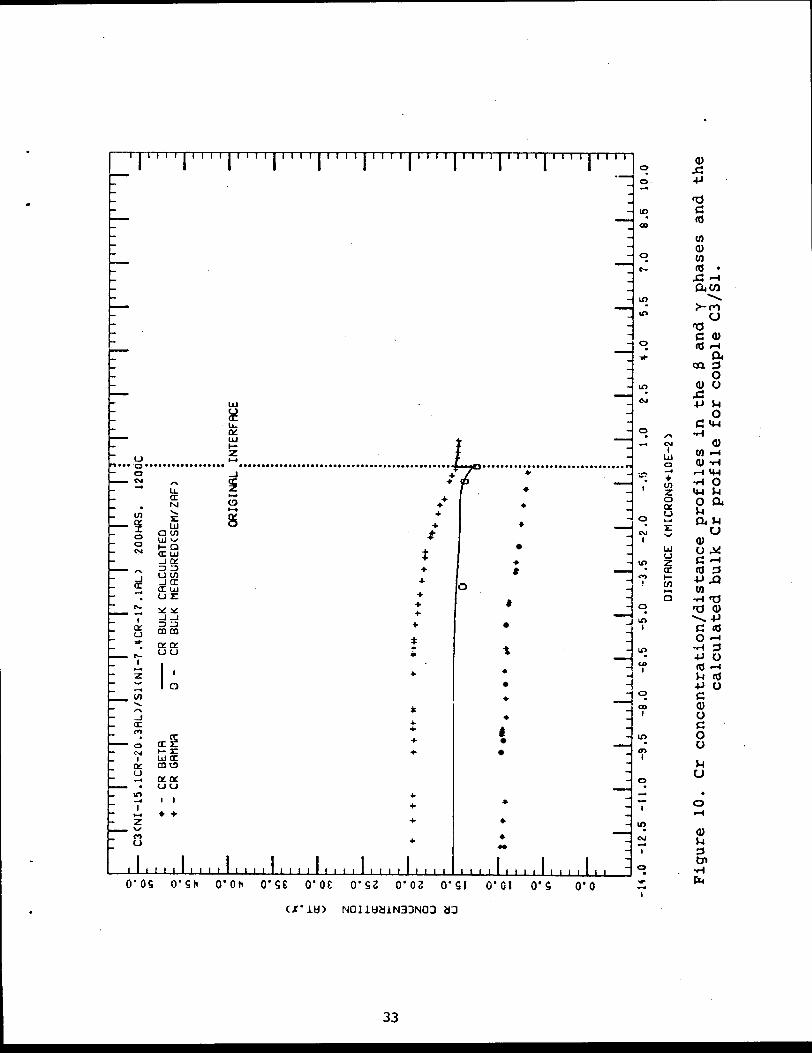
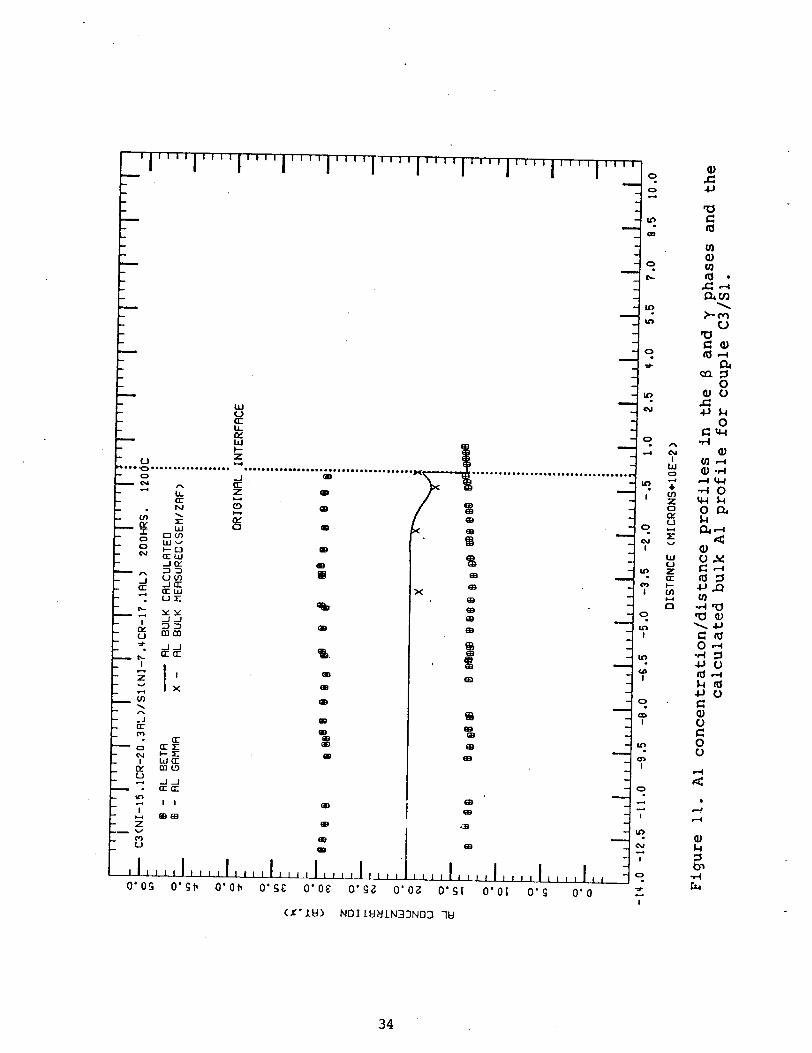
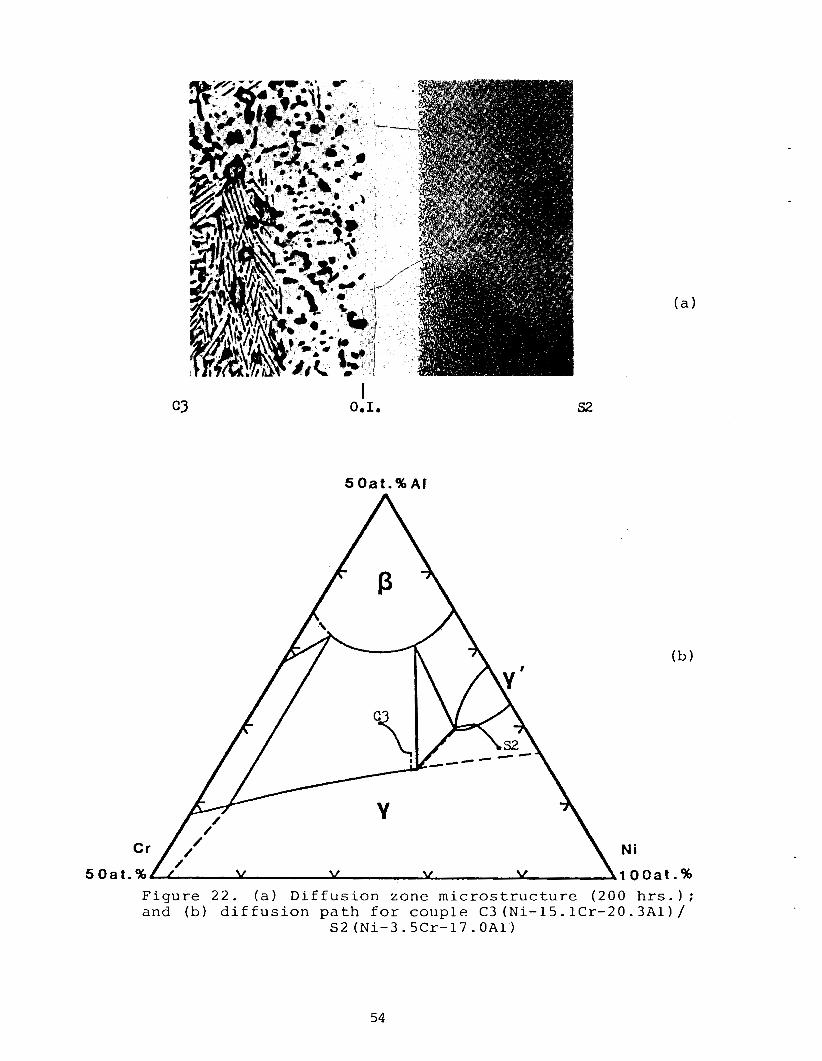
3. C3(Ni-lS.lCr-20.3Al)/Sl. I n t e r d i f f u s i o n r e s u l t e d i n growth
of y i n t o t h e y+y' a l l o y . The d i f f u s i o n zone, shown i n F i g u r e
9 , c o n s i s t s of t h e B+y a l l o y (C31, t h e y growth l a y e r , and t h e
y+y' a l l o y (Sl). C,/D p r o f i l e s f o r C r and A 1 i n t h e and y
phases, t h e y growth l a y e r , and t h e c a l c u l a t e d b u l k C r and A 1
C/D p r o f i l e s a re shown i n F i g u r e s 10 and 11, r e s p e c t i v e l y . Sim-
i l a r t o c o u p l e s C l / S l and C 2 / S 1 , t h e b u l k A 1 C/D p r o f i l e decreases
toward t h e 0.1. w h i l e t h e b u l k C r C /D p r o f i l e s t a y s r e l a t i v e l y
c o n s t a n t . The decrease i n b u l k A 1 c o r r e s p o n d s t o a r e d u c t i o n
i n t h e v; l i lme f r a c t i o n of f3 toward t h e 0.1.. A t d i s t a n c e s n e a r
t h e O.I., t h e b u l k Cr C / D p r o f i l e b e g i n s t o decrease and t h e
b u l k A 1 C / D p r o f i l e b e g i n s t o i n c r e a s e . The i n c r e a s e i n b u l k
A 1 c o r r e s p o n d s t o the f ac t t h a t a v e r y nar row f3+y l a y e r i s grown
31

s1
Ni
l o o a t . %
Figure 9. (a) Diffusion zone microstructure (200 hrs.) ; and ( b ) diffusion p a t h for couple C3 (Ni-15.1Cr-20.3Al)/
S1 (Ni-7.4Cr-17.1Al)
32
u 0 0 ru d
Y Y -1-1 33
ELI: u u
m a
I:, Ixk? b-x w u
W!cL uu I 1
* +
m w
............................ + + + f. I t + + + + + + * x +
t c + + +
L
+ + +
3
Y
............................... * 4
0
4
+ 2
*
t 0
4
4
+
+ 4
4 +.
*m W a
C Q , a 4 a -1 0
Q,u c 4 J k
0 C W
33
t 0 ' 0 s O ' S C O ' O C O ' S E O ' O E O ' S Z 0 ' 0 2 O'SI 0'01 0.s 0'0 d
1
( X ' l t J ) NOIlkjliLN33N03 8J
a c a
I\
N I
W 0 d
- . aJ r n d
t- z n
34

a t t h e 0.1.. The l a y e r c a n be s e e n as p e r t u b a t i o n s of B i n t o
t h e y growth l a y e r a t t h e 0.1.. The volume f r a c t i o n of B c h a n g e s
from a p p r o x i m a t e l y 20 vo l .% on t h e B+y s i d e of t h e 0.1. (--2Own)
t o 35 vo l .% a t t h e O.I., and t h i s volume f r a c t i o n change i s re-
f l e c t e d i n t h e i n c r e a s e o f t h e b u l k A 1 C/D p r o f i l e . A t t h e 0.1.
t h e b u l k C r C / D p r o f i l e d i s c o n t i n u o u s l y i n c r e a s e s and becomes
c o i n c i d e n t w i t h t h e C r c o m p o s i t i o n i n t h e y growth l a y e r . L ike-
w i s e a t t h i s p o i n t , t h e b u l k A 1 C / D p r o f i l e d i s c o n t i n u o u s l y de-
creases and becomes; c o i n c i d e n t w i t h t h e A 1 c o m p o s i t i o n i n t h e y
growth l a y e r .
The d i f f u s i o n path, shown i n F i g u r e 9 , shows some s i m i l a r f e a -
t u r e s i n t h e B+y p h a s e f i e l d t o t h e p a t h s of c o u p l e s C l / S l a n d C 2 / S 1 .
F i r s t , t h e b u l k A 1 decreases w h i l e t h e b u l k C r s t a y s r e l a t i v e l y
c o n s t a n t . Second, t h e p a t h does r ise l i k e t h e o t h e r p a t h s be-
c a u s e a B+Y l a y e r ;is grown a t t h e 0.1. P a s t t h e r i s i n g segment
o f p a t h though, t h e s imi l a r f e a t u r e s i n pa ths s t o p . A t t h e O.I.,
t h e v e r y nar row B+y g r o w t h l a y e r changes d i s c o n t i n u o u s l y i n t o a
Y growth l a y e r .
phase boundary ( r e p r e s e n t e d by a dashed l i n e ) and p r o c e e d s t o
The p a t h t h u s fol lows a t i e l i n e t o t h e Y / B + Y
. f o l l o w t h e y/B+y p h a s e boundary toward t h e y c o r n e r of t h e B+y+y'
t r i a n g l e . The p o i n t where t h e p a t h fo l lows t h e t i e l i n e corres-
ponds t z +he p o i n t where t h e b u l k C r C / D p r o f i l e d i s c o n t i n u o u s l y
i n c r e a s e s and t h e b u l k A 1 C / D p ro f i l e d i s c o n t i n u o u s l y decreases,
both becoming c o i n c i d e n t w i t h t h e i r r e s p e c t i v e c o n c e n t r a t i o n s
i n t h e y growth l a y e r . Thus t he b u l k C r and A 1 d i s c o n t i n u i t i e s
35

simply correspond to a discontinuous transition from B+y to y in
the couple. At the y corner of the B + Y + Y ' triangle, the path
proceeds up the y+y' side and exits into the Y+Y' phase field at
the same point where the paths of couples Cl/Sl and C2/S1 exited
the triangle. (These points were determined by measuring the Y'
volume fraction at the three-phase interface.) The path then
cuts tie lines until it reaches the composition.
4 . C4(Ni-26.4Cr-17.1Al)/Sl. Interdiffusion resulted in reces-
sion of B in the B+y alloy (i.e., the B phase dissolved at the
O . I . , creating a y layer which thickened with time of interdif-
fusion) and growth of B+y into the y+y' alloy. The diffusion
zone, shown in Figure 12, consists of the B+y alloy (C4), a y
phase layer (which resulted from the B recession), the B+y growth
layer, and the y+y' alloy (Sl). C/D profiles for Cr and A1 in
the B and y phases, and the calculated bulk Cr and A1 C/D pro-
files are shown in Figures 13 and 14, respectively. The behavior
of this couple is similar to the behavior of couples CL/S1 and
C2/S1 in that a @+y growth layer resulted from interdiffusion.
The B+y growth layer formed at the expense of the B phase in
. B+Y alloy. C/D profiles in the B and y phases in the B+y alloy
showed no concentration gradients. Only at the B+y alloy/y
interface (i.e., at the start of the y layer that resulted from B
recession) did the C/D profiles start to show concentration gra-
dients. The bulk Cr and A1 C/D profiles likewise were constant
in the B+y alloy. Similar to couple C3/S1, at the B+y alloy/y
interface, the bulk C/D profiles show discontinuities - the Cr
36

6 O a t .
S O a t . % A l
si
Ni
1 O O a t .%
Figure 12. (a) Diffusion z o n e microstructure (200 hrs.) : and (b) diffusion path for couple C4 (Ni-26.4Cr-17.1Al)/
S1 (Ni-7.4Cr-17.lAl)
37

t i++ + + + +t
it
+
+
+
4
4
* ' 4
4
j 0.0s O ' S t r O ' O C O ' S E O ' O E O ' S Z 0 ' 0 2 0 . S i 0 '01 0's 0 ' 0 d
I
38

Q) c +,
3- I
F
F 9 pc.
v! VI
0 t
-4 a Q ) I L O + J u
I 8
m
99
m 88
......a ................................. 1 v! (u w 0 LL oi W I- Z
a
Y ... .............. h
:: ......... * c3
.... .... , .......... ,. L" I
~
W n LL
N
.-I
a L .
e W W z e v)
a a Y
0 B e,
ca, O + , d l d : J-l L h ==
C 0 0 B
3 rn I I I I 1 I I I I I I I I I I I
0 ' 0 s O ' S b O ' O C O ' S E 0'06 O ' S Z 0 ' 0 2
-d r4
I .
39

increases and becomes coincident with the Cr concentration in
the y layer, and the A1 decreases and becomes coincident with
the A1 concentration in the y layer. These discontinuities sig-
nify that the diffusion path is following a tie line in the B+y
phase field to the y/@yphase boundary. This can be seen in
the diffusion zone as a discontinuous change in B volume fraction
from approximately 30 vol.% in the @+y alloy to 0 vol.% in the y
layer.
The bulk C/D profiles stay coincident with they phase con-
centrstions in the y layer until slightly past the 0.1. (+40~m)
at which point they again change discontinuously. The bulk Cr
C/D profile decreases while the bulk A1 C/D profile increases.
These discontinuities arise from the formation of the B+y growth
layer at the 0.1. They signify that, at the y/B+y growth layer
interface, the diffusion path is proceeding from the y/B+yphase
boundary into the B+y phase field along a tie line. In the
B + ~ growth layer, the volume fraction of B remains constant and
this leads to a relatively constant bulk A1 C/D profile. The
bulk Cr C/D profile continues to decrease in the B+y growth
. layer.
The diffusion path, shown in Figure 12, reflects the changes
that occur in the diffusion zone microstructure and the C/D pro-
files. The dashed line from the bulk composition of alloy C4
to the y/B+y phase boundary reflects the B+y alloy/y interface
in the diffusion zone, and the first discontinuity in the bulk
Cr and Ai C/D profiles. During interdiffusion, the B phase dis-
40

solves i n t h e f3+y a l l o y , c r e a t i n g a y l a y e r and a B+y a l l o y / y
i n t e r f a c e . T h i s i n t e r f a c e , b e i n g p l a n a r , and t h e f a c t t h a t no
c o n c e n t r a t i o n g r a d i e n t s are p r e s e n t i n t h e f3 and y p h a s e s u p t o
t h e f3q a l loyJy i n t e r f a c e , means t h e d i f f u s i o n p a t h p r o c e e d s
f r o m t h e b u l k c o m p o s i t i o n o f a l l o y C4 t o t h e y/f3+y p h a s e boundary
a l o n g the e q u i l i b r i u m t i e l i n e of a l l o y C 4 . The p a t h p r o c e e d s
a l o n g t h e y/f3+y p h a s e boundary and t h e n f o l l o w s a t i e l i n e (rep-
r e s e n t e d by a n o t h e r dashed l i n e ) i n t o t h e B + y p h a s e f i e l d . The
p a t h p r o c e e d s t h r o u g h t h e B 4 - y p h a s e f i e l d and e n t e r s t h e B + y + y '
t r i a n g l e a t a lower A 1 c o m p o s i t i o n t h a n c o u p l e s C l / S l and C 2 / S 1 .
The p a t h e x i t s t h e t r i a n g l e on t h e y+U' s i d e a t t h e same A 1 com-
p o s i t i o n where t h e o t h e r c o u p l e s i n t h e series e x i t e d t h e t r i -
a n g l e . I t t h e n c u t s t i e l i n e s and e n d s a t t h e b u l k c o m p o s i t i o n
of a l l o y S1.
5. G r o w t h Layer K i n e t i c s . Measured f3+y growth f o r c o u p l e s
C l / S 1 , C2/S1 and C4,/S1, and measured y growth f o r c o u p l e C3/S1,
a l l v e r s u s t i m e , a re shown i n F i g u r e 15. The c u r v e s t h r o u g h t h e
da ta p o i n t s f o l l o w t h e e q u a t i o n :
where X r e p r e s e n t s t h e l e n g t h of t h e growth l a y e r , C i s a con-
s t a n t , t i s t i m e , and y is a n exponen t . I f p a r a b o l i c growth
k i n e t i c s p r e v a i l e d , y s h o u l d be e q u a l t o 0.5. Us ing s t a n d a r d
l i n e a r r e g r e s s i o n t e c h n i q u e s , t h e c o n s t a n t C and e x p o n e n t w e r e
c a l c u l a t e d f o r e a c h c o u p l e . The e x p o n e n t s r anged f r o m 0.37
41 -
A
0 -
0
07 0 -
0 -
0 0 - CD
9 -
n . 4
t W
I l l 1 I l l 1 1 1 1 1 I I I I
- - -
- + - BETR+GAMMR GROWTH: C l / S 1 I
- + - BETA+GAMMA GROWTH: C 4 / S 1
- 8 - BETA+GAMMR GRO!JTH: C 2 / S 1 - -
- -
e - GAMMA GROWTH : C 3 / S 1 - - - - - - -
- -
W 0 z U
0 - - 0 -
cc. - -
0 -
0 0 - CD
- - - - - - - -
- 0 -
0 0 - Lo
- - - - - - -
- 0 -
0 0 -
- - - - - - - -
I- <n 0 Y
C l / S l , vs.
42

(C2/S1) t o 0.47 ( C l / S l ) . Comparing t h e data a t 200 h o u r s , it
c a n be s e e n t h a t C l / S l had t h e l a r g e s t B+y growth l a y e r (650vm1,
followed b y C2/S1 (360pm) and C4/S1 (330vm). The amount of
growth o f t h e y l a y e r a t 200 h o u r s i n c o u p l e C3/S1 w a s much less
t h a n t h e amount of B+y growth a t 200 h o u r s i n e a c h of t h e o t h e r
c o u p l e s .
S e r i e s 2 . C1, C2,, C3, C4/S2 (Ni-3.5Cr-17.OAl)
1. Cl/S2. I n t e r d i f f u s i o n r e s u l t e d i n t h e f o r m a t i o n o f t w o
l a y e r s : a B+y growth l a y e r and a y ' growth l a y e r . The d i f f u -
s i o n zone, shown .in F i g u r e 16 , c o n s i s t s of t h e B+y a l l o y ( C l ) ,
t h e B+y growth lalqer, t h e y ' growth l a y e r , and t h e y+y ' a l l o y
( S 2 ) . The d i f f u s i o n zone of t h i s c o u p l e i s s i m i l a r t o t h e d i f f u -
s i o n zone of c o u p l e C l / S l e x c e p t t h a t a y ' l a y e r a l so r e s u l t s
f m m i n t e r d i f f u s i o n . C / D p r o f i l e s fo r C r and A 1 i n t h e B , y ,
and y ' p h a s e s , and t h e c a l c u l a t e d b u l k C r and A 1 C / D p r o f i l e s
are shown i n F i g u r e s 1 7 and 18, r e s p e c t i v e l y . The C / D p r o f i l e s
i n t h e p h a s e s and t h e b u l k C / D p r o f i l e s are s i m i l a r t o t h o s e of
c o u p l e C l / S l . Thle s h a r p decrease i n t h e b u l k C r C /D p r o f i l e and
t h e s h a r p i n c r e a s e i n t h e b u l k A 1 C / D p r o f i l e a t d i s t a n c e s n e a r
t h e 0.1. r e s u l t s f rom a n almost d i s c o n t i n u o u s change o f B volume
f r a c t i o n from 38 v o l . % i n t h e B+y a l l o y , n e a r t h e O.I., t o 4 8
vo l .% a t t h e s t a r t of t h e B+y growth l a y e r . T h e 6 volume frac-
t i o n i s less n e a r t h e 0.1. i n t h i s c o u p l e t h a n i n c o u p l e C l / S l .
I n t h e B+y growth l a y e r t h e volume f r a c t i o n of B i n c r e a s e s o v e r
t h e f i r s t 150pm f r o m 4 8 vol.% t o 66 vo l .% and t h e n r ema ins con-
43

c1 I 0.1 .
S O a t . % A t
6 0 a t .
s2 (a)
Ni l ooat .%
F i g u r e 1 6 . ( a ) D i f f u s i o n zone m i c r o s t r u c t u r e (200 h r s . ) ; and ( b ) d i f f u s i o n p a t h f o r c o u p l e C 1 (Ni-20.OCr-24.1Al)/
S 2 (Ni-3.5Cr-17.OAl)
44

n
I 45
cu W 0 d
d k V
W u Z 0: t
0 2
3 tF

a E: (d
h N I
W 0
Y
5
46

s t a n t up t o t h e B+y/y ' i n t e r f a c e . Thus, t h e b u l k A1 C/D profile
does i n c r e a s e i n t h e B+y growth l a y e r and t h e n levels off to a
c o n s t a n t v a l u e . A t t h e B+y/y ' i n t e r f a c e t h e b u l k C r and A1 C/D
p r o f i l e s change d i s c o n t i n u o u s l y and become c o i n c i d e n t w i t h t h e i r
r e s p e c t i v e c o n c e n t r a t i o n s i n t h e y ' growth l a y e r . The C r con-
c e n t r a t i o n i n t h e y ' l a y e r decreases s h a r p l y i n i t i a l l y and t h e n
l e v e l s o f f . The A 1 c o n c e n t r a t i o n i n t h e y ' l a y e r i n c r e a s e s
s l i g h t l y over t h e same d i s t a n c e .
The d i f f u s i o n p a t h , shown i n F i g u r e 1 6 , h a s s imi l a r f e a t u r e s
i n t h e B+y p h a s e f i e l d t o t h a t of c o u p l e C l / S l . The b u l k A1 de-
creases f i r s t w h i l e t h e b u l k C r s t a y s r e l a t i v e l y c o n s t a n t . The
decrease i n b u l k A 1 i s grea te r i n t h i s c o u p l e t h a n i n c o u p l e C1/
S1 b e c a u s e t h e vo'lume f r a c t i o n of B n e a r t h e 0.1. i s less t h a n
t h e volume f r a c t i o n of (3 n e a r t h e 0.1. i n c o u p l e C l / S l . The p a t h
i n t h e ~ + y p h a s e f i e l d s t a y s "V" shaped l o n g e r t h a n t h e p a t h
f o r c o u p l e C l / S 1 b e c a u s e t h e volume f r a c t i o n o f f3 i n c r e a s e s i n
t h e B + Y g rowth l a y e r over t h e f i r s t 150pm. Only i n a p p r o x i m a t e l y
t h e l a s t 200pm of t h e B+y growth l a y e r does t h e volume f r a c t i o n
of f3 remain c o n s t a n t and t h u s t h e p a t h does n o t l e v e l off as
f a s t as i t d i d f o r c o u p l e C l / S l .
The pa th e n t e r s t h e B+y+y' t r i a n g l e a t a h i g h e r A 1 composi-
t i o n t h a n t h e p a t h of C l / S l . T h i s is b e c a u s e t h e volume f r a c -
t i o n o f f3 i s g r e a t e r a t t h e t h r e e - p h a s e i n t e r f a c e i n t h i s
c o u p l e , t h a n i n C l / S l . As t h e p a t h moves t h r o u g h t h e t r i a n g l e
( r e p r e s e n t e d by a dashed l i n e which i n d i c a t e s a n i n t e r f a c e of
no s p a t i a l e x t e n t ) t h e c o m p o s i t i o n s of C r and A 1 m u s t change
47
!

discontinuously. These discontinuous changes in composition can
be seen in the bulk Cr and A1 C/D profiles at the B+y/y' inter-
face. (It should be noted that the couples of Series 1 also
show discontinuities in bulk composition at the B + Y / Y + Y ' inter-
face present in the couples. These were not shown in the C/D
figures because bulk compositions in the Y+Y' alloy were not
determined.) The path exits the triangle into the y' phase field.
In the phase field the path increases in A1 composition
slightly, while the Cr composition continues to decrease. At
the y ' /y+y ' interface in the couple, the path exits the Y' phase
field into the y t y ' phase field and cuts tie lines (as seen by
a gradual reduction in the volume fraction of Y' away from the
y ' / y + y ' interface in Figure 16) until it reaches the composition
of s2.
2. C2/S2. Interdiffusion resulted in a similar diffusion zone
microstructure to couple C1/S2 - consisting of the B+Y alloy
(C2), B+y growth, y' growth, and the y+y' alloy (S21, as shown
in Figure 19. C/D profiles for Cr and A1 in the 6, Y, and Y'
phases, and the calculated bulk Cr and A1 C/D profiles are shown
in Figures 20 and 21, respectively. The C/D profiles in the
B + ~ regions are similar to those of couple C2/S1.
C/D profile shows similar behaviclr to the bulk A1 C/D profile
of C2/S1, but two differences can be noted. First, it decreases
to slightly lower values near the 0.1. because the reduction in
the volume fraction of B is slightly greater near the 0.1..
The bulk A1
48

c2 I
0.1.
5 0 a t . % A I
Ni
1 O O a t . %
Figure 14. (a) Diffusion zone microstructure (200 hrs.) ; and (b) diffusion path for couple C2(Ni-l5.3Cr-23.9Al)/
S2 (Ni-3.5Cr-17. OAl)
49

50

€- I , ,
m (D
e,
51

Second, it increases sharply and levels off to a higher A 1 com-
position because the volume fraction of 8 in the B+y growth layer
is higher. At the B+y/y' interface the bulk Cr and A1 C/D pro-
files change discontinuously and become coincident with their
respective concentrations in the y l growth layer.
The diffusion path shown in Figure 19, exhibits a "V" shape
similar to that of couple Cl/S2. Comparing the section of path
in the B+y field to that of couple C2/S1 shows that the path de-
C r e a s e s t o s l i g h t l y l o w e r A l compositions in the first segment and
then rises and enters the B+y+y' triangle, at a higher A1 com-
position - both facts in accord with the differences found be- tween the bulk A1 C/D profiles of the two couples. The constant
A 1 composition segment of path, which was large in couple C1/S1
and C2/S1, is very small, if nonexistent, in this couple. The
volume fraction of 8 changes discontinuously from 42 vol.% on
the B+y alloy side of the 0.1. to 4 9 vol.% on the B+y growth
layer side of the 1.0.. The volume fraction of B continues
to increase from 49 vol.% to 59 vol.% at 150um in the B+y growth
layer. Past 150um, the volume fraction of B remains constant.
Because of the constant B volume fraction, the bulk A 1 composi-
tion remains constant past 150um. The bulk Crcomposition past
150um changes little and is very near the Cr compasition at the
B+y side of the B+y+y' triangle. Thus, although the bulk A1
stays constant over the last 1 0 0 ~ of the B+y growth layer, when
. plotted with the bulk Cr compositions on the phase diagram, it
52
t r a n s l a t e s t o a v e r y s m a l l p a t h segmen t of c o n s t a n t A 1 composi-
t i o n .
The p a t h e x i t s t h e t r i a n g l e i n t o t h e Y' p h a s e f i e l d . The
p a t h segment t h r o u g h t h e y' p h a s e f i e l d i s t h e same as t h e p a t h
segment t h r o u g h t h e )' p h a s e f i e l d i n c o u p l e Cl/S2. I t e x i t s
t h e p h a s e f i e l d i n t o t h e y+y' p h a s e f i e l d a t t h e same C r and
A 1 c o m p o s i t i o n where t h e p a t h of C1/S2 e x i t e d t h e u' phase f i e l d .
The p a t h t h e n c u t s , t i e l i n e s i n t h e y + y ' p h a s e f i e l d u n t i l it
r e a c h e s t h e b u l k c o m p o s i t i o n o f a l l o y S2.
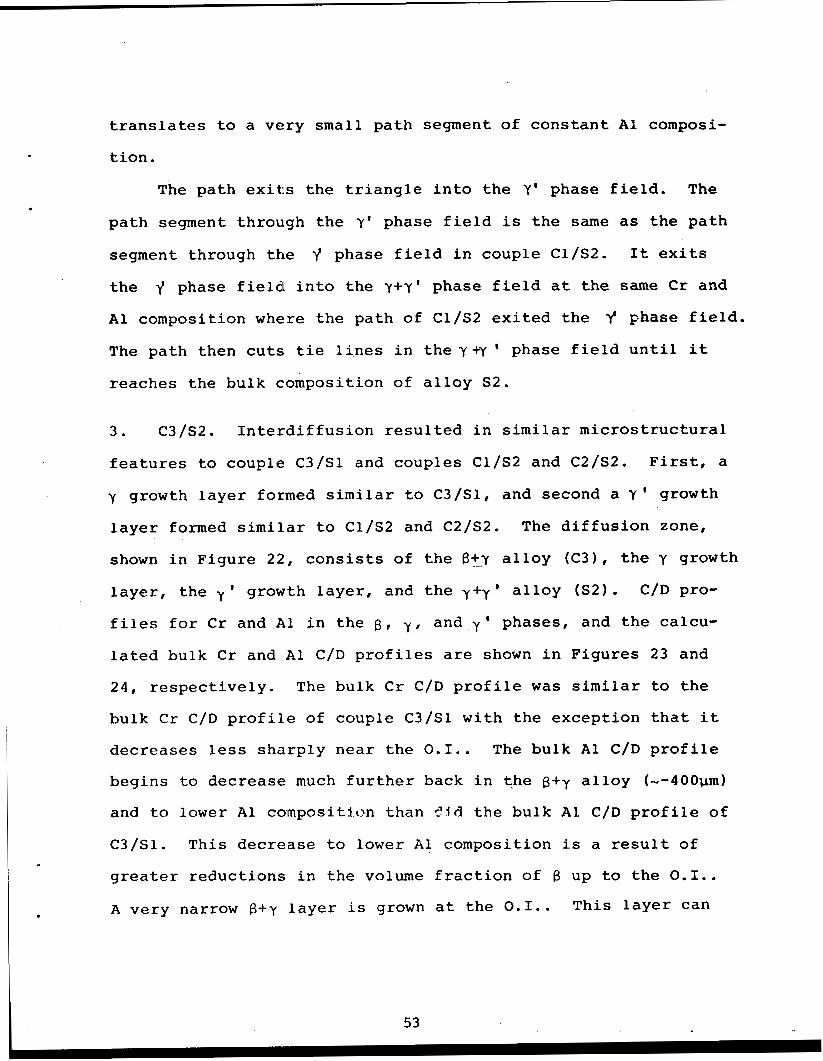
3 . C3/S2. I n t e r d i f f u s i o n r e s u l t e d i n s i m i l a r m i c r o s t r u c t u r a l
f e a t u r e s t o c o u p l e C3/S1 and couples Cl/S2 and C2/S2. F i r s t , a
y growth l a y e r formed s i m i l a r t o C3/S1, and second a Y' growth
l a y e r formed s imi l a r t o C1/S2 and C2/S2. The d i f f u s i o n zone ,
shown i n F i g u r e 22, cons is t s of t h e B+_u a l l o y (C31, t h e y growth
l a y e r , t h e y' growth l a y e r , and t h e y+y' a l l o y ( S 2 ) . C/D pro-
f i l e s f o r C r and A 1 i n t h e B , y , and y' p h a s e s , and t h e calcu-
l a t e d b u l k C r and A 1 C/D p r o f i l e s are shown i n F i g u r e s 23 and
2 4 , r e s p e c t i v e l y . The b u l k C r C /D p r o f i l e w a s s i m i l a r t o t h e
b u l k C r C /D p r o f i l e of c o u p l e C3/S1 w i t h t h e e x c e p t i o n t h a t it
decreases less s h a r p l y n e a r t h e 0.1.. The b u l k A 1 C/D p r o f i l e
b e g i n s t o d e c r e a s e much f u r t h e r back i n t h e B+Y a l l o y (--400vm)
and t o lower A 1 c o m p o s i t i o n t h a n :.id t h e b u l k A 1 C/D p r o f i l e of
C3/S1. T h i s d e c r e a s e t o l o w e r A 1 c o m p o s i t i o n i s a r e s u l t of
greater r e d u c t i o n s i n t h e volume f r a c t i o n of B up t o t h e 0.1..
A v e r y nar row B+y l a y e r is grown a t t h e 0.1.. T h i s l a y e r can
53
c3
5 0 a t .
I 0.1.
5 O a t . % A t
Ni
l o o a t . % Figure 22. (a) Diffusion zone microstructure (200 hrs.) ; and ( b ) diffusion path for couple C3 (Ni-15.1Cr-20.3Al)/
S2 (Ni-3.5Cr-17. OAl)
54

L .
+ 3 + + + + +
4
+
4
~ I 4
9 a> I
v! as I
0 Ifl , , , , I I , , , I I I I , , i i I I I I , , I , , , I cv I - m +
u
* 0'0s O ' f L O ' O b O ' S C O ' O E O ' S Z 0 ' 0 2 O ' S I 0'01 O'S 0'0 - l
c @a) u s c u 0 W
& V
55

u U
0 -f Q,
ru U . - a n z
...'O.................. ................................ F4 U
LL U
m . N
g 2 0 E?? I W
aul JIY e,
2 -1a
3 b - 0
h
m u c')
9 sk! m i (D
m
* I
0 . 0 5 O ' S C O ' O C O ' S E O ' O E O ' S Z 0'31 G'SI 0'01 9.s 0'0 - ( X ' l U ) N O I l W L N 3 3 N 0 3 7 3
56

be seenaspertubations of 8 into the y growth layer at the 0.1,.
However, the volume fraction of B at the 0.1. is similar to the
volume fraction o f 8 near the 0.1. in the B+y alloy (0 to - S o p ) ,
and thus the bulk A1 C/D profile does not increase at the O . I - .
At the f3+y/y growth layer interface, the bulk Cr C/D pro-
file increases discontinuously and becomes coincident with the
Cr concentration in the y growth layer. Likewise the bulk A1
C/D profile decreases discontinuously and becomes coincident with
the A1 concentration in the y growth layer. The bulk composi-
tions stay coincident with the y growth layer concentrations
until the y/y' interface at which point they again change dis-
continuously. The bulk Cr decreases almost 7.0 at.% and becomes
coincident with t:he Cr concentration in the y' growth layer.
The bulk A1 incre(ases 5.0 at.% and hecomes coincident with the
A 1 concentration in the y' layer. The presence of the y/y' in-
terface in the couple, and the bulk composition discontinuities
at the interface, signify the diffusion path is moving up the
y-ry' side of the B+y+y' triangle from the y corner to the y'
corner.
The diffusion path, shown in Figure 22, has some similar
features in the B , + ~ phase field to the path of C3/Sl.
A1 decreases first, and to lower A1 composition than the same
The bulk
path segment in C3/S1. The path levels off slightly in A1 com-
position because (of a relatively constant 8 volume fraction
from -50um to the 0.1. in the couple. At the O . I . , the narrow
57
B+y growth layer changes discontinuously into a y growth layer,

a n d t h u s t h e p a t h fo l lows a t i e l i n e i n t h e B+y p h a s e f i e l d t o
t h e y/B+y p h a s e boundary. The p a t h fo l lows t h e y/B+y p h a s e boun-
d a r y t o t h e y c o r n e r of t h e B+y+y' t r i a n g l e , a t which p o i n t it
proceeds u p t h e y+y' s i d e t o t h e y' c o r n e r . I n t h e y ' -phase
f i e l d , t h e p a t h i s t h e same as fo r t h e o t h e r c o u p l e s i n t h e
series. L i k e w i s e , the C r - a n d A 1 c o m p o s i t i o n s a t t h e y'/y+y' i n -
terface are t h e same as t h e o t h e r c o u p l e s i n t h e series. T h i s
s i m i l a r i t y i n c o m p o s i t i o n s means t h e p a t h e x i t s t h e y' p h a s e
f i e l d i n t o t h e y+y' p h a s e f i e l d a t t h e same p o i n t where t h e
paths of t h e o the r c o u p l e s e x i t e d t h e y' p h a s e f i e l d . The p a t h
t h e n c u t s t i e l i n e s i n t h e y+y' p h a s e f i e l d u n t i l it r e a c h e s t h e
c o m p o s i t i o n of S2.
4.' C 4 / S 2 . I n t e r d i f f u s i o n r e s u l t e d i n a s i m i l a r d i f f u s i o n zone
m i c r o s t r u c t u r e t o c o u p l e C 4 / S 1 , w i t h t h e a d d i t i o n o f a y' growth
l a y e r . The d i f f u s i o n zone, shown i n F i g u r e 25, c o n s i s t s of t h e
B+y a l l o y ( C 4 ) , a y l a y e r which r e s u l t e d from r e c e s s i o n of 6,
t h e B+y growth l a y e r , t h e y' growth l a y e r , and t h e y+y' a l l o y
( S 2 ) . C /D p r o f i l e s fo r C r and A 1 i n t h e 6, y, and y' p h a s e s ,
and t h e c a l c u l a t e d b u l k C r and A 1 C/D p r o f i l e s are shown i n
F i g u r e s 2 6 and 27, r e s p e c t i v e l y . The C/D p r o f i l e s show v e r y
s ' i m i l a r b e h a v i o r t o t h o s e of c o u p l e C 4 / S l .
p ro f i l e s i n the B and y p h a s e s , and the b u l k C r and A 1 C I S p r c -
f i l e s are c o n s t a n t up t o t h e B+y a l l o y / y i n t e r f a c e . A t t h e B+y
a l l o y / y i n t e r f a c e , t h e C r and A 1 c o n c e n t r a t i o n s i n t h e y l a y e r
b e g i n t o e x h i b i t c o n c e n t r a t i o n g r a d i e n t s . The b u l k C r and A 1
The er and AI C / D
58

5 0 a t
I 0.1.
5 O a t . % A t
Cr
.%L Ni i O O a t . %
F i g u r e 25.. ( a ) D i f f u s i o n p a t h m i c r o s t r u c t u r e (200 h r s . ; a n d (b) d i f f u s i o n p a t h f o r c o u p l e C 4 (Ni-26.4Cr-17.1A111
S2 (Ni-3.5Cr-17. O A l )

L +
* +
+ ! # * + + $
*
4
4 +
4
+ 4
*
4
...
60

.
h
61
n
W 0
cv
4
5
0 u
4 d
r- N
Q) k

C/D profiles change discontinuously at the B+Y alloy/Y interface,
the Cr increases and becomes coincident with the Cr concentration
in the y layer while the A1 decreases and becomes coincident
with the A1 concentration in the Y layer. The bulk C/D profiles
stay coincident with the y layer concentrations until approxi-
mately +70.Oum at which point they change discontinuously again.
The bulk Cr C/D profile decreases while the bulk A1 C/D profile A
increases. In the B+y growth layer, the B volume fraction is F
greater than the B volume fraction in the 6+y growth layer of
couple C4/S1. Thus, the bulk A1 C/D profile is higher in the
B + r growth layer than in C4/S1. At the B+y/y' interface, the
bulk Cr and A1 C/D profiles again change discontinuously and
become coincident with the Cr and A1 concentrations in the Y'
growth layer. The Cr concentration decreases in the r' layer
while the A1 concentration increases slightly.
The diffusion path, shown in Figure 25, is very similar to
that of C4/S1. The path follows the equilibrium tie line of
alloy C4 from the bulk composition of alloy C4 to the y/B+Y .
phase boundary. This section of path is represented by the B + Y
alloy/y interface in the couple. The path proceeds along the
y/B+y phase boundary and then follows a tie line into the B + Y
phase field. This tie line section of path is represented by
the y/B+y growth layer interface in the couple. The path fol-
lows the tie line to higher A1 composition than did C4/S1, be-
cause the @ volume fraction is greater in the f3+y growth layer
than in C4/S1. Because of a higher B volume fraction the path
62

.
a l so e n t e r s t h e B+y+y' t r i a n g l e a t a h i g h e r A 1 compos i t ion t h a n
. d i d C4/S1. The p a t h e x i t s t h e t r i a n g l e i n t o t h e y ' phase f i e l d .
The s e c t i o n o f p a t h th rough t h e y ' phase f i e l d , and y + y ' p h a s e
f i e l d , t o t h e c o m p o s i t i o n o f S2, i s t h e same as f o r t h e o t h e r
c o u p l e s i n t h e series.
5 . Growth Layer K i n e t i c s . Measured B+y growth f o r c o u p l e s
Cl /S2, C2/S2, and C4/S2, and m e a s u r e d y growth f o r c o u p l e C3/S2,
a l l v e r s u s t i m e , are shown i n F i g u r e 28. Measured Y ' g rowth
v e r s u s t i m e f o r a l l c o u p l e s i n t h e series i s shown i n F i g u r e 29.
Exponents f o r t h e c u r v e s t h r o u g h t h e B+y growth d a t a p o i n t s i n
F i g u r e 2 9 ranged from 0.37 (C2/S2) t o 0 . 4 2 ( C l / S 2 ) . Exponents
f o r t h e c u r v e s t h r o u g h t h e y ' g rowth d a t a p o i n t s i n F i g u r e 2 9
ranged from 0.54 (C3/S2) t o 0.79 ( C l / S 2 ) . Comparing t h e B + Y
g rowth a t 200 h o u r s i t can b e s e e n t h a t C1/S2 had t h e l a rges t
B+y growth l a y e r ( 4 6 5 ~ 1 , f o l l o w e d by C2/S2 (268pm) and C4/S2
(170pm) . The growth o f t h e y l a y e r a t 2 0 0 h o u r s i n c o u p l e C3/S1
w a s a p p r e c i a b l y less t h a n t h e amount o f B + Y g rowth a t 200 h o u r s
i n e a c h o f t h e o t h e r c o u p l e s . Comparing t h e Y ' g rowth a t 200
h o u r s i t can be s e e n t h a t C3/S2 had t h e l a r g e s t y ' g rowth l a y e r
( 2 3 0 ~ m 1 , f o l l o w e d by C 4 / S 2 (190prn1, C2/S2 (170vm), and C1/S2
(135pm).
---- S e r i e s 3 . C 1 , C 2 , C3/S3 ( N i - 1 6 . 2 A l !
1. C1/S3. I n t e r d i f f u s i o n r e s u l t e d i n a s i m i l a r d i f f u s i o n zone I -
m i c r o s t r u c t u r e t o t h a t o f Cl /S2, w i t h t h e f o r m a t i o n o f a B+y
growth l a y e r and a y ' g rowth l a y e r . However, because a l l o y S3
63

z v
I- cn 0 H
9 4 - BETA+GAMMA GROWTH: C 1 / S 2
0 0) 8 - BETA+GAMMA GROWTH: C 2 / S 2
+ - BETA+GAMMA GROWTH: C 4 / S 2
9 @ - GAMMA GROWTH : C 3 / S 2
0
0 0 00
2 0 0 CL
9 0 0 CD
9 0 0 Ln
0
0 0 f
0
0 0 0
9 0 0 cu
0
0 0 4
0 .o 100 .o 200 .o 300 .O 1100 .o
T I M E (HRS.1
F i g u r e 2 8 . Measured B+y growth vs. t i m e f o r couples C l / S Z , C 2 / S 2 , and C 4 / S 2 , a n d m e a s u r e d
y g r o w t h vs. t i m e f o r c o u p l e C 3 / S 2 .
64

h
t- 0
0 H
T I M E (HRS.1
F i g u r e 2 9 . Measured y ' growth v s . t i m e f o r c o u p l e s C l / S 2 , C 2 / S 2 , C 3 / S 2 , and C 4 / S 2 .
65
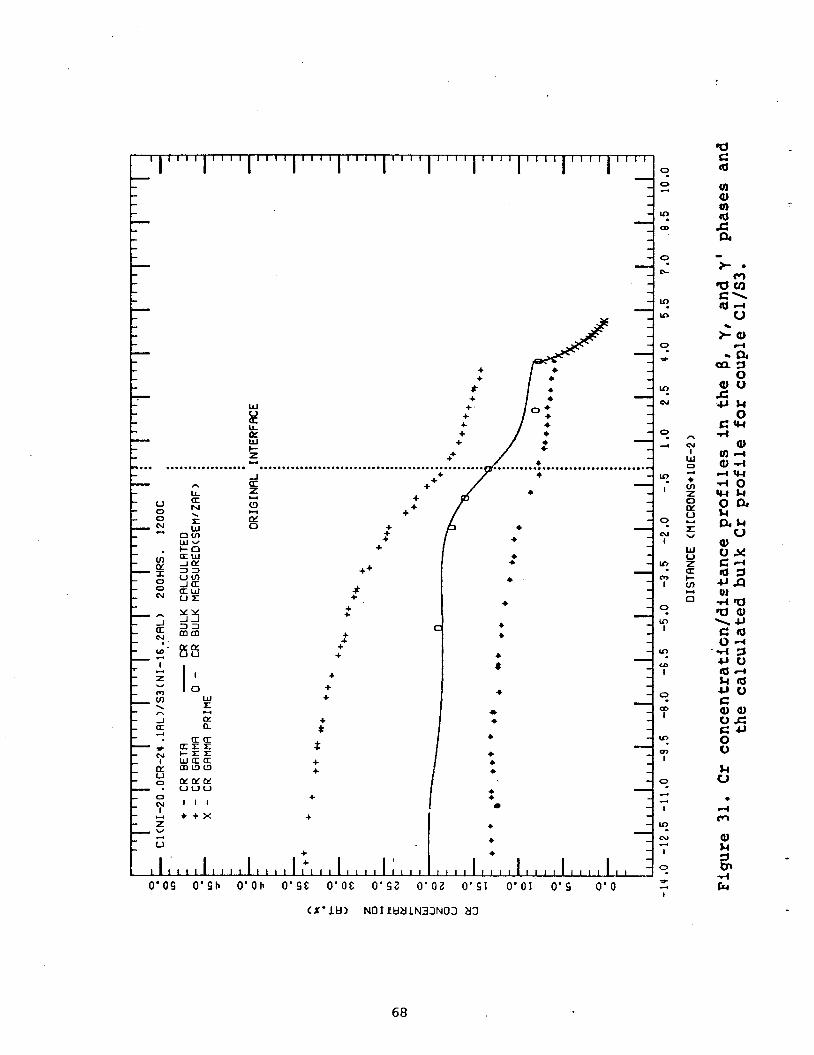
r e s u l t e d i n a y a l l o y a f t e r b e i n g c a s t and a n n e a l e d , and n o t a
y + y a l l o y , a y+y' zone i s a l s o p r e s e n t i n t h e m i c r o s t r u c t u r e .
The d i f f u s i o n zone m i c r o s t r u c t u r e , shown i n F i g u r e 3 0 , c o n s i s t s
o f t h e B + Y a l l o y ( C l ) , t h e B + Y g rowth l a y e r , t h e Y' growth l a y e r ,
t h e y+y ' l a y e r , and t h e y a l l o y ( S 3 ) . C / D p r o f i l e s f o r C r and
A1 i n t h e B, y, and y ' p h a s e s , and t h e calculated b u l k C r and A 1
C/D p r o f i l e s are shown i n F i g u r e 3 1 and 32 , r e s p e c t i v e l y . The
C / D p r o f i l e s i n t h e p h a s e s and t h e b u l k C / D p r o f i l e s e x h i b i t
s i m i l a r f e a t u r e s t o t h e p r o f i l e s o f c o u p l e s C l / S l and Cl/S2.
The b u l k C r C / D p r o f i l e d e c r e a s e s much more s h a r p l y a t d i s t a n c e s
n e a r t h e 0.1. t h a n i n C1/S1 and Cl/S2. L ikewise , t h e b u l k A 1
C/D p r o f i l e i n c r e a s e s s h a r p l y a t d i s t a n c e s n e a r t h e 0.1. and
t o h i g h e r c o m p o s i t i o n s t h a n i n C l / S l and Cl /S2 , b e c a u s e t h e
volume f r a c t i o n o f B i n t h e B+y growth l a y e r i s grea te r t h a n
t h e volume f r a c t i o n s o f B i n t h e B+y growth l a y e r s of C1/S1 and
Cl /S2 . At t h e B+y /y ' i n t e r f a c e t h e b u l k C r and A1 C / D p r o f i l e s
change d i s c o n t i n u o u s l y and become c o i n c i d e n t w i t h t h e C r and A1
c o n c e n t r a t i o n s i n t h e y' growth l a y e r . The C r c o n c e n t r a t i o n
d e c r e a s e s v e r y s h a r p l y i n t h e y ' l a y e r . The C r g r a d i e n t i n t h e
y ' l a y e r i s much h i g h e r t h a n t h e C r g r a d i e n t i n t h e Y' l a y e r
o f Cl /S2 . The A1 c o n c e n t r a t i o n i n t h e y ' l a y e r i n c r e a s e s q u i t e
s h a r p l y , and e x h i b i t s a l a r g e r g r a d i e n t t h a n i n t h e y ' l a y e r
o f C l / S 2 .
The d i f f u s i o n p a t h , shown i n F i g u r e 3 0 , i s v e r y s i m i l a r t o
t h e d i f f u s i o n p a t h o f Cl /S2 . I n t h e (3+y p h a s e f i e l d i t e x h i b i t s
t h e s a m e "V" s h a p e as t h a t o f Cl /S2 . The o n l y n o t e a b l e d i f f e r -
66

I 0.1.
S O a t . % A l
s3
Ni 1 O O a t .%
Figure 30. (a) Diffusion z o n e microstructure (200 hrs.) : and (b) diffusion path for couple Cl(Ni-20.0Cr-24.1Al)/
S3 (Ni-16.2A1)
c h
+ +
+ * * +
4
* 4
4 I . 4
I + +
4. + 4 I
4 Q3
1
L" oa I
0
a.
I 0 ' 0 s O ' S h O ' O b O ' S E O ' O E O ' S 2 0'02 O'SI 0'01 0's 0'0 d
(I'ltO NOIltlLILN33NOS XI
68

.
.
0 m m tD
as a3 W rn e, 0 (D (II L L OL W I- Z Y ID
J
m @
zl (D
a? e, e4 =rn Ft3 ............................................... ... .................. ................................
al W €e m m
n 9 2 8 Y
OL 0 m e,
m 03 c8
=
%I
63 68
I W m m
X
1 m
m
0 sal
0 alu c s
Lu
CD I & a
4 J u 9 1: al h j a ,
Y
us: c4J 0 u
I
Q) I
4 ' m
al k
69

erence i s t h a t i t e n t e r s t h e B+y+Y' t r i a n g l e a t a h i g h e r A 1 compo-
s i t i o n t h a n d i d Cl /S2 , b e c a u s e t h e volume f r a c t i o n of B i n t h e B+y
growth l a y e r i s h i g h e r t h a n t h e Bvolume f r a c t i o n i n t h e B+y growth
l a y e r o f Cl /S2 . The p a t h e x i t s t h e t r i a n g l e i n t o t h e y ' p h a s e f i e l d .
I n t h e y ' p h a s e f i e l d t h e p a t h i n c r e a s e s i n A1 c o m p o s i t i o n from
1 9 . 5 a t . % t o a p p r o x i m a t e l y 2 2 . 3 a t . % . T h i s s u b s t a n t i a l i n c r e a s e i n A 1
c o n c e n t r a t i o n i s r e f l e c t e d i n t h e i n c r e a s e o f t h e A 1 C / D p r o f i l e
i n t h e y ' growth l a y e r . Over t h i s same p a t h segment t h e C r de-
creases from 7.3 a t . % t o 0 . 5 a t . % . T h i s l a r g e d e c r e a s e i n C r
c o m p o s i t i o n l e a d s t o a la rge C r g r a d i e n t i n t h e y ' growth l a y e r .
The p a t h e x i t s t h e y ' p h a s e f i e l d i n t o t h e y k y ' p h a s e f i e l d ,
v e r y n e a r t h e N i - A 1 s i d e o f t h e p h a s e d iagram. I t c u t s t i e l i n e s
t h r o u g h t h e y t y ' p h a s e f i e l d (as s e e n i n t h e d i f f u s i o n zone by a
g r a d u a l r e d u c t i o n i n y' volume f r a c t i o n i n t h e Y+Y' l a y e r ) and
e x i t s t h e y t y ' p h a s e f i e l d i n t o t h e y p h a s e f i e l d where it r e a c h e s
t h e c o m p o s i t i o n o f a l l o y S3, on t h e N i - A 1 s i d e o f t h e p h a s e d i a -
gram.
2 . C2/S3. I n t e r d i f f u s i o n r e s u l t e d i n t h e same d i f f u s i o n zone
m i c r o s t r u c t u r e a s i n C1/S3 - c o n s i s t i n g of t h e B + Y a l l o y ( C 2 ) ,
t h e B+y growth l a y e r , t h e y ' g rowth l a y e r , t h e Y + Y ' l a y e r , and
t h e y a l l o y ( S 3 ) , as shown i n F i g u r e 33. C / D p r o f i l e s i n t h e
~ , y , an< y' p h a s e s , and t h e c a l c u l a t e d b u l k C r and A 1 C / D pro-
f i l e s are shown i n F i g u r e s 34 and 35, r e s p e c t i v e l y . The C/D
p r o f i l e s i n t h e p h a s e s , a n 6 t h e b u l k c / D p r o f i l e s e x h i b i t s i m i -
l a r b e h a v i o r t o t h e p r o f i l e s of c o u p l e s C2/S1 and C 2 / S 2 . The
b u l k A 1 C / D p r o f i l e rises t o h i g h e r c o m p o s i t i o n s i n t h e b+y
70

c2
71
J
I 0.1.
S O a t . % A l
Ni
1 O O a t . % F i g u r e 3 3 . ( a ) D i f f u s i o n z o n e m i c r o s t r u c t u r e ( 2 0 0 h r s . ) ; and ( b ) d i f y f u s i o n p a t h f o r c o u p l e C2 ( N i - 1 5 . 3 C r - 2 3 . 9 A l ) /
S3 ( N i - 1 6 . 2 A l )

I
a. C cd tn Q) tn Id c 91
0 u k V . m
Q) M 3 rn -d tk
72

5 c a
- 3 0
Q ) u
0 cwl 5 &
73

growth layer than it did in C2/S1 and C2/S2 because the volume
fraction of 8 is higher in the B+y growth layer. At the 8+y/y '
interface the bulk C/D profiles change discontinuously and be-
come coincident with the concentrations in the y ' growth layer.
The Cr concentration decreases rapidly in the y ' growth layer
while the A1 composition increases, similar to couple Cl/S3.
The diffusion path, shown in Figure 33, is very similar
to the diffusion path of C2/S2. The section of path in the B+y
phase field exhibits the same "V" shape as did the path section
in the B + r phase field in C2/S2. It enters the B+y+y ' triangle
at a higher A 1 composition than C2/S2 because the volume frac-
tion of B is higher in the B+y growth layer. The path exits
the triangle into the y ' phase field. The section of path
through the y' phase field, y+y ' phase field, and Y phase field,
to the bulk composition of S3, is the same as in C1/S3.
3. C3/S3. Interdiffusion resulted in different behavior than
couples C3/SI and C3/S2 exhibited in that a y layer did not grow
into alloy S3. Instead, recession of B occurred, although a Y'
growth layer and a y+y.' layer did form, similar to couples C1./S3
and C2/S3. The diffusion zone shown in Figure 36, consists of
the f3+y alloy (C3), a y layer which formed from B recession,
the y' gl.e:Jth layer, the y+y ' layer, arld the y alloy (S3). C/D
profiles in the B , y, and y' phases, and the calculated bulk Cr
and A1 C/D profiles are shown in Figures 37 and 38, respectively.
The bulk Cr C/D profile begins to decrease slightly in the B+y
74

6 O a t .
c3 1
0.1.
50at.96 A l
s3
Ni
100at .96
F i g u r e 3 6 . ( a ) D i f f u s i o n z o n e m i c r o s t r u c t u r e ( 2 0 0 h r s . ) ; a n d ( b ) d i f f u s i o n p a t h f o r c o u p l e C3 ( N i - l 5 . l C r - 2 0 . 3 A l ) / S 3 ( N i - 1 6 . 2 A l )
75

u 0 0 N H
+ + + +
+ + + +
+ + +
+ + + + + + + + +
t
4
4
4
4
4
+ 4
+ 4
+
4
4 6
f 0'09 0'41i O ' O C O ' S E O ' O t O ' S Z 0 ' 0 2 O ' S I 0 ' 0 1 0's 0'0 d
I
(I'ltl) N O I l I j M l N 3 3 N 0 3 83
* cu I
W 0
+ cn z 0 rL
-4
2 E W V z U t-
0 E
76

? Ln
Lo 4: CD
t
I 0 ' 0 5 O ' S b O'Ob O ' S E O ' O E O ' S Z 0'02 O'SI 0 ' 0 1 0's 0'0 -
< Z " l t i ) N O I l H k l l N 3 3 N 0 3 lkj
77

alloy at approximately -800um from the 0.1.. Likewise, the bulk
A1 C/D profile begins to decrease at the same distance. The
bulk Cr C/D profile decreases very slowly over the next 500vm
while the bulk A1 C/D profile decreases slightly faster over the
same distance. At -280pm the bulk C/D profiles change discontin-
uously and become coincident with the concentrations in the 8
layer. These discontinuities correspond to the diffusion path
following a tie line in the B+y phase field to the y/B+y phase
boundary. The bulk C/D profiles stay coincident with the con-
centrations in the y layer until the 0.1. at which point they
change discontinuously and become coincident with the concentra-
tions in the y' growth layer. These discontinuities correspond
to the diffusion path proceeding up the y+y' side of the B i - y i - y '
triangle from the y corner to the y' corner. In the y' growth
layer the Cr concentration decreases appreciably while the A1
concentration increases, similar to couples C1/S3 and C2/S3.
The diffusion path, shown in Figure 36, reflects the changes
that occur in the diffusion zone microstructure. Although reces-
sion of B resulted from interdiffusion, similar to couples C4/S1,
and C4/S2, the path does not follow the equilibrium tie line of
C3 from the bulk ccmposition of C3 to the y / B q phase boundary,
like it did in C4/S1 and C4/S2.
to lower A1 composition while the Cr composition decreases
slightly. This path segment clearly cuts tie lines in the B f y
phase field. This is apparent in the C/D profiles and the dif-
fusion zone microstructure. Unlike couples C4/S1 and C4/S2,
Instead it begins by moving
78

where t h e p h a s e and b u l k C / D p r o f i l e s w e r e c o n s t a n t i n t h e B+y
a l l o y up t o t h e y l a y e r t h a t formed from B recession, t h e p h a s e s
and b u l k C/D p r o f i l e s i n t h i s c o u p l e do e x h i b i t c o n c e n t r a t i o n
g r a d i e n t s up t o t h e B+y a l l o y / y in te r face . I n t h e d i f f u s i o n
zone, t h i s c a n be s e e n as a measurable r e d u c t i o n i n t h e f3 volume
f r a c t i o n up t o t h e B+y a l l o y / y i n t e r f a c e . Thus, i n C4/S1 and
C4/S2, t h e s e g m e n t of p a t h from t h e b u l k c o m p o s i t i o n of C4 t o
t h e y/B+y p h a s e boundary w a s s i m p l y r e p r e s e n t e d by t h e e q u i l i -
b r ium t i e l i n e o f a l l o y C 4 . I n t h i s c o u p l e , t h e p a t h mus t c u t
t i e l i n e s before it e x i t s t h e f3+y p h a s e f i e l d v i a a t i e l i n e . The
p a t h p r o c e e d s a l o n g t h e y/B+y p h a s e boundary u n t i l i t r e a c h e s
t h e y c o r n e r o f t h e B+y+y' t r i a n g l e . A t t h i s p o i n t it moves
up t h e y+y ' s i d e of t h e t r i a n g l e t o t h e y ' c o r n e r . The p a t h
segment f rom t h e y' c o r n e r t o t h e b u l k c o m p o s i t i o n of S3 i s t h e
same as i n c o u p l e s C1/S3 and C2/S3.
I 79
4 . Growth Layer K i n e t i c s . Measured @+y growth v e r s u s t i m e f o r
c o u p l e s C1/S3 and. C2/S3 a re shown i n F i g u r e 39. Measured y '
growth f o r a l l t h L e c o u p l e s i n t h e series i s shown i n F i g u r e 40.
Exponents f o r t h e c u r v e s t h r o u g h t h e d a t a p o i n t s w e r e n o t cal-
c u l a t e d b e c a u s e o n l y 1 0 0 h o u r s and 2 0 0 h o u r s d a t a w e r e a v a i l a b l e .
The 300 h o u r s s a m p l e s , which would have g i v e n t h e n e c e s s a r y t h i r d
d a t a p o i n t , w e r e n o t a v a i l a b l e . Comparing t h e B+s, growtf zt
200 h o u r s i t c a n be s e e n t h a t C1/S3 had a l a r g e r B+y g rowth
l a y e r (335pm) t h a n C2/S3 (170pm). Comparing t h e y ' growth a t
2 0 0 h o u r s , i t can be s e e n t h a t C3/S3 had t h e l a r g e s t y ' growth
l a y e r (285pm) f o l l o w e d by C2/S3 (186pm) and C1/S3 (140pm).

0 0 Q)
0 0 Q)
0
0
0 0 CI)
9 0 0 cu
0 0
0 .o 100 .o 200.0 ' 300 .O 400 .o
TIME <HRS.>
F i g u r e 39. Measured B+y growth vs . time f o r couples C1/S3 and C 2 / S 3 .
80

w u z a c
81
I
in +4
0
4 - GAlvlMA P R I M E GROWTH: C1/S3
0 + - GAIYlMA P R I M E GROWTH : C2/S3
0 - GAlYlMA P R I M E GROWTH: C 3 / S 3
0
0,o 100 .o 200 .o 300 .O 4 0 0 .o
T I M E (HRS.)
F i g u r e 4 0 . Measured y ' g r o w t h v s . t i m e for coup les C l / S 3 , C 2 / S 3 , C 3 / S 3 .

Bulk Flow Analysis
In order to gain insight into the mechanisms governing the
establishment of the diffusion structures in the diffusion zone,
analyses of the direction (i.e., into the y+y’ alloy or into
the fkyalloy) and amount of bulk Cr and A1 flow in the diffu-
sion couples were performed. Analyses of bulk flow in diffusion
couples requires location of the Matano interface in the couple.
The Matano interface serves to locate the plane in the couple
where the mass lost from one side of the plane equals the mass
gained on the other side of the plane. In general, the Matano
plane is not coincident with the original interface because the
interface can move during diffusion, as shown by Kirkendall ( 3 3 ) .
The Matano plane is determined according to the equation:
i = 1,2,. ..,n -- (1) c: .XdC = 0 C;
+ where X is measured fromWe.Matano plane and Ci and Ci are the
bulk compositions at either end of the couple for component i.
Breaking up Eqn. (1) into two integrals yields:
M ‘i
i = 1,2, ..., n ( 2 ) J -XdC = J - Xdc ‘i C+
M ‘i
+ . .,n ( 2 )
where C F is the concentration of component i at the Matano
plane. Positioning of the Matano plane should ideally be iden-
tical for all components (19).
82

The Matano i n t e r f a c e s f o r t h e c o u p l e s i n t h i s s t u d y were I
~
83
located by g r a p h i c a l i n t e g r a t i o n , a c c o r d i n g t o Fqn. ( 2 1 , o f the
c a l c u l a t e d b u l k C r and A 1 c o n c e n t r a t i o n / d i s t a n c e p r o f i l e s . The
e x p e r i m e n t a l a c c u r a c y o f t h e c a l c u l a t e d b u l k C r and A 1 c o n c e n t r a -
t i o n / d i s t a n c e p r o f i l e s w a s es t imated as b e i n g 22 .0 a t .% ' ( C r o r
A l l . T h i s a c c u r a c y w a s con f i rmed by m e a s u r i n g b u l k c o n c e n t r a t i o n s
a t v a r i o u s d i s t a n c e s i n t h e d i f f u s i o n zone w i t h a s c a n n i n g elec-
t r o n mic roscope l i n e s c a n , KEVEX 8000 Series e n e r g y - d i s p e r s i v e
X-ray a n a l y z e r , and s u b s e q u e n t Magic V ZAF c o r r e c t i o n r o u t i n e .
The measurements were a lways w i t h i n 1 .5 a t . % ( C r o r A l l of t h e
c a l c u l a t e d v a l u e s . Tak ing t h i s a c c u r a c y i n t o a c c o u n t , however,
l e a d s t o s o m e error i n g r a p h i c a l l y i n t e g r a t i n g t h e b u l k p r o f i l e s .
Fu r the rmore , b u l k c o n c e n t r a t i o n / d i s t a n c e p r o f i l e s w e r e n o t d e t e r -
mined i n t h e y-t'y' a l l o y ad jacent t o t h e growth l a y e r s . The gra-
d u a l r e d u c t i o n i n t h e y' volume f r a c t i o n from t h e growth l a y e r
( i . e . , @+y , y, o r y ' ) / y - + y ' i n t e r f a c e i n t o t h e y t y ' a l l o y showed
t h a t C r and A 1 d i E f u s i o n h a d - o c c u r r e d p a s t t h e growth l a y e r s .
Thus, t h e amount o f C r and A 1 g a i n e d i n t h e s e r e g i o n s had t o
be est imated. T o t a k e i n t o a c c o u n t t h e a c c u r a c y o f t h e p r o f i l e s ,
and t h e C r and A1 g a i n e d i n t h e y + y ' a l l o y a d j a c e n t t o t h e growth
l a y e r s , r e p e a t e d i n t e g r a t i o n s of t h e p r o f i l e s w e r e made. The
c a l c u l a t e d Matano i n t e r f a c e s , XM and t h e area on e i t h e r
s i d e of t h e i n t e r f a c e , ACr,A1, l i s t e d i n Table 4 , are a v e r a g e s
o f t h e r e p e a t e d i n t e g r a t i o n s .
C r , A l '
From t h e d a t a i n Table 4 it c a n be s e e n f o r a l l c o u p l e s t h a t
t h e amount o f C r and A 1 l o s t from t h e B+y a l l o y ( i . e . ACr, A A r )

1 Couple
Cl/Sl c1/s2 c1/s3
c2/s1 c2/s2 c2/s3
c3/s1 c3/s2 c3/s3
c4/s1 c4/s2
TABLE 4
Calculated Matano Interfaces and Loss of Cr and A1 From the B+Y Alloys in the Diffusion Couples.
AA1 (at . X =pm)
2371 (+123) 138 (+85) 2675 (+123) 2835 (7151) 100 (746) 3085 (7134)
3828 (7130) 80 (726) - 3653 (2204) -
1185 (+119) 62 (+19) 1719 (+111) 1893 (7 20) 67 (7 4) 2133 (7 58) 2193 (7 - 36) 25 (7 - 7) 2535 (7154) -
651 (+126) 27 (+68) 145 (+ 37) 943 (7 60) 47 (s32) 893 (5 25)
1582 (T118) 1004 (7 - 0) 2 (7 - 0) -
1383 (+ 0) , 130 (+ 0) 1830 (2 0) 1757 (7 - 0) 150 (T - 0) 2136 C+ 0)
1. Cl(Ni-20.OCr-24.1Al) Sl(Ni-7.4Cr-17.1Al) C2(Ni-l5.3Cr-23.9Al) S2(Ni-3.5Cr-17.OAl)
C4(Ni-26.4Cr-17.1Al) C3(Ni-15.1Cr-20.3Al) S3(Ni-16.2Al)
39 (+25)
73 (731) - 47 (721)
40 (+48) 42 (T39) 30 (+56)
-22 (+32) -81 (+20) -14 (+20)
-19 (2 0) -48 (2 0)
NOTE: fr, are measured from original interface.
84

i n c r e a s e s as t h e C r c o m p o s i t i o n o f t h e y + y ' a l l o y d e c r e a s e s . A s
t h e C r c o m p o s i t i o n of t h e B i - y a l l o y d e c r e a s e s , a t c o n s t a n t A 1
c o m p o s i t i o n ( e . g . C l / S l v s . C 2 / S 1 ) , t h e amount o f C r and A 1 l o s t
f r o m t h e ~ f u a l l o y d e c r e a s e s . L i k e w i s e , a s t h e A 1 c o m p o s i i t o n
i n t h e ~ f y a l l o y d.ecreases, a t c o n s t a n t C r c o m p o s i t i o n (e .g . C2/S1
vs. C3/S1) t h e amount of C r and A 1 l o s t from t h e @+y a l l o y de-
creases.
The data i n Table 4 a l s o shows t h a t t h e p h a s e c o m p o s i t i o n s ,
and n o t j u s t t h e b u l k c o m p o s i t i o n s , p l a y a ro l e i n d e t e r m i n i n g
t h e amount o f C r amd A 1 l o s t from t h e B-ty a l l o y . The amount of
C r and A 1 l o s t f rom C 1 c o u p l e s w a s h i g h e r t h a n t h e amount o f C r
and A 1 l o s t f rom C:4 c o u p l e s , even though a l l o y C4 had a h i g h e r
b u l k C r c o m p o s i t i o n ( 2 6 a t . % C r ) t h a n a l l o y C 1 ( 2 0 a t . % C r ) .
The f3 a n d y p h a s e C r c o n c e n t r a t i o n s i n a l l o y C 1 , however, are
h i g h e r t h a n t h e B and y p h a s e C r c o n c e n t r a t i o n s i n a l l o y C 4 .
(The A 1 c o m p o s i t i o n s i n t h e p h a s e s w e r e s i m i l a r f o r b o t h a l l o y s . )
L ikewise , t h e amount o f C r and A 1 l o s t from C2 c o u p l e s w a s h i g h e r
t h a n t h e amount of: C r and A 1 l o s t f r o m C3 c o u p l e s , e v e n though
b o t h a l l o y s had a p p r o x i m a t e l y t h e s a m e b u l k C r c o m p o s i t i o n (15
a t . % C r ) . Again, t h e B and y p h a s e C r c o n c e n t r a t i o n s i n a l l o y
C2 are h i g h e r t h a n t h e B and y p h a s e C r c o n c e n t r a t i o n s i n a l l o y
C3. Thus t h e d a t a shows t h a t t h e p h a s e c o m p o s i t i o n s , and i n p a r -
t i c u l a r , t h e C r c o n c e n t r a t i o n i n t h e p h a s e s , are i m p o r t a n t i n
d e t e r m i n i n g t h e amount o f C r and A 1 l o s t f rom t h e B + Y a l l o y .
The d i r e c t i o n of C r and A 1 f l ow can b e deduced f rom t h e d i f -
f u s i o n zone m i c r o s t r u c t u r e . K i r k e n d a l l p o r o s i t y w a s a lways ob-
85

served on the B i y side of the original interface. The location
of porosity in the B+y alloys is similar to the location of poro-
sity found in similar B+y alloys of a previous study (19). In
the previous study (191, the porosity was attributed to an in-
trinsic flux imbalance. An intrinsic flux imbalance will occur
whenever the number of atoms diffusing in one direction is greater
than the number diffusing in the reverse direction. Consequently,
a net flux of vacancies, equal to, and opposite to the intrinsic
flux imbalance must exist. Porosity results when the number of
lattice imperfections is insufficient to absorb and equilibrate
the vacancy flux. In the previous study (191, the intrinsic
diffusivities of Ni, Cr, and A1 were ranked as:
The porosity was therefore attributed to high A1 and Cr fluxes
from the high Cr, high A1 (B+y or y ) . alloys into the low Cr, low
A1 y alloys (19). The similar location of porosity in the B + Y
alloys of this study shows that high Cr and A1 fluxes, in the
direction of the y+y' alloy, are responsible for the porosity.
Therefore, the location of porosity in the @+y alloys of this
study shows conclusively that Cr and A1 diffusion is occurring
in the direction of the y+y' alloy.
. . .. . . 86 . . . . . . -

Y-Phase Flux Analysis
The establishment of the diffusion structures in the B+y/
r+y ' couples, a result of bulk Cr and A1 flow between the B+y and
y+y' alloys, occu:rs by Cr and A1 diffusion in the phases. A way
to gain insight into the mechanisms by which the bulk Cr or A1
flow takes place :is to examine the Cr or A1 flux variation in
the phases in the diffusion zone. The diffusion flux defines
the amount of Cr or A1 transported per unit area, per unit time.
By determining the flux variation in the phases, the regions in
the couple where maximum Cr or A1 transport occurs can be found.
Relating these regions to the changes in bulk Cr or A1 flow that
occurs in the diffusion zone then allows the mechanisms by which
the structures fo.rm in the diffusion zone to be determined.
Following Onsager's initial formalism ( 3 4 - 3 6 1 , the diffu-
sion flux, Ji, of each component, i, is a linear functior, of all
the concentration gradients, Ck, given by:
n I
(i=l, 2, . . . , n) Ji = c Dik "k k=l
The diffusion coefficients Dik' are assumed to be functions of
the concentrations, Ck. Kirkaldy ( 3 7 ) imposed the following
conditiops: n C J i = O i=l
a7
n C Ci = constant i=l

These conditions allow n equations involving n2 diffusion coef-
ficients to be reduced to n-1 equations involving (n-112 diffu-
sion coefficients. Thus Eqn. (1) can be written as:
n- 1 Ji = C Dik VCk
k=l ( 4 )
where Dik = Dikt - Din'. Considering a 3 component system, where diffusion occurs in the
X direction only, Eqn. ( 4 ) expands to:
ac2 D12 ax ( 5 )
(6) - acl ac2 J2 - -D21ax - D22 ax
Eqns. ( 5 ) and (6) are valid in a single phase. In two-phase
alloys, separate sets of equations are necessary for each
phase ( 3 8 ) .
Fluxes were calculated for Cr and A 1 in the y phase of the
couples in this study. Fluxes in the y phase,could be calculated
because the four ternary diffusion coefficients as a function
of Cr and A 1 concentration were determined at 1200°C from an
,earlier study (19). For the B and y ' phases, diffusion coeffi-
cient data were insufficient to allow flux calculations.
Analysis of ternary diffusion in the B+y regions of the
B + Y / Y + Y ' couples in this study ideally requires that fluxes of
Cr and A 1 be known in the B phase as well as in the y phase.
.The need to have fluxes in the B phase can be alleviated if they
can be shown to be smaller than the fluxes in the y phase, and/
88

or, that thej are not predominately responsible for transport
of Cr and A 1 during interdiffusion. Available data 0x1 the 4 ter-
nary diffusion coefficients in the B phase at 1025OC ( 3 9 ) , and
binary DNiAl data in the phase at 1000°C - 1200°C (39-411,
allow the 4 diffusion coefficients in the phase at 12OOOC to
be assessed as being of the same order of magnitude as the 4 dif-
fusion coefficients in the y phase at 1200°C. The A 1 concentra-
tion gradient in the B phase in the couples was approximately
zero (or very small). Thus any flux of A1 in the 8 phase would
have to be a result of the Cr concentration gradient in the B
phase. The Cr concentration gradient in the B phase was at most
an order of magnitude less than the Cr concentration gradient
in the y phase. Therefore, assuming the assessment of the order
of magnitudes of the 4 diffusion coefficients in the B phase at
1200°C is correct, the flux of Cr and A1 in the phase can at
best be an order of magnitude less than the flux of Cr and A1
in the y phase. Using this basis alone, most transport of Cr
and A1 would have to occur in the Y phase. Further support that
the y phase fluxes are predominately responsible for transport
of Cr and A1 during interdiffusion can be found from considera-
tion of the diffusion zone microstructures of couples C4/S1 and
C4/S2. The complete B dissolution in these couples shows that
the B phase is not necessary as a mechanism of transport for Cr
and A1 to the layers that form during interdiffusion. The com-
plete B dissolution also shows that the 8 phase simply dissolves
during interdiffusion, giving up Cr and A1 to be transported in
N

the y phase. Therefore, the diffusion behavior in B+y/y+y'
couples is primarily a result of diffusion in the y ?hase.
the diffusion behavior in fj+y/y+y' diffusion couples can be
Thus,
rationalized in terms of fluxes in they phase.
A computer program was developed to calculate Cr and A1
fluxes in the y phase using Eqns. (5) and ( 6 ) . First, a smooth
curve representative of the concentration/distance data (Cr or
Al) measured by the electron microprobe was produced by a cubic
spline curve smoothing routine ( 4 2 ) . The cubic spline smooth-
ing routine (CSSR) allows point to point fluctuations in the ex-
perimental data to be eliminated. The benefit of the CSSR is
it allows the concentration gradient at any position on the con-
centration profile to be calculated.
The Cr and A1 concentration gradients from the smoothed
curves were calculated using finite-difference techniques (43).
The finite-difference (F-D) technique requires definition of grid
points across the smoothed curves. The grid points are equally
spaced across the curves, each point being associated with h
specific Cr or A1 concentration. A total of 1000-3000 grids
where used in the present study. The gradients were calculated
at each grid point using a second-forward difference ( 4 3 ) :
Yi ' = (-Ci (I+2) +4.0 *Ci (I+l) - 3 . 0 *Ci (I) ) /2 'DELX (7 1
where : ' = gradient at the Ith grid point (i=Cr or Al) Yi
Ci(I+2) = concentration of Cr or A1 at the Ith + 2
Ci(I+l) = concentration of Cr or A 1 at the Ith + 1 grid point.
grid point.
99

Ci(I) = concentration of Cr or A1 at the Ith grid point.
DELX = distance between successive grid points.
Once the gradients were calculated at each grid point, the 4
diffusion coefficients (19) were calculated using the Cr and A1
concentrations at each grid point. The 4 diffusion coefficients
as a function of Cr and A1 concentration used in the program are
given below: *
= 1.97 + 1.38 A1 + 0.18 Cr + 0.0061 A12 - 0.0032 Cr2 = 0.135+0.28Al- 0.016Cr+O.O35Al2 + 0.0004 Cr2 = -1.41 + 0.33 A1 + 0.47 Cr - 0.013 A12 - 0.0081 Cr2 = 3.21 - 0.56 A1 + 0.18 Cr +. 0.07 A12 - 0.0037 Cr2
D ~ i ~ i
DAICr
DCrAl
DCrCr
A1,Cr = A1 or Cr concentration (at.%)
*Taken from Reference 19
The calculated gradients and diffusion coefficients at each grid
point were substituted into the following flux equations:
and the flux of Cr and A1 was calculated at each grid point. The
flux at eC37ch grid point was then plotted, yielding a curve which
showed the flux variation in the y phase in the diffusion zone.
F-D techniques are a convenient method for calculating the
concentration gradient at any given point on a concentration/dis-
~ . . . . . . . . . . . . . . . . . . . . . 91 .. .

t a n c e p r o f i l e . F-D t e c h n i q u e s , however, are o n l y a n approxima-
t i o n t o t h e t r u e g r a d i e n t t h a t e x i s t s a t any g i v e n p o i n t on t h e
p ro f i l e . When t h e F-D t e c h n i q u e i s u s e d , i n c r e a s i n g t h e number
of g r i d p o i n t s s h o u l d g i v e a c loser and closer a p p r o x i m a t i o n of
t h e t r u e g r a d i e n t t h a t e x i s t s a t any g i v e n g r i d p o i n t . Thus,
i f t h e c a l c u l a t e d g r a d i e n t a t a g i v e n g r i d p o i n t is plo t ted
a g a i n s t t h e number o f g r i d p o i n t s , i t s h o u l d c o n v e r g e toward t h e
real g r a d i e n t as t h e number of g r i d p o i n t s increases. T h e r e f o r e ,
t o check w h e t h e r t h e F-D t e c h n i q u e is p r o p e r l y e x e c u t e d , t h e num-
ber of g r i d s must be i n c r e a s e d t o see i f t h e c a l c u l a t e d g r a d i e n t s
conve rge . T h i s check w a s per formed on t h e program, and conve r -
gence of t h e c a l c u l a t e d g r a d i e n t s o c c u r r e d .
P o s s i b l e Errors
There are t h r e e s o u r c e s of e r ror i n c a l c u l a t i n g t h e y-phase
C r and A 1 f l u x e s i n t h i s s t u d y . The t h r e e s o u r c e s o f error are:
1. The a c c u r a c y o f t h e c o n c e n t r a t i o n measurements .
2. The a c c u r a c y o f t h e d i f f u s i o n c o e f f i c i e n t s .
3 . D e t e r m i n a t i o n o f t h e c o n c e n t r a t i o n g r a d i e n t s by t h e c u b i c s p l i n e smooth ing r o u t i n e .
The a c c u r a c y of t h e c o n c e n t r a t i o n measurements i s d i s c u s s e d i n
Appendix B. The a c c u r a c y o f t h e d i f f u s i o n c o e f f i c i e n t s w a s ve r i -
f i e d i n a p r e v i o u s s t u d y ( 1 9 ) by compar ison of measured and p r e -
d i c t ed c o n c e n t r a t i o n / d i s t a n c e p r o f i l e s .
deve loped t o s i m u l a t e i n t e r d i f f u s i o n i n y / y d i f f u s i o n c o u p l e s
( 1 9 ) . The computer model u t i l i z e d f i n i t e - d i f f e r e n c e t e c h n i q u e s
A computer m o l e 1 w a s
92

and the measured diffusion coefficients to predict measured
concentration/distance profiles. Excellent agreement was found
between the measured and predicted profiles, thus supporting the
accuracy of the diffusion coefficients. The largest source of
error in calculating the Cr and A1 fluxes in this study comes
from the calculation of the concentration gradients. The con-
centration gradients were calculated from curves smoothed through
the experimental data by a cubic spline smoothing routine (CSSR).
The CSSR used in this study was desired to eliminate the obvious
point to point fluctuations in the experimental data. The point
to point fluctuations in the experimental data were most obvious
in the two-phase regions for both Cr and Al. Concentration mea-
surements in two-phase regions were always carefully made in the
center of a given phase. However, the possibility of the other
phase being right underneath, or near, the phase being measured
always existed, and thus fluctuations in the Cr and A1 experi-
mental data were inevitable. In one-phase regions, this diffi-
culty was not encountered, and the fluctuations were much less
than in the two-phase regions. In general, as the point to
point fluctuations in the experimental data increased, larger
smoothing parameters were necessary. To account for the fluc-
tuations in the Cr and A1 experimental data in this study,
smoothing parameters in the range 0.5-7.0 were necessary, de-
pending on the given couple.
Selection of the Cr and A1 smoothing parameters were deter-
mined by observing the variation in the calculated Cr and A1
93

f l u x e s i n t h e d i f f u s i o n zone. The smooth ing p a r a m e t e r s w e r e se t
when t h e C r and A 1 f l u x v a r i a t i o n i n t h e d i f f u s i o n zone w e r e
found t o be smooth c u r v e s . Two r e g i o n s o f t h e c a l c u l a t e d C r and
A 1 f l u x e s (shown i n F i g u r e 4 1 ) w e r e found t o be s e n s i t i v e t o t h e
smooth ing p a r a m e t e r s . The f i r s t r e g i o n w a s a t d i s t a n c e s w e l l
back i n t h e &Y a l l o y s ( -1400 t o -800pm r a n g e , depend ing on t h e
c o u p l e ) and t h e second r e g i o n w a s a t t h e t h r e e - p h a s e i n t e r f a c e s
i n t h e c o u p l e ( i .e . f l u x e s on t h e p o s i t i v e side o f t h e o r i g i n a l
i n t e r f a c e , i n t h e l a s t l O p m o f t h e c a l c u l a t e d f l u x p r o f i l e s ) .
The C r and A 1 f l u x e s i n r e g i o n s n e a r t h e o r i g i n a l i n t e r f a c e ( i . e . ,
where t h e f l u x e s r e a c h e d a maximurr?.) w e r e n o t as s e n s i t i v e t o the
smooth ing p a r a m e t e r s a s t h e f l u x e s i n t h e other t w o r e g i o n s .
The C r and A 1 f l u x e s i n t h e - 1 4 0 0 t o - 8 0 0 ~ r a n g e w e r e s en -
s i t i v e t o t h e smooth ing p a r a m e t e r s because of t h e p o i n t t o p o i n t
f l u c t u a t i o n s i n t h e e x p e r i m e n t a l d a t a . The p o i n t t o p o i n t f l u c -
t u a t i o n s i n t h e e x p e r i m e n t a l d a t a arose from v a r i o u s measurement
errors, such as f o c u s i n g , i n s t r u m e n t d r i f t , e tc . . . The C r and
A 1 e x p e r i m e n t a l d a t a i n t h e s e r e g i o n s w e r e a l l w i t h i n t h e s t a n -
dard d e v i a t i o n o f t h e C r and A 1 c o n c e n t r a t i o n s measured i n t h e
y-phase of homogenized a l l o y s used f o r phase d iagram de te rmina -
t i o n . T h e r e f o r e , i n these r e g i o n s , no c o n c e n t r a t i o n g r a d i e n t s
w e r e p r e sen t . However, t h e CSSR w i l l o n l y smooth a p e r f e r t l y
h o r i z o n t a l c u r v e t h r o u g h da ta p o i n t s when a l l t h e d a t a p o i n t s
have t h e e x a c t same v a l u e . When t h e da ta p o i n t s do n o t have t h e
'same v a l u e , s u c h as f r o m p o i n t . t o p o i n t f l u c t u a t i o n s i n t h e ex-
p e r i m e n t a l d a t a , b u t are known t o f a l l a l o n g a h o r i z o n t a l l i n e ,
94

t h e CSSR w i l l smooth a c u r v e t h r o u g h t h e d a t a p o i n t s w i t h s o m e
f i r l i t e s l o p e . Thus, i n t h e -1400 t o -800pm r a n g e , b o t h t h e C r
and A1 smoothed c u r v e s e x h i b i t e d v e r y s m a l l c o n c e n t r a t i o n gra-
d i e n t s . These v e r y s m a l l g r a d i e n t s lead t o non-zero f l u x v a l u e s
i n t h e s e r e g i o n s . Changing t h e smooth ing p a r a m e t e r s d i d n o t ap-
p r e c i a b l y e f f e c t t h e C r f l u x e s i n t h e reg ions , b u t d i d a p p r e c i -
a b l y e f f e c t t h e A 1 f l u x e s i n t h e s e r e g i o n s . T h e r e f o r e , many of
t h e A 1 f l u x e s i n t h e s e r e g i o n s e x h i b i t e d n e g a t i v e f l u x v a l u e s
o f -2 .0 t o -3 .0 -10- ' a t . % cm/sec. The f l u x e s s h o u l d be z e r o i n
t h e e s r e g i o n s b e c a u s e compar i sons o f c o n c e n t r a t i o n measurements
i n t h e s e r e g i o n s t o y-phase c o n c e n t r a t i o n s i n homogenized a l l o y s
shows no c o n c e n t r a t i o n g r a d i e n t s are p r e s e n t .
The C r and A1 f l u x e s a t t h e t h r e e - p h a s e i n t e r f a c e s i n t h e
c o u p l e ( i . e . t o t h e f a r r i g h t o f t h e o r i g i n a l i n t e r f a c e ) w e r e
a l s o i n f l u e n c e d by t h e smooth ing p a r a m e t e r s . The r e a s o n t h e C r
and A 1 f l u x e s w e r e i n f l u e n c e d by t h e smooth ing p a r a m e t e r s i n
t h e s e r e g i o n s i s b e c a u s e of t h e s m a l l c o n c e n t r a t i o n g r a d i e n t s
t h a t w e r e p r e s e n t i n t h e s e r e g i o n s . V a r i a t i o n s i n smooth ing p a r a -
meter changed t h e smoothed c o n c e n t r a t i o n s i n t h e s e r e g i o n s v e r y
l i t t l e , b u t t h e s e v e r y s m a l l changes i n c o n c e n t r a t i o n lead t o
m e a s u r a b l e changes i n t h e c o n c e n t r a t i o n g r a d i e n t s . Changing t h e
smooth ing p a r a m e t e r s on t h e ordcr of 2 l e a d t o + 2 . 5 - 1 0 - ' - a t . %
cm/sec. v a r i a t i o n s i n t h e C r and A 1 f l u x e s i n t h e s e r e g i o n s .
The C r and A1 f l u x maxima ( i . e . , .in r e g i o n s n e a r t h e o r i g i -
n a l i n t e r f a c e ) w e r e e f f e c t e d l e a s t by t h e smooth ing p a r a m e t e r s .

Changes i n smooth ing p a r a m e t e r on t h e o r d e r o f 2 g e n e r a l l y l e a d
t o less t h a n a +1.5*10-* a t . % cm/sec. v a r i a t i o n i n t h e C r and
A 1 f l u x maxima.
F l u x A n a l y s i s
The c a l c u l a t e d f l u x e s , shown i n F i g u r e 4 2 , show many impor-
t a n t f e a t u r e s . The f i r s t i m p o r t a n t f e a t u r e i s t h a t t h e f l u x o f
A 1 i s p o s i t i v e i n t h e d i f f u s i o n zone o f a l l c o u p l e s , even though
t h e g r a d i e n t s i n t h e A 1 p r o f i l e s w e r e p o s i t i v e a l so . The f a c t
t h a t t h e A1 f l u x i s p o s i t i v e shows t h a t A1 i s d i f f u s i n g up i t s
g r a d i e n t i n t h e y phase frclm t h e f3+r a l l o y t o t h e y+y I a l l o y .
The p o s i t i v e A1 f l u x a l s o shows t h a t t h e s t r o n g ( n e g a t i v e ) C r
g r a d i e n t i s c a u s i n g A1 t o d i f f u s e up i t s g r a d i e n t toward t h e Y + 7 "
a l l o y . T h e f a c t t h a t t h e n e g a t i v e C r g r a d i e n t i s c a u s i n g A1 t o
d i f f u s e up i t s g r a d i e n t c a n be s e e n by examining t h e terms i n
Eqn. ( 8 ) :
dCn 7 dC,- ni L L - - - '11 - -DAIA1 dX (8)
The v a l u e s of DAIA1, and DAICr , f o r t h e r a n g e s o f C r and A 1 con-
c e n t r a t i o n e n c o u n t e r e d i n t h i s s t u d y , f a l l i n t h e r a n g e s :
: 1 8 . 1 - 2 4 . 4 x 10-l0crn2/sec. D ~ i ~ i
: 5 . 9 - 10.8 x 10-"cm2/sec . D A I C r
The A1 g r a d i e n t , dCAl/dX, i n a l l c o u p l e s f e l l i n t h e r a n g e 7-25
a t . % / c m , w h i l e t h e C r g r a d i e n t , dCCr/dX, i n a l l c o u p l e s f e l l i n
t h e r ange -70 - -350 a t . % / c m . Thus, a l t h o u g h DAIAl ' i s approx i -
96

.
L
ORl6INRC ,lNTCRFFACE
a
* g = .
b
Figure 41. Calculated Cr and A1 fluxes in the y phase. a). Cl/Sl; b). Cl/S2.
97

C
d
Figure 41 (con't.). Calculated Cr and A1 fluxes in the y phase. c ) C l / S 3 ; d) C 2 / S l .
98

e
F i g u r e 41 (can't.). Calculated C r and A1 fluxes in the y phase. e) C 2 / S 2 ; f) C 2 / S 3
99
f
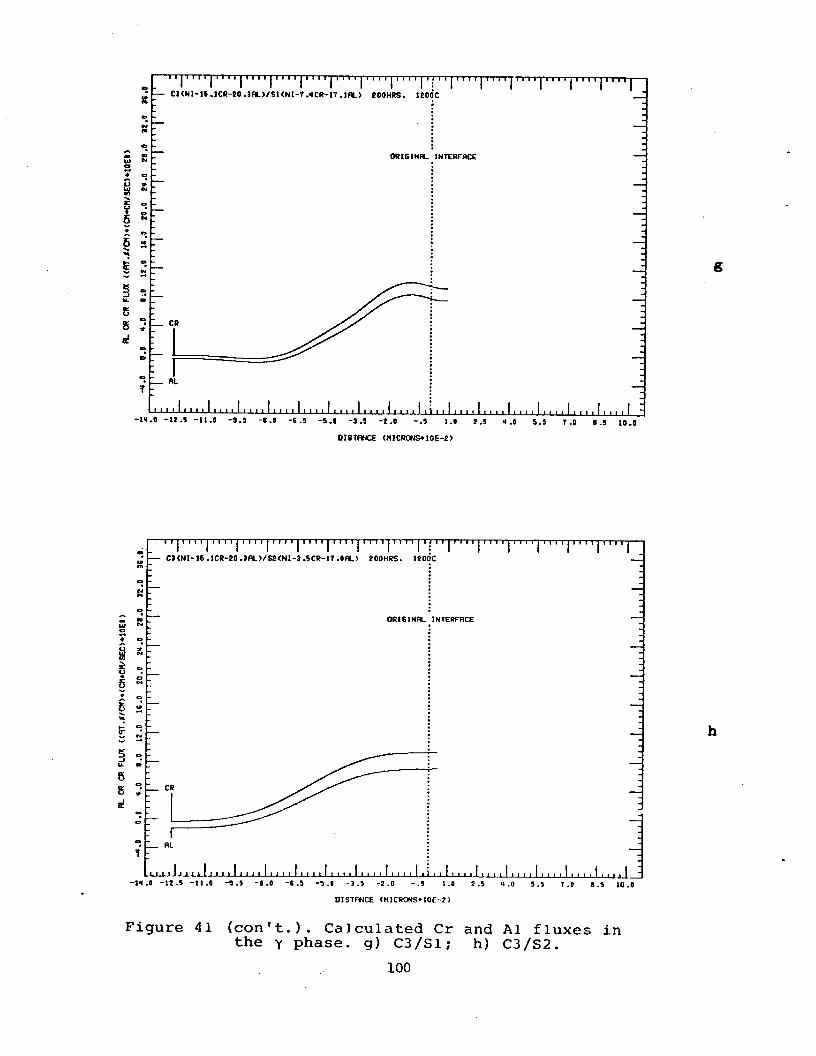
N
0
ss " 0
N .+ 'F 9 0
9 !! ORIGlNRL ,lNTERFRCE
-1q.O -12.5 -11.0 -3.5 -8 .0 -6 .5 -5.0 - 3 - 5 - 2 . 0 - . 5 1.0 2 .5 Y . 0 S .5 7.0 8 . S 10.0
OISTF+IC€ (HlCRONS+IOE-l)
Figure 41 (can't.). Calculated Cr and A1 fluxes in the y phase. g ) C3/S1; h) C3/S2.
100
h

i
F i g u r e 41 (can't.). C a l c u l a t e d C r and A1 f l u x e s in
101 t h e y phase. i) C3/S3; j)C4/S1
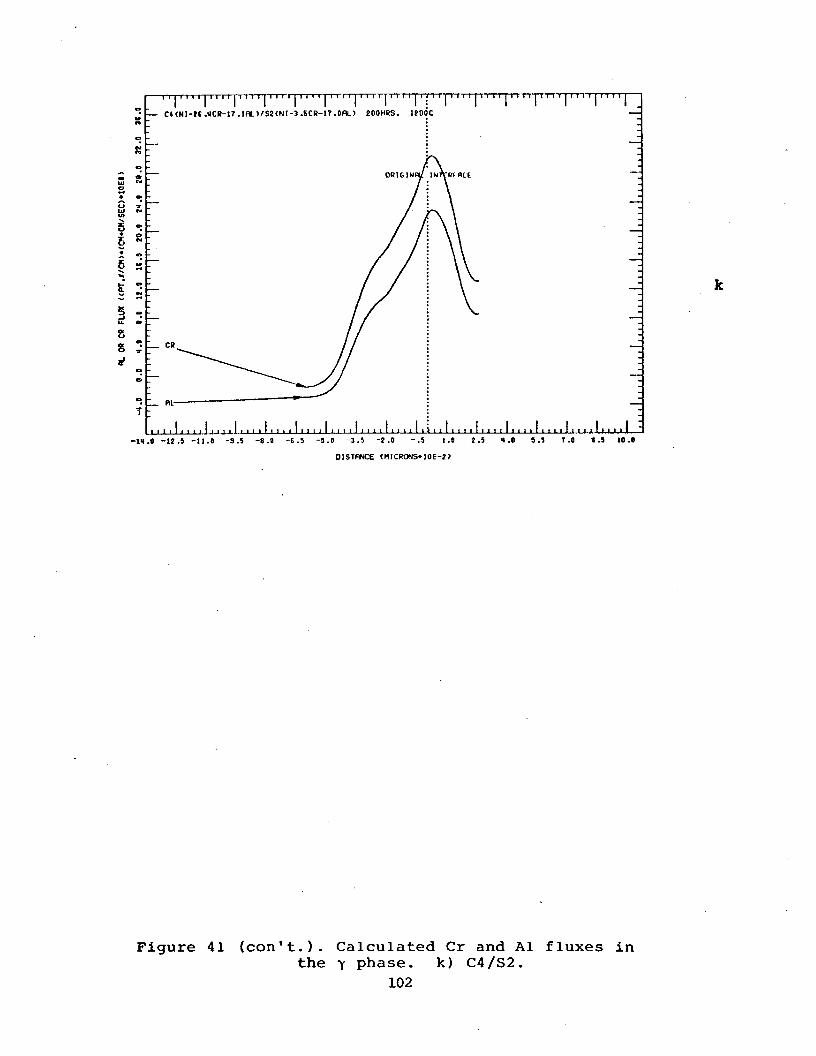
k
Figure 41 (con't.). Calculated Cr and A1 fluxes in the y phase. k) C4/S2.
102

dCCr/dX i s 10 t i m e s greater A l C r ' m a t e l y 3 t i m e s greater t h a n D
t h a n dCAl/dX.
' d C / d X greater t h a n t h e a b s o l u t e v a l u e o f DAIA< Value of DAICr
/ d X i s p o s i t i v e , and -DAIA1* dCAl /dX. Thus, b e c a u s e - dCAl/dX i s n e g a t i v e , t h e A 1 f l u x w i l l a lways be p o s i t i v e , show-
i n g c o n c l u s i v e l y t h a t t h e s t r o n g C r g r a d i e n t i s C a u s i n g A l t o d i f -
f u s e up i t s g r a d i e n t . The e f f e c t of t h e C r g r a d i e n t on t h e A 1
f l u x c a n a l so be s e e n i n t h e s h a p e of t h e A 1 f l u x c u r v e s . The
s h a p e o f t h e A 1 f l u x c u r v e s ( F i g u r e 4 2 ) w a s a lways s i m i l a r t o
t h e s h a p e o f t h e C r f l u x c u r v e s .
T h i s l a r g e n e g a t i v e C r g r a d i e n t r n . ~ k ~ ~ s t t w absolute
C r
* d C D A I C r C r
The second i m p o r t a n t f e a t u r e o f t h e C r and A 1 f l u x e s i n Fig-
u r e 4 2 i s t h a t t h e y a l l i n c r e a s e and r e a c h a maximum a t , o r v e r y
n e a r , t h e o r i g i n a l i n t e r f a c e i n a l l c o u p l e s . The maximum i n t h e
f l u x e s was h i g h e s t f o r c o u p l e s w i t h C4 a s common a l l o y , f o l l o w e d
by c o u p l e s w i t h C 1 a s common a l l o y , C2 as common a l l o y , and C3 as
common a l l o y . The maximum i n t h e f l u x e s w a s t y p i c a l l y h i g h e r as
t h e b u l k C r d i f f e r e n c e be tween a common B+y a l l o y and a g i v e n
y+y' a l l o y i n c r e a s e d .
Discussion ----
Interdiffusion in f3i-y /y+y ' infinite diffusion couples re-
sults in the formation of complex, multi-phase diffusion zones.
The results of this study allow the growth of the various layers
(e?, y,or y') to be rationalized in terms of being controlled
by either the f3i-y alloy composition or the y+y' alloy composi-
tion. The causes of formation of the various layers, and the
changes that occur in the layers as the f3-y or yty' alloy compo-
sition changes will be discussed.
B+ror-Y-&aY ez-FormatLo!? Growth of a f3+y or y layer can be attributed directly to
the rphase Cr composition in the B+y alloy. Figure 42 lists
the bulk compositions of the B y alloys, and plots the bulk Cr
composition versus y-phase Cr composition. Interdiffusion in
couples with C1, C2, and C4 as common alloy resulted in B+y
layer growth. Interdiffusion in couples with C3 as common alloy
resulted in B pertubations at the original interface (0.1.)
(couples C3/S1 and C3/S2) and y layer growth, or no Y layer
growth at all (C3/S3). The growth of the G+y layer cannot be
attributed to the bulk Cr composition of the alloy because C2
and C3 had the same bulk Cr corp7cition. The growth of the B+y
layer also cannot be attributed.to the bulk A1 composition of
the alloy because C4 had a lower bulk A1 composition than C3.
What the bulk compositions do control, however, is the y-phase
Cr composition. During interdiffusion, the y-phase Cr concen-
104

1 I I 1 I I I I I I I I I I I I I 1 I I I I I 1 I I I I , 1 1 3 3 ,
1 - C 1 ( N I - 2 0 . O C R - 2 4 . 1 A L ) 2 - C X N I - 1 5 . 3 C R - 2 3 . 9 R L > 3 - C 3 ( N I - 1 5 . 1 C R - 2 0 . 3 R L > 4 - C u N I - 2 6 . 4 C R - 1 5 . 1 R L >
M
3 2
4
1
10 .o 15 .O 20 . o 2 5 .O 30 . O 35 .o GRMMA PHASE CR CONCENTRATION ( A T . % >
Figure 42. Bulk Cr composition of the f3+y alloys versus y phase Cr composition.
105 I

t r a t i o n changes from i ts e q u i l i b r i u m v a l u e t o a p p r o x i m a t e l y
14.0 a t . % C r a t t h e y c o r n e r o f t h e B+y+y' t r i a n g l e . I t i s
t h i s y-phase C r d i f f e r e n c e ( i . e . ? e q u i l i b r i u m C r c o n c e n t r a t i o n
i n t h e Y-phase i n t h e B + Y a l l o y - C r c o n c e n t r a t i o n a t t h e y
c o r n e r of t h e B+y+y' t r i a n g l e ) which i s c r i t i c a l i n d e t e r m i n -
i n g w h e t h e r a B+y o r y l a y e r w i l l form i n t h e d i f f u s i o n zone .
The f a c t t h a t t h e y-phase C r d i f f e r e n c e i s c r i t i ca l i n
d e t e m r i n i n g w h e t h e r a 8 i - y o r y l a y e r w i l l form c a n be s e e n i n
t h e c o n c e n t r a t i o n / d i s t a n c e ( C / D ) p r o f i l e s i n t h e y - p h a s e and t h e
r e s u l t i n g f l u x e s i n t h e y -phase . F i g u r e 43 p l o t s t h e C r C/D
p ro f i l e s i n t h e y -phase o f c o u p l e s C2/S1 and C3/S1, and t h e C r
f l u x e s r e s u l t i n g from t h e C / D p r o f i l e s . The maximum C r g r a d i e n t
o c c u r r e d n e a r t h e 0.1. i n b o t h c o u p l e s . For c o u p l e C2/S1, t h e
maximum C r g r a d i e n t was-140 at .%/cm, w h i l e i n c o u p l e C3/S1, t h e
maximum C r g r a d i e n t was-100 a t . % / c m . The C r c o n c e n t r a t i o n a t t h e
maximum g r a d i e n t w a s 1 8 . 2 a t . % C r f o r C 2 / S 1 and 1 6 . 1 a t . % C r f o r
C3/S1. Both t h e larger maximum C r g r a d i e n t and h i g h e r C r con-
c e n t r a t i o n a t t h e maximum g r a d i e n t i n c o u p l e C2/S1 i s a r e s u l t
of t h e l a r g e r c r d i f f e r e n c e i n C 2 / S l c o m p a r e d t o C 3 / S 1 . The la rger
C r g r a d i e n t and h i g h e r C r c o n c e n t r a t i o n a t t h e maximum g r a d i e n t ,
which w a s p r e s e n t i n a l l C 2 c o u p l e s compared t o C3 c o u p l e s , leads
t o l a r g e r C r and A 1 f l u x e s i n t h e y-phase of C2 c o u p l e s compared
106

k 0
........
+ 0 ~
+ o i ; 0 W
0
U K + '0
$ 0
i+ $0 x
E5 I- $ p " x
f) z .......... I ................................................. .........................
o x +
+ + + +
+ + + + + +
* +
+ + +
+ +
o x 0:
....
107 I

t o C3 c o u p l e s . The la rger C r and A 1 f l u x e s i n t h e y-phase of
C2 c o u p l e s , and t h a t B+y growth and n o t y growth o c c u r r e d , p o i n t s
t o t h e c o r r e l a t i o n t h a t t h e f l u x e s i n t h e y-phase and growth
of t h e v a r i o u s l a y e r s are i n t e r r e l a t e d . The B p e r t u b a t i o n s a t
t h e 0.1. (which may be though of a s a v e r y nar row B+y l a y e r )
i n C3 c o u p l e s ( e x c e p t C3/S3, which w i l l be d i s c u s s e d l a t e r ) shows
t h a t t h e a b i l i t y t o s u s t a i n growth o f a B+y l a y e r is d e p e n d e n t
on t h e f l u x e s r e a c h i n g c r i t i c a l magn i tudes i n t h e y-phase.
Reaching t h e c r i t i c a l f l u x magn i tudes depends on t h e C r concen-
t r a t i o n g r a d i e n t s and t h e C r c o n c e n t r a t i o n a t t h e g r a d i e n t s ,
which i n t u r n depends on t h e y-phase C r d i f f e r e n c e .
The n e c e s s i t y t o r e a c h c r i t i c a l y-phase f l u x m a g n i t u d e s
b e f o r e f3+y growth c a n o c c u r c a n be s u p p o r t e d by r e l a t i n g t h e
y-phase f l u x e s t o t h e d i f f u s i o n p a t h s and t h e b u l k C/D p r o f i l e s
i n t h e d i f f u s i o n zone. The d i f f u s i o n p a t h s f o r c o u p l e s i n which
a B+y l a y e r r e s u l t e d from i n t e r d i f f u s i o n i n f l e c t e d and i n c r e a s e d
t o h i g h e r A 1 c o m p o s i t i o n ( l o w e r C r c o m p o s i t i o n ) i n t h e B+Y p h a s e
f i e l d . These i n f l e c t i o n s w e r e a r e s u l t of s h a r p d e c r e a s e s i n
t h e b u l k C r C/D p r o f i l e s and s h a r p i n c r e a s e s i n t h e b u l k A 1 C / D
p r o f i l e s a t t h e 0.1. i n t h e c o u p l e s . (The 0.1. w a s where t h e
B+y growth l a y e r s s t a r t e d i n t h e d i f f u s i o n zone . ) C l e a r l y , f o r
t h e b u l k A 1 t o f l o w up i t s g r a d i e n t i t must b e forced t o do so.
The force c a u s i n g t h e b u l k A 1 t o f l o w up i t s g r a d i e n t i s t h e
s t r o n g n e g a t i v e C r g r a d i e n t . Thus, i n a n a n a l o g o u s manner t o
t h e s t r o n g n e g a t i v e C r g r a d i e n t f o r c i n g A 1 t o d i f f u s e u p i t s
g r a d i e n t i n t h e y-phase, t h e s t r o n g n e g a t i v e b u l k C r g r a d i e n t
108

forces b u l k f l o w of A 1 u p i t s g r a d i e n t . However, b e c a u s e b u l k
f l o w , and b u l k g r a d i e n t s , are a r e s u l t of d i f f u s i o n i n t h e
p h a s e s , t h e c a u s e o f t h e b u l k f l o w and b u l k g r a d i e n t s c a n be
d i r e c t l y re la ted t o t h e f l u x maxima i n t h e y-phase.
A t o r v e r y n e a r , t h e 0.1. i n t e r f a c e i n a l l c o u p l e s , t h e
f l u x e s o f C r and A 1 i n t h e y-phase r e a c h e d maxima. The maximum
i n t h e f l u x e s c o r r e s p o n d e d e x a c t l y t o t h e p o i n t s where t h e b u l k
C r C/D p r o f i l e s began t o d e c r e a s e r a p i d l y , and t h e b u l k A 1 C / D
p ro f i l e s began t o i n c r e a s e r a p i d l y i n t h e d i f f u s i o n zone , as
shown i n F i g u r e s 4 4 , 45, and 4 6 €or c o u p l e s w i t h C1 a s common
a l l o y . The maxima i n t h e f l u x e s i n d i c a t e t h a t a t t h e 0.1. ( i . e .
a t t h e s t a r t o f t h e B+y growth l a y e r ) t h e maximum m o u n t of C r
and A 1 i s t r a n s p o r t e d p e r u n i t area from t h e y - p h a s e i n t o t h e
B+y growth l a y e r . The C r is s u p p l i e d p r i m a r i l y by t h e C r - r i c h
y-phase. The A 1 i s s u p p l i e d p r i m a r i l y by t h e A l - r i c h B p h a s e .
The f a c t t h a t A 1 i s s u p p l i e d p r i m a r i l y by t h e B-phase c a n be sup-
p o r t e d b y many r e a s o n s . F i r s t , t h e A 1 c o n c e n t r a t i o n i n t h e B -
p h a s e i s a p p r o x i m a t e l y 3 0 . 0 a t . % A 1 compared t o 9.0-14.0 a t . %
A 1 i n t h e y-phase. I f t h e y p h a s e w e r e t o s u p p l y t h e n e c e s s a r y
A 1 f o r growth of t h e B+y l a y e r (which c o n t a i n s g rea te r t h a n 2 0 . 0
a t . % b u l k A l l , it would have t o d i s s o l v e p r e f e r r e n t i a l l y t o t h e
3-phase. T h i s d i s s o l u t i o n o f y i s h i g h l y u n l i k e l y f r o m c o n s i -
d e r a t i o n s o f t h e A 1 c o m p o s i t i o n i n t h e t w o p h a s e s a l o n e , and t h e
d i f f u s i o n zone m i c r o s t r u c t u r e s show t h a t t h e y-phase does n o t
d i s s o l v e . The d i f f u s i o n zone m i c r o s t r u c t u r e s show t h a t t h e B-
p h a s e d i s s o l v e s . T h e r e f o r e , d i s s o l u t i o n o f t h e B-phase c a n o n l y
be r a t i o n a l i z e d , l o g i c a l l y , i n terms o f o c c u r r i n g t o s u p p l y A 1
109

3 0 u
I-
L .
L v
c 4
X 7
rec 4
-c
4 a c a
Q) k
110

111

I-
cn &! I 0 0 1. N
L? v)
9 j.
L? N
9 d
... .................. ................................. t L? I
9 &I I
m m I
9 Y; I
Ln
CD I
9 cp I
m
m Y Y X X J J 3 3 3 3 J J m m k k J r Y M J 9 c ruua
I
4 - I
LD
&I
I
0
I I I I
+ + o x
d
r\
CJ
W 0
+ ln Z 0 rY u
4
Y
5 W U z U t
0 !2
a, a 7 0 u c -4
X 7 rl w rl
4
4 a c a k V
7 -rl cnz k -
c z a-
112

f o r growth o f t h e B+y l a y e r (and t h e o t h e r l a y e r s i n t h e couple).
Second, t h e b u l k f l o w a n a l y s i s showed t h a t t h e amourlt of A 1 l o s t
f r o m t h e B+y a l l o y i n c r e a s e d as t h e C r c o m p o s i t i o n i n t h e f3+Y
a l l o y d e c r e a s e d . The d i f f u s i o n zone m i c r o s t r u c t u r e s showed t h a t
t h e amount of t3 d i s s o l u t i o n i n t h e B+y a l l o y i n c r e a s e d a s t h e
C r c o m p o s i t i o n i n t h e y+y' a l l o y decreased. T h i r d , i n C4 c o u p l e s ,
complete B d i s s o l u t i o n o c c u r r e d . Both t h e b u l k f l o w a n a l y s i s
and y -phase f l u x a n a l y s i s show t h a t A 1 f l o w o c c u r s f r o m t h e B+y
a l l o y t o t h e y + y ' a l l o y . The A 1 c o n t a i n e d i n t h e f3 p h a s e had
t o g o i n t o t h e B+y growth l a y e r . The o n l y mechanism o f t r a n s p o r t
f o r t h e A 1 s u p p l i e d by t h e B p h a s e t o r e a c h t h e g rowth l a y e r i s
t h r o u g h d i f f u s i o n i n t h e y-phase. Fu r the rmore , t h e comple t e B
d i s s o l u t i o n i n C4 c o u p l e s i n d i c a t e s t h a t t h e y p h a s e i s used f o r
t r a n s p o r t o f C r and A 1 t o t h e B+y growth l a y e r . The B-phase
s i m p l y d i s s o l v e s t o s u p p l y A1 n e c e s s a r y f o r growth o f t h e B+y
l a y e r (and t h e o t h e r l a y e r s i n t h e c o u p l e ) . Thus, t h e B and Y
p h a s e s i n t e r a c t t o c a u s e growth of t h e 13+y l a y e r . The maximum
C r f l u x i n t h e y-phase c a u s e s a maximum A1 f l u x i n t h e Y-phase.
I n r e s p o n s e t o t h e maximum A 1 f l u x i n t h e y-phase , and t o s u p p l y
A 1 n e c e s s a r y f o r growth of t h e B+y l a y e r , d i s s o l u t i o n o f t h e B
p h a s e o c c u r s . I t i s t h e s e 13 and y p h a s e i n t e r a c t i o n s which lead
t o t h e b u l k f l o w and b u l k g r a d i e n t s a t t h e 0.1. i n t h e c o u p l e .
Thus, g rowth o f t h e B+y l a y e r c a n be r a t i o n a l i z e d i n terms
o f maximum f l u x e s i n t h e y-phase, and t h e i r a b i l i t y t o c a u s e b u l k
g r a d i e n t s which lead t o growth of t h e l a y e r s . I n c o u p l e C3/S1,
t h e p e r t u b a t i o n s o f f3 p r e s e n t a t t h e 0.1. i n d i c a t e d t h a t t h e f l u x
113

maxima i n t h e y -phase w e r e large enough t o c a u s e a b u l k grad ien t
which would force b u l k f l o w o f A 1 u p i t s g rad ien t a t t h e 0.1.
However, t h e y were n o t l a r g e e n o u g h t t o s u s t a i n t h e b u l k C r gra-
d i e n t , and f l o w o f A 1 up i t s g r a d i e n t , and t h u s growth of t h e y
layer r e s u l t e d . I n c o u p l e s t h a t g r e w B+y l a y e r s , t h e f l u x maxima
and t h e f l u x e s i n t h e 8+y growth l a y e r w e r e l a r g e r t h a n t h e f l u x e s
i n C3/S1. Thus, t h e f l u x e s w e r e large enough t o s u s t a i n a nega-
t i v e b u l k C r g r a d i e n t which would f o r c e b u l k f l o w of A 1 u p i t s
g r a d i e n t and r e s u l t i n B+y growth . I n c o u p l e C3/S2, t h e f l u x e s
r e a c h no maximum, b u t w e r e o f t h e same magn i tude i n t h e y growth
l a y e r as t h e f l u x e s i n C3/S1, as shown i n F i g u r e 4 7 . Thus, no
s u b s t a n t i a l b u l k C r g r a d i e n t c o u l d be g e n e r a t e d wh ich would f o r c e
b u l k A 1 u p i t s g r a d i e n t , and t h u s t h e b u l k A 1 C / D p r o f i l e i n C3/S2
d i d n o t i n c r e a s e a t t h e 0.1. The f l u x e s w e r e l a rge enough, how-
ever, t o grow a y l a y e r . I n c o u p l e C3/S3, t h e f l u x e s a g a i n
r e a c h e d no maximum and w e r e s m a l l e r a t t h e 0.1. t h a n i n C3/S1
and C3/S2, as shown i n F i g u r e 47 . Thus, n o t even a Y l a y e r re-
s u l t e d from i n t e r d i f f u s i o n .
I n summary, t h e a b i l i t y t o g r o w a B + Y l a y e r depends on t h e
a b i l i t y t o g e n e r a t e and s u s t a i n b u l k C r f l ow down a s t r o n g nega-
t i v e g r a d i e n t . The s t r o n g n e g a t i v e C r g r a d i e n t forces b u l k f l o w
of A 1 up i t s g r a d i e n t . The a b i l i t y t o g e n e r a t e and s u s t a i n t h e s e
g r a d i e n t s i s d i r e c t l y r e l a t e d t o t h e a b i l i t y t o g e n e r a t e f l u x
maxima i n t h e y phase . The a b i l i t y t o g e n e r a t e maximum f l u x e s
i n t h e y p h a s e i s d i r e c t l y re la ted t o t h e C r c o m p o s i t i o n (or C r
d i f f e r e n c e ) i n t h e y p h a s e .
114

115
m r/) \ m W a c a . cv rn \ m V . 4 rn \ m u tn al
c
c -rl
tn a, X 3 4 w k u

p Volume Fraction in the B+y Growth Layer
When the Cr composition in the y + y ' alloy decreased, the
bulk A1 composition in the B+y growth layer increased. In the
diffusion zone, the increase in the bulk A1 composition was a
result of increases in the volume fraction of B in the B+y growth
layer. In terms of the diffusion paths, as the Cr composition
in the y+y ' alloy decreased, the diffusion paths translated up
the B+y side of the B+y+y' triangle to higher A1 composition.
The cause of the diffusion path translation (or increase in B
volume fraction) is related to the height to which the diffusion
path rises in A1 composition on the y + y ' side of the triangle.
For couples with S1 as common alloy, the highest A1 composition
point .on the y ' side is where the path exits the triangle on the
y+y ' side. For couples with S2 and S 3 as common alloy, the high-
est A1 composition point on the y ' side is where the diffusion
path exits the y ' phase field into the y+y ' phase field. Thus,
for y+y ' alloys in which a y ' layer results from interdiffusion,
as the Cr composition in the y+y ' alloy decreases, the amount
of diffusion path in the y ' phase field increases. As the amount
of diffusion path in the y ' phase field increases, the higher
it must increase in P.1 composition. The higher the path in-
creases in A1 composition in the y ' phase field, the higher the
path increases in A1 composition on the f3+y side of the triangle,
or, the greater the volume fraction of 6 becomes in the B+y growth
layer. Thus, in order to account for the substantial increase
in A1 composition that occurs in the path segment in the y ' phase
116

f i e l d , a l a r g e r b u l k A 1 d i s c o n t i n u i t y i s created a t t h e t h r e e -
p h a s e i n t e r f a c e i n t h e c o u p l e . T h i s d i scont i r lu l ty is c-l-c.att.d
b y i n c r e a s i n g t h e B volume f r a c t i o n i n t h e B+y growth l a y e r .
To a c c o u n t f o r t h e i n c r e a s e i n b u l k A 1 c o m p o s i t i o n i n t h e
B+y growth l a y e r , as c o n t r o l l e d by t h e y + y ' a l l o y , t h e f l u x max-
i m a i n t h e y-phase of t h e [3+y a l l o y i n c r e a s e . Thus, t h e f l u x
maxima w e r e h i g h e r i n t h e y-phase as t h e C r c o m p o s i t i o n i n t h e
y+y' a l l o y decreased, as shown i n F i g u r e 4 8 f o r c o u p l e s w i t h C 1
as common a l l o y . T h i s o f c o u r s e fo l lows from what h a s b e e n pre-
v i o u s l y p r e s e n t e d . The growth o f t h e B+y l a y e r r e q u i r e s a s t r o n g
n e g a t i v e b u l k C r g r a d i e n t a t t h e s t a r t o f t h e B+y growth l a y e r .
T h i s s t r o n g n e g a t i v e b u l k C r g r a d i e n t f o r c e s b u l k f l o w of A1 up
i t s g r a d i e n t . F o r t h e b u l k A 1 t o f l o w u p steeper g r a d i e n t s
(which o c c u r s as t h e b u l k A 1 c o m p o s i t i o n i n t h e B+y growth l a y e r ,
or volume f r a c t i o n , i n c r e a s e s ) t h e n e g a t i v e b u l k C r g r a d i e n t
mus t become larger. T h i s , i n f a c t , i s o b s e r v e d as t h e y+y ' a l l o y
C r c o m p o s i t i o n d e c r e a s e s . I n o rder t o g e n e r a t e larger n e g a t i v e
b u l k C r g r a d i e n t s , and f o r c e b u l k f l o w of A 1 u p s t e e p e r g r a f i i e n t s ,
t h e f l u x maxima i n t h e y-phase i n c r e a s e . Again , t h i s i s observed
a s t h e y + y ' C r c o m p o s i t i o n decreases.
Y ' L a y e r Format ion
Thr: f o r m a t i o n of 2 y ' l a y e r i n t h p d i f f u s i o f i zone c a n be
a t t r i b u t e d d i r e c t l y t o t h e y + y ' a l l o y c o m p o s i t i o n . V a r i a t i o n s
i n y+y ' a l l o y C r c o m p o s i t i o n from 10 .0 a t . % C r t o 0 a t . % C r
showed t h a t t h e t r a n s i t i o n from a B+y/y+y ' i n t e r f a c e t o a B+y/y '
117

118
w
Y
n
m cn 1 r i U
a c a
k 0 w Q) tn id c a >-
k U
--

i n t e r f a c e (where a y' l a y e r forms i n t h e d i f f u s i o n zone ) o c c u r s
g r a d u a l l y a s t h e C r c o m p o s i t i o n i s decreased. I n terms of t h e
d i f f u s i o n p a t h s , the d i f f u s i o n p a t h t r a n s l a t e s u p t h e y+y' s ide
of t h e B+y+y' t r i a n g l e toward t h e y ' c o r n e r . I n t h e d i f f u s i o n
zone, t h e y ' volume f r a c t i o n a t t h e t h r e e - p h a s e i n t e r f a c e g r a d u a l
i n c r e a s e s as t h e y+y ' a l l o y C r c o m p o s i t i o n d e c r e a s e s u n t i l t h e
p a t h r e a c h e s t h e y ' c o r n e r . Once t h e p a t h r e a c h e s t h e y' c o r n e r ,
a y ' l a y e r forms i n t h e d i f f u s i o n zone. The C r c o m p o s i t i o n i n
the y + y ' a l l o y a t which p o i n t a y ' l a y e r w i l l form i n t h e d i f f u -
s i o n zone h a s been d e t e r m i n e d t o be s l i g h t l y less t h a n 6 . 0 a t . %
C r . Any f u r t h e r d e c r e a s e s i n t h e y + y ' a l l o y C r c o m p o s i t i o n o n l y
l e a d s t o i n c r e a s e d y ' growth.
B+y and y ' Growth L a y e r K i n e t i c s
As t h e C r c o m p o s i t i o n i n t h e B+Y a l l o y decreased, t h e amount
of B + Y growth d e c r e a s e d . From t h e s t a n d p o i n t o f b u l k c o m p o s i t i o n
d i f f e r e n c e s as d r i v i n g f o r c e s , t h e decrease i n t h e amount of B+y
growth w a s e x p e c t e d . A s t h e b u l k C r d i f f e r e n c e be tween B + Y a l l o y
and y + y ' a l l o y decreases, t h e d r i v i n g f o r c e f o r B+y g rowth i s
e x p e c t e d t o d e c r e a s e and t h e data shows t h a t i t does. I n terms
of t h e C r and A 1 f l u x e s i n t h e y-phase, t h i s d e c r e a s e i n B+y
g rowth c a n a l s o be r a t i o n a l i z e d . The C r and A 1 f l u x e s i n t h e
B+y growth l a y e r , and a t t h e threcs-;hase i n t e r f a c e s , w e r e t y p i c a l l y
lower as t h e B+y a l l o y C r c o m p o s i t i o n decreased. The i n t e r f a c e
v e l o c i t y i s r e l a t e d t o a m a s s b a l a n c e a t t h e i n t e r f a c e by:
B + Y - J Y + Y ' o r Y' AC d c / d t = JCr,A1 C r , A 1 (1)
119
where AC i s t h e C r o r A 1 compos i t ion d i f f e r e n c e across t h e i n t e r -
face, d E / d t i s t h e i n t e r f a c e v e l o c i t y ,
o r A 1 i n t h e B or y phase on t h e B+y s i d e o f t h e i n t e r f a c e and
B+y J C r , A 1 i s t h e f l u x o f C r
'+" Or " is t h e f l u x of C r o r A 1 i n t h e y and y' p h a s e s , i f J C r , A 1 , t h e i n t e r f a c e i s B+y/y+y', or t h e f l u x of C r o r A 1 i n t h e y'
phase , i f t h e - i n t e r f a c e i s B+y/y'. I f t h e i n t e r f a c e i s B+y/y+y',
t h e s imi l a r y' volume f r a c t i o n s on t h e y + y ' s i d e o f t h e i n t e r f a c e
i n a l l c o u p l e s i n d i c a t e s t h a t JCr,Al Y+Y' is a p p r o x i m a t e l y c o n s t a n t
f o r a l l c o u p l e s . L i k e w i s e , i f t h e i n t e r f a c e i s y', t h e s i m i l a r
C r and A 1 c o n c e n t r a t i o n g r a d i e n t s i n t h e y' phase a t t h e i n t e r -
is a p p r o x i m a t e l y cons- face i n a l l c o u p l e s i n d i c a t e s t h a t JCr,A1 Y'
t a n t f o r a l l c o u p l e s . Thus, because AC i s f i x e d , as JCr,A1 B+y de-
creases, t h e i n t e r f a c e v e l o c i t y d c / d t mus t d e c r e a s e , and t h i s
leads t o a d e c r e a s e i n t h e amount o f B+y growth.
As t h e C r compos i t ion i n t h e y+y' a l l o y d e c r e a s e d , t h e
amount of B+y growth d e c r e a s e d . A t f i r s t , t h i s would seem t o b e
a c o n t r a d i c t i o n because as t h e b u l k C r d i f f e r e n c e be tween B+y
a l l o y and y+y' a l l o y i n c r e a s e s , t h e d r i v i n g force f o r B+y growth
would be e x p e c t e d t o i n c r e a s e . But , n o t o n l y B+y growth m u s t be
c o n s i d e r e d , b u t a l s o y' growth ( and y+y' growth f o r y a l l o y S3).
As t h e y+y' a l l o y C r compos i t ion d e c r e a s e s , t h e amount o f y'
growth iqcreases. Thus, if the amount of growth of e a c h l a y e r
i s added fo r e a c h couple ( e . g . f o r C 2 / S 1 , B+y growth ( 3 6 0 ~ ) ;
f o r C 2 / S 2 , B+y and y growth (438um); and fo r C2/S3, B+y, y', and
yi-y ' g m w t h (518pmI1, t h e t o t a l amount of growth i n c r e a s e s a s
t h e y+y' compos i t ion d e c r e a s e s , i n a c c o r d w i t h a n i n c r e a s e d d r i v -
120
i n g force.
From t h e s t a n d p o i n t of f l u x e s , t h e C r and A 1 f l u x e s i n t h e
y-phase d e c r e a s e d r a p i d l y i n t h e B+y growth l a y e r s and t o l o w e r
v a l u e s as t h e y+y ' C r compos i t ion d e c r e a s e d . From Eqn. (11, t h e
decrease i n t h e f l u x v a l u e s a t t h e i n t e r f a c e would lead t o a de-
crease i n t h e i n t e r f a c e v e l o c i t y , and t h e r e f o r e a d e c r e a s e i n
t h e amount o f B+y growth. The amount o f y ' growth i n c r e a s e d
as t h e y+y' a l l o y C r compos i t ion d e c r e a s e d .
growth can a l so be r a t i o n a l i z e d i n t e rms o f f l u x e s a t the i n t e r -
face. The C r c o n c e n t r a t i o n g r a d i e n t a t t h e y'/y+y' i n t e r f a c e
i n c r e a s e d as t h e y+y' a l l o y C r compos i t ion d e c r e a s e d . Because
the C r f l u x a t t h e i n t e r f a c e i s d i r e c t l y p r o p o r t i o n a l t o t h e C r
c o n c e n t r a t i o n g r a d i e n t a t t h e i n t e r f a c e , t h e C r f l u x would be
l a rger a t t h e y'/y+y' i n t e r f a c e as t h e y+y ' a l l o y C r c o m p o s i t i o n
d e c r e a s e d . The l a r g e r C r f l u x would l e a d t o a n i n c r e a s e d growth
v e l o c i t y o f t h e y' l a y e r , and t h u s t h e amount o f y' growth would
i n c r e a s e .
The amount of y'
The d e c r e a s e i n B+y growth ar?d increase i n y ' growth as t h e
y+y' a l l o y C r c o m p o s i t i o n d e c r e a s e s correlates v e r y w e l l w i t h
t h e b u l k f l o w a n a l y s i s . For c o u p l e s w i t h y+y' a l l o y S1 as common
a l l o y , a l l t h e C r and A 1 t h a t d i f f u s e d i n S1 c o n t r i b u t e d t o form-
i n g a B+y l a y e r . For c o u p l e s w i t h y+y' a l l o y S2 as common a l l o y ,
t h e volume f r a c t i o n of B i n t h e B+y growth l a y e r i s h i g h e r , and
a y' l a y e r forms . The amount of C r and A 1 t h a t d i f f u s e s i n t o
S2 must go i n t o forming t h e h i g h e r b u l k A 1 B+y l a y e r and t h e y'
l a y e r .
4
. Although more C r and A 1 i s l o s t f r o m t h e B+y a l l o y s w i t h
121

S2 as common a l l o y , t h e amount o f C r and A 1 t h a t d i f f u s e s i n t o
S2 c a n n o t p o s s i b l y g r o w a la rger , h i g h e r b u l k A 1 B+y l a y e r t h a n
in S1 c o u p l e s , and a t t h e same t i m e grow a y ' l a y e r . Thus a S2
c o u p l e s r e s u l t i n sma l l e r , h i g h e r b u l k A 1 B+y l a y e r s , and a y '
l a y e r .
Summary __-- The d i f f u s i o n p a t h s f o r c o u p l e s i n S e r i e s 1, 2 , and 3 , are
r e p l o t t e d i n F i g u r e s 4 9 , 50 , and 51. From t h e s e F i g u r e s it c a n
be s e e n t h a t t h e y+y ' a l l o y c o m p o s i t i o n d e t e r m i n e s where t h e d i f -
f u s i o n p a t h e x i t s t h e B+y s i d e o f t h e ~ + y + y ' t r i a n g l e . Thus, t h e
d i f f u s i o n p a t h formed be tween t h e B+y and y + y ' a l l o y m u s t m e e t
t h i s f i x e d p o i n t . H o w t h e p a t h p r o c e d e s from t h e ~ + y a l l o y t o
t h i s f i x e d p o i n t i s a f u n c t i o n of t h e B+y a l l o y c o m p o s i t i o n , and
i n p a r t i c u l a r , t h e C r c o m p o s i t i o n i n t h e y-phase o f t h e @+y a l -
l o y . I n t e r d i f f u s i o n w i t h B+y a l l o y s of h i g h y-phase c o m p o s i t i o n s
r e s u l t s i n 8+y growth a s t h e mode f o r t h e p a t h t o r e a c h t h e
f3tyty ' t r i a n g l e . The growth o f t h e B+y l a y e r i s a r e s u l t o f
s t r o n g n e g a t i v e b u l k C r g r a d i e n t s f o r c i n g b u l k f l o w of A 1 up i t s
g r a d i e n t . The c a u s e of t h e g r a d i e n t s i s d i r e c t l y related t o maxi-
mum f l u x e s i n t h e Y-phase. I n t e r d i f f u s i o n w i t h B+y a l l o y s o f
l o w y-phase C r c o m p o s i t i o n r e s u l t s i n y l a y e r growth a s t h e mode
f o r t h e p a t h t o r e a c h t h e f3+y+y' t r i a n g l e . The r e a s o n a y l a y e r ,
and n o t a B+y l a y e r , i s grown i s d i r e c t l y r e l a t e d t o f l u x maxima
i n t h e y-phase b e i n g i n s u f f i c i e n t t o s u s t a i n a s t r o n g n e g a t i v e
b u l k C r g r a d i e n t . The i n a b i l i t y t o s u s t a i n t h e b u l k C r g r a d i e n t
leads t o t h e i n a b i l i t y t o s u s t a i n b u l k f low of Al up i t s g r a d i e n t
122

>
12 3

Q 0 ;< v)
I
>
. ( I . . , , . . . 124
. .. , . . . . . . . . . . , . . . . . . . , . . . , , ... ~ . . .

>
h
m Cn \ m V . N u . 4 V v
m
u1 aJ 4 k aJ v)
c 4
u) Q)
a 3 0 u k 0 VI
0 c 4J rd a c 0 4 0 3 cu cu -4
4
n
4 In aJ k 3 rn rl G.i
I . , . . ., . , . I . , , I . . , . I , . , ,
125 . -. . .. . . . , . . , . , , . , 1 , . . . . . , .. , , , - _. - , . . ,. I
for @+y growth t o o c c u r .
The shape o f t h e p a t h i n t h e B t Y phase f i e l d i s d e t e r m i n e d
by volume f r a c t i o n a d j u s t m e n t s i n t he B and Y p h a s e s i n accord
w i t h s u p p l y i n g C r and A 1 f o r growth o f t h e l a y e r s . The C r i s
s u p p l i e d p r i m a r i l y by t h e Cr - r i ch y-phase, and t h e A 1 i s sup-
p l ied p r i m a r i l y by t h e A l - r i c h B-phase. Thus, i n a l l c o u p l e s ,
r e d u c t i o n s i n t h e volume f r a c t i o n of B o c c u r r e d i n t h e B+y a l l o y .
These B volume f r a c t i o n r e d u c t i o n s lead t o t h e "V" shaped p a t h s
i n t h e B+Y phase f i e l d .
F i g u r e 52 r e p l o t s t h e d i f f u s i o n p a t h s f o r c o u p l e s w i t h C 1
as common a l l o y .
a l l o y c o m p o s i t i o n d e t e r m i n e s t h e A1 compos i t ion a t which p o i n t
t h e p a t h i n t h e B + Y phase f i e l d w i l l e n t e r t h e B+y s i d e o f t h e
B+Y+Y' t r i a n g l e . T h i s means t h e y+y' a l l o y c o m p o s i t i o n d e t e r -
mines t he volume f r a c t i o n of B i n t h e B+y growth l a y e r . The y+y'
a l l o y compos i t ion a l s o d e t e r m i n e s whe the r a y' l a y e r w i l l form
i n t h e d i f f u s i o n zone. A s t h e y+y' a l l o y C r c o m p o s i t i o n de-
creases, t h e amount o f C r and A1 lost f rom t h e B+y a l l o y i n -
creases. A s t h e amount of A 1 l o s t f rom t h e B+y a l l o y i n c r e a s e s ,
greater r e d u c t i o n s i n t h e volume f r a c t i o n o f B o c c u r , and hence
t h e "V" s e c t i o n o f p a t h d e c r e a s e s t o l o w e r A 1 compos i t ion . Fur-
t he rmore , as t h e y+y' a l l o y C r compos i t ion d e c r e a s e s , t h e amount
of B+y growth d e c r e a s e s , and t h e amount of y' growth i n c r e a s e s .
From F i g u r e 5 2 it can be s e e n t h a t t h e y+y'
Compar ison t o B+y/y N i - C r - A 1 -- I n t e r d i f f u s i o n
One of the p u r p o s e s of t h i s s t u d y w a s t o compare B+y/y+y'
i n t e r d i f f u s i o n t o a p r e v i o u s s t u d y (19) of B+y/y i n t e r d i f f u s i o n .
126

I ~
I
L
127

In Nesbitt's study (191, higher bulk A1 gradients than Cr gradients
were present the diffusion couples. Interdiffusion of B+y
alloys with the y Ni-Cr-A1 alloys used in Nesbitt's study (19)
always resulted in recession of f3 in the B+Y alloy. In real
coating/superalloy systems, interdiffusion also results in re-
cession of B in the coating. The y alloys used in Nesbitt's
study (19) were compositionally similar in Ni, Cr, and A1 com-
positions to Ni-base superalloys. The y + y ' Ni-Cr-A1 alloys used
in this study were structurally similar to Ni-base superalloys.
The fact that Nesbitt's study (19) showed results similar to real
coating/superalloy systems and this study did not leads to an
important conclusion: In trying to model interdiffusion in real
coating/superalloy systems using coating/Ni-Cr-A1 substrates,
the compositional similarity between Ni-Cr-A1 alloys and super-
alloys is much more important than the structural similarity.
The results of Nesbitt's study have since been verified by
Pilsner with a real coating/superalloy system ( 4 4 ) .
The fact that Nesbitt's (19) and Pilsner's (44) work have
shown that interdiffusion in real coating/superalloy systems can
be modeled with compositionally similar y Ni-Cr-A1 substrates
gives this study some important implications. It logically
makes sense by analogy to Nesbitt's study that, if the A 1
composition in superalloys was raised to the A1 composition used
in the y+y' alloysof this study, the f3+y/y+y' interdiffusion
. behavior seen in this study would occur in the real system. If
this did happen, interdiffusion would not be detrimental, but
128

but beneficial because growth of the coating into the substrate
would result. Thus the A1 that diffused from the coating into the
substrate would not be lost (thereby decreasing the life of the
coating), but in fact would contribute to increasing the 1i.fe
of the coating (by growing more coating).
work could then be used to understand the interdiffusion pheno-
mena. This analogy, however, is very simplistic and could only
be proven with experimentation. It does though lead to some
very exciting implications, and should be pursued in greater
detail.
The results of this
129

C o n c l u s i o n s
1 . The f3+y a l l o y c o m p o s i t i o n , and i n p a r t i c u l a r t h e Y-phase C r
c o m p o s i t i o n i n t h e B+y a l l o y , d e t e r m i n e w h e t h e r a B+Y o r Y
l a y e r will r e s u l t f rom i n t e r d i f f u s i o n .
a. The growth o f t h e B+y l a y e r i s a r e s u l t of a s t r o n g n e g a t i v e b u l k C r g r a d i e n t f o r c i n g b u l k f l o w o f A 1 u p i t s g r a d i e n t . The a b i l i t y t o g e n e r a t e t h e s e gra- d i e n t s i s d i r e c t l y r e l a t e d t o maximum C r and A 1 f l u x e s i n t h e y-phase.
Growth o f t h e l a y e r s r e q u i r e s C r and A 1 t o be sup- p l i e d by t h e @ and y p h a s e s . The C r i s s u p p l i e d p r i m a r i l y by t h e Y-phase and t h e A 1 i s s u p p l i e d p r i m a r i l y by t h e B-phase. I n s u p p l y i n g A l , t h e 6- p h a s e d i s s o l v e s , and t h u s r e d u c t i o n s i n t h e volume f r a c t i o n o f B o c c u r i n t h e B + Y a l l o y .
b.
2 . The y4-y' a l l o y c o m p o s i t i o n d e t e r m i n e s how t h e d i f f u s i o n p a t h
p r o c e e d s t h r o u g h t h e 6 +y +y ' t r i a n g l e .
a. As t h e y + y ' a l l o y C r c o m p o s i t i o n d e c r e a s e s , t h e d i f f u s i o n p a t h t r a n s l a t e s up t h e y + y ' s i d e toward t h e y' c o r n e r . When t h e p a t h r e a c h e s t h e y' c o r n e r a y ' l a y e r forms i n t h e d i f f u s i o n zone . The c r i t i c a l C r c o m p o s i t i o n o f t h e y + y ' a l l o y f o r y' l a y e r f o r m a t i o n t o o c c u r h a s been d e t e r m i n e d t o be s l i g h t l y less t h a n 6 . 0 a t . % C r .
b. F o r B+y a l l o y s i n which a B+y l a y e r r e s u l t e d from i n t e r d i f f u s i o n , as t h e C r c o m p o s i t i o n i n t h e Y+Y' a l l o y d e c r e a s e d , t h e volume f r a c t i o n o f 6 i n t h e @+y growth l a y e r i n c r e a s e d . T h i s i n c r e a s e i n 8 volume f r a c t i o n c a u s e d t h e d i f f u s i o n p a t h s t o t r a n s l a t e up t h e B+y s i d e o f t h e B + Y + Y ' t r i a n g l e t o h i g h e r A1 c o m p o s i t i o n .
3 . I n g e n e r a l , as t h e C r c o m p o s i t i o n o f t h e B+y a l l o y i n c r e a s e s
( p e r f i x e d y + y ' a l l o y c o m p o s i t i o n ) t h e amount o f B + y growth i n -
creases. As t h e C r c o m p o s i t i o n i n t h e y+y' a l l o y decreases
( p e r f i x e d B+y a l l o y c o m p o s i t i o n ) , t h e amoun to f B+y o r y growth
130

decreases and the amount of y ' growth increases.
Comparing the results of this study to the results of
Nesbitt's study (19) using y Ni-Cr-A1 alloys as substrates, it
can be concluded that:
1. Interdiffusion in real coating/superalloy systems
is accurately simulated with coating/y Ni-Cr-A1
substrates. Thus, in trying to model interdiffu-
sion in real coating/superalloy systems using coat-
ing/Ni-Cr-A1 substrates, the compositional similar-
ity between superalloys and y Ni-Cr-A1 substrates
is more important than the structural similarity
between superalloys and y+y ' Ni-Cr-A1 substrates.
131

REFERENCES
1. P. Lane, Jr. and N . M. Geyer , J. Metals, l8, 186 ( 1 9 6 6 ) .
2. G. W. G o w a r d , D. H. Boone, a n d C. S . G i g g i n s , T r a n s . ASM, 60, 228 (1967) .
3 . G. W. G o w a r d , S o u r c e Book f o r E l e v a t e d Tempera tu re A p p l i c a t i o n s , pp. 369-386, ASM, 1979.
4 . W. K . H a l n a n ' a n d D. Lee, High Tempera tu re P r o t e c t i v e Coa t inqs , S. C. S i n g h a l , E d i t o r , AIME, p. 3 , 1982.
5. M. Nakamori, Y . Harada, and I. Hukua, Hiqh Tempera tu re P r o t e c t i v e C o a t i n q s , S. C. S i n g h a l , E d i t o r , A I M E , P. 175, 1982.
6 . C. J. S p e n g l e r , S . T. S c h e i r e r , and D. C. B a r k s d a l e , Hiqh Tempera tu re P r o t e c t i v e C o a t i n q s , S. C. S i n g h a l ? E d i t o r , A I M E , p. 189, 1982.
7 . G. W. G o w a r d , J. Metals, 22, 3 1 (1970) .
8. S. R. Lev ine , M e t . T r a n s . , s, 1237 (1978) .
9 , F. S. P e t t i t and G. W. G o w a r d , Me ta l lu r s i ca l T r e a t i s e s , J. K. T i e n and J. F. E l l i o t t , E d i t o r s , AIME, p. 603, 1981.
10 . S. J. Gr i sa f f e , The S u p e r a l l o y s , J o h n Wiley a n d Sons , N e w York, p. 341, 1972.
11. J. A. N e s b i t t and R . W. Heckel , Hiqh Tempera tu re P r o t e c - t i v e C o a t i n q s , S . C. S i n g h a l , E d i t o r , TMS-AIME, p. 76, 1982.
12. C. A. B a r r e t t and C. E. Lowel l , O x i d a t i o n of Metals, 11, 200 ( 1 9 7 7 ) .
13. R . G . Ubank, Rev. I n t . H t e s . Temp. e t R e t r a c t . 14, 21 (1977) .
14 . 2. W. G o w a r d , High Tempera tu re C o r r o s i o n , R . A . Rapp, E d i c o r , NACE, p . 5 5 6 , 1 9 8 3 .
15. R. F. Decker , " S t r e n g t h e n i n g Mechanisms i n Nicke l -base S u p e r a l l o y s , " C l i m a x Molybdenum Company Symposium, Z u r i c h , S w i t z e r l a n d , p. 3 , ( 1 3 6 9 ) .
132

16. R. F. Decker and C. T. Sims, The Superalloys, John Wiley and Sons, New York, p. 36, 1972.
17. P. Kofstad, Hiqh Temperature Oxidation of Metals, John Wiley and Sons, New York, pp. 112-146, 1966.
18. J. A. Nesbitt, "Solute Transport During Cyclic Oxida- tion of Ni-Cr-A1 Alloys," M.S. Thesis, Michigan Technological University, Houghton, MI, 1981, (also available as NASA Contractor Report No. 165544, May 1982).
19. J. A. Nesbitt, "Overlay Coating Degradation by Simul- taneous Oxidation and Coating/Substrate Interdif- fusion," Ph.D. Dissertation, Michigan Technological University, Houghton, MI, 1983.
20. R. A. Mulford and D. P. Pope, Acta. Metall., 21, p.1375, (1973).
21 P. K. Footnear and B. P. Richards, J. Materials Science, - I 17 p. 2141, (1982).
22. R. A. Ricks, A. J. Porter, and R. C. Ecob, Acta. Metall., 31, p. 43, (1983). -
23. R. W. Guard, J. H. Westbrook, Trans. AIME, 215, p. 807, (1959).
2 4 . C. Lall, S . Chin, and D. P. Pope, Met. Trans., g, p. 1323, (1979).
25. S. Chakravortz, D.R.F. West, Metals Tech., p. 414, (Oct. 1980).
26. A . Baldan, D.R.F. West, J. Materials Science, lti, p. 24, (1981).
27. B. Reppich, Acta. Metall., 30, p. 87, (1982).
28. D. H. Maxwell, J. F. Baldwin, and J. F. Radavich- Metallurgia and Metal Forming, p. 3 3 3 , (Oct. 1375).
29. A. D. Smigelskas and E. 0 . Kirkendall, Trans. AIME, - I 171 P. 130, (1974).
30. B. D. Cullity, Elements of X-Ray Diffraction, Addison- Wesley Publishing Co., pp. 506-507, 1978.
133 I
31.
32.
33.
34 . 35.
36.
3 7 .
38.
39.
40.
41
42.
43.
44.
___--_---- Metals Handbook, ASM, 8th Edition, 8, p. 288, 1973.
Metals ______- Handbook ASM, Gth Edition, 1, p. 342, 1972.
A. Smigelskas and E. Kirkendall, Trans. AIME, 171, 130 (1947). L. Onsager, Phys. Rev., 37, 405, (1931).
L. Onsager, Phys. Rev., 38, 2265, (1931). L. Onsager, Ann. N.Y. Acd. Sci., 46, 241, (1945-6). J. S. Kirkaldy, Can. J. Phys. 35, 435, (1957) A. S. Norkiewicz and J. I. Goldstein, Met. Trans., a, 891,
(1975).
D. Tu, "Diffusion and Pack Aluminizing Study in the Ni-Cr- A1 System, Ph.D. Dissertation, SUNY, Stoney Brook, NY, 1982.
M.M.P. Janssen, Met. Trans., 4, 1623, (1973).
A. J. Hick1 and R. W. Heckel, Met. Trans., e, 431, (1975). IMSL Library Reference Manual, Chapter I, Vol. 2, 9th
Edition, IMSL, Inc., 1982.
M L. James, G. M. Smith, and J. C. Wolford, Analog and Digital Computer Methods, International Textbook Co., Scranton, pp. 323-7, 1964.
B. H. Pilsner, "The Effects of Substrate Composition (MAR-M247) on Coating Oxidation and Coating/Substrate Interdiffusion," M.S. Thesis, Michigan Technological University, Houghton, MI, 1984.
134

APPENDIX A
Bulk Composi t ion A n a l y s i s
The N i , C r , and A 1 b u l k c o m p o s i t i o n s i n a l l t h e a l l o y s
u s e d i n t h i s s t u d y were d e t e r m i n e d by u s e of a s c a n n i n g elec-
t r o n mic roscope (SEMI, a n e n e r g y d i s p e r s i v e X-ray spectrometer
(EDS) , and a ZAF n u m e r i c a l c o r r e c t i o n scheme. The SEM w a s a
JEOL model 35C operated a t a n a c c e l e r a t i n g v o l t a g e of 2 0 K e V
and a beam c u r r e n t o f a p p r o x i m a t e l y l*lO-’ amperes. The EDS
s y s t e m c o n s i s t e d o f a n EDAX S i ( L i ) c o u n t i n g s y s t e m c o u p l e d t o
a 711 series m u l t i c h a n n e l a n a l y z e r . The EDS s y s t e m w a s con-
n e c t e d t o a Texas I n s t r u m e n t 733 ASR h i g h s p e e d da ta t e r m i n a l
i n t e r f a c e d t o a Data Genera l NOVA2 mini -computer . The min i -
computer c o n t a i n e d b o t h s t r i p p i n g r o u t i n e s and v a r i o u s cor-
r e c t i o n a l schemes.
The c o r r e c t i o n scheme u s e d i n t h i s s t u d y t o o b t a i n quan-
t a t i v e b u l k c o m p o s i t i o n s w a s t h e w e l l e s t a b l i s h e d ZAF method
(1) . The ZAF method cor rec ts measured r e a l i t i v e X-ray i n t e n -
s i t y da t a f o r t h r e e p r i m a r y s o u r c e s of i n t e r f e r e n c e be tween
e l e m e n t s i n t h e a l l o y . These t h r e e s o u r c e s o f i n t e r f e r e n c e
are:
1 . An atomic number e f f e c t ( Z ) , which o c c u r s b e c a u s e an e l e m e n t sca t te rs and r e t a r d s i n c i d e n t elec- t r o n s d i f f e r e n t l y i n a n a l l o y as opposed t o t h e p u r e s t a t e .
2 . A b s o r p t i o n ( A ) of c h a r a c t e r i s t i c X-rays of o n e e l e m e n t by t h e o t h e r e l e m e n t s i n t h e a l l o y .
3 . F l u o r e s c e n c e ( F ) of X-rays g e n e r a t e d by a n ele- ment as i t absorbs p r i m a r y X-rays g e n e r a t e d by o t h e r e l e m e n t s .
A-1

E q u a t i o n s f o r t h e s e i n t e r f e r e n c e phenomena are w e l l d e v e l o p e d
( 1 - 2 ) . I n g e n e r a l , t h e c o m p o s i t i o n of e l e m e n t i can b e rep-
r e s e n t e d by:
Ci = (ZAFliKi (1)
where: Ci = c o m p o s i t i o n p f e l e m e n t i i n t h e a l l o y
2 = atomic number c o r r e c t i o n
A = a b s o r p t i o n c o r r e c t i o n
F = F l u o r e s c e n c e c o r r e c t i o n
Ki = R a t i o o f t h e measured X-ray i n t e n s i t y o f e l e m e n t i i n t h e a l l o y t o t h e m e a - s u r e d X-ray i n t e n s i t y of p u r e e l e m e n t i ( o f t e n r e f e r r e d t o as "K-rat io") .
C o n s i d e r i n g t h e N i - r i c h p o r t i o n o f t h e N i - C r - A 1 . s y s t e m
u s e d i n t h i s s t u d y , t h e i n t e r f e r e n c e e f f e c t s a n d t h e corres-
pond ing c o r r e c t i o n s w i l l be la rger f o r A 1 c o n c e n t r a t i o n p r e -
d i c t i o n s t h e n f o r C r a n d N i c o n c e n t r a t i o n p r e d i c t i o n s . T h i s
c a n b e s e e n by examin ing t h e c r i t i c a l p a r a m e t e r s i n e a c h
c o r r e c t i o n term.
The atomic number c o r r e c t i o n (Z) i s c r i t i c a l l y d e p e n d e n t
upon t h e a v e r a g e atomic number of t h e a l l o y . I f t h e r e i s a
d i f f e r e n c e be tween a v e r a g e atomic number o f t h e a l l o y and
t h a t of t h e p u r e e l e m e n t , t h a n a c o r r e c t i o n i s r e q u i r e d . I n
t h i s s t u d y , t h e average atomic nurnbcrs of t h e a l l o y s r;:-.ged
from 23.58 t o 25 .6 . Comparing t h e s e numbers t o t h e atomic
numbers of A1 (Z=13) , C r ( Z = 2 4 ) , a n d N i (Z=28) shows t h a t A1 h a s
t h e l a r g e s t d i f f e r e n c e . Thus, AI w i l l have t h e l a r g e s t Z
A-2

c o r r e c t i o n , w i t h C r h a v i n g a Z c o r r e c t i o n o f almost 1.
The t h r e e m a j o r v a r i a b l e s a f f e c t i n g t h e a b s o r p t i o n cor-
r e c t i o n (A) are t h e o p e r a t i n g v o l t a g e , t h e t a k e o f f a n g l e
( a n g l e a t which X-rays emerge from t h e s a m p l e ) , and t h e m a s s
a b s o r p t i o n c o e f f i c i e n t . A b s o r p t i o n i s minimized as t h e o p e r -
a t i n g v o l t a g e i s d e c r e a s e d , t h e t a k e o f f a n g l e i s i n c r e a s e d ,
o r t h e mass a b s o r p t i o n c o e f f i c i e n t i s decreased. Because t h e
o p e r a t i n g v o l t a g e and t a k e o f f a n g l e a re f i x e d , t h e m a g n i t u d e o f
t h e a b s o r p t i o n c o r r e c t i o n c a n b e d e t e r m i n e d from t h e m a s s ab-
s o r p t i o n c o e f f i c i e n t s . I n t h i s s t u d y , t h e m a s s a b s o r p t i o n
c o e f f i c i e n t s r a n g e d from 2370-2718 cm2/g f o r A l , 0-141 c m 2 / g
f o r C r , and 61-113 cm2/g f o r N i . By f a r , A1 h a s t h e l a rges t
m a s s a b s o r p t i o n c o e f f i c i e n t s , and t h u s w i l l have t h e l a r g e s t
a b s o r p t i o n c o r r e c t i o n .
F l u o r e s c e n c e occurs when t h e e n e r g y o f a c h a r a c t e r i s t i c
X-ray peak from one e l e m e n t i n t h e a l l o y i s g rea t e r t h a n t h e
c r i t i c a l e x c i t a t i o n e n e r g y f o r e m i s s i o n o f a c h a r a c t e r i s t i c
X-ray f r o m a n o t h e r e l e m e n t i n t h e a l l o y . A f l u o r e s c e n c e cor-
r e c t i o n (F ) i s n e c e s s a r y b e c a u s e more X-rays are g e n e r a t e d
from t h e f l u o r e s c e d e l e m e n t t h a n would have been p roduced by
e l e c t r o n e x c i t a t i o n a l o n e . The c r i t i c a l e x c i t a t i o n v o l t a g e s
Y f o r K, X-ray g e n e r a t i o n f o r N i , C r , and A1 a re 8 . 3 3 , 5 . 9 9 , and
1 . 5 6 KV r e s p e c t i v e l y . Thus, A1 w i l l b e f l u o r e s c e d by C r a n d
N i , and w i l l have t h e l a r g e s t f l u o r e s c e n c e c o r r e c t i o n .
I n t h i s s t u d y i t w a s found t h a t t h e Z , A , and F correc-
t i o n s f o r C r and N i w e r e s m a l l , o r v e r y n e a r 1. The Z and F
A-3 I

corrections for A1 were small, but the A correction was quite
large - many times double the Z and F correction. Each correction term, Z, A, and F, is a function of the
composition of the element i in the alloy (i.e., 2 , A, F =
f ( C i ) ) . Thus, compositions obtained from Eqn. (1) involve
iteration. The general sequence of events involved in obtain-
ing compositions with the ZAF method are as follows:
1. U s e the K-ratio to estimate a composition for the Z, A , and F correction terms.
2. Calculate the composition using Eqn. (1).
3 . Repeat until convergence is achieved.
Many modifications of the basic ZAF correction scheme have
been incorporated into computer programs and are commercially
available. The ZAF correction scheme used to obtain bulk com-
positions in this study was a modified version of the computer
program designated FRAME ( 3 - 4 ) . Input into the program consisted
of the K ratios for each element in the alloy, the characteristic
X-ray line measured (Ka in this study), the operating voltage,
and the angles between the incident electron beam, sample sur-
face, and EDS collector.
To obtain bulk compositions the SEM was operated in a scan
mode. Using unetched samples, a magnification of 500X was fourid
to be safficient to obtain a representative area of the microstruc-
ture. Thespectrum generated by a given sample was measured through
A-4

4 0 0 , 0 0 0 c o u n t s . The s p e c t r u m w a s t h e n e n t e r e d i n t o the mini -
computer where t h e c h a r a c t e r i s t i c s p e a k s o f N i , C r , and A 1 w e r e
s t r i p p e d from t h e c o n t i n u o u s spec t rum. The s t r ipped Ka peaks
w e r e c o n v e r t e d i n t o K-ratios which w e r e t h e n u s e d a s i n p u t i n t o
t h e ZAF c o r r e c t i o n program as p r e v i o u s l y described. O u t p u t of
t h e program c o n s i s t e d o f a l i s t i n g o f t h e w e i g h t f r a c t i o n s f o r
e a c h e l e m e n t . I n a l l cases, t h e sum of t h e w e i g h t f r a c t i o n s of
N i , C r , and A 1 w a s i n t h e r a n g e 0.95-1.00.
A- 5

REFERENCES
1. 3. I. Goldstein, D. E. Newbury, P. Echlin, D. C. Joy, C. Fiori, E. Lifshin, Scanning Electron Microscopy and X-Ray Microanalysis, Plenum Press, N.Y., Chapter 7, 1981.
Van Nostrand and Reinhold Co., N . Y . , 1981. 2. K.F.J. Heinrich, Electron Beam X-Ray Microanalysis,
3. EDIT/EP Operators Manual, EDAX International, Inc., Manual #80-00503-00, 1975.
4. J. I. Goldstein, H. Yakowitz, Practical Scanninq Elec- tron Microscopy, Plenum Press, N.Y., Chapter 10, 1975.
A-6 1

APPENDIX B
--- Phase Concentration Measurements
All 6, y, and y' phase compositions and all concentra-
tion/distance profiles were determined by use of an electron
microprobe (EM) and a subsequent ZAF correction scheme (ZAF).
The electron microprobe was a Materials Analysis Co. model
MAC400, operated at 15KV and 150 microamperes. The electron
probe spot size was estimated (1) to be approximately 4-5pm.
Two wavelength spectrometers were utilized to measure Cr and
A1 X-rays. The Cr X-rays were measured ir a sealed detector
with a LiF crystal while the A1 X-rays were measured in a
flowing P-N (90% Ar, 10% CH4) gas detector with a TAP crystal.
Cr and A1 concentrations on y, y' and B alloys of known com-
position were measured to assess the accuracy of the EM/ZAF
procedure.
Measurement Procedure
Measurements of standard compositions, phase compositions,
and concentration/distance profiles involved collecting X-ray
intensities for Cr and Al. The X-rays were counted for six
ten second periods at each spot were a measurement was taken.
At the start, finish, and at various intervals during the
measurement procedure, the pure element (Cr and Al) X-ray
intensities were measured. Again, s i x ten second counts were
made. The sample current was measured at each time the pure
I B-1

e l e m e n t s were measured u s i n g a F a r a d a y c u p on t h e sample
holder. The s t a r t i n g and f i n i s h i n g t i m e , and t h e t i m e a t
which e a c h spot w a s measured w a s a l so r e c o r d e d . The aver-
aged p u r e e l e m e n t i n t e n s i t i e s a t t h e s t a r t and f i n i s h , t h e
averaged measured i n t e n s i t i e s of t h e sample , and t h e t i m e of
each, w e r e i n p u t i n t o a computer program ( 2 ) t o correct f o r
background, i n s t r u m e n t d r i f t , and dead t i m e . The corrected
i n t e n s i t i e s fo r t h e sample w e r e d i v i d e d b y t h e corrected
p u r e e l e m e n t i n t e n s i t i e s t o p roduce K ra t ios fo r C r a n d A l .
The K r a t i o s w e r e t h e n i n p u t i n t o t h e ZAF c o r r e c t i c n program.
The ZAF c o r r e c t i o n programMULTI8 ( 3 ) w a s u s e d t o c a l c u -
l a t e C r a n d A 1 atomic f r a c t i o n s f r o m t h e K r a t io s , g i v i n g
t h e N i atomic f r a c t i o n by d i f f e r e n c e . A s p r e v i o u s l y d i s -
c u s s e d , t h e MULTI8 program corrects f o r t h r e e p r i m a r y s o u r c e s
of i n t e r f e r e n c e between e l e m e n t s i n t h e a l l o y . I n a d d i t i o n
t o t h e K r a t io s , parameters i n p u t i n t o MULTI8 i n c l u d e d : t h e
X-ray emergence a n g l e , t h e atomic numbers a n d atonic w e i g h t
of t h e e l e m e n t s b e i n g measured , t h e o p e r a t i n g KV, t h e exci-
t a t i o n p o t e n t i a l a n d f l u o r e s c e n c e y i e l d of e a c h e l e m e n t , and
t h e a p p r o p r i a t e m a s s a b s o r p t i o n c o e f f i c i e n t s ( i .e. m a s s ab-
s o r p t i o n c o e f f i c i e n t s f o r A 1 K, X-rays i n p u r e Al, p u r e C r ,
a n d p u r e N i , e t c . ) . The v a l u e s o f t h e f l u o r e s c e n c e y i e l d
of eltch e l e m e n t and t h e a p p r o p r i a t e m a s s a b s o r p t i o n coeffi-
c i e n t s u sed i n t h e program are g i v e n e l sewhere ( 2 ) . E a c h
i t e r a t i o n of t h e MULTI8 program n o r m a l i z e d t h e N i , C r , and
1 See Appendix A - Bulk Composi t ion A n a l y s i s .
B-2

A1 c o n c e n t r a t i o n s t o l o o % , t h e r e b y i n c l u d i n g t h e e f fec t of
N i on t h e ZAF correct ion of C r a n d A l . O u t p u t of t h e MULTI8
program c o n s i s t e d o f a l i s t i n g of t h e w e i g h t a n d atomic
f r a c t i o n s of N i , C r , and A l , a n d t h e p o s i t i o n ( d i s t a n c e ) a t
which t h e measurement w a s t a k e n .
The a c c u r a c y of t h e c o n c e n t r a t i o n measurements made i n
t h i s s t u d y w i t h t h e EM/ZAF p r o c e d u r e w a s d e t e r m i n e d by m e a -
s u r i n g C r and A 1 c o n c e n t r a t i o n s on s t a n d a r d s of known c o m -
p o s i t i o n . The s t a n d a r d s used , a n d t h e a c c u r a c y of t h e m e a -
s u r e m e n t s i s d i s c u s s e d below.
y-Phase S t a n d a r d s
Seven h i g h b u l k C r , low b u l k A 1 (HCR-LAL) y p h a s e a l l o y s
u s e d i n a n ea r l i e r s t u d y ( 2 1 , a n d f i v e l o w b u l k C r , h i g h
b u l k A 1 (LCR-HAL) y p h a s e a l l o y s p r e p a r e d i n t h i s s t u d y ,
w e r e u s e d a s y p h a s e s t a n d a r d s . The a l l o y s w e r e p r e p a r e d by
r e p e a t e d arc m e l t i n g of p r e s s e d e l e m e n t a l powders , f o l l o w e d
by a n a n n e a l of a p p r o x i m a t e l y 150 h o u r s a t 1250OC. The
HCR-LAL a l l o y c o n c e n t r a t i o n s w e r e d e t e r m i n e d by atomic ab-
s o r p t i o n . The LCR-HAL a l l o y c o n c e n t r a t i o n s w e r e d e t e r m i n e d
by w e t chemica l a n a l y s i s . Numerous m i c r o p r o b e measurements
were t a k e n on e a c h s t a n d a r d . The measurements w e r e averaged
and compared t o t h o s e o b t a i n e d by a t o m i c a b s o r p t i o n and w e t
c h e m i s t r y . Table B-1 compares t h e c o n c e n t r a t i o n measurements
t a k e n on t h e HCR-LAL y s t a n d a r d s t o t h e c o n c e n t r a t i o n s ob-
t a i n e d by a t o m i c a b s o r p t i o n . T a b l e B-2 compares t h e concen-
B-3

TABLE B-1
Comparison of the Concentrations' of the y-Phase Standards as Measured by Atomic Absorption and
the EM/ZAF Procedure
2 Standard
s1
s2
s3
s4
s5
S6
s7
Atomic Absorption
57.90 (+O.26)Ni 35.88 (ZO.1O)Cr 6.22 (50.36)Al
61.30 (+0.14)Ni 30.71 (Z0.03)Cr 7.94 (50.24)Al
64.44 (+0.07)Ni 25.62 (ZO.OO)Cr 9.94 (+0.14)A1
70.13 (+O.lO)Ni 18.60 (50.02)Cr 11.26 (50.26)Al
69.19 (+0.15)Ni 25.82 (+0.05)Cr 4.98 (+0.25)A1 -
76.03 (+0.03)Ni 19.23 (~0.00)Cr 4.75 (50.06)Al
86.93 (50.13)Ni 7.71 (+0.02)Cr 5.36 (50.25)Al
EM/ZAF3
36.49 (+0.38)Cr 6.59 (20.44 )A1
31.04 (+0.52)Cr 7.41 (K0.27)Al
25.88 (+0.14)Cr 10.34 (10.29)Al
18.72 (+0.16)Cr 10.98 (E0.20)Al
26.22 (+0.24)Cr 5.48 (+0.32-)Al
19.66 (50.27)Cr 5.06 (+0.30)A1
8.10 (+0.17)Cr 5.23 (+O.lg)Al -
1. All concentrations in atonic percent
2. Standard designation used in Ref. (2)
3 . Ni concentrations were determined by difference
AC -
0.61 0.37
0.33 0.53
0.26 0.40
0.12 0.28
0.40 0.50
0.43 0.33
0.36 0.13
l3-4

TABLE B-2
Comparisons of t h e C o n c e n t r a t i o n s ' of t h e y-Phase S t a n d a r d s as Measured by W e t Chemis t ry and
t h e EM/ZAF P r o c e d u r e
S t a n d a r d
G 1
62
6 3
G 4
G5
W e t Chemis t ry 2 EM/ZAF
77.20 N i
13 .71 A 1 9.09 C r 9 - 5 6 (+0.36)Cr
13.42 ( 7 0 . 3 4 ) ~ -
80.03 N i 6.69 C r 7.24 (+0 .38)Cr
13.29 A 1 12.98 ( tO.38)Al -
82.78 N i 4.35 C r 4.65 (+0 .25)Cr
12.87 A l 13.48 (Z0.86)Al
83.14 N i 2.21 C r 2.42 (20 .14 )Cr
14.65 A 1 14.82 ( + 0 . 3 7 ) ~ 1
85.90 N i 0 .05 C r 0.00 (+O.OO)er
14.05 A 1 13.59 (T0.40)Al -
. AC -
0.47 0 . 2 9
0.55 0 .31
0.30 0.61
0 .21 0.17
0.05 0.46
1. A l l c o n c e n t r a t i o n s i n atomic p e r c e n t
2. N o s t a n d a r d d e v i a t i o n s were g i v e n

tration measurements taken on the LCR-HAL y standards to the con-
cectrations obtained by wet chemistry. As shown, the agreement
between the EM/ZAF concentration measurements and the atomic ab-
sorption or wet chemistry measurements is good. For the HCR-LAL
y-phase standards, the maximum difference between the two measure-
ments (i.e., AC) is approximately 0.5 at.% A1 and 0.6 at.% Cr.
For the LCR-HAL y-phase standards, the maximum difference between
the measurements is approximately 0.6 at.% A1 and 0.5 at.% Cr.
Considering the measurements made on both sets of y-phase stan-
dards, the accuracy of the EM/ZAF procedure for the y phase is
estimated as being tO.6 at.% A1 and 50.6 at.% Cr. These accura-
cies are near those found in a previous study (2) for the same
EM/ZAF procedure and y-phase standards.
y'-Phase Standards
Three Y'-phase alloys were used as standards in this study.
The alloys were prepared from pressed elemental powders followed
by an anneal of greater than 4 0 0 hours at 1200°C. The alloy con-
centrations were analyzed by wet chemical analysis. Table B-3
compares the concentration measurements taken on the Y'-phase
standards to the concentration measurements obtained by wet
chemistry. As shown, the agreement between the EM/ZAF procedure
and the wet cnemical analysis is good. The maximum difference
between the measurements is approximately 0.30 at.% A1 and 0.5
at.% Cr. Thus, the accuracy of the y'-phase measurements made
in this study can be estimated as 50.3 at.% A1 and 50.5 at.% Cr.
B-6

TABLE B-3 1 Comparisons of t h e Concentrat ions of y'-Phase and B-Phase
Standards as Measured by W e t Chemistry and t h e EM/ZAF Procedure
hC - EM/ZAF 2 y ' Standard W e t Chemistry
GP 1 75.34 N i 4.19 C r 4.71 (50.21) C r 0.52 20.46 A1 20.17 (+0.41) A1 0.29
GP2 77.20 N i 2.10 C r 2.52 (20.21) cr 0.46
20.70 A1 20.57 (50.21) A1 0.13
GP3 78.08 Ni 0.05 C r 0.00 (+O.OO)Cr 0.05 21.87 A1 21.55 (50*26) A1 0.32
B Standard
B1 50.20 Ni
49.80 A1 48.98 (21.8)Al 0.82 0 . 0 0 C r 0.00 (+O.OO)Cr 0 . 0 0
1. All c o n c e n t r a t i o n s i n atomic p e r c e n t
2 . No standard d e v i a t i o n s w e r e g i v e n
l3-7

@-Phase Standard
One NiAl @ phase alloy was used as a standard in this study.
An attempt was made to make phase alloys containing Cr but
success was limited. The alloys that were made suffered oxida-
tion down cracks in the sample buttons during annealing. The
cracks formed in the hard, brittle phase during cooling in the
arc melter. Many of the alloys (even <2 at.% Cr) contained Cr
segregations that could not be eliminated by a high temperature
anneal. In view of these problems, and the problems encountered
with @-phase alloys in an earlier study (21, only the NiAl alloy
was used as a standard. The NiAl alloy was supplied in the as-
cast condition ( 4 ) and had to be encapsulated in quartz tubing,
evacuated, and annealed at 1200°C for 6 hours. The short an-
nealing time was used to avoid excessive oxidation of the ex-
tremely small sample. Table B-3 compares the concentration mea-
surement obtained by wet chemistry. As shown, the difference
between the measurements is only 0.82 at.% A1 but this is some-
what misleading. The standard deviation of the EM/ZAF measure-
ments was approximately 2 at.% Al. This large standard devia-
. tion may be attributed to inhomogeniety of the 6-phase standard.
Considering the possible inhomogeniety of the @-phase standard,
the accuracy of the 6-phase A1 concentration measurements made in
this study is estimated as being lfi1.0-2.0 at.% Al. Beeause no B-
phase standards could be made that contained Cr, the accuracy of
the B-phase Cr concentration measurements could qot be assessed
quantitatively. However, considering the accuracy of they and
B-8

. . y ' Cr concentration measurements, the Cr concentration measure-
ments in the B phase are probably of similar accuracy. Thus,
the B-phase Cr concentration measurements are estimated as being
within 50.6 at.% Cr.
B-9

REFERENCES
1. D. C. Joy, Scanning Electron Microscopy and X-Ray Micro- analysis Short Course, Lehigh University, Bethlehem, PA, June 13-17, 1983.
2 . J. A. Nesbitt, "Overlay Coating Degradation by Simul- taneous Oxidation and Coating/Substrate Interdiffu- sion," Ph.D. Dissertation, Michigan Technological Unviersity, Houghton, MI, Appendix A , 1983.
3 . K. .E. Heinrich, R. L. Myklebust, H. Yakowitz, and S. D. Rasberry, "A Simple Correction Procedure for Quanti- tative Electron Probe Microanalysis," NBS Technical Note. 719, 1972.
4 . Supplied by S. M. Merchant, Department of Metallurgy and Materials Eng., Lehigh University, Bethlehem, PA, 1983.
€3-10

APPENDIX C
P a r t i a l N i C r A l Phase D i a q r a m a t 1200°C
I n order t o g a i n i n s i g h t i n t o t h e d i f f u s i o n a l i n t e r a c -
t i o n be tween f3+y/y+y' a l l o y s , and t o p l o t q u a n t i t a t i v e d i f -
f u s i o n p a t h s , t h e N i - r i c h (50-100 a t . % N i l p o r t i o n of t h e
N i C r A l p h a s e diagram a t 1200°C w a s d e t e r m i n e d . The B+y+ct,
B+y, B+y+y', a n d B+y' p h a s e f i e l d s were q u a n t i t a t i v e l y d e t e r -
mined by e l e c t r o n m i c r o p r o b e a n a l y s i s u s i n g homogenized a l -
l o y s and d i f f u s i o n c o u p l e s . Table C - l l i s ts t h e a l l o y s u s e d
t o d e t e r m i n e t h e p h a s e f i e l d s . F i g u r e C-1 shows t h e p a r t i a l
N i C r A l p h a s e diagram (1200°C) d e t e r m i n e d f r o m t h e s e a l l o y s .
The method u s e d t o d e t e r m i n e e a c h p h a s e f i e l d ( i . e . , homo-
g e n i z e d a l l o y and/or d i f f u s i o n c o u p l e ) . w i l l be d i s c u s s e d
l a t e r . The a c c u r a c y of t h e measurements w a s d i s c u s s e d i n
Appendix B.
A l l a l l o y s u s e d i n t h i s s t u d y w e r e p r e p a r e d from
pressed e l e m e n t a l powders , f o l l o w e d b y a r g o n arc m e l t i n g on
a water-cooled c o p p e r h e a r t h . '
were a n n e a l e d a t t e m p e r a t u r e s a t o r greater t h a n , 1200°C f o r
t i m e s g rea te r t h a n 3 0 0 h o u r s t o o b t a i n homogeneous micro-
s t r u c t u r e s . D e t e r m i n a t i o n o f homogenei ty w a s made u s i n g t h e
e l e c t r o n n i c r o p r o b e and i s di ,Lussed below.
A f t e r m e l t i n g , t h e a l l o y s
D e t e r m i n a t i o n o f Homogeneity
The p r o d u c t i o n o f X-rays from a s e c t i o n o f a l l o y i n c i -
'See E x p e r i m e n t a l P r o c e d u r e f o r more i n f o r m a t i o n . I

TABLE C-1
Alloys Used to Determine the Partial NiCrAl Phase Diagram at 1200°C
1 A1 loy Alloy Composition 3,4 Phases Present Designation
B + Y + ~ Phase Nominal Bulk EDAX2
Field
1 Ni-30.OCr-21.25Al Ni-30.OCr-20.8Al
B+y Phase Field
4 Ni-14.4Cr-26.4Al 5 Ni-9.6Cr-26.9Al c1 Ni-19.8Cr-24.. 7A1 c2 Ni-14.9Cr-24.7Al c3 Ni-14.9Cr-20.8Al c4 Ni-26.OCr-16.9Al
Ni-14.8Cr-25.2Al Ni-10.8Cr-25.7A1 Ni-20.OCr-24.1Al Ni-15.3Cr-23.9Al Ni-15.1Cr-20.3Al Ni-26.4Cr-17.1Al
B +Y B +Y B +Y B +Y B +Y B +Y
B+y+y' Phase - Field
B + Y + Y ' 14 Ni-7.5Cr-24.1Al Ni-8.2Cr-22.9Al
B+y ' Phase Field
6 7 8 9
Ni-4.8Cr-29.OAl Ni-2.4Cr-30.7Al Ni-0.91Cr-32.4Al Ni-33. SA1
Ni-S.OCr-27.3Al Ni-2.7Cr-29.OAl Ni-0.85Cr-31.8Al Ni-3 1.8A1
B + Y ' B+y ' B+y ' B + Y '
y' Phase Fiela
Ni-4.7Cr-22.1Al Ni-2.4Cr-22.5Al
Ni-23,. 7A1
Ni-4.9Cr-19.4Al Ni-2.2Cr-20.8A1
Ni-21.4A1
Y' Y' Y'
GP 1 GP2 GP3
c-2

TABLE C-1 (Continued)
Alloy Alloy Composition Designation Nominal Bulk EDAX
Y+Y' Phase Field
s1 Ni-2.4Cr-18.1Al Ni-7.4Cr-17.1Al s2 Ni-3.7Cr-18.1Al Ni-3.5Cr-17.OAl s3 Ni-l8.1Al Ni-16. SA1 s4 s5 Ni-6.OCr-17.8Al
Ni-10.OCr-16.3A1 ,-5 --
Phases Present
Y+Y ' Y+Y l
Y+Y l
Y Y
1. All compositions in atomic percent
2. See Appendix A - Bulk Composition Analysis for details 3 . At 1200°C
4 . All alloys containing B except 8 and 9 contained Cr segregations in the B of not greater than 3.0 vol %
5 . EDAX system not available
c-3

L.
U 0 z L -
c-4

d e n t t o a n e l e c t r o n beam i s s t a t i s t i c a l i n n a t u r e (1 ) . The
number o f X-rays which i n t e r a c t w i t h X-ray d e t e c t o r s i s com-
p l e t e l y random i n t i m e , b u t has a f i x e d mean v a l u e . The d i s -
t r i b u t i o n of t h e number of d e t e r m i n a t i o n s of X-ray c o u n t s
from o n e spot on a n a l l o y v s . t h e number of X-ray c o u n t s fo r
a f i x e d t i m e i n t e r v a l may be a p p r o x i m a t e d by a normal (Guas-
s i a n ) p r o b a b i l i t y d i s t r i b u t i o n ( 1 - 3 ) . The normal p r o b a b i l i t y
d i s t r i b u t i o n f o r X-ray e m i s s i o n , shown i n F i g u r e C-2, is
described by t h e normal d e n s i t y f u n c t i o n ( 4 , 5 ) :
- 4 (ZZlL) 2 f ( X , p , u ) = ' e 0 a&
where X i s a m e a s u r e a b l e random v a r i a b l e ( i n t h i s case, X-ray
c o u n t s ) , p is t h e t r u e mean of random v a r i a b l e X, a n d u i s
t h e error associated w i t h m e a s u r i n g random v a r i a b l e X ( s t a n -
dard d e v i a t i o n ) . F i g u r e C-2 shows t h a t f o r a n i n f i n i t e num-
ber o f d e t e r m i n a t i o n s of X-ray c o u n t s from one s p o t on a n
a l l o y , t h e m o s t f r e q u e n t ( p r o b a b l e ) X-ray c o u n t measured w i l l
have a v a l u e e q u a l t o p. The ideal s t a n d a r d d e v i a t i o n (o=p 4 )
r e s u l t s f rom f l u c t u a t i o n s t h a t c a n n o t be e l i m i n a t e d as l o n g
as q u a n t a a re c o u n t e d ( 1 ) .
C o n s i d e r i n g a homogeneous a l l o y o r phase, a s suming idea l
c o n d i t i o n s (e.9. no d r i f t of e l e c t r o n i c components , e x a c t re-
f o c u s i n g a t e a c h s p o t , e t c . ) and a n i n f i n i t e number of X-ray
c o u n t d e t e r m i n a t i o n s p e r spot , a s e t of X-ray c o u n t s measured
a t a g i v e n s p o t s h o u l d have a mean v a l u e e q u a l t o p. Thus,
i n a s s e s s i n g w h e t h e r a n a l l o y is homogeneous o r n o t , a l l t h a t

X - R a y Counts -
F i g u r e C - 2 . Frequency of o b t a i n i n g a X-ray c o u n t vs. X-ray c o u n t s .
C-6

need be done i s d e t e r m i n e if t h e average v a l u e of X-ray c o u n t s
p e r s p o t , i s t h e same f o r e a c h s p o t ( i . e . e v e r y s p o t measured
s h o u l d have a n a v e r a g e of X-ray c o u n t s e q u a l t o p). T h i s
t a s k would be s i m p l e if c o n d i t i o n s w e r e i d e a l and a n i n f i n i t e
number of d e t e r m i n a t i o n s of X-ray c o u n t s p e r s p o t c o u l d be
made. I n r e a l i t y , however, c o n d i t i o n s are n o t ideal and o n l y
f i n i t e d e t e r m i n a t i o n s of X-ray c o u n t s p e r s p o t c a n be made.
Each se t o f X-ray c o u n t s measured a t a g i v e n s p o t w i l l have
a d i f f e r e n t mean v a l u e b e c a u s e of t h e f i n i t e n a t u r e of t h e
sample ( 4 ) . T o d e t e r m i n e i f t h e mean v a l u e s are r e p r e s e n t a -
t i v e of t h e t r u e mean o f t h e a l l o y , p , assuming i t is homo-
geneous , s t a t i s t i c s mus t be u s e d . Us ing n u l l h y p o t h e s i s t e s t s
( 4 , 5 ) , it c a n be d e t e r m i n e d fo r a l l s p o t s measured i f t h e
mean v a l u e s o f X-ray c o u n t s are s i g n i f i c a n t l y l i k e o r s i g n i f i -
c a n t l y d i f f e r e n t f rom p, e v e n though p is n o t known. I f t h e
mean v a l u e s do n o t m e e t these s p e c i f i c tests, t h e a l l o y o r
p h a s e c a n b e rejected as n o t b e i n g homogeneous. Therefore,
i n e s t i m a t i n g homogenei ty , i t mus t be d e t e r m i n e d i f t h e mean
v a l u e of X-ray c o u n t s p e r s p o t , f o r a l l s p o t s , f a l l w i t h i n
s p e c i f i c l i m i t s , o r c o n f i d e n c e l e v e l s .
To o b t a i n estimates of t h e level of homogenei ty ( % I , cer-
t a i n l i m i t s o r c o n f i d e n c e l e v e l s m u s t ' b e e s t a b l i s h e d . A s i m -
p l i f i e d c r i t e r i o n t h a t has been u s e d t o estimate homogenei ty
(1) u t i l i z e s t w o parameters: 1. The mean v a l u e of t h e X-ray
c o u n t s measured a t a g i v e n spot j , X g i v e n by: -
1' n
c-7

- and 2 . The mean v a l u e of t h e x ' s , X, g i v e n by: j
N X = ( C Xj)/N
j = l
- ( 3 1
where Xi = t h e number o f X-ray c o u n t s t a k e n a t s p o t j .
n = t h e t o t a l number of d e t e r m i n a - t i o n s o f X-ray c o u n t s t a k e n a t spot j .
N = t h e t o t a l number of s p o t s measured .
The c r i t e r i o n s ta tes t h a t a l l t h e x ' s mus t f a l l w i t h i n 2532'
l i m i t s f o r a n a l l o y o r p h a s e t o b e c o n s i d e r e d homogeneous (1).
T h i s l i m i t i s der ived f r o m t h e f a c t t h a t 9 9 . 7 % o f t h e area
u n d e r a normal d i s t r i b u t i o n i s c o n t a i n e d i n F53X4 l i m i t s .
T h e r e f o r e , if a n 2 d o e s n o t f a l l w i t h i n t h i s l i m i t , it is
safe t o assume it is s i g n i f i c a n t l y d i f f e r e n t f rom t h e t r u e
mean of t h e a l l o y p , had t h e a l l o y been homogeneous. Us ing
t h i s c r i t e r i o n t h e v a r i a t i o n of t h e e l e m e n t of i n t e r e s t i n
t h e a l l o y o r p h a s e , o r t h e l e v e l of homogenei ty , i s g i v e n by
(1) :
j
j
(+3X'I/X, - 100 ( % I ( 4 1
A m o r e r i g o r o u s d e t e r m i n a t i o n of t h e level of homogenei ty
i n v o l v e s t h e u s e of t h e s t a n d a r d d e v i a t i o n , S, of t h e ' s ,
g i v e n > y : j
and t h e d e g r e e of s t a t i s t i c a l c o n f i d e n c e u s e d i n t h e determi-
C-8

nation of x (I). sible errors arising from instrument drift, X-ray focusing
errors, and X-ray production variability is included in the
analysis. The degree of confidence in the determination of
X simply reflects an attempt to avoid a risk, a, of rejecting
a good result (i.e. a representative of 11) a large per-
centage (say 95-100%) of the time. The degree of confidence
is given by 1-a and high degrees of confidence have typical
values 0.95-0.995. The use of a degree of confidence allow
a range of homogeneity to be defined in which it can be ex-
pected that only a small number of measurements will be out-
side this range (1). The level of homogeneity for a confi-
dence level of 1-a, is given by (1):
By utilizing the standard deviation, S, pos-
-
j
where W1-a is the range of homogeneity (wt.%), C is the true
weight fraction of the element of interest, and tN-l is the
Student t Statistic (4, 5 ) for a 1-a confidence level and N-1
degrees of freedom. Student t values for various levels of
confidence and degrees of freedom can be found in tabulated
form in many probability books ( 4 , 5 ) .
Calculations of the level of homogeneity (L .H . ) for Cr
and A 1 in each phase were performed on the alloys used for
phase diagram determination and diffusion couples. Before
L.H. was calculated, the X-ray count averages, X I s , were
checked to be within the limits K53kf.
- j
If all the x ' s were j
c-9

within these limits, Eqn. (6) was used to calculate L.H.
The highest tabulated degree of confidence, 1-or = 0.995, was
used for finding the Student t statistic in Eqn. ( 6 ) . A L.H.
of 5 - + 1.0% was set as being the maximum deviation for which the alloys would be considered homogeneous (1). Counts were
measured at lo-25 different areas (random selection) of the
same phase, with 1-5 spots determined per phase area. Calcu-
lated L.H. for Cr and A1 in the phases present in the alloy,
and the time and temperature at which the alloys were annealed,
is shown in Table C-2. As shown, almost all the L.H. were
below 51.0%. The L.H. for A1 in the y phase for most of the
alloys containing (3 was slightly greater than 1.0%. This oc-
curs because the concentration of A 1 in the y phase is low
-(-9-14 at.%). The low concentration leads to low X-ray count
averages. It is more difficult to measure the same L.H. as
the concentration present in the alloy decreases (1). The
value of S / % in Eqn. (6) will increase as C and the number of
X-ray counts per spot (5.) decreases. To obtain the same num-
ber of X-ray counts per spot, the time of analysis must be
increased. The analysis time per spot in this study was fixed.
Therefore, more spots should have been taken on the elements
with low concentrations to obtain a lo'wer L.H. However, to
obtain a L.H. of 0.5 for AI in the 'y phase of the alloys con-
taining 8, N must be greater than 160 (i.e. 160 separate spots
in the y phase must be analyzed). The length of time to do
this would have been phenomenal, and therefore, tne same
3
c-10

TABLE C-2
Calculated Levels of Homogeneity f o r Alloys Used to Determine the Partial NiCrAl Phase Diagram at 1200°C
Cr - A1 -
1 350/1200 B 0.68 0.30 Y 0.13 1.10 a 0.33 3.90
4 350/1200 B 0.44 0.29 Y 0.22 0.99
5 350/1200 B 0.72 0.51 Y 0.45 1.08
c1
c2
c3
c4
6
7
8
150/1250 200/1200
B Y
0.72 0.25
0.52 1.10
150/1250 200/1200
B Y
0.86 0.24
0.58 1.18
150/1250 200/1200
B Y
0.72 0.33
0.43 0.73
150/1250 200/1200
B Y
0.44 0.47
0.55 0.68
400/1200 B Y
0.63 0.56
0.38 0.59
400/1200 B Y'
1.03 1.04
0.41 0.71
400/1200 1.41 1.80
2 -- 0.51 0.44
B Y'
400/1200 B Y'
0.53 0.74
9
i43 0.47 400/1200 B 0.75
c-11

TABLE C-2 (Continued)
t 0 . 9 9 s ) ~ ( l ~ ~ )
N4 x ( % I ( N-1 L.H.=+ Al loy Time (hr) / - Designation Temperature ("C) Phase
A1 - Cr - GP 1 450/1200 Y' 0.61 0.52
GP2 450/1200 Y' 1.06 0.48
GP3 450/1200 Y' -- 0.54
0.69 -- s3 50/1250 Y 100/1200
1. L.H. = Level of Homogeneity
2. All dashes indicate Ni-A1 alloys, therefore, no L.H. w a s calculated for Cr
3. y and y ' could not be distinguished with unetched sample

number of spots per phase was measured. Typically, as the . -
L.H. for an element goes above + l . O % , the concentration in
the phase drops below 10 at.%. The L.H. of 3.9 for A1 in the
a phase of alloy 1 simply reflects the fact that approximately
1-2 at.% A1 is contained in that phase. Likewise, some of the
high L.H. for Cr in the y' phase of the ty' and y' alloys
reflects a Cr concentration below 5 at.% Cr. When the L.H.
was above 1.0% for one element, the other element L.H. was
sufficiently below 1.0% to indicate the phase was homogeneous.
Although calculations of L.H. revealed the alloys were
homogeneous, other independent checks of homogeneity were
performed. Concentration scans were run between phases to
determine if any concentration gradients existed between
phases. In all cases, the scans revealed a step-like concen-
tration profile, signifying no concentration gradients be-
tween phases. L.H. were recalculated for @+y alloys used in
diffusion couples. Spots were measured after 200 hours at
1200°C in the bulk section of the alloy, well removed from
the diffusion zone. In all cases, the L.H. did not signifi-
cantly change from the value listed in Table C-2. In view
of the L.H. calcualtions and the checks, it was concluded
that the alloys were indeed hoqogeneous under the analytical
measuring sensitivity of the electron microprobe.
Cr Segreqations
All alloys containing f3, listed in Table C-1, except
alloys8 and 9 were found to contain segregations of Cr in, or
(2-13 I

. adjacent to, the phase. A survey of the available litera-
ture on studies involving the Ni-Cr-A1 system showed, in each
case, similar occurrences of Cr segregation in the B (6-12).
In these studies, the Cr segregations were identified as being
the a(Cr) phase because they had high concentrations of Cr
and low concentrations of Ni and Al. No work has been done
to quantitatively determine if these segregations are indeed
a (Cr) . The identification of the Cr segregations (also referred
to as "particles") as a(Cr) creates a series of anomalies
that cannot be explained by the phase diagram. Observations
of the Cr segregations in the alloys used in this study, and
the anomalies associated with their presence are presented
below:
1. As cast, no Cr segregations could be detected opti- cally or under high magnification (1OOOX-2OOOX) with a scanning electron microscope for all alloys in which f3 crystallized from the melt except the three phase alloy + y + a (alloy 1). If the Cr segre- gations are present as cast, they must be sub-micron in size, and would only be detected by transmission electron microscopy.
2 . After heat treatment at high temperature (Th1200'C) all alloys containing f3 (except alloys 8 and 9 ) con- tained Cr segregations. The segregations could be seen after very short annealing times (t<24 hours at temperature). Even after prolonged anneals (t>600 hrs.) at 1200°C, t_L,_z Cr segregations per- sisted in the alloys. The segregations were mor- phologically similar in all alloys, with a blocky, faceted appearance. The size of the particles varied throughout a given alloy and were in the range of 1-1Opm. The volume fraction of th2 par-
-.titles varied from alloy to alloy and were in the range of 1-3 vole%.
C-14

3.
4 .
5.
6 .
7.
A f t e r l o n g a n n e a l i n g t i m e s ( t '300 h r s . ) , t h e C r s e g r e g a - t i o n s a p p e a r e d t o be i n e q u i l i b r i u m w i t h t h e s u r r o u n d i n g m a t r i x . C o n c e n t r a t i o n / d i s t a n c e p r o f i l e s measured from t h e m i d d l e o f l a r g e p a r t i c l e s t o t h e m i d d l e of a d j a c e n t e q u i l i b r i u m p h a s e s ( i . e . 6, y , y ' , e tc . ) showed s t e p - l i k e c o n c e n t r a t i o n p r o f i l e s - i n d i c a t i n g n e g l i g i b l e c o n c e n t r a t i o n g r a d i e n t s be tween p a r t i c l e s and p h a s e s . The s e g r e g a t i o n s d i d c o a r s e n w i t h t i m e d u r i n g t h e i n i - t i a l h e a t t r e a t m e n t s ( i . e . , a t t i m e s less t h a n 3 0 0 h r s . ) , b u t i n a l l cases, t h e c o m p o s i t l o n o f t h e p a r t i c l e s d id n o t change .
. B o t h t h r e e p h a s e a l l o y s , a l l o y 1 (B+y+a) and a l l o y 1 4 (B+y+y') , c o n t a i n e d C r s e g r e g a t i o n s . The s e g r e g a t i o n s i n a l l o y 1, i n t h e form of f i n e l y d i s t r i b u t e d p a r t i c l e s i n t h e B , w e r e m o r p h o l o g i c a l l y d i f f e r e n t f rom t h e a phase . The C r s e g r e g a t i o n s w e r e b l o c k y and f a c e t e d w h i l e t h e a p h a s e w a s g l o b u l a r and of much l a r g e r s i z e . The e x i s t e n c e o f 4 p h a s e s - 8 y, and C r s e g r e g a t i o n s or B, y , y ' and C r s e g r e g a t i o n s i s a d e f i n i t e v i o l a - t i o n of t h e Gibbs p h a s e r u l e f o r a t h r e e component sys t em.
The c o m p o s i t i o n o f C r i n t h e a p h a s e i n a l l o y 1 w a s d i f f e r e n t f rom t h e c o m p o s i t i o n o f C r i n t h e p a r t i c l e s . The c o m p o s i t i o n o f t h e a p h a s e w a s d e t e r m i n e d by elec- t r o n m i c r o p r o b e a n a l y s i s t o be a p p r o x i m a t e l y 84 .0-86 .0 a t . % C r . The p a r t i c l e s c o n t a i n e d be tween 94.0-97.0 a t . % C r .
The C r s e g r e g a t i o n s found i n B+y and B+y' a l l o y s i s i n v i o l a t i o n of t h e Gibbs p h a s e r u l e f o r a t h r e e compon- e n t sys t em. The a l l o y s c a n n o t b e e q u i l i b r i u m t h r e e - p h a s e a l l o y s b e c a u s e t h e c o m p o s i t i o n s of and y or 8 and y ' change a s t h e b u l k c o m p o s i t i o n changes . Fur - t he rmore , t h e c o m p o s i t i o n s o f t h e y p h a s e i n a l l e q u i l i b r a t e d a l l o y s w a s found t o c o r r e s p o n d e x a c t l y t o t h e y/y+B p h a s e boundary d e t e r m i n e d by N e s b i t t ( 1 2 , 1 3 ) u s i n g d i f f u s i o n c o u p l e s and B + Y a l l o y s o x i - d i z e d a t 1200°C. Thus, i n d e p e n d e n t methods o f bound- a r y d e t e r m i n a t i o n , w i t h and w i t h o u t C r s e g r e g a t i o n s , have y i e l d e d t h e same p h a s e boundary . T h i s means t h e C r s e g r e g a t i o n s d o n o t a p p e a r t o e f f e c t t h e e q u i l i i - r i u m between p h a s e s i n t h e two-phase f i e l d s .
C r s e g r e g a t i o n s w e r e found i n l a r g e r volume f r a c t i o n i n some o f t h e l o w e r b u l k C r B+y a l l o y s t h a n i n l a r g e r b u l k C r B+y a l l o y s . I f t h e s e g r e g a t i o n s w e r e a ( C r ) , t h i s o b s e r v a t i o n rnakes no s e n s e b e c a u s e t h e h i g h b u l k
(2-15 I

Cr alloys would be expected to have more ct than the low bulk Cr alloys.
In view of these observations, and the anomalies asso-
ciated with them, it appears that the identification of the
Cr segregations as a(Cr) has been spurious. A possible al-
ternate explanation of the Cr segregations is that they are
a Cr carbide. The Ni powder used in making the alloys con-
tained approximately 0.1 wt.% graphite which originated from
the Ni powder fabrication process (14). Chemical analysis
of three alloys (one B+y alloy, one y alloy, and one Y' alloy)
showed carbon contents of 0.085, 0.034, and 0.035 wt.%. The
higehst carbon content was found in the B + Y alloy. In com-
parison, the carbcn contents found in cast Ni-base superalloys
are normally in the range of 0.1 wt.% (15, 161, and lead to
the formation of several types of carbides (15-20). No car-
bides were found to be present in a low carbon (0.01 wt.%)
Ni-base superalloy (15). The typical carbides that have been
observed in normal carbon (0.1%) containing superalloys are
of four types: MC, M23C6, Cr7C3, and M6C, where M represents
a carbide forming element (e.g. Ta, Ti, W, Nb, Cr) or some
combinaticn of these elements (15). Out of these carbide
types, M23C6 is usually Cr rich (15, 17-20).
The fact that the alloys used in this study contained
appreciable levels of carbon (comparable to the carbon levels
in normal carbon containing Ni-base superalloys), alonc with
the fact that Cr is a carbide former, does suggest the Cr
(2-16

s e g r e g a t i o n s may be carbides. An estimate o f t h e d r i v i n g
f o r c e fo r C r c a r b i d e f o r m a t i o n c a n be made w i t h thermodynamic
d a t a s u p p l i e d by Worrell i n a n a n a l y s i s of t h e Cr -C-0 s y s t e m
( 2 1 ) . T a b l e C-3 l i s t s t h e G i b b s f ree e n e r g y o f f o r m a t i o n
as a f u n c t i o n o f t e m p e r a t u r e f o r t h e compounds: C r 2 0 3 ( s ) ,
C23C6 (s 1, Cr8C3 ( s 1, and Cr3C2 (SI. fo r C r 0 w a s i n c l u d e d so t h a t t h e free e n e r g y v a l u e s of t h e
carbides c o u l d be compared t o it. A t 120OOC (1473 K) t h e
free e n e r g i e s o f f o r m a t i o n fo r C r 2 0 3 t C r 2 3 C 6 , C r 7 C 3 ' and
C r 3 C 2 a r e -180842, -164394, -67468, and -31645 cal/mole,
r e s p e c t i v e l y . As c a n be s e e n , t h e f r e e e n e r g y of f o r m a t i o n
f o r C r 2 3 C 6 i s v e r y n e a r t h a t of C r 2 0 3 .
have a p p r e c i a b l y lower f ree e n e r g i e s o f f o r m a t i o n . A l though
t h e free e n e r g y of f o r m a t i o n c a l c u l a t e d fo r e a c h carbide
g i v e s no idea how f a v o r a b l e t h e k i n e t i c s of f o r m a t i o n are,
i t does show t h e r e i s a d r i v i n g force f o r f o r m a t i o n - especi-
a l l y C r 2 3 C 6 .
The free e n e r g y f u n c t i o n
2 3
The o t h e r C r carbides
I f t h e C r s e g r e g a t i o n s are C r carbide, many o f t h e ob-
s e r v a t i o n s and a n o m a l i e s p r e v i o u s l y p r e s e n t e d c a n be e x p l a i n e d .
The f a c t t h a t t h e s e g r e g a t i o n s a p p e a r t o p r e c i p i t a t e o n l y
d u r i n g h i g h t e m p e r a t u r e h e a t t r e a t m e n t s correlates w i t h t h e
f i n d i n g t h a t M23C6 c a r b i d e s i n Ni-base s u p e r a l l o y s are pro-
d u c t s of s o l i d - s t a t e p r e c i p i t a t i o n (15 , 1 8 ) . The f a c t t h a t
*-
t h e s e g r e g a t i o n s a p p e a r t o be i n e q u i l i b r i u m w i t h t h e s u r -
r o u n d i n g m a t r i x a l s o s u p p o r t s c a r b i d e f o r m a t i o n . The car-
C-17
bide, o n c e formed, c o u l d e x i s t i n e q u i l i b r i u m w i t h t h e s u r -

TABLE C-3
Thermodynamic Data f o r S tab le Compounds Occurr ing i n t h e Cr-C-0 System1
Compound Gibbs F r e e of Format ion , cal per m o l e
Cr23C6 (SI
Cr7Cg ( S )
Cr3C2 (SI
-270,400 + 60.8T
-139,500 - 16.9T
-54,800 - 8.6T
-29,500 - 3.9T
1. Taken from R e f e r e n c e 2 1 .
C-18
r o u n d i n g phases, w i t h o u t u p s e t t i n g t h e e q u i l i b r i u m be tween
p h a s e s if t h e carbide w e r e n o t p r e s e n t ( i .e. t h e p h a s e boun-
daries c o u l d be t h e same w i t h , o r w i t h o u t , t h e carbide p r e -
s e n t ) . I f t h e s e g r e g a t i o n s w e r e a carbide, t h e i r a p p e a r a n c e
i n t h r e e p h a s e a l l o y s would n o t be a v i o l a t i o n of t h e Gibb ' s
p h a s e r u l e b e c a u s e t h e s y s t e m would be 4 component (Ni -Cr -A1-C)
and n o t 3 component ( N i - C r - A l l . Be ing a carbide would a l so
e x p l a i n why t h e s e g r e g a t i o n s have a d i f f e r e n t C r c o n c e n t r a t i o n
t h a n t h e e q u i l i b r i u m a : C r ) phase i n t h e f3i-y- a l l o y . I t
would a l so e x p l a i n why some of t h e l o w b u l k C r &tu a l l o y s
have larger volume f r a c t i o n s of C r s e g r e g a t i o n s t h a n t h e h i g h
b u l k C r B+y a l l o y s . The c a r b i d e f o r m a t i o n would be a s t r o n g e r
f u n c t i o n of t h e c a r b o n c o n c e n t r a t i o n i n t h e a l l o y t h a n t h e
C r c o n c e n t r a t i o n , a n d t h u s t h e l o w b u l k C r a l l o y s p r o b a b l y
have h i g h e r c a r b o n c o n t e n t s t h a n t h e h i g h b u l k C r a l l o y s .
The o n l y o b s e r v a t i o n t h a t does n o t s u p p o r t t h e s e g r e g a t i o n s
b e i n g a carbide (or a ( C r ) ) i s t h a t t h e y are found o n l y i n
a l l o y s c o n t a i n i n g t h e B phase . The Y + Y ' and Y a l l o y s d i d n o t
c o n t a i n C r s e g r e g a t i o n s .
E f f o r t w a s m a d e i n t h i s s t u d y t o t r y a n d i d e n t i f y w h e t h e r
t h e C r s e g r e g a t i o n s were a ( C r ) o r C r carbide. T r a n s m i s s i o n
e l e c t r o n mic roscopy w a s u t i l i z e d i n a n e f f o r t t o o b t a i n a
d i f f r a c t i o n p a t t e r n of t h e p a r t i c l e s . The e f f o r t w a s unsuc-
c e s s f u l b e c a u s e no par t ic les c o u l d be located. The d i f f i -
c u l t y i n l o c a t i n g t h e pa r t i c l e s s t e m s f r o m the i r s m a l l s i z e ,
s m a l l volume f r a c t i o n , a n d random o r i e n t a t i o n i n t h e m a t r i x .
c-19

S t a n d a r d p h a s e e x t r a c t i o n t e c h n i q u e s (15 ) w e r e a l so employed
i n a n e f f o r t t o d i s s o l v e away t h e m a t r i x , l e a v i n g t h e p a r -
t ic les (assuming t h e y w e r e carbides) as a r e s i d u e . D i f f r a c -
t i o n p a t t e r n s of t h e r e s i d u e from p h a s e e x t r a c t i o n s d i d n o t
y i e l d any r e s u l t s . T i m e d i d n o t permit f u r t h e r a n a l y s e s of
t h e C r s e g r e g a t i o n s . S t u d i e s s h o u l d b e i n i t i a t e d t o spec i f j . -
c a l l y i d e n t i f y t h e s e p a r t i c l e s .
F i n a l l y , b e c a u s e t h e y /e +y p h a s e boundary d e t e r m i n e d i n
t h i s s t u d y c o r r e s p o n d s e x a c t l y t o t h e y/8+Y p h a s e boundary
d e t e r m i n e d by N e s b i t t ( 1 2 , 1 3 ) u s i n g a l l o y s w i t h o u t C r seg-
r e g a t i o n s , i t a p p e a r s t h e s e g r e g a t i o n s are n o t e f f e c t i n g t h e
e q u i l i b r i u m be tween p h a s e s (e.g. B+Y, B + Y ' , e t c . ) . I n f u r -
t h e r s u p p o r t of t h i s , t h e b o u n d a r i e s d e t e r m i n e d i n t h i s s t u d y
correlate v e r y w e l l w i t h t h e b o u n d a r i e s d e t e r m i n e d by Nesb i t t
(12 ) and T a y l o r and F l o y d ( 6 ) a t 1150OC. I n v iew of t h e s e
f a c t s , it i s c o n c l u d e d t h a t t h e p h a s e d i ag ram d e t e r m i n e d i n
t h i s s t u d y is a n a c c u r a t e r e p r e s e n t a t i o n o f t h e p h a s e e q u i l i -
b r ium t h a t e x i s t s i n t h e N i - C r - A 1 s y s t e m a t 1200°C.
Phase F i e l d D e t e r m i n a t i o n
Two s t a n d a r d t e c h n i q u e s were used t o d e t e r m i n e t h e p h a s e
f i e l d s o f t h e p a r t i a l N i C r A l p h a s e d i ag ram ( F i g u r e C-1) deter-
mined i n t h i s s t u d y : homogenized a l l o y s a n d d i f f u s i o n
c o u p l e s ( 2 2 ) . I n m o s t cases, homogenized a l l o y s w e r e u t i l -
i z e d t o o b t a i n e q u i l i b r i u m t i e l i n e s . D i f f u s i o n c o u p l e s w e r e
u s e d t o d e t e r m i n e some p o r t i o n s o f t h e p h a s e f i e l d s , and a l so
c-20

t o check t h e b o u n d a r i e s d e t e r m i n e d by t h e homogenized a l l o y s .
The a l l o y 5 used t o determine e a c h p h a s e f i e l d are l i s t e d i n
Table C-1. The method u s e d t o d e t e r m i n e e a c h p h a s e f i e l d i s
d i s c u s s e d below.
1.
2.
3.
4 .
~ + u + a . A l l o y 1 w a s used t o d e t e r m i n e t h e B y * tri- a n g l e . A l l p h a s e s w e r e of s u f f i c i e n t s i z e t o a l l o w a c e u r a t e e l e c t r o n m i c r o p r o b e measurements . The com- p o s i t i o n o f t h e a p h a s e , n o t shown i n F i g u r e C-1 , w a s d e t e r m i n e d t o b e a p p r o x i m a t e l y 86.0 a t . % C r , 1 . 5 a t . % A l . The l o w s o l u b i l i t y o f A 1 i n a is i n a c c o r d w i t h t h e f i n d i n g s of T a y l o r and F l o y d (6) a t 115OoC and Tu (11) a t 1025OC. The s o l u b i l i t y o f N i i n a correlated v e r y w e l l w i t h t h e s o l u b i l i t y of N i i n a a t 1200°C i n t h e b i n a r y N i - C r s y s t e m (23).
B+Y S i x homogenized a l l o y s (Table C-1) w e r e u s e d t o d e t e r m i n e t h e f3+y p h a s e f i e l d . The e q u i - l ibrium t i e l i n e s shown i n F i g u r e C-1 c o r r e s p o n d t o t h e f o u r a l l o y s u s e d i n d i f f u s i o n c o u p l e s , namely: C 1 , C 2 , C3, and C 4 . The c o n c e n t r a t i o n / d i s t a n c e p ro - f i l e o b t a i n e d from d i f f u s i o n c o u p l e s w e r e a lso p l o t t e d on t h e p h a s e diagram t o c h e c k t h e b o u n d a r i e s d e t e r - mined by t h e homogenized a l l o y s . I n a l l cases, t h e p o i n t s f e l l a l o n g t h e b o u n d a r i e s d e t e r m i n e d by t h e homogenized a l l o y s .
B+y+y'. A l l o y 1 4 w a s u s e d o n l y t o d e t e r m i n e t h e f3 c o r n e r of t h e t r i a n g l e . The y and y ' p h a s e s i n t h e a l l o y c o u l d n o t be d i s t i n g u i s h e d u n e t c h e d . Thus, t h e y and y ' c o r n e r s o f t h z t r i a n g l e had t o be d e t e r m i n e d a t t h r e e p h a s e i n t e r f a c e s ( B+y/y+y' o r ~ + y / y ' ) p r e s e n t i n t h e d i f f u s i o n c o u p l e s . The
c o r n e r , d e t e r m i n e d w i t h a l l o y 1 4 , w a s found t o b e i n e x c e l l e n t ag reemen t w i t h B p h a s e measurements a t t h r e e p h a s e i n t e r p h a s e s . I n v iew of t h i s , i t w a s c o n c l u d e d t h a t t h e y and y ' measurements made a t t h r e e p h a s e i n t e r f a c e s were a l so r e p r e s e n t a t i v e of t h e B+y+y' e q u i l i b r i u m .
f3+y'. Four homogenized a l l o y s (Table C-1) w e r e u s e d t o d e t e r m i n e t h e B+y' p h a s e f i e l d . The t i e l i n e s c o r r e s p o n d i n g t o t h e s e a l l o y s are shown i n F i g u r e C-1. The measured p h a s e c o m p o s i t i o n s of a l l o y 9 (Ni-31.8Al) c o r r e s p o n d e d e x a c t l y t o t h o s e found i n t h e B+y' p h a s e f i e l d a t 1 2 0 0 ° C i n t h e N i - A 1 sys t em.
c-21

5 . y + y * . Microprobe measurements on homogenized y+y' a l l o y s could n o t be o b t a i n e d because t h e y and y ' p h a s e s could n o t be d i s t i n g u i s h e d u n e t c h e d , and t h e y' w a s on t h e order of t h e p r o b e spot s i z e . The y'/y+y' bounds ry w a s d e t e r m i n e d w i t h y'/y+y' i n t e r - faces present i n d i f f u s i o n c o u p l e s , a n d b i n a r y N i - A 1 data a t 1200°C. The y/y+y ' boundary w a s o n l y es t i - mated u s i n g t h e y corner of t h e B+y+y' t r i a n g l e , b i n a r y N i - A 1 d a t a , t h e y and y+y' a l l o y s l i s t ed i n T a b l e C-1, a n d t h e da t a o f T a y l o r a n d F loyd ( 6 ) and N e s b i t t ( 1 2 ) a t 1150°C. I t i s t h e r e f o r e rep- resented b y a d a s h e d l i n e i n F i g u r e C-1 .
e 2 2

. REFERENCES
1. J. I. Goldstein, D. E. Newbury, P. Echlin, D. C. Joy, C. Fiori, E. Lifshin, Scanninq Electron Microscopy andX-RayMicroanalysis, Plenum Press, N.Y., pp. 430- 433, 1981.
2. H. A. Liebhafsky, H. G. Pfeiffer, and P. D. Zemany, Anal. Chem., 27, 1257, (1955).
3. H. A. Liebhafsky, H. G. Pfeiffer, E. H. Winslow, P. D. Zemany, and S. S. Liebhafsky, X-Rays, Electrons and Analytical Chemistry, Wiley Interscience, N.Y., 1972.
4. I. Miller, J. E. Freund, Probability and Statistics for Enqineers, Prentice-Hall, Inc., New Jersey, 2nd Edition, 1977.
5. M. M. Eisen, C. A. Eisen, Probability and its Applica- tions, Quantum Publishers, Inc., N.Y. , 1975.
6. A. Taylor and R. W. Floyd, J. Inst. Metals, 81, 462, (1952).
7 . G. W. Goward, D. H. Boone and C. S. Giggins, Trans. ASM, - 60, 238, (1967).
8 . H. W. Lavendel, J. Metals, 27, 4 , (1975).
9. C. A. BarretandC. E. Lowell, Oxi. Metals, 11, 203, (19771. 10. S. R. Levine, Met. Trans., 9A, 1242, (1978).
11. D. Tu, "Diffusion and Pack Aluminizing Study in the Ni-Cr-A1 System," Ph.D. Dissertation, SUNY, Stoney Brook, N.Y., 1982.
12. J. A. Nesbitt, "Overlay Coating Degradation by Simul- taneous Oxidation and Coating/Substrate Interdiffu- sion," Ph.D. Dissertation, Michigan Technological University, Houghton, MI, 1983.
13. J. A. Nesbitt, "Solute Transport During Cyclic Oxida- tion of Ni-Cr-A1 Alloys," M.S. Thesis, Michigan Technological University, Houghton, MI, 1981.
14. The International Nickel Company, Inc., INCO Nickel Powder Type 123, One New York Plaza, N.Y., N.Y., 10004.
C-23

15. H. C. Nguyen, "The Effect of Tantulum and Carbon on the Structure/Propertics of a Sinqlc C r y s t , i l Nickel-base Superalloy," M.S. Thesis, Michigan Technological University, Houghton, MI, 1984.
16. R. F. Decker, "Strengthening Mechanisms in Nickel-Base Superalloys," Climax Molybdenum company Symposium, Zurich, Switzerland, (1969).
17. M. A. Burke, J. Greggi, Jr., G. A. Whitlow, Scripta. Met., 18, 91, (1984).
18. B. J. Pearcey, and R. W. Smashey, Trans. AIME, 239, 451, (1967).
19. R. T. Holt and W. Wallace, In. Metals. Rev., Review 203, March 1976.
20. W. V. Youdelis and 0. Kwon, Met. Sci., l7, 385, (1983).
21. W. L. Worrell, Trans. AIME, 233, 1173, (1965).
22. A. D. Romig and J. I. Goldstein, &plications of Phase Diagrams in Metallurqy and Ceramics, G. C. Carter, Editor, NBS Sp-496, p. 463, 1977.
23. Metals Handbook, ASM, 8th Edition, E, p. 291, 1973.
C-24

APPENDIX D
Diffusion Paths and Diffusion Path Determination
Interdiffusion between two ternary alloys of the same
system results in changes in concentration of the two solute
elements, 1 and 2 and the solvent element, 3, with distance
into each alloy. Following Onsager's initial formalism (1-31,
Kirkaldy solved the differential equations describing semi-
infinite single phase/single phase ternary interdiffusion
( 4 - 8 ) . The analytical solutions were able to determine the
concentrations of 1 and 2, C1 and C2, as a function of the
parameter X = distance/ (time) . Through these solutions, 4
and borne out by experiment, it was found that the functions
C , ( X ) and C , ( X ) have unique values for a given value ofX
( 4 , 5). This means the diffusion profile, once established
(i.e. after a finite time), does not change but merely varies
dimensionally with time ( 9 ) . Elimination of X between the
functions Cl(h) and C2(A) yields a relationship in the form
CI = C,(C2) (10-11). This expression is a function of the
concentrations C and C2 only (i.e. distance and time have
been eliminated), and therefore defines an invariant line on
the appropriate ternary isotherm (11). This invariant line
is referred to as a diffusion path (10, 12).
1
A diffusion path represents how the bulk composition
changes in the diffusion zone of a diffusion couple. Con-
sider first a diffusion path between two single phase
alloys, each of the same phase, as shown in Figure D-1. The

C l
C
+ - - . o - Distance
Figure D-1. Hypothetical diffusion path constructed from the concentration/distance profiles of
diffusion couple. solute elements 1 and 2 in a y/y
D-2

I .
.
d i f f u s i o n p a t h c a n e a s i l y be c o n s t r u c t e d from a measured con-
c e n t r a t i o n / d i s t a n c e ( h e r o a f t e r referred t o as C / D ) p r o f i l e .
The C/D p r o f i l e measu res how t h e b u l k composition of 1 and 2
change w i t h d i s t a n c e b e c a u s e a l l d i f f u s i o n h a s o c c u r r e d i n a
s i n g l e phase . T h e r e f o r e , e a c h C1 and C2 a t a g i v e n d i s t a n c e
r e p r e s e n t t h e b u l k c o m p o s i t i o n s a t t h a t d i s t a n c e , a n d t r a n s -
l a t e t o a u n i q u e p o i n t on t h e t e r n a r y diagram. T r a n s l a t i n g
e a c h C1, C2 c o m b i n a t i o n o v e r t h e e n t i r e l e n g t h o f t h e d i f f u -
s i o n zone t o t h e t e r n a r y d i ag ram w i l l y i e l d t h e d i f f u s i o n
p a t h .
C o n s i d e r s econd , a d i f f u s i o n p a t h be tween t w o s i n g l e p h a s e
a l l o y s , e a c h a d i f f e r e n t phase . The d i f f u s i o n p a t h mus t now
cross a two-phase f i e l d between t h e t w o t e r m i n a l a l l o y s . I f ,
a f t e r d i f f u s i o n , t h e i n t e r f a c e be tween t h e a l l o y s i s p l a n a r ,
t h e d i f f u s i o n p a t h simp1.y c u t s across t h e two-phase f i e l d v i a
a n e q u i l i b r i u m t i e l i n e (121, as shown i n F i g u r e D - 2 . The
C/D p r o f i l e i n t h i s s i t u a t i o n would show a d i s c o n t i n u i t y i n
C1 and C a t t h e two-phase i n t e r f a c e . The d i f f u s i o n p a t h
would be c o n s t r u c t e d t h e same a s fo r a p a t h be tween t w o 2
s i n g l e p h a s e a l l o y s of t h e same p h a s e , w i t h t h e d i s c o n t i n u i t y
i n C1 and C2 a t t h e i n t e r f a c e t r a n s l a t i n g t o a n e q u i l i b r i u m
t i e l i n e on t h e t e r n a r y d iagram. F o l l o w i n g t h e c o n v e n t i o n of
C l a r k ( 1 3 ) , a dashed l i n e c r o s s i n g t h e two-phase f i e l d p a r a l -
l e l t o t h e t i e l i n e s (shown i n F i g u r e D - 2 ) i s u s e d t o r e p r e -
s e n t t h e i n t e r f a c e between t h e t w o p h a s e s w i t h i n t e r f a c i a l
c o m p o s i t i o n s d e s i g n a t e d by t h e e n d s o f t h e t i e l i n e . The
0-3

c1
0 cv
0
1 L
c
c2
A I
1
I I
c 3
- - 0 - + Distance
Figure D - 2 . Hypothetical diffusion path constructed from the concentration/distance profiles of solute elements 1 and 2 in a y/B diffusion couple. The interface between the
alloys remains planar.
D-4

c
line represents no spatial extent.
The situation depicted above changes, however, if a two-
phase layer appears in the diffusion zone. The appearance of
the two-phase layer indicates the diffusion path cuts across
tie lines in the two-phase field (121, as shown in Figure D-3.
In the two-phase layer, C/D profiles must be measured in each
phase and do not correspond to the bulk composition. In
order to plot a diffusion path cutting tie lines in a two-
phase field, C/D profiles in each phase must be known, and
also the volume fraction of one of the phases with distance
(9). Only with this information can bulk compositions be
calculated via the lever rule and plotted as a diffusion path
through the two-phase field. The C/D profile for the entire
couple (shown in Figure D-3) will contain three regions - two single-phase regions and one two-phase region. The profiles
of C1 and C2 in the one phase regions will translate directly
to diffusion paths in the respective one phase fields on the
ternary diagram. In the two-phase region, the profiles of
C1 and C2 in each phase will determine which tie lines are
cut by the diffusion path (9). Measured volume fractions of
one of the phases with distance will define the position at
which the diffusion path cuts the tie lines (9). Using the
lever rule, bulk compositoins can be calculated at each dis-
tance in the two phase layer. The calculated bulk composi-
tions can be translated to the ternary diagram and a diffu-
sion path can be constructed through the two-phase field.
D-5 I

c 1
1 I - - 0 - + Distance
Figure D-3. Hypothet ica l d i f f u s i o n path c o n s t r u c t e d from t h e c o n c e n t r a t i o n , / d i s t a n c e p r o f i l e s of s o l u t e ele-
ments 1 and 2 i n a y/B d i f f u s i o n c o u p l e . A two-phase l a y e r forms i n t h e d i f f u s i o n zone .
I -
I n a s i m i l a r manner , if a d i f f u s i o n p a t h e n t e r s a t h r c e -
p h a s e f i e l d from a s ide , and e x i t s a l o n g a n o t h e r s i d e , concen-
t r a t i o n s i n t h e p h a s e s as w e l l a s t h e volume f r a c t i o n of o n e
of t h e p h a s e s must be known t o d e t e r m i n e how t h e d i f f u s i o n
p a t h passes t h r o u g h t h e t h r e e - p h a s e f i e l d . I t s h o u l d be
n o t e d , f o l l o w i n g t h e c o n v e n t i o n of C l a r k (131, t h a t a d i f -
f u s i o n p a t h t h r o u g h a t h r e e - p h a s e f i e l d i s r e p r e s e n t e d by a
dashed l i n e . T h i s i s b e c a u s e t h e e q u i l i b r i u m between t h e
t h r e e p h a s e s (e.g. a two-phase l a y e r a d j a c e n t t o a s i n g l e
p h a s e l a y e r o f a d i f f e r e n t p h a s e , o r a d j a c e n t two-phase l a y e r s
w i t h a common p h a s e ) m u s t be a n i n t e r f a c e o n l y ( i . e . a t h r e e
l a y e r c a n n o t form i n t h e d i f f u s i o n z o n e ) . The l i n e r e p r e -
s e n t s no s p a t i a l e x t e n t .
I n summary, c o n s t r u c t i o n of a q u a n t i t a t i v e complex, mul-
t i p h a s e d i f f u s i o n p a t h c a n o n l y be done from a measured C / D
p r o f i l e . The p a t h t h r o u g h a one-phase f i e l d i s d e t e r m i n e d
from a C/D p r o f i l e i n t h e o n e p h a s e l a y e r of t h e d i f f u s i o n
zone. The p a t h t h r o u g h a two-phase f i e l d ( a s suming t i e l i n e s
are c u t ) i s d e t e r m i n e d f r o m C/D p r o f i l e s i n t h e p h a s e s i n t h e
two-phase l a y e r and t h e volume f r a c t i o n of o n e o f t h e p h a s e s
w i t h d i s t a n c e t h r o u g h t h e two-phase l a y e r . The p a t h t h r o u g h
a t h r e e - p h a s e f i e l d i s d e t e r m i n e d i n t h e same manner as f o r
a p a t h t h r o u g h a two-phase f i e l d .
C l a r k and Rh ines ( 1 2 ) w e r e f o r e r u n n e r s i n p l o t t i n g c o m -
p l e x m u l t i p h a s e d i f f u s i o n p a t h s . S i n c e t h e n , o n l y a s m a l l
number o f w o r k e r s (10-11, 14-19) have s t u d i e d t h e deve lopment

of complex, multiphase diffusion paths. Clark and Rhines (12)
and Kirkaldy and Brown (10) have summarized theorems pertaining
to plotting diffusion paths on the ternary diagram. In response
to a discussion of the work by Kirkaldy and Brown (lo), Clark (13)
put forth rules concerning how diffusion paths should be plotted
on the ternary diagram. All paths constructed in this study con-
formed to the theorems of Kirkaldy and Brown (10). The diffusion
path plotting convention proposed by Clark (13) was also followed.
In this study, the terminal alloys were composed of two-
phase/two-phase (B+y/y+y ' ) alloys and two-phase / one-phase (B+y/y)
alloys. Interdiffusion resulted in complex multiphase diffusion
paths. All diffusion path segments in the B+y regions were deter-
mined following the suggestion of Clark ( 9 ) . C/D profiles of Cr
and A1 in the B and yphases were measured with the electron
microprobe analyzer. The volume fraction of they phase at spe-
cific distances was also measured using lineal analysis (20).
The B and y phase concentrations and the volume fraction of y,
all at a given distance, were input into a computer program which
calculated the bulk Cr and A1 compositions at that distance. The
procedure was repeated throughout the diffusion zone. After the
bulk Cr and A1 compositions were obtained throughout the diffus-
Zion Z O A F , t h e y were plotted versus distance to yield the varia-
tion of the bulk compositions in the diffusion zone. Typically,
the calculated bulk Cr and A1 compositions did not fall along
smooth curves, and thus smooth curves had to be drawn through
D-8 .- ,

the data points. In doing this, the volume fraction of y at any
given distance measured frcm the bulk Cr curve usually did not
equal the volume fraction of measured at the same distance from
the bulk A1 curve. Typically, the volume fractions of y calcu-
lated from the bulk Cr curve and bulk A1 curve were off by less
than 10.0 vol.%, which was within the standard deviation of the
volume fraction measurements made by lineal analysis. Using the
bulk Cr and A1 curves, Cr and A1 compositions at given distances
in the diffusion zone were extracted and plotted on the NiCrAl
phase diagram. The points on the NiCrAl phase diagram were con-
nected to yield the diffusion path through the B+y phase field.
One adherent assumption in calculating diffusion paths
through two-phase fields is that each parallel layer of the
couple (parallel to the original interface) is in equilibrium
across the whole couple, with no lateral diffusion. This assump-
tion allows the measured phase concentrations at a given dis-
tance to define which tie lines are cut, and the measured volume
fraction at a given distance to determine at what points the tie
lines are cut. This assumption is quite valid for the section
of diffusion path that resulted from diffusion in the B+y alloy.
Lateral microprobe traces (at a given distance) over at least
two to three 6 and phases showed, within experimental error,
that local equilibrium existed. In the B + ~ growth layer, however,
the very nature of the columnar layers suggested that some lat-
' eral diffusion must occur (10,211. If lateral diffusion occurs
extensively, deviations from equilibrium tie line compositions
I D-9
I

c a n o c c u r . T h i s f a c t w a s found t o o c c u r i n non-p lana r i n t e r f a c e s
i n a s t u d y of m u l t i - p h a s e d i f f u s i o n i n t h e F e - N i - A 1 s y s t e m ( 1 9 ) .
L a t e r a l microprobe traces w e r e per formed a t g i v e n d i s t a n c e s i n
t h e B+y growth r e g i o n . The r e s u l t s showed t h a t some la te ra l d i f -
f u s i o n w a s o c c u r r i n g . The e x t e n t o f l a t e r a l d i f f u s i o n w a s v e r y
small - s i g n i f i e d by v e r y small c o n c e n t r a t i o n g r a d i e n t s ( i . e .
each measurement w a s almost w i t h i n t h e s t a n d a r d d e v i a t i o n of t h e
p r e v i o u s measurement) - and i n s i g n i f i c a n t compared t o t h e change
i n c o n c e n t r a t i o n t h a t o c c u r r e d a l o n g t h e l o n g a x i s of t h e columns.
I t w a s therefore assumed t h a t local e q u i l i b r i u m e x i s t e d eve rywhere ,
and t h u s t h e d i f f u s i o n pa th w a s r e p r e s e n t e d by a s t a t i o n a r y l i n e
c o n n e c t i n g a c o n t i n u o u s series of local e q u i l i b r i a .
Segments of t h e d i f f u s i o n p a t h s t h a t e n t e r e d t h e t h r e e - p h a s e
@+rfv ' t r i a n g l e from t h e B+y s i d e w e r e c a l c u l a t e d i n t h e same
manner as f o r t h e p a t h segments i n t h e B+y p h a s e f i e l d . P a t h
segments t h a t e x i t e d t h e t r i a n g l e on t h e y+y' s i d e w e r e d e t e r m i n e d -
by measu r ing t h e volume f r a c t i o n of a t t h e growth l a y e r (B+Y
o r y ) / y + y ' i n t e r f a c e s i n t h e c o u p l e s . D i f f u s i o n p a t h segments
t h r o u g h t h e y+y ' p h a s e f i e l d w e r e o b t a i n e h Ly c o n n e c t i n g t h e
p o i n t where t h e p a t h e n t e r e d t h e y+y ' p h a s e f i e l d t o t h e y+y'
a l l o y compos i t ion . Therefore, these segments are est imated.
A l l o t h e r d i f f u s i o n p a t h segments ( i . e . , segments i n t h e y phase ,
and segments i n t h e y ' p h a s e ) w e r e d e t e r m i n e d f r o m C/D p r o f i l e s
i n t h e r e s p e c t i v e p h a s e l a y e r s i n t h e d i f f u s i o n zone .
E s t i m a t i o n s of t h e a c c u r a c y of t h e c a l c u l a t e d d i f f u s i o n p a t h
segments i n t h e B+y p h a s e f i e l d w e r e made u s i n g t h e s t a n d a r d

deviations of the volume fraction measurements made by lineal
analysis (20). On average, a standard deviation of approximately
- +5.0 vol.% y was found. Inputting the limits (i.e., measured
value 5 standard deviation) into the computer program along with
the measured phase concentrations gave variations in bulk Cr and
A1 composition of 2.0 at.% or less. Thus, the accuracy of the
diffusion path segments in the B+y phase field is estimated as
being approximately 52.0 at.% (Cr or Al). This accuracy was con-
firmed by measuring bulk compositions at given distances in the
diffusion zone with a scanning electron microscope line scan,
KEVEX 8000 series energy-dispersive X-ray analyzer and subsequent
Magic V ZAF correction routine.
within 1.5 at.% (Cr or Al) of the calculated values.
The measurements were always
Finally, it should be noted that diffusion paths are the
most concise analytical representation of the structure that re-
sults from diffusion (9). They show on the ternary isotherm the
final steady state sequence of phases that appear in the diffu-
sion couple ( 9 ) . Kirkaldy et.al. !lo) has argued that in plot-
ting diffusion paths on the ternary isotherm, time and distance
have been eliminated, and hence most of the kinetic information
contained in the C/D profile is lost. In view of this, efforts
have been made in this study to present both forms of informa-
tion - diffusion paths and the C/D profiles from which the paths originated.
D-11

REFERENCES
1. L. Onsager, Phys. Rev., 37, 405, ( 1 9 3 1 ) .
2 . L. Onsage r , Phys. Rev., 38, 2265, ( 1 9 3 1 ) .
3 . L. Onsager, Ann. N.Y. Acad. S c i . , 4 6 , 2 4 1 , (1945-6) .
4 - J. S. K i r k a l d y , Can. J. Phys . , 35, 435, ( 1 9 5 7 ) .
5. J. S . K i r k a l d y , Can. J. Phys. , 36, 899, ( 1 9 5 8 ) .
6 . J. S . Kirka ldy . , Can. J. Phys . , 36, 907, ( 1 9 5 8 ) .
7 . J. S . K i r k a l d y , Can. J. Phys . , 36, 917, ( 1 9 5 8 ) .
8. J. S. K i r k a l d y , Can. J. Phys . , 37, 30, ( 1 9 5 9 ) .
9. J. B. C l a r k , D i s c u s s i o n t o R e f e r e n c e 10 .
10. J. S. K i r k a l d y and L. C. Brown, Can. M e t . Qua r t . , 3, 8 9 , (1963) .
11. D. E. Coates and J. S. K i r k a l d y , M e t . T r a n s . , 2, 3467, (1971) .
12. J. B. C l a r k and F. N . Rh ines , ASM T r a n s . , 51, 199, ( 1 9 5 9 ) .
13. J. B. C l a r k , T r a n s . A I M E , 227, 1250, ( 1 9 6 3 ) .
1 4 . A. G. Guy, H. F e c h t i g , and R . H . Buck, T r a n s . AIME, 233, 1178, ( 1 9 6 5 ) .
15 . J. S. K i r k a l d y and D. G. Fedak, T r a n s . AIME, 224, 490, ( 1 9 6 2 ) .
1 6 . C. W. T a y l o r , Jr . , M. A. Dyaananda, and R. E. Grace, M e t . T r a n s . , I, 127, ( 1 9 7 0 ) .
17 . R. D. S i s s o n , Jr. and M. A. Dayananda, M e t . T r a n s . , 3, 647, ( 1 9 7 2 ) .
18. L. E. W i r t z a n d M. A. Dayananda, M e t . T r a n s . , E, 367, ( 1 9 7 7 ) .
19 . G. H. Cheng and M. A. Dayananda, M e t . T r a n s . , G, 1407, ( 1 9 7 9 ) .
b12

20. J. E. Hilliard, J. W. Cahn, Trans. AIME, 221, 344, (1961).
21. J. S. Kirkaldy, Discussion to Reference 12.
D-13

1. Report No.
NASA CR-174852
A Study of Interdiffusion in B + y / y + y ' Ni-Cr-A1 Alloys at 1200 C
2. Government Accession No.
7. Author@)
19. Security Classif. (of this report) 20. Security Classif. (of this page) 21. No. of pages
Unclassified Unclassified 189
Lawrence A. Carol
22. Price'
A 0 9
9. Performing Organization Name and Address
Michigan Technological University Houghton, Michigan
2. Sponsoring Agency Name and Address
National Aeronautics and Space Administration Washington, D.C. 20545
3. Recipient's Catalog No.
5. Report Date
February 1985 --
6. Performlng Organization Code
8. Performing Organization Report No.
None 10. Work Unit No.
11. Contract or Grant No NAG 3-244
13. Type of Report and Period Covered
Contractor Report
14. Sponsoring Agency Code
505-33-62
15. Supplementary Notes Final report. Lewis Research Center, Cleveland, Ohio 44135. This report was submitted in partial fulfillment of the requirements for the degree Master of Science in Metallurgical Engineering to Michigan Technological University, Houghton, Michigan in 1984.
Project Manager, Michael A. Gedwill, Jr., Materials Division, NASA
16. Abstract Terna ry d i f f u s i o n i n t h e N i C r A l system a t 1200 O C has been s t u d i e d w i t h 0 + y $ + y ' d i f f u s i o n couples. C o n c e n t r a t i o n / d i s t a n c e p r o f i l e s f o r C r and A 1 i n t h e phases p r e s e n t i n t h e d i f f u s i o n zone were measured a f t e r 200 hr. The Ni - r ich p o r t i o n o f t h e N i C r A l phase d iagram (1200 O C was a l s o determined.
isotherm. Growth l a y e r k i n e t i c s o f t h e l a y e r s p r e s e n t i n t h e d i f f u s i o n zone were a l s o measured. R e s u l t s o f t h i s work showed t h a t t h e d i f f u s i o n p a t h s proceeded f rom t h e 6 + y a l l o y compos i t i on t o t h t y + y ' a l l o y . The p a t h s s tayed i n t h e B + y phase f i e l d , o r a long t h e y/8 + y phase boundary and u s u a l l y proceeded t h r o u g h t h e B + y + y ' t r i a n g l e t o t h e y + y ' a l l o y composi t ion. P rog ress ion o f t h e p a t h f r o m t h e 0 + y a l l o y compos i t i on t o t h e t r i a n g l e occu r red b y g rowth o f 0 + y o r y l a y e r s , Which l a y e r was grown depended on t h e 0 + y a l l o y composi t ion, and i n p a r t i c u l a r , t h e C r c o n c e n t r a t i o n i n t h e y-phase. C a l c u l a t e d b u l k c o n c e n t r a t i o n / d i s t a n c e p r o f i l e s showed t h a t s t r o n g n e g a t i v e b u l k C r g r a d i e n t s were l a r e l y r e s p o n s i b l e f o r f o r m a t i o n and g rowth o f t h e 6 + y l a ers . Development o f t h e s t r o n g b u l k C r q r a j i e n t s was r e l a t e d t o maximum C r f l u x e s i n t h e y-phase. d e a b i l i t y t o develop maximum C r f l u x e s i n t h e y-phase was a f u n c t i o n o f t h e y-phase C r c o n c e n t r a t i o n . The y + y ' a l l o y compos i t i on was found t o de te rm ine where t h e d i f f u s i o n p a t h s proceeded th rough t h e 0 + y + y ' angle. As t h e y + y ' a l l o y C r compos i t i on decreased, t h e d i f f u s i o n p a t h s t r a n s l a t i o n up t h e 6 + y and y + y ' s i d e o f t h e t r i a n g l e t o h i g h e r A1 composi t ion. The p a t h t r a n s l a t e d up t h e 6 + y s i d e o f t h e t r i a n g l e r e s u l t e d i n i nc reased volume f r a c t i o n s o f 8 i n t h e 0 + y q rowth l aye rs . T r a n s l a t i o n 01 t h e p a t h up t h e y + y ' s i d e r e s u l t e d i n inc reased volume f r a c t i o n s o f y a t t h e 8 + y/y + y ' i n t e r f a c e s . A; y + y ' a l l o y compos i t i ons l e s s t h a n 6.0 a t % C r , t h e p a t h s move i n t o t h e y ' phase f i e l d and a y
i n f i n i t e I n t e r d i f f u s i o n r e s u l t e d i n t h e f o r m a t i o n o f complex, m u l t i p ase d i f f u s i o n zones.
From t h e s e data, b u l k C r and A 1 p r o f i l e s were c a l c u l a t e d and t r a n s l a t e d t o d 1 f f u s i o n pa ths on t h e t e r n a r y
a l l o y compos i t i on as a r e s u l t o f C r and A 1 t r a n s p o r t f r o m t h e 0 + y a l l o y t o t h e y + y '
tri-
g rowth l a y e r forms i n t h e d i f f u s i o n zone.
17. Key Words (Suggested by Author@)) 118. Distribution Statement
NiCrAl alloy Overlay coatings Interdiffusion
Unclassified - unlimited STAR Category 26
'For sale by the National Technical Information Service. Springfield. Virginia 22161