nasa cr 4% · table ii. weather summary ... 2802 psa 181 8:54 63 59 79 240 7 2805 psa 59 11:55 69...
TRANSCRIPT

NASA CR + 4%
NOISE MEASUREMENTS TAKEN AT LAX
DURING OPERATIONAL EVALUATION OF TWO-SEGMENT
APPROACHES IN A 727-200 AIRCRAFT
By Carole S. Tanner and Ray E. Glass
(GASA-C2 -114690) :CSE 'ASUcEiETS l AKEINAl LAX DUAOIG OPERAIOjhAI EVALUATICO C7TWo-SEGE APP'aCHES Ii A 727-200AISCz A.? (lHydrospace-Challlaer, Inc., San Uhcl1sDieqo, Caliz.) 21 p HC C.CL 20A G3/02 33011 )
Distribution of this report is provided in the interest ofinformation exchange. Responsibility for the contentsresides in the author or organization that prepared it.
HCI Report No. TR-S-231
Prepared under Contract No. NAS2-7369 byHYDROSPACE-CHALLENGER, INC.
San Diego, California
for
AMES RESEARCH CENTERNATIONAL AERONAUTICS AND SPACE ADMINISTRATION
Reproduced by
NATIONAL TECHNICALINFORMATION SERVICE
US Department of CommerceSpringfield, VA. 22151
?or
https://ntrs.nasa.gov/search.jsp?R=19740010573 2018-08-23T09:05:32+00:00Z

NOISE MEASUREMENTS TAKEN AT LAX
DURING OPERATIONAL EVALUATION OF TWO-SEGMENT
APPROACHES IN A 727-200 AIRCRAFT
By Carole S. Tanner and Ray E 0,-,oeHydrospace -Challenger, Inc.
SUMMARY
A series of seven noise measurements were made each day over a
period of fifteen days. The first and last flights each day were made by aspecially instrumented 727-200 aircraft being used to evaluate the opera-tional effectiveness of two-segment noise abatement approaches in scheduled service. Noise measurements were made to determine the noisereduction benefits of the two-segment approaches.
INTRODUCTION
This report presents the results of acoustic measurements made on727-200 aircraft in revenue service. There were a total of seven flightsrecorded each day. The first and last measurement flights each day uti-lized a United Airlines aircraft equipped with a special-purpose glide slocpecomputer to provide the capability of making two-segment noise abatementapproaches., For upper segment computations, the computer used barometric.,corrected pressure altitude and the slant range to a DME transmitter whichwas co-located with the glide slope transmitter. The computer used the ILSglide slope deviation for lower segment computations.
Additional measurements were taken each day on three PSA revenue
flights and two other United Airlines revenue flights. The PSA revenueflights performed visual two-segment approaches whenever possible. Thetwo United Airline flights always utilized ILS approaches. These latter wereintended as baseline data.
The purpose of the acoustical portion of the test was to measure andidentify the noise levels associated with automated and visual two-segmentapproaches and to compare approaches. A total of six measurement siteswere utilized. These -were located on or near the extended runway center-line from 1 to 7 nautical miles from runway threshold.
The accustic tests were conducted from 15 to 29 June 1973 on runway25L at Los Angeles International Airport.

APPARATUS AND METHODS
Aircraft and Test Profiles
The United aircraft were Boeing 727-222 with three Prat . VI "'.. iy
JT8D-7 turbofan engines. The specially instrumented United Airlines air-
craft flew a two-segment six-degree/690-foot intercept profile as shown in
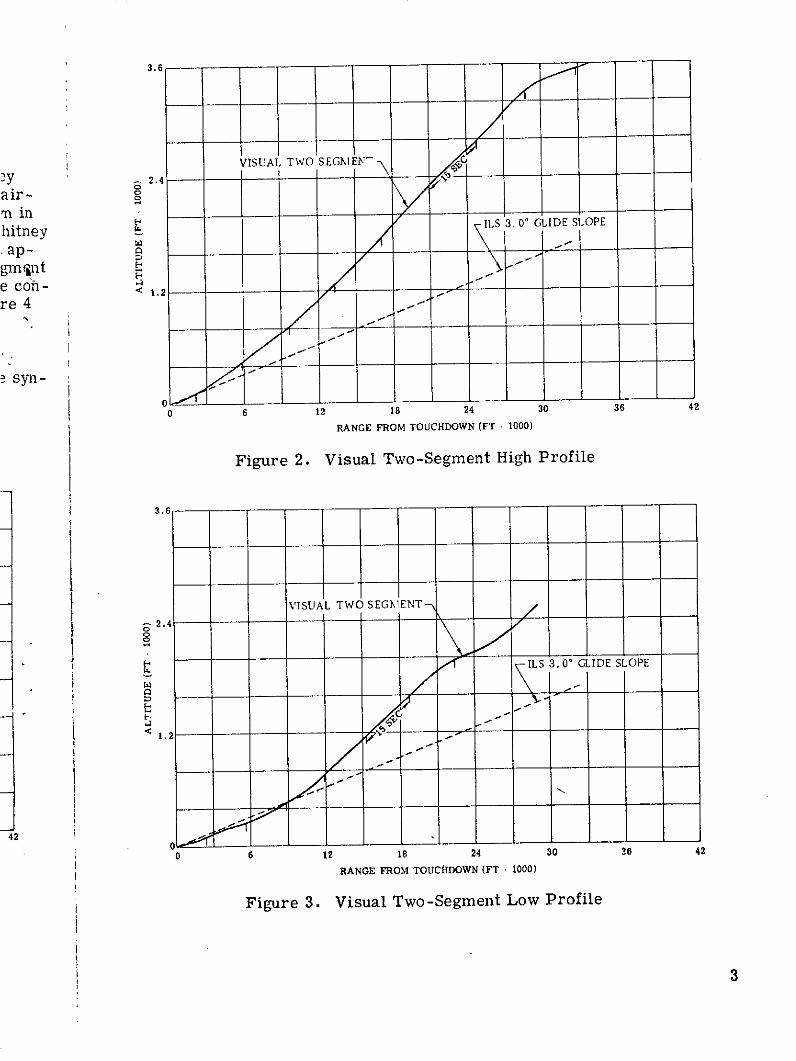
Figure 1. The PSA aircraft were Boeing 727-214 with three Pratt &WhitneyJT8D-9 turbofan engines. The PSA aircraft flew a visual two-segment ap-
proach when weather permitted. Figure 2 shows a typical high two-segment
approach and Figure 3 shows a typical low two-segment approach. The con-
ventional United Airlines aircraft flew standard ILS approaches. Figure 4
:'-ws a typical ILS approach profile.
The specially equipped United Airlines aircraft was instrumented to
record on-board a number of flight parameters. These data were time syn-
chronized to both the radar and acoustic data using IRIG B time code.
3.6
2.4
<1.2 I
0 6 12 18 24 30 36 42
RANGE FROM TOUCHDOWN (FT • 1000)
Figure 1. Two-Segment Instrumented Aircraft, 6 Deg/690 Ft
2
3.6
VISUAL TWO SEGMlEN-'Y ^ 2.4
,n inhitney ILS 3. 0' GLIDE SLOPE
gm ent 1-'e coni- 1.2re 4
? syn -
00 6 12 18 24 30 36 42
RANGE FROM TOUCHDOWN (FT . 1000)
Figure 2. Visual Two-Segment High Profile
3.6
VISUAL TWO SEGMENT
ILS 3. 0' GLIDE SLOPE
<1 .
420
0 6 12 18 24 30 36 42
RANGE FROM TOUCHDOWN (FT . 1000)
Figure 3. Visual Two-Segment Low Profile

3.6
-2.4 -
C. NORMAL ILS
ILS 3. 0* GLIDE SLOPE
- 1.2
00 6 12 18 24 30 36 42
RANGE FROM TOUCHDOWN (FT - 1000)
Figure 4. Normal ILS
Acoustic Measurements
Acoustic data were acquired using battery-operated remote-controlled,portable acquisition systems. Figure 5 presents a block diagram of the sys-tems. The typical system utilizes a two-channel analog tape recorder. Onechannel records acoustic data and the other channel records an IRIG B time
signal. The time is broadcast over a radio link at 162.275 MHz (megahertz).The time signal is a 1-kHz (kilohertz) modulated carrier. The received timesignal serves two functions: 1) it provides a common recorded time base forall systems and 2) the 1-kHz carrier operates a tape motion controller built
by Hydrospace-Challenger, Inc. (HCI).
Each system was calibrated over a frequency range of 40 to 12 000 Hz
using an electrical signal. Figure 6 is a typical total system frequencyresponse. The high frequency pre-emphasis is removed during processingbut provides a better signal for analog recording since it compensates forhigh-frequency sound attenuation due to the atmosphere.
The recording systems were checked for tape quantity as well as acous-tically calibrated every morning.
4

162.275 MHZ FM
VHFMICNT
FMCROPHONE EMICROPHONE POWER RECEIVER/
SIGNAL TAPE MOTIONCONDITIONING CONTROL
ACOUSTIC IRIG B
DATA TIME CODE
TWO-CHANNELANALOG TAPE TAPE MOTION
RECORDER COMMAND3-3/4 IPS
42'
Figure 5. Acoustic Data Acquisition System
rolled,the sys- Q!r. One z1B time Dzahertz). -ved -time Uobase forer built
00 Hzluency.essing
sfor ooo00o0 C C (D C C C
i acouS- FREQUENCY (CPS)
Figure 6. Typical System Response
5

The radio receiver was always operated using normal 115-volt 60-Hzpower. The 1-kHz signal from the IRIG B time code controlled power tc themicrophone system and tape recorder. The warm-up time was less than10 seconds. All systems were activated when the aircraft was 8 to 10 naut>-cal miles from runway threshold ank deactivated 0.5 mile after touchdown.
Acoustic measurements were madeat six locations on or near the extended Table I. Noise Measurementrunway centerline. Table I presents thepositioning of the sites used during theexercise. All distances along the ex- Distance
From Runwaytended centerline are referenced to the Thresholdrunway threshold. The sites were lo- Site (ft)cated using an orthographic map obtained 1 6 822from the U.S. Geological Survey. The 2 10557site locations were measurable to an ac-curacy of ±150 feet. Figures 7 through 3 16 76012 show the measurement microphone 4 21 500and antenna arrangements at each of the 5 27 735six sites; Sites 1, 2, 3, 4, 5, 7, respec-tively. Figure 13 shows the noise mea- 7 37 685surement site locations and majortopographical features.
Meteorological Measurements
Meteorological measurements of temperature, relative humidity, andwind speed and direction were obtained from the National Weather Serviceat LAX. Their measurement equipment was located between runways 25Land 25 R. The measurements were less than 0.5 mile from the radar van,which also housed the noise acquisition command station. Table II lists theappropriate meteorological parameters.
Aircraft Tracking
Radar tracking was provided by a Bell Aerospace radar unit. The radarprovided both an on-line two-dimensional plot and digital three-dimensionaldata. Acoustic data processing was performed using the three-dimensionaldata which was reduced to slant range from the measurement site to the air-craft for each measurement site as a function of time.
6

-Hz
.i
.to th
e L .
.
nau
ti- .
dow
n.
25L
' :
-emen
t 4j
A-
,.
\andi i
..
25L
e radar
r
sional
e z
sion
alhe a
ir -
i h~j r
i

03
..:.
" t
i ci
'bD I~~*
... .... 4,-". " ," -.
Figure 9. Measurement Site 3 Figure 10. Measurement Sue 4
\ .

Ir
Figure 9. Measurement Site 3 Figure 10. Measurement Site 4
S.- --- -.... . . . . . .- - - .-.-.--, ~' ~ ~ F"
1-"
©
\
-" - I!
F - "' tF
i e . Mt S 5iv U-1 II
I. 3jjjAut< 41. Iesrmn tS.-- . -iue1.Maurmn:S

Table II. Weather Summary
Relative Wind Wind
Run Time of Temp Data Humidity Direction Speed
No. Flight Reading ("F) Point (I0) (deg) (kt)
1502 PSA 181 7:55 66 52 36 230 4
1503 PSA 281 9:55 68 52 31 241505 PSA 59 11:55 70 53 29 250 11
1601 UA 975 7:35 66 54 44 150 5
1602 PSA 181 7:55 68 55 42 200 5
1605 PSA 59 11:55 70 55 36 230 11
1607 UA 729 14:55 70 56 40 250 13
1701 UA 975 7:18 65 56 56 070 6
1704 UA 289 9:55 70 56 40 240 10
1706 UA 371 12:55 71 56 37 240 11
1707 UA 729 14:55 70 57 44 250 13
1801 UA 975 7:33 '68 58 54 100 5
1803 PSA 281 9:55 71 59 48 250 6
1805 PSA 59 11:55 72 60 49 240 13
1806 UA 371 12:55 72 60 49 230 10
1807 UA 729 14:55 73 58 39 240 10
1904 UA 289 9:55 78 62 39 250 7
1905 PSA 59 11:55 83 61 25.5 260 9
1907 UA 729 14:54 78 62 39 270 16
2001 UA 975 7:35 85 56 10 330 4
2102 PSA 181 7:56 87 44 <1 110 52104 UA 289 9:55 86 62 23 260 8
2105 PSA 59 11:55 85 57 13 250 11
2106 UA 371 12:55 88 54 03 240 9
2203 PSA 281 9:55 68 58 54 240 8
2204 UA 289 9:55 68 58 54 240 8
2206 UA 371 12:54 72 59 45 250 12
2207 UA 729 14:54 73 58 39 240 13
2301 UA 975 7:56 73 61 50 140 3
2302 PSA 181 7:56 73 61 50 140 3
2303 PSA 281 9:56 73 61 50 240 8
2305 PSA 59 11:55 74 58 36 250 10
2306 UA 371 12:46 73 58 39 240 12
2307 UA 729 14:55 71 56 37 240 17
2401 UA 975 7:55 72 59 45 130 4
2404 UA 289 9:55 74 61 47 240 8
2406 UA 371 12:55 73 62 53 250 9
2407 UA 729 14:55 73 63 57 250 10
2505 PSA 59 11:55 72 62 57 250 6
2602 PSA 181 7:55 64 61 84 240 5
2603 PSA 281 9:55 69 62 67 140 6
2604 PSA 289 9:55 69 62 67 140 6
2606 UA 371 12:56 74 62 50 240 10
2702 PSA 181 7:55 67 61 71 210 5
2703 PSA 281 9:55 71 61 56 250 62706 UA 371 12:55 71 60 52 250 11
2801 UA 975 7:54 63 59 79 240 7
2802 PSA 181 8:54 63 59 79 240 7
2805 PSA 59 11:55 69 62 67 150 5
2806 UA 371 12:55 67 61 71 140 4
2901 UA 975 7:32 63 59 79 240 6
2902 PSA 181 7:55 63 58 79 250 5
2904 UA 289 9:55 67 61 71 240 6
2906 UA 371 12:55 74 61 47 240 8
2907 UA 729 14:55 71 56 37 240 6
10

- - _ ' T.''A '
Li r . A.
1 it
ftiflv UT iiSREET I
1 9t 92
0 27
~l-,- 3 'Jj U
W-E 12.= Figure 13. Measurement Site Lpr~ation

Acoustic Data Processing
The acoustic data were processed at HCI's San Diego Operations. The
processing equipment and the computer program used conform to the require-
ments of FAR Part 36. The acoustic data were adjusted for system fre-
quency response, effect of w '.dscreen, grazing incidence, effects of tem-
perature and humidity, and effects of backgrourd. Deta. wr- r.t corree+od
for gross weight differences.
Aircraft Performance Data
For the specially instrumented test aircraft, which made two approaches
a day into LAX, flight, control, and engine parameters were recorded on a
digital recording system aboard the aircraft along with time code. A flightdata entry panel was provided on the flight deck and a time code generator
enabled synchronization of the airborne recorder with data recorded at the
ground radar and noise data. The remaining five flights each day simply re-ported gross weight, flaps, and EPR. The pilots attempted to maintain con-
stant flaps and EPR. The changes are not known, however.
Time Synchronization
Timing between-the radar and acoustic data was provided with a singletime code generator synchronized daily to WWV. The time code generatorwas located in the radar van. The radar van also housed the noise measure-ment command station. The time code generator output signal (IRIG B) wasconnected in parallel to both the radar recorder and the noise measurementtiming and command transmitter. There is no timing error between radarand acoustic data.
RESULTS
Tables III through VIII represent the noise measurements at each site.
The measurements at each site are grouped according to the specific dayand ordered as they occurred each day. Missing flights are the result of
landing on an uninstrumented runway, inability to track aircraft, or ambientacoustic interference during the flyover, as well as occasional hardwaremalfunction of either the radar or acoustic instrumentation.
Corresponding aircraft range for each noise data point was obtainedfrom Government-furnished data. Slant range at CPA is the closest the air-
craft came to the measurement site. The time of PNLTM is the time during
PRBCEDING PAGE BLANK NOT FILMED 13

the flyover of a given site when the maximum tone-corrected perceived
noise level occurred. It does not necessarily occur at the CPA time. This
time is an output of the acoustic data processing program.
Hydrospace-Challenger, Inc.1360 Rosecrans Street
San Diego, California, August 31, 1973
14

ived Table III. LAX - June 1973, Site 1
.e. ThisSLANT RANGE TIME OF
(CPA) PNLTMDATE FLIGHT EPNL C (ft) (hr:min:sec)
15 June PSA 181 110.6 343 08:04:27
PSA 59 116. 1 368 12:03:14
16 June PSA 181 103. 2 372 07:57:33
PSA 59 104.8 321 11:59:05
UA 729 100.9 186 14:52:30
17 June UA 975 102. 0 350 07:35:05UA 289 100.0 353 10:11:13
UA 371 102.6 313 12:46:56UA 729 107.3 360 14:53:51
18 June UA 975 102.6 339 07:32:07PSA 281 98.3 "455 10:01:12PSA 59 96.2 352 12:04:19UA 371 100.2 366 12:50:30UA 729 102.2 327 14:47:17
19 June UA 289 101.5 323 10:12:27UA 729 99.4 320 14:56:30
20 June UA 975 99.8 334 07:34:40
21 June PSA 181 110.3 527 07 :59:44UA 289 111.6 320 10:12:49PSA 59 109.9 392 11:58:31
22 June PSA 281 98.0 875 09:57:24UA 289 111.9 308 10:20:03UA 371 109.4 320 12:57:39UA 729 111.1 303 15:00:53
23 June UA 975 111.3 340 07:30:52PSA 181 105.4 390 07:55:07
PSA 281 110.0 418 09:54:47PSA 59 116.2 304 11:55:54UA 729 112.8 318 14:53:01
24 June UA 975 105.6 330 07:29:54UA 289 114.0 340 10:10:52
26 June UA 289 108.5 318 10:26:56UA 371 108.9 318 12:57:01
27 June UA 371 109.6 318 12:59:14
28 June UA 975 109. 5 344 07:33:42
PSA 181 114.2 248 08:04:19
PSA 59 108.9 299 12:05:00UA 371 111.3 325 13:04:06
29 June UA 975 111. 5 357 07:35:24PSA 181 106. 7 362 08:03:51
UA 289 113. 5 309 10:11:41UA 371 111.8 314 13:13:54
UA 729 110.4 347 15:01:02
15

Table IV. LAX - June 1973, Site 2
SLANT RANGE TIME OF(CPA) PNLTM
DATE FLIGHT EPNLC (ft) (hr:min:sec)
15 June PSA 181 108.0 631 08:04: 1PSA 59 109.5 552 12:02:59
16 June PSA 181 96.1 711 07:57:17PSA 59 109.0 476 11:58:46UA 729 105.6 518 14:52:12
17 June UA 975 102.6 571 07:34:51UA 289 102.4 534 10:10:58UA 371 103.6 492 12:46:40UA 729 96.4 597 14:53:34
18 June UA 975 100. 6 535 07:31:51PSA 281 94.3 861 10:00:58PSA 59 92.2 748 12:04:03UA 371 102.3 510 12:50:12UA 729 102.7 525 14:46:59
19 June UA 289 99.0 540 10:12:11UA 729 100.2 529 14:56:12
20 June UA 975 98.4 529 07:34:26
21 June PSA 181 101.1 913 07:59:30UA 289 105.7 471 10:12:33PSA 59 99.2 749 11:58:16
22 June PSA 281 95.0 875 09:57:02UA 289 96.0 466 10:19:40UA 371 106.6 506 12:57:21UA 729 105.6 526 15:00:33
23 June UA 975 102.9 574 07:30:36PSA 181 97.3 790 07:54:53PSA 281 95.6 769 09:54:31PSA 59 106.2 594 11:55:36UA 729 108. 6 498 14:52:39
24 June UA 975 98.9 540 07:29:41UA 289 104.9 489 10:10:16UA 371 99.3 1020 12:52:02
25 June PSA 59 102.5 776 12:01:22
26 June UA 289 105.0 506 10:20:41
27 June UA 371 105.2 509 12:58:55
28 June UA 975 106.4 520 07:33:26PSA 181 103.4 495 08:04:02PSA 59 103.9 509 12:04:42UA 371 107.5 508 13:03:48
29 June UA 975 109.2 519 07:35:09PSA 181 102.1 537 08:03:36UA 289 110.1 485 10:11:23UA 371 107. 1 504 13:13:37UA 729 104.2 666 15:00:46
16

Table V. LAX - June 1973, Site 3
SLANT RANGE TIME OF(CPA) PNLTM
DATE FLIGHT EPNLC (ft) (hr:min:sec)
15 June PSA 181 104.3 965 08:03:46PSA 59 102.4 835 12:02:31
16 June PSA 181 94. 1 1219 07:56:56PSA 59 96. 7 1023 11:58:20UA 729 100.6 1000 14:51:40
17 June UA 975 98.5 1096 07:34:28UA 289 105.4 835 10:10:34UA 371 102.0 851 12:46:11UA 729 99.7 1316 14:53:12
18 June UA 975 97.3 1059 07:31:27PSA 281 91.7 1347 10:00:34
PSA 59 92.4 1208 12:03:40UA 371 106.2 827 12:49:41UA 729 100.5 1049 14:46:30
19 June UA 289 100.2 852 10:11:45UA 729 93.3 1026 14:55:45
20 June UA 975 92. 3 1019 07:34:03
21 June PSA 181 89.0 1554 07:58:32UA 289 103. 0 800 10:12:02
22 June UA 289 102. 0 823 10:19:21UA 371 102.5 807 12:56:55UA 729 101.6 977 15:00:07
23 June UA 975 99. 3 957 07:30:13PSA 181 88.4 1613 07:54:29PSA 281 88.0 1308 09:54:08PSA 59 90.6 1290 11:55:13UA 729 94.9 1039 14:52:09
24 June UA 975 94. 3 1030 07:29:19UA 289 102.8 820 10:08:58UA 371 101.5 884 12:51:39
25 June PSA 59 90.6 1310 12:00:58
26 June UA 289 106. 0 803 10:20:14UA 371 103. 0 762 12:56:16
27 June UA 371 105. 6 802 12:58:24
28 June UA 975 91.9 1019 07:32:59PSA 181 102.9 796 08:03:38PSA 59 104. 3 757 12:04:17
UA 371 108.7 836 13:03:22
29 June UA 975 102.8 887 07:34:45UA 371 106.3 817 13:13:08UA 729 99.3 1099 15:00:22
17

Table VI. LAX - June 1973, Site 4
SLANT RANGE TIME OF(CPA) PNLTM
DATE FLIGHT EPNLC (ft) (hr:min:sec)
15 June PSA 181 100.8 1301 08:03:24PSA 59 96.2 1173 12:02:10
17 June UA 371 95. 6 1338 12:45:50
18 June PSA 281 88.6 1844 10:00:18PSA 59 89.6 1541 12:03:22UA 371 101.8 969 12:49:21UA 729 94.1 1452 14:46:11
19 June UA 289 95.9 962 10:11:23PSA 59 * 81.4 1987 11:56:43
21 June UA 289 100.2 ' 930 10:11:56
22 June UA 729 92.9 1397 14:59:41
23 June UA 975 92.8 1453 07:29:53PSA 181 98.4 1990 07:54:13
24 June UA 975 90. 5 1404 07:29:05UA 289 99.1 869 10:08:47
25 June PSA 59 97.7 1783 12:00:45
26 June UA 289 100.9 905 10:20:00UA 371 107. 0 850 12:55:56
27 June UA 371 101.4 914 12:58:10
28 June UA 975 87.5 1416 07:32:53PSA 181 99.4 908 08:03:14PSA 59 97.3 1011 12:04:00UA 371 96.4 956 13:03:03
29 June UA 371 101. 0 900 13:34:37UA 729 98.4 1821 15:00:13
18

Table VII. LAX - June 1973, Site 5
SLANT RANGE TIME OF(CPA) PNL,TM
DATE FLIGHT EPNLC (ft) (hr:min:sec)
15 June PSA 181 94.3 1658 08:03:05PSA 59 92.6 1880 12:01:40
16 June PSA 181 84.4 2156 07:56:16PSA 59 88.3 2210 11:57:30UA 729 92.2 2203 14:50:59
17 June UA 975 87. 4 2193 07:33:39UA 289 97.3 1156 10:09:48UA 371 95.4 1368 12:45:27UA 729 83.2 3305 14:52:43
18 June UA 975 88. 8 2097 07:30:41PSA 281 92.7 2654 09:59:46PSA 59 85. 8 2108 12:02:55UA 371 96.6 1375 12:48:55UA 729 90. 7 2239 14:45:59
19 June UA 289 91.6 1313 10:11:00PSA 59 90.2 2516 11:56:25
20 June UA 975 82.8 2331 07:33:19
21 June PSA 181 87.3 3033 07:58:20UA 289 89. 7 1354 10:11:02
22 June UA 729 91.4 2038 14:59:10
23 June UA 975 84.3 2164 07:29:27PSA 181 82.4 2588 07:53:48PSA 281 83.6 2240 09:53:31PSA 59 82.2 2268 11:54:27.UA 729 80.6 2080 14:51:40
24 June UA 975 83. 8 2099 07:28:37UA 289 95. 7 1379 10:08:12UA 371 95.6 1528 12:50:59
25 June PSA 59 88.8 2436 12:00:27
26 June UA 289 95. 4 1285 10:19:29UA 371 92.6 1312 12:55:30
27 June UA 371 94.2 1233 12:57:36
28 June UA 975 85.2 2165 07:32:20PSA 181 96.8 1230 08:02:53PSA 59 91.4 1303 12:03:34UA 371 94. 1 1188 13:02:32
29 June UA 975 85. 6 1964 07:33:58PSA 181 89.2 1110 08:02:33UA 289 97.0 1355 10:10:06UA 371 94.8 1249 13:12:21UA 729 89.0 2124 14:59:40
19

Table VIII. LAX - June 1973, Site 7
SLANT RANGE TIME OF
(CPA) PNLTNIDATE FLIGHT EPNT.C (ft) (hr:min:sec)
15 June PSA 181 88.3 2577 OP 02.2'PSA 59 98. 1 2748 12:01:02
16 June PSA 181 92.0 2912 07:55:53PSA 59 96.9 2810 11:56:53UA 729 87.2 3199 14:50:19
17 June UA 975 87.7 3190 07:33:06UA 289 95.0 1935 10:09:10UA 371 89.6 1996 12:44:55
18 June UA 975 83.6 3285 07:30:00PSA 281 84.2 2921 09:59:12PSA 59 84.2 3157 12:02:23UA 371 89.3 2089 12:48:18UA 729 88.9 3260 14:45:14
19 June UA 289 88. 0 2095 10:10:21PSA 59 82.7 2920 11:56:01UA 729 92.7 3239 14:54:32
20 June UA 975 83.5 3267 07:32:41
21 June PSA 181 84. 8 3669 07:57:46UA 289 94. 2 1657 10:10:48PSA 59 83.0 3757 11:56:41
22 June PSA 281 89. 0 3439 09:55:05UA 289 92.7 2055 10:18:08UA 371 87.3 1872 12:55:34UA 729 81.5 3397 14:58:44
23 June UA 975 88.5 3266 07:28:36PSA 181 88.7 3362 07:53:11PSA 281 81.5 3349 09:52:53UA 729 80.4 3267 14:50:41
24June UA 975 89.9 3313 07:28:10UA 289 86.9 2686 10:07:35UA 371 90.2 1749 12:50:23
25 June PSA 59 83.0 5650 11:59:59
26 June UA 289 95.9 6602 10:18:52
27 June UA 371 94.8 1820 12:56:55
28 June UA 975 82. 7 3501 07:31:44PSA 59 94.8 1821 12:03:02UA 371 91.9 1893 13:01:55
29 June UA 975 81.6 2934 07:33:22UA 289 90.9 1881 10:09:29UA 729 90.3 3219 14:59:05
20