nasa galactic cosmic radiation environment model: badhwar ... · nasa galactic cosmic radiation...
TRANSCRIPT

NASA galactic cosmic radiation environment model:Badhwar - O’Neill (2014)
S. Golge∗a,b, P. M. O’Neillc, and T. C. Slabad
aUniversity of Houston, Houston, Texas 77004, USAbSpace Radiation Analysis Group, NASA Johnson Space Center, Houston, Texas 77058, USAcEEE Parts and Radiation Group, NASA Johnson Space Center, Houston, Texas 77058, USAdSpace Radiation Group, NASA Langley Research Center, Hampton, Virginia 23681, USA
The Badhwar-O’Neill (BON) Galactic Cosmic Ray (GCR) flux model has been used by NASAto certify microelectronic systems and in the analysis of radiation health risks for human spaceflight missions. Of special interest to NASA is the kinetic energy region below 4.0 GeV/n dueto the fact that exposure from GCR behind shielding (e.g., inside a space vehicle) is heavilyinfluenced by the GCR particles from this energy domain. The BON model numerically solvesthe Fokker-Planck differential equation to account for particle transport in the heliosphere due todiffusion, convection, and adiabatic deceleration under the assumption of a spherically symmetricheliosphere. The model utilizes a comprehensive database of GCR measurements from variousparticle detectors to determine boundary conditions. By using an updated GCR database andimproved model fit parameters, the new BON model (BON14) is significantly improved over theprevious BON models for describing the GCR radiation environment of interest to human spaceflight.
The 34th International Cosmic Ray Conference,30 July- 6 August, 2015The Hague, The Netherlands
∗Speaker. Corresponding author e-mail: [email protected]
c© Copyright owned by the author(s) under the terms of the Creative Commons Attribution-NonCommercial-ShareAlike Licence. http://pos.sissa.it/
https://ntrs.nasa.gov/search.jsp?R=20150016022 2018-07-16T14:29:43+00:00Z
Badhwar - O’Neill 2014 Galactic Cosmic Ray Flux Model Description
1. Introduction
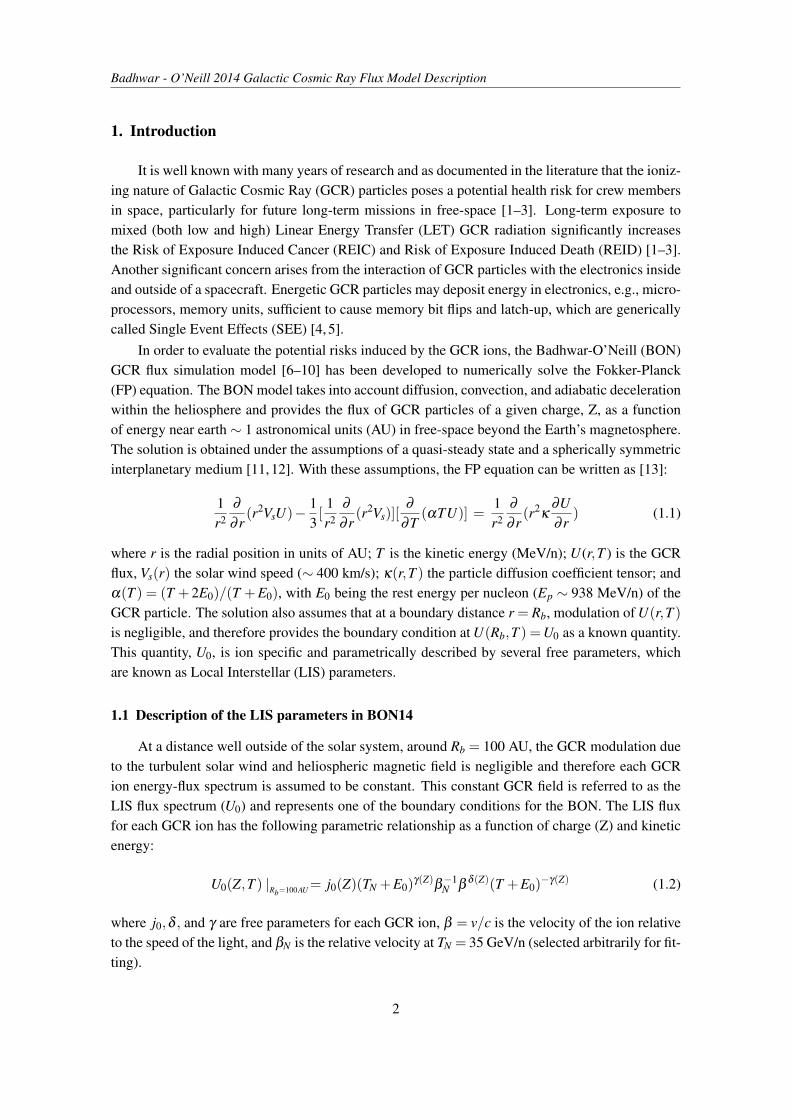
It is well known with many years of research and as documented in the literature that the ioniz-ing nature of Galactic Cosmic Ray (GCR) particles poses a potential health risk for crew membersin space, particularly for future long-term missions in free-space [1–3]. Long-term exposure tomixed (both low and high) Linear Energy Transfer (LET) GCR radiation significantly increasesthe Risk of Exposure Induced Cancer (REIC) and Risk of Exposure Induced Death (REID) [1–3].Another significant concern arises from the interaction of GCR particles with the electronics insideand outside of a spacecraft. Energetic GCR particles may deposit energy in electronics, e.g., micro-processors, memory units, sufficient to cause memory bit flips and latch-up, which are genericallycalled Single Event Effects (SEE) [4, 5].
In order to evaluate the potential risks induced by the GCR ions, the Badhwar-O’Neill (BON)GCR flux simulation model [6–10] has been developed to numerically solve the Fokker-Planck(FP) equation. The BON model takes into account diffusion, convection, and adiabatic decelerationwithin the heliosphere and provides the flux of GCR particles of a given charge, Z, as a functionof energy near earth ∼ 1 astronomical units (AU) in free-space beyond the Earth’s magnetosphere.The solution is obtained under the assumptions of a quasi-steady state and a spherically symmetricinterplanetary medium [11, 12]. With these assumptions, the FP equation can be written as [13]:
1r2
∂
∂ r(r2VsU)− 1
3[
1r2
∂
∂ r(r2Vs)][
∂
∂T(αTU)] =
1r2
∂
∂ r(r2
κ∂U∂ r
) (1.1)
where r is the radial position in units of AU; T is the kinetic energy (MeV/n); U(r,T ) is the GCRflux, Vs(r) the solar wind speed (∼ 400 km/s); κ(r,T ) the particle diffusion coefficient tensor; andα(T ) = (T +2E0)/(T +E0), with E0 being the rest energy per nucleon (Ep ∼ 938 MeV/n) of theGCR particle. The solution also assumes that at a boundary distance r = Rb, modulation of U(r,T )is negligible, and therefore provides the boundary condition at U(Rb,T ) =U0 as a known quantity.This quantity, U0, is ion specific and parametrically described by several free parameters, whichare known as Local Interstellar (LIS) parameters.
1.1 Description of the LIS parameters in BON14
At a distance well outside of the solar system, around Rb = 100 AU, the GCR modulation dueto the turbulent solar wind and heliospheric magnetic field is negligible and therefore each GCRion energy-flux spectrum is assumed to be constant. This constant GCR field is referred to as theLIS flux spectrum (U0) and represents one of the boundary conditions for the BON. The LIS fluxfor each GCR ion has the following parametric relationship as a function of charge (Z) and kineticenergy:
U0(Z,T ) |Rb=100AU= j0(Z)(TN +E0)γ(Z)
β−1N β
δ (Z)(T +E0)−γ(Z) (1.2)
where j0,δ , and γ are free parameters for each GCR ion, β = v/c is the velocity of the ion relativeto the speed of the light, and βN is the relative velocity at TN = 35 GeV/n (selected arbitrarily for fit-ting).
2

Badhwar - O’Neill 2014 Galactic Cosmic Ray Flux Model Description
Table 1: The LIS parameters that areused in the BON14 shown for eachion.
Z γ δ j0
1 2.75 -2.82 9.50×10⁻⁴
2 2.80 -2.00 4.53×10⁻⁵
3 3.21 -0.69 6.37×10⁻⁸
4 2.93 1.50 1.20×10⁻⁷
5 3.00 -0.40 2.40×10⁻⁷
6 2.70 -2.00 1.60×10⁻⁶
7 2.95 -0.60 2.65×10⁻⁷
8 2.73 -1.90 1.50×10⁻⁶
9 3.08 0.40 1.63×10⁻⁸
10 2.75 -1.60 2.35×10⁻⁷
11 2.73 -1.80 4.60×10⁻⁸
12 2.70 -2.40 3.03×10⁻⁷
13 2.75 -1.40 5.30×10⁻⁸
14 2.65 -2.40 2.65×10⁻⁷
15 3.15 2.00 5.68×10⁻⁹
16 2.70 -1.00 5.78×10⁻⁸
17 3.13 2.00 5.99×10⁻⁹
18 2.90 0.60 1.68×10⁻⁸
19 3.13 0.80 7.90×10⁻⁹
20 2.75 -1.60 3.23×10⁻⁸
21 3.15 0.40 3.50×10⁻⁹
22 3.00 -0.50 1.44×10⁻⁸
23 3.00 -0.50 7.14×10⁻⁹
24 2.90 -1.00 1.78×10⁻⁸
25 2.80 -1.00 1.39×10⁻⁸
26 2.60 -2.40 2.00×10⁻⁷
27 2.60 -2.50 1.11×10⁻⁹
28 2.55 -2.40 1.19×10⁻⁸
The LIS parameters are formulated by using the GCR mea-surement data from detectors at or near 1 AU, e.g., satelliteand balloon measurements. In the model, the flux of anyion beyond nickel (Z > 28) is obtained by scaling from thesilicon result. In BON14, as opposed to the previous BONreleases, we have modified the LIS parameters, j0,δ , and γ ,driven by a sensitivity study by using several metrics. Fora detailed description of the sensitivity analysis, please seethe referenced publication series by T. Slaba et al. [14–16].
One of the major results of this study was that for thedifferential effective dose rate as a function of kinetic en-ergy behind 20 g/cm2 of aluminum shielding at a period ofminimal sun activity, GCR ions in the energy domain be-tween 0.5 GeV/n and 4.0 GeV/n account for most of theexposure. As presented in the study, H and He with bound-ary energy (BE) less than 0.5 GeV/n induce approximately9% of the total effective dose. GCR ions with Z > 2 andBE less than 0.5 GeV/n induce less than 4%, while all GCRions, from hydrogen (Z=1) to nickel (Z=28), with BE be-tween 0.5 GeV/n and 4.0 GeV/n induce ∼ 66% of the totaleffective dose behind 20 g/cm2 aluminium shielding.
Based on the results of that study, the new LIS parame-ters are fitted to the GCR data, in such a way that allowed usa range of parameter combinations to be evaluated to min-imize the uncertainty and relative difference between GCRmeasurements and the model. The updated LIS parametersfor each of the corresponding ions from hydrogen to nickelare shown in Table 1.
1.2 Selection of GCR data
In this revision of the BON model, BON14, we haveincluded the GCR data beyond 1970, which spans SolarCycles 20 to 24 (to date). A comprehensive table that rep-resents the entire GCR measurements used for the BON14is presented in [10, 16]. In the past, the LIS parameters ofthe BON were uniquely influenced by measurements from the Cosmic Ray Isotope Spectrometer(CRIS) on the NASA Advanced Composition Explorer (ACE) spacecraft [17]. The CRIS instru-ment is currently measuring the flux of ions and their isotopes from boron (Z=5) to nickel (Z=28),where the lowest and highest kinetic energy measurements are ion specific. CRIS provides ki-netic energy of GCR isotopes between ∼ 50 - 500 MeV/n. In the BON14, greater emphasis wasplaced on the higher kinetic energies, a region not covered by CRIS. Nonetheless, we show that theupdated model still accurately represents the lower energy regions.
3

Badhwar - O’Neill 2014 Galactic Cosmic Ray Flux Model Description
2. Comparison of BON14 to GCR measurements
In Fig. 1, the differential flux for H ion as a function of energy for several GCR measurements,AMS (Alcaraz et al., 2000) [18], IMAX (Menn et al., 2000) [19] , and PAMELA (Adriani etal., 2011) [20], compared with the BON14 model for the same measurement periods is shown.The solid black line in the figure (LIS-BON14) represents the LIS flux for H. The energy axis ismagnified in the 0.1-10 GeV/n region and re-plotted in the inset figure.
Figure 1: The differential flux for H ions as a function of energy is shown for various GCR measurements,AMS (1998), IMAX (1992), and PAMELA (2008). Those measurements are compared with BON14 for thesame measurement periods. The solid black line (LIS-BON14) represents the LIS flux for H ion at R=100AU. The energy axis is magnified in the 0.1-10 GeV/n region and replotted in the inset figure.
In this paper, we report the comparison of BON14 with the GCR measurement data by evaluat-ing the relative differences between both measurements and the model. A comprehensive study in-cluding model uncertainty analysis comparison of the previous BON models (BON10 and BON11)with the current model was reported elsewhere [10]. The relative difference, Rd, is a measurementbetween the GCR measurement data and the BON model that allows us to find where the modelunderpredicts or overpredicts the measured GCR flux. Rd is defined as follows:
Rd =1N
N
∑k=1
Modelk−Datak
Datak, (2.1)
where N is the number of measurements. The average of the residual Rd does not provide acomplete picture of the model versus measurement agreement, as the quantity may end up in thevicinity of zero due to positive-negative cancellation effect. Therefore, we also used the averageabsolute relative difference, |Rd|, to determine the overall difference between the model and the
4
Badhwar - O’Neill 2014 Galactic Cosmic Ray Flux Model Description
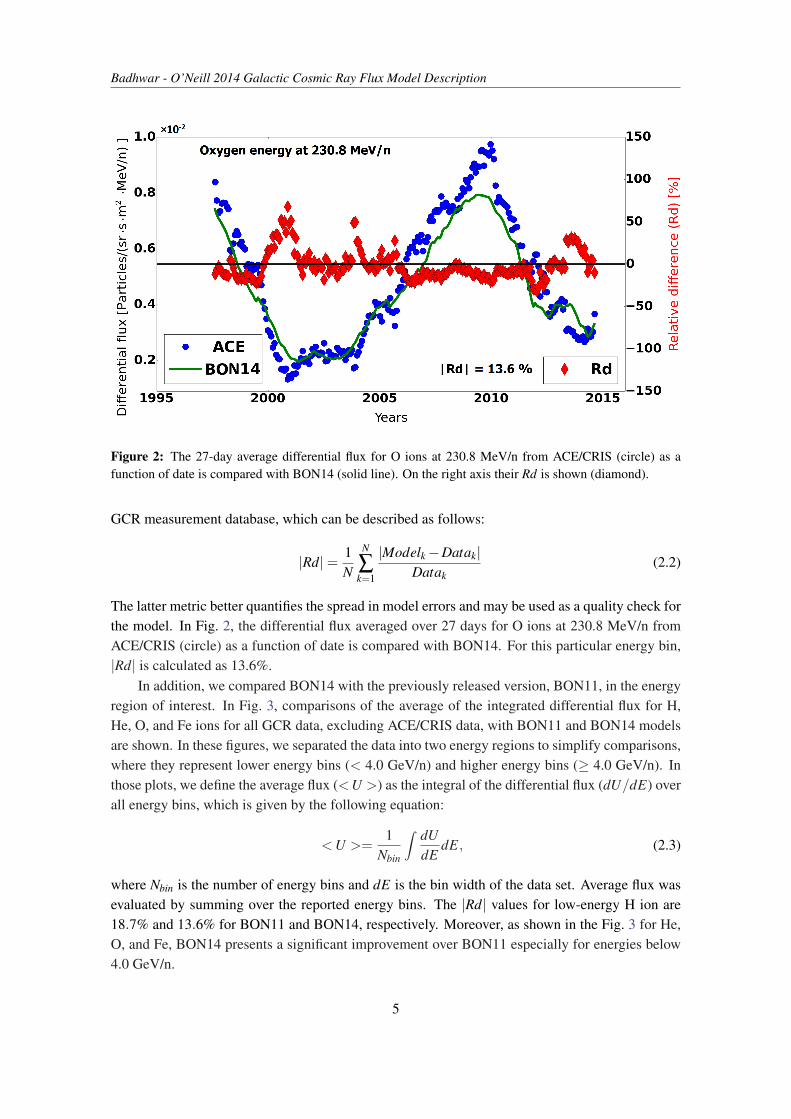
Figure 2: The 27-day average differential flux for O ions at 230.8 MeV/n from ACE/CRIS (circle) as afunction of date is compared with BON14 (solid line). On the right axis their Rd is shown (diamond).
GCR measurement database, which can be described as follows:
|Rd|= 1N
N
∑k=1
|Modelk−Datak|Datak
(2.2)
The latter metric better quantifies the spread in model errors and may be used as a quality check forthe model. In Fig. 2, the differential flux averaged over 27 days for O ions at 230.8 MeV/n fromACE/CRIS (circle) as a function of date is compared with BON14. For this particular energy bin,|Rd| is calculated as 13.6%.
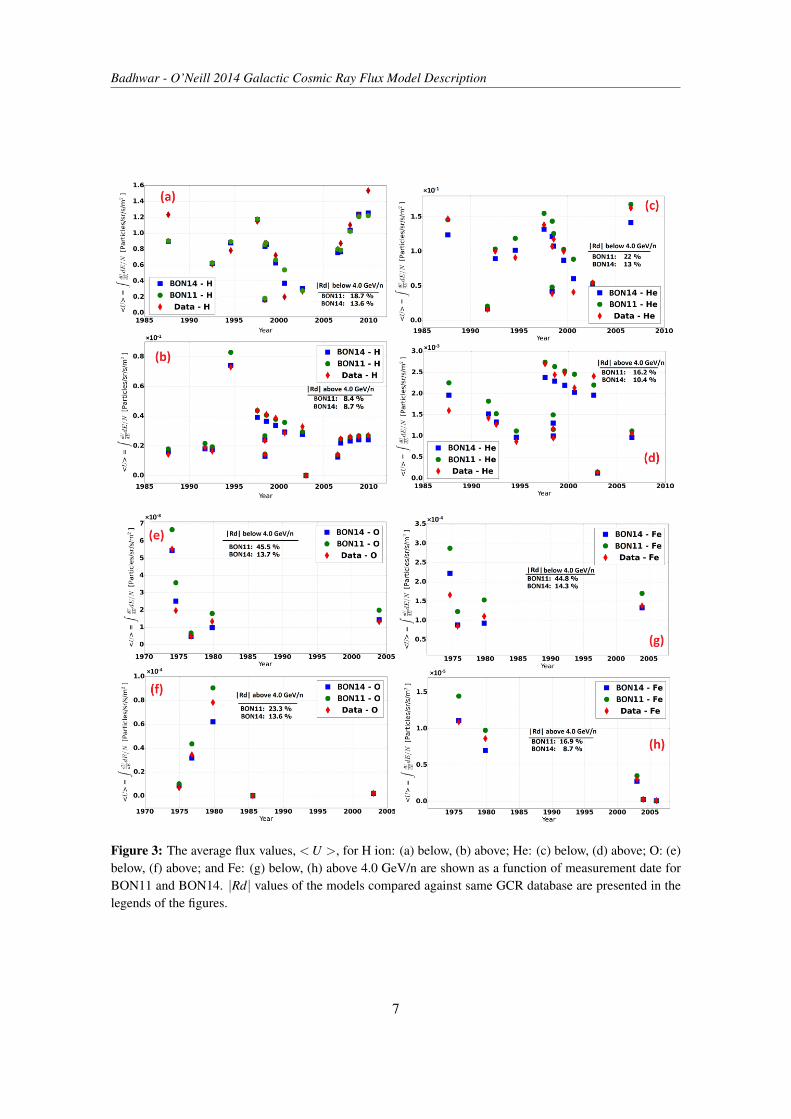
In addition, we compared BON14 with the previously released version, BON11, in the energyregion of interest. In Fig. 3, comparisons of the average of the integrated differential flux for H,He, O, and Fe ions for all GCR data, excluding ACE/CRIS data, with BON11 and BON14 modelsare shown. In these figures, we separated the data into two energy regions to simplify comparisons,where they represent lower energy bins (< 4.0 GeV/n) and higher energy bins (≥ 4.0 GeV/n). Inthose plots, we define the average flux (<U >) as the integral of the differential flux (dU/dE) overall energy bins, which is given by the following equation:
<U >=1
Nbin
∫ dUdE
dE, (2.3)
where Nbin is the number of energy bins and dE is the bin width of the data set. Average flux wasevaluated by summing over the reported energy bins. The |Rd| values for low-energy H ion are18.7% and 13.6% for BON11 and BON14, respectively. Moreover, as shown in the Fig. 3 for He,O, and Fe, BON14 presents a significant improvement over BON11 especially for energies below4.0 GeV/n.
5

Badhwar - O’Neill 2014 Galactic Cosmic Ray Flux Model Description
In Table 2, the overall average relative difference metrics, Rd and |Rd|, are presented forBON11 and BON14. These values were determined by averaging the relative difference metricsover each ion. Individual results for each ion were reported in [10]. The results in Table 2 wereobtained by considering the entire GCR measurement database (all ion and energy bins). It is seenin Table 2, that for BON11, the |Rd| value is calculated as 23.7% and Rd = 17.9%. For BON14,these errors are reduced to |Rd| = 13.0% and Rd = −0.4%. The BON11 model systematicallyoverpredicts the GCR measurement data, whereas BON14 provides a more balanced prediction.More importantly, the overall spread in the new model error was reduced from 23.7% to 13.0%. Itshould be emphasized that at all energies, BON14 is only a marginally improved fit to the hydrogenGCR data compared with BON11. There is room for improvement since BON14 underpredictshydrogen GCR data for ∼ 8 year-long periods since 1998 (per Fig. 3). A similar underpredictingpattern is observed for He as well.
3. Conclusions
Table 2: The average relative differ-ence metrics between the entire GCRdatabase with BON11 and BON14.
Average [%]Rd |Rd|
BON11 17.9 23.7BON14 -0.4 13.0
We present the comparison results of BON14 with anupdated set of GCR measurements from various balloon,satellite, and space shuttle measurements. The new modelLIS parameters were fitted with an updated approach basedon the sensitivity study described earlier. This study showedthat the GCR ions with energies between 0.5 GeV/n and 4.0GeV/n account for most of the shielded effective dose.
The overall average Rd value is calculated as 17.9%for the BON11 and -0.4% for the BON14 model, whereas|Rd| is found as 23.7% and 13.0% for BON11 and BON14models, respectively. As described in [10], the uncertainty metrics study also revealed that overallthe BON14 model has been improved significantly with respect to the previous models (BON10and BON11) both at low- and high-energy regions. However, it should be noted that the LISparameters used by BON14 slightly underpredict hydrogen GCR data for most of the years since∼1998 (beginning of a solar maximum). We anticipate significant model improvement in the energyregion of interest with hydrogen data when the new GCR measurements are available in the future,e.g., AMS-02 measurements. In addition, we will attempt to improve the model by incorporatingseveral physics effects on the GCR particles (e.g., curvature and gradient drifts) which have notbeen included in the previous BON models.
6
Badhwar - O’Neill 2014 Galactic Cosmic Ray Flux Model Description
Figure 3: The average flux values, <U >, for H ion: (a) below, (b) above; He: (c) below, (d) above; O: (e)below, (f) above; and Fe: (g) below, (h) above 4.0 GeV/n are shown as a function of measurement date forBON11 and BON14. |Rd| values of the models compared against same GCR database are presented in thelegends of the figures.
7

Badhwar - O’Neill 2014 Galactic Cosmic Ray Flux Model Description
References
[1] National Council on Radiation Protection and Measurements (NCRP), Information Needed to MakeRadiation Protection Recommendations for Space Missions Beyond Low-Earth Orbit, Tech. Rep. No.153, Natl. Counc. on Radiat. Prot. and Meas., Bethesda, Maryland, 2006.
[2] F. A. Cucinotta, M.-H. Y. Kim, and L. J. Chappell, Space Radiation Cancer Risk Projections andUncertainties-2012, Tech. Rep. NASA/TP-2013-217375, (2013).
[3] M. Durante and F. A. Cucinotta, Physical basis of radiation protection in space travel, Rev. Mod.Phys. 83 (Nov, 2011) 1245–1281.
[4] L. Adams, Cosmic ray effects in microelectronics, Microelectronics Journal 16 (1985), no. 2 17 – 29.
[5] P. M. O’Neill and G. D. Badhwar, Single event upsets for Space Shuttle flights of new general purposecomputer memory devices, IEEE Transactions on Nuclear Science 41 (Oct., 1994) 1755–1764.
[6] G. D. Badhwar and P. M. O’Neill, Long-term modulation of galactic cosmic radiation and its modelfor space exploration., Advances in Space Research 14 (1994), no. 10 (749 – 757).
[7] G. Badhwar and P. O’Neill, Galactic cosmic radiation model and its applications, Advances in SpaceResearch 17 (1996), no. 2 7 – 17.
[8] P. O’Neill, Badhwar-O’Neill 2010 Galactic Cosmic Ray Flux Model; Revised, Nuclear Science, IEEETransactions on 57 (Dec, 2010) (3148–3153).
[9] P. M. O’Neill and C. C. Foster, Badhwar-O’Neill 2011 Galactic Cosmic Ray Flux Model Description,Tech. Rep. NASA/TP-2013-217376, (2013).
[10] P. M. O’Neill, S. Golge, and T. C. Slaba, Badhwar - O’Neill 2014 Galactic Cosmic Ray Flux ModelDescription, Tech. Rep. TP-2015-218569, NASA Technical Report, 2015.
[11] E. N. Parker, The passage of energetic charged particles through interplanetary space, Planetary andSpace Science 13 (1965), no. 1 9 – 49.
[12] L. J. Gleeson and W. I. Axford, Cosmic rays in the interplanetary medium, Astrophysical Journal 149(1967) L115.
[13] L. A. Fisk, Solar modulation of galactic cosmic rays, 2, Journal of Geophysical Research 76 (1971),no. 1 221–226.
[14] T. C. Slaba and S. R. Blattnig, GCR environmental models I: Sensitivity analysis for GCRenvironments, Space Weather 12 (2014), no. 4 217–224.
[15] T. C. Slaba and S. R. Blattnig, GCR environmental models II: Uncertainty propagation methods forGCR environments, Space Weather 12 (2014), no. 4 225–232.
[16] T. C. Slaba, X. Xu, S. R. Blattnig, and R. B. Norman, GCR environmental models III: GCR modelvalidation and propagated uncertainties in effective dose, Space Weather 12 (2014), no. 4 233–245.
[17] E. C. Stone, A. M. Frandsen, R. A. Mewaldt, E. R. Christian, D. Margolies, J. F. Ormes, and F. Snow,The advanced composition explorer, Space Science Reviews 86 (1998), no. 1-4 1–22.
[18] J. Alcaraz et al., Cosmic protons, Physics Letters B 490 (2000), no. 1-2 27–35.
[19] W. Menn et al., The Absolute Flux of Protons and Helium at the Top of the Atmosphere Using IMAX,The Astrophysical Journal 533 (Apr., 2000) 281–297.
[20] O. Adriani et al., PAMELA Measurements of Cosmic-Ray Proton and Helium Spectra, Science 332(Apr., 2011) 69, [arXiv:1103.4055].
8