nasa global precipitation measurement (gpm) integrated ... · algorithm theoretical basis document...
TRANSCRIPT

Algorithm Theoretical Basis Document (ATBD) Version 5.2
NASA Global Precipitation Measurement (GPM)
Integrated Multi-satellitE Retrievals for GPM (IMERG)
Prepared for: Global Precipitation Measurement (GPM) National Aeronautics and Space Administration (NASA) Prepared by: George J. Huffman NASA/GSFC NASA/GSFC Code 612 Greenbelt, MD 20771 and David T. Bolvin, Dan Braithwaite, Kuolin Hsu, Robert Joyce, Christopher Kidd, Eric J. Nelkin, S. Sorooshian, J. Tan, Pingping Xie 7 February 2018
National Aeronautics and Space Administration

IMERG ATBD Version 5.2
ii
TABLE OF CONTENTS Page 1. INTRODUCTION ......................................................................................................................1
1.1 Objective ...........................................................................................................................1 1.2 Revision History ................................................................................................................1
2. OBSERVING SYSTEMS ..........................................................................................................1 2.1 Core Satellite .....................................................................................................................2 2.2 Microwave Constellation ..................................................................................................4 2.3 IR Constellation .................................................................................................................4 2.4 Additional Satellites ..........................................................................................................5 2.5 Precipitation Gauges ..........................................................................................................5
3. ALGORITHM DESCRIPTION .................................................................................................7 3.1 Algorithm Overview ..........................................................................................................7 3.2 Processing Outline .............................................................................................................8
3.2.1 Initial Processing ...................................................................................................8 3.2.2 Retrospective Processing .....................................................................................10 3.2.3 Rotating Calibration Files and Spin-Up Requirements .......................................10
3.3 Input Data ........................................................................................................................11 3.3.1 Sensor Products ...................................................................................................11 3.3.2 Ancillary Products ...............................................................................................11
3.4 Microwave Intercalibration .............................................................................................11 3.5 Merged Microwave .........................................................................................................13 3.6 Microwave-Calibrated IR ................................................................................................13 3.7 Kalman-Smoother Time Interpolation ............................................................................13 3.8 Satellite-Gauge Combination ..........................................................................................14 3.9 Post-Processing ...............................................................................................................15 3.10 Precipitation Phase ...........................................................................................................15 3.11 Error Estimates ................................................................................................................16 3.12 Quality Index ...................................................................................................................16
3.12.1 QIh: Quality Index for Half-Hourly Data ............................................................16 3.12.2 QIm: Quality Index for Monthly Data ................................................................17
3.13 Algorithm Output ............................................................................................................17 3.14 Pre-Planned Product Improvements ................................................................................18
3.14.1 Addition/Deletion of Input Data ..........................................................................19 3.14.2 Upgrades to Input Data ........................................................................................19 3.14.3 Polar Sensors .......................................................................................................19 3.14.4 Upgrades for Near-Real Time .............................................................................19 3.14.5 Use of Model Estimates ......................................................................................20
3.15 Options for Processing ....................................................................................................20 3.15.1 Use of Multi-Spectral Geo-Data ...........................................................................20 3.15.2 Computing Propagation from Data Other than IR ...............................................20 3.15.3 Incorporating Cloud Development Information ...................................................21 3.15.4 Use of Daily Gauges .............................................................................................21

IMERG ATBD Version 5.2
iii
3.15.5 Improve Error Estimation .....................................................................................21
4. TESTING .................................................................................................................................22 4.1 Algorithm Verification in the PPS System ......................................................................22 4.2 Algorithm Verification for the Different Runs .................................................................22 4.3 Algorithm Validation ......................................................................................................22
5. PRACTICAL CONSIDERATIONS ........................................................................................23 5.1 Module Dependencies .....................................................................................................23 5.2 Files Used in IMERG ......................................................................................................24 5.3 Built-In Quality Assurance and Diagnostics ...................................................................24 5.4 Surface Temperature, Relative Humidity, and Pressure Data ..........................................24 5.5 Exception Handling .........................................................................................................26 5.6 Transitioning from TMPA to IMERG Products ..............................................................26 5.7 Timing of Reprocessing for Research Product ................................................................27
6. ASSUMPTIONS AND LIMITATIONS .................................................................................27 6.1 Data Delivery ..................................................................................................................27 6.2 Assumed Sensor Performance .........................................................................................27
7. REFERENCES .........................................................................................................................28
8. ACRONYMS ...........................................................................................................................29
LIST OF FIGURES Page
Figure 1 PMW sensor Equator-crossing times for 12-24 Local Time (LT; 00-12 LT is the same) for the modern PMW sensor era These are all ascending passes, except F08 is descending. Shading indicates that the precessing TRMM, Megha-Tropiques, and GPM cover all times of day. [Image by Eric Nelkin (SSAI; GSFC), 14 December 2017; https://pmm.nasa.gov/sites/default/files/imce/times_allsat.jpg holds the current version.] .....5
Figure 2. High-level block diagram illustrating the major processing modules and data flows in IMERG. The blocks are organized by institution to indicate heritage, but the final code package will be an integrated system. The numbers on the blocks are for reference in Section 5. Box 3 is computed at CPC as an integral part of IMERG. ................................9

IMERG ATBD Version 5.2
iv
LIST OF TABLES Page
Table 1. List of current and planned contributing data sets for IMERG, broken out by sensor type. Data sets with start dates of Jan 98 extend before that time, but these data are not relevant to IMERG. Square brackets ([ ]) indicate an estimated date. “M-T” stands for Megha-Tropiques. The M-T MADRAS instrument is not included on this list because of its short, gappy record. The geosynchronous IR data are processed into “even-odd” files at NESDIS. All data are at Level 2 (scan/pixel) except for the precipitation gauge analyses and IR data. ............................................................................................................. 2-4
Table 2. Notional requirements for IMERG. TCI and CORRA are TRMM Combined Instrument and GPM Combined Instrument, respectively. ......................................................8
Table 3. Lists of data fields to be included in each of the output datasets. ..................................18 Table 4. Estimates of file counts and sizes used in IMERG. The letters i, o, t, a, s in
“Module Relation” indicate input, output, transfer (between modules or within a module), accumulator, and static, respectively. The numbers in “Module Relation” are keyed to the numbered boxes in Fig. 2. ........................................................................................... 24-26

IMERG ATBD Version 5.2
1
1. INTRODUCTION
1.1 OBJECTIVE
This document describes the algorithm and processing sequence for the Integrated Multi-satellitE Retrievals for GPM (IMERG). This algorithm is intended to intercalibrate, merge, and interpolate “all” satellite microwave precipitation estimates, together with microwave-calibrated infrared (IR) satellite estimates, precipitation gauge analyses, and potentially other precipitation estimators at fine time and space scales for the TRMM and GPM eras over the entire globe. The system is run several times for each observation time, first giving a quick estimate and successively providing better estimates as more data arrive. The final step uses monthly gauge data to create research-level products. Background information and references are provided to describe the context and the relation to other similar missions. Issues involved in understanding the accuracies obtained from the calculations are discussed. Throughout, the current Version 05 product is described, together with options and planned improvements that might be instituted in future version(s) depending on maturity and project constraints.
1.2 REVISION HISTORY
Version Date Author Description 1.0 30 November 2010 G. Huffman Initial version 2.0 30 November 2011 G. Huffman Second delivery version 3.0 30 November 2012 G. Huffman Third delivery version 3.1 12 July 2013 G. Huffman Document Prob. Liq. Precip. Type 4 30 September 2013 G. Huffman Fourth delivery version 4.1 16 December 2013 G. Huffman At-launch modifications 4.2 20 December 2013 G. Huffman Edits; add overpass diagram 4.3 22 July 2014 G. Huffman Edits for post-launch information 4.4 15 September 2014 G. Huffman Change to single snapshot each half hour 4.5 16 November 2015 G. Huffman Version and Run file naming, current status,
input satellite dates 4.6 14 March 2017 G. Huffman Initial upgrade to GPM Version 05 5 9 November 2017 G. Huffman Upgrade to IMERG Version 05 5.1 10 November 2017 G. Huffman No GPROF-TMI; trimmed MHS, ATMS swaths 5.2 1 February 2018 G. Huffman
2. OBSERVING SYSTEMS
Historically and for the foreseeable future, passive microwave (PMW) sensors provide the lion’s share of relatively accurate satellite-based precipitation estimates, and these are only available from low-Earth-orbit (leo) platforms. IMERG is designed to compensate for the limited sampling available from single leo-satellites by using as many leo-satellites as possible, and then augmenting with geosynchronous-Earth-orbit (geo) infrared (IR) estimates. This happens in two ways. First, the leo-PMW data are morphed (linear interpolation following the geo-IR-based feature motion). Second, geo-IR precipitation estimates are included using a Kalman filter when the leo-PMW are too sparse. Additionally, at high latitudes the usual PMW imager channels have significant shortcomings, but satellite-sounding-based and experimental sounding-channel-

IMERG ATBD Version 5.2
2
based algorithms have shown utility, and numerical-model-based estimates have the potential to add value. Finally, precipitation gauge analyses are used to provide crucial regionalization and bias correction to the satellite estimates. None of the satellites except the GPM Core satellite are under GPM direction. Therefore, IMERG uses as many satellites of opportunity as possible in a very flexible framework. Table 1 gives a listing of the current and planned data sources, the date spans of useful operation, and the responsible institution. Note that we plan to provide a continuous record from the beginning of TRMM. In all cases except the geo-IR and the precipitation gauge analyses the input data are accessed as Level 2 (scan-pixel) precipitation.
2.1 CORE SATELLITE The GPM Core Satellite, like the TRMM satellite before it, serves as both a calibration and an evaluation tool for all the PMW- and IR-based precipitation products integrated in IMERG, since it will provide match-ups with all other PMW-equipped leo-satellites and IR-equipped geo-satellites. [Note that all of the PMW data are used to calibrate the IR estimates.] Both the TRMM and GPM satellites provide multi-channel, dual-polarization PMW sensors and active scanning radars. Three critical improvements in GPM are that 1) the orbital inclination has been increased from 35° to 65°, affording coverage of important additional climate zones; 2) the radar has been upgraded to two frequencies, adding sensitivity to light precipitation; and 3) “high-frequency” channels (165.5 and 183.3 GHz) have been added to the PMW imager, which hold promise for facilitating sensing of light and solid precipitation. The higher inclination for the GPM orbit reduces the radiometer and radar sampling compared to TRMM in the latitude band covered by TRMM.
Table 1. List of current and planned contributing data sets for IMERG, broken out by sensor type. Data sets with start dates of Jan 98 extend before that time, but these data are not relevant to IMERG. Square brackets ([ ]) indicate an estimated date. “M-T” stands for Megha-Tropiques. The M-T MADRAS instrument is not included on this list because of its short, gappy record. The geosynchronous IR data are processed into “even-odd” files at NESDIS. All data are at Level 2 (scan/pixel) except for the precipitation gauge analyses and IR data.
Merged Radar – Passive Microwave Imager Products
Product Period of Record GPM DPR-GMI Mar 14 - [Feb 24] TRMM PR-TMI Jan 98 - Sep 14
IMERG ATBD Version 5.2
3
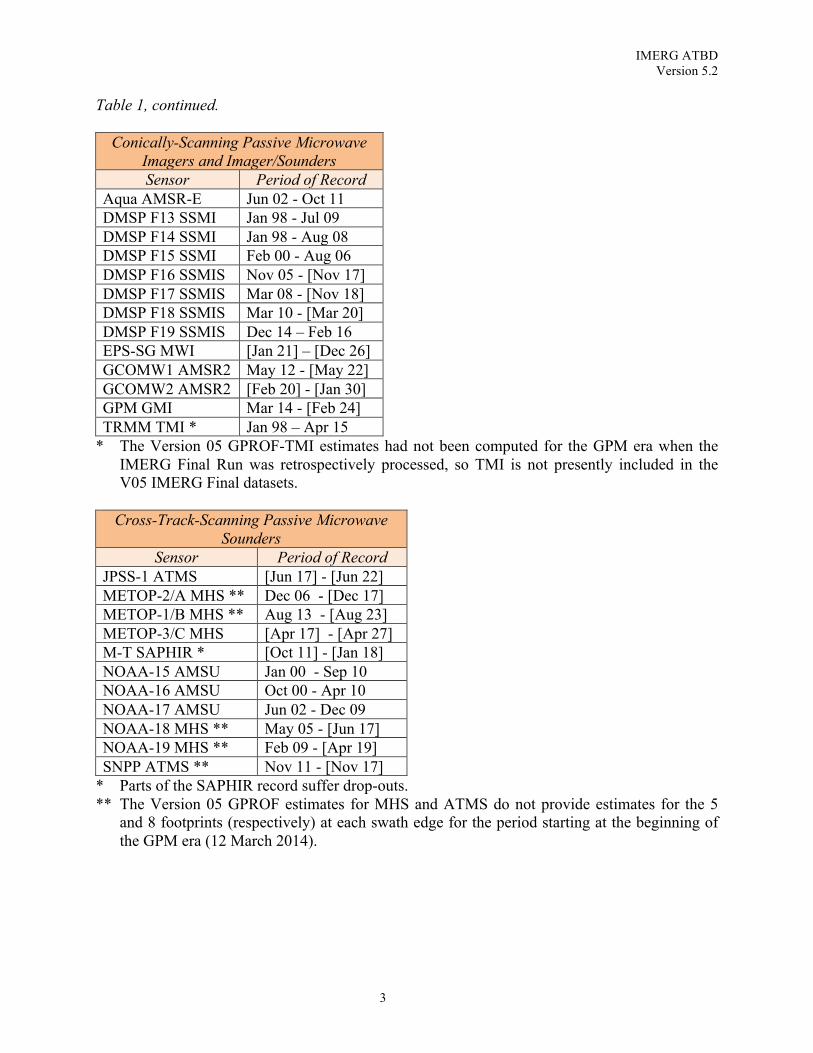
Table 1, continued.
Conically-Scanning Passive Microwave Imagers and Imager/Sounders Sensor Period of Record
Aqua AMSR-E Jun 02 - Oct 11 DMSP F13 SSMI Jan 98 - Jul 09 DMSP F14 SSMI Jan 98 - Aug 08 DMSP F15 SSMI Feb 00 - Aug 06 DMSP F16 SSMIS Nov 05 - [Nov 17] DMSP F17 SSMIS Mar 08 - [Nov 18] DMSP F18 SSMIS Mar 10 - [Mar 20] DMSP F19 SSMIS Dec 14 – Feb 16 EPS-SG MWI [Jan 21] – [Dec 26] GCOMW1 AMSR2 May 12 - [May 22] GCOMW2 AMSR2 [Feb 20] - [Jan 30] GPM GMI Mar 14 - [Feb 24] TRMM TMI * Jan 98 – Apr 15
* The Version 05 GPROF-TMI estimates had not been computed for the GPM era when the IMERG Final Run was retrospectively processed, so TMI is not presently included in the V05 IMERG Final datasets.
Cross-Track-Scanning Passive Microwave
Sounders Sensor Period of Record
JPSS-1 ATMS [Jun 17] - [Jun 22] METOP-2/A MHS ** Dec 06 - [Dec 17] METOP-1/B MHS ** Aug 13 - [Aug 23] METOP-3/C MHS [Apr 17] - [Apr 27] M-T SAPHIR * [Oct 11] - [Jan 18] NOAA-15 AMSU Jan 00 - Sep 10 NOAA-16 AMSU Oct 00 - Apr 10 NOAA-17 AMSU Jun 02 - Dec 09 NOAA-18 MHS ** May 05 - [Jun 17] NOAA-19 MHS ** Feb 09 - [Apr 19] SNPP ATMS ** Nov 11 - [Nov 17]
* Parts of the SAPHIR record suffer drop-outs. ** The Version 05 GPROF estimates for MHS and ATMS do not provide estimates for the 5
and 8 footprints (respectively) at each swath edge for the period starting at the beginning of the GPM era (12 March 2014).
IMERG ATBD Version 5.2
4
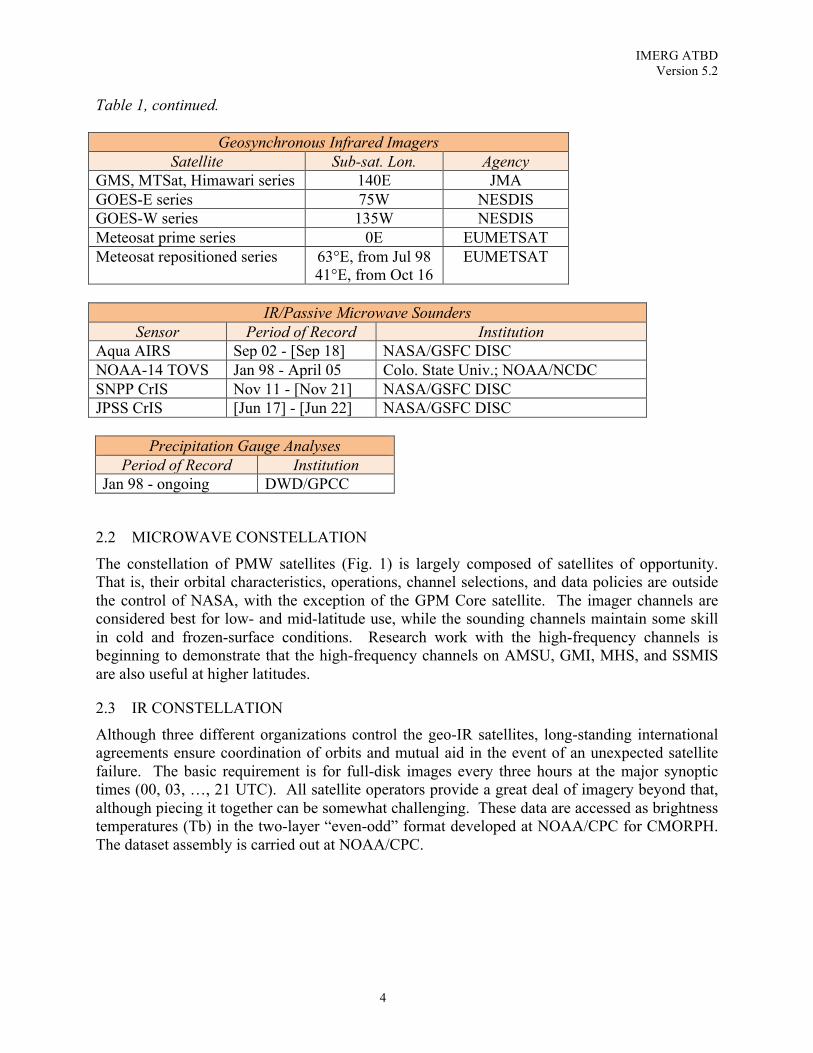
Table 1, continued.
Geosynchronous Infrared Imagers Satellite Sub-sat. Lon. Agency
GMS, MTSat, Himawari series 140E JMA GOES-E series 75W NESDIS GOES-W series 135W NESDIS Meteosat prime series 0E EUMETSAT Meteosat repositioned series 63°E, from Jul 98
41°E, from Oct 16 EUMETSAT
IR/Passive Microwave Sounders
Sensor Period of Record Institution Aqua AIRS Sep 02 - [Sep 18] NASA/GSFC DISC NOAA-14 TOVS Jan 98 - April 05 Colo. State Univ.; NOAA/NCDC SNPP CrIS Nov 11 - [Nov 21] NASA/GSFC DISC JPSS CrIS [Jun 17] - [Jun 22] NASA/GSFC DISC
Precipitation Gauge Analyses
Period of Record Institution Jan 98 - ongoing DWD/GPCC
2.2 MICROWAVE CONSTELLATION
The constellation of PMW satellites (Fig. 1) is largely composed of satellites of opportunity. That is, their orbital characteristics, operations, channel selections, and data policies are outside the control of NASA, with the exception of the GPM Core satellite. The imager channels are considered best for low- and mid-latitude use, while the sounding channels maintain some skill in cold and frozen-surface conditions. Research work with the high-frequency channels is beginning to demonstrate that the high-frequency channels on AMSU, GMI, MHS, and SSMIS are also useful at higher latitudes.
2.3 IR CONSTELLATION
Although three different organizations control the geo-IR satellites, long-standing international agreements ensure coordination of orbits and mutual aid in the event of an unexpected satellite failure. The basic requirement is for full-disk images every three hours at the major synoptic times (00, 03, …, 21 UTC). All satellite operators provide a great deal of imagery beyond that, although piecing it together can be somewhat challenging. These data are accessed as brightness temperatures (Tb) in the two-layer “even-odd” format developed at NOAA/CPC for CMORPH. The dataset assembly is carried out at NOAA/CPC.

IMERG ATBD Version 5.2
5
Fig. 1 PMW sensor Equator-crossing times for 12-24 Local Time (LT; 00-12 LT is the same) for the modern PMW sensor era These are all ascending passes, except F08 is descending. Shading indicates that the precessing TRMM, Megha-Tropiques, and GPM cover all times of day. [Image by Eric Nelkin (SSAI; GSFC), 14 December 2017; https://pmm.nasa.gov/sites/default/files/imce/times_allsat.jpg holds the current version.]
2.4 ADDITIONAL SATELLITES
Experience in creating fully global precipitation products for the Global Precipitation Climatology Project (GPCP) demonstrates that precipitation estimated from satellite soundings using the Susskind et al. (1997) algorithm has useful skill at scales as fine as 1° daily (Adler et al. 2003; Huffman et al. 1997). Even assuming that high-frequency channels on AMSU/MHS, GMI, and SSMIS eventually provide high-quality precipitation estimates at high latitudes, we expect that the sounding-based estimates may still be needed to fill gaps in the collection of high-latitude estimates.
2.5 PRECIPITATION GAUGES
Work in GPCP and TRMM has shown that incorporating a uniform precipitation gauge analysis is important for controlling the bias that typifies satellite precipitation estimates. These projects show that even monthly gauge analyses produce significant improvements, at least for some regions in some seasons. Recent work at CPC shows substantial improvements in the bias

IMERG ATBD Version 5.2
6
correction using daily gauge analysis for regions in which there is a sufficient number of gauges. It is planned to explore the use of daily gauges.
The Deutscher Wetterdienst (DWD) Global Precipitation Climatology Centre (GPCC) was established in 1989 to provide high-quality precipitation analyses over land based on conventional precipitation gauges. We use two GPCC products, the V7 Full Data Analysis for the majority of the time (currently 1998-2013), and the V5 Monitoring Product from 2014 to the then-present. The Monitoring Product is posted about two months after the month of observation (see Schneider et al. 2008; Rudolf and Schneider, 2005) and is based on SYNOP and monthly CLIMAT reports received in near-real time via GTS from ~7,000–8,000 stations world-wide reported in the following sources: • monthly precipitation totals accumulated at GPCC from the SYNOP reports received at
DWD, Offenbach, • monthly precipitation totals accumulated at NOAA/CPC from the SYNOP reports received at
NOAA, Washington D.C., • monthly precipitation totals from CLIMAT reports received at DWD, Offenbach, Germany, • monthly precipitation totals from CLIMAT reports received at the UK Met. Office (UKMO),
Exeter, UK, and • monthly precipitation totals from CLIMAT reports received at Japan Meteorological Agency
(JMA), Tokyo, Japan. GPCC’s Full Data Analysis is based on a data base that covers the period 1901 up to 2013 (current V.7 released in late 2015). Compared to the Monitoring Product, the Full Data Analysis includes additional data acquired from global data collections such as GHCN, FAO, CRU; data sets from the National Meteorological and/or Hydrological Services of about 190 countries of the world; and some data from GEWEX-related projects.
For both products, if data are available from more than one source for a station, an “optimum” value – according to the quality of the different data sources – is selected for the precipitation analysis. The selected precipitation data undergo an automatic pre-screening, and subsequently the data flagged as questionable are interactively reviewed by an expert. Based on the remaining quality-controlled station data, the (monthly) anomalies from the background climatology are computed at the stations, interpolated using the SPHEREMAP objective analysis, and added to the background climatology to create the month’s analysis. CPC collects daily precipitation gauge data from ~16,000 stations around the world through the GTS, and from enhanced national networks over the U.S., Mexico, and a few other countries. They analyze global daily precipitation on a near-real-time basis by interpolating quality-controlled station reports. Note that the “day” in this analysis is defined region by region, not at a uniform UTC time. These data are the basis for the daily satellite-gauge option in Subsection 3.14.4. Precipitation gauges suffer a variety of errors in collecting precipitation, including evaporation, splashing, side wetting, and wind effects, with all resulting in a low bias for most gauge configurations. The wind effects occur because the air has to flow around the opening of the gauge and hydrometeors tend to follow the air flow. This is most true for the hydrometeors that

IMERG ATBD Version 5.2
7
fall the most slowly, namely drizzle and snowflakes. Undercatch ranges from 5% in heavy rain situations to 100%, 200% or more, and depends on the design of the gauge (Legates 1987; Sevruk 1989). Until recently, the state of the art was a set of monthly maps of climatological adjustment ratios computed by Legates and Willmott (1990), and these are used to adjust the gauge analyses in this work. Recently, the GPCC has started computing daily adjustments based on station meteorological data for the Monitoring Analysis starting in 1982 (Schneider et al. 2015) based on Fuchs et al. (2001), and this will be adapted for use in a future version of IMERG.
3. ALGORITHM DESCRIPTION
Given the available diverse, changing, uncoordinated set of input precipitation estimates, with various periods of record, regions of coverage, and sensor-specific strengths and limitations, we seek to compute the longest, most detailed record of “global” precipitation. To do this, we combine the input estimates into a “best” data set. Although we wish to maintain reasonable homogeneity in the input datasets, for example by using consistently processed archives for each sensor, we are not striving to compute a Climate Data Record dataset. The requirements for the multi-satellite product are summarized in Table 2. The space-time resolution is roughly the microwave spatial scale and the IR temporal scale. The space-time domain represents the PMM goal of covering the whole globe starting with TRMM. Multiple output products are specified to satisfy different classes of users, summarized in Subsection 3.2. The term “snapshot” for half-hourly estimates reflects the fact that individual satellite overpasses are the basis for these data. However, the resulting satellite estimates are not “instantaneous”, but represent an interval that can exceed an hour (Villarini et al. 2008). The best TRMM, and then GPM estimate of precipitation should be taken as the calibration standard. Currently this is considered to be the TRMM Combined Instrument (TCI, using TMI and PR) and the comparable GPM Combined Radar-Radiometer (CORRA, using GMI and DPR). As well, gauge data are clearly important for anchoring the satellite estimates. Error estimates and embedded auxiliary data fields are key to giving users (and developers) the information needed to assess quality by time and region over the life of the dataset. Finally, as a quasi-operational system, the code must “take a licking and keep on ticking.”
3.1 ALGORITHM OVERVIEW
A great deal of expertise in merged precipitation algorithms was developed in the U.S. during the TRMM era, funded mainly by PMM and by NASA NEWS, NOAA programs (CPO, USWRP), NSF SAHRA, and UNESCO GWADI. In the current effort the strengths of the various groups on the PMM Science Team are applied to create a unified U.S. algorithm. Specifics are: • Perform careful intercalibration of microwave estimates
• the GSFC group has a strong background • Provide finer time and space scales to get adequate sampling
• the CPC group has strong experience with Lagrangian time interpolation using Kalman filters – CMORPH-KF
• Provide microwave-calibrated IR estimates to fill “holes” in the PMW constellation • the CPC group operationally produces the 4-km Merged and “Even-Odd” IR Tb products • the U.C.-Irvine group has strong experience in computing IR estimates

IMERG ATBD Version 5.2
8
• Incorporate gauge data to control bias • the GSFC group has a strong background in monthly corrections • the CPC group has developed a test system to perform daily bias correction
• Provide error estimates • both the GSFC and CPC groups bring strengths
• Deliver and support a code package that runs in the PMM Precipitation Processing System (PPS) environment • the GSFC group has a strong track record
The high-level block diagram that results from this analysis is shown in Fig. 2, which identifies the institutions that provide the heritage code for the various blocks.
Table 2. Notional requirements for IMERG.
Resolution 0.1° [i.e., roughly the resolution of microwave estimates] Time interval 30 min. [i.e., the geo-satellite interval] Spatial domain global, initially filled with data 60°N-60°S Time domain 1998-present; later explore entire SSMI era (1987-present) Product sequence
“Early” sat. (~4 hr), “Late” sat. (~12 hr), “Final” sat.-gauge (~2.5 months after month) [more data in longer-latency products]
Instantaneous vs. accumulated
Snapshot for half-hour, accumulation for monthly
Sensor precipitation products intercalibrated to TCI for data before GPM launch, then to CORRA Global, undercatch-adjusted monthly gauge analyses including retrospective product; explore use in submonthly-to-daily and near-real-time products Error estimates, including “quality”; final form still open for definition Embedded data fields showing how the estimates were computed Precipitation phase estimates; probability of liquid precipitation Operationally feasible, robust to data drop-outs and (constantly) changing constellation Output in HDF5 (compatible with NetCDF4) Archiving and retrospective processing for all RT and post-RT products
3.2 PROCESSING OUTLINE 3.2.1 Initial Processing
The block diagram for IMERG is shown in Fig. 2. In words, the input precipitation estimates computed from the various satellite PMW sensors are assembled, mostly received at PPS as Level 1 brightness temperatures from the relevant providers, converted to GPM Level 1C intercalibrated brightness temperatures, then converted to Level 2 precipitation estimates using GPROF2014v2 (currently). The single exception is that the SAPHIR data are not well-behaved in GPROF, so those data are processed using the Precipitation Retrieval and Profiling Scheme (PRPS; Kidd 2018). All estimates are gridded, intercalibrated to the CORRA product on a rolling 45-day basis using probability matching, and climatologically calibrated to the GPCP monthly estimates with a simple ratio in high latitude oceans (where GPM Version 05 is deficient in precipitation) and over all land (where the CORRA tends to be high). These “high quality” (HQ) data are combined into half-hourly fields and provided to both the CPC Morphing-
IMERG ATBD Version 5.2
9
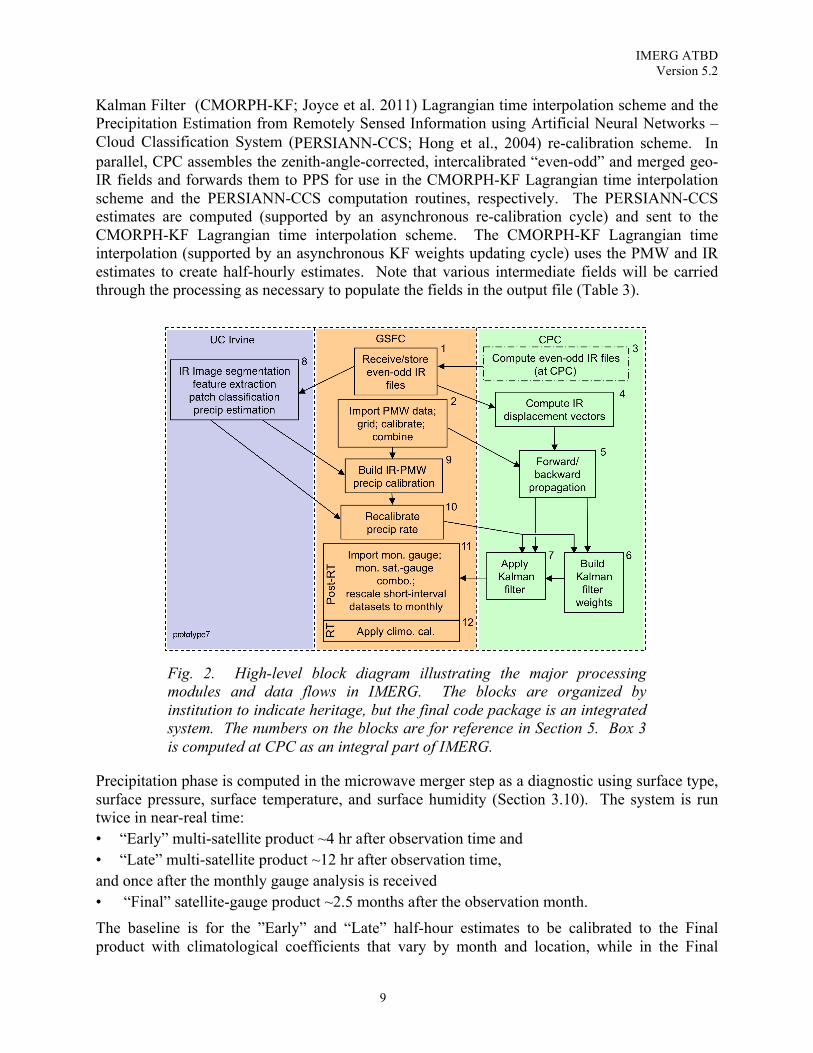
Kalman Filter (CMORPH-KF; Joyce et al. 2011) Lagrangian time interpolation scheme and the Precipitation Estimation from Remotely Sensed Information using Artificial Neural Networks – Cloud Classification System (PERSIANN-CCS; Hong et al., 2004) re-calibration scheme. In parallel, CPC assembles the zenith-angle-corrected, intercalibrated “even-odd” and merged geo-IR fields and forwards them to PPS for use in the CMORPH-KF Lagrangian time interpolation scheme and the PERSIANN-CCS computation routines, respectively. The PERSIANN-CCS estimates are computed (supported by an asynchronous re-calibration cycle) and sent to the CMORPH-KF Lagrangian time interpolation scheme. The CMORPH-KF Lagrangian time interpolation (supported by an asynchronous KF weights updating cycle) uses the PMW and IR estimates to create half-hourly estimates. Note that various intermediate fields will be carried through the processing as necessary to populate the fields in the output file (Table 3).
Fig. 2. High-level block diagram illustrating the major processing modules and data flows in IMERG. The blocks are organized by institution to indicate heritage, but the final code package is an integrated system. The numbers on the blocks are for reference in Section 5. Box 3 is computed at CPC as an integral part of IMERG.
Precipitation phase is computed in the microwave merger step as a diagnostic using surface type, surface pressure, surface temperature, and surface humidity (Section 3.10). The system is run twice in near-real time: • “Early” multi-satellite product ~4 hr after observation time and • “Late” multi-satellite product ~12 hr after observation time, and once after the monthly gauge analysis is received • “Final” satellite-gauge product ~2.5 months after the observation month. The baseline is for the ”Early” and “Late” half-hour estimates to be calibrated to the Final product with climatological coefficients that vary by month and location, while in the Final

IMERG ATBD Version 5.2
10
product the half-hour multi-satellite estimates are adjusted so that they sum to the monthly satellite-gauge combination computed in IMERG (following the TMPA approach). In all cases the output contains multiple fields that provide information on the input data, selected intermediate fields, and estimation quality.
Given the multiplicity of runs discussed here and below, it is key to IMERG maintainability and consistency that all of the runs share a common code. The different runs are achieved with options programmed into the single system, even though PPS chooses to install separate instantiations of the code for each run.
Finally, the Early and Late runs are executed in the PPS Real Time (RT) processing system, which is keyed to rapid creation of results, while the Final run is executed in the PPS Production processing system. 3.2.2 Retrospective Processing
Retrospective processing is key to creating consistent archives of data for users. This is true for users of all three runs of IMERG, so all three will be reprocessed. By design, the Production processing system, which computes the Final run, supports reprocessing. The RT processing system, which computes the Early and Late runs, does not support reprocessing. This issue is addressed by invoking IMERG in the Production system with calls that mimic the processing for Early and Final. Specifically, the selection of input data available to the retrospective Early Run will be approximated by limiting the forward time span of data to the typical latency time (~3 hours) before the Early run time (currently 4 hours after observation time). For simplicity, this solution is implemented by using Production input datasets. These choices cause the Early Run to be reprocessed with a superset of input data covering the original Early, and the input data from a particular sensor are produced by the “climo” GPROF estimates (computed with more-carefully prepared reanalysis data). In a future release we may decide to institute climatological calibrations in the retrospective Early Run that are different from those in the Early. The same is true for the Late.
Retrospective processing for both the Early and Late Runs is carried out after retrospective processing for the Final Run to allow computation of climatological calibration coefficients for Early and Late to the Final monthly product (which has gauge information). 3.2.3 Rotating Calibration Files and Spin-Up Requirements
There are three calibrations that require routine rotating accumulators in IMERG. First, there is the primary calibration of precipitation products, which in the TRMM era is carried out as TMI calibrated to the TCI, and in the GPM era is carried out as GMI calibrated to the CORRA. This calibration is done over an interval of 9 5-day periods (9 pentads) for stability. [Recall that the TMI and GMI products are used as calibrators for all the other satellite precipitation estimates. This is done because matchups between TCI or CORRA with the other sensors are exceedingly sparse.] Note that TMI is reduced to the status of just another (high quality) sensor during the period in which GMI is officially operating. The rotating calibrations are necessarily trailing in the Early and Late runs, but we use a centered approach for the Final run. The second rotating accumulator is for the Kalman filter, whose statistics are currently calibrated over a 3-month period. A side study showed that this interval yields results very similar to a 5-month period.

IMERG ATBD Version 5.2
11
The third rotating accumulator is for the PERSIANN-CCS/PMW calibration, which uses an interval of 6 pentads (30 days) for stability. The accumulator file is trailing for the Early and Late runs and centered for the Final run. There are also a number of calibrations that are currently climatological, but have the potential to be converted to rotating calibration files in the future if further research shows that the climatological approach is insufficiently accurate. These include the various calibrations of other sensor precipitation datasets to TMI and GMI. The final issue for the rotating accumulation files is providing seed and restart files. The development team provides the start-of-record seed files for TRMM and GPM. Thereafter, in normal operations the rotating files are programmed to refresh as new data arrive. However, it is likely that processing difficulties, bad input data, or undetected code errors will force a restart of processing. To accommodate such cases, PPS saves daily dumps of rotating accumulation files and all the intermediate files.
3.3 INPUT DATA
3.3.1 Sensor Products The sensor products are detailed in Section 2 as part of the discussion of the various sensors. For the most part, the datasets listed in Table 1 from previous and current sensors are already archived at PPS as part of the TMPA work under TRMM, but the requirement in GPM is that all inputs be processed using the current GPM version of GPROF2017. As such, we are working closely with the developers at Colorado State Univ. and with PPS in testing to ensure the best quality products. Note that the Version 05 GPROF estimates for MHS and ATMS do not provide estimates for the 5 and 8 footprints (respectively) at each swath edge for the period starting at the beginning of the GPM era (12 March 2014). This is due to algorithm issues as revealed in early testing. As well, note that the Version 05 GPROF-TMI estimates had not been computed for the GPM era when the IMERG Final Run was retrospectively processed, so TMI is not presently included in the V05 IMERG Final datasets. Taken together, these limitations somewhat reduce the amount of microwave-based data contained in Version 05 IMERG, compared to previous versions. Future reprocessings will correct these issues. 3.3.2 Ancillary Products
The ancillary products required on a routine basis for the IMERG algorithm are surface type, surface pressure, surface temperature, and surface relative humidity. Surface type is provided by the standard static map of percent water coverage from PPS. Surface temperature, relative humidity, and surface pressure are provided by the JMA forecasts (for Early) and GANAL gridded assimilation (for Late) of meteorological data. The Final Run uses the ECMWF analysis for consistency with the “climatological” run of GPROF2017.
3.4 MICROWAVE INTERCALIBRATION As with TMPA, the IMERG precipitation estimates are calibrated to the GPM single- or combined-sensor estimates deemed highest-quality following Huffman et al. (2007), currently the CORRA estimates. During the initial release period in the GPM mission a short-record (6-9 month-based) calibrator was used, pending a longer GPM-based calibrator, while in Version 05

IMERG ATBD Version 5.2
12
it is seasonal averages for 2015. The microwave intercalibration technique is based on quantile-quantile matching, similar to Miller (1972) and Krajewski and Smith (1991). The temporal and spatial scale of the histogram matching for any given sensor depends upon the unique orbit and individual sensor characteristics. Vastly different orbits, leading to fewer data overlaps, may require a longer calibration period to ensure representative geographic and diurnal sampling. Similarly, radically different sensors may require sampling at higher spatial and temporal resolution. Climatological (fixed) calibrations are used when possible, with dynamically-computed (monthly, say) calibrations utilized when necessary.
The GMI-CORRA calibrations are computed on a 1°x1° grid using a 3°x3° template. Experience in Version 03 showed that regions with differing gradients in GMI and CORRA resulted in blocky patterns when the calibrations were used on the original 1° grid. So, starting in Version 05, the calibrations are distance-weighted interpolations of the four surrounding 1° calibration values. The GMI-other-satellite calibrations are computed on 22 15° zonal histogram bands overlapping at 5° increments for ocean. A single histogram is used for land due to sampling concerns. Experience in Version 03 showed that zonal bands with differing gradients between GMI and other satellites occasionally resulted in zonal discontinuities when the calibrations were used on the center 15° band. So, the calibrations are equal-weighted averages of the upper, center, and lower band calibration values. However, testing for Version 05 showed that high-rate gridboxes were badly overestimated in this process, so GMI-other-satellite calibrations are not carried out in Version 05 except for SSMIS, whose PDF of GPROF precipitation rates differed from the other constellation sensors.
CMORPH-KF, PERSIANN-CCS, and TMPA-RT all use various lengths of trailing calibration in which updating is considered necessary, and this is the intended approach for the near-real-time IMERG Runs. The post-real-time TMPA uses a calendar-month calibration, but for consistency across the IMERG Runs, we routinely update the Final calibrations such that each day is approximately in the middle of its calibration period. One improvement in GPM over TRMM is that both DPR and CORRA are available in real time, whereas PR and TCI were not in TRMM. This allows us to have the same calibrating sensor for all the IMERG runs.
Even though CORRA is considered to be the best estimator, in Version 05 (as in Version 04) all of the GPM individual-sensor precipitation products are biased low in the high latitude oceans compared to the GPCP Satellite-Gauge product and estimates based on CloudSat (Behrangi et al. 2014 and subsequent revisions to the approach). There is some variation between the latter two, but the GPCP can provide regionally varying monthly climatological adjustment factors, while the CloudSat-based data currently only have an annual latitudinal profile over ocean. Thus, in Version 05 (as in Version 04) we are making a simple ratio adjustment to bring the CORRA-calibrated constellation estimates in line with what is considered a more reasonable estimate. We apply these corrections outside of a somewhat subjectively chosen, seasonally varying low-latitude zone where the ratio of CORRA to GPCP is close to one. Meanwhile, over land the CORRA is frequently too high, so a seasonal calibration to GPCP is applied at all latitudes. This is not as severe as it first appears, since GPCP includes gauge data, and the complete IMERG products (for all Runs) include calibration to monthly gauge analyses, climatologically for Early and Late, and by month for Final.

IMERG ATBD Version 5.2
13
3.5 MERGED MICROWAVE The intercalibrated microwave precipitation estimates from GMI, TMI, and all of the partner sensors in the constellation are merged to create Level 3 data sets containing the best observational data available in each half hour. All of the input data sets are gridded from their native Level 2 swath data to the IMERG 0.1°x0.1° Level 3 global grid on the IMERG half-hourly interval (namely the first and second half hour for each UTC hour). The grid is populated with sensor data in the priority order conical-scan radiometer, and then cross-track scanner. If there is more than one sensor in a class, the one closer to the center of the half hour is chosen. The precipitation estimate, sensor type, and time of observation (to the nearest minute) are reported in the output data set. In Version 05 the gridding is extended to fully global (90°N-S), and inserted into the merged microwave.
3.6 MICROWAVE-CALIBRATED IR
Geo-satellites give frequent sampling, but the resulting IR Tb data are related to cloud top features (temperature and albedo) rather than directly to surface precipitation. This indirect relationship is best captured if the IR Tb-precipitation relationship is improved using texture and patch classification as well as applying routine updates using leo-PMW based precipitation estimates. Here, following the PERSIANN-CCS (Hong et al. 2004), the 60°N-S latitude belt that contains geo-IR data is subsetted into 24 overlapping sub-regions (six in longitude by four in latitude) to allow for regional training and parallel processing. For each sub-region, the full-resolution IR Tb field is segmented into separable cloud patches using a watershed algorithm. Cloud patch features are extracted at three separate temperature levels: 220K, 235K, and 253K, which are chosen to represent the cloud patches at different altitudes in the atmosphere. [Expansion to a fourth, warmer threshold is underway to better capture precipitation from low clouds, particularly in dry zones.] An unsupervised clustering analysis (Self-Organizing Feature Map) is used to classify cloud patches into a number of cloud patch groups based on the similarities of patch features. Precipitation is assigned to each classified cloud patch group based on a training set of leo-PMW precipitation samples. These initial precipitation estimates are then adjusted using coefficients based on a trailing backlog of matched leo-PMW precipitation and cloud-patch precipitation. The backlog is sized to ensure sufficient sampling to generate a stable estimate.
3.7 KALMAN-SMOOTHER TIME INTERPOLATION Under the Kalman Smoother framework as developed in CMORPH-KF and applied here, the precipitation analysis for a grid box is defined in three steps (Joyce et al. 2011). First, PMW estimates of instantaneous rain rates closest to the target analysis time in both the forward and backward directions are propagated from their observation times to the analysis time using the cloud motion vectors computed from the geo-IR images (see next paragraph). The “prediction” of the precipitation analysis is then defined by compositing the forward- and backward-propagated PMW estimates with weights inversely proportional to their error variance. If the time interval from the nearest PMW observation is longer than 90 minutes, the final "analysis" is defined by updating the “forecast” with IR-based precipitation observations with weights inversely proportional to the observational correlations. This 90-minute threshold is due both to the natural timescale of precipitation at these fine scales and to the retrieval errors in the microwave algorithms.

IMERG ATBD Version 5.2
14
The cloud motion vectors used to propagate the PMW estimates are calculated by computing the pattern correlation between spatially lagged geo-IR Tb arrays from two consecutive images. The spatial displacement with the highest correlation is used to define the cloud motion vector. The cloud motion vectors are defined for each 2.5° lat/lon grid box using IR data over a 5° lat/lon domain centered on the target grid box. Over mid-latitudes, precipitation systems present slightly different movements than the cloud systems that we are tracing with the geo-IR Tb. To account for the differences, Joyce et al. (2011) compared the PDFs of the zonal and meridional components of the cloud motion vectors against those of the precipitation systems observed by the Stage II radar over the contiguous U.S. (CONUS). A static correction table was then established for adjusting the geo-IR-based cloud motion vectors in both hemispheres’ mid-latitudes to better represent precipitation motion. Interpolation in time, and then space is used to provide spatially complete propagation fields.
Errors for the individual satellite estimates are calculated by comparison against TMI/GMI estimates. Error functions for the TMI/GMI are taken to be the same as those for the AMSR-E, based on an early comparison against the Stage II radar observations over CONUS. Expressed in the form of correlation, the errors for the propagated PMW estimates are defined as regionally dependent and seasonally changing functions of sensor type (imager, sounder, IR) and the length of propagation time. Over land, the error functions are computed for each 10° latitude band using data collected over a 30°-wide latitude band centered on the target band. No zonal differences in the error are considered due to the limited sampling of the data. Over ocean, the error functions are defined for each 20°x20° lat/lon box using data over a 40°x40° lat/lon region centered on the target box. Over both land and ocean, the error functions are calculated for each month using data over a three-month period, trailing for Early and Late, and centered on the target month for Final, to account for the seasonal variations. The comparisons against Stage II were done once, while those against TMI/GMI are updated monthly.
3.8 SATELLITE-GAUGE COMBINATION
For the baseline post-real-time IMERG package, we follow the TMPA approach for infusing monthly gauge information into the fine-scale precipitation estimates (Huffman et al. 2007). All of the full-resolution half-hour multi-satellite estimates in a month are summed to create a monthly multi-satellite-only field. This field is combined with the monthly GPCC precipitation gauge analysis (over land) in a three-step process. First, the gauge analysis is adjusted for undercatch by multiplying the monthly precipitation values by the corresponding month’s gridbox climatological adjustment ratios from Legates and Willmott (1990). Second, the multi-satellite estimate is adjusted to the large-scale mean of the gauges, and finally, the adjusted multi-satellite and gauge fields are combined using weighting by inverse estimated error variance. This monthly satellite-gauge combination is a product in its own right (see Table 3). In addition, the field of ratios between the original monthly multi-satellite and monthly satellite-gauge fields is computed, then each field of multi-satellite precipitation estimates in the month is multiplied by the ratio field to create the “calibrated” half-hourly IMERG estimates. In Version 03 we found that the 1° GPCC data grid caused unphysical blockiness along coasts, so starting in Version 04 we trimmed the gauge contribution to the coast. Furthermore, the GPCC data volume adjustment caused blockiness over land, so it was removed. The net effect is to “spread” the gauge analysis precipitation values for a particular grid box to the surrounding grid boxes. To date, the resulting smoothing has not been considered a significant problem. Note that the zone outside the 60°N-S latitude band that contains geo-IR data is only populated with gauge
IMERG ATBD Version 5.2
15
data and GPROF estimates in areas without snowy/icy surfaces, so the data coverage is not complete.
3.9 POST-PROCESSING
IMERG ends with a precipitation post-processing step that introduces gauge information into the multi-satellite-only half-hourly data (carried as field precipitationUncal). For the Final Run, the ratio between the monthly accumulation of half-hourly multi-satellite-only fields and the monthly satellite-gauge field is computed, then each half-hourly field of multi-satellite-only precipitation estimates in the month is multiplied by the ratio field to create the final half-hourly calibrated IMERG precipitation estimates. The ratio between the monthly satellite-gauge and the monthly accumulation of half-hourly multi-satellite-only fields is limited to the range [0.2,3]. The cap of 3 was chosen because the value 2 (used in TRMM V6) was too restrictive. The value was moved to 3 because it did a better job of matching the two accumulations, while testing showed that 4 started introducing unrealistic shifts to the histogram of half-hourly precipitation rates for the month. Early in TRMM the lower bound was set to 0.5, but it can be argued that a smaller value allows matching between the two accumulations without creating the egregious high snapshot values that result when the upper bound is expanded too far. The baseline IMERG near-real-time products follow the TMPA procedure in providing both the original multi-satellite estimate and a climatologically calibrated field. The climatological calibration is intended to make the near-real-time products as consistent as possible with the Final product. One important simplification compared to the TMPA is that both the DPR and CORRA are computed in real time for GPM. This contrasts to the situation in TRMM where the PR and TCI were not computed in real time and we have had to substitute TMI as the RT calibrator. Accordingly, in GPM we compute a straightforward calibration to the Final product using a climatological CORRA calibration. If the sub-monthly precipitation gauge combination option is incorporated in the Late product, presumably the need for post-processing will have to be re-assessed, but the Early product is certain to require the climatological calibration to the Final product.
3.10 PRECIPITATION PHASE
Users are interested in the phase of the precipitation (i.e., liquid, solid, or mixed). Most of the standard microwave precipitation algorithms do not yet retrieve such information (GPROF in particular), so we must use ancillary data sets to create the estimate. Formally, there should be separate estimates for each phase. However, mixed-phase cases tend to be a small fraction of all cases, and we consider the estimation schemes to be sufficiently simplistic that estimating mixed phase as a separate class seems unnecessary. Most users appear to focus on the solid phase, both due to the delays it introduces in moving accumulated water mass through hydrological systems, and due to the hazardous surface conditions that snow and ice create. Accordingly, we lump together liquid and mixed as “liquid” and compute a simple probability of liquid phase precipitation (PLPP). For the half-hourly data, we adopt the Liu scheme (personal communication, 2013), which appeared in Sims and Liu (2015). The present (pre-publication)

IMERG ATBD Version 5.2
16
form is a simple look-up table for PLPP as a function of wet-bulb temperature, with separate curves for land and ocean. This is a current area of research in the field, so we anticipate changes as research results are reported. Since this diagnostic is independent of the estimated precipitation, we choose to report the probability of liquid phase for all grid boxes, including those with missing or zero estimated precipitation. [This raises the possibility that the IMERG PLPP field can be applied to any other global precipitation field for estimating phase.]
At the monthly scale the probability value could either be the fraction of the time that the precipitation is liquid or the fraction of the monthly accumulation that fell as liquid. The latter seems to be what most users want, so this is the parameter computed. Specifically, the monthly probability of liquid is the precipitation-rate-weighted average of all half-hourly probabilities in the month, except for grid boxes where zero precipitation is estimated for the month, in which case it is the simple average of all available probabilities in the month.
Note well that the assignment of phase does not change the units of precipitation, which is the depth of liquid. In the case of solid precipitation, this is usually referred to as snow water equivalent (SWE). The depth of fallen snow that corresponds to this SWE depends on the density of the snow. Typically, it takes about 10 mm of fallen snow to yield 1 mm of SWE, but the ratio depends on location, meteorological regime, time of year, and elevation. There's an excellent discussion of how Environment Canada is addressing this in Wang et al. (2017).
3.11 ERROR ESTIMATES
Error estimates are a required item in the output datasets. The baseline fine-scale datasets errors are estimated following the TMPA downscaled monthly estimation scheme. The baseline monthly Final dataset error estimates are computed as part of the optimal estimation of the satellite-gauge combination. We expect that more sophisticated error fields will be incorporated as part of IMERG in the future, for example providing additional information on the error quantiles following Maggioni et al. (2014) or the correlation parameter computed in the Kalman filter methodology. In such a case, the critical problem is to limit the number of time/space-varying parameters that consequently require the insertion of additional parameter fields in each dataset.
3.12 QUALITY INDEX
There have been several requests from users recently for a “simple” quality index to give some guidance on when they should most trust the Integrated Multi-satellitE Retrievals for GPM (IMERG). While the goal is reasonable, there is no agreement about how this quantity should be defined. After some discussion within the team, two distinctly different quality indices were chosen for the half-hourly and monthly data fields for implementation in Version 05. It is a matter of investigation to determine if users find these insightful, or if different quality indices should be developed for future releases. Details are provided in the document “IMERG Quality Index”, available at https://pmm.nasa.gov/sites/default/files/document_files/IMERG_QI.pdf .
3.12.1 QIh: Quality Index for Half-Hourly Data At the half-hourly scale, the best metric is some measure of the relative skill that might be expected from the fluctuating mix of different passive microwave- and infrared-based

IMERG ATBD Version 5.2
17
precipitation estimates. The Kalman smoother used in IMERG (and originated in the CPC Morphing [CMORPH] algorithm, Joyce et al. 2011) routinely recomputes estimates of correlation between GMI and each of the other satellite estimates in coarse blocks across the entire IR domain (60°N-S) and then uses these correlation coefficients (squared) to provide weights for use in the combination of forward-propagated passive microwave, backward-propagated passive microwave, and current-time infrared precipitation estimates. However, the formalism never provides an overall correlation for the combined estimate, so one approach is provided here.
The correlation coefficients developed for the Kalman smoother are substituted for inverse error variance to compute the approximate correlation coefficient of the merged precipitation estimate. Furthermore, the correlation coefficients are transformed with the Fisher (1915) z statistic before the computation and back-transformed afterwards, which is a simple variance stabilization transformation. Formally, the Fisher transformation requires that the two variables being correlated follow a bivariate normal distribution. While this is not true for precipitation, we adopt this approach as a first approximation to computing the correlation coefficient of the combined precipitation estimate because it’s use as a quality index seems reasonable and useful. The units are non-dimensional correlation coefficients. There is one additional issue: we lack the zero half-hour correlation of each constellation member to the GMI for computational reasons in the current implementation of IMERG and need an approximate value. Lacking strong justification for alternatives, we chose to set the correlation coefficients to 1 when the microwave estimate is present. The next version of this approach should revisit this choice.
3.12.2 QIm: Quality Index for Monthly Data At the monthly scale, a relatively well-founded metric exists for random error, based on Huffman’s (1997) analysis of sampling error for a particular data source for a month. The general form of the relationship is simplified to a relationship that it can be inverted to give the number of samples. When all the constants on the right-hand side are set for the gauge analysis, but final satellite-gauge values are used for the estimated precipitation and random error values, the number variable is defined as the equivalent number of gauges. Following Huffman (1997), the interpretation is that this is the approximate number of gauges required to produce the estimated random error, given the estimated precipitation. The units are gauges per area, and in the current implementation the area is carried as 2.5°x2.5° of latitude/longitude, even though IMERG is computed on a much finer scale, in order to facilitate interpretation in large-error regions.
3.13 ALGORITHM OUTPUT All output data files have multiple fields with PMM-mandated metadata and are written in HDF5, which is compatible with NetCDF4. All fields are produced for all data Runs. Table 3 lists the data fields. Recall that PMM provides an on-the-fly data subsetting by time, region, and parameter, so users are not required to download the entire file. The output files for the various runs are identified with these prefixes (see http://pps.gsfc.nasa. gov/Documents/FileNamingConventionForPrecipitationProductsForGPMMissionV1.4.pdf):

IMERG ATBD Version 5.2
18
• 3B-HHR-E – half-hourly, Early Run • 3B-HHR-L – half-hourly, Late Run • 3B-HHR – half-hourly, Final Run • 3B-MO – monthly, Final Run
As listed in Table 2, the notional requirement is that the output be on a global 0.1° grid. However, there is a strong argument that a fully global grid should be (approximately) equal-area, and this issue is under discussion within the project for future revisions. Also, the IR data are actually available on a 0.035° grid, and the question has been raised whether the notional grid size ought to be in the range 0.035°-0.05°. At present the baseline is left at 0.1° because there are scientific questions about downscaling microwave footprints to the finer scale, and operational questions about data volume.
3.14 PRE-PLANNED PRODUCT IMPROVEMENTS
Throughout the useful life of IMERG we plan for the code to be reasonably robust to errors, drop-outs, and changes in the make-up of the satellite constellation. The preceding discussion also detailed some developmental issues that are being addressed as we gain experience running IMERG. In addition, the team considers it helpful to pre-plan certain enhancements to the code that we are fairly certain will be required at some point.
Table 3. Lists of data field variable names and definitions to be included in each of
the output datasets. Primary fields for users are in italics.
Half-hourly data file (Early, Late, Final)
precipitationCal Multi-satellite precipitation estimate with gauge calibration (recommended for general use)
precpitationUncal Multi-satellite precipitation estimate
randomError Random error for gauge-calibrated multi-satellite precipitation
HQprecipitation Merged microwave-only precipitation estimate HQprecipSource Microwave satellite source identifier HQobservationTime Microwave satellite observation time IRprecipitation IR-only precipitation estimate
IRkalmanFilterWeight Weighting of IR-only precipitation relative to the morphed merged microwave-only precipitation
probabilityLiquidPrecipitation Probability of liquid precipitation phase PrecipitationQualityIndex Quality Index for precipitationCal field Monthly data file (Final)
precipitation Merged satellite-gauge precipitation estimate (recommended for general use )
randomError Random error for merged satellite-gauge precipitation
gaugeRelativeWeight Weighting of gauge precipitation relative to the multi-satellite precipitation
probabilityLiquidPrecipitation Accumulation-weighted probability of liquid precipitation phase
PrecipitationQualityIndex Quality Index for precipitationCal field
IMERG ATBD Version 5.2
19
3.14.1 Addition/Deletion of Input Data
Satellites come and go over time. For the most part, satellite drop-outs, other than of the GPM Core itself, simply result in a smaller amount of input data for the system. Addition of data, on the other hand, is potentially complicated by a range of possible priorities and calibration needs of the new sensor. In IMERG we follow the work pioneered in the Version 7 TMPA, where extra satellite slots are programmed in, separated into conical and cross-track scanners. When a new sensor comes on-line, it can be assigned to an appropriate-type slot and start contributing from that point forward, once the calibration coefficients are determined, which can require several months of data. However, including the new sensor’s data from before the date/time on which it is instituted in the dataset requires retrospective processing (next Subsection). 3.14.2 Upgrades to Input Data When an existing sensor’s data record is reprocessed, or a new sensor is introduced that has an archive not previously used, it is necessary to reprocess the archive of IMERG data to preserve consistent statistical behavior (to the extent possible) across the entire record. While reprocessing should not be undertaken lightly, given the computing demands on PPS and the disruption to the users, hard practical experience shows that we need to be more aggressive about this issue than has been the case previously for TMPA. For example, the second version of NESDIS AMSU, introduced in 2004, resulted in an underestimate of light rain. The result in TMPA during part of its Version 6 was a low bias in fractional coverage and rain amount over ocean. When an upgraded version of the NESDIS AMSU was introduced in early 2007 these biases were greatly reduced, but we allowed the inhomogeneity to persist in the Version 6 TMPA archive. As a result, users had to be continually reminded that the relatively low values are a known problem, a problem that was not fixed until the Version 7 TMPA reprocessing some five years later.
3.14.3 Polar Sensors The Multi-Satellite team intends to extend IMERG to the polar regions, consistent with GPM’s fully global focus. This requires estimating displacement vectors at higher latitudes, either from the asynchronous assemblage of leo-IR satellites or by tracking precipitation in a reanalysis/ forecast assemblage such as MERRA2 and GEOS5. We will then use these vectors to displace the available high-latitude precipitation estimates and apply the backward/forward Kalman filter to compute the output estimates. Available high-latitude estimates include the TOVS and AIRS estimates computed using the Susskind et al. (1997) algorithm, PMW estimates computed by GPROF2014, and numerical model estimates (Subsection 3.13.5). This development work will require close cooperation with the experts in high-latitude GV.
3.14.4 Upgrades for Near-Real Time It is likely that the Near-Real Time products will require modifications to create the most useful output. For example, we started with somewhat loose latency limits for the Early and Late Runs and are paring back the timing as we gain experience with the realities of the data reception. For the Late Run, this requires balancing the useful time range of backward-propagated microwave data against the latency of the following microwave overpass. If the daily gauge option is instituted for the Late Run, we believe we can fit it into the latency structure of the baseline
IMERG ATBD Version 5.2
20
scenario. That is, if the daily gauge analysis has a latency that is much longer than the Late Run satellites require, the daily gauge computation might be able to use the PDF of data up through the previous day. 3.14.5 Use of Model Estimates
Validation work by Ebert et al. (2007) and Gehne et al. (2016) among others, demonstrates that numerical model estimates of precipitation can out-perform observational estimates at daily 0.25°x0.25° scale in the cool season over land. This stands in contrast to the poor performance by model estimates in tropical and subtropical conditions for day-to-day variations, diurnal cycle, and seasonal variation. The Multi-Satellite team’s experience in isolating bias in input datasets and the flexible, error-sensitive behavior of the Kalman filter concept seem to suggest that IMERG is a natural platform for testing the joint use of observational and model-based precipitation estimates. This is particularly true given the expectation that the team will be exploring extension into polar regions (Subsection 3.13.4). It is absolutely clear that the team intends to maintain a robust observation-only capability throughout GPM to support a variety of applications, not the least being validation of model estimates. However, a parallel joint observation-model product is a worthy contribution to the project and to advancing scientific understanding.
3.15 OPTIONS FOR PROCESSING
Since the clear mandate for the Day-1 IMERG algorithm was driven by a very aggressive schedule, the baseline algorithm was designed around code that was already running and tested. At the same time, the team had several concepts in research that might become sufficiently mature that one or more of them might be prime targets for upgrading the future versions.
3.15.1 Use of Multi-Spectral Geo-Data Besides the thermal IR channel discussed above, geo-satellites also provide other channels, usually visible and one or more spread across the IR spectrum. Historically, these channels have not been used due to apparent modest improvements in skill, difficulties in handling the higher data volumes, and limitations to daylight hours (for visible). However, our ongoing dependence on geo-satellite data to fill large gaps between PMW overpasses and the increasing number of (non-microwave) channels on newer satellites make it important to reconsider this aspect. Recent studies seem to indicate reasonable increases in skill using modern neural net approaches, particularly when visible data are used (Behrangi et al. 2009). Several important steps must be taken to capitalize on this apparent benefit in using multi-spectral data. First the scientific development must be advanced to operational status. Second, we must work with the data providers to arrange for routine delivery of the data in a useful format, including a complete archive. Third, choices must be made on the selection of channels, recognizing that previous generations of geo-satellites had less-capable sensors than those now in use.
3.15.2 Computing Propagation from Data Other than IR The propagation vectors currently used in the CMORPH-KF Lagrangian time interpolation are computed from IR-based cloud motions. As noted in Subsection 3.7, these differ from the motion of precipitation systems, creating a source of error. We plan to explore alternatives of computing, or at least correcting the motion vectors from the PMW precipitation itself, and of using pattern motions from precipitation and other variables as depicted in numerical model runs. Note that the philosophy of using numerical reanalysis/model output would be very consistent

IMERG ATBD Version 5.2
21
with how the IR is currently used; the data source’s quantitative variable values are not used as such, but rather the data are used to depict motions. Pingping Xie has made some advances in this approach that could be useful. Due to limitations on accessing the TRMM-era archive of the CPC “even-odd” global IR files that are used to compute the IR-based cloud motions, the use of MERRA and GEOS5 data are being actively researched. It is expected that they will, in fact, be satisfactory for providing the motion vectors. This substitution in the TRMM era implies that the current IMERG estimates would then be replaced with estimates based on MERRA/GEOS5 motion vectors, likely in summer 2018. 3.15.3 Incorporating Cloud Development Information
Precipitation develops and decays over time periods that are short compared to the typical revisit time of the leo-PMW constellation. As noted above, the autocorrelation of observed and propagated precipitation fields may drop from 1.0 to ~0.6 within 30 minutes and further fall to ~0.4 or lower after an hour of propagation, while instantaneous geo-IR precipitation estimates are notoriously poor, but nonetheless provide a minimum floor of skill when a gridbox lacks recent propagated leo-PMW estimates. Taking a different approach, capturing the dynamic evolution of geo-IR cloud images may help to identify cloud systems in various stages of development. This approach to addressing the “cloud development problem” is a relatively new area of research and requires further investigation to determine the best strategies for capturing the development process. One possibility is to drive a highly simplified conceptual cloud model with parameters computed from the geo-IR Tb data, as in the Bellerby et al. (2009) Lagrangian Model (LMODEL). Another is to modify the propagated leo-PMW precipitation estimates with time based on parameters computed from the geo-IR Tb data, as in the Behrangi et al. (2010) Rain Estimation using Forward Adjusted-advection of Microwave Estimates (REFAME).
3.15.4 Use of Daily Gauges The biases discussed previously vary on sub-monthly time scales, of course. To address this problem, we will examine the possibility of refining the bias correction approach described in Subsection 3.8 through the use of daily gauge analysis. CPC has developed a new technique to correct the bias in high-resolution satellite precipitation estimates through matching the PDF of the satellite estimates against that of the daily gauge analysis (Xie et al. 2010). The PDF bias correction is carried out in two steps using historical, and then real-time data. First, PDF tables are constructed for each 0.25° lat/lon gridbox over the global land and for each calendar day using co-located satellite and gauge data pairs over a spatial domain centered on the target grid box and over a sliding window of 31 days centered on the target calendar day for the 16-year period beginning in 1998. The spatial domain is expanded until a sufficient number of data pairs are collected. After the correction using historical data, the satellite estimates are further calibrated against the real-time data to remove the year-to-year variations in the bias. To this end, PDF tables are created using co-located data collected over a 30-day period ending at the target date. The least numbers of co-located data pairs used to create PDFs for the corrections are 500 and 300 using historical and real-time data, respectively.
3.15.5 Improve Error Estimation Error estimation has proved resistant to easy progress, in no small part because precipitation is a highly intermittent, non-negative process resulting in non-Gaussian, strongly skewed PDF’s of
IMERG ATBD Version 5.2
22
precipitation events that are generated at very fine space and time scales, and which demonstrate multi-scale correlation structures. The current scheme for computing random error estimates is based on the Huffman (1997) approach for monthly data, and badly needs to be replaced. The Precipitation Uncertainties for Satellite Hydrology (PUSH) scheme (Maggioni et al. 2014) seems to promise a clean computation of the full quantiles of precipitation for each grid box, which presumably encompasses both systematic and random error. Detailed work on PUSH is being led by Dr. Maggioni under separate funding, so the role of the present project is to work with her group and make use of the results as feasible. Another promising concept developed under separate funding is the Probabilistic QPE using Infrared Satellite Observations (PIRSO; Kirstetter et al. 2018). Despite the name, it should be applicable to IMERG. Note that neither scheme directly addresses the grand challenge of accounting for the time/space error correlation structure in estimating error for arbitrary time/space averages of IMERG data.
4. TESTING
The CMORPH-KF and PERSIANN-CCS systems were brought up in the GSFC development environment in GSFC Code 612 with the minimum number of changes possible to ensure that the code as originally presented was functional. The TMPA code already satisfied this requirement. Thereafter, the IMERG code was the development system.
4.1 ALGORITHM VERIFICATION IN THE PPS SYSTEM
As each generation of IMERG code is developed, it is validated on the development system. At the agreed-upon deliveries the entire package is assembled and transferred to PPS for integration and testing. This allows us to validate the PPS processing. The IMERG products are compared against coincident CMORPH-KF, PERSIANN-CCS, TMPA, prior IMERG, and various ground validation fields. The goal in this stage is to shake out as many bugs and conceptual difficulties as possible, applying corrections to the production and near-real-time IMERG instantiations.
4.2 ALGORITHM VERIFICATION FOR THE DIFFERENT RUNS The main features to be validated between the near-real-time and production instantiations are the use of somewhat different input data sets and the addition of monthly gauge calibration in the Final run. As before, it is important to compare the results to the other estimates and validation data listed above.
4.3 ALGORITHM VALIDATION
The more formal algorithm validation is examining various aspects of the IMERG results. At the snapshot level, comparison to the fine-scale NOAA Multi-Radar Multi-Sensor (MRMS) analyses, and to the PMM Kwajalein radar archives are considered key. As part of this effort, we carry out similar comparisons against the gridded Level 2 input data. The performance at larger space-time scales is being assessed using accumulations of these three datasets, as well as the CPC daily gauge analysis, the IPWG validation sites (Australia, CONUS, Japan, South America, Western Europe), the GPCC global monthly gauge analysis, the Pacific atoll data, and the ATLAS II buoy data. For higher-latitude validation, the GPCC data can be used to validate the satellite-only products. The team already has access to Finnish Meteorological Institute precipitation gauge data. At a minimum, metrics include bias, root-mean-square error, mean

IMERG ATBD Version 5.2
23
absolute error, correlation, and skill scores. Decompositions into hit error, miss error, etc. following Tian et al. (2009) are considered as well. We are working with the validation teams to examine the IMERG datasets with the detailed validation approaches that they manage. Finally, we work with selected users, particularly hydrologists, to incorporate the test datasets and report their experiences to help determine what IMERG’s level of skill is for their applications. Some early Version 05 results are displayed in the release notes, posted at
https://pmm.nasa.gov/sites/default/files/document_files/IMERG_FinalRun_V05_release_notes-rev3.pdf
and this discussion will be expanded as additional results are computed.
5. PRACTICAL CONSIDERATIONS
5.1 MODULE DEPENDENCIES The baseline structure of IMERG is shown in Fig. 2. We have not enforced consistency on the various boxes in the sense that some boxes might be programmed as multiple modules, while others will be computed in a single module. As summarized in Subsection 5.2, the data flow between modules, and between executions of the same module, is carried out using files, which typically have fixed names. Input and output datasets necessarily have names that reflect the time sequencing of the data that they contain. The satellite-satellite calibrations, which include the PMW intercalibrations to a GPM standard (block 2), IR-PMW precip calibration for the IR estimates (block 10), and the Kalman filter weights (block 6), are conceptually asynchronous with the actual half-hourly precipitation dataset processing. It is a matter of computational choice within PPS as to whether the calibrations are run sequentially or in parallel, but the system is designed to be very forgiving of occasional missed calibration match-ups – without significant loss of skill it can run with the then-current calibration files, as long as the dropouts do not become too severe. The heritage TMPA system computed the PMW intercalibration on a calendar month basis, while the PERSIANN-CCS and CMORPH-KF run the IR-PMW and KF weights, respectively, on trailing accumulations of match-ups. For IMERG we necessarily run all the Early and Late calibrations on trailing accumulations of match-ups. The post-real-time Final run has to wait for the GPCC precipitation gauge analysis and the ECMWF ancillary data, so we accumulate the match-ups with a sufficient delay after real time that the Final calibrations are approximately centered.
The only important difference between near- and post-real-time runs comes in the last calibration, which is computed for the near-real-time as climatological adjustments to the Final product, and for the post-real-time as calendar-month adjustments to, and combination with monthly gauge analyses.
As noted above, we intend to compute three runs of the algorithm, namely the “Early”, “Late”, and “Final” Runs at about 4 hr, 12 hr, and 2.5 months after observation time. The simplest approach is chosen, namely to maintain three entirely separate sets of files and to compute everything in each run. This eliminates dependencies between runs and facilitates retrospective processing.
IMERG ATBD Version 5.2
24
5.2 FILES USED IN IMERG Input, output, inter-module data transfer, and inter-run/static data storage is accomplished through files in IMERG. Table 4 displays our best estimate of what the file sizes and count are, but some of the file sizes are variable due to internal compression. It is important to note that the granularity of the input data implies that two of each of the input types will have to be used in each half-hour with fair regularity. On the other hand, the precipitation gauge analysis provides only one file in a month, which is also true for the monthly Merged Satellite/Gauge product. Several of the options and planned upgrades will require the use, transport, and accumulation of data in additional files.
5.3 BUILT-IN QUALITY ASSURANCE AND DIAGNOSTICS
To the extent possible, every effort is being made to incorporate quality assurance checks in the IMERG system. This includes quality checks of all input data, and of selected intermediate and output data based on metrics developed for TRMM. The goal of these metrics is to capture discrepancies before they propagate into the downstream processing. PPS toolkit warning and error messages are the primary mechanism used to flag potential problems. Optional diagnostic information are available to the operator when requested. It is possible that a separate, post-processing algorithm will be used to extend the quality assurance procedure to the Final product as part of the operational development. The goal of this post-processing algorithm would be to capture more subtle issues than observable during production.
5.4 SURFACE TEMPERATURE, RELATIVE HUMIDITY, AND PRESSURE DATA
The estimation of precipitation phase requires global surface temperature, relative humidity, and surface pressure data, since the operational algorithms cannot provide phase directly. The JMA model forecast and GANAL analysis data are computed in 6-hour increments, and five 6-hour increments are provided within a single delivered file (i.e., a day). The data are provided in grib2 format, and converted to individual 6-hour files in flat binary by PPS using the standard wgrib2 utility. The ECMWF model data are computed in 3-hour increments and converted from grib2 format to binary. These binary files are read into IMERG and the appropriate parameters extracted and used to compute the percent probability of liquid phase.
Table 4. Estimates of file counts and sizes used in IMERG for the entire TRMM-GPM era. The letters i, o, t, a, s in “Module Relation” indicate input, output, transfer (between modules or within a module), accumulator, and static, respectively. The numbers in “Module Relation” are keyed to the numbered boxes in Fig. 2. M-T MADRAS is not included in this list due to its short, gappy record.
INTERMEDIATE/STATIC ID # Files Size (MB) Total Size (MB) Module Relation
CORRA-GMI accum
1 1385 1385 a2
GMI-other cal 21 25 525 s2 Surface type 1 52 52 s2 TCI-TMI accum 1 1385 1385 a2 TMI-other cal 21 25 525 s2

IMERG ATBD Version 5.2
25
Table 4, cont.
INPUT ID #
Granules Granularity Granule
Size (MB) Total Size
(MB) Module Relation
AIRS 1 One orbit 11 11 i2 AMSR x 3 3 One orbit 56 112 i2 AMSU x 3 3 One orbit 56 168 i2 ATMS x 2 2 One orbit 56 112 i2 CrIS 1 One orbit 11 11 i2,i4 CORRA 1 One orbit 328 328 i2 GMI 1 One orbit 56 56 i2 GPCC 1 One month 8 8 i11 IR 2 One hour 65 130 i1,t1-4,t1-8 JMA Forecast Tsfc, RHsfc, Psfc
1 forecast run 121 121 i11,i12
JMA Analysis Tsfc, RHsfc, Psfc
1 analysis run
120 120 i11,i12
MHS x 5 5 One orbit 56 336 i2 SAPHIR 1 One orbit 56 56 i2 SSMI x 3 3 One orbit 56 168 i2 SSMIS x 4 4 One orbit 56 224 i2 TCI 1 One orbit 328 328 i2 TMI 1 One orbit 56 56 i2 TOVS 1 One orbit 11 11 i2
OUTPUT
ID # Granules
Granularity Granule Size (MB)
Total Size (MB)
Module Relation
Half-hourly IMERG 1 30 minutes 181 181 o11,o12 Monthly IMERG (Final Run only)
1 One month 58 58 o11
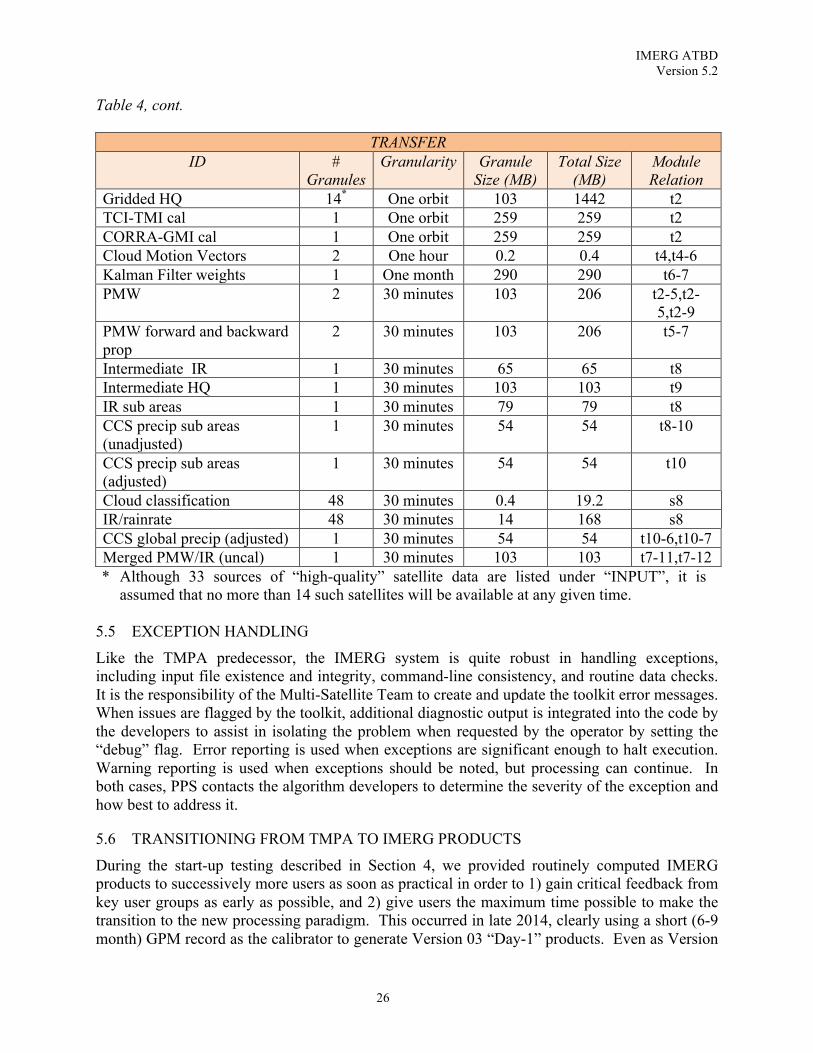
IMERG ATBD Version 5.2
26
Table 4, cont.
TRANSFER ID #
Granules Granularity Granule
Size (MB) Total Size
(MB) Module Relation
Gridded HQ 14* One orbit 103 1442 t2 TCI-TMI cal 1 One orbit 259 259 t2 CORRA-GMI cal 1 One orbit 259 259 t2 Cloud Motion Vectors 2 One hour 0.2 0.4 t4,t4-6 Kalman Filter weights 1 One month 290 290 t6-7 PMW 2 30 minutes 103 206 t2-5,t2-
5,t2-9 PMW forward and backward prop
2 30 minutes 103 206 t5-7
Intermediate IR 1 30 minutes 65 65 t8 Intermediate HQ 1 30 minutes 103 103 t9 IR sub areas 1 30 minutes 79 79 t8 CCS precip sub areas (unadjusted)
1 30 minutes 54 54 t8-10
CCS precip sub areas (adjusted)
1 30 minutes 54 54 t10
Cloud classification 48 30 minutes 0.4 19.2 s8 IR/rainrate 48 30 minutes 14 168 s8 CCS global precip (adjusted) 1 30 minutes 54 54 t10-6,t10-7 Merged PMW/IR (uncal) 1 30 minutes 103 103 t7-11,t7-12 * Although 33 sources of “high-quality” satellite data are listed under “INPUT”, it is
assumed that no more than 14 such satellites will be available at any given time. 5.5 EXCEPTION HANDLING
Like the TMPA predecessor, the IMERG system is quite robust in handling exceptions, including input file existence and integrity, command-line consistency, and routine data checks. It is the responsibility of the Multi-Satellite Team to create and update the toolkit error messages. When issues are flagged by the toolkit, additional diagnostic output is integrated into the code by the developers to assist in isolating the problem when requested by the operator by setting the “debug” flag. Error reporting is used when exceptions are significant enough to halt execution. Warning reporting is used when exceptions should be noted, but processing can continue. In both cases, PPS contacts the algorithm developers to determine the severity of the exception and how best to address it.
5.6 TRANSITIONING FROM TMPA TO IMERG PRODUCTS
During the start-up testing described in Section 4, we provided routinely computed IMERG products to successively more users as soon as practical in order to 1) gain critical feedback from key user groups as early as possible, and 2) give users the maximum time possible to make the transition to the new processing paradigm. This occurred in late 2014, clearly using a short (6-9 month) GPM record as the calibrator to generate Version 03 “Day-1” products. Even as Version
IMERG ATBD Version 5.2
27
03, 04, and 05 processing for IMERG products are carried out, the TMPA products are continuing to be produced to support users who require the long record that the TMPA and TMPA-RT provide. The first retrospective processing for IMERG through the TRMM era (i.e., starting in 1998), is expected to occur in Spring 2018, using GPM Version 05 code to create the final TRMM Version 8 data sets. The TMPA products will continue to be produced for a few additional months to allow a graceful transition. This foresees a shutdown of TMPA processing in mid-2018. Note that TMPA-RT has long used climatological TRMM-based RT calibrations, so the only actual effect of the end of TRMM is the loss of the TMI precipitation estimates in April 2015 in the combined microwave field. The impact on the final TMPA was more serious, since it routinely used the TCI product as a calibrator. When the PR no longer produced useful estimates, in October 2014, we implemented a climatological calibration and accepted the lower quality result in order to maintain continuity. Should too many legacy sensors cease providing data, the TMPA legacy products could degrade to the point that we might choose to end production less gracefully. See https://pmm.nasa.gov/sites/default/files/document_files/TMPA-to-IMERG_transition_180205.pdf .
5.7 TIMING OF RETROSPECTIVE PROCESSING FOR IMERG PRODUCTS
As hinted in the previous Subsection, the decision to retrospectively process the IMERG archive as the result of algorithm changes in one or more input products critically depends on the availability of a completely reprocessed archive of the affected input product(s). In particular, when a general reprocessing is called for in the GPM suite of products, the IMERG products can be started only after the requisite Level 2 GPM products have been finalized and substantially reprocessed, allowing IMERG to apply the upgraded data for calibration and routine use in the products.
6. ASSUMPTIONS AND LIMITATIONS
6.1 DATA DELIVERY In general, the IMERG package is extremely forgiving of dropouts in individual sensors, including the calibrating sensor products and the geo-IR data. Our experience with IMERG is that extended drop-outs are rare for the GMI and DPR (and so CORRA), but serious dropouts have occurred for partner satellites and ancillary data.
6.2 ASSUMED SENSOR PERFORMANCE
The implicit assumption in the IMERG code is that the various PMW datasets are either stable or unavailable. The main impact of data denial is on IMERG quality due to longer runs of morphed data and more-frequent use of IR estimates. What about changes in sensor performance? There is a time-dependent calibration update for the IR-PMW and GMI-CORRA calibrations in both near-real and post-real time. So, if the IR or GMI is drifting, the time-dependent calibrations should account for the problem. However, using climatological GMI-to-everything-else calibrations means a drifting GMI cannot be accommodated. We would be more flexible if we decide to routinely update these GMI-to-everything-else calibrations, since drift in the GMI would be automatically accommodated, but such a modification would require a major development effort. For all sensors, including geo-IR and gauge, variations in the amount of

IMERG ATBD Version 5.2
28
unbiased noise should not automatically bias the results, although the resulting random errors will fluctuate correspondingly.
7. REFERENCES Adler, R.F., G.J. Huffman, A. Chang, R. Ferraro, P. Xie, J. Janowiak, B. Rudolf, U. Schneider,
S. Curtis, D. Bolvin, A. Gruber, J. Susskind, P. Arkin, E.J. Nelkin, 2003: The Version 2 Global Precipitation Climatology Project (GPCP) Monthly Precipitation Analysis (1979-Present). J. Hydrometeor., 4(6), 1147-1167.
Behrangi, A., K. Hsu, B. Imam, S. Sorooshian, G.J. Huffman, R.J. Kuligowski, 2009: PERSIANN-MSA: A Precipitation Estimation Method from Satellite-based Multi-spectral Analysis. J. Hydrometeor., 10(6), 1414-1429.
Behrangi, A., B. Imam, K. Hsu, S. Sorooshian, T.J. Bellerby, G.J. Huffman, 2010: REFAME: Rain Estimation Using Forward Adjusted-Advection of Microwave Estimates. J. Hydrometeor., 11, 1305-1321.
Behrangi, A., G. Stephens, R.F. Adler, G.J. Huffman, B. Lambrigtsen, M. Lebsock 2014: An Update on Oceanic Precipitation Rate and Its Zonal Distribution in Light of Advanced Observations from Space. J. Climate, 27, 3957-3965. doi:10.1175/JCLI-D-13-00679.1
Bellerby, T., K. Hsu, S. Sorooshian, 2009: LMODEL: A Satellite Precipitation Methodology Using Cloud Development Modeling. Part I: Algorithm Construction and Calibration. J. Hydrometeor., 10, 1081-1095.
Ebert, E.E., J.E. Janowiak, C. Kidd, 2007: Comparison of Near-Real-Time Precipitation Estimates from Satellite Observations and Numerical Models. Bull. Amer. Meteor. Soc., 88, 47-64.
Fuchs, T., J. Rapp, F. Rubel, B. Rudolf , 2001: Correction of Synoptic Precipitation Observations due to Systematic Measuring Errors with Special Regard to Precipitation Phases. Phys. Chem. Earth (B), 26, 689-693.
Gehne, M., T.M. Hamill, G.N. Kiladis, K.E. Trenberth, 2016: Comparison of Global Precipitation Estimates across a Range of Temporal and Spatial Scales. J. of Climate, 29, 7773-7795.
Kidd, C., 2018: Algorithm Theoretical Basis Document (ATBD) Version 01-02 for the NASA Global Precipitation Measurement (GPM) Precipitation Retrieval and Profiling Scheme (PRPS). GPM Project, Greenbelt, MD, 16 pp. https://pmm.nasa.gov/sites/default/files/document_files/PRPS_ATBD_V01-02.pdf
Hong, K.L. Hsu, S. Sorooshian, X. Gao, 2004: Precipitation Estimation from Remotely Sensed Imagery Using an Artificial Neural Network Cloud Classification System. J. Appl. Meteorol. 43, 1834–1852.
Huffman, G.J., R.F. Adler, D.T. Bolvin, G. Gu, E.J. Nelkin, K.P. Bowman, Y. Hong, E.F. Stocker, D.B. Wolff, 2007: The TRMM Multi-satellite Precipitation Analysis: Quasi-Global, Multi-Year, Combined-Sensor Precipitation Estimates at Fine Scale. J. Hydrometeor., 8, 38-55.
Huffman, G.J., R.F. Adler, M. Morrissey, D.T. Bolvin, S. Curtis, R. Joyce, B McGavock, J. Susskind, 2001: Global Precipitation at One-Degree Daily Resolution from Multi-Satellite Observations. J. Hydrometeor., 2(1), 36-50.
Joyce, R.J., P. Xie, J.E. Janowiak, 2011: Kalman Filter Based CMORPH. J. Hydrometeor., 12, 1547-1563. doi:10.1175/JHM-D-11-022.1
IMERG ATBD Version 5.2
29
Pierre-Emmanuel Kirstetter, P.-E., N. Karbalaee, K. Hsu, Y. Hong, 2018: Probabilistic Precipitation Rate Estimates with Space-based Infrared Sensors. Quart. J. Roy. Meteor. Soc., in press. doi:10.1002/qj.3243
Krajewski, W.F., J.A. Smith, 1991: On the Estimation of Climatological Z–R Relationships. J. Appl. Meteor., 30, 1436–1445.
Legates, D.R., 1987: A Cimatology of Global Precipitation. Publications in Climatology, Vol. 40, Univ. of Delaware, 85 pp.
Legates, D.R., C.J. Willmott, 1990: Mean Seasonal And Spatial Variability In Gauge-Corrected, Global Precipitation. Internat. J. Climatol., 10, 111-127.
Maggioni, V., M.R.P. Sapiano, R.F. Adler, Y. Tian, G.J. Huffman, 2013: An Error Model for Uncertainty Quantification in High-Time Resolution Precipitation Products. J. Hydrometeor., 15(3), doi:10.1175/JHM-D-13-0112.1, 1274-1292.,
Meng, H., B. Yan, R. Ferraro, C. Kongoli, 2012: Snowfall Rate Retrieval Using Passive Microwave Measurements. 12th Specialist Meeting on Microwave Radiometry and Remote Sensing of the Environment, 5-9 March 2012, Frascati, Italy.
Miller, J.R., 1972: A Climatological Z-R Relationship for Convective Storms in the Northern Great Plains. 15th Conf. on Radar Meteor., 153-154.
Rudolf, B., U. Schneider, 2005: Calculation of Gridded Precipitation Data for the Global Land-Surface Using In-Situ Gauge Observations. Proc. of the 2nd Internat. Precip. Working Group Workshop, 25-28 October 2004, Monterey, CA, 231-247.
Schneider, U., T. Fuchs, A. Meyer-Christoffer, B. Rudolf, 2015: Global Precipitation Analysis Products of the GPCC. GPCC Internet Publication, DWD, 12 pp. Available online at ftp://ftp262-anon.dwd.de/pub/data/gpcc/PDF/GPCC_intro_products_2008.pdf.
Sevruk, B., 1989: Reliability of Precipitation Measurements. Proc. WMO/IAHS/ETH Workshop on Precipitation Measurements, St. Moritz, Switzerland, World Meteor. Org., 13–19.
Sims, E.M., and G. Liu, 2015: A Parameterization of the Probability of Snow–Rain Transition. J. Hydrometeor., 16, 1466–1477. doi:10.1175/JHM-D-14-0211.1
Susskind, J., P. Piraino, L. Rokke, L. Iredell, A. Mehta, 1997: Characteristics of the TOVS Pathfinder Path A dataset. Bull. Amer. Meteor. Soc., 78, 1449–1472.
Tian, Y., C. Peters-Lidard, J. Eylander, R. Joyce, G. Huffman, R. Adler, K.-L. Hsu, F. J. Turk, M. Garcia, J. Zeng, 2009: Component Analysis of Errors in Satellite-Based Precipitation Estimates. J. Geophys. Res, - Atmos., 114, D22104.
Villarini, G., P.V. Mandapaka W.F. Krajewski, R.J. Moore, 2008: Rainfall and Sampling Errors: A Rain Gauge Perspective. J. Geophys. Res., 113, D11102, doi:10.1029/2007JD009214.
Wang, X.L., H. Xu, B. Qian, Y. Feng, E. Mekis, 2017: Adjusted Daily Rainfall and Snowfall Data for Canada. Atmos.-Ocean, 55, 155-168. doi:10.1080/07055900.2017.1342163 Xie, P., S.-H. Yoo, R. Joyce, Y. Yarosh, 2010: A High-Resolution Gauge-Satellite Merged
Global Precipitation Analysis and Its Applications for Model Verifications. WMO 3rd Internat. Conf. on QPE / QPF and Hydrol., 18-22 October, 2010, Nanjing, China.
8. ACRONYMS
AIRS Advanced Infrared Sounder AMSR-E Advanced Microwave Scanning Radiometer – Earth Observing System ATBD Algorithm Theoretical Basis Document ATMS Advanced Technology Microwave Sounder
IMERG ATBD Version 5.2
30
CLIMAT Monthly Climatological Data CMORPH-KF CPC Morphing – Kalman Filter technique CONUS contiguous U.S. CPC Climate Prediction Center CPO Climate Program Office CORRA GPM Combined Radar-Radiometer CrIS Cross-track Infrared Sounder CRU Climate Research Unit DISC Data and Information Services Center DMSP Defense Meteorological Satellite Program DPR Dual-frequency Precipitation Radar DWD Deutscher Wetterdienst DWSS Defense Weather Satellite System ECMWF European Centre for Medium-range Weather Forecasting EPS-SG EUMETSAT Polar Satellite – Second Generation EUMETSAT European organization for the exploitation of Meteorological Satellites FAO Food and Agriculture Organization GCOMW Global Change Observation Mission - Water geo geosynchronous Earth orbit GEOS5 Goddard Earth Observing System model, Version 5 GESDISC Goddard Earth Science Data and Information System Center GIOVANNI Geospatial Interactive Online Visualization ANd aNalysis Infrastructure GEWEX Global Energy and Water cycle Experiment GHCN Global Historical Climatology Network GMI GPM Microwave Imager GMS Geosynchronous Meteorological Satellite GOES Geosynchronous Operational Environmental Satellite GPCC Global Precipitation Climatology Centre GPCP Global Precipitation Climatology Project GPM Global Precipitation Measurement mission GSFC Goddard Space Flight Center G-WADI Water and Development Information for Arid Lands – a Global Network HDF Hierarchical Data Format IMERG Integrated Multi-satellitE Retrievals for GPM IR Infrared JMA Japanese Meteorological Agency JPSS Joint Polar Satellite System KF Kalman filter version leo low Earth orbit LMODEL Lagrangian Model LT Local Time MADRAS Microwave Analysis and Detection of Rain and Atmospheric Structures MERRA2 Modern-Era Retrospective analysis for Research and Applications, Version 2 Meteosat Meteorological Satellite METOP Meteorological Polar Orbit satellite MHS Microwave Humidity Sounder

IMERG ATBD Version 5.2
31
MRMS (NOAA) Multi-Radar Multi-Sensor (precipitation analysis) MTSat Multi-functional Transport Satellite MWI Microwave Imager NASA National Aeronautics and Space Administration NCDC National Climatic Data Center NESDIS National Environmental Satellite Data and Information Service NetCDF Network Common Data Format NEWS NASA Energy and Water Studies program NOAA National Oceanic and Atmospheric Administration NRT Near Real Time NSF National Science Foundation PDF Probability Density Function PERSIANN-CCS Precipitation Estimation from Remotely Sensed Information using Artificial
Neural Networks – Cloud Classification System PLPP Probability of Liquid Phase Precipitation PMM Precipitation Measurement Missions PMW Passive Microwave PPS Precipitation Processing System PR Precipitation Radar REFAME Rain Estimation using Forward Adjusted-advection of Microwave Estimates RT Real Time SAHRA Sustainability of semi-Arid Hydrology and Riparian Areas SNPP Suomi National Polar-orbiting Partnership SSMI Special Sensor Microwave Imager SSMIS Special Sensor Microwave Imager/Sounder SYNOP Synoptic Weather Report TCI TRMM Combined Instrument product TMI TRMM Microwave Imager TMPA TRMM Multi-satellite Precipitation Analysis TOVS Television-Infrared Observation Satellite (TIROS) Operational Vertical
Sounder TRMM Tropical Rainfall Measuring Mission UNESCO United Nations Educational Scientific and Cultural Organization USWRP U.S. Weather Research Program UTC Universal Coordinated Time