nasa goddard space flight center summer 2010 internship shawn doria interactive time-series...
TRANSCRIPT

NASA GODDARD SPACE FLIGHT CENTER SUMMER 2010 INTERNSHIP
SHAWN DORIA
Interactive Time-Series Visualizations
Goal
To research and create a interactive and general purpose
time-series graph for the web in
JavaScript.

Content
BackgroundWork DescriptionWhat I DidResultsConclusion
About Me
Shawn Doria
University of Pennsylvania
Computer Information Science
CCMC – Community Coordinated Modeling Center
David Berrios
Time-Series Graph?
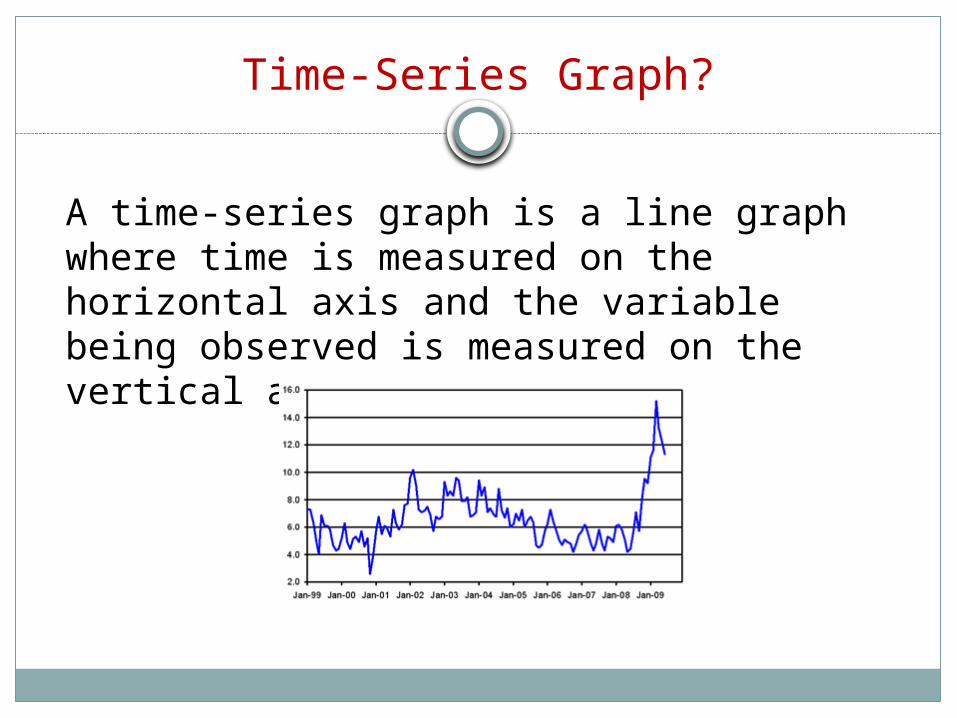
A time-series graph is a line graph where time is measured on the horizontal axis and the variable being observed is measured on the vertical axis.

The Problem
CCMC provides time-series graph of its space weather observation on its iSWA (iNTEGRATED SPACE WEATHER ANALYSIS SYSTEM ) website.
Currently the graphs are created using Flash• It’s not convenient• Needs to install Flash• No XML• Interaction issues

Solution
• JavaScript• Supports JSON (JavaScript Object Notation)• Interactive• Free (or a non-restrictive license)• Cross-platform• Needs to look good
The fix? Create the graphs using cross-browser JavaScript• Speed• Browsers natively support JavaScript• Easy to develop, ship, and maintain
Requirements

Research
Native JSON Support
Cost/License Ease of Dev/Use
Support/ Community
Result
Protovis Yes (+2) Free/BSD (+2) Medium (+1) High (+2) 7
Hicharts Yes (+2) Pay/Private (+0) Easy (+2) Medium (+1)
5
Digraph No (+0) Free/? (+1) Easy (+2) Low (+0) 3
Raphaël Yes with hack (+1)
Free/MIT (+2) Medium (+1) Medium (+1)
5
Processing.js
Yes with hack (+1)
Free/MIT (+2) Medium (+1) High (+2) 6
Many visualization-oriented JavaScript Libraries
Protovis
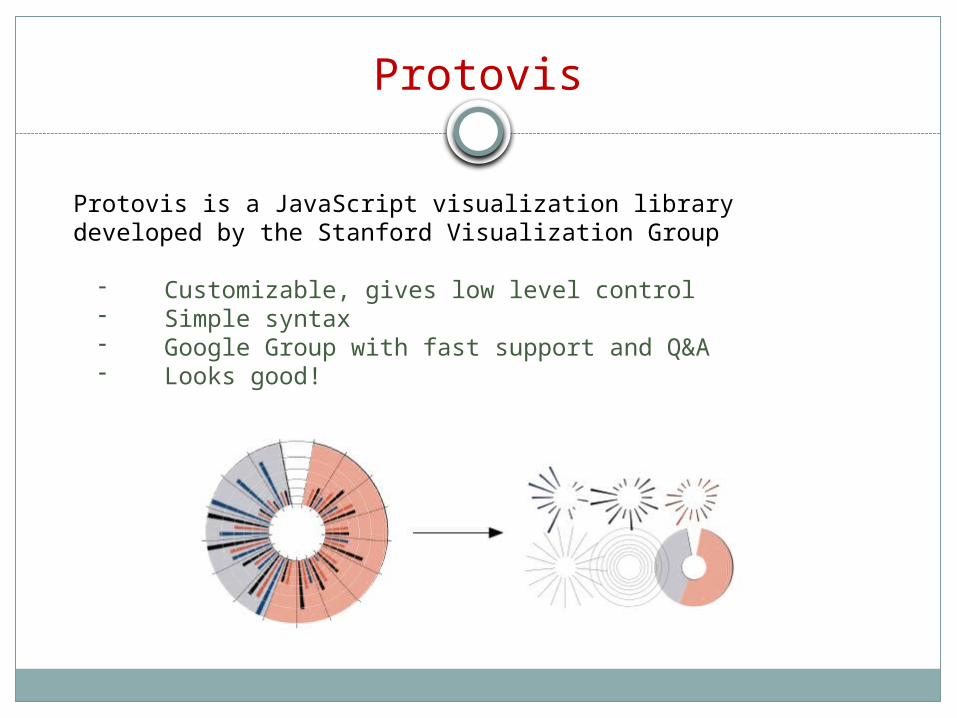
Protovis is a JavaScript visualization library developed by the Stanford Visualization Group
- Customizable, gives low level control- Simple syntax- Google Group with fast support and Q&A- Looks good!

Rest of the Summer…
…were spent learning the Protovis syntax/API and then agonizingly debugging JavaScript errors.
The result?

Result
Special Thanks
David BerriosCCMSStanford Visualization
GroupCori Quirk
Questions?