nasa technical memorandum 89070 finite-element analysis … · 2013-08-30 · nasa technical...
TRANSCRIPT

NASA TECHNICAL MEMORANDUM 89070
FINITE-ELEMENT ANALYSIS OF CORNER CRACKS IN RECTANGULAR BARS
1 S. Raju and J. C. Newman, Jr.
(NA SA -TPI-8907 0) F I N I TE-EL ERE NT B NA LY S I3 OF N87-25602 CORNER CRACKS IN R E C T A N G U L A R B A R S ( N A S A ) 47 p A v a i l : NTIS HC A O 3 / U F A01 CSCL 20K
U n c l a s G3/39 0083878
JUNE 1987
c
Q
https://ntrs.nasa.gov/search.jsp?R=19870016169 2018-07-11T08:12:26+00:00Z

FINITE ELEMENT ANALYSIS OF CORNER CRACKS IN RECTANGULAR BARS
I. S . Raju" and J. C. Newman, Jr. ** NASA Langley Research Center
Hampton, VA 23665-5225
SUMMARY
This paper presents stress-intensity factors for a wide range of
quarter-elliptical corner cracks in rectangular bars. Cracked configura-
tions were subjected to remote tension, in-plane bending, or out-of-plane
bending. The ratio of crack depth to crack length ranged from 0.2 to 2; the
ratio of crack depth to specimen thickness ranged from 0.2 to 0.8; and the
ratio of crack length to specimen width ranged from 0.04 to 0.8. The con-
figurations analyzed varied from a square bar to a very wide plate. These
particular crack configurations were chosen to cover the range of shapes and
sizes that have been observed to grow in experiments conducted on rectangular
bars. The stress-intensity factors were calculated by a three-dimensional
finite-element method. Finite-element models employed singularity elements
along the crack front and linear-strain elements elsewhere. The models had
about 7000 degrees of freedom. Stress-intensity factors were calculated
using a nodal-force method.
The present results were compared with other numerical results for a
quarter-circular corner crack configuration. The present results along the
interior of the crack generally agreed within 3 percent with those from the
literature. Some larger differences ( 3 to 1 3 percent) were observed near
the intersection of the crack front and the free surfaces (in the
*Senior Scientist, Analytical Services & Materials, Inc., 107 Research Drive, Hampton, VA 23666. (work perfomed under contract NAS1-18256.)
**Senior Scientist, Materials Division.
1

boundary-layer region). Thus, analyses were also performed to study the
effect of mesh refinement in the boundary-layer region and the influence of
Poisson’s ratio on the distribution of stress-intensity factors.
L
KEY WORDS: cracks, surface cracks, crack propagation, fracture, stress
analysis, fatigue (materials), stress-intensity factors, finite
elements, boundary-layer region
INTRODUCTION
Corner cracks can occur in many structural components. These cracks can
cause premature failure of landing gear of aircraft, spars, stiffeners, and
other reinforcements which employ rectangular-shaped components.
stress analyses of these corner crack components are needed for reliable pre-
diction of crack-growth rates and fracture strengths.
for Testing and Materials (ASTM) Committee E24 Task Group has also proposed
to include this crack configuration in E740 on Fracture Testing with Surface-
Crack Tension Specimens.
One of the earliest analyses of a corner crack configuration was made by
Accurate
An American Society
Tracey 111. He analyzed a quarter circle corner crack in a quarter-circular
bar subjected to remote tension using a three-dimensional ( 3 - D ) finite-
element method. Tracey obtained the stress-intensity factor distribution for
a shallow crack (ratio of crack depth to specimen radius was 0.2) . Kobayashi
and Enetanya [ 21 used the alternating method to obtain stress-intensity
factors for corner cracks in three shapes (crack-depth-to-surface-half-length
ratios of 0.98, 0 . 4 , and 0.2) . These results were obtained for uniform and
.
2

linearly varying crack-face pressure loadings. Pickard [ 3 ] used 3-D finite-
element analyses to obtain stress-intensity factors for circular and
elliptical cracks in rectangular bars for various values of crack-depth-to-
specimen-thickness ratios. These results were obtained for uniform remote
tensile loading. Newman and Raju [4,5] also used the 3-D finite-element
method to obtain stress-intensity factors for corner cracks for a wide range
of crack shapes and crack sizes in wide plates. They also presented empiri-
cal equations for stress-intensity factors obtained by curve fitting to the
finite-element results and using engineering judgment. The results in refer-
ences 4 and 5 were obtained for uniform tensile and out-of-plane bending
loadings. While the results in references 4 and 5 are comprehensive, stress-
intensity factor solutions are needed for a wide range in plate sizes (from a
square bar to a wide plate). In addition to the two loadings used in
references 4 and 5, the results for remote in-plane bending loading are also
of interest.
This paper presents stress-intensity factors for a wide range of
quarter-elliptical corner cracks in a rectangular bar as shown in figure 1.
The bar was subjected to remote tension, in-plane bending, or out-of-plane
bending loads. The ratio of crack depth to crack length (a/c) ranged from
0.2 to 2 ; the ratio of crack depth to specimen thickness (a/t) ranged from
0.2 to 0.8; and the ratio of crack length to specimen width (c/b) ranged from
0.04 to 0.8. The ratio of specimen width to thickness varied from a square
bar to a very wide plate.
3-D finite-element analysis using the nodal-force method [6-81. The present
results are compared with other numerical results from the literature for a
shallow quarter-circular corner-crack configuration. Analyses were also
Stress-intensity factors were calculated from a
3

performed to study the effect of mesh refinement and the influence of
Poisson's ratio on the distribution of stress-intensity factors in the
boundary-layer region where the crack front intersects the free surface.
a
b
C
F
h
K
Q
sbx
sbz
SYMBOLS
depth of corner crack
width of bar
length of corner crack
stress-intensity boundary-correction factor
half-length of bar
stress-intensity factor (mode I)
shape factor for elliptical crack
remote stress on outer fiber due to bending about x-axis (out-of- plane bending)
remote stress on outer fiber due to bending about z-axis (in-plane bending)
remote uniform tensile stress
thickness of bar
Cartesian coordinate system
Poisson's ratio
parametric angle of ellipse
THREE-DIMENSIONAL FINITE-ELEMENT ANALYSIS
A three-dimensional finite-element analysis was used to calculate the
mode I stress-intensity factor variations along the crack front for a corner
crack in a bar, as shown in figure 1. In this analysis, Poisson's ratio ( Y )
c
4

.
was assumed to be 0.3. In the investigation of the boundary-layer effect,
however, Poisson's ratio was varied from 0 to 0.45.
Figure 2 shows a typical finite-element model for a corner crack in a
rectangular bar. The finite-element models employed singularity elements
along the crack front and eight-noded hexahedral elements elsewhere. The
models had about 7000 degrees of freedom. Stress-intensity factors were
evaluated using a nodal-force method. Details of the formulation of these
types of elements, development of the models, and of the nodal-force method
are given in references 6 through 8 and are not repeated here.
Loading
Three types of loads were applied to the finite-element models of the
corner cracked bar: remote uniform tension, remote in-plane bending (bending
about z-axis), and remote out-of-plane (bending about x-axis). The remote
uniform tensile stress is St and the remote outer-fiber bending stresses
are either Sbx or Sbz. The bending stress Sbx and Sbz are calculated
at the origin of the surface crack (x - y = z = 0 in fig. 1) without the
crack present.
Stress -Intensity Factor
The tensile and bending loads cause only mode I deformations. The
mode I stress-intensity factor K for any point along the corner crack front
was taken to be
where the subscript i denotes tension load (i - t) or bending loads 5

(i = bx The half-length of the bar, h, was chosen large enough to
have a negligible effect on stress-intensity factors (h/b > 5 ) . Values €or
F, the boundary-correction factor, were calculated along the crack front for
various combinations of parameters (a/t, a/c, c/b, and I$ ) . The crack
dimensions and parametric angle, 4 , are defined in figure 3 . Note that the
parametric angle is measured from the x-axis for all crack shapes. The shape
factor for an ellipse, Q, is given by the square of the complete elliptic
integral of the second kind.
or bz).
The empirical expressions for Q (taken from ref. 7) used in this paper
are
Q 9 1 t 1.464(a/~)l.~~ for a/c < 1 (2a)
Q 9 1 t 1.464(c/a)l~~~ for a/c > 1 (2b)
RESULTS AND DISCUSSION
The stress-intensity factors were obtained for corner cracks in bars
subjected to the three loadings: remote uniform tension, out-of-plane
bending, and in-plane bending. For these loading conditions, corner cracked
bars with various crack sizes (a/t) and crack shapes (a/c) were analyzed.
The range of the parameters considered were:
a/t - 0.2, 0 . 5 , and 0.8
a/c = 0.2, 0.4, 1, and 2
c/b 9 0.04, 0.1, 0.2, 0 . 5 , and 0.8
h/b 2 5
For' each of these combinations, stress-intensity factors were obtained
Because of the voluminous results generated from this
The complete
along the crack front.
study, only typical results for each type of loading are shown.
6

results are given Table 1. In all the figures, the normalized stress-
intensity factor, K/[si(~a/Q)l/~], is presented as a function of the
parametric angle, 4 .
Rectangular Bar
Tensile loading.- Figure 4 presents the normalized stress-intensity
factors for a quarter-circular corner crack (a/c - 1) in a large plate (c/b = 0.1). Because the crack shape is symmetric about 4 - n / 4 , the
stress-intensity factors are also almost symmetric. The stress-intensity
factors are slightly larger at 4 - 0 than at 4 - x/2. As expected,
deeper cracks (larger a/t values) produced higher normalized stress-
intensity factors.
Out-of-Dlane bending.- Figures 5 and 6 show the normalized stress-
intensity factors for quarter elliptic corner cracks (a/c - 0.4 and 0 . 2 ,
respectively) in a large plate (c/b = 0.1). At 4 - 0, deeper cracks gave higher normalized stress-intensity factors. However, at 4 - x / 2 , the
stress-intensity factors are lower for deeper cracks. This behavior is
expected because, at 4 - x/2, the crack front is in a lower stress field than that at 4 - 0. A comparison of figures 5 and 6 shows that the lower
a/c ratio caused higher normalized stress-intensity factors at the maximum
depth location ( 4 - n/2) but caused lower normalized stress-intensity
factors at the free surface ( 4 - 0). In-Dlane bending.- Figure 7 shows the normalized stress-intensity
factors for a quarter-elliptic corner crack (a/c - 2) in a large plate (c/b - 0.1). Note that, in contrast to the earlier crack shapes, this crack
shape has the major axis in the thickness direction. Figure 7 shows that
7

larger values of a/t produced larger normalized stress-intensity factors
all along the crack front. There is no appreciable change in the shape of
the stress-intensity factor distribution from shallow to deep cracks.
Because of the large width ( c / b - 0.1), under in-plane bending, the crack experiences a state of near uniform stress. Therefore, the stress-intensity
factors for this case are not vastly different from those due to a remote
tensile loading. Comparison of results from reference 4 with those in figure
7 confirms this observation.
Square Bar
As previously mentioned, the corner-crack specimen is being considered
for inclusion in ASTM E740 on Fracture Testing of Surface-Crack Tension
Specimens. One of the corner-crack configurations being considered is a
square bar (b - t). Some typical results for a square bar with a quarter-
circular corner crack (a/c - 1 and a/t = 0.2) subjected to all three
loadings are presented in figure 8 . In this figure the circular symbols
denote the normalized stress-intensity factors due to remote tension, the
square symbols denote the results due to out-of-plane bending, and the
diamond symbols denote the results due to in-plane bending. As expected, the
tensile loading produced higher normalized stress-intensity factors than the
other loadings. A l s o , all the results are symmetric about 4 = x/4 because
of the symmetric specimen configuration. Comparison of the results in
figures 4 and 8 (c/b - 0.1 and 0.2, respectively) show that the normalized
stress-intensity factors are larger for larger c/b. The results for the
out-of-plane bending can be obtained from those for in-plane bending by
changing 4 to x / 2 - 4 .
8

Comparison With Results From Literature
Figure 9 shows normalized stress-intensity factors calculated by several
investigators for a quarter-circular corner crack in a rectangular bar
(a/t - 0.2) subjected to remote tensile loading. The present finite-element
results are shown as solid circular symbols and equation (27) of reference 4
is shown as the solid curve. Tracey [l] and Pickard [ 3 ] also used the
finite-element method, but the width (b) and half length (h) of their model
were equal to the thickness (see quarter-circular and square configurations
in the insert in fig. 9 ) . Kobayashi and Enetanya [2] used the alternating
method. Their model had an a/c ratio of 0.98 and the width (b) and half
length (h) were large compared to crack length. For all values of v ,
Pickard's results were 1 to 3 percent higher than the present finite-element
results. Part of the difference is due to a width and length effect in
Pickard's model. Near d - 0 and x / 2 , Tracey's and Kobabyashi and
Enetanya's results are 5 to 13 percent higher than the present results. All
results are in good agreement (within 3 percent) at the midpoint ( 4 - 9r/4).
Kobayashi and Enetanya's results [ 2 ] show a drop in the stress-intensity
factor near the ends of the crack (at 4 - 0 and x / 2 ) . This is believed to
be due to the boundary-layer effect at the locations where the crack front
intersects a free surface [9-13]. The present finite-element model with
eight wedges (fig. 2) did not show any boundary-layer effect. The boundary-
layer effect is investigated in the next section by refining the finite-
element 'model and by analyzing the configuration with several values of
Poisson's ratio.
9

Boundary-Layer Effect on Stress-Intensity Factors
This section examines the boundary-layer effect where the crack front
meets a free surface. To study this effect, a semi-circular surface crack
(a/c - 1) in a large bar (a/t - 0.2 and c/b - 0.04) was used. The surface-
crack configuration was chosen because, due to symmetry, only one of the
locations where the crack meets the free surface needs to be analyzed. In
contrast, the corner-crack configuration would require examination at two
locations. However, the boundary-layer effect is expected to be identical
for the two configurations.
Effect of mesh refinement.- Four different finite-element models with 8 ,
10, 14, and 16 wedges between 0 I 4 I n/2 were considered. The 8-wedge
model, shown in figure 2, has 8 equal wedges, each with a parametric angle of
n/16. The other models have non-uniform wedges and were obtained by refining
the 8-wedge model near the free surface. The smallest wedge angles for the
lo-, 14-, and 16-wedge models are n / 6 4 , n/128, and n/256, respectively.
The normalized stress-intensity factors for remote tensile loading obtained
from these four models are shown in figure 10, where the parametric angle is
measured from the free surface (see insert). Except for the 8-wedge model,
the maximum stress-intensity factor occurred very near the free surface (at
4 - n/80 from the free edge). At the free edge, however, the stress-
intensity factor dropped rapidly. The drop-off is most pronounced for the
16-wedge model. The stress-intensity factors in the interior ( 4 > n / 8 0 )
showed little o r no change with mesh refinement. This strongly suggests that
the region 0 I Q I n / 8 0 is a boundary-layer region, where the computed
stress-intensity factors depend on the mesh refinement and, hence, may not be
reliable.
~ ~ ~~
10

Although, as shown in figure 10, the stress-intensity factors show
larger drop-offs at 4 - 0 with further mesh refinement, the peak values were nearly the same as that obtained from the 8-wedge model at 4 - 0 (within about 1.5 percent). Thus, the stress-intensity factors obtained from the
8-wedge model should be interpreted as an average value near the free
surface. Results from the 8-wedge models at 4 - 0 have been successfully
used to predict crack-growth patterns and lives for several surface- and
corner-crack configurations and materials in reference 14.
Effect of Poisson's ratio.- Many investigators have postulated that the
stress singularity where the crack front meets a free surface is different
from the classical square-root singularity and is a function of Poisson's
ratio ( v ) of the material [9-131. To study this, the 16-wedge model was
analyzed with Poisson's ratios of 0, 0.3, and 0.45. (The limiting value of
v -.5 was not analyzed because the three-dimensional finite-element analysis
does not permit the use of this value.) Figure 11 presents the normalized
stress-intensity factors obtained with these three Poisson ratios. For v - 0, the 16-wedge model does not show any drop-off in the stress-intensity
factor at the free surface. But, higher values of Poisson's ratio showed
large drop-offs near the free surface. References 9 through 13 showed that
the power of the singularity has the largest deviation from the classical
square root for v - 0.5. The present results appear to agree with these
findings. Away from the free surface, higher Poisson's ratios gave higher
stress-intensity factors (10 percent difference between results for Poisson's
ratio of 0 and 0.45).
11

CONCLUDING REMARKS
Stress-intensity factors for corner cracks in rectangular bars have been
obtained by a three-dimensional finite-element analysis. The bars were
subjected to remote tension, out-of-plane bending, or in-plane bending
loading. A wide range of crack shapes, crack sizes, and crack-length-to-
specimen-width ratios were considered. Only typical results for each type of
loading are presented in this paper.
For all loadings considered, smaller width bars produced higher
normalized stress-intensity factors than the larger width bars. For tensile
loading, quarter-circular corner cracks gave higher stress-intensity factors
near the free surfaces and lower values in the interior. The maximum
normalized stress-intensity factors occurred at the free surface along the
width direction for cracks with crack-depth-to-length (a/c) ratios greater
than 1 and at the free surface along the thickness direction for a/c less
than 1.
For out-of-plane bending loading, the highest value of the normalized
stress-intensity factor occurred at either end of a shallow crack (low crack-
depth-to-specimen-thickness (a/t) ratios); the location depended on the crack
shape. However, for deep cracks the highest values occurred at the free
surface in the width direction. For bars of large widths, the normalized
stress-intensity factors due to in-plane bending loading are nearly the same
as those due to remote tension.
Stress-intensity factors from the present analysis for shallow quarter-
circular' corner cracks were compared to those in the literature for remote
tensile loading. The present results for stress-intensity factors in the
interior agreed well (within 3 percent) with those obtained by other three-
12

dimensional finite-element and alternating methods. Some differences ( 3 to
13 percent) were observed near the two free surfaces.
A boundary-layer effect exists at locations where a crack intersects a
free surface. In the small region where the crack meets the free surface,
the stress-intensity factors showed a sudden drop. The region in which this
drop occurred has a parametric angle of about n/80 from the free surface.
Smaller mesh refinements gave larger drop-offs. The boundary-layer effect is
more pronounced for materials with larger Poisson ratios. Away from the free
surface, higher Poisson ratios gave higher stress-intensity factors (10
percent difference between results for Poisson's ratio of 0 and 0.45).
The stress-intensity factors given in this paper should be useful in
predicting crack growth rates and fracture strengths, in designing structural
components and in establishing inspection intervals for structures subjected
to cyclic loading.
13

REFERENCES
[l] Tracey, D. M., "3D Elastic Singularity Element for Evaluation of K Along an Arbitrary Crack Front," Int. J. of Fracture, Vol. 9, 1973, pp. 340-343.
[2] Kobayashi, A. S. and Enetanya, A. N., "Stress Intensity Factor of a Corner Crack," Mechanics of Crack Growth, ASTM STP-590, American Society for Testing and Materials, 1976, pp. 477-495.
[3] Pickard, A. C., "Stress-Intensity Factors for Cracks with Circular and Elliptic Crack Fronts - Determined by 3D Finite Element Methods," PNR- 90035, Rolls-Royce Limited, May 1980.
[4] Newman, J. C . , Jr. and Raju, I. S., "Stress-Intensity Factor Equations for Cracks in Three-Dimensional Finite Bodies," Fracture Mechanics: Fourteenth SvmDosium - Volume I: Theory and Analvsis, ASTM STP-791, J. C. Lewis and G. Sines, Eds., American Society for Testing and Materials, 1983, pp. 1-238 - 1-265.
[5
[7
Newman, J. C . , Jr. and Raju, I. S., "Stress-Intensity Factor Equations for Cracks in Three-Dimensional Finite Bodies Subjected to Tension and Bending Loads," NASA TM-85793, April 1984.
Raju, I. S. and Newman, J. C., Jr., "Three-Dimensional Finite-Element Analysis of Finite-Thickness Fracture Specimens," NASA TN D-8414, 1977.
Raju, I. S. and Newman, J. C., Jr., "Improved Stress-Intensity Factors for Semi-Elliptical Surface Cracks in Finite-Thickness Plates," NASA TM X-72825, 1977.
Raju, I. S. and Newman, J. C., Jr., "Stress-Intensity Factors for a Wide Range of Semi-Elliptical Surface Cracks in Finite-Thickness Plates," Engineering Fracture Mechanics, Vol. 11, No. 4, 1979, pp. 817-829.
Hartranft, R. J. and Sih, G. C., "An Approximate Three-Dimensional Theory of Plates with Application to Crack Problems," Int. J. of Env. u, Vol. 8, 1970, pp. 711-729.
[lo] Benthem, J. P., "State of Stress at the Vertex of a Quarter-Infinite Crack in a Half-space," Int, J. Solids and Structures, Vol. 13, 1977, pp. 479-492.
[ll] Benthem, J. P., "The Quarter-Infinite Crack in a Half-space: Alternative and Additional Solutions," Int. J. Solids and Structures, Vol, 16, 1980, pp. 119-130.
[12] Bazant, Z. P. and Estenssoro, L. F., "General Numerical Method for Three-Dimensional Singularities in Cracked or Notched Elastic Solids," Advances in Research on the Strength - and Fracture of Materials, D. M. R. Taplin, Ed., Vol. 3a, Pergamon Press, 1977, pp. 371-385.
14
[13] Solecki, J. S. and Swedlow, J. L., "On the Three-Dimensional Implications of LEFM: Finite-Element Analysis of Straight and Curved Through Cracks in a Plate," ASTM STP-868, American Society for Testing and Materials, 1985, pp. 535-553.
[14] Newman, J. C., Jr. and Raju, I. S., "Prediction of Fatigue Crack-Growth Patterns and Lives in Three-Dimensional Cracked Bodies, " Advances in Fracture Research. Proceedings of the 6th International Conference on Fracture (ICF6), New Delhi, India, December 4-10, 1984.
15

Table 1.- Stress-intensity factors for corner crack in a plate.
a/c - 1.0 ; a/t - 0.2 ; h/b > 5
K/ [ Si (WQ) 'I2 1
c/b 24/.rr TENSION BENDING ABOUT X BENDING ABOUT Z
0.000 0.125 0.25 0.375
0.04 0 .50 0.625 0 .75 0.875 1.000
1.1480 1.1207 1.0865 1.0695 1 .0641 1.0688 1 . 0 8 5 1 1.1185 1.1653
1.0543 0.9956 0.9214 0.8655 0.8234 0.7953 0.7833 0.7894 0.7944
1.0790 1.0556 1.0267 1.0153 1.0164 1.0286 1.0527 1 . 0 9 4 1 1.1268
0. 1
0.000 0.125 0.25 0.375 0 .50 0.625 0.75 0.875 1.000
1.1542 1.1268 1.0923 1.0752 1.0697 1.0745 1.0909 1.1246 1.1516
1.0577 1.0087 0.9372 0.8814 0.8394 0.8115 0.8008 0.8115 0.8270
0.9926 0.9726 0.9503 0 .9471 0 .9581 0.9814 1.0176 1.0709 1.1107
0.000 0.125 0.25 0.375
0 .2 0 . 5 0 0.625 0.75 0.875 1.000
1.1716 1.1436 1.1086 1.0914 1 .0861 1.0914 1.1086 1.1436 1.1716
1.0807 1.0264 0.9527 0.8964 0.8544 0.8270 0.8164 0.8264 0 .8381
0 .8381 0.8264 0.8164 0.8270 0.8544 0.8964 0.9527 1.0264 1.0807

Table 1. - Continued.
a/c - 1 . 0 ; a/t - 0 . 5 ; h/b > 5
K/[Si64Q)1/21
c/b 24/n TENSION BENDING ABOUT X BENDING ABOUT 2
0.000 0.125 0.25 0.375
0.04 0.50 0.625 0.75 0.875 1.000
1.2421 1.2051 1.1582 1.1315 1.1197 1 . 1 2 1 6 1.1383 1.1747 1.2041
0.9863 0.8849 0.7479 0.6313 0.5338 0.4578 0.4066 0.3795 0.3638
1.1659 1.1331 1.0921 1.0716 1.0666 1.0760 1.1004 1.1444 1.1792
0.000 0.125 0.25 0.375
0 . 1 0.50 0.625 0 .75 0.875 1.000
1.2612 1.2232 1.1750 1.1473 1.1348 1.1366 1.1533 1.1903 1.2201
0.9971 0.9052 0.7696 0.6512 0.5523 0.4756 0.4242 0.4017 0.3977
1.0938 1.0637 1.0287 1.0159 1.0205 1.0410 1.0774 1.1334 1.1754
0.000 0.125 0.25 0.375
0.2 0.50 0.625 0.75 0.875 1.000
1.3088 1.2685 1.2174 1.1880 1.1749 1.1770 1.1953 1.2350 1.2671
1.0329 0.9349 0.7959 0.6763 0.5768 0.5001 0.4494 0.4267 0.4192
0.9599 0.9376 0.9140 0.9146 0.9356 0.9749 1.0319 1.1095 1.1669
17

0.
0.000 0.125 0.25 0.375
,5 0.50 0.625 0.75 0.875 1.000
1.5469 1.4920 1.4231 1.3856 1.3735 1.3856 1.4232 1.4920 1.5469
1.1941 1.0842 0.9318 0.8054 0.7047 0.6325 0.5922 0.5856 0.5898
0.5898 0.5856 0.5922 0.6325 0.7047 0.8053 0.9318 1.0842 1.1940

Table 1. - Continued.
a/c - 1.0 ; a/t- 0.8 ; h/b > 5
K/ [ SF (WQ) 1/2 1
c/b 24/% TENSION BENDING ABOUT X BENDING ABOUT 2
0.000 0.125 0.25 0.375
0.04 0.50 0.625 0.75 0.875 1.000
1.4313 1.3649 1.2760 1.2065 1.1856 1.1825 1.2257 1.3008 1.3720
0.9714 0.8151 0.5984 0.4057 0.2391 0.1112 0.0183 -0.0370 -0.0612
1.3460 1.2851 1.2038 1.1424 1.1286 1.1337 1.1835 1.2651 1.3404
0.000 0.125 0.25 0.375
0.1 0.50 0.625 0.75 0.875 1.000
1.4696 1.4001 1.3069 1.2338 1.2107 1.2065 1.2498 1.3264 1.3992
0.9830 0.8352 0.6185 0.4222 0.2533 0.1242 0.0309 -0.0194 -0.0319
1.2877 1.2283 1.1519 1.0979 1.0924 1.1084 1.1696 1.2630 1.3451
0.000 0.125 0.25 0.375
0.2 0.50 0.625 0.75 0.875 1.000
1.5651 1.4888 1.3863 1.3064 1.2802 1.2758 1.3228 1.4064 1.4856
1.0310 0.8747 0.6521 0.4527 0.2821 0.1525 0.0629 0.0103
- 0.0056
1.1799 1.1270 1.0607 1.0200 1.0294 1.0656 1.1474 1.2640 1.3630

0.000 0.125 0.25 0.375
0.5 0.50 0.625 0.75 0.875 1.000
2.075 1.953 1.794 1.677 1.644 1.658 1.752 1.911 2.056
1.2816 1.0998 0.8449 0.5233 0.4434 0.3167 0.2407 0.2193 0.2282
0.9423 0.8946 0.8477 0.8432 0.9025 1.0136 1.1805 1.3989 1.5733
0.000 0.125 0.25 0.375
0.8 0.50 0.625 0.75 0.875 1.000
3.1711 2,8561 2.5007 2.2911 2.2325 2.2911 2.5007 2.8561 3.1711
1.8318 1.5519 1.1950 0.9190 0.7165 0.5990 0.5644 0.6206 0.6982
~
0.6981 0.6205 0.5643 0.5989 0.7164 0.9188 1.1968 1.5516 1.8315

Table 1. - Continued.
c / b 2 w TENSION BENDING ABOUT X BENDING ABOUT Z
0.000 0 .125 0 .25 0 .375
0 . 0 4 0 .50 0 .625 0 .75 0 .875 1.000
0.6157 0 .6480 0.7483 0 .8650 0 .9670 1 .0494 1.1128 1 .1549 1 .1583
0 .5824 0 .5890 0.6508 0.7236 0.7802 0 .8211 0.8503 0.8669 0 .8571
0 .5710 0 .6018 0 .6979 0 .8123 0 .9164 1 .0052 1 .0784 1 .1324 1 .1445
0.000 0 .125 0 .25 0.375
0.1 0 . 5 0 0 .625 0 .75 0 .875 1.000
0.6173 0.6496 0 .7501 0 .8671 0 .9693 1 .0519 1 .1155 1 .1577 1 . 1 6 1 1
0.5805 0 .5850 0 .6471 0.7197 0.7762 0.8169 0 .8461 0.8627 0.8526
0 .5023 0 .5309 0 .6204 0.7308 0 .8373 0 .9351 1 .0226 1 .0939 1 .1189
0.000 0 .125 0 .25 0.375
0 . 2 0 .50 0.625 0 .75 0 .875 1.000
0.6208 0 .6534 0 .7544 0 .8721 0 .9750 1 .0582 1 .1224 1 , 1 6 5 2 1 .1688
0 .5794 0.5998 0.6588 0 .7310 0.7876 0.8288 0 .8584 0.8762 0.8696
0.4007 0 .4256 0.5065 0 .6129 0 .7261 0 . 8 4 1 4 0 .9548 1 .0568 1 .1040
2 1

0.
0.000 0 . 1 2 5 0 . 2 5 0 . 3 7 5
5 0 . 5 0 0 . 6 2 5 0 . 7 5 0 . 8 7 5 1.000
0 . 6 3 4 8 0 .6677 0 .7708 0 . 8 9 1 4 0 . 9 9 7 6 1 .0846 1 . 1 5 3 0 1 . 2 0 0 3 1 . 2 0 6 6
0 .6082 0 . 6 1 6 9 0 .6813 0 .7575 0 . 8 1 7 4 0 .8615 0 .8945 0 .9162 0 . 9 1 0 0
0 .0850 0.1000 0 .1525 0 .2446 0 . 3 7 5 4 0 . 5 4 1 2 0 . 7 3 0 8 0 .9246 1 . 0 3 9 2
22

Table 1. - Continued.
a/c - 0.2 ; a / t - 0.5 ; h/b > 5
K/ [ Si (4Q) 'i2 1
c / b 24/% TENS ION BENDING ABOUT X BENDING ABOUT Z
0.000 0.125 0.25 0.375
0.04 0.50 0.625 0.75 0.875 1.000
0.7905 0.8179 0.9348 1.0796 1.2112 1.3251 1.4196 1.4960 1.5232
0.6602 0.6271 0.6449 0.6737 0.6855 0.6869 0.6876 0.6934 0.6848
0.7386 0.7648 0.8770 1.0187 1.1517 1.2715 1.3757 1.4640 1.4996
0.000 0.125 0.25 0.375
0.1 0.50 0.625 0.75 0.875 1.000
0.7991 0.8264 0.9439 1.0896 1.2219 1.3365 1.4316 1.5085 1.5359
0.6637 0.6288 0.6474 0.6768 0.6891 0.6910 0.6921 0.6981 0.6894
0.6670 0.6911 0.7964 0.9336 1.0687 1.1973 1.3157 1.4210 1.4696
0.000 0.125 0.25 0.375
0.2 0.50 0.625 0.75 0.875 1.000
0.8199 0.8464 0.9657 1.1139 1.2485 1.3654 1.4628 1.5421 1.5706
0.6832 0.6331 0.6566 0.6888 0.7032 0.7068 0.7096 0.7167 0.7059
0.5631 0.5846 0.6805 0.8131 0.9543 1.1002 1.2448 1.3817 1.6529

0.000 0.8913 0.7297 0.2370 0.125 0.9163 0.6972 0.2477 0.25 1.0414 0.7191 0.3148 0.375 1.1999 0.7556 0.4324
0.5 0.50 1.3465 0.7759 0.5926 1.4778 0.7872 0.7922 0.625
0.75 1.5925 0.7997 1.0195 0.875 1.6916 0.8193 1.2565 1.000 1.7322 0.8195 1.4001
0.000 0.125 0.25 0.375
0.8 0.50 0.625 0.75 0.875 1.000
1.0030 1.0180 1.1444 1.3110 1.4689 1.6162 1.7535 1.8825 1.9437
0.8179 0.7762 0.7983 0.8387 0.8638 0.8828 0.9074 0.9443 0.9564
-0.1235 -0.1240 -0.0889 0.0117 0.1905 0.4441 0.7546 1.0937 1.3127

Table 1. - Continued.
c/b 24/% TENSION BENDING ABOUT X BENDING ABOUT Z
0.000 0 .125 0 .25 0 .375
0 . 0 4 0 . 5 0 0 .625 0 .75 0 .875 1.000
1.1608 1 .1641 1.2867 1 .4379 1 .5896 1 .7151 1.8243 1 .9404 2.0645
0 .7965 0 .7184 0 .6810 0.6452 0.5892 0.5198 0.4478 0.4083 0.4142
1 .0949 1 .0979 1 .2160 1 .3646 1 .5176 1 .6495 1.7688 1 .8971 2.0289
0. 1
0.000 0 .125 0 .25 0 .375 0 . 5 0 0 .625 0 .75 0 .875 1.000
1.1909 1 .1923 1 .3154 1 .4675 1 .6198 1 .7453 1 .8545 1 .9715 2.0976
0 .8101 0 .7294 0.6928 0.6576 0 .6021 0.5328 0.4610 0.4219 0.4283
1 .0206 1.0217 1 .1330 1.2777 1 .4324 1 .5732 1 .7069 1 .8533 1.9978
0.000 0 .125 0 .25 0 .375
0 . 2 0 .50 0 .625 0 .75 0 .875 1.000
1.2665 1.2629 1 .3881 1.5437 1 .6994 1.8278 1 .9401 2.0628 2.1962
0 .8490 1 .7529 0.7910 0.6889 0.6358 0.5683 0.4983 0.4616 0.4689
0.9308 0.9278 1.0305 1 .1726 1.3344 1.4943 1.6563 1 .8386 2.0100
25

0.000 0.125 0.25 0.375
0.5 0.50 0.625 0.75 0.875 1.000
1.5776 1.5547 1.6871 1.8629 2.0458 2.2079 2.3632 2.5503 2.7494
0.9977 0.9088 0.8740 0.8479 0.8048 0.7502 0.6978 0.6899 0.7301
0.6471 0.6310 0.7076 0.8448 1.0361 1.2673 1.5340 1.8504 2.1239
0.
0.000 0.125 0.25 0.375
8 0.50 0.625 0.75 0.875 1.000
2.0587 1.9773 2.0948 2.2857 2.5048 2.7242 2.9643 3.2879 3.6232
1.2570 1.1353 1.0898 1.0660 1.0345 I. 0008 0.9829 1.0341 1.1347
0.2744 0.2393 0.2809 0.4105 0.6352 0.9474 1.3342 1.8066 2.2001
26

Table 1. - Continued.
a/c - 0.4 ; a/t - 0.2 ; h/b > 5
K/ [ Si (WQ) 1
c/b 24/.rr TENSION BENDING ABOUT X BENDING ABOUT Z
0.000 0.125 0.25 0.375
0 .04 0.50 0.625 0.75 0.875 1.000
0.7851 0.7819 0.8244 0.8924 0.9620 1.0240 1.0760 1.1184 1.1316
0.7278 0.7031 0.7108 0.7387 0.7665 0.7894 0.8082 0.8237 0.8120
0.7314 0.7293 0.7717 0.8403 0.9128 0.9806 1.0408 1.0928 1.1132
0.000 0.125 0.25 0.375
0 .1 0.50 0.625 0.75 0.875 1.000
0.7883 0.7846 0.8272 0.8954 0.9652 1.0274 1.0797 1.1222 1.1354
0.7733 0.7014 0.7081 0.7378 0.7675 0.7912 0.8105 0.8224 0.8022
0.6572 0.6581 0.7008 0.7707 0.8484 0.9255 0.9985 1.0656 1.0975
0.000 0.125 0.25 0.375
0 .2 0.50 0.625 0.75 0.875 1.000
0.7949 0.7915 0.8345 0.9034 0.9739 1.0370 1.0901 1.1335 1.1473
0.7374 0.7186 0.7269 0.7556 0.7845 0.8086 0.8288 0.8463 0.8461
0.5388 0.5412 0.5843 0.6570 0.7435 0.8365 0.9313 1.0236 1.0736
27

Table 1. - Continued.
a/c - 0 . 4 ; a/t - 0 .5 ; h/b > 5
K/ [ Si ( WQ) 'I2 1
c/b 2d/n TENSION BENDING ABOUT X BENDING ABOUT Z
0.000 0.125 0.25 0.375
0.04 0.50 0.625 0.75 0.875 1.000
0.9498 0.9342 0.9705 1.0389 1.1115 1.1803 1.2430 1.3010 1.3250
0.7602 0.6989 0.6536 0.6265 0.5990 0.5721 0.5520 0.5421 0.5296
0.8919 0.8779 0.9144 0.9836 1.0594 1.1342 1.2051 1.2725 1.3036
0.
0.000 0.125 0.25 0.375 0.50 0.625 0.75 0.875 1.000
0.9622 0.9460 0.9820 1.0508 1.1237 1.1928 1.2560 1.3145 1.3388
0.7692 0.7006 0.6555 0.6290 0.6022 0.5758 0.5562 0.5460 0.5284
0.8148 0.8030 0.8397 0.9101 0.9907 1.0743 1.1574 1.2392 1.2809
0 . 2
0.000 0.125 0.25 0.375 0.50 0.625 0.75 0.875 1.000
0.9908 0.9734 1.0096 1.0794 1.1539 1.2251 1.2905 1.3517 1.3775
0.7794 0.7235 0.6783 0.6517 0.6252 0.5995 0.5811 0.5737 0.5621
0.7030 0.6935 0.7312 0.8051 0.8955 0.9958 1.1016 1.2096 1.2700
28
~

0.000 0.125 0.25 0.375
0.5 0.50 0.625 0.75 0.875 1.000
1.1060 1.0822 1.1178 1.1940 1.2792 1.3654 1.4505 1.5358 1.5770
0.8717 0.8063 0.7593 0.7358 0.7148 0.6975 0.6907 0.6977 0.6942
0.3559 0.3544 0.3944 0.4790 0.6005 0.7546 0.9337 1.1280 1.2514
0.000 0.125 0.25 0.375
0.8 0.50 0.625 0.75 0.875 1.000
1.3102 1.2625 1.2830 1.3587 1.4524 1.5562 1.6698 1.7950 1.8647
1.0138 0.9315 0.8736 0.8484 0.8312 0.8234 0.8330 0.8638 0.8769
-0.0285 -0.0243 0.0155 0.1094 0.2620 0.4707 0.7251 1.0093 1.1995
29

i Table 1.- Continued.
a/c - 0.4 ; a/t - 0.8 ; h/b > 5
K/[si(~a/Q)~/~l
c / b 24/% TENSION BENDING ABOUT X BENDING ABOUT Z
0.000 0.125 0.25 0.375
0.04 0.50 0.625 0.75 0.875 1.000
1.2761 1.2195 1.2182 1.2507 1.3100 1.3718 1.4498 1.5546 1.6630
0.8446 0.7334 0.6179 0.5157 0.4134 0.3206 0.2416 0.1989 0.1929
1.2072 1.1540 1.1545 1.1895 1.2527 1.3211 1.4071 1.5209 1.6348
0.
0.000 0.125 0.25 0.375
1 0.50 0,625 0.75 0.875 1.000
1.3085 1.2491 1.2457 1.2769 1.3355 1.3968 1.4750 1.5811 1.6914
0.8613 0.7430 0.6270 0.5250 0.4228 0.3303 0.2516 0.2092 0.2017
1.1373 1.0863 1.0878 1.1253 1.1937 1.2716 1.3699 1.4985 1.6228
0.000 0.125 0.25 0.375
0.2 0.50 0.625 0.75 0.875 1.000
1.3899 1.3242 1.3165 1.3459 1.4046 1.4675 1.5492 1.6622 1.7802
0.8848 0.7767 0.6589 0.5556 0.4532 0.3613 0.2843 0.2460 0.2466
1.0343 0.9856 0.9882 1.0304 1.1082 1.2033 1.3243 1.4806 1.6247
30

0.5
0.000 0.125 0.25 0.375 0.50 0.625 0.75 0.875 1.000
1.7588 1.6592 1.6301 1.6558 1.7263 1.8169 1.9448 2.1307 2.3175
1.0780 0.9472 0.8159 0.7076 0.6070 0.5247 0.4662 0.4588 0.4880
0.7581 0.7130 0.7176 0.7775 0.8930 1.0560 1.2676 1.5388 1.7700
0.8
0.000 0.125 0.25 0.375 0.50 0.625 0.75 0.875 1.000
2.4137 2.2173 2.1096 2.1053 2.1843 2.3269 2.5512 2.8995 3.2390
1.4182 1.2370 1.0630 0.9345 0.8312 0.7663 0.7463 0.8080 0.9032
0.4104 0.3603 0.3584 0.4359 0.5948 0.8388 1.1595 1.5728 1.9134
.
31

Table 1. - Continued.
a/c - 2.0 ; a / t - 0.2 ; h/b > 5
K/ [ Si ( WQ) 1/2 I
c/b 24/n TENSION BENDING ABOUT X BENDING ABOUT Z
0.000 0.125 0.25 0.375
0.04 0.50 0.625 0.75 0.875 1.000
0.8006 0.7881 0.7568 0.7224 0.6832 0.6406 0.6011 0.5799 0.5860
0.7361 0.7009 0.6377 0.5752 0.5156 0.4612 0.4173 0.3938 0.3975
0.7576 0.7471 0.7195 0.6896 0.6559 0.6192 0.5855 0.5692 0.5778
~ ~~ ~
0.000 0.125 0.25 0.375
0 . 1 0.50 0.625 0.75 0.875 1.000
0.8058 0.7933 0.7618 0.7271 0.6877 0.6448 0.6050 0.5839 0.5900
0.7374 0.7011 0.6376 0.5753 0.5157 0.4615 0.4177 0.3939 0.3946
0.6831 0.6766 0,6552 0.6328 0.6080 0.5806 0.5558 0.5473 0.5607

.
Table 1. - Continued.
c / b 2 4 / n TENSION BENDING ABOUT X BENDING ABOUT Z
0.000 0.125 0 .25 0 .375
0 . 0 4 0 .50 0 .625 0 .75 0 .875 1.000
0.8244 0.8092 0.7742 0.7367 0.6952 0 .6510 0.6105 0 .5890 0 .5950
0.6678 0.5965 0.4836 0.3783 0 .2871 0.2145 0.1635 0.1359 0.1338
0.7806 0 .7676 0 ,7362 0 .7034 0.6675 0.6293 0.5945 0 .5779 0 .5864
0.000 0 .125 0 . 2 5 0 .375
0.1 0 . 5 0 0 .625 0 .75 0 .875 1.000
0.8374 0.8217 0 .7858 0 .7474 0 . 7 0 5 1 0 .6601 0 .6190 0.5973 0.6036
0 .6844 0 .6101 0 .4951 0.3885 0.2957 0 .2224 0.1705 0.1418 0 .1344
0.7274 0.7175 0 .6911 0 .6645 0.6362 0.6062 0.5795 0 .5701 0.5833
0.000 0 .125 0 . 2 5 0.375
0 . 2 0 .50 0 .625 0 .75 0 .875 1.000
0.8746 0.8577 0.8192 0.7785 0.7342 0.6876 0 .6453 0.6235 0.6308
0.7102 0.6347 0.5176 0 .4090 0.3147 0.2396 0.1867 0 .1578 0.1505
0 .6475 0.6403 0.6216 0.6049 0 .5889 0.5725 0.5593 0 .5623 0 .5829
33
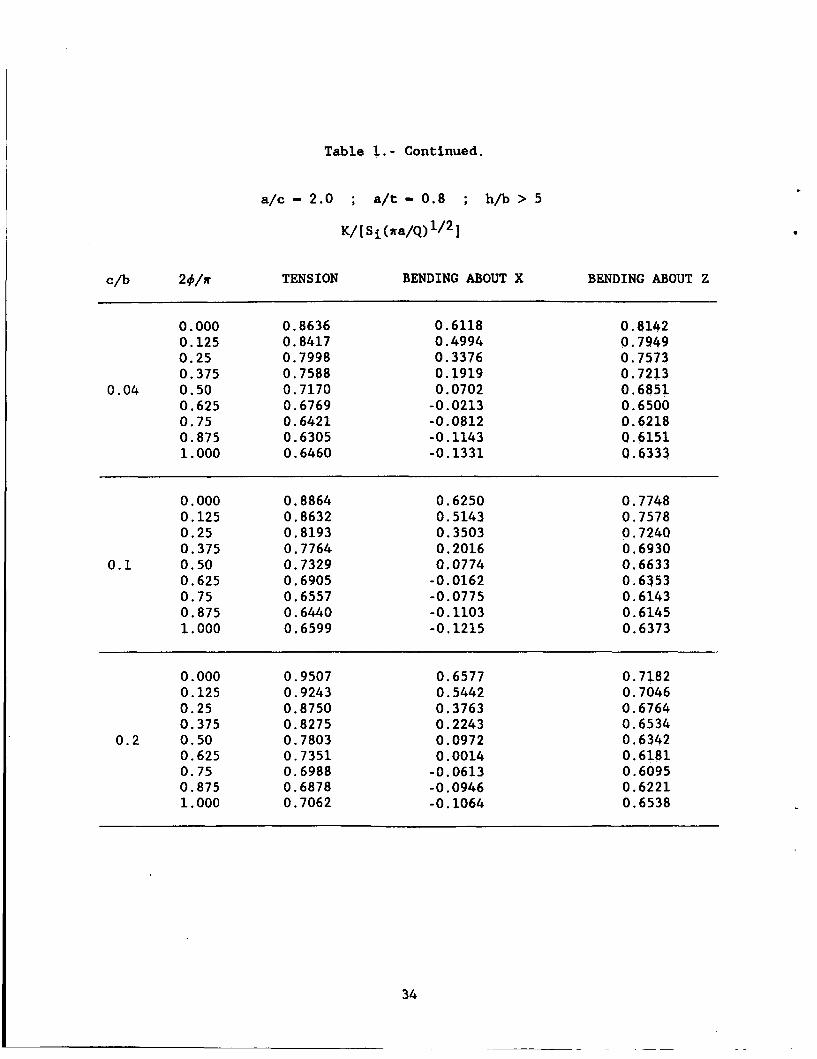
Table 1.- Continued.
a/c - 2.0 ; a/t - 0.8 ; h/b > 5
K/[Si(=a/Q)1/21
c/b 2 4 h TENSION BENDING ABOUT X BENDING ABOUT Z
0.04
~~
0.000 0.125 0.25 0.375 0.50 0.625 0.75 0.875 1.000
0.8636 0.8417 0.7998 0.7588 0.7170 0.6769 0.6421 0.6305 0.6460
0.6118 0.4994 0.3376 0. $919 0.0702 -0.0213 -0.0812 -0.1143 -0.1331
0.8142 0.7949 0.7573 0.7213 0.6851 0.6500 0.6218 0.6151 0.6333
0.000 0.125 0.25 0.375
0.1 0.50 0.625 0.75 0.875 1 * 000
0.8864 0.8632 0.8193 0.7764 0.7329 0.6905 0.6557 0.6440 0.6599
0.6250 0.5143 0.3503 0.2016 0.0774 -0.0162 -0.0775 -0.1103 -0.1215
0.7748 0.7578 0.7240 0.6930 0.6633 0.6353 0.6143 0.6145 0.6373
~ ~~~ ~
0.000 0.125 0.25 0.375
0.2 0.50 0.625 0.75 0.875 1.000
0.9507 0.9243 0.8750 0.8275 0.7803 0.7351 0.6988 0.6878 0.7062
0,6577 0.5442 0.3763 0.2243 0.0972 0.0014 -0.0613 -0.0946 -0.1064
0.7182 0.7046 0.6764 0.6534 0.6342 0.6181 0,6095 0.6221 0.6538
.
34

0.000 0.125 0.25 0.375
0.5 0.50 0.625 0.75 0.875 1.000
1.3239 1.2694 1.1797 1.1043 1.0411 0.9906 0.9605 0.9726 1.0212
0.8358 0.7059 0.5146 0.3449 0.2058 0.1036 0.0402 0.0141 0.0128
0.6132 0.6008 0.5787 0.5749 0.5874 0.6118 0.6486 0.7117 0.7827

.
\
0' 0
/
Fig. 1. - Quarter -e l l lp t ica l corner crack I n rectangular bar.
36

x
x
ai S 0 a 0
I1
S 0
E a c, CI 0 Q
r v) a E n P Y
. I 0 P U a Y V P L V
+ 0
a 0 0 E n 0 Y
a Y V cer L u L aJ c L 0 V
0 c cer aJ V cer e L
L 0 e c
f c,
i aJ
c LL
I
cu a
m c LL
37

x
N
t
A u \ 0 n
Y
+ 0 4 I
x
t
u \ 0
N
n 0 Y
e 0
c 0 c
c
c
c, C
2 I
0
c P,
LL
38

.
I i Fir-
X
0 4 .
00 0
c CCI P =1 V L
v I c aJ
c
0
39

0 .
n
i
fE 0
I
v)
cn LL c

.
c v r ( 0 0
0 .
II II
W N
X
t
T - i . c
m a J n L OaJ e c
0
41

4
(vo II II
0
u n \ \ o u
I
cy 0 -
n I X
t
1.
42
N .
L 0 c L 0 0
V
c r
d6
L 0 - *
em:

x
t
1
II II II II
0 4 - c aJ
E c 0 V
L cer c
I
43

t
cv 0
0
II
0

4
.
=r N O M
VI N
0
0 N
0
VI rl
0
3 rl I
L n 0 .
0
v) c 0 L) L cer c
0 aJ N
cer
0 E
E E 0
c,
E
aJ c c L 0 %
45

Standard Bibliographic Page
1. Report No.
NASA TM-89070 ~~-
2. Government Accession No.
7. Author(s)
19. Security Classif.(of this report) 20. Security Classif.(of this page) 21. No. of Pages U n c l a s s i f i e d Uncl ass i f i ed 46
I . S. Raju and J. C. Newman, Jr.
NASA Langley Research Center Hampton, VA 23665-5225
9. Performing Organization Name and Address
22. Price A03
~ _ _ ~ ~
12. Sponsoring Agency Name and Address
Nat ional Aeronautics and Space Admin is t ra t ion Washington, DC 20546
3. Recipient's Catalog No.
5. Report Date
June 1987 6. Performing Organization Code
8. Performing Organization Report No.
10. Work Unit No.
506-43- 11-04 11. Contract or Grant No.
13. Type of Report and Period Covered Techn i ca 1 Memorandum
14. Sponsoring Agency Code
15. Supplementary Notes
I. S . Raju, Ana ly t i ca l Services & Mater ia ls , Inc . , Hampton, V i r g i n i a . J. C. Newman, Jr., Langley Research Center, Hampton, V i r g i n i a .
16. Abstract Thi s paper presents s t ress- i n tens i t y f a c t o r s f o r a wide range o f quar te r -e l 1 i p t i ca l corner cracks i n rectangular bars. Cracked con f igu ra t i ons were subjected t o remote tens ion, in-p lane bending, or out -of -p lane bending. The r a t i o o f crack depth t o crack l eng th ranged from 0.2 t o 2; t h e r a t i o o f crack depth t o specimen th ickness ranged from 0.2 t o 0.8; and the r a t i o o f crack l eng th t o specimen w id th ranged from 0.04 t o 0.8. The conf igura t ions analyzed va r ied from a square bar t o a very wide p la te . shapes and s izes tha t have been observed t o grow i n experiments conducted on rec- tangul a r bars. f i n i t e -e lemen t method. F in i te-e lement models employed s i n g u l a r i t y elements along t h e crack f r o n t and l i n e a r - s t r a i n elements elsewhere. The models had about 7000 deyrees o f freedom. St ress- i n tens i t y f a c t o r s were cd l cu l a ted us1 ng a nodal - force met hod.
These p a r t i c u l a r crack con f igu ra t i ons were chosen t o cover t h e range o f
The s t ress - i n t e n s i t y f a c t o r s were ca l cu la ted by a three-dimensional
The present r e s u l t s were compared w i t h o ther numerical r e s u l t s f o r a quar ter - c i r c u l a r corner crack con f igu ra t i on . The present r e s u l t s along t h e i n t e r i o r o f t h e crack genera l l y agreed w i t h i n 3 percent w i t h those from t h e l i t e r a t u r e . Some l a r g e d i f f e rences ( 3 t o 13 percent) were observed near the i n t e r s e c t i o n o f t h e crack f r o n and t h e f r e e surfaces ( i n t h e boundary-layer reg ion) . performed t o study the e f fec t of mesh ref inement i n t h e boundary-layer reg ion and t h e i n f l u e n c e o f Poisson's r a t i o on t h e d i s t r i b u t i o n o f s t r e s s - i n t e n s i t y factors .
Thus, analyses were a l so
17. Key Words (Suggested by Authors(s)) Cracks Surface cracks St ress- in tens i ty f a c t Crack propagat ion F in i te-e lements Frac ture Boundary-1 ayer reg ion Stress ana lys i s
F a t i gue (ma t e r i a 1 s ) 18. Distribution Statement
r s U n c l a s s i f i e d - Un l im i ted
Subject Category 39