nasa technical memorandum nasa tm -77396 flow processes in
TRANSCRIPT

NASA TECHNICAL MEMORANDUM NASA TM -77396
FLOW PROCESSES IN OVEREXPANDED CHEMICAL ROCKET NOZZLES. PART 1: FLOW SEPARATION
Robert H. Schmucker
Translation of "Stromungsvorgange beim Betrieb Uberexpandierter ,, Duessen Chemischer Reketentriebwerke. Teil 1: Stromungsablosung, Techniscbe Universitat, Munich (West Germany), Lehrstuhl fur Raumfahrttechnik Report Number TUM-LRT-TB-7 and NASA-CR- 143044, July 3, 1073, pp 1-60.
NATIONAL AERONAUTICS AND SPACE ADMINISTRATION WASHINGTON, DC 20546 JANlIARY 1984
https://ntrs.nasa.gov/search.jsp?R=19840011402 2019-03-28T03:40:27+00:00Z

- . .
. . NDARD TlTLE PAGE
. n '
Robert 'H. Schmucker
9. Prrlormng Orgmizcfion N o m . a d AdCrrrr
Leo Kanner Associates Redwood City, CA 94063
2. $pmsorinj Agency H m r o l d Addrrrr '
gational Aeronautics and Space Admin.
"Stromungsvorgange beim Betrieb Dberexpandierter Dussen I I t * . Chemischer Raketentriebwerke. Teil 1: SEromungsablosung,
Technische Universitat, Munich (WeSt Germany), Lehrstuhl fur 'Raumfahrttechnik , Report Number TUM-LRT-TB-7 and NASA-CR- 1
(N 75- 2601 I) 143044, July 3, (973, pp 1-60
6. X?rtrd;r * An investigation was made of published nozzle flow
separation data in order to de'tep-mine the parameters which affect the separation conditloris. 'A comparison of experi- mental data with empirical and theoretical separat-ion pre- diction methods leads to-the selection.~€ suitable equations f o r the,separation criteribn. predict flow separation of the main space 'shuttle engine.
Sponsored by NASA, U. SL Acgdemy of Sciences .and Deukche Forschungsgemeinshaft. 0
The rqsuLts.were used to - ..
- * ..
..
. \
Unclassified Unlimited
Unclassified Unclassified . *
1 t
FOREWORD
The investigations on "Flow Processes in Overexpanded Chemical Rocket Nozzles" were conducted from March 1972 until February 1973 within the framework of the NRC Resident Research Associateship Program of the National Academy of Sciences (USA) in the Astronautics Laboratory of the George C. Marshall Space Flight Center of NASA (NASA-MSFC), Huntsville, Alabama, USA. My gratitude for their support and encouragement is due to Mr. C.R. Bailey, Scientific Advisor, K.W. Gross, H.G. Paul, Division Chief, and D. Pryor. I
the German Forschungsgemeinschaft (DEG). Since March 1973 these investigations have been supported by
The result of the work is presented in three reports from
1
the Lehrstuhl fur Raumfahrttechnik of the TUM:
Flow Processes In Overexpanded Chemical Rocket Nozzles Part 3- : Flow Sepa..ra.tf-on
Part 2: Side Forces due to Asymmetrical Separation *
Part 3: .Methods for Specific Flow Separation and Lateral Force Reduction.
ii

TABLE OF CONTENTS
Foreword List of Symbols Summary 1. Introduction 2. The Process of Plow Separation 2.1 Pressure Distribution in a Lava1 Nozzle 2.2 Flow Separation Process 2.2.1 Pure Flow Separation 2.2.2 Separation and Recovery of the Flow
Page ii iii 1 2 3 3 8 8 12 13 23
2.2.3 5-2 Separation Phenomena 2.3 Measurement of Separation 2.4 Beginning of Separateon 25 2.5 Separation Criterion 26 3. Experimental and Theoretical Results of Flow 27
Separation 3.1 Experimental Separation Results 3.1.1 Published Experimental Data
27 27
3.1.2 Methods of Graphic Representation 29 3.1.3 Compilation of the Separation Data on Chemical 30
3.1.4 The Influence of Various Parameters on the Separation 31
3.1.5 Summary of Experimental Separation Results 36
Rocket Engines
Behavior
3.2 Experimental Separation Criteria 3.3 Theoretical Calculation of the Separation
36 39
3.3.1 Overview of the Most Important Flow Separation 39 Theories for Rocket Nozzles
3.3.2 Separation Theory of L. Crocco and R. Probstein [8] 40 References 44 Appendix: Prediction of Separation for the Space Shuttle 48
Main Engine
iii

List of Symbols
1.
F K I 1 m M
P r t T U
Y
2.
Y 6
6"
e
I c
8
P
3 .
a C
CL CP e i
P
Latin letters
Thrust Constant Pulse Length Mass Mach number Pres sur e Radius Time Temperature Velocity Coordinate perpendicular to the nozzle wall
Greek letters
Isentropy exponent Boundary layer thickness Com~resslon rhickness Area ratio Nozzle angle Pulse thickness Density
Indices
Environ Combustion chamber Crocco-Lees . Crocco-Probstein Nozzle end Starting point of the recompression zone Plateau point
iv

r Rounding S
sc Separation criterion t Throat vac Vacuum w Wall
S e p ara t i on
V

SUMMARY
In the design of a rocket motor to be operated in alternating counter-pressure, the condition "no flow separation" plays an important role. This requires a corresponding specification of the nozzle wall-pressure distribution. In order to do this, several effects of multi-dimensional nozzle flow are treated and the various phenomena of flow separation in nozzles are described and compared.
An investigation of the various published flow separation data permits the specification of various parameters which affect the separation condition. A comparison of experimental data with empirical and theoretical separation predictiron methods leads to the choice of suitable equations for the separation criterion. The results are applied to the flow separation prediction of the space shuttle main engine.
1
I I
1. Introduction
In the design of a rocket motor to be operated inside the earth's atmosphere, the potential of flow separation in the nozzle plays an important role. This condition can occur during the burn periods of an engine whose nozzle is designed for great altitudes, without diffusor at low altitude, and results during the start-up, shut-down and excess propulsion- throttle phases. Under stationary conditions it is best to prevent flow separation since the location of the separation point of the flow is instable and leads to asymmetrical, oscilla- ting forces which can damage the engine mountings [36].
Flow separation occurs in the supersonic portion of a rocket nozzle when the wall pressure at one point of the nozzle drops to 20 to 50 percent of the surrounding pressure due to over-expansion. Thus, the surface ratio of a given engine is chosen so that the flow does not separate under stationary operating conditions. I
In an engine designed for a maximum power output in a vacuum which is to be ignited at sea-level*, as is the case for the Space Shuttle main engine, the specification of the nozzle opening ratio is affected by two factors. The power output from a rocket engine increases with increasing'opening ratio. Since the nozzle weight will also increase, there exists a point beyond which the power increase Ita-eliminated by the increase in weight. The aspect of flow separation when operating at sea-level limits the opening ratio as well. Thus, an accurate design of the nozzle geometry is necessary. Too conservative a surface ratio leads to an undesired power l o s s .
Initial investigations on flow separation in nozzles were ;conducted by Buchner, Prandtl, Meyer, Flugel and Stanton and published by Stodola [ 25 , 38, 401. After World War I1 the increased research work in the area of rocket engines led to numerous investigations of this problem. Forster and Cowles at the California Institute of Technology undertook the first publicized hot-gas tests with a small nitric acid/anilin motor [13]. in an over-expansion to 40 percent of the surrounding pressure, the flow separates from the wall. This number is often called the "Summerfield Criterion" [3] and is today considered to be a conservative design value [3]. In the meantime, the results of numerous cold-gas tests and various hot-gas tests have been published which confirm the tendency of the measurements of Forster and Cowles.
The result of this work was the separation condition that
-L I\
Similar problems occurred for the Atlas Sustainer Motor and for the 5-2 motor.
2

The rising performance requirements of rocket motors no longer permit the use of the simple Summerfield criterion for nozzle design. One is thus compelled to use more accurate predictions for the separation condition in nozzles in order to achieve a maximum engine power output.
2. The Process of Flow Separation
of experimentally observed phenomea is needed. The question of whether the flow separates in a nozzle depends essentially on the value of the nozzle wall-pressure reached as a function of the surrounding pressure. Thus the pressure distribution in a Laval nozzle will be investigated in more detail at first.
For a treatment of the flow separation process, a description
2.1 Pressure Distribution in a Laval Nozzle i,
Figure 1 presentls’a general Laval nozzle. The wad1 pressure p depends on the state of the combustion gas in the combustion c#amber, the inlet and outlet conditions in the throat, expressed by the radii of curvature rrl and rr2, the local opening ratio c and the nozzle contour. In this case the opening angle : ratio is:
I
I
Fue 1 Nozzle axis chamber
Throat
3

Normally, to simplify the calculation, a one-dimensional flow is assumed as is a constant pressure over the nozzle cross- section [3, 421. For an ideal gas with the isentropic exponent y the relationship between the wall pressure, the chamber pressure
and the opening ratio is obtained as: PC
I 1 y-l
Thus the wall pressure, normed with the fuel-chamber pressure, can be determined for any cross-section ratio. For long nozzles with small divergence angle and large inlet radius, these values agree well with the experimental data [13, 331.
I
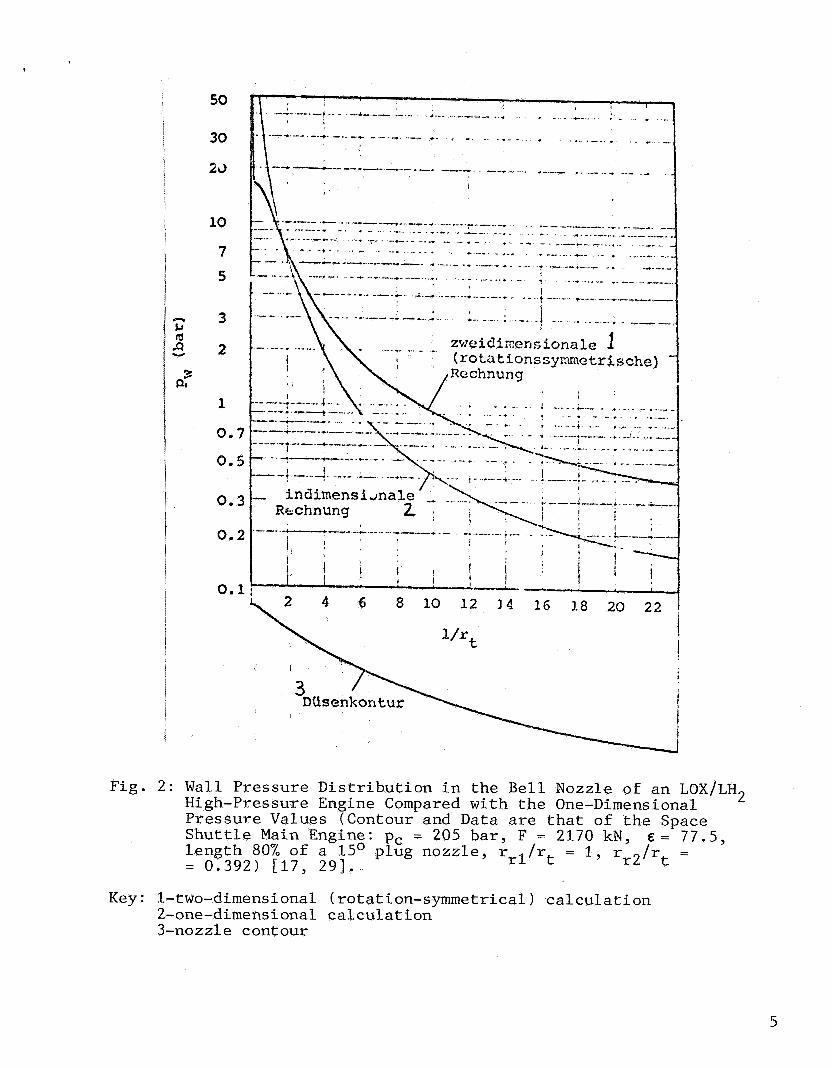
But if the divergenze angle is greater than 10' or if nozzles with curved contours are used, then greater deviations result from the one-dimensional theory, since the pressure distribution is no longer constant over the cross-section. The one-dimensional theory then only gives the average ratios in the cross-section. The trend of the pressure distribution in the nozzle cross-section-- whether the wall pressure is greater or smaller than the one- dimensional pressure--depends on the location of the cross-section relative to the throat and end cross-section. For an accurate calculation of the flow field in the nozzle, methods like the method of characteristics must be applied. In fig. 2 the wall pressure distribution in a bell nozzle of a LOX/LH2 high-pressure engine is shown. Along the axis is also the nozzle contour corresponding to the Space Shuttle main engine. tion of the wall pressure, the following points were taken into account [171:
0 Two-dimensional rotation-symmetric flow field and relaxation
In a calcula-
of the combustion gas (kinetic relaxation) P
0 Mixing ratio distribution over the injector ( 2 0 flow tubes)
o Wall temperature distribution and change of the real contour through compression thickness of the boundary layer
0 Increase in enthalpy of the fuels before injection due to heat addition during cooling.
4
, .
Fig.
Key :
50
30
23
10
7
5
3
2
1
2: Wall Pressure Distribution in the Bell Nozzle of an LOX/LH2 High-pressure Engine Compared with the One-Dimensional Pressure Values (Contour and Data are that of the Space Shuttle Main Engine: pc = 205 bar, F = 2170 kN, length 80% of a 15O plug nozzle, rrl/rt = 1, rr2/rt - = 0.392) [17, 291.
e = - 77.5,
1-two-dimensional (rotation-symmetrical) calculation 2-one-dimensional calculation 3-nozzle contour
5
A s a comparison to this nearly "real" pressure distribution, the one-dimensional pressure values are also listed. It turns out that in the throat region the multi-dimensional pressure drops off much faster than the one-dimensional calculation would indicate. The severe change in the pressure gradient when moving from the throat rounding to the parabolic contour, leads to weak compression jolts. In the wide part of the nozzle, the "real" pressure is about 2 to 3 times greater than the one- dimensional. The wall pressure at the nozzle end corresponds to the one-dimensional pressure at a surface ratio of about 40.
JJ k 5
8
7
6
5
4
3
2
1
0 0 0.1 0.2 0.3 0.4
P (bar)
Fig. 3: Pressure Distribution in the End Cross-Section (Nozzle Contour from fig. 2 )
Key: 1-one-dimensional pressure
Since the wall pressure is considerably greater than the average pressure, the pressure of the core flow must be much less. Figure 3 shows the pressure distribution in the end cross- section of the nozzle of figure 2. The shape of the pressure distribution near the axis is emphasized by the mixing-ratio variation at the injection head.
The pressure distribution at the wall can be influence a change in nozzle contour at constant length and constant expansion ratio. wall pressure distribution for doing this, are shown for a nozzle
In figure 4 various possible contours and the
6
I
I
I
Fig.
Key :
0. 100
0.070
0.050
0.030
0 a 0.020
'5. d 0.010
0.007
0.005 1 2 3 4 S 6 7 8 9 1 0 1 1
'DUsenkontur: zXegcldUse ( 25- 2D Kontur - 3 ~ a o O p t i n a l k o n t u
F r c i s t r a h l k o n tlir
4: Wall Pressure Distribution and Nozzle Contour (Nozzle Length 75% of a 15O Plug Nozzle, E = 27.5, y= 1.2)
l-plug nozzle 2-J-2D contour 3-Rao optimum contour &free jet contour 5-nozzle contour
with 75% of the length of a plug nozzle of 15O and an area ratio of 27.5. The plug nozzle gives the lowest noaaEe end-pressure. In operation behind the nozzle throat, the wall pressure is greater than in a bell nozzle, since the local cross-section ratio is even smaller. Proceeding from an optimum contour (Rao optimum contour) which gives the greatest-possible thrust coefficient in a vacuum for this length and opening ratio, the shape can be changed so that the wall pressure increases in the end cross-section. This increase is obtained through a greater inward curvature of the wall. Although the end-pressure is increased, the thrust coefficient decreases slightly [27]. Through suitable change of the wall curvature radius along the nozzle axis, a pressure increase can be achieved in spite of an expanded contour (J-2D contour).
4'
Therefore, a multi-dimensional expansion must always be used as a starting point in the investigation of separation behavior. The use of one-dimensional computed wall-pressure values can invalidate the results [33].
7

2.2 Flow Separation Process
2.2.1 Pure Flow Separation
The flow field in an over-expanded nozzle with pure flow separation and the pertinent wall-pressure distribution are presented in figure 5.9; This type of flow separation is most frequently observed for chemical rocket engines.
Proceeding from the combustion chamber, the gas expands in the nozzle. If the surrounding pressure is negligible, then the pressure distribution does not change. This pressure should thus be designated as the "vacuum wall pressure." Due to the viscosity a boundary layer forms on the wall. turbulent in rocket engines, only the turbulent flow separation shall be discussed.
Since this is normally
If the surrounding pressure is higher than the nozzle end pressure, then a compression shock is needed to compress the jet to the outside pressure. The boundary layer can only exist in a certain pressure difference, above which it separdtes. In this case the gas jet initially expands in the manner described above up to a point i at which the separation process begins due to a severe pressure increase. The boundary layer thickens and a slanting compression shock is generated which extends deep into the boundary layer. Within a few boundary-layer thicknesses the pressure rises almost to the surrounding pressure and the boundary layer separates off. The separation angle in most experiments is constant at about 13.50 [20]. Downstream the wall pressure increases only a little after the sharp pressure increase, until it almost reaches the surrounding pressure.
This classical picture of flow separation in an over-expanded supersonic nozzle permits the definition of four different (time- averaged) points:
i: At point i the first deviation from the vacuum wall-pressure profile is found. At this point the re-compression of the flow begins, but no separation occurs yet.
Jr The wall pressure distribution, the characteristic points and the various spacings result as time averages of low-frequency wall pressure measurements. This data can be used for a descrip- tion of the separation process and for the nozzle design.
High-frequency pressure measurements show however, that the separation point oscillates within the {separation length. This behavior is discussed in section 2.2.3 and especially in [36] (part 2: Lateral Forces due to Asymmetrical Separation).
8

3 Q4
Umgchurgsdruck pa
s e n k r e c h t c r StoS
r d i chtungsstdfie 7
-ahgeEster
Fig. 5: Flow and Wall-Pressure Distribution in an Over-Expanded Nozzle with Pure F%ow~S$paration. i Beginning of the separation region s Separation point p Plateau point
Key: 1-separation pressure increase 8-separated jet 2-surrounding pressure 9-back-flow 3-nozzle end-pressure 10-boundary layer 4-vacuum wall-pressure 11-throat 5-nozzle axis 12-noz zl e wall 6-perpendicular shock (Mach disk) 13-separation point 7-compression shock
9

s: The flow separates at point s. The location of this point can be determined in cold-gas tests with oil films etc. In hot-gas rocket tests, such methods cannot be applied; thus the actual separation point almost always cannot be determined. Only the deposition of soot [ 4 1 ] or condensation on the wall (see sec. 2 . 2 . 3 ) can provide any information. Between i and s the greatest part of the separation pressure- increase takes place. Cold-gas tests in wind tunnels with steps, incident compression shocks etc. show that more than 80% of the total pressure increase occurs in this region. The spacing between i and s is small and amounts to about 3 boundary-layer thicknesses in cold-gas tests [ Z O ] . The spacing presented in [ 2 9 ] of only one boundary-layer thick- ness deviates considerably from this and is somewhat question- able.
p: At point p the steep pressure gradient of the separation region flattens out. This spot is called the plateau pressure point. The point p is somewhat difficult to define since the pressure gradient never disappears between i and the nozzle end. Between i and p the entire separation
goundary-layer thicknesses [ 2 0 , 291 and is called the separation length.
rocess takes place. The separation amounts to about 6
e: In the region between the plateau pressure-point and the nozzle end cross-section, the final pressure increase occurs. The nozzle end-pressure is somewhat lower than the surround- ing pressure, since the outside air is sucked in due to a back-flow. The pressure increase between p and e is affected by the nozzle shape. For normal nozzles, it is small and increases almost linearly between p and e. In the tests described in [ 2 5 ] with parabolic nozzles, a stronger pressure gradient is found near e and a detailed plateau point. This pressure distribution appears to be caused only by the type of plotting, since the pressure is illustrated not as a function of the nozzle length, but of the surface ratio. In a parabolic nozzle the increase in the surface ratio becomes increasingly smaller with decreasing distance from the nozzle end.
The location of the separation point depends on the combus- tion chamber and surrounding pressure. If the chamber or outside pressure is changed, then only the region of flow separation is shifted. Figure 6 shows the wall pressure measured for a plug nozzle with different surrounding pressures. The wall pressure is normed with the combustion-chamber pressure, since in the individual experiments, the same chamber pressure could not always be attained. The vacuum pressure profile is practically indepen- dent of the pressure within a broad range of chamber pressuae in the normed case. If the surrounding pressure is much greater than the nozzle end-pressure, then the wall-pressure distribution described above sets in and the jet separates off far inside the
10

I
I , i '
I I
1 1 I
I
I
I I
Fig. 6
I
0 . 0 2 5
' 0.020
V I 5 0.015 a
0.010
0 3 4 5 6 7 8 9 30 11 12
Wall Pressure Distribution as Function f the Thr Spacing for Different Pressure Relationships pc/pa
st $ 1 .
Key: 1-vacuum wall-pressure profile 2-beginning of separation (schematic)
nozzle. If the chamber pressure is increased or if the outside pressure is reduced, then the separation region shifts in the direction of the nozzle end. Since the boundary-layer thick- iness increases, the separation region and the pressure gradient decrease.
The location of the first pressure-increase point i is illustrated in fig. 7 as a function of the pressure relation- ship p /pa. tinualfy until finally, the outside pressure and the nozzle end-pressure coincide.
The distance from the nozzle end decreases con-
11

Fig. 7: Distance of the First Point of Pressure Increase i from the Nozzle End, Plotted Against the Pressure Ratio Pc/Pa [41
Key: 1-distance from the nozzle end
2.2.2 Separation and Recovery of the Flow
Normally after the separation of the flow there is no flow recovery. In [ 2 9 , 39, 421 a wall-pressure profile is described which differs from that of pure flow separation. The gas jet expands in the nozzle at lower pressure values than for pure separation. The wall pressure in the separation region sur- passes the surrounding pressure and then drops off to the outside pressure. In figure 8 a pressure measurement of this process is presented. In contrast to pure flow separation where the exhaust jet fills up only a part of the nozzle end cross-section, in the end cross-section no separation from the wall is observed.
This behavior of the nozzle which was already discovered by Stodola [38], is similar to the flow in supersonic tubes with compression shock [37]. Thus, a flow field can be defined which is seen in fig. 9 . The sharp compression shock, generated in the separation region, is reflected at the perpendicular shock. The Mach disk fills almost the entire nozzle cmss-section. The reflection of the shock causes a recovery of the flow so that the nozzle has full flow.
The few available data indicate that this phenomenon can occur primarily in small nozzles with low outlet angle. This configuration is similar to that of a cylindrical tube with supersonic velocity. In a small nozzle moreover, the boundary layer takes up relatively more space than in a large nozzle.
12
av -?% a
I 8
I i 1 0.06 ! 1
0.05
0 . 0 4
0.03
0.02
0.01
0 6 8 10 12 1 4
l/rt
Fig. 8: Wall Pressure Distribution upon Separation and Recovery of the Flow (Cold Gas 5-2 Nozzle, E = 40 [39]).
Key: 1-vacuum wall-pressure distribution
2.2.3 5-2 Separation Phenomena
Low-frequency measurements of wall pressure in a circumfer- ential direction in a 4-k H /LOX motor (NASA-MSFC) and soot deposits E411 show that in $he case of pure separation, the separation line runs rather axis-symmetrical in a time-average.
The visual observations of the interior of the nozzle of 5-2 engines gave a picture which deviates significantly from this. This optimistic description of the separation process is possible in a 5-2 engine since the exhaust jet of an LH2/LOX engine is transparent and cryogenic cooling of the nozzle leads to condensa- tion on the wall. Instead of a smooth separation line, triangular- shaped tepees are observed which change position in the circum- ferential direction and along the nozzle axis at low frequency. Figure 10 presents a cross-section through a 5-2 engine and these phenomena are illustrated schematically. This figure also indicates the camera position to observe the separation phenomena. Figure 11 shows a photograph of the nozzle interior with the significant phenomena also entered.
13

3 l a
- s e n k r e c h t e r Stof3 4 (Mach d i s k )
I I
Vexdichtdngs- 4 stof3
Fig. 9 : Schematic of the Wall-Pressure Distribution and of the Flow Field in a Nozzle with Separation and Recovery
Key: 1-surrounding pressure 7-boundary layer 2-vacuum wall pres sure 3-nozzle axis 9- throat 4-perpendicular shock 1 0-noz z l e wall
(Mach disk) 11-separation 5-reflected compression shock 12-flow recovery to the wall 6-full-flowing nozzle 13-recirculation
8-compression shock
14

5-2 Triebwerk
Turbinenabgase bei 2 Norrnalausftihrung (keine Vexwendung bei Ablosungstests)
dreiecksfarmigen 3
t dreiecksfaxmiyer 4
ungscrscheinungcn
ung (Tepees)
!
I \, \
'Abgass trahl
\ ',
I (durchsichtig) i
s Filmkamora zur Beobachtung der Ahlosungscx- scheinungen
Fig. 10: Schematic Illustration of the 5-2 Engine with the
Key: 1-5-2 engine 5-film camera to observe the 2-turbine exhaust of normal separation phbnomena design (not used for 6-turbine exhaust inlet openings separation tests) 7-triangular separation (Tepee)
3-no triangular separation 8-exhaust jet (transparent) phenomena
4-region of triangular : separation (Tepees)
Observed Separation Phenomena
The 5-2 unit is a 1000 kN LH2/LOX engine whose combustion chamber and nozzle are made of 360 and 540 thin-wall tubes. At an area ratio of 12.5 (J-2D) the turbine exhaust is normally blown into the nozzle under normal operation. During the separa- tion tests, the turbine gases were ejected to the outside through a tube to the side of the engine (fig. 11).
15

, I
i 6
Fig. 11: Separation Phenomena in a 5-2 Engine (Saturn S-I1 and S-IV Stage)
Key: 1-nozzle wall 6-marking in the nozzle to 2-turbine exhaust inlet measure the separation
3-nozzle edge 8-slant compressing shock 4-shifted, slanted com- 9-perpendicular shock
5-inflow of surrounding air
openings 7-condensation
pression shock 10-turbine exhaust tube
16
zwn Injektor I
jTurbinenabgase in- laR8f f nungen \
Wandtemperatur vm 2
DGsenwand
6
3 Kiihleinlal3 f u r LH2
I
Umkehrung 5 a! w - Dci s enende
Fig. 12: Schematic of the Turbine Exhaust Blow-in Openings (Cat Eyes) Key: l-to the injector 5-reversal at the nozzle end
7-turbine exhaust inlet openings 2-nozzle wall 6-wall temperature 3-cooling inlet for LH2 4-nozzle wall 8-cooling tubes
I 40 50 60 70 80 90
PC (bar)
Fig. 13: Number of Triangular Peaks as a Function of the Chamber Pressure for J-2s Engine [ 1 2 ] .
1 7

In figure 1 2 the turbine exhaust blow-in position is shown schematically. By increasing the number of tubelets from 360 to 540, triangular slits (Cat Eyes) result which interrupt the wall along a distance of about 10 cm. In several separation tests these openings were sealed with sheet-metal triangles and ablation material, without decisively changing the optical separation picture. In this turbine exhaust inlet region the wall temperatures change very much. They drop by about 300 K in the direction of the nozzle end; due to the feed of coolant the temperature in the circumferential direction is not constant (temperature calcula- tion as per [ 2 7 ] 1 . The temperature of the uncooled blow-in openings might reach 1000 K since several sheet-metal triangles sealing the openings were blown out during the tests.
The phenomena occurring in the different experiments (J-2s engine gut: Rocketdyne [ 1 2 , 141 , J-2D engine at NASA-MSFC) can be characterized as follows:
0 Optical Separation Observations:
The triangular-shaped separation phenomena are onLy observed in the region between Cat Eyes and nozzle end. The suction of surrounding air, the condensation of water vapor on the nozzle wall and a wedge-shaped compression shock whose divergence angle increases in the direction of the nozzle end, are seen. For a fixed combustion chamber pressure, the triangular peaks extend only up to a certain maximum position in the nozzle. This distance depends on the combustion chamber pressure, just like the number of triangles. Figure 13 shows the number of tepees as a function of the chamber pressure.
The evaluation of high-speed film indicates that the phen- omena occur periodically. If three sequential tepees are considered, then the middle triangle increases when the other two decrease, and vice-versa. The frequencies and shock life-span of these processes are presented in table 1:
Table 1: Frequency of Triangular Phenomena in the 5-25 Nozzle [14] Combustion Mixing Life-span Frequency chamber ratio (ms) (Hz) pressure (bar) LOX/LH2
' 62 - 65 4 . 4 - 4 . 5 85 - 90 10.5 - 11 59 - 60 4.3 105 9.6
10.5 - 15 5 1 - 56 4.4 - 4.8 65 - 95
18

0
% a
0.030
0.020
0.010
0,008
0.006
0 . 0 0 4
L Turbinenabgas- einlaf3offnungen.
I
2 3 Turbincnein laa offen
_ _ * _ . _ _ * - TurbineneinlaB geschlossen -f -- - - -
2 4 6 8 10 3.2 1 4
Fig. 14: Wall Pressure Measurements of the J-2s Experiments [12, 141 ----- Turbine inlet openings open
closed I 1 I t 11
Key: l-turbine exhaust inlet openings 3-turbine inlet closed 2-turbine inlet open 4-theoretical wall-pressure
profile
0 Measurements of Wall Pressure:
The measurements of wall pressure to determine the flow separation exhibit several anomalies. In the experiments where the turbine inlet is not closed, theoretical and experimental wall pressure do not agree. The experimental wall pressures are greater than the calculated ones; with decreasing chamber pressure, this difference increases. Tests with the same unit and closed turbine exhaust openings indicate a wall pressure which is less than the theoretical, however the measurement accuracy is not very great. 14 shows the wall-pressure distribution of these tests. Some comments are in order for the pressure deviations. All model tests produce wall pressures which agree with theory; the J - 2 D NASA-MSFC measurements also lead to agree- ment between theory and experiment. Lower wall pressures than the theoretical are presented in [22] and are explained by compression shocks behind the throat.
Figure
One can attempt to explain the optical phenomena by high- frequency measurements of wall pressure. Figure 15 shows the chronological wall-pressure profile for rising combustion- chamber pressure during the start-up phase. Time is counted from the switch-on point.
19

h k m a U
3 a
l e 2 I
. .-. .. . . - - .. ..- ..- - 1.0 I - - ' -
Fig. 15: High-Frequency Wall-Pressure Measurement During the Start-up Phase of the J-2D Engine (Wall Pressure and Contour see fig. 4 : I/rtmeas. Pt, = 7.8)
theoretical P V I
5 . 5 5 .G 5.7 5 . 8 5.9 6.0 6 . 1
t (SI
Fig. 16: Measurement of Wall Pressure During Operation of the J-2D Engine (l/rt = 7.8, pc = 46 bar)
The transition from separated flow to full-flowing nozzle shows up. Pumping off the measurement point occurs by oscilla- tion and oan be explained by vibrations of the separation point (see [36]). The low-frequency vibrations are at 30 Hz and do not correlate with the frequency of the tepees or engine structure vibrations. Wall pressures at other places and especially farther downstream (l/r = 8.2 and l/r = 9 . 1 ) show the same behavior. Although the f ifm recordings skow triangular separations which would have to lead to severe oso2llations in the wall-pressure measurements, the amplitudes of the oscillations are only 0.03 bar. Figure 16 shows the wall-pressure profile of the above measurement point at a later time. evident correlation between pressure oscillations and triangular phenomena.
The measurements of wall pressure show no
20

To clarify the optical phenomena and the wall-pressure anomalies found in the first 5-25 tests, different interpreta- tions were proposed which pertained primarily to the following points:
0
0 Nozzle contour changes due to Correlation between injector and separation picture
0 Pressure 0 Temperature 0 Vibrations 0 Boundary layer
0 Three-dimensional bound :try layer due to the tube construction
0 Disturbance of the wall contour due to of the nozzle wall
0 Turbine inlet openings 0 Wall temperature differences in the circumferential
direction 0 Boundary layer changes due to
0 Chemical reaction 0 Laminari zat i on 0 Long separation region
0 Condensation shock at the wall due to subcooling.
Until now no final clarification of the optical phenomena and the wall-pressure behavior has been given. But the observed phenomena and the measurements of others lead to the following summary points:
0 The separation line oscillates asymmetrically within a certain region and can onlybeviewedas nearly symmetrical as a time average [ 3 6 ] . The possibility of a purely two-dimensional (rotation-symmetric) separation process is considered doubtful by others.
0 The triangular-shaped separation phenomena and the attendant conical compression shocks are generated by the instantaneous separation from one point. The divergence angle of the separation triangle increases in the direction to the nozzle end since the vacuum wall-pressure drops (intensification of the sharp shock-compression).
0 The optical phenomena represent not only the oscillation of the separation point. They are affected by additional influences (and their regularity is enhanced). Condensation and stationary heat transfer to the wall do not set in
2 1

instantaneously, rather, they need a certain time (see fig. 11, shifted, slanting compression shock). Therefore the fre- quencies of the optical phenomena and of the wall-pressure jumps are not the same. The regularity of the separation triangle can be compared with the deformation of a thin-wall nozzle upon separation. The bulging of a nozzle cone illustrated in [44] can generate minor changes in wall contour, similar to the 5-2 engine. Such vibrations (waves in a membrane) can explain the per5odic sequence of three tepees side-by-side (fig. 46 in [12]).
0 At a fixed combustion-chamber pressure, the position of the first point of pressure increase coincides with the location of the triangular peaks.
0 At a particular combustion-chamber pressure, the lateral forces are very small and the nozzle has full flow (defini- tion of the "separation beginning" is found in sec. 2.4). In spite of this, small separation t/ angles show up near the nozzle end. these triangles decrease in size in accord with the shift of the point of pressure increase in fig. 7.
With increasing combustion-chambe,r pressure,
0 The optical phenomena.extend only up to the turbine inlet since above this, in the direction to the throat, the wall temperature is too high for condensation to occur.
0 The measurements-of wall-pressure se aration give an average separation behavior which agrees wel? with the other, larger rocket motors. These were stationary measurements in the 5-2s engine with closed turbine inlet openings, extrapolated data of the measurements of the 5-2s engine with open Cat Eyes and instationary pressure measurements during the start-up phase of the J-2D engine.
The wall-pressure anomalies are probably generated by open turbine-inlet openings since closing the openings nearly confirms the differences between theory and experiment. These phenomena thus should not be considered in investiga- tions of separation.
0
These findings permit the supposition that the processes observed in the 5-2 engine are found in more or less similar, pronounced form, for other rocket engines. Since in these cases an optical observation of the dynamic character of the separation process is not possible (since the exhaust jet is normally not transparent and the wall temperature is not low enough for con- densation to occur, and the measurements of wall pressure are normally of low frequency), the 5-2 phenomena cannot be determined. But in a chronological average, the 5-2 observations agree with the processes described in sec. 2.1 on pure separation.
22

,
Thus in an investigation of the separation process, one must always decide whether the dynamic character (side forces) or the quasi-stationary behavior is of interest. The latter permits the design of a nozzle under consideration of flow separation.
2.3 Measurement of Separation
To determine the separation behavior of a rocket nozzle, pressure measurements must be used. Optical observations of the exhaust jet can only provide guidelines. In an experiment an attempt is made to measure the pressures pi and p as a function of the engine and environmental conditions. photograph of a small rocket motor (4k H2/LOX NASA-MSFC engine) with 21 wall-pressure probes.
Figuge 17 shows a
Fig. 17: Test Set-up for Measurement of Separation on the 4k H2/LOX Engine of NASA-MSFC.
Experimental data are fhlsified by measurement error. To determine the wall-pressure profile, only a limited number of pressure probes i w available. Therefore, the- presisure pi at which the first deviation from the vacuum wall-pressure profile occurs, cannot be determined exactly. The same applies to a much greater extent for the plateau pressure. Fi ure 18 shows different measurements of pressure of the 4k H2 7 LOX engine. The normed pressures during the test without separation show good agreement; the smaller deviations are caused by the accuracy of the probes and amplifier, combustion- chamber pressure error and wall and measurement-hole disturbances. The measurement of wall pressure in the case of separation agrees well with these wall-pressure values, up to the point of separation.
23

p a 4
17 18 19 20 21 22 23 24 25
Fig. 18: Wall Pressure Distribution in the 4k H /LOX /Engine (NASA-MSFC). Test 268/023 (p = 42.4 gar
Te s t 2 6 8 /019-0 22
~ e y : l-region of wall-pressure distribution 1
Between the 4th and 5th measurement point there is the pressure increase; the wall pressure in the separation region also exhibits a dependence on the operating time.
The scattering of pressure data and the limited number of measurement probes permit the entry of a region of possible wall-pressure distribution w5thin which the correct pressure profile must lie. The minimum wall pressure can only be read off to 0.02 bar accuracy; this is about 6% of the absolute value. A determination of the plateau pressure is practically impossible.
This shows that in all flow separation tests on rocket nozzles, the minimum wall pressure pi can only be determined within an accuracy of 5 to 10%. In many experiments, this value is even exceeded [43]. It is useful to perform a test without separation in order to have a reference pressure dis- tribution which can be used to better determine the minimum point. The plateau pressure is almost impossible to determine.
ik
An elegant method of compensating at least in part for the limited number of measurement points, is found in [33]. If the combustion chamber pressure or environmental pressure is quasi-stationary, then by means of the time behavior of the wall pressure it is possible to know when the minimum pressure is reached at a measurement point.
J;
24

2.4 Beginning of Separation
With increasing combustion-chamber pressure or with decreas- ing environmental pressure, the separation region shifts in the direction of the nozzle end. This relation is shown in fig. 7 . In this case the region of back-flow becomes increasingly smaller until finally, the separation zone arrives at the end cross-section. Then the separation point is located in the immediate vicinity of the nozzle end. A slight increase in the pressure ratio leads to a full-flowing nozzle and the separation takes place in the end cross-section. This condition is called the 'Ibeginning of separation." It denotes the boundary value from which a flow separation can be expected for a falling pressure ratio. In this case the slanting compression shock arrives near the end cross-section and the minimum pressure is reached before the nozzle end since the compression region is several boundary- layer thicknesses long. If the jpressure ratio is increased-- groceeding from the beginning of separation--then no qualitative changes take place to the flow and wall-pressure picture. The flow is compressed only in the boundary layer at the no,zzle end, without any separation in the actual sense. Since the increase in wall pressure is similar to that of flow separation, this phenomenon is often confused with the actual separation. Thus, this phenomenon is called the "nozzle-end effect" in [29].
To determine the wall pressure at which the beginning flow separation occurs, let us plot the minimum wall pressure against the pressure ratio pc/pa. 6 and 7 are entered accordingly in fig. 19. With increasing pressure ratio, the minimum wall pressure decreases. This is the-region of flow separation in the nozzle. If the separation- region is near the nozzle end, then pi obtains a flat minimum. This pressure corresponds to the condition of beginning-separation defined above. Since a larger region of the pressure ratio is overlined where the initial separation pressure is reached, the pressure ratio of beginning separation can hardly be deter- mined with any accuracy from fig. 19. The minimum wall pressure exhibits a hysteresis effect, particularly in the region of beginning separation. It depends on the direction of the com- bustion-chamber pressure change and is generated by friction, separation and recovery [29, 411. The above measurement errors are not insignificant and likewise contribute to a band of minimum wall-pressure values. A general statement about the width of this scattering band is not possible (see also 3.1.4). If pc/pa is further increased, then the minimum pressure also increases since no flow separation will occur, until finally, the environmental and nozzle-end pressures coincide.
The measured values of figures
25

w
30 50 70 10'3 200 500 1000
kcine A b 1-6 s un g
Y - Stramungsab- lasung
tibcrcxpandicr tc D3isen- S tr6nung
Fig. 19: Minimum Wall Pressure as a Function of the Pressure Ratio
Key: 1-hysteresis &flow separation (from measurements by [41).
2-beginning sepa'ration 5-over-expanded nozzle flow 3-no separation
2.5 Separation Criterion
An important question in the design of a nozzle is the minimum value of the vacuum nozzle end-pressure pe no flow separation occurs. This value depends on environmental pressure. describes the condition "no flow separation," we have:
at which the vac
With the separation criterion Ksc which
P > Pa *sc %ac ( 3 )
Ksc depends on the various nozzle parameters. and the outside pressure, then a nozzle geometry must be chosen which satisfies (3).
If we know Ksc
The condition "no flow separation'? is the boundary case of beginning separation. If the width of the separation region is neglected, then we can write:
26

a I beginning separation Kgc must be determined by theoretical laws or experimental data. Since in most tests only the minimum wall pressure is determined for several pressure relations and thus the beginning separation is not available, the following simplifying separation criterion must be used:
pi 2 - Ksc
, separation (5)
The difference between ( 4 ) and ( 5 ) is the difference p,-pp, the increase from plateau pressure to the nozzle end-pressure contained in (5). Since p and pe are. approximately equal, ( 5 ) gives sufficiently accerate values within the range of measurement accuracy.
3. Experimental and Theoretical Results of Flow Separation
To design a non-separating nozzle in counter-pressure, the separation criterion is needed. Experimental and theoretical separation data can be used for this. laws are based on data obtained in tests, one must always rely on the separation experiment.
Since all theoretical
3.1 Experiemntal Separation Results
The use of experimental separation results requires the conversionlof test data to the desired engine. This leads to several questions: How similar must the engine be in comparison to the new motor so that the data can be applied to real equip- ment, and what conversion laws must be applied? Therefore, one must know which factors affect the flow separation and what effect they have on the separation criterion. This can only be deter- mined experimentally by comparing the separation results of numerous motors.
3.1.1 Published Experimental Data
Experimental separation data from chemical rocket motors are available from about 14 different places. In table 1 the sources and most important engine parameters are presented. In [35] there is a table of the separation data.
Several comments on table 1 and on the different measurements are needed. In table 1 there are no separation data from engines with solid propellants. Some results are presented in [23].
27

Table 1: Presentation of the Most Important Sources of Experimental Separation Data in Chemical Rocket Engines and Pertinent Engine Data
. 0 rorntcr und Coulee (JPL) ilfl
0 Blaatler and Mitar- belter (f;ASA-Levin
k3 0 Sunnley and P c r r l -
man (i3rlatol- S l d d l r y ) [ S f l A t l a s - S u a t a l n c r
0 S a t u r n 5-25. Trleb- &erk (Rocbetdyne)
S a t u r n J-?O T r l e b - 19wcrk (Hockotdync)
NASA-WSFC Datcn 0 J-2D 14odcl l t r ieb-
%crk (Rockctdync)
0 43
0 ,3Rt10 Trlctverk P r a t t i W i thncy) b j J
LL NhSA-YSFC 4-k I?~TrleLvcrt
4 HN03/Ani? i n
S OZ/Banzln
s
f H202/8cnzin
U)X/uenzi n
wx/Ln2
tozfin,
mx/Ln2
L0X/Lfl2
L?3X/Lr12
LoX/LH2
I/)X/LI12
2 T r e l b s t o f f p, nom pnotr
(bar ) (ktr) 20 3.3
22 13 *
37 22 37 89
4 0 270
82 1200
45 1ooc)
45 18
20 67
20! 44
34
68
c B Y T to)
10 15 g r 20 15 10 10 10 20 10 30 50 1 0 q r 42 25 75 25 60 ‘0
10 17 r r 14 17 r r
25 15 r r
4 0 g r k
27.5 g r k
21.5 g g r
60 g r k
0.9 35 b r 35 e3
18 2 0 18 g u
259 b g u 2 0 5 125 100 99
3 Scrccrkungcn
6 . 7
kclne Sei tcnkrk i f tc WanJdruckrccrsuny
)..cine S e i t c n k r 8 f t e b 8 S n s t a t i o n h r e D d u n
wlhrcr$d Anfahr2ham cnvcrBf fcntlict,:c 9 Datcn Vcrr loung l c l t u n g e n
d e r Mc3- 10
Nominal combustion-cLlamber pressure Nominal thrust
Pc nom Fnom E Relaxation ratio 0 Nozzle angle (g for bell nozzle) W Nozzle wall: g smooth wall
T Nozzle-wall temperature: u uncooled r tube wall
r fuel or water-cooled k cooling by hydrogen
Key: 1-source 2-fuel 3-c ommen t s 4-aniline 5-benzene 6-no side forces 7-wall-pressure measurement 8-instationary data during 9-unpublished data start-up phase 10-icing of measurement lines 11-tests of ca. 1 second duration 12_with 15O plug nozzle 14-J-2D model engine
1 3 -engine
28

Since in [23] the measured points are illustrated graphically only and in addition, numerous hot and cold-gas data is also plotted, an identification of the measured points is hardly possible. The data agrees with that of other sources. The measurements of Forster and Cowles and of Bloomer et al. were conducted more than 10 years ago, but they extend over a broad range of test and engine conditions. the most important data on separation in chemical engines. There is only a little reliable separation information available on the 5-2 engines [12]. is taken together with the combustion chamber and theoretical wall- pressure as a criterion for a full-flow nozzle. Several instationary measurements of wall pressure during the start-up phase of the J-2D engine are available from NASA-MSFC tests. theoretical wall pressure at the point of the first pressure in- crease is taken, since the measurement of instationary pressure is not very accurate. During the stationary part of the experi- ments there was good agreement between theoretical and experimental wall pressure. The RL-10 separation data are somewhat question- able, since the measurement lines iced up due to the cryogenic wall cooling. The data of Kah and Lewis with a high-pressure engine are based on short-time tests of about 1 s duration. High-speed photographs show: a flow which does not separate until the nozzle end cross-section. In several of the tests of Thayer and Booz with a model rocket motor of the Space Shuttle main engine, separation and recovery occurred. These data differ very much from the other results, so that they should not be used for the specification of a separation criterion.
Thus they belong today to
Thus the condition "no side forces"
For pi the
3.1.2 Methods of Graphic Representation
A fundamental question in the evaluation of experimental results is the method of graphic representation. In the case of the flow separation in rocket nozzles, this problem has not been fully solved.
[ 13 Sch
The original method is to use pressure ratios pi/p and pc/pa , 401. Improvements have been proposed by Green [le] and illing [30, 341 in order to reduce the scattering of data
in the graphic representation. But the results achieved do not represent an actual improvement since the reduction in scattering is obtained only through a change in scale.
The other method of plotting is based on a result of the separation theories which states that the Mach-number at the beginning of the recompression zone is aldecisive parameter for the separation. Therefore in this method, pi/pa is represented as a function of Mi. This method is also used in the discussion of experimental results.
29

3.1.3 Compilation of the Separation Data on Chemical Rocket Engines
Plotting of the experimental data requires a calculation of the Mach number at point i. If an isentropic relaxation is assumed along the wall flow-line, then for an ideal gas one can write:
Since in a real nozzle the isentropic exponent 7 changes during the relaxation, the use of a suitable Y is somewhat arbitrary in (6). The occurfi-ng errors are not very large since a small deviation from the average isentropic exponent only slightly affects the computed Mach number. The values for the isentropic exponents taken as a basis for the evaluation, are presented in table 2.
Table 2. Isentropic Exponent of the Various Fuel Comb'inations [3, 421.
Fuel Combination Isentropic Exponent HN03/aniline H202/benzene 02/benzene
OdH2
1.23 1.20 1.24 1.26
The separation data of chemical rocket engines are plotted in fig. 20. In addition, the region of cold-gas test data is given; this is compiled in [ 2 9 ] for the values from [l, 5, 11, 251. The shaded field designates the majority of the cold-gas data. Figure 20 shows that the trenld of hot-gas and cold-gas data coincides. With increasing Mach number at the beginning of the recompression zone, the separation pressure decreases. The cold-gas data covers the region of the hot-gas valwes, but the majority of the cold- gas tests leads to a separation criterion which is about 10% less than that of the hot gas. It is possible that the upper range of cold-gas tests does not represent true separation. This can be a nozzle end-effect as is seen in the data of [l]. Two test series do not agree with the trend of the other hot-gas data. These are the results of tests with small bell nozzles. The observed pressures are much lower than in the other cases.
on the separation behavior, a reduction of the scattering in the experimental values is needed. In section 2.3 it was found that
For an investigation of the influence of different parameters
30

0 . 5
0 . 4
a 0.3 \
0.2
0.1 I I
I . I 1 J
1 2 3 4 5 Mi
Fig. 20: Compilation of Separation Data in Chemical Rocket Engines
Key: 1-majority of cold-gas test data 2-region of cold-gas test data [35] (Symbols: See table 1)
3-separation and recovery
an error of 5 to 10% must be expected in the separation tests. A usual method for reducing measurement errors is to average different measurements taken under approximately the same con- ditions. This method can be applied to the separation tests by averaging the data of each engine within a certain region of Mi. In figure 21 these averaged separation data are presented. The large scattering range of fig. 20 has been reduced dramatic- ally. The separation in chemical rocket engines with higher thrust takes place much earlier than in the small, cold-gas nozzles. The difference is considerable,especially at higher Mach numbers.
3.1.4 The Influence of Various Parameters on the Separation Behavior
The averaged separation data of fig. 21 can be used to determine the influence of various parameters on the separation behavior.
With increasing Mach number at the beginning of the recom- pression zone, the separation criterion declines. At higher Mach numbers, this influence becomes smaller and for very large Mach
31

0 . 5
0 . 4
(d QI 0.3 QI ‘d
0.2
0.3 1 2 3 4 5
Mi Fig. 21: Average Separation Data of Chemical Engines e351
Key: 1-majority of cold-gas test data 2-region of cold-gas test data (Symbols: See table 1)
numbers, p./pa certainly will not fall below a certain limit value whick is greater than zero. of the cold-gas data. The separation values for hydrogen entered in [30] show a separation criterion of 0.2 for a Mach number of 6.2 and this indicates that the lower limit for cold gases lies between 0 and 0.1. In hot-gas tests, this limit can be higher, as we see in fig. 21*.
This trend agrees with that
The influence of the nozzle angle on the separation point is a question which has been investigated since the beginning of separation measurements. The nearly axis-parallel separation observed in plug nozzles of about 15O half divergence angle, led to the supposition that the separation angle coincides with the divergence angle [33]. The separation pressures of nozzles of different divergence angle are plotted in fig. 22. The available data extends over a region of loo to 300. The separation data at a Mach number of about 3...[page 36 is missing]
The separation theory of Crocco-Probstein [ 8 ] described in sec. 3.3.2 also shows a lower l4miting value for Pi/Pa. presented hot-gas data, it lies at 0.12 to 0.19.
Jr
For the
32

r
0 . 5
0 . 4
a
-4
a \ a
0.3
0 . 2 1
I I i 1 1 I i I
I ! I i
I
i i
2 3 4
Fig. 22: Separation Point in Plug Nozzles of Different Divergence Angle
Half divergence Angle
( O )
10 15 20 25 30
Symbol
0 ' V 0
, a n
at 100, 1 5 O and ZOO, to have the se aration occur later with de-
however. The data at a Mach number of about 4 exhibit no relation- ship between separation behavior and opening angle. one must assume that the separation pressure depends very little or not at all on the nozzle angle. The strong dependence between nozzle angle and separation criterion found by Scheller and Bier- lein in [ 3 3 ] is probably the result of a poor pressure measurement since the computed, two-dimensional value does not agree with the measured values.
creasing angle. The nozzle with 30.. g does not follow this rule, Therefore,
33

0 . 5 I
0.3
0.2 1 2 3 4 5
Mi ,
Fig. 23: The Influence of the Isentropic Exponents on the Separation Point [35]. Fuel Combination Symbol
HN03/aniline HzO~/benzine 021benzine 02 IH:!
10 cl cl
‘ A
In separation tests with different fuel combinations, the isentropy exponent varies. Figure 23 shows the separation pressure of the averaged tests of fig. 21 and the points corres- ponding to the particular y are marked. It is visible that a negligible effect is present.
Other parameters like wall configuration--smooth wall or tube construction--and wall temperature have no significant influence on the se aration behavior within the scattering of measured values [35 P .
Figure 21 shows that there is a difference between the separation data of chemical engines and that of the cold-gas tests. There is also a certain scattering of the averaged data of chemical engines; this is particularly striking in the meas- ured values of rocket engines in the range of Mi = 3.7. This data is plotted in fig. 24 against the thrust of the engines. With increasing thrust, the separation pressure increases in the bell nozzle until it approximately equals that of the larger plug nozzles.
34

1 0 - 4
0. 3 m
*d
a I \
a 0 . 2
I
I I 0.1
NASA-NSFC 1 4-k Motx .( Kcge 1 ?.il sc ) RL- 1,O
Fig. 24: Separation Pressure of Engines with Bell Nozzles having Different Thrust Values (Mic3.7, LOX/H2) 1
A final explanation of this effect is not possible since the number of corresponding test values is still much too small. Besides the measurement errors which can cause only a part of the scattering, the following additional items may be responsible for this behavior:
-Reynolds number In fig. 24 a Reynolds number effect could be supposed,
since with increasing thrust, the Re-number increases along the wall. But in all turbulent separation measurements, little or no Re-effect is found [ l o , 241. Since the separation process takes place within a very short distance and thus almost ex- clusively the pressure-pulse forces are decisive (see sec. 3.3.21, the viscosity forces have only an insignificant influence.
-Development of Boundary Layer The boundary layer forms in a curved nozzle due to the
pressure distribution and it forms perpendicular to the nozzle wall, in contrast to the process in a plug nozzle. Thus, the separation behavior can be affected (see Crocco-Probstein theory in sec. 3.3.2). In addition, in a small nozzle the boundary layer takes up relatively more space than in a large engine, so that three-dimensional effects can play a role.
-Change of Separation Length (Oscillation Width of the Separation Region) due to the Test and Engine Conditions
distance which amounts to several thicknesses of the boundary layer. The length of this zone can be affected by the engine
The average separation process takes place within a certain
35

operating conditions and the test conditions. Model tests with cold-gas nozzles and small engines can be conducted very care- fully (rigid model, smooth-polished wall). In these cases the separation length is shorter (lower separation oscillations [ 3 6 ] ) and consequently there results a flow separation at smaller pressures than in a large engine where the disturbances of the boundary layer and inflow conditions are more severe. Due to these disruptions, the flow separates even at a higher pressure.
The latter phenomenon would mean that besides a general trend of the separation pressure with the Mach number, the exact values depend on the particular engine and test conditions. The measured results presented in [ 3 6 ] make this influence appear possible. The separation data of larger engines accord- ingly represent a type of upper limit which can only be undercut in very carefully performed tests with the appropriate model engines. Model tests are thus useless for the determination of the separation behavior of large engines (see fig. 2 4 , 5-2 model and large engine).
1
3 . 1 . 5 Summary of Experimental Separation Results
The various experimental investigations of flow separation in supersonic nozzles turned up a series of (partly scattered) effects which can be combined into the following findings:
o The separation criterion pi/pa is lowered with increasing Mach number Mi of the first recompression point.
pressure" which could lie between 0.1 and 0.2 pa for hot- gas engines.
0 There probably exists a lower limit for this "separation
0 The separation criteria of large engines (bell and plug nozzles) are higher than those of cold-gas and hot-gas model engines. The measured data of larger engines repre- sents a type of upper separation limit.
0 The separation criterion is affected slightly or not at all by: 0 Nozzle divergence angle 0 Nozzle contour (plug or bell nozzle) 0 Wall contour 0 Wall temperature 0 Fuel combination
3 . 2 Experimental Separation Criteria
For the design of a nozzle it is useful to have an analytical relation for the separation criterion, instead of having to read off the pertinent value from fig. 21. The usual method is to
36
e
use an empirical function whose constants are determined by the data points.
Several empirical separation criteria have been published, all of which provide a relationship between the separation pressure and the pressure ratio pc/pa.
Summerfield [ 4 0 ] : The oldest separation criterion comes from M. Summerfield. Building on the tests of Forster and Cowles, the following expression results as a guideline value for low pressure conditions (pc/pa 15 to 2 0 ) :
p i Pa - = 0 .4 ( 7 )
At higher pressure conditions, this value decreases.
Schilling [ 3 0 , 3 4 1 : 1
Building on the Green method [ 1 6 ] of norming of pi with the combustion chamber pressure instead of p./p provides an expression:
Schilling 1 a,
pc -1.195 1 - I p i = 0.583 (-1 pc Pa
( 8 )
Equation ( 8 ) applies for short, bell nozzles El]. Similar equations can be set up for long bell nozzles and plug nozzles. If equation ( 8 ) is multiplied by pc/pa, then the separation criterion results as:
A comparison of equation ( 9 ) with the averaged experimental data of fig. 21 shows that the Schilling equation provides far too small separation pressures. Thus one must assume that ( 8 ) is based on cold-gas data. Equation ( 9 ) should therefore not be taken as a separation criterion for chemical engines [ 3 5 ] .
Kalt-Rendall [ 2 3 ] : S. Kalt and D. Bendall apply an equation similar to ( 9 ) . The test values of cold-gas nozzles and rocket engines with solid and liquid propellants of differing sizes led to the re la t i on :
p, -0.2 0 . 6 6 7 (-)
pi
Pa Pa I - (10)
37

At low pressure relationships the agreement with averaged data of fig. 21 is relatively good; but at greater Mach numbers, (10) like (91 , deviates from the experimental data.
All equations with a simple power law for the pressure rela- tion decrease too much at higher Mach numbers of the separation pressure. More complicated equations for the pressure relation like that in [ 3 0 ] , can indeed improve the agreement with experi- mental data within a broader range of the pressure ratio, but a significant influence of the isentropy exponent on the separa- tion pressure remains, and this was not observed in the test. The preparation of an empiriaal separation equation with the pressure ratio is thus connected with an "a priori" specified isentropy exponent.
In an empirical equation it is better to take the Mach number Mi from the beginning of the separation zone, instead of the pressure relationship p' /p . An example for one such separation criterion (presenteg i8 fig. 25 together with the averaged experimental data) runs:
I
(1.88 M~ - 1)'0064 I - 1 pi 1 Pa
I I I
I a a .r(
: \ , 0 4 I
1 ! I
f 2 3
..'Ii
a
(11)
5
Fig. 25: Empirical Separation Criterion ( 0 : Averaged Separation Data of Chemical Engines)
38
For Mi the value '5' should not be exceeded since test values above this range are not avaizable.
3.3 Theoretical Calculation of the Separation
The phenomenon of separation of turbulent boundary layers at supersonic speed can occur not only in over-expanded rocket nozzles, but also when flowing over steps, q'round wedges and in the interaction between incident compression shocks and boundary layers. The theories proposed to account for this have thus also been applied in part to flow separation in nozzles.
3.3.1 Overview of the Most Important Flow Separation Theories for Rocket Nozzles
The task of the flow separation theory consists in describing the change in the boundary layer during the recompression and its interplay with the outlet flow. calculation sometimes differ significantly; they are based on the following points:
0 Equilibrium between wall friction and pressure change in
The methods developed ,for this
the separation region (Donaldson-Lange [9])
0 Pulse change of the boundary layer in the separation region and characteristic velocity profile for the points i and s (Tyler-Shapior [46]). ( A principally similar method is used by J. Nielsen, J. Nielsen Epgineering & Research, Inc., for the calculations in the SQID project)
0 Pulse change of the boundary layer in the separation region, transformation in the incompressible form and boundary-layer form factors (Crocco-Probstein [ 8 ] )
0 Constant ratio of Mach numbers before and after the*separation point (Ma er [28], Guman [18], Reshotko-Tucker [32] , Law- rence [25 7 )
0 Pressure change in the boundary layer and rotation of the
o Similarity of the separation pressure-increase (Chapman [6])
o Characteristic flow line in the boundary layer (Gadd [15],
outward flow (Mager [28])
Arens-Spiegler fz]).
J-
"Reshotko-Tucker, Lawrence and Tyler-Shapiro do not make a dis- tinction between the separation point and plateau pressure-point.
39
Although several of these theories are old, they are still used today in the calculation of flow separation in rocket nozzles [291.
In [35] the various theories are presented and compared with experimental data. It turns out that the calculation method of L. Crocco and R. Probstein gives the best agreement with the experimental data. In the other theories, either the isentropy exponent will have a strong influence on the separation pressure [2, 6, 15, 18, 28, 321 or the Reynolds number formed with the local nozzle length, will play an important role [6, 91. The theory of E461 even gives a rising separation pressure at higher Mach numbers.
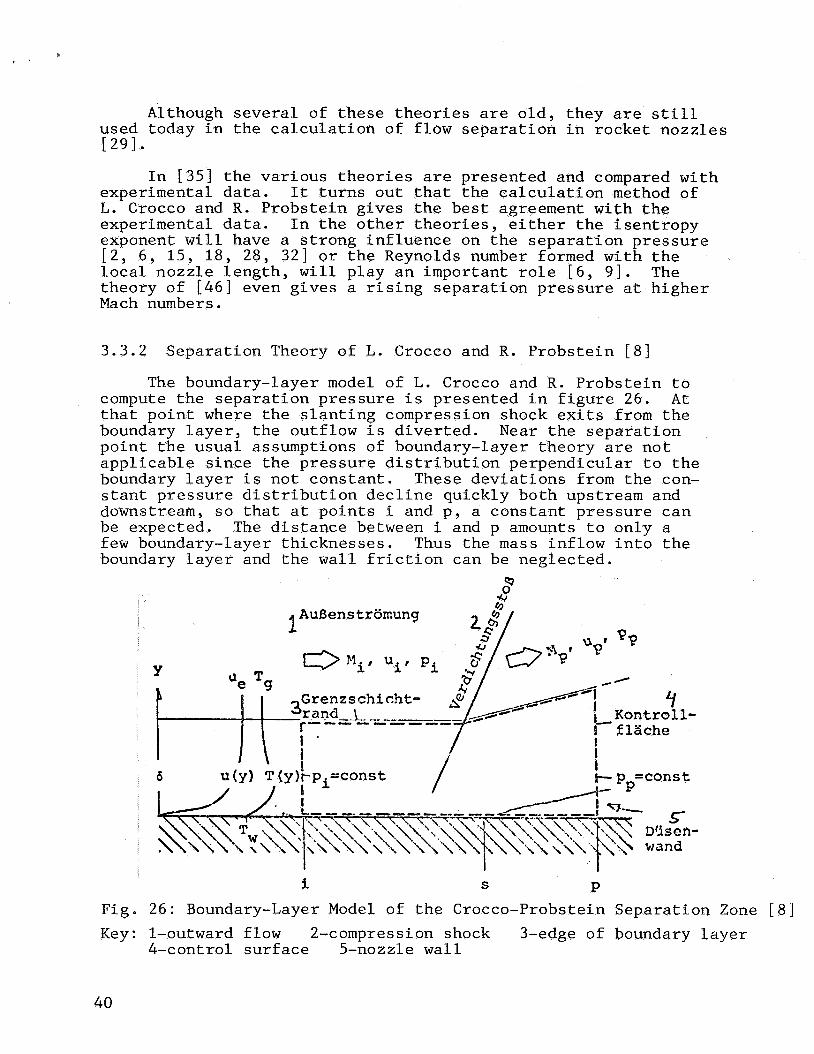
3.3.2 Separation Theory of L. Crocco and R. Probstein [8]
The boundary-layer model of L. Crocco and R. Probstein to compute the separation pressure is presented in figure 26. At that point where the slanting compression shock exits from the boundary layer, the outflow is diverted. Near the separation point the usual assumptions of boundary-layer theory are not applicable since the pressure distribution perpendicular to the boundary layer is not constant. These deviations from the con- stant pressure distribution decline quickly both upstream and downstream, so that at points i and p, a constant pressure can be expected. The distance between i and p amounts to only a few boundary-layer thicknesses. Thus the mass inflow into the boundary layer and the wall friction can be neglected.
4r AuSenstromung 1
j. s P Fig. 26: Boundary-Layer Model of the Crocco-Probstein Separation Zone [8] Key: 1-outward flow 2-compression shock 3-edge of boundary layer
&control surface 5-nozzle wall
40

With the compression thickness 6* [ 4 4 ]
and the pulse-loss thickness 8
I p u U 0 = 1 -(1- -1 dy
ue Pcue l o (13)
one can write tbe following expression for the mass flow & and the pulse flow I:
( 1 4 ) I E* li .c p u c ( 1 - 7) I e e
I . 2 6" 0 I I = p e e u a ( 1 - T - T) ( 1 5 )
In this case, p denotes the density and u the velocity in the boundary layer, e stands for the values at the edge of the boundary layer.
If we consider only time-averaged processes and select a control volume as is illustrated in fig. 26, then the laws of conservation become:
1 . .
The change in flow values at the edge of the boundary layer due to the slanting compression shock is described by the Hugeniot-Rankine equation:
where T is the temperature at the edge of the boundary layer and y is the isentropy exponent.
41
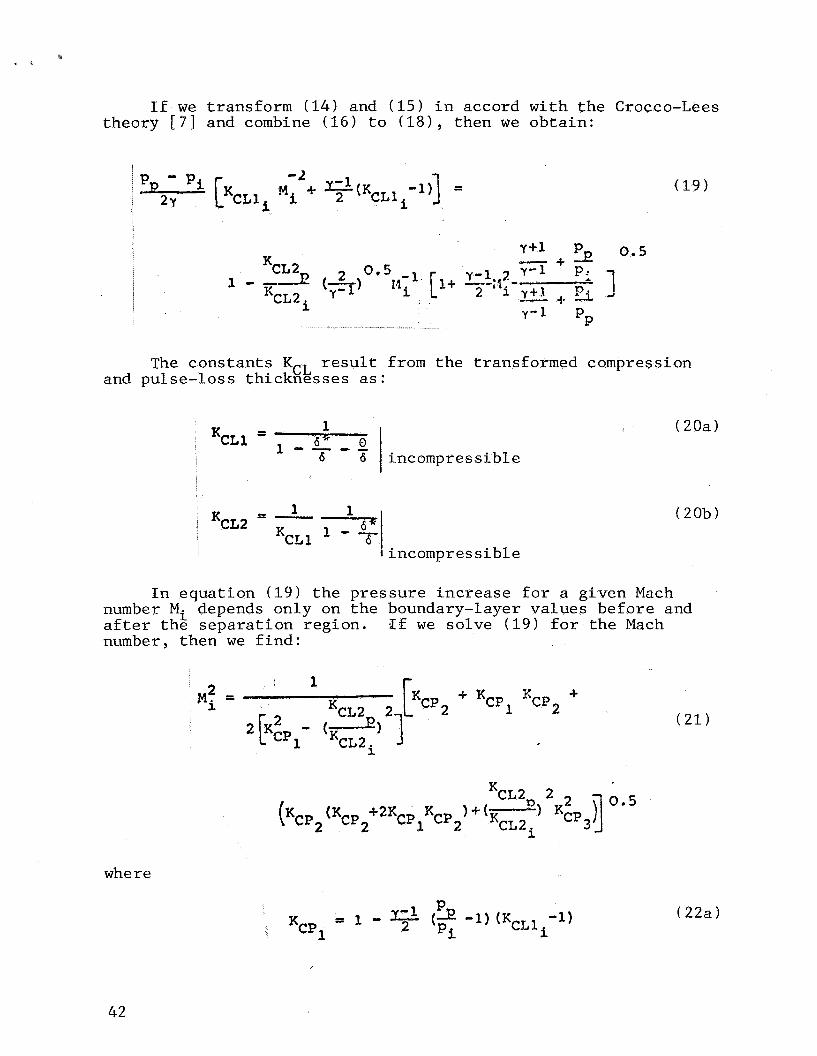
If we transform (14) and ( 1 5 ) in accord with the Crocco-Lees theory [7] and combine ( 1 6 ) to (181, then we obtain:
I?, - Pi 2Y
(19)
0 . 5
The constants KCL result from the transformed compression and pulse-loss thicknesses as:
1
6 incompressible I I
(20a)
I - 1 1 - -
I incompressible
, %L2 I %Ll
(20b)
In equation (19) the pressure increase for a given Mach number Mi depends only on the boundary-layer values before and after the separation region. $ € we solve (19) for the Mach number, then we find:
I I 1 + ' M i = [.CP2 + %?l XCP2
2b&; 2h2] KCL2i
where
P -1 1 %PI = 1 - 9 -1) ( X CLli
(21)
(22a)
42

7 c
c
2 Y-1 - (KCLZP) 2
KCL21
(flE "1) 2 E - - I Kcp3 Y %Lli pi
I
(22b)
(22c)
The functional relationship of equations ( 2 1 ) and (22) is illustrated in figure 27. The values selected for KCL lead to good agreement between theoretical and experimental separation &ea. The influence of the isentropy exponent on the separation behavior is rather small--a phenomenon which agrees well with the experiment.
This separation theory shows that the pressure at which the flow separati3n Qccurs in the nozzle, depends on the 5olindary- lzyer parameters of compression Chickness and pulse l o s s thickcess. DLsturbances in boundzry layer development dlue to wall oscill.3- tions, pressure fluctuations and surface roughness change the Crocco-Lees parameters azd the separation occlirs at a different presscrz.
1 0 . 5
i 0 . 4
' r d la a '4
0.3
0.2 1 2 3 4 5
y=l. 4 1.3 I. * 2
i
Fig. 27: SeDaratjon Criterion of Crocco-Probstein 'KCL2: = 0.865.
KCL1, = KCL2 - 1. lJ L
0 Averaged experimental data
4 3

REFERENCES
iblbergir J e H . 1 et al. : ' f runcatcd perfect i o z z l e s in optimum nozzle design. In: A&S-Journal Jo l . 31, No. 5 Way 1961)' p.614-623 W e n s , X. , E , Spicglcr: Shock induced boundary layer separation in ovcrcxpanded cor,ical exhaust nozzles. In: AIAA-Journal Vol. 1, NO. 3 (Xarch 1963) , p.578-581 aarrcre, M. 1 et : Zocket p r o p u l s i o n . Elsevier Publishing Company Ncw York , 1961 Bloomer, i i , J , , K . J . irnt1, Y.E. Renas: Sxreximental study of effects of gconetxic variables CT performance of conical rocket engine exhaust nozz1.e:;. GASR Tii D-846 (1461) CampSell, C . E . , J.M. Parley: Performance of several conical convcrgent-divcrgctit rocket t y p e exhaust nozzI.es. iiIAS.4 TW 0-467 (1961) Chapman, D . R . , D.I.4. Xuchn, H . K . Larson: fnvcs t iga t ion of scparatcd flows i n superscr1j.c and s u b s o n i c strcays with crnphasis OR e f f c c t of t r t n s i t i o n . NACA Ti< 3869 ( 1 9 5 7 ) CXOCCO, L.? L. Lees: A mixing theory for the i n t e r a c t i o n between dissipative flows anc! near ly isentropic streams. In: JourmZ of the Aeronautical Sciences Vol. 19 , 130, 10 (Qct. 1952) , p.649-€76 Crocco, Le, R.Fe Probs tc in : The peak pressure r i m across an obliylte shock emcxgj.ng from a t u r b u l e n t boun6ary l a y e r over a plane swiacc. P r i n c e t o n Univers i ty Report 254 (Xzxch 1954) Dvnaldson, C.du, R.11. Langc: Study of pressure rise across shock waves requj.rcd to separate laninaw and turbulent boundary l ayers . !JAT,CA T,PJ 2 770 ( 19 5 3 ) Elkstrocn, A,: Xnc5.pient scpnration at svlpcrsonic and hypersonic speeds U ~ i t r ~ r ~ i t y of Tenncssec, Space I n s t i t u t e (Tullahornn) , Short Course on l?lwd Scpnraticrl (i!ov. 137%)
Farlcy, J.X, , C.E. Campbell: Pcirformancc of several method of characterictics exhaust- nozzles. NASA Ti? 0 - 2 9 3 (19GO)
Penwick , J., 14. Ivloriaxty, L. Xave, A . Petcracn: Test results an8 a n n l y s c s of J - 2 s e n g i n e side load procjrmi. Fockctdync DJ vf.niot1, !.;TiR, Rc>port CDK 3124- 4087 (April 27, 1973)

Fofster, C.R., F.B, C o w l e s : Exper imenta l s t u d y of gas- f low s e p a r a t i o n i n overexpanded exhaus t n o z z l e s for r o c k e t motors. JPL-Progress Report 130. 4-103 (1949) F u l l e r , P.N.: 3-2s n o z z l e side load s tudy . F i n a l Report. Rocketdyne D i v i s i o n , GAR, Report R-9045 ,(August. 1, 1 9 7 2 ) I Gadd, G.E.: I n t e r a c t i o n s between wholly l amina r and whol ly t u r b u l e n t boundary l a y e r s and shock waves s t r o n g enough t o c a u s e s e p a r a t i o n . In: J o u r n a l of t h e Aero- n a u t i c a l S c i e n c e s Vol. 2 0 , 110. 11 (Nov. 1 9 5 3 ) , p . 7 2 9 - - 739 Green, L.jx . : Flow s e p a r a t i o n i n r o c k e t n o z z l e s . In : AliS-Journal Vol. 2 3 , N o . 1 (Jan-Feb 1 9 5 3 ) , p .34 -35 Gross, K.w.:j SSXE (NASA-!4SFC-S%E-ASTr\r-PP) ( J a n . 1973)
Guman, W.J.: On t h e p l a t e a u and peak p r e s s u r e of r e g i o n s of p u r e l amina r and f u l l y t u r b u l e n t s e p a r a t i o n i n two d imens iona l flow. In : J o u r n a l of t h e A c r o n a u t i c a l S c i e n c e s V o l . 26, N o . 1 ( Jan . 19591, p . 5 6 Hege, D.W.: Semi-Annual T e c h n i c a l Progrim Repor t , A%las. Rocketdyne D i v i s i o n , IJAA, Repor t R-354-XP (AF04 ( 6 4 5 ) - 1 ) , ( D e c . 3 0 , 1956) Herbert, !4.V., R . J . Herd: Boundary l a y e r s e p a r a t i o n i n s u p e r s o n i c p r o p e l l i n g n o z z l e s . f - l i n i s t r y of P.viation, Reports and IMnorandn No. 3421 (1964) Xah, C.L., G.D. Lewis: High p r e s s u r e e n g i n e f e a s i b i l i t y program. P ra t t eWi tkney A i r c r a f t , FR-11.71 ( D e c . 10, 1964) Kah, C.L., G.D. Lewis: High chnrlibcr p r e s s u r e s t a g e d combust ion r e s e a r c h program. F i n a l r e p o r t . P r a t t a Withney A i r c r a f t , FR-1676 ( J u m 30, 1 9 6 6 )
Unpublished Boundary Layer Data Of the
K a l t , S., D. Bcndal: C o n i c a l rocket per formance under flow separated c o n d i t i o n s . I n : J o u r n a l of S p a c e c r a f t s and Rockets Vol. 2, NO. 3 ( i h y 1965) p .447-449 Lange, R.H.: P r e s e n t s t a t u s of i n f o r m a t i o n r e l a t i v e t o the p r e d i c t i o n of shock induced boundary l a y e r s e p a r a t i o n . WACA T!.Z 3065 (1955) Lawrence, R.A. : Syrrmetr ical and unsymmetr ical f low s e p a r a t i o n i n s u p e r s o n i c nozzlcs. Southerr: Me thod i s t U n i v e r s i t y Texas , Ph. I). T h e s i s 1967 L e w i s , J .T.: R e s u l t s of s e p a r a t e d n o z z l e flow s t u d i e s on E-6 and E-7 e n g i n e s t a n d s , P ra t t cWi thney Ai rcraf t , SMR FR- (Febr . 8 , 1967)
Lombardo, J., K . W . G r o s s , S. O n o r i : A n a l y t i c a l p r e d i c t i o n of the ice f o r m a t i o n i n s i d e th? 5-2 e n g i n e n o z z l e con tour (200k t h r u s t l e v e l ) . NASA-MSFC I n t e r n a l !-T.lernorandum t o
I3 . G . P a u l (S&E-ASTN-PP) ( 7 I-!+ L 63)
45
c351
[28] Mager, A*: On the model of the free, shock separated turbulent boundary l a y e r . I n : J o u r n a l of the A e r o n a u t i c a l Sc ience ; Vol. 23, N o . 2 (Febr. 1950) p. 181-184 Nave, L.: E v a l u a t i o n of the nozzle incipient separation chamber pressure for the SSIvlE 470 k engine, Rocketdyne Division, BAR, Rcport (Dec. 1, 1972) Pra t t&t l i t hney Aircraf t : Suggested program for applied research on nozz le flow s e p a r a t i o n . Pratt&Withney Aircraft, FP 65-117 (1966) Rocketdyne: Analysis of predicted side loads in the nozzle of the space shutt le booster and orbiter main engine, Rocketdyne Division, NAR, Report SSE 4.1.1 D-
Reshotko, E - , MI Tucker: Effect of a d i s c o n t i n u i t y on t u r b u l e n t boundary l a y e r thickness parameters and application to s!,ock-induced separation. i4ACA TN 3452 (1955) Scheller, K., 3 . A , B i e r l e i n : Some experiments on flow s e p a r a t i o n i n rocket nozzles. In: AKS-3ournal ko1. 23 (1953) p.28-32 Schilling, T.W.: Flow separation in a rockef nozzle. University of Buffalo, M.S. T h e s i s {June 1962) Schmucker, R.H. : Status oi flow separation predictlor. i n l iqu id p r o p e l l a n t rocket cngincs. George C. Marshall Space Flight Center NASA Ti4X (im Dxuck) Scbmuckcr, R . H . : I ;Flow Processes in Overexpanded Chemical Rocket Nozzles, Part 2: Lateral Forces due to Asymmetrical
*
1414-2 (1970)
f Segaration. Lehrstuhl f u r Raumfahrttechnik, TU Munich, /
t371
t 3 9 1
T B ~ I O (in prepara t ion) Shaplro, R . H , : The dynamics and thermodynamics of compressible fluid flow. Vol. 1 and 2, The Ronald Press Company,rkw York (1954) Stodola, A . : Steam and gas turbines. Mac Gratr-Hill Book Company, Flew York (1927)
Stromsta, E.R.: Results of S-2SE 40:l area-ratio bell nozzle dcsign and cold flow test program. Rocketdyne Division, UbR, Report LAP G7-368 (RC) (liug. 31, 1967) Summerfield, M., C. F ~ r s t e r , W. Swan: Flow separation in overexpanded supersonic exhaust nozzles. In: Jet propulsion Vol, 24, No. 9 (Sept, 19S4) p.319-320 Sunlcy, lT,L,, V . N . Ferrj-man: Jet separation in conical nozzles. In: Journal of t h e Royal A e r o n a u t i c a l Society Vol. 68 (1964) p.808-817 S u t t o n , G.P.: Rockct propulsion elements. John Wiley and Sons, New York (1967)
46

- 52 - [433 Thayer , E.B I D.E. Booz: Flow S e p a r a t i o n T e s t s of
Cand ida te S ace S h u t t l e Nozzles . P ra t t sWi thney A i r c r a f t
[44] l k u c k e n b r o d t , E.: Flow Mechanics. Springer Pub.
[451
[46]
SMR, FR-3491 (NOV. 21, 1969)
B e r l i n , 1968 I T u o v i l a , M.J., N . S . Land: Exper imenta l S tudy o f Aeroclastic I n s t a b i l i t y of Overexpanded Rocket Nozzle' Extens ion . NASA TN D-4471 ( A p r i l 1968) T y l e r , R.D., A.H. Shap i ro : P r e s s u r e R i s e Requi red for S e p a r a t i o n i n I n t e r a c t i o n between T u r b u l e n t Boundary Layer and Shock Wave. I n : J o u r n a l of t he A e r o n a u t i c a l S c i e n c e s , Vol. 20, N o . 12 (Dcc. 1953) pp. 858-860
47

APPENDIX: Prediction of Separation for the Space Shuttle Main Engine
beginning
In fig. AI the normed wall-pressure distribution is illus- With the trated in the nozzle of the Space Shuttle Main Engine.
vacuum pressure ratio at the nozzle end pe expressions result via equations (6) and (Yff:
/pc the following
M. = 4 .5 ( v = 1.26) (Multi-dimensional value from E171
pi/pa = 0.28 to 0.29 (the upper value takes into account the
Mi = 4 . 2 ) 1
scattering of experilmental data)
Thus, for the pressure ratio at which the nozzle will have f u l l flow:
= 148 to 153
and the upper value should be taken for safety reasons.
48

5 a
0; 1 0407
0 *os
0.03
0.02
0.01
0.007
0.005
0.003
0.002
0.001 0 2 4 6 8 10 12 1 4 1G 18 20 22
Fig. Al: Normed Wall-Pressure-Distribution of the Space Shuttle Main Engine [17]
49