nasa technical note nasa t n - -e · · 2013-08-31nasa technical note nasa t_n dz5292 4, 1 --i...
TRANSCRIPT

NASA TECHNICAL NOTE N A S A T_N Dz5292 4, 1 --I
E" a 1 N - - E o* 0" N I+== Lm I l J E D I nJ-= a Qa=*
m- g z o m 7 1 + mp 4 - L - 2
c/) 4 z LOAN COPY: RETURN TO
KIRTLAW AFB, N MEX AFWL (WLIL-2)
METHOD FOR PREDICTION OF PUMP CAVITATION PERFORMANCE FOR VARIOUS LIQUIDS, LIQUID TEMPERATURES, A N D ROTATIVE SPEEDS
by Robert S. Rzlggeri und Royce D. Moore
Lewis Reseurcb Center CZeveZund, Ohio
N A T I O N A L A E R O N A U T I C S A N D SPACE A D M I N I S T R A T I O N W A S H I N G T O N , D . C. J U N E 1 9 6 9
https://ntrs.nasa.gov/search.jsp?R=19690019787 2018-06-10T18:15:58+00:00Z

TECH LIBRARY KAFB, NM
I Illill 1111 Ill 11111 Ill1 lllll1llll Ill1 IIII 0322820
NASA T N D-5292
METHOD F O R PREDICTION OF P U M P CAVITATION PREFORMANCE F O R
VARIOUS LIQUIDS, LIQUID TEMPERATURES, AND ROTATIVE SPEEDS
By R o b e r t S. Rugger i and Royce D. Moore
L e w i s R e s e a r c h C e n t e r Cleve land , Ohio
NATIONAL AERONAUT ICs AND SPACE ADMINISTRATION
For sale by the Clearinghouse for Federal Scientific ond Technical Information Springfield, Virginia 22151 - CFSTI price $3.00
ABSTRACT
A method for predicting the cavitation performance of pumps with various liquids, liquid temperatures, and rotative speeds is presented. tal studies used in formulating the method are discussed. in comparisons between experimental and predicted results of cavitation performance for several pumps operated in liquids tha$ exhibit a wide range of physical properties. Use of the method requires that two sets of test data be available for the pump and operating conditions of interest, but these data need not be for the same liquid, tempera- ture, or pump speed. Numerical examples are presented.
Both theoretical and experimen- Good agreement was obtained
ii

METHOD FOR PREDICTION OF PUMP CAVITATION PERFORMANCE FOR
VARIOUS LIQUIDS, LIQUID TEMPERATURES, AND ROTATIVE SPEEDS
b y Robert S. Ruggeri a n d Royce D. Moore
Lewis Research Center
SUMMARY
A method that predicts the cavitation performance for pumps and inducers is pre- sented. The present study shows that the method consistently provided good agreement between experimental and predicted performance for an inducer and five different pumps operated with a variety of liquids that have widely diverse physical properties. Use of the method requires that two sets of appropriate tes t data be available for each pump and operating condition of interest. same liquid, liquid temperature, o r rotative speed. At least one s e t of data, however, must provide measurable thermodynamic effects of cavitation. tes ts , accurate predictions of cavitation performance for a given pump can be made for other liquids, liquid temperatures, and/or rotative speeds. the basis of flow similari ty with cavitation and, thus, predicted values apply to the same conditions of flow coefficient and pump cavitation performance level used in obtaining the reference test data.
These test data need not necessarily be for the
From these reference
Predictions are made on
INTRODUCTION
Cavitation, which is the formation and collapse of vaporous cavities in flowing li- quids, can degrade the performance of pumps and other hydraulic equipment. Because cavitation is a vaporization process that involves heat and mass transfer, the physical properties of the liquid and its vapor and the flow conditions can affect the cavitation pro- ces s and thus the cavitation performance of hydraulic equipment as well. effects of fluid properties, flow conditions, and heat transfer, termed thermodynamic effects of cavitation, can improve cavitation performance. ies with pumps and venturis (refs. 1 to 10) have shown that, for 'cer ta in liquids and/or liquid temperatures, the net positive suction head (NPSH) requirements can be signifi-
The combined
For example, cavitation stud-
I
cantly less than that obtained for room-temperature water. (NPSH is defined as the total pressure above vapor pressure at the inlet to a pump. ) This improvement (decrease) in inlet pressure requirements is attributed to the varying degrees of evaporative cooling associated with the cavitation process. Because of the evaporative cooling, the cavity pressure and the vapor pressure of the liquid adjacent to the cavity are decreased relative to the vapor pressure of the bulk liquid. This decrease in cavity pressure retards the rate of further vapor formation, thereby allowing the pump to operate at lower values of NPSH than would otherwise be possible. The NPSH requirement fo r a pump operating at a given head rise and flow condition is reduced by the amount corresponding to the decrease in cavity pressure. The accurate prediction of thermodynamic effects of cavitation is therefore essential to a n optimum flow system that is designed to operate with cavitation.
have been proposed (refs. 1 to 7). Although these studies are.usefu1 in predicting trends, their applicability is somewhat limited because either (1) the analysis does not predict quantitative values o r (2) the experimental data used did not adequately cover the range of fluid properties and flow conditions of current interest, particularly in the aerospace field. Also, existing analyses do not account for effects of heat transfer, flow velocity (and its relation to heat transfer), o r pump scale.
Subsequent to the studies of references 1 to 7, several investigations have been con- ducted to study in detail the thermodynamic effects of cavitation and its relation to the .cavitation performance of various flow devices such as venturis, pumps, and pump inducers (refs. 9 to 12). From venturi studies, a method for predicting thermodynamic effects of cavitation as a function of the liquid used, liquid temperature, flow velocity, and body scale for a given venturi design was formulated in references 10 and 11. Use of the method requires reference data obtained by experiment. The method, based primarily on Freon-114 cavitation results, was later demonstrated to be applicable to the prediction of cavitation performance for pumps and inducers (refs. 9, 13, and 14). The applica- bility of the method was extended over a wide range of fluid properties and flow condi- tions by conducting a subsequent cavitation study using liquid hydrogen (ref. 15) in a venturi of identical design to that previously used. These hydrogen data were then used in conjunction with other available cavitation data for the same venturi design to re- evaluate the exponents of the prediction equation. The new exponents, which are now based on a wider range of variables, are reported in reference 16. The resulting slight changes have little effect on pkedicted results of references 9, 13, and 14.
The objective of this study was to present, in a comprehensive and detailed manner, a method for the prediction of cavitation performance for pumps and inducers. The method presented is based on, and is an extension of, the method already reported in reference 16 for venturis. It is applicable to various liquids, liquid temperatures, and pump rotative speeds. A prerequisite to this prediction method is that similarity of the cavitating flow over the suction surface of the blade be maintained for all conditions to
2
Various analyses that relate thermodynamic effects of cavitation to pump performance
I
which the method is applied. Use of the method requires that two sets of appropriate test data be available for each pump and operating condition of interest.
Cavitation performance data for several research and commercial pumps, obtained with a variety of liquids over a range of conditions, are compared with predicted resul ts using the derived method. Selective data for an inducer and two centrifugal pump impel- lers operated with liquid hydrogen are presented and compared with predictions to show magnitude changes in thermodynamic effects of cavitation with hydrogen temperature, pump speed, flow coefficient, and geometric design. A discussion on the implementation of the method, including numerical examples, is also presented.
ANALY S IS
Develop men t of Basic Re1 at ion s
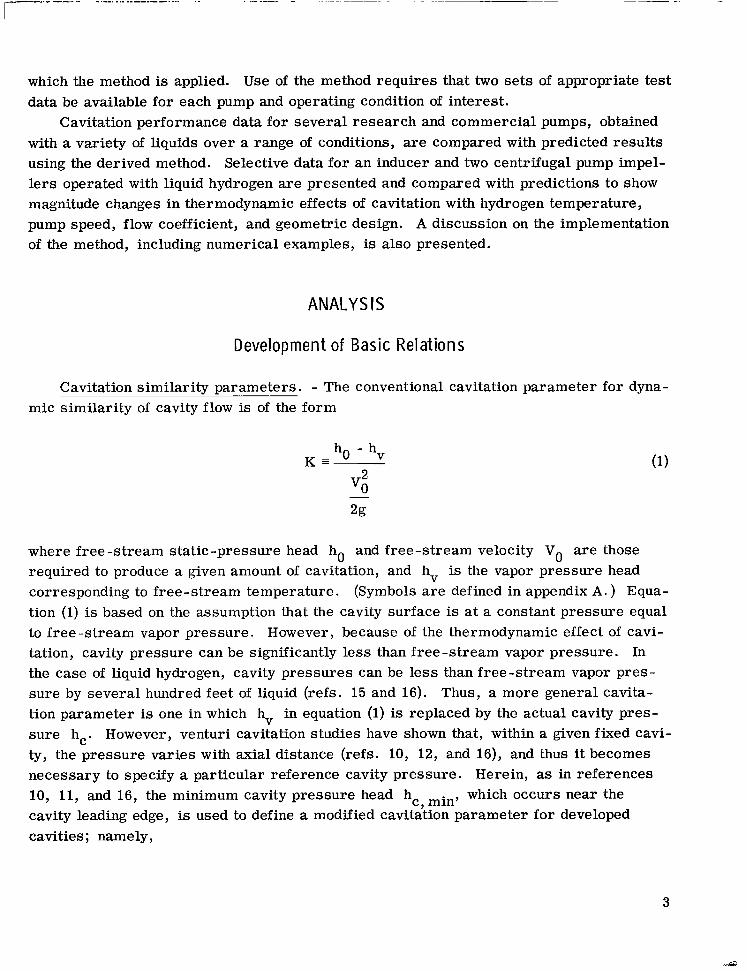
Cavitation similari ty parameters. - The conventional cavitation parameter for dyna- mic similari ty of cavity flow is of the form
where free-s t ream static-pressure head ho and free-s t ream velocity Vo are those required to produce a given amount of cavitation, and hv is the vapor pressure head corresponding to f ree-s t ream temperature. (Symbols are defined in appendix A. ) Equa- tion (1) is based on the assumption that the cavity surface is at a constant pressure equal to free -stream vapor pressure. However, because of the thermodynamic effect of cavi- tation, cavity pressure can be significantly less than free-s t ream vapor pressure. In the case of liquid hydrogen, cavity pressures can be less than free-s t ream vapor pres - sure by several hundred feet of liquid (refs. 15 and 16). Thus, a more general cavita- tion parameter is one in which hv in equation (1) is replaced by the actual cavity pres- sure hc. However, venturi cavitation studies have shown that, within a given fixed cavi- ty, the pressure varies with axial distance (refs. 10, 12, and 16), and thus it becomes necessary to specify a particular reference cavity pressure. Herein, as in references 10, 11, and 16, the minimum cavity pressure head hc, min, which occurs near the cavity leading edge, is used to define a modified cavitation parameter for developed cavities; namely,
3

- h~ - hc, min = + hv - hc, min = K + - AhV Kc, min -
In the absence of thermodynamic effects of cavitation, cavity pressure corresponds to free-s t ream vapor pressure (Ahv = 0) and thus Kc, min = K. The usefulness of
Kc, min and 16 wherein it was shown that, for fixed-size cavities in a given venturi design (AX/D = Constant), the modified parameter Kc, min remained essentially constant for different liquids, liquid temperatures, flow velocities, and venturi scales, whereas the corresponding K values, which are based on s t ream vapor pressure, varied widely. For constant values of Kc,min and V0 in equation (2), a change in the minimum cavity pressure hc, min (maximum depression) resul ts i n an equal change in s t ream static pressure under conditions of flow similari ty. As discussed later in this section, this direct correspondence between hc,min and ho provides the basis for use of equation (2) in the prediction of cavitation performance (free-stream stat ic-pressure requirements) for devices such as pumps and inducers.
flow velocity, and the heat- and mass-transfer processes involved, as well as the physi- cal properties of the liquid and its vapor. Because of the complexity of the cavitation process, the value of h, a rb i t ra ry flow device, liquid, and/or flow situation. However, performance predictions for a given flow device can be made indirectly by experimentally determining a refer- ence value of Ahv and, thus, Kc, min by using practically any convenient combination of test liquid, liquid temperature, or flow velocity that yields a measurable Ahv. Then by use of the method detailed in references 10, 11, 16, and herein, predicted values of AhV, relative to the reference test value, are calculated fo r other liquids, liquid tem- peratures, and/or flow velocities of interest . With the experimentally determined value
which remains constant for geometrically s imilar cavities, the f ree-s t ream of Kc,min’ s ta t ic-pressure requirement h0 is predicted by use of equation (2).
prediction purposes. dependent on the vapor cavity volume present within the blade passages, although the presence of smal l vapor cavities on the suction surface of the blade will not necessarily affect the performance. It is reasonable to assume that, for operation of a pump at a constant flow coefficient (similarity of entering flow), the cavity on the suction surface of the blade, and thus the vapor volume corresponding to a specified head-rise coefficient ra t io Q/+Nc, is essentially constant irrespective of the liquid, liquid temperature, and/or rotative speed. This cri terion of fixed-vapor cavity volume, together with the
as a similari ty parameter has been demonstrated by the studies of references 10
The magnitude of cavity pressure depression is a complex function of body geometry,
or Ahv is not generally known o r predictable for any - 9
Geometric similari ty of the cavitated region is essential to the use of Kc, min for In a given pump o r inducer, cavitation performance is of course
4

previously discussed constancy of K,, min, allows the prediction method developed for venturis to be extended to pumps and inducers. The prediction method, as applied to pumps, is described in the following section.
Similarity relations for pumps. - Pump cavitation performance is generally pre- sented in t e rms of the net positive suction head (NPSH) required at a specified ratio of the head-rise coefficient with cavitation to that without cavitation (Q/QNc). The NPSH is defined as the margin of fluid total head above fluid vapor pressure head at the pump inlet; o r in t e rms of inlet static-pressure head and velocity head,
In t e rms of net positive suction head, equation (2) may be written as
- (Kc, min + 1.0) = h 2g
or
NPSH + Ahv - 1.0 - -
Kc, min
where V1 in the preceding equations is analogous to Vo for venturis. Because the value of Kc, min is constant fo r geometrically similar cavities in a given flow device, it follows (from eq. (3)) that
NPSHref + ( ~ h v ) , , ~ = e v ; , j 2 (4)
NPSH + Ahv
where the subscript ref denotes a reference value that must be established by experi- ment. With flow similarity, the fluid velocity at the pump inlet is proportional to pump rotative speed N, and thus equation (4) may be expressed as
(5) NPSH + Ahv \ N /
5
Equation (5) may be used to predict the required NPSH fo r a particular pump opera- ted with cavitation at a fixed flow coefficient and head coefficient ra t io but with changes in liquid, liquid temperature, and/or rotative speed. For a fixed rotative speed, equa- tion (5) reduces to
NPSHref - NPSH= Ahv - (Ahv) ref
which states that a change in NPSH requirements for different liquids and/or liquid temperatures is equal to the change in the maximum pressure depression Ahv within the cavitated region.
cussed in the following section. The procedure fo r estimating Ahv, required for use in equations (5) and (6), is dis-
Determinat ion of Cavity Pressure Depressions
Thermodynamic effects of cavitation. - A method for estimating values of Ahv for untested liquids and conditions f rom known reference values was previously reported fo r venturis in references 10, 11, and 16. However, the pertinent resul ts that lead to the development of the prediction method f o r pumps presented herein are included for con- venience and clarity.
The previously mentioned reduction in pressure (below free-s t ream vapor pressure) within cavitated regions of various liquids is attributed to evaporative cooling of a thin layer of liquid adjacent to the cavity. This cooling causes a decrease in the vapor pres - su re of the affected liquid layer and a corresponding decrease in cavity pressure pro- vided that the liquid and its vapor a r e locally in thermodynamic equilibrium and no permanent gases a r e present.
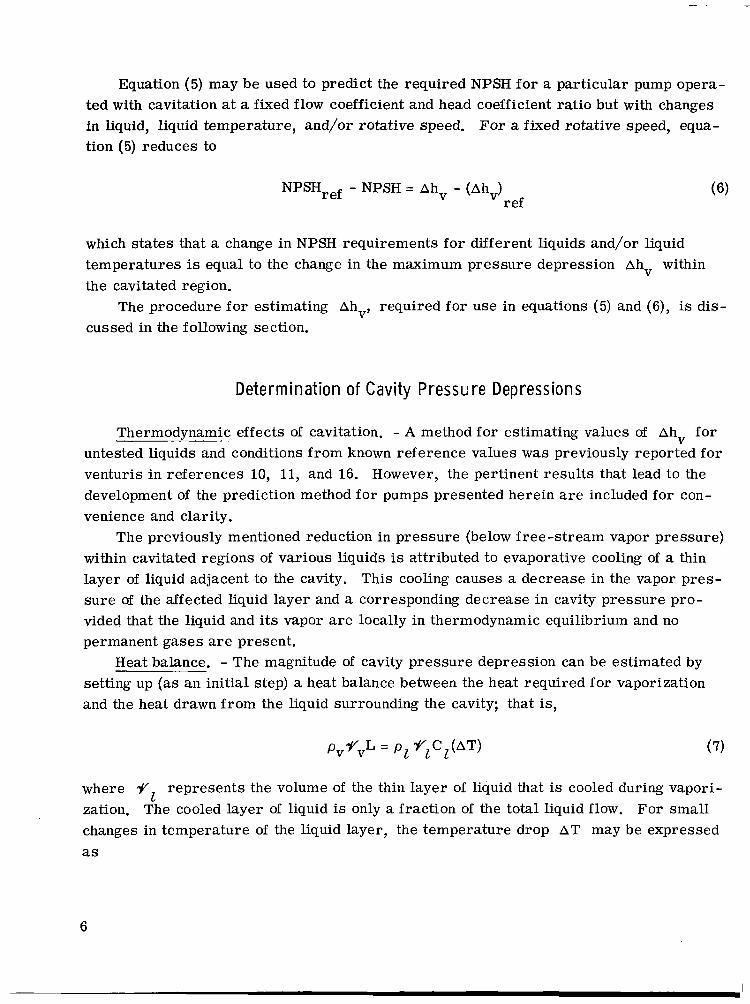
Heat balance. - The magnitude of cavity pressure depression can be estimated by setting up (as an initial step) a heat balance between the heat required for vaporization and the heat drawn f rom the liquid surrounding the cavity; that is,
where l y I represents the volume of the thin layer of liquid that is cooled during vapori- zation. changes in temperature of the liquid layer, the temperature drop AT may be expressed as
The cooled layer of liquid is only a fraction of the total liquid flow. For small
6

A T = Ahv (5)
80
9 3 U .- - c 0
E
g S- 0 c m N
L
m
.-
.- g > 40- ,o a, 3 v
3 VI VI W I- CL
k 20- 9 S
a, VI m
U W
.-
n
where dhv/dT is the slope o the vapor pressure-tempera..-lre curve. With the use of this relation equation (7) becomes
-
B 3 U .- - L 0 ;r 5
6 0 - %
c 0
m N
L
.- c
._ 8 > 0 c
5 E a
3 VI VI PI L a L
@ c .- W VI
% L U a, n
0-
An accurate solution of equation (8), which accounts fo r changes in fluid properties
Values of Ahv as a function of the vapor- to liquid-volume ratio based on the as the equilibrium temperature drops because of vaporization, is presented in re fer - ence 10. solution of reference 10 are presented in figure 1 for liquid hydrogen, water, butane, and
Hydrogen temperature,
T, O R (K)
280
240
200 -
160
0 Vapor- to liquid-volume ratio, 'f'v/"l'l
(a) Liquid hydrogen
Figure 1. -Vapor pressure depression as function of vapor- to l iquid- volume ratio for various l iquids and l iquid temperatures.
7

Liquid temperature,
T, "R (K)
0 .4
Liquid
Water Butane Methyl alcohol
----
550 (3061 t f ._tk - - I I
1.2 Vapor- to liquid-volume ratio, 'bv/7,1
(b) Water, butane, and methyl alcohol.
Figure 1. -Concluded.
methyl alcohol at various temperatures. cavity pressure can vary by several o rders of magnitude depending on liquid and liquid temperature.
An approximate solution of equation (8) is obtained through the use of the Clausius- Clapeyron equation to approximate the slope of the vapor pressure -temperature curve. The Clausius -Clapeyron equation states that
For a given value of </ Y , the depression in I
L gc - J - _ - (9)
where vv and v 1 are the specific volume of the vapor and liquid, respectively. Except near the cri t ical temperature, v << vv and thus v 1 can be neglected. Setting v 1 = 0 and substituting for Ahv/AT (eq. (9)) in equation (8) gives
1
8
. , . , I
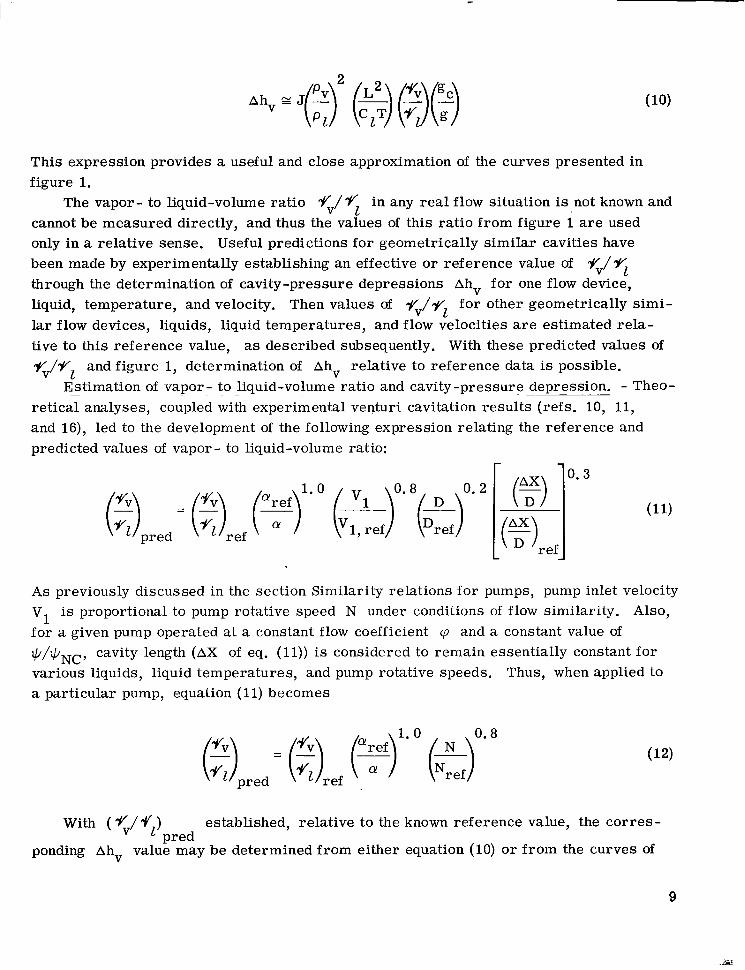
This expression provides a useful and close approximation of the curves presented in figure 1.
cannot be measured directly, and thus the values of this ra t io f rom figure 1 are used only in a relative sense. Useful predictions for geometrically s imilar cavities have been made by experimentally establishing an effective or reference value of </V 1 through the determination of cavity-pressure depressions Ahv for one flow device, liquid, temperature, and velocity. Then values of vv/y for other geometrically s imi-
1 lar flow devices, liquids, liquid temperatures, and flow velocities a r e estimated rela- tive to this reference value, as described subsequently. With these predicted values of yV/Y 1
retical analyses, coupled with experimental venturi cavitation resul ts (refs. 10, 11, and 16), led to the development of the following expression relating the reference and predicted values of vapor - to liquid-volume ratio:
The vapor- to liquid-volume rat io vv/v in any real flow situation is not known and 1
and figure 1, determination of Ahv relative to reference data is possible. Estimation .- of vapor- . to liquid-volume ratio and cavity -pressure . - depression. -- - Theo-
As previously discussed in the section Similarity relations for pumps, pump inlet velocity V is proportional to pump rotative speed N under conditions of flow similarity. Also, for a given pump operated at a constant flow coefficient cp and a constant value of +/QNC, cavity length (AX of eq. (11)) is considered to remain essentially constant for various liquids, liquid temperatures, and pump rotative speeds. a particular pump, equation (11) becomes
1
Thus, when applied to
pred
With ( </ql) established, relative to the known reference value, the cor res - pred
ponding Ahv value may be determined from either equation (10) o r f rom the curves of
9
Ahv against yv/ y similar to those of figure 1 f o r any liquid or liquid temperature of interest. With Ahv known, the NPSH requirements may then be predicted by use of equation (5) (eq. (6) if N = constant). It should be emphasized that, because of the im- plied assumption of flow similari ty used in this analysis, a predicted value of required NPSH applies only to the particular pump and the specific operating conditions of cp and q/qNc used to obtain the required test data.
1
For pumps, the direct measurement of (Ahv) , needed for use in the prediction ref
equations, is not feasible. However, an estimate of Ahv is possible without measuring cavity pressure directly. F o r a particular pump, this estimation requires that two sets of experimental data be obtained to determine the NPSH requirement a t each value of q/qNC and flow coefficient cp of interest. These tes t s need not necessarily be for the same liquid, liquid temperature, o r pump rotative speed; however, at least one of these must yield measurable thermodynamic effects of cavitation. Measured values of NPSH and rotative speed N from one of the two test conditions a r e arbi t rar i ly chosen as the reference values in equation (5). Because both Ahv and (Ahv) a r e unknown, an iter-
ref ative procedure is. required fo r the solution of equation (5). First, a value of (Ahv)
ref is assumed. The corresponding ( %/% ) can be obtained from equation (10) (or equi-
ref valent curves of fig. 1). The predicted fv/V 1 culated from equation (12), and the corresponding value of Ahv is then obtained from equation (10) (or equivalent curves of fig. 1). Successive calculations a r e made until
for the second test condition is then cal-
the values of Ahv and (Ahv) satisfy equation (5). With the value of (Ahv) once ref ref
determined, values of Ahv and, consequently, the NPSH requirements can be-predicted for other liquids, liquid temperatures, o r pump rotative speeds by the use of equation (5). As indicated in the preceding paragraph, the predicted values apply only to a particular pump and specific values of q/qNc used to obtain the necessary test data (i. e . , values of q/qNc and cp corresponding to Ahv, ref).
Further details on the implementation of the prediction method a r e presented in appendix B. Numerical examples, which use test data obtained under various conditions, a r e included.
APPARATUS AND PROCEDURE
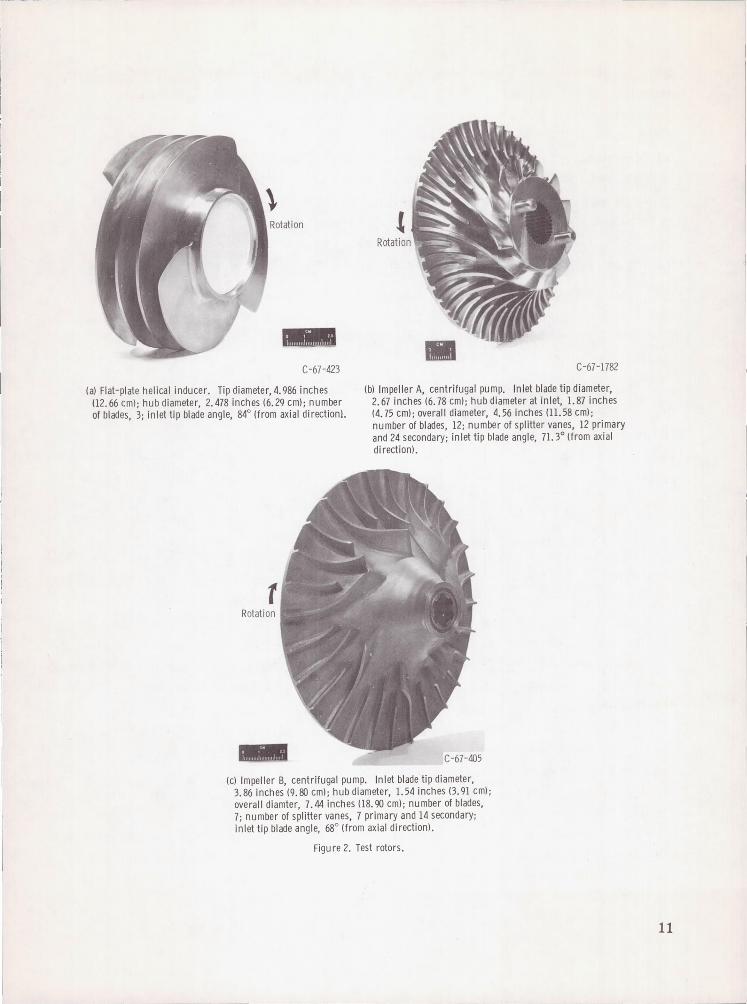
The test rotors used in the present study a r e shown in figure 2. Some of the geome- t r i c features of hach rotor a r e a l so presented in the figure. The flat-plate helical inducer (fig. 2(a)) is the same as that described fully in reference 9. The centrifugal pump im- peller with the 2.67-inch (6.78-cm) inlet blade t ip diameter, herein termed impeller A (fig. 2(b)), is described in reference 17. The other centrifugal impeller (inlet blade tip
10
C-67-423
(a) Flat-plate helical inducer. Tip diameter, 4.986 inches 02. 66 em); hub diameter, 2.478 inches (6.29 cm); number of blades, 3; inlet tip blade angle, 84° (from axial directionL
t Rotation
C-67-1782
(b) Impeller A, centrifugal pump. Inlet blade tip diameter, 2.67 inches (6.78 cm); hub diameter at inlet, 1.87 inches (4.75 cm); overall diameter, 4.56 inches (11.58 cm); number of blades, 12; number of splitter vanes, 12 primary and 24 secondary; inlet tip blade angle, 71. 3° (from axial direction).
(c) Impeller B, centrifugal pump. Inlet blade tip diameter, 3.86 inches (9.ro cm); hub diameter, 1.54 inches (3.91 cm); overall diamter, 7.44 inches (18.90 cm); number of blades, 7; number of splitter vanes, 7 primary and 14 secondary; inlet tip blade angle, 68° (from axial direction).
Figure 2. Test rotors.
11
diam, 3.86 in. or 9.80 cm), herein termed impeller By is shown in figure 2(c) and is described in reference 18. The impellers used f o r this study were those for which suf- ficient data were available to check the prediction method. They do not necessarily re- present the best designs for good cavitation performance. The ro tors were tested in ' the liquid-hydrogen tes t facilities located at the NASA Plum Brook Station.
The test procedure used to obtain the data was the same fo r the three rotors. Throughout each tes t run, the liquid temperature, rotative speed, and flow coefficient were held constant. cavitating conditions (q/qNC = 1.0) to a value that corresponds to about $/qNC = 0.7. This same procedure was used for each liquid temperature, rotative speed, and flow coef - ficient studied.
The NPSH was steadily reduced from a value corresponding to non-
RESULTS AND DISCUSSION
The prediction method was applied to an axial-flow inducer and several centrifugal pump impellers. These ro tors were operated in several different liquids at various liquid temperatures. for (1) an inducer operated in liquid hydrogen at various temperatures, (2) two centrifugal pump impellers operated at various values of flow coefficient and rotative speed in constant -temperature hydrogen, and (3) several smal l commer cia1 centrifugal pumps operated in a variety of liquids, each over a temperature range. Experimental data f o r the commercial pumps are taken from references 1 and 2.
Experimental and predicted cavitation performance resul ts a r e compared
Inducer Cavitation Pe r fo r m an ce
The cavitation performance f o r the 4.986-inch- (12.664-cm-) diameter research inducer shown in figure 2(a) is presented in figure 3. The data a r e for liquid hydrogen at temperatures f rom 27. 5' to 36.6' R (15.3 to 20.3 K) and for constant values of flow coefficient and rotative speed. As expected, fo r a given value of the head-rise coefficient ratio q/qNc, the required NPSH decreases rapidly with increasing hydrogen tempera- ture. The performance resul ts obtained at 27.5' and 31.7' R (15.3 and 17.6 K) were arbi t rar i ly chosen as reference test data to predict the NPSH requirements for hydrogen at 34.3' and 36.6' R (19.1 and 20.3 K). The predicted NPSH requirements (dashed lines of fig. 3) agree with experimental results.
temperatures for q/qNc of 0.9 and 0.8 a r e listed in table I. the Ahv values increased rapidly with increasing temperature.
The magnitude of the thermodynamic effects of cavitation realized at the various For both values of q/qNc,
12

20 .5.- m
10
2.2 (0. 7)
I 5
11. 5 (3. 5) 24.0 (7. 3) ----------
30 40 50 60 ..
Net positive suction head, NPSH, ft
i
i c 0
P ~
I I 1 I 10 15 20 25
Net positive suction head, NPSH, m
Hydrogen temperature,
T. "R (K)
0 36.6 (20.3) 0 34.3(19.1) 0 31.7 ( 17.6) n 27.5 (15.3)
Reference data Predicted values - - -_
Figure 3. - Comparison of experimental and predicted inducer cavitation performance for a n inducer in hydrogen at constant rotative speed of 20 OOO rpm and flow coefficient of 0.074.
The data of table I a lso show that the values of Ahv increase with decreasing values of the head coefficient ra t io increase in the length of cavity present within the blade passages. The analysis shows that Ahv should increase with cavity length AX under otherwise fixed conditions (see eq. (11)). Thus, the trend noted in table I is expected.
At a relatively low value of NPSH, depending on the pump design and mode of opera- tion, a condition can be reached where the static pressure in the inlet line becomes equal to the vapor pressure of the entering liquid. As a result, vapor forms in the inlet line,
A decrease in the value of implies an
TABLE I. - INDUCER CAVITY-PRESSURE
DEPRESSION VALUES
[Rotative speed, 20 000 rpm; flow coefficient, 0.074.1
Hydrogen t empera tu re , T, OR (K)
Cavity - p r e s s u r e depression, Ahy, f t of liquid (m of liquid)
13
and any further reductions in NPSH produce increasing amounts of vapor that are ingested by the pump. For the inducer performance data of figure 3, this condition of boiling in the inlet line occurred at an NPSH of about 17 feet (5.2 m). The data for 36.6' R (20.3 K) show that the test inducer was capable of pumping boiling hydrogen while maintaining about 8 5 percent of the noncavitating head-rise coefficient.
With vapor present in the inlet line, the requirement of flow similarity with respect to reference test conditions is, in general, not met; and thus the present method is not applicable to this mode of operation. The subject of two-phase flow in the inlet line and its effect on inducer cavitation performance in hydrogen is discussed in references 19 and 20.
Pump Cavitation Performance
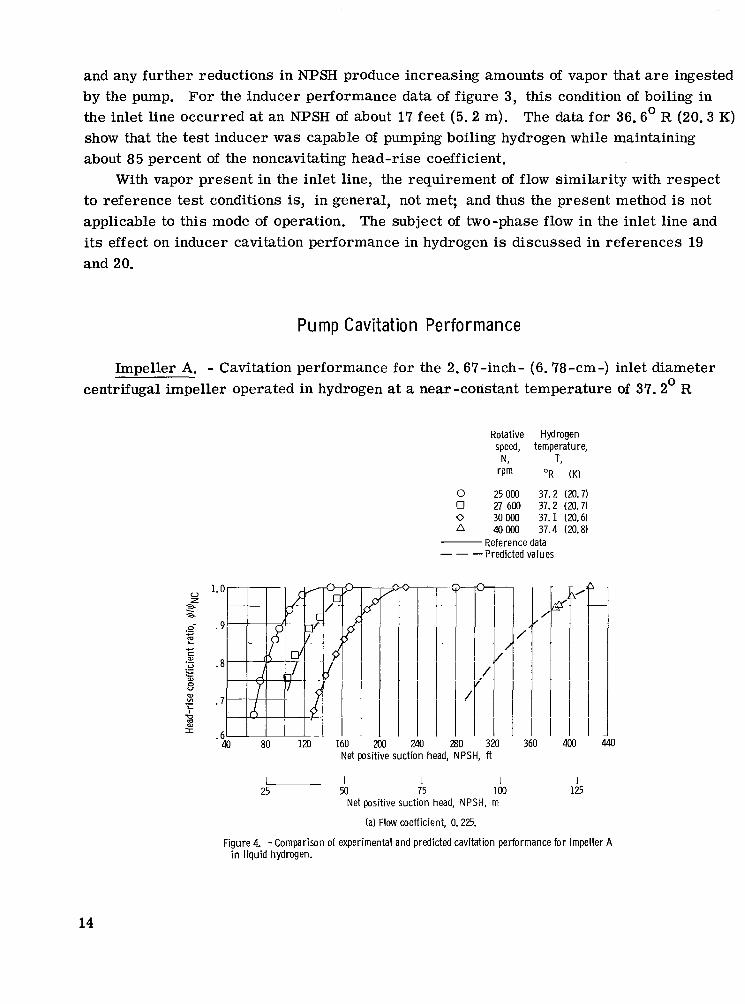
Impeller A. - Cavitation performance for the 2.67-inch- (6.78-cm-) inlet diameter centrifugal impeller operated in hydrogen at a near-constant temperature of 37.2' R
Rotative Hydrogen speed, temperature,
N, T, rpm OR (K)
0 25000 37.2 (20.7) 0 27 600 37.2 (20.71 0 30 000 37.1 (20.6)
40000 37.4 (20.8) Reference data
-- -Predicted values
." 40 80 120 160 203 ..
Net positive suction head, NPSH, ft
I 1 1 I I 25 50 75 100 125
Net positive suction head, NPSH, m
(a) Flow coefficient, 0. 225.
Figure 4. -Comparison of experimental and predicted cavitation performance for impeller A in l iquid hydrogen.
14
l . O I I I / I I d f I V I 7 1p I Id I
* I l l . 7 ~ I I .6
5 80 120
0
0’
Rotative Hydrogen speed, temperature,
rpm O R (K) N, T,
0 25000 37.0(20.6) 0 27700 36.7(20.4) 0 30 100 37.1 (20.6)
Reference data Predicted values ---
I I 1- 50 75 100 125
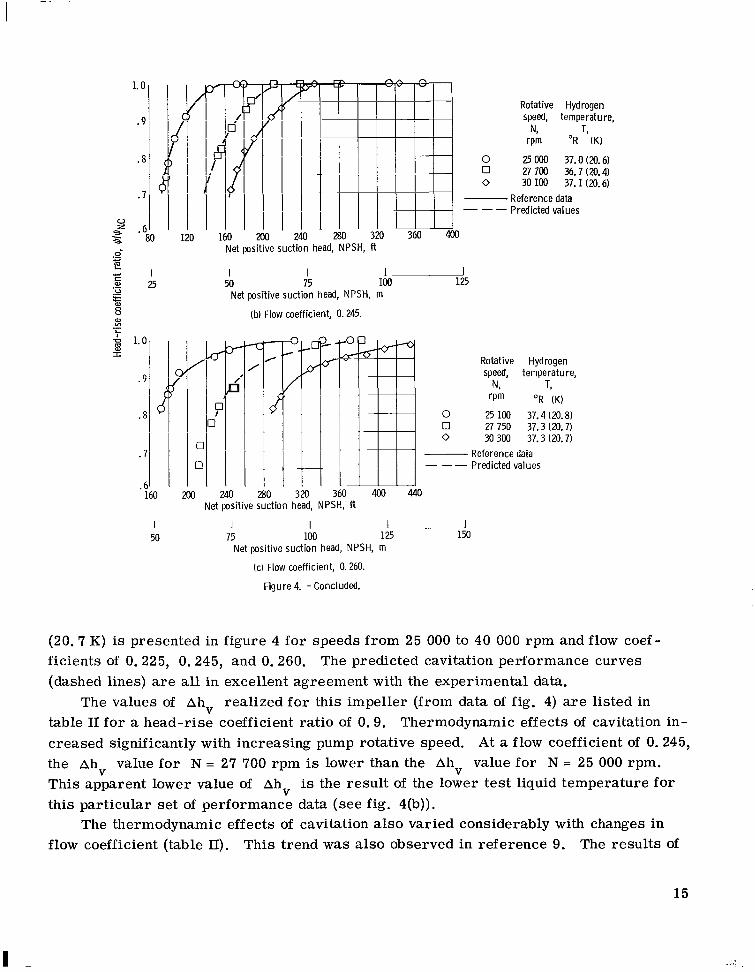
Net positive suction head, NPSH, m (b) Flow coefficient, 0.245.
Y
/
.61 1 160 200 240
T-6:
i I I 380 330 360 400 440
0 0 0
Rotative Hydrogen speed, temperature,
N, T, ‘pm O R (K)
25 100 37.4 (20.8) 27 750 37.3 (20.7) 30 300 37,3 (20.7)
Reference data Predicted values
__ - Net positive suction head, NPSH, ft
I I I I d
Net positive suction head, NPSH, m (c) Flow coefficient, 0.260.
Figure 4. -Concluded.
50 75 100 125 1%
(20.7 K) is presented in figure 4 for speeds from 25 000 to 40 000 rpm and flow coef - ficients of 0.225, 0.245, and 0. 260. (dashed lines) a r e all in excellent agreement with the experimental data.
table I1 for a head-rise coefficient ratio of 0.9. creased significantly with increasing pump rotative speed. the Ahv value for N = 27 700 rpm is lower than the Ahv value for N = 25 000 rpm. This apparent lower value of Ahv is the result of the lower tes t liquid temperature f o r this particular se t of performance data (see fig. 4(b)).
flow coefficient (table 11). This trend was also observed in reference 9. The resul ts of
The predicted cavitation performance curves
The values of Ahv realized fo r this impeller (from data of fig. 4) a r e listed in Thermodynamic effects of cavitation in-
At a flow coefficient of 0. 245,
The thermodynamic effects of cavitation also varied considerably with changes in
15
I
TABLE II. - IMPELLER A CAVITY-PRESSURE
Flow Nominal rotat ive speed, N, r p m I 25 000 27 700 30 000 40 000
0.225
reference 2 1 indicate that the magnitude of thermodynamic effects of cavitation is a func- tion of the noncavitqting wall p ressure distribution. affect the pressure distribution on the pump blades, this variation in thermodynamic ef - fects with flow coefficient is to be expected.
Because of the rapid change in the physical properties of hydrogen with temperature, the seemingly small variation in temperature of about 0.3' R (0.2 K) between the various performance curves, as in figure 4(a), must be accounted for if reasonably accurate pre- dictions are to be realized. predicted value of NPSH would have been 380 feet (115.8 m) of hydrogen instead of 361 feet (110.0 m) if the temperature for all the performance curves of figure 4(a) had been assumed to be constant at 37.1' R (20.6 K).
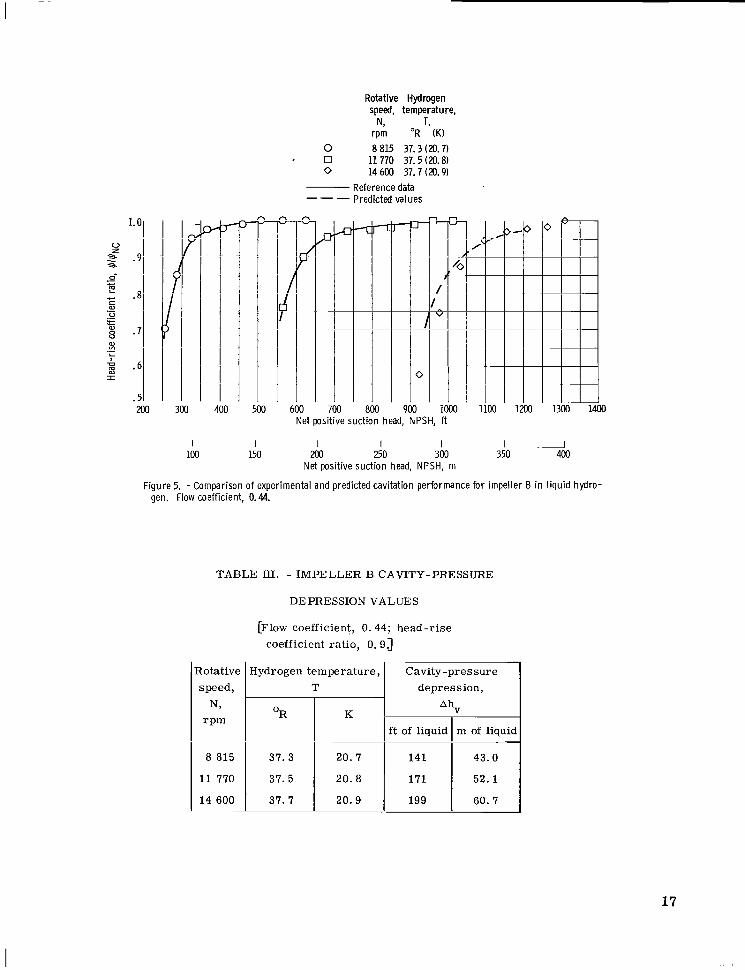
inlet diameter impeller operated in hydrogen at nearly constant temperature for three rotational speeds are presented in figure 5. The predicted cavitation performance (dashed line) is in good agreement with the experimental data. A s with pump impeller A, the thermodynamic effects of cavitation increase significantly with pump speed, as can be noted by the Ahv values listed in table III. However, for a comparable hydrogen temperature, the magnitudes of the thermodynamic effects fo r this impeller exceed the largest value noted for either the inducer or impeller A. The reason for these large changes in thermodynamic effects of cavitation with rotor design is not known at present.
dynamic effects of cavitation in liquid hydrogen a r e substantial. These effects depend on liquid temperature, rotor type and geometric design, rotative speed, flow coefficient cp, and, to some extent, head-rise coefficient ratio */qNC.
Since changes in flow coefficient
For N = 40 000 rpm and t,b/t,bNC = 0.9, fo r example, the
Impeller B. - Experimental and predicted resul ts fo r the 3.86-inch- (9.80-cm-)
An examination of the Ah values of tables I to 111 show conclusively that thermo- V
Cavi ty-pressure depression, Ahv, f t of liquid (m of liquid)
98 (29.9) 1103 (31.4) I106 (32.3) 1133 (40.5)
16
.245
.260
112 (34.1) 111 (33.8) 127 (38.7) --------- 110 (33.5) I l l 114 (34.8) 122 (37.2) ---------
lp
! I 300
I 100
400
I
500
1 150
Rotative Hydrogen speed, temperature,
rpm "R (K) N, T,
0 8 815 37.3 (20.7) - 0 11 770 37.5 (20.8)
0 14 600 37.7 (20.9) Reference data Predicted values ---
-E 1 r
4 1
I 600 700 800 900 1
Net positive suction head, NPSH,
I I I 200 250 300
Net positive suction head, NPSH, m
1200 1300 1
I 400
KI
Figure 5. - Comparison of experimental and predicted cavitation performance for impeller B in l iquid hydro- gen. Flow coefficient, 0.44.
TABLE III. - IMPELLER B CAVITY-PRESSURE
DEPRESSION VALUES
[Flow coefficient, 0.44; head-r i se coefficient ra t io , 0.91
Rotative
speed , N,
rPm ~
8 815
11 770
14 600 ~~~
Hydrogen tempera ture , T
Cavity - p r e s s u r e depress ion ,
Ahv
f t of liquid
141
171
199
m of liquic
43.0
52.1
60. 7
17
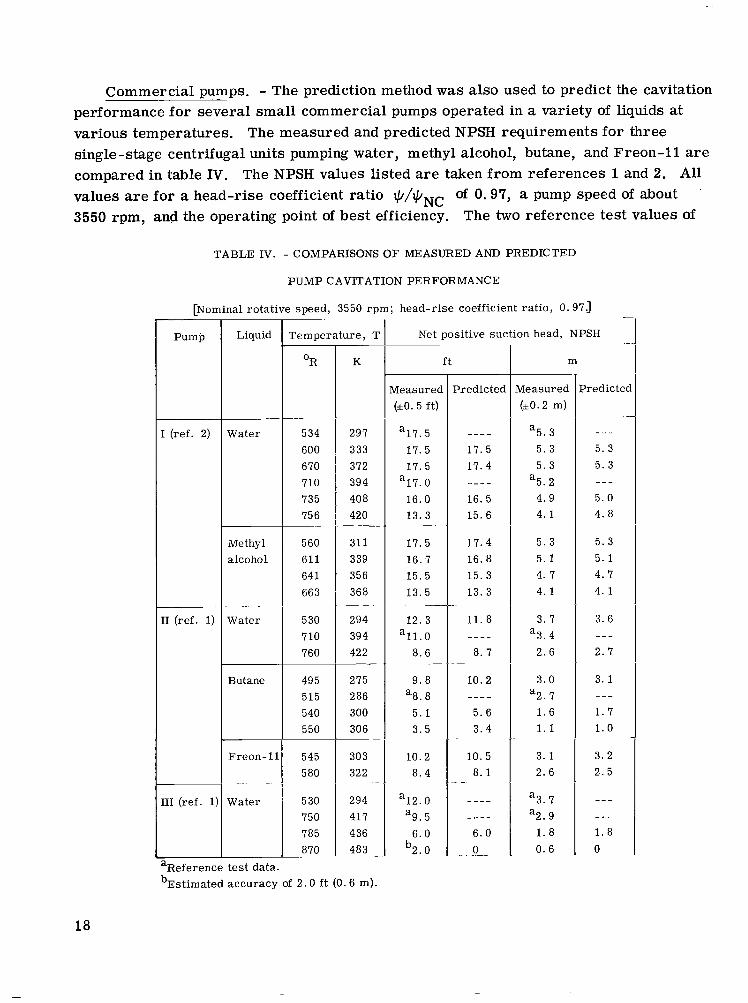
Commercial pumps. - The prediction method was also used to predict the cavitation performance for several small commercial pumps operated in a variety of liquids at various temperatures. The measured and predicted NPSH requirements for three single -stage centrifugal units pumping water, methyl alcohol, butane, and Freon-11 are compared in table IV. The NPSH values listed are taken from references 1 and 2. All values a r e for a head-rise coefficient ratio Q/QNC of 0.97, a pump speed of about 3550 rpm, and the operating point of best efficiency. The two reference test values of
TABLE IV. - COMPARISONS O F MEASURED AND PREDICTED
PUMP CAVITATION PERFORMANCE
[Nominal rotat ive speed, 3550 r p m ; head-r i se coefficient ra t io , 0.97.1
Pump
[ (ref. 2)
[I1 (ref . 1
Liqu
Water
Methy alcoho
Water
Butant
F r e o n
Water
r e m p e r a t u r e , T
OR
~-~ ~
534 600 670 710 735 756
560 611 64 1 663
530 710 760
495 515 540 550
545 5 80
5 30 750 785 870
~~
K
297 333 372 394 408 420
311 339 356 368
294 394 422
275 286 300 306
__
_ _
-~
303 322
294 417 436 483 -
-
-
Net positive suct ion head, NPSH
Keasured bo. 5 f t )
a17. 5 17. 5 17. 5
a17. 0 16 .0 13. 3
17 .5 16 .7 15. 5 13. 5
1 2 . 3
8 .6
9 . 8 a8. 8
5 . 1 3 . 5
10 .2 8 . 4
-
. -
a l l . O
~
a12. 0 a9. 5
6 . 0 -b2.0
f t
Predicted
_ _ _ _ 17 .5 17. 4 -_ -_
16. 5 15. 6
1 7 . 4 1 6 . 8 15. 3 13. 3
11. 8 _ _ _ _
8. 7
10 .2
~
-_ - - 5. 6 3 . 4
10 .5 8 . 1 _ _
_ _ _ _ _---
6 . 0 0 -.
.-
m
Ueasured 6 0 . 2 m)
a5. 3 5 . 3 5 . 3
a5. 2 4 . 9 4 . 1
5 . 3 5 . 1 4. 7 4 . 1
3 . 7 a3. 4
2. 6
3 .0 a2. 7
1 . 6 1.1
3 . 1 2 .6
a3. 7 a2. 9
1. 8 0 . 6
Predictec
- - - 5 . 3 5 . 3 _ _ _ 5 . 0 4. 8
5 . 3 5 . 1 4 . 7 4 . 1
3 . 6 _ _ _ 2 . 7
3 . 1 _- - 1 . 7 1 . 0
3. 2 2 . 5
_ _ _ _-- 1. 8 0
aReference t e s t data . bEst imated accuracy of 2 . 0 f t (0.6 m).
18
- - -. I
NPSH listed f o r each pump (noted by (a)) were arbi t rar i ly chosen to determine reference values of vapor- to liquid-volume ratio (.v,/.u ) and subsequently (Ahv) for use in ' ref ref the prediction method. The predicted resul ts a r e in excellent agreement with the experi- mental data. In fact, except for the 756' R (420 K) water data fo r pump I, the predicted values are all within the experimental accuracy of measured NPSH values.
which implies that this pump should have been capable of satisfactory operation at an NPSH value sufficiently low to cause vapor to form in the inlet line. Reference 2 states that there were indeed indications of flashing in the inlet line at rated flow.
As a consequence, the listed NPSH value of 2.0 feet (0.6 m) of water was actually determined by extrapolation of performance data obtained at less-than-design flow rates. This set of data, as well as the hydrogen data of figure 3, i l lustrates that it is possible to pump boiling liquids satisfactorily if the fluid being pumped has sufficiently high ther- modynamic effects of cavitation.
For pump 111 operated in 870' R (483 K) water, the predicted NPSH value is zero,
CONCLUDING REMARKS
The method for predicting the cavitation performance of pumps presented herein provided consistently good agreement between predicted and experimental results for several different pumps operated in liquids having widely diverse physical properties. Use of the method requires that two se t s of tes t data, at least one of which provides measurable thermodynamic effects, be available for the pump and operating conditions of interest. However, the tes t data need not necessarily be for the same liquid, liquid temperature, o r pump rotative speed. of cavitation performance for a given pump can be made for any liquid, liquid tempera- ture, and pump rotative speed provided that a condition of flow similari ty is maintained.
The method also has useful application in the generalization of experimental data obtained with liquids that exhibit substantial thermodynamic effects of cavitation. Pump studies involving a particular liquid, for example, need not be conducted at precise values of liquid temperature or rotative speed since, by use of the present method, the data can be normalized or adjusted to any convenient liquid temperature o r pump speed. the prediction method may provide substantial reductions in the cost and development time required for new pump designs, particularly for those used in the aerospace field. It should be possible to conduct development testing at reduced speed using convenient or easy-to-handle liquids that exhibit thermodynamic effects of cavitation, such as Freon or high-temperature water; f rom these tests, the cavitation performance for the liquid and operating condition of interest may be predicted.
From these reference tests, accurate predictions
Use of
19
Although additional studies are required to prove the validity of the method to size effects for geometrically similar pumps, additional substantial savings a r e possible if the method can be used to accurately predict the cavitation performance for a full-scale pump f rom test results obtained for smaller prototypes.
Lewis Research Center, National Aeronautics and Space Administration,
Cleveland, Ohio, March 27, 1969, 128-31-32-12-22.
20

APPENDIX A
SYMBOLS
D
g
g C
hC
hO
hV
AhV
AH
J
K
Kc,min
k
L
N
T
AT
vO
v1
5 “YV
AX
CY
I
specific heat of liquid, Btu/(lbm)(OR); J/(kg)(K)
characterist ic body dimension, in. ; cm local acceleration due to gravity, 32.163 ft/sec 2 ; 9.80 m/sec 2
dimensional constant, 32. 174 (ft)(lbm)/(sec2)(lbf); 1. 0 (m)(kg)/(sec 2 )(N)
pump or inducer head rise, f t of liquid; m of liquid
pressure in cavitated region, f t of liquid abs; m of liquid abs
f ree-s t ream or pump inlet static pressure, f t of liquid abs; m of liquid abs
vapor pressure corresponding to f ree-s t ream temperature, f t of liquid abs; m of liquid abs
decrease in vapor pressure due to vaporization, f t of liquid; m of liquid
mechanical equivalent of heat, 778 (ft)(lbf)/Btu
developed cavitation parameter based on f r ee -s t ream vapor pressure, (ho - hv)/(Vi/2g)
(ho - hc,min)/(vo/2g) 2 developed cavitation parameter based on minimum cavity pressure,
thermal conductivity of saturated liquid, (Btu)(ft)/(hr)(ft 2 0 ) ( R); J/(m)(sec)(K)
latent heat of vaporization, Btu/lbm; J/kg
rotative speed, rpm
free-s t ream liquid temperature, OR; K decrease in local equilibrium temperature due to vaporization, 0 R; K
blade tip velocity, ft/sec; m/sec
free-s t ream velocity, ft/sec; m/sec
mean axial inlet velocity, ft/sec; m/sec
volume of saturated liquid, cu f t ; cu m
volume of saturated vapor, cu f t ; cu m
length of cavitated region, in. ; cm
thermal diffusivity, k/pzCZ, ft2/hr; m2/hr
specific volume of saturated liquid, cu ft/lbm; cu m/kg
specific volume of saturated vapor, cu ft/lbm; cu m/kg *V
saturated liquid density, Ibm/cu ft; kg/cu m PI saturated vapor density, lbm/cu f t ; kg/cu m PV flow coefficient, v /U P 1 T
2 Q head -rise coefficient, AH/UT
Subs c r ip ts :
min minimum
NC noncavitating
pred predicted value
ref
2 V
reference value obtained from experimental tests
22

APPENDIX B
NUMERICAL EXAMPLES
Example 1 - Predict ion Based o n Test Data Obtained fo r a
Given L iqu id at Var ious Temperatures
Cavitation performance curves a r e available for an inducer operated at a constant flow coefficient and rotative speed in liquid hydrogen at 27. 5' and 31. 7' R (15 .3 and 1 7 . 6 K); see figure 3.
at a head-rise coefficient ratio of 0 . 9 for the same operating conditions. To be determined is the inducer NPSH required for 36.6' R (20 .3 K) liquid hydrogen
From the analysis presented ear l ier ,
NPSH + Ahv \ N /
and
With 27. 5' R (15 .3 K) hydrogen data arbi t rar i ly chosen for reference conditions, the values of NPSH for a head-rise coefficient ratio of 0 . 9 (from fig. 3) a r e
NPSHref = 63. 5 f t (19 .4 m) f o r Tref = 27. 5' R (15 .3 K)
NPSH = 57 .4 f t (17 .5 m) f o r T = 31.7' R (17 .6 K)
-4 2 For this example, Nref = N; aref = 7 . 7 1 ~ 1 0 - ~ square feet per hour (7.16X10 a = 7 . 2 3 ~ 1 0 - ~ square feet per hour (6.71xlO equations (B l ) and (B2) yields
m /hr); -4 2 m /hr). Substitution of these values into
Ahv - (Ahv) = 6 . 1 f t ( 1 . 9 m) ref
and
I
23
(;) = 1.07 (;) ref
An iterative solution of these two expressions using the curves of figure l(a) resul ts in the following:
(2) = 0.25
ref
and
(Ahv) = 2.0 f t (0. 6 m) ref
For hydrogen at 36; 6' R (20.3 K), CY = 6 . 6 9 ~ 1 0 - ~ square feet per hour (6. 22X10e4 m2/hr). With the use of this value f o r a and the foregoing reference value for ( < / f ) equation (B2), the predicted (^v,/.v,)
in ' ref fo r 36.6' R (20.3 K) hydrogen is pred
fV = 0.25 ( l .O) ( 7. V X ~ O - ~ -3) = 0.29 ("pr ed 6 . 6 9 ~ 1 0
From figure l(a), the corresponding value for Ahv is 35.0 feet (10.7 m). The predicted value of required NPSH fo r 36.6' R (20.3 K) hydrogen is obtained by substitution of the reference values and Ahv into equation (Bl); thus,
NPSH = 63.5 + 2.0 - 35.0 = 30.5 f t (9.3 m)
The corresponding measured value of NPSH is about 30.0 feet (9.1 m).
Example 2 - Predict ion Based o n Test Data Obtained w i t h a Given L iqu id
at D i f fe ren t Temperatures and Pump Rotative Speeds
Cavitation performance curves are available for a pump handling 37.2' R (20.7 K) hydrogen at 25 000 rpm and 37.1' R (20.6 K) hydrogen at 30 000 rpm at a constant flow coefficient of 0.225 (see fig. 4(a)).
24
. I
To be determined is the pump NPSH required with 37.4' R (20.8 K) hydrogen fo r a head-rise coefficient ratio of 0.95 , a pump speed of 40 000 rpm, and the same flow coef- ficient.
With the data for 25 000 rpm abitrari ly taken as reference conditions, the NPSH values for a head-rise coefficient ratio of 0 . 9 5 (from fig. 4(a)) are
NPSHref = 107.5 f t (32.8 m) fo r 25 000 rpm = Nref
NPSH = 190.0 f t (57.9 m) for 30 000 rpm = N
Substitution of these values in equations (Bl ) and (B2) yields
(Ahv) - 0.695 Ahv = 24. 5 f t (7. 5 m) ref
($) = l6 (;)ref
An iterative solution of the two preceding expressions using the curves of figure l(a) results in the following reference values: (Note: for this example, changes in CY
(eq. (B2)) a r e negligible; but effects of small changes in hydrogen temperature a r e ac- counted for in the use of curves of fig. 1 . )
= 0.80; (Ahv) = 9 8 . 0 f t (29 .9 m) at 25 000 rpm ref
Substituting ( fv/VL) into equation (B2) gives the value of ( Vv/Y ) ref pred
for 40 000 rpm
(2) = 0 . 8 (Eoa8 = 1 . 1 7 where CY = aref
pred
From figure l(a), the corresponding value of Ahv at 37.4' R (20 .8 K) is 134.0 feet (40 .8 m). Substituting for Ahv and N in equation ( B l ) and solving fo r NPSH yields
25
lo7. + 98- - 134.0 = 392.1 f t (119. 5 m) (NPSH)pred =
The corresponding measured value from figure 4(a) is about 387 feet (118.0 m).
Example 3 - Predic t ion Based on Test Data Obtained Us ing D i f fe ren t L iqu ids
The NPSH requirements are given fo r pump I1 (table IV) handling 710' R (394 K) water and 515' R (286 K) butane at fixed operating conditions (3550 rpm and */qNC =
To be determined is the pump NPSH required for 550' R (306 K) butane under the
With the water data arbi t rar i ly chosen for reference, the NPSH values (from ta-
0.97).
same operating conditions.
ble IV) a r e
NPSHref = 1 1 . 0 f t ( 3 . 4 m) for 710' R (394 K) water
NPSH = 8 . 8 f t (2 .7 m) for 515' R (286 K ) butane
Values of liquid thermal diffusivity a a r e 6. 60X10-3 square feet per hour ( 6 . 1 3 ~ 1 0 - ~ -4 2 m2/hr) for 710' R (395 K) water and 4. O W ~ O - ~ square feet per hour (3.73xlO
for 515' R (286 K) butane. tions (B l ) and (B2) yields
m /hr) Substituting the foregoing values of NPSH and LY into equa-
Ahv - (Ahv) = 2 . 2 f t (0 .7 m) ref
(;)= (;)ref
An itera ive solution of the above relations using the curves of f igur l(b) gives
26
I_ I .-..I-., - 1 1 1 1 1 1 1 1-11 I 1.11111111-11 I 111 111 1111 1 1 1 I I1 111..111-.111111
Substituting (Yv/T ) 550' R (306 K) butane
into equation (B2) yields the predicted value of (vv/+' ) fo r ref 2
= 0.49 (1.0) (6. 6 o x 1 0 ~ ~ ) = 0 .80 ('Ipred 4.02xlO
for butane, ' ~ ~ ~ ~ o From figure l(b), the corresponding value of Ahv is 8 . 3 feet (2. 5 m). Thus, f rom equation (Bl) , the predicted NPSH fo r pump 11 (table IV) pumping 550' R (306 K) butane at 3550 rpm and a head-rise coefficient ratio of 0.97 is
(306 K) = c ~ ~ ~ ~ o (286 K).
NPSHpred = 11.0 + 0 . 7 - 8. 3 = 3 . 4 f t (1 .0 m)
From table IV, the corresponding measured NPSH is 3. 5 feet ( 1 . 1 m).
27
I
REFERENCES
1. Salemann, Victor: Cavitation and NPSH Requirements of Various Liquids. J. Basic Eng., vol. 81, no. 2, June 1959, pp. 167-180.
2. Spraker, W. A. : The Effects of Fluid Properties on Cavitation in Centrifugal Pumps. J. Eng. Power, vol. 87, no. 3, July 1965, pp. 309-318.
3. Wilcox, Ward W. ; Meng, Phillip R. ; and Davis, Roger L. : Performance of an Inducer -Impeller Combination at or Near Boiling Conditions for Liquid Hydrogen. Advances in Cryogenic Engineering. Vol. 8, K. D. Timmerhaus, ed., Plenum Press, Inc., 1963, pp. 446-455.
4. Jacobs, Robert B. : Prediction of Symptoms of Cavitation. J. Res. Natl. Bur. Std., sec. C, vol. 65, no. 3, July-Sept. 1961, pp. 147-156.
5. Stahl, H. A. ; and Stepanoff, A. J. : Thermodynamic Aspects of Cavitation in Cen- trifugal Pumps. Trans. ASME, vol. 78, no. 8, Nov. 1956, pp. 1691-1963.
6. Stepanoff, A. J. : Cavitation in Centrifugal Pumps with Liquids Other Than Water. J. Eng. Power, vol. 83, no. 1, Jan. 1961, pp. 79-90.
7. Stepanoff, A. J. : Cavitation Properties of Liquids. J. Erg. Power, vol. 86, no. 2, Apr. 1964, pp. 195-200.
84' Helical Pump Inducer Operated in 37' and 42' R Liquid Hydrogen. NASA 8. Ball, Calvin L. ; Meng, Phillip R. ; and Reid, Lonnie: Cavitation Performance of
TM X-1360, 1967.
9. Meng, Phillip R. : Change in Inducer Net Positive Suction Head Requirement with Flow Coefficient in Low Temperature Hydrogen (27.9' to 36.6' R). NASA TN D-4423, 1968.
10. Gelder, Thomas F. ; Ruggeri, Robert S. ; and Moore, Royce D. : Cavitation Similar - ity Considerations Based on Measured P r e s s u r e and Temperature Depressions in Cavitated Regions of Freon-114. NASA TN D-3509, 1966.
11. Moore, Royce D; and Ruggeri, Robert S. : Venturi Scaling Studies on Thermodyna- mic Effects of Developed Cavitation of Freon-114. NASA TN D-4387, 1968.
12. Ruggeri, Robert S. ; and Gelder, Thomas F. : Cavitation and Effective Liquid Ten- sion of Nitrogen in a Tunnel Venturi. NASA TN D-2088, 1964.
13. Pinkel, I. Irving; Hartmann, Melvin J.; Hauser, Cavour H.; Miller, Max J.; Ruggeri, Robert S. ; and Soltis, Richard F. : Pump Technology. Selected Tech- nology for the Petroleum Industry. NASA SP-5053, 1966, pp. 81-101.
28

14. Ruggeri, Robert S. ; Moore, Royce D. ; and Gelder, Thomas F. : Method for Pre- dicting Pump Cavitation Performance. Paper presented at the ICRPG Ninth Liquid Propulsion Symposium, St. Louis, Oct. 25-27, 1967.
15. Hord, Jesse; Edmonds, Dean K. ; and Millhiser, David R. : Thermodynamic Depres- sions Within Cavities and Cavitation Inception in Liquid Hydrogen and Liquid Nitro- gen. Rep. 9705, National Bureau of Standards (NASA CR-72286), Mar. 1968.
16. Moore, Royce D. ; and Ruggeri, Robert S. : Prediction of Thermodynamic Effects of Developed Cavitation Based on Liquid-Hydrogen and Freon-114 Data in Scaled Venturi. NASA TN D-4899, 1968.
17. Urasek, Donald C. : Investigation af Flow Range and Stability of Three Inducer- Impeller Pump Combinations Operating in Liquid Hydrogen. NASA TM X-1727, 1969.
18. Miller, Max J. ; and Soltis, Richard F. : Detailed Performance of a Radial-Bladed Centrifugal Pump Impeller in Water. NASA TN D-4613, 1968.
19. Meng, Phillip R. ; and Connelly, Robert E. : Investigation of Effects of Simulated Nuclear Radiation Heating on Inducer Performance in Liquid Hydrogen. NASA TM X-1359, 1967.
20. Urasek, Donald C. ; Meng, Phillip R. ; and Connelly, Robert E. : Cavitation Per- formance of 80.6' Helical Inducer in Liquid Hydrogen. NASA TN D-5258, 1969.
21. Moore, Royce D. ; Ruggeri, Robert S. ; and Gelder, Thomas F. : Effects of Wall Pressure Distribution and Liquid Temperature on Incipient Cavitation of Freon-114 and Water in Venturi Flow. NASA TN D-4340, 1968.
NASA-Langley, 1969 - 15 E-4832 29
NATIONAL AERONAUTICS AND SPACE ADMINISTRATION WASHINGTON, D. C. 20546
OFFICIAL BUSINESS FIRST CLASS MAIL
POSTAGE A N D FEES PAID NATIONAL AERONAUTICS A N
SPACE ADMINISTRATION
POSTMASTER: If Undelivcrdble (Section 158 Postal Manual) Do Not Recur
-
"The aesonnicticnl nnd space nctivities of the United States shall be condgicted so as to contribute . . , to the expansion of huitinn Knowl- edge of phenoniena in the ntitiosphere and space. T h e Adiizinistrrttion shall provide for the widest practicable and appropvinte disseiiiinntioia of infositintion concerning i ts actiilities nnd the vesrrlts thereof."
-NATIONAL AERONAUTICS AND SPACE ACT OF 1958
NASA SCIENTIFIC AND TECHNICAL PUBLICATIONS
TECHNICAL REPORTS: Scientific and technical information considered important, complete, and a lasting contribution to existing knowledge.
TECHNICAL NOTES: Information less broad in scope but nevertheless of importance as a contribution to existing knowledge.
TECHNICAL MEMORANDUMS : Information receiving limited distribution because of preliminary data, security classifica- tion, or other reasons.
TECHNICAL TRANSLATIONS: Information published in a foreign language considered to merit NASA distribution in English.
SPECIAL PUBLICATIONS: Information derived from or of value to NASA activities. Publications include conference proceedings, monographs, data compilations, handbooks, sourcebooks, and special bibliographies.
TECHNOLOGY UTILIZATION PUBLICATIONS: Information on technology used by NASA that may be of particular interest in commercial and other non-aerospace applicatiom. Publications include Tech Briefs, TEchnology Utilization Reports and Notes, and Technology Surveys.
CONTRACTOR REPORTS: Scientific and technical information generated under a NASA contract or grant and considered an important contribution to existing knowledge.
Details on the availability of ihese publications may be obtained from:
SCIENTIFIC AND TECHNICAL INFORMATION DIVISION
NATI 0 NA L AERON AUT1 C S AN D SPACE ADM I N I STRATI ON Washington, D.C. 20546