nasa technical report · technical report if lith loan copy: return to kirtland afb, n mex afwl...
TRANSCRIPT

N A S A
EFFECTS
T E C H N I C A L
R E P O R T
IF LITH
LOAN COPY: RETURN TO
KIRTLAND AFB, N MEX AFWL (WLIL-2)
A N D OXYGEN LOSSES ON THE MAGNETIC AhTD CRYSTALLOGRAPHIC PROPERTIES OF SPINEL LITHIUM FERRITE
by D. H. RidgZey, H. Less05 und J. D. ChiZdress
Electronics Reseurcrb Center Cumbridge, Muss.
P
N A T I O N A L AERONAUTICS A N D SPACE A D M I N I S T R A T I O N 9 WASHINGTON, D . C. M A R C H 1 9 6 9
https://ntrs.nasa.gov/search.jsp?R=19690011413 2018-06-17T14:18:11+00:00Z

TECH LIBRARY KAFB. NY
EFFECTS OF LITHIUM AND OXYGEN LOSSES
ON THE MAGNETIC AND CRYSTALLOGRAPHIC PROPERTIES
O F SPINEL LITHIUM FERRITE
By D. H. Ridgley, H. Lessoff, and J. D. Chi ldress
Electronics Re search Center Cambridge, Mass.
NATIONAL AERONAUTICS AND SPACE ADMINISTRATION
For sale by the Clearinghouse for Federal Scientific ond Technical Information Springfield, Virginia 22151 - C F S T I price $3.00

*Presented in part at the Seventieth Annual Meeting, The American Ceramic Society, Chicago, Ill., April 24, 1968 (Electronics Division, No. 34-E-68).
EFFECTS OF LITHIUM AND OXYGEN LOSSES ON THE MAGNETIC AND CRYSTALLOGRAPHIC PROPERTIES
OF SPINEL LITHIUM FERRITE*
By D. H. Ridgley, H. Lessoff, and J. D. Childress Electronics Research Center
SUMMARY
The magnetic moment and lattice parameter of stoichiometric spinel lithium ferrite (Lio.5Fe2.5011) has been reliably estab- lished, respectively, as 3736 f 20G at 25OC and 8.3293 2 0.0005& at 28OC. Under 1 atmosphere of oxygen, lithium ferrite loses both oxygen and lithium oxide in increasing amounts with in- creasing temperature above about 950 to 1000°C. Slow cooling and annealing at a lower temperature bring about reoxidation and precipitation of a-Fe203. Rapid cooling from the sintering temperature leads to anomalously high magnetic moments and lat- tice parameters; lower temperature anneals and very slow cooling rates produce anomalously low moment values. Intermediate cooling procedures lead to properties intermediate between these properties.
The properties of the resultant product can be explained very satisfactorily on the basis of solid solutions between lithium ferrite and Fe304 with rapid cooling and on the basis of solid solution between lithium ferrite and y-Fe203 with a second phase of a-Fe203 on lower temperature annealing and slow-cooling.
It is doubtful whether the second limiting case described above can occur to any appreciable extent because of the tendency of the products to precipitate the excess Fez03 as a-Fe203.
Finally one is led to the following conclusion: The lithium oxide volatilization is associated with oxygen loss under moder- ate oxygen pressure (-1 atmosphere), but the oxygen loss can be shown to be the primary cause of the lithium loss under normal sintering conditions.
I. INTRODUCTION
Although spinel lithium ferrite has been studied by a number of workers (refs. 1-14), the properties of the stoichiometric material remain very much in doubt. Reported magnetic moments

(47~M~) vary from 2400 (ref. 121 to 3900 gauss (ref. 151, lattice parameters from 8.314 to 8.37 A (ref. 151, Curie temperatures from 590 to 68OoC, and resistivities are reported from a few ohm- centimeters to values many orders of magnitude higher. Prior work on lithium ferrite has been reviewed and summarized by von Alouck (ref. 15). Much consideration has been given to the order-disorder transition occurring near 75OoC, but little concern has been shown for the effects of ferrous ion or lack of stoichiometry. Much of the variation in properties can probably be traced to these last factors and, thus, to the preparation techniques. Only occasion- ally are the materials characterized by x-ray diffraction and rarely are such characterizations reported in detail.
It is generally accepted that lithium volatilizes rapidly from lithium ferrite and similar materials, but the quantitative evidence presented has been limited. This results from the absence of a good analytical method for lithium, the errors of analysis being comparable in many cases to the expected lithium deficiencies.
Strickler and Roy (ref. 10) studied the Li20-Fe203 system and found that the solubility of LiFeO;! in Li0.5Fe2.504 to be less than 5 percent and probably less than 1 percent. Others (refs. 7,8) have reported studies of materials analyzed and found to have compositions containing large excesses of Li20. This dis- crepancy is not insignificant.
A study of the effects of sintering conditions on the mag- netic and crystallographic properties of lithium ferrite was made and are reported in this document. The experimental details are given in section 11, the observed results in section 111, and the authors' interpretations in section IV.
11. EXPERIMENTAL METHODS
Materials Preparation
All samples were prepared from reagent grade Li2CO3 and y-Fe~O3. The y-Fe203 was analyzed by standard techniques; the Li2CO3 was analyzed by acid titration, which requires the assump- tion of no significant quantity of metal ions other than lithium. The quantities of Li2C03 and y-Fe203 were adjusted in accordance with these analyses.
The calculated amounts of Li2C03 and y-Fe203 were combined and milled 8 hours under ethanol in an attritor. This product was dried, passed through a 100 mesh screen, and heated in air at 7OO0C for 4 hours. The resulting material was remilled under ethanol, as previously, dried, and screened.
2

This prefired Li2C03-Fe203 material was fired under 1 atmos- phere of oxygen at temperatures from 900 to 14OOOC for times varying from 1 minute to 72 hours after the samples reached tem- perature. The majority of the samples were fired for either 4 or 24 hours. The heat treatments were concluded by varied cooling schedules, including sharp cooling by rapid removal of the samples from the furnace to room ambient conditions, and by controlled cooling under 1 atmosphere of oxygen at rates varying from 20 to 320°C/hr. The sharply cooled and slowly cooled samples for each sintering schedule were heated simultaneously under oxygen, and then one sample container was removed and sharply cooled in air, while the other was cooled slowly at a controlled rate under 1 atmosphere of oxygen. A l l such samples were characterized by x-ray diffraction and magnetic moment measurements. The pre- viously sharply cooled samples were subsequently annealed in oxygen at 900°C for 8 hours, and then cooled to room temperature at 10°C/hr. The x-ray diffraction and magnetic moment measure- ments were then repeated.
Magnetic Measurements
Magnetic moments of the products, after the various heating schedules, were determined at room temperature (25OC) using a Princeton Applied Research vibrating sample magnetometer (Foner type) at an applied field of 8 kOe. To reduce the effects of temperature fluctuations, a selected lithium ferrite sample was compared with nickel (99.999%) in a series of a large number of measurements. All products were compared with this one product. The probable error of the individual magnetic measurements is estimated to be about f25 G. The value assumed for nickel was 54.39 emu/g.
X-ray Diffraction Measurements
Lattice parameters of all products were determined using a Norelco diffractometer with Cu Ka radiation (Ka1 = 1.54051 8, Kan = 1.54433 A ) , and an Advanced Metals Research focusing LiF crystal monochromator in the diffracted beam, a scintillation counter detector, and pulse-height discriminator. Scanning speed was 1/8 deg 20/min with a 1-sec time constant; data was recorded as 1 deg 20/in. of chart length. Other measurement conditions were: standard flat sample without rotation in the plane of the sample surface; 1 deg divergence slit throughout the scan: hori- zontal divergence of Soller slits 4.5 deg. Peak angle positions were taken as the highest point of the peak. A l l x-ray measure- ments were made at 28OC, the ambient temperature of the room which was found to remain constant to within floc. Lattice parameters calculated from the various peaks with 28 > 90 deg were plotted versus cos2 0 and extrapolated to cos’ 8 = 0. The lattice parameter of one sample was determined by the extrapolation
3

method and also by use of silicon as internal standard; the values found differed by 0.0005 f i . silicon derived from this same scan using the extrapolation method was 5.4308 f i ; the I.U.C. value according to Parrish (ref. 16) is 5.43050 at 25OC (5.43054 at 28OC after applying the thermal expansion coefficient) without refraction correction. This latter difference (-0.003 f i ) was applied as a correction to all extrapolated lattice parameters. This difference is thought to arise primarily from a failure of the lattice parameter values calculated from the individual diffraction peaks to be a true linear function of the extrapolation function cos2 8 . The prob- able error gf the lattice parameter measurements is estimated to be +0.0005 A.
The lattice parameter of
111. RESULTS
The effects of the various heat treatments are shown in Figures 1 and 2. In Figure 1 the moment values plotted are not the true 47rM, values since the density increases during the heat treatment, as explained in section IV. The values shown are proportional to the moment per unit weight and are the values which would be obtained if the separate products were prepared under those conditions and were assumed to be stoichiometric lithium ferrite. It can be seen that as the sintering tempera- ture is increased, the moments (Figure 1) and the lattice param- eters (Figure 2) increase in parallel fashion, both for the sharply cooled and the slowly cooled materials. When the mate- rials originally sharply cooled were annealed at 900°C for 8 hours and then cooled very slowly (lO°C/hr), the moments de- creased with increase in the temperature of the initial firing, but the lattice parameters decreased to values differing from each other and from the stoichiometric value, 8.3293 A , only slightly (see section IV).
Each of the x-ray diffraction patterns of the products, after this annealing treatment, showed the presence of a-Fe203, except the sample sintered at 1000°C for only 4 hours. All those samples heated at 900°C only showed a-Fe203 in the x-ray patterns, regardless of the time at temperature or the rate of cooling; however, this is regarded as the result of incomplete reaction. Because of the relatively low x-ray scattering amplitude of lithium and oxygen, only rather large amounts of Li2O (and Li2C03) could be detected by x-ray diffraction methods. No attempt was made to achieve a greater degree of reaction by a series of regrindings and firings.
The relative quantity of a-Fe203 was gauged by the intensity of the 104 peak (the strongest a-Fe203 diffraction) appearing at
4

4000
3800
F 3600 Y
0 I 0 c w z c3
2 3400
RS., SHARPLY COOLED
4 HRS.,COOLED 220°C I HR.
+900°C ANNEAL
4 HRS., SHARPLY COOLED + 9 0 0 ° C ANNEAL
900 1000 1100 1200
SINTERING TEMPERATURE ( " C )
1300
Figure 1.- Effects of sintering temperatures, sintering times, and cooling rate on magnetic moment (density assumed 4.759 g/cm3 . I

43410
8.3390
A
.a
K W I- W
U
- 83370
5 83350 if
E w 8.3330
t-
8.3310
83290 I I I I I I I 1 I
900 1000 I100 1200 1300 SINTERING TEMPERATURE ('C)
Figure 2.- Effects of sintering temperatures, sintering times, and cooling rates on lattice parameter.

I ' -
about 33.30 deg 28 The height of this peak was zero for the sample fired initially 4 hours at 1000°C, a small bump on the background with 24 hours at 1000°C; it then increased with increasing temperature and time to become more than one-half the height of the 220 peak of the lithium ferrite phase after 24 hours at 1225OC. The x-ray diffraction patterns of all samples, except those fired at temperatures of 13OOOC and higher, showed the superlattice peaks associated with the ordering of the lithium on the octahedral sites. The cooling rate of the sharply cooled samples evidently was not sufficiently rapid to achieve lithium disorder; it has been reported (ref. 6 ) that the cooling
disorder. Little variation in intensity or width of the x-ray diffraction peaks was noted among the various samples and no
rate was evident.
(d = 2.688 8 ) .
t must be accomplished in a matter of.l to 2 seconds to achieve
I clear dependence of the intensity or peak width on the cooling
Attempts were made to obtain a disordered sample by quenching a portion of one of the 4-hour-1000°C samples into water from 80OoC. The lattice parameter found was 8.3314 fi and the moment found was 3758 G. Since no large change in moment was observed on quenching sharply enough to achieve disorder of the lithium, it appears very unlikely that any significant transfer of lithium to tetrahedral sites occurs in the stoichiometric material. The spinel superlattice peaks (110, 210, 211, 310, etc.) disappeared from the x-ray diffraction pattern; however, the remaining peaks showed no visible changes in intensity or position. A sensitivity to water and water vapor has been reported* for lithium ferrite; however, no appreciable sensitivity was observed in this experi- ment. The mechanism of any such action by water in its effect on the properties of lithium ferrite is not known. Kat0 (ref. 6) reports a lattice parameter of 8.3326 & for disordered lithium ferrite quenched from 1000°C and 8.3296 for the ordered mate- rial. The chemical analysis reported by Kato indicated a lithium deficiency of about 15 percent; however, the analytical procedures for lithium are not the most reliable. The lattice parameter values from NASA-ERC for the stoichiometric material are in good agreement with those of Kato, but an analysis of one of the NASA- ERC 4-hour-1000°C samples (presumed stoichiometric) indicated a lithium deficiency of only 0.6 percent (see below). The elec- trical resistivity reported by Kato for the ordered material is too high to be consistent with large lithium deficiencies, unless the samples had been slowly cooled. It appears that Kato's mate- rials were much more nearly stoichiometric than indicated. Kato reports a slightly lower resistivity for disordered lithium ferrite than for the ordered material.
.. . -
*B. Frackiewicz, NASA/ERC, private communication
7

11
I \ Efforts were made to achieve disorder in a sample by allow- $i ing powder to fall from a furnace (8OO0C, 1 atmosphere oxygen) B ’$
nitrogen. The superlattice peaks of the x-ray diffraction pat- 1
L
c
upon an inclined aluminum plate with one end resting in liquid
tern were considerably reduced in intensity but not completely to zero.
~~~ ~. ~~~ - _ _
Sharp 320 220 110 100 20
900°C Anneal + 10 O C/hr
.~
The effects of cooling rate on the magnetic moment and lattice parameter were investigated in one series in which all samples were fired at llOO°C for 4 hours under 1 atmosphere oxygen, and then subjected to various cooling schedules. The results are tabulated in Table I. The sample designated as 900°C 9
anneal was the sample initially sharply cooled, annealed at 9 0 0 ° C for 8 hours, and then cooled to room temperature at 10°C/hr.
&.
. . ~~
- _ .~ ~
3808 3767 3765 3776
. ~ . . - . __
- 3748 3620
(two phase) -~ .- - . . . - . . ~~~~
TABLE I
EFFECT OF COOLING RATE ON MAGNETIC MOMENT AND LATTICE PARAMETER*
Lattice Parameter
A series of heat treatments was carried out at 12OOOC to investigate, to a limited degree, the rate of attainment of the final properties. In this series, samples were heated at times varying from 1 minute to 24 hours, then rapidly cooled by remov- ing the samples from the furnace and allowing them to cool under ambient room conditions. These results are shown in Figure 3. From these data, it appears that the rates of increase of the
8

3950 t
i w I
3900
0 I- W z 3 3850 I
z - 8334 a w I- w
8 - 8.330 I- I- 5
1 I I I I
.I 8.3372 *2% HRS.
P
k
I 1 1 1 I 1 I I 1 1 1 I I I l l ~ ' ~ l ~ ~ " ~ ~ l
0 60 120 180 240
SINTERING TIME AT 1200.C (MIM)
Figure 3 . - Effect of time on magnetic moment and lattice parameter at 12OO0C, all samples sharply cooled; the 2 4 hour values are designated at the right for each property.

magnetic moment and the lattice parameter at 120OOC are very large at first, but rapidly decrease with time, becoming nearly stable after about 40 minutes.
The magnetic moments versus lattice parameters for all single-phase materials have been plotted in Figure 4, regardless of the heat treatment. The degree of departure from stoichiometry is presumed to decrease with decreasing temperature down to about 1000°C. The value of the moment at which a straight line through the points intersects the stoichiometric lattice parameter ab- scissa (8.3293 8) should be the magnetic moment of stoichiometric lithium ferrite at 25OC. This value, ~TM, = 3732 G, is well 0
within the experimental error of the values 3725 G for the 4 hour- 1000°C material, sharply cooled, and 3747 G for this same mate- rial after the 900°C anneal, and essentially equal to the value b
derived below as the best-fit value for all the data: 3736 G. An independent measurement of the magnetic moment was made on a separately prepared sample by Mee, Besser, and Whitcomb (ref. 17). This sample was fired at 1000°C for 4 hours under 1 atmosphere oxygen, and then cooled rapidly as described above. The moment found at 25OC was 3720 +40G. This value is a lso within the experimental error of all the above values, even though the measurements were made by independent workers us-ing a different magnetometer. This same group of workers also obtained a chemical analysis of the sample and found the ratio Fe/Li = 5.03. This corresponds to a lithium deficiency of 0.6 percent; however, this is much less than the experimental analytical error for lithium and must be so regarded in this light.
IV. DISCUSSION
The volatilization of lithium (probably as the oxide) from lithium aluminum oxide has been studied by Hummel, Sastry and Watring (ref. 18), from lithium nickel oxides by Iida (ref. 19), and a lithium nickel ferrite by Salmon and Marcus (ref. 20). It is generally accepted that spinel lithium ferrite shows a similar tendency to lose lithium.
The precipitation of a-Fe203 during the 900°C annealing treatment is convincing evidence that lithium has been lost from NASA-ERC materials, and the increasing amount of a-Fe203 with increased sintering temperature suggests that the lithium loss and the increases in magnetic moment and lattice parameter are interrelated. It is clear that stoichiometric lithium ferrite can exist in only those samples which yielded no a-Fe203 pre- cipitate and also showed no change in moment or lattice parameter, within experimental error, before and after the annealing and slow cooling treatment. Further, it is unlikely that an excess of Li20 in the structure, if this can occur, would result in a de- crease in lattice parameter. Strickler and Roy (ref. 10) found
10

II 11111
a34 o
0338
- m
a 8.336
- W I- W
2 a a a W 0 8.334 + I- 3
0332
8.3 30
X SHARPLY COOLED 0 SLOWLY COOLED
373; \
3700 3800 3900 4000 MAGNETIC MOMENT, 4WMs (6)
Figure 4 . - Magnetic moment versus lattice parameter for all single-phase materials regardless of sintering times or cooling rates; the 8.3293 a lattice parameter represents the value derived as the lattice parameter for stoichiomet- ric Li0.5 Fe2.504, and the intersection of the curve with this abscissa yields the corresponding magnetic moment: 3732 G.
11

no evidence that Lio.sFe2.504 does dissolve LiFeOn; this would be equivalent to excess lithium in the structure. Thus, the mate- rial yielding the minimum lattice parameter should be the one most closely approaching stoichiometric lithium ferrite. Above this temperature, lithium-deficient materials will result which will give magnetic moments which are either too high or too low depending upon the cooling rate, as shown in Figure 1. That magnetic moment and lattice parameter values very near the sto- chiometric values have been obtained is no guarantee that the material is stoichiometric, since any intermediate value of the moment can be obtained by a proper choice of cooling rate. The lattice parameter would not necessarily differ greatly from the stoichiometric value in this case.
All materials fired at 900°C and no-higher and the materials fired only 4 hours at 1000°C, whether rapidly cooled, slowly cooled, or annealed and very slowly cooled, showed lattice param- eters within the estimated experimental error of the average value, 8.3296 A. lattice parameter of stoichiometric lithium ferrite, Lio.sFe2.504, subject only to the condition that lithium ferrite will accept the full quota of lithium. There is no reason for believing that it will not. The true magnetic moment of stoichiometric lithium ferrite cannot be so directly and reliably derived. A non- ferromagnetic material, when present as a second phase or im- purity, such as a-Fe203, Li2O or Li2C03, will reduce the measured moment and prevent a direct measurement of the true moment. Be- cause of the significant magnitude of the detectability limit of the NASA-ERC x-ray diffraction methods, there is no guarantee of the complete absence of these contaminants and, therefore, no assurance that the value obtained from an individual moment measurement is the true moment. The magnetic moments obtained for the various 4-hour-1000°C firings indicate the stoichiometric moment to be near 3735 G. The six curves of Figure 1 show a minimum divergence at about 900°C. The average of the moments along this ordinate is only slightly smaller than this value; however, this value is not highly reliable.
This can be assumed to approach closely the
If all moments are plotted versus the corresponding lattice parameters (Figure 4), a curve of much greater point density is obtained. The best-fit or least-squares line through the collec- tion of points should pass through the intersection of the stoi- chiometric moment ordinate and the stoichiometric lattice param- eter abscissa, 8.3293 A , the value found to be the probable lattice parameter of stoichiometric lithium ferrite (see below). The magnetic moment thus derived is found to be 3732 G, which is very close to the average of the individual measurements for the 4-hour-1000°C firings.
Strickler and Roy (ref. 10) state that the equilibrium oxygen pressure over lithium ferrite reaches 1 atmosphere below
12

1 0 0 0 ° C . The oxygen loss associated with this process and with the Li20 volatilization is not expected to generate any appre- ciable number of oxygen vacancies in the lattice since the binary oxides of iron show no such tendency. A l l such binary oxides of iron have close-packed oxygen sublattices, the variations in composition being achieved by changes in the valence state and packing density of iron. To understand the temperature-induced variations in the properties of lithium ferrite, cognizance must be taken of this fact and of the loss of lithium.
From the above, two limiting cases can now be derived:
pressures, and (2) those materials which are slowly cooled under higher oxygen pressures. In both cases, when lithium is removed
example, and if that unit cell retains its full complement of 32 oxygens, the positive charge of the departed lithium must be made up in some manner. This is accomplished by the diffusion of iron into the crystal from the surface as the oxygen on the surface is removed. In the first case, applicable to rapidly cooled materials and low oxygen pressures, each vacated lithium site is reoccupied, in effect, by an Fe+2 ion diffusing in from the crystal surface. Charge neutrality is maintained by the concurrent reduction of another Fe+3 to Fe+2. The phase composi- tion can now be represented:
(1) those materials which are rapidly cooled under lower oxygen
4 from a region of the crystal, from a selected unit cell, for
+2 +3 LiO .5-X Fe2-XFe2.5-X '4
This formulation can be viewed as representing a solid solution between spinel lithium ferrite and Fe304. With few exceptions, the Fe+2 ions should be found on octahedral sites, as in the case of Fe304.
The second limiting case is applicable to lithium loss not correlated with an oxygen evolution and reduction of Fe+3 to Fe+2. In the limit the additional ions diffusing in will be Fef3 with
position of the phase can be formulated: 4 only one-third the vacated lithium sites so occupied. The com-
. +3
Li 0 .5-y Fe2. 5+y/3'4
This picture can also be yiewed as a solid solution between spinel lithium ferrite and y-Fe203, but, since y-Fe2O3 is unstable with respect to the alpha form at these temperatures, materials deficient in lithium might be expected to show this instability to some degree under strong oxidizing conditions and dissociate into a higher lithium-content phase (spinel) and a-Fe2O3.
13
d According to the above pictures, the population of the i octahedral sites by magnetic cations has been increased and an I increase in the measured magnetic moment should be found. It is assumed to be true that the tetrahedral site cations and the octahedral site cations generate separate magnetic sublattices which are opposed in a Neel-type configuration.
Following the above descriptions, one can calculate the lithium loss from the magnetic moment and lattice parameter increases. One method would be to consider the individual sam- ples to be solid solutions of the end members of the series, lithium ferrite and Fe304 in the first limiting case and lithium ferrite and y-Fen03 in the second. An interpolation technique (Vegard's law) would be used with the lattice parameters. These require that dependable values be available for the magnetic moments and lattice parameters of the end members. Such values were not found after limited effort, except for the lattice parameters of Fe304 and lithium ferrite and the magnetic moment of lithium ferrite (the latter two from this study, which we assume to be good values). Abrahams and Calhoun (ref. 21) and Tombs and Rooksby (ref. 22) report the same value of 8.3940 + 0 . 0 0 0 5 a for the lattice parameter of Fe304 at 22OC. By use of a thermal expansion coefficient provided by the former authors, a value of 8.3944 a is obtained at 28OC, the temperature of the NASA-ERC measurements.
b
Another method is available for the calculation of lithium losses and was preferred to the procedure above. This method involves relating the measured magnetic moment of a particular lithium oxide deficient sample, either with or without separate oxygen loss, to these deficiencies through the proportionate change in the theoretical number of Bohr magnetons per unit weight or per unit volume. To obtain values on a volume basis, it is necessary to include a density correction which is expressed in terms of the deficiencies and the measured lattice parameters. These values, however, will not be completely independent of those derived by the Vegard's law approach. Thus, the emphasis was placed on calculation from the proportionate change in the number of Bohr magnetons per unit weight. Separate values of lithium loss were calculated by this method and by the Vegard's law method for the limiting case of the rapidly cooled samples. . The results are tabulated in Table 11. The details of the cal- culation procedure are given in Appendix A.
L
It should be pointed out here that two different values can be derived to express the degree of lithium volatilization: (1) a lithium loss value, and ( 2 ) a lithium deficiency value. The former represents the percentage of the original quantity of lithium volatilized; this is not equal to the lithium deficiency of the final product. The lithium deficiency represents the
14

TABLE I1
DATA CORRESPONDENCE IN FIRST LIMITING CASE FOR SHARPLY COOLED MATERIALS
4 hrs. llOO°C , 4.8 24 hrs.,llOO°C 8.0
-
I Ma netic Moments Lattice Parameters Sintering ~ ( % I JLy& (A 1 Density ?4nMs ( G I 1
Calcd. Conditions , From j From
Calcd. Li Loss
Calcd. Calcd. From Ave. From Ave. (g/cm3) ( % I Ave .
1 I ' Moment ~ Lat. Par. ~
5.8 I 5.3 4.4 3808 3 816 8.3325 8.3322 4.779 8.5 I 8.3 7.0 3857 3861 8.3340 8.3340 1 4.790
4 hrs.,lOOO°C - - - -* 3725 - 8.3295 - 4.759 24 hrs.,lOOO°C 2.2 , 2.2 2.2 1.9 3769 3769 8.3305 8.3305 4.767
I
4 hrs. ,1200°C ' 12.7 11.0 11.9 24 hrs.,1200°C 13.5 13.7 13.6
24 hrs.,1225'C 15.8 13.3 14.6
24 hrs.,1250°C 18.4 19.6 19.0
10.1** 3928 11.6 3941
12.4 3975
16.3 4015
3865
3915 3942
3957
4025
~ 8.3339
8.3354 8.3369
8. 3367
8.3403
8.3340
8.3359 8.3369
8.3374
8.3399
4.792
4.804 4.811
4.815
4.832 I

percen tage of t h e l a t t i c e s i tes o r i g i n a l l y occu i e d by l i t h i u m b u t occupied i n t h e f i n a l p roduc t by Fe+2 o r Fe+f s t a t e d t h a t t h e l i t h i u m s i t e i s occupied , i n p a r t i c u l a r , by e i t h e r va l ence s t a t e . ) These d e f i n i t i o n s are fol lowed throughout t h i s r e p o r t . I n t h e r ap id -coo l case, t h e f r a c t i o n a l l i t h i u m d e f i c i e n c y w i l l be 5p/6-p, where p i s t h e f r a c t i o n a l l i t h i u m loss (see Appendix C ) .
( I t cannot be
I n Table 11, t h e f i r s t column g i v e s t h e tempera ture a t which t h e samples w e r e s i n t e r e d and t h e t i m e a t tempera ture . The n e x t t h r e e columns g i v e t h e c a l c u l a t e d l i t h i u m l o s s e s : column 2 l i s ts v a l u e s computed from t h e measured moments (column 6 ) ; column 3 l i s t s t h e v a l u e s computed from measured l a t t i c e parameters (column 8 ) , assuming Vegard 's law; and column 4 shows t h e average of t h e two lo s s v a l u e s . These average l i t h i u m l o s s e s w e r e used t o c a l c u l a t e t h e magnet ic moments and l a t t i c e parameters given i n columns 7 and 9 and t o c a l c u l a t e t h e d e n s i t i e s of column 1 0 . The l i t h i u m d e f i c i e n c i e s of column 5 w e r e d e r i v e d from t h e average l o s s e s as d e s c r i b e d above.
Both t h e c a l c u l a t e d and measured moments of columns 6 and 7 of Table I1 are uncor rec t ed f o r t h e d e n s i t y changes accompanying t h e oxygen and l i t h i u m losses and, t h e r e f o r e , a r e p r o p o r t i o n a l t o t h e magnet ic m o m e n t p e r gram. Div id ing t h e s e v a l u e s by 41~d ( d = 4.759 9 / c m 3 , t h e x-ray d e n s i t y of s t o i c h i o m e t g i c l i t h i u m f e r r i t e assuming t h e l a t t i c e parameter a = 8.3293 A ) y i e l d s t h e magnet ic moments i n emu/g. The s t o i c h i o m e t r i c mater ia l i s gener- a l l y t h e one sought and t h e s e v a l u e s a r e t h o s e which would b e ob ta ined under t h e g iven s i n t e r i n g c o n d i t i o n s i f t h e p roduc t w e r e assumed s t o i c h i o m e t r i c and t h e cor responding d e n s i t y a p p l i e d .
The exper imenta l d a t a w e r e ana lyzed a s fo l lows : v a l u e s f o r t h e magnetic moment and l a t t i c e parameter of s t o i c h i o m e t r i c l i t h i u m f e r r i t e and t h e l a t t i c e parameter of magne t i t e w e r e determined (see Appendix A ) i n a manner c o n s i s t e n t w i t h a b e s t l e a s t - s q u a r e s f i t t o t h e d a t a w h e r e t h e magnet ic moment and l a t t i c e parameter d a t a w e r e weighted r e l a t i v e t o t h e r e s p e c t i v e e s t ima ted e r r o r s . The r e s u l t i n g v a l u e s are 3736G and 8.3293 & f o r the,moment and l a t t i c e parameter of l i t h i u m f e r r i t e and 8.3943 A f o r t h e l a t t i c e parameter of magne t i t e . It should be noted t h a t a change of one u n i t i n t h e l eas t s i g n i f i c a n t f i g u r e of e i t h e r o r bo th l i t h i u m f e r r i t e v a l u e s produces a change of one o r more u n i t s i n t h e n e x t - t o - l e a s t s i g n i f i c a n t f i g u r e of t h e b e s t - fit magne t i t e l a t t i c e pagameter v a l u e . The l a t t i c e parameter of l i t h i u m f e r r i t e (8.3293 A ) which g i v e s t h e b e s t f i t t o a l l t h e d a t a i s a l s o t h e v a l u e ob ta ined from t h e 4-hour-1000°C s i n t e r i n g w i t h t h e s i l i c o n i n t e r n a l s t a n d a r d t echn ique . The b e s t - f i t magnetic moment v a l u e d i f f e r s much less t h a n t h e exper imenta l e r r o r from t h e v a l u e s d e r i v e d g r a p h i c a l l y above and from t h e average of t h e v a l u e s o b t a i n e d by d i r e c t measurement of t h e 4-hour-1000°C samples.
1 6

The lithium l o s s as a function of the sintering temperature for sintering times of 4 and 24 hours is plotted in Figure 5. Straight lines have been drawn through the points, although there is no assurance that lithium loss need be a linear function of temperature. Indeed, with greater lithium losses and high temperatures, deviation from linear might very well be expected. These curves indicate that the lithium loss at any selected temperature and the temperature at which lithium loss begins is a function of sintering time. Since the approach of the curves to the axis is very likely non-linear, the temperature at which volatilization begins need not be assumed to be time-dependent. It is more probable that these intercepts merely suggest the relative rates of loss , and signal the onset of rapid increases in the lithium volatilization rates. In general, some time- dependence of lithium l o s s would be expected.
Samples were also fired at 1300 and 14OO0C, but no dependable calculations of lithium loss could be made. The peaks of the x-ray diffraction patterns were considerably smaller and broader and did not permit the determination of accurate lattice param- eters. The peaks of a-Fe203 were pronounced in both cases, in- dicating a two-phase material, which rendered the magnetic moment data unusable. The measured moments were considerably lower than the stoichiometric value, as would be expected.
Calculations of lithium deficiencies on the basis of the change in the number of Bohr magnetons per unit volume, using densities expressed in terms of the deficiencies and the measured lattice parameters, yielded values differing by only a few hun- dredths in percentage from the lithium deficiencies derived from the loss values calculated on the basis of the change in Bohr magnetons per unit weight.
Mee, Besser, and Whitcomb (ref. 17) also analyzed one lithium- deficient material (4 hours, 1200°C + 900°C anneal). The analysis showed 9.2 f2.7 percent lithium deficiency; the NASA-ERC calcula- ted value is 10.1 percent (11.86 percent lithium l o s s ) . The dif- ference between the analyzed and calculated values is equivalent to an analysis error of only about 1 percent. The apparently large error quoted for the analysis value represents an analysis error of only 3 percent. The agreement between these two values is surprisingly good and, when considered in conjunction with the analysis results quoted above for a stoichiometric material, sug- gest that the analysis may be more accurate than quoted.
A similar series of calculations for the materials cooled at moderately slow rates require modification. The 900°C anneal results suggest that precipitation of a-Fe2O3 probably has started, but has not proceeded to a point that a-Fe203 peaks appear in the x-ray diffraction patterns. The view here is that the products
17

20
15
c
O t L I u - 1 1 I 1
1000 I 100 1200
SINTERING TEMPERATURE ("C)
A
A 4 HRS., LATTICE PARAMETER o 4 HRS.,MOMENT A 24 HRS., LATTICE PARAMETER 0 24 HRS, MOMENT t 4 HRS., ANALYZED
Figure 5.- Calculated lithium loss as a function of sintering temperature: values of lithium are differentiated according to time at temperature and basis for calculation.
18

can be described as a mixture of a lithium ferrite phase with dissolved y-Fe203 and a-Fe203 precipitate. This modified. calcu- lation procedure is included in Appendix B and the results are presented in Table 111. The lithium loss was assumed to be the average value computed for the corresponding rapidly cooled mate- rials (column 4, Table 11). As Figure 3 shows, any additional lithium loss occurring during the cooling process should be small. The results of this calculation serve to indicate that the mate- rials probably approach the state assumed. Attempts to calculate lithium losses directly without providing for the presence of a-Fe203 as a second phase yielded values completely inconsistent with the rapid-cool resu,lts.
The percentage of the slowly cooled products estimated to be a-Fe2O3 (column 8 ) is of the order generally considered to be the lower limit of detectability of a second phase by standard x-ray diffraction techniques. The detectability of the a-Fe203 is further reduced if it is present in very fine or submicroscopic particle size. The a-Fe203 precipitated after the 900°C anneal was detected in all cases, including the 24-hour-1000°C sample, but not the 4-hour-1000°C sample. The fact that such amounts of a-Fe2O3 were detected after the anneal, but larger calculated amounts in the slow-cooled materials were not may be either a result of better coagulation of the a-FezO3 or errors in the calculated values. This apparent discrepancy is not considered significant.
In columns 5 and 6 are shown the magnetic moments (without density correction) derived for the magnetic lithium ferrite phases present in the products. Column 5 shows the value obtained from the magnetic moment, applying the lithium loss values of column 4, Table 11, and the fractional Fez03 precipitation value of column 7, Table 111. Column 6 shows the moments derived by calculating a lithium deficiency for the lithium ferrite phase from the lattice parameters. The agreement is very satisfactory. A first-order reaction rate for the precipitation process (in- stantaneous rate dependent upon the concentration of excess Fen03 dissolved) would require that the fraction of Fe203 precipitated be constant if the annealing time and cooling rates were identical. The values of column 7 show reasonably good constancy in most cases and are generally satisfactory, in view of the experimental errors and the indirect manner of derivation.
The value derived for the lattice parameter of y-Fe203 cor- responding to the best-fit of the data was 8 . 3 5 7 8. Schoon (ref. 2 3 ) report a lattice parameter of 8 . 3 5 0 8 for y-Fe203 prepared by an electric arc process, and a value of 8 . 3 3 8 & for a material prepared by oxidation of Fe304. Van Oosterhout and Rooijmans (ref. 24) and Schrader and Buttner (ref. 25) report that y-Fe203 is tetragonal with the lattice parameter a = 8 . 3 3 & and
Haul and
19

tu 0
Sintering and Cooling Conditions
TABLE I11
Lattice
% Original Measd. Li Loss Parameter
DATA CORRESPONDENCE I N SECOND LIMITING CASE FOR SLOWLY COOLED - ! 'TERIALS
Fraction of Excess
Wt. % of Sample
24 hrs.,1000°C,800C/hr 8.3300 4 hrs.,llOO°C,llOOC/hr 8.3301 24 hrs.,110O0C,llO0C/hr 8.3311
, 4 hrs.,115OoC,22O0C/hr 8.6 8.3307 1 4 hrs. , 12OO0C, 220°C/hr 11.9 8.3315
0.57 0.10 0.12 0.10 0.21
Magnetic Moment [4.rrMS ( G I 1
1.2 0.5 1.0 0.8 2.4
Measd. Total
3769 3777 37 87 3747
3787 3778 3815 3812 3819 3806 3839 3833
FepOB Precipated
3693
3594
2.2 8.3299 24 hrs.,lOOO°C, Rapid Cool +8 hrs., 90O0C,1O0C/hr 4 hrs.,llOO°C, Rapid Cool
+8 hrs., 900°C,100C/hr 5.3 8.3304
i
3744 3752 0.67 1.4
3743 3762 0.87 4.5
8.3 8.3300 3490
8.6 8.3303 3631
3744 3755 0.89 7.1
3786 3781 0.49 4.1
24 hrs.,120O0C,11O0C/hr 13.6 24 hrs.,1225°C,l100C/hr 14.6 8.3337 24 hrs.,125O0C,11O0C/hr 19.0 8.3340 3838 3921
- 8. 32g7 3748 4 hrs.,100O0C, Rapid Cool +8 hrs., 900°C,100C/hr
24 hrs.,llOO°C, Rapid Cool +8 hrs., 900°C,100C/hr 4 hrs.,l150°C, Rapid Cool
+8 hrs., 90OaC,1O0C/hr
11.9 4 hrs.,1200°C, kapid Cool +8 hrs., 900°C,100C/hr 8.3307 3588 I 3811 I 3802 I 0.48 ~ 5.5 I
8.3304 3328 1 3757 1 3769 1 0.87 13.6 24 hrs.,1200°C, Rapid Cool +8 hrs., 900°C,100C/hr 11.5

c/a = 3.000. The latter authors find that the cation vacancies order along a screw axis parallel to the tetragonal c-axis. It is possible that the two values reported by Haul and Schoon represent different degrees of order or partial reduction. Either could occur in an electric arc. The smaller value is to be preferred as the lattice parameter of y-Fe203. Any such vacancies occurring in lithium ferrite are disordered, and it is not unlikely that such materials with disordered vacancies would have a larger lattice parameter. A small increase in lattice parameter was noted on disordering of stoichiometric lithium ferrite. Here ions of comparable size are exchanging positions rather than ions with vacancies, and a somewhat greater effect might wel; be expected in the latter case. The NASA-ERC value of 8.357 A for the lattice parameter for y-Fe203 agrees suffi- ciently well, in view of the manner of derivation, that measure of support is given to the NASA-ERC interpretation.
There were indications that the precipitation of a-Fe203 from the lithium-deficient materials after the 900°C anneal was not complete in that the amount precipitated was not directly proportional to the lithium losses calculated (column 4, Table 11). The relative amount of a-Fe2O3 appearing as a second phase can be estimated experimentally from the intensity of the strongest a-Fep03 peak found in the x-ray diffraction pattern and normal- izing to the intensity of the spinel 220 peak. The intensity of the spinel 220 peak is derived essentially only from the tetra- hedral site ions and should not be appreciably affected by moderate amounts of lithium deficiency. Plots of the reduced intensity of the a-Fe203 peak ( I a / 1 2 2 0 ) versus calculated lithium losses and versus the sintering temperature were far from linear. Plots of reduced intensity versus the calculated amount of a-Fe203 precipitated showed much more linear behavior (Figure 6), giving further measure of support to the NASA-ERC assumptions.
The question arises as to whether the changes in the magnetic moment and lattice parameter could be the result of exchange of sites by octahedral lithium and tetrahedral iron, either as the sole effect or in combination with a loss of lithium and oxygen and reoccupation of the lithium sites by iron. The precipitation of a-Fe203 after the anneal at 9 0 0 ° C establishes that lithium oxide has been lost and places a minimum value on the extent of this loss . The amount of a-Fe203 precipitated, as calculated from the moments and lattice parameters, correlated well with the lithium l o s s calculated in the higher lithium losses cases. The effects on the moment and lattice parameter by any site exchange by lithium must then be confined to the differences between the observed values and the values which would be derived on the basis of the amount of a-Fe203 actually precipitated. The latter was not directly determined quantitatively. Chemical analysis results indicate that the differences should be small.
2 1

0
x
- I I I I I I I I I I
0. I 0.2 0.3 0.4 0.5
RATIO X-RAY DIFFRACTION PEAK HEIGHTS ( I,/I220
Figure 6.- Calculated percentage of a-Fe2O3 present as a precipitate in the products after the 9 0 0 ° C anneal versus the height of the strongest a-Fe2O3 diffraction peak normalized to the height of the 220 peak of the lithium ferrite component ( I a / 1 2 2 0 ) .

The magnet ic moment i s ve ry s e n s i t i v e t o any exchange of si tes by l i t h i u m wi th t e t r a h e d r a l i r o n . The l i t h i u m l o s s e s c a l c u l a t e d above from magnet ic m o m e n t s and from l a t t i c e param- eters agreed w e l l w i t h i n t h e l i m i t s of exper imenta l e r r o r . Thus, any o t h e r mechanism proposed t o account f o r t h e observed moment and l a t t i c e parameter i n c r e a s e s , such as s i t e exchange by o c t a - h e d r a l l i t h i u m wi th t e t r a h e d r a l i r o n , must show t h a t some r e l a t i v e e f f e c t on t h o s e p r o p e r t i e s i n o r d e r t h a t a comparable degree of c o r r e l a t i o n be o b t a i n e d . Fo r t h e l i t h i u m loss mechanism d e s c r i b e d above, a 25 p e r c e n t l i t h i u m d e f i c i e n c y i n t h e f i n a l p roduc t should y i e l d a moment i n c r e a s e 8f 15 p e r c e n t and a l a t t i c e parameter i n c r e a s e of abou t 0 .016 A; a s h i f t of t h e same number of l i t h i u m s t o t e t r a h e d r a l s i t e s should cause a moment i n c r e a s e of 2 0 p e r c e n t , which would r e q u i r e a l a t t i c e expansion of about 0.053 A t o r e t a i n t h e same de ree of c o r r e l a t i o n . A c o n s i d e r a t i o n of t h e i o n i c r a d i i of L i q and Fe+3 s u g g e s t s t h a t t h i s i s r easonab le . t h e r e f o r e , no a s su rance t h a t s i t e exchanges of c o n s i d e r a b l e mag- n i t u d e could be e s t a b l i s h e d on t h i s b a s i s and even less i n t h e case of s m a l l amounts, which would n e c e s s a r i l y be t h e case he re .
There i s ,
A c a r e f u l s tudy of t h e v a r i o u s s t r u c t u r a l f a c t o r s which g e n e r a t e c e r t a i n x-ray d i f f r a c t i o n peaks i n d i c a t e s t h a t t h e peaks most s e n s i t i v e t o s i t e exchanges are t h o s e a r i s i n g from t h e 111, 2 1 0 , and 2 2 2 p l a n e s . Disorder w i t h i n t h e o c t a h e d r a l s i t es a lone would cause l a r g e changes i n t h e i n t e n s i t y of t h e 2 1 0 peak: t h e r e f o r e , t h i s peak must be e l i m i n a t e d from c o n s i d e r a t i o n . Both t h e 111 and 2 2 2 peaks r e p r e s e n t c a s e s i n which t h e phase and s c a t t e r i n g ampl i tudes of t h e v a r i o u s i n t e n s i t y c o n t r i b u t i o n s a r e such as t o r e s u l t i n a lmost complete c a n c e l l a t i o n . A small change i n any one of t h e c o n t r i b u t i o n s can t h u s have a r e l a t i v e l y s t r o n g e f f e c t on r e s u l t a n t i n t e n s i t y . I t has a l r e a d y been e s t a b l i s h e d t h a t c o n s i d e r a b l e l i t h i u m loss must occur . The e f f e c t on t h e i n t e n s i t y of t h e s e peaks a r i s i n g from t h e replacement of l i t h i u m on t h e o c t a h e d r a l s i t es by i r o n wi thou t a l t e r i n g t h e t e t r a h e d r a l p o p u l a t i o n ( l i t h i u m los s ) i s i n t h e s a m e d i r e c t i o n a s w i th s i t e exchange b u t somewhat less i n degree . O n e i s t h u s r e s t r i c t e d t o d i f f e r e n t i a t i n g between t h e changes i n i n t e n s i t y r e s u l t i n q from t h e two p r o c e s s e s , w i th t h e i n t e n s i t y change be ing sma l l i n each case. Unfo r tuna te ly t h e normal s t a t i s t i c a l f l u c t u a t i o n s encountered i n x-ray scanning t echn iques are such a s t o r ende r such a t t e m p t s i m p r a c t i c a l . Accurate i n t e n s i t i e s measurements might succeed i n c l a r i f y i n g t h i s p o i n t .
The d i f f i c u l t y which was exper ienced a t NASA-ERC i n a t tempt- i n g t o ach ieve o c t a h e d r a l d i s o r d e r i n l i t h i u m f e r r i t e i s cons i s - t e n t w i th t h e o b s e r v a t i o n s of Kato ( r e f . 6 ) , and r e f l e c t s t h e h igh v a l u e of t h e o c t a h e d r a l s i t e o r d e r i n g energy c a l c u l a t e d by d e Boer, van Santen and Verwey ( r e f . 3 ) . The energy a s s o c i a t e d w i t h t h e s h i f t o f l i t h i u m between o c t a h e d r a l and t e t r a h e d r a l s i tes must c e r t a i n l y b e g r e a t e r t han t h e energy of o c t a h e d r a l
23

site ordering. cooled or sharply cooled from temperatures of 125OOC and below showed well developed superlattice peaks. there appears to be little basis for assuming any large octahedral-tetrahedral site shift by lithium. A limited amount is possible and may occur on a sharp quench of non-stoichiometric materials. The small moment increase observed in the NASA-ERC single quench into water of a stoichiometric sample is within experimental error and indicates that any shift of lithium to tetrahedral sites is very small at most.
All materials investigated which were slowly-
In view of this,
Electronics Research Center National Aeronautics and Space Administration Cambridge, Massachusetts, December 1968
129-03 -15 -03 -25
2 4

REFERENCES
1. Hoffmann, A.: Crystal Chemistry of Lithium Ferrite. Naturwissenshaften, vol. 26, p . 431, 1938.
2. Braun, P. B . : A Superstructure in Spinels. Nature, vol. 170, p. 1123, 1952.
3. de Boer, F., van Santen, J. H., and Verwey, E. J. W.: The Electrostatic Contribution to the Lattice Energy of Some Ordered Spinels. J. Chem. Phys., vol. 18, no. 8, pp. 1032- 34, 1950.
4. Collongues, R., and Chaudron, J.: The Preparation of Lithium Ferrite. Compt. Rend., vol. 231, pp. 143-45, 1950.
5. Gorter, E . W . : Saturation Magnetization and Crystal Chemistry of Ferrimagnetic Oxides. Philips Research Report, no. 9, pp. 295-365 and 403-443, 1954.
6. Kato, E.: Phase Transition of Li20-Fe203 System 11--Thermal and Electric Properties of Lithium Ferrospinel LiFesOe. Bull. Chem. SOC. Japan, vol. 31, no. 1, p. 113, 1958.
7. Schnitzler, A. D., Folen, V. J., and Rado, G. T.: Ionic Ordering Effects in the Ferromagnetic Resonance of Lithium Ferrite Monocrystals. J . Appl. Phys., vol. 31, no. 5, Suppl., p. 3485, 1960.
8. Spencer, E. G . , Lepore, D. A., and Nielsen, J. W.: Measure- ments on Lithium Ferrite Crystals Having Near-Zero Defect Concentrations. J. Appl. Phys., vol. 39, no. 2, p . 732, 1968.
9. Remeika, J . P., and Comstock, R. L.: Properties of Single- Crystal Lithium Ferrite Grown in the Ordered State. J. Appl. Phys., vol. 35, no. 11, p. 3320, 1961.
10. Strickler, D. W., and Roy, R.: Studies in the System Li20-A1203-Fe203-H20. J. Am. Ceram. SOC., vol. 44, no. 5, pp. 225-30, 1961.
11. Vassiliev, A.: Study of the Magnetic Properties of Ferro- spinels Containing Lithium Ions. Ph.D. Thesis, University of Paris, 1962.
12. Baltzer, P. K . : Sintered Spinel Magnetic Cores. U. S. Patent No. 3,034,987, May 15, 1962.
25

13.
14.
15.
16.
17.
18.
19.
20.
2 1..
22.
23.
24.
25.
Nielsen, J. W., Lepore, D. A., Zneimer, J., and Townsend, G. B.: Effect of Mechanical, Thermal, and Chemical Treatment on the Ferrimagnetic Resonance Linewidth of Lithium Ferrite Crystals. J. Appl. Phys., vol . 33, no. 3, Suppl., p. 1379, 1962.
Schwabe, E. A., and Campbell, D. A.: Influence of Grain Size on Square-loop Properties of Lithium Ferrites. J. Appl. Phys., vol. 34, no. 4, pt. 2, pp. 1251-53, 1963.
von Aulock, W. H.: Handbook of Microwave Ferrite Materials. Academic Press, New York, p. 4 0 7 f f , 1965.
Parrish, W.: X-ray Analysis Papers. Centrex Publishing Co., Eindhoven, p. 299, 1965.
Mee, J. E., Bener, P. J., and Whitcomb, E. C.: Monthly Reports, North American Rockwell Corp., under Contract NAS12-522, NASA-ERC, Cambridge, Mass. , 1968. Hummel, F. A., Sastry, B. S., and Watring, D.: Studies in Lithium Oxide Systems: 11. Li20*A1203-Al2O3. J. Am. Ceram. SOC., vol. 41, no. 3, pp. 88-92, 1958.
Iida, Y.: Evaporation of Lithium Oxide from Solid Solution of Lithium Oxide in Nickel Oxide. J. Am. Ceram. SOC., vol. 43, no. 3, pp. 171-72, 1960.
Salmon, 0. N., and Marcus, L.: Note on Sublimation of Lithium from Li-Ni Ferrite. J. Am. Ceram. SOC., vol. 43, no. 10, pp. 549-50, 1960.
Abrahams, S. C., and Calhoun, B. A.: The Low-Temperature Transition in Magnetite. Acta Cryst., vol. 6, p. 105, 1953.
Tombs, N. C., and Rooksby, H. P.: Structure Transition and Antiferromagnetism in Magnetite. Acta Cryst. v o l . 4, p. 474, 1951.
Haul, R., and Schoon, T.: The Structure of the Ferromagnetic Iron(II1) Oxide y-Fe203. Z. Phys. Chem., vol. 44, series B, pp. 216-26, 1939.
van Oosterhout, G. W., and Rooijmans, C. J. M.: A New Super- structure in Gamma-Ferric Oxide. Nature, vol. 181, no. 4601, p. 44, 1958.
Schrader, R., and Buttner,G.: Studies of y-Iron(II1) Oxide. Z. anorg. alleqm. Chem., vol. 320, nos. 5-6, pp. 205-34, 1963.
26
APPENDIX A
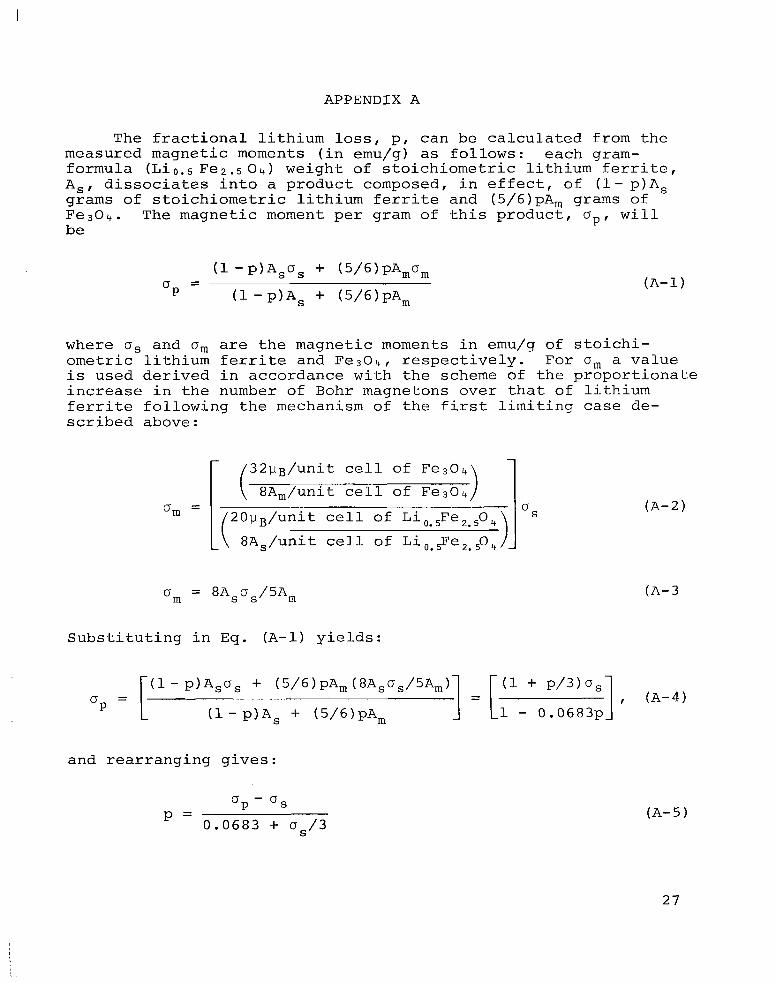
The fractional lithium l o s s , p, can be calculated from the measured magnetic moments (in emu/g) as follows: each gram- formula (Li,., Fe2.,04) weight of stoichiometric lithium ferrite, A,, dissociates into a product composed, in effect, of (1-p)A, grams of stoichiometric lithium ferrite and (5/6)pAm grams of Fe304. The magnetic moment per gram of this product, o p , will be
where o s and om are the magnetic moments in emu/g of stoichi- ometric lithium ferrite and Fe304, respectively. For om a value is used derived in accordance with the scheme of the proportionate increase in the number of Bohr magnetons over that of lithium ferrite following the mechanism of the first limiting case de- scribed above:
32u~/unit cell of Fe304 8Am/unit cell of Fe304
~ ~~
/20pB/unit cell of om =
L \ 8A,/unit cell of Li,.,Fe,., 0 ,+ 11
om = 8Asos/5A,
(A-2)
(A- 3
Substituting in Eq. (A-1) yields:
and rearranging gives:
cJp- cJs = 0.0683 + o s / 3
(A-5)
27

APPENDIX B
For t h e second l i m i t i n u case, a p p l i c a b l e t o s t r o n g l y o x i d i - z i n g c o n d i t i o n s , as d e s c r i b e d i n t h e Discuss ion (page 1 3 ) one may assume one gram-formula weight of L i 0 . 5 0 4 t o d i s s o c i a t e forming (1 -p)As grams of Li0 .5Fe2 .504 and, i n e f f e c t , (5/4)pAh grams of Fe203. Fe203 and t h e o t h e r sym 01s have t h e same s i q n i f i c a n c e as above. I t i s a l so assumed t h a t of t h e Fe2O3 formed dur ing t h e d i s s o c i a - t i o n , a f r a c t i o n , f , remains d i s s o l v e d and (1 - f ) p r e c i p i t a t e s as a-FenO3. The a-Fe203 c o n t r i b u t i o n t o t h e t o t a l measured moment w i l l be i n s i g n i f i c a n t . Thus, t h e magnet ic moment i n emu/g of t h e mixed p roduc t , o , w i l l be:
r e p r e s e n t s t h e gram-formula weight of Here Ak
P
where og i s t h e magnet ic moment p e r gram of y-Fe203. To e x p r e s s O g i n t e r m s of a p r o p o r t i o n a t e i n c r e a s e i n t h e t h e o r e t i c a l number of Bohr magnetons p e r u n i t weight r e l a t i v e t o t h a t of l i t h i u m f e r r i t e fo l lowing t h e second l i m i t i n g case mechanism desc r ibed above, t h e fo l lowing equa t ion i s used:
( 2 6 2 /3uB) /un i t c e l l of y-Fe203
( 1 0 2/3Ah)/unit c e l l of y-Fe203
20wB/unit c e l l of Lie. , Fe,., 0,
8As/unit c e l l of Lie., F e z - , 0,
) . .. .. - . . . ~~~~
. . - . ___ ~
. - -. -.
S u b s t i t u t i n g i n Eq. (B-1) y i e l d s :
and r ea r r ang ing g i v e s :
O S
28

APPENDIX C
The relationship between the fraction of the original lithium lost and the fractional lithium deficiency of the final product (first limiting case) was derived as follows: C unit cells of stoichiometric LiO .5 Fe2.5 0 4 dissociate to generate (1- p)C unit cells of lithium ferrite in which are dissolved 5Cp/6 unit cells of Fe304, where p is the fractional lithium loss as calculated in appendix A. The total number of spinel unit cells generated are
(1- p f 5p/6)C = (1- p/6)C . (C-1)
In each lithium ferrite unit cell there are four lithium sites. The total number of lithium sites in the final product becomes 4(1- p/6)C. The total number of the original lithium sites occupied by lithium in the final product is 4(i- p)C. The total deficiency of lithium in the product becomes
The fractional lithium
4(1- p)C = 4(5p/6)C .
deficiency is thus:
2. 6 - P
2 9

EFFECTS OF LITHIUM AND OXYGEN LOSSES ON THE MAGNETIC AND CRYSTALLOGRAPHIC PROPERTIES
OF SPINEL LITHIUM FERRITE
By D. H. Ridgley, H. Lessoff, and J. D. Childress Electronics Research Center
ABSTRACT
A study of the effects of sintering temperatures and cooling rates on the magnetic and crystallographic properties of spinel lithium ferrite shows that both the magnetic moment and lattice parameter increase with sintering temperature. Either annealing at lower temperatures or slow-cooling under oxygen causes re- oxidation of the Fe+2 decreases in moment and lattice parameter and gradual precipita- tion of a-Fe203 as a second phase. The various products formed have been shown to be equivalent to solid solutions of spinel lithium ferrite with Fe304 on rapid cooling and to solid solu- tion of lithium ferrite and y-Fe203 with precipitation of a-Fe203 on slow cooling. Lithium losses and a-Fe2O3 precipitate amounts are calculated. The magnetic moment and lattice parameter of stoichiometric lithium ferrite have been determined: magnetic moment gt 25OC: 3736 +20G; lattice parameter at 28OC: 8.3293 + O . 0005A.
formed at higher temperatures with attendent
STAR Categories 06 and 26
30 NASA-Langley, 1969 - 26 c- 6 7

NATIONAL AERONAUTICS AND SPACE ADMINISTRATION WASHINGTON, D. C. 20546
OFFICIAL BUSINESS FIRST CLASS MAIL
POSTAGE A N D FEES PAID NATIONAL AERONAUTICS A N D
SPACE ADMINISTRATION
POSTMASTER: If Undeliverable (Section 158 Postal Manual) Do Nor Return
' T h e aeronazrtical and space activities of the United States shall be condtlcted so as to contribute . . . to the expamion of hirman knowl- edge of phenomena iiz the atmosphere and space. T h e Administration shall provide for the widest practicable and appropriate dissemination of inforiiiation concerning its actithies and the results thereof."
-NATIONAL AERONAUTICS A N D SPACE ACT OF 1958
NASA SCIENTIFIC AND TECHNICAL PUBLICATIONS
TECHNICAL REPORTS: Scientific and technical information considered important, complete, and a lasting contribution to existing knowledge.
TECHNICAL NOTES: Information less broad in scope but nevertheless of importance as a contribution to existing knowledge.
TECHNICAL MEMORANDUMS : Information receiving limited distribution because of preliminary data, security classifica- tion, or other reasons.
TECHNICAL TRANSLATIONS : Information published in a foreign language considered to merit NASA distribution in English.
SPECIAL PUBLICATIONS: Information derived from or of value to NASA activities. Publications include conference proceedings, monographs, data compilations, handbooks, sourcebooks, and special bibliographies.
TECHNOLOGY UTILIZATION PUBLICATIONS: Information on technology used by NASA that may be of particular interest in commercial and other non-aerospace applications. Publications include Tech Briefs, Technology Utilization Reports and Notes, and Technology Surveys.
CONTRACTOR REPORTS: Scientific and technical information generated under a NASA contract or grant and considered an important contribution to existing knowledge.
Details on the availability of these publications may be obtained from:
SCIENTIFIC AND TECHNICAL INFORMATION DIVISION
NATIONAL AERONAUTICS AND SPACE ADMINISTRATION Washington, D.C. 20546