nasa/tm-2003-210738 · 2013-04-10 · nasa/tm-2003-210738 in-flight capability for evaluating...
TRANSCRIPT
NASA/TM-2003-210738
In-Flight Capability for Evaluating Skin-Friction Gages and Other Near-Wall Flow Sensors Trong T. Bui and Brett J. Pipitone NASA Dryden Flight Research Center Edwards, California
Keith L. Krake Spiral Technology, Inc. Edwards, California
February 2003
https://ntrs.nasa.gov/search.jsp?R=20030020636 2020-04-09T01:29:13+00:00Z

The NASA STI Program Office.. .in Profile
Since its founding, NASA has been dedicated to the advancement of aeronautics and space science. The NASA Scientific and Technical Information (STI) Program Office plays a key part in helping NASA maintain this important role.
The NASA STI Program Office is operated by Langley Research Center, the lead center for NASA's scientific and technical information. The NASA STI Program Office provides access to the NASA STI Database, the largest collection of aeronautical and space science STI in the world. The Program Office is also NASA's institutional mechanism for disseminating the results of its research and development activities. These results are published by NASA in the NASA STI Report Series, which includes the following report types:
TECHNICAL PUBLICATION. Reports of completed research or a major significant phase of research that present the results of NASA programs and include extensive data or theoretical analysis. Includes compilations of significant scientific and technical data and information deemed to be of continuing reference value. NASA's counterpart of peer-reviewed formal professional papers but has less stringent limitations on manuscript length and extent of graphic presentations.
TECHNICAL MEMORANDUM. Scientific and technical findings that are preliminary or of specialized interest, e.g., quick release reports, working papers, and bibliographies that contain minimal annotation. Does not contain extensive analysis.
CONTRACTOR REPORT. Scientific and technical findings by NASA-sponsored contractors and grantees.
CONFERENCE PUBLICATION. Collected papers from scientific and technical conferences, symposia, seminars, or other meetings sponsored or cosponsored by NASA.
SPECIAL PUBLICATION. Scientific, technical, or historical information from NASA programs, projects, and mission, often concerned with subjects having substantial public interest.
TECHNICAL TRANSLATION. English- language translations of foreign scientific and technical material pertinent to NASA's mission.
Specialized services that complement the STI Program Office's diverse offerings include creating custom thesauri, building customized databases, organizing and publishing research results.. .even providing videos.
For more information about the NASA STI Program Office, see the following:
Access the NASA STI Program Home Page at http://w w w.sti. nasa.gov
E-mail your question via the Internet to help (9 sti.nasa.gov
Fax your question to the NASA Access Help Desk at (301) 621-0134
Telephone the NASA Access Help Desk at (301) 621-0390
Write to: NASA Access Help Desk NASA Center for Aerospace Information 7 12 1 Standard Drive Hanover, MD 21076-1320
NASNTM-2003-2 10738
In-Flight Capability for Evaluating Skin-Friction Gages and Other Near-Wall Flow Sensors
Trong 1: Bui and Brett J. Pipitone NASA Dryden Flight Research Center Edwards, California
Keith L. Krake Spiral Technology, lnc. Edwards, California
National Aeronautics and Space Administration
Dryden Flight Research Center Edwards, California 93523-0273
February2003

NOTICE Use of trade names or names of manufacturers in this document does not constitute an official endorsement of such products or manufacturers, either expressed or implied, by the National Aeronautics and Space Administration.
Available from the following:
NASA Center for Aerospace Information (CASI) 7 12 1 Standard Drive Hanover, MD 21076-1320
National Technical Information Service ("TIS) 5285 Port Royal Road
Springfield, VA 22161-2171 (301) 621-0390 (703) 487-4650
IN-FLIGHT CAPABILITY FOR EVALUATING SKIN-FRICTION GAGES AND OTHER NEAR-WALL FLOW SENSORS§
Trong T. Bui* and Brett J. Pipitonet NASA Dryden Flight Research Center
Edwards, California
Keith L. KrakeS Spiral Technology, Inc.
Edwards, California
Abstract
An 8-in.-square boundary-layer sensor panel has been developed for in-flight evaluation of skin-friction gages and other near-wall flow sensors on the NASA Dryden Flight Research Center F-15BFlight Test Fixture (FIT). Instrumentation on the sensor panel includes a boundary-layer rake, temperature sensors, static pressure taps, and a Preston tube. Space is also available for skin-friction gages or other near-wall flow sensors. Pretest analysis of previous F-lSB/FTF flight data has identified flight conditions suitable for evaluating skin-friction gages. At subsonic Mach numbers, the boundary layer over the sensor panel closely approximates the two-dimensional (2D), law-of-the-wall turbulent boundary layer, and skin-friction estimates from the Preston tube and the rake (using the Clauser plot method) can be used to evaluate skm-friction gages. At supersonic Mach numbers, the boundary layer over the sensor panel becomes complex, and other means of measuring skin friction are needed to evaluate the accuracy of new skin-friction gages. Results from the flight test of a new rubber-damped skin-friction gage confirm that at subsonic Mach numbers, nearly 2D, law-of-the-wall turbulent boundary layers exist over the sensor panel. Sensor panel data also show that this new skin-friction gage prototype does not work in flight.
*Aerospace Engineer fEngineering Student Trainee $Instrumentation Engineer
'Note that use of trade names or names of manufacturers in th is document does not constitute an official endorsement of such products or manufacturers, either expressed or implied, by the National Aeronautics and Space Administration.
Acronvms
FTF
ITllS
RTD
Symbols
c;
g
P T
U
U+
Ueq
UT
X
Y
Y+
6
A
P V
P
z
Nomenclature
Flight Test Fixture
root mean square
resistance temperature detector
coefficient of skin friction transformed into the incompressible plane by the van Driest TI transformation
gravitational acceleration
static pressure
temperature
streamwise flow velocity eq velocity in wall units, - UT
van Driest effective velocity r
U
= 4k friction velocity, uT
streamwise distance from the leading edge
normal distance from the wall PwUrY distance in wall units, y+ = -
P W
boundary-layer thickness
pressure gradient parameter, vw dpe
3 dx A = --
P W U T
viscosity coefficient P kinematic viscosity, - P
density
shear stress
1
aw adiabatic wall
e edge of boundary layer
W wall
Introduction
Surface skin-friction drag is an important force affecting supersonic and hypersonic flight vehicles and vehicle propulsion systems. During the last 40 years, the NASA Dryden Flight Research Center (Edwards, California) has made a significant contribution to skin-friction research for high-speed flight. As early as 1967, Garringer and Saltzman' demonstrated the successful operation of a small, commercially available skin-friction gage on the X-15 aircraft (North American Aviation, Inc., Los Angeles, California) to Mach 4.9. They found that the influence of the wall-to-recovery temperature ratio on measured turbulent skin-friction values was not as large as expected. In 1969, Quinn and Olinge? extended skin-friction measurement on the X-15 aircraft to Mach5.25 and found that the experimentally determined Reynolds analogy factor was significantly higher than the theoretically predicted values. In 1973, Fisher and Saltzman3 measured the skin friction and boundary-layer velocity profiles at various locations on the XB-70-1 aircraft (North American Aviation, Inc., Los Angeles, California) to Mach 2.5. The skin friction was measured using a skin-friction force balance, a Preston tube, and a boundary-layer rake (using the Clauser plot method). Good agreement was obtained with the Karman-Schoenherr correlation at aircraft locations that had approximately two-dimensional (2D) flows. In 1980, Quinn and Gong4 measured skin friction, heat transfer, and boundary-layer velocity profiles on a hollow cylinder. The cylinder was mounted beneath a YF-12A aircraft (Lockheed Martin Aeronautics Company, Palmdale, California) at Mach 3.0. Quinn and Gong's results showed good wind-tunnel-to-flight skin-friction correlation.
Current hypersonic flight research efforts at NASA Dryden, primarily the X-43A research vehicle (Micro Craft, Inc., Tullahoma, Tennessee),' have made accurate skin-friction measurement even more critical than it has been in the past. In addition to flying at comparatively higher Mach numbers of 7.0 to 10.0, where external aerodynamic skin-friction drag is expected to be severe, the X-43A uses a scramjet engine through which flow remains supersonic. As a result, the skin-friction drag inside the X-43A scramjet engine can be significant as well.
Measuring skin friction in flight poses unique challenges in addition to those encountered in wind-tunnel testing. The gages and signal-conditioning systems must be compact to fit into tight spaces in the volume-limited flight vehicle. For ease of integration into the flight instrumentation system, the gages should not have any signal-conditioning requirement other than those supported by the flight vehicle. The gages and signal-conditioning systems are exposed to a wide variation of ambient pressures and temperatures in Right, and the test time in fight often is longer than in a wind-tunnel test. Most importantly, the gages must be robust to survive extreme conditions encountered in flight, such as stage-separation shock, g loads, vibration, electromagnetic interference, and engine-firing heat loads, and still provide accurate measurements.
To address the challenges of measuring skin friction in flight and to support the development of skin-friction gages and other near-wall flow sensors for flight research, a boundary-layer sensor panel has been developed for use on the NASA Dryden F-15B (McDonnell Douglas Corporation, St. Louis, Missouri)/Flight Test Fixture (FTF). This report describes the boundary-layer sensor panel and flight signal-conditioning system, evaluates flow quality over the sensor panel for both subsonic and supersonic flight conditions using previous F-lSBFIF flight data, and discusses results from a recent in-flight evaluation of a new rubber-damped skin-friction gage.
Flight Facility Description
The F - 1 5 B R F is an aerodynamics and fluid dynamics research test bed at NASA Dryden.6 Figure 1 shows the F-l5B/FTF in flight, carrying the boundary-layer sensor panel. The FTF is the black, vertical, fin-shaped object mounted on the centerline of the F-15B lower fuselage. Primarily made of composite materials, the FTF was designed for flight research at Mach numbers to a maximum of Mach 2.0. Without the aft fairing, the FTF is 107 in. long, 32 in. high, and 8 in. wide. To improve the flow quality aft of the FTF, the aft fairing was used for the flight discussed in this report. The aft fairing adds an additional 18.8 in. to the length of the FTF, as shown in figure 2. The boundary-layer sensor panel is the small white aluminum panel located toward the aft end of the FTE As shown in figure 2b, the flow at the proposed sensor panel location is relatively straight and uniform. The FTF noseboom provides local incoming flow properties in addition to the airdata provided by the aircraft noseboom. Signal-conditioning systems for the experiment are mounted inside the FI'F.
2

Figure 1. NASA Dryden E15BIFTF in flight with the boundary-layer sensor panel.
3

Tufts
L
Figure 2.
(a) FTF without aft fairing.
J 1 _~____-- - - ------ I-LIy---”__x-..LI-_L.̂ cy_--I_~III.-_.II1-
(b) FIT with aft fairing.
Tuft flow visualization of the F-lSB/FI’F at Mach 0.7,45,000 ft (from Richwin&.
4

'I I ,
Boundary-J .aver Sensor Panel Description
Figure 3 shows a closeup view of the boundary-layer sensor panel. The sensor panel is an 8.00-in.-square, 0.75-inAhick aluminum plate designed to fit into existing 8.00-in. hatches on either side of the FI'F, which facilitates joint flight testing with other FTF experiments. Detailed survey of the boundary layer over the sensor panel is made possible by a high-resolution boundary-layer rake and a Preston tube. Resistance temperature detectors (RTDs) and Micro-Foil@ (RdF Corporation, Hudson, New Hampshire) heat-flux sensors have been installed on both the front and back side of the sensor panel. In addition, three rows of static pressure taps (indicated by the triangles in figure 3) are present to provide local-wall static pressures on the surface of the sensor panel. In the top row, two static pressure taps are located in front of the Preston tube. In the middle row, two static pressure taps are placed across the skin-friction gage, and two static pressure taps are located in front of the rake in the bottom row. Space is available on the sensor panel to accommodate
two skin-friction gages or other near-wall flow sensors. As figure 3 shows, only one skin-friction gage has been installed at location No. 1. The mounting hole for the second skin-friction gage has been filled with a matching aluminum blank plug at location No. 2.
As figure 3 shows, limited space on the sensor panel necessitates the mounting of the boundary-layer rake and the Preston tube 1.5 in. downstream of the skin-friction gages. Boundary-layer analysis for the F-15BIFTF flight conditions shows that this location mismatch should result in a skin-friction coefficient change of only 0.25 percent. This small change is well within the accuracy of direct skin-friction measurement gages, which is ?5 percent based on past skin-friction mea~urements.~ The location mismatch, therefore, is not expected to present problems in evaluating skin-friction gages. Furthermore, mounting the rake and the Preston tube downstream of the skin-friction gages reduces any interference effects that these intrusive instruments might have on the gages.
Instrumcntlocatlon6: l-Skln-triCtlong8gel 2 - Skln-frlctlon gage 2 3- Boundary-layer rake 4-RTDtempcraturesanwr 5 - Heat-flux sensor 6-Ptestontube A- Static t e p ~
Figure 3. Closeup view of the boundary-layer sensor panel installation on the F- 1 5 B m in flight.
5

The boundary-layer rake and the Preston tube used on the sensor panel have been designed and built specifically for the F- 15BFI-F flight c0nditions.l As figure 4 shows, the rake has a curved body, which allows the pitot tubes to be more densely clustered in the near-wall region than conventional rakes allow. For the FTF boundary layer, the law-of-the-wall region extends approximately 0.5 in. above the surface of the FTF, and the pitot tubes are spaced on the curved portion of the rake such that approximately ten tubes are located inside this region. This number of tubes should be sufficient for computing the skin-friction shear stress using the Clauser plot method. The rake total height is 2.94 in., which allows it to span the entire F-15BFI-F boundary layer over the expected flight envelope. The centerline of the first pitot tube is approximately 0.04 in. from the
wall. This boundary-layer rake has been found to give accurate measurements in a wind-tunnel test to a maximum of Mach 2.0.'
Hopkins and Keener' discussed a method for sizing Preston tubes. Using their method and a representative F-15BFI-F flight condition at Mach 0.8 and an altitude of 30,000 ft, analysis has shown that the maximum Preston tube diameter for which a single calibration curve would be expected to be applicable is 0.312 in., and the minimum Preston tube diameter is 0.012 in. Essentially the same range of Preston tube sizes is obtained using the sizing formulas from Allen." The current Preston tube outer diameter of 0.125 in. falls well within this allowable range. This Preston tube also has been found to perform well in a wind-tunnel test.'
n 2.536 in. - 3.030 in.
\\ / 0.165 in. I
0.030 in. 00.042 in.
detail^ I I Scale 8:l
0.188 in.
Figure 4. Detailed three-view drawing of the F-lSBFIT curved rake design.
6

Sicnal Conditioning Svstem for the Boundary-Layer Sensor Panel
The various flow sensors and pressure taps on the boundary-layer sensor panel require an onboard signal-conditioning system. A compact and high-performance signal-conditioning system was configured for the boundary-layer sensor panel. Conditioned signals from each of the boundary-layer sensor panel measurements are added to the standard FTF data acquisition system, which is described by Richwine.6
Analog signal conditioning for the low-output-level skin-friction gages and heat-flux gages was provided by a multiple-purpose design containing bridge completion, gain, offset, and active three-pole Butterworth filtering. Each channel was configured individually for each sensor. Signal conditioning is located in close proximity to the boundary-layer sensor panel.
Pressure measurements, including all boundary-layer rake ports, the Preston tube, and surface static ports, are obtained using two temperature-controlled, electronically scanned pressure transducers sampled at a rate of 25 samples/sec. The surface static ports, Preston tube, and six boundary-layer rake ports nearest the surface are measured with a +5-lbf/in2 differential transducer. Estimated uncertainty in these measurements is 20.018 lbf/in2. The remaining boundary-layer rake ports are measured with a k 10-lbf/in2 differential transducer. Estimated uncertainty in these measurements is 20.036 lbf/in2. Both pressure transducers are referenced to the FTF noseboom static pressure with estimated uncertainty within 20.023 Ibf/in2. Transducer temperatures are monitored and available in the data stream.
The RTD, configured as one arm of a Wheatstone bridge with a three-wire hookup, measures wall temperature. Measurement uncertainty is estimated at 20.4 OF. Signal conditioning, including cold-junction compensation, is supplied for both Type-K and Type-T thermocouples installed in the skin-friction and heat-flux gages, respectively. In addition to the uncertainties associated with the specific thermocouple types, the measurement uncertainty from the onboard data system is estimated to be 22.0 OF.
Pre-Test Boundary-Layer Analvsis for Flows Near the Boundary-Laver Sensor Panel
During the design phase of the boundary-layer sensor panel, analysis of boundary-layer velocity profiles collected during previous F-lSB/FTF flight tests6 was conducted to determine the flow quality in the vicinity of the proposed sensor panel. An understanding of boundary-layer properties is important to determine the correct instrumentation size and location. Also, the Preston tube and Clauser plot methods assume a 2D, fully turbulent boundary layer. Therefore, the identification of flight conditions that produce 2D, fully turbulent boundary layers is important so that an evaluation of the skin-friction gage accuracy can be made.
Richwine published boundary-layer data for the entire matrix of flight conditions conducted in his experiment, covering a significant portion of the F-lSB/FI'F flight envelope.6 Boundary-layer velocity profiles near the current boundary-layer sensor panel location are available for altitudes of 15,000, 30,000, and 45,000 ft, at Mach numbers ranging from 0.39 to 2.0. An understanding of the local boundary-layer properties can be gained from analyzing this comprehensive database.
The van Driest effective velocity concept, as described by White," can be used to collapse the boundary-layer velocity profiles at different free-stream Mach numbers into the well-known incompressible law of the wall. Figure 5 compares the turbulent boundary-layer velocity profiles obtained at an altitude of 15,000 ft for aircraft Mach numbers ranging from 0.39 to 0.98. The velocity profiles at different Mach numbers all collapse into the ordinary incompressible law of the wall, and the agreement is good. The rake used in Richwine's flight experiment is a canted rake that spans approximately 5 in. across the flow. Because the velocity profiles do not have discontinuities, Richwine's rake data show that the flow is approximately 2D at this location.
Figure 6 compares the turbulent boundary-layer velocity profiles obtained at an altitude of 30,000 ft for aircraft Mach numbers ranging from 0.51 to 1.48. Only the data from subsonic flights agree with the law of the wall. At supersonic Mach numbers, the velocity profiles are below the law of the wall, and the disagreement becomes larger at greater Mach numbers.
7

Figure 7 compares the turbulent boundary-layer velocity profiles obtained at an altitude of 45,000 ft for aircraft Mach numbers ranging from 0.7 to 2.0. Again, only the data from subsonic flights agree with the law of the wall, a result similar to the data obtained at an altitude of 30,000 ft. At supersonic Mach numbers, the velocity profiles are significantly below the law of the wall. Starting at Mach 1.06, the velocity profiles move away from the law of the wall until Mach 1.39; then at Mach numbers greater than 1.39, the velocity profiles move back toward the law of the wall.
At supersonic Mach numbers, the disagreement between the velocity profiles and the law of the wall appears to be caused by shock formation over the FI'F surface, as observed by Richwine.6 At transonic and supersonic Mach numbers, wall pressure data from his experiment indicated the presence of shocks over the FIT. Richwine observed that the shocks weakened at Mach numbers greater than 1.39.6 Figure 7 shows that the velocity profiles move back toward the law of the wall at Mach numbers greater than 1.39, a trend that corresponds with Richwine's observation.
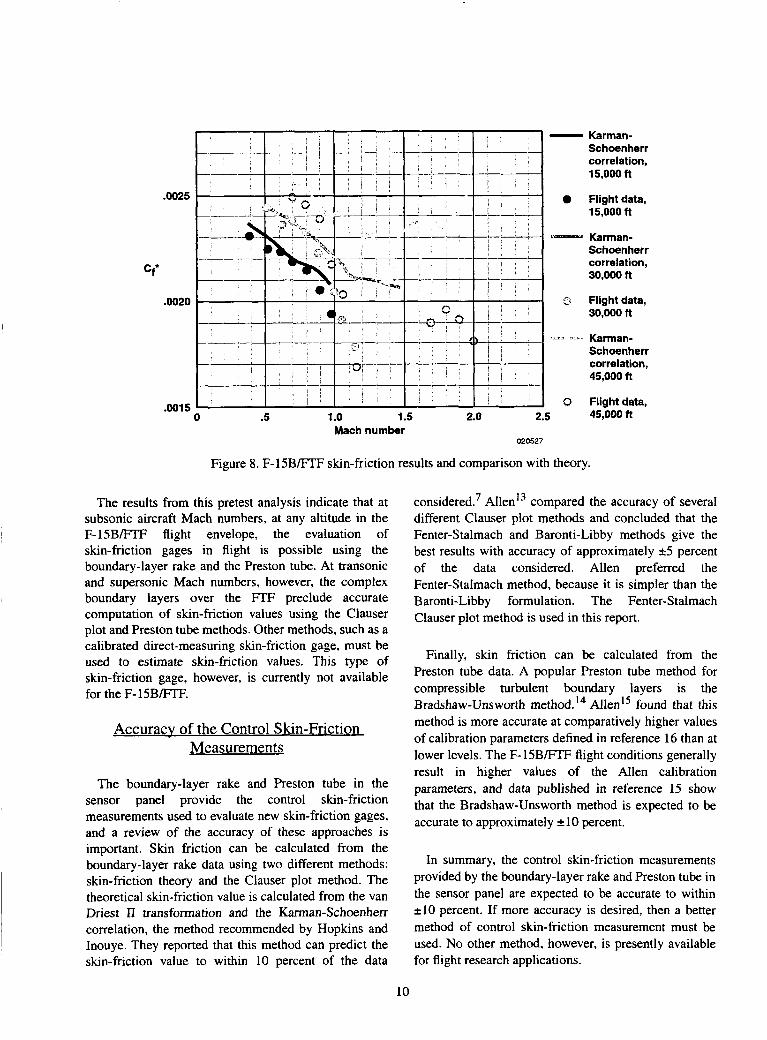
The skin friction can be calculated from Richwine's boundary-layer velocity profiles using the Clauser plot
method and the Fenter-Stalmach law of the wall, as described by Allen and Tudor.I2 Figure 8 presents the skin-friction results for altitudes of 15,000, 30,000, and 45,000 ft. Comparison with the incompressible Karman-Schoenherr correlation is possible, because the compressible skin-friction values have been transformed into the incompressible plane using the van Driest Il correlation, described by Hopkins and I n ~ u y e . ~ A different Karman-Schoenherr curve exists for each altitude, because the Reynolds number changes with altitude.
For the three altitudes considered, the agreement with theory is good at subsonic Mach numbers, and the agreement worsens as the flight Mach number is increased toward Mach 1.0. At supersonic Mach numbers, the rake results diverge from theory, which indicates complex boundary layers. At an altitude of 45,000 ft, for aircraft Mach numbers between 1.16 and 1.69, the computation of skin-friction values using the Clauser plot method is not possible. At these particular conditions, the velocity profiles could not be made to fit the log-law profile, regardless of the skin-friction values.
Ln(y+)/0.41 Mach 0.39 Mach 0.52 Mach 0.61 Mach 0.70 Mach 0.80 Mach 0.90 Mach 0.98
10 100 1 ,Ooo 10,000 100,Ooo
Y+ 020524
Figure 5. F-lSB/FTF boundary-layer velocity profiles at 15,000 ft.
+ 5.00
8

35
30
25
U+
20
15
- Ln(y+)/0.41 + 5.00 Mach0.51
A Mach0.62 X Mach0.70 X Mach0.79 0 Mach0.89 4- Mach 1.00 I Mach 1.05
* Mach 1.15 Mach 1.28 Mach 1.39 Mach 1.48
10 100 1,000 10,000 100,000 Y+
020525
Figure 6. F- 1 5 B m boundary-layer velocity profiles at 30,000 ft.
35
30
25
U+
20
15
10
- Ln(y+)lOAl + 5.00 0 Mach0.70 A Mach0.79 X Mach0.90 X Mach0.98 0 Mach 1.06
4- Mach1.16 I Mach 1.28 0 Mach 1.39
Mach 1.49 Mach 1.69
, Mach 1.80 ' Mach 1.90 .: Mach2.00
100 1,000
Y+ 10,000 100,000
020526
Figure 7. F-ISBFIF boundary-layer velocity profiles at 45,000 ft.
9
- -- ---
I ' , i ' I t
- -
I I ! I - , 1
The results from this pretest analysis indicate that at subsonic aircraft Mach numbers, at any altitude in the F-lSB/FTF flight envelope, the evaluation of skin-friction gages in flight is possible using the boundary-layer rake and the Preston tube. At transonic and supersonic Mach numbers, however, the complex boundary layers over the FTF preclude accurate computation of skin-friction values using the Clauser plot and Preston tube methods. Other methods, such as a calibrated direct-measuring shn-friction gage, must be used to estimate shn-friction values. This type of skin-friction gage, however, is currently not available for the F- 15BlFF.
- Karman- Schuenherr correlation, 15,000 ft
Accuracv of the Control Slun-Friction Measurements
The boundary-layer rake and Preston tube in the sensor panel provide the control skin-friction measurements used to evaluate new skin-friction gages, and a review of the accuracy of these approaches is important. Skin friction can be calculated from the boundary-layer rake data using two different methods: skin-fnction theory and the Clauser plot method. The theoretical skin-friction value is calculated from the van Driest I1 transformation and the Karman-Schoenherr correlation, the method recommended by Hopkins and Inouye. They reported that this method can predict the skin-friction value to within 10 percent of the data
ons side red.^ AllenI3 compared the accuracy of several different Clauser plot methods and concluded that the Fenter-Stalmach and Baronti-Libby methods give the best results with accuracy of approximately 25 percent of the data considered. Allen preferred the Fenter-Stalmach method, because it is simpler than the Baronti-Libby formulation. The Fenter-Stalmach Clauser plot method is used in this report.
Finally, skin friction can be calculated from the Preston tube data. A popular Preston tube method for compressible turbulent boundary layers is the Bradshaw-Unsworth method.I4 Allen" found that this method is more accurate at comparatively higher values of calibration parameters defined in reference 16 than at lower levels. The F- 1 5 B m flight conditions generally result in higher values of the Allen calibration parameters, and data published in reference 15 show that the Bradshaw-Unsworth method is expected to be accurate to approximately k10 percent.
In summary, the control skin-friction measurements provided by the boundary-layer rake and Preston tube in the sensor panel are expected to be accurate to within 1-10 percent. If more accuracy is desired, then a better method of control skin-friction measurement must be used. No other method, however, is presently available for flight research applications.
10

Flight Test of a New Rubber-Damped Skin-Friction Gaee
A new rubber-damped skin-friction gage was evaluated in flight using the boundary-layer sensor panel on the F-lSB/Fl'F. Magill, et al,I7 described an early design of the gage. Sang and Schetz" discussed a significantly improved and ruggedized version of this gage, which was specifically made for flight testing on the F-lSB/FI'F. Figure 9 shows a diagram of the gage, which uses a cantilever-beam, non-nulling approach, with a rubber sheet covering the top of the sensing disk.
7 Rubber Wall shear, 7, -.
/ sheet
020528
Figure 9. Diagram of a rubber-damped F-15B skin-friction gage.
Environmental Test Results
Before it is accepted for use in NASA Dryden aircraft, new flight hardware is normally subjected to a series of rigorous environmental tests, including vibration, altitude (pressure), and temperature tests. In addition to qualifying the equipment for flight, these tests provide an opportunity to evaluate the performance of new sensors and equipment in the controlled environment of a ground laboratory. The specifications for the environmental testing of F- 15B/FTF equipment are provided in reference 6.
For the vibration test on the new gage, the gage was securely mounted on a vibration table, and random vibration measuring 8 g rms was applied for 20 min in each of the 3 normal directions. The frequency for the vibration test ranged from 15 to 2000 Hz. Several modifications were done before the gage passed the
vibration test. The first gages had glycerin fill tubes and caps that were loosely attached to the gage housing. For the gage to withstand the vibration tests, the tubes and caps were replaced by set screws. Later, when glycerin was not used to fill the gage cavity, the glycerin fill holes were left open.
Problems with strain-gage wiring also were discovered during the ground vibration tests. These skin-friction gage prototypes use semiconductor strain gages that are extremely delicate and small, the size of single strands of hair. In the first skin-friction gages delivered to NASA Dryden for this project, the relatively large electrical wires on the outside electrical connector were soldered directly to these delicate semiconductor strain gages, allowing forces on the external wiring connector to be transmitted directly onto the strain gages. Consequently, a slight movement of the wiring connector on the skin-friction gage housing would produce significant erroneous gage outputs. When the vibration test was first attempted, and the skin-friction gage was being mounted to the vibration table, the solder joints to the semiconductor strain gages broke, causing the skin-friction gage to become inoperative before any vibration was applied.
To solve this problem, aircraft-quality electrical connectors and wiring harnesses were used on subsequent skin-friction gages. To relieve the stress on the delicate semiconductor strain gages, an extra soldering pad was used inside the skin-friction gage housing. Small electrical wires were used between the internal soldering pad and the strain gages, and larger electrical wires were used to connect the soldering pad to the outside electrical connector. In addition, stress-relieving wiring loops were used inside the skin-friction gage housing to further isolate the delicate strain gages from forces on the electrical connector. After these modifications, the skin-friction gage passed the ground vibration test.
For the pressure and temperature environmental tests, the skin-friction gage was placed inside a sealed test chamber. The pressures and temperatures inside the chamber were varied to simulate conditions at altitude while the gage output was monitored. For the altitude (pressure) test, the gage was left at ambient temperature, and the pressures were varied between ambient and that of an altitude at 50,000 ft. For the temperature test, the temperatures were varied between -50 and 100 "E and the pressure was held at ambient value. Several different gage configurations were tested. The first skin-friction gages had significant sensitivity to changes in both pressure and temperature. With no glycerin fill (the
11
configuration that was flown on the F-lSB/FTF), the gage was found to be relatively insensitive to changes in ambient pressure. The sensitivity to temperature changes, however, was significant, and it remains a serious flaw of this gage design.
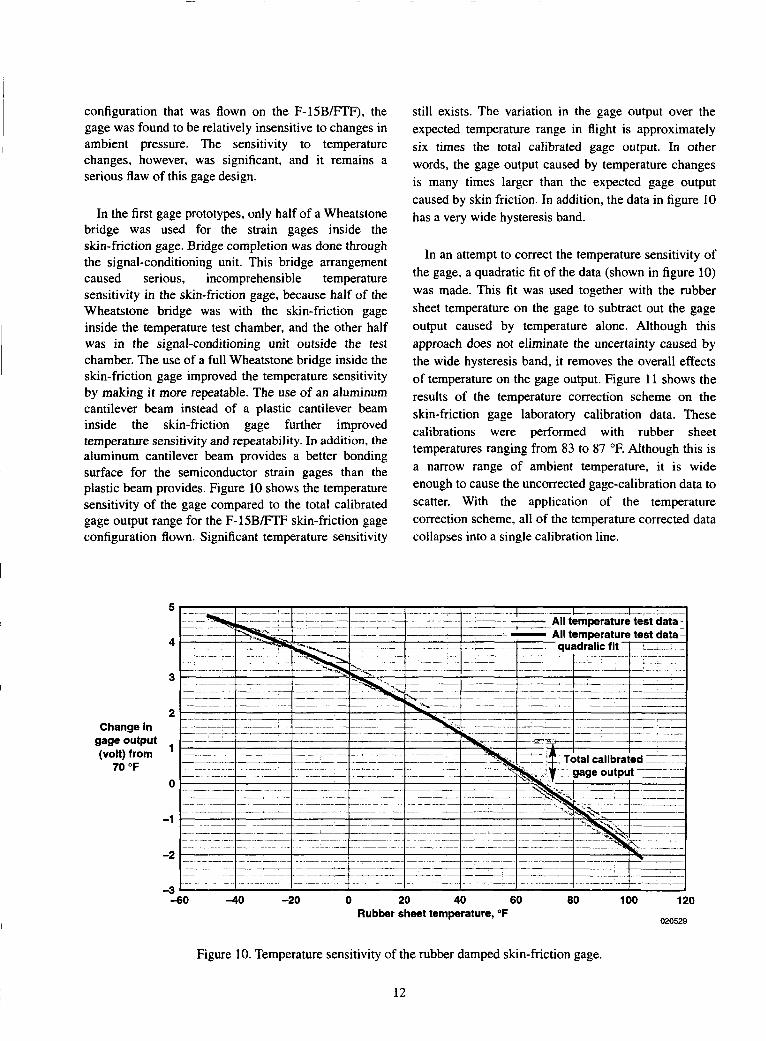
In the first gage prototypes, only half of a Wheatstone bridge was used for the strain gages inside the skin-friction gage. Bridge completion was done through the signal-conditioning unit. This bridge arrangement caused serious, incomprehensible temperature sensitivity in the skin-friction gage, because half of the Wheatstone bridge was with the skin-friction gage inside the temperature test chamber, and the other half was in the signal-conditioning unit outside the test chamber. The use of a full Wheatstone bridge inside the skin-friction gage improved the temperature sensitivity by making it more repeatable. The use of an aluminum cantilever beam instead of a plastic cantilever beam inside the skin-friction gage further improved temperature sensitivity and repeatability. In addition, the aluminum cantilever beam provides a better bonding surface for the semiconductor strain gages than the plastic beam provides. Figure 10 shows the temperature sensitivity of the gage compared to the total calibrated gage output range for the F-lSBFlT skin-friction gage configuration flown. Significant temperature sensitivity
still exists. The variation in the gage output over the expected temperature range in flight is approximately six times the total calibrated gage output. In other words, the gage output caused by temperature changes is many times larger than the expected gage output caused by skin friction. In addition, the data in figure 10 has a very wide hysteresis band.
In an attempt to correct the temperature sensitivity of the gage, a quadratic fit of the data (shown in figure 10) was made. This fit was used together with the rubber sheet temperature on the gage to subtract out the gage output caused by temperature alone. Although this approach does not eliminate the uncertainty caused by the wide hysteresis band, it removes the overall effects of temperature on the gage output. Figure 11 shows the results of the temperature correction scheme on the skin-friction gage laboratory calibration data. These calibrations were performed with rubber sheet temperatures ranging from 83 to 87 "E Although this is a narrow range of ambient temperature, it is wide enough to cause the uncorrected gage-calibration data to scatter. With the application of the temperature correction scheme, all of the temperature corrected data collapses into a single calibration line.
-60 -40 -20 0 20 40 60 80 100 120 Rubber sheet temperature, O F
020529
Figure 10. Temperature sensitivity of the rubber damped skin-friction gage.
12

Change in weight,
9
0 - -- - --+-q2--- -
w ! , ~ : , - Linearfit oftemperaturez I compensated data
1 - -i ____- i- . ___ r- --
Figure 11. Temperature correction to the ground calibration data at different ambient temperatures.
Elight Test Results simultaneously constant, indicating steady-state conditions had been reached. The heat-flux sensors
In-flight evaluation of a non-glycerin-filled malfunctioned during this flight; therefore no meaningful heat-flux data were collected. The wall rubber-damped skin-friction gage was performed using
the F - l S B F F . On December 20, 2000, a dedicated skin-friction flight was conducted on an F-15B aircraft, NASA Dryden tail number 836. An FTF aft fairing was used for this flight. Figure 12 shows the profile for this flight. During the first portion of the flight, a sweep of three altitudes (15,000, 30,000, and 45,000 ft) was conducted. As the aircraft descended from 45,000 ft, the same sweep was conducted in reverse order to confirm data repeatability. At each altitude, four subsonic Mach test points (Mach 0.6, 0.7, 0.8, and 0.9) were obtained. At each test point, the F- 15B aircraft maintained straight and level flight for approximately 2 min to maintain high flow quality and keep acceleration loads from influencing the skin-friction gage reading. Each of the test points shown in figure 12 was carefully chosen to assure a 2D, law-of-the-wall boundary layer over the sensor panel, as discussed previously.
- temperature measurements, however, provide a good indication of wall heat-transfer rates. Figure 13 shows a plot of the ratio of the wall temperature as measured by the outside wall RTD to the calculated adiabatic wall temperature ( T w / T a w ) for all the flight conditions. The wall temperature is close to adiabatic wall temperature for most of the flight conditions, with T w / T a w ranges from 0.88 to 1.16. An “adiabatic wall-seeking’’ temperature variation is generally observed. As the airplane climbs to higher altitudes, the warm wall cools towards the adiabatic wall temperature. Conversely, as the airplane descends, the cool wall heats up towards the adiabatic wall temperature. The in-flight variation of TWITaw is not expected to influence the accuracy of various instruments in the sensor panel. Hopkins and Inouye7 found that skin-friction theories can accurately
When reducing flight data, care was taken to average
flight conditions, including Mach number, altitude, angle of attack, and angle of sideslip, were ratios as low as 0.32 to 0.51.
predict the slun friction at TWITaw ratios greater than 0.3.
calibrations agree very well with the data at TWITaw only the data in the time intervals during which all the Also, Allen16 found that the compressible Preston tube
13

I - i Altitude, ft 50,000
45,000
40,000
35,000
30,000
Altitude, 25,000
20,000
1 5 , m
10,Ooo
5,OOO
ft
0 0 10 20 30 40 50 60 70
Flight time, min om531
Figure 12. Flight profile for skin-friction gage evaluation.
I .o
.9
.8
.7
.6
s number Mach
.4
.3
.2
.1
TW
Taw -
Flight conditions 020532
Figure 13. Wail temperature ratio at the sensor plate.
14

Data from the wall static pressure taps indicate that very small streamwise pressure gradients exist in the vicinity of the sensor panel. The pressure gradient parameter
as discussed by Patel," is plotted in figure 14. In this figure, pressure gradients for the rake and Preston tube were computed using two wall pressure taps in front of the rake and two in front the Preston tube. Pressure gradients for the skin-friction gage were computed using one wall pressure tap upstream and one downstream of the skin-friction gage. Because the skin-friction gage pressure taps are located beside the boundary-layer rake, these taps also provide the streamwise pressure gradient beside the rake. Interestingly, the small adverse pressure gradient in front of the rake is almost exactly mirrored by the small favorable pressure gradient beside the rake, which shows that the rake is producing a small local pressure disturbance on the sensor plate in a manner similar to that of a small airfoil. The Preston tube produces less disturbance than the rake. The pressure gradient in front of the Preston tube is close to zero for all conditions.
The limiting values of A, as recommended by Patel for a maximum Preston tube error of 6 percent, are plotted in figure 14. The A limits range from -0.007 to 0.015. As figure 14 shows, all pressure gradients are well within the Patel limits. Frei and Thomann2' also studied the Preston tube error caused by local pressure gradients. They found that the error depends on both the local pressure gradient and the Reynolds number (based on the local friction velocity and the Preston tube diameter) and published an empirical fit for the error. Using the Frei and Thomann empirical fit, the expected Preston tube error can be computed for the current flight experiment. Figure 14 shows that the local pressure gradient reaches a maximum of 0.003 at Mach 0.9, and an altitude of 45,000 ft. At this flight condition, the Reynolds number is 419. The expected Preston tube error based on the Frei and Thomann fit is approximately 0.7 percent. This error is well within the uncertainties of this instrument, and the local pressure gradient effects can be considered negligible for this experiment. Note that if the upper A limit value of 0.015 was used in the Frei and Thomann fit, then the error becomes approximately 6 percent, in agreement with Patel's findings.
be derived from the Preston-tube calibration curve. Allen16 demonstrated that a number of popular compressible Preston tube calibrations can be reduced to the incompressible log law at the limit of zero free-stream Mach number. The findings pertaining to the Preston tube (discussed in the preceeding paragraph) can also apply to the Clauser plot method; therefore, the pressure gradient effects can be considered negligible for the Clauser plot method as well.
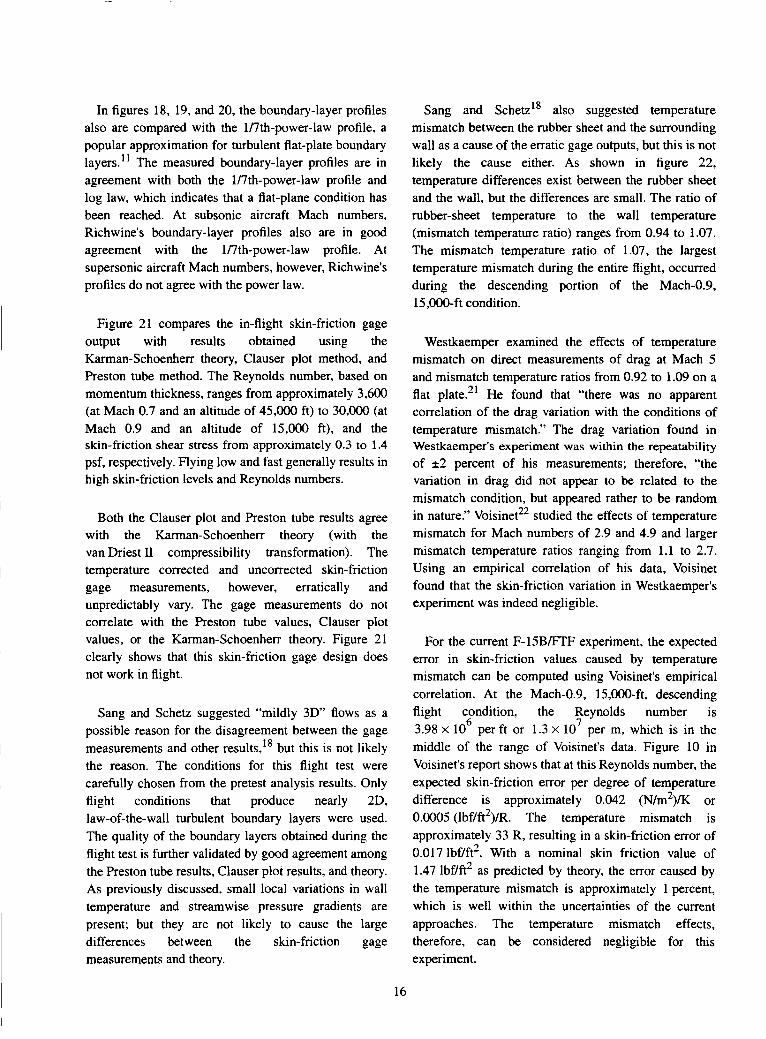
Figures 15, 16, and 17 show the boundary-layer velocity profiles obtained in flight. Figure 15a shows data from the ascending portion of the flight, and figure 15b shows data from the descending portion of the flight, both at altitudes of 15,000 ft. Analogous labeling is used in figures 16 and 17 for the test points at altitudes of 30,000 and 45,000ft, respectively. No Mach-0.9, 45,OOO-ft test point exists for the descending portion of the flight (figure 17b), because this test point is at the top of the flight profile as shown in figure 12. In calculating u+ and y+, the skin-friction values used were obtained from the actual local boundary-layer momentum thickness and the Karman-Schoenherr theory. When skin friction was calculated this way, compressibility was accounted using the van Driest I1 transformation. To compare data with the incompressible law of the wall, the van Driest effective velocity concept was used. As expected, good agreement was obtained between the measured velocity profiles and the law of the wall. Also, for most conditions, very good repeatability of data was achieved between the ascending and descending portions of the flight. In the descending portion of the 45,000-ft flight, however, the measured velocity profiles are noticeably above the standard log-law profile.
During the flight, the pilot had difficulty maintaining steadiness at the Mach-O.7,45,OOO-ft condition, because 0.7 is close to the low Mach number limit for the aircraft at this altitude. Figure 12 shows that as a result of this difficulty, very little time was spent at the Mach-0.7, 45,000-ft condition. This difficulty might have contributed to the large disagreement with the log-law profile shown in figure 17. Interestingly, results derived from Richwine's data (figure 7) also show a worse correlation between skin friction and theory at a 45,000-ft altitude. Apparently, the boundary-layer
The validity of both the Preston tube and Clauser plot methods is based on the well-known log law. Patel'' showed that constants in the incompressible log law can
profiles at a 45,000-ft altitude do not correlate with the log-law profile as well as boundary-layer profiles at lower altitudes.
15
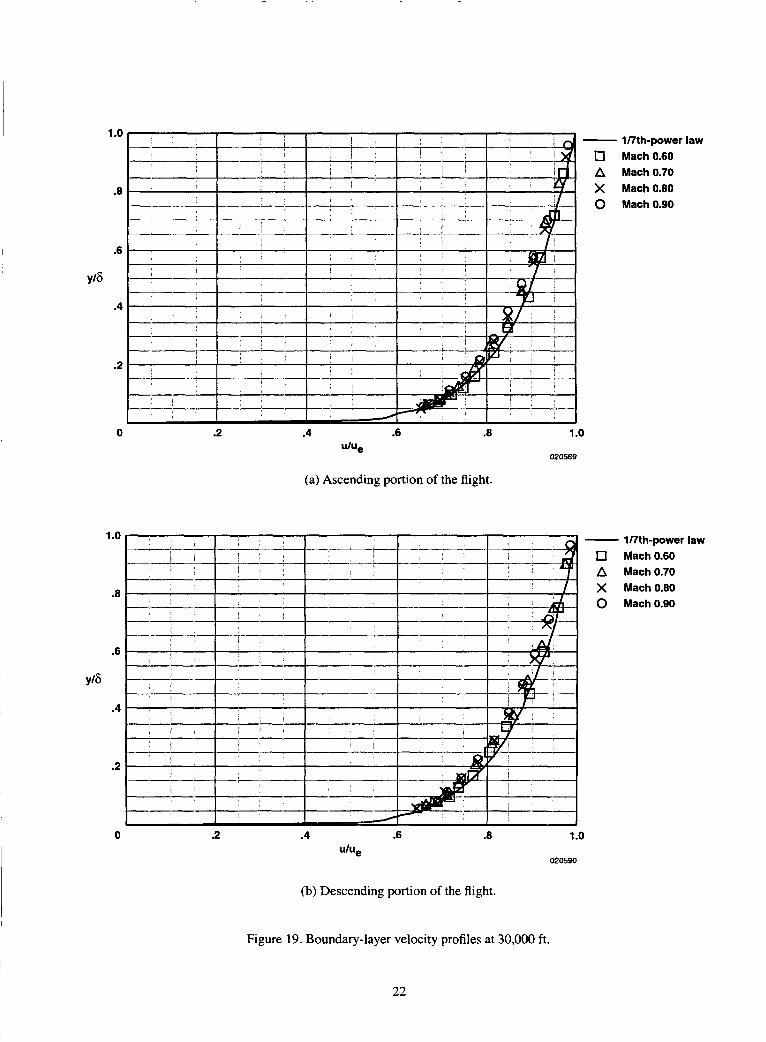
In figures 18, 19, and 20, the boundary-layer profiles also are compared with the 1/7th-power-law profile, a popular approximation for turbulent flat-plate boundary layers. " The measured boundary-layer profiles are in agreement with both the 1/7th-power-law profile and log law, which indicates that a flat-plane condition has been reached. At subsonic aircraft Mach numbers, Richwine's boundary-layer profiles also are in good agreement with the V7th-power-law profile. At supersonic aircraft Mach numbers, however, Richwine's profiles do not agree with the power law.
Figure 2 1 compares the in-flight skin-friction gage output with results obtained using the Karman-Schoenherr theory, Clauser plot method, and Preston tube method. The Reynolds number, based on momentum thickness, ranges from approximately 3,600 (at Mach 0.7 and an altitude of 45,000 ft) to 30,000 (at Mach 0.9 and an altitude of 15,000 ft), and the skin-friction shear stress from approximately 0.3 to 1.4 psf, respectively. Flying low and fast generally results in high skin-friction levels and Reynolds numbers.
Both the Clauser plot and Preston tube results agree with the Karman-Schoenherr theory (with the van Driest Il compressibility transformation). The temperature corrected and uncorrected skin-friction gage measurements, however, erratically and unpredictably vary. The gage measurements do not correlate with the Preston tube values, Clauser plot values, or the Karman-Schoenherr theory. Figure 21 clearly shows that this skin-friction gage design does not work in flight.
Sang and Schetz suggested "mildly 3D' flows as a possible reason for the disagreement between the gage measurements and other results,'8 but this is not likely the reason. The conditions for this flight test were carefully chosen from the pretest analysis results. Only flight conditions that produce nearly 2D, law-of-the-wall turbulent boundary layers were used. The quality of the boundary layers obtained during the flight test is further validated by good agreement among the Preston tube results, Clauser plot results, and theory. As previously discussed, small local variations in wall temperature and streamwise pressure gradients are present; but they are not likely to cause the large differences between the skin-friction gage measurements and theory.
Sang and Schetz" also suggested temperature mismatch between the rubber sheet and the surrounding wall as a cause of the erratic gage outputs, but this is not likely the cause either. As shown in figure 22, temperature differences exist between the rubber sheet and the wall, but the differences are small. The ratio of rubber-sheet temperature to the wall temperature (mismatch temperature ratio) ranges from 0.94 to 1.07. The mismatch temperature ratio of 1.07, the largest temperature mismatch during the entire flight, occurred during the descending portion of the Mach-0.9, 15,000-ft condition.
Westkaemper examined the effects of temperature mismatch on direct measurements of drag at Mach 5 and mismatch temperature ratios from 0.92 to 1.09 on a flat plate.21 He found that "there was no apparent correlation of the drag variation with the conditions of temperature mismatch." The drag variation found in Westkaemper's experiment was within the repeatability of 22 percent of his measurements; therefore, "the variation in drag did not appear to be related to the mismatch condition, but appeared rather to be random in nature." Voisinet22 studied the effects of temperature mismatch for Mach numbers of 2.9 and 4.9 and larger mismatch temperature ratios ranging from 1.1 to 2.7. Using an empirical correlation of his data, Voisinet found that the skin-friction variation in Westkaemper's experiment was indeed negligible.
For the current F-lSB/FI'F experiment, the expected error in skin-friction values caused by temperature mismatch can be computed using Voisinet's empirical correlation. At the Mach-0.9, 15,000-ft, descending flight condition, the Reynolds number is
6 I 3.98 x 10 per ft or 1.3 x 10 per m, which is in the middle of the range of Voisinet's data. Figure 10 in Voisinet's report shows that at this Reynolds number, the expected skin-friction error per degree of temperature difference is approximately 0.042 (N/m2)/K or 0.0005 (lbf/ft2)/R. The temperature mismatch is approximately 33 R, resulting in a skin-friction error of 0.017 Ibf/ft2. With a nominal skin friction value of 1.47 Ibf/ft2 as predicted by theory, the error caused by the temperature mismatch is approximately 1 percent, which is well within the uncertainties of the current approaches. The temperature mismatch effects, therefore, can be considered negligible for this experiment.
16

Possible causes of the skin-friction gage failure during the flight test include the temperature sensitivity of the semiconductor strain gages, faulty installation of the strain gages, mismatch of the strain gages, and the temperature sensitivity of the rubber sheet. The rubber sheet can unevenly expand and contract in response to the ambient temperature changes during flight, inducing extraneous forces on the sensing element of the skin-friction gage. Because of the plastic-elastic nature of the rubber sheet, the effect can be highly non-linear
and non-repeatable, which causes the failure of the temperature compensating algorithm in flight. The rubber sheet can modify the local wall surface. The rubber sheet is not suitable for skin-friction measurements in hot flows, such as a scramjet combustor. Because of these problems, semiconductor strain gages, as well as rubber or polymer materials, should be avoided in the construction of skin-friction gages used in flight test applications.
-8- Rake -A- Skin-friction gage 43- Preston tu& - Upper limit, 6-percent maximum error = = Lower limit, 6-percent maximum error
__I--
:-,-: j : !.d--
.015
.010
.005 Local
pressure gradient 0
parameter,
A -.w5
-.010
Figure 14. Local pressure gradient on the sensor plate.
17

35
30
25
U+
20
15
10
35
30
25
U+
20
15
10
100
- Ln(y+)/0.41 + 5.00 Mach0.60
A Mach0.70 X Mach0.80 0 Mach0.90
1 ,Ooo 10,Ooo 100,Ooo
020534 Y+
100
(a) Ascending portion of the flight.
Ln(y+)/0.41 + 5.00 - 0 Mach0.60 A Mach0.70 X Mach0.80 0 Mach0.90
1,000 10,000 100,Ooo
020535 Y+
(b) Descending portion of the flight.
Figure 15. Boundary-layer velocity profiles at 15,000 ft, in wall units.
18

35
30
25
U+
20
15
10
35
30
25
U+
20
15
10
- Ln(y+)/0.41 + 5.00 0 Mach0.60 A Mach0.70 X Mach0.80 0 Mach0.90
100 1,000 10,000 1 00,Ooo
020536 Y+
(a) Ascending portion of the flight.
- Ln(y+)/0.41 + 5.00 Mach0.60
A Mach0.70 X Mach0.80 0 Mach0.90
100 1,000 10,000 100,000
020537 Y+
(b) Descending portion of the flight.
Figure 16. Boundary-layer velocity profiles at 30,000 ft, in wall units.
19
35
30
25
U+
20
15
10
- Ln(y+)/0.41 + 5.00 A Mach0.70 X Mach0.80 0 Mach0.90
100 1,000 10,Ooo 100,Ooo
020538 Y+
(a) Ascending portion of the flight.
Ln(y+)/0.41 + 5.00 - A Mach0.70 X Mach0.80
35
30
25
U+
20
15
10 100 1,000 10,000 100,000
020539 Y+
(b) Descending portion of the flight.
Figure 17. Boundary-layer velocity profiles at 45,000 ft, in wall units.
20

1 .o
.8
0
1 .o
.8
.2
- 0 A X 0
lnth-power law Mach 0.60 Mach 0.70 Mach 0.80 Mach 0.90
.2 .4 .6 .8 1 .o
020587 ““e
(a) Ascending portion of the flight.
A X 0
lnth-power Mach 0.60 Mach 0.70 Mach 0.80 Mach 0.90
law
0
(b) Descending portion of the flight.
Figure 18. Boundary-layer velocity profiles at 15,000 ft.
21
1 .o
.8
.6
YlS
.4
.2
- lffth-power law 0 Mach0.60 A Mach0.70 X Mach0.80 0 Mach0.90
0 .2 .4 .6 .8 1 .o
020589 due
(a) Ascending portion of the flight.
1 .o I - lffth-power law _______- I i--.-.---,
! I A Mach0.70 X Mach0.80
-____- 0 Mach0.90
I I I # I 0 Mach0.60 ----
II___~__
f - -- I
.8
I
___ -
I
0 .2 .4 .6 .8 1 .o
020590 due
(b) Descending portion of the flight.
Figure 19. Boundary-layer velocity profiles at 30,000 ft.
22

0
1 .o
.8
- ll7th-power law A Mach0.70 X Mach0.80 0 Mach0.90
.2 .4 .6 .8 1 .o
020591 due
(a) Ascending portion of the flight.
0 .2 .4 .6 .8 1 .o UlU,
020592
(b) Descending portion of the flight.
ll7th-power law l - A Mach0.70
~ X Mach0.80
Figure 20. Boundary-layer velocity profiles at 45,000 ft.
23

1 0 ,
Xi 0
2
Shear,
PSf 0 o o v X -2
X
I
-6 Y Y
-
A
X
0
KarmanSchoenherr Theory
Clauser Plot (FenterStalmach)
Preston Tube (Bradshaw-Unsworth)
Skin-friction gage (compensated)
Skin-friction gage (uncompensated)
-10 I 0 5,000 10,OOO 15,000 20,000 25,000 30,000 35,000
Reynolds number based on momentum thickness 020540
Figure 21. Comparison of skin-friction gage measurements in flight with other methods.
Ratio of rubber-sheet temperature
to wall temperature
1.5
1.4
1.3
1.2
1.1
1 .o .9
.8
.7
.6
c ."
020593 Flight conditions
Figure 22. Ratio of skin-friction gage rubber-sheet temperature to the surrounding wall temperature.
24

Conclusion
An 8-in.-square boundary-layer sensor panel has been developed for in-flight evaluation of skin-friction gages and other near-wall flow sensors on the NASA Dryden Flight Research Center F- 15BFlight Test Fixture (FTF). Instrumentation on the sensor panel includes a boundary-layer rake, temperature sensors, static pressure taps, and a Preston tube. Space is also available for skin-friction gages or other near-wall flow sensors.
Pretest analysis of previous F-lSB/FTF flight data has identified flight conditions suitable for evaluating skin-friction gages. At subsonic Mach numbers, the boundary layer over the sensor panel closely approximates the two-dimensional (2D), law-of-the-wall turbulent boundary layer, and skin-friction estimates from the Preston tube and the rake (using the Clauser plot method) can be used to evaluate skin-friction gages and other near-wall sensors. At supersonic Mach numbers, the boundary layer over the sensor panel becomes complex, and other means of measuring skin friction are needed to evaluate the accuracy of new skin-friction gages.
Results from the flight test of a new rubber-damped skin-friction gage confirm that at subsonic Mach numbers, nearly 2D, law-of-the-wall turbulent boundary layers exist over the sensor panel location. The boundary layers are in good agreement with both the law of the wall and the 1/7th power law. At subsonic Mach numbers, the high quality of flows over the sensor panel enables in-flight evaluation of skin-friction gages and other near-wall sensors. In-flight evaluation of a new rubber-damped skin-friction gage prototype showed that the gage did not work in flight. The skin-friction gage measurements did not agree with the control measurements and theory. The gage failure in flight was probably caused by the temperature sensitivity of both the rubber sheet and the semiconductor strain gages used in the skin-friction gage. Because of these problems, semiconductor strain gages, as well as rubber or polymer materials, should be avoided in the construction of skm-friction gages used in flight test applications.
References
‘Garringer, Darwin J., and Edwin J. Saltzman, Flight Demonstration of a Skin-Friction Gage to a Local Mach Number of 4.9, NASA TN D-3830, Feb. 1967.
*Qui,,, Robert D., and Frank V. Olinger, Flight-Measured Heat Transfer and Skin Friction at a
Mach Number of 5.25 and at Low Wall Temperatures, NASA TM X-1921, NOV. 1969.
3Fisher, David F., and Edwin J. Saltzman, Local Skin Friction Coeficients and Boundary-Layer Profiles Obtained in Flight From the XB-70-1 Airplane at Mach Numbers up to 2.5, NASA TN D-7220, June 1973.
4Quinn, Robert D., and Leslie Gong, In-Flight Boundary-Layer Measurements on a Hollow Cylinder at a Mach Number of 3.0, NASA TP-1764, 1980.
’Rausch, V., C. McClinton, and J. Sitz, “Hyper-X Program Overview,” ISABE 99-7213, Sept. 1999.
6Richwine, David M., F-ISB/Flight Test Fixture II: A Test Bed for Flight Research, NASA TM-4782, Dec. 1996.
7Hopkins, Edward J., and Mamoru Inouye, “An Evaluation of Theories for Predicting Turbulent Skin Friction and Heat Transfer on Flat Plates at Supersonic and Hypersonic Mach Numbers,” AZAA Journal, vol. 9, no. 6, June 1971, pp. 993-1003.
‘Bui, Trong T., David L. Oates, and Jose C. Gonsalez, Design and Evaluation of a New Boundary-Layer Rake for Flight Testing, NASA TM 2000-209014, Jan. 2000.
’Hopkins, Edward J., and Earl R. Keener, Study of Sur$ace Pitots for Measuring Turbulent Skin Friction at Supersonic Mach Numbers - Adiabatic Wall, NASA TN D-3478, July 1966.
“Allen, Jerry M., “Critical Preston-Tube Sizes,” Journal of Aircraf, vol. 7, no. 3, May-June, 1970, pp. 285-287.
“White, Frank M., Viscous Fluid Flow, 2nd ed., McGraw-Hill, Inc., Boston, Massachusetts, 199 1.
12AIlen, Jerry M., and Dorothy H. Tudor, Charts for Interpolation of Local Skin Friction From Experimental Turbulent Velocity Profiles, NASA SP-3048, 1969.
13Allen, Jerry M., Use of Baronti-Libby Transformation and Preston Tube Calibrations to Determine Skin Friction from Turbulent Velocity Profiles, NASA TN D-4853, Nov. 1968.
14Bradshaw, P. and K. Unsworth, “Comment on Evaluation of Preston Tube Calibration Equations in Supersonic Flow,” AIM Journal, vol. 12, no. 9, Sept. 1974, pp. 1293-1295.
25

”Allen, Jerry M., “Reply by Author to P. Bradshaw and K. Unsworth,” A I M Journal, vol. 12, no. 9, Sept. 1974, pp. 1295-1296.
16Allen, Jeny M., Evaluation of Compressible-Flow Preston Tube Calibrations, NASA TN D-7190, May 1973.
”Magill, Samantha, Matthew MacLean, Joseph Schetz, Rakesh Kapania, Alexander Sang, and Wade Pulliam, “Study of Direct-Measuring Skin-Friction Gauge with Rubber Sheet for Damping,” AZAA Journal, vol. 40, no. 1, Jan. 2002, pp. 50-57.
‘*Sang, Alexander K., and Joseph A. Schetz, “Study of Rubber Damped Skin Friction Gages for Transonic Flight Testing,” 40th Aerospace Sciences Meeting and Exhibit, AIAA-2002-0533, Jan. 2002.
”Patel, V. C., “Calibration of the Preston tube and limitations on its use in pressure gradients,” Journal of Fluid Mechanics, vol. 23, part 1, pp. 185-208, 1965.
2%rei, D. and H. Thomann, “Direct measurements of skin friction in a turbulent boundary layer with a strong adverse pressure gradient,” Journal of Fluid Mechanics, vol. 101, part 1, pp. 79-95,1980.
21Westkaemper, John C., “Step-Temperature Effects on Direct Measurements of Drag,” AlAA Journal, vol. 1, no. 7, Jul. 1963, pp. 1708-1710.
22Voisinet, Robert L. P., “Temperature Step Effects on Direct Measurement of Skin-Friction Drag,” International Aerodynamics Testing Conference, AlAA-78-779, April 1978.
26


REPORT DOCUMENTATION PAGE
Boundary layer, Flight test, Flow sensors, F-15B, Skin friction
17. SECURITY CLASSIFICATION 18. SECURITY CLASSIFICATION 19. SECURITY CLASSIFICATION OF REPORT OFTHIS PAGE OF ABSTRACT
Unclassified Unclassified Unclassified
Form Approved OMB NO. 0704-0188
31
A03 16. PRICE CODE
20. LIMITATION OF ABSTRACT
Unlimited
Public reportmg burden lor Vus c d l m n of inlormaron IS estimated to average 1 hour per response, icludng the rime lor reviewing instructtons. searching enstlng data sources. gathering and rnamlaIMng the data needed. and completlng and reviemng the collection ot inlwmabon Send comments regarding ths burden estlmate or any omer aspect of Ihs collecllon 01 information, includng suggestlorn lor reduclng lhis burden. to Washington Headquaners SeMces, Directorate for Information operations and Reports. 1215 Jefferson Davis Highway, Suite 1204, Arlington. VA 222024302. and 10 the Offce 01 Management and Budget, Paperwork RedUctlon Prqect (0704-0188). Washington, DC 20503
1. AGENCY USE ONLY (Leave blank) I 2. REPORT DATE I 3. REPORTTYPE AND DATES COVERED
I February2003 I Technical Memorandum 4.TlTLE AND SUBTlTLE
In-Flight Capability for Evaluating Skin-Friction Gages and Other Near-Wall Flow Sensors
6. AUTHOR(S)
Trong T. Bui, Brett J. Pipitone, and Keith L. bake
7. PERFORMING ORGANIZATION NAME(S) AND ADDRESS(ES)
NASA Dryden Flight Research Center P.O. Box 273 Edwards, California 93523-0273
9. SPONSORINGfMONITORING AGENCY NAME(S) AND ADDRESS(ES)
National Aeronautics and Space Administration Washington, DC 20546-0001
5. FUNDING NUMBERS
WU 7 10-55-04-RR-00-000
8. PERFORMING ORGANIZATION REPORT NUMBER
H-25 18
io. SPOKSRIWONITORING AGENCY REPORT NUMBER
11. SUPPLEMENTARY NOTES
Presented at the 41st A M Aerospace Sciences Meeting and Exhibit, Jan. 6-9, 2003, Reno NV as AIAA-2003-074 1
12a. DlSTRlBUTlONlAVAlLABlLlTY STATEMENT 12b. DISTRIBUTION CODE
Unclassified-Unlimited Subject Category 34
This report is available at http://www.dfrc.nasa.gov/DTRS/ I 13. ABSTRACT (Maximum 200 words)
An 8-in.-square boundary-layer sensor panel has been developed for in-flight evaluation of skin-friction gages and other near-wall flow sensors on the NASA Dryden Flight Research Center F-lSB/Flight Test Fixture (FlT). Instrumentation on the sensor panel includes a boundary-layer rake, temperature sensors, static pressure taps, and a Preston tube. Space is also available for skin-friction gages or other near-wall flow sensors. Pretest analysis of previous F-lSBFTF flight data has identified flight conditions suitable for evaluating skin-friction gages. At subsonic Mach numbers, the boundary layer over the sensor panel closely approximates the two-dimensional (2D), law-of-the-wall turbulent boundary layer, and skin-friction estimates from the Preston tube and the rake (using the Clauser plot method) can be used to evaluate skin-friction gages. At supersonic Mach numbers, the boundary layer over the sensor panel becomes complex, and other means of measuring skin friction are needed to evaluate the accuracy of new skin-friction gages. Results from the flight test of a new rubber-damped skin-friction gage confirm that at subsonic Mach numbers, nearly 2D, law-of-the-wall turbulent boundary layers exist over the sensor panel. Sensor panel data also show that this new skin-friction gage prototype does not work in flight.
14. SUBJECTTERMS 115. NUMBER OF PAGES

National Aeronautics and Space Administration codem
I Washington, D.C. 20546-OO01 USA official Business penalty for private use. $300 I
I SPECIAL FOURTH-CLASS RATE POSTAGE AND FEES PAID
NASA I PERMIT No G27
POST MA^ If Undeliverable (Section 158 Postal manual) Do Not Return