nasdaq: mlhr delivering growth by design - … growth by design nasdaq: mlhr investor presentation...
TRANSCRIPT

Delivering Growth by Design
NASDAQ: MLHR
Investor PresentationFourth Quarter FY2017

2
This information contains forward-looking statements within the meaning of Section 27A of the Securities Act of 1933, as amended, and Section 21E of the Securities Exchange Act, as amended, that are based on management’s beliefs, assumptions, current expectations, estimates, and projections about the office furniture industry, the economy, and the company itself. Words like “anticipates,” “believes,” “confident,” “estimates,” “expects,” “forecasts,” likely,” “plans,” “projects,” “should,” variations of such words, and similar expressions identify such forward-looking statements.
These statements do not guarantee future performance and involve certain risks, uncertainties, and assumptions that are difficult to predict with regard to timing, extent, likelihood, and degree of occurrence. These risks include, without limitation, the success of our growth strategy, employment and general economic conditions, the pace of economic recovery in the U.S, and in our International markets, the increase in white-collar employment, the willingness of customers to undertake capital expenditures, the types of products purchased by customers, competitive-pricing pressures, the availability and pricing of raw materials, our reliance on a limited number of suppliers, our ability to expand globally given the risks associated with regulatory and legal compliance challenges and accompanying currency fluctuations, the ability to increase prices to absorb the additional costs of raw materials, the financial strength of our dealers and the financial strength of our customers, the mix of our products purchased by customers, our ability to locate new DWR studios, negotiate favorable lease terms for new and existing locations and the implementation of our studio portfolio transformation, our ability to attract and retain key executives and other qualified employees, our ability to continue to make product innovations, the success of newly
introduced products, our ability to serve all of our markets, possible acquisitions, divestitures or alliances, the pace and level of government procurement, the outcome of pending litigation or governmental audits or investigations, political risk in the markets we serve, and other risks identified in our filings with the Securities and Exchange Commission.
Therefore, actual results and outcomes may materially differ from what we express or forecast. Furthermore, Herman Miller, Inc., undertakes no obligation to update, amend or clarify forward-looking statements.
Forward looking statements

Headquarters: Zeeland, MI, USA Founded: 1905 Employees: ~8,000
FY17 Revenue: $2.28B FY17 Adj. EBITDA: $264M
Company Snapshot
Over 600 dealers in 109 countries and 31 Design Within Reach retail studios
North America 59%
Specialty 10%
Consumer 14%
ELA 17%
3

4
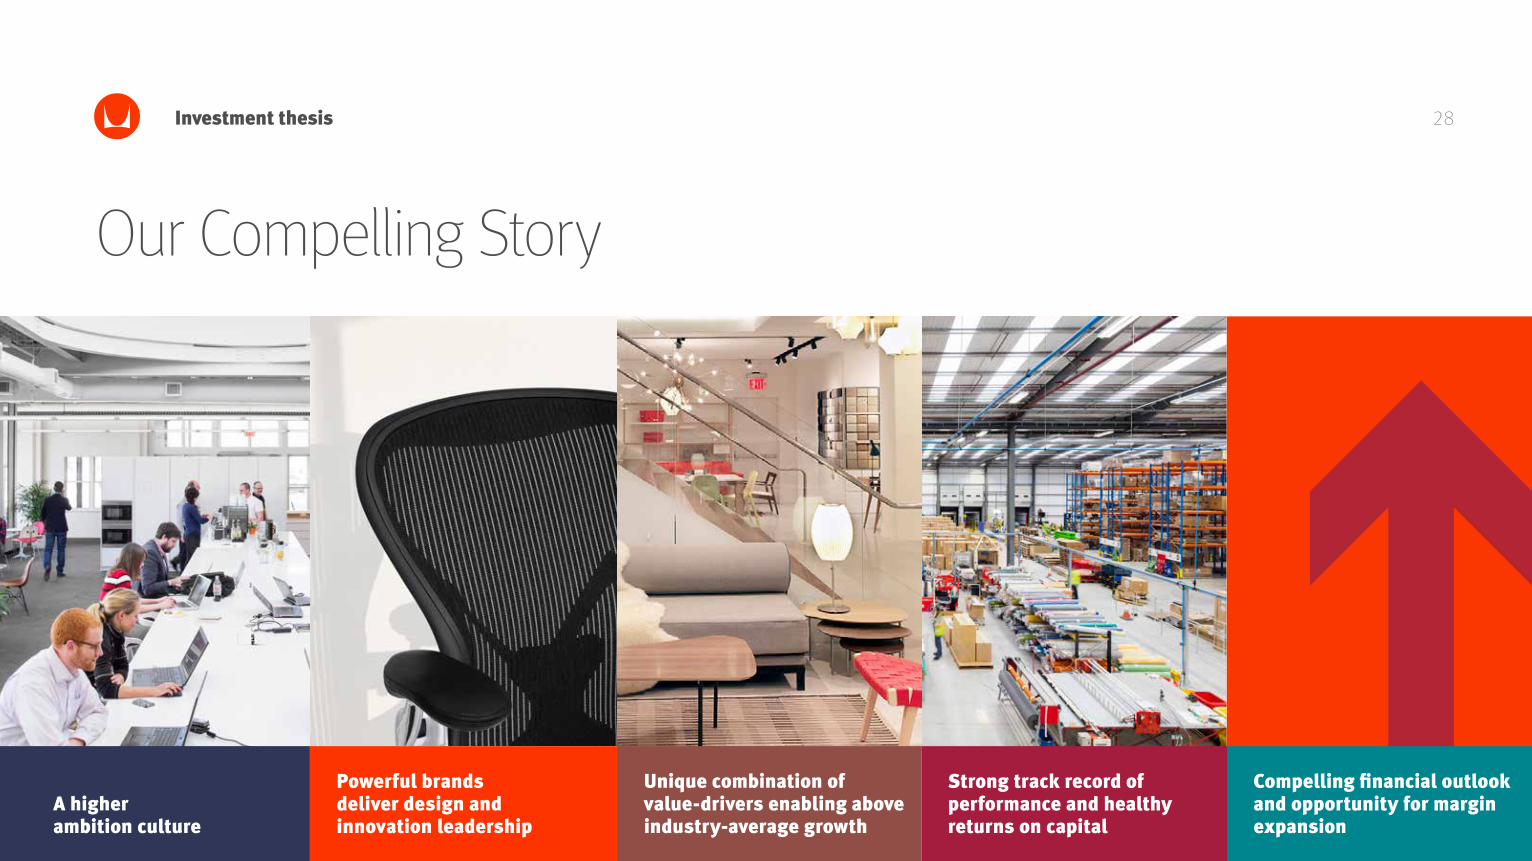
Our Compelling Story
Investment thesis
Powerful brands deliver design and innovation leadership
A higher ambition culture
Unique combination of value-drivers enabling above industry-average growth
Compelling financial outlook and opportunity for margin expansion
Strong track record of performance and healthy returns on capital

5
A higher ambition culture

66
Driven by a sense of purpose and values
A higher ambition culture
“A business is rightly judged by its products and services, but it must also face scrutiny as to its humanity.”- D.J. De Pree, Herman Miller Founder
Ten Consecutive Perfect Score in Human Rights Campaign Foundation’s Corporate Equality Index
Twelve of the Last Thirteen Years on the Dow Jones Sustainability World Index
Corporation of the Year in the Commercial sector for 9 of the last 11 years by the Michigan Minority Supplier Development Council

7
Powerful brands deliver design and innovation leadership

8
An inspiring brand that customers value
Powerful brands deliver design and innovation leadership 8
* Twitter followers as of June 2017 (Herman Miller, Allsteel, Haworth, Knoll, and Steelcase)
#1 in Brand that Inspires, Contract Magazine Survey
Social Media Followers – Over 4X all major competitors combined*

9Powerful brands deliver design and innovation leadership
Healthcare
Performance textiles
Ergonomic work tools
Asia distribution
Nemschoff
Maharam
Colebrook Bosson Saunders
POSH
A portfolio of leading global brands
TIMELESS CRAFT
The convergence of world-class designers, impeccable craftsmanship, and superior materials.
Brabo Sofa by Vincent Van Duysen
Crosshatch™ Chair by EOOS
H Frame Table by Ward Bennett
Full Twist™ Chair by Mark Goetz
Domino Storage™ by Isay Weinfeld
geigerfurniture.com
Herman Miller brands are #1 in six categories, Contract Magazine Survey (2016)
Craft wood furnishingsGeiger
Design Within ReachMarketplace for authentic modern furnishings

10
Commitment to innovation
Powerful brands deliver design and innovation leadership
– Innovation Priorities:
– 24% of our sales were from new products in fiscal 2017
– Introduced 50 new products and extensions in fiscal 2017
– Industry-leading investment in design, research and development at 3.2% of sales in fiscal 2017
10
Collaborative and other
work points
Active/healthy postures
Outdoor, lighting, and
materials
Technology enhanced user
experience

1111
An icon remastered - the new Aeron
Powerful brands deliver design and innovation leadership 11
– Reinforces Herman Miller’s worldwide leadership in high performance seating
– Incorporates the latest in ergonomics and material science innovation
– Extends a powerful franchise that has sold over 7 million chairs in 134 countries

1212
Bringing innovative solutions to our customers through the Living Office framework
Powerful brands deliver design and innovation leadership
– An insight-driven and research-based framework for making place a strategic asset
– Delivers measurable results through improved: • Workplace Effectiveness • Work Activity Support • Workplace Experience

1313
Unique combination of value-drivers enabling above industry-average growth

14
LiveWork Heal Learn
14
The global leader dedicated to creating inspiring places
Unique combination of value-drivers enabling above industry-average growth

Capitalizing on an expanded total addressable market
Unique combination of value-drivers enabling above industry-average growth
North America (Contract)(1)
European (Contract)(2)
Target Emerging Markets (Contract)(3)
Consumer Lifestyle(4)
Healthcare/Education/Hospitality(3)
Small/Medium Business(3)
Textiles(5)
$8B
$10B
$8B$4B
$6B
$4B
$2B$1B
$9B
$2B
$4B
2011—$24B 2016—$35B
Source: (1) BIFMA; (2) CSIL; (3) Company Estimate; (4) Parthenon Group (2014); (5) ACT Financial Survey (2015)
15

Unparalleled multi-channel reach including direct to consumer
Unique combination of value-drivers enabling above industry-average growth
– Over 600 contract dealers in 109 countries
– 31 Design Within Reach retail studios
– Direct to consumer catalog
– Multiple global e-commerce storefronts
– Opportunities to grow share of channel/customer wallet
Catalog
31 Studios600 Dealers
y
E-Commerce
16

17
Clear path to revenue growth and margin expansion in Consumer business
Unique combination of value-drivers enabling above industry-average growth
– Double digit revenue growth opportunity from Design Within Reach by transforming legacy studios to larger formats and adding new locations • 3 to 6 new or expanded studios per year • Increase studio count to low forties and square footage to 500,000 by 2020
– Increase exclusive product mix from 60% to 70% of revenue
– Continued e-commerce growth
– High single digit operating margin target by 2020
17

1818
Positioned for global growth
Unique combination of value-drivers enabling above industry-average growth
– Growing and profitable business outside North America
– Favorable trends and demographics in Asia-Pacific
– Further growth opportunities: • Leverage Herman Miller and POSH brands in Asia-Pacific
• Expand dealer networks and e-commerce platforms • Regional R&D and manufacturing capabilities support new product growth • Leverage Healthcare, Education and Consumer franchises
2012 2017
+2%CAGR
(+5% organic)
ELA Revenue$386M
$347M

19
Strong track record of performance and healthy returns on capital
20
$2.3B
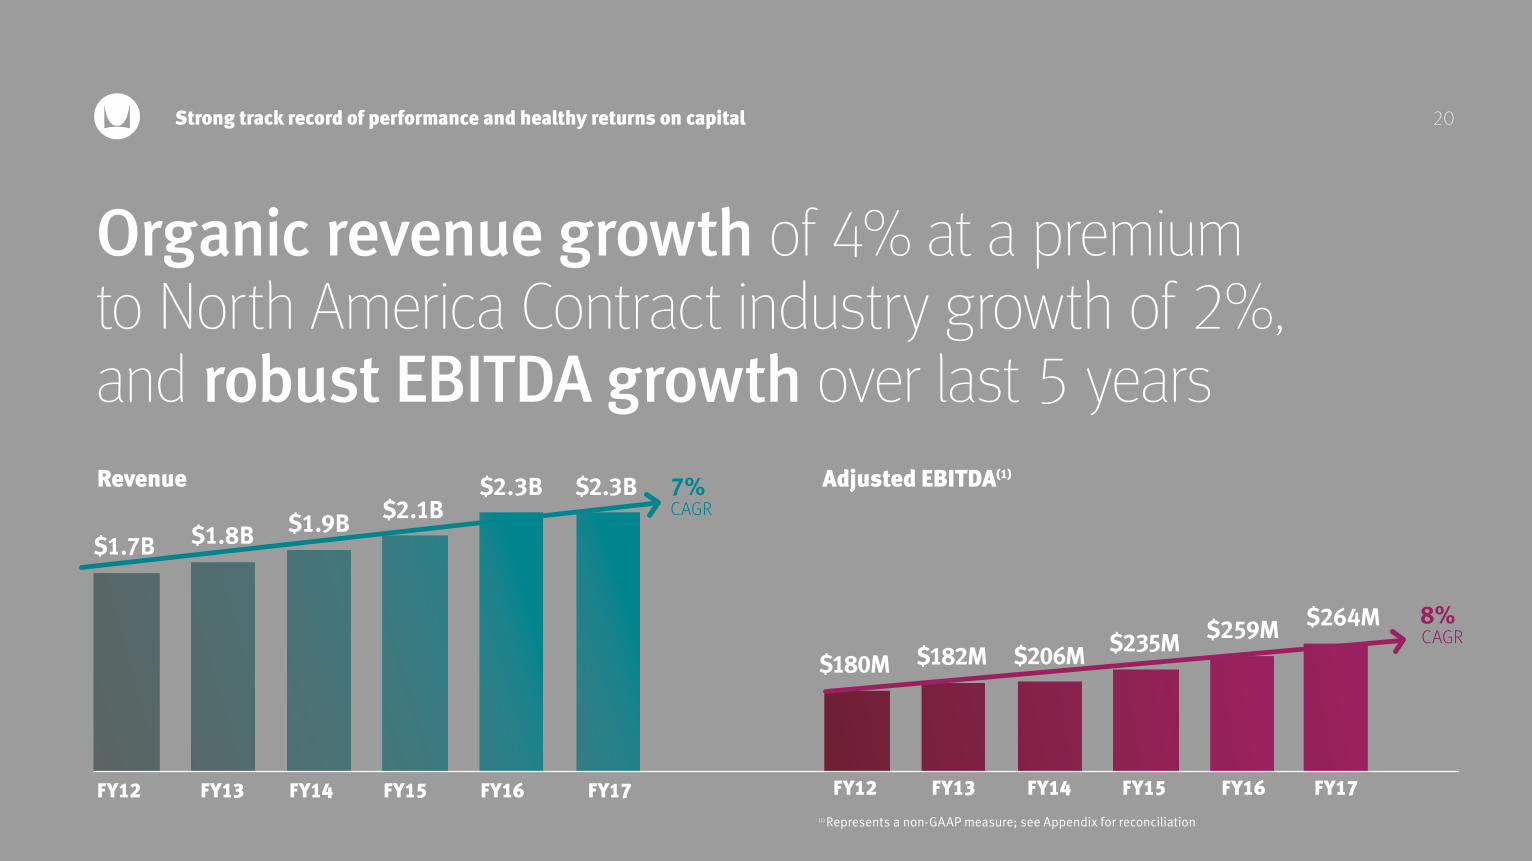
Organic revenue growth of 4% at a premium to North America Contract industry growth of 2%, and robust EBITDA growth over last 5 years
Strong track record of performance and healthy returns on capital
FY12 FY13 FY14 FY15 FY16 FY17
$2.1B$2.3B
$1.9B$1.8B$1.7B
FY12 FY13 FY14 FY15 FY16 FY17
$235M $259M$206M$182M$180M
Revenue Adjusted EBITDA(1)
(1) Represents a non-GAAP measure; see Appendix for reconciliation
8%
7%
CAGR
CAGR
20
$264M

2121
Focused acquisition strategy accelerates our performance
Strong track record of performance and healthy returns on capital
Entering New Areas:
Audience
Channel
Geography
Product

2222
Best-in-class lean enterprise delivers leverage
Strong track record of performance and healthy returns on capital
– Focused improvement through: • Customer first orientation • Waste reduction • Asset efficiency
– One of three U.S. companies showcased by Toyota Production System Support Center
– Further opportunity to spread more broadly and deeply through the organization and across the entire value chain
West Michigan sales per mfg. square foot
+28%
Manufacturing Quality
Engineering lead time for custom requests
+17% +39%
Improvement from FY11 to FY16
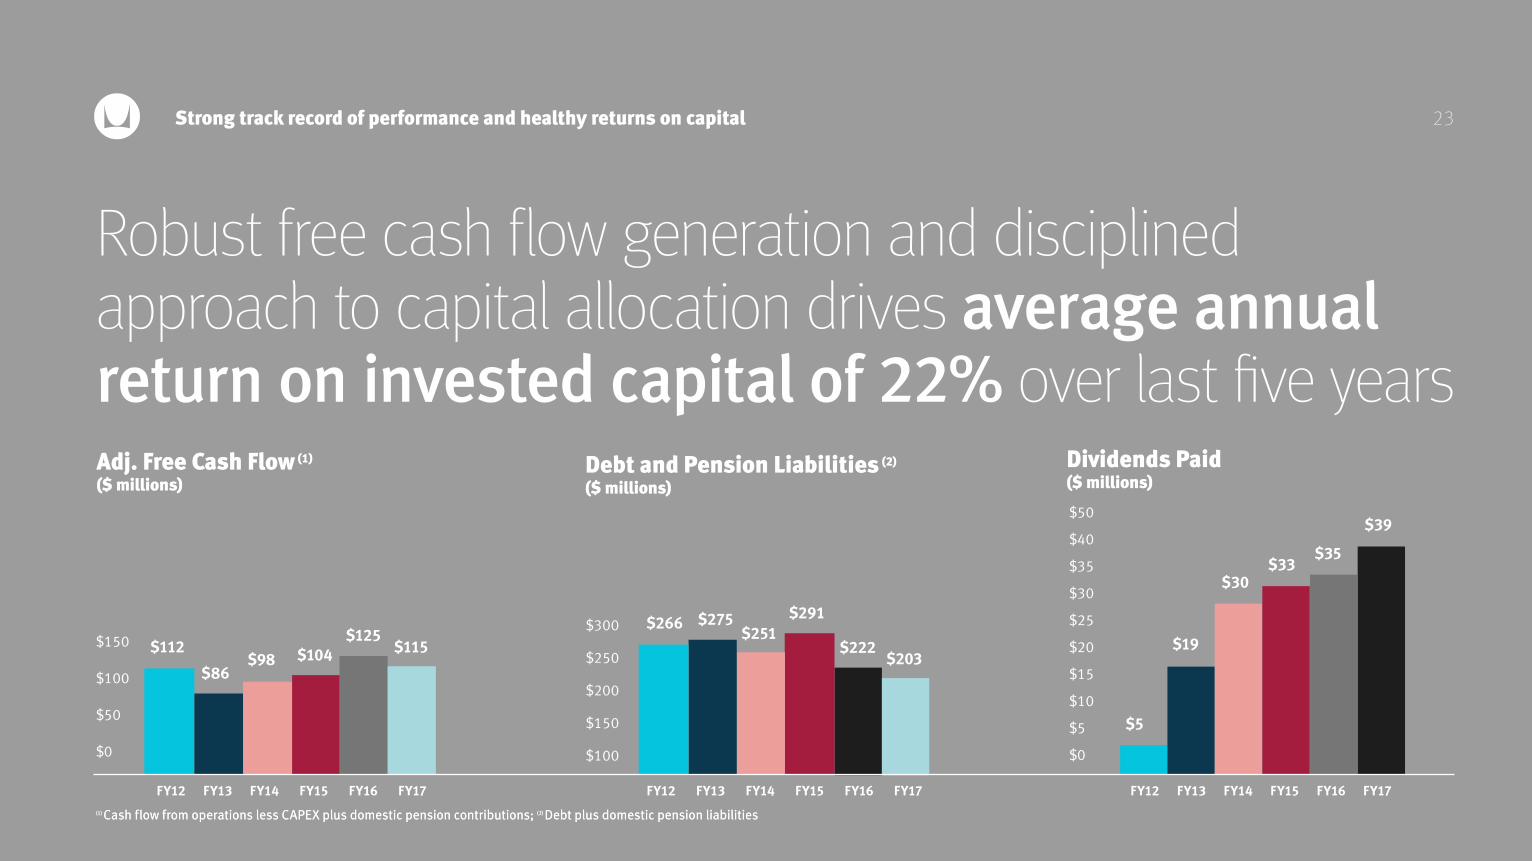
Robust free cash flow generation and disciplined approach to capital allocation drives average annual return on invested capital of 22% over last five years
Strong track record of performance and healthy returns on capital
(1) Cash flow from operations less CAPEX plus domestic pension contributions; (2) Debt plus domestic pension liabilities
23
(1) Cash flow from operations less CAPEX plus domestic pension contributions; (2) Debt plus domestic pension liabilities
FY12 FY13 FY14 FY15 FY16 FY17
$39
Adj. Free Cash Flow (1)
($ millions)
FY12 FY13 FY14 FY15 FY16 FY17
$150
$100
$50
$0
Debt and Pension Liabilities (2)
($ millions)
$300
$250
$200
$150
$100
$125$115
FY12 FY13 FY14 FY15 FY16 FY17
Dividends Paid($ millions)
$35
$50
$40
$35
$30
$25
$20
$15
$10
$5
$0
$98$112
$86$104
$266 $275$251
$291
$222$203
$5
$19
$30$33

2424
Compelling financial outlook and opportunity for margin expansion

25
Housing GDP Forecast
Existing Home Sales (thousands of units)
Housing Starts(thousands of units)
2015 2016 2017 2018
5,250 5,450 5,640 5,806
History Forecast
16.7
2013
17.4
2014
18.2
2015
18.3
2016
19.3
2017
20.2
2018
Forecast
2015 2016 2017 2018
1,1121,174 1,265 1,375
History Forecast
Supportive industry trends
Compelling financial outlook and opportunity for margin expansion 25
Source: BIFMA (May 2017)
Source: World Bank (June 2017)Source: National Association of Realtors (June 2017)
AIA Consensus Construction Forecast
Office (% YOY Growth)
2018
2017
4.6%
10.6%
Jan 2017
201720182019
UK Europe & Cent. Asia
Middle East & N. Africa
IndiaChina Mexico
2.5%2.7%2.8%
2.1%
3.1%2.9%
6.5%7.2%
7.5%7.7%
1.8%2.2%
2.5%
6.3% 6.3%
1.2%1.3%1.3%
North America Sales (in US$ billions) U.S. Architects Billing IndexSource: American Institute of Architects
58
56
54
52
50
48
46
44Ja
n-13
Mar
-13
May
-13
Jul-1
3
Sep-
13
Nov
-13
Jan-
14
Mar
-14
May
-14
Jul-1
4
Sep-
14
Nov
-14
Jan-
15
Mar
-15
May
-15
Jul-1
5
Sept
- 15
Nov
- 15
Jan-
16
Ma-
16
May
-16
Jul-1
6
Sept
-16
Nov
-16
Dec
-16
Jan-
16
Feb-
16
Mar
-16
Apr-
16
May
-16
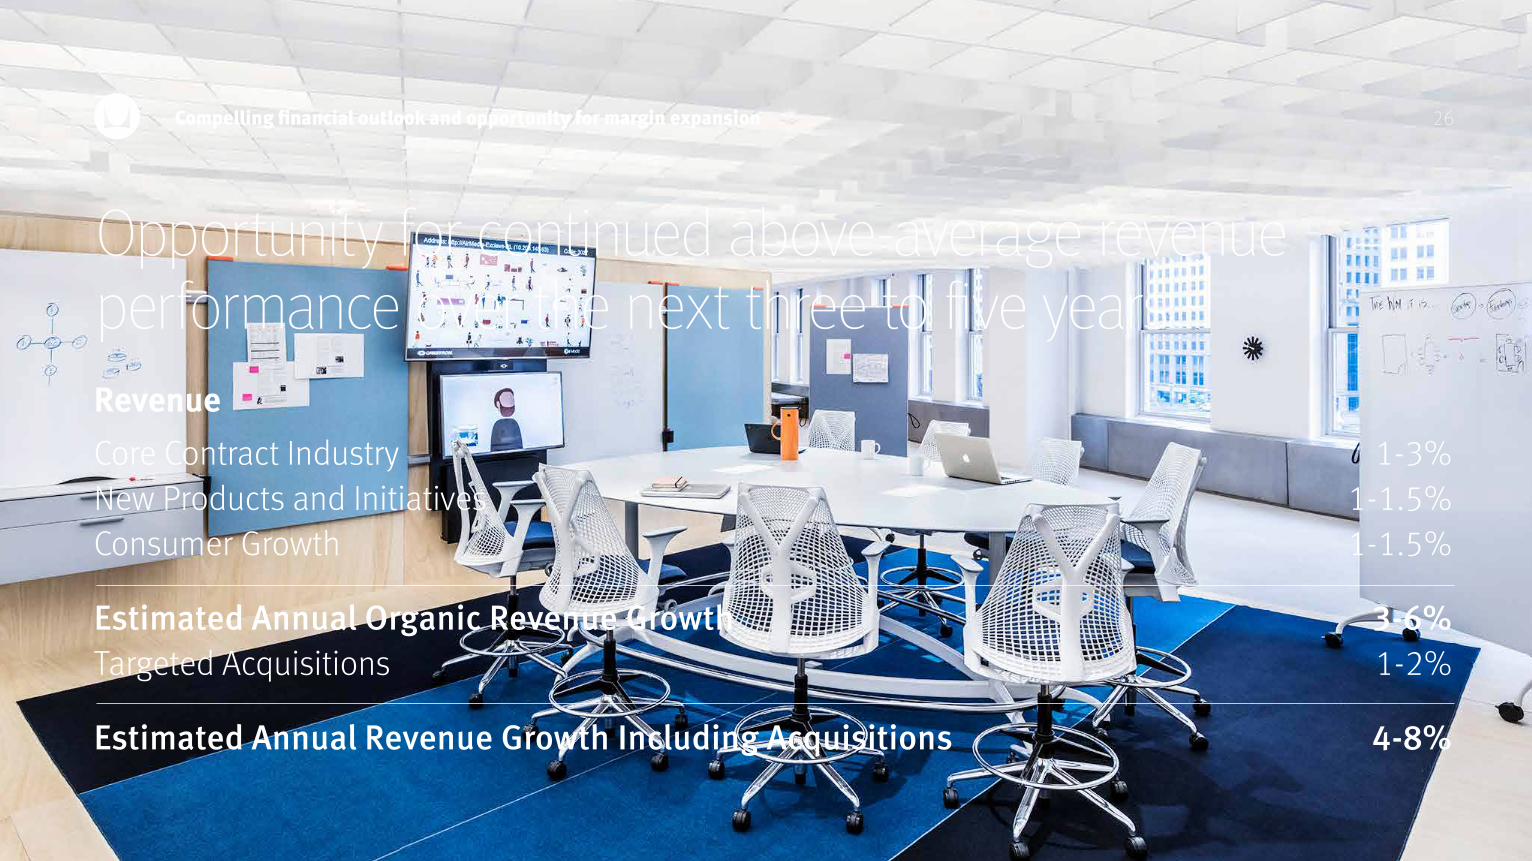
Opportunity for continued above-average revenue performance over the next three to five years
Compelling financial outlook and opportunity for margin expansion
Core Contract Industry 1-3%New Products and Initiatives 1-1.5% Consumer Growth 1-1.5%
Estimated Annual Organic Revenue Growth 3-6%Targeted Acquisitions 1-2%
Estimated Annual Revenue Growth Including Acquisitions 4-8%
Revenue
26

Operating income growth of 2x to 2.5x the rate of organic revenue growth
Compelling financial outlook and opportunity for margin expansion
– Structurally higher operating margins driven by: • Expanding business and channel mix • Consumer growth and higher exclusive product mix • Volume leverage • Lean enterprise focus • Cost savings initiative targeting $25M to $35M in annual savings by FY20
27
28
Our Compelling Story
Investment thesis
Compelling financial outlook and opportunity for margin expansion
Powerful brands deliver design and innovation leadership
A higher ambition culture
Unique combination of value-drivers enabling above industry-average growth
Strong track record of performance and healthy returns on capital

Recent Quarterly Financial Trends

30Recent Quarterly Financial Trends
Quarterly Net Sales + Orders ($ millions) Gross Margin and Adjusted Operating Margin (% net sales)
Quarterly Operating Expenses ($ millions)
Net SalesOrders
Gross Margin %Adjusted Operating Income %
Q1 FY17Q2 FY17Q3 FY17Q4 FY17
Q1 FY17Q1 FY17
Q2 FY17Q2 FY17
Q3 FY17Q3 FY17
Q4 FY17Q4 FY17
$167
38.4% 37.7%
9.4%
37.2%
8.8%
38.3%
7.0%10.2%
$158 $162
$599$578 $577
$525
$174
$596$576 $568$543
$600
$500
$400
$300
$200
50.0%
40.0%
30.0%
20.0%
10.0%
0.0%
$190
$170
$150
$130
$110
$90
$70
$50
Q4 net sales and orders decreased 0.9% and 6.3%, respectively, from the prior year; on an organic basis, excluding the impact of dealer divestitures, the impact of Q4 orders from a Q3 increase and foreign exchange, sales increased 2.7%, while orders were essentially flat compared to the prior year.
Gross margin in Q4 declined 40 bps from the prior year primarily due to higher commodity costs and discounting levels, offset by price realization.
EPS in Q4 totaled $0.55 per share; $0.64 per share on an adjusted basis.

31Recent Quarterly Financial Trends
Quarterly Cash Flow from Operations ($ millions) Rolling 4 Qtr Coverage Ration (EBITDA(1) to Interest)
Rolling 4 Qtr Leverage Ration (Debt to EBITDA)(1)
Q1 FY17Q2 FY17Q3 FY17Q4 FY17
Q1 FY17Q2 FY17Q3 FY17Q4 FY17
Q1 FY17Q2 FY17Q3 FY17Q4 FY17
0.9
Bank Covenant < 3.5
0.80.9
0.8
$80 18.0
$30
18.3
$60
17.9
$28
17.9$90$80$70$60$50$40$30$20$10$0
20.018.016.014.012.010.08.06.04.02.00.0
4.0
3.5
3.0
2.5
2.0
1.5
1.0
0.5
0.0
Q4 ending cash and equivalents totaled $96 million.
LT Debt maturity schedule:
–PPN ($150M) due 2018 –PPN ($50M) due 2021 –Revolver ($0M) due 2021
Availability of $392 million on the revolving line of credit at the end of Q4.
CAPEX totaled $17 million in Q4 and $87 million for the full fiscal year.
Q4 dividends paid totaled $10 million and share repurchases of $7 million. (1) Represents a Non-GAAP Measure, see Appendix for reconciliation
Bank Covenant > 4.0

32Recent Quarterly Financial Trends
Guidance as provided in July 5, 2017 earnings press release:
Q1 Fiscal 2018
Net Sales $570 to $590 million
Gross Margin % 37.5% to 38.5%
Operating Expenses $166 to $170 million
Effective Tax Rate 30.5% to 32.5%
Earnings Per Share, Diluted $0.55 to $0.59

Appendix

Segment Overviews

35Appendix – Segment Overviews
Overview
FY17 Percent of Consolidated Revenues
Macro-Economic Drivers
Five Year Revenue Trend (in US$ millions) FY17 Adj. EBITDA Margin
13.4%
Description: Design, manufacture and sale of furniture products for office, education and healthcare environments in the United States and Canada
Source: BIFMA, May 2017North America Sales (in US$ billions) Healthcare Construction Spending (in US$ billions)
FY12 FY13 FY14 FY15 FY16 FY17
5 YEAR CAGR 2%(3% organic)
Other Leading Economic Indicators include: Corporate profitability, service sector employment, Architectural Billings Index (ABI), Office vacancy rates, CEO and small business confidence, Non-residential Construction
North America Furniture Solutions
Source: U.S. Census Bureau and AIA Fcst, Jan 2017
201
3
201
4
201
5
201
6
2017
2018
2002
200
3
200
4
200
5
200
6
200
7
200
8
200
9
201
0
201
1
201
2
201
3
201
4
201
5
201
6
2017
2018
History Forecast History Forecast
Education Construction Spending (in US$ billions)Source: U.S. Census Bureau and AIA Fcst, Jan 2017
2002
200
3
200
4
200
5
200
6
200
7
200
8
200
9
201
0
201
1
201
2
201
3
201
4
201
5
201
6
2017
2018
History Forecast
70.5 71.2 72.377.1 86.0
98.4104.1 103.1
88.2 88.794.3 100.6
83.579.784.684.779.1
27.5 29.434.1 36.7
39.545.0
47.7 47.0
39.943.4
45.6
41.440.738.4
41.839.7 40.7
1,219 1,222 1,216 1,242$1500
$1300
$1100
$900
$700
$500
North America 59%
Specialty 10%
Consumer 14%
ELA 17%
16.717.4
18.2 18.3 19.320.2
1,332 1,342

36Appendix – Segment Overviews
FY17 Percent of Consolidated Revenues FY16 Adj. EBITDA Margin
Source: CSIL (December 2016)Regional Office Furniture Consumption (in US$ billions) GDP Forecast
201720182019
Region Annual 5 Year CAGR Consumption
Europe $8.7 2.1%China $11.1 7.6%India $2.1 4.3%Brazil $1.3 -10.0%Mexico $0.3 -8.0%
Source: World Bank (June 2017)
10.5%
Overview
Macro-Economic Drivers
Description: Design, manufacture and sale of furniture products primarily for office settings in EMEA (39% of sales in FY17), Latin America (21% of sales in FY17) and Asia-Pacific (41% of sales in FY17)
ELA Furniture Solutions
North America 59%
Specialty 10%
Consumer 14%
ELA 17%
Five Year Revenue Trend (in US$ millions)
413
5 YEAR CAGR 2%(5% organic)
FY12 FY13 FY14 FY15 FY16 FY17
347 377 392 386410
$500
$400
$300
$200
$100
$0
UK Europe & Cent. Asia
Middle East & N. Africa
IndiaChina Mexico
2.5%2.7%2.8%
2.1%
3.1%2.9%
6.5%7.2%
7.5%7.7%
1.8%2.2%
2.5%
6.3% 6.3%
1.2%1.3%1.3%

37
North America 59%
Specialty 10%
Consumer 14%
ELA 17%
FY17 Percent of Consolidated Revenues Five Year Revenue Trend (in US$ millions) FY17 Adj. EBITDA Margin5 YEAR CAGR 20%(6% organic) 11.1%
SpecialtyAppendix – Segment Overviews
FY12 FY13 FY14 FY15 FY16 FY17
Overview
Macro-Economic Drivers
Description: Design, manufacture and sale of high-craft furniture products and textiles focused on architect and design specifiers. The Specialty portfolio includes Geiger wood products, Maharam textiles and Herman Miller Collection products.
Annual Fabric Sales (in US$ millions)Source: ACT Financial Survey
AIA Consensus Construction Forecast (% YOY Growth)Source: The American Institute of Architects, Jan 2017
2017 2018
Non-Residential 5.6% 4.9%Commercial Total 8.3% 4.4%Office 10.6% 4.6%Health 4.9% 4.9%Education 6.3% 6.7%Hotel 7.2% 1.8% 2009 2010 2011 2012 2013 2014 2015
738 814 895929 990
760
1,069
94 112
206 220
$250
$200
$150
$100
$0
232 232
U.S. Architects Billing IndexSource: The American Institute of Architects
58
56
54
52
50
48
46
44
Jan-
13
Mar
-13
May
-13
Jul-1
3
Sep-
13
Nov
-13
Jan-
14
Mar
-14
May
-14
Jul-1
4
Sep-
14
Nov
-14
Jan-
15
Mar
-15
May
-15
Jul-1
5
Sept
- 15
Nov
- 15
Jan-
16
Ma-
16
May
-16
Jul-1
6
Sept
-16
Nov
-16
Dec
-16
Jan-
16
Feb-
16
Mar
-16
Apr-
16
May
-16
38
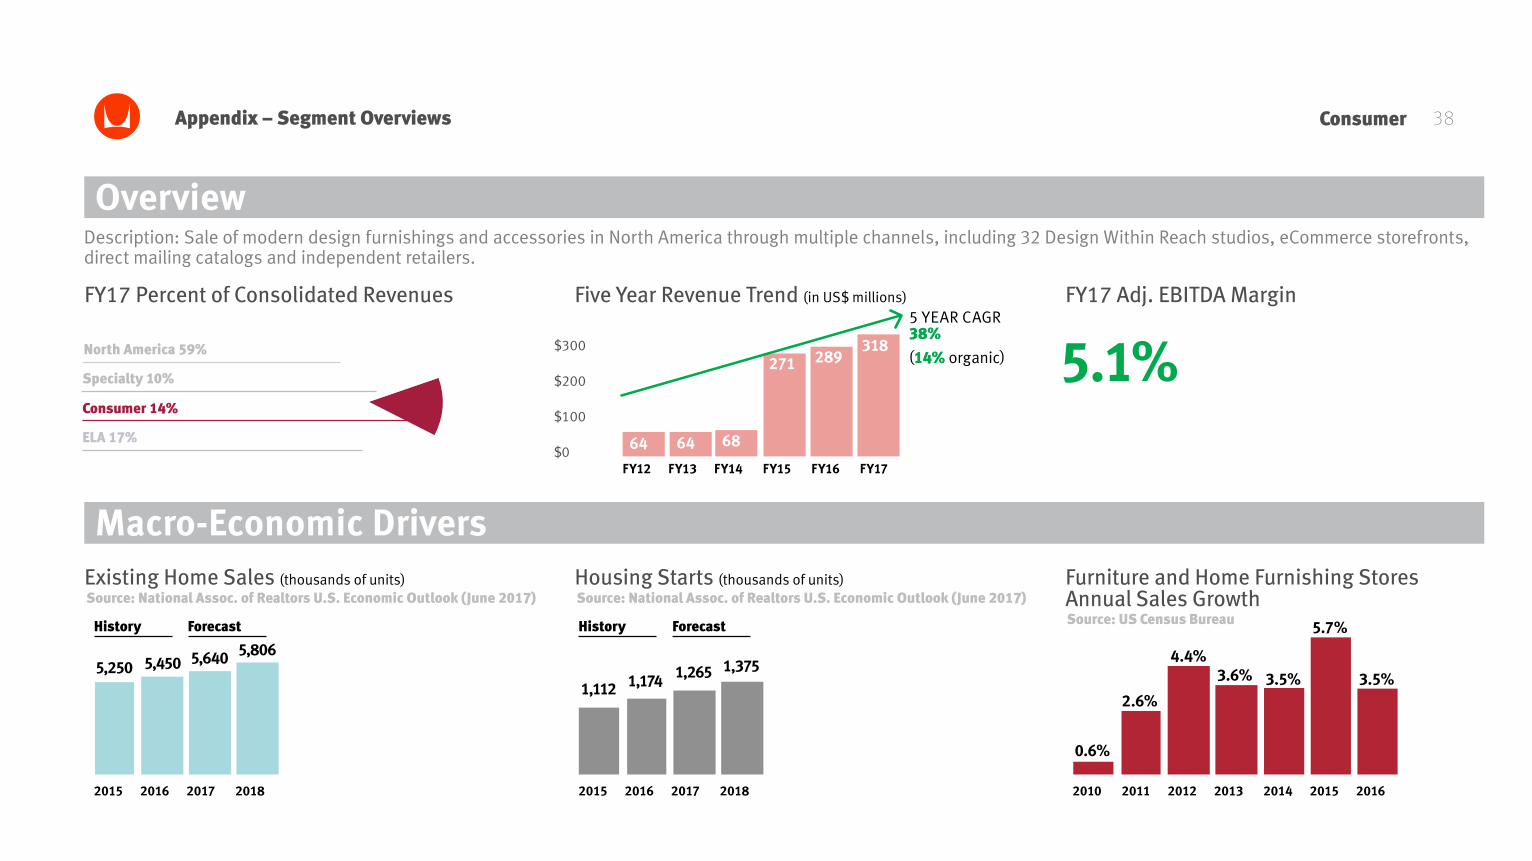
FY17 Percent of Consolidated Revenues Five Year Revenue Trend (in US$ millions) FY17 Adj. EBITDA Margin
64 64 68
271
5 YEAR CAGR 38%(14% organic) 5.1%
ConsumerAppendix – Segment Overviews
FY12 FY13 FY14 FY15 FY16 FY17
Overview
Macro-Economic Drivers
Description: Sale of modern design furnishings and accessories in North America through multiple channels, including 32 Design Within Reach studios, eCommerce storefronts, direct mailing catalogs and independent retailers.
Source: National Assoc. of Realtors U.S. Economic Outlook (June 2017)Existing Home Sales (thousands of units) Housing Starts (thousands of units) Furniture and Home Furnishing Stores
Annual Sales Growth
2010 2011 2012 2013 2014 2015 2016
0.6%
2.6%
4.4%3.6% 3.5%
5.7%
3.5%
Source: US Census Bureau
2015 2016 2017 2018
5,250 5,450 5,640 5,806
Source: National Assoc. of Realtors U.S. Economic Outlook (June 2017)
History Forecast
2015 2016 2017 2018
1,174 1,265 1,375
History Forecast
1,112
North America 59%
Specialty 10%
Consumer 14%
ELA 17%
$300
$200
$100
$0
289318

39
This presentation contains Organic Sales Growth, Adjusted EBITDA, Adjusted EBITDA ratios, Adjusted Operating Earnings, and Adjusted Earnings Per Share, all of which constitute non-GAAP financial measures. Each of these financial measures is calculated by excluding items the Company believes are not indicative of its ongoing operating performance. The Company presents these non-GAAP financial measures because it considers them to be important supplemental indicators of financial performance and believes them to be useful in analyzing ongoing results from operations.
These non-GAAP financial measures are not measures of financial performance under GAAP and should not be considered alternatives to GAAP. Non-GAAP financial measures have limitations as analytical tools and should not be considered in isolation or as a substitute for analysis of the Company’s results as reported under GAAP. In addition, you should be aware that in the future the Company may incur expenses similar to the adjustments presented.
Appendix –Reconciliation of Non-GAAP Measures

40Appendix –Reconciliation of Non-GAAP MeasuresOrganic Sales Growth (Decline) by Reportable Segment ($ Millions); (unaudited)
Sales, as reported
Proforma Adjustments Dealer DivestituresCumulative foreign exchangeAcquisition - base year
Sales, pro forma
Compound Annual Growth Rate, as reported Compound Annual Growth Rate, pro forma
$ 1,218.5
(70.3)-
-
$ 1,148.2
$ 1,724.1
(95.3) - (7.0)
$ 1,621.8
$ 347.3
(25.0)-
(7.0)
$ 315.3
$ 94.1
---
$ 94.1
$ 64.2
---
$ 64.2
$ 1,342.2
(16.6) 25.6
-
$ 1,351.2
2.0% 3.3%
$ 2,278.2
(16.6)
88.2(353.2)
$ 1,996.6
5.7% 4.2%
$ 385.5
- 60.3
(51.4)
$ 394.4
2.1% 4.6%
$ 232.4
-
1.0 (107.5)
$ 125.9
19.8% 6.0%
$ 318.1
- 1.3
(194.3)
$ 125.1
37.7% 14.3%
North America ELA Specialty Consumer Total
2012 2012 2012 2012 20122017 2017 2017 2017 2017

41Appendix –Herman Miller Inc. Reconciliation of Non-GAAP MeasuresAdjusted EBITDA by Reportable Segment ($ Millions) (unaudited)
Segment Operating EarningsAdd: Allocated Depreciation & AmortizationAdd: Acquisition-related AdjustmentsAdd: Legacy Pension ExpensesAdd: Restructuring/Impairment ExpensesLess: POSH Contingent Consideration ReductionAdjusted EBITDARevenue by SegmentAdjusted EBITDA Margin
Segment Operating EarningsAdd: Allocated Depreciation & AmortizationAdd: Acquisition-related AdjustmentsAdd: Legacy Pension ExpensesAdd: Restructuring/Impairment ExpensesLess: Other, netLess: POSH Contingent Consideration ReductionAdjusted EBITDARevenue by SegmentAdjusted EBITDA Margin
Segment Operating EarningsAdd: Allocated Depreciation & AmortizationAdd: Acquisition-related AdjustmentsAdd: Restructuring/Impairment ExpensesLess: Nonrecurring gainsOther, netAdjusted EBITDARevenue by SegmentAdjusted EBITDA Margin
$ 96.928.7
----
$ 125.6$ 1,218.5
10.3%
$ (27.0)26.8
-147.0
---
$ 146.8$ 1,216.3
12.1%
$ 152.027.9
----
$ 179.9$ 1,331.8
13.5%
$ 32.15.7
----
$ 37.8$ 347.3
10.9%
$ 23.17.6
----
(2.6)$ 28.1
$ 392.27.2%
$ 35.38.5
--
(6.1)-
$ 37.7$ 412.6
9.1%
$ 1.12.2
----
$ 3.3$ 94.1
3.5%
$ (5.3)6.81.4
12.2---
$ 15.1$ 205.8
7.3%
$ 16.47.4
----
$ 23.8$ 231.8
10.3%
$ 14.10.7
----
$ 14.8$ 64.223.1%
$ 9.91.2
-5.2
---
$ 16.3$ 67.724.1%
$ 8.18.6
----
$ 16.7$ 288.7
5.8%
$ (6.6)---
5.4-
$ (1.2)-
0.0%
$ (26.4)---
26.5--
$ 0.1-
0.0%
$ (0.3)0.6
---
0.5$ 0.8
-0.0%
$ 137.637.3
--
5.4-
$ 180.3$ 1,724.1
10.5%
$ (25.7)42.4
1.4164.4
26.5-
(2.6)$ 206.4
$ 1,882.011.0%
$ 211.553.0
--
(6.1)0.5
$ 258.9$ 2,264.9
11.4%
$ 76.628.0
-26.5
--
$ 131.1$ 1,221.9
10.7%
$ 125.226.5
-----
$ 151.7$ 1,241.9
12.2%
$ 137.732.0
-10.3(0.7)
-$179.3
$ 1,342.213.4%
$ 24.76.6
----
$ 31.3$ 377.3
8.3%
$ 25.98.2
-----
$ 34.1$ 409.9
8.3%
$ 30.88.8
-1.0
--
$ 40.6$ 385.5
10.5%
$ 1.82.4
-1.7
--
$ 5.9$ 111.7
5.3%
$ 13.57.4
-----
$ 20.9$ 219.9
9.5%
$ 17.77.5
-0.6
--
$ 25.8$ 232.4
11.1%
$ 13.60.6
----
$ 14.2$ 64.022.2%
$ 14.77.37.8
----
$ 29.8$ 270.5
11.0%
$ 5.310.2
-0.6
--
$ 16.1$ 318.1
5.1%
$ (1.8)---
1.2-
(0.6)-
0.0%
$ (15.9)0.42.2
-12.7(0.7)
-$ (1.3)
-0.0%
$ (0.7)0.4
---
2.0$ 1.7
-0.0%
$ 114.937.6
-28.2
1.2-
$ 181.9$ 1,774.9
10.2%
$ 163.449.810.0
-12.7(0.7)
-$ 235.2
$ 2,142.211.0%
$ 190.858.9
-12.5(0.7)
2.0$ 263.5
$ 2,278.211.6%
NA NA
NA
NA
ELA ELA
ELA
ELA
Specialty Specialty
Specialty
Specialty
2012 Actual 2013 ActualConsumer Consumer
Consumer
Consumer
Corporate Corporate
Corporate
Corporate
Consol.
NA ELA Specialty2014 Actual 2015 Actual
Consumer Corporate Consol.
NA ELA Specialty2016 Actual 2017 Actual
Consumer Corporate Consol.
Consol.
Consol.
Consol.

42Appendix Adjusted Operating Earnings and Adjusted Earnings Per Share ($ millions, except for per share amounts) (unaudited)
Operating Earnings (GAAP)Operating Earnings (%)Add: Restructuring and Impairment Expenses Adj. Operating Earnings (non-GAAP)Adj. Operating Earnings (%)
Earnings per Share - DilutedAdd: Restructuring ExpensesAdjusted Earnings per Share - Diluted
Net Sales
Q4 FY17 Q4 FY17
$ 577.2
$ 49.8 8.6%
8.8$ 58.6
10.2%
$ 0.55$ 0.09 $ 0.64
Adjusted Operating Earnings Adjusted Earnings per Share

43Appendix Adjusted EBITDA and Adjusted EBITDA Ratios (Bank) ($ millions) (unaudited)
Earnings Before Income Taxes (EBT)Add: Depreciation Amortization InterestOther Adjustments(1)
Adjusted EBITDA - Bank
Total Debt, End of Trailing Period (includes outstanding LC’s)
Rolling 4-Quarter Debt-to-Adj. EBITDA
Rolling 4-Quarter Adj. EBITDA-to-Interest
Q1 FY17 Q2 FY17 Q3 FY17 Q4 FY17
184.6 177.6
$ 271.5 $ 272.9
$ 243.3 $ 211.6
0.9 0.8
17.9 18.0
192.4
$ 273.3
$ 228.5
0.8
17.9
199.1
$ 278.8
$ 242.8
0.9
18.3
50.1 52.96.0 6.0
15.2 15.215.6 21.2
47.76.0
15.311.9
47.16.0
15.211.4
Adjusted EBITDA (Bank) RatiosTrailing 4-Quarter Period Ended
(1) “Other Adjustments” include, as applicable in the period, charges associated with business restructuring actions, non-cash stock-based compensation, as described in lending agreements.
