nashville international airport (bna)
TRANSCRIPT

Facility Requirements
Nashville International Airport (BNA)
Master Plan Update June 5, 2019
DRAFT

Quality information
Prepared by Checked by Approved by
AECOM and InterVistas Wayne Schuster
Technical Leader
Allan A’Hara
Vice President
Revision History
Revision Revision date Details Authorized Name Position

Prepared for:
Prepared by:
AECOM
1700 Market Street
Philadelphia, PA 19103
aecom.com
Disclaimer
All forecasts are subject to levels of uncertainty. The forecasts provided in this Technical Report are
based on the information available at the time of their creation. Various factors, other than those included
in the forecast models, can influence future aviation demand. Unexpected events may occur and some
underlying forecast assumptions and/or expectations may not materialize. Therefore, actual performance may differ from the forecasts presented in this report and could be significant.
Copyright © 2019 by AECOM
All rights reserved. No part of this copyrighted work may be reproduced, distributed, or transmitted in any form or by any means without the prior written permission of AECOM.

BNA Airport Master Plan Update
Chapter 4 – Facility Requirements - DRAFT
Page | i
Contents
4.1. INTRODUCTION .............................................................................................................................................. 1
4.1.1. Summary of Demand Forecasts .............................................................................................................................................. 1
4.2. AIRFIELD CAPACITY & REQUIREMENTS ....................................................................................................... 2
4.2.1. Airfield Capacity Analysis ........................................................................................................................................................... 2
4.2.2. Runway Length Analysis........................................................................................................................................................... 12
4.2.3. Runway Design Standards & Requirements .................................................................................................................... 17
4.2.4. Taxiway/Taxilane Design Standards & Requirements .................................................................................................. 29
4.2.5. Airfield Separation Standards ................................................................................................................................................ 34
4.2.6. Airfield Marking and Lighting ................................................................................................................................................ 37
4.2.7. Current Modifications of Standards (MOS) ...................................................................................................................... 38
4.2.8. Navigational Aids ........................................................................................................................................................................ 39
4.2.9. Airfield Facility Requirements Summary ............................................................................................................................ 40
4.3. PASSENGER TERMINAL CAPACITY AND REQUIREMENTS ...................................................................... 41
4.3.1. Methods, Assumptions, and Performance Specifications........................................................................................... 43
4.3.2. Aircraft Gate Parking Positions and RON Parking ......................................................................................................... 46
4.3.3. Check-In / Ticketing ................................................................................................................................................................... 49
4.3.4. Security Checkpoint (SSCP)..................................................................................................................................................... 55
4.3.5. Checked Baggage Inspection System (CBIS) ................................................................................................................... 60
4.3.6. Baggage Makeup (BMU) .......................................................................................................................................................... 63
4.3.7. Baggage Claim ............................................................................................................................................................................. 66
4.3.8. Federal Inspection Services (FIS) ........................................................................................................................................... 70
4.3.9. Holdrooms ..................................................................................................................................................................................... 75
4.3.10. Concessions .................................................................................................................................................................................. 81
4.3.11. Restrooms ...................................................................................................................................................................................... 82
4.3.12. Supporting Functions ................................................................................................................................................................ 86
4.3.13. Terminal Facility Requirements Summary ......................................................................................................................... 88
4.4. LANDSIDE CAPACITY & REQUIREMENTS .................................................................................................. 89
4.4.1. Data Sources ................................................................................................................................................................................. 89
4.4.2. Activity Growth/Mode Share Assumptions ...................................................................................................................... 90
4.4.3. Roadways ....................................................................................................................................................................................... 98
4.4.4. Curbsides, Commercial Ground Transportation, and Public Transit.................................................................... 115
4.4.5. Public Parking ............................................................................................................................................................................ 136
4.4.6. Rental Cars .................................................................................................................................................................................. 144
4.4.7. Employee Parking .................................................................................................................................................................... 147
4.4.8. Landside Facility Requirements Summary ..................................................................................................................... 148
4.5. AIR CARGO CAPACITY & REQUIREMENTS............................................................................................... 150
4.5.1. Air Cargo Apron Requirements .......................................................................................................................................... 152
4.5.2. Air Cargo Building Area ......................................................................................................................................................... 155
4.5.3. Cargo Landside Facilities ...................................................................................................................................................... 157
BNA Airport Master Plan Update
Chapter 4 – Facility Requirements - DRAFT
Page | ii
4.5.4. Cargo Facility Requirements Summary ........................................................................................................................... 158
4.6. GENERAL AVIATION CAPACITY AND REQUIREMENTS .......................................................................... 159
4.6.1. GA Design Aircraft ................................................................................................................................................................... 162
4.6.2. Hangar Storage Space ........................................................................................................................................................... 165
4.6.3. Apron Area ................................................................................................................................................................................. 167
4.6.4. Fixed Base Operator (FBO) Terminal Buildings ............................................................................................................ 170
4.6.5. Vehicle Parking Area............................................................................................................................................................... 171
4.6.6. General Aviation (GA) Facility Requirements Summary ........................................................................................... 173
4.7. AIRPORT & AIRLINE SUPPORT REQUIREMENTS .................................................................................... 174
4.7.1. Aircraft Deicing ......................................................................................................................................................................... 174
4.7.2. MNAA Maintenance Facilities ............................................................................................................................................. 176
4.7.3. Aircraft Maintenance Facilities............................................................................................................................................ 176
4.7.4. Ground Support Equipment (GSE) Facilities.................................................................................................................. 176
4.7.5. Aircraft Fuel Storage Facilities ............................................................................................................................................ 177
4.7.6. Aircraft Rescue and Firefighting Facility (ARFF) ........................................................................................................... 178
4.7.7. Airport & Airline Support Requirements Summary ................................................................................................... 182
4.8. SUSTAINABLE FACILITIES ........................................................................................................................... 183
4.8.1. Overview ...................................................................................................................................................................................... 184
4.8.2. Methodology ............................................................................................................................................................................. 184
4.8.3. Sustainability Facilities Opportunities .............................................................................................................................. 184
Tables
Table 4-1. Summary Of Demand Forecasts ........................................................................................................ 2
Table 4-2. Fleet Mix Share Allocations ............................................................................................................... 7
Table 4-3. Annual Service Volume Vs. Annual Demand ...................................................................................... 9
Table 4-4. Taxi Times Calibration (Minutes) ..................................................................................................... 10
Table 4-5. Hourly Runway Throughput Calibration ........................................................................................... 11
Table 4-6. Comparison Of Average Taxi Times (Minutes) – VMC ...................................................................... 11
Table 4-7. Comparison Of Average Taxi Times (Minutes) – IMC........................................................................ 11
Table 4-8. FAA Runway Design Code (RDC) Parameters ................................................................................... 18
Table 4-9. Runway End Information ................................................................................................................. 18
Table 4-10. Runway Physical Dimensions ......................................................................................................... 19
Table 4-11. Required Dimensions of Runway Object Clearing Surfaces ............................................................ 20
Table 4-12. RSA Dimensions at BNA ................................................................................................................. 22
Table 4-13. ROFA Dimensions at BNA .............................................................................................................. 23
Table 4-14. OFZ Applicability ........................................................................................................................... 24
Table 4-15. OFZ Object Clearing Analysis ......................................................................................................... 25
Table 4-16. RPZ Dimensions at BNA ................................................................................................................. 27
Table 4-17. Incompatible Objects and Land Uses Within RPZs .......................................................................... 28

BNA Airport Master Plan Update
Chapter 4 – Facility Requirements - DRAFT
Page | iii
Table 4-18. Declared Distances ........................................................................................................................ 29
Table 4-19. Taxiway Object Clearing Standards ................................................................................................ 30
Table 4-20. Runway Separation ....................................................................................................................... 35
Table 4-21. Taxiway/Taxilane Separation ......................................................................................................... 36
Table 4-22. Available Runway Lighting ............................................................................................................. 37
Table 4-23. Current Approved Modifications of Standards ............................................................................... 38
Table 4-24. Approach Navaids at Each Runway ................................................................................................ 39
Table 4-25. IATA Level of Service Guidelines .................................................................................................... 45
Table 4-26. Peak Hour Enplanements and Deplanements ................................................................................ 46
Table 4-27. Contact Gate Requirements .......................................................................................................... 47
Table 4-28 - Remain Overnight Aircraft Parking Requirements Summary ......................................................... 49
Table 4-29. Check-In Options ........................................................................................................................... 50
Table 4-30. Check-In Processing Times Per Passenger (Seconds) ...................................................................... 51
Table 4-31. Maximum Waiting Time ............................................................................................................... 51
Table 4-32. Check-In Facility Capacity .............................................................................................................. 52
Table 4-33. Check-In Facility Requirements ...................................................................................................... 55
Table 4-34. SSCP Baseline Conditions ............................................................................................................... 57
Table 4-35. SSCP Key Assumptions ................................................................................................................... 58
Table 4-36. SSCP Capacity ................................................................................................................................ 59
Table 4-37. SSCP Facility Requirements - Number of Lanes .............................................................................. 59
Table 4-38. SSCP Facility Requirements – Area Square Footage ....................................................................... 60
Table 4-39. CBIS Baseline Conditions .............................................................................................................. 61
Table 4-40. CBIS Key Assumptions .................................................................................................................. 61
Table 4-41. CBIS Facility Requirements ........................................................................................................... 63
Table 4-42. BMU Key Assumptions ................................................................................................................. 64
Table 4-43. Number Of Carts Required per Flight ............................................................................................ 65
Table 4-44. BMU Facility Requirements .......................................................................................................... 66
Table 4-45. Bag Claim Key Assumptions ........................................................................................................... 68
Table 4-46. Bag Claim Facility Requirements .................................................................................................... 69
Table 4-47. FIS Baseline Conditions .................................................................................................................. 73
Table 4-48. FIS Key Assumptions ...................................................................................................................... 73
Table 4-49. FIS Capacity ................................................................................................................................... 74
Table 4-50. DDFS - Peak Hour International Arrivals ......................................................................................... 74
Table 4-51. FIS Facility Requirements............................................................................................................... 75
Table 4-52. Holdrooms Key Assumptions ......................................................................................................... 77
Table 4-53. Holdroom Capacity ........................................................................................................................ 78
Table 4-54. Holdroom Facility Requirements ................................................................................................... 79
Table 4-55. Concession Type Split .................................................................................................................... 81
Table 4-56. Concession Capacity ...................................................................................................................... 81
Table 4-57. Concession Facility Requirements.................................................................................................. 82

BNA Airport Master Plan Update
Chapter 4 – Facility Requirements - DRAFT
Page | iv
Table 4-58. Restroom Baseline Conditions ....................................................................................................... 83
Table 4-59. Restroom Key Assumptions ........................................................................................................... 83
Table 4-60. Public Restroom Baseline Inventory .............................................................................................. 84
Table 4-61. Public Restroom Facility Requirements in Secure Area .................................................................. 85
Table 4-62. Public Restroom Facility Requirements in Non-Secure Area ........................................................... 85
Table 4-63. Airport Support Baseline Conditions .............................................................................................. 86
Table 4-64. Airport Support Facility Requirements ........................................................................................... 86
Table 4-65. Airline Support Baseline Conditions ............................................................................................... 86
Table 4-66. Airline Support Facility Requirements ............................................................................................ 87
Table 4-67. Future Demand Multipliers due to Passenger Growth and Mode Changes ..................................... 95
Table 4-68. Future Demand Multipliers due to Passenger Growth and Mode Changes ..................................... 97
Table 4-69. Assumed Roadway Capacities...................................................................................................... 100
Table 4-70. Level-of-Service Associated with Volume/Capacity Ratios ........................................................... 101
Table 4-71. Roadway Volumes and Requirements, 2022 and 2027................................................................. 105
Table 4-72. Roadway Volumes and Requirements, 2032 and 2037................................................................. 108
Table 4-73. Roadway Volumes and Requirements, Key I-40 Access Ramps ..................................................... 114
Table 4-74. Curbside Utilization Level of Service Ratios .................................................................................. 116
Table 4-75. Curbside Roadway Level of Service Ratios ................................................................................... 116
Table 4-76. Curbside Vehicle Dwell Times and Lengths .................................................................................. 118
Table 4-77. Peak Hour Curbside and Ground Transportation Volumes, Departures Level, BNA Vision ............ 119
Table 4-78. Peak Hour Curbside and Ground Transportation Volumes, Arrivals and Ground Transportation
Level, BNA Vision ................................................................................................................................... 120
Table 4-79. Future Peak Hour Volumes, Departures Level .............................................................................. 122
Table 4-80. Future Peak Hour Volumes, Arrivals Level, Ground Transportation Roadway, and Ground
Transportation Center ........................................................................................................................... 125
Table 4-81. Future Peak Hour Volumes, Arrivals Level, “Low” TNC Impact Scenario ....................................... 127
Table 4-82. Assumed Curbside Activity Distribution ....................................................................................... 129
Table 4-83. Curbside Requirements – Vehicle Unloading and Loading Areas .................................................. 130
Table 4-84. Curbside Requirements – Curbside Roadway Lanes, Departures Level ......................................... 132
Table 4-85. Curbside Requirements – Curbside Roadway Lanes, Arrivals Level ............................................... 133
Table 4-86. Ground Transportation Center Requirements .............................................................................. 135
Table 4-87. Parking Occupancy, October 2018, All Facilities ........................................................................... 137
Table 4-88 - Parking Demand and Monthly Passengers, October 2017 and 2018............................................ 138
Table 4-89. Unconstrained Parking Demand, October 2018 ........................................................................... 140
Table 4-90. Total Parking Requirements, “Low TNC Impact” Scenario ............................................................ 142
Table 4-91. Total Parking Requirements, High Forecast Scenario ................................................................... 143
Table 4-92. Rental Car Requirements ............................................................................................................. 145
Table 4-93. Employee Parking Requirements ................................................................................................. 148
Table 4-94. Existing Cargo Buildings .............................................................................................................. 150
Table 4-95. Air Cargo Design Aircraft Characteristics ..................................................................................... 152

BNA Airport Master Plan Update
Chapter 4 – Facility Requirements - DRAFT
Page | v
Table 4-96. Air Cargo Aircraft Parking Position Requirements ....................................................................... 153
Table 4-97. Cargo Aircraft Parking Apron Area Requirements ....................................................................... 154
Table 4-98. Projected Cargo Throughput by Type .......................................................................................... 155
Table 4-99. Projected Cargo Building Requirements by Carrier...................................................................... 156
Table 4-100. Air Cargo Landside Facility Requirements ................................................................................. 158
Table 4-101. Percentage of Annual Operations at BNA by Aircraft Category .................................................. 162
Table 4-102. Design Aircraft for Different Based Aircraft Categories ............................................................. 164
Table 4-103. Design Aircraft for Transient Aircraft ........................................................................................ 164
Table 4-104. Existing and Forecasted Based Aircraft by Category .................................................................. 165
Table 4-105. Hangar Space Requirements ..................................................................................................... 166
Table 4-106. Annual Operations and Corresponding Transient Aircraft Parking Requirements ...................... 168
Table 4-107. Based Aircraft Apron Parking Requirements ............................................................................. 169
Table 4-108. Apron Parking Area Requirements ............................................................................................ 170
Table 4-109. FBO Terminal Building Requirements........................................................................................ 171
Table 4-110. Vehicle Parking Requirements .................................................................................................. 173
Table 4-111. Existing Aircraft Deicing Positions ............................................................................................. 174
Table 4-112. Peak Hour Departures ............................................................................................................... 175
Table 4-113. Deicing Position Requirements .................................................................................................. 176
Table 4-114. Fuel Reserve Requirements ....................................................................................................... 177
Table 4-115. 2018 Annual Departures and Average Daily Departures at BNA by Aircraft Type ....................... 179
Table 4-116. Future DDFS Daily Operations by Aircraft Type at BNA .............................................................. 180
Table 4-117. Response Time from Existing ARFF Station to the Midpoint of each Runway ............................. 182
Figures
Figure 4-1. BNA Airport Diagram........................................................................................................................ 4
Figure 4-2. Arrival Runway Exits – North and South Flow ................................................................................... 6
Figure 4-3. BNA Fleet & Market Demand Shift ................................................................................................. 12
Figure 4-4. Distance from BNA to Global Destinations ..................................................................................... 13
Figure 4-5. Existing Runway Lengths Compared Against Required Runway Lengths.......................................... 15
Figure 4-6. Landing Runway Length Requirement ............................................................................................ 16
Figure 4-7. Runway Object Clearing Surfaces ................................................................................................... 21
Figure 4-8. RPZ Location .................................................................................................................................. 26
Figure 4-9. Displaced Runway 31 Departure RPZ .............................................................................................. 28
Figure 4-10. Obstacles in TOFA ........................................................................................................................ 31
Figure 4-11. Obstacles in TOFA (Continued) ..................................................................................................... 31
Figure 4-12. Taxiway Shoulders & Fillets Deficiencies ....................................................................................... 33

BNA Airport Master Plan Update
Chapter 4 – Facility Requirements - DRAFT
Page | vi
Figure 4-13. Existing Terminal Building ............................................................................................................ 41
Figure 4-14. BNA Vision Projects ...................................................................................................................... 42
Figure 4-15. IATA Los Space-Time Diagram ...................................................................................................... 44
Figure 4-16. Standard Agent Counter Module .................................................................................................. 53
Figure 4-17. Automated Screening Lane (ASL) Typical Configuration ................................................................ 57
Figure 4-18. Typical Baggage Makeup Device ................................................................................................... 64
Figure 4-19. FIS Before and After BNA Vision ................................................................................................... 67
Figure 4-20. FIS Facility .................................................................................................................................... 70
Figure 4-21. Bag-First Process .......................................................................................................................... 72
Figure 4-22. Typical Holdroom Layout.............................................................................................................. 76
Figure 4-23. Holdroom Facility Requirements .................................................................................................. 80
Figure 4-24. Historical Activity per Passenger, Selected Modes ........................................................................ 92
Figure 4-25. Estimated Future Activity per Passenger, Selected Modes ............................................................ 94
Figure 4-26. BNA Vision Roadway Microsimulation Results .............................................................................. 99
Figure 4-27. Assumed Roadway Network ....................................................................................................... 103
Figure 4-28. Anticipated Roadway Deficiencies .............................................................................................. 104
Figure 4-29. Intersection Configurations, Volumes and Expected Level of Service .......................................... 112
Figure 4-30. Key I-40 Airport Access Ramps .................................................................................................. 113
Figure 4-31. Curbside Level of Service Depictions .......................................................................................... 117
Figure 4-32. Daily Peak Parking Occupancy, October and November 2018, Terminal Garage ......................... 137
Figure 4-33. Existing Cargo Facilities for Integrator Carriers (West Side) ......................................................... 151
Figure 4-34. Existing Cargo Facilities for Combination Carriers (Terminal Area) .............................................. 151
Figure 4-35. Design Aircraft Parking Area Requirements ................................................................................ 153
Figure 4-36. General Aviation Facilities at BNA .............................................................................................. 159
Figure 4-37. Standard Vehicle Parking Spaces ................................................................................................ 172
Figure 4-38. Aircraft Deicing Areas ................................................................................................................. 174
Figure 4-39. ARFF Indices ............................................................................................................................... 178
Figure 4-40. Depiction of the Drainage Basin Area Encompassing BNA. .......................................................... 185

BNA Airport Master Plan Update
Chapter 4 – Facility Requirements - DRAFT
Page | 1
4.1. Introduction
This chapter identifies facility requirements for airfield, terminal, landside, and support facilities at
Nashville International Airport (BNA) throughout the 20-year planning period. The determination of
facility requirements is achieved first by analyzing the impacts of forecast demand on the capacity of
existing facilities to accommodate expected activity. After summarizing the capacity of existing
airfield, terminal, landside, and support facilities, improvement requirements are identified for four
future planning activity levels (PAL) corresponding to 5-year (2022), 10-year (2027), 15-year (2032),
and 20-year (2037) forecasts. Facility requirements are identified in this chapter for the following
elements:
1. Airfield facilities
2. Passenger terminal facilities
3. Landside facilities (roadway access, circulation roadways, parking)
4. Air cargo
5. General aviation
6. Airport and airline support facilities
7. Sustainability
4.1.1. Summary of Demand Forecasts
The timing of facility improvements is driven by when future aviation activity levels will be reached, not
a predicted set point in time. The actual timing of development may vary from the Master Plan
forecast depending upon the actual progression of future activity. As a result, “planning activity
levels” (PALs) are encouraged to be used by the Federal Aviation Administration (FAA) in evaluating
the need for additional facilities. The FAA’s guidance on Master Plans suggests that “... planners should
identify what demand levels will trigger the need for expansion or improvement of a specific facility. In this way,
the airport sponsor can monitor growth trends and expand the airport as demand warrants.”
As summarized in Table 4-1, the PALs used in this Master Plan correspond approximately to five-year
increments presented in the Forecasts of Aviation Demand chapter. These PALs represent activity-based
milestones that can be used to make future facility improvement decisions, focusing on the specific volumes of
activity that trigger the facility improvement requirement. It is important to note that the Master Plan
forecasts make certain assumptions about the mix of airlines and aircraft, as well as assumptions
about the processes required to move passengers through the terminal building, provide security, etc.
By monitoring future aviation activity continually, the Metropolitan Nashville Airport Authority (MNAA)
can detect changes in these assumptions and adjust capital improvement schedules as appropriate.

BNA Airport Master Plan Update
Chapter 4 – Facility Requirements - DRAFT
Page | 2
Table 4-1. Summary of Demand Forecasts
2017
(Baseline)
2022
(5-year)
2027
(10-year)
2032
(15-year)
2037
(20-year)
Annual Enplanements 7,076,371 9,047,142 9,938,318 10,886,036 11,935,070
Total Annual Operations 205,802 256,599 273,924 291,664 311,114
Annual Air Carrier Operations 135,135 183,362 191,530 200,815 210,387
Annual Cargo Operations 2,662 3,099 3,343 3,610 3,901
Annual GA Operations 67,117 69,686 78,844 87,299 97,176
Annual Military Operations 3,550 3,550 3,550 3,550 3,550
Annual Cargo Tonnage 48,353 58,224 64,213 70,787 78,055
Based Aircraft 107 122 140 160 184 Source: BNA Master Plan Update 2018: Aviation Demand Forecasts Chapter
4.2. Airfield Capacity & Requirements
Airfield capacity is defined as the number of aircraft that can use the airfield during a specified
amount of time, usually expressed as aircraft movements per hour or year. The estimation of airfield
capacity also considers the amount of aircraft delay that may occur with an airport’s airfield
configuration. An airfield’s capacity is a function of its physical facilities, including runway orientation
and configuration, runway length, runway exit locations, and the available taxiway system that
accommodates the various destinations of aircraft on the ground (i.e. passenger terminal, general
aviation area, etc.). The capacity of any given airfield system is also affected by operating
characteristics such as aircraft fleet mix, wind, and weather, as well as air traffic control (ATC)
procedures used to coordinate air traffic movement on the ground and in the immediate airport
vicinity. Each of these components is examined as part of the airfield capacity analysis.
4.2.1. Airfield Capacity Analysis
4.2.1.1. Methodology and Assumptions
The methodology used to estimate airfield capacity is based on Federal Aviation Administration (FAA)
guidance. In 1983, the FAA published Advisory Circular 150/5060-5, Airport Capacity and Delay. That
document described how to compute airfield capacity for airport planning and design purposes and
had been the standard methodology for many years. Using this methodology, users could identify an
airfield layout and then provide parameters such as aircraft fleet mix and limitations to taxi flows to
determine an estimated hourly and annual airfield capacity for an airport.
Subsequently, in 2012, the National Academies of Science, Engineering, and Medicine’s (NASEM)
Transportation Research Board (TRB), through its Airport Cooperative Research Program (ACRP),
sponsored ACRP project 03-17 which published ACRP Report 79 “Evaluating Airfield Capacity”. This
report evaluated models beyond methods used in FAA AC 150/5060-5 and was further enhanced with
a capacity spreadsheet model. The updated tool for determining airfield capacity is the Airfield

BNA Airport Master Plan Update
Chapter 4 – Facility Requirements - DRAFT
Page | 3
Capacity Spreadsheet Model. ACRP’s Airfield Capacity Spreadsheet Model was used to estimate BNA’s
airfield capacity. Guidance and procedures were taken from ACRP Report 79, Appendix A: Prototype
Airfield Capacity Spreadsheet Model User’s Guide.
The Airfield Capacity Spreadsheet Model requires a number of parameters and assumptions regarding
runway layout, fleet mix, aircraft separation assumptions, and weather conditions to be defined. These
assumptions and inputs are described below.
Runway Layout
BNA airport has a total of four (4) runways, as depicted in Figure 4-1. These consist of three (3)
parallel, approximately 8,000-foot long northeast/southwest runways (Runways 2L/20R, 2C/20C, and
2R/20L) and one intersecting 11,000-foot long northwest/southeast “crosswind” runway (Runway
13/31). Runways 2L/20R and 2C/20C are separated by 1,176 feet. Runway 2R/20L is approximately
5,000 feet from Runway 2C/20C. For the purposes of the airfield capacity estimate, only the three
parallel runways were evaluated. Intersecting runways provide less capacity than parallel runways due
to operating restrictions that require aircraft to be separated by a greater distance and/or spacing
than with parallel runways. Thus, while crosswind Runway 13-31 provides an operational benefit when
its runway length is needed for aircraft operations or when the wind dictates its use, generally the
runway does not add measurable capacity to the BNA airfield, and was not considered in the capacity
calculations due to its relatively infrequent usage.
Runway Utilization and Wind Conditions
Aircraft perform most safely and efficiently when they arrive and depart into the wind. At BNA,
approximately 50 percent of BNA’s annual operational pattern is a north flow and similarly 50 percent
of activity operates in a south flow. Notably, less than one percent of annual activity operates in a
northwest/southeast flow due to the infrequency of strong northwest or southeast winds.
Visibility
Visibility for controlling aircraft movements is important to airfield capacity, since it directly affects
how easily aircraft can be separated in the air and on the ground. An airport operates most efficiently
and with greatest capacity when weather conditions allow unobstructed visibility of the airfield. Based
on information gathered from the National Oceanic and Atmospheric Administration’s (NOAA)
National Centers for Environmental Information (NCEI) and data from the BNA Master Plan inventory,
Nashville International Airport experiences Visual Meteorological Conditions (VMC) (greatest visibility)
about 90.8% of the time and Instrument Meteorological Conditions (IMC) (lower visibility) conditions
approximately 9.2% of annual operations.

BNA Airport Master Plan Update
Chapter 4 – Facility Requirements - DRAFT
Page | 4
Figure 4-1. BNA Airport Diagram
Source: FAA Airport Diagram, retrieved on April 1
st, 2019 from https://www.faa.gov/airports/runway_safety/diagrams/

BNA Airport Master Plan Update
Chapter 4 – Facility Requirements - DRAFT
Page | 5
Arrivals Percentage
An airfield must accommodate both arriving and departing aircraft. Arriving aircraft must be
sequenced into the flow of departing aircraft that might be using the same runway. Also, an arriving
aircraft occupies a runway for a period of time that is factored into the capacity calculations. While
there are periods throughout a day where aircraft arrivals and departures are not balanced, a 50/50
arrivals and departures balance typically occurs in any 24-hour period. Thus, a factor of 50% arrivals
and 50% departures was assumed for the capacity model.
Touch and Go
Touch-and-Go’s are operations where an aircraft touches down on the runway during landing but
immediately takes off again, and is typically associated with small general aviation aircraft training
operations. For the purposes of the model, touch and go operations were assumed to be less than
1% of the annual operations and calculated to have no impact on the annual capacity of the airport.
Taxiway Factors
Airfield capacity is affected by an aircraft’s runway occupancy time and the availability of
appropriately-spaced runway exit taxiways. The model allows for limiting runway activity if taxiway
exits are not sufficient. Because each of the runways at BNA has full-length parallel taxiways and a
sufficient number of appropriately-spaced runway exit taxiways, no limitations on aircraft exiting the
runways due to the taxiway system was considered in the calculation of airfield capacity. Figure 4-2
illustrates the available runway exit txiways in north and south flow, and indicates the approximate
usage of each exit.

BNA Airport Master Plan Update
Chapter 4 – Facility Requirements - DRAFT
Page | 6
Figure 4-2. Arrival Runway Exits – North and South Flow
Data Source: North-flow Data Collected at BNA by TransSolutions, December 2016; South-flow approximated from north-flow landing roll distances.
Aircraft Fleet Mix
The original FAA Advisory Circular for calculating airfield capacity (AC 150/5060-5) used a
mathematical formula to determine aircraft fleet mix based on the size of aircraft. Aircraft between
12,500 pounds and 300,000 pounds were identified as Category C, and aircraft heavier than 300,000
pounds were identified as Category D. The formula of “C+3D” was used by the original AC to
calculate a fleet mix index number.
For BNA, the base year aircraft mix shows:
Class C = 81.2 percent of airport operations
Class D = 2.0 percent of airport operations
Therefore, for BNA, the fleet mix index formula for airfield capacity estimation purposes would be:
C + 3 * D = Fleet Mix Index
81.2 + (3* 2.0) = 87.2
North Flow South Flow
BNA Airport Master Plan Update
Chapter 4 – Facility Requirements - DRAFT
Page | 7
The FAA established fleet mix index ranges for use in capacity calculations as listed below:
0 to 20 21 to 50 51 to 80 81 to 120 121 to 180
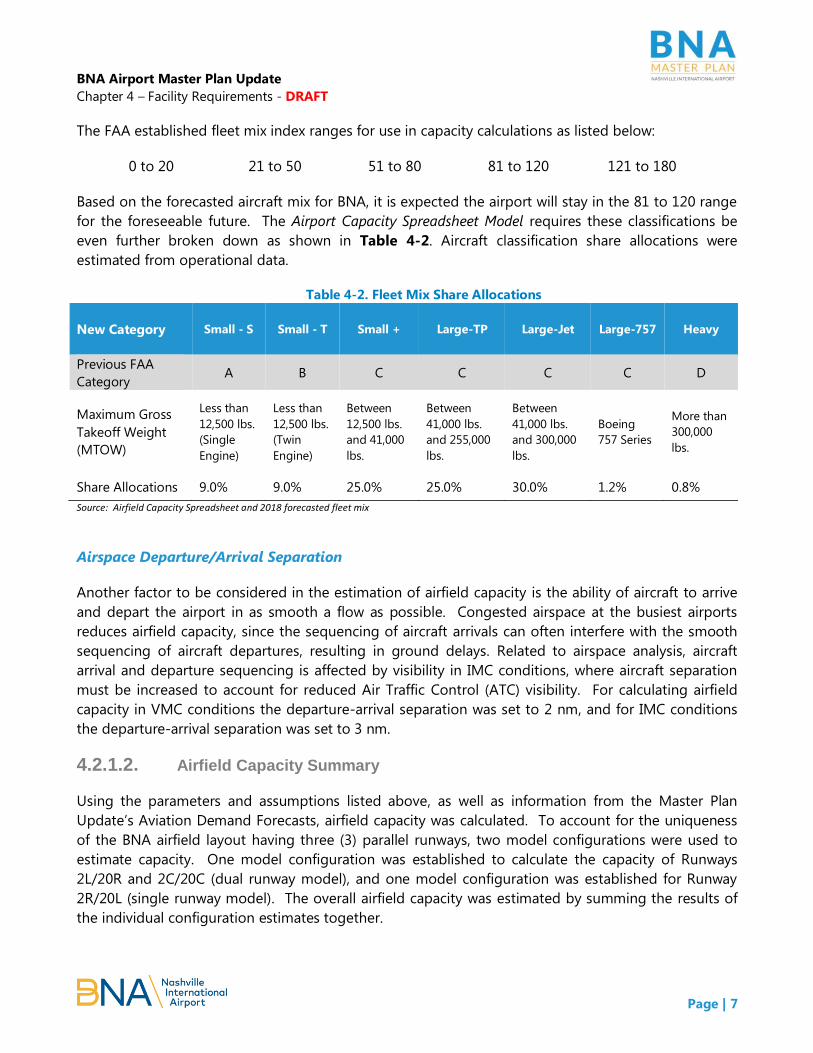
Based on the forecasted aircraft mix for BNA, it is expected the airport will stay in the 81 to 120 range
for the foreseeable future. The Airport Capacity Spreadsheet Model requires these classifications be
even further broken down as shown in Table 4-2. Aircraft classification share allocations were
estimated from operational data.
Table 4-2. Fleet Mix Share Allocations
New Category Small - S Small - T Small + Large-TP Large-Jet Large-757 Heavy
Previous FAA
Category A B C C C C D
Maximum Gross
Takeoff Weight
(MTOW)
Less than
12,500 lbs.
(Single
Engine)
Less than
12,500 lbs.
(Twin
Engine)
Between
12,500 lbs.
and 41,000
lbs.
Between
41,000 lbs.
and 255,000
lbs.
Between
41,000 lbs.
and 300,000
lbs.
Boeing
757 Series
More than
300,000
lbs.
Share Allocations 9.0% 9.0% 25.0% 25.0% 30.0% 1.2% 0.8%
Source: Airfield Capacity Spreadsheet and 2018 forecasted fleet mix
Airspace Departure/Arrival Separation
Another factor to be considered in the estimation of airfield capacity is the ability of aircraft to arrive
and depart the airport in as smooth a flow as possible. Congested airspace at the busiest airports
reduces airfield capacity, since the sequencing of aircraft arrivals can often interfere with the smooth
sequencing of aircraft departures, resulting in ground delays. Related to airspace analysis, aircraft
arrival and departure sequencing is affected by visibility in IMC conditions, where aircraft separation
must be increased to account for reduced Air Traffic Control (ATC) visibility. For calculating airfield
capacity in VMC conditions the departure-arrival separation was set to 2 nm, and for IMC conditions
the departure-arrival separation was set to 3 nm.
4.2.1.2. Airfield Capacity Summary
Using the parameters and assumptions listed above, as well as information from the Master Plan
Update’s Aviation Demand Forecasts, airfield capacity was calculated. To account for the uniqueness
of the BNA airfield layout having three (3) parallel runways, two model configurations were used to
estimate capacity. One model configuration was established to calculate the capacity of Runways
2L/20R and 2C/20C (dual runway model), and one model configuration was established for Runway
2R/20L (single runway model). The overall airfield capacity was estimated by summing the results of
the individual configuration estimates together.

BNA Airport Master Plan Update
Chapter 4 – Facility Requirements - DRAFT
Page | 8
For the dual runway model, the lateral separation between Runways 2L/20R and 2C/20C (1,176 feet) is
considered too close to allow independent arrivals and departures in IMC weather conditions. This is
because, even with current technology, ATC controllers require increased aircraft separation in
reduced visibility weather conditions. Thus, these two runways are considered “dependent” – they
cannot be used at the same time for arrivals and departures without increased aircraft separation,
which reduces airfield capacity in those weather conditions. For the modeling effort, dependent
parallel runway configuration scenario number 7 was chosen to best represent these runways.
Hourly VMC Capacity
Hourly VMC capacity was estimated at 92 for the dual configuration and another 54 operations for the
single runway totaling to an overall estimate of 146 hourly operations in both north flow and south
flow operations.
Hourly IMC Capacity
Hourly IMC capacity was estimated at 64 for the dual configuration and another 43 operations for the
single runway totaling to an overall estimate of 107 hourly operations in both north flow and south
flow operations.
Annual Service Volume (ASV)
Annual Service Volume is the estimate of the annual capacity of total aircraft operations at the airport.
It is calculated from the hourly capacities noted above along with factors to adjust for peak hours and
peak days.
From ACRP 03-17, Appendix A: Prototype Aircraft Capacity Spreadsheet Model User’s Guide, the
following calculation is used to estimate ASV:
ASV = Cw * D * H, where Cw is the weighted average of hourly capacities at their respective
percent occurrence over a period of time. The model capacity outputs can be calculated for
VMC and IMC. The ASV model asks the user to input the hourly capacity values determined
from the single, dual or intersecting models and also the percent occurrence of those
meteorological conditions to determine Cw.
D and H are the demand ratios which represent the Annual Demand/Avg. Peak Month Daily
Demand (D), and the Avg. Peak Month Daily Demand/Avg. Peak Hour Demand (H). Daily
traffic activity data for at least the peak month and the annual traffic volume is required to
determine these demand ratios.
For the calculation of (D), the following inputs were used:
June 2018 Operations = 18,885
18,885 / 30 days in June = 629.5 Average Day peak month demand
BNA Airport Master Plan Update
Chapter 4 – Facility Requirements - DRAFT
Page | 9
Total operations for year ending June 2018 = 210,357
210,357 / 629.5 = 334.2 = D
For the calculation of (H), the following inputs were used:
43 peak operations / hour (not including GA or Military) based on the Official Airline Guide
(OAG) for June 18, 2018
An estimated 162 GA operations were spread over 18 hours for an average of 9 per hour
No Military or Cargo operations are forecasted during the peak hour (18:06-19:05)
Total peak operations on 2018 ADPM = 52
629.5 / 52 = 12.1 = H
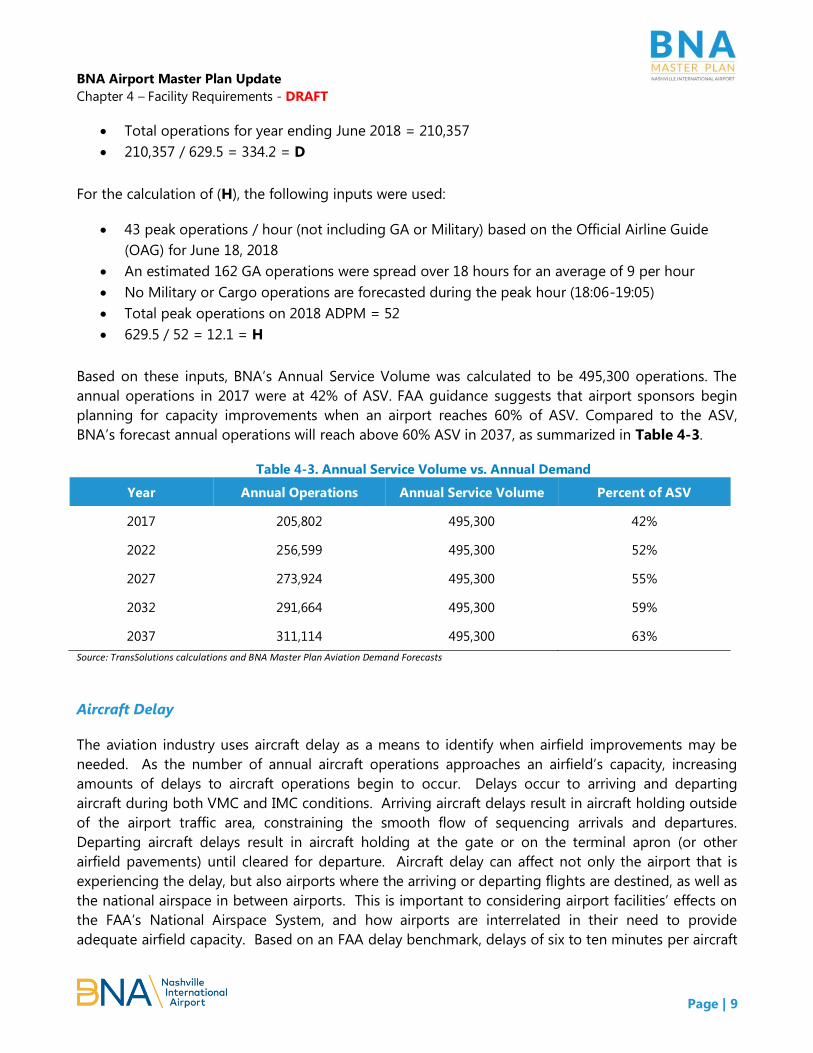
Based on these inputs, BNA’s Annual Service Volume was calculated to be 495,300 operations. The
annual operations in 2017 were at 42% of ASV. FAA guidance suggests that airport sponsors begin
planning for capacity improvements when an airport reaches 60% of ASV. Compared to the ASV,
BNA’s forecast annual operations will reach above 60% ASV in 2037, as summarized in Table 4-3.
Table 4-3. Annual Service Volume vs. Annual Demand
Year Annual Operations Annual Service Volume Percent of ASV
2017 205,802 495,300 42%
2022 256,599 495,300 52%
2027 273,924 495,300 55%
2032 291,664 495,300 59%
2037 311,114 495,300 63%
Source: TransSolutions calculations and BNA Master Plan Aviation Demand Forecasts
Aircraft Delay
The aviation industry uses aircraft delay as a means to identify when airfield improvements may be
needed. As the number of annual aircraft operations approaches an airfield’s capacity, increasing
amounts of delays to aircraft operations begin to occur. Delays occur to arriving and departing
aircraft during both VMC and IMC conditions. Arriving aircraft delays result in aircraft holding outside
of the airport traffic area, constraining the smooth flow of sequencing arrivals and departures.
Departing aircraft delays result in aircraft holding at the gate or on the terminal apron (or other
airfield pavements) until cleared for departure. Aircraft delay can affect not only the airport that is
experiencing the delay, but also airports where the arriving or departing flights are destined, as well as
the national airspace in between airports. This is important to considering airport facilities’ effects on
the FAA’s National Airspace System, and how airports are interrelated in their need to provide
adequate airfield capacity. Based on an FAA delay benchmark, delays of six to ten minutes per aircraft

BNA Airport Master Plan Update
Chapter 4 – Facility Requirements - DRAFT
Page | 10
operation indicate a degraded airport level of service. The FAA identifies 20 minutes of average delay
per aircraft operation as a maximum tolerated delay in its guidance for benefit-cost analyses of airfield
improvements.
An airfield capacity analysis was conducted using the Airport and Airspace Simulation Model
(SIMMOD) program to assess aircraft delay at BNA. Aircraft delay is defined as the difference between
the actual and the unimpeded time for aircraft ground movements using the system of runways and
taxiways. The analysis identified the delays and aircraft taxi times at BNA for current conditions and
two future demand levels – 2027 and 2037. The analysis relies on a very detailed identification and
computer modeling for each segment of an aircraft movement on the airfield, from aircraft parking
location to the runway for departing aircraft, and from the runway to the aircraft parking destination
for arriving aircraft. The list of required assumptions and aircraft movement segments included in the
modeling analysis for the current conditions and two future demand levels (2027 and 2037) include:
Visual and Instrument Meteorological Conditions (VMC/IMC)
Total daily flight demand
Aircraft fleet mix
Projected design day flight schedule
Flight dependability (percent that operations are “on-time”)
Aircraft taxi speed for each aircraft type
Projected airline parking locations at the terminal
Time it takes for an aircraft “pushback” from a terminal gate
Length of time needed for aircraft landing/take-off rolls
Required separation between aircraft
Assumptions regarding runway to be used by aircraft type
Once all inputs are quantified, the computer model output is calibrated with known information on
actual aircraft operations. Two primary sources were used to calibrate the SIMMOD model – the U.S.
Department of Transportation’s (USDOT) Bureau of Transportation Statistics (BTS), and the airport’s
noise data. The calibrated models are then used for the study. Table 4-4 compares the taxi times
obtained from BTS to the simulation model’s taxi times in both north flow and south flow.
Table 4-4. Taxi Times Calibration (minutes)
Flow Operations BTS Simulated
North Arrivals 6.2 7.0
Departures 12.3 11.8
South Arrivals 6.4 6.9
Departures 11.0 11.2 Source: Commercial flights for July-August 2017 and June 2018, BTS
The 2018 average hourly runway throughputs for north flow and south flow were also calibrated with
the peak month runway throughputs at BNA (Noise Data from May to August 2017 and 2018). Table
4-5 summarizes the runway throughput calibrations.

BNA Airport Master Plan Update
Chapter 4 – Facility Requirements - DRAFT
Page | 11
Table 4-5. Hourly Runway Throughput Calibration
Flow BNA Noise Data Simulated
North 42 43
South 42 44 Source: BNA Noise Data, May – August 2017 and 2018
All taxi times and hourly throughputs are within 10% of the actual data, thus deeming the baseline
simulation model to be calibrated and accurate for future capacity estimation analyses.
The results of the SIMMOD modeling for taxi times and average aircraft delay are presented in Table
4-6 and Table 4-7. The parallel runway system at BNA, combined with sufficient runway exit taxiways,
result in aircraft experiencing a minimum of ground movement delay through the planning period in
both VMC and IMC conditions. Ground movement delays increase throughout the planning period as
aircraft operations increase; however, the SIMMOD model predicts that ground delays will not exceed
more than approximately two (2) minutes, which is considerably less than the FAA’s benchmark of
approximately 6 – 10 minutes of average annual aircraft delay per operation. This should not imply
that airfield improvements are not needed; rather, it is a confirmation that the current airfield
configuration and operating conditions are not contributing to aircraft movement delay.
Table 4-6. Comparison of Average Taxi Times (minutes) – VMC
Operations 2018 2027 2037
Unimpeded
Taxi Time Delay Total
Unimpeded
Taxi Time Delay Total
Unimpeded
Taxi Time Delay Total
North
Flow
Arrivals 5.7 0.3 6.0 6.0 0.5 6.5 6.0 0.5 6.5
Departures 10.2 0.6 10.8 10.5 1.0 11.5 10.4 1.1 11.5
South
Flow
Arrivals 6.0 0.2 6.2 6.1 0.4 6.5 6.2 0.5 6.7
Departures 9.3 0.8 10.1 9.4 1.2 10.6 9.5 1.5 11.0 Source: TransSolutions analysis.
Table 4-7. Comparison of Average Taxi Times (minutes) – IMC
Operations 2018 2027 2037
Unimpeded
Taxi Time Delay Total
Unimpeded
Taxi Time Delay Total
Unimpeded
Taxi Time Delay Total
North
Flow
Arrivals 5.7 0.3 6.0 6.0 0.4 6.4 6.0 0.5 6.5
Departures 10.2 0.8 11.0 10.5 1.3 11.8 10.4 1.7 12.1
South
Flow
Arrivals 6.0 0.2 6.2 6.1 0.5 6.6 6.2 0.5 6.7
Departures 9.3 1.1 10.4 9.4 1.9 11.3 9.5 2.3 11.8 Source: TransSolutions analysis.

BNA Airport Master Plan Update
Chapter 4 – Facility Requirements - DRAFT
Page | 12
4.2.2. Runway Length Analysis
Runway length is critical to an airport’s ability to accommodate the aircraft used for existing and
future airline, cargo, general aviation, and military operations. Two major factors determine runway
length requirements: the design aircraft and the longest nonstop distance to be flown by the design
aircraft.
4.2.2.1. Design Aircraft
The design aircraft established in this Master Plan is ADG D-V, which includes the B787 currently
serving the airport. Potential future aircraft having the same ADG include the B777, A330, A340, and
A350. The aircraft fleet of the future is evolving differently than examined in the 2013 master plan,
and this factor has an impact on the runway length needed at BNA. The 2013 Master Plan indicated
that a runway length of 11,000 feet would suffice at BNA; however, the international destinations
identified in the 2013 Plan were more indicative of the range capability of the narrowbody B757, which
would be limited to Western Europe. Figure 4-3 illustrates the general airline trend towards newer
aircraft, and highlights the benefits of updating the runway length analysis from the 2013 Master Plan.
Figure 4-3. BNA Fleet & Market Demand Shift
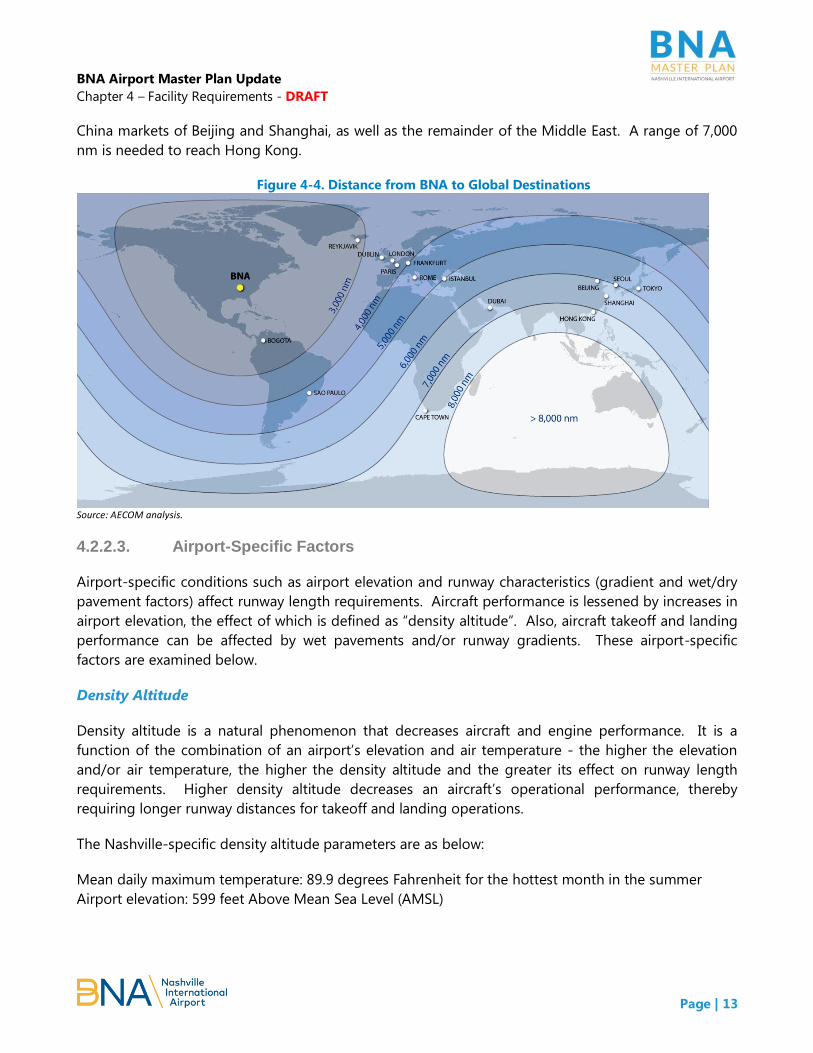
4.2.2.2. Longest Nonstop Distance
Figure 4-4 illustrates the distance from Nashville to several major global airport destinations.
Generally, aircraft with capabilities of reaching a 4,000 nautical mile (nm) nonstop distance from BNA
would include all Caribbean markets, the northern half of South America, the northwestern coast of
Africa, and most of western Europe, including Iceland. A range of 5,000 nm from BNA would include
almost all of South America, the western third of Africa, and all of western and central Europe. At a
6,000 nm range, the Far East, including Tokyo and Seoul can be reached, as well as most of the Middle
East, all of South America, and the western half of Africa. A range of 6,500 nm from BNA includes the
BNA Airport Master Plan Update
Chapter 4 – Facility Requirements - DRAFT
Page | 13
China markets of Beijing and Shanghai, as well as the remainder of the Middle East. A range of 7,000
nm is needed to reach Hong Kong.
Figure 4-4. Distance from BNA to Global Destinations
Source: AECOM analysis.
4.2.2.3. Airport-Specific Factors
Airport-specific conditions such as airport elevation and runway characteristics (gradient and wet/dry
pavement factors) affect runway length requirements. Aircraft performance is lessened by increases in
airport elevation, the effect of which is defined as “density altitude”. Also, aircraft takeoff and landing
performance can be affected by wet pavements and/or runway gradients. These airport-specific
factors are examined below.
Density Altitude
Density altitude is a natural phenomenon that decreases aircraft and engine performance. It is a
function of the combination of an airport’s elevation and air temperature - the higher the elevation
and/or air temperature, the higher the density altitude and the greater its effect on runway length
requirements. Higher density altitude decreases an aircraft’s operational performance, thereby
requiring longer runway distances for takeoff and landing operations.
The Nashville-specific density altitude parameters are as below:
Mean daily maximum temperature: 89.9 degrees Fahrenheit for the hottest month in the summer
Airport elevation: 599 feet Above Mean Sea Level (AMSL)

BNA Airport Master Plan Update
Chapter 4 – Facility Requirements - DRAFT
Page | 14
Runway Characteristics
Runway characteristics such as runway pavement slopes and wet surface conditions are also important
inputs used to determine runway length requirements. In considering runway slope (“effective
gradient”1) in runway length requirements, it would be ideal if runways could be constructed as flat
surfaces. However, most airport runways are constructed with consideration of the natural terrain
resulting in an effective gradient that increases an aircraft’s runway length requirement when
operating in the uphill direction. The FAA recommends using dry surface conditions for takeoff length
requirements, and an additional 10 feet is added to the takeoff length requirement for each foot of
difference in the high and low points of the runway centerline elevations. The manufacturer’s
performance manuals assume zero effective runway gradients and thus this additional factor is
required. At Nashville, the effective gradient of the runways due to terrain differences from one
runway end to the other (approximately 50 feet) results in the requirement for an additional 500 feet
of takeoff runway length.
Wet runway pavements also require longer landing lengths than dry surfaces. Some aircraft
manufacturers have calculated the effect of wet runways on the required landing length. For those
manufacturers that do not offer these calculations, a standard 15 percent of additional required length
is added to the dry landing length requirements to account for wet pavement conditions.
4.2.2.4. Takeoff Runway Length Analysis
The analysis of runway length requirements focuses on the length required for aircraft takeoffs, since
this length is considerably greater than landing runway length requirements. Aircraft require more
takeoff runway length as the aircraft is developing power and speed to begin flight rather than during
landing when aircraft are typically operated at a reduced power setting thus requiring less length to
slow down and exit the runway.
In order to identify a recommended takeoff runway length for the design aircraft, an analysis of
aircraft manufacturer (Boeing, Airbus) flight performance characteristics manuals for several Group V
aircraft types and models was conducted. These aircraft included the:
Boeing 787-8 and Boeing 787-9
Boeing 777 (various models, such as the -200ER, -200LR, and -300ER)
Boeing 747-400ER
Airbus 330 (various models, such as the -200 and -300)
Airbus 340 (-300 and -600 models)
Airbus 350-900
1 Effective gradient is defined as the difference between the highest and lowest elevations of the runway
centerline divided by the runway length.

BNA Airport Master Plan Update
Chapter 4 – Facility Requirements - DRAFT
Page | 15
The analysis of the various Group V aircraft performance manuals took into account the longest
nonstop distance to be flown from Nashville to existing and potential destinations, as well as the
airport’s elevation (599’ AMSL), effective runway gradient, and average annual high temperatures
(89.9o F) in the Nashville area.
Figure 4-5 summarizes the analysis of runway length needed by various aircraft types. Only a
selection of representative aircraft is depicted on this figure. The Table indicates that a takeoff runway
length of approximately 11,500 – 12,000 feet is needed to serve most potential international markets
from Nashville, assuming the representative aircraft types listed above are operating at a 100%
payload at maximum takeoff weight (MTOW).
Figure 4-5. Existing Runway Lengths Compared Against Required Runway Lengths
Source: AECOM analysis.
Regarding “payload”, or the amount of passengers, cargo, and fuel an aircraft can carry, a 100%
payload weight is the optimal condition for an operating airline. Operating flights at maximum
payload and aircraft weight produces the greatest revenue opportunity for an airline. Not all of the
Design Aircraft can reach all international destinations with maximum payload. If an airline nonstop
destination cannot be reached due to insufficient runway length that doesn’t allow the aircraft to
operate at 100% payload, an airline has no choice but to reduce the amount of passengers, cargo,
and/or fuel carried. Payload restrictions can be a deciding factor in an airline’s decision to serve a
nonstop destination.
4.2.2.5. Landing Runway Length Analysis
In addition to identifying the takeoff runway length required to accommodate the existing and future
aircraft fleet, it is important to consider the runway length needed for landings. The landing runway
length requirements were calculated using the aircraft’s maximum landing weight (MLW) in dry and

BNA Airport Master Plan Update
Chapter 4 – Facility Requirements - DRAFT
Page | 16
wet pavement conditions. The findings are summarized in Figure 4-6. Landing length requirements on
dry pavement ranged from 5,000 feet (Boeing 757-200) to 7,500 feet (Boeing 747-400). For wet
pavement conditions, landing length requirements ranged from 5,800 feet (Boeing 757-200) to 8,600
feet (Boeing 747-400). All existing and projected aircraft, other than the Boeing 747-400 and the
Airbus 340-600, can land on BNA’s primary north/south oriented runways in wet pavement conditions.
Figure 4-6. Landing Runway Length Requirement
Source: AECOM analysis.
4.2.2.6. Runway Length Analysis Summary
None of the existing runways has the length needed to serve potential international destinations using
the Design Aircraft that can operate in these markets. While the length of Runway 13-31 comes close
to providing suitable length for the aircraft listed, airlines serving destinations beyond approximately
4,000 nm would need to reduce payload.
Based on the analysis of aircraft performance using a range of ADG D-V aircraft serving the most likely
international destinations from BNA during the 20-year planning horizon, it is recommended that a
runway length of 11,500 – 12,000 feet be planned to meet future international travel demand.
-
1,000
2,000
3,000
4,000
5,000
6,000
7,000
8,000
9,000
10,000
Landing Runway Length - Dry Landing Runway Length - Wet

BNA Airport Master Plan Update
Chapter 4 – Facility Requirements - DRAFT
Page | 17
4.2.3. Runway Design Standards & Requirements
FAA design standards for airfield facilities are based primarily on the characteristics of the aircraft
expected to use the airport, and airports must comply with current design standards, unless a
modification of standards (MOS) is approved by the FAA. The FAA also recognizes that it is
sometimes not possible to base design of all airfield components on one aircraft. Therefore, the
selection of a “design aircraft” for purposes of geometric design at an airport with multiple runways
such as BNA is typically based on a composite aircraft representing a collection of aircraft classified by
three parameters: Aircraft Approach Category (AAC), Airplane Design Group (ADG), and Taxiway
Design Group (TDG).
For this Master Plan, it is important to note that the prior selection of the B757 and B747 aircraft as
“design aircraft” (the largest aircraft expected to have more than 500 annual takeoffs/landings) has
changed in favor of newer widebody aircraft, such as the B787. In FAA terminology, the B757 (ADG IV)
aircraft is being replaced at BNA by the B787 (ADG V) aircraft, such as is being used by British Airways
on its Nashville – London route.
Although the design aircraft for this Master Plan is D-V, some runways and taxiways at BNA were
originally designed to meet D-IV standards or even lower standards. The analysis in this section
identifies gaps in the ability of the existing airfield to meet D-V standards, and also reviews
compliance with D-IV design standards.
4.2.3.1. Runway Design Code
With the design aircraft (ADG D-V) identified, the next step in evaluating BNA’s airfield for compliance
with current FAA design standards is to identify a Runway Design Code (RDC) for each runway. The
RDC is used to determine the design standards that apply to a specific runway and parallel taxiway to
allow unrestricted operations by the design aircraft under desired meteorological conditions. In
addition to the design aircraft designation, each runway’s planned instrument approach visibility
minimums combines to establish the RDC.
The RDC is comprised of three components, the Aircraft Approach Category (AAC), the Airplane
Design Group (ADG), and visibility minimums. Table 4-8 below indicates the various aircraft
classifications and design groups based on approach speed, wingspan, and approach visibility.

BNA Airport Master Plan Update
Chapter 4 – Facility Requirements - DRAFT
Page | 18
Table 4-8. FAA Runway Design Code (RDC) Parameters:
Aircraft Approach Category (AAC) Classification
Approach Category Approach Speed (Knots)
A Less than 91 knots
B 91-<121
C 121-<141
D 141-<166
E 166 or greater
Airplane Design Group (ADG) Classification
Design Group Wingspan (Feet) Tail Height (Feet)
I <49 <20
II 49 - <79 20 - <30
III 709 - <118 30 - <45
IV 118 - <171 45 - <60
V 171 - <214 60 - <66
VI 214 - <262 66 - <80
Visibility Minimums
RVR (ft.) Instrument Flight Visibility Category (statute mile)
5000 Not lower than one mile
4000 Lower than 1 mile but not lower than ¾ mile
2400 Lower than ¾ mile but not lower than ½ mile
1600 Lower than ½ mile but not lower than ¼ mile
1200 Lower than ¼ mile Source: FAA Advisory Circular (AC) 150/5300-13A, Airport Design, Change 1
The RDCs for all the runway ends at BNA are summarized in Table 4-9, together with approach type
and runway end elevation for each runway. Runways 2L-20R and 13-31 were designed as D-V
runways, whereas Runways 2C-20C and 2R-20L were designed as D-IV runways. These are the crucial
data in determining the object clearing surfaces applicable to each runway end.
Table 4-9. Runway End Information
Runway RDC Approach Type1
Runway End
Elevation (ft MSL)2
2L D-V-1200 CAT II/III 598.7
20R D-V-4000 CAT I 555.4
2C D-IV-2400 CAT I 569.0
20C D-IV-5000 RNAV RNP & GPS 571.8
2R D-IV-1200 CAT II/III 589.7
20L D-IV-2400 CAT I 539.9
13 D-V-5000 RNAV RNP & GPS 535.8
31 D-V-4000 CAT I 582.2 Sources:
1. Approach plates 2. BNA Airport Layout Plan 2013

BNA Airport Master Plan Update
Chapter 4 – Facility Requirements - DRAFT
Page | 19
4.2.3.2. Runway Physical Dimensions
Table 4-10 summarizes the required runway physical dimensions for D-IV and D-V runways per AC
150/5300-13A, in comparison to the dimensions of the existing runways at BNA. All the runways are
of sufficient D-V width. The shoulders of Runways 2C-20C and 2R-20L need to be widened to meet
both D-IV and D-V standards. The blast pads of Runways 2C-20C, 2R-20L, and 13-31 are sufficient for
D-IV standards, but need to be enlarged to meet D-V standards. The blast pads for Runway 2L-20R
need to be enlarged to meet D-IV and D-V standards.
Table 4-10. Runway Physical Dimensions
Runway Design D-IV D-V 2L 20R 2C 20C 2R 20L 13 31
Runway Width (ft) 150 150 150 150 150 150
Shoulder Width (ft) 25 35 35 12 12 35
Blast Pad Width (ft) 200 220 150 150 200 200 200 200 200a
200
Blast Pad Length (ft) 200 400 200 150 200 200 200 200 200a
200 Notes:
a. Blast pad is in irregular shape b. Orange text denotes insufficiency based on ADG-V standards c. Red text denotes insufficiency based on both ADG-IV and ADG-V standards
4.2.3.3. Runway Object Clearing Surfaces
While all design standards are important for safe and efficient aircraft movements, the design criteria
established to protect the area immediately surrounding the runway environment is the most critical.
These areas consist of:
Runway Safety Areas (RSAs)
Runway Object Free Areas (ROFAs)
Obstacle Free Zones (OFZs)
Runway Protection Zones (RPZs)
As indicated below in Table 4-11, the required dimensions of these object clearing surfaces are the
same for design aircraft categories D-IV and D-V. Each of these critical areas is discussed in detail in
subsequent sections.
An object clearing analysis was performed for each of these surfaces, as depicted on Figure 4-7.
Obstacles analyzed included man-made structures such as navaids, poles, signs, buildings, and fences;
as well as natural objects such as trees and ground. The obstacles falling within each surface are
identified in subsequent sections. (It is noted that wetlands and open water features fall within the
object clearing surfaces. However, these environmental features are not categorized as structures or
obstructions. When projects evolve from planning to design, there would need to be an assessment of
the wetlands and waters to determine their function (such as stormwater management or habitat),
their quality, and whether the impacts to them can be minimized).

BNA Airport Master Plan Update
Chapter 4 – Facility Requirements - DRAFT
Page | 20
Table 4-11. Required Dimensions of Runway Object Clearing Surfaces
Object Clearing Surfaces ADG IV ADG V
RSA
Length beyond Departure End 1,000 FT 1,000 FT
Width 500 FT 500 FT
ROFA
Length beyond Departure End 1,000 FT 1,000 FT
Width 800 FT 800 FT
ROFZ
Length beyond Departure End 200 FT 200 FT
Width 400 FT 400 FT
Other OFZs
IAOFZ Details specified in AC 150/5300-13A Para. 308 (b)
ITOFZ Details specified in AC 150/5300-13A Para. 308 (c)
POFZ Details specified in AC 150/5300-13A Para. 308 (d)
Approach RPZ
Outer Width 1,750 FT 1,750 FT
Inner Width 1,000 FT 1,000 FT
Length 2,500 FT 2,500 FT
Departure RPZ
Outer Width 1,010 FT 1,010 FT
Inner Width 500 FT 500 FT
Length 1,700 FT 1,700 FT Source: FAA Advisory Circular (AC) 150/5300-13A, Airport Design, Change 1
Runway Safety Areas
A runway safety area (RSA) is a defined surface surrounding a runway prepared or suitable for
reducing the risk of damage to aircraft in the event of undershoot, overshoot, or excursion from the
runway. An RSA: must be cleared and graded and have no potentially hazardous ruts or other surface
variations; must be drained to prevent water accumulations; and must be free of objects exceeding
three (3) inches in height. Mandated by the U.S. Congress, all RSA’s at the 529 commercial airports in
the U.S. were expected to comply with RSA standards by December, 2015. RSA standards cannot be
modified, and any airport facing challenges in meeting with RSA standards must have implemented
alternative means of compliance, including declaring reduced available runway lengths for arriving
and/or departing aircraft.
Table 4-12 summarizes the RSA dimensions at each runway end, in comparison to the required
runway design standards for D-IV and D-V. Runways 2L/20R and 2R/20L have fully compliant RSA
dimensions of 1,000 feet beyond runway ends. Based on clear RSAs for these two runways, there is no
requirement to apply declared distances or reduce runway length to comply with FAA design
standards.

BNA Airport Master Plan Update
Chapter 4 – Facility Requirements - DRAFT
Page | 21
Figure 4-7. Runway Object Clearing Surfaces
Data Source:
Object clearing surfaces created through AECOM analysis
All man-made and natural obstacles data are from GIS shapefiles provided by the MNAA.

BNA Airport Master Plan Update
Chapter 4 – Facility Requirements - DRAFT
Page | 22
The RSA for Runway 2C-20C was not fully compliant by December 2015, as Taxiway K and the Runway
2C Localizer fell within the RSA off the Runway 20C end. Considering the Localizer location, the RSA
off Runway 20C end was out of compliance by 400 feet, which reduced Runway 2C’s Accelerate-Stop
Distance Available (ASDA) and Landing Distance Available (LDA) from 8,001 feet to 7,601 feet. Runway
20C’s ASDA and LDA remained at 8,001 feet.
For Runway 13-31, the RSAs at both runway ends were penetrated by objects such as localizers, public
roads, airport service roads, and fences. At the approach end of Runway 13, U.S. Route 40, Briley
Parkway, and the Runway 31 localizer all fell within the standard 500-foot x 1,000-foot RSA; therefore
the RSA only provided 198 feet, requiring a displacement of the Runway 13 threshold by 802 feet to
meet the 1,000-foot RSA design standard. At the approach end of Runway 31, the airport service
road, airport fence, Donelson Pike, Runway 2R/20L, and Taxiway H all fell within the standard RSA;
therefore the RSA only provided 176 feet, requiring a threshold displacement of 824 feet from the
Runway 31 end to provide a standard RSA.
As a result, the ASDAs for Runways 13 and 31 are shorter than the runway pavement length. More
details about declared distances are discussed in a subsequent section.
Table 4-12. RSA Dimensions at BNA
RSA Length beyond
Runway End (ft.)1
Width
(ft.)1 Object Clearance
Required
(D-IV & D-V) 1,000 500 -
2L 1,000 500 Clear
20R 1,000 500 Clear
2C 1,000 500 Clear
20C 600a
500 Clear
2R 1,000 500 Clear
20L 1,000 500 Clear
13 198b
500 Clear
31 176c
500 Clear Source:
1. BNA 2013 ALP & 5010. Notes:
a. RSA length reduced due to Runway 2C Localizer and Twy K b. RSA length reduced due to Runway 31 Localizer c. RSA length reduced due to vehicle service road, fence, and Donelson Pike

BNA Airport Master Plan Update
Chapter 4 – Facility Requirements - DRAFT
Page | 23
Runway Object Free Areas
In addition to RSAs, each runway is required to maintain an object free area that prohibits above-
ground objects protruding above the nearest point of its adjacent RSA. Only objects that need to be
located in the ROFA for air navigation or aircraft ground maneuvering purposes, such as airfield
signage and certain navaids (PAPI, VASI, REIL, RVR, etc.), are allowable within the ROFA. To the extent
practicable, objects in the ROFA should meet the same frangibility requirements as the RSA. For
airports across the country, typical objects that fall within ROFA but are not allowable include airport
service roads, windsocks, glide slope antennas, localizers, airport fences, aircraft parking apron, and
sometimes even public roads. All such objects should be cleared from the ROFA.
Per FAA design standards, a ROFA is 800 feet wide and 1,000 feet beyond the departure end of
runway. Due to the obstacles discussed in the previous section about RSAs, the ends of Runways 20C,
13, and 31 had to be displaced with the RSAs to provide standard ROFAs. Although the ROFAs
beyond the runway ends are now clear, several objects not allowable within the ROFA on the sides of
the runways remain within the ROFA, as summarized in Table 4-13.
Table 4-13. ROFA Dimensions at BNA
ROFA Length beyond
Runway End (ft.)1
Width
(ft.)1 Object Clearance
D-IV & D-V 1,000 800
2L 1,000 800
Airport service road near 2L Windsock;
Glide slope antenna near 2L end;
Control box near the runway intersection;
20R 1,000 800 Glide slope antenna near 20R end;
Fence and airport service road near 20R end;
2C 1,000 800
Fence along Murfreesboro Pike tunnel;
Glide slope antenna and its fence near 2C;
Windsock near 2C;
20C 600a
800
Localizer shelter near 20C end;
Windsock near 20C;
Airport service road west of runway;
2R 1,000 800
Airport service road near 2R;
Glide slope antenna near 2R;
Windsock near 2R;
Quarry & fence around the quarry
20L 1,000 800 Glide slope antenna near 20L;
Airport service road & fence near 20L;
13 198b
800 Clear
31 176c
800 Windsock near 31;
Glide slope antenna near 31; Data Source:
All man-made and natural obstacles data are from GIS shapefiles provided by the MNAA. Notes:
a. ROFA length reduced due to Runway 2C Localizer and Twy K b. ROFA length reduced due to Runway 31 Localizer c. ROFA length reduced due to vehicle service road, fence, and Donelson Pike

BNA Airport Master Plan Update
Chapter 4 – Facility Requirements - DRAFT
Page | 24
Obstacle Free Zones
As specified in FAA AC 150/5300-13A, the obstacle free zone clearing standard precludes aircraft and
other object penetrations, except for frangible navaids that need to be located in the OFZs because of
their function. OFZs must be kept clear during operations.
There are four types of OFZs – Runway OFZ, inner-approach OFZ (IAOFZ), inner-transitional OFZ
(ITOFZ), and Precision OFZ (POFZ). The shape, size, and applicability of the OFZs depend on various
factors specific to each runway end. Table 4-14 summarizes the applicability of each OFZ to each
runway.
Table 4-14. OFZ Applicability
Runway Approach
Minimums
Equipped
with ALS
OFZ Applicability
ROFZ IAOFZ ITOFZ POFZ
2L 600 ft. Y Y Y Y Y
20R ¾ mile Y Y Y N N
2C ½ mile Y Y Y Y Y
20C 1 mile N Y N N N
2R 600 ft. Y Y Y Y Y
20L ½ mile Y Y Y Y Y
13 1 mile N Y N N N
31 ¾ mile N Y N N N Source: AECOM analysis.
Runway Obstacle Free Zone (ROFZ)
ROFZ is a design surface and an operational surface that must be kept clear during aircraft operations.
An ROFZ is applicable to each runway end at BNA. The ROFZ is a defined volume of airspace centered
above the runway centerline, above a surface whose elevation at any point is the same as the
elevation of the nearest point on the runway centerline.
Inner-approach OFZ (IAOFZ)
IAOFZ is a defined volume of airspace centered on the approach area. It applies only to runways with
an approach lighting system (ALS). Runways 20C, 13, and 31 are not equipped with an ALS and thus
do not have an IAOFZ.
An IAOFZ begins 200 feet from the runway threshold at the same elevation as the threshold, and
extends 200 feet beyond the last light unit in the ALS. Its width is the same as the ROFZ and rises at a
slope of 50 (horizontal) to 1 (vertical) from its beginning.
Inner-transitional OFZ (ITOFZ)
An ITOFZ is a defined volume of airspace along the sides of the ROFZ and the IAOFZ. It applies only to
runways with lower than ¾ statute mile approach minimums. Therefore, Runways 20R, 20C, 13, and

BNA Airport Master Plan Update
Chapter 4 – Facility Requirements - DRAFT
Page | 25
31 do not have ITOFZs. The shape, dimensions, and slopes of the ITOFZs are calculated based on the
specifications in AC 150/5300-13A, paragraph 308c.
Precision OFZ (POFZ)
A POFZ is a defined volume of airspace above an area beginning at the threshold at the threshold
elevation and centered on the extended runway centerline. A POFZ is 200 feet long by 800 feet wide,
and is only applicable when all three of the following conditions are met:
(1) The approach includes vertical guidance
(2) The reported ceiling is below 250 feet or visibility is less than ¾ statute mile
(3) An aircraft is on final approach within 2 miles of the runway threshold
Therefore, only Runways 2L, 2C, 2R, and 20L have POFZs.
Object Clearing Analysis
Table 4-15 summarizes the object clearing analysis results for each of the runways. ROFZs and POFZs
for all runways are clear from objects. As shown on Figure 4-7, objects exist below the IAOFZs and
ITOFZs, but due to the sloping nature of these surfaces, the objects do not penetrate these surfaces.
Therefore, all OFZs at BNA are clear from objects.
Table 4-15. OFZ Object Clearing Analysis
Runway ROFZ IAOFZ ITOFZ POFZ
2L
Clear
Murfreesboro Pike about
40 feet below the surface
Hangar 4160 and Monell’s more
than 70 feet below surface;
Fence much lower than the
surface
Clear
20R VSR and I-40 more than
40 feet below the surface Not Applicable Not Applicable
2C Substation below the
surface
Several GA hangars more than
100 feet below the surface Clear
20C Not Applicable Not Applicable Not Applicable
2R Knapp Blvd 30 feet below
the surface.
Building near employee parking
lot more than 100 feet below the
surface
Clear
20L VSR more than 40 feet
below the surface
DPS office and USPS office more
than 100 feet below the surface Clear
13 Not Applicable Not Applicable Not Applicable
31 Not Applicable Not Applicable Not Applicable Data Source:
All man-made and natural obstacles data are from GIS shapefiles provided by the MNAA.

BNA Airport Master Plan Update
Chapter 4 – Facility Requirements - DRAFT
Page | 26
Runway Protection Zones
The RPZ is a trapezoidal area located prior to the runway threshold or beyond the departure
end of the runway to provide unobstructed passage of aircraft through the airspace above it.
Figure 4-8 illustrates the location and relationship of the RPZ to the physical runway
environment.
The main purpose of RPZ is to avoid negatively impacting people and property on the
ground. FAA requires airports to gain control over RPZs through acquisition of sufficient
property interest (such as ownership, lease, or avigation easement) in the RPZs. While it is
desirable to keep the entire RPZ clear of all above-ground objects, at a minimum RPZs should
be maintained clear of all incompatible activities. Per the FAA, permissible land uses within
RPZs include:
Farming
Irrigation channels
Airport service roads
Underground facilities
Unstaffed NAVAIDS and facilities (only if fixed by function)
Public roads were a permissible land use in RPZs but the newest update of AC 150/5300-13A
eliminated this exception. As a result, public roads that fall within RPZs should be examined
closely to identify mitigation measures. The FAA’s Memorandum, Interim Guidance on Land
Uses within a Runway Protection Zone, dated September 27, 2012 is used to determine
the appropriate action required for mitigation of incompatible land uses within existing RPZs.
Figure 4-8. RPZ Location
Source: AC 150/5300-13A, Figure 3-16.

BNA Airport Master Plan Update
Chapter 4 – Facility Requirements - DRAFT
Page | 27
Although the RPZ dimensional standards for D-IV and D-V runways are the same, the dimensions of
approach RPZs vary for runways with different approach visibility minimums. Table 4-16 summarizes
the dimensions of approach RPZs at BNA. The different colors of the cells indicates the varying
dimensions for visibility minimums (1) lower than ¾ mile, (2) NOT lower than ¾ mile, and (3) NOT
lower than 1 mile.
Table 4-16. RPZ Dimensions at BNA
Approach RPZ Approach
Minimums Length (ft) Inner Width (ft) Outer Width (ft)
D-IV & D-V
2L 600 ft. 2,500 1,000 1,750
20R ¾ mile 1,700 1,000 1,510
2C ½ mile 2,500 1,000 1,750
20C 1 mile 1,700 500 1,010
2R 600 ft. 2,500 1,000 1,750
20L ½ mile 2,500 1,000 1,750
13 1 mile 1,700 500 1,010
31 ¾ mile 1,700 1,000 1,510 Notes:
Blue: complies with visibility minimums lower than ¾ mile
Orange: complies with visibility minimums NOT lower than ¾ mile
Green: complies with visibility minimums NOT lower than 1 mile
The departure RPZs have the same dimensions regardless of visibility minimums. All departure RPZs at
BNA are 1,700 feet in length, 500 feet in inner width, and 1,010 feet in outer width. Departure RPZs
start 200 feet from the runway end, and approach RPZs start 200 feet from the runway threshold.
Except for Runways 13 and 31 which have displaced thresholds, all other departure RPZs start at the
same location as the approach RPZs. Given that approach RPZs are larger than (or of equal size with)
departure RPZs, all the departure RPZs fall completely within the approach RPZs at BNA, with the
exception of Runways 13 and 31.
It is important to note that the Runway 31 departure RPZ, which is located before the approach end of
Runway 13, is not located 200 feet from the runway end; instead it was displaced towards the
southeast by 383 feet so that the Interstate AC Service buildings do not fall within this RPZ, as
illustrated on Figure 4-9. Such displacement of the departure RPZ resulted in a reduction in the
Runway 31 Takeoff Run Available (TORA), which will be discussed in more detail in a subsequent
section.

BNA Airport Master Plan Update
Chapter 4 – Facility Requirements - DRAFT
Page | 28
Figure 4-9. Displaced Runway 31 Departure RPZ
Table 4-17 summarizes incompatible objects and land uses within the RPZs of runways at BNA.
Table 4-17. Incompatible Objects and Land Uses within RPZs
RPZ Object Clearance
2L Davidson County Building, parking lot, light pole;
Murfreesboro Pike & fence, light poles;
20R I-40 & fence & poles;
One small off-airport building;
2C
Knight Valley Dr., fence, light poles;
Substation?
Off-airport properties;
20C Runway 13-31 and associated taxiways
2R
Donelson Pike, fence, light poles;
Knapp Blvd;
A corner of the Employee Lot
20L I-40, fence, light poles
13 I-40 interchange with Briley Pkwy, fence, light poles;
31 Donelson Pike, fence, light poles (but lower than the runway);
Runway 2R-20R and associated taxiways Data Source:
All man-made and natural obstacles data are from GIS shapefiles provided by the MNAA.

BNA Airport Master Plan Update
Chapter 4 – Facility Requirements - DRAFT
Page | 29
Declared Distances
Table 4-18 shows the declared distances for each runway end at BNA, based on BNA’s Form 5010-1
(Airport Master Record). The declared distances for Runways 2L-20R, 2C-20C, and 2R-20L are correct;
however the declared distances for Runway 13-31 do not correctly reflect the displaced thresholds
that were implemented to meet RSA and ROFA standards, as well as the displaced Runway 31
departure RPZ. These records should be corrected based on the proposed changes in Table 4-18.
Table 4-18. Declared Distances
Existing Conditions
1 Required Changes
2
2L/20R 2C/20C 2R/20L 13/31 13/31
LENGTH 7,702' 8,001' 8,001' 11,030' 11,030
Displaced
Threshold N.A. N.A. N.A. 801’/741’ 801’/741’
Takeoff Run
Available
(TORA)
7,702'/7,702' 8,001'/8,001' 8,000'/8,000' 10,288'/10,288' 11,030/10,647
Takeoff
Distance
Available
(TODA)
7,702'/7,702' 8,001'/8,001' 8,000'/8,000' 11,029'/11,029' 11,030/11,030
Accelerate-
Stop
Distance
Available
(ASDA)
7,702'/7,702' 7,601'/8,001' 8,000'/8,000' 10,288'/10,288' 11,206’/10,228’
Landing
Distance
Available
(LDA)
7,702'/7,702' 7,601'/8,001' 8,000'/8,000' 9,487'/9,487' 9,405’/9,487’
Sources: 1. Form 5010-1, Airport Master Record 2. Calculated based on the RSA, ROFA, and RPZ displacements.
4.2.4. Taxiway/Taxilane Design Standards & Requirements
The design standards for taxiways and taxilanes have evolved. Previous standards were based only on
the Airplane Design Group (ADG) associated with runway design dimensions. More recently, the FAA
established Taxiway Design Groups (TDG) to take into account the dimensions of Main Gear Width
(MGW) and the Cockpit to Main Gear Distance (CMG) of specific aircraft. Considering that the height
above the pavement of large aircraft cockpits can result in taxiway centerline tracking challenges,
taxiway and taxilane design now considers the operating characteristics of aircraft maneuvering on the
pavement to track more closely with “cockpit over centerline” rather than pilots using “judgmental
oversteering”.

BNA Airport Master Plan Update
Chapter 4 – Facility Requirements - DRAFT
Page | 30
The key taxiway design criteria evaluated include:
Taxiway Safety Areas (TSAs)
Taxiway Object Free Areas (TOFAs)
Taxiway Shoulders
Taxiway Fillets and Intersection Geometry
Taxiway “Hot Spots”
Table 4-19 presents the dimensional requirements for taxiways and taxilanes for Group IV and Group
V aircraft. The width and separation requirements for ADG-V taxiways are higher than those for ADG-
IV taxiways.
Table 4-19. Taxiway Object Clearing Standards
Taxiway Design ADG IV ADG V
Taxiway Safety Area 171 FT 214 FT
Taxiway Object Free Area 259 FT 320 FT
Taxilane Object Free Area 225 FT 276 FT
Source: FAA Advisory Circular 150/5300-13A
4.2.4.1. Taxiway Safety Area (TSA) and Taxiway Object Free Area (TOFA)
TSA and TOFA are centered on the taxiway/taxilane centerlines. Their widths correspond to
their respective ADG and are summarized in Table 4-19. The function of TSAs and TOFAs is to
allow enough separation and clearance for aircraft to navigate the airfield safely by providing
adequate wingtip clearances.
The TSA must be cleared, graded, and drained properly per requirements in paragraph 404(d)
of AC 150/5300-13A. TSAs must be free of objects, except those that need to be located
within TSAs due to their function. The TOFA is wider than TSA, and the TOFA clearing
standards prohibit vehicle service roads, parked aircraft, and other objects except for those
that must be located in the OFA for air navigation or aircraft ground maneuvering purposes.
While the TSAs at BNA are clear of objects, there are objects that fall within the ADG-V
taxiway or taxilane OFAs. Figure 4-10 shows the objects that are not allowed but fall within
the 320-feet-wide ADG-V TOFA. Possible mitigation includes (1) removing/relocating the
objects to outside of the TOFA, (2) limiting taxiway/taxilane design to ADG-IV aircraft at
locations where objects cannot be cleared, or (3) requesting a modification of standards from
the FAA.

BNA Airport Master Plan Update
Chapter 4 – Facility Requirements - DRAFT
Page | 31
Figure 4-10. Obstacles in TOFA
For instance, Donelson Pike and the airport fence along it falls
within the ADG-V TOFA of Taxiway H, as shown on Figure 4-11.
Since relocating Donelson Pike to provide the room for the
perimeter fence is not a feasible/cost-effective alternative, but
Taxiway H must serve as an ADG-V taxiway to support the
increasing traffic in this ADG, the use of an aircraft-specific MOS
through this area should be considered, as recommended in the
technical memorandum, Runway 2R-20L Geometry Review Final
Report (October 2018).
Figure 4-11. Obstacles in
TOFA (Continued)

BNA Airport Master Plan Update
Chapter 4 – Facility Requirements - DRAFT
Page | 32
4.2.4.2. Taxiway Shoulders
Paved taxiway shoulders are required for taxiways serving ADG-IV and higher aircraft. Taxiway
shoulder widths are determined based on TDG. For TDG 5 and 6, which typically include ADG-V
aircraft, the required taxiway shoulder width is 30 feet.
A comprehensive analysis was performed throughout the BNA airfield to identify deficiencies in
shoulder widths based on TDG 5 and 6 requirements. Figure 4-12 shows (in orange) the existing
shoulders that meet the TDG 5 and 6 requirements, and also shows (in blue) the shoulders that require
widening to meet standards. Taxiways that require shoulder widening include Taxiways A, B, H, K, L, N,
S, R1, and R2.
4.2.4.3. Taxiway Fillets and Intersection Geometry
FAA AC 150/5300-13A specifies detailed dimensions for taxiway fillets and intersection geometries in
paragraph 406. Pavement fillets at taxiway intersections are designed for the entire selected TDG and
must accommodate all aircraft of lesser TDGs so that the main gear of the aircraft always remains on
pavement of sufficient strength. Tables 4-3 through 4-10 in AC 150/5300-13Aprovide standard fillet
dimensions for taxiway intersections with angles of 30, 45, 60 90, 120, 135, and 150 degrees. Such
standards also apply to taxiway-apron intersections.
Taxiway fillets at intersections at many airports across the country are designed based on older
standards, which typically require less pavement compared to the most current FAA design standards.
Similar to the taxiway shoulder analysis, a comprehensive evaluation was performed throughout the
BNA airfield to identify where additional pavement is needed to provide standard fillet geometries.
Figure 4-12 also shows the taxiway intersections that require fillet reconfiguration to meet standards,
such as the intersections along Taxiways K, H, S, and L.
4.2.4.4. Taxiway “Hot Spots”
“Hot spots” are areas where the geometry of a taxiway intersection has the potential to cause
confusion and/or reduced visibility for pilots, with the potential to affect safe ground movements.
There are three taxiway intersections that have been designated as “hot spots” at BNA, and they have
been appropriately identified on the published Airport Diagram to alert pilots. Hot spot 1 is located
on the west side of Runway 2L-20R at the intersection of Taxiways A, K, and R3; hot spot 2 is located
east of Runway 2L-20R at the intersection of Taxiways B, K, and T3; and hot spot 3 is located just to
the east of Runway 20C at the intersection of Taxiways S, S6, and S7. As of this writing, hot spots 1
and 3 are being addressed by efforts to fix their geometry. Hot spot 2 remains an outstanding design
standards deficiency, and will be reviewed for corrective options in the Alternatives chapter of this
Master Plan.

BNA Airport Master Plan Update
Chapter 4 – Facility Requirements - DRAFT
Page | 33
Figure 4-12. Taxiway Shoulders & Fillets Deficiencies

BNA Airport Master Plan Update
Chapter 4 – Facility Requirements - DRAFT
Page | 34
4.2.5. Airfield Separation Standards
Since the design aircraft for this Master Plan is determined to be D-V, it is crucial to evaluate whether
the required separations from runways and taxiways throughout the airfield are met based on D-V
design standards. Several areas of the BNA airfield were initially designed to accommodate ADG-III or
ADG-IV standards, which require smaller separation than those under D-V standards.
Table 4-20 summarizes the D-IV and D-V runway separation standards, in comparison with existing
conditions of all four runways at BNA. The key findings are:
- The parallel runway separation is adequate for simultaneous VFR operations between Runways
2L-20R and 2C-20C. The parallel runway separation is adequate for simultaneous IFR
operations between Runways 2L-20R and 2R-20L, and between Runways 2C-20C and 2R-20L;
- Several holding positions on taxiways intersecting Runways 2C-20C and 13-31 should be
relocated further from the runway centerlines;
- Runways 2L and 2R have approach visibility minimums lower-than ½ statute mile, and thus
their centerlines must be at least 500 feet from parallel taxiway centerlines. However, the
Taxiway A centerline is only 400 feet from the Runway 2L centerline, and the Taxiway H
centerline is only 400 feet from the Runway 2R centerline; and,
- The separations between each of the four runway centerlines and their parallel
taxiways/taxilanes and to their aircraft parking areas are adequate.
Table 4-21 summarizes the D-IV and D-V taxiway/taxilane separation standards, in comparison with
the existing conditions of all major taxiways and taxilanes at BNA. The key findings are:
- Separation between Taxiways B and M, Taxiways T1 and T2, and Taxiways L and J do not
comply with the ADG-V requirement;
- Some objects fall within 160 feet of the centerlines of Taxiways T4 and H, which is less than
adequate for ADG-V standards;
- The dual parallel taxilanes at the Concourse A apron and Concourse C apron have inadequate
separation for ADG-V standards; and,
- Objects (buildings, fences, roads) fall within 112.5 feet of the centerlines of all major taxilanes
(U, U3, Concourses A, B, and C), which is less than ADG-V standards.
When feasible, sufficient separation should be provided in these identified areas. However, some
areas, such as Taxilanes U and U3, and Concourse C, are intended to mainly serve ADG-III traffic. For
these areas, as long as the major aircraft served remain ADG-III, it is not necessary to increase
separation to ADG-V standards.

BNA Airport Master Plan Update
Chapter 4 – Facility Requirements - DRAFT
Page | 35
Table 4-20. Runway Separation
Separation D-IV D-V 2L-20R 2C-20C 2R-20L 13-31
Runway
Separation
Parallel
Runway
Centerline
700’ for VFR;
3,000’ for IFR
Approaches;
2,500’ for IFR
Departures
1,200’ for VFR;
3,000’ for IFR
Approaches;
2,300’ for IFR
Departures
1,200’ from
2C-20C
5,855’ from
2R-20L
1,200’ from
2L-20R
4,655’ from
2R-20L
4,655’ from
2C-20C
5,855’ from
2L-20R
N/A
Holding
Position 256’ 256’
All above
256’
Holding
positions
with <256’
separation:
Twy N, Twy
S3, Twy S5
All above
256’
Holding
positions
with <256’
separation:
Twy L
entrance to
Rwy 13, Twy
L1
Parallel
Twy/Txl
Centerline
400’ for
visibility
minimums NO
LESS THAN ½
statute mile;
500’ for
visibility
minimums
LESS THAN ½
statute mile
400’ for
visibility
minimums NO
LESS THAN ½
statute mile;
500’ for
visibility
minimums
LESS THAN ½
statute mile
Taxiway A
is at 400’
from
Runway 2L
(visibility
minimum
at 600’)
All at or
above 400’
Taxiway H
is at 400’
from
Runway 2R
(visibility
minimum
at 600’
All at or above
400’
Aircraft
Parking Area 500 500
All above
500’
All above
500’
All above
500’ All above 500’
Notes: a. Red text denotes insufficiency based on both ADG-IV and ADG-V standards

BNA Airport Master Plan Update
Chapter 4 – Facility Requirements - DRAFT
Page | 36
Table 4-21. Taxiway/Taxilane Separation
Taxiway
Separation
Taxiway Centerline to
Parallel
Taxiway/Taxilane
Centerline
Taxiway Centerline to
Fixed or Moveable
Objecta
Taxilane Centerline to
Parallel Taxilane
Centerline
Taxilane Centerline to
Fixed or Moveable
Object
D-IV 215’ 129.5’ 198’ 112.5’
D-V 267’ 160’ 245’ 138’
Taxiway A
340’ from south cargo
apron taxilane;
267’ from north cargo
apron taxilane
Above 160’ N/A N/A
Taxiway B 225’ from Twy M Above 160’ N/A N/A
Taxiway S 350’ from Twy T4 Above 160’ N/A N/A
Taxiway S7 215’ from Twy S6 Above 160’ N/A N/A
Taxiway T4 350’ from Twy S
155’ from fence at
Murfreesboro Pk
Tunnel;
153’ from fence
around Building 4203
N/A N/A
Taxiway H N/A 150’ from fence along
Donelson Pk N/A N/A
Taxiway K 365’ from MRO apron
taxilane Above 160’ N/A N/A
Taxiway L 251’ from Twy J Above 160’ N/A N/A
Taxiway J More than 370’ from
terminal apron taxilane Above 160’ N/A N/A
Taxiway T1 225’ from Twy T2 Above 160’ N/A N/A
Taxilane U N/A N/A N/A 108’ from Building
4263
Taxilane U3 N/A N/A N/A
108’ from Building
4265;
105’ from fence
Concourse C
Apron
Taxilanes
N/A N/A 140’ ~ 198’ between
the dual taxilanes
81’ from vehicle
service road
Concourse B
Apron
Taxilanes
N/A N/A N/A 112.5’ from vehicle
service road
Concourse A
Apron
Taxilanes
N/A N/A 225’ between the dual
taxilanes
112.5’ from vehicle
service road
Notes: b. Orange text denotes insufficiency based on ADG-V standards c. Red text denotes insufficiency based on both ADG-IV and ADG-V standards

BNA Airport Master Plan Update
Chapter 4 – Facility Requirements - DRAFT
Page | 37
4.2.6. Airfield Marking and Lighting
4.2.6.1. Airfield Markings
Part 139-certified airports, such as BNA, must provide and maintain, at a minimum, the following
markings:
Runway markings meeting the specifications for takeoff and landing minimums of each runway
Taxiway centerlines
Taxiway edge markings, as appropriate
Holding position markings
ILS critical area markings
Airport pavement markings at BNA are in accordance with FAA AC 150/5340-1L, Standards for Airport
Marking. The markings are in good condition and refreshed as needed.
4.2.6.2. Airfield Lighting
Runway Lighting
Table 4-22 outlines the available runway lighting at each runway to provide clarity to pilots. The
Runway Centerline Lighting Systems (RCLS) and the Touchdown Zone (TDZ) lights are required on
runways with Category II and III approaches, and Category I approaches where visibility minimums are
less than 2,400 feet RVR.
Table 4-22. Available Runway Lighting
Runway Approach
Lights
Centerline
Lights REIL
2L ALSF 2 YES NO
20R MALSF YES NO
2C MALSR NO YES
20C NO NO YES
2R ALSF 2 YES NO
20L MALSR YES NO
13 NO NO YES
31 NO NO YES
Taxiway Lighting
All BNA taxiways have edge lights. Like runway edge lighting, taxiway edge lighting delineates the
taxiway’s edge and provides guidance to pilots in darkness or restricted visibility conditions. These
lights are blue, set at 200 foot intervals along the taxiway edges. Like the runway edge lights, they are
classified according to their intensity and brightness. BNA’s taxiways are equipped with Medium-

BNA Airport Master Plan Update
Chapter 4 – Facility Requirements - DRAFT
Page | 38
Intensity Taxiway Lighting (MITL) systems. In addition to taxiway edge lighting, Taxiway H and
portions of Taxiways J and L (between Taxiways T6 and H) have centerline lighting.
4.2.7. Current Modifications of Standards (MOS)
Table 4-23 lists the current FAA-approved Modifications of Standards (MOS) for BNA’s airfield
components, which were in part based on the prior Master Plan evaluation of Group IV standards
(which included the B757as the “design aircraft”). The airfield design standards review in this Master
Plan evaluates the ability of the current airfield to meet Group V design standards associated with
aircraft such as the B787.
Table 4-23. Current Approved Modifications of Standards
No. Description FAA Standard Mitigation Approval Date
1 Gradient of proposed Taxiway T-4
extension 1.5% gradient
Taxiway gradients will
be addressed as
pavement is overlaid or
strengthened
May-93
2 Localizer siting criteria, Runway 2C
Only objects
fixed by
function may be
located within
an RSA
FAA to install frangible
localizer antenna and
declare "fixed by
function"
Dec-93
3 Runway 2C-20C, 13-31, and 2R-20L
shoulder widths
35-foot paved
or stabilized
shoulders
No modification, but
runway shoulders to be
addressed with future
projects
Jul-04
4 Taxiway A, A-1, K2, l shoulder
widths / C-1 fillet dimensions
35-foot paved
or stabilized
shoulders
Taxiway shoulders to
be addressed in future
projects
Jul-04
5 Taxiway A, B, l, R-4 Taxiway Safety
Area transverse gradients
1.5% to 3%
gradient
Taxiway Safety Area
transverse gradients
will be addressed as
pavement is overlaid or
strengthened
Jul-04
6
Runway Visibility Zone associated
with intersection of extended
Runway 2L and Runway 13
No objects
permitted within
RVZ
Modification was
granted for future RVZ Oct-04
7
Taxiway T-4 longitudinal grades
between Taxiways Kilo and Runway
13-31
0.015 None Jun-09
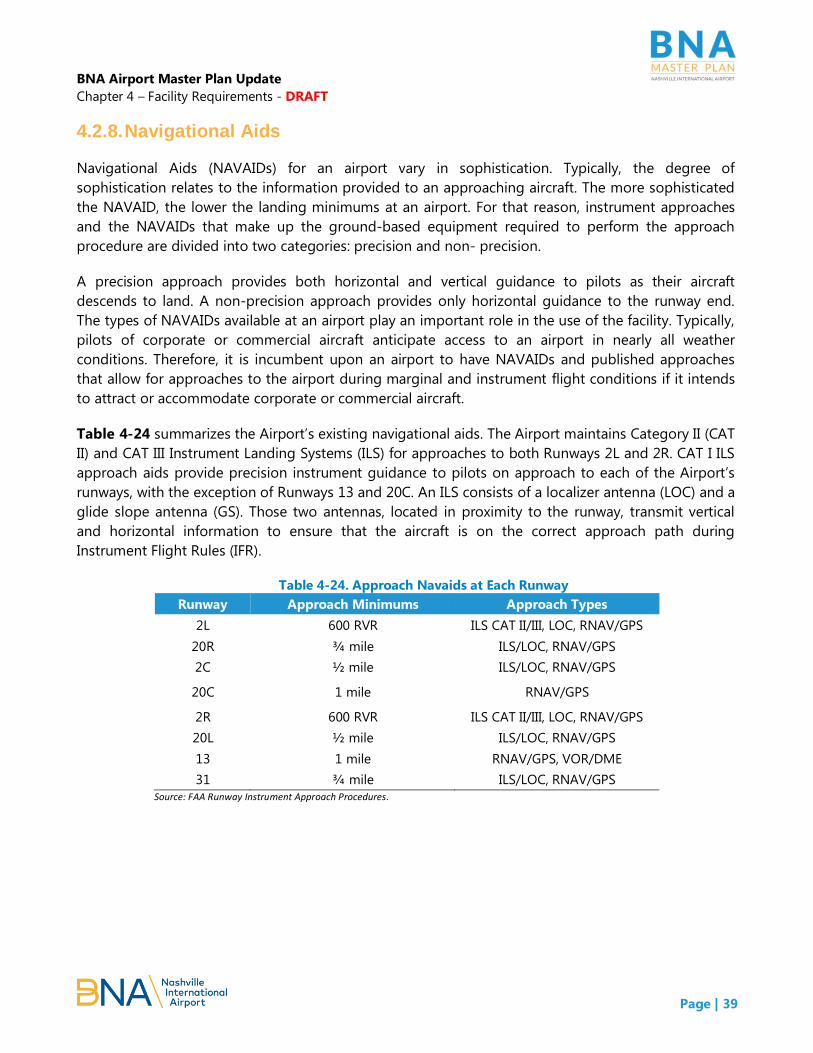
BNA Airport Master Plan Update
Chapter 4 – Facility Requirements - DRAFT
Page | 39
4.2.8. Navigational Aids
Navigational Aids (NAVAIDs) for an airport vary in sophistication. Typically, the degree of
sophistication relates to the information provided to an approaching aircraft. The more sophisticated
the NAVAID, the lower the landing minimums at an airport. For that reason, instrument approaches
and the NAVAIDs that make up the ground‐based equipment required to perform the approach
procedure are divided into two categories: precision and non‐ precision.
A precision approach provides both horizontal and vertical guidance to pilots as their aircraft
descends to land. A non‐precision approach provides only horizontal guidance to the runway end.
The types of NAVAIDs available at an airport play an important role in the use of the facility. Typically,
pilots of corporate or commercial aircraft anticipate access to an airport in nearly all weather
conditions. Therefore, it is incumbent upon an airport to have NAVAIDs and published approaches
that allow for approaches to the airport during marginal and instrument flight conditions if it intends
to attract or accommodate corporate or commercial aircraft.
Table 4-24 summarizes the Airport’s existing navigational aids. The Airport maintains Category II (CAT
II) and CAT III Instrument Landing Systems (ILS) for approaches to both Runways 2L and 2R. CAT I ILS
approach aids provide precision instrument guidance to pilots on approach to each of the Airport’s
runways, with the exception of Runways 13 and 20C. An ILS consists of a localizer antenna (LOC) and a
glide slope antenna (GS). Those two antennas, located in proximity to the runway, transmit vertical
and horizontal information to ensure that the aircraft is on the correct approach path during
Instrument Flight Rules (IFR).
Table 4-24. Approach Navaids at Each Runway
Runway Approach Minimums Approach Types
2L 600 RVR ILS CAT II/III, LOC, RNAV/GPS
20R ¾ mile ILS/LOC, RNAV/GPS
2C ½ mile ILS/LOC, RNAV/GPS
20C 1 mile RNAV/GPS
2R 600 RVR ILS CAT II/III, LOC, RNAV/GPS
20L ½ mile ILS/LOC, RNAV/GPS
13 1 mile RNAV/GPS, VOR/DME
31 ¾ mile ILS/LOC, RNAV/GPS
Source: FAA Runway Instrument Approach Procedures.

BNA Airport Master Plan Update
Chapter 4 – Facility Requirements - DRAFT
Page | 40
4.2.9. Airfield Facility Requirements Summary
Airfield Capacity:
o BNA’s Annual Service Volume was calculated to be 495,300 operations. The annual operations
in 2017 were at 42% of ASV. BNA’s forecast annual operations will reach above 60% ASV in
2037, which is the FAA’s suggested trigger for airport sponsors to begin planning for capacity
improvements.
Runway Length Requirements:
o A takeoff runway length of approximately 11,500 – 12,000 feet is needed to serve most
potential international markets from Nashville, assuming the representative aircraft types
evaluated are operating at a 100% payload at maximum takeoff weight (MTOW).
Runway Design Standards:
o In anticipation of increasing operations of D-V aircraft at BNA, various elements of the airfield
need to be upgraded to meet the FAA D-V design standards, including runway blast pads,
runway shoulders, taxiway shoulders, and taxiway intersection fillets.
o There are objects located within several object clearing surfaces, including ROFAs, TOFAs, and
RPZs. It is recommended to clear the objects from these surfaces.
o Runway and taxiway separation standards for D-V are not met at several locations in the
airfield and should be addressed through airfield reconfiguration, modification of standards, or
maintaining Group IV standards for Group V-deficient areas.
o The Runway 13-31 declared distances as published on 5010 Airport Master Records do not
accurately reflect the non-standard object clearing surfaces at BNA and should be corrected.
Marking and Lighting:
o The BNA markings meet the FAA design standards and are in good condition.
o The BNA runway and taxiway lighting meet the design standards.

BNA Airport Master Plan Update
Chapter 4 – Facility Requirements - DRAFT
Page | 41
4.3. Passenger Terminal Capacity and Requirements
The existing terminal building (Figure 4-13) is undergoing major improvement with the
implementation of the $1.2 billion BNA Vision program. Significant physical changes are being made
to the existing terminal building, including terminal lobby expansion, constructing a new and
expanded passenger security screening checkpoint, expanding the number baggage claim devices,
and adding a new International Arrivals Facility with six international (“T”) gates between Concourses B
and C; constructing a new Concourse D with six domestic gates with new dining and retail space;
constructing a new central utility plant beyond the end of new Concourse D; and demolishing the
existing Interim International Arrivals Building at the end of Concourse A.
This Section focuses on future facility requirements for the passenger terminal building once the BNA
Vision program is complete, currently projected to be 2023 (Figure 4-14). The Section also includes a
capacity analysis of BNA Vision facilities expected to be in place in 2023. Industry guidelines were used
to assess the capacity of different functional areas in the terminal, and facility requirements and
terminal space needs for each functional area were evaluated to accommodate projected demand for
the planning periods presented in BNA Master Plan Chapter 3, Aviation Demand Forecasts.
Figure 4-13. Existing Terminal Building

BNA Airport Master Plan Update
Chapter 4 – Facility Requirements - DRAFT
Page | 42
Figure 4-14. BNA Vision Projects
Source: BNA Vision.
The terminal facility is categorized into different functional areas for the analysis, as listed below.
Gates, Parking Positions, and Remain Overnight (RON) Parking Positions: facilities dedicated to
aircraft parking and passenger loading and unloading between the terminal building and aircraft.
Check-in/Ticketing: The check-in/ticketing facilities are found in two areas - the ticketing hall and
curbside check-in.
o The ticketing hall: consists of full-service and bag drop check-in counters, area for self-
servicing kiosks, and space for baggage conveyers, passenger queuing, and circulation space.
o Curbside Check-in: The exterior area adjacent to the departures level drop-off curb where
passengers can check bags before entering the building. Curbside check-in includes queue
area, space for counters, and conveyors to transport bags to the baggage screening area and
ultimately, the airline’s outbound baggage makeup area.
Security Screening Checkpoint (SSCP): The SSCP continues to evolve with the addition of new
programs intended to increase passenger throughput rates. The number of required SSCP lanes will
always be determined by peak period demand; however, increased throughput rates may also require
a slightly larger footprint for each screening lane.
Checked Baggage Inspection System (CBIS): CBIS typically refers to the specific systems and
machines used in screening bags for explosives detection.
Baggage Makeup Area (BMU): The BMU area includes tug and cart circulation, cart staging, and the
bag makeup devices and excess bag storage area. Cart staging and carousel capacity are the primary
determining factor for this functional area and has been analyzed based on the peak bag demand per
flight and standard number of carts used to make up a flight.

BNA Airport Master Plan Update
Chapter 4 – Facility Requirements - DRAFT
Page | 43
Baggage Claim (BC): BC area is the final functional area for arriving passengers before exiting the
terminal building and proceeding toward the curb/ground transportation or parking. The BC area
consists of general circulation, waiting area adjacent to the baggage claim device, active bag retrieval
area, and the baggage claim devices.
International Arrivals Facilities - Federal Inspection Services (FIS): FIS facilities are required at all
airports with international flights, except for most flights from Canada and a limited number of other
airports with U.S. pre-clearance facilities and processes. Passengers arriving on pre-cleared
international flights are treated the same as domestic arrivals.
Holdrooms: Holdrooms provide a waiting area for passengers prior to boarding an aircraft and
include areas for an airline agent customer service podium, boarding queues, circulation, and other
amenities.
Concessions: Concessions space planning is important to the overall terminal program because of its
impact on airport revenues as well as passenger convenience/satisfaction. For master planning
purposes, the primary goal is to identify existing and potential issues and recommend general
programming needs based on industry guidelines.
Restrooms: The unique considerations of airport terminal restrooms include continuous availability
and operation, changing passenger demographics, evolving customer expectations, and greater space
requirements to accommodate luggage and operational/maintenance needs.
Support Functions: in addition to the major functions specified above, areas for several support
functions are estimated in this section, including airport support (MNAA operations, maintenance,
office space), airline support, mechanical/electrical/communications space, and other miscellaneous
space needs.
Subsequent sections will focus on each area by first estimating the projected capacity of the terminal
facilities at the time of BNA Vision completion, and then evaluating whether further improvements will
be needed to accommodate future demand in each of these functional areas throughout the master
planning period.
4.3.1. Methods, Assumptions, and Performance Specifications
Terminal facility capacity analysis and requirements were developed based on a series of assumptions
and parameters. Many assumptions were developed during passenger surveys conducted at BNA in
May 2018 and data collected specific to BNA airport. Other parameters were determined by
identifying similarities with comparable airports and using terminal facility planning best practices and
industry guidelines.
Facility requirements can vary dependent on the level of detail of planning assumptions. The key
assumptions used in this analysis were derived from the following major sources:
Several BNA-specific passenger processing parameters and passenger behaviors were
determined based on on-site data collection surveys conducted in May 2018 and information
provided in BNA Vision documents;

BNA Airport Master Plan Update
Chapter 4 – Facility Requirements - DRAFT
Page | 44
Time and space standards as defined in the International Air Transport Association (IATA)’s
Airport Development Reference Manual (ADRM) as well as the Airport Cooperative Research
Program (ACRP) Report 25, Airport Passenger Terminal Planning and Design Guidebook, were
both used as criteria and metrics;
All assumptions were reviewed against the BNA Vision program to adjust for changing
conditions and evolving stakeholder preferences;
Transportation Security Administration (TSA) Checkpoint Requirements and Planning Guide
(CRPG);
Customs and Border Protection (CBP) Airport Technical Design Standards Manual (ATDS); and,
Airport Cooperative Research Program (ACRP) Report 25 “Airport Passenger Terminal Planning
and Design Guidebook.”
According to guidelines provided in the IATA ADRM, level of service (LOS) of many terminal facilities is
dictated by two important variables: space and time – specifically queuing space and waiting time.
Figure 4-15 shows the LOS space-time
diagram from IATA. The X-axis defines the
amount of space available per occupant,
whereas the Y axis denotes the maximum
waiting time for passengers in queue.
When both space and time fall within the
optimum range, the facility is offering an
acceptable LOS. Otherwise the facility
could be either underprovided, or over-
designed and require adjustments in
either the time or space aspect. When
planning for new or expanded facilities,
typically the peak hour of the average day
in the peak month (ADPM) is used for
demand and the optimum LOS should be
targeted for initial sizing. However,
sometimes an airport sponsor might
choose to accept facilities that operate at
a lower LOS for short periods of time during very high demand peaks in order to be responsive to
local parameters, capital/operational costs, and user needs. Considering the recent, rapid growth at
BNA, this analysis identifies facilities that will provide the optimum LOS where possible, while
accounting for flexibility to adjust for BNA-specific operations.
Table 4-25. IATA Level of Service Guidelinesshows the space and time LOS standards from IATA for
each functional passenger processing area. This capacity and requirements analysis uses the upper
bound numbers in the optimum ranges; that is, assumes higher waiting times (slower processing
speeds) and larger square feet per passenger parameters.
Figure 4-15. IATA LOS Space-Time Diagram
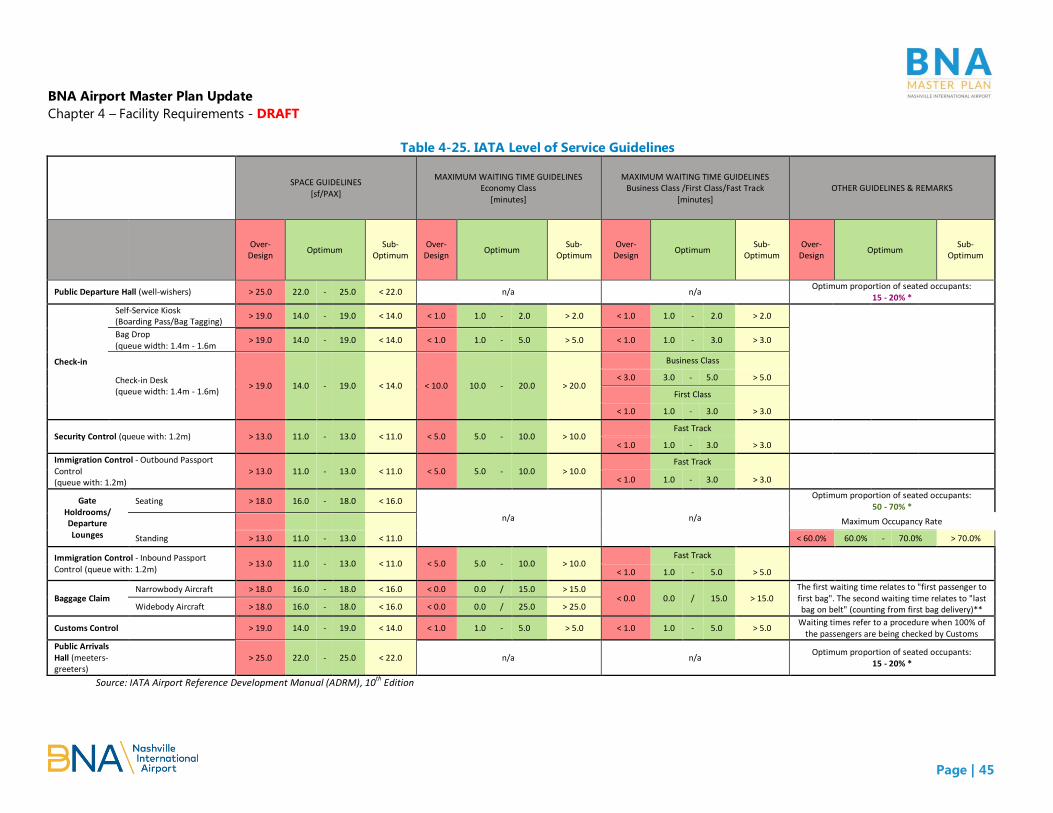
BNA Airport Master Plan Update
Chapter 4 – Facility Requirements - DRAFT
Page | 45
Table 4-25. IATA Level of Service Guidelines
SPACE GUIDELINES
[sf/PAX]
MAXIMUM WAITING TIME GUIDELINES Economy Class
[minutes]
MAXIMUM WAITING TIME GUIDELINES Business Class /First Class/Fast Track
[minutes] OTHER GUIDELINES & REMARKS
Over-
Design Optimum
Sub-Optimum
Over-Design
Optimum Sub-
Optimum Over-
Design Optimum
Sub-Optimum
Over-Design
Optimum Sub-
Optimum
Public Departure Hall (well-wishers) > 25.0 22.0 - 25.0 < 22.0 n/a n/a Optimum proportion of seated occupants:
15 - 20% *
Check-in
Self-Service Kiosk (Boarding Pass/Bag Tagging)
> 19.0 14.0 - 19.0 < 14.0 < 1.0 1.0 - 2.0 > 2.0 < 1.0 1.0 - 2.0 > 2.0
Bag Drop (queue width: 1.4m - 1.6m
> 19.0 14.0 - 19.0 < 14.0 < 1.0 1.0 - 5.0 > 5.0 < 1.0 1.0 - 3.0 > 3.0
Check-in Desk (queue width: 1.4m - 1.6m)
> 19.0 14.0 - 19.0 < 14.0 < 10.0 10.0 - 20.0 > 20.0
Business Class
< 3.0 3.0 - 5.0 > 5.0
First Class
< 1.0 1.0 - 3.0 > 3.0
Security Control (queue with: 1.2m) > 13.0 11.0 - 13.0 < 11.0 < 5.0 5.0 - 10.0 > 10.0 Fast Track
< 1.0 1.0 - 3.0 > 3.0
Immigration Control - Outbound Passport Control (queue with: 1.2m)
> 13.0 11.0 - 13.0 < 11.0 < 5.0 5.0 - 10.0 > 10.0 Fast Track
< 1.0 1.0 - 3.0 > 3.0
Gate Holdrooms/ Departure Lounges
Seating > 18.0 16.0 - 18.0 < 16.0
n/a n/a
Optimum proportion of seated occupants: 50 - 70% *
Maximum Occupancy Rate
Standing > 13.0 11.0 - 13.0 < 11.0 < 60.0% 60.0% - 70.0% > 70.0%
Immigration Control - Inbound Passport Control (queue with: 1.2m)
> 13.0 11.0 - 13.0 < 11.0 < 5.0 5.0 - 10.0 > 10.0 Fast Track
< 1.0 1.0 - 5.0 > 5.0
Baggage Claim Narrowbody Aircraft > 18.0 16.0 - 18.0 < 16.0 < 0.0 0.0 / 15.0 > 15.0
< 0.0 0.0 / 15.0 > 15.0 The first waiting time relates to "first passenger to first bag". The second waiting time relates to "last bag on belt" (counting from first bag delivery)** Widebody Aircraft > 18.0 16.0 - 18.0 < 16.0 < 0.0 0.0 / 25.0 > 25.0
Customs Control > 19.0 14.0 - 19.0 < 14.0 < 1.0 1.0 - 5.0 > 5.0 < 1.0 1.0 - 5.0 > 5.0 Waiting times refer to a procedure when 100% of
the passengers are being checked by Customs
Public Arrivals Hall (meeters-greeters)
> 25.0 22.0 - 25.0 < 22.0 n/a n/a Optimum proportion of seated occupants:
15 - 20% *
Source: IATA Airport Reference Development Manual (ADRM), 10th
Edition

BNA Airport Master Plan Update
Chapter 4 – Facility Requirements - DRAFT
Page | 46
Future terminal requirements can, in part, be determined by identifying the number of peak hour
passengers projected to flow through the terminal. Peak hour passenger volumes are derived from the
aviation demand forecast, which also serves as the basis for development of design day flight
schedules (DDFS) for future years. Peak hour enplanement and deplanement demand was
approximated through a rolling 60-minute flow of arriving and departing passengers across the
design day. Table 4-26 provides a summary of peak hour enplanements and deplanements
throughout the planning horizon.
Table 4-26. Peak Hour Enplanements and Deplanements
Year Peak Hour Enplanements Peak Hour Deplanements
2017 2,439 2,652
2022 3,118 3,391
2027 3,425 3,725
2032 3,752 4,080
2037 4,114 4,473 Source: Table 3-43, BNA Master Plan Update Chapter 3, Aviation Demand Forecasts.
Peak hour enplanements and deplanements include origin and destination (O&D) passengers as well
as connecting passengers. According to BNA Master Plan Update Section 3.4.2.2, Originating vs.
Connecting Passengers, this analysis assumes 12% connecting passengers, and 88% O&D passengers.
For the purpose of projecting terminal facility requirements, peak departure and peak arrival demand
profiles assume 100% O&D since the highest departure demand occurs early in the morning before
current and projected airline schedules foresee passengers connecting from one flight to another; and
the highest arrival demand occurs in the late evening when most passengers are ending their travel at
BNA.
Since passenger activity is not evenly distributed during the peak hour, but more typically follows a
curved distribution, the DDFS also helps with constructing a passenger show-up profile to understand
how many passengers are processed through each facility during the peak 30 minutes. This indicator
is referred to as the “peak 30 minute factor.” Typically, more than half of peak hour passengers would
show up during the peak-30 minutes, making the peak 30 minutes the real ‘pressure point” for
terminal facilities. BNA’s peak 30 minute factor is roughly 68%, which means that among all peak hour
passengers, 68% of them are processed during the peak 30 minutes. The peak 30 minute factor is a
key consideration when estimating facility requirements for terminal core processors such as check-in,
SSCP, and baggage claim.
4.3.2. Aircraft Gate Parking Positions and RON Parking
4.3.2.1. Contact Gate Requirements
Contact gate requirements for BNA were developed using the Design Day Flight Schedules (DDFSs)
created as part of the Master Plan Update. The assumptions used in determining gate requirements
included:

BNA Airport Master Plan Update
Chapter 4 – Facility Requirements - DRAFT
Page | 47
Continued BNA gate assignment/use parameters
Number of daily operations per gate limited to 8 or less per gate per airline
Factors regarding gate reduction due to adjacencies – wide body to narrow body gate use
Additional gates needed for use during construction phasing
Contact gate requirements for the planning horizons are shown in Table 4-27.
Table 4-27. Contact Gate Requirements
2022 2027 2032 2037
Dedicated gates
Dedicated gates
Dedicated gates
Dedicated gates
Sub-Total 48
51
53
54
Added gates to reduce daily operations per gate to a maximum of 8.0
4
1
1
1
Sub-Total 52
55
57
58
Added gates to address adjacency and construction phasing needs
Adjacency 2
2
2
2
Phasing 2
1
1
1
TOTAL 56
58
60
61
Source: TransSolutions and AECOM analysis.
While the design day flight schedules can be accommodated with a reduced numbers of gates, there
would be little to no gate availability and flexibility for the airport and airlines during periodic flight
delays or other-than-normal operations, such as temporary gate closures for construction. If the
number of daily operations (turns) per gate per day were limited to a lower number for operational
considerations, the gate requirements would increase and provide operational flexibility for the airport
and airlines to allow, for example, longer buffer times between flight arrivals and departures if needed.
In order to reduce the number of turns per gate per day to be more consistent with current and
anticipated future activity, one additional gate was added for each of the following airlines: American
(AA), Delta (DL), United (UA), and Southwest (WN).
For planning purposes, it was considered that during the peak gate demand, two wide body aircraft
may occupy four narrow body positions, reducing the gate availability by two gates. As such, two
gates were added to address this anticipated adjacency issue.
Finally, BNA will be in some stage of construction for many years as the BNA Vision plan is
implemented and future improvements recommended as part of this Master Plan Update occur.
During construction phasing, it is assumed that one to two gates would be needed as interim gates to

BNA Airport Master Plan Update
Chapter 4 – Facility Requirements - DRAFT
Page | 48
relocate airlines temporarily during construction. As a more detailed phasing analysis is done, it may
be determined that more construction phasing gates are required for relocated airlines.
Contact gate dimensional characteristics are determined by the planned fleet mix. For BNA, the
majority of operations are projected to be Airplane Design Group (ADG) III. The largest ADG-III
aircraft is the A321 NEO which has a 117.45-foot wingspan and fuselage length of 146 feet. Contact
stands should also include:
Wing clearance on both sides of the contact gate position can vary from 20- to 25-feet and
would be split between the two adjacent positions
Pushback tractor staging and maneuvering space forward of the aircraft nose, which can vary
from 30- to 40-feet
A buffer zone between the aircraft tail and a vehicle service road (VSR) or taxilane object free
area (OFA) of roughly 5- to 10-feet
The VSR can be located either adjacent to the concourse (referred to as a head-of-stand VSR)
or behind the aircraft tail; the VSR is typically a two-way drive approximately 20- to 25-feet
wide
Overall dimensions for an ADG-III contact gate position is 225-feet deep by approximately 145-feet
wide. It is suggested that a 25-foot wide VSR should be provided between every grouping of five
contact gates. Actual contact gate depth and width can vary based on site limitations and airline
requirements.
4.3.2.2. Remain Overnight (RON) Requirements
Near the end of the evening when airline arrivals continue beyond the number of available gates and
no departures are scheduled until the following day, these aircraft are considered RON aircraft at BNA.
RON demand is defined by the DDFS prepared for BNA. RON aircraft parking is a key component of
an airline’s operation to ensure that the right aircraft is located at the correct airport to begin daily
operations. Total RON parking consists of on-gate and off-gate aircraft parking positions. On-gate
RON positions use a contact gate that may include a passenger boarding bridge. Off-gate RON
positions are those that cannot be accommodated at a contact gate and must be parked remote to
the concourse gate area. The number of off-gate RON positions is the total RON demand minus the
number of contact gate aircraft parking positions.
Based on the DDFS created for the four planning horizons (2022, 2027, 2032, 2037), RON parking
position requirements were developed. RON parking is a fluid aspect of terminal apron requirements
and can vary based on the available gates to use for RON aircraft parking. Sometimes a gate used by
an airline needs to remain vacant overnight and cannot be used for RON by another airline due to
early morning scheduling of departures. Additionally, many airlines have preferential use agreements
for gates that limit the use of the gate by other airlines. Table 4-28 summarizes the off-gate RON
aircraft parking requirements for the PALs.
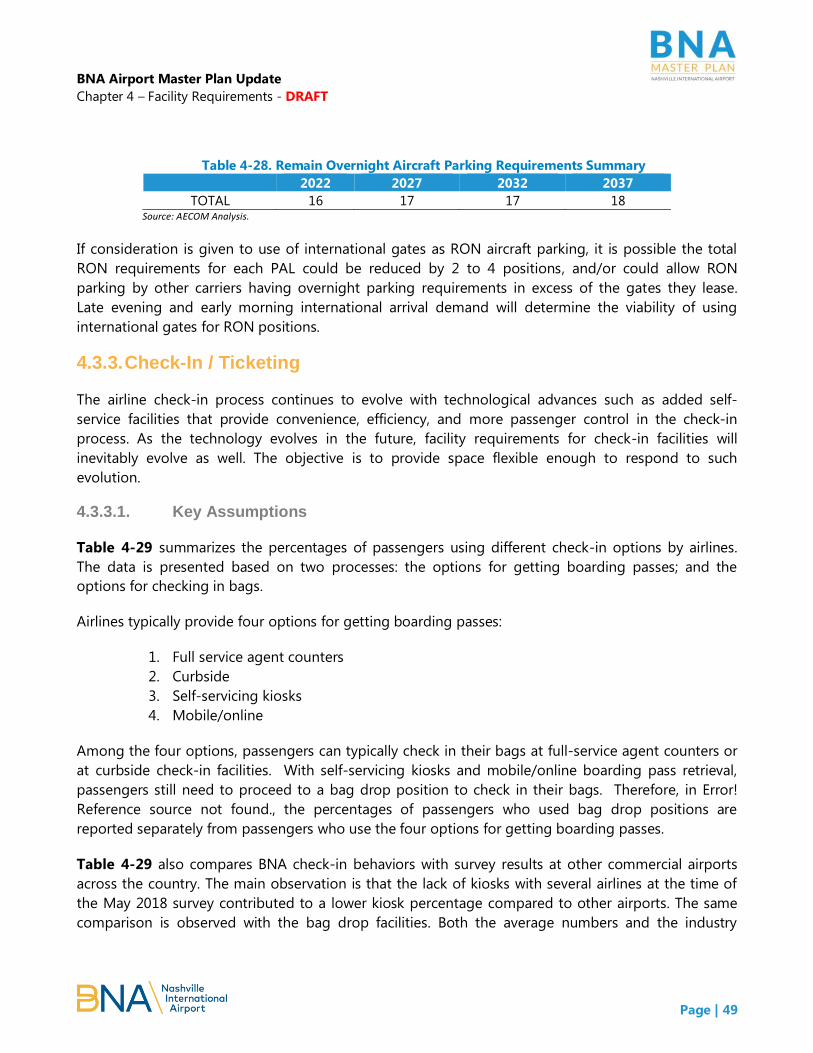
BNA Airport Master Plan Update
Chapter 4 – Facility Requirements - DRAFT
Page | 49
Table 4-28. Remain Overnight Aircraft Parking Requirements Summary
2022 2027 2032 2037
TOTAL 16 17 17 18 Source: AECOM Analysis.
If consideration is given to use of international gates as RON aircraft parking, it is possible the total
RON requirements for each PAL could be reduced by 2 to 4 positions, and/or could allow RON
parking by other carriers having overnight parking requirements in excess of the gates they lease.
Late evening and early morning international arrival demand will determine the viability of using
international gates for RON positions.
4.3.3. Check-In / Ticketing
The airline check-in process continues to evolve with technological advances such as added self-
service facilities that provide convenience, efficiency, and more passenger control in the check-in
process. As the technology evolves in the future, facility requirements for check-in facilities will
inevitably evolve as well. The objective is to provide space flexible enough to respond to such
evolution.
4.3.3.1. Key Assumptions
Table 4-29 summarizes the percentages of passengers using different check-in options by airlines.
The data is presented based on two processes: the options for getting boarding passes; and the
options for checking in bags.
Airlines typically provide four options for getting boarding passes:
1. Full service agent counters
2. Curbside
3. Self-servicing kiosks
4. Mobile/online
Among the four options, passengers can typically check in their bags at full-service agent counters or
at curbside check-in facilities. With self-servicing kiosks and mobile/online boarding pass retrieval,
passengers still need to proceed to a bag drop position to check in their bags. Therefore, in Error!
Reference source not found., the percentages of passengers who used bag drop positions are
reported separately from passengers who use the four options for getting boarding passes.
Table 4-29 also compares BNA check-in behaviors with survey results at other commercial airports
across the country. The main observation is that the lack of kiosks with several airlines at the time of
the May 2018 survey contributed to a lower kiosk percentage compared to other airports. The same
comparison is observed with the bag drop facilities. Both the average numbers and the industry
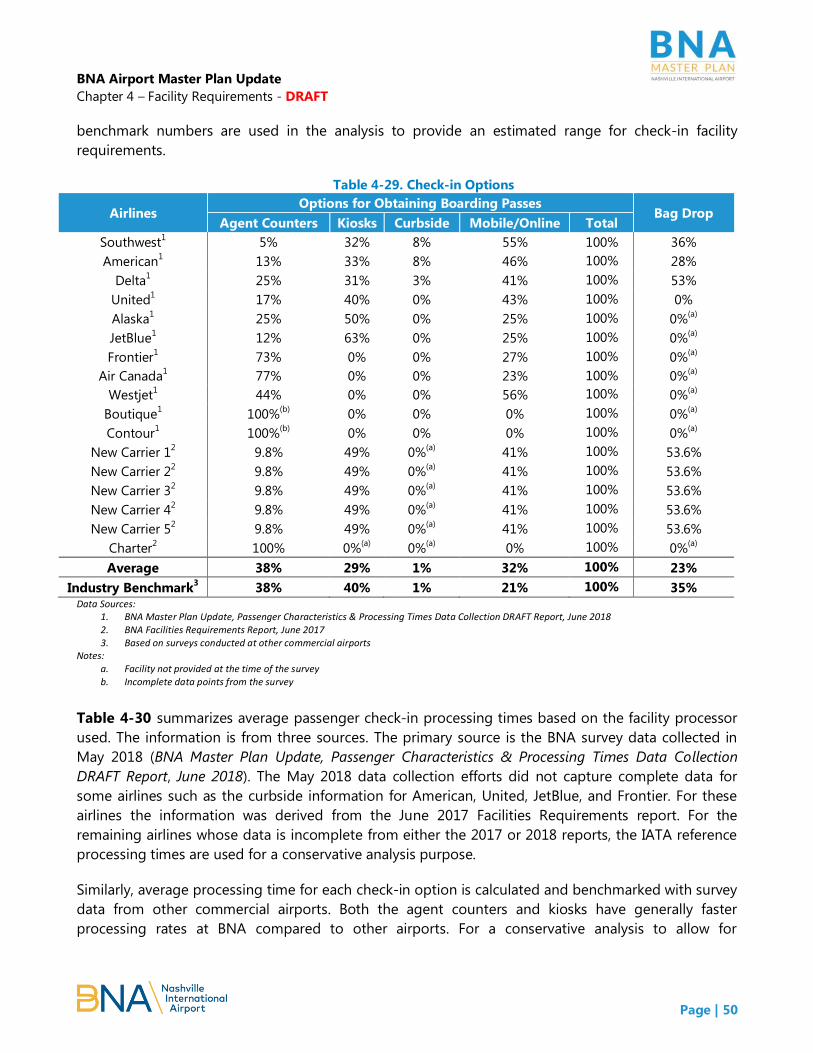
BNA Airport Master Plan Update
Chapter 4 – Facility Requirements - DRAFT
Page | 50
benchmark numbers are used in the analysis to provide an estimated range for check-in facility
requirements.
Table 4-29. Check-in Options
Airlines Options for Obtaining Boarding Passes
Bag Drop Agent Counters Kiosks Curbside Mobile/Online Total
Southwest1
5% 32% 8% 55% 100% 36%
American1 13% 33% 8% 46% 100% 28%
Delta1 25% 31% 3% 41% 100% 53%
United1 17% 40% 0% 43% 100% 0%
Alaska1 25% 50% 0% 25% 100% 0%
(a)
JetBlue1 12% 63% 0% 25% 100% 0%
(a)
Frontier1 73% 0% 0% 27% 100% 0%
(a)
Air Canada1 77% 0% 0% 23% 100% 0%
(a)
Westjet1 44% 0% 0% 56% 100% 0%
(a)
Boutique1 100%
(b) 0% 0% 0% 100% 0%
(a)
Contour1 100%
(b) 0% 0% 0% 100% 0%
(a)
New Carrier 12
9.8% 49% 0%(a)
41% 100% 53.6%
New Carrier 22 9.8% 49% 0%
(a) 41% 100% 53.6%
New Carrier 32 9.8% 49% 0%
(a) 41% 100% 53.6%
New Carrier 42 9.8% 49% 0%
(a) 41% 100% 53.6%
New Carrier 52 9.8% 49% 0%
(a) 41% 100% 53.6%
Charter2 100% 0%
(a) 0%
(a) 0% 100% 0%
(a)
Average 38% 29% 1% 32% 100% 23%
Industry Benchmark3
38% 40% 1% 21% 100% 35% Data Sources:
1. BNA Master Plan Update, Passenger Characteristics & Processing Times Data Collection DRAFT Report, June 2018 2. BNA Facilities Requirements Report, June 2017 3. Based on surveys conducted at other commercial airports
Notes: a. Facility not provided at the time of the survey b. Incomplete data points from the survey
Table 4-30 summarizes average passenger check-in processing times based on the facility processor
used. The information is from three sources. The primary source is the BNA survey data collected in
May 2018 (BNA Master Plan Update, Passenger Characteristics & Processing Times Data Collection
DRAFT Report, June 2018). The May 2018 data collection efforts did not capture complete data for
some airlines such as the curbside information for American, United, JetBlue, and Frontier. For these
airlines the information was derived from the June 2017 Facilities Requirements report. For the
remaining airlines whose data is incomplete from either the 2017 or 2018 reports, the IATA reference
processing times are used for a conservative analysis purpose.
Similarly, average processing time for each check-in option is calculated and benchmarked with survey
data from other commercial airports. Both the agent counters and kiosks have generally faster
processing rates at BNA compared to other airports. For a conservative analysis to allow for

BNA Airport Master Plan Update
Chapter 4 – Facility Requirements - DRAFT
Page | 51
operational flexibility, both the average processing time and industry benchmark are used in this
analysis to provide an estimated range for the facility requirements.
Table 4-30. Check-in Processing Times per Passenger (seconds)
Airlines Agent Counters
Kiosks Curbside Bag Drop Economy Premium
Southwest1 102 114 84 90 30
American1 2
228 264 228 164 36
Delta1 96 72 96 78 72
United1 2
125 108 126 125 42
Alaska3 140 150 120 140 110
JetBlue1 2 3
132 150 72 108 90
Frontier1 2 3
78 150 80 108 44
Air Canada1 3
108 150 120 140 110
Westjet1 3
132 150 120 140 114
Boutique1 3
90 150 120 140 110
Contour1 3
90 150 120 140 110
New Carrier 13 140 150 120 140 110
New Carrier 23 140 150 120 140 110
New Carrier 33 140 150 120 140 110
New Carrier 43 140 150 120 140 110
New Carrier 53 140 150 120 140 110
Charter3 140 150 120 140 110
Average 127 148 118 130 90
Industry Benchmark 150 210 150 130 90 Data Sources:
1. BNA Master Plan Update, Passenger Characteristics & Processing Times Data Collection DRAFT Report, June 2018 2. BNA Facilities Requirements Report, June 2017 3. IATA Airport Reference Development Manual (ADRM), 10
th Edition
Based on IATA’s ADRM, it is assumed that 85% of passengers use economy agent counters, and 15%
of passengers use premium check-in counters. Table 4-31 provides a simplified summary of the
maximum waiting time from the IATA ADRM LOS guidelines for the check-in facilities.
Table 4-31. Maximum Waiting Time
Max Waiting Time in Queue for
Optimum Services (Min)
Check-in
Economy Counter 20
Premium Counter 5
Self-Service Kiosks 2
Curbside 5
Bag Drop 3

BNA Airport Master Plan Update
Chapter 4 – Facility Requirements - DRAFT
Page | 52
In correlating peak hour enplanement data with specific airline facility capacity, each airline’s
requirements were estimated individually. However, where specific airline data was unavailable, an
aggregate approach was taken for the facility requirements.
4.3.3.2. Check-In Capacity
BNA Vision will be expanding airline check-in facilities, and Table 4-32 provides a summary of the
total number of units for the different types of facilities after the expansion. Based on the processing
time per passenger by airline for each type of facility and several other key assumptions to allow for
demand variability, the number of passengers each airline’s facility can process during the peak hour
was evaluated and summarized in Table 4-32. The total number of passengers that the check-in
facilities can process during the peak hour, not including mobile or online check-in passengers, is
estimated to be approximately 3,880 when the BNA Vision ticketing expansion is fully completed.
Table 4-32. Check-in Facility Capacity
Full
Service1 Kiosks
1 Curbside
1
Bag
Drop1
Peak Hour
Passenger
Capacity
Southwest 5 15 10 15 947
American 4 12 2 8 233
Delta 3 13 2 10 541
United 10 10 1 0 278
Alaska 1 6 0 1 151
JetBlue 1 4 0 2 166
Frontier 1 4 0 2 166
Air Canada 1 3 0 1 96
Westjet 2 0 0 2 61
Boutique 1 0 0 0 40
Contour 1 0 0 0 40
New Carrier 1 3 6 0 2 210
New Carrier 2 3 7 0 2 230
New Carrier 3 2 6 1 2 201
New Carrier 4 3 5 0 2 190
New Carrier 5 1 5 1 3 151
Charter 6 0 0 0 176
Total 48 96 17 52 3,8802
Notes: 1. Information from Section 1.1, Ticketing & Security, BNA Vision Bridging Document 2. The capacity analysis focuses on how many passengers the on-site facilities are capable of processing. Therefore, this number only includes
passengers processed through full service counters, kiosks, and curbside positions, as well as passengers who dropped their bags at the bag drop positions. This number does not include passengers who check in online or on their mobile devices and bypass any of the physical on-site check-in facilities, including bag drop positions

BNA Airport Master Plan Update
Chapter 4 – Facility Requirements - DRAFT
Page | 53
4.3.3.3. Check-In Facility Requirements
The facility requirements focus on both the number of units needed and the space required to
accommodate these units.
The agent counters and the self-service kiosks can be configured in a variety of layouts. The modules
used for this analysis are consistent with the layout proposed in the BNA Vision documents.
As shown on Figure 4-16. Standard Agent Counter Module, a standard agent counter module would
be roughly 10 feet deep by 4.5 feet wide, each position occupying 45 square feet. This zone includes
the counter, agent standing/sitting area, and the bag load conveyor. In addition to the counter itself,
additional area for circulation between the counters and the queue areas must be provided for
passengers to navigate around the counter areas. The typical depth for circulation is 11 feet based on
the BNA Vision design. The curbside counters and bag drop counters are assumed to be configured in
a similar module, consistent with the current facilities at BNA.
Figure 4-16. Standard Agent Counter Module
Self-service kiosks range in size and configuration as well as placement within the check-in lobby.
Typically kiosks can be placed in two configurations:
- “In-line” or “in-counter” along the ticket counter line, such as the existing kiosk configuration
for United Airlines, or
- Independent from the counters, in rows or clusters in the proximity of the airlines’ full-service
and bag drop agent positions, such as the existing Southwest or American Airlines kiosk
configuration.
9’ 4.5’ 4.5’

BNA Airport Master Plan Update
Chapter 4 – Facility Requirements - DRAFT
Page | 54
Although some airlines use a one-step process that incorporates in-counter kiosks to obtain boarding
passes with the bag drop process using an agent, this analysis assumes the independent kiosks
configuration used by Southwest and American Airlines in order to allow for the flexibility to
accommodate the two-step bag tagging process that has increased in popularity. The two-step
process uses kiosks for passengers to obtain boarding passes and baggage tags, and then passengers
carry their bags to a bag drop counter position for agent processing. Each kiosk typically occupies
two square feet of space. IATA recommends adding a factor of 3 to this space to accommodate
passengers and their baggage when they operate in front of the kiosk. An additional 35% of
circulation factor is also recommended by IATA between kiosks and passenger queueing area.
In-Counter Kiosks Configuration for United Airlines
Independent Kiosks Configuration for American Airlines and Southwest Airlines
Based on the processing time per passenger, the maximum allowable queue time, the passenger
arrival profiles for the peak 30 minutes, and the space required for the check-in units, the check-in
facility requirements were calculated. Table 4-43 presents the requirements for agent counters, kiosks,
curbside counters, and bag drop positions in terms of the number of units and the space required for
these units. As indicated, the BNA Vision check-in expansion will provide sufficient area, kiosks, and
curbside counter facilities. Although there is a projected deficiency in agent counter and bag drop
positions, there is sufficient space in the check-in facilities to adjust the number of kiosks, curbside,
agent counters, and bag drop positions to meet demand, if needed. Throughout the planning period,
it is possible that facility deficiencies may resolve with passenger processing behavior and check-in
protocol changes.

BNA Airport Master Plan Update
Chapter 4 – Facility Requirements - DRAFT
Page | 55
Table 4-33. Check-in Facility Requirements
Facility Type Facility Requirements
Baseline 2022 2027 2032 2037
Units Agent Counters 48 39~47 42~51 46~57 50~62
Kiosks 96 40~67 43~74 46~81 51~89
Bag Drop 52 26~41 29~44 32~48 35~53
Curbside Counters 17 2 2 2 2
Areas
Indoor Counter Areas (s.f.) 2 6,395 2,930 ~ 3,960 3,200~4,280 3,510~4,730 3,830~5,180
Existing Queue, Circulation &
Kiosks Areas (s.f.) 3
22,890 12,480~15,620 13,710~17,100 15,020~18,780 16,400~20,560
Curbside Counter Areas &
Queue (s.f.) TBD 540 540 560 560
Notes: 1. Not including online/mobile/people who don't check bags 2. Agent counters and bag drop counters 3. Results rounded up to the nearest tenths 4. Red text indicates deficiencies 5. S.f. = square feet
4.3.4. Security Checkpoint (SSCP)
After completing the check-in process, passengers proceed to the security screening checkpoints
(SSCP). Security screening is generally regarded as a major “pressure point” in terminal facility
planning for a number of reasons:
1. Unlike other areas which might only be used by a percentage of passengers (for instance some
people might not check bags to bypass the ticketing facility), the SSCP is a function that must
serve all passengers.
2. More airports are moving to a 100% security screening policy for employees. While some
portion of the employee population will use passenger SSCP’s, more airports are investigating
dedicated employee SSCP’s as an option to reduce the employee population using passenger
SSCP’s.
3. In contrast to other areas where technology and new processes expedite the flow of people,
security screening technology steadily evolves with increasing complexity, and the ever
changing screening protocols could increase the queue wait time as well as space
requirements.
In developing requirements for the SSCP, an allowance should be provided to accommodate future
changes to security screening equipment and processes.
The SSCP consists of a standard module set with either single or dual inspection lanes. The
Transportation Security Administration (TSA) policy is that single or dual inspection lane configuration
can be further enhanced for higher throughput rates by adjustments to include Automated Security

BNA Airport Master Plan Update
Chapter 4 – Facility Requirements - DRAFT
Page | 56
Lane (ASL) technology. Thus, requirements and planning for future SSCP’s include allowances to
install ASL configurations. A typical single lane module set consists of the following:
Divesting area for multiple passengers
X-Ray Unit
Walk-Through Metal Detector for expedited screening (WTMD) and/or an Advanced Imaging
Technology (AIT) unit for standard screening
Passenger containment/holding area
Composure area for multiple passengers
A secondary screening area with Explosives Trace Detection (ETD), Bottle Liquid Scanner (BLS),
Alternate Viewing Station (AVS), and passenger and carry-on bag inspection
A dual-lane module set is similar to a single-lane module set but with a second X-ray unit. The dual-
lane module set increases the efficiency of the SSCP and is generally recommended. However, a
single-lane module set is utilized when there are an odd number of lanes required per peak hour
demand. The SSCP at BNA has mostly dual-lane modules in both the existing conditions and when
BNA Vision projects are completed. The single- or dual-lane configuration can be
assigned/configured as “Standard” for all passenger screening or “Pre-check” to screening passengers
who have been approved for use of Pre-check lanes. While Pre-check lanes do not typically include
AIT equipment, for flexibility AIT’s should be provided for all SSCP lanes. ASL lane configurations can
vary slightly depending on the equipment used for each lane. Figure 4-17 shows a typical ASL
configuration.
The TSA has pilot programs that are trying to speed up the screening checkpoint process and increase
passenger throughput. The FLEX lane program is a recent pilot program to investigate various risk-
based screening (RBS) processes and protocols aimed at enhancing the passenger experience at the
checkpoint. As TSA further develops and refines their RBS programs FLEX, Pre-check and other
programs will evolve into the standard checkpoint planning and design process with a goal of
maximizing existing facilities and infrastructure. Other checkpoint lane processes such as CLEAR
typically use established standard or Pre-check and CLEAR enrolled passengers essentially get priority
processing to the next available document check officer. Known Crew Member (KCM) lanes are
typically established at the egress point from the concourse or an access point into the secure area.
The lanes are not typical security screening lanes in that they are essentially an identity and credential
checkpoint with a podium. The requirement for KCM lanes varies considerably from airport to airport
based on the airport configuration more than volume of people. At BNA it is anticipated that no more
than 2 KCM lanes/access point will be required.

BNA Airport Master Plan Update
Chapter 4 – Facility Requirements - DRAFT
Page | 57
Figure 4-17. Automated Screening Lane (ASL) Typical Configuration
Source: TSA Checkpoint Requirements Planning Guide, 12/17/2018
Pre-Check lanes allow pre-approved travelers to leave on shoes, light outerwear and belts, laptops in
the case, and 3-1-1 compliant liquids/gels bag in the carry-on luggage. Passengers and personnel
that are screened through TSA Pre-Check lanes include the TSA Pre-Check passengers and Managed
Inclusion (MI) passengers.
As of early 2019, BNA employees and crew members are processed through a dedicated dual-lane
module in a separate screening area, instead of being mixed with passenger traffic in the main SSCP
area. Future SSCP requirements will include a total number of lanes needed to process passengers
and employees.
4.3.4.1. Key Assumptions
Based on BNA Vision, the baseline conditions for the SSCP after the planned expansion are as
summarized in Table 4-34. SSCP Baseline Conditions
Table 4-34. SSCP Baseline Conditions
Type of Lanes Number of
Lanes
Queue Area
(s.f.)
Pre-Check 4
7,125
Premium 5
Standard 12
ADA 3
Total 24 Source: BNA Vision.
95’ to 115’
20’ to 25’

BNA Airport Master Plan Update
Chapter 4 – Facility Requirements - DRAFT
Page | 58
The use of TSA Pre-Check is anticipated to increase based on recent registration statistics and the
TSA’s initiative in risk-based screening (RBS). RBS refers to the method that defines a passenger’s
credentials prior to the security screening process. TSA Pre-Check is an existing example of the RBS
program that is intended to increase throughput rates for SSCP lanes which in turn would reduce the
required number of lanes. Although there are few other RBS programs currently utilized (CLEAR, Flex,
Known Crew Member), the TSA plans on expanding RBS in the future. The implementation of the TSA
Pre-Check has effectively increased the processing rate at TSA Pre-Check checkpoints. Therefore, in
order to estimate future SSCP requirements for BNA it is assumed that the current TSA Pre-Check
utilization of 25% will gradually increase to approximately 40% in the 20-year planning horizon. Table
4-35 summarizes the key assumptions for the SSCP facilities.
Table 4-35. SSCP Key Assumptions
Type of Lanes Throughput
(Pax/Hr/Lane)1
LOS Maximum Wait
Times (mins)2
Split of
Passengers3
Pre-Check 250 10 25%-40%
Premium 150 10 20%
Standard 150 15 30~45%
ADA 130 10 10% Sources:
1. BNA Vision Bridging Document, SSCP Requirements Studies 2. Generally accepted wait times by the TSA and comparable airports 3. BNA Facilities Requirements Report, June 2017
Based on the BNA Vision SSCP layout, it is assumed that future crew and employee traffic will also use
the main SSCP area. Therefore, an additional 3% is added to the overall peak hour passenger number
to account for the extra traffic based on general industry observations. It is assumed that crew
members and employees will typically use Pre-Check Lanes. The Alternatives chapter will examine
options for additional or separate checkpoint lanes for the various new technologies and employee
screening requirements.
The general planning area requirement for each SSCP lane is approximately 1,540 square feet per lane.
This area includes the primary screening area (WMTD/AIT devices, conveyor belts, etc.), secondary
screening area (ETD, BLS, etc.) and egress/composure area where passengers re-arrange their
belongings before heading to gates. This area does not include the queue area for passengers. Based
on IATA LOS standards, 13 square feet of queue area should be provided for each passenger in the
queue for optimum design.

BNA Airport Master Plan Update
Chapter 4 – Facility Requirements - DRAFT
Page | 59
4.3.4.2. SSCP Capacity
Based on the number of post-BNA Vision lanes and the projected throughput for each lane, the
capacity of the SSCP lanes is calculated and summarized in Table 4-36.
Table 4-36. SSCP Capacity
Type of Lanes Number of
Lanes
Throughput
(Pax/Hr/Lane)
Capacity
(Pax/Hr)
Pre-Check 4 250 1,000
Premium 5 150 750
Standard 12 150 1,800
ADA 3 130 390
Total 24 n.a. 3,940 Source: AECOM Analysis.
4.3.4.3. SSCP Facility Requirements
Table 4-37 provides the estimated facility requirements for each type of SSCP lane, as well as the total
requirements. In summary, due to the fast growth projected at BNA during the planning horizon,
additional lanes may be required by 2037. Before 2037, the total number of SSCP lanes is sufficient but
a portion of the standard lanes should be re-designated as Pre-check and premium lanes to serve the
increasing percentage of passengers using these two types of lanes.
Table 4-37. SSCP Facility Requirements - Number of Lanes
Type of
Lanes
Number of
Lanes Number of Lanes Required
1
Baseline 2022 2027 2032 2037
Pre-Check 4 4 5 7 8
Premium 5 5 5 6 6
Standard 12 9 8 8 8
ADA 3 3 3 3 3
Total 24 21 21 24 25 Notes:
1. The number of security screening lanes includes a correction factor for demand variability and is based on the maximum waiting time allowed 2. Red text indicates deficiencies

BNA Airport Master Plan Update
Chapter 4 – Facility Requirements - DRAFT
Page | 60
Table 4-38 shows the total areas required for the screening area and queue area, in comparison to
the areas provided based on the BNA Vision program. A larger queue area than designed in BNA
Vision is required to accommodate the number of queuing passengers during the peak periods.
Table 4-38. SSCP Facility Requirements – Area Square Footage
Area Existing Area Area Required2
Baseline 2022 2027 2032 2037
Screening Area 35,527 32,370 32,370 37,000 38,540
Queue Area1
7,125 8,940 9,690 10,500 11,370
Total Area 42,652 41,310 42,060 47,490 49,900
Notes: 1. Queue space includes a correction factor for the maximum number of passengers in the security queue at any one time and is based on the
maximum waiting time allowed 2. Numbers are rounded up to the tenths 3. Red text indicates deficiencies
It is also noted that the throughput per lane (passengers/hour/lane) is based on BNA Vision design
parameters and benchmarked by on-site data collection results. It is anticipated that the processing
rate has the potential to increase in the future with technological advances as well as new processing
protocols. However, the number of SSCP lanes is very heavily dependent on the actual throughput
capacity of each lane. Should future lane physical configuration or TSA protocols not produce the
estimated throughput, additional lanes above the forecast presented may be necessary.
4.3.5. Checked Baggage Inspection System (CBIS)
The CBIS is the total bag screening system that centers around Explosive Detection Systems (EDS)
machines. EDS machines are characterized by the throughput capacity achieved. These machines have
remained relatively large but technological advances have increased the effectiveness, speed, and
reliability of the bag screening process. In general, as throughput rates increase, fewer EDS machines
should be required; but increased throughput rates could also result in upstream and downstream
baggage processing congestion if bag belt speeds are not able to be adjusted simultaneously with
reducing the number of EDS machines.
4.3.5.1. Key Assumptions
The CBIS at BNA are divided into two areas – the north CBIS in the main terminal, and south CBIS in
Concourse C. This analysis assumes maintaining the two separate CBIS areas. Although BNA Vision
does not propose any expansion of the CBIS facility, the CBIS systems are currently being reviewed in
a separate study, since baggage throughput rates are not currently achieving their rated capacity. For
this Master Plan analysis, the post-BNA Vision baseline conditions for the number of existing EDS
machines remain the same as the existing conditions in 2019. Table 4-39 provides a summary of the
number of screening facilities at each level.
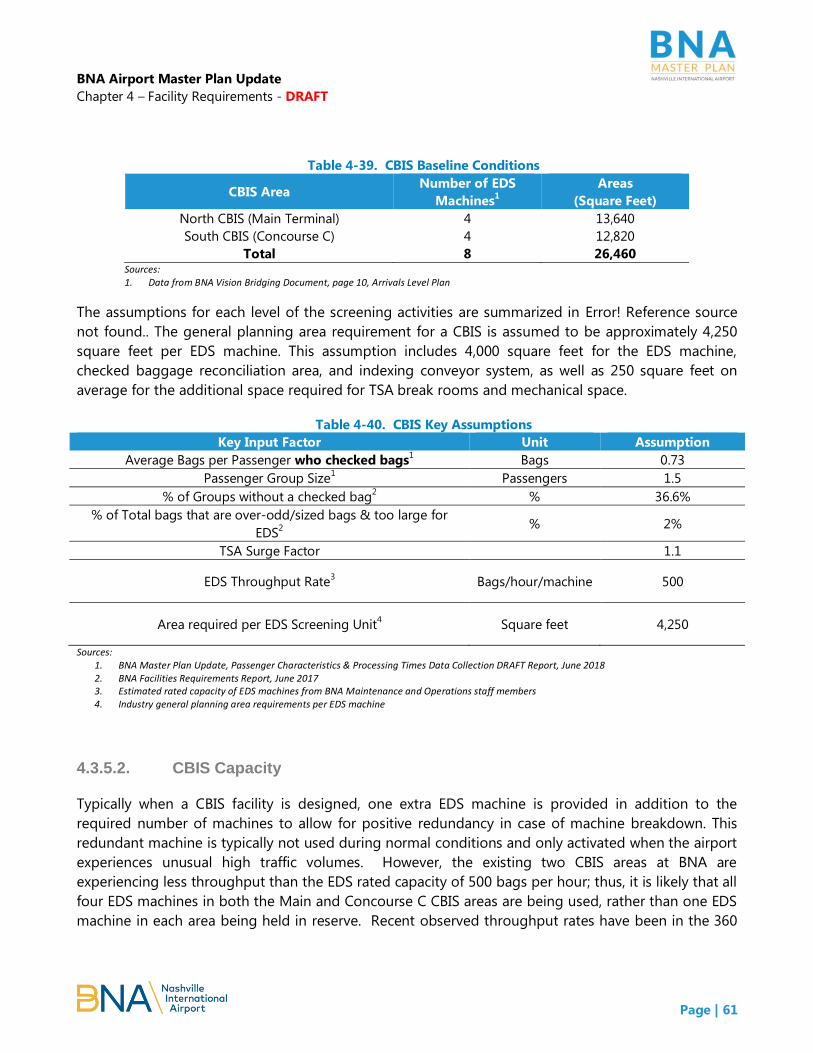
BNA Airport Master Plan Update
Chapter 4 – Facility Requirements - DRAFT
Page | 61
Table 4-39. CBIS Baseline Conditions
CBIS Area Number of EDS
Machines1
Areas
(Square Feet)
North CBIS (Main Terminal) 4 13,640
South CBIS (Concourse C) 4 12,820
Total 8 26,460 Sources: 1. Data from BNA Vision Bridging Document, page 10, Arrivals Level Plan
The assumptions for each level of the screening activities are summarized in Error! Reference source
not found.. The general planning area requirement for a CBIS is assumed to be approximately 4,250
square feet per EDS machine. This assumption includes 4,000 square feet for the EDS machine,
checked baggage reconciliation area, and indexing conveyor system, as well as 250 square feet on
average for the additional space required for TSA break rooms and mechanical space.
Table 4-40. CBIS Key Assumptions
Key Input Factor Unit Assumption
Average Bags per Passenger who checked bags1
Bags 0.73
Passenger Group Size1 Passengers 1.5
% of Groups without a checked bag2
% 36.6%
% of Total bags that are over-odd/sized bags & too large for
EDS2 % 2%
TSA Surge Factor 1.1
EDS Throughput Rate3 Bags/hour/machine 500
Area required per EDS Screening Unit4
Square feet 4,250
Sources: 1. BNA Master Plan Update, Passenger Characteristics & Processing Times Data Collection DRAFT Report, June 2018 2. BNA Facilities Requirements Report, June 2017 3. Estimated rated capacity of EDS machines from BNA Maintenance and Operations staff members 4. Industry general planning area requirements per EDS machine
4.3.5.2. CBIS Capacity
Typically when a CBIS facility is designed, one extra EDS machine is provided in addition to the
required number of machines to allow for positive redundancy in case of machine breakdown. This
redundant machine is typically not used during normal conditions and only activated when the airport
experiences unusual high traffic volumes. However, the existing two CBIS areas at BNA are
experiencing less throughput than the EDS rated capacity of 500 bags per hour; thus, it is likely that all
four EDS machines in both the Main and Concourse C CBIS areas are being used, rather than one EDS
machine in each area being held in reserve. Recent observed throughput rates have been in the 360

BNA Airport Master Plan Update
Chapter 4 – Facility Requirements - DRAFT
Page | 62
bags per hour range. For this Master Plan, two separate calculations for determining facility
requirements were prepared to account for the rated throughput and the observed throughput.
The first analysis assumes that one of the four in-line systems at each CBIS area is the redundant
machine, and therefore the total active in-line systems under normal conditions are only six, instead of
eight. Given that each machine has a rated throughput of 500 bags per hour, the total throughput
rate for the six machines would be 3,000 bags per hour. Using this methodology, and after
accounting for factors such as the oversize/irregular-shape bags, the TSA baggage surge factor during
the peak 10 minutes, and the average bags per passenger, it is conservatively estimated through the
ACRP Report 25 Baggage Screening model that the CBIS areas at BNA have a peak hour capacity of
processing approximately 3,800 passengers who check their bags.
For the second analysis, it was assumed that all four EDS machines in each CBIS area are being used to
meet baggage demand due to observed throughputs of 360 bags per hour. At 360 bags per hour, the
throughput rate for the eight (8) EDS machines would be 2,880 bags per hour; however, this would
not allow one EDS machine to be held in reserve for redundancy and maintenance practices. Using
the same factors as described above, the CBIS in the second analysis would have a peak hour capacity
of processing approximately 3,600 passengers who check their bags.
4.3.5.3. CBIS Facility Requirements
The requirements for each level of screening facilities and the associated areas were determined based
on projected peak hour baggage demand and throughput rates. Table 4-41 depicts the peak hour
enplanements, peak hour bags to be screened, and the facility requirements, assuming that the EDS
machines can achieve their rated throughput of 500 bags per hour, and assuming that the TSA’s “n+1”
configuration can be achieved in keeping one EDS machine in reserve and separate from the CBIS
available capacity for redundancy and maintenance needs. A separate calculation is made to identify
the number of EDS machines required if the baggage processing rate can only achieve the 360 bags
per hour.
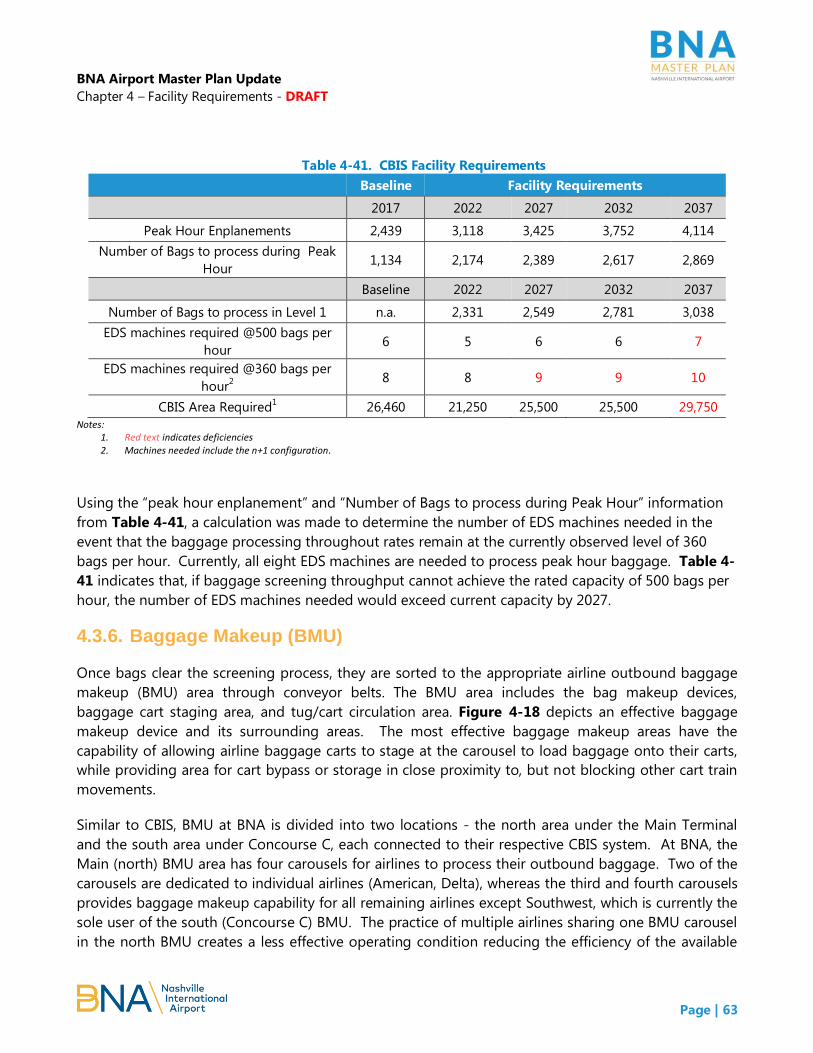
BNA Airport Master Plan Update
Chapter 4 – Facility Requirements - DRAFT
Page | 63
Table 4-41. CBIS Facility Requirements
Baseline Facility Requirements
2017 2022 2027 2032 2037
Peak Hour Enplanements 2,439 3,118 3,425 3,752 4,114
Number of Bags to process during Peak
Hour 1,134 2,174 2,389 2,617 2,869
Baseline 2022 2027 2032 2037
Number of Bags to process in Level 1 n.a. 2,331 2,549 2,781 3,038
EDS machines required @500 bags per
hour 6 5 6 6 7
EDS machines required @360 bags per
hour2 8 8 9 9 10
CBIS Area Required1
26,460 21,250 25,500 25,500 29,750
Notes: 1. Red text indicates deficiencies 2. Machines needed include the n+1 configuration.
Using the “peak hour enplanement” and “Number of Bags to process during Peak Hour” information
from Table 4-41, a calculation was made to determine the number of EDS machines needed in the
event that the baggage processing throughout rates remain at the currently observed level of 360
bags per hour. Currently, all eight EDS machines are needed to process peak hour baggage. Table 4-
41 indicates that, if baggage screening throughput cannot achieve the rated capacity of 500 bags per
hour, the number of EDS machines needed would exceed current capacity by 2027.
4.3.6. Baggage Makeup (BMU)
Once bags clear the screening process, they are sorted to the appropriate airline outbound baggage
makeup (BMU) area through conveyor belts. The BMU area includes the bag makeup devices,
baggage cart staging area, and tug/cart circulation area. Figure 4-18 depicts an effective baggage
makeup device and its surrounding areas. The most effective baggage makeup areas have the
capability of allowing airline baggage carts to stage at the carousel to load baggage onto their carts,
while providing area for cart bypass or storage in close proximity to, but not blocking other cart train
movements.
Similar to CBIS, BMU at BNA is divided into two locations - the north area under the Main Terminal
and the south area under Concourse C, each connected to their respective CBIS system. At BNA, the
Main (north) BMU area has four carousels for airlines to process their outbound baggage. Two of the
carousels are dedicated to individual airlines (American, Delta), whereas the third and fourth carousels
provides baggage makeup capability for all remaining airlines except Southwest, which is currently the
sole user of the south (Concourse C) BMU. The practice of multiple airlines sharing one BMU carousel
in the north BMU creates a less effective operating condition reducing the efficiency of the available

BNA Airport Master Plan Update
Chapter 4 – Facility Requirements - DRAFT
Page | 64
area, and potentially jeopardizing the airport’s ability to accommodate new or expanded air service.
BMU configurations and expansion options will be evaluated in the Alternatives section.
Figure 4-18. Typical Baggage Makeup Device
Source: Airport Cooperative Research Program (ACRP) Report 25, “Airport Passenger Terminal Planning and Design Guidebook”
4.3.6.1. Key Assumptions
The demand for BMU area is primarily driven by the number of peak period departing flights, peak
bag demand per flight, and the required number of carts to accommodate bag demand. Domestic
and international flights are treated separately in this analysis because typically international flights
are operated on widebody aircraft with more passengers and more checked bags, whereas domestic
flights carry fewer passengers and a lower percentage of checked bags.
In the post-BNA Vision baseline condition, the north BMU area is 25,747 square feet and processes
both domestic and international flights. The south BMU area is 28,508 square feet and processes
domestic flights only.
Table 4-43 documents the key assumptions for the BMU analysis.
Table 4-42. BMU Key Assumptions
Domestic
Flights
International
Flights
Load Factor1
82.6% 82.9%
Seats2
200 300
Checked bag per pax3
0.73 1
Bags per cart4
40 Sources: 1. BNA Master Plan Update 2018: Aviation Demand Forecasts Report 2. Conservative estimates about number of seats based on typical seat configurations on narrowbody and widebody aircraft 3. BNA Master Plan Update, Passenger Characteristics & Processing Times Data Collection DRAFT Report, June 2018 4. Airport Cooperative Research Program (ACRP) Report 25 “Airport Passenger Terminal Planning and Design Guidebook”

BNA Airport Master Plan Update
Chapter 4 – Facility Requirements - DRAFT
Page | 65
Based on the key assumptions, the number of carts needed per flight is estimated for domestic and
international flights as summarized in Table 4-43.
Table 4-43. Number of Carts Required per Flight
Domestic
Flights
International
Flights
Average Passengers per Flight
165 249
Average Bags per Flight
121 249
Carts Required to serve each Flight
4 7 Source: AECOM Analysis.
The typical configuration requires an average area of approximately 620 square feet per baggage
cart2, which includes the makeup device, the work aisle for operators to load bags, the baggage train
staging area by the device, bypass lanes, and additional baggage train circulation. However, at BNA,
there is no bypass lane capability in the north (Main) BMU rooms for any of the four carousels, limiting
the ability for cart storage and cart train circulation.
4.3.6.2. BMU Capacity
Based on the available square footage at each BMU area, the number of carts required to serve each
flight, and the area required for each cart, it is estimated that:
- The north BMU area has a capacity to serve 9 domestic flights and one international flight
simultaneously, which translates to a capacity of approximately 1,750 passengers.
- The south BMU area has a capacity to serve 12 domestic flights simultaneously, translating to
1,900 passengers.
- The total capacity of the baseline BMU facilities at BNA is 21 domestic flights, one international
flight, and 3,650 passengers being processed at the same time.
2 Area calculated based on standards provided in Airport Cooperative Research Program (ACRP) Report 25
“Airport Passenger Terminal Planning and Design Guidebook”
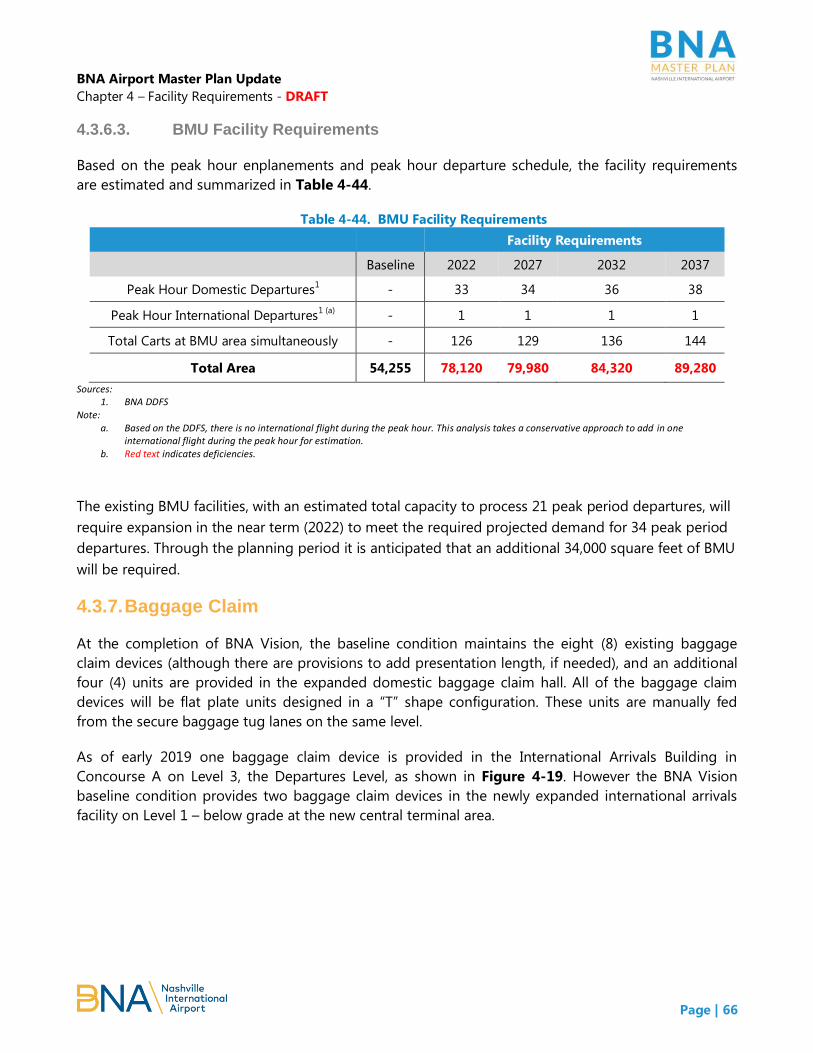
BNA Airport Master Plan Update
Chapter 4 – Facility Requirements - DRAFT
Page | 66
4.3.6.3. BMU Facility Requirements
Based on the peak hour enplanements and peak hour departure schedule, the facility requirements
are estimated and summarized in Table 4-44.
Table 4-44. BMU Facility Requirements
Facility Requirements
Baseline 2022 2027 2032 2037
Peak Hour Domestic Departures1
- 33 34 36 38
Peak Hour International Departures1 (a)
- 1 1 1 1
Total Carts at BMU area simultaneously - 126 129 136 144
Total Area 54,255 78,120 79,980 84,320 89,280
Sources: 1. BNA DDFS
Note: a. Based on the DDFS, there is no international flight during the peak hour. This analysis takes a conservative approach to add in one
international flight during the peak hour for estimation. b. Red text indicates deficiencies.
The existing BMU facilities, with an estimated total capacity to process 21 peak period departures, will
require expansion in the near term (2022) to meet the required projected demand for 34 peak period
departures. Through the planning period it is anticipated that an additional 34,000 square feet of BMU
will be required.
4.3.7. Baggage Claim
At the completion of BNA Vision, the baseline condition maintains the eight (8) existing baggage
claim devices (although there are provisions to add presentation length, if needed), and an additional
four (4) units are provided in the expanded domestic baggage claim hall. All of the baggage claim
devices will be flat plate units designed in a “T” shape configuration. These units are manually fed
from the secure baggage tug lanes on the same level.
As of early 2019 one baggage claim device is provided in the International Arrivals Building in
Concourse A on Level 3, the Departures Level, as shown in Figure 4-19. However the BNA Vision
baseline condition provides two baggage claim devices in the newly expanded international arrivals
facility on Level 1 – below grade at the new central terminal area.

BNA Airport Master Plan Update
Chapter 4 – Facility Requirements - DRAFT
Page | 67
Figure 4-19. FIS before and after BNA Vision
After – Main Terminal
Before – Concourse A

BNA Airport Master Plan Update
Chapter 4 – Facility Requirements - DRAFT
Page | 68
4.3.7.1. Key Assumptions
Requirements for the baggage claim area were based on the peak period flight arrivals, first and last
bag show-up on the claim device, and the number of bags per passenger. Table 4-45 documents the
key assumptions in this analysis.
Table 4-45. Bag Claim Key Assumptions
Domestic
Flights
International
Flights
Load Factor1
82.6% 82.9%
Seats2
200 300
Ratio of Terminating Passenger1
88% 88%
Checked bag per pax3
0.73 1
Passengers Per Group3 1.5
Percentage of Additional Passengers at the Claim4
30%
Average Claim Device Occupancy Time5 20 ~ 25
mins 30 ~ 45 mins
Sources: 1. BNA Master Plan Update 2018:Aviation Demand Forecasts Report 2. Conservative estimates about number of seats based on typical seat configurations on narrowbody and widebody aircraft 3. BNA Master Plan Update, Passenger Characteristics & Processing Times Data Collection DRAFT Report, June 2018 4. Airport Cooperative Research Program (ACRP) Report 25 “Airport Passenger Terminal Planning and Design Guidebook” 5. Typical observation in the industry and at BNA
Typically, a flight will substantially clear (90 percent or more of bags and passengers have left the bag
claim area) a bag claim device in 20 to 25 minutes for narrowbody aircraft (Boeing 737 and Airbus
A320). Smaller aircraft will clear slightly quicker and widebody aircraft will take more time to clear the
device. Typically an international flight or widebody aircraft will take 45 minutes. Based on site
observations, airlines occasionally unload bags for multiple flights currently onto one claim device.
Planning for the BNA Vision program assumed that it would be necessary in the future to change the
use of the baggage claim devices from preferential use to common use in order to process the
number of simultaneous peak period arrivals.
The Master Plan DDFS was used to identify peak hour flight arrivals used for bag claim requirements.
The peak period for domestic arrivals and international arrivals are not coincidental and use separate
baggage claim areas. The international baggage claim requirements will be discussed as part of the
Federal Inspection Station (FIS) facility requirements.
4.3.7.2. Baggage Claim Capacity
Based on the assumption that each domestic baggage claim device will serve on average 2.5 to 3
flights during one hour, and all the domestic flights are performed on narrowbody aircraft at BNA, it is
estimated that the twelve (12) baggage claim devices in the domestic baggage claim hall have a total
capacity of serving between 4,360 to 5,230 terminating passengers. The projected 4,473 peak hour
deplanements would indicate that the presentation length of the 12 devices would be adequate to
accommodate the demand; however, there are 38 projected peak hour arrivals in 2037. Using the

BNA Airport Master Plan Update
Chapter 4 – Facility Requirements - DRAFT
Page | 69
assumption of 3 arrivals per hour per device yields a requirement for 12.67 (13) devices needed by
2037.
Based on the assumption that each international baggage claim device will serve on average 1.5 to 2
flights during one hour, it is estimated that the two baggage claim devices in the international
baggage claim hall have a total capacity of serving approximately a range of 570 to 870 terminating
passengers.
4.3.7.3. Baggage Claim Facility Requirements
The resulting requirements for baggage claim devices and linear frontage are estimated based on
peak hour deplaning passengers and arrival flights, as summarized in Table 4-46.
Table 4-46. Bag Claim Facility Requirements
Facility Requirements
Baseline 2022 2027 2032 2037
Domestic Baggage Claim
Peak Hour Domestic Deplanements1 2 (a)
- 3,391 3,725 4,080 4,473
Peak Hour Domestic Arrivals1 2
- 33 34 36 38
Estimated Passengers at Claim Devices
During Peak 20 Minutes - 824 905 992 1,087
Required Linear Frontage of the Claim
Devices (feet) 1,752 1,236 1,358 1,487 1,631
Required Number of Claim Devices(b)
12 11 12 12 13
Sources: 1. BNA Master Plan Update 2018: Aviation Demand Forecasts Report 2. DDFS
Notes: a. Based on the DDFS, there is no international arriving flight during the peak hour. Therefore, the peak hour deplanements are all domestic
passengers. b. Based on the assumption that each domestic flight typically takes 20 minutes to clear the device. c. The peak hour for international arrivals is not in the same peak hour with the domestic arrivals. d. Based on the assumption that each international flight typically takes 30 minutes to clear the device. e. Red text denotes deficiencies
The requirements show that both domestic and international baggage claim devices have sufficient
linear frontage to accommodate passengers waiting alongside the devices during the peak periods.
However, if device sharing is not allowed between different flights (which means baggage from one
flight must be totally cleared from a device before the next flight could occupy the device), the
domestic baggage claim hall would need to install one additional baggage claim device by 2037.
It is recommended that sharing devices be allowed during the peak periods given that the linear
frontage provided in the baseline condition is much higher than the required linear frontage, and that
no additional claim devices are required in the domestic baggage claim hall to meet demand in the
planning horizon.

BNA Airport Master Plan Update
Chapter 4 – Facility Requirements - DRAFT
Page | 70
While it is typical for many of the airlines to use the same bag claim devices continually based on
gates locations and operations, it is imperative that the baggage claim devices be available as
common use facilities. A key assumption for BNA carried into this Master Plan analysis is that the
baggage claim hall is completely common use.
The staging and queuing area in the baggage claim hall is key to the passenger experience. The
staging and queueing area is defined as all the space allocated to the claim area, less the space the
claim devices use and any offices, restrooms or cross circulation corridors. As indicated in the BNA
Vision Facility Requirements Report, a LOS C goal was assumed in the baggage claim hall using 14
square feet per passenger. The baggage claim hall staging and queueing area is approximately 55,200
square feet. Based on the projected demand levels and anticipated meeter/greeter ratio,
approximately 3,950 peak hour deplanements can be accommodated in the baggage claim hall
staging and queuing area. Theoretically, this area should be adequate through 2027. Options will be
evaluated in the alternatives phase to expand the staging and queuing areas to meet projected future
demand.
4.3.8. Federal Inspection Services (FIS)
The Interim International Arrivals Building at Concourse A as of early 2019 is configured in a more
traditional flow, in which passengers are processed through primary inspection counters first, proceed
to collect their bags, and then exit the FIS or go through additional inspection at the secondary
screening area. Comparatively, the new international arrival facility centrally located at the Main
Terminal is designed with the most current Customs and Border Protection (CBP) design standard
known as a “bag-first” process, in which the baggage collection and the primary inspection are
reversed in order. Figure 4-20 shows the different areas in the new BNA Vision FIS facility.
Figure 4-20. FIS Facility

BNA Airport Master Plan Update
Chapter 4 – Facility Requirements - DRAFT
Page | 71
The general processing steps in the bag-first flow are depicted in Figure 4-21 and explained as
follows. The analysis model is established upon this processing procedure.
1. U.S. citizen, lawful permanent residents (LPR), Global Entry holders, and ESTA holders3 go
through the Automatic Passport Control (APC) kiosks first before collecting their bags
from the claim devices. Those who fail to pass the APCs must enter a dedicated queue in
the Primary Screening area to meet with a Passport Control agent from CBP; whereas
those who passed the APCs proceed directly to the Document Check Podiums before
exiting.
2. Mobile Passport Control (MPC) allows eligible passengers to use an online application
form prior to arriving at a U.S. port of entry in lieu of using an Automated Passport
Control kiosk in the FIS facility. The passenger path taken for MPC users is similar to those
using an APC kiosk and is shown on Figure 4-21.
3. Foreign nationals cannot be processed through APC kiosks. Thus, they are directed to
collect their bags first, and then proceed to the Primary Screening area to meet with the
Passport Control agents.
4. Those who clear the inspection at Primary Screening can proceed to the Document Check
Podiums before exiting the FIS.
5. A random number of passengers in the Primary Screening area could be directed to the
Secondary Screening area for additional inspection of their documents and baggage.
6. Those who clear the Secondary Screening Area can then proceed to the Document Check
Podiums and exit the FIS.
3 The Electronic System for Travel Authorization (ESTA) is an automated system that determines the eligibility of visitors to
travel to the United States under the Visa Waiver Program (VWP).

BNA Airport Master Plan Update
Chapter 4 – Facility Requirements - DRAFT
Page | 72
Figure 4-21. Bag-First Process
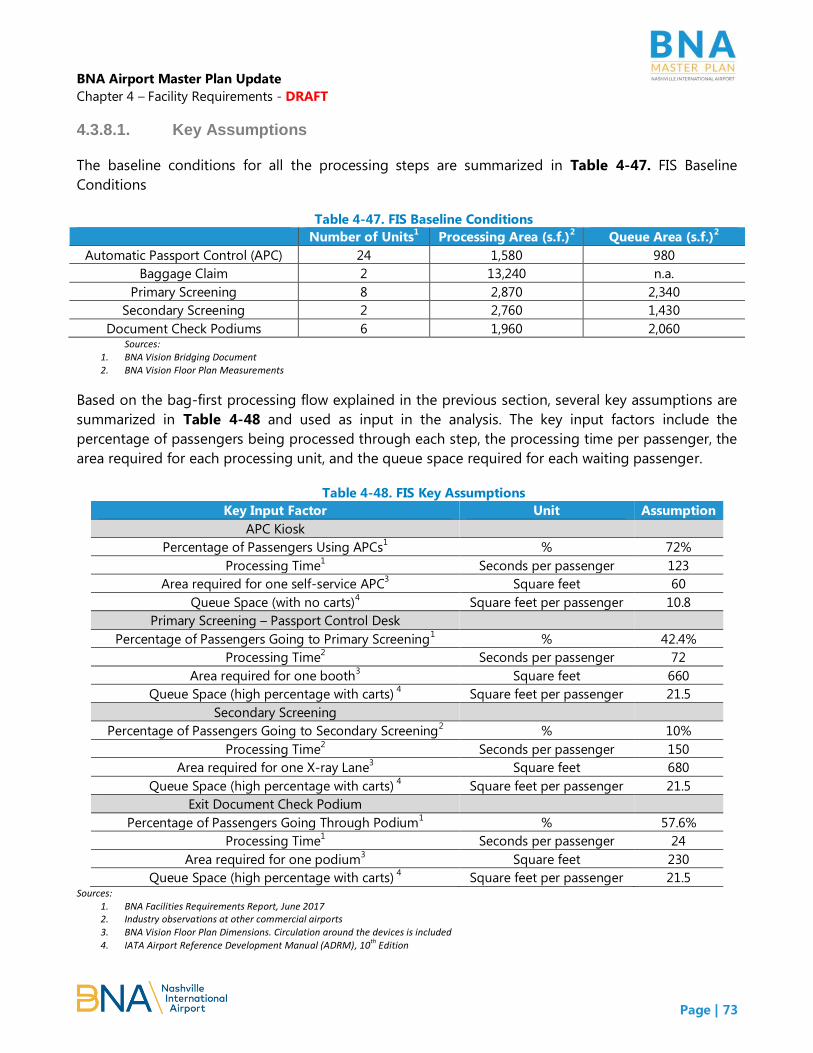
BNA Airport Master Plan Update
Chapter 4 – Facility Requirements - DRAFT
Page | 73
4.3.8.1. Key Assumptions
The baseline conditions for all the processing steps are summarized in Table 4-47. FIS Baseline
Conditions
Table 4-47. FIS Baseline Conditions
Number of Units1
Processing Area (s.f.)2
Queue Area (s.f.)2
Automatic Passport Control (APC) 24 1,580 980
Baggage Claim 2 13,240 n.a.
Primary Screening 8 2,870 2,340
Secondary Screening 2 2,760 1,430
Document Check Podiums 6 1,960 2,060 Sources:
1. BNA Vision Bridging Document 2. BNA Vision Floor Plan Measurements
Based on the bag-first processing flow explained in the previous section, several key assumptions are
summarized in Table 4-48 and used as input in the analysis. The key input factors include the
percentage of passengers being processed through each step, the processing time per passenger, the
area required for each processing unit, and the queue space required for each waiting passenger.
Table 4-48. FIS Key Assumptions
Key Input Factor Unit Assumption
APC Kiosk
Percentage of Passengers Using APCs1
% 72%
Processing Time1
Seconds per passenger 123
Area required for one self-service APC3
Square feet 60
Queue Space (with no carts)4
Square feet per passenger 10.8
Primary Screening – Passport Control Desk
Percentage of Passengers Going to Primary Screening1 % 42.4%
Processing Time2 Seconds per passenger 72
Area required for one booth3 Square feet 660
Queue Space (high percentage with carts) 4 Square feet per passenger 21.5
Secondary Screening
Percentage of Passengers Going to Secondary Screening2 % 10%
Processing Time2 Seconds per passenger 150
Area required for one X-ray Lane3 Square feet 680
Queue Space (high percentage with carts) 4 Square feet per passenger 21.5
Exit Document Check Podium
Percentage of Passengers Going Through Podium1 % 57.6%
Processing Time1 Seconds per passenger 24
Area required for one podium3 Square feet 230
Queue Space (high percentage with carts) 4 Square feet per passenger 21.5
Sources: 1. BNA Facilities Requirements Report, June 2017 2. Industry observations at other commercial airports 3. BNA Vision Floor Plan Dimensions. Circulation around the devices is included 4. IATA Airport Reference Development Manual (ADRM), 10
th Edition
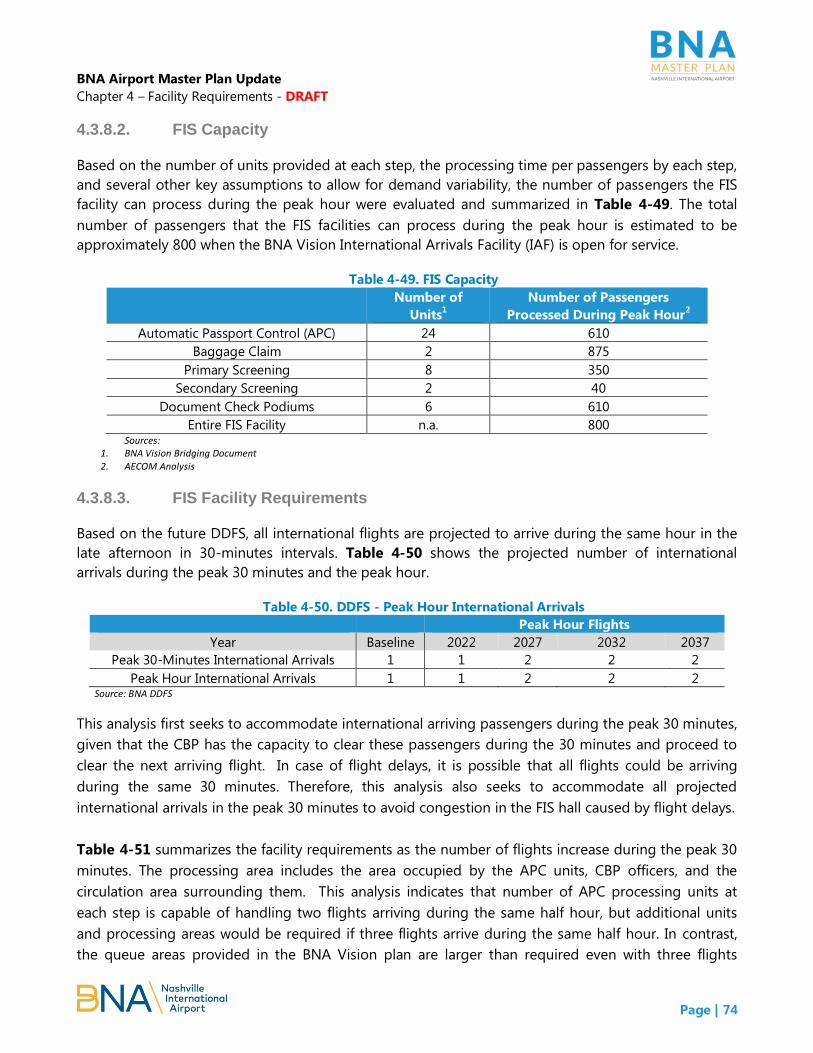
BNA Airport Master Plan Update
Chapter 4 – Facility Requirements - DRAFT
Page | 74
4.3.8.2. FIS Capacity
Based on the number of units provided at each step, the processing time per passengers by each step,
and several other key assumptions to allow for demand variability, the number of passengers the FIS
facility can process during the peak hour were evaluated and summarized in Table 4-49. The total
number of passengers that the FIS facilities can process during the peak hour is estimated to be
approximately 800 when the BNA Vision International Arrivals Facility (IAF) is open for service.
Table 4-49. FIS Capacity
Number of
Units1
Number of Passengers
Processed During Peak Hour2
Automatic Passport Control (APC) 24 610
Baggage Claim 2 875
Primary Screening 8 350
Secondary Screening 2 40
Document Check Podiums 6 610
Entire FIS Facility
n.a. 800 Sources:
1. BNA Vision Bridging Document 2. AECOM Analysis
4.3.8.3. FIS Facility Requirements
Based on the future DDFS, all international flights are projected to arrive during the same hour in the
late afternoon in 30-minutes intervals. Table 4-50 shows the projected number of international
arrivals during the peak 30 minutes and the peak hour.
Table 4-50. DDFS - Peak Hour International Arrivals
Peak Hour Flights
Year Baseline 2022 2027 2032 2037
Peak 30-Minutes International Arrivals
1 1 2 2 2
Peak Hour International Arrivals
1 1 2 2 2 Source: BNA DDFS
This analysis first seeks to accommodate international arriving passengers during the peak 30 minutes,
given that the CBP has the capacity to clear these passengers during the 30 minutes and proceed to
clear the next arriving flight. In case of flight delays, it is possible that all flights could be arriving
during the same 30 minutes. Therefore, this analysis also seeks to accommodate all projected
international arrivals in the peak 30 minutes to avoid congestion in the FIS hall caused by flight delays.
Table 4-51 summarizes the facility requirements as the number of flights increase during the peak 30
minutes. The processing area includes the area occupied by the APC units, CBP officers, and the
circulation area surrounding them. This analysis indicates that number of APC processing units at
each step is capable of handling two flights arriving during the same half hour, but additional units
and processing areas would be required if three flights arrive during the same half hour. In contrast,
the queue areas provided in the BNA Vision plan are larger than required even with three flights

BNA Airport Master Plan Update
Chapter 4 – Facility Requirements - DRAFT
Page | 75
arriving during the same hour, especially in the Secondary Screening and Exit Document Check area.
Therefore, the FIS facility as designed in BNA Vision provides flexibility to allow for possibly expanding
the number of APC processing units into the available queue space.
Table 4-51. FIS Facility Requirements
Number of International Arrivals during
Peak 30-Mins
Baseline
Conditions 1 2 3
APC
Number of Units 24 11 22 33
Processing Area (s.f.) 1,580 800 1,600 2,390
Queue Area (s.f.) 980 460 920 1,370
Primary Screening
Number of Units 8 4 8 12
Processing Area (s.f.) 2,870 1,320 2,640 3,960
Queue Area (s.f.) 2,340 540 1,080 1,610
Secondary Screening
Number of Units 2 1 2 3
Processing Area (s.f.) 2,760 1,360 2,710 4,070
Queue Area (s.f.) 1,430 50 90 130
Exit Document Check Podium
Number of Units 6 3 5 7
Processing Area (s.f.) 1,960 960 1,600 2,240
Queue Area (s.f.) 2,060 270 540 800
Baggage Claim
Number of Units 2 1 2 3
Linear Frontage 330 101 310 446
Processing Area (s.f.) 13,240 4,060 12,420 17,900 Notes:
a. Red text indicates deficiency.
4.3.9. Holdrooms
The holdrooms provide a waiting area for passengers prior to boarding an aircraft as well as airline
agent customer service podium, boarding queues, circulation, and other amenities. The holdroom
requirements in this analysis are based on the analytical approach provided in ACRP Report 25 which
estimates the size of the holdrooms as a function of the dimension of different elements in the
holdroom, the split of seated and standing passengers, allowance for amenities, and holdroom sharing
conditions between adjacent gates.
The ACRP Report 25 method is based on an open-area gate concept (similar to BNA) which means
holdrooms for adjacent gates are not blocked by walls and also have contiguous space with adjacent
concessions space. Holdrooms in such an open environment typically require less space because
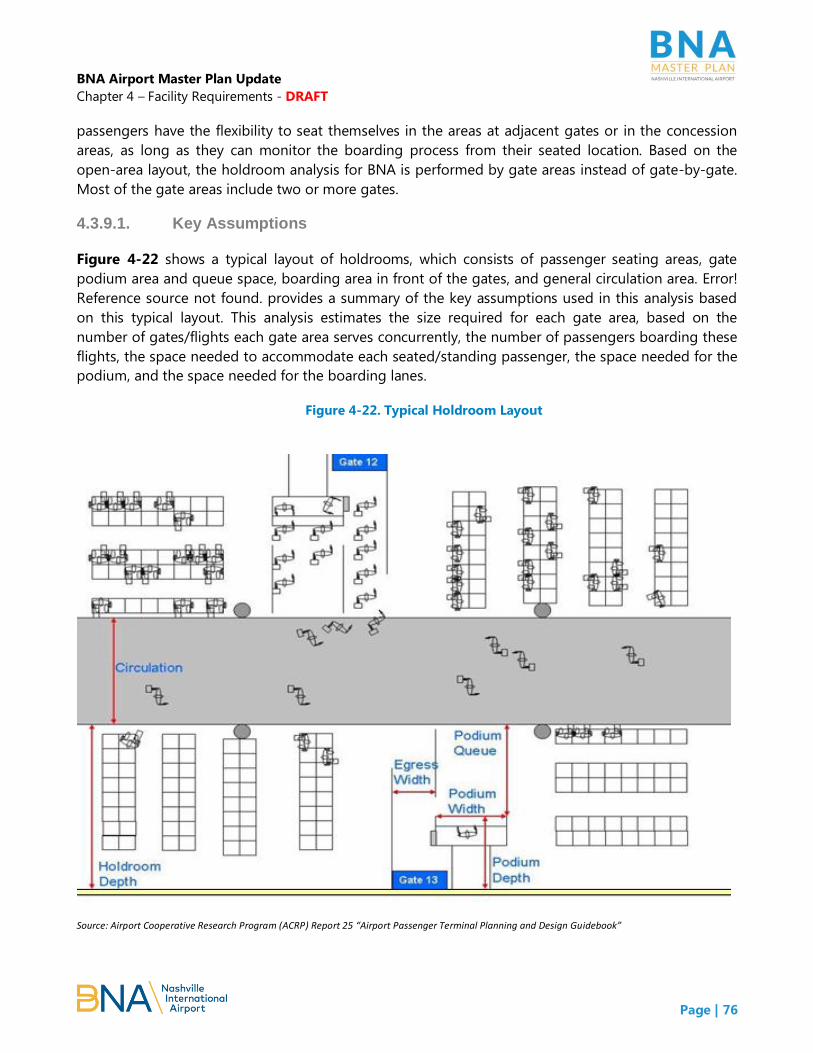
BNA Airport Master Plan Update
Chapter 4 – Facility Requirements - DRAFT
Page | 76
passengers have the flexibility to seat themselves in the areas at adjacent gates or in the concession
areas, as long as they can monitor the boarding process from their seated location. Based on the
open-area layout, the holdroom analysis for BNA is performed by gate areas instead of gate-by-gate.
Most of the gate areas include two or more gates.
4.3.9.1. Key Assumptions
Figure 4-22 shows a typical layout of holdrooms, which consists of passenger seating areas, gate
podium area and queue space, boarding area in front of the gates, and general circulation area. Error!
Reference source not found. provides a summary of the key assumptions used in this analysis based
on this typical layout. This analysis estimates the size required for each gate area, based on the
number of gates/flights each gate area serves concurrently, the number of passengers boarding these
flights, the space needed to accommodate each seated/standing passenger, the space needed for the
podium, and the space needed for the boarding lanes.
Figure 4-22. Typical Holdroom Layout
Source: Airport Cooperative Research Program (ACRP) Report 25 “Airport Passenger Terminal Planning and Design Guidebook”
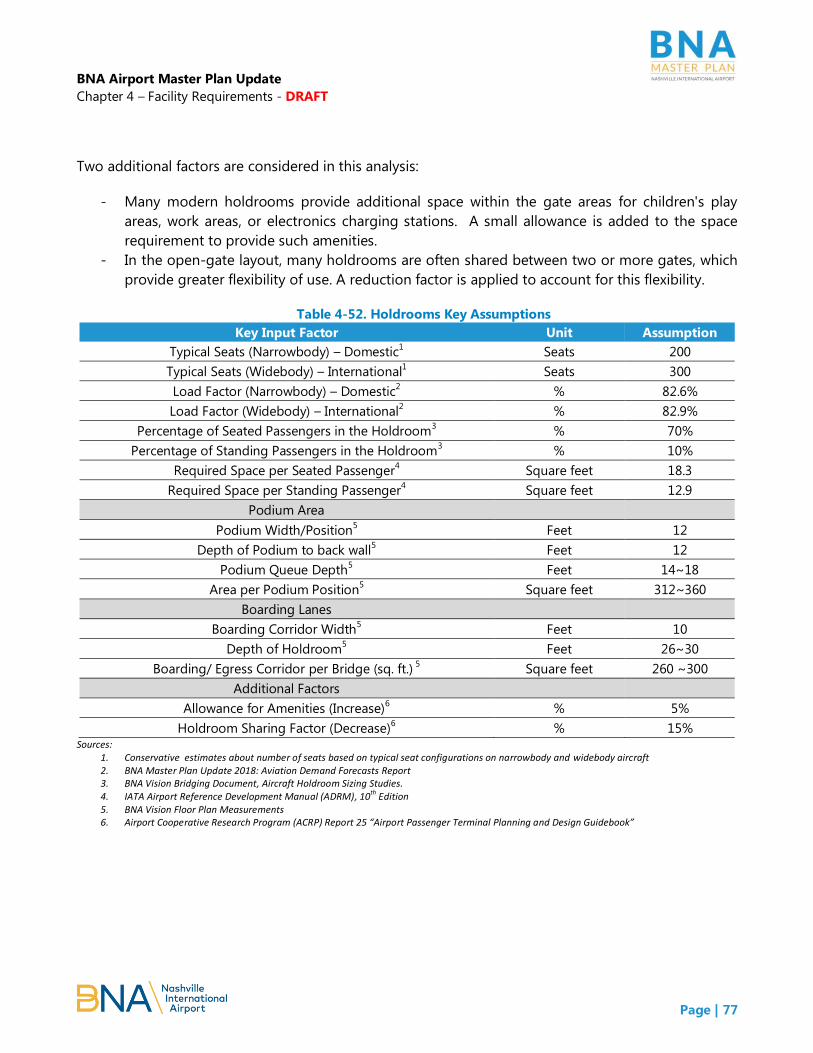
BNA Airport Master Plan Update
Chapter 4 – Facility Requirements - DRAFT
Page | 77
Two additional factors are considered in this analysis:
- Many modern holdrooms provide additional space within the gate areas for children's play
areas, work areas, or electronics charging stations. A small allowance is added to the space
requirement to provide such amenities.
- In the open-gate layout, many holdrooms are often shared between two or more gates, which
provide greater flexibility of use. A reduction factor is applied to account for this flexibility.
Table 4-52. Holdrooms Key Assumptions
Key Input Factor Unit Assumption
Typical Seats (Narrowbody) – Domestic1
Seats 200
Typical Seats (Widebody) – International1 Seats 300
Load Factor (Narrowbody) – Domestic2
% 82.6%
Load Factor (Widebody) – International2
% 82.9%
Percentage of Seated Passengers in the Holdroom3
% 70%
Percentage of Standing Passengers in the Holdroom3
% 10%
Required Space per Seated Passenger4
Square feet 18.3
Required Space per Standing Passenger4
Square feet 12.9
Podium Area
Podium Width/Position5
Feet 12
Depth of Podium to back wall5 Feet 12
Podium Queue Depth5 Feet 14~18
Area per Podium Position5 Square feet 312~360
Boarding Lanes
Boarding Corridor Width5 Feet 10
Depth of Holdroom5 Feet 26~30
Boarding/ Egress Corridor per Bridge (sq. ft.) 5 Square feet 260 ~300
Additional Factors
Allowance for Amenities (Increase)6
% 5%
Holdroom Sharing Factor (Decrease)6
% 15% Sources:
1. Conservative estimates about number of seats based on typical seat configurations on narrowbody and widebody aircraft 2. BNA Master Plan Update 2018: Aviation Demand Forecasts Report 3. BNA Vision Bridging Document, Aircraft Holdroom Sizing Studies. 4. IATA Airport Reference Development Manual (ADRM), 10
th Edition
5. BNA Vision Floor Plan Measurements 6. Airport Cooperative Research Program (ACRP) Report 25 “Airport Passenger Terminal Planning and Design Guidebook”

BNA Airport Master Plan Update
Chapter 4 – Facility Requirements - DRAFT
Page | 78
4.3.9.2. Holdroom Capacity
Table 4-53 shows the capacity of each holdroom in terms of number of passengers to accommodate
and number of flights to serve concurrently. The analysis indicates that except for the newly designed
D gates and T gates, most of the holdrooms are too small to concurrently serve all the gates in each
gate area. For these holdrooms it is important to avoid scheduling flights at all the gates in the same
gate area concurrently.
Additional relievers to stretch holdroom capacity could be reconfiguring the holdrooms for narrower
boarding lanes, smaller podium area, and tighter seating areas. However such reconfigurations will
inevitably compromise the level of service.
Table 4-53. Holdroom Capacity
Gate Areas
Baseline
Conditions -
Area Size (s.f.)
Number of Passengers
Each Area can
Accommodate
Concurrently
Number of
Flights Each
Area can
Accommodate
Concurrently(a)
Total
Gates on
Plan
Concourse A
Narrowbody
Gate A5, A6 5,730 354 2
7 Gate A3, A4 2,728 117 1(b)
Gate A1, A2 3,250 158 1
Concourse B
Narrowbody
Gate B3, B5 8,059 539 3
10 Gate B7 2,052 113 1
(b)
Gate B9, B11, B13, B12, B10 7,123 314 2
B6, B8 3,730 195 1
Concourse C
Narrowbody
Gate C4 2,988 184 1
19
Gate C7, C9 4,731 269 2(c)
Gate C6, C8 4,770 271 2(c)
Gate, C10, C11, C12, C13, C14 10,696 581 3
Gate C15, C17 3,631 181 1
Gate C16, C18 4,828 275 2(c)
Gate C19, C20, C21, C22, C25 10,114 535 3
Concourse D
Narrowbody
Gate D1, D2, D3 9,787 617 3 6
Gate D4, D5, D6 10,264 655 4
Main Terminal
Narrowbody
(Widebody)
Gate T1, T2, T3, T4, T5, T6 22,160 1,396 8(6) 6 (3) Notes:
a. The numbers accounted for load factors on each flight b. The gate area is very tight to accommodate all the passengers on one narrowbody flight c. The gate area is very tight to accommodate all the passengers on two narrowbody flights concurrently d. Red text indicates deficiencies.

BNA Airport Master Plan Update
Chapter 4 – Facility Requirements - DRAFT
Page | 79
4.3.9.3. Holdroom Space Requirements
The holdroom space requirements analysis was performed to determine expansion required to
maintain the optimal level of service in the holdrooms, if the airport were to provide unconstrained
operational flexibility to schedule flights at all gates at any time. Table 4-54 and Figure 4-23
summarize the total area required for each gate area. Similar to the capacity analysis, except for the
newly designed D gates and T gates, most of the gate areas are undersized and would require
expansion or other innovative solutions in order to serve all projected gate demand. Any additional
gates and/or new concourse(s) proposed for the Master Plan will also be subject to the same design
criteria so that holdrooms are sufficiently sized to allow for unconstrained operational flexibility.
Table 4-54. Holdroom Facility Requirements
Gate Areas
Baseline
Conditions -
Area Size (s.f.)
Adjusted
Seated &
Standing
Area (s.f.)
Boarding
Lane (s.f.)
Podium
Area (s.f.)
Total Area
(s.f.) (a)
Baseline Area/
Total Area
Concourse A
Gate A5, A6 5,730 4,158 555 666 5,380 107%
Gate A3, A4 2,728 4,158 535 642 5,340 51%
Gate A1, A2 3,250 4,158 535 642 5,340 61%
Concourse B
Gate B3, B5 8,059 4,158 550 660 5,370 150%
Gate B7 2,052 2,079 275 330 2,690 76%
Gate
B9,B11,B13,B12,B10 7,123 10,395 1375 1650 13,420 53%
B6,B8 3,730 4,158 550 660 5,370 69%
Concourse C
Gate C4 2,988 2,079 315 378 2,780 107%
Gate C7, C9 4,731 4,158 621 745 5,530 86%
Gate C6, C8 4,770 4,158 636 763 5,560 86%
Gate, C10, C11, C12,
C13, C14 10,696 10,395 1581 1897 13,880 77%
Gate C15,C17 3,631 4,158 633 760 5,560 65%
Gate C16,C18 4,828 4,158 641 769 5,570 87%
Gate
C19,C20,C21,C22,C25 10,114 10,395 1,587 1,904 13,890 73%
Concourse D
Gate D1, D2, D3 9,787 6,237 941 1129 8,310 118%
Gate D4,D5, D6 10,264 6,237 941 1129 8,310 124%
Main Terminal
Gate T1,T2,T3, T4, T5,
T6 (Widebody
Configuration)
22,160 9,389 1214 1080 11,690 190%
Gate T1,T2,T3, T4, T5,
T6 (Narrowbody
Configuration)
22,160 12,474 2428 2160 17,070 130%
Notes: a. Numbers rounded up to the nearest tenths. b. Red text indicates facility deficiencies.

BNA Airport Master Plan Update
Chapter 4 – Facility Requirements - DRAFT
Page | 80
Figure 4-23. Holdroom Facility Requirements

BNA Airport Master Plan Update
Chapter 4 – Facility Requirements - DRAFT
Page | 81
4.3.10. Concessions
Concessions space planning is important to the overall terminal program because of its impact
on airport revenues as well as passenger convenience/satisfaction. Concessions programs are
such a specialized aspect of terminal facility needs, that a more refined detailed analysis is
typically conducted by a firm specializing in concessions programming and planning. For
master planning purposes, the primary goal is to identify existing and potential issues and
recommend general programming needs based on industry guidelines. This section evaluates
the overall concession space throughout the entire terminal complex and how it is allotted.
4.3.10.1. Key Assumptions
Concessions are provided both prior to and after the SSCP (pre-security and post-security). The
total concessions area in the baseline condition amounts to 123,273 square feet according to
the BNA Vision floor plans. The standard metrics recommended for benchmarking concession
space are based on annual enplanements, in multiples of one thousand. IATA specifies that the
typical concession spaces (per 1,000 enplaned passengers) should range from 8.6 square feet to
16.1 square feet.
It is also assumed that the types of concessions at
BNA will be split as indicated in Table 4-55. The
breakdown percentage is based on general
concession planning parameters identified in the
IATA ADRM as well as local characteristics at BNA.
4.3.10.2. Concessions Capacity
Table 4-56 summarizes the range of concessions capacity in terms of annual enplanements and
total passengers, based on the varying concessions space requirements per 1,000 enplaned
passengers. Given the 123,273 square feet of concessions space throughout the passenger
terminal, the annual total passenger capacity ranges from 15.3 MAP to 28.7 MAP, depending on
the space provided per 1,000 enplaned passengers.
Table 4-56. Concession Capacity
8.6 SF/1,000
Enplaned Pax
12.4 SF/1,000
Enplaned Pax
16.1 SF/1,000
Enplaned Pax
Existing/Proposed Area (sf) 123,273
Annual Enplaned Passengers Capacity 14,334,070 9,981,619 7,656,708
Annual Total Passenger Capacity 28.7 MAP 20.0 MAP 15.3 MAP Source: AECOM Analysis.
Type of Concession Percentage
Duty-Free 5%
Specialty Retail, Duty Paid 35%
Convenience Retail 10%
Food and Beverage 45%
Personal or Business Services 5%
Total 100%
Table 4-55. Concession Type Split

BNA Airport Master Plan Update
Chapter 4 – Facility Requirements - DRAFT
Page | 82
4.3.10.3. Concessions Facility Requirements
For the purposes of this concessions requirements analysis, the midpoint of the IATA ADRM
recommended range was used to evaluate concessions facility requirements. Based on the
assumption of providing 12.4 square feet for every 1,000 enplaned passengers, Table 4-57
summarizes the facility requirements for total concessions area, as well as a breakdown for the
space required for each type of concessions. The total concessions area will become deficient
beyond 2027 and could be expanded.
Table 4-57. Concession Facility Requirements
Future Number of Flights
Baseline 2022 2027 2032 2037
Annual Enplaned Passengers1 7,076,371
(2017) 9,047,142 9,938,318 10,886,036 11,935,070
Total Required Area for Concessions
(s.f.)(a) 123,273 112,200 123,250 135,000 148,010
Concession Space Split
Duty-Free n.a. 5,610 6,170 6,750 7,410
Specialty Retail, Duty Paid n.a. 39,270 43,140 47,250 51,810
Convenience Retail n.a. 11,220 12,330 13,500 14,810
Food and Beverage n.a. 50,490 55,470 60,750 66,610
Personal or Business Services n.a. 5,610 6,170 6,750 7,410 Source:
1. BNA Master Plan Update 2018: Aviation Demand Forecasts Report Notes:
a. Numbers rounded up to the nearest tenths. b. Red text indicates facility deficiency.
4.3.11. Restrooms
Often the customer comments that airports receive relate to the convenience, location, design,
and cleanliness of public restrooms in the terminal. According to the ACRP Report 130,
Guidebook for Airport Terminal Restroom Planning & Design, the unique considerations of
airport terminal restrooms include continuous availability and operation, changing passenger
demographics, evolving customer expectations, and greater space requirements to
accommodate luggage and operational/maintenance needs. As part of the BNA Vision
program, an extensive analysis was conducted of restrooms to determine fixture count
requirements and optimum location. The BNA Vision analysis was used as the basis for the
Master Plan restroom requirements analysis.
4.3.11.1. Key Assumptions
Public restrooms at BNA are located both before and after security. Each public restroom
module consists of a male, female, and family/assisted facility. The module should be located so
that maximum walking distance is 250-feet or essentially 500-feet between modules. Restroom
modules range in size from 1,500 square feet to 2,200 square feet depending on the number of

BNA Airport Master Plan Update
Chapter 4 – Facility Requirements - DRAFT
Page | 83
fixtures to be accommodated. Table 4-58 provides a baseline condition inventory of the
restroom facilities provided at BNA in terms of number of fixtures and modules in different
terminal areas.
Table 4-58. Restroom Baseline Conditions
Number of
Modules Total Male Fixtures
Total Female
Fixtures
Secure Area
Concourse A 2 25 28
Concourse B 3 26 22
Concourse C 4 52 70
Concourse D 3 20 24
Main Terminal 2 18 20
FIS Facility 1 10 12
Non-secure Area
Departures Floor 4 37 29
Arrivals Floor 4 25 32 Source: BNA Vision CAD floor plans
The capacity and facility requirements analysis for the public restrooms is performed in
accordance with the methodologies and guidelines in the ACRP Report 130, Guidebook for
Airport Terminal Restroom Planning & Design. Table 4-59 summarizes the key assumptions used
in this analysis. Also the following principles are followed in the calculation:
- The restroom requirements for the secure area are based on the number of enplaning
and deplaning passengers.
- The restroom requirements for the non-secure area account for the additional needs
from well-wishers who send off enplaning passengers and the meeters/greeters who
wait for the deplaning passengers.
- For the non-secure area, one male fixture should be provided per 70 peak hour
passengers for the first 400 passengers, and one male fixture per 200 peak hour
passengers in excess of 400 passengers.
- A female increase factor is applied to the analysis as recommended in the ACRP report.
Table 4-59. Restroom Key Assumptions
Key Input Factor Unit Assumption
Typical Seats (Narrowbody) – Domestic1 Seats 200
Typical Seats (Widebody) – International1 Seats 300
Load Factor (Narrowbody) – Domestic2 % 82.6%
Load Factor (Widebody) – International2 % 82.9%
Percentage of Male Passengers3 % 50%
Percentage of Passengers during Peak 20 minutes3 % 50%
Percentage of Passengers Using Restroom3 % 50%
Female Increase Factor3 n.a. 1.5
Increase Factor for Well-Wishers3 % 20%

BNA Airport Master Plan Update
Chapter 4 – Facility Requirements - DRAFT
Page | 84
Key Input Factor Unit Assumption
Increase Factor for Meeters & Greeters3 % 30%
Sources: 1. Conservative estimates about number of seats based on typical seat configurations on narrow body and wide body aircraft 2. BNA Master Plan Update 2018: Demand Forecast Report 3. ACRP Report 130, Guidebook for Airport Terminal Restroom Planning & Design
4.3.11.2. Public Restroom Capacity
Based on the methodology specified in ACRP Report 130, the number of passengers that the
restrooms in each terminal area could accommodate during the peak 20 minutes was estimated
and summarized in Table 4-60.
Table 4-60. Public Restroom Baseline Inventory
Total Male
Fixtures
Total
Female
Fixtures
Passengers
Accommodated During
the Peak 20-Minutes(a) (b)
Secure Area
Concourse A 25 28 650
Concourse B 26 22 676
Concourse C 52 70 1,352
Concourse D 20 24 520
Main Terminal 18 20 468
FIS Facility 10 12 260
Non-secure Area
Departures Floor 37 29 1,387
Arrivals Floor 25 32 819 Notes:
a. The numbers only account for passengers who have the need to use the restroom facility during the peak 20 minutes. b. The total number of passengers for the secure area and non-secure are not provided because the peak 20-minutes happen at
different times during the day in different terminal areas.
4.3.11.3. Public Restroom Facility Requirements
This restroom requirements analysis for the secure-side facilities is based on a conservative
scenario assuming all gates are occupied by flights during the same hour. This scenario would
result in the maximum number of passengers in the concourses and secure portion of the
terminal. Table 4-61 summarizes the number of fixtures required for each concourse, the FIS
and the post-security screening portion of the terminal.
Overall, the public restrooms post-security screening and the FIS meet and exceed the facility
requirements in terms of total number of fixtures. And, each restroom module is well within the
maximum 250-foot walking distance criteria. Any new restroom modules added in the
alternative’s analysis should be sized and located using the same criteria.

BNA Airport Master Plan Update
Chapter 4 – Facility Requirements - DRAFT
Page | 85
Table 4-61. Public Restroom Facility Requirements in Secure Area
Number
of Gates
Total
Seats
Total
Passengers (a)
Peak 20-
minute
Passengers(b)
Peak 20-min
Passengers
Using
Restrooms(c)
Required
Male's
Fixtures
Required
Female's
Fixtures
Concourse A 7 1,400 1,157 579 290 12 18
Concourse B 10 2,000 1,652 826 413 16 24
Concourse C 19 3,800 3,139 1,570 785 31 47
Concourse D 6 1,200 992 496 248 10 15
Main Terminal 6 (NB) 1,200 992 496 248 10 15
FIS 3 (WB) 900 747 374 187 8 12 Notes:
a. After accounting for load factors b. Assuming 50% of peak hour passengers concentrate in the peak-20 minute c. Assuming 50% of passengers use the restrooms
Table 4-62 summarizes the number of fixtures required in the non-secure area based on the
peak hour enplanements for the departures level and peak hour deplanements for the arrivals
level. It is noteworthy that the number of female’s fixtures provided on the departures level is
lower than that of male’s fixtures, which will result in a deficiency based on projected activity
levels. The arrivals level will observe deficiency in both male’s and female’s fixtures. In the
baseline condition, all the non-secure restrooms are also within the maximum walking distance
from one another. Some smaller modules only have three fixtures per gender. The non-secure
restrooms need to be expanded to accommodate the projected future demand and also meet
the minimum fixtures per module requirements.
Table 4-62. Public Restroom Facility Requirements in Non-Secure Area
Baseline
Conditions 2022 2027 2032 2037
Departures
Peak Hour Enplanements n.a 3,118 3,425 3,752 4,114
Design Demand (after accounting
for well-wishers) n.a 4,054 4,453 4,878 5,349
Required Male's Fixtures(a)
25 24 26 29 31
Required Female's Fixtures(b)
32 36 39 44 47
Arrivals
Peak Hour Deplanements n.a 3,391 3,725 4,080 4,473
Design Demand (after accounting
for Meeters/Greeters) n.a 4,070 4,470 4,896 5,368
Required Male's Fixtures(a)
37 25 27 29 31
Required Female's Fixtures(b)
29 38 41 44 47 Notes:
a. 1 fixture per 70 peak hour passengers for first 400 passengers + 1 fixture per 200 peak hour passengers in excess of 400 passengers b. Accounting for the female increase factor of 1.5. c. Red text denotes deficiencies

BNA Airport Master Plan Update
Chapter 4 – Facility Requirements - DRAFT
Page | 86
4.3.12. Supporting Functions
4.3.12.1. Airport Support
This functional category includes a number of spaces such as administrative offices, Welcome
Centers/Information desks, United Service Organizations (USO), Airport Operations and
Maintenance, etc. Table 4-63 provides the baseline conditions for the airport support areas.
Based on discussions with airports, these spaces are typically increased by 15% to 20% over the
entire planning period. Table 4-64 summarizes the required area for airport support functions in
a range based on 15% to 20% over the planning period.
Table 4-63. Airport Support Baseline Conditions
Baseline Airport Support Areas Non-Secure
Area (s.f.) Secure Area (s.f.)
Total (s.f)
Level 1 – Ground Transportation 99 5,761 5,860
Level 2 – Arrivals 2,764 15,677 18,441
Level 3 – Departures 8,076 4,346 12,422 Source: AECOM Analysis.
Table 4-64. Airport Support Facility Requirements
Required Airport Support Areas Non-Secure
Area (s.f.) Secure Area (s.f.)
Total (s.f)
Level 1 – Ground Transportation 120 ~ 150 6,630 ~ 7,960 6,740 ~ 8,090
Level 2 – Arrivals 3,180 ~ 3,820 18,030 ~ 21,640 21,210 ~ 25,460
Level 3 – Departures 9,290 ~ 11,150 5,000 ~ 6,000 14,290 ~ 17,150
Source: AECOM Analysis.
4.3.12.2. Airline Support
Airline support areas are typically airline operations spaces associated with gate operations, pilot
lounges, operations and administrative space, janitorial spaces, etc. Airlines vary significantly in
terms of the way they operate and thus the amount of space they need. For a master plan level
analysis, a per-gate square footage factor is used to estimate how much additional airline
support space is needed when the number of gates increases.
Table 4-65 summarizes the airline support areas in the baseline condition. Due to the nature of
airline support operations, all the areas are post-security, and the majority of the airline support
areas are on the arrivals/apron level to support apron activities of servicing the aircraft.
Table 4-65. Airline Support Baseline Conditions
Baseline Airline Support Areas Secure Area (s.f.)
Level 1 – Ground Transportation 363
Level 2 – Arrivals 63,711
Level 3 – Departures 3,965
Total 68,039 Source: AECOM Analysis.
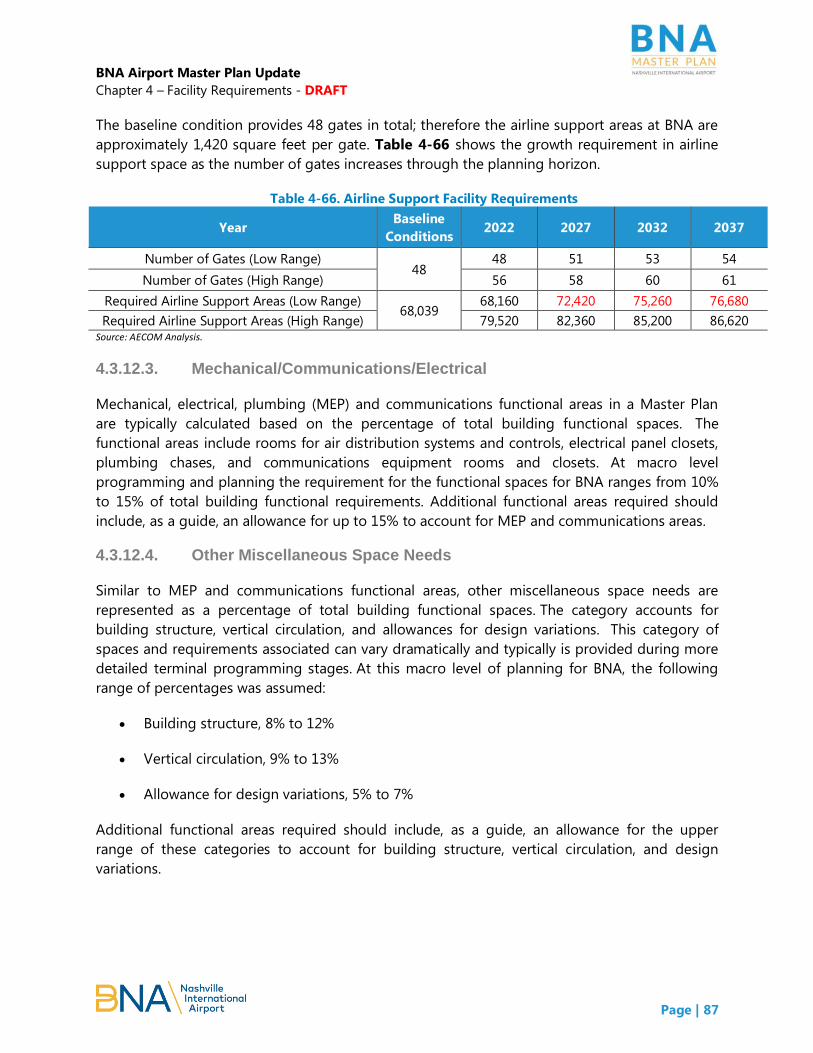
BNA Airport Master Plan Update
Chapter 4 – Facility Requirements - DRAFT
Page | 87
The baseline condition provides 48 gates in total; therefore the airline support areas at BNA are
approximately 1,420 square feet per gate. Table 4-66 shows the growth requirement in airline
support space as the number of gates increases through the planning horizon.
Table 4-66. Airline Support Facility Requirements
Year Baseline
Conditions 2022 2027 2032 2037
Number of Gates (Low Range) 48
48 51 53 54
Number of Gates (High Range) 56 58 60 61
Required Airline Support Areas (Low Range) 68,039
68,160 72,420 75,260 76,680
Required Airline Support Areas (High Range) 79,520 82,360 85,200 86,620 Source: AECOM Analysis.
4.3.12.3. Mechanical/Communications/Electrical
Mechanical, electrical, plumbing (MEP) and communications functional areas in a Master Plan
are typically calculated based on the percentage of total building functional spaces. The
functional areas include rooms for air distribution systems and controls, electrical panel closets,
plumbing chases, and communications equipment rooms and closets. At macro level
programming and planning the requirement for the functional spaces for BNA ranges from 10%
to 15% of total building functional requirements. Additional functional areas required should
include, as a guide, an allowance for up to 15% to account for MEP and communications areas.
4.3.12.4. Other Miscellaneous Space Needs
Similar to MEP and communications functional areas, other miscellaneous space needs are
represented as a percentage of total building functional spaces. The category accounts for
building structure, vertical circulation, and allowances for design variations. This category of
spaces and requirements associated can vary dramatically and typically is provided during more
detailed terminal programming stages. At this macro level of planning for BNA, the following
range of percentages was assumed:
Building structure, 8% to 12%
Vertical circulation, 9% to 13%
Allowance for design variations, 5% to 7%
Additional functional areas required should include, as a guide, an allowance for the upper
range of these categories to account for building structure, vertical circulation, and design
variations.

BNA Airport Master Plan Update
Chapter 4 – Facility Requirements - DRAFT
Page | 88
4.3.13. Terminal Facility Requirements Summary
o Check-In Facilities:
o Adjust allocation of check-in methods throughout the planning period to maximize
available terminal space (i.e. use of more self-serve kiosks and bag drop positions
might lessen need for additional full-service counter positions to avoid ticketing
expansions)
SSCP:
o Meet TSA checkpoint design standards to maximize throughput
o Enlarge the queue area
o Add one additional lane by 2037
o Convert some standard lanes to Pre-check lanes to absorb increasing demand from
projected pre-check passengers
CBIS:
o One additional EDS machine by 2037 and enlarged CBIS area
BMU:
o Requires expansion by 2022
Domestic Baggage Claim:
o Requires one additional claim devices by 2037
FIS:
o The new IAF has the capacity to process two international arrivals during the peak
30-mins, but all functional areas would require expansion IF the number of peak hour
arrivals reach 3
Holdrooms:
o Most of Concourse A, B, and C holdrooms require expansion; BNA Vision “T” gates
and Concourse D gates have sufficient holdrooms. Any additional gates should be
designed with adequate holdroom space
Concessions:
o Concessions areas require expansion by 2032
Restrooms:
o Restrooms in the secure area are adequate, whereas those in the non-secure area
(departures hall and domestic baggage claim) require expansion in both male and
female fixtures
Supporting functions:
o Airport support and airline support require expansion to support the growing
demand from other functional areas
BNA Airport Master Plan Update
Chapter 4 – Facility Requirements - DRAFT
Page | 89
4.4. Landside Capacity & Requirements
This Section presents requirements for key on-Airport ground access and parking facilities and
describes data sources, assumptions, and key elements of the methodology. Facilities
addressed in this chapter include on-airport roadways, terminal curbsides, commercial ground
transportation and public transit facilities, public and employee parking, and rental car facilities.
Requirements are based on a capacity analysis of existing facilities (as of October 2018) and
capacity estimates determined in 2016 and 2017 as part of BNA Vision planning and
programming efforts.
The data used in the BNA Vision analyses has been updated to reflect more recent passenger
activity as described Chapter 3, Aviation Demand Forecasts (the Forecast). For facilities not
specifically addressed in BNA Vision, such as valet and employee parking, requirements are
based on conditions observed in 2018 and early 2019. Facility requirements correspond to the
following planning activity levels:
Baseline (2017 activity): 7.1 million annual enplaned passengers (MEP)
Updated Baseline (2018 activity): 8.0 million MEP
Planning Activity Level (PAL) 1 (2022): 9.05 MEP
PAL 2 (2027): 9.9 MEP
PAL 3 (2032): 10.9 MEP
PAL 4 (2037): 11.9 MEP
4.4.1. Data Sources
Data collected, assembled, and used for the analysis of ground access and parking requirements
include:
Monthly passenger enplanements from January 2010 through October 2018
Hourly parking occupancy data for October 2017 and October 2018 for the Terminal
Garage, Terminal Lot A, Economy Lot B, and Economy Lot C
Hourly vehicle pickups and drop-offs for Valet Parking facility for October 2018
Daily Valet Parking and BNA Express overnight vehicle counts for October 2018 and
October 2017
BNA Airport Master Plan Update
Chapter 4 – Facility Requirements - DRAFT
Page | 90
Transportation Network Company (TNC) pickup and drop-off transaction records for
August 2018, monthly pickup volumes for October 2014 through October 2018, and
monthly drop-off volumes for December 2014 to October 2018
Monthly taxicab pickup volumes for October 2014 through October 2018
Monthly rental car contracts and rental days for January 2010 through September 2018
Surveys of rental car operators regarding existing and anticipated future facility needs
and fleet size and operating characteristics
Peak accumulation counts for the Employee Parking Lot in summer and winter
2018/2019
Hourly entry and exit volumes for employees parking in the Employee Parking Lot and
Economy Lot C for July through November 2018
Number of employee access cards and associated spaces in each employee parking
facility in the fall of 2018
In addition, the analysis of facility requirements incorporated data and findings developed as
part of the BNA Vision Plan, including the following:
Basis of Design Report, Terminal Area Parking Garage, prepared by Atkins and Walker
Consultants
Technical Memorandum: Analysis of Landside Roadway System Configurations to
Compliment the Donelson Pike Realignment Project, prepared by Atkins
June 2018 Parking Demand Analysis, prepared by Walker Consultants
Roadway Analyses, Curbside Analyses, and Ground Transportation Center Program,
prepared by InterVISTAS in September 2017
4.4.2. Activity Growth/Mode Share Assumptions
Traditionally, airport master plans have projected ground transportation and parking facility
requirements by assuming that demand would change in direct proportion with changes in
originating and terminating passengers. This Master Plan, however, cannot rely solely on that
traditional approach. Since the introduction of Transportation Network Company (TNC) services
at the Airport in 2014, passenger use of TNCs has increased significantly while demand (on a
per-passenger basis) for public parking, rental cars, and taxicabs has declined. Given the
increasing trend in TNC popularity, it is projected that airport passengers will rely less on public
parking, rental cars, and taxicabs in favor of TNCs and other technologies that are expected to
reduce demand for traditional airport access and parking. While the specific timing and impact

BNA Airport Master Plan Update
Chapter 4 – Facility Requirements - DRAFT
Page | 91
of these emerging technologies on facility planning cannot be predicted, activity growth
assumptions presented in this Section project continued growth in total demand for public
parking facilities, but at a declining rate in demand for public parking, rental cars, and taxicabs
on a per passenger basis.
It is also expected that demand for public parking, rental car, and taxicab facilities could be
affected by emerging technology improvements such as “car sharing” and “autonomous
vehicles”. Car sharing is a trend that relies on peer-to-peer car sharing (i.e., Turo) and/or
subscription-based shared fleets (such as ZipCar), and less on personally-owned automobiles.
Customers of these services would likely choose a vehicle near their point of origin within the
region (i.e., home or business), drive to the airport, and drop the vehicle off at a designated
location on or near the airport. Upon their return, they would pick up a vehicle at the
designated location on or near the airport and drive it to a location near their destination within
the region.
Through the planning period, a share of vehicles in the general fleet will likely be autonomous.
While it may take several years for these vehicles to comprise a significant share of the fleet, it
appears likely that over time, they could reduce demand for airport parking and/or rental cars
due to their ability to travel unoccupied to off-airport locations. In the event they cannot (or are
not permitted to) travel unoccupied, it appears likely that the early adopters of autonomous
vehicles will be TNCs (due to goals of reducing driver costs), rental car companies (due to rapid
fleet turnover), and car-sharing services (due to ability to disperse higher vehicle costs among
multiple subscribers). Given that TNCs and rental car companies serve significant shares of
airport customers, autonomous vehicles are likely to either reduce demand for airport parking
and rental cars by themselves or increase the popularity of other services that, in turn, would
reduce demand for airport parking and rental cars.
4.4.2.1. Recent Historical Trends
Figure 4-24 summarizes historical demand levels, on a per-passenger basis, for rental cars,
taxicabs, TNCs, and public parking for the month of October in 2014 through 2018. The rental
car values reflect the number of contracts per enplaning passenger; taxicab values reflect the
number of pickups per deplaning passenger; and TNC values reflect total drop-offs and pickups
per total passengers. The public parking values reflect the ratio of the number of occupied
spaces during a typical busy day to the monthly enplanements, expressed as a number of spaces
per 1,000 monthly enplaning passengers.

BNA Airport Master Plan Update
Chapter 4 – Facility Requirements - DRAFT
Page | 92
Figure 4-24. Historical Activity per Passenger, Selected Modes
Source: InterVISTAS, from data provided by MNAA.\
As shown, since their introduction in 2014, TNC trips per passenger have increased steadily from
near 0 in 2014 to over 0.15 in 2018. Over the same period, rental car transactions per
enplanement have decreased by 0.146 to 0.117 (a 20% reduction); taxicab trips per deplanement
have decreased from 0.085 to 0.048 (a 44% reduction); and public parking spaces per 1,000
monthly enplanements have decreased from 17.8 to 14.3 (a 20% reduction). The reduction in
rental car, taxicab, and public parking demand appears to be predominantly due to increased
use of TNCs, as they appear to have also attracted customers who previously used other modes,
but reductions in public parking could also be due to recent changes in the mix of resident
versus visiting passengers.

BNA Airport Master Plan Update
Chapter 4 – Facility Requirements - DRAFT
Page | 93
4.4.2.2. Future Mode Share Projections
Given the significant and sudden change in passenger mode choice at the Airport since 2014, it
is difficult to estimate how behavior will continue to evolve through the Master Plan planning
horizon, especially considering significant BNA Vision construction disruptions affecting close-in
garage parking supply and terminal area circulation. To capture that uncertainty, potential
outcomes for TNCs, public parking, rental cars, and taxicabs were established for two scenarios,
as shown on Figure 4-25, Table 4-67 and Table 4-68: “high TNC impact” and “low TNC
impact.” For purposes of these projections, the “TNCs” activity growth assumptions capture
existing TNC services as well as future services such as car sharing and the influence of
connected/autonomous vehicles. It is recognized, however, that the future split between TNCs
and the new services is unknown. Therefore, for planning purposes, it is assumed that the new
services operate similar to TNCs.
The recent and ongoing significant changes in mode shares at the Airport and at other U.S.
airports provide an uncertain basis for the projection of future passenger behavior. Therefore,
the values shown on Figure 4-25, Table 4-67 and Table 4-68 are based substantially on
professional judgement, informed by observations at other U.S. airports where TNC mode shares
appear to be stabilizing, and do not reflect a mode share forecast model.
TNCs
In general, both scenarios assume that airline passenger willingness to use TNCs will continue to
increase, though at slightly lower growth rates than observed since 2014. Through 2022, the
TNC growth rate is assumed to predominantly comprise a continued market share increase at
the expense of other access modes as the TNC market continues to mature. Under the “high
TNC impact” scenario, TNC trips per passenger are expected to increase from 0.15 in 2018 to
0.22 in 2022. Under the “low TNC impact” scenario, TNC trips per passenger are expected to
increase to 0.19 by 2022. After 2022, the growth rate assumes that the TNC market is mature,
but the TNC share of activity continues to increase due to the increasing influence of car sharing
services and connected/autonomous vehicles. The difference between the “high” and “low” TNC
impact scenarios reflects uncertainty regarding (a) the extent to which the TNC market at the
Airport is approaching maturity and (b) the future adoption rate of car sharing services and
connected/autonomous vehicles. By 2037, the “high TNC impact” scenario assumes 0.33 TNC
trips per passenger and the “low TNC impact” scenario assumes 0.25 TNC trips per passenger.
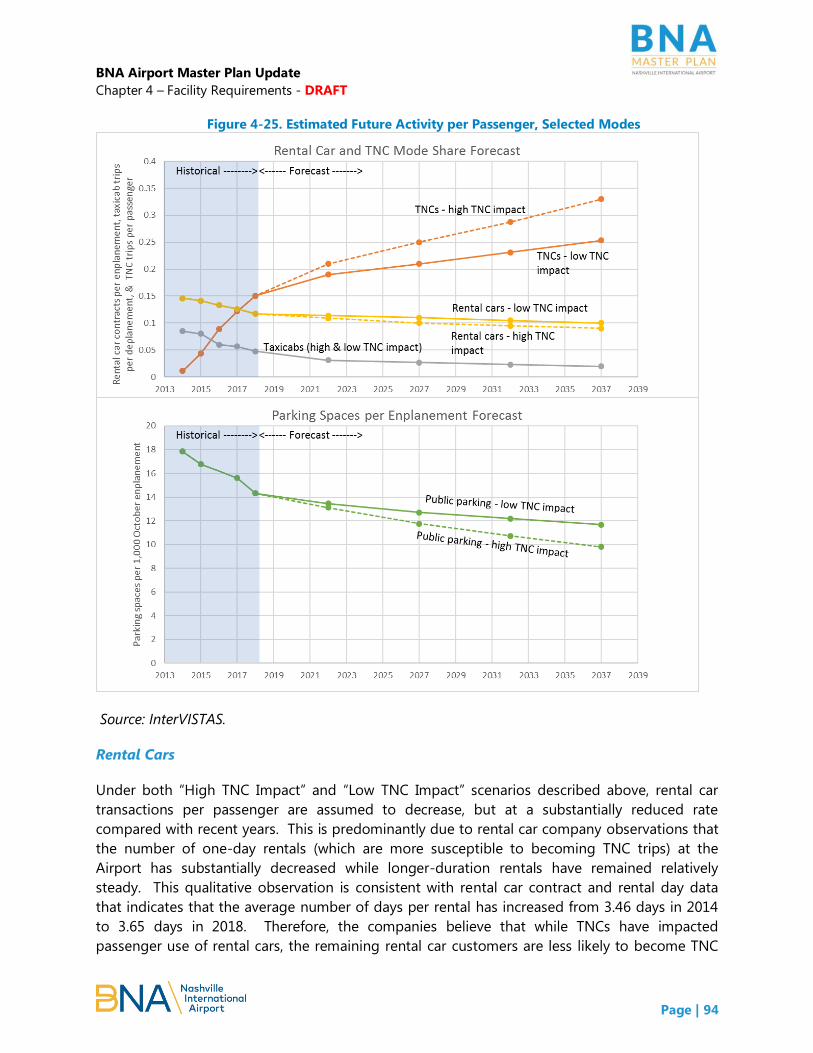
BNA Airport Master Plan Update
Chapter 4 – Facility Requirements - DRAFT
Page | 94
Figure 4-25. Estimated Future Activity per Passenger, Selected Modes
Source: InterVISTAS.
Rental Cars
Under both “High TNC Impact” and “Low TNC Impact” scenarios described above, rental car
transactions per passenger are assumed to decrease, but at a substantially reduced rate
compared with recent years. This is predominantly due to rental car company observations that
the number of one-day rentals (which are more susceptible to becoming TNC trips) at the
Airport has substantially decreased while longer-duration rentals have remained relatively
steady. This qualitative observation is consistent with rental car contract and rental day data
that indicates that the average number of days per rental has increased from 3.46 days in 2014
to 3.65 days in 2018. Therefore, the companies believe that while TNCs have impacted
passenger use of rental cars, the remaining rental car customers are less likely to become TNC

BNA Airport Master Plan Update
Chapter 4 – Facility Requirements - DRAFT
Page | 95
customers due to longer rental durations. The rental car values shown on Table 4-67 and Table
4-68 assume a slight continued decrease in rental car activity per passenger at the Airport and a
small difference in the “low” and “high” TNC impact scenarios. Rental car contracts per
passenger are expected to decline from 0.117 in 2018 to between 0.09 (“high TNC impact”
scenario) and 0.10 (“low TNC impact” scenario) by 2037.
Table 4-67. Future Demand Multipliers due to Passenger Growth and Mode Changes
“High TNC Impact”
Scenario 2018 2022 2027 2032 2037
Annual enplanements 8,000,000 9,047,142 9,938,318 10,886,036 11,935,070
Peak hour enplanements 2,757 3,118 3,425 3,752 4,114
Peak hour deplanements 2,999 3,391 3,725 4,080 4,473
TNCs
Trips per passenger 0.151 0.21 0.25 0.29 0.33
Multiplier due to passenger
increase 1 1.13 1.24 1.36 1.49
Multiplier due to mode
change 1 1.39 1.66 1.91 2.19
Combined multiplier 1 1.58 2.06 2.59 3.27
Rental cars
Contracts per enplanement 0.117 0.109 0.100 0.095 0.090
Multiplier due to passenger
increase 1 1.13 1.24 1.36 1.49
Multiplier due to mode
change 1 0.93 0.85 0.81 0.77
Combined multiplier 1 1.05 1.06 1.10 1.15
Public parking
Occupied spaces per 1,000
monthly enplanements 14.17 12.98 11.75 10.73 9.80
Multiplier due to passenger
increase 1 1.13 1.24 1.36 1.49
Multiplier due to mode
change 1 0.92 0.83 0.76 0.70
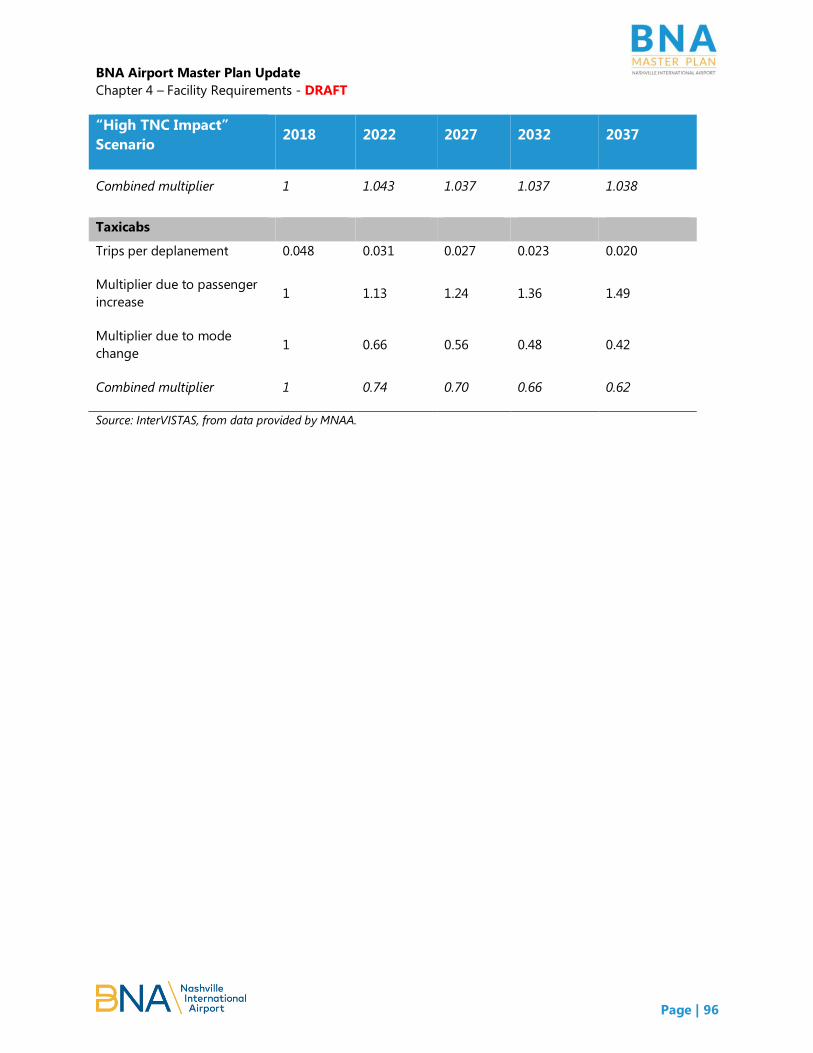
BNA Airport Master Plan Update
Chapter 4 – Facility Requirements - DRAFT
Page | 96
“High TNC Impact”
Scenario 2018 2022 2027 2032 2037
Combined multiplier 1 1.043 1.037 1.037 1.038
Taxicabs
Trips per deplanement 0.048 0.031 0.027 0.023 0.020
Multiplier due to passenger
increase 1 1.13 1.24 1.36 1.49
Multiplier due to mode
change 1 0.66 0.56 0.48 0.42
Combined multiplier 1 0.74 0.70 0.66 0.62
Source: InterVISTAS, from data provided by MNAA.

BNA Airport Master Plan Update
Chapter 4 – Facility Requirements - DRAFT
Page | 97
Table 4-68. Future Demand Multipliers due to Passenger Growth and Mode Changes
“Low TNC Impact” Scenario 2018 2022 2027 2032 2037
Annual enplanements 8,000,000 9,047,142 9,938,318 10,886,036 11,935,070
Peak hour enplanements 2,757 3,118 3,425 3,752 4,114
Peak hour deplanements 2,999 3,391 3,725 4,080 4,473
TNCs
Trips per passenger 0.151 0.19 0.21 0.23 0.25
Multiplier due to passenger
increase 1 1.13 1.24 1.36 1.49
Multiplier due to mode change 1 1.26 1.39 1.53 1.68
Combined multiplier 1 1.43 1.73 2.08 2.51
Rental cars
Contracts per enplanement 0.117 0.114 0.110 0.105 0.100
Multiplier due to passenger
increase 1 1.13 1.24 1.36 1.49
Multiplier due to mode change 1 0.97 0.94 0.90 0.85
Combined multiplier 1 1.10 1.17 1.22 1.28
Public parking
Occupied spaces per 1,000 monthly
enplanements 14.06 13.45 12.72 12.19 11.67
Multiplier due to passenger
increase 1 1.13 1.24 1.36 1.49
Multiplier due to mode change 1 0.96 0.90 0.87 0.83
Combined multiplier 1 1.081 1.120 1.178 1.237
Taxicabs
Trips per deplanement 0.048 0.031 0.027 0.023 0.020
Multiplier due to passenger
increase 1 1.13 1.24 1.36 1.49
Multiplier due to mode change 1 0.66 0.56 0.48 0.42
Combined multiplier 1 0.74 0.70 0.66 0.62
Source: InterVISTAS, from data provided by MNAA.
Taxicabs

BNA Airport Master Plan Update
Chapter 4 – Facility Requirements - DRAFT
Page | 98
Taxicab trips per passenger are expected to continue to decline through the planning period,
though the rate of decrease is expected to be lower than observed since 2014 (most of the
decrease occurred from 2015 to 2016 with a much lower rate occurring after 2016). Given the
relatively low share of taxicab activity, it is assumed that the “high” and “low” TNC impact
scenarios would be substantially similar. Taxicab trips per deplanement are expected to decline
from 0.048 in 2018 to 0.020 by 2037.
Public Parking
For purposes of assessing the impact of TNCs and predicting future parking demands, parking
demand is expressed in terms of occupied spaces per 1,000 monthly enplanements. Through
2037, the pattern of future parking demand substantially mirrors that of TNC activity growth. In
2018, during typical busy periods of the Airport’s busy month for parking (October), there were
approximately 10,860 occupied public parking spaces. When compared with the October 2018
monthly enplanements (approximately 771,000), parking demand can be expressed as 14.09
occupied spaces per 1,000 monthly enplanements. Under the “high TNC impact” scenario, this
ratio is expected to reduce to 12.99 by 2022 and 9.80 by 2037. Under the “low TNC impact”
scenario, this ratio is expected to reduce to 13.46 by 2022 and 11.67 by 2037.
Use in Facility Requirements Estimates
The future activity levels and corresponding facility requirements described in this section are
expressed in terms of trips per passenger or occupied spaces per passenger, but are calculated
based on monthly passenger volumes, as per the Forecast. While a range of requirements has
been prepared reflecting the “high” and “low” TNC impact scenarios described above, the
requirements presented in this chapter reflect the side of that range that would result in the
greatest facility capacity need for a given facility type.
4.4.3. Roadways
From 2018 through 2023, the Airport will be implementing improvements to the on-airport
roadways. The roadway network will be under construction as the Airport implements the
Terminal Access Roadway Improvements (TARI) project, which accommodates reconstruction of
parking facilities and the realignment of Donelson Pike. The Tennessee Department of
Transportation (TDOT) will be relocating Donelson Pike and reconfiguring the interchange
between Donelson Pike and Interstate 40. Roadway facility requirements in this Section reflect
the completed roadway network. This section projects peak hour traffic for the on-Airport
roadway network and identifies associated lane requirements. Two recent efforts have
estimated roadway capacity – a roadway microsimulation prepared for BNA Vision, and an
independent assessment by the Master Plan team.

BNA Airport Master Plan Update
Chapter 4 – Facility Requirements - DRAFT
Page | 99
4.4.3.1. Roadway Microsimulation Results (Prepared by Others)
As part of the BNA Vision planning and design process, the BNA Vision Team developed a
CORSIM microsimulation model to evaluate future conditions on the roadways. The model
results for 2041 peak hour volumes are shown on Figure 4-26. In general, the microsimulation
determined that the on-Airport roadways would operate satisfactorily upon completion of TARI
improvements, with the exception of the roadways exiting from and toward I-40. Additional
lanes entering the airport from, and exiting the airport to I-40 were proposed to TDOT; however,
the additional lanes were not accepted for programming into future TDOT capital budgets.
Figure 4-26. BNA Vision Roadway Microsimulation Results
Source: Atkins.
4.4.3.2. Independent Assessment of On-Airport Roadways
A volume-to-capacity ratio analysis was prepared independently by the Master Plan Team. As
part of the TARI project, MNAA developed peak hour traffic volumes for the on-Airport roadway
network for 2041 and assumed that in 2041, the Airport would be serving 13,277,000 annual
enplanements. To estimate volumes for the Master Plan forecast years, these 2041 volumes
were used to reflect each forecast year’s annual enplanement levels. For example, in 2027, the
Airport is expected to serve 9.9 million annual enplanements, so 2027 roadway volumes reflect
the 2041 volumes multiplied by a factor of 0.756 (9.9 divided by 13.277). Because the peak hour
volumes were based on analyses prepared as part of the TARI project, no range was established
reflecting a “high” versus “low” TNC impact scenario.

BNA Airport Master Plan Update
Chapter 4 – Facility Requirements - DRAFT
Page | 100
For each roadway link identified in the 2041 network, the projected peak hour volume was
compared to the assumed hourly link capacity to determine, based on the volume/capacity
ratio, whether an acceptable level of service would be provided. Hourly link capacity was
identified using Airport Cooperative Research Program (ACRP) Report 40, which provides hourly
roadway capacities based on the assumed roadway free-flow speed. The ACRP Report 40
values, which do not address roadways with free-flow speeds below 25 miles per hour, were
extrapolated to estimate the hourly capacity of a roadways with free-flow speeds of 15 and 20
miles per hour. Capacity values were generally reduced by an additional 10% to reflect the
presence of many drivers who would likely be unfamiliar with the roadways network (at many
U.S. airports that accommodate a large visitor population, a high proportion of those passengers
may use the Airport only once or twice per year). Table 4-69 summarizes the assumed roadway
hourly capacities and Table 4-70 summarizes the level-of-service associated with ranges of
calculated volume/capacity ratios.
Table 4-69. Assumed Roadway Capacities
Roadway free flow
speed
(miles per hour)
Hourly capacity
(vehicles per hour)
15 820
20 970
25 1,125
30 1,305
35 1,440
40 1,575
45 1,710
50 1,800
Note: Assumes 10% capacity reduction related to infrequent users.
Source: Airport Cooperative Research Program (ACRP) Report 40, Table 4-1.

BNA Airport Master Plan Update
Chapter 4 – Facility Requirements - DRAFT
Page | 101
Table 4-70. Level-of-Service Associated with Volume/Capacity Ratios
Volume / capacity ratio (a) Level-of-
service
Up to 0.26 A
0.26 to 0.42 B
0.42 to 0.60 C
0.60 to 0.80 D
0.80 to 1.0 E
Greater than 1.0 F
(a) Volume / capacity ratios shown are for roadways with a 30 – 35 miles
per hour posted speed. Ratio ranges vary slightly for other speeds.
Source: Airport Cooperative Research Program (ACRP) Report 40, Table 4-1.
Figure 4-27 depicts the roadway network following completion of the TARI project and
identifies the key roadway links used in this requirements analysis. Table 4-71 and Table 4-72
summarize, for each roadway link and each forecast year (roadway link identifiers shown in
Table 4-71 and Table 4-72 correspond with those on Figure 4-27):
Assumed free-flow speed (provided by the Airport) and corresponding per-lane capacity;
Assumed number of lanes and corresponding total roadway capacity;
Peak hour volumes;
Volume/capacity ratio and corresponding LOS; and
For roadways operating at LOS D or poorer, the number of roadway lanes required to
achieve LOS C or better. For on-Airport roadways, facility requirements reflect a desire
to achieve LOS “C” during the design hour. LOS C represents conditions where traffic
flows smoothly during peak periods but vehicles travel close together and individual
motorists find it more difficult to change lanes without other motorists’ cooperation in
providing a gap. This LOS threshold (and corresponding volume/capacity ratio) reflects a
more-stringent standard than may be used for typical urban transportation planning
because for roadways used by airline passengers, the potential result of congestion can
be more critical: a passenger may miss their flight.
The results of the independent analysis indicates that there could be on-airport roadway
deficiencies should traffic evolve differently than predicted in the CORSIM microsimulation. As
shown in Figure 4-27 and detailed in Table 4-71 and Table 4-72, eleven (11) roadway links
could be expected to operate at LOS D or poorer by 2037, including four (4) which could
experience LOS D prior to 2022 (links E, F, R, and X).

BNA Airport Master Plan Update
Chapter 4 – Facility Requirements - DRAFT
Page | 102
Link A, Airport entrance from eastbound I-40. This two-lane link is expected to
operate at LOS D through 2032. A third lane would be required to achieve LOS C
through 2032 and a fourth would be required to achieve LOS C through 2037.
Link C, Terminal approach. This four-lane roadway is expected to operate at LOS D by
2032. A fifth lane would achieve LOS C through 2037.
Link E, Terminal-area exit to the north. This three-lane roadway is expected to
operate at LOS D prior to 2022. A fourth lane would achieve LOS C through 2032 and a
fifth lane would be required to achieve LOS C prior to 2037.
Link F, Terminal-area entrance from southbound Donelson Pike. This one-lane
roadway is expected to operate at LOS D prior to 2022. A second lane would achieve
LOS C through 2037.
Link G, Terminal loop, northbound (excludes lane added from Link F). This five-lane
roadway is expected to operate at LOS D by 2032. A sixth lane would achieve LOS C
through 2037.
Link H, Terminal loop, northbound, after exit to Donelson Pike (includes lane added
from Link F). This five-lane roadway is expected to operate at LOS D by 2027. A sixth
lane would achieve LOS C through 2032 and a seventh lane would achieve LOS C by
2037.
Link M, Terminal loop, westbound. This six-lane roadway is expected to operate at
LOS C or better through 2022. A seventh lane would be required to achieve LOS C
through 2032 and an eighth would be required prior to 2037.
Link N, Terminal loop, southbound. This five-lane roadway is expected to operate at
LOS C or better through 2022. A sixth lane would achieve LOS C through 2032 and a
seventh would be required prior to 2037.
Link Q, Terminal loop exit to I-40. This three-lane roadway is expected to operate a
LOS C or better through 2022. A fourth lane would be required by 2027 to achieve LOS
C or better through 2037.
Link R, Airport exit to I-40. At its narrowest point, this one-lane roadway is expected to
operate at LOS F by 2022. LOS C would be achieved through 2037 with two additional
lanes.
Link X, Curbside exit. This two-lane roadway is expected to operate at LOS D by 2022.
A third lane would achieve LOS C through 2037.

BNA Airport Master Plan Update
Chapter 4 – Facility Requirements - DRAFT
Page | 103
Figure 4-27. Assumed Roadway Network
Source: InterVISTAS, from base map provided by AECOM.

BNA Airport Master Plan Update
Chapter 4 – Facility Requirements - DRAFT
Page | 104
Figure 4-28. Anticipated Roadway Deficiencies
Source: InterVISTAS, from base map provided by AECOM.

BNA Airport Master Plan Update
Chapter 4 – Facility Requirements - DRAFT
Page | 105
Table 4-71. Roadway Volumes and Requirements, 2022 and 2027
2022 (9.0 million annual
enplanements) (a)
2027 (9.9 million annual
enplanements)
Link identifier and description
(see Figure 4-27)
Assumed
speed (miles
per hour) (b)
Per-lane
capacity
(c)
Current or
planned
lane count
Assumed
capacity
(vehicles
per
hour)
Volume
Volume /
capacity
ratio
LOS
Lanes
required
to
achieve
LOS C or
better
Volume
Volume /
capacity
ratio
LOS
Lanes
required
to
achieve
LOS C or
better
A
Eastbound Terminal Drive
(entrance from eastbound
I-40)
25 1,125 2 2,250 1,615 0.72 D 3 1,770 0.79 D 3
B
Entrance to terminal area
from eastbound Terminal
Drive
20 970 1 970 445 0.46 C
485 0.50 C
C Terminal approach 15 819 4 3,276 1,685 0.51 C
1,850 0.56 C
D Terminal-area exit to
southbound Donelson Pike 25 1,125 1 1,125 40 0.04 A
45 0.04 A
E Terminal-area exit to north 30 1,305 3 3,915 2,145 0.55 C
2,355 0.60 D 4
F
Terminal-area entrance
from southbound
Donelson Pike
20 970 1 970 655 0.67 D 2 715 0.74 D 2
G Terminal loop northbound 30 1,305 5 6,525 3,525 0.54 C
3,875 0.59 C
H Terminal loop northbound,
after exit to Donelson Pike 30 1,305 5 6,525 3,915 0.60 C
4,305 0.66 D 6

BNA Airport Master Plan Update
Chapter 4 – Facility Requirements - DRAFT
Page | 106
2022 (9.0 million annual
enplanements) (a)
2027 (9.9 million annual
enplanements)
Link identifier and description
(see Figure 4-27)
Assumed
speed (miles
per hour) (b)
Per-lane
capacity
(c)
Current or
planned
lane count
Assumed
capacity
(vehicles
per
hour)
Volume
Volume /
capacity
ratio
LOS
Lanes
required
to
achieve
LOS C or
better
Volume
Volume /
capacity
ratio
LOS
Lanes
required
to
achieve
LOS C or
better
I Exit to southbound
Donelson Pike 25 1,125 1 1,125 265 0.24 A
290 0.26 A
J Exit from northbound
Donelson Pike 25 1,125 1 1,125 455 0.40 B
500 0.44 C
K On-ramp to southbound
Donelson Pike 25 1,125 1 1,125 340 0.30 B
370 0.33 B
L On-ramp to terminal loop
roadway 25 1,125 1 1,125 385 0.34 B
425 0.38 B
M Terminal loop westbound 30 1,305 6 7,830 4,300 0.55 C
4,725 0.60 D 7
N Terminal loop southbound 30 1,305 5 6,525 3,845 0.59 C
4,220 0.65 D 6
O Terminal loop exit to
Economy Lot C and hotels 25 1,125 1 1,125 460 0.41 B
505 0.45 C
P Terminal approach, north
of Terminal Drive 30 1,305 3 3,915 1,240 0.32 B
1,365 0.35 B
Q Terminal loop exit to I-40 30 1,305 3 3,915 2,210 0.56 C
2,430 0.62 D 4
R Airport exit to I-40 40 1,750
(d) 1 1,750 2,300 1.31 F 3 2,525 1.44 F 3

BNA Airport Master Plan Update
Chapter 4 – Facility Requirements - DRAFT
Page | 107
2022 (9.0 million annual
enplanements) (a)
2027 (9.9 million annual
enplanements)
Link identifier and description
(see Figure 4-27)
Assumed
speed (miles
per hour) (b)
Per-lane
capacity
(c)
Current or
planned
lane count
Assumed
capacity
(vehicles
per
hour)
Volume
Volume /
capacity
ratio
LOS
Lanes
required
to
achieve
LOS C or
better
Volume
Volume /
capacity
ratio
LOS
Lanes
required
to
achieve
LOS C or
better
S Terminal loop exit to
eastbound Terminal Drive 20 972 3 2,916 515 0.18 A
570 0.20 A
T Eastbound Terminal Drive
in infield area 30 1,305 3 3,915 305 0.08 A
335 0.09 A
U Westbound Terminal Drive
in infield area 30 1,305 3 3,915 110 0.03 A
120 0.03 A
V Southbound approach to
Terminal Drive 25 1,125 1 1,125 105 0.09 A
115 0.10 A
W GTC and Garage access
road 25 1,125 3 3,375 1,300 0.39 B
1,430 0.42 C
X Curbside exit 30 1,305 2 2,610 1,625 0.62 D 3 1,785 0.68 D 3
Note: Volumes are based on Terminal Access Roadway Improvements (TARI) Basis of Design Report, 35% Level, January 29, 2019, w hich provided peak hour volumes associated with 13.277
million annual enplanements. Volumes for 2022, 2027, 2032, and 2037 were estimated by applying the ratio of the forecast annual enplanements to13.277 mill ion.
(a) Roadway configuration in 2022 may be changing periodically due to ongoing construction. Volumes are hypothetical as they assume construction is complete.
(b) Reflects lowest speed portion of the link.
(c) Based on ACRP 40, extrapolated for speeds below 25 mph
(d) Assumes no capacity reduction; a driver’s only remaining decision is eastbound versus westbound I-40.
Source: InterVISTAS, from traffic volumes provided by Atkins.

BNA Airport Master Plan Update
Chapter 4 – Facility Requirements - DRAFT
Page | 108
Table 4-72. Roadway Volumes and Requirements, 2032 and 2037
2032 (10.9 million annual
enplanements)
2037 (11.9 million annual
enplanements)
Link identifier and description (see
Figure 4-27)
Assumed
speed (miles
per hour) (a)
Per-lane
capacity
(b)
Current or
planned
lane count
Assumed
capacity
(vehicles
per hour)
Volume
Volume /
capacity
ratio
LOS
Lanes
required
to
achieve
LOS C or
better
Volume
Volume /
capacity
ratio
LOS
Lanes
required
to
achieve
LOS C or
better
A
Eastbound Terminal Drive
(entrance from eastbound
I-40)
25 1,125 2 2,250 1,940 0.86 E 3 2,130 0.95 E 4
B
Entrance to terminal area
from eastbound Terminal
Drive
20 970 1 970 535 0.55 C 585 0.60 C
C Terminal approach 15 819 4 3,276 2,030 0.62 D 5 2,225 0.68 D 5
D
Terminal-area exit to
southbound Donelson
Pike
25 1,125 1 1,125 50 0.04 A 55 0.05 A
E Terminal-area exit to
north 30 1,305 3 3,915 2,580 0.66 D 4 2,830 0.72 E 4
F
Terminal-area entrance
from southbound
Donelson Pike
20 970 1 970 785 0.81 E 2 860 0.88 E 2
G Terminal loop northbound 30 1,305 5 6,525 4,245 0.65 D 6 4,655 0.71 D 6
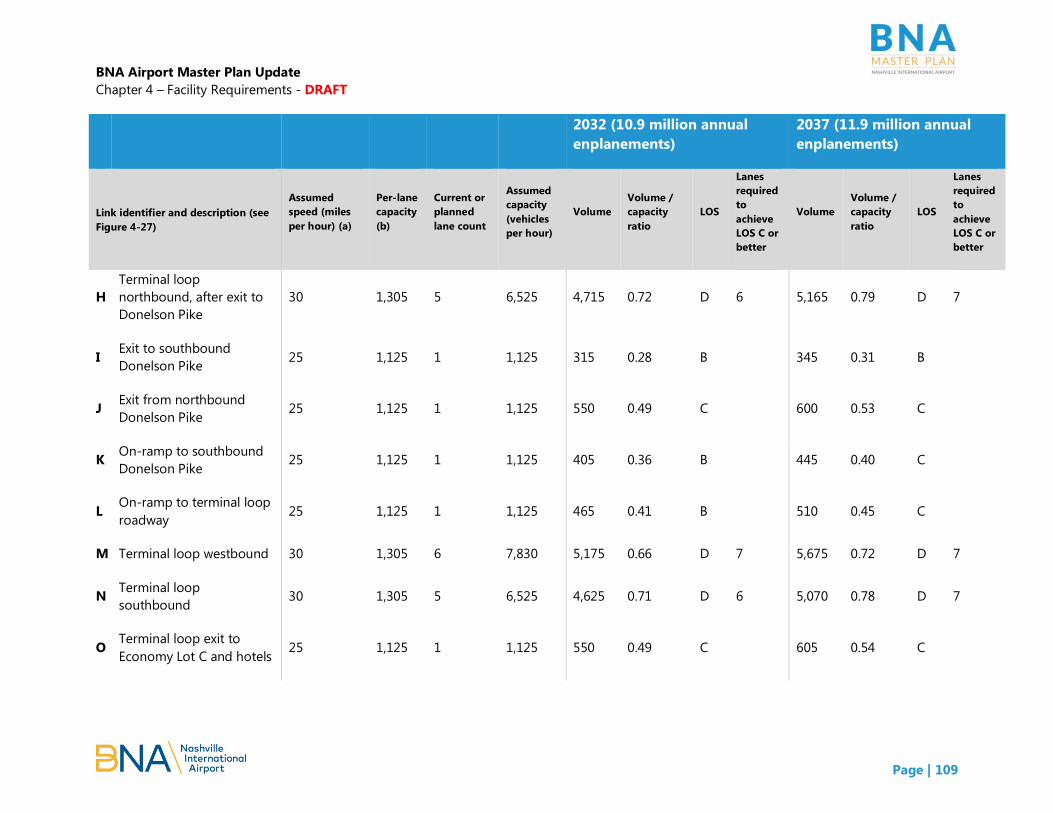
BNA Airport Master Plan Update
Chapter 4 – Facility Requirements - DRAFT
Page | 109
2032 (10.9 million annual
enplanements)
2037 (11.9 million annual
enplanements)
Link identifier and description (see
Figure 4-27)
Assumed
speed (miles
per hour) (a)
Per-lane
capacity
(b)
Current or
planned
lane count
Assumed
capacity
(vehicles
per hour)
Volume
Volume /
capacity
ratio
LOS
Lanes
required
to
achieve
LOS C or
better
Volume
Volume /
capacity
ratio
LOS
Lanes
required
to
achieve
LOS C or
better
H
Terminal loop
northbound, after exit to
Donelson Pike
30 1,305 5 6,525 4,715 0.72 D 6 5,165 0.79 D 7
I Exit to southbound
Donelson Pike 25 1,125 1 1,125 315 0.28 B 345 0.31 B
J Exit from northbound
Donelson Pike 25 1,125 1 1,125 550 0.49 C 600 0.53 C
K On-ramp to southbound
Donelson Pike 25 1,125 1 1,125 405 0.36 B 445 0.40 C
L On-ramp to terminal loop
roadway 25 1,125 1 1,125 465 0.41 B 510 0.45 C
M Terminal loop westbound 30 1,305 6 7,830 5,175 0.66 D 7 5,675 0.72 D 7
N Terminal loop
southbound 30 1,305 5 6,525 4,625 0.71 D 6 5,070 0.78 D 7
O Terminal loop exit to
Economy Lot C and hotels 25 1,125 1 1,125 550 0.49 C 605 0.54 C
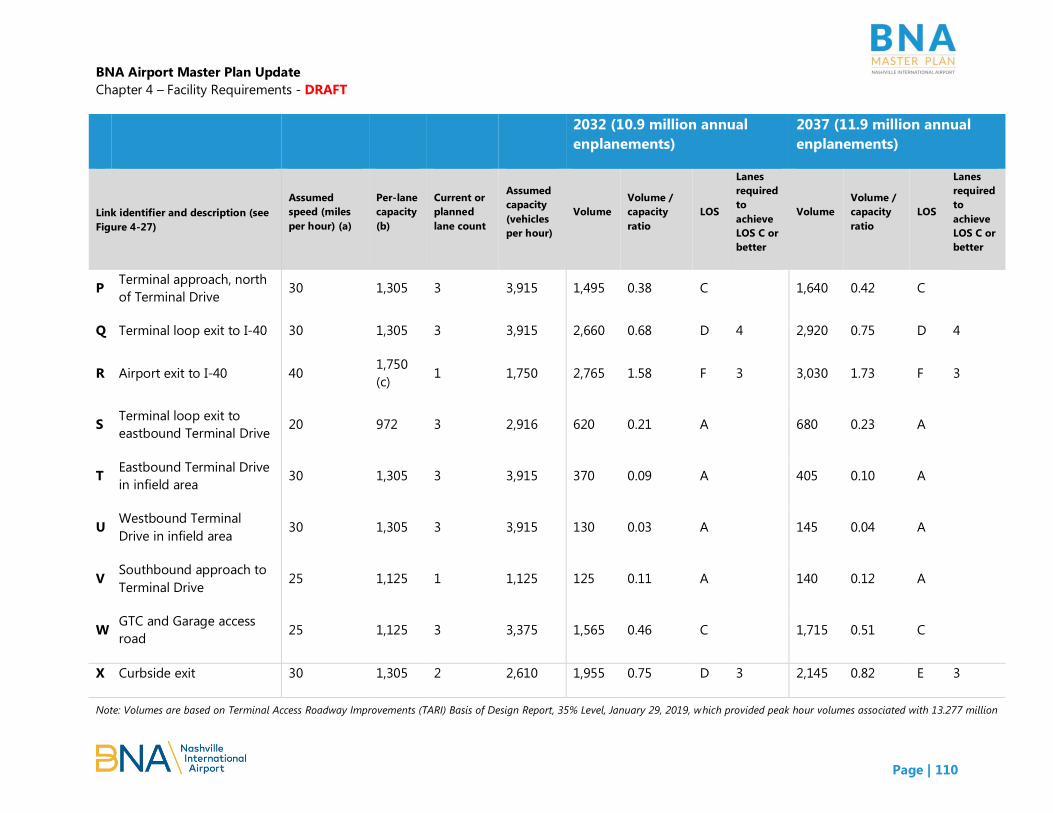
BNA Airport Master Plan Update
Chapter 4 – Facility Requirements - DRAFT
Page | 110
2032 (10.9 million annual
enplanements)
2037 (11.9 million annual
enplanements)
Link identifier and description (see
Figure 4-27)
Assumed
speed (miles
per hour) (a)
Per-lane
capacity
(b)
Current or
planned
lane count
Assumed
capacity
(vehicles
per hour)
Volume
Volume /
capacity
ratio
LOS
Lanes
required
to
achieve
LOS C or
better
Volume
Volume /
capacity
ratio
LOS
Lanes
required
to
achieve
LOS C or
better
P Terminal approach, north
of Terminal Drive 30 1,305 3 3,915 1,495 0.38 C 1,640 0.42 C
Q Terminal loop exit to I-40 30 1,305 3 3,915 2,660 0.68 D 4 2,920 0.75 D 4
R Airport exit to I-40 40 1,750
(c) 1 1,750 2,765 1.58 F 3 3,030 1.73 F 3
S Terminal loop exit to
eastbound Terminal Drive 20 972 3 2,916 620 0.21 A 680 0.23 A
T Eastbound Terminal Drive
in infield area 30 1,305 3 3,915 370 0.09 A 405 0.10 A
U Westbound Terminal
Drive in infield area 30 1,305 3 3,915 130 0.03 A 145 0.04 A
V Southbound approach to
Terminal Drive 25 1,125 1 1,125 125 0.11 A 140 0.12 A
W GTC and Garage access
road 25 1,125 3 3,375 1,565 0.46 C 1,715 0.51 C
X Curbside exit 30 1,305 2 2,610 1,955 0.75 D 3 2,145 0.82 E 3
Note: Volumes are based on Terminal Access Roadway Improvements (TARI) Basis of Design Report, 35% Level, January 29, 2019, which provided peak hour volumes associated with 13.277 million

BNA Airport Master Plan Update
Chapter 4 – Facility Requirements - DRAFT
Page | 111
2032 (10.9 million annual
enplanements)
2037 (11.9 million annual
enplanements)
Link identifier and description (see
Figure 4-27)
Assumed
speed (miles
per hour) (a)
Per-lane
capacity
(b)
Current or
planned
lane count
Assumed
capacity
(vehicles
per hour)
Volume
Volume /
capacity
ratio
LOS
Lanes
required
to
achieve
LOS C or
better
Volume
Volume /
capacity
ratio
LOS
Lanes
required
to
achieve
LOS C or
better
annual enplanements. Volumes for 2022, 2027, 2032, and 2037 were estimated by applying the ratio of the forecast annual enplanements to13.277 million.
(a) Reflects lowest speed portion of the link.
(b) Based on ACRP 40, extrapolated for speeds below 25 mph
(c) Assumes no capacity reduction; a driver’s only remaining decision is eastbound versus westbound I-40.
Source: InterVISTAS, from traffic volumes provided by Atkins.
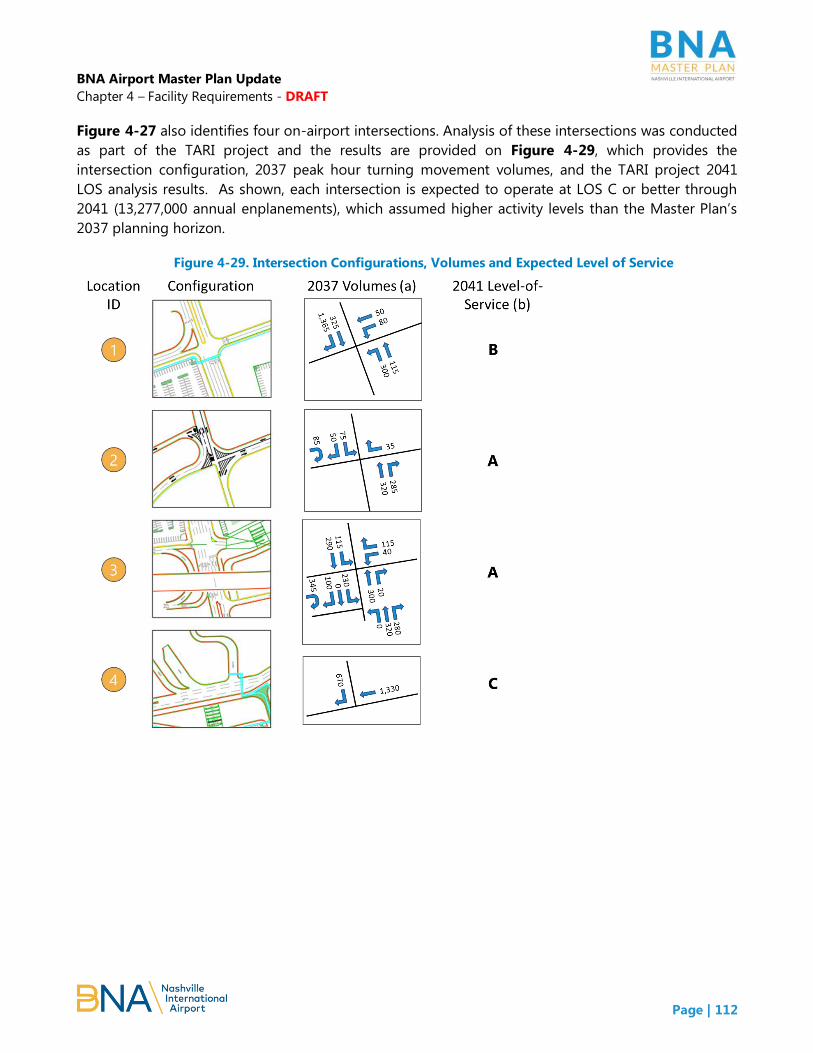
BNA Airport Master Plan Update
Chapter 4 – Facility Requirements - DRAFT
Page | 112
Figure 4-27 also identifies four on-airport intersections. Analysis of these intersections was conducted
as part of the TARI project and the results are provided on Figure 4-29, which provides the
intersection configuration, 2037 peak hour turning movement volumes, and the TARI project 2041
LOS analysis results. As shown, each intersection is expected to operate at LOS C or better through
2041 (13,277,000 annual enplanements), which assumed higher activity levels than the Master Plan’s
2037 planning horizon.
Figure 4-29. Intersection Configurations, Volumes and Expected Level of Service

BNA Airport Master Plan Update
Chapter 4 – Facility Requirements - DRAFT
Page | 113
The ramps entering the Airport from eastbound I-40 and exiting the Airport to westbound and
eastbound I-40 are expected to serve the majority of peak hour traffic entering and exiting the
terminal area. These ramps, shown on Figure 4-30 are one lane each. As shown on Table 4-73, the
Airport entrance from eastbound I-40 is expected to operate at LOS F by 2022. This ramp would need
a second lane to achieve LOS C or better through 2027 and a third lane to achieve LOS C or better
through 2037. The Airport exit to westbound I-40 is expected to operate at LOS E by 2022 and would
need a second lane to achieve LOS C or better through 2037. After completion of the Donelson Pike
relocation project, the future Airport exit to eastbound I-40 is expected to operate at LOS C or better
through 2037.
Figure 4-30. Key I-40 Airport Access Ramps

BNA Airport Master Plan Update
Chapter 4 – Facility Requirements - DRAFT
Page | 114
Table 4-73. Roadway Volumes and Requirements, Key I-40 Access Ramps
2022
(9.0 Million Annual Enplanements)
2027
(9.9 Million Annual Enplanements)
Roadway Link
(see Figure 4-30)
Assumed
Speed
(Miles Per
Hour) (a)
Per-
Lane
Capacity
(b)
Current or
Planned
Lane
Count
Assumed
Capacity
(Vehicles
Per
Hour)
Volume
Volume /
Capacity
Ratio
LOS
Lanes
Required
to Achieve
LOS C or
Better
Volume
Volume/
Capacity
Ratio
LOS
Lanes
Required to
Achieve LOS
C or Better
Airport entrance from
eastbound I-40 40 1,575 1 1,575 1,615 1.03 F 2 1,770 1.12 F 2
Airport exit to
westbound I-40 40 1,750 1 1,750 1,530 0.87 E 2 1,680 0.96 E 2
Airport exit to
eastbound I-40 40 1,750 1 1,750 770 0.44 C 845 0.48 C
2032
(10.9 Million Annual
Enplanements)
2037
(11.9 Million Annual
Enplanements)
Airport entrance from
eastbound I-40 40 1,575 1 1,575 1,940 1.23 F 3 2,130 1.35 F 3
Airport exit to
westbound I-40 40 1,750 1 1,750 1,840 1.05 F 2 2,015 1.15 F 2
Airport exit to
eastbound I-40 40 1,750 1 1,750 925 0.53 C 1,015 0.58 C
Note: Volumes are based on Terminal Access Roadway Improvements (TARI) Basis of Design Report, 35% Level, January 29, 2019, which provided peak hour volumes associated with 13.277
million annual enplanements. Volumes for 2022, 2027, 2032, and 2037 were estimated by applying the ratio of the forecast annual enplanements to13.277 million.
(a) Reflects lowest speed portion of the link. Airport exit to westbound I-40 is assumed to not have capacity reduction as drivers would no longer be facing any potential decisions.
(b) Based on ACRP 40.
Source: InterVISTAS, from traffic volumes provided by Atkins.

BNA Airport Master Plan Update
Chapter 4 – Facility Requirements - DRAFT
Page | 115
4.4.4. Curbsides, Commercial Ground Transportation, and Public Transit
This section summarizes existing and future use of curbside facilities and presents curbside facility
requirements through the planning period for both the high-TNC impact condition and the low-TNC
impact condition, as applicable.
Curbside facility requirements are based on providing level-of-service (LOS) C or better during the
‘design hour’ identified for the facility. LOS, as defined in Airport Cooperative Research Program
(ACRP) Report 40, Airport Curbside and Terminal Area Roadway Operations, is based on two factors.
The first factor is curbside utilization, which indicates the ability of the curbside to accommodate
existing or projected requirements for vehicles loading or unloading at the curbside by comparing the
required length of loading or unloading area with the available curbside length. The required length
for loading or unloading incorporates factors that reflect peaks within the peak hour as well as likely
non-uniform distribution of demand across the curbside, such as demand levels near terminal
doorways or certain airlines.
The second factor is the volume to capacity (v/c) ratio of the curbside roadway. A v/c ratio of 1.00
would indicate that the roadway is operating at its capacity; thus, a v/c ratio of approximately 0.60
would indicate a LOS C. Table 4-74 summarizes the curbside utilization ratio associated with LOS A
through F. Additionally, because the curbside utilization value impacts the curbside roadway capacity
value used in the v/c ratio, Table 4-74 also provides the assumed curbside roadway capacity
associated with each curbside utilization LOS threshold.

BNA Airport Master Plan Update
Chapter 4 – Facility Requirements - DRAFT
Page | 116
Table 4-74. Curbside Utilization Level of Service Ratios
Airport curbside levels of service
Assumes double-parking is permitted A B C D E F
Curbside utilization ratio (a) 0.90 1.10 1.30 1.70 2.00 > 2.00
Curbside roadway capacity (vehicles per hour)
4- lane roadways (Departures Level – inner curb) 2,830 2,790 2,680 2,220 1,800 Up to 1,800
3-lane roadways (Departures Level – outer curb;
and Arrivals Level – middle curb) 2,200 1,950 1,580 860 750 Up to 750
Assumes double-parking is prohibited A B C D E F
Curbside utilization ratio (a) 0.70 0.85 1.00 1.20 1.35 > 1.35
Curbside roadway capacity (vehicles per hour)
2-lane roadways (Arrivals Level – outer curb) (b) 880 780 630 340 300 Up to 300
(a) The ratio between the calculated curbside demand and the available effective curbside length.
(b) Capacity is assumed to be 40% of the capacity of a 3-lane curbside roadway.
Source: Airport Cooperative Research Program Report 40, Table 5-2.
Table 4-75 summarizes the v/c ratio associated with each curbside roadway LOS threshold.
Table 4-75. Curbside Roadway Level of Service Ratios
Airport curbside levels of service
A B C D E F
Maximum through lane volume/capacity ratio 0.25 0.40 0.60 0.80 1.00 >1.00
Source: Airport Cooperative Research Program Report 40, Table 5-2.
Figure 4-31 depicts representative curbside conditions associated with each LOS.

BNA Airport Master Plan Update
Chapter 4 – Facility Requirements - DRAFT
Page | 117
Figure 4-31. Curbside Level of Service Depictions
Source: Airport Cooperative Research Program Report 40.
The goal of the curbside facility requirements analysis is to identify, for each planning horizon, the
number of loading and/or unloading vehicles requiring accommodation during the ‘design hour” for
each curbside. For curbsides where vehicles park in a linear fashion, such as at BNA, curbside
requirements are also typically provided in linear feet of curbside frontage parallel to a functioning
terminal building and assume some amount of double-parking.
4.4.4.1. Methodology
Curbside facility requirements are calculated by one of two methods depending on the operating
characteristics of the mode.
Vehicles operating on an on-demand basis (e.g., private vehicles, taxicabs, TNCs). Design
hour vehicle volumes are combined with the assumed dwell times to determine the average
number of vehicles simultaneously picking up and/or dropping off passengers. This average
value is then adjusted to reflect the 95th percentile number of vehicles expected to
simultaneously pick up and/or drop off passengers during the design hour. Using the 95th
percentile number accounts for uneven distribution of traffic volumes during the peak hour
(i.e., peaks within the peak) as well as likely uneven distribution of demand along the face of
the curbside. This 95th percentile value is then multiplied by the average vehicle length to
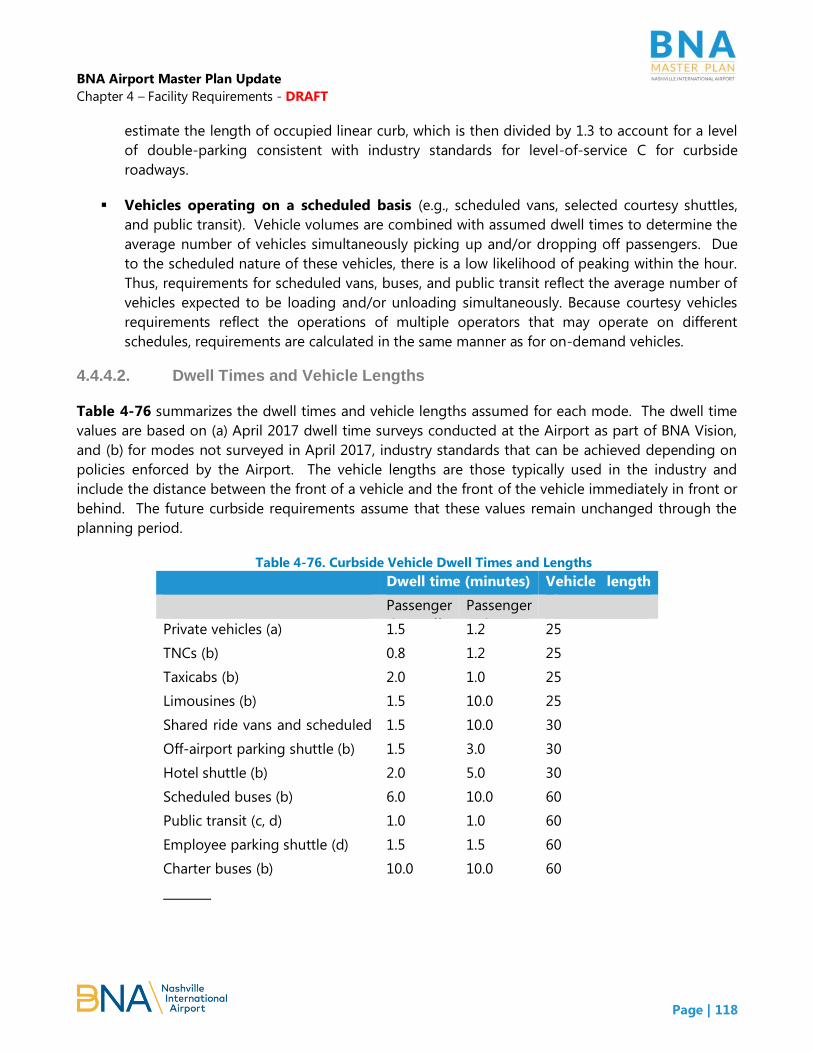
BNA Airport Master Plan Update
Chapter 4 – Facility Requirements - DRAFT
Page | 118
estimate the length of occupied linear curb, which is then divided by 1.3 to account for a level
of double-parking consistent with industry standards for level-of-service C for curbside
roadways.
Vehicles operating on a scheduled basis (e.g., scheduled vans, selected courtesy shuttles,
and public transit). Vehicle volumes are combined with assumed dwell times to determine the
average number of vehicles simultaneously picking up and/or dropping off passengers. Due
to the scheduled nature of these vehicles, there is a low likelihood of peaking within the hour.
Thus, requirements for scheduled vans, buses, and public transit reflect the average number of
vehicles expected to be loading and/or unloading simultaneously. Because courtesy vehicles
requirements reflect the operations of multiple operators that may operate on different
schedules, requirements are calculated in the same manner as for on-demand vehicles.
4.4.4.2. Dwell Times and Vehicle Lengths
Table 4-76 summarizes the dwell times and vehicle lengths assumed for each mode. The dwell time
values are based on (a) April 2017 dwell time surveys conducted at the Airport as part of BNA Vision,
and (b) for modes not surveyed in April 2017, industry standards that can be achieved depending on
policies enforced by the Airport. The vehicle lengths are those typically used in the industry and
include the distance between the front of a vehicle and the front of the vehicle immediately in front or
behind. The future curbside requirements assume that these values remain unchanged through the
planning period.
Table 4-76. Curbside Vehicle Dwell Times and Lengths
Dwell time (minutes) Vehicle length
(feet)
Passenger
drop-off
Passenger
pickup
Private vehicles (a) 1.5 1.2 25
TNCs (b) 0.8 1.2 25
Taxicabs (b) 2.0 1.0 25
Limousines (b) 1.5 10.0 25
Shared ride vans and scheduled
vans (b)
1.5 10.0 30
Off-airport parking shuttle (b) 1.5 3.0 30
Hotel shuttle (b) 2.0 5.0 30
Scheduled buses (b) 6.0 10.0 60
Public transit (c, d) 1.0 1.0 60
Employee parking shuttle (d) 1.5 1.5 60
Charter buses (b) 10.0 10.0 60
(a) Includes rental cars using the curbsides.
(b) Vehicle picks up passengers in the Ground Transportation Center.
(c) Vehicle picks up and drops off passengers on the Ground
Transportation Level roadway.
(d) Vehicle picks up and drops off passengers simultaneously.

BNA Airport Master Plan Update
Chapter 4 – Facility Requirements - DRAFT
Page | 119
4.4.4.3. Base Year Activity
The BNA Vision project included analysis of automatic traffic counts, vehicle classifications surveys,
and dwell time surveys. These data were substantially collected in 2016 and 2017 and the BNA Vision
project used March 2016 as a basis for establishing design day requirements. To incorporate the
significant shift in mode share that was occurring in 2016 and 2017, the BNA Vision project conducted
April 2017 vehicle classification surveys and applied them to the March 2016 peak hour volumes. For
this Master Plan, those data were supplemented with evaluations of TNC activity during busy periods
in 2017 and 2018, and taxicab activity during busy periods in 2017.
Table 4-77 and Table 4-78 summarize the 2016 peak hour volumes identified in BNA Vision for the
Departures Level and Arrivals Level, respectively.
Table 4-77. Peak Hour Curbside and Ground Transportation Volumes, Departures Level, BNA
Vision
April 2017 survey
March 2016
peak hour
volumes
March 2016
volumes,
assuming April
2017
distribution
Volumes Distribution
Inner
curb
Outer
curb
Inner
curb
Outer
curb
Total Inner
curb
Outer
curb
Inner
curb
Outer
curb
Departures level – on demand vehicles:
Private vehicles 377 12 66.5% 2.1% 68.6% 495 0 444 14
TNCs 18 125 3.2% 22.0% 25.2% 0 48 21 147
Taxicabs 0 27 0.0% 4.8% 4.8% 0 115 0 32
Limousines 0 8 0.0% 1.4% 1.4% 0 10 0 9
Total 395 172 69.7% 30.3% 100.0
%
495 173 465 203
Departures level – scheduled/infrequent vehicles:
Scheduled and
shared-ride vans
0 5 0 4 0 5
Off-airport parking
shuttle
0 57 0 55 0 55
Hotel shuttle 0 27 0 34 0 34
Scheduled bus 0 1 0 0 0 1
Charter bus 0 2 0 0 0 2
Airport parking
shuttle (a)
0 40 0 40 0 40
Employee parking
shuttle
0 31 0 31 0 31
Total 0 163 0 164 0 168
(a) Includes shuttles for Terminal Lot A, Economy B, Economy C, and BNA Express.
Source: BNA Vision.

BNA Airport Master Plan Update
Chapter 4 – Facility Requirements - DRAFT
Page | 120
Table 4-78. Peak Hour Curbside and Ground Transportation Volumes, Arrivals and Ground
Transportation Level, BNA Vision
March 2016 peak hour volumes
Arrivals level: Inner curb Middle curb Outer curb
Private vehicles 0 659 0
Airport parking shuttles (a) 30 0 0
Parking Shuttle - BNA Express 0 0 10
Off-airport parking shuttle 0 0 57
Hotel shuttle 0 0 33
Scheduled and shared-ride vans 0 0 14
Total 30 659 114
Ground Transportation Level: Level 1 roadway Garage roadway
TNCs 0 101
Taxicabs 116 0
Limousines 0 36
Scheduled bus 2 0
Public transit 2 0
Charter bus 4 0
Total 124 137
(a) Includes shuttles for Terminal Lot A, Economy B, and Economy C.
Source: BNA Vision.
4.4.4.4. Future Volumes
Table 4-79 summarizes future peak hour volumes for vehicles using the Departures Level curbsides.
Volumes assume the “high TNC impact” scenario, and are assumed to increase as follows:
TNCs. TNC volumes are assumed to increase at the rates shown in Table 4-79, which predict
that due to passenger growth and mode shifts, TNC peak hour volumes will increase
(compared with 2018 volumes) 58% by 2022, 106% by 2027, 159% by 2032, and 227% by 2037.
Based on observations that despite the increase in TNC activity from March 2016 to March
2017, the ratio of Departures Level peak hour trips to monthly passengers remained constant,
indicating that the growth in TNCs was due to customers switching from other curbside modes
(as opposed to public parking, rental cars, and off-Airport parking). Therefore, it is assumed

BNA Airport Master Plan Update
Chapter 4 – Facility Requirements - DRAFT
Page | 121
that the growth in TNC hourly traffic is due to passengers switching from taxicabs and private
vehicles.
Taxicabs. Taxicab volumes are assumed to decrease at the rates shown in Table 4-79, which
predict that due to passenger growth and mode shifts, taxicab peak hour volumes will
decrease (compared with 2018 volumes) 26% by 2022, 30% by 2027, 34% by 2032, and 38% by
2037. This rate reflects the growth in activity due to passenger growth as well as the reduced
market share that taxis serve. Trips lost due to decreased market share are assumed to have
shifted to TNCs.
Private vehicles. Private vehicle volumes are assumed to increase at the same rate as hourly
passengers (the rates are shown in Table 4-79, but volumes are subsequently reduced as it is
assumed that the TNC volume increases due to changes in market share (as opposed to
passenger growth) come from passengers who otherwise would have used private vehicles and
taxicabs.
Limousines and charter buses. Volumes are assumed to increase at the same rate as hourly
passengers.
Scheduled and shared-ride vans. By late 2018, shared-ride van service at the Airport had
ceased and scheduled van service had reduced to a single operator providing service to and
from Chattanooga. Therefore, future volumes were assumed to be one trip per hour.
Scheduled buses and airport parking shuttles. These vehicles are assumed to operate on a
schedule and thus, volumes are assumed to be constant during peak periods.
Employee parking shuttle. These vehicles are assumed to operate at 100% capacity during
existing peak periods and thus volumes are expected to increase at the same rate as growth in
employee parking requirements, which are summarized below in Table 4-93.
Off-Airport parking and hotel shuttles. These vehicles are assumed to operate on a schedule
during peak periods. Therefore, volumes will increase only with the introduction of new hotels
and/or off-Airport parking facilities. To reflect the introduction of new facilities, peak hour
volumes are assumed to be constant through 2022. Beyond 2022, peak hour volumes are
assumed to increase at 50% the growth rate in hourly passengers.

BNA Airport Master Plan Update
Chapter 4 – Facility Requirements - DRAFT
Page | 122
Table 4-79. Future Peak Hour Volumes, Departures Level 2016
(see Table 4-77) 2018 (a) 2022 2027 2032 2037
Annual enplanements (b) 6,489,739 8,000,000 9,047,142 9,938,318 10,886,036 11,935,070
Peak hour enplanements (b) 2,439 2,757 3,118 3,425 3,752 4,114
Activity multipliers, applied to 2018 volumes (see Table 4-68)
Private vehicles, limousines,
charter buses
1 1.131 1.242 1.361 1.492
TNCs 1 1.575 2.060 2.592 3.265
Taxicabs 1 0.742 0.700 0.658 0.620
Private vehicles
Volume based on passenger
growth
458 565 639 702 769 843
Volume shifted to TNCs n/a n/a (107) (203) (310) (451)
Total 458 565 532 499 459 392
TNCs
Volume based on passenger
growth 168 271 306 336 368 404
Volume shifted from private
vehicles n/a n/a 107 203 310 451
Volume shifted from taxicabs n/a n/a 13 18 23 29
Total 168 271 426 557 701 883
Taxicabs
Volume based on passenger
growth 32 33 37 41 45 49
Volume shifted to TNCs n/a n/a (13) (18) (23) (29)
Total 32 33 24 23 22 20
Limousines 9 12 13 14 16 17
Scheduled and shared-ride vans
(c, d)
5 1 1 1 1 1
Off-airport parking shuttle (e) 55 55 55 58 60 63
Hotel shuttle (e) 34 34 43 46 48 50
Scheduled bus (c) 1 1 1 1 1 1
Charter bus 2 2 3 3 3 3

BNA Airport Master Plan Update
Chapter 4 – Facility Requirements - DRAFT
Page | 123
2016
(see Table 4-77) 2018 (a) 2022 2027 2032 2037
Airport parking shuttles (c, f) 40 40 40 40 40 40
Employee parking shuttle (c) 31 31 38 39 42 46
Total 835 1,045 1,176 1,281 1,393 1,516
(a) 2018 TNC volumes reflect observed 2018 activity. Private vehicle, limousine, and charter bus volumes assumed to grow at same rate as peak
hour enplanements growth from 2016 to 2018.
(b) 2018 levels estimated based on activity through November 2018. 2022 through 2037: Aviation Demand Forecasts, Master Plan Update,
Nashville International Airport, June 2018.
(c) Assume no peak hour volume growth as these modes are assumed to operate on a schedule.
(d) By late 2018, shared-ride van service had ceased and scheduled van service reduced to one trip per hour, or less.
(e) Assumes that vehicles operate on a schedule during peak periods and that volumes would increase only with the introduction of new
operators. Assume constant peak hour volumes through 2022; beyond 2022, assume peak hour volume increase at 50% the growth r ate in
hourly passengers.
(f) Includes shuttles for Terminal Lot A, Economy B, Economy C, and BNA Express.
Source: InterVISTAS, January 2019.
Table 4-80 summarizes future peak hour volumes for vehicles using the Arrivals Level curbsides, the
Ground Transportation Roadway, and the Ground Transportation Center (GTC) for the “high” TNC
impact scenario, as this scenario has the largest capacity requirements for the GTC. Volumes are
assumed to increase as follows:
TNCs. TNC volumes are assumed to increase at the rates shown in Table 4-80, which are
identical to the rates predicted for the Departures Level. Based on observations that despite
the increase in TNC activity from March 2016 to March 2017, the ratio of Arrivals Level peak
hour trips (which are almost exclusively private vehicles) to monthly passengers remained
constant, it was determined that the growth in TNCs was not due to customers switching from
other curbside modes and instead, was predominantly from customers who previously used
taxicabs, public parking, rental cars, and off-Airport parking.
Taxicabs. Taxicab volumes are assumed to decrease at the rates shown in Table 4-80, which
are identical to the rates predicted for the Departures Level. This rate reflects the growth in
activity due to passenger growth as well as the reduced market share that taxis serve. Trips
lost due to decreased market share are assumed to have shifted to TNCs.
Private vehicles. Private vehicle volumes are assumed to increase at the same rate as hourly
passengers through 2022. Beyond 2022, it is assumed that the growth in TNC hourly traffic
starts to include passengers who previously used private vehicles at the curbsides. In 2027, it
assumed that 25% of TNC volume growth due to mode shifts is from customers switching from

BNA Airport Master Plan Update
Chapter 4 – Facility Requirements - DRAFT
Page | 124
private vehicles at the curbs. In 2032 and the 2037, that value is assumed to be 33% and 50%,
respectively.
Limousines and charter buses. Volumes are assumed to increase at the same rate as hourly
passengers.
Scheduled and shared-ride vans. By late 2018, shared-ride van service at the Airport had
ceased and scheduled van service had reduced to a single operator providing service to and
from Chattanooga. Therefore, future volumes were assumed to be one trip per hour.
Scheduled buses and airport parking shuttles. These vehicles are assumed to operate on a
schedule and thus, volumes are assumed to be constant during peak periods.
Off-Airport parking and hotel shuttles. These vehicles are assumed to operate on a schedule
during peak periods. Therefore, volumes will increase only with the introduction of new hotels
and/or off-Airport parking facilities. To reflect the introduction of new facilities, peak hour
volumes are assumed to be constant through 2022. Beyond 2022, peak hour volumes are
assumed to increase at 50% the growth rate in hourly passengers.

BNA Airport Master Plan Update
Chapter 4 – Facility Requirements - DRAFT
Page | 125
Table 4-80. Future Peak Hour Volumes, Arrivals Level, Ground Transportation Roadway, and
Ground Transportation Center
2016 (see
Table 4-78)
2018 (a) 2022 2027 2032 2037
Annual enplanements (b) 6,489,739 8,000,000 9,047,142 9,938,318 10,886,036 11,935,070
Peak hour deplanements (b) 2,652 2,999 3,391 3,725 4,080 4,473
Activity multipliers, applied to 2018 volumes (see Table 4-68)
Private vehicles, limousines, charter
buses 1 1.131 1.242 1.361 1.492
TNCs 1 1.575 2.060 2.592 3.265
Taxicabs 1 0.742 0.700 0.658 0.620
Private vehicles
Volume based on passenger
growth 659 812 919 1,010 1,106 1,212
Volume shifted to TNCs n/a n/a 0 (55) (c) (109) (d) (238) (e)
Total 659 812 919 955 997 974
TNCs
Volume based on passenger
growth 101 268 303 333 365 400
Volume shifted from private
vehicles n/a n/a 0 55 109 238
Volume shifted from taxicabs n/a n/a 46 64 83 103
Volume shifted from other modes n/a n/a 73 100 138 135
Total 101 268 422 552 695 875
Taxicabs
Volume based on passenger
growth 116 118 133 146 160 176
Volume shifted to TNCs n/a n/a (46) (64) (83) (103)
Total 116 118 87 82 78 73
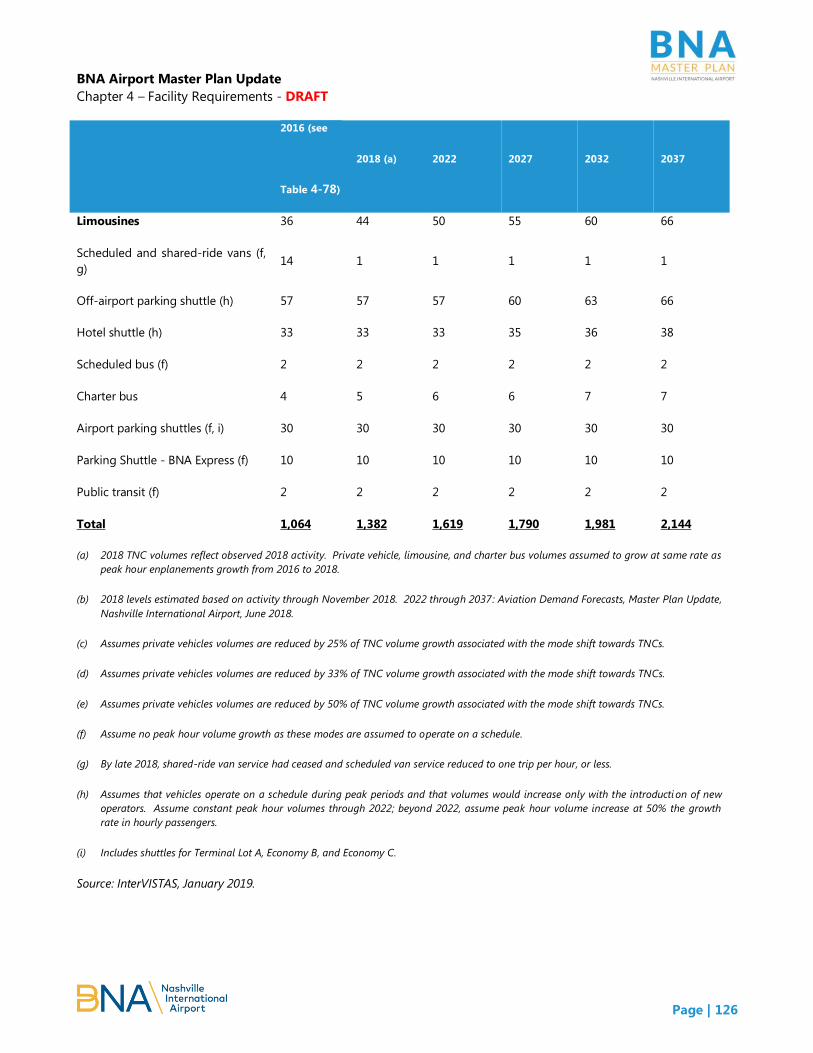
BNA Airport Master Plan Update
Chapter 4 – Facility Requirements - DRAFT
Page | 126
2016 (see
Table 4-78)
2018 (a) 2022 2027 2032 2037
Limousines 36 44 50 55 60 66
Scheduled and shared-ride vans (f,
g) 14 1 1 1 1 1
Off-airport parking shuttle (h) 57 57 57 60 63 66
Hotel shuttle (h) 33 33 33 35 36 38
Scheduled bus (f) 2 2 2 2 2 2
Charter bus 4 5 6 6 7 7
Airport parking shuttles (f, i) 30 30 30 30 30 30
Parking Shuttle - BNA Express (f) 10 10 10 10 10 10
Public transit (f) 2 2 2 2 2 2
Total 1,064 1,382 1,619 1,790 1,981 2,144
(a) 2018 TNC volumes reflect observed 2018 activity. Private vehicle, limousine, and charter bus volumes assumed to grow at same rate as
peak hour enplanements growth from 2016 to 2018.
(b) 2018 levels estimated based on activity through November 2018. 2022 through 2037: Aviation Demand Forecasts, Master Plan Update,
Nashville International Airport, June 2018.
(c) Assumes private vehicles volumes are reduced by 25% of TNC volume growth associated with the mode shift towards TNCs.
(d) Assumes private vehicles volumes are reduced by 33% of TNC volume growth associated with the mode shift towards TNCs.
(e) Assumes private vehicles volumes are reduced by 50% of TNC volume growth associated with the mode shift towards TNCs.
(f) Assume no peak hour volume growth as these modes are assumed to operate on a schedule.
(g) By late 2018, shared-ride van service had ceased and scheduled van service reduced to one trip per hour, or less.
(h) Assumes that vehicles operate on a schedule during peak periods and that volumes would increase only with the introducti on of new
operators. Assume constant peak hour volumes through 2022; beyond 2022, assume peak hour volume increase at 50% the growth
rate in hourly passengers.
(i) Includes shuttles for Terminal Lot A, Economy B, and Economy C.
Source: InterVISTAS, January 2019.

BNA Airport Master Plan Update
Chapter 4 – Facility Requirements - DRAFT
Page | 127
Table 4-81 summarizes peak hour volumes for the Arrivals Level under the “Low” TNC Impact
Scenario as this scenario creates the highest volumes for the Arrivals Level.
Table 4-81. Future Peak Hour Volumes, Arrivals Level, “Low” TNC Impact Scenario
2016 (see
Table 4-78)
2018 2022 2027 2032 2037
Annual enplanements (a) 6,489,739 8,000,000 9,047,142 9,938,318 10,886,036 11,935,070
Peak hour deplanements (a) 2,652 2,999 3,391 3,725 4,080 4,473
Activity multipliers, applied to 2018 volumes (see Table 4-68)
Private vehicles, limousines, charter
buses 1 1.131 1.242 1.361 1.492
TNCs 1 1.575 2.060 2.592 3.265
Taxicabs 1 0.742 0.700 0.658 0.620
Private vehicles
Volume based on passenger
growth 659 812 919 1,010 1,106 1,212
Volume shifted to TNCs n/a n/a 0 (33) (b) (64) (c) (136) (d)
Total 659 812 919 977 1,042 1,076
TNCs
Volume based on passenger
growth 101 268 303 333 365 400
Volume shifted from private
vehicles n/a n/a 0 33 64 136
Volume shifted from taxicabs n/a n/a 46 64 83 103
Volume shifted from other modes n/a n/a 33 34 47 33
Total 101 268 382 464 559 671
(a) 2018 levels estimated based on activity through November 2018. 2022 through 2037: Aviation Demand Forecasts, Master Plan Update,
Nashville International Airport, June 2018.
(b) Assumes private vehicles volumes are reduced by 25% of TNC volume growth associated with the mode shift towards TNCs.
BNA Airport Master Plan Update
Chapter 4 – Facility Requirements - DRAFT
Page | 128
(c) Assumes private vehicles volumes are reduced by 33% of TNC volume growth associated with the mode shift towards TNCs.
(d) Assumes private vehicles volumes are reduced by 50% of TNC volume growth associated with the mode shift towards TNCs.
Source: InterVISTAS, January 2019.
4.4.4.5. Curbside Requirements
As described above, the primary element defining the LOS at an airport curbside roadway is the ability
of a motorist to enter and exit the curbside space of their choice (e.g., one nearest their airline door or
other chosen destination). As roadway demand and congestion increases, motorists are required to
stop in spaces further away from their preferred destination. This requires the motorist to either stop
in a downstream curbside space, double-park, or in an extreme case, circle past the curbside area
multiple times while searching for an empty space. Level of service “C” is desirable for design of a new
facility or for an existing facility at medium-hub airports, recognizing that during peak hours and days
of the year the level of service may fall to “D” or poorer. As noted previously, level of service on
curbside roadways is estimated separately for through traffic and for curbside loading/unloading
traffic, but the overall LOS is governed by the poorer of the two components.
For estimating future curbside requirements, it is assumed the curb areas will be assigned as follows
(locations may vary from conditions in 2018 through 2022 as services are relocated to enable
construction projects):
Departures Level – inner roadway: serves private vehicles and limousines dropping off
passengers (TNCs, which have been observed to use the inner roadway, are assumed to follow
Airport policy and use only the outer roadway);
Departures Level – outer roadway: serves all other modes dropping off passengers and the
Employee Parking Shuttle (which drops off and picks up passengers on this level);
Arrivals Level – inner roadway: serves airport parking shuttle buses picking up and dropping
off customers parking in Lot A, Lot B, and the Economy Lot;
Arrivals Level – middle roadway: serves private vehicles picking up passengers;
Arrivals Level – outer roadway: serves private vehicles picking up passengers and the BNA
Express Park shuttle picking up passengers; and
Ground Transportation roadway: serves valet parking customers.
All other activity is assumed to occur in the Ground Transportation Center.
Table 4-83 summarizes the curbside requirements for 2016 through 2037 to achieve LOS C or better
for vehicle unloading and loading. These requirements reflect the volumes presented in Table 4-79

BNA Airport Master Plan Update
Chapter 4 – Facility Requirements - DRAFT
Page | 129
and Table 4-80 and the dwell times and vehicle lengths presented in Table 4-76. Other assumptions
include:
Demand will be distributed among the curbside zones based on hourly seats, during the
curbside’s peak period, associated with air carriers associated with each curbside zone. These
distributions are provided in Table 4-82.
For the Arrivals Level, observations made in Spring 2019 indicated that of the private vehicles
using the Arrivals Level, approximately 32% were using the Outer curbside. This proportion is
maintained through the planning period though in practice, it is likely that during periods of
increased activity on the Middle curbside, a higher share of traffic would use the Outer
curbside to avoid Middle curbside congestion.
For the Departures Level roadways and the Arrivals Level Middle curbside, requirements reflect
the length of curb required to achieve a curbside utilization ratio of 1.30 or better (which, as
shown on Table 4-74, corresponds with LOS C.
For the Arrivals Level Outer curbside (which is limited to two total lanes), requirements reflect
the length of curb required to achieve a curbside utilization ratio of 1.00 or lower.
Table 4-82. Assumed Curbside Activity Distribution
Distribution of Airline Seats
During Period Associated with
Curbside Peak Hour
2016 2018 - 2037
Departures Level:
Inner curbside
North zone (north of northern crosswalk) 16.1% 20.5%
Middle zone (between crosswalks) 16.8% 36.5%
South zone (south of southern crosswalk) 67.1% 43.0%
Outer curbside
North zone (north half of curb) 16.1% 37.7%
South zone (south half of curb) 83.9% 62.3%
Arrivals Level:
Inner curbside
North zone (north of northern crosswalk) 13.5% 20.1%
Middle zone (between crosswalks) 28.0% 31.7%
South zone (south of southern crosswalk) 58.5% 48.3%

BNA Airport Master Plan Update
Chapter 4 – Facility Requirements - DRAFT
Page | 130
Distribution of Airline Seats
During Period Associated with
Curbside Peak Hour
Outer curbside
North zone (north half of curb) 26.7% 45.2%
South zone (south half of curb) 73.3% 54.8%
Source: InterVISTAS, 2019, based on Diio airline seat reports for a Sunday and Monday in October, 2016
and 2018.
Table 4-83. Curbside Requirements – Vehicle Unloading and Loading Areas
Required curbside length (linear feet) / Level of
service provided by existing capacity
Existing
capacity
(linear
feet)
2016 2018 2022 2027 2032 2037
Departures Level:
Inner curbside
North zone 306 75/A 115/A 115/A 95/A 95/A 95/A
Middle zone 147 75/A 175/D 175/D 155/D 155/D 135/C
South zone 305 250/B 190/A 190/A 190/A 175/A 155/A
Outer curbside
North zone 274 125/A 225/B 245/C 265/C 280/D 345/D
South zone 274 295/D 255/C 270/C 315/D 360/D 390/E
Arrivals Level (a):
Inner curbside (b) 400 180/A 180/A 180/A 180/A 180/A 180/A
Middle curbside
North zone 210 60/A 95/A 95/A 95/A 115/A 115/A
Middle zone 120 95/B 135/D 135/D 155/D 155/D 155/D
South zone 190 175/C 175/C 190/C 210/D 210/D 230/D
Outer curbside
North zone 280 50/A 125/A 125/ A 150/A 150/A 150/A
South zone (c) 250 175/A 150/A 150/A 175/A 175/A 175/A
Ground Transportation:

BNA Airport Master Plan Update
Chapter 4 – Facility Requirements - DRAFT
Page | 131
Roadway 385 0 0 0 0 0 0
Note: Bold numbers indicate requirements that exceed existing capacity.
(a) Prior to the 2019 opening of the Ground Transportation Center (GTC), private vehicles were not allowed to use the Outer
curbside as it was reserved for commercial vehicles. For 2016 and 2018, the table reflects conditions assuming the GTC had
been in place.
(b) Assumes one space for the shuttle route serving each of the three remote parking lots.
(c) Excludes 30 linear feet reserved for BNA Express shuttle.
Source: InterVISTAS, 2019.
As shown, the Departures Level – inner curbside, middle zone requires additional capacity starting in
2018 while the other two zones have sufficient capacity. The Departures Level – outer curbside
requires additional length in the south zone by 2027 and additional length in the north zone by 2032
The Arrivals Level – inner curbside, Arrivals Level – outer curbside, and Ground Transportation
Roadway are expected to be able to accommodate demand through the planning period. The Arrivals
Level – middle curbside requires additional capacity in the middle zone in 2018 and the south zone by
2027.
The other component of curbside requirements is the number of lanes required to carry vehicular
volume, recognizing that lane capacity is influenced by the LOS provided for vehicles loading and
unloading. As shown on Table 4-74, a 4-lane curbside roadway (such as the Departures Level – inner
curbside) that operates at LOS C for vehicle loading and unloading has a maximum capacity of 2,680
vehicles per hour. As shown on Table 4-75, to achieve LOS C or better for the roadway, the ratio of
the total volume on the roadway versus the capacity needs to be 0.6 or lower. Therefore, a 4-lane
curbside operating at LOS C for vehicle loading or unloading can accommodate approximately 1,600
vehicles per hour and achieve LOS C for the roadway lanes. However, if a curbside roadway is
interrupted by pedestrian crosswalks, the capacity is reduced by the portion of the hour when the
crosswalks are occupied. Based on crosswalk surveys conducted during BNA Vision and observations
in Spring 2019, it is estimated that the pedestrian activity in the crosswalks obstructs each crosswalk
approximately 30% of the time during the peak hour. Thus, for the Departures Level – inner curbside
and the Arrivals Level – middle curbside, each of which has two crosswalks, the amount of time when
the road is not obstructed by pedestrians at one or both crosswalks is approximately 49%. For
planning purposes, it was assumed that through increased control of the crosswalk and efforts to
reduce the frequency of pedestrian crossings, this value could be raised by a factor of 1.05, to
approximately 51%.
Table 4-84 summarizes the Departures Level curbside roadway lane requirements under two
scenarios: (1) the curbside unloading and loading areas operate at the service levels identified in Table
4-83, with the poorest zone governing, and (2) the curbside unloading and loading areas operate at
LOS C or better in all zones due to geometric changes or operational strategies than improve the
distribution of activity between zones or between curbs on the same level.

BNA Airport Master Plan Update
Chapter 4 – Facility Requirements - DRAFT
Page | 132
Table 4-84. Curbside Requirements – Curbside Roadway Lanes, Departures Level
2016 2018 2022 2027 2032 2037
Departures Level – inner curb:
Volume (vehicles per hour) 468 577 545 513 475 409
Curbside LOS for unloading B D D D D C
Capacity (vehicles per hour) (a) 1,443 1,132 1,132 1,132 1,132 1,367
Volume / capacity (v/c) ratio 0.32 0.51 0.48 0.45 0.42 0.30
Additional lanes required to
achieve v/c of 0.6 (LOS C) or
lower
n/a n/a n/a n/a n/a n/a
Departures Level – outer curb:
Volume (vehicles per hour) 368 468 632 768 918 1,109
Curbside LOS for unloading D C C D D E
Capacity (vehicles per hour) (a) 860 1,580 1,580 860 860 750
Volume / capacity (v/c) ratio 0.43 0.30 0.40 0.89 1.07 1.48
Additional lanes required to
achieve v/c of 0.6 (LOS C) or
lower
n/a n/a n/a 1 1 1
Additional lanes required to
achieve v/c of 0.6 if curbside LOS
for unloading achieved LOS C or
better
n/a n/a n/a 0 0 1
(a) Includes capacity reduction due to pedestrian activity in crosswalks.
Source: InterVISTAS, 2019.
As shown, the Departures Level – inner curb roadway has sufficient capacity to meet demand through
2037 while the Departures Level – outer curb would need one additional lane in 2027, unless the
curbside unloading LOS can be improved to LOS C or better. In that case, the additional lane would
be needed prior to 2027. The need for the additional could be potentially be mitigated by
encouraging some outer curb traffic to use the inner curb, and/or choosing to accept LOS D.

BNA Airport Master Plan Update
Chapter 4 – Facility Requirements - DRAFT
Page | 133
Table 4-85 summarizes the Arrivals Level curbside roadway lane requirements under two scenarios:
(1) the curbside unloading and loading areas operate at the service levels identified in Table 4-83,
with the poorest zone governing, and (2) the curbside unloading and loading areas operate at LOS C
or better in all zones due to geometric changes or operational strategies than improve the distribution
of activity between zones or between curbs on the same level.
Table 4-85. Curbside Requirements – Curbside Roadway Lanes, Arrivals Level
2016 2018 2022 2027 2032 2037
Arrivals Level – inner curb: Curb serves 30 buses per hour, significantly below the capacity of a
one-lane roadway
Arrivals Level – middle curb:
Volume (vehicles per hour) 448 552 625 664 708 732
Curbside LOS for loading C D D D D D
Capacity (vehicles per hour) (a) 806 439 439 439 439 439
Volume / capacity (v/c) ratio 0.56 1.26 1.43 1.52 1.62 1.67
Additional lanes required to
achieve v/c of 0.6 (LOS C) or
lower
n/a 1 1 1 2 2
Additional lanes required to
achieve v/c of 0.6 if curbside LOS
for unloading achieved LOS C or
better
n/a 1 1 1 1 1
Arrivals Level – outer curb:
Volume (vehicles per hour) 211 260 294 313 333 344
Curbside LOS for loading A A A A A A
Capacity (vehicles per hour) (a) 880 880 880 880 880 880
Volume / capacity (v/c) ratio 0.24 0.31 0.35 0.36 0.38 0.39
Additional lanes required to
achieve v/c of 0.6 (LOS C) or
lower
n/a n/a n/a n/a n/a n/a
Source: InterVISTAS, 2019.

BNA Airport Master Plan Update
Chapter 4 – Facility Requirements - DRAFT
Page | 134
As shown, the Arrivals Level – middle curb requires up to two additional lanes, depending on whether
the curbside loading LOS improves to LOS C. Due to the locations of columns supporting the
Departures Level, it is unlikely this roadway could be widened. Therefore, LOS improvement would
require diversion of volume to the Arrivals Level – outer curb, which could, in turn, require additional
lanes to accommodate the increased volumes.
4.4.4.6. Ground Transportation Center
The Ground Transportation Center (GTC), located on the first level of Garage A, opened in late 2018.
For purposes of facility requirements, it is assumed the GTC accommodates pickup operations for the
following modes:
TNCs
Taxicabs
Limousines
Off-Airport parking shuttles
Hotel shuttles
Scheduled and shared-ride vans
Scheduled buses
Charter buses
Public transit
Table 4-86 summarizes the number of loading positions required in the GTC for each of these modes.
In addition to these loading positions, it is recommended that a five-vehicle taxicab feeder queue be
provided close to the taxicab loading area to ensure that customers do not need to wait for a vehicle.
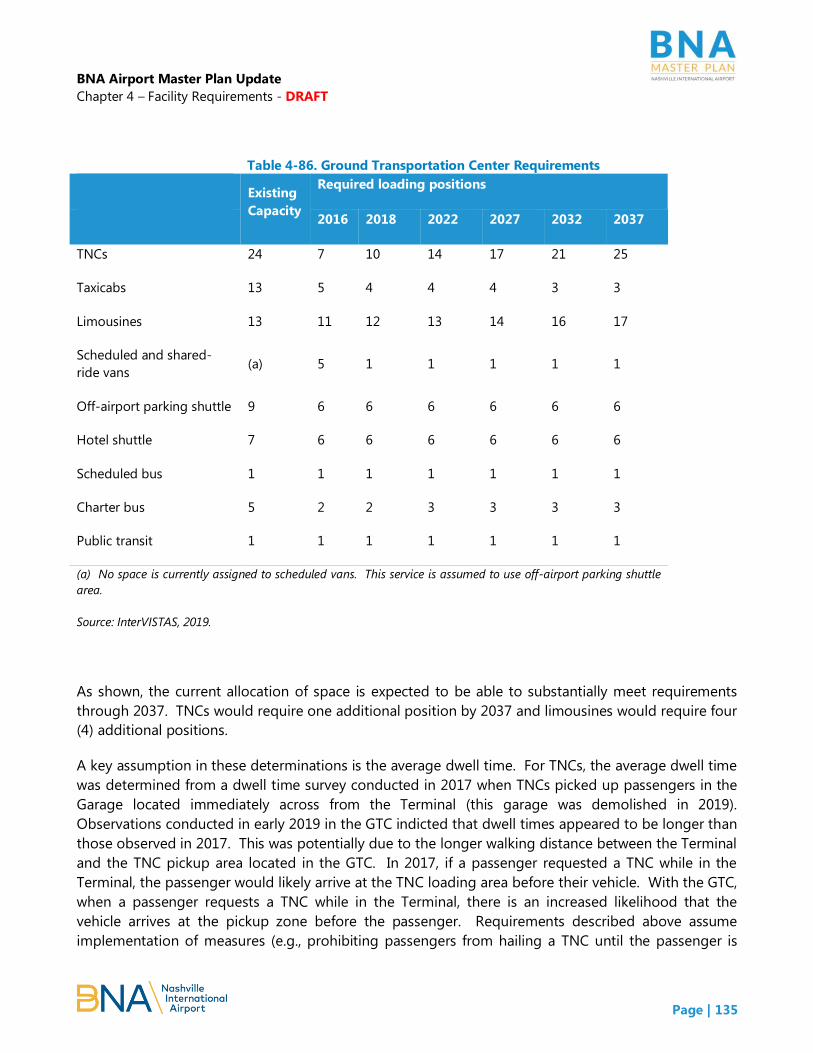
BNA Airport Master Plan Update
Chapter 4 – Facility Requirements - DRAFT
Page | 135
Table 4-86. Ground Transportation Center Requirements
Existing
Capacity
Required loading positions
2016 2018 2022 2027 2032 2037
TNCs 24 7 10 14 17 21 25
Taxicabs 13 5 4 4 4 3 3
Limousines 13 11 12 13 14 16 17
Scheduled and shared-
ride vans (a) 5 1 1 1 1 1
Off-airport parking shuttle 9 6 6 6 6 6 6
Hotel shuttle 7 6 6 6 6 6 6
Scheduled bus 1 1 1 1 1 1 1
Charter bus 5 2 2 3 3 3 3
Public transit 1 1 1 1 1 1 1
(a) No space is currently assigned to scheduled vans. This service is assumed to use off-airport parking shuttle
area.
Source: InterVISTAS, 2019.
As shown, the current allocation of space is expected to be able to substantially meet requirements
through 2037. TNCs would require one additional position by 2037 and limousines would require four
(4) additional positions.
A key assumption in these determinations is the average dwell time. For TNCs, the average dwell time
was determined from a dwell time survey conducted in 2017 when TNCs picked up passengers in the
Garage located immediately across from the Terminal (this garage was demolished in 2019).
Observations conducted in early 2019 in the GTC indicted that dwell times appeared to be longer than
those observed in 2017. This was potentially due to the longer walking distance between the Terminal
and the TNC pickup area located in the GTC. In 2017, if a passenger requested a TNC while in the
Terminal, the passenger would likely arrive at the TNC loading area before their vehicle. With the GTC,
when a passenger requests a TNC while in the Terminal, there is an increased likelihood that the
vehicle arrives at the pickup zone before the passenger. Requirements described above assume
implementation of measures (e.g., prohibiting passengers from hailing a TNC until the passenger is
BNA Airport Master Plan Update
Chapter 4 – Facility Requirements - DRAFT
Page | 136
close to the TNC loading area) that will reduce the chance that a TNC arrives at the GTC before their
passenger does.
4.4.5. Public Parking
From 2018 through 2023, the Airport will be implementing improvements to the parking facilities,
including removing the existing public parking garage and replacing it with approximately 7,000 total
garage spaces. This section summarizes public parking demand and corresponding public parking
facility requirements through the planning period. Requirements are presented for both a “design
day” and a “holiday.” The design day represents a typical busy day during a busy month but does not
represent the busiest day of the year, as there are a limited number of days, such as holidays, when
Airport parking demand is expected to be significantly higher than other days during the year. Thus,
the design day is used to identify the quantity of spaces needed on a day-to-day basis that should be
provided in parking structures and/or paved surface parking lots. Conversely, the holiday demand
represents the busiest day of the year; spaces used only during such periods may be built as
temporary facilities.
4.4.5.1. Base Year Activity
For public parking requirements, 2018 represents Base Year conditions. Due to the ongoing changes
in uses of parking, TNCs, and other services, Base Year conditions reflect activity observed in 2018 to
provide the most up-to-date basis possible.
Historical Analysis
Current and historical peak period occupancies, by facility, provided the basis for estimates of future
public parking requirements. These data were analyzed to identify the design day occupancy and the
peak occupancy. For 2018, the design day was identified by sorting the observed occupancies for
each facility during October and November and ordering them from highest to lowest, creating an “s-
curve”. The s-curve for the Terminal Garage is shown in Figure 4-32 and is an example of the curves
developed for each facility.
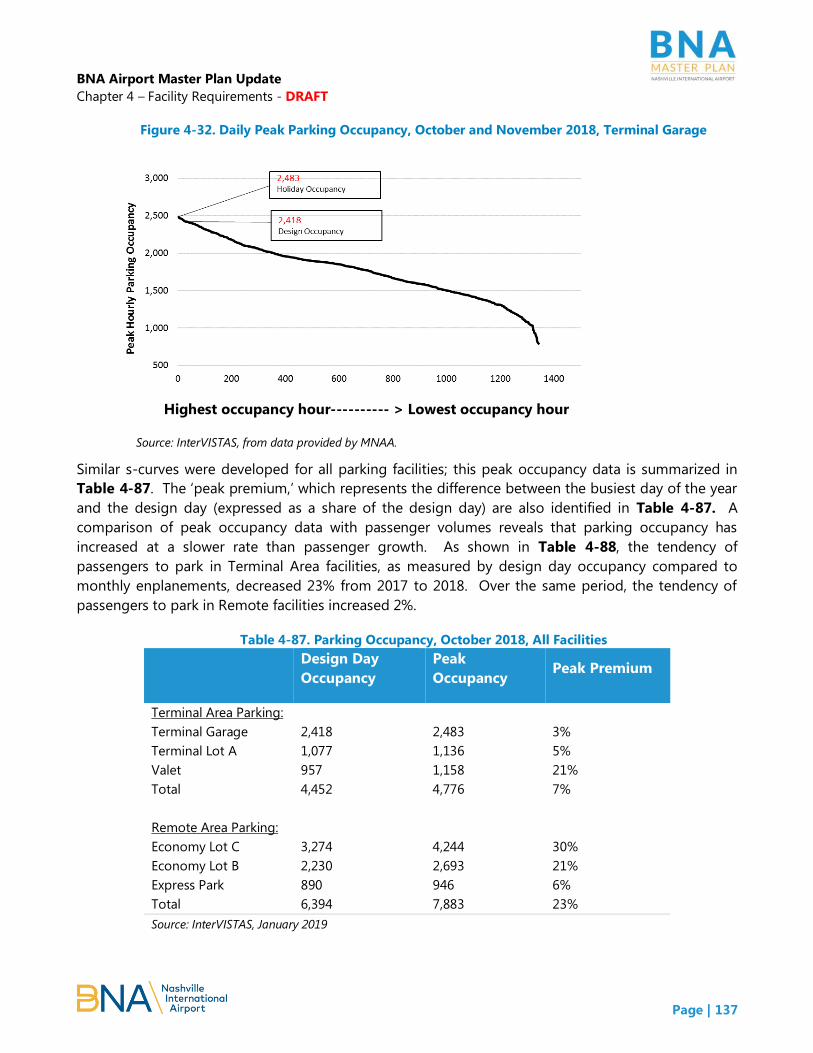
BNA Airport Master Plan Update
Chapter 4 – Facility Requirements - DRAFT
Page | 137
Figure 4-32. Daily Peak Parking Occupancy, October and November 2018, Terminal Garage
Similar s-curves were developed for all parking facilities; this peak occupancy data is summarized in
Table 4-87. The ‘peak premium,’ which represents the difference between the busiest day of the year
and the design day (expressed as a share of the design day) are also identified in Table 4-87. A
comparison of peak occupancy data with passenger volumes reveals that parking occupancy has
increased at a slower rate than passenger growth. As shown in Table 4-88, the tendency of
passengers to park in Terminal Area facilities, as measured by design day occupancy compared to
monthly enplanements, decreased 23% from 2017 to 2018. Over the same period, the tendency of
passengers to park in Remote facilities increased 2%.
Table 4-87. Parking Occupancy, October 2018, All Facilities
Design Day
Occupancy
Peak
Occupancy Peak Premium
Terminal Area Parking:
Terminal Garage 2,418 2,483 3%
Terminal Lot A 1,077 1,136 5%
Valet 957 1,158 21%
Total 4,452 4,776 7%
Remote Area Parking:
Economy Lot C 3,274 4,244 30%
Economy Lot B 2,230 2,693 21%
Express Park 890 946 6%
Total 6,394 7,883 23%
Source: InterVISTAS, January 2019
Highest occupancy hour---------- > Lowest occupancy hour
Source: InterVISTAS, from data provided by MNAA.

BNA Airport Master Plan Update
Chapter 4 – Facility Requirements - DRAFT
Page | 138
Table 4-88 - Parking Demand and Monthly Passengers, October 2017 and 2018
October 2017 October 2018 Growth
Monthly Epax. 654,334 771,444 18%
Terminal Area Parking: Design day space demand Growth
Terminal Garage
Spaces 2,361 2,418 2%
Spaces per 1,000 Epax. 3.61 3.13 (13%)
Terminal Lot A
Spaces 1,843 1,077 (a) (42%)
Spaces per 1,000 Epax. 2.82 1.40 (50%)
Valet
Spaces 699 957 37%
Spaces per 1,000 Epax. 1.07 1.24 16%
Total
Spaces 4,902 4,402 (9%)
Spaces per 1,000 Epax. 7.49 5.77 (23%)
Remote Parking:
Economy Lot C
Spaces 2,842 3,274 15%
Spaces per 1,000 Epax. 4.34 4.24 (2%)
Economy Lot B
Spaces 2,031 2,230 10%
Spaces per 1,000 Epax. 3.10 2.89 (7%)
Express Park
Spaces 421 890 111%
Spaces per 1,000 Epax. 0.64 1.15 79%
Total
Spaces 5,294 6,394 21%
Spaces per 1,000 Epax. 8.08 8.28 2%
Epax. = enplaning passengers
(a) Capacity reduced prior to October 2018 due to construction.
Source: InterVISTAS, January 2019

BNA Airport Master Plan Update
Chapter 4 – Facility Requirements - DRAFT
Page | 139
As shown in Table 4-88, terminal area parking (Terminal Garage, Terminal Lot A, and Valet) has
experienced a larger decrease in passenger willingness to park than remote parking (Economy Lot B,
Economy Lot C, and BNA Express Park). While the overall decrease in parking demand is likely the
result of the increasing popularity of TNCs, the larger decrease in terminal area parking demand per
passenger is likely due to frequently full facilities that required passengers to park elsewhere. The
frequently full conditions were the result of rapid passenger growth as well as ongoing construction in
2018 that reduced the capacity of Terminal Lot A.
Unconstrained Demand Estimate
Recognizing the constrained facility conditions in 2018, future requirements for public parking
demand are based on estimated demand levels that would have occurred were there no construction
impacts to facility capacity.
To isolate the change in behavior of airport customers from increases in airline passenger volumes,
unconstrained demand estimates are expressed as a number of occupied spaces per enplanement.
The 2018 unconstrained demands were estimated as follows:
Identify the parking space demand per passenger prior to the introduction of TNCs. As
described in Preliminary Basis of Design Report, Terminal Area Parking Garage (Walker
Consultants, May 2016) in 2016, the advent of TNCs resulted in a 6% decrease in parking
space demand per passenger from 2014 to 2015. As shown on Table 4-89, prior to the
introduction of TNCs, demand for terminal-area, remote, and total parking was 10.32, 7.52,
and 17.84 spaces per 1,000 monthly passengers, respectively, during October, the peak month
for parking.
Determine the total reduction in parking demand per passenger from 2014 to 2018. As shown
on Table 4-89, 2018 demand for parking was 14.06 spaces per 1,000 monthly passengers,
respectively, a 3.78 space reduction.
Estimate the parking demand reduction due to TNC activity. Analysis of 2018 parking activity
levels compared to 2014 estimated that TNCs accounted for a 20.6% decrease in parking
demand per passenger. As shown in Table 4-89, TNCs reduced demand for terminal-area,
remote, and total parking by 2.12, 1.55, and 3.67 spaces per 1,000 monthly passengers,
respectively. It is assumed that these customers are unlikely to choose to park again.
Assume that the remaining reduction in parking spaces per 1,000 passengers (0.11 spaces per
1,000 passengers) was due to Terminal Garage customers choosing to park off-airport or use
non-TNC modes. It is assumed that once new Garages B and C are complete, these customers
will return and park in terminal-area parking facilities.
Assume that upon completion of Garages B and C, customer use of terminal-area versus
remote facilities will return to the distribution observed prior to the introduction of TNCs. It is
estimated that in 2018, demand for 2.31 spaces per 1,000 passengers occurred in the remote

BNA Airport Master Plan Update
Chapter 4 – Facility Requirements - DRAFT
Page | 140
parking lots instead of terminal-area parking facilities due to insufficient terminal-area parking
capacity.
Table 4-89. Unconstrained Parking Demand, October 2018
Spaces per 1,000 monthly enplanements
Terminal Remote Total
Parking demand prior to introduction of TNCs 10.32 7.52 17.84
Shift to TNCs (20.6%) (2.12) (1.55) (3.67)
Capacity constraints
Shift from Terminal-area to Remote [A] (2.31) 2.31 0
Shift to off-Airport parking and other modes [B] (0.11) 0 (0.11)
Actual October 2018 (see Table 4-88) [C] 5.77 8.28 14.06
Unconstrained October 2018 [D = C – A – B] 8.20 5.97 14.17
Source: InterVISTAS, January 2019.
Based on Walker Consultants report for 2015 conditions, adjusted to reflect Walker conclusions regarding TNC impact on
parking demand (decrease of 6% from 2014 to 2015).
4.4.5.2. Activity Growth Assumptions
As discussed in Section 4.4.2.2, passenger use of parking facilities is expected to gradually decrease
due to continued maturation of TNC market, increasing share of autonomous vehicles, and increasing
use of subscription-based car-sharing services. The parking demand forecast reflects potential
variations in the rate of adoption of these services. In addition to the evolution of mode share,
assumptions used in developing the future parking requirements include:
Upon completion of terminal area facilities construction in 2023, demand currently diverted
to remote parking facilities come back to terminal area facilities. The share of parking
demand occurring in the terminal-area versus remote parking facilities is assumed to remain
constant through the planning period. In practice, however, the Airport can use pricing and
other strategies to modify those shares to encourage or discourage use of certain parking
facilities.
Holiday demand will increase at the same rate as design day parking demand.
BNA Airport Master Plan Update
Chapter 4 – Facility Requirements - DRAFT
Page | 141
Future design day parking space requirements include a circulation factor to reflect the
difficulty motorists have in locating the last available parking spaces in a large facility,
vehicles circulating within a parking structure, and to allow for improperly parked vehicles
and other inefficiencies. Holiday requirements do not include a circulation factor as during
holiday periods, airport parkers typically expect to experience congested conditions and may
allow extra time to find vacant parking spaces.
4.4.5.3. Requirements
Parking space requirements reflect the “low TNC impact” scenario, as that would result in the higher
capacity requirement, and are provided in Table 4-90. As shown, current facility capacity (10,800
spaces) is 600 spaces and 2,400 spaces below typical busy day and peak day demand, respectively.
During such periods, customers frequently parked in aisles and in other areas not intended for
parking. Once Garages A, B and C are completed in 2023, future facility capacity (17,658 spaces) is
expected to accommodate design day and holiday requirements through 2037.
As shown in Table 4-90, in 2032 through 2037, remote parking requirements are expected to exceed
supply.

BNA Airport Master Plan Update
Chapter 4 – Facility Requirements - DRAFT
Page | 142
Table 4-90. Total Parking Requirements, “Low TNC Impact” Scenario
Baseline
(2018)
PAL 1
(2022)
PAL 2
(2027)
PAL 3
(2032)
PAL 4
(2037)
Annual enplanements 8,000,000 9,047,142 9,938,318 10,886,036 11,935,070
Terminal Area:
Total space per enplanement 8.20 7.84 7.42 7.10 6.80
Design Day Demand 6,800 7,150 7,550 7,950 8,350
Design Day Requirement (a) 7,100 7,500 7,950 8,350 8,750
Parking Supply (b) 4,031 7,673 11,783 11,783 11,783
Surplus/(Shortfall) (3,069) 173 3,833 3,433 3,033
Remote Area:
Total space per enplanement 5.97 5.71 5.41 5.18 4.96
Design Day Demand 4,600 4,850 5,150 5,400 5,650
Design Day Requirement (a) 4,850 5,100 5,650 5,950 6,250
Parking Supply 6,769 5,875 7,775 7,775 7,775
Surplus/(Shortfall) 1,919 775 2,125 1,825 1,525
Total Parking:
Total space per enplanement 14.17 13.55 12.82 12.28 11.76
Design Day Demand 11,400 12,000 12,700 13,350 14,000
Design Day Requirement (a) 11,950 12,600 13,600 14,300 15,000
Holiday Requirement 12,950 13,650 14,450 15,200 15,900
Parking Supply (b) 10,800 13,548 19,558 19,558 19,558
Surplus/(Shortfall) – Design Day (c) (1,150) 948 5,958 5,258 4,558
Surplus/(Shortfall) – Holiday (2,150) 102 5,108 4,358 3,658
Source: Parking requirements—InterVISTAS, January 2019; Parking supply—MNAA.
(a) Until 2023, space requirements are based on a 10% circulation allowance both for Terminal-Area and Remote
parking facilities. Assuming space guidance upon completion of Garage A, B and C in 2023, space requirements
include 5% allowance for Terminal-Area parking facilities and 10% for Remote parking facilities
(b) Includes valet storage, excludes valet customer service spaces at the curb.
(c) October 2018 design day occupancy is higher than 100%. Surplus/(Shortfall) for subsequent years is based on
marked space availability and is based on design day requirement. Surplus/(Shortfall) estimates do not include
employee and hotel demand.

BNA Airport Master Plan Update
Chapter 4 – Facility Requirements - DRAFT
Page | 143
4.4.5.4. High Growth Sensitivity
As noted above, the parking requirements presented in this section reflect the “Base” passenger
forecast. Passenger activity growth since 2014 has exceeded projections from multiple forecasts and it
is possible that growth will continue to exceed forecasts. To test potential impacts of growth
exceeding forecast, the “High” passenger forecast, as presented in BNA Master Plan Update, Aviation
Demand Forecasts, dated August 17, 2018, was applied to the future parking space-per-enplanement
ratios presented in Table 4-90 (low TNC impact scenario). The result parking requirements are
summarized in Table 4-91.
Table 4-91. Total Parking Requirements, High Forecast Scenario
Baseline
(2018)
PAL 1
(2022)
PAL 2
(2027)
PAL 3
(2032)
PAL 4
(2037)
Annual enplanements 8,000,000 9,553,211 10,950,798 12,517,561 14,308,485
Terminal Area:
Total space per enplanement 8.20 7.84 7.42 7.10 6.80
Design Day Demand 6,800 7,550 8,350 9,150 10,000
Design Day Requirement (a) 7,100 7,950 8,750 9,600 10,500
Parking Supply (b) 4,031 7,673 11,783 11,783 11,783
Surplus/(Shortfall) (3,069) 123 3,433 2,633 1,783
Remote Area:
Total space per enplanement 5.97 5.71 5.41 5.18 4.96
Design Day Demand 4,600 5,150 5,650 6,200 6,800
Design Day Requirement (a) 4,850 5,400 6,200 6,800 7,500
Parking Supply 6,769 5,875 7,775 7,775 7,775
Surplus/(Shortfall) 1,919 475 1,575 975 275
Total Parking:
Total space per enplanement 14.17 13.55 12.82 12.28 11.76
Design Day Demand 11,400 12,700 14,000 15,350 16,800
Design Day Requirement (a) 11,950 13,350 14,950 16,400 18,000
Holiday Requirement 12,950 14,450 15,900 17,450 19,100
Parking Supply (b) 10,800 13,548 19,558 19,558 19,558
Surplus/(Shortfall) – Design Day (c) (1,150) 198 4,608 3,158 1,558
Surplus/(Shortfall) – Holiday (2,150) (902) 3,658 2,108 458
Source: InterVISTAS, January 2019.
(a) Until 2023, space requirements are based on a 10% circulation allowance both for Terminal-Area and Remote parking
facilities. Assuming space guidance upon completion of Garage A, B and C in 2023, space requirements include 5%
allowance for Terminal-Area parking facilities and 10% for Remote parking facilities

BNA Airport Master Plan Update
Chapter 4 – Facility Requirements - DRAFT
Page | 144
(b) Includes valet storage, excludes valet customer service spaces at the curb.
(c) October 2018 design day occupancy is higher than 100%. Surplus/(Shortfall) for subsequent years is based on marked
space availability and is based on design day requirement. Surplus/(Shortfall) estimates do not include employee and
hotel demand.
4.4.6. Rental Cars
This section summarizes rental car requirements through the planning period.
4.4.6.1. Base Year Activity
The existing Consolidated Rental Car Facility (CONRAC) accommodates eleven rental car brands, which
are owned by four companies: Enterprise Holdings; Hertz Corporation; AvisBudget Group; and
Advantage. In November 2018, questionnaires were distributed to the four rental car companies to
understand their current facility capacity and operations. Follow-up interviews were conducted to
better understand the questionnaire responses and to conduct a facility walk-through.
Representatives of Enterprise, Avis, and Advantage participated in the process. Hertz did not
participate and therefore market share data was used to estimate their facility requirements. The
facility requirements are presented in aggregate to protect the confidentiality of individual companies.
The rental car facility requirements are divided into four separate areas: Customer Service Counters,
Ready and Return Garage, Quick Turn Around (QTA), and Remote Storage Sites.
4.4.6.2. Activity Growth Assumptions
The 2018 facility requirements were calculated using peak-hour transaction data from a typical busy
day, as provided by the rental car companies. The 2018 requirements were then increased in
accordance with (a) the passenger activity forecast and (b) the decline in rental car transactions per
airline passenger, as described in Section 4.4.2.2.
In 2017, DeMattei Wong Architecture (DWA) developed rental car facility requirements based on 2016
activity. A comparison to DWA’s estimated 2016 facility requirements is included in the descriptions
below. DWA’s future estimated requirements are significantly higher due to differences in assumed
future changes in mode shares.
Table 4-92 summarizes the future rental car facility requirements, which reflect the “low TNC impact”
scenario as this provides the more conservative assumption for rental car requirements. Key
assumptions for each of the four facility elements are provided below.

BNA Airport Master Plan Update
Chapter 4 – Facility Requirements - DRAFT
Page | 145
Table 4-92. Rental Car Requirements
Existing
capacity 2018 2022 2027 2032 2037
Annual Enplanements 8,000,000 9,047,142 9,938,318 10,886,036 11,935,070
Customer Service Counters 45 41 43 45 46 47
Ready and Return Area (acres) 18 17.3 19.0 20.2 21.1 22.0
QTA Area
Wash/Fuel Area (acres) 2.6 4.1 4.6 4.9 5.0 5.3
Short-Term Storage (acres) 2.2 7.2 7.9 8.4 8.8 9.2
Remote Storage Sites (acres) 27 14.5 15.9 16.9 17.6 18.4
Source: InterVISTAS, January 2019
Customer Service Counters
The number of required customer service counters was calculated for each individual company using
industry-accepted standards regarding the number of counters per-bypass and per-counter-
transaction. Because of the increasing number of customers that bypass the counters and go directly
to their vehicle, the required number of counters is assumed to grow at half the growth rate of other
rental car facilities, which is consistent with the overall industry trend.
41 counters are required in 2018, 45 in 2027, and 47 in 2037. There are currently 45 counters. Any
queues that extend beyond the allocated queueing area is due to either (a) the company is not fully-
staffing their counters during a peak hour and/or (b) the number of counters allocated to a single
company is not sufficient for their market share. DWA also indicated a need of 41 counters in 2016.
Ready and Return Garage
The ready/return garage consists of four key components: the ready spaces (clean vehicles ready to be
rented); the return spaces (rows where vehicles are returned—these vehicles are considered dirty);
customer service kiosks; and exit booths/lanes. Facility requirements were identified for each of these
four components, based on industry-accepted metrics regarding the required number of ready spaces,
return spaces, and exit booths per the peak-hour transactions.

BNA Airport Master Plan Update
Chapter 4 – Facility Requirements - DRAFT
Page | 146
The requirements are summarized into an area requirement. 17.3 acres of ready/return floor space is
required in 2018, 20.2 acres in 2027, and 22.0 acres in 2037. The existing ready/return garage provides
approximately 18 acres. DWA estimated that 19 acres were required for ready/return in 2016.
Quick Turn Around (QTA) Areas
The QTA consists of two parts: (a) a wash and fuel area, which includes fuel islands, car wash tunnels,
and vehicle queueing areas (referred to as stacking spaces) and (b) a short-term storage area.
Requirements for each individual component of the QTA were developed, but they are summarized as
area requirements in Table 4-92. It is assumed that all of the returns during the peak rental hour are
processed within an hour to partly replenish the vehicles available for rentals. As such, the
requirements are based on industry-accepted metrics regarding the time it takes to fuel, vacuum, and
wash a vehicle. Sufficient short-term storage should exist to provide for all rentals on a typical busy
day, accounting for available vehicle storage in ready/return and the wash and fuel area.
For the wash and fuel area, 4.1 acres are currently required while 2.6 acres are provided. The stacking
area is under-sized according to industry standards. Also, most CONRAC QTAs include light
maintenance bays, which are not included in the QTA at the Airport. The area requirement for wash
and fuel increases to 4.9 acres in 2027 and 5.3 acres in 2037.
For short-term storage, 7.2 acres are required in 2018, 8.4 acres in 2027 and 9.2 acres in 2037. The
current short-term storage on the roof of the QTA provides 2.2 acres. Due to the significant shortage
of short-term storage area, rental car companies are frequently shuttling vehicles to the remote
storage sites on peak return days and returning them to the terminal on peak rental days.
Combined, the 2018 demand for QTA area is 11.3 acres. DWA estimated that 12.23 acres of QTA area
was required in 2016. DWA’s estimate for remote storage is significantly lower, so it is believed that
their requirement traded more short-term storage area for less remote storage area.
Remote Storage Sites
The remote storage sites consist of maintenance bays, offices, vehicle storage for maintenance, vehicle
parking for in-fleeting and de-fleeting, and area for car transports to load/off-load. It was estimated
that 10% of returns must be sent to the remote storage sites for maintenance needs. Data was also
collected regarding in-fleeting and de-fleeting operations.
14.5 acres are required for remote activities in 2018, which increases to 16.9 acres in 2027 and 18.4
acres in 2037. Approximately 27 acres are available in the remote sites. The shortage of available
short-term storage in the QTA is somewhat mitigated by the excess capacity available in the remote
sites. DWA estimated that 10.9 acres were required for the remote sites in 2016.
BNA Airport Master Plan Update
Chapter 4 – Facility Requirements - DRAFT
Page | 147
4.4.7. Employee Parking
This section summarizes employee parking requirements through 2037. These requirements are
based on those identified as part of the Employee Parking Lot Analysis, completed in January 2019. In
general, the employee parking requirements are based the following assumptions:
Employees currently parking at the Airport include MNAA employees, “tenant” employees
(comprised of employees of concessionaires, Federal agencies, service provide, and airline
employees that are not flight crew), and “commuter” employees (comprised of airline flight
crews who typically park for multiple days).
2018 demand was based on observations of peak accumulations in July through November
and December in multiple facilities used by employee parkers.
Requirements do not include employees currently parking within leased property or off-
Airport.
Employee parking demand is assumed to grow at the average of annual growth in
enplanements and annual growth in commercial operations.
In 2019 and 2020, employee parking demand will increase slightly faster due to the
introduction of a new concession management team that expects to use higher numbers of
employees to staff the in-terminal concessions.
Employee parking demand generally increases at a rate reflecting the blended growth rates in
total passengers and commercial operations.
Requirements include a 10% circulation allowance to improve a parker’s ability to locate a
space in a large, full parking facility.
As of March 2019, the Airport was developing additional employee parking such that 2,285
spaces would be available by May 2019.
Table 4-93 summarizes the employee parking facility requirements. Values for 2027 and 2032 were
not included in the Employee Parking Lot Analysis and are based on applying the growth rate
assumptions used in that analysis to the interim years. As shown, following the capacity expansion
(planned for completion in May 2019), the Airport will have sufficient employee parking capacity
through the planning period.

BNA Airport Master Plan Update
Chapter 4 – Facility Requirements - DRAFT
Page | 148
Table 4-93. Employee Parking Requirements
Required Parking Spaces
Post-BNA Vision
capacity (a) 2019 2024 2027 2032 2037
Employee parking 2,257 1,525 1,850 1,900 2,075 2,250
(a) Includes 1,882-space expanded Employee Lot (as of June 2019), 75 spaces in the D&E Lot, and 300 spaces to be
available in the new Terminal Garages.
Source: Employee Parking Lot Analysis, AECOM, January 2019.
4.4.8. Landside Facility Requirements Summary
Roadways:
o Ramp entering the Airport from eastbound I-40 requires one additional lane by 2022 and
another by 2032.
o Ramp exiting the Airport to westbound I-40 requires one additional lane by 2022.
o Up to 11 other roadway segments (links) may require additional capacity if future activity
varies from TARI assumptions
Curbside – Departures Level:
o Requires immediate redistribution of demand from inner curb to outer curb
o Requires additional lane on outer roadway or relocation of Employee Shuttle from outer
roadway by 2037 and allow up to 33% of TNCs to drop off on inner curbside
Curbside – Arrivals Level:
o Requires immediate redistribution of demand from middle curb to outer curb
o Requires two additional lanes by 2032
Ground Transportation Center:
o Requires additional capacity for TNCs and limousines, which should be achieved by
reallocating area from services that have surplus capacity

BNA Airport Master Plan Update
Chapter 4 – Facility Requirements - DRAFT
Page | 149
Public Parking:
o No additional parking spaces required following completion of Garage and TARI project.
Rental Cars:
o Requires an immediate 6.5 additional acres in the quick turn-around area and up to 10
total additional acres by 2037. The additional area required is to provide additional short-
term storage associated with fueling and washing operations.
o Requires one additional customer service counter by 2032 and another by 2037.
o Requires 1.0 additional acres of ready/return capacity by 2022 and up to 4.0 total
additional acres by 2037.
Employee Parking:
o Requires no additional capacity following completion of the programmed Employee Lot
expansion and Garage B/C.
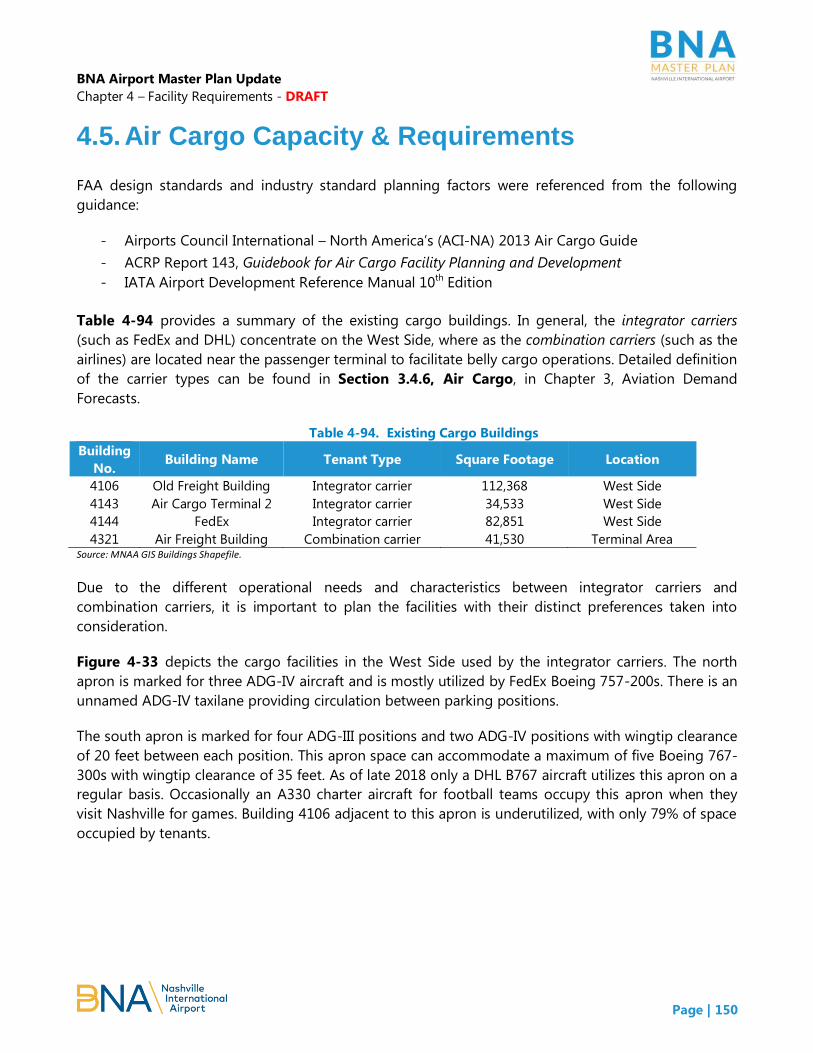
BNA Airport Master Plan Update
Chapter 4 – Facility Requirements - DRAFT
Page | 150
4.5. Air Cargo Capacity & Requirements
FAA design standards and industry standard planning factors were referenced from the following
guidance:
- Airports Council International – North America’s (ACI-NA) 2013 Air Cargo Guide
- ACRP Report 143, Guidebook for Air Cargo Facility Planning and Development
- IATA Airport Development Reference Manual 10th Edition
Table 4-94 provides a summary of the existing cargo buildings. In general, the integrator carriers
(such as FedEx and DHL) concentrate on the West Side, where as the combination carriers (such as the
airlines) are located near the passenger terminal to facilitate belly cargo operations. Detailed definition
of the carrier types can be found in Section 3.4.6, Air Cargo, in Chapter 3, Aviation Demand
Forecasts.
Table 4-94. Existing Cargo Buildings
Building
No. Building Name Tenant Type Square Footage Location
4106 Old Freight Building Integrator carrier 112,368 West Side
4143 Air Cargo Terminal 2 Integrator carrier 34,533 West Side
4144 FedEx Integrator carrier 82,851 West Side
4321 Air Freight Building Combination carrier 41,530 Terminal Area Source: MNAA GIS Buildings Shapefile.
Due to the different operational needs and characteristics between integrator carriers and
combination carriers, it is important to plan the facilities with their distinct preferences taken into
consideration.
Figure 4-33 depicts the cargo facilities in the West Side used by the integrator carriers. The north
apron is marked for three ADG-IV aircraft and is mostly utilized by FedEx Boeing 757-200s. There is an
unnamed ADG-IV taxilane providing circulation between parking positions.
The south apron is marked for four ADG-III positions and two ADG-IV positions with wingtip clearance
of 20 feet between each position. This apron space can accommodate a maximum of five Boeing 767-
300s with wingtip clearance of 35 feet. As of late 2018 only a DHL B767 aircraft utilizes this apron on a
regular basis. Occasionally an A330 charter aircraft for football teams occupy this apron when they
visit Nashville for games. Building 4106 adjacent to this apron is underutilized, with only 79% of space
occupied by tenants.

BNA Airport Master Plan Update
Chapter 4 – Facility Requirements - DRAFT
Page | 151
Figure 4-33. Existing Cargo Facilities for Integrator Carriers (West Side)
Figure 4-34 depicts the cargo facility in between the passenger terminal area and the fuel farm. This
facility serves the combination carriers.
Figure 4-34. Existing Cargo Facilities for Combination Carriers (Terminal Area)

BNA Airport Master Plan Update
Chapter 4 – Facility Requirements - DRAFT
Page | 152
4.5.1. Air Cargo Apron Requirements
The combination carriers load their cargo to the belly compartments of their passenger aircraft, which
are located at the terminal apron. This section focuses on estimating the aircraft parking needs for the
integrator carriers, who currently occupy the north and south cargo aprons on the West Side.
4.5.1.1. Air Cargo Aircraft Parking Positions
The air cargo aircraft fleet mix presented in Table 4-95 was used to determine an adequate apron
area to accommodate the air cargo fleet at BNA. Based on the information found in Section 3.4.6, Air
Cargo, in 2017, over 78% of freighter operations at BNA were flown by B757-200 aircraft and those
operations are increasing with the growth of FedEx. Meanwhile, the DHL operations are driving the
increase of B767-300 freighter operations at BNA. This analysis is based on the assumption that the
future fleet mix for freighter at BNA will still be dominated by B757-200 with slight increase in B767-
300 operations. These two aircraft are selected as the design aircraft for the cargo facility
requirements.
Table 4-95. Air Cargo Design Aircraft Characteristics
Aircraft Type
Percentage of Total
2017 Cargo
Operations
Wingspan(ft.) Length(ft.) ADG
Boeing 757-200F 78% 124.87 155.25 IV
Boeing 767-300F 8% 156.07 180.18 IV Sources: FAA’s Traffic Flow Management System Counts (TFMSC). AECOM analysis.
Based on the FAA Traffic Flow Management System Counts (TFMSC) data, in 2017 the peak month
cargo operations (arrivals and departures) accounted for 10% of the total annual cargo operations
(arrivals and departures). This analysis assumes this peak month ratio of 10% remains constant
throughout the planning horizon.
The average day in the peak month (ADPM) operations can be calculated using the following formula:
(Annual Operations) x (Peak Month Ratio) / (30 days) = ADPM Operations
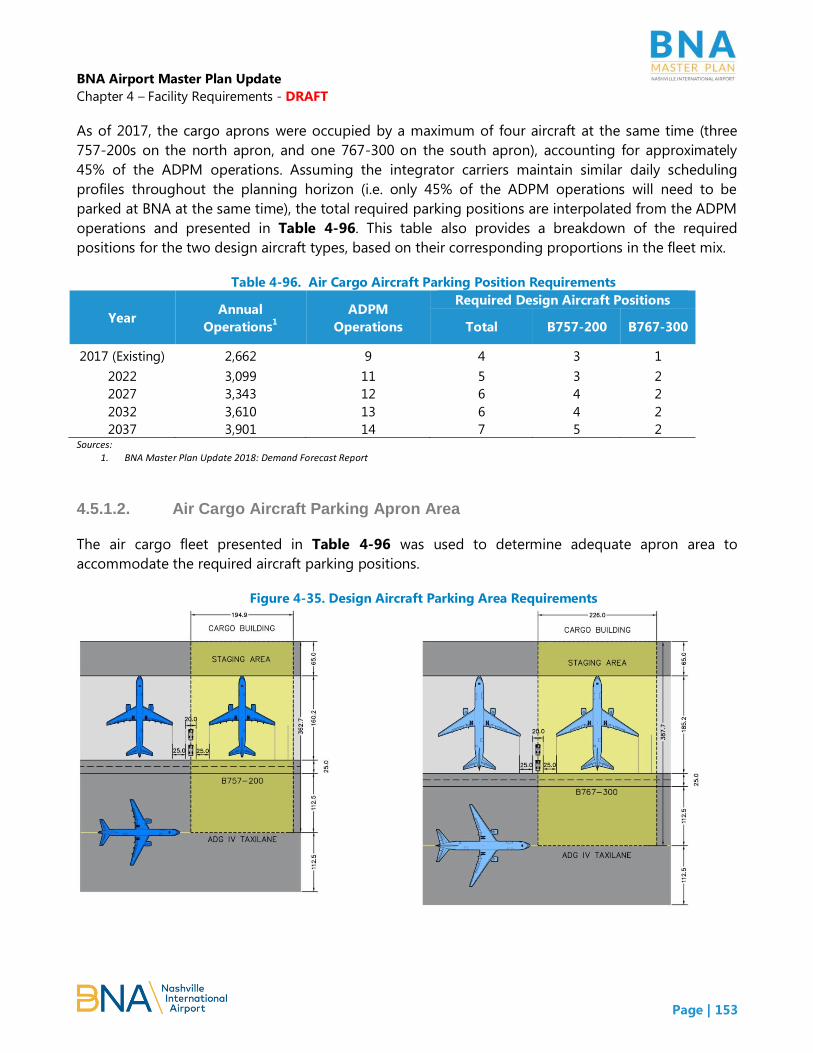
BNA Airport Master Plan Update
Chapter 4 – Facility Requirements - DRAFT
Page | 153
As of 2017, the cargo aprons were occupied by a maximum of four aircraft at the same time (three
757-200s on the north apron, and one 767-300 on the south apron), accounting for approximately
45% of the ADPM operations. Assuming the integrator carriers maintain similar daily scheduling
profiles throughout the planning horizon (i.e. only 45% of the ADPM operations will need to be
parked at BNA at the same time), the total required parking positions are interpolated from the ADPM
operations and presented in Table 4-96. This table also provides a breakdown of the required
positions for the two design aircraft types, based on their corresponding proportions in the fleet mix.
Table 4-96. Air Cargo Aircraft Parking Position Requirements
Year Annual
Operations1
ADPM
Operations
Required Design Aircraft Positions
Total B757-200 B767-300
2017 (Existing) 2,662 9 4 3 1
2022 3,099 11 5 3 2
2027 3,343 12 6 4 2
2032 3,610 13 6 4 2
2037 3,901 14 7 5 2 Sources:
1. BNA Master Plan Update 2018: Demand Forecast Report
4.5.1.2. Air Cargo Aircraft Parking Apron Area
The air cargo fleet presented in Table 4-96 was used to determine adequate apron area to
accommodate the required aircraft parking positions.
Figure 4-35. Design Aircraft Parking Area Requirements

BNA Airport Master Plan Update
Chapter 4 – Facility Requirements - DRAFT
Page | 154
As depicted in Figure 4-35, the size for each aircraft parking position includes:
- ADG-IV taxilane clearance (112.5-feet)
- Aircraft stand (aircraft length plus 5-foot aircraft tail clearance)
- 25-feet-wide vehicle service road (VSR) for GSE operations
- 65-feet of clearance from head of stand service road to building for marshaling and other
support functions
- 25-feet of clearance between aircraft wingtips and fixed/movable objects
- 20-foot ground support equipment (GSE) maneuvering/staging area between aircraft parking
positions
The apron paving area requirements for B757-200 and B767-300 parking are approximately 7,900 SY
and 9,800 SY respectively.
Table 4-97 summarizes the cargo apron area requirements. The existing cargo apron areas are
approximately 80,230 square yards in total. Therefore, the cargo aprons are expected to be sufficient
to accommodate existing and future cargo operations through the planning horizon.
Table 4-97. Cargo Aircraft Parking Apron Area Requirements
Year ADPM Operations Required Parking
Positions1
Apron Size
SF SY
2017 (Existing) 9 4 301,500 33,500
2022 11 5 389,700 43,300
2027 12 6 460,800 51,200
2032 13 6 460,800 51,200
2037 14 7 531,900 59,100 Note:
1. Calculated based on the previously discussed assumption that only 45% of the ADPM operations will need to be parked at BNA at the same time
Based on the assumed square yardage per aircraft parking position and percentage split of 757 and
767 operations, it is estimated that the existing apron area of 80,230 square yards can accommodate
up to 9 design aircraft positions (seven 757-200s and two 767-300s) at a given time, and therefore is
adequate to serve the projected cargo aircraft parking demand. In addition to the projected cargo
aircraft parking demand, the capacity of nine (9) design aircraft positions can also absorb some
additional demand from a new carrier. Should any new carrier require more cargo aircraft parking
position than calculated in this analysis, the cargo apron in the west can be expanded to
accommodate the growth.

BNA Airport Master Plan Update
Chapter 4 – Facility Requirements - DRAFT
Page | 155
4.5.2. Air Cargo Building Area
Air cargo building requirements are estimated as a function of projected cargo volumes. The air cargo
building must have sufficient space for the following functions:
- Consolidating outbound freight into unit load devices (ULD) or onto cargo carts for loading
onto cargo aircraft
- Breaking down, sorting, and loading inbound freight onto individual trucks for ground
shipping.
- Short-term storage of cargo while awaiting additional material for consolidation, aircraft
arrival/departure, and truck arrival/departure
Typically, in order to avoid congestion and maintain a smooth process, increase in cargo volume
would mean higher building space requirements. Based on information found in Section 3.5.2, Air
Cargo Forecast, cargo throughput is expected to grow at BNA. Table 4-98 provides a summary of
projected cargo throughput by integrator carriers and combination carriers. As discussed in Section
3.4.6, the air mail at BNA is carried by combination carriers as well. The cargo building facility
requirements are estimated based on the different cargo throughputs associated with each carrier
type.
Table 4-98. Projected Cargo Throughput by Type
Year
Freight (Tons) Air mail (tons)
Integrator
Carriers1
Combination
Carriers1 Combination Carriers
2
2017 (Existing) 39,720 8,633 808
2022 46,234 11,031 959
2027 49,878 13,301 1,034
2032 53,858 15,812 1,117
2037 58,210 18,638 1,207 Sources:
1. Chapter 3, Aviation Demand Forecasts, Table 27 2. Chapter 3, Aviation Demand Forecasts, Table 26
Cargo building utilization rate is a factor used in determining projected building space required for
cargo operations. The cargo utilization rate is calculated through dividing cargo volume by the
available cargo processing space. The resulting quotient is a measure of cargo tonnage per square
foot. Utilization rates can fluctuate based on how the cargo is processed, as well as the addition or
removal of available cargo processing space.
According to the previous master plan, BNA experienced cargo building utilization rates between 0.26
and 0.36 annual cargo tons per square foot. As of 2018, the cargo buildings on the west side are less
utilized, with a utilization rate of approximately 0.18 tons per square foot.
ACRP Report 143, Guidebook for Air Cargo Facility Planning and Development, indicates that the
building utilization rate for all-cargo carriers (i.e. integrator carriers) is typically 0.81 annual ton per

BNA Airport Master Plan Update
Chapter 4 – Facility Requirements - DRAFT
Page | 156
square foot, and the rate for passenger airlines (i.e. combination carriers) is typically 0.64, based on
extensive data collection efforts. In order to avoid overbuilding based on current low building
utilization rates, these typical rates suggested by ACRP are used to calculate the future cargo building
requirements at BNA to process the projected cargo tonnage.
Table 4-99 provides a summary of the building space requirements by carrier types.
Table 4-99. Projected Cargo Building Requirements by Carrier
Year
Integrator Carriers
(0.81 annual ton per square foot)
Existing Space: 229,750 s.f.
Combination Carriers
(0.64 annual ton per square foot)
Existing Space: 33,030 s.f.
Building s.f.
Required for
Freight
% of the
Existing
Building
Utilized
Building s.f.
Required
for Freight
Building s.f.
Required for
Air Mail
Total Building
s.f. Required
% of the
Existing
Building
Utilized
2017 49,100 21% 13,500 1,300 14,800 45%
2022 57,100 25% 17,300 1,500 18,800 57%
2027 61,600 27% 20,800 1,700 22,500 68%
2032 66,500 29% 24,800 1,800 26,600 81%
2037 71,900 31% 29,200 1,900 31,100 94% Source: AECOM Analysis.
As summarized above in Figure 4-33, the three buildings leased to, or are suited to be leased to
integrator carriers on the West Side provide 229,750 square feet of total building space, which is more
than adequate for the projected integrator carriers demand throughout the planning horizon. Since
the integrator cargo buildings are underutilized in the current condition, the available capacity could
be available to new carriers that wish to start operations at BNA.
Only one building is used by the combination carriers - Building 4321 (Air Freight Building) comprising
41,530 square feet located near the passenger terminal for easier integration with airline operations.
Only 83% of the Building 4321 is currently occupied by combination carriers (i.e. 33,030 square feet),
and the remaining 17% of space is rented to tenants providing ground support equipment (GSE)
maintenance and support services. Although Table 4-99 indicates that the required building footage
for the projected freight and air mail tonnage is lower than 33,030 square feet, the airlines in Building
4321 are experiencing space shortage as of late 2018 because they use this building not only for belly
cargo processing, but also for GSE storage and maintenance. In order to ensure sufficient space for
cargo processing, a separate facility should be identified for GSE. Moreover, based on industry
experience, some airlines experience space shortage due to a suboptimal workflow. Enhancing cargo
processing workflow would help airlines better utilize existing building space without requiring facility
expansion.

BNA Airport Master Plan Update
Chapter 4 – Facility Requirements - DRAFT
Page | 157
4.5.3. Cargo Landside Facilities
The landside facilities are a key element in evaluating the overall efficiency of cargo operations. As
noted in the ACI-NA Air Cargo Guide, the ground networks of integrator carriers are expanding,
increasing demand for adequate landside facilities at key junction points. Landside facilities include
mainly the truck docks, the associated maneuvering area, and vehicle parking area.
Figure 4-33 above depicted the landside areas for each of the cargo buildings on the West Side. The
truck maneuvering area for FedEx (Building 4144) consists of truck docks behind the building,
circulation area, and container staging areas. The total available truck docks with capabilities to
load/unload directly from the building are estimated to be 32. The adjacent Building 4143 does not
have truck docking capability. Building 4106 has a total building frontage of 1,155 linear feet, but
currently some segments of the building frontage are used for employee vehicle parking or
equipment staging instead of truck docks. The total available truck docks with capabilities to
load/unload directly from the building are estimated to be 59.
Figure 4-34 above depicted the landside areas for Building 4321 in the terminal area. Similar to the
condition at Building 4106, the building frontage of Building 4321 is not entirely dedicated to truck
docks; instead, several areas are marked for vehicle parking.
Based on guidelines provided in the ACI-NA Air Cargo Guide and ACRP Report 113, the following
planning parameters were used for sizing the landside facilities:
Truck dock spaces: 0.6 spaces per 1,000 square feet of building
Truck dock area depth: 150 feet to allow for docking and maneuvering
Personal vehicle parking:
Two employee parking spaces per 1,000 square feet of cargo building
One customer parking space per 10,000 square feet of cargo building
350 square feet per vehicle parking space
Table 4-100 summarizes landside facility requirements based on these parameters. Based on industry
guidelines, the landside areas for cargo operations, including truck dock, truck maneuvering, and
vehicle parking are adequate through the planning period.

BNA Airport Master Plan Update
Chapter 4 – Facility Requirements - DRAFT
Page | 158
Table 4-100. Air Cargo Landside Facility Requirements
Landside Facility - Combination Carriers
Required Air
Cargo Building
Space (s.f.)
Required Truck
Dock Positions
Required Truck
Maneuvering
Areas (s.f.)
Vehicle Parking
Areas (s.f.)
Existing 41,530 26 49,540 25,250
2017 14,800 9 20,250 10,500
2022 18,800 12 27,000 13,300
2027 22,500 14 31,500 15,750
2032 26,600 16 36,000 18,900
2037 31,100 19 42,750 22,050
Landside Facility – Integrator Carriers
Required Air
Cargo Building
Space (s.f.)
Required Truck
Dock Positions
Required Truck
Maneuvering
Areas (s.f.)
Vehicle Parking
Areas (s.f.)
Existing 229,750 91 290,906 183,570
2017 49,100 30 67,500 36,400
2022 57,100 35 78,750 42,350
2027 61,600 37 83,250 45,850
2032 66,500 40 90,000 49,000
2037 71,900 44 99,000 53,200 Source: AECOM Analysis.
4.5.4. Cargo Facility Requirements Summary
Based on the cargo facility requirements analysis, it is summarized that:
Apron Area:
o The south and north cargo aprons are adequately sized to accommodate future cargo
aircraft parking needs during the peak hour
Buildings:
o The three cargo buildings on the West Site are sufficiently sized for future integrator cargo
processing needs
o The Air Freight Building (4321) in the terminal area is sufficiently sized for future combination
carrier and air mail demand; however, the airlines experience space shortage due to their
need to also store and maintain GSE in the same building. It is recommended that a
separate facility be identified for GSE so that Building 4321 can be dedicated to belly cargo
operations. Also, the airlines’ cargo processing flows can be further optimized to facilitate
efficient use of building space.
Landside Facilities:
o Truck docks, truck maneuvering, and vehicle parking are adequate through the planning
period.
Based on the evaluation of existing air cargo facilities, there is sufficient building, apron, and
landside space to accommodate additional integrator cargo operations. Recently, Amazon

BNA Airport Master Plan Update
Chapter 4 – Facility Requirements - DRAFT
Page | 159
announced the opening of an “Operations Center of Excellence” to serve as the company’s Eastern
U.S. hub for Retail Operations in downtown Nashville. The company expects to add 5,000 new
employees to their existing 2,500-person customer fulfillment infrastructure. While it could be
expected that the growth of Amazon’s presence in the Nashville area would have positive effects on
passenger and airline activity1, there has been no indication to date that Amazon intends to begin
air cargo operations at BNA. Nevertheless, there are available facilities for modest introduction of
new air cargo service or increased utilization by existing integrator cargo carriers at BNA.
1 https://www.bisnow.com/national/news/office/amazons-operations-center-announcement-for-
nashville-means-big-plans-for-citys-infrastructure-housing-and-hospitality-94962
4.6. General Aviation Capacity and Requirements
This section focuses on evaluating the General Aviation (GA) facility needs for the planning horizon.
The GA facilities include hangars, apron areas, Fixed Base Operator (FBO) terminal buildings, and
vehicle parking areas, as illustrated on Figure 4-36.
Figure 4-36. General Aviation Facilities at BNA

BNA Airport Master Plan Update
Chapter 4 – Facility Requirements - DRAFT
Page | 160
The following documents provided standards, guidance, and industry recommendations and planning
factors for the analysis:
- Federal Aviation Administration (FAA) Advisory Circular 150/5300-13A (Change 1), Airport
Design
- FAA Advisory Circular 150/5360-13 (AC13), Planning and Design Guidelines for Airport Terminal
Facilities
- Transportation Research Board (TRB) Airport Cooperative Research Program (ACRP) Report
113: Guidebook on General Aviation Facility Planning
- Federal Aviation Administration (FAA) Advisory Circular 150/5390-2C, Heliport Design
GA aircraft are typically categorized into two groups at airports – based aircraft and transient
aircraft.
Based aircraft are aircraft normally stored at the airport, requiring a parking position either on
the apron or in a hangar. The tenants (pilots, aircraft owners, etc.) choose between these two
options according to their aircraft’s characteristics (size, condition, age, needs, etc.) and based
on space availability, preference, price, location, weather, and other needs (maintenance,
storage of parts, frequency of usage, etc.).
Transient aircraft are visiting aircraft and, therefore, do not rent parking positions at BNA and
typically use the Airport for takeoff, landing, fueling, and occasionally maintenance.
The FAA classifies aircraft based on their category and class. The typical based and transient aircraft
categories at BNA are listed below.
Single-Engine Airplanes (SE)
Single-engine airplanes are powered by one piston or turbine engine, typically located at the nose of
the airplane with one propeller attached to it. These aircraft are characterized by their smaller size,
lighter weight, and lower purchasing cost. The representative models that are observed at BNA include
Cessna 210 and Pilatus PC-12.
Cessna 210 Pilatus PC-12
Photo Source: AOPA Photo Source: Pilatus
Multi-Engine Airplanes (ME)

BNA Airport Master Plan Update
Chapter 4 – Facility Requirements - DRAFT
Page | 161
Multi-engine airplanes are powered by more than one piston or turbine engine, typically located on
the wings of the airplane with one propeller attached to each engine. The representative models that
are observed at BNA include Beechcraft King Air C90 and 350 models.
Beechcraft King Air C90 Beechcraft King Air 350
Photo Source: Beechcraft Photo Source: Beechcraft
Jet Airplanes
Although jet airplanes can be considered both single-engine and multi-engine depending on the
number of engines they have, they are all included in this separate category for the purpose of this
report. Jet airplanes (or simply referred to as “jets”) are aircraft propelled by jet engines through jet
propulsion, as compared to propeller-powered airplanes under the previous two categories. The
propeller-powered airplanes generally achieve maximum efficiency at lower speeds and altitudes,
whereas jets can achieve much higher speeds and altitudes and are typically used for longer-range
trips. The representative jets that are observed at BNA for GA purposes include the Dassault Falcon
50EX and Gulfstream IV.
Dassault Falcon 50EX Gulfstream IV (G400)
Photo Source: Dassault Aviation Photo Source: Globalair.com
Helicopters
Compared to fixed-wing airplanes, helicopters are a type of rotorcraft in which lift and thrust are
generated from the rotors instead of the wings. The rotors allow aircraft to take off and land vertically,
in comparison to the fixed-wing aircraft which require a runway for takeoff run and landing
deceleration. One based GA helicopter at BNA is a Bell 206.

BNA Airport Master Plan Update
Chapter 4 – Facility Requirements - DRAFT
Page | 162
Bell 206
Photo Source: Globalair.com
Table 4-101 provides a summary of the percentage of GA aircraft operations (based and transient) at
BNA by each aircraft category based on 2017 annual operations data obtained from the FAA Traffic
Flow Management System Counts (TFMSC) database. The TFMSC database reports GA operations
under two categories, air taxi and general aviation. As defined in the TFMSC glossary, “general
aviation” is defined as takeoffs and landings of all civil aircraft, except those classified as air carriers or
air taxis. An “air taxi” is an aircraft designed to have a maximum seating capacity of 30 seats or less or
a maximum payload capacity of 7,500 pounds or less, carrying passengers or cargo for hire or
compensation. With this definition, the scheduled passenger services operated by regional jets (both
Bombardier and Embraer) at the passenger terminal by the airlines would be included in the number
of air taxi operations in the TFMSC database. These operations are excluded from this analysis because
they do not utilize the GA facilities.
Table 4-101. Percentage of Annual Operations at BNA by Aircraft Category
Aircraft Category Percentage of Annual Operations
Air Taxi 100%
Multi-Engine 0.20%
Jet 99.80%
General Aviation 100%
Single-Engine 9.78%
Multi-Engine 23.15%
Jet 67.05%
Helicopter 0.02% Source: FAA Traffic Flow Management System Counts (TFMSC) 2017 database
4.6.1. GA Design Aircraft
In order to estimate the hangar and apron size needed to accommodate future GA activities at BNA,
the “design aircraft” and square footage required to accommodate it are identified. The design aircraft
enables airport planners and engineers to design the airport in such a way as to satisfy the operational
requirements of such aircraft and meet FAA design separation standards.
For fixed-wing airplanes:

BNA Airport Master Plan Update
Chapter 4 – Facility Requirements - DRAFT
Page | 163
- The square footage requirements for indoor parking in the hangars account for the aircraft
wingspan, overall length, and a clearance of 10 feet around the aircraft for maneuvering and
equipment storage purposes4.
- The square footage requirements for outdoor tie-down and FBO parking on the apron
account for the aircraft wingspan, overall length, 10-feet wingtip clearance5, and clearance
from the taxilane Object Free Area (OFA). Typically, the requirements for outdoor parking are
higher than those for indoor due to the inclusion of the adjacent required taxilane object free
area (OFA).
For helicopters6:
Based helicopters are typically parked in hangars. The square footage requirements for indoor
parking are assumed to be 50 feet by 50 feet per helicopter based on the recommendation in
the ACRP Report 113, Exhibit 5-13, for the design aircraft Bell 206. (More information on
design aircraft in subsequent section)
Transient helicopters are typically parked outdoor. The square footage requirements for
outdoor helicopter parking pads are assumed to be 80 feet by 80 feet per helicopter for the
design aircraft Bell 206.
Given the observed pressing demand for based aircraft hangar space at BNA as indicated by the fixed
based operators (FBOs), this analysis assumes that all hangars are dedicated to based aircraft, and only
common-use hangars will accommodate transient aircraft when there is space available in the
hangars.
Design Aircraft for Based Aircraft
As summarized in Table 4-102, the design aircraft for the different based aircraft categories is
determined based on the 2018 inventory list showing 87 based aircraft at BNA. The average square
footage was calculated for different aircraft categories including single engine, multiengine, jet, and
helicopter, and will be used as the key input for assessing additional hangar and apron space needs
for the growing number of based GA aircraft at BNA.
4 ACRP Report 113, page 62.
5 ACRP Report 113, page 62.
6 ACRP Report 113, page 59, Exhibit 5-13.

BNA Airport Master Plan Update
Chapter 4 – Facility Requirements - DRAFT
Page | 164
Table 4-102. Design Aircraft for Different Based Aircraft Categories
Aircraft
Category Design Aircraft
1
Hangar Area Required
Per Aircraft (s.f.)2
Apron Area Required
Per Aircraft (s.f.)3
Single-Engine C-210 1,870 6,7004
Multi-Engine King Air C90A 2,470 9,070
Jet Dassault Falcon 50EX 4,430 15,9605
Helicopter Bell 206 2,5006
6,4006
Source: AECOM analysis. Notes:
1. The aircraft with the required square footage closest to the average square footage for each aircraft category is selected as the design aircraft for that aircraft category.
2. This area accounts for aircraft wingspan, overall length, and a clearance of 10 feet around the aircraft for maneuvering and equipment storage purposes.
3. This area accounts for aircraft wingspan, overall length, 10-feet wingtip clearance, and clearance from the taxilane OFA. 4. Although the design aircraft C-210 is an Airplane Design Group(ADG)-I aircraft, ADG-II taxilane OFA standards are used for the single-engine
type to make sure ADG-II single-engine airplanes can maneuver to the apron parking positions. 5. Although the design aircraft Falcon 50EX is an ADG-II aircraft, ADG-III taxilane OFA standards are used for the jet type to make sure ADG-III jet
airplanes can maneuver to the apron parking positions. 6. Based on ACRP Report 113, page 59, Exhibit 5-13. 7. Numbers all rounded up to the nearest tenth.
Design Aircraft for Transient Aircraft
Since transient aircraft is a category based on GA operations at an airport, the FAA TFMSC Annual
Operations data was used to determine the design aircraft for transient aircraft. Among the aircraft
with more than 500 operations at BNA in 2017, the model with the largest footprint is selected as the
design aircraft under each aircraft category. Table 4-103 summarizes the design aircraft for each
aircraft category, as well as their respective parking requirements.
Table 4-103. Design Aircraft for Transient Aircraft
Aircraft Category Design Aircraft1
Apron Area Required Per
Aircraft (s.f.)2
Single-Engine PC-12 10,280
Multi-Engine King Air 350 10,980
Jet Gulfstream IV 21,990
Helicopter Bell 206 6,4003
Source: AECOM analysis. Notes:
1. The aircraft with the required square footage closest to the average square footage is selected as the design aircraft for each engine type. 2. This area accounts for aircraft wingspan, overall length, 10-feet wingtip clearance, and clearance from the taxilane OFA. 3. Based on ACRP Report 113, page 59, Exhibit 5-13. 4. Numbers all rounded up to the nearest tenth.

BNA Airport Master Plan Update
Chapter 4 – Facility Requirements - DRAFT
Page | 165
4.6.2. Hangar Storage Space
Two types of hangars are typically provided for GA operators: T-hangars and conventional hangars.
- T-hangars typically serve smaller single-engine and twin-engine aircraft, while the conventional
hangars provide more flexibility to store a variety of different aircraft types and sizes. All T-
hangars at BNA were demolished to provide room for new conventional hangars. The airport is
not planning on developing new T-hangars.
- Conventional hangars are characterized as high-bay, clear span, rectangular structures, often
capable of accommodating two or more aircraft. Conventional hangars typically have the
majority of space dedicated to aircraft storage, with a small fraction of space dedicated to
offices and equipment storage.
Given that the airport is not planning on developing new T-hangars, the hangar storage analysis
focuses on conventional hangars. As discussed under Section 4.6.1, Design Aircraft, hangar space is
only planned for based aircraft and not transient aircraft.
The growth of based aircraft is a deciding factor for the future hangar facility needs. Chapter 3,
Aviation Demand Forecasts, projects that the number of based aircraft at BNA will increase from 87
today to 164 aircraft in the planning horizon, not including military aircraft. Table 4-104 provides a
detailed breakdown by aircraft category.
Table 4-104. Existing and Forecasted Based Aircraft by Category
Aircraft Category Existing Forecast (Baseline)
2017 2022 2027 2032 2037
Single-Engine 17 20 24 27 32
Multi-Engine 12 14 16 18 21
Jet 57 67 79 93 109
Helicopter 1 1 1 2 2
Total Based Aircraft 87 102 120 140 164 Source: BNA Master Plan Update 2018: Aviation Demand Forecasts Chapter
Several key assumptions were established for this analysis, based on general industry standards as well
as discussions with the GA operators and the Airport sponsor:
- The ratios of based aircraft7 stored in hangars differ between different aircraft types. While
most of the SEs and some MEs are parked on the apron, all corporate jets are stored indoors
to avoid exposure to weather and possible damage. Based on the current inventory, the
hangar parking ratios are as follows:
o SE: 29%
o ME: 75%
7 Calculated from the 2018 based aircraft parking inventory.

BNA Airport Master Plan Update
Chapter 4 – Facility Requirements - DRAFT
Page | 166
o Jet: 100%
o Helicopter: 100%
- An additional 20% of square footage is included for office, training, and maintenance areas.
Apron areas in front of the hangars are also provided to allow based aircraft to have room to
be fueled, tugged into the hangar, and loaded in front of the hangar without blocking other
aircraft using the adjacent taxiway/taxilane8. This analysis assumes that such apron area would
be of the same size as the hangar it serves, based on typical hangar/apron configuration at
BNA.
- The total required apron area does not include area for taxiways or taxilanes that lead to
hangars, because such required area could vary significantly with different taxiway/taxilane
configurations. During the GA alternatives analysis stage it is important to make sure sufficient
taxiway/taxilane areas are provided for aircraft to access the hangars.
Table 4-105 summarizes the space requirements for hangars to accommodate the projected based
aircraft growth through the planning horizon. It is estimated that additional hangars would be
required before 2032.
Table 4-105. Hangar Space Requirements
Item Existing Forecast
2017 2022 2027 2032 2037
Based Aircraft Parked Indoor
Single-Engine 5 6 7 8 10
Multi-Engine 9 11 12 14 16
Jet 57 67 79 93 109
Helicopter 1 1 1 2 2
Total Aircraft 72 85 99 117 137
Required Hangar Square Footage
Required Hangar Storage
(s.f.)
529,260
337,700 395,200 466,530 546,090
Additional Area (s.f.) 67,540 79,040 93,306 109,218
Total Required Hangar
Area (s.f.)1,2 405,240 474,240 559,840 655,310
Total Required Apron
Area in Front of
Hangars (s.f.)1,2
529,260 405,240 474,240 559,840 655,310
Source: AECOM analysis. Notes:
1. Red text indicate deficiencies 2. Numbers rounded up to the nearest tenth
8 ACRP Report 113, page 16.

BNA Airport Master Plan Update
Chapter 4 – Facility Requirements - DRAFT
Page | 167
4.6.3. Apron Area
Both based aircraft and transient aircraft can be parked on the GA apron. The smaller, lighter-weight
aircraft are parked in tie-downs such as those in front of Building 4207 (shown on Figure 4-36) for the
flight school, whereas the larger, heavier-weight jets mostly concentrate on the apron areas in front of
the FBO terminals (Buildings 4254 and 4266 for Atlantic Aviation and Signature Flight Support,
respectively).
4.6.3.1. Transient Aircraft Parking Requirements
Transient aprons are utilized by aircraft that are only at the airport on a short-term basis and usually
have faster turnaround times, although some can be on the ground for a few days. Transient aprons
are best located near GA terminal buildings. Both Atlantic Aviation and Signature Flight Support
provide tie-down spaces to secure the lighter-weight SE and ME aircraft.
The number of aircraft parking positions required for transient aircraft is determined through the
methods provided in Appendix C of ACRP Report 113. The ACRP method utilizes annual transient
operations to identify an adequate number of parking positions.
The ACRP formula is:
(X / 2 * T) / 365 * P = Number of Transient Parking Positions, where:
X = Number of general aviation operations
T = Percentage of transient operations
P = Percentage of transient aircraft that are parked on the apron at any one time
The following data and assumptions are used as input for the formula above:
X: Number of GA and air taxi operations from Chapter 3, Aviation Activities Forecast
T: Section 3.5.3.3, GA and Air Taxi Operations, of Chapter 3, Aviation Demand Forecasts,
specifies that approximately 80% of general aviation operations and 60% of air taxi operations
were considered to be by transient aircraft in 2017
P: 50% of transient aircraft would be parked on the apron at the same time during a day
Table 4-106 provides a summary of existing and forecasted annual GA and air taxi operations by
transient aircraft. The annual operations by aircraft categories are also derived based on the
percentage breakdowns provided previously in Table 4-101. This information translates into a
required transient aircraft parking positions when applying the ACRP formula.

BNA Airport Master Plan Update
Chapter 4 – Facility Requirements - DRAFT
Page | 168
Table 4-106. Annual Operations and Corresponding Transient Aircraft Parking Requirements
Item Existing Forecast
2017 2022 2027 2032 2037
Annual GA & Air Taxi Operations1
GA-Itineranta
36,570 37,649 42,240 46,363 51,596
GA-Localb
7 8 9 10 11
Air Taxic 7,536 7,904 9,030 10,099 11,245
Annual Operations by Aircraft Category2
General Aviation
Single-Engine 3,577 3,683 4,132 4,535 5,047
Multi-Engine 8,469 8,719 9,782 10,737 11,949
Jet 24,524 25,249 28,327 31,093 34,602
Helicopter 7 7 8 9 10
Air Taxi
Multi-Engine 15 15 18 20 22
Jet 7,522 7,888 9,013 10,079 11,223
Required Transient Aircraft Parking Positions3
Single-Engine 2 3 3 3 3
Multi-Engine 6 6 7 7 8
Jet 18 18 20 23 24
Helicopter 1 1 1 1 1
Total Required Apron Positions 27 28 31 34 36 Sources:
1. Table 3-35, BNA Master Plan Update 2018: Aviation Demand Forecasts Chapter 2. Calculated based on the projected annual GA and Air Taxi operations and Table 4-101. Percentage of Annual Operations at BNA by Aircraft 3. Calculated based on the ACRP Report 113 formula: (X / 2 * T) / 365 * P = Number of Transient Parking Positions
Notes: a. Itinerant – Represents operations that arrive from outside the traffic pattern or depart the airport traffic pattern. b. Local – Represents operations that stay within the traffic pattern airspace (non-itinerant). c. The scheduled passenger services operated on Bombardier CRJs and Embraer ERJs at the passenger terminal by the airlines are excluded from
this analysis.

BNA Airport Master Plan Update
Chapter 4 – Facility Requirements - DRAFT
Page | 169
4.6.3.2. Based Aircraft Parking Requirements
In addition to transient aircraft, based aircraft can also be parked on the apron instead of in the
hangars. With the exception of flight schools, based aircraft parking aprons often have lower activity
but a higher density as aircraft are parked for longer periods of time.
Table 4-105 in the previous section listed the number of based aircraft that are projected to utilize
hangar storage. The remaining based aircraft are assumed to be parked outdoors. Table 4-107
summarizes the number of based aircraft positions needed on the apron by aircraft category.
Table 4-107. Based Aircraft Apron Parking Requirements
Aircraft Category Existing Forecast
2017 2022 2027 2032 2037
Single-Engine 12 14 17 19 22
Multi-Engine 3 3 4 4 5
Jet 0 0 0 0 0
Helicopter 0 0 0 0 0
Total Required Apron
Positions 15 17 21 23 27
Source: AECOM Analysis.
4.6.3.3. Apron Size Requirements
Based on the apron parking area required for the design aircraft in Table 4-103, the total apron area
requirements to accommodate future transient and based aircraft are estimated in Table 4-108. The
total required apron area include the apron area to park transient and outdoor based aircraft, as well
as the apron area in front of hangars for temporary staging and maneuvering of indoor based aircraft,
as previously discussed in Section 4.6.2. Nonetheless, the total required apron area does not include
area for taxiways or taxilanes that lead to hangars, because such required area could vary significantly
with different development options.
The existing GA apron at BNA has a total area of 1,750,280 square feet, which can accommodate the
estimated GA apron parking requirements throughout the planning horizon.

BNA Airport Master Plan Update
Chapter 4 – Facility Requirements - DRAFT
Page | 170
Table 4-108. Apron Parking Area Requirements
Aircraft Category Existing Forecast
2017 2022 2027 2032 2037
Aircraft Positions Required on the Apron (Transient & Based)
Single-Engine 14 17 20 22 25
Multi-Engine 9 9 11 11 13
Jet 18 18 20 23 24
Helicopter 1 1 1 1 1
Total Required Apron Positions 42 45 52 57 63
Apron Size Required (s.f.)1
Single-Engine 144,000 124,640 144,740 158,140 178,240
Multi-Engine 98,900 85,980 103,660 103,660 121,340
Jet 395,900 395,820 439,800 505,770 527,760
Helicopter 6,400 6,400 6,400 6,400 6,400
Subtotal 645,200 612,840 694,600 773,970 833,740
Apron Required In front of Hangars 343,908 405,240 474,240 559,840 655,310
Total Required Apron Area 989,108 1,018,080 1,168,840 1,333,810 1,489,050 Source: AECOM Analysis. Note: 1. Apron sizes rounded up to the nearest tenths.
4.6.4. Fixed Base Operator (FBO) Terminal Buildings
BNA has two major FBOs – Atlantic Aviation and Signature Flight Support. Each FBO operates from its
own terminal building that consists of a waiting lounge, offices, meeting rooms, pilot briefing rooms,
restrooms, and other amenities. The Atlantic Aviation terminal building is Building 4266 (4,820 square
feet), and the Signature Flight Support terminal building is Building 4254 (6,050 square feet). Both
buildings are single story.
As of late 2018, Signature Flight Support is constructing a new FBO terminal building to upgrade
facilities and enhance capacity. The new Signature terminal will have a total of 8,000 square feet. Once
the new terminal building is open, the old terminal building will be demolished to provide space for
other development. Therefore, for the purpose of this analysis, the upcoming Signature terminal
(8,000 square feet) and the existing Atlantic terminal (4,820 square feet) account for a total of 12,820
square feet of terminal space.

BNA Airport Master Plan Update
Chapter 4 – Facility Requirements - DRAFT
Page | 171
The required size of an FBO terminal is largely based on the needs of the specific FBO and, in turn, its
clients. Based on recommendations in ACRP Report 113, the following planning factors are used for
estimating FBO terminal needs:
- Peak month operations accounts for 9% of annual operations9
- Peak hour operations accounts for 9.1% of daily operations10
- Assuming 4 persons (crew and passengers) will use the terminal building for each peak hour
operation11
- Assuming 150 square feet is needed for each person12
Table 4-109 summarizes the FBO terminal requirements based on the planning factors above. It is
estimated that the FBO terminals would require expansion before 2027.
Table 4-109. FBO Terminal Building Requirements
Aircraft Category Existing Forecast
2017 2022 2027 2032 2037
Total Annual GA & Air Taxi Operations 67,117 69,686 78,844 87,299 97,176
Peak Hour Operations 18 19 22 24 27
Persons per Peak Hour Operation 4 4 4 4 4
Space Per Person (s.f.) 150 150 150 150 150
Required FBO Terminal Area (s.f.)1 2
12,820 12,800 14,400 16,000 17,800 Source: AECOM analysis. Notes:
1. Terminal area rounded up to the nearest hundreds. 2. Red text denotes deficiency.
4.6.5. Vehicle Parking Area
Adequate vehicle parking areas are required to provide safe and efficient access to the GA facilities.
Currently a total of 369,500 square feet of land is dedicated to GA vehicle parking. Figure 4-36 shows
the existing parking lots for GA facilities in both the Hangar Lane Area and on the West Side.
The two elements used to determine vehicle parking area requirements include the number of parking
spaces required and the dimensions used for each parking space and driving lane. Per Exhibit 5-48 of
ACRP Report 113, the number of required parking spaces differs for each type of GA facility including
terminals, hangars, and parking positions. This analysis assumes the following planning factors from
9 Figure 3-39, BNA Master Plan Update 2018 Aviation Demand Forecasts Chapter
10 Table 3-45, BNA Master Plan Update 2018 Aviation Demand Forecasts Chapter
11 ACRP Report 113, page 95, recommends 2.5 persons per operation but this analysis increases that to 4 to
provide a more accurate estimate considering the clientele at BNA use larger business jets requiring two pilots
and sometimes even having a flight attendant. 12
ACRP Report 113, page 95.

BNA Airport Master Plan Update
Chapter 4 – Facility Requirements - DRAFT
Page | 172
ACRP Report 113 as well as industry and local observations to derive the parking spaces required for
different types of GA functions:
Hangars
o 1 space per 1,000 Square Footage (SF) of hangar floor area
o 1 space per 200 SF of office/operations area
o 1 space per 750 SF of maintenance area
FBO Terminals
o 4 spaces per peak hour operation
o 1 space per 200 SF of office space
o 10 spots per FBO terminal for rental
car staging
Based Aircraft Apron Area
o 1 space for every two based aircraft
parking spaces
45 parking spaces for charter
operations in total
As depicted in Figure 4-37, the standard
parking space size (10-feet by 20-feet) and
driving lane width (25-feet) used in ACRP
Report 113 are used to determine the size of
each parking area. Each 140-feet of parking
lot length can accommodate 4 parking spaces.
Therefore, an average parking space factor of
350 square feet per car (1,400 square feet
divided by 4) is used for the purposes of this
analysis.
Table 4-110 provides a breakdown of the
vehicle parking requirements. Overall, the existing vehicle parking area could accommodate the
growth in demand through 2032. However, for 2037, the vehicle parking areas should be expanded.
Figure 4-37. Standard Vehicle Parking
Spaces

BNA Airport Master Plan Update
Chapter 4 – Facility Requirements - DRAFT
Page | 173
Table 4-110. Vehicle Parking Requirements
Item Required
2017 2022 2027 2032 2037
Hangar Area
Total Required Hangar Area 343,908 405,240 474,240 559,840 655,310
Hangar Floor Area 275,126 324,192 379,392 447,872 524,248
1 space/1,000 SF of Hangar Floor Area 276 325 380 448 525
Office Area 34,391 40,524 47,424 55,984 65,531
1 space/200 SF of Office Area 172 203 238 280 328
Maintenance Area 34,391 40,524 47,424 55,984 65,531
1 space/750 SF of Maintenance Area 46 55 64 75 88
Total Vehicle Parking Spaces 494 583 682 803 941
FBO Terminal Buildings
Required Terminal Size 12,300 12,800 14,400 16,000 17,800
Peak Hour Operations 20 21 24 27 30
2.5 spaces/peak-hour operation 82 85 96 107 119
Office Area 8,610 8,960 10,080 11,200 12,460
1 space/200 sf of office space 44 45 51 56 63
10 spots per FBO terminal for rental car staging 20 20 20 20 20
Total Vehicle Parking Spaces 146 150 167 183 202
Based Aircraft Apron
Total Required Apron Parking Spaces 15 17 21 23 27
1 space for 50% of Apron Positions 8 9 11 12 14
Charter Operations
Charter Parking Spaces 45 45 45 45 45
Total Parking Needs
Total Vehicle Parking Spaces 693 787 905 1,043 1,202
Total Vehicle Parking Area (s.f.) 242,550 275,450 316,750 365,050 420,700
Source: AECOM analysis. Notes:
1. Red text denotes deficiency.
4.6.6. General Aviation (GA) Facility Requirements Summary
Below is a summary of GA facility requirements:
There is a need for more hangar space before 2032.
The apron areas are sufficient to accommodate both base and transient aircraft throughout the
planning horizon. However, additional hangars require additional apron areas to be provided in
front of them.
FBO terminal buildings require expansion before 2027 even with the new Signature Flight Support
terminal.
Vehicle parking areas require expansion before 2037.

BNA Airport Master Plan Update
Chapter 4 – Facility Requirements - DRAFT
Page | 174
4.7. Airport & Airline Support Requirements
4.7.1. Aircraft Deicing
4.7.1.1. Aircraft Deicing Areas
Aircraft deicing activities at BNA are performed both at-gate and also in dedicated deicing areas, as
shown on Figure 4-38. Table 4-111 shows the number of deicing positions in each deicing area.
Section 2.6.9 in Chapter 2, Inventory, provides detailed deicing positions layout for each of the deicing
pads.
Figure 4-38. Aircraft Deicing Areas
Table 4-111. Existing Aircraft Deicing Positions
Deicing Positions
North Deicing Pad 3 for ADG-III; 1 for up to E-195
South Deicing Pad 5 for ADG-III; 1 for ADG-II
Terminal Deicing (All Gates) All Gates Source: Section 2.6.9, Chapter 2, Inventory.
The deicing positions needed at the dedicated deicing area are estimated based on the number of
peak hour departures from the future design day flight schedule (DDFS), as well as the time required
to deice each aircraft. Table 4-112 summarizes the number of peak hour departure flights based on

BNA Airport Master Plan Update
Chapter 4 – Facility Requirements - DRAFT
Page | 175
the DDFS. The aircraft operated during the departure peaks are predominantly ADG-III narrowbody
aircraft, or ADG-II regional jets.
Table 4-112. Peak Hour Departures
Number of Peak Hour Departure Flights
(7:36-8:35am)
Aircraft Baseline 2022 2027 2032 2037
Narrowbody
319 1 2 2 2 2
320 0 3 3 4 4
717 0 1 1 1 1
738 0 1 1 1 2
739 0 1 1 1 1
73H 1 2 2 2 3
73W 12 12 13 13 13
7M8 1 1 1 1 1
M88 1 1 0 0 0
Subtotal 16 24 24 25 27
Regional Jet
CNC 1 1 1 1 1
CR7 2 2 2 2 2
CR9 1 2 2 2 2
E75 0 0 0 1 1
E7W 2 3 3 3 3
E90 0 0 1 1 1
ERD 1 1 0 0 0
ERJ 0 0 1 1 1
Subtotal 7 9 10 11 11
Total PH Departures 23 33 34 36 38 Sources: BNA Design Day Flight Schedule, TransSolutions, September 2018. AECOM analysis.
A planning factor of deicing time per aircraft is used to estimate how many deicing positions are
required to process the peak hour departures. It is assumed that 20 minutes are required to deice a
narrowbody, and 15 minutes are required to deice a regional jet. Table 4-113 summarizes the number
of deicing positions required based on the hourly deicing throughput for narrowbody and regional
jets. The existing number of deicing positions will be inadequate before 2022. Therefore, the deicing
pads need to be expanded or reconfigured to accommodate the forecast deicing activities during the
peak hour.
It is not uncommon for airports to use the same apron area for both RON and deicing functions. Given
that departures at BNA start as early as 5:00am and the departure peak is not until 7:30am, the RON
and deicing functions would not be conflicting needs as long as the RON aircraft are moved in a
timely fashion to the terminal gates for departure.

BNA Airport Master Plan Update
Chapter 4 – Facility Requirements - DRAFT
Page | 176
Table 4-113. Deicing Position Requirements
Deicing
Time
Hourly Deicing
Throughput
Number of Positions Required
Baseline 2022 2027 2032 2037
Narrowbody 20 min 3 departures 2 3 3 3 3
Regional Jet 15 min 4 departures 6 8 8 9 9
Total 8 11 11 12 12 Source: AECOM analysis.
In addition to commercial air carrier operations, air cargo and GA aircraft could also require deicing
during peak periods. Currently, both cargo and GA aircraft travel long distances across the airfield to
be deiced at the terminal deicing aprons; however, the operators have been requesting to have
deicing areas dedicated close to their facilities in Hangar Lane Area and also the West Side to improve
operational efficiency.
4.7.2. MNAA Maintenance Facilities
Currently the MNAA maintenance facilities are located in two areas – the Consolidated Service Facility
(CSF, Building 4351) in the Hangar Lane Area, and scattered buildings on the West Side. The functions
in the scattered buildings on the West Side include the Airfield Electricians unit (AFEL), Grounds,
Mobile Equipment and Welding, Procurement, and Material Controls. The MNAA is planning on
relocating most functions on the West Side to the CSF Building so that maintenance functions are
consolidated, except for a Mobile Equipment Facility to house portions of the Maintenance team for
quick response.
4.7.3. Aircraft Maintenance Facilities
Aircraft maintenance facilities at BNA are operated by different tenants, including the FBOs and
Embraer. The FBOs provide maintenance to the GA aircraft at the GA facilities, whereas Embraer is
based in Buildings 4140 and 4141 on the West Side. Embraer has been requesting additional space for
expanding their facilities at BNA.
4.7.4. Ground Support Equipment (GSE) Facilities
The GSEs at BNA are stored and maintained both outdoors on the terminal apron, in covered areas
surrounding the terminal gates, and indoors at the Air Freight Building (Building 4321). In previous
years, Building 4323 adjacent to Building 4321 was also dedicated to GSE storage and maintenance
workshops for airline operations. However, the MNAA plans to use Building 4321 as a consolidated
concession screening facility, and the belly cargo operations require more space in Building 4321.
Therefore, a dedicated GSE building should be provided in the vicinity of the passenger terminal
complex to support all the day-to-day GSE needs, including vehicle storage, offices, maintenance
shops, supply storage, electric vehicle charging, etc.
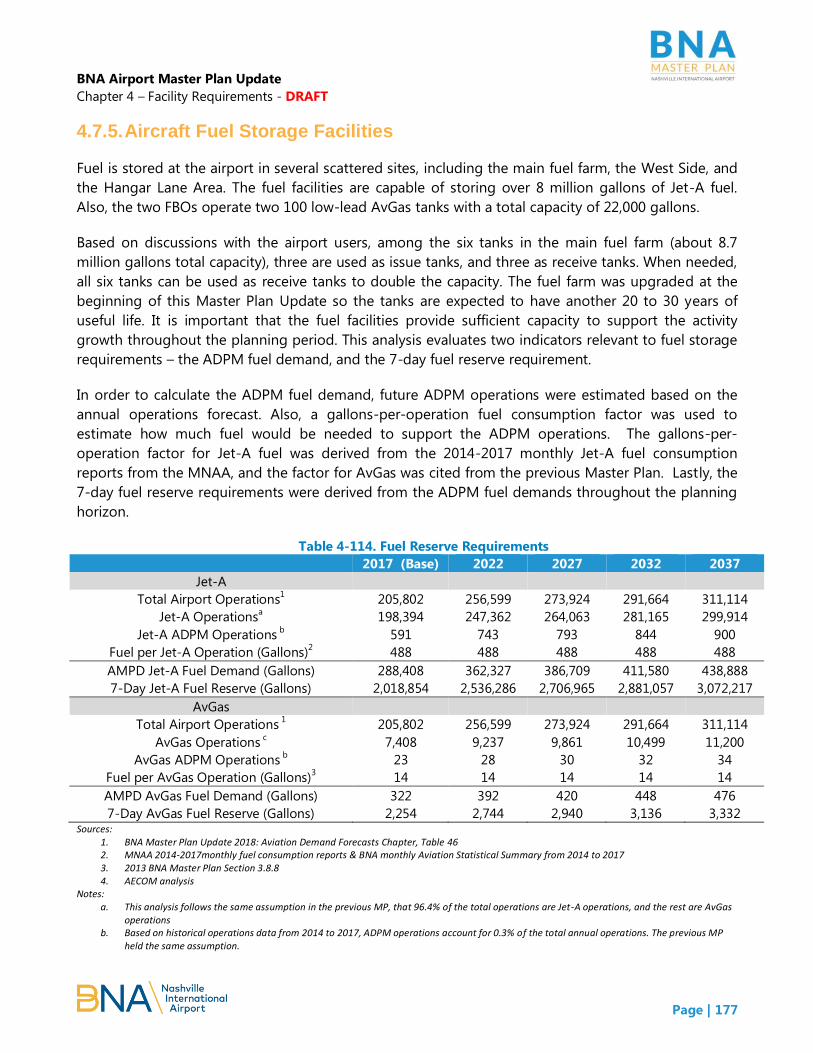
BNA Airport Master Plan Update
Chapter 4 – Facility Requirements - DRAFT
Page | 177
4.7.5. Aircraft Fuel Storage Facilities
Fuel is stored at the airport in several scattered sites, including the main fuel farm, the West Side, and
the Hangar Lane Area. The fuel facilities are capable of storing over 8 million gallons of Jet-A fuel.
Also, the two FBOs operate two 100 low-lead AvGas tanks with a total capacity of 22,000 gallons.
Based on discussions with the airport users, among the six tanks in the main fuel farm (about 8.7
million gallons total capacity), three are used as issue tanks, and three as receive tanks. When needed,
all six tanks can be used as receive tanks to double the capacity. The fuel farm was upgraded at the
beginning of this Master Plan Update so the tanks are expected to have another 20 to 30 years of
useful life. It is important that the fuel facilities provide sufficient capacity to support the activity
growth throughout the planning period. This analysis evaluates two indicators relevant to fuel storage
requirements – the ADPM fuel demand, and the 7-day fuel reserve requirement.
In order to calculate the ADPM fuel demand, future ADPM operations were estimated based on the
annual operations forecast. Also, a gallons-per-operation fuel consumption factor was used to
estimate how much fuel would be needed to support the ADPM operations. The gallons-per-
operation factor for Jet-A fuel was derived from the 2014-2017 monthly Jet-A fuel consumption
reports from the MNAA, and the factor for AvGas was cited from the previous Master Plan. Lastly, the
7-day fuel reserve requirements were derived from the ADPM fuel demands throughout the planning
horizon.
Table 4-114. Fuel Reserve Requirements
2017 (Base) 2022 2027 2032 2037
Jet-A
Total Airport Operations1
205,802 256,599 273,924 291,664 311,114
Jet-A Operationsa
198,394 247,362 264,063 281,165 299,914
Jet-A ADPM Operations b 591 743 793 844 900
Fuel per Jet-A Operation (Gallons)2
488 488 488 488 488
AMPD Jet-A Fuel Demand (Gallons) 288,408 362,327 386,709 411,580 438,888
7-Day Jet-A Fuel Reserve (Gallons) 2,018,854 2,536,286 2,706,965 2,881,057 3,072,217
AvGas
Total Airport Operations 1 205,802 256,599 273,924 291,664 311,114
AvGas Operations c 7,408 9,237 9,861 10,499 11,200
AvGas ADPM Operations b
23 28 30 32 34
Fuel per AvGas Operation (Gallons)3
14 14 14 14 14
AMPD AvGas Fuel Demand (Gallons) 322 392 420 448 476
7-Day AvGas Fuel Reserve (Gallons) 2,254 2,744 2,940 3,136 3,332 Sources:
1. BNA Master Plan Update 2018: Aviation Demand Forecasts Chapter, Table 46 2. MNAA 2014-2017monthly fuel consumption reports & BNA monthly Aviation Statistical Summary from 2014 to 2017 3. 2013 BNA Master Plan Section 3.8.8 4. AECOM analysis
Notes: a. This analysis follows the same assumption in the previous MP, that 96.4% of the total operations are Jet-A operations, and the rest are AvGas
operations b. Based on historical operations data from 2014 to 2017, ADPM operations account for 0.3% of the total annual operations. The previous MP
held the same assumption.

BNA Airport Master Plan Update
Chapter 4 – Facility Requirements - DRAFT
Page | 178
As shown in Table 4-114, the BNA fuel storage facilities are adequate to store a 7-day fuel reserve for
the projected activity growth. Nonetheless, routine maintenance may be required to ensure the
expected useful life of these facilities. Airport users indicated that the pipelines that transport fuel to
the ground fuel hydrant system at the terminal apron are typically full and the operators are
increasing the use of fuel trucks to catch up with the fuel transport needs. Given that the fuel farm has
limited space to accommodate and load fuel trucks, the Airport is working with Colonial Pipeline to
expand the pipeline network. If the pipelines cannot be expanded, additional area to accommodate
and load fuel trucks should be provided adjacent to the fuel farm to the extent feasible.
4.7.6. Aircraft Rescue and Firefighting Facility (ARFF)
Airport ARFF facilities provide first response services for aircraft involved in emergencies as well as a
wide variety of other incidents such as building fires and medical emergencies. Specific requirements
for airport ARFF services are established in 14 CFR Part
139; however, the FAA and NFPA also provide guidance
for ARFF facilities. Two of the primary elements used to
evaluate ARFF facilities include:
1. The applicable ARFF Index and associated equipment
(vehicles and fire extinguishing agents) requirements and
personnel
2. The ARFF Station’s location (s) on the airfield
4.7.6.1. ARFF Index
For Part 139 airports like BNA, it is important to review if
its Aircraft Rescue and Firefighting (ARFF) index will
change during the planning period, based on the aircraft
operations forecast.
An airport’s ARFF Index is based on the length of the
largest aircraft conducting an average of 5 or more daily
departures. Figure 4-39 depicts the aircraft
characteristics and examples for the five ARFF Indexes
from A to E, as prescribed in Section 315 of Part 139.
Given the varying aircraft sizes, different index levels
have different requirements for the number and capacity
of firefighting agents carried on the response vehicles,
as specified in Section 317 of Part 139. BNA is currently
at Index C.
Figure 4-39. ARFF Indices

BNA Airport Master Plan Update
Chapter 4 – Facility Requirements - DRAFT
Page | 179
Table 4-115 shows the annual departures by aircraft type at BNA with the larger aircraft that fall
under Indices C, D, and E. In 2018, none of the aircraft that fall under Indices D and E meet the
requirement of five or more average daily departures. Therefore, the existing ARFF Index at BNA
remains at Index C.
Table 4-115. 2018 Annual Departures and Average Daily Departures at BNA by Aircraft Type
Aircraft Type1 Aircraft
Length2
2018 Annual
Departures1
Average
Daily
Departures
Index E
A346 - Airbus A340-600 247.24 2 0.005
B744 - Boeing 747-400 231.85 3 0.008
B742 - Boeing 747-200 231.83 2 0.005
B77L - Boeing 777-200LRF/LR 209.08 2 0.005
A333 - Airbus A330-300 208.99 1 0.003
B764 - Boeing 767-400 201.33 9 0.025
MD11 - Boeing (Douglas) MD 11 200.75 3 0.008
Index D
A332 - Airbus A330-200 193.57 1 0.003
B788 - Boeing 787-800 186.08 163 0.447
DC10 - Boeing (Douglas) DC 10-10/30/40 182.25 6 0.016
B763 - Boeing 767-300 180.25 154 0.422
B753 - Boeing 757-300 178.58 21 0.058
A306 - Airbus A300 B4-600 177.43 89 0.244
B762 - Boeing 767-200 159.17 83 0.227
Index C
B752 - Boeing 757-200 155.25 1,604 4.395
A310 - Airbus A310 All Series 153.16 27 0.074
MD90 - Boeing (Douglas) MD 90 152.58 350 0.959
MD81 - Boeing (Douglas) MD 81 147.83 1 0.003
MD82 - Boeing (Douglas) MD 82 147.83 154 0.422
MD83 - Boeing (Douglas) MD 83 147.83 625 1.712
MD88 - Boeing (Douglas) MD 88 147.83 3,095 8.479
A321 - Airbus A321 All Series 146.03 237 0.649
B739 - Boeing 737-900 138.17 623 1.707
B738 - Boeing 737-800 129.50 12,295 33.685
E190 - Embraer 190 126.83 631 1.729 Sources:
1. FAA Traffic Flow Management System Counts (TFMSC), Aviation System Performance Metrics (ASPM), BNA 2018 data 2. FAA Aircraft Characteristics Database, October 2018
Table 4-116 shows the number of operations by aircraft on the future design day flight schedule
(DDFS). Aircraft that fall under Index D include A330-200, and B787-8. The projected total daily
operations of these two aircraft triple from 2 in 2017 to 6 in 2037, which equates to 3 daily departures
on the 2037 design day. Since the average daily departure of the Index D aircraft are no more than 5,
the ARFF Index at BNA should remain Index C for the planning period based on the future DDFS.
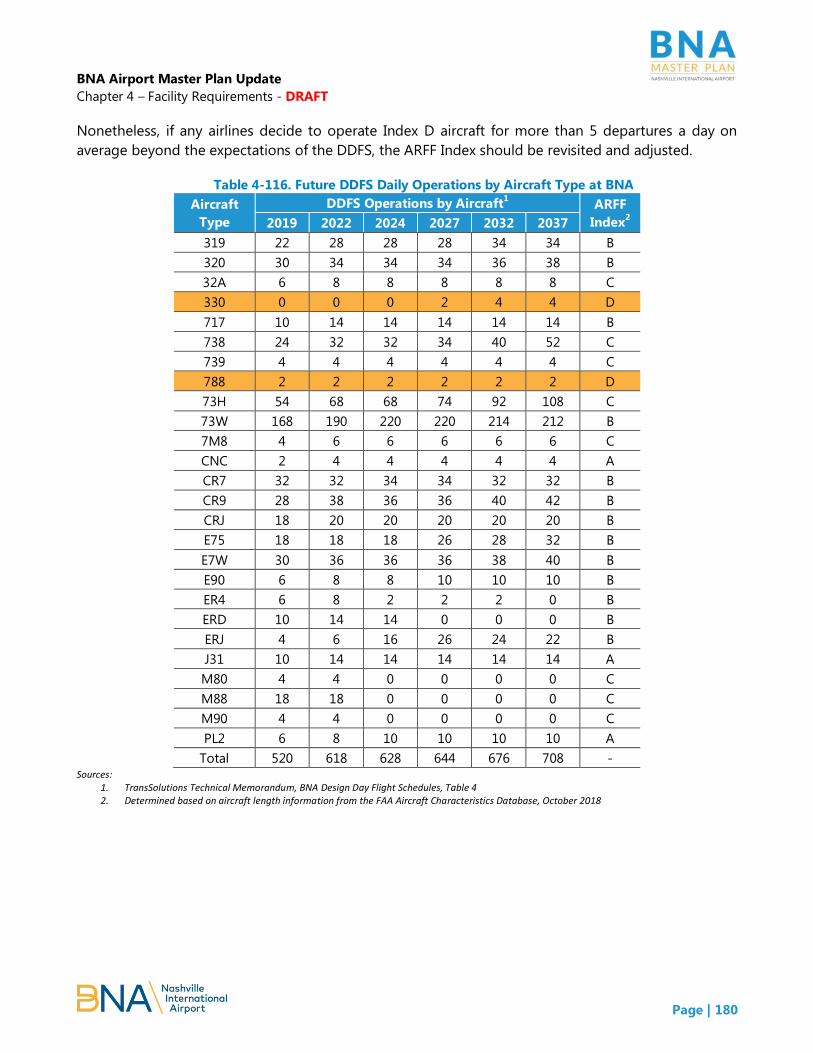
BNA Airport Master Plan Update
Chapter 4 – Facility Requirements - DRAFT
Page | 180
Nonetheless, if any airlines decide to operate Index D aircraft for more than 5 departures a day on
average beyond the expectations of the DDFS, the ARFF Index should be revisited and adjusted.
Table 4-116. Future DDFS Daily Operations by Aircraft Type at BNA
Aircraft
Type
DDFS Operations by Aircraft1
ARFF
Index2
2019 2022 2024 2027 2032 2037
319 22 28 28 28 34 34 B
320 30 34 34 34 36 38 B
32A 6 8 8 8 8 8 C
330 0 0 0 2 4 4 D
717 10 14 14 14 14 14 B
738 24 32 32 34 40 52 C
739 4 4 4 4 4 4 C
788 2 2 2 2 2 2 D
73H 54 68 68 74 92 108 C
73W 168 190 220 220 214 212 B
7M8 4 6 6 6 6 6 C
CNC 2 4 4 4 4 4 A
CR7 32 32 34 34 32 32 B
CR9 28 38 36 36 40 42 B
CRJ 18 20 20 20 20 20 B
E75 18 18 18 26 28 32 B
E7W 30 36 36 36 38 40 B
E90 6 8 8 10 10 10 B
ER4 6 8 2 2 2 0 B
ERD 10 14 14 0 0 0 B
ERJ 4 6 16 26 24 22 B
J31 10 14 14 14 14 14 A
M80 4 4 0 0 0 0 C
M88 18 18 0 0 0 0 C
M90 4 4 0 0 0 0 C
PL2 6 8 10 10 10 10 A
Total 520 618 628 644 676 708 - Sources:
1. TransSolutions Technical Memorandum, BNA Design Day Flight Schedules, Table 4 2. Determined based on aircraft length information from the FAA Aircraft Characteristics Database, October 2018

BNA Airport Master Plan Update
Chapter 4 – Facility Requirements - DRAFT
Page | 181
4.7.6.2. ARFF Station
Section 139 in CFR Part 139 requires that the ARFF station must be located so that the first response
vehicle can reach the midpoint of the farthest runway within 3 minutes. The existing ARFF station
driving response time to each of the existing runways are analyzed based on the following
assumptions.
The primary ARFF vehicle characteristics specified in the National Fire Protection Association (NFPA)
414, Standard for Aircraft Rescue and Fire-Fighting Vehicles (2017 Edition), Chapter 4 are used to
define the vehicle driving parameters13:
Maximum speed of the vehicle is not greater than 70 miles per hour (mph) or 103 feet per
second (fps)
Maximum acceleration time is from 0 to 80.5 kph (or 73.3 fps) for 30 seconds, which translated
to a 2.5 feet per square second (f/s²) acceleration rate (a constant acceleration rate was
assumed for this analysis)
Decelerate from 33 kph (or 30.2 fps) to a stop is within less than 36 feet for a deceleration rate
of -12.53 ft/s²
Speed of 40 kph (or 36.4 fps) on a 100 feet radius turn
Speed of 48 kph (or 43.7 fps) on a 150 feet radius “J” turn
Additionally, the analysis included a period of 30 seconds to account for the typical alarm response
time (the time from when the alarm sounds until the trucks are moving). Other factors affecting
vehicle performance include roadway surface conditions, weather, driver technique, vehicle
impediments, etc. However, these factors were not included in this analysis due to the difficulty in
quantifying them and the relatively minimal impact on overall response time. In order to determine
the shortest duration from the facility to the required points on the airfield, a route which combined
the shortest path available and the ability to reach top speed for the greatest distance was used.
Based on these assumptions, the response time from the existing ARFF station to the midpoint of each
runway was calculated and summarized in Table 4-117. The response time to Runway 2C-20C is the
longest and close to the three-minute requirement.
While the existing location of the ARFF station allows for a response time within the maximum
allowed, proposed runway extension or a new runway may increase it. Also, the Department of Public
Safety expressed the need to have more space in the ARFF building and expressed concerns about the
ARFF station being located adjacent to the main fuel farm. Such proximity eliminates the possibility of
co-locating an ARFF training facility with the ARFF station. Therefore, a new or supplemental ARFF
13 All the numbers are translated from the original metric units to imperial units.

BNA Airport Master Plan Update
Chapter 4 – Facility Requirements - DRAFT
Page | 182
location will be explored as a part of the alternatives analysis to ensure response time to new runways
as well as providing enhanced space, safety, and flexibility to the facility.
Table 4-117. Response Time from Existing ARFF Station to the Midpoint of Each Runway
Runway Response Time
(seconds)
Response Time
(minutes)
2L-20R 134.4 2.2
2C-20C 170.2 2.8
2R-20L 70.2 1.2
13-31 128.6 2.1
Source: AECOM analysis.
4.7.7. Airport & Airline Support Requirements Summary
Aircraft Deicing
o The existing number of deicing positions will be inadequate before 2022. Therefore, the
deicing pads need to be expanded or reconfigured to accommodate the forecast deicing
activities during the peak hour.
o Provide dedicated deicing areas close to the cargo and GA facilities in Hangar Lane Area and
also on the West Side to improve operational efficiency.
MNAA Maintenance Facilities
o The MNAA is planning on relocating the functions on the West Side to the CSF Building so that
all maintenance functions are consolidated.
Aircraft Maintenance Facilities
o The amount of space needed will be dependent upon specific operational need of the
operator.
Ground Support Equipment Facilities
o A dedicated GSE building should be provided in the vicinity of the passenger terminal complex
to support all the day-to-day GSE needs, including vehicle storage, offices, maintenance shops,
supply storage, electric vehicle charging, etc.
Aircraft Fuel Storage Facilities
o The BNA fuel storage facilities are adequate to store a 7-day fuel reserve for the projected
activity growth.
o The Airport is working with Colonial Pipeline to expand the pipeline network. If the pipelines
cannot be expanded, additional area to accommodate and load fuel trucks should be provided
adjacent to the fuel farm to the extent feasible.
Aircraft Rescue and Firefighting Facility
o The ARFF Index at BNA should remain Index C for the planning period based on the future
DDFS.

BNA Airport Master Plan Update
Chapter 4 – Facility Requirements - DRAFT
Page | 183
o If any airlines decide to operate Index D aircraft for more than 5 departures a day on average
beyond the expectations of the DDFS, the ARFF Index should be revisited and adjusted, if
necessary.
o While the existing location of the ARFF station allows for a response time within the maximum
allowed, proposed runway extension or a new runway may increase it. Also, the Department of
Public Safety expressed the need to have more space in the ARFF building and expressed
concerns about the ARFF station being located adjacent to the main fuel farm.
4.8. Sustainable Facilities
Sustainability is a core objective of planning at BNA. In 2012, the Nashville International Airport
Sustainability Study was developed in accordance with guidance issued by FAA for airports that
choose to incorporate sustainability in their master plans.14 In alignment with this guidance, BNA
identified a sustainability mission15 and specified categories that were designated as the main focus of
its sustainability planning. In 2017 the study was updated but the MNAA’s mission statement and
goals/objectives from the 2012 study did not change. The main sustainability areas of focus are:
Passenger Terminal Energy Efficiency
Materials Management
Natural Resources Conservation
Socioeconomic and Community Support
Air Quality and Greenhouse Gas (GHG) Emissions
Surface Transportation
Aircraft Noise
14 https://www.flynashville.com/.../Nashville_IntlAirport_SustainabilityStudy_2012HR.pdf
15 BNA’s sustainability mission, developed by the Sustainability Committee, is defined as: “To sustain the heartbeat of the
Mid-South by cherishing its resources to ensure Music City keeps flying high.” This messaging is featured on BNA’s and
throughout its outreach and public-relations materials.

BNA Airport Master Plan Update
Chapter 4 – Facility Requirements - DRAFT
Page | 184
4.8.1. Overview
As part of its commitment to sustainability criteria, the MNAA integrates sustainability planning into
master planning and project implementation activities undertaken at BNA. In keeping with this
process, and to ensure that additional support facilities are identified which enable the advancement
of BNA sustainability and encourage integration into future planned facilities, a review of existing BNA
sustainability plans and ongoing regional sustainable development planning efforts was completed
and compared with the MNAA’s current growth and expansion plan, BNA Vision.
4.8.2. Methodology
The goal of the assessment was to evaluate existing BNA plans for initiatives and facility requirements
and determine the need for additional support or ancillary facilities that could advance BNA
sustainability initiatives or integrate them into future planned facilities. A broader definition of
‘facilities’ was utilized to ensure that all potential opportunities were considered. Multiple documents
were reviewed 16 with an emphasis on resource needs of particular interest to BNA (such as
stormwater, waste, and transportation); however, additional elements were also considered and noted
when appropriate.
Where applicable, identified sustainability-related facilities needs were integrated directly into
applicable sections of this chapter. However, the following section provides an overview of the
facilities that were identified as discrete opportunities necessary to meet the sustainability needs as
identified above.
4.8.3. Sustainability Facilities Opportunities
Stormwater
Stormwater management is an area of increasing concern for residents of Nashville. As of 2016, the
frequency and intensity of Tennessee’s flood events (now occurring every 10.2 days) has elevated
flooding to the state’s second leading natural hazard.17 To address the growing need for proactive
stormwater management and help reduce the probability of high impact water-related events, BNA
can align new development and redevelopment to allow for appropriate stormwater control in
accordance with the Metro Water Service Low Impact Development (LID) Manual. 18 For new
16 Reviewed documents included: Sustainability Study (October 2012), Sustainability Update (2017), Energy Strategy Plan,
BNA Vision, Recycling, Reuse, and Waste Reduction Plan, Livable Nashville, Nashville Next, Metro’s National Pollutant
Discharge Elimination System (NPDES) Phase 1 Municipal Separate Stormwater Sewer System (MS4) permit, Metro Water
Services Low Impact Development Manual, and Nashville’s Solid Waste Master Plan (not yet published).
17 https://www.pewtrusts.org/en/research-and-analysis/fact-sheets/2016/12/tennessee-flood-risk-and-mitigation
18https://www.nashville.gov/Portals/0/SiteContent/WaterServices/Stormwater/docs/SWMM/2016/Vol5LID/2016_FullVol5LID
Manual.pdf

BNA Airport Master Plan Update
Chapter 4 – Facility Requirements - DRAFT
Page | 185
infrastructure, the stormwater runoff reduction goal is 80% and for redevelopment the goal is 60% to
reach post-construction water quality compliance.
For BNA, this means planning for necessary infrastructure for stormwater collection, retention, and/or
treatment when new development and redevelopment at the airport occurs, to allow for appropriate
stormwater control in accordance with the Metro Water Service Low Impact Development Manual.
The LID Manual details Green Infrastructure Practices (GIP) for improving stormwater management
beyond conventional means and provides specific guidance related to optimizing stormwater runoff.
The following benefits of GIP’s are articulated in the LID Manual for new and redevelopment projects
and are ways BNA could contribute to enhanced stormwater management in the community:
Volume control and pollutant removal
Groundwater and stream base flow recharging
Restoration and protection of stream channels
Reduction of Combined Sewer Overflows
Ancillary environmental benefits such as improved aesthetics and public awareness
Image courtesy of MNAA
Figure 4-40. Depiction of the drainage basin area encompassing BNA.

BNA Airport Master Plan Update
Chapter 4 – Facility Requirements - DRAFT
Page | 186
Waste and Recycling
As domestic waste and recycling conditions shift in response to international markets, it is important
that BNA’s facilities and infrastructure keep pace. Given BNA’s current size, future waste program
needs identified in recent analyses, and potential program changes, determining an overall size
footprint for waste/recycling facilities and infrastructure is essential. Considering current passenger
volume and expected growth at BNA, an appropriate space allocation to support the current waste
program and help ensure additional capacity to match growth would be approximately 2,200 square
feet.19 For example, this would adequately support a 30 yd. roll-off waste container, up to 5 individual
large compactors, 16 yards of total food waste/organics collection, and an area for staging source-
separated and additional specialized recycling and materials aggregation, including refrigerated
storage for a food donation program. BNA’s size also makes it an excellent candidate for a single
pass-through location, a Central Waste Area (CWA)20, where many of the largest-generating and
geographically-connected waste collection points could be consolidated; however, regardless of
whether a CWA is pursued, the specific space requirements (referenced above) should be addressed.
Alternative Transportation
Accommodating alternative fueling options for landside fleet and/or airside vehicles may require
additional facilities support and infrastructure in the future. As of 2017, the MNAA Planning and
Sustainability Committee recommended switching to a CNG (Compressed Natural Gas) Fleet at BNA.
While specific facility needs related to an alternative fuel fleet will be highly dependent on fleet size
and specific vehicle type, infrastructure related to fueling will need to be considered. Alternative
fueling could be provided from an on-site or off-site fueling facility. Currently there is no on-site
fueling for CNG buses or alternative vehicles. A full evaluation related to CNG or Renewable Natural
Gas (RNG) facility and the amount of fuel storage will be essential to determine if an on-site station is
appropriate for BNA, and, if so, inform the design, size, and footprint of the fueling station. 21
19 Proxy space estimation is based on program footprint at Portland International Airport (PDX). This meets or exceed BNA’s
current requirements given the size differential between the two airports.
20 Benefits of a CWA may include reduced hauler service levels (thereby lowering both costs and emissions associated with
vehicle miles), a single access point for monitoring waste/recycling compliance, more targeted outreach opportunities, and
fewer staff hours allocated for program management. If a single CWA is not feasible, a disaggregated “hub-and-spoke”
approach that is similar in design can still offer these benefits and be used to maintain control over material flow (though
some oversight and outreach efficiency may be lost.
21 Specific guidance related to utilizing alternative fuels can be found in Airport Cooperation Research Program (ACRP)
Synthesis 85: Alternative Fuels in Airport Fleets: http://www.trb.org/Publications/Blurbs/176442.aspx
BNA Airport Master Plan Update
Chapter 4 – Facility Requirements - DRAFT
Page | 187
Wellness
Because socioeconomic and community support are included among MNAA’s primary sustainability
focus areas, investing in healthy spaces is encouraged. Specifically, by including space for health and
wellness facilities such as spiritual/reflection areas, yoga facilities and outdoor or natural areas that
promote relaxation, MNAA will contribute to improved passenger experiences at BNA. Additionally,
supporting facilities that encourage healthy lifestyle trends will align BNA with regional planning
initiatives like Livable Nashville22 that support active transit goals to increase bicycle and pedestrian
transportation to 7% by 2020, 12% by 2030, and 30% by 2050. New development and redevelopment
associated with the BNA Vision and Master Plan should consider bike commuter-related and active
transit amenities (for BNA staff, tenants, and concessionaires) where appropriate, including: bike
parking, showers, and lockers. This will reduce barriers that prevent active transportation by offering
commuters and travelers maximum convenience related to active transit. Additionally, as the number
of physical and emotional support animals onboard commercial airlines continues to climb at a
significant rate,23 accommodating pets at BNA is increasingly important. Considering additional space
for pet relief areas in association with new and redevelopment of terminal space will serve the
growing number of passengers who travel with four-legged companions.
22 https://www.nashville.gov/Portals/0/SiteContent/MayorsOffice/Sustainability/docs/LN%20DRAFT.pdf
23 United airlines reported a 75 percent increase in year-to-year increase in in customers bringing emotional support animals
onboard. https://hub.united.com/united-emotional-suppport-animal-policy-2530539164.html