nass corporation (nass.bh) overweight
TRANSCRIPT

Call us on +973 17549499 or email us at [email protected]
Nass Corporation (NASS.BH)
CMP BHD 0.101 Target BHD 0.142 Potential Upside 40.3%
MSCI GCC Index 304.19 Bahrain Stock Exchange 1,594.90
Key Stock Data Sector Construction Reuters Code NASS.BH Bloomberg Code NASS BI Equity No. of Shares (Mn) 200.00 Market Cap (BHD Mn) 20.20 Market Cap (USD Mn) 53.60 Avg. 12m Vol. (Mn) 0.095 Volatility (30 day) 39.84 Volatility (180 day trend) 41.38
Stock Performance (%) 52 week high / low (BHD) 0.500 / 0.101
1M 3M 12M Absolute (%) -32.7 -55.5 -69.0 Relative (%) -32.8 -48.4 -45.7
Shareholding Pattern (%)
Private 51.00
Public 36.10
Corporate 12.90
NASS and BSE Movement
Executive Summary Nass Corporation (NASS) is the first regional family-owned conglomerate operating in the construction sector that went public in one of the largest initial public offerings to have taken place in Bahrain at that time. It is the only listed construction company on the Bahraini bourse. It offers solutions in the areas of civil, mechanical and electrical engineering, scaffolding and landscaping. Registered the highest ever top-line and bottom-line growth during FY08 Registering its highest ever top-line growth in the past five years, NASS’ total revenues accelerated a robust 56.6% YoY to reach BHD 121.52 million for FY08, mainly on the back of expanding operational segments and order book position. Segment-wise, contract income nearly doubled to BHD 71.99 million, significantly improving its contribution to total revenues to 59.2% in FY08 from 51.1% in FY07 – well above the 5-year average of 58.5% over 2004-2008. In tandem with the healthy growth in total revenues and share of profit from joint ventures, the firm also reported its highest ever bottom-line growth in the last five years, which soared 57.9% to BHD 13.03 million, despite cost of sales/contract costs rising sharply.
Outlook and valuation Focusing on successfully winning and implementing vital and diversified infrastructure projects in Bahrain as well as other countries in the GCC region, NASS continues to add new projects to its order book either on its own or through strategic alliances. As of February 25, 2008, the company’s total order book position stood at BHD 217.69 million, including its portion of work pertaining to joint venture projects amounting BHD 132.06 million. In addition, it has also added total new orders estimated at BHD 65.71 million during FY08, which provides healthy revenues and earnings visibility. In tandem with its strategic focus towards bigger projects with joint venture partners, the company’s share of profit from JV operations continues to be the major profit driver, contributing 62.3% of its bottom-line in FY08 as compared to 47.6% in FY07, well above the 5-year average of 29.3% over 2004-2008. On the flip side, the sharply rising cost of sales/contract costs is a matter of concern, which continues to pressurize its profit margins. Impacted by the ongoing economic and financial crisis, the company’s Salam Resort project in partnership with Murray & Roberts worth BHD 153.80 million was cancelled in January 2009, which may impact earnings growth. Despite reporting healthy financial results, the stock performance has severely impacted by the overall negative sentiment regarding the construction/real estate sector and concerns over cancellation/delay of construction projects going forward. However, NASS’ stock is presently trading at a P/E multiple of 1.55x and 1.49x on 2009E and 2010E earnings, and at a P/B multiple of 0.44x and 0.37x on 2009E and 2010E BVPS, respectively. Considering the above factors and based on our DCF and TTM P/E valuation methods, we revise downwards our earlier price target of BHD 0.406 (September 05, 2007), to BHD 0.142, which exhibits a potential upside of 40.3% from its closing price of BHD 0.101 (as on March 23, 2009). Therefore, we maintain our earlier OVERWEIGHT opinion on NASS Corporation.
(BHD Million) 2007A 2008E 2009E 2010E 2011E Total Revenue 77.60 121.52 138.01 154.19 173.61 EBITDA 9.26 10.53 11.62 12.22 12.69 EBITDA Margin (%) 11.9 8.7 8.4 7.9 7.3 Net Profit 8.25 13.03 14.38 14.96 15.41 Net Profit Margin (%) 10.6 10.7 10.4 9.7 8.9 Adj. EPS (BHD) 0.041 0.065 0.065 0.068 0.070 Total Assets 66.40 101.81 117.29 132.88 151.70 ROAE (%) 26.9 36.3 32.1 27.2 23.9
OVERWEIGHT
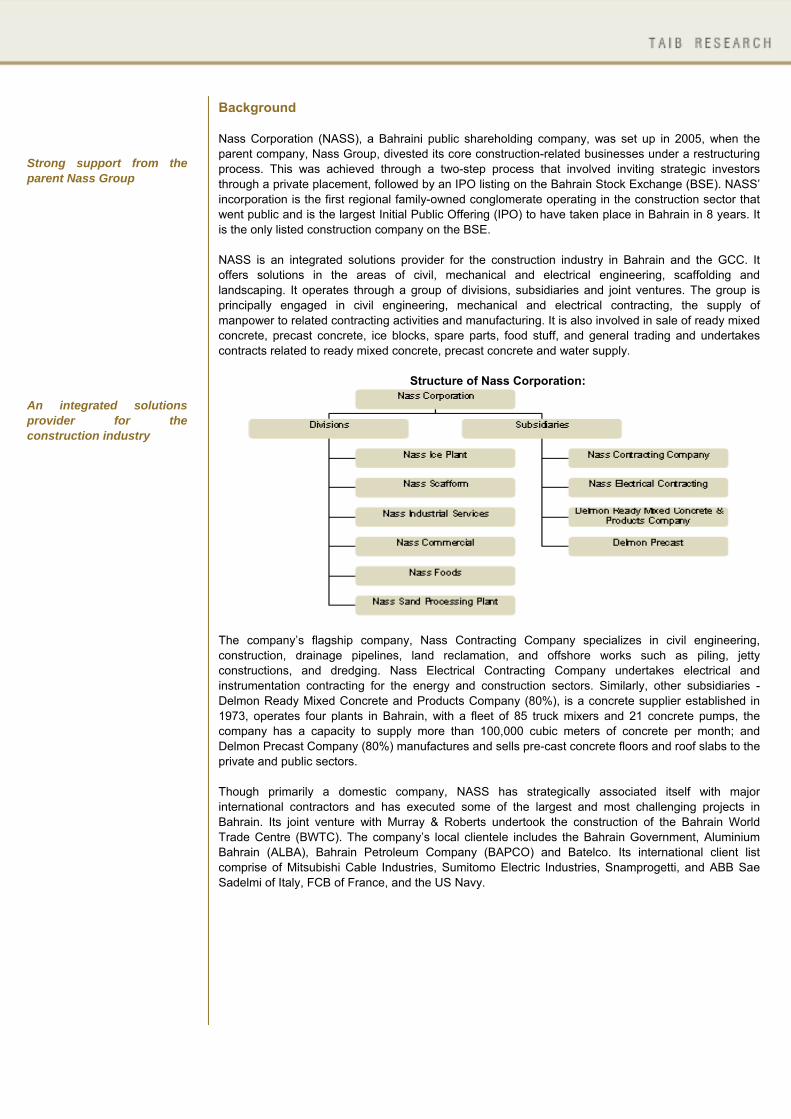
Background Nass Corporation (NASS), a Bahraini public shareholding company, was set up in 2005, when the parent company, Nass Group, divested its core construction-related businesses under a restructuring process. This was achieved through a two-step process that involved inviting strategic investors through a private placement, followed by an IPO listing on the Bahrain Stock Exchange (BSE). NASS’ incorporation is the first regional family-owned conglomerate operating in the construction sector that went public and is the largest Initial Public Offering (IPO) to have taken place in Bahrain in 8 years. It is the only listed construction company on the BSE. NASS is an integrated solutions provider for the construction industry in Bahrain and the GCC. It offers solutions in the areas of civil, mechanical and electrical engineering, scaffolding and landscaping. It operates through a group of divisions, subsidiaries and joint ventures. The group is principally engaged in civil engineering, mechanical and electrical contracting, the supply of manpower to related contracting activities and manufacturing. It is also involved in sale of ready mixed concrete, precast concrete, ice blocks, spare parts, food stuff, and general trading and undertakes contracts related to ready mixed concrete, precast concrete and water supply.
Structure of Nass Corporation:
The company’s flagship company, Nass Contracting Company specializes in civil engineering, construction, drainage pipelines, land reclamation, and offshore works such as piling, jetty constructions, and dredging. Nass Electrical Contracting Company undertakes electrical and instrumentation contracting for the energy and construction sectors. Similarly, other subsidiaries - Delmon Ready Mixed Concrete and Products Company (80%), is a concrete supplier established in 1973, operates four plants in Bahrain, with a fleet of 85 truck mixers and 21 concrete pumps, the company has a capacity to supply more than 100,000 cubic meters of concrete per month; and Delmon Precast Company (80%) manufactures and sells pre-cast concrete floors and roof slabs to the private and public sectors. Though primarily a domestic company, NASS has strategically associated itself with major international contractors and has executed some of the largest and most challenging projects in Bahrain. Its joint venture with Murray & Roberts undertook the construction of the Bahrain World Trade Centre (BWTC). The company’s local clientele includes the Bahrain Government, Aluminium Bahrain (ALBA), Bahrain Petroleum Company (BAPCO) and Batelco. Its international client list comprise of Mitsubishi Cable Industries, Sumitomo Electric Industries, Snamprogetti, and ABB Sae Sadelmi of Italy, FCB of France, and the US Navy.
Strong support from the parent Nass Group An integrated solutions provider for the construction industry
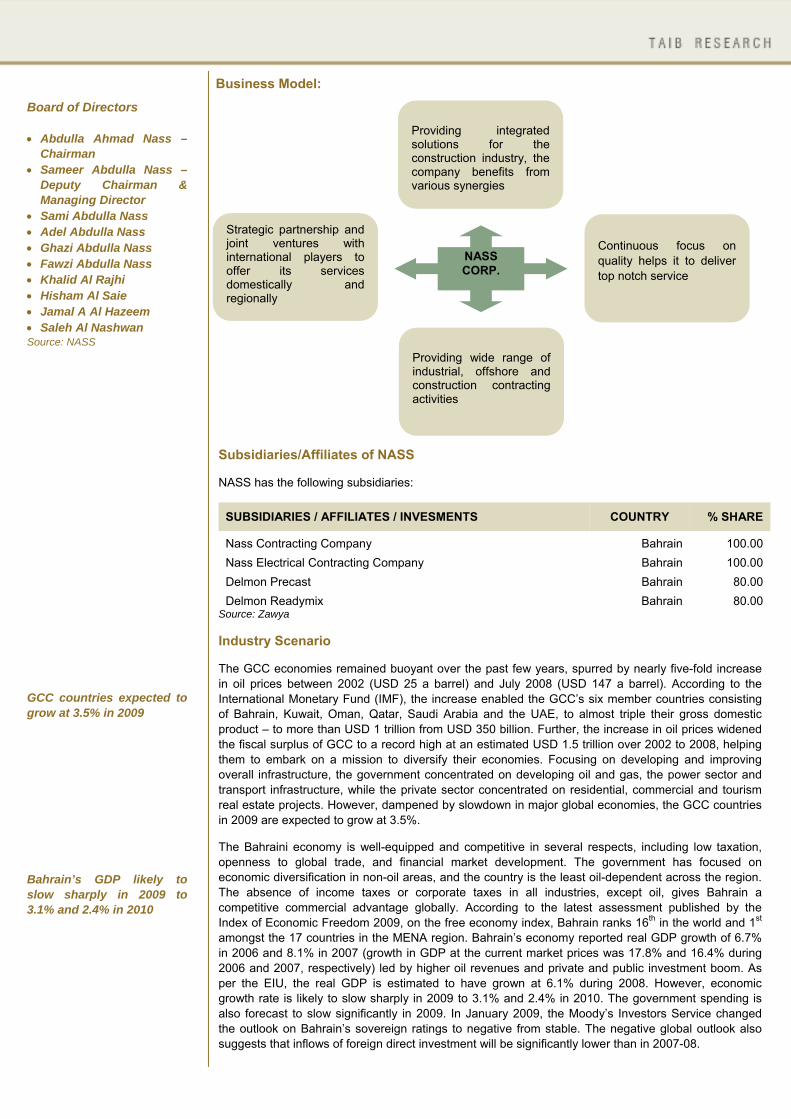
NASSCORP.
Providing wide range of industrial, offshore and construction contracting activities
Strategic partnership and joint ventures with international players to offer its services domestically and regionally
Continuous focus on quality helps it to deliver top notch service
Providing integrated solutions for the construction industry, the company benefits from various synergies
Subsidiaries/Affiliates of NASS NASS has the following subsidiaries:
SUBSIDIARIES / AFFILIATES / INVESMENTS COUNTRY % SHARE
Nass Contracting Company Bahrain 100.00 Nass Electrical Contracting Company Bahrain 100.00 Delmon Precast Bahrain 80.00 Delmon Readymix Bahrain 80.00
Source: Zawya
Industry Scenario The GCC economies remained buoyant over the past few years, spurred by nearly five-fold increase in oil prices between 2002 (USD 25 a barrel) and July 2008 (USD 147 a barrel). According to the International Monetary Fund (IMF), the increase enabled the GCC’s six member countries consisting of Bahrain, Kuwait, Oman, Qatar, Saudi Arabia and the UAE, to almost triple their gross domestic product – to more than USD 1 trillion from USD 350 billion. Further, the increase in oil prices widened the fiscal surplus of GCC to a record high at an estimated USD 1.5 trillion over 2002 to 2008, helping them to embark on a mission to diversify their economies. Focusing on developing and improving overall infrastructure, the government concentrated on developing oil and gas, the power sector and transport infrastructure, while the private sector concentrated on residential, commercial and tourism real estate projects. However, dampened by slowdown in major global economies, the GCC countries in 2009 are expected to grow at 3.5%. The Bahraini economy is well-equipped and competitive in several respects, including low taxation, openness to global trade, and financial market development. The government has focused on economic diversification in non-oil areas, and the country is the least oil-dependent across the region. The absence of income taxes or corporate taxes in all industries, except oil, gives Bahrain a competitive commercial advantage globally. According to the latest assessment published by the Index of Economic Freedom 2009, on the free economy index, Bahrain ranks 16th in the world and 1st amongst the 17 countries in the MENA region. Bahrain’s economy reported real GDP growth of 6.7% in 2006 and 8.1% in 2007 (growth in GDP at the current market prices was 17.8% and 16.4% during 2006 and 2007, respectively) led by higher oil revenues and private and public investment boom. As per the EIU, the real GDP is estimated to have grown at 6.1% during 2008. However, economic growth rate is likely to slow sharply in 2009 to 3.1% and 2.4% in 2010. The government spending is also forecast to slow significantly in 2009. In January 2009, the Moody’s Investors Service changed the outlook on Bahrain’s sovereign ratings to negative from stable. The negative global outlook also suggests that inflows of foreign direct investment will be significantly lower than in 2007-08.
Board of Directors • Abdulla Ahmad Nass –
Chairman • Sameer Abdulla Nass –
Deputy Chairman & Managing Director
• Sami Abdulla Nass • Adel Abdulla Nass • Ghazi Abdulla Nass • Fawzi Abdulla Nass • Khalid Al Rajhi • Hisham Al Saie • Jamal A Al Hazeem • Saleh Al Nashwan Source: NASS GCC countries expected to grow at 3.5% in 2009 Bahrain’s GDP likely to slow sharply in 2009 to 3.1% and 2.4% in 2010
Business Model:
BAHRAIN KEY INDICATORS 2005 2006 2007 2008E 2009E 2010E 2011E GDP (USD billion) 3,853 4,109 4,441 4,714 4,855 4,998 5,229 Growth of real GDP (%) 7.9 6.7 8.1 6.1 3.0 2.9 4.6 GDP per head (USD at PPP) 22,910 24,350 23,930 24,240 24,270 23,930 24,300 Inward direct investment (USD million) 1,049 2,915 1,756 1,700 1,020 1,040 1,092 Inward direct investment (% of GDP) 8 18 10 9 6 5 5 Source: Economist Intelligence Unit
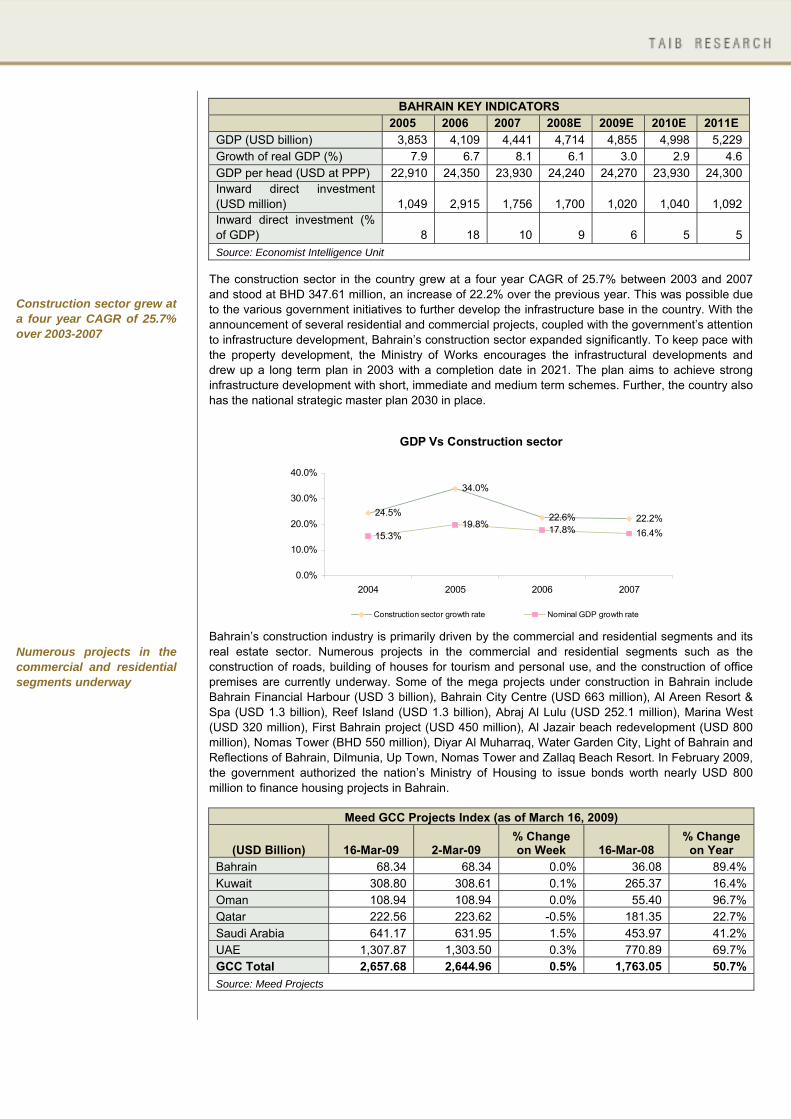
The construction sector in the country grew at a four year CAGR of 25.7% between 2003 and 2007 and stood at BHD 347.61 million, an increase of 22.2% over the previous year. This was possible due to the various government initiatives to further develop the infrastructure base in the country. With the announcement of several residential and commercial projects, coupled with the government’s attention to infrastructure development, Bahrain’s construction sector expanded significantly. To keep pace with the property development, the Ministry of Works encourages the infrastructural developments and drew up a long term plan in 2003 with a completion date in 2021. The plan aims to achieve strong infrastructure development with short, immediate and medium term schemes. Further, the country also has the national strategic master plan 2030 in place.
GDP Vs Construction sector
24.5%
34.0%
22.6% 22.2%
15.3%19.8% 17.8% 16.4%
0.0%
10.0%
20.0%
30.0%
40.0%
2004 2005 2006 2007
Construction sector growth rate Nominal GDP growth rate
Bahrain’s construction industry is primarily driven by the commercial and residential segments and its real estate sector. Numerous projects in the commercial and residential segments such as the construction of roads, building of houses for tourism and personal use, and the construction of office premises are currently underway. Some of the mega projects under construction in Bahrain include Bahrain Financial Harbour (USD 3 billion), Bahrain City Centre (USD 663 million), Al Areen Resort & Spa (USD 1.3 billion), Reef Island (USD 1.3 billion), Abraj Al Lulu (USD 252.1 million), Marina West (USD 320 million), First Bahrain project (USD 450 million), Al Jazair beach redevelopment (USD 800 million), Nomas Tower (BHD 550 million), Diyar Al Muharraq, Water Garden City, Light of Bahrain and Reflections of Bahrain, Dilmunia, Up Town, Nomas Tower and Zallaq Beach Resort. In February 2009, the government authorized the nation’s Ministry of Housing to issue bonds worth nearly USD 800 million to finance housing projects in Bahrain.
Meed GCC Projects Index (as of March 16, 2009)
(USD Billion) 16-Mar-09 2-Mar-09 % Change on Week 16-Mar-08
% Change on Year
Bahrain 68.34 68.34 0.0% 36.08 89.4% Kuwait 308.80 308.61 0.1% 265.37 16.4% Oman 108.94 108.94 0.0% 55.40 96.7% Qatar 222.56 223.62 -0.5% 181.35 22.7% Saudi Arabia 641.17 631.95 1.5% 453.97 41.2% UAE 1,307.87 1,303.50 0.3% 770.89 69.7% GCC Total 2,657.68 2,644.96 0.5% 1,763.05 50.7% Source: Meed Projects
Construction sector grew at a four year CAGR of 25.7% over 2003-2007 Numerous projects in the commercial and residential segments underway
USD 3 billion Qatar-Bahrain Friendship Bridge - longest marine causeway in the world Based more on real demand, the sector will sustain and prevent any sharp declines
Adding a major fillip to the construction industry is the large number of transport projects in the Gulf. Most of the GCC countries have launched long-term strategic transport plans to alleviate escalating traffic congestion problems and support swelling populations. Bahrain has a wide portfolio of projects under way including the expansion of the Bahrain International Airport. The Manama airport expansion is set to nearly triple passenger capacity to 27 million passengers a year, from the current 10 million. Spread over a period of eight years, the project is expected to cost several billion dollars and will be split into two 4-year phases. The first phase of the project involves the expansion of the existing passenger terminal and the construction of a second passenger terminal, with a rail link between the two. It will also include a multi-storey car park and the first phase of the Airport City. Further, the country is also finalising the new structure of the country’s aviation regulator, Civil Aviation Affairs, creating a separate company to oversee the project. In addition, the country will be developing the USD 3 billion Qatar-Bahrain Friendship Bridge. When completed in 2013, it will be the longest marine causeway in the world and will link the two nations via a twin carriageway spanning more than 40 kilometers. Meanwhile, Bahrain is also planning an integrated public transport system, including a monorail train network project at an estimated cost of USD 8 billion. Meanwhile, driven by rapid industrialisation and population growth, the GCC countries would invest USD 100 billion to generate 100,000 MW of additional power over the next 10 years to meet demand. According to the Electricity & Water Authority, Bahrain’s rising power demand would help it to emerge as one of the strongest energy markets in the world. The sector is estimated to attain growth rate of 7% by 2010 on rising consumer demand. Currently, the country’s installed power capacity is struggling to meet domestic requirements. Apart from trying to increase supply, the Bahraini government is also planning to improve its transmission and distribution infrastructure. The country aims to invest an estimated USD 1 billion to generate an additional 1200 MW planned by 2010. It is also mulling to privatise the entire power sector, which will further open the power sector for international players. This implies that like other global and regional players, NASS which provides integrated construction contracting solutions’ with having efficient electrical and mechanical division, has potential room for growth in this segment. With no major projects being cancelled and developers making continuous efforts to sustain the confidence in the market, the construction industry is expected to progress at a steady pace. According to industry experts, Bahrain seems to be in a better position than many countries to face the challenges of the global financial uncertainty. Based more on real demand, the sector will sustain and prevent any sharp declines. Additionally, the country’s major real estate developments have been largely backed by Islamic banks and have not suffered from the credit crunch. Also, the nation was not dependent as other nations on outside finance for new developments. Further, fall in prices of raw materials such as cement and steel would enable construction companies to complete projects within budget.
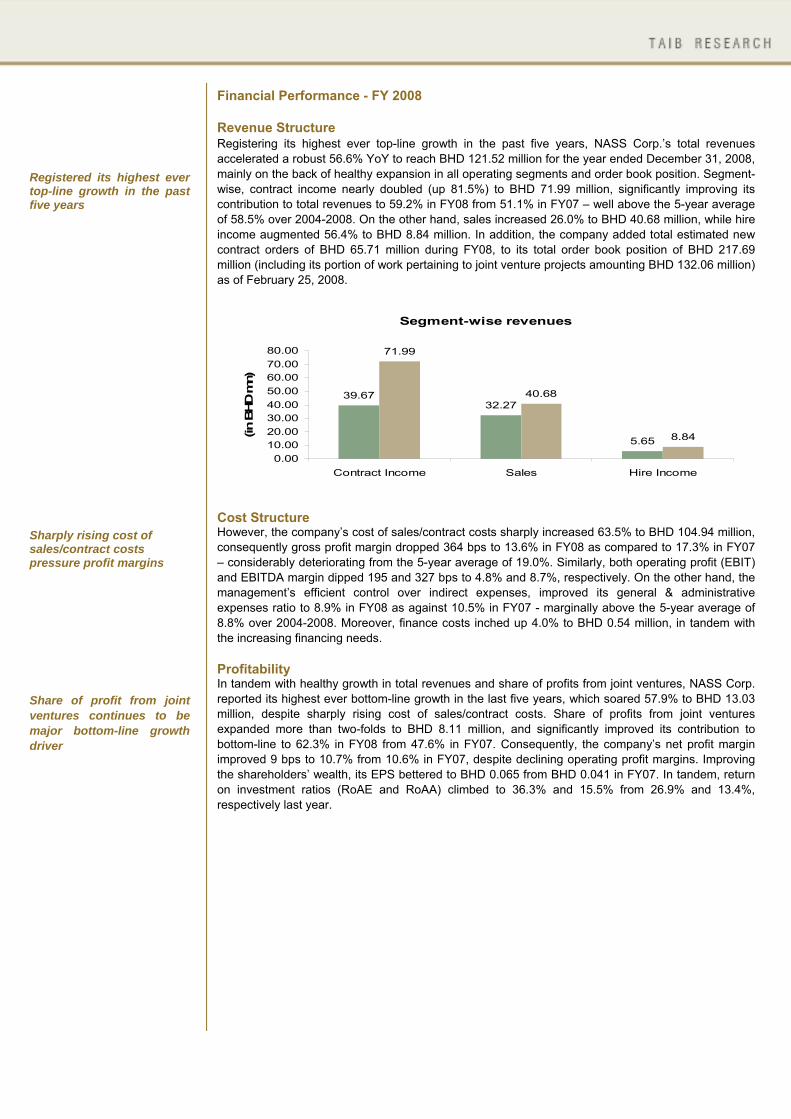
Financial Performance - FY 2008 Revenue Structure Registering its highest ever top-line growth in the past five years, NASS Corp.’s total revenues accelerated a robust 56.6% YoY to reach BHD 121.52 million for the year ended December 31, 2008, mainly on the back of healthy expansion in all operating segments and order book position. Segment-wise, contract income nearly doubled (up 81.5%) to BHD 71.99 million, significantly improving its contribution to total revenues to 59.2% in FY08 from 51.1% in FY07 – well above the 5-year average of 58.5% over 2004-2008. On the other hand, sales increased 26.0% to BHD 40.68 million, while hire income augmented 56.4% to BHD 8.84 million. In addition, the company added total estimated new contract orders of BHD 65.71 million during FY08, to its total order book position of BHD 217.69 million (including its portion of work pertaining to joint venture projects amounting BHD 132.06 million) as of February 25, 2008.
Segment-wise revenues
39.6732.27
5.65
71.99
40.68
8.84
0.0010.0020.0030.0040.0050.0060.0070.0080.00
Contract Income Sales Hire Income
(in B
HD m
n)
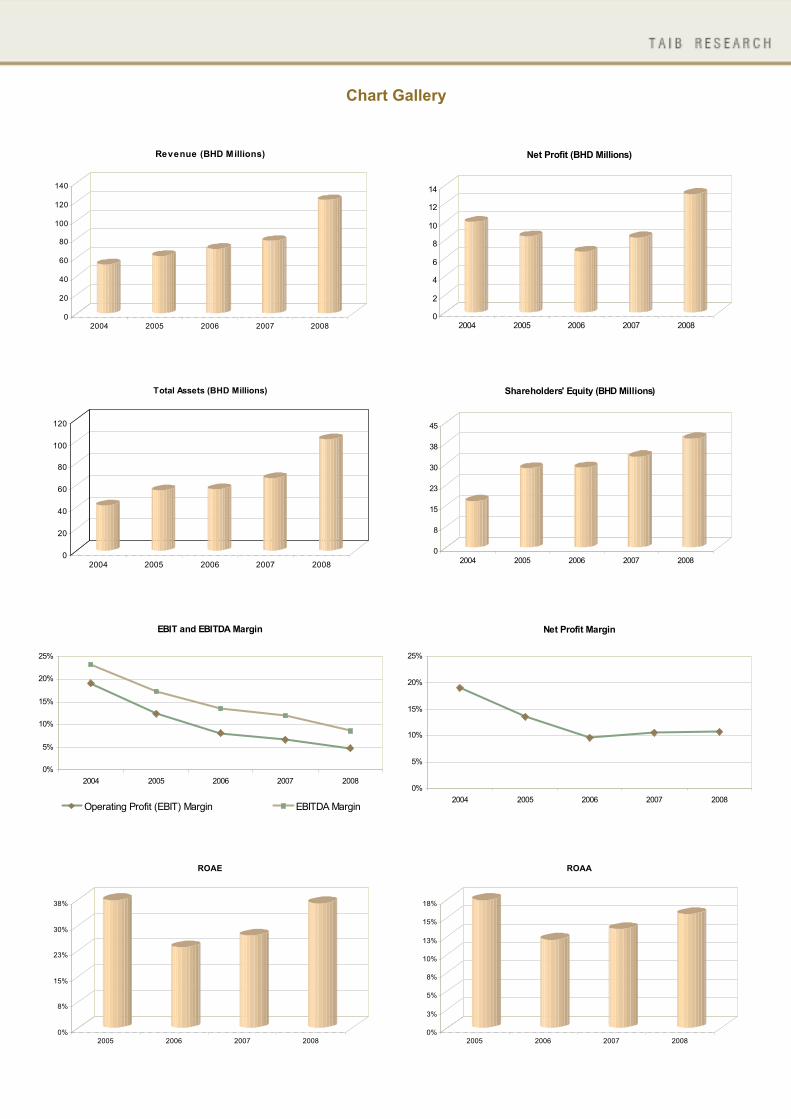
Cost Structure However, the company’s cost of sales/contract costs sharply increased 63.5% to BHD 104.94 million, consequently gross profit margin dropped 364 bps to 13.6% in FY08 as compared to 17.3% in FY07 – considerably deteriorating from the 5-year average of 19.0%. Similarly, both operating profit (EBIT) and EBITDA margin dipped 195 and 327 bps to 4.8% and 8.7%, respectively. On the other hand, the management’s efficient control over indirect expenses, improved its general & administrative expenses ratio to 8.9% in FY08 as against 10.5% in FY07 - marginally above the 5-year average of 8.8% over 2004-2008. Moreover, finance costs inched up 4.0% to BHD 0.54 million, in tandem with the increasing financing needs. Profitability In tandem with healthy growth in total revenues and share of profits from joint ventures, NASS Corp. reported its highest ever bottom-line growth in the last five years, which soared 57.9% to BHD 13.03 million, despite sharply rising cost of sales/contract costs. Share of profits from joint ventures expanded more than two-folds to BHD 8.11 million, and significantly improved its contribution to bottom-line to 62.3% in FY08 from 47.6% in FY07. Consequently, the company’s net profit margin improved 9 bps to 10.7% from 10.6% in FY07, despite declining operating profit margins. Improving the shareholders’ wealth, its EPS bettered to BHD 0.065 from BHD 0.041 in FY07. In tandem, return on investment ratios (RoAE and RoAA) climbed to 36.3% and 15.5% from 26.9% and 13.4%, respectively last year.
Registered its highest ever top-line growth in the past five years Sharply rising cost of sales/contract costs pressure profit margins Share of profit from joint ventures continues to be major bottom-line growth driver
0
20
40
60
80
100
120
140
2004 2005 2006 2007 2008
Revenue (BHD Millions)
0
2
4
6
8
10
12
14
2004 2005 2006 2007 2008
Net Profit (BHD Millions)
0
20
40
60
80
100
120
2004 2005 2006 2007 2008
Total Assets (BHD Millions)
0
8
15
23
30
38
45
2004 2005 2006 2007 2008
Shareholders' Equity (BHD Millions)
EBIT and EBITDA Margin
0%
5%
10%
15%
20%
25%
2004 2005 2006 2007 2008
Operating Profit (EBIT) Margin EBITDA Margin
Net Profit Margin
0%
5%
10%
15%
20%
25%
2004 2005 2006 2007 2008
0%
8%
15%
23%
30%
38%
2005 2006 2007 2008
ROAE
0%
3%
5%
8%
10%
13%
15%
18%
2005 2006 2007 2008
ROAA
Chart Gallery

Size of the Company The salient points about the balance sheet are as follows:
During FY08, NASS’ total assets base rose 53.3% YoY to BHD 101.81 million from BHD 66.40 million a year ago, well above the 4-year CAGR of 25.3% over 2004 to 2008.
During the year, the company’s total current assets jumped 65.0% to BHD 82.18 million and its
share in total assets increased 569 bps to 80.7% from 75.0% in 2007. Subsequently, trade and other receivables soared 74.4% to BHD 40.56 million, while due from customers more than doubled to BHD 9.90 million from BHD 4.42 million in the previous year. On the other hand, share of due from related parties plunged 523 bps to 9.9% from 15.1%.
Meanwhile, interest in joint ventures climbed 87.1% to BHD 8.16 million from BHD 4.36 million in
FY07 and inventories advanced 80.8% to BHD 7.73 million from BHD 4.28 million in FY07.
The company’s cash & cash equivalents increased 66.4% to BHD 5.75 million and its share in total assets went up by 44 bps to 5.7% from 5.2% in FY07.
On the other hand, property, plant and equipment rose 18.4% to BHD 19.63 million from BHD
16.58 million in FY07. However, the share of total non current assets in total assets contracted 569 bps to 19.3% from 25.0% during last year.
The company’s current liabilities increased nearly two-folds to BHD 58.14 million with its share in
the balance sheet rising 1,235 bps to 57.1% in 2008 from 44.8% in 2007. This was mainly led by a 60.0% rise in trade and other payables to BHD 27.28 million compared to BHD 17.06 million the prior period. On the other hand, current portion of term loans also grew nearly four-folds to BHD 3.49 million and due to related parties reached BHD 15.71 million contributing to the increase in current liabilities.
During 2008, non-current liabilities, which included non-current portion of term loans and
employee benefits increased to BHD 2.44 million from BHD 2.22 million in 2007. While employee benefits grew 58.7% to BHD 2.03 million, non-current portion of term loans plunged 56.8% to BHD 0.41 million.
Its shareholders’ equity rose 19.8% to BHD 39.14 million due to increase in retained earnings and
statutory reserves. Statutory reserves increased to BHD 3.64 million in 2008 from BHD 2.33 million a year ago. Retained earnings also improved to BHD 17.10 million from BHD 10.39 million in 2007 reflecting improved bottom-line performance.
NASS has an equity-based capital structure, with little reliance on debts. However, total debt-to-
equity (D/E) ratio increased to 0.17x from 0.12x last year.

Working Capital Snapshot
Working Capital Snapshot (BHD ’000) 2005A 2006A 2007A 2008A
Current Assets: 39,492 40,683 49,815 82,175 Inventories 2,493 3,450 4,276 7,730 Average Inventory Conversion Period (Days) 17 19 22 21 Trade and Other Receivables 20,928 23,193 23,254 40,557 Average Collection Period (Days) 115 116 109 96 Cash and Cash Equivalents 2,173 2,646 3,458 5,754 Interests in Joint Ventures 1,407 2,749 4,361 8,160 Due from Customers 3,898 3,991 4,424 9,899 Due from Related Parties 8,593 4,654 10,042 10,075 Current Liabilities: 24,434 24,147 29,719 58,143 Trade and Other Payables 12,308 11,770 17,057 27,283 Average Payment Period (Days) 69 64 68 67 Term Loans 352 970 874 3,486 Bank Overdrafts 2,258 1,181 1,971 2,849 Due to Customers 234 892 959 4,327 Employee Benefits 885 1,102 1,192 1,883 Due to Related Parties 6,039 6,547 4,258 15,706 Bills Payable 2,358 1,685 3,408 2,609 Net Core Working Capital 11,113 14,873 10,473 21,004 Average Core Working Capital Cycle (Days) 63 72 63 50 Net Current Assets 15,058 16,536 20,096 24,032 Average Working Capital Cycle (Days) 59 83 65 50 Source: NASS Financial Statements
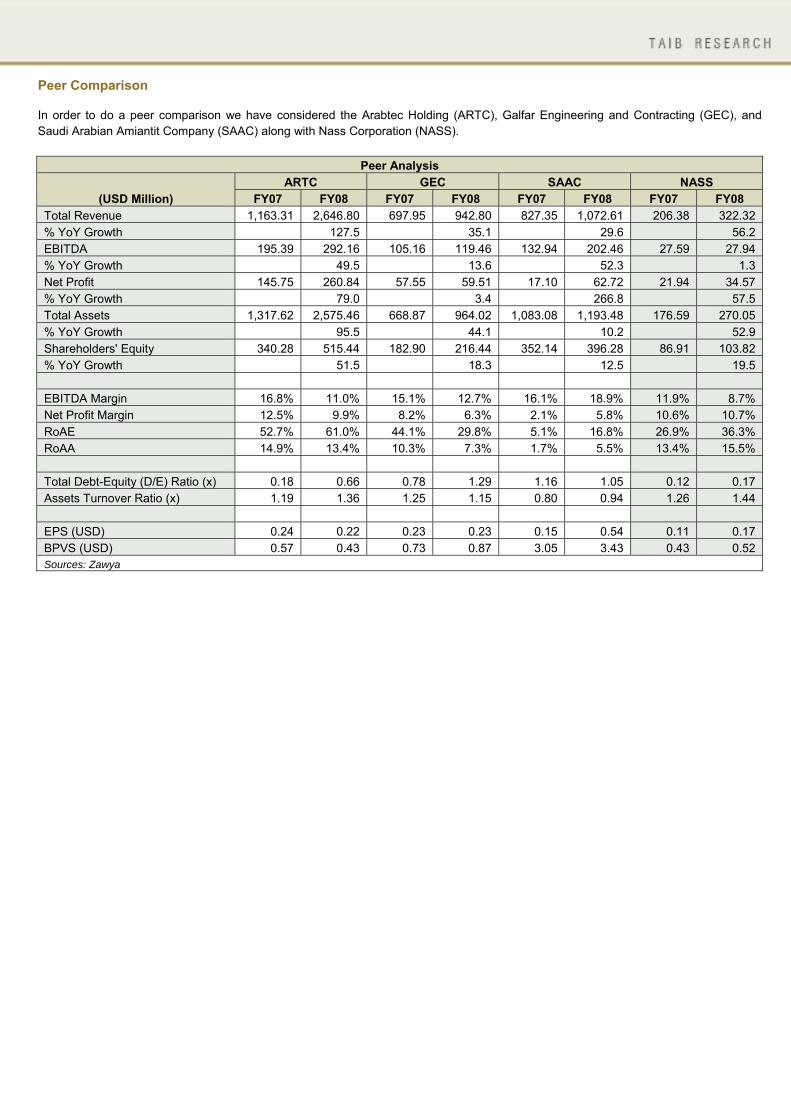
Peer Comparison In order to do a peer comparison we have considered the Arabtec Holding (ARTC), Galfar Engineering and Contracting (GEC), and Saudi Arabian Amiantit Company (SAAC) along with Nass Corporation (NASS).
Peer Analysis
(USD Million) ARTC GEC SAAC NASS
FY07 FY08 FY07 FY08 FY07 FY08 FY07 FY08 Total Revenue 1,163.31 2,646.80 697.95 942.80 827.35 1,072.61 206.38 322.32 % YoY Growth 127.5 35.1 29.6 56.2 EBITDA 195.39 292.16 105.16 119.46 132.94 202.46 27.59 27.94 % YoY Growth 49.5 13.6 52.3 1.3 Net Profit 145.75 260.84 57.55 59.51 17.10 62.72 21.94 34.57 % YoY Growth 79.0 3.4 266.8 57.5 Total Assets 1,317.62 2,575.46 668.87 964.02 1,083.08 1,193.48 176.59 270.05 % YoY Growth 95.5 44.1 10.2 52.9 Shareholders' Equity 340.28 515.44 182.90 216.44 352.14 396.28 86.91 103.82 % YoY Growth 51.5 18.3 12.5 19.5 EBITDA Margin 16.8% 11.0% 15.1% 12.7% 16.1% 18.9% 11.9% 8.7% Net Profit Margin 12.5% 9.9% 8.2% 6.3% 2.1% 5.8% 10.6% 10.7% RoAE 52.7% 61.0% 44.1% 29.8% 5.1% 16.8% 26.9% 36.3% RoAA 14.9% 13.4% 10.3% 7.3% 1.7% 5.5% 13.4% 15.5% Total Debt-Equity (D/E) Ratio (x) 0.18 0.66 0.78 1.29 1.16 1.05 0.12 0.17 Assets Turnover Ratio (x) 1.19 1.36 1.25 1.15 0.80 0.94 1.26 1.44 EPS (USD) 0.24 0.22 0.23 0.23 0.15 0.54 0.11 0.17 BPVS (USD) 0.57 0.43 0.73 0.87 3.05 3.43 0.43 0.52 Sources: Zawya

Implementing vital and diversified infrastructure projects BHD 153.80 million – Salam Resort Project cancelled Numerous projects in hand including Raffel City Bahrain, district cooling service project for Tabreed Bahrain, a dredging and reclamation contract from Darari Investment among others
New Projects and Strategy Focusing on winning and implementing vital and diversified infrastructure projects in Bahrain as well as other countries in the GCC region, NASS continues to add new projects to its order book either on its own or through strategic alliances. In March 2009, Nass Contracting Co., its wholly owned subsidiary, signed a contract with Energy Central Company (ECC) to build infrastructure and ancillary works for a sea water desalination plant at Durrat Al Bahrain. The plant will meet the irrigation demand at Durrat Al Bahrain, a mixed-use residential and resort development in the south of Bahrain with a total investment of USD 6 billion. In order to permit installation of the desalination and electrical equipment, the company will complete the construction of the building, infrastructure and ancillary works –Phase 1 for BHD 3.08 million by September 2009. On the other hand, as the country started to reel under the effects of global crisis, the company’s Salam Resort project in partnership with Murray & Roberts worth BHD 153.80 million was cancelled in January 2009. Earlier in December 2008, Nass Contracting Co. and Greatlakes received approval from Diyaar Al Muharraq to extend the scope of their joint venture. The deal will now include stage two of dredging, reclamation and marine shore protection works at Muharraq for a total value of about BHD 70 million, with Nass Contracting Co. accounting for BHD 18.5 million. In August 2008, Nass Contracting Co. received a letter of award for the construction of building & staff accommodation worth BHD 14.02 million. In June 2008, the company signed another deal worth BHD 6.5 million with UniTraders for the construction of office building at Diplomatic Area, Manama. Simultaneously, its joint venture with Murray & Roberts received letter of acceptance from Bahrain Bay Integrated Development Investment for the Raffel City Bahrain, foundation and substructure works worth BHD 30.99 million. The duration of the project is 12 months. In April 2008, the subsidiary bagged the District Cooling Service Project for architectural works & MEP works for Tabreed Bahrain (Bahrain District Cooling Co.) for a total value of BHD 8.58 million. Additionally, in March, it was awarded a BHD 5.62 million Darari Project dredging and reclamation contract from Darara Investment Company. In November 2007, Nass Contracting Co. received notice of intent from Riffa Views for Riffa Views Development Project-IW4200-landscaping work amounting to BHD 7.91 million. In a bid to expand its investor base, the company aimed at listing on other regional bourses. In April 2008, the Securities & Commodities Authority (SCA), UAE, approved the application of NASS for registration, subsequently to be listed, on the securities markets under the foreign company category.
Risks and Concerns:
The real estate and construction activities are largely dependent on the economic performance. The ongoing global economic crisis has tightened the liquidity position across economies with declining oil prices further reducing large reserve surpluses. As a result, the overall economic activity has slowed down resulting in high unemployment rate thereby negatively impacting the demand in the property market.
The current global economic crisis has driven away investments from big infrastructure projects with most of them either being postponed or put on hold. This is likely to negatively impact the anticipated cash flows from these projects, which in turn is expected to lead to subdued growth for future development projects.
With a cloud of uncertainty on the economic growth, governments across economies are promoting savings, thereby impacting the business volumes in the real estate sector.
SWOT Analysis
THREATS
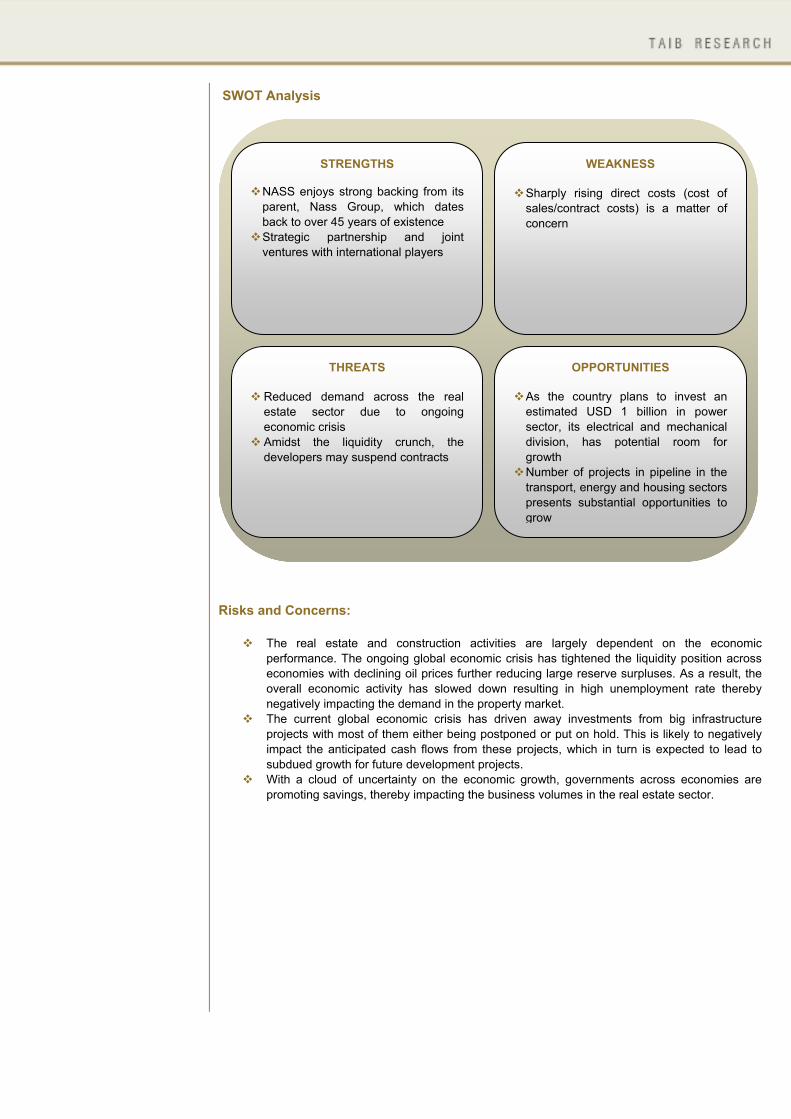
Reduced demand across the real estate sector due to ongoing economic crisis Amidst the liquidity crunch, the developers may suspend contracts
OPPORTUNITIES
As the country plans to invest an estimated USD 1 billion in power sector, its electrical and mechanical division, has potential room for growth Number of projects in pipeline in the transport, energy and housing sectors presents substantial opportunities to grow
WEAKNESS
Sharply rising direct costs (cost of sales/contract costs) is a matter of concern
STRENGTHS
NASS enjoys strong backing from its parent, Nass Group, which dates back to over 45 years of existence Strategic partnership and joint ventures with international players

Cost of Equity: 15.40% WACC: 14.13%
Valuation Methodology: We have used two valuation methods for arriving at the fair value of NASS, as explained below:
I. DCF Valuation Method II. TTM P/E Valuation Approach.
DCF Valuation: Assumptions:
(i) Risk free rate (Rf) of 3.46%, equivalent to 12-month average yield on 10-year US T-Notes.
(ii) Average emerging markets’ heavy construction companies unlevered beta of 1.21 (iii) A terminal growth rate of 2.0%
Based on the inputs and the Capital Asset Pricing Model (CAPM), we have arrived at a Cost of Equity of 15.40%. Taking into consideration the long-term and short-term debts of NASS, we have arrived at the Weighted Average Cost of Capital (WACC) of 14.13%.
DCF Calculations
DCF Valuation (FCFF Model) (BHD ’000) 2009E 2010E 2011E 2012E 2013E
Operating Profit (EBIT) 6,319 6,166 5,797 4,984 4,129 Less: Tax on EBIT 0 0 0 0 0 Effective Tax Rate 0.00% 0.00% 0.00% 0.00% 0.00% NOPAT 6,319 6,166 5,797 4,984 4,129 Add: Depreciation & Amortisation 5,303 6,050 6,893 7,819 8,722 Less: Capex 8,237 9,059 10,600 11,483 12,246 Less: Changes in Net Working Capital 7,638 6,758 6,630 7,986 8,125 Operating Free Cash Flows to Firm (OFCFF) -4,253 -3,602 -4,540 -6,665 -7,520 Non-Operating Income 9,620 10,361 11,250 11,987 12,581 Add: Non-Operating Cash Flows (After Tax Non-Operating Income) 9,620 10,361 11,250 11,987 12,581 Free Cash Flow to Firm (FCFF) 5,366 6,759 6,710 5,322 5,061 WACC (Ko) 14.13% 14.13% 14.13% 14.13% 14.13% Present Value / Discount Factor 0.8762 0.7677 0.6726 0.5893 0.5164 Long-Term Growth Rate (g) 2.00% Terminal Multiple [(1 + g) / (WACC - g)] 8.41 Nominal Terminal Value [(FCFF * (1 + g)) / (WACC - g)] 42,547 Present Value of Free Cash Flows 4,702 5,189 4,513 3,137 2,613 Present Value of Nominal Terminal Value 21,970

Calculation of Equity Value and Fair Value Per Share NPV of Free Cash Flows (during Explicit Forecast Period) (BHD ’000) 20,154Terminal Value (BHD ’000): Residual Cash Flow (FCFF of 2013E) 5,061 WACC 14.13% Long-Term/Terminal Growth Rate (g) 2.00% Divided by Capitalization Rate (WACC - g) 12.13%Equals Nominal Terminal Value 42,547 Implied Multiple of 2013E EBITDA 3.31 Times PV/ Discount Factor 0.52Present Value of Terminal/Residual Value 21,970 Enterprise Value (BHD ’000) 42,124 Implied Multiple of 2013E EBITDA 3.28 Less: Long-term Debts 6,740Less: Market Value of Preferred Shares 0Add: Surplus Cash and Investments 0Equity Value (BHD ’000) 35,384Outstanding Shares (’000) 220,000Fair Value Per Share (BHD) 0.161
Sensitivity Analysis We have prepared a sensitivity analysis table, showing the probable nominal terminal value, discounted terminal value and enterprise value, given different growth rate assumptions and the WACC. The shaded area represents the most probable outcomes.
Sensitivity Analysis of Nominal Terminal Value (BHD ’000)
Discount Factor Long-Term Growth Rate
1.00% 1.50% 2.00% 2.50% 3.00% 12.13% 45,915 48,312 50,946 53,853 57,079 13.13% 42,130 44,159 46,369 48,788 51,445 14.13% 38,922 40,663 42,547 44,594 46,824 15.13% 36,168 37,680 39,307 41,064 42,964 16.13% 33,778 35,105 35,105 38,051 39,693
Sensitivity Analysis of Discounted Terminal Value (BHD ’000)
Discount Factor Long-Term Growth Rate
1.00% 1.50% 2.00% 2.50% 3.00% 12.13% 25,900 27,252 28,738 30,378 32,197 13.13% 22,733 23,828 25,021 26,326 27,760 14.13% 20,098 20,997 21,970 23,027 24,178 15.13% 17,879 18,626 19,431 20,299 21,239 16.13% 15,991 16,619 17,292 18,014 18,791
Sensitivity Analysis of Enterprise Value (BHD ’000)
Discount Factor Long-Term Growth Rate
1.00% 1.50% 2.00% 2.50% 3.00% 12.13% 47,042 48,394 49,880 51,520 53,339 13.13% 43,371 44,466 45,659 46,964 48,398 14.13% 40,252 41,151 42,124 43,181 44,332 15.13% 37,566 38,314 39,118 39,986 40,926 16.13% 35,229 35,858 36,530 37,252 38,029
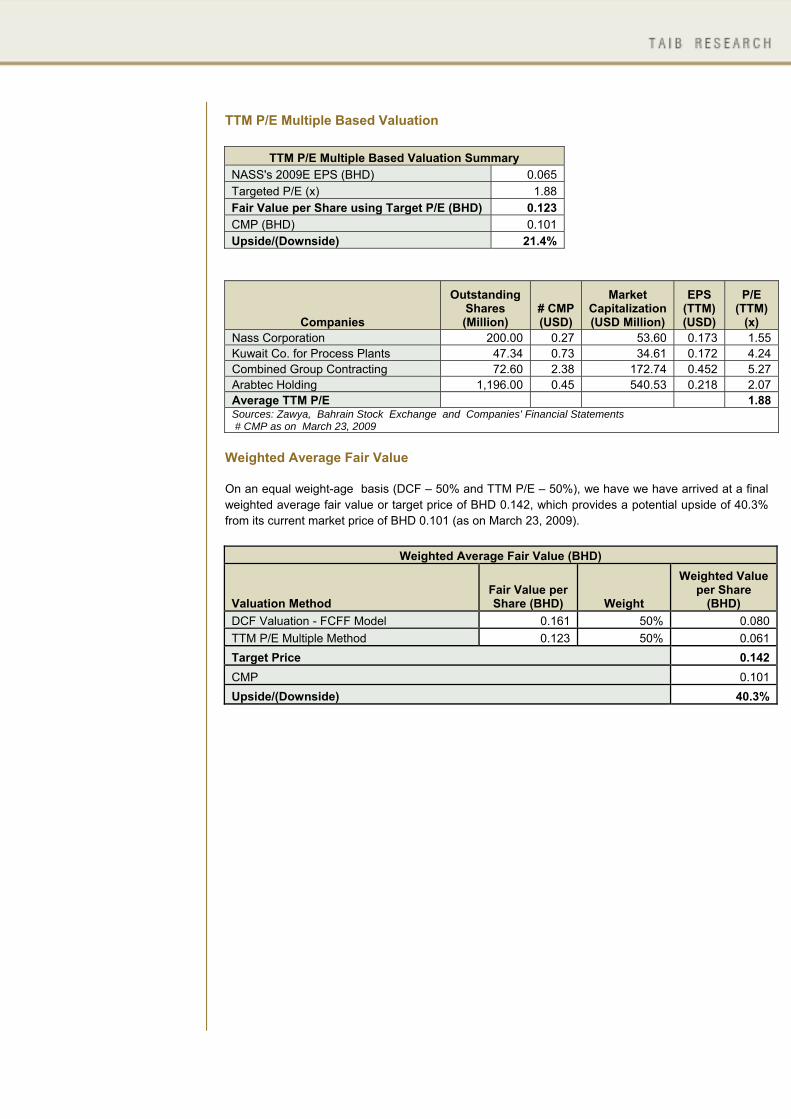
TTM P/E Multiple Based Valuation
TTM P/E Multiple Based Valuation Summary NASS's 2009E EPS (BHD) 0.065 Targeted P/E (x) 1.88 Fair Value per Share using Target P/E (BHD) 0.123 CMP (BHD) 0.101 Upside/(Downside) 21.4%
Companies
Outstanding Shares (Million)
# CMP (USD)
Market Capitalization (USD Million)
EPS (TTM) (USD)
P/E (TTM)
(x) Nass Corporation 200.00 0.27 53.60 0.173 1.55 Kuwait Co. for Process Plants 47.34 0.73 34.61 0.172 4.24 Combined Group Contracting 72.60 2.38 172.74 0.452 5.27 Arabtec Holding 1,196.00 0.45 540.53 0.218 2.07 Average TTM P/E 1.88 Sources: Zawya, Bahrain Stock Exchange and Companies' Financial Statements # CMP as on March 23, 2009
Weighted Average Fair Value On an equal weight-age basis (DCF – 50% and TTM P/E – 50%), we have we have arrived at a final weighted average fair value or target price of BHD 0.142, which provides a potential upside of 40.3% from its current market price of BHD 0.101 (as on March 23, 2009).
Weighted Average Fair Value (BHD)
Valuation Method Fair Value per Share (BHD) Weight
Weighted Value per Share
(BHD) DCF Valuation - FCFF Model 0.161 50% 0.080TTM P/E Multiple Method 0.123 50% 0.061Target Price 0.142CMP 0.101Upside/(Downside) 40.3%

Investment Opinion Amid prevailing economic and financial crisis, the construction activities in the GCC region still continues, albeit at a slower pace. As evident, the MEED GCC Projects Index presently stands at USD 2.66 trillion (as of March 16, 2009), advancing a 0.5% over the previous week. On a year-on-year basis, the index has expanded a healthy 50.7% over USD 1.76 trillion as of the same date last year. Notably, total planned or underway projects in Bahrain (with smallest construction and real estate sector among GCC countries) almost doubled reaching USD 68.34 billion as of March 16, 2009, as compared to USD 36.08 billion a year ago. The commercial and residential segments together with real estate sector primarily drive the growth in the construction sector. Numerous projects in the commercial and residential segments such as the construction of roads, building of houses for tourism and personal use, and the construction of office premises are currently underway. In February 2009, the government authorized the Nation’s Ministry of Housing to issue bonds worth nearly USD 800 million to finance housing projects in Bahrain, which is expected to act as a main growth driver for the industry in the medium-term. Moreover, the large number of transport projects adds a major fillip to the construction industry. With no major projects being cancelled and developers making continuous efforts to sustain the confidence in the market, the industry is expected to progress at a steady pace. Based more on real demand, the sector will sustain and prevent any sharp declines. Additionally, the country’s major real estate developments have been largely backed by Islamic banks, and have not suffered, for the most part, from the credit crunch. Further, fall in prices of raw materials such as cement and steel would enable construction companies to complete projects within budget. On the other hand, focusing on successfully winning and implementing vital and diversified infrastructure projects in Bahrain as well as other countries in the GCC region, NASS continues to add new projects to its order book either on its own or through strategic alliances. As of February 25, 2008, the company’s total order book position stood at BHD 217.69 million, including its portion of work pertaining to joint venture projects amounting BHD 132.06 million. In addition, it has also added estimated total new orders of BHD 65.71 million during FY08, which provides healthy revenue and earnings visibility. In tandem with its strategic focus towards bigger projects with joint venture partners, the company’s share of profit from JV operations continues to be the major profit driver, which contributed 62.3% of its bottom-line in FY08 as compared 47.6% in FY07, well above the 5-year average of 29.3% over 2004-2008. Further, the company reported the highest ever top and bottom-line growth in FY08 over the past five years. On the flip side, the sharply rising cost of sales/contract costs is a matter of concern, which continues to pressurize its profit margins. However, the declining global demand and prices of construction materials may improve the margins in near future. Tottering under the ongoing economic and financial crisis, the company’s Salam Resort project in partnership with Murray & Roberts worth BHD 153.80 million was cancelled in January 2009, which may impact earnings growth. The performance of NASS’ stock has remained highly volatile in the last twelve months, touching a 52-week high of BHD 0.455 as on July 16, 2008, while trading at its all time-low of BHD 0.101 as on March 23, 2009. The stock has lost 55.5% since the beginning of this year, as compared to an 11.6% YTD plunge in the Bahrain All Share Index (BASI). Despite reporting sturdy financial results, the stock performance has severely impacted by the overall negative sentiment regarding the construction/real estate sector and concerns over cancellation/delay of construction projects going forward. However, NASS’ stock is presently trading at a P/E multiple of 1.55x and 1.49x on 2009E and 2010E earnings, and at a P/B multiple of 0.44x and 0.37x on 2009E and 2010E BVPS, respectively. Considering the above factors and based on our DCF and TTM P/E Valuation Methods, we revise downwards our earlier price target of BHD 0.406 (September 05, 2007), to BHD 0.142, which exhibits a potential upside of 40.3% from its closing price of BHD 0.101 (as on March 23, 2009). Therefore, we maintain our earlier OVERWEIGHT opinion on NASS Corporation.
Fair Value: BHD 0.142 Investment Opinion: OVERWEIGHT
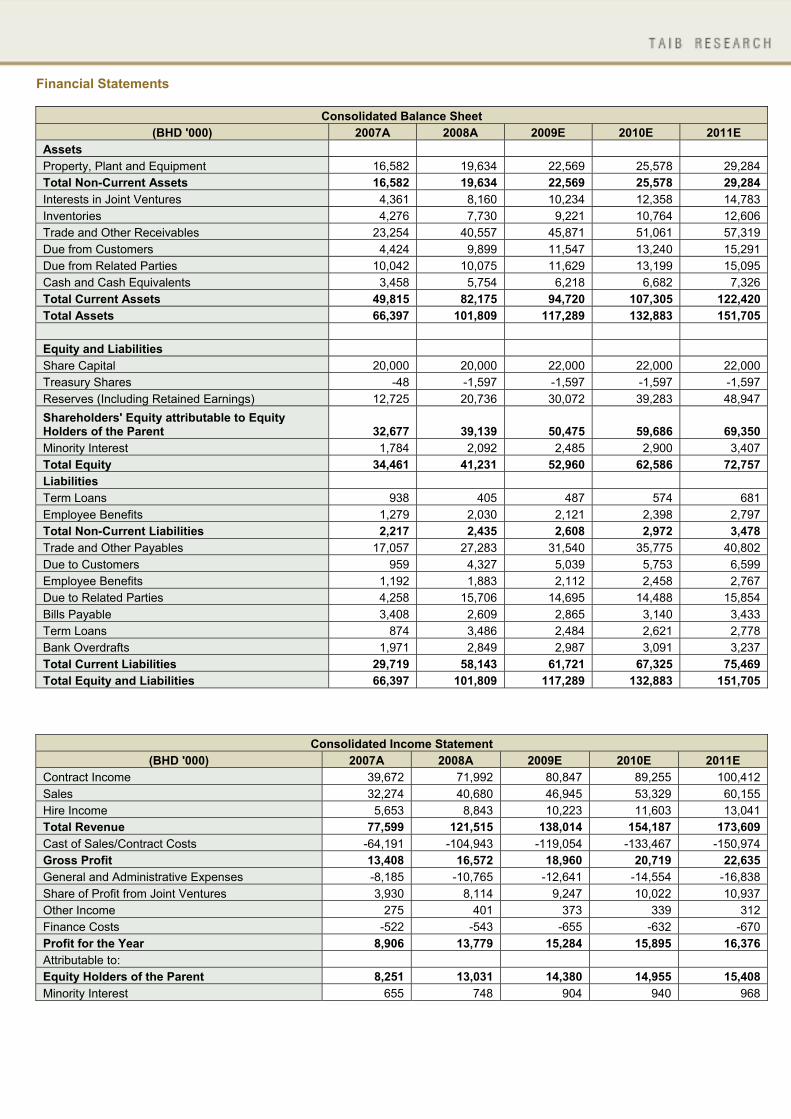
Financial Statements
Consolidated Balance Sheet (BHD '000) 2007A 2008A 2009E 2010E 2011E
Assets Property, Plant and Equipment 16,582 19,634 22,569 25,578 29,284 Total Non-Current Assets 16,582 19,634 22,569 25,578 29,284 Interests in Joint Ventures 4,361 8,160 10,234 12,358 14,783 Inventories 4,276 7,730 9,221 10,764 12,606 Trade and Other Receivables 23,254 40,557 45,871 51,061 57,319 Due from Customers 4,424 9,899 11,547 13,240 15,291 Due from Related Parties 10,042 10,075 11,629 13,199 15,095 Cash and Cash Equivalents 3,458 5,754 6,218 6,682 7,326 Total Current Assets 49,815 82,175 94,720 107,305 122,420 Total Assets 66,397 101,809 117,289 132,883 151,705 Equity and Liabilities Share Capital 20,000 20,000 22,000 22,000 22,000 Treasury Shares -48 -1,597 -1,597 -1,597 -1,597 Reserves (Including Retained Earnings) 12,725 20,736 30,072 39,283 48,947 Shareholders' Equity attributable to Equity Holders of the Parent 32,677 39,139 50,475 59,686 69,350 Minority Interest 1,784 2,092 2,485 2,900 3,407 Total Equity 34,461 41,231 52,960 62,586 72,757 Liabilities Term Loans 938 405 487 574 681 Employee Benefits 1,279 2,030 2,121 2,398 2,797 Total Non-Current Liabilities 2,217 2,435 2,608 2,972 3,478 Trade and Other Payables 17,057 27,283 31,540 35,775 40,802 Due to Customers 959 4,327 5,039 5,753 6,599 Employee Benefits 1,192 1,883 2,112 2,458 2,767 Due to Related Parties 4,258 15,706 14,695 14,488 15,854 Bills Payable 3,408 2,609 2,865 3,140 3,433 Term Loans 874 3,486 2,484 2,621 2,778 Bank Overdrafts 1,971 2,849 2,987 3,091 3,237 Total Current Liabilities 29,719 58,143 61,721 67,325 75,469 Total Equity and Liabilities 66,397 101,809 117,289 132,883 151,705
Consolidated Income Statement (BHD '000) 2007A 2008A 2009E 2010E 2011E
Contract Income 39,672 71,992 80,847 89,255 100,412 Sales 32,274 40,680 46,945 53,329 60,155 Hire Income 5,653 8,843 10,223 11,603 13,041 Total Revenue 77,599 121,515 138,014 154,187 173,609 Cast of Sales/Contract Costs -64,191 -104,943 -119,054 -133,467 -150,974 Gross Profit 13,408 16,572 18,960 20,719 22,635 General and Administrative Expenses -8,185 -10,765 -12,641 -14,554 -16,838 Share of Profit from Joint Ventures 3,930 8,114 9,247 10,022 10,937 Other Income 275 401 373 339 312 Finance Costs -522 -543 -655 -632 -670 Profit for the Year 8,906 13,779 15,284 15,895 16,376 Attributable to: Equity Holders of the Parent 8,251 13,031 14,380 14,955 15,408 Minority Interest 655 748 904 940 968

Consolidated Statement of Cash Flows
(BHD '000) 2007A 2008A 2009E 2010E 2011E Operating Activities: Profit for the Year before Minority Interest 8,906 13,779 15,284 15,895 16,376 Adjustments for: Depreciation 4,039 4,725 5,303 6,050 6,893 Gain on Disposal of Plant and Equipment -77 -29 0 0 0 Employee Benefits 328 751 91 277 399 13,196 19,226 20,677 22,222 23,669 Working Capital Changes: Inventories -826 -3,454 -1,491 -1,543 -1,842 Trade and Other Receivables -61 -17,270 -5,314 -5,190 -6,258 Due from Customers -433 -5,475 -1,648 -1,693 -2,050 Due from Related Parties and Interests in Joint Ventures -7,000 -3,832 -3,628 -3,694 -4,321 Accounts Payable, Accruals, and Provisions 5,064 9,985 4,257 4,235 5,027 Due to Customers 67 3,368 712 714 846 Due to Related Parties -2,289 11,448 -1,011 -207 1,366 Bills Payable 1,723 -799 256 275 293 Employee Benefits 90 691 229 346 309 Net Cash from/(used) in Operating Activities 9,531 13,888 13,039 15,464 17,039 Investing Activities: Purchase of Property, Plant and Equipment -5,174 -7,831 -8,237 -9,059 -10,600 Proceeds on Sale of Property, Plant and Equipment 365 83 0 0 0 Investment in Associate 0 -33 0 0 0 Net Cash from/(used) in Investing Activities -4,809 -7,781 -8,237 -9,059 -10,600 Financing Activities: Net Movement in Bank Loans -327 2,079 -782 328 410 Dividends Paid -4,137 -4,975 -2,800 -5,500 -5,500 Directors Remuneration Paid -165 -220 -220 -220 -220 Purchase of Own Shares -48 -1,549 0 0 0 Donations Paid -23 -24 -24 -24 -24 Net Cash from/(used) in Financing Activities -4,700 -4,689 -3,826 -5,416 -5,334 Net (Decrease)/Increase in Cash And Cash Equivalent 22 1,418 975 989 1,105 Cash and Cash Equivalents (Opening) 1,465 1,487 2,905 3,880 4,869 Cash and Cash Equivalents (Closing) 1,487 2,905 3,880 4,869 5,974
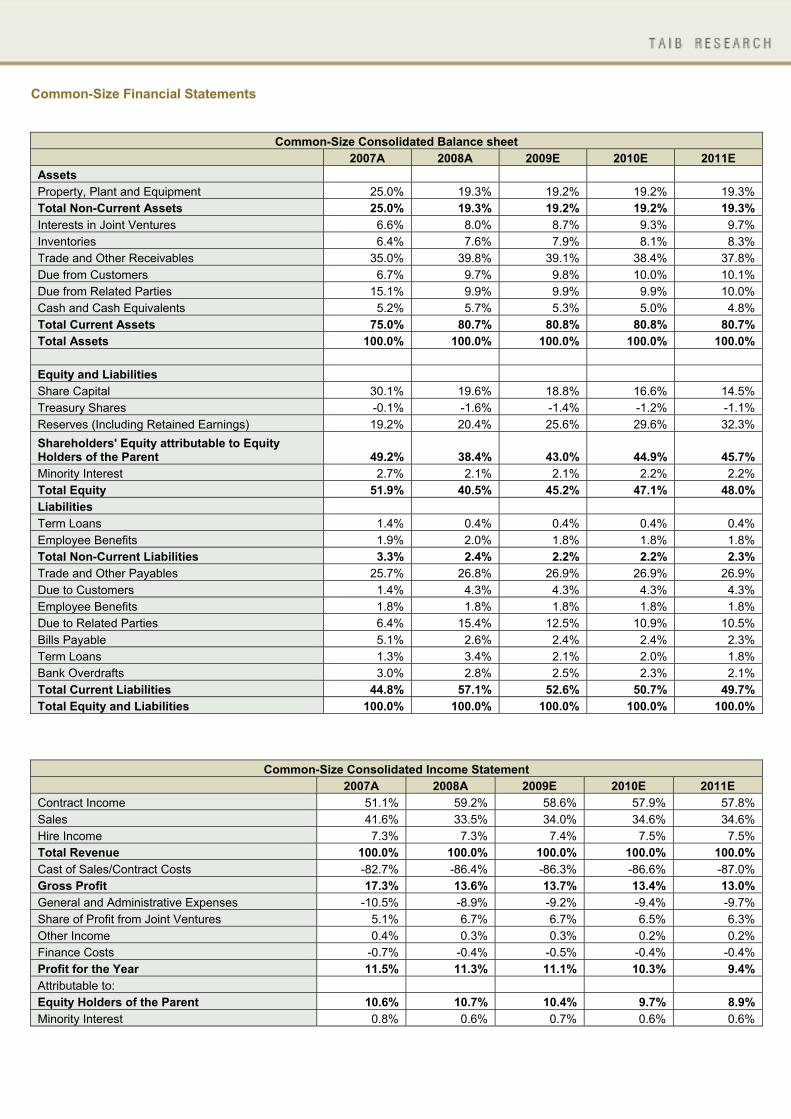
Common-Size Financial Statements
Common-Size Consolidated Balance sheet 2007A 2008A 2009E 2010E 2011E
Assets Property, Plant and Equipment 25.0% 19.3% 19.2% 19.2% 19.3% Total Non-Current Assets 25.0% 19.3% 19.2% 19.2% 19.3% Interests in Joint Ventures 6.6% 8.0% 8.7% 9.3% 9.7% Inventories 6.4% 7.6% 7.9% 8.1% 8.3% Trade and Other Receivables 35.0% 39.8% 39.1% 38.4% 37.8% Due from Customers 6.7% 9.7% 9.8% 10.0% 10.1% Due from Related Parties 15.1% 9.9% 9.9% 9.9% 10.0% Cash and Cash Equivalents 5.2% 5.7% 5.3% 5.0% 4.8% Total Current Assets 75.0% 80.7% 80.8% 80.8% 80.7% Total Assets 100.0% 100.0% 100.0% 100.0% 100.0% Equity and Liabilities Share Capital 30.1% 19.6% 18.8% 16.6% 14.5% Treasury Shares -0.1% -1.6% -1.4% -1.2% -1.1% Reserves (Including Retained Earnings) 19.2% 20.4% 25.6% 29.6% 32.3% Shareholders' Equity attributable to Equity Holders of the Parent 49.2% 38.4% 43.0% 44.9% 45.7% Minority Interest 2.7% 2.1% 2.1% 2.2% 2.2% Total Equity 51.9% 40.5% 45.2% 47.1% 48.0% Liabilities Term Loans 1.4% 0.4% 0.4% 0.4% 0.4% Employee Benefits 1.9% 2.0% 1.8% 1.8% 1.8% Total Non-Current Liabilities 3.3% 2.4% 2.2% 2.2% 2.3% Trade and Other Payables 25.7% 26.8% 26.9% 26.9% 26.9% Due to Customers 1.4% 4.3% 4.3% 4.3% 4.3% Employee Benefits 1.8% 1.8% 1.8% 1.8% 1.8% Due to Related Parties 6.4% 15.4% 12.5% 10.9% 10.5% Bills Payable 5.1% 2.6% 2.4% 2.4% 2.3% Term Loans 1.3% 3.4% 2.1% 2.0% 1.8% Bank Overdrafts 3.0% 2.8% 2.5% 2.3% 2.1% Total Current Liabilities 44.8% 57.1% 52.6% 50.7% 49.7% Total Equity and Liabilities 100.0% 100.0% 100.0% 100.0% 100.0%
Common-Size Consolidated Income Statement 2007A 2008A 2009E 2010E 2011E
Contract Income 51.1% 59.2% 58.6% 57.9% 57.8% Sales 41.6% 33.5% 34.0% 34.6% 34.6% Hire Income 7.3% 7.3% 7.4% 7.5% 7.5% Total Revenue 100.0% 100.0% 100.0% 100.0% 100.0% Cast of Sales/Contract Costs -82.7% -86.4% -86.3% -86.6% -87.0% Gross Profit 17.3% 13.6% 13.7% 13.4% 13.0% General and Administrative Expenses -10.5% -8.9% -9.2% -9.4% -9.7% Share of Profit from Joint Ventures 5.1% 6.7% 6.7% 6.5% 6.3% Other Income 0.4% 0.3% 0.3% 0.2% 0.2% Finance Costs -0.7% -0.4% -0.5% -0.4% -0.4% Profit for the Year 11.5% 11.3% 11.1% 10.3% 9.4% Attributable to: Equity Holders of the Parent 10.6% 10.7% 10.4% 9.7% 8.9% Minority Interest 0.8% 0.6% 0.7% 0.6% 0.6%

Financial Ratios
Financial Ratios 2007A 2008A water 010E 2010E 2011E Liquidity Ratios: Current Ratio (x) 1.68 1.41 1.53 1.59 1.62 Quick Ratio (x) 1.53 1.28 1.39 1.43 1.46 Inventory Conversion Period (Days) 22 21 26 27 28 Average Collection Period (Days) 109 96 114 115 114 Length of Operating Cycle (Days) 131 117 140 142 142 Average Payment Period (Days) 68 67 78 80 80 Length of Cash Cycle (Days) 63 50 62 62 62 � � � Activity Ratios: �� � Inventory Turnover Ratio (x) 16.62 17.48 14.05 13.36 12.92 Debtors' Turnover Ratio (x) 3.34 3.81 3.19 3.18 3.20 Creditors' Turnover Ratio (x) 5.38 �� ��å� .69 4.69 4.58 4.53 Total Assets Turnover Ratio (x) 1.26 1.44 1.26 1.23 1.22 Net Fixed Assets Turnover Ratio (x) 4.80 6.71 6.54 6.40 6.33 Working Capital Turnover Ratio (x) 5.65 7.34 4.84 4.23 3.99 Capital/Equity Turnover Ratio (x) 2.53 3.38 3.08 2.80 2.69 Profitability Ratios: Gross Profit Margin (GPM) (%) 17.3 13.6 13.7 13.4 13.0 EBITDA Margin (%) 11.9 8.7 8.4 7.9 7.3 Operating Profit (EBIT) Margin (%) 6.7 4.8 4.6 4.0 3.3 Net Profit Margin (NPM) (%) 10.6 10.7 10.4 9.7 8.9 Return on Average Equity (ROAE) (%) 26.9 36.3 32.1 27.2 23.9 Return on Average Assets (ROAA) (%) 13.4 15.5 13.1 12.0 10.8 Leverage Ratios: Total Debt to Equity (D/E) Ratio (x) 0.12 0.17 0.12 0.11 0.10 Shareholders' Equity to Total Assets Ratio (x) 0.49 0.38 0.43 0.45 0.46 Total Liabilities to Total Assets Ratio (x) 0.48 0.60 0.55 0.53 0.52 Current Liabilities to Equity Ratio (x) 0.91 1.49 1.22 1.13 1.09 Growth Rates: % YoY Growth in Total Revenue 12.3 56.6 13.6 11.7 12.6 % YoY Growth in Operating Profit (EBIT) -6.6 11.2 8.8 -2.4 -6.0 % YoY Growth in EBITDA -1.5 13.7 10.4 5.1 3.9 % YoY Growth in Net Income 23.4 57.9 10.4 4.0 3.0 % YoY Growth in Total Assets 17.68 53.3 15.20 13.29 14.16 % YoY Growth in Shareholders' Equity 14.0 19.8 29.0 18.2 16.2 Valuation Ratios: EPS (BHD) 0.041 0.065 0.065 0.068 0.070 Adj. EPS (BHD) 0.041 0.065 0.065 0.068 0.070 BVPS (BHD) 0.163 0.196 0.229 0.271 0.315 Adj. BVPS (BHD) 0.163 0.196 0.229 0.271 0.315 Current Market Price (BHD) 0.101 0.101 0.101 0.101 0.101 P/E Ratio (x) 2.45 1.55 1.55 1.49 1.44 P/BV Ratio (x) 0.62 0.52 0.44 0.37 0.32

DISCLAIMER: All reasonable care has been taken to ensure that the information contained herein is not misleading or untrue at the time of publication, but we make no representation as to its accuracy or completeness. All information is for the private use of the person to whom it is provided without any liability whatsoever on the part of TAIB Securities WLL, any associated company or the employees thereof. Nothing contained herein should be construed as an offer to buy or sell or a solicitation of an offer to buy or sell. The value of any investment may fall as well as rise. Past performance is no guide to the future. The rate of exchange between currencies may cause the value of the investment to increase or diminish. Consequently, investors may not get back the full value of their original investment
Call us on +973 17549499 or email us at [email protected]