nasscom report on it adoption in the auto component industry
TRANSCRIPT

8/7/2019 NASSCOM Report on IT Adoption in the Auto Component Industry
http://slidepdf.com/reader/full/nasscom-report-on-it-adoption-in-the-auto-component-industry 1/54
IT Adoption in the
Indian Auto Component Industry

8/7/2019 NASSCOM Report on IT Adoption in the Auto Component Industry
http://slidepdf.com/reader/full/nasscom-report-on-it-adoption-in-the-auto-component-industry 2/54
IT Adoption in the
Indian Auto Component Industry
National Association of Software and Service Companies
International Youth Centre, Teen Murti Marg, Chanakyapuri, New Delhi-110 021, India
Phone: 91 11 2301 0199 Fax: 91 11 2301 5452 Email: [email protected]
Website: www.nasscom.in

8/7/2019 NASSCOM Report on IT Adoption in the Auto Component Industry
http://slidepdf.com/reader/full/nasscom-report-on-it-adoption-in-the-auto-component-industry 3/54
Copyright ©2007
National Association of Software and Service Companies
International Youth Centre, Teen Murti Marg, Chanakyapuri, New Delhi -110 021, India
Phone: 91 11 2301 0199 Fax: 91 11 2301 5452 E mail: [email protected]
First Print: December 2007
Published by
NASSCOM, New Delhi
Designed & Produced by
Creative Inc.
Phone: 91 11 4163 4469
Printed at
P. S. Press Services
Disclaimer
The information contained herein has been obtained from sources believed to be reliable. The
information contained in sections of the report reflects data that was derived from both public
and confidential information collected during the conduct of the study by NASSCOM. Readers
should note that NASSCOM has not independently verified all of the data and assumptions used
in these analyses. Each reader of this report should conduct their own independent evaluation
of the information provided herein. NASSCOM shall have no liability for errors, omissions or
inadequacies in the information contained herein or for interpretations thereof.
The material in this publication is copyrighted. No part of this can be reproduced either on paper
or electronic media without permission in writing from NASSCOM. Request for permission to
reproduce any part of the report may be sent to NASSCOM.

8/7/2019 NASSCOM Report on IT Adoption in the Auto Component Industry
http://slidepdf.com/reader/full/nasscom-report-on-it-adoption-in-the-auto-component-industry 4/54
Chapter 1: Introduction
The Indian Auto Component Industry .............................................................. 12
IT adoption in the Auto Component Industry ................................................... 14
Study objectives and methodology .................................................................. 15
Chapter 2: Business challenges and current state of IT adoption
Challenges faced by business heads .............................................................. 17
Challenges faced by IT heads ......................................................................... 20
Factors infl uencing IT adoption ....................................................................... 21
Measuring IT adoption effectiveness ............................................................... 22
Criticality of business processes ..................................................................... 23
IT adoption – implemented applications/systems ............................................ 27
IT budgets ........................................................................................................ 32
IT workforce and outsourcing .......................................................................... 33
Key features of IT adoption in auto component fi rms ...................................... 35
Chapter 3: Mapping supply chain strategies for
auto component fi rms
Linking capability levels to manufacturing practices ........................................ 37
Chapter 4: Evolving an IT strategy for different levels
Aligning IT strategy with manufacturing capabilities ........................................ 42
The MSC perspective ...................................................................................... 47
Chapter 5: Looking ahead
Call for action: Strategies for stakeholders ...................................................... 49
•
•
•
•
•
•
•
•
•
•
•
•
•
•
•
•
Table of Contents

8/7/2019 NASSCOM Report on IT Adoption in the Auto Component Industry
http://slidepdf.com/reader/full/nasscom-report-on-it-adoption-in-the-auto-component-industry 5/54
Foreword
4

8/7/2019 NASSCOM Report on IT Adoption in the Auto Component Industry
http://slidepdf.com/reader/full/nasscom-report-on-it-adoption-in-the-auto-component-industry 6/54
5

8/7/2019 NASSCOM Report on IT Adoption in the Auto Component Industry
http://slidepdf.com/reader/full/nasscom-report-on-it-adoption-in-the-auto-component-industry 7/54
6
Foreword
The Indian Auto Component Industry has been amongst the drivers of the renaissance inIndia’s manufacturing sector, and given its strong performance over the last few years, it is
rightfully considered a ‘sunrise’ sector of the Indian economy. Years of sustained efforts by the
auto component fi rms and a pro-active government policy framework have transformed a
relatively small and unsophisticated domestic industry into one with world-class manufacturing
practices and a global footprint.
With success come greater challenges and expectations. To sustain and accelerate the current
growth trajectory and develop new competitive advantages, the Indian auto component fi rms will
need to continuously strive to increase their effi ciency, quality and value proposition. In this, IT
will increasingly play a crucial role by helping the auto component fi rms achieve step changes
in productivity benchmarks through the entire range of manufacturing processes and in enabling
the fi rms to seamlessly integrate with their global and domestic customers and suppliers.
Unfortunately, IT penetration in Indian manufacturing, especially among the SME segment,
continues to lag behind comparator industries in other countries. In order to increase
IT penetration, it is vitally important to understand the IT adoption challenges faced by the
manufacturing industry fi rms and especially the SME segment. Developing this understanding
is crucial to ensure that IT investments by the fi rms are deployed where they can result in
the greatest impact on a fi rm’s competitiveness and help the fi rm to derive positive outcomes
from the IT investments.
It is with this aim that this study has been undertaken. This report seeks to bring an understanding
of IT adoption thresholds, challenges and processes in the different segments of the Indian
auto component sector. This has been utilised to develop IT adoption strategies based upon
the manufacturing capabilities of the different segments of the Auto Component Industry.
This will enable the auto component fi rms to align their IT investments with the business
objectives, while enabling the IT fi rms to develop solutions specifi c to the needs of the different
segments of the industry.
NASSCOM is deeply committed to the development of the domestic IT market, since a strong
and vibrant domestic market is crucial to the continued growth of the Indian IT industry.
We hope this report will stimulate useful discussions and more importantly, actions onhow individual fi rms in the auto component and IT industries, as well as other ecosystem
partners such as the government, industry bodies, academia and others, can together work
to accelerate the adoption of IT by the Indian Auto Component Industry so as to further
stimulate its growth.
Kiran Karnik
President, NASSCOM

8/7/2019 NASSCOM Report on IT Adoption in the Auto Component Industry
http://slidepdf.com/reader/full/nasscom-report-on-it-adoption-in-the-auto-component-industry 8/54
7
The Indian Automobile Component Industry has emerged as a sunrise sector of the Indianmanufacturing industry and a key stakeholder in the global automobile manufacturing industry.
While India’s share of the global auto components trade of US$ 185 billion (Rs 75,850 crores)
is only 0.4 percent currently, India is estimated to have the potential to become one of the top
fi ve auto component economies by 2025. By 2015, the global Auto Component Industry is
expected to source goods worth US$ 700 billion (Rs 2,870,000 crores) from low-cost countries
like India.
According to the Auto Component Manufacturers’ Association (ACMA), the Indian auto
component sector generated sales of about US$ 15 billion (Rs 61,500 crores) in fi scal year
2006-07, including US$ 2.8 billion (Rs 11,480 crores) worth of exports. The industry has
been experiencing a high growth rate of 20 per cent over the period 2000-05 and is expectedto grow at a CAGR of 17 per cent over the period 2006-14. Similarly, while growth rate of
exports has been 25 per cent during 2000-05, the exports are expected to grow by a CAGR of
34 per cent during 2006-14.
To sustain the current growth trajectory and face the increasing competition in the global and
domestic markets, the Indian auto component fi rms will have to create a new set of competitive
advantages based on value-capture rather than cost reduction. Achieving this will not be easy
and the Indian fi rms will have to focus on moving up the value curve and relentlessly increasing
fi rm level productivity through adoption of global manufacturing best practices. IT will be a key
enabler for the Indian auto component fi rms to achieve these aspirations.
An increase in IT adoption will provide the necessary productivity benefi ts only when the IT
investments are made in business processes which contribute to a fi rm’s competitiveness.
Thus, it is important to evaluate IT adoption at the level of business processes instead of at the
fi rm level. This understanding will fi rstly, help the automobile component fi rms to align their IT
investments with business objectives and secondly, help the IT fi rms to develop solutions which
are specifi c to the requirements of the Automobile Component Industry. The auto component
manufacturing sector in India has seen tremendous growth in recent years and therefore one
expects this sector to be ahead of others in IT adoption. An understanding of IT adoption
processes in this sector can also be useful in defi ning effective IT adoption strategies for this
as well as other sectors.
Current status of IT adoption in the Indian Auto Component Industry
Studies have shown that the adoption of information technologies can increase the performance
of fi rms. Despite these advantages, IT adoption among manufacturing fi rms in India is rather
low. The diversity in the Indian manufacturing sector is very high; apart from differences in fi rm
size, sector specifi c peculiarities can also play a role in the processes of IT adoption. While
policy initiatives to encourage adoption have been explored, it is equally important to understand
the process of IT adoption by fi rms along with the constraints faced by them.
Executive Summary

8/7/2019 NASSCOM Report on IT Adoption in the Auto Component Industry
http://slidepdf.com/reader/full/nasscom-report-on-it-adoption-in-the-auto-component-industry 9/54
8
The need of the auto component fi rms to integrate various functions and processes hasdriven them to invest in IT, and as a result, in fi rms that have implemented IT, there has been
a considerable increase in the productivity as well as revenues. However, very few fi rms have
aligned their IT investments with business objectives or adopted a clutch of applications to
maximise the potential of effi ciency gains and this obviously has an adverse effect on the
effi cacy of IT adoption.
The current study conducted by NASSCOM is based on an survey of 158 fi rms including
small, medium and large automobile component manufacturers across the key automobile
manufacturing clusters in Delhi, Mumbai, Chennai, Pune and Bangalore. Some key highlights
of the current IT adoption in the Indian Auto Component Industry, identifi ed through the survey
are as follows:• Different fi rms appear to be devising differing strategies for IT adoption and size of the
fi rm seems to be defi ning the trajectory that a fi rm will adopt for IT adoption. Firms are at
very different levels of IT implementation and the IT strategy of many fi rms is not based
on a judicious process improvement strategy.
• Supply Chain Management (SCM) has been ranked as the most critical challenge by
Business Unit (BU) heads. Some of the other challenges include fl uctuations in raw
material costs, meeting customer demands for product quality & timelines and procurement
of raw materials, reiterating the importance of the supply chain.
• The three most critical business processes identifi ed by the fi rms are:
Order receipt and demand managementProduction planning
Order processing
• Quick access to reliable business information is a key bottleneck as the auto component
fi rms possess disparate systems including manual paper based processes that lead to
disconnect amongst the supply chain constituents. This has two major impacts – fi rstly,
it impedes real-time decision making and secondly, it results in creation of ad-hoc sources
of information which further exacerbate the problem of availability of accurate data.
The survey reveals some variance in the criticality of business processes by fi rm size.
While for medium and large fi rms the three processes mentioned above remain the most
critical, for small fi rms, order processing is replaced by material handling.
• BU heads expect IT to play an important role in addressing their business challenges.
The key expectations of the BU heads from IT are meeting customer requirements
for timely delivery and product quality, tracking production costs and quick access to
business information.
• The IT heads have identifi ed the lack of alignment between business goals and IT
initiatives as a major challenge. The IT heads also fi nd it diffi cult to justify the current
levels of investments in any IT initiative, as the time for the complete deployment of the
initiative is quite long as compared to many other business function initiatives and the
impact of these IT initiatives and their effectiveness is also felt after a period of time.
1.2.
3.

8/7/2019 NASSCOM Report on IT Adoption in the Auto Component Industry
http://slidepdf.com/reader/full/nasscom-report-on-it-adoption-in-the-auto-component-industry 10/54
• The most common measure of IT effectiveness, amongst the auto componentmanufacturers is increased productivity. While the measure of increased productivity for
IT effectiveness is the most preferred one for both BU heads as well as IT heads of fi rms
of all sizes, it is not entirely clear how it is measured. Increased customer satisfaction, is
also a key measure for evaluating IT effectiveness by auto component manufacturers.
However, in many fi rms, none of the metrics that were mentioned are actually used to
measure the IT effectiveness.
• Broadly, large fi rms are ahead of small and medium fi rms in the adoption of all application
systems and Enterprise Resource Planning (ERP) is the most widely adopted IT application
among auto component fi rms. However, very few fi rms adopt a clutch of applications to
maximise the potential of effi ciency gains and this obviously has an adverse effect on
the effi cacy of IT adoption. In the adoption of networking and groupware systems also,
large fi rms are generally ahead of the small and medium fi rms.
• The fi rms are undertaking IT investments to integrate the fi rm’s production facilities with
the other constituents of the supply chain, so that real-time accurate information on the
inventory, production schedule and materials is available as and when required. In order
to have better access to business information, many auto component fi rms have deployed
intranets which are made available to all the relevant in-house business functions and
enable effective planning and scheduling.
• During the year 2005-06, a majority of the surveyed auto component manufacturers hadtheir annual IT budgets to the tune of Rs.20 lakhs. Hardware forms the major proportion
of the current IT investments. The annual IT budget is expected to increase for a
majority (~90%) of auto component manufacturers in the coming years.
• Hardware maintenance appears to be the most outsourced IT service by the auto
component fi rms. The outsourced activities related to hardware maintenance include
management and functioning of offi ce hardware such as PCs, laptops, etc. In a majority of
auto component manufacturing companies that participated in the survey, less than 10 full
time employees take care of the IT service and support function, across all locations. Most
fi rms on average have 1-5 servers, 50-199 workstations and 10-99 network nodes.
Aligning IT strategy with supply chain capabilities
Firms in the Auto Component Industry grow by producing more complex products that have
higher value add and the situation in India is no different especially with the changes in the
product technology. The Indian Auto Component Industry comprises fi rms ranging from tiny
and small producers to large fi rms who supply to both the OEM and replacement markets.
As a result, there is enormous diversity in the intent and strategies of the fi rms in the auto
component sector.
9

8/7/2019 NASSCOM Report on IT Adoption in the Auto Component Industry
http://slidepdf.com/reader/full/nasscom-report-on-it-adoption-in-the-auto-component-industry 11/54
10
What fi rms require is a good understanding of how they can compete by building distinctivecompetitive capabilities. While there is no one answer to building their capabilities through
adoption of world-class practices and IT, there is, however, a trajectory through which fi rms
could look to building capabilities and develop distinctive competitive stances. This trajectory
can be defi ned terms of various stages or Levels with each Level being defi ned by certain
operational characteristics.
• Level I fi rms are essentially producers that perform job work. Level I fi rms receive material
from their customers and they produce to the blueprint provided by them. Most often, these
fi rms are tiny to small in size and turnover, and produce exclusively for their customer
from a single facility. Very often, the process technology employed in these fi rms is old
and the equipment is second-hand and obsolete.• Level II fi rms are also Tier 3 suppliers and posses the same characteristics as Level I
fi rms except that they have more experience in contract manufacturing and have a higher
turnover as compared to their Level I counterparts.
• Level III fi rms are also often small in size but on the verge of entering medium scale.
While Level I & Level II fi rms may be performing machining operations, the Level III
manufacturers produce a part or whole of a component for the industry. Many of these
fi rms may not be dedicated to a single customer and produce similar components for
different customers. As a result, they need to develop systems for maintaining various
designs as well as capabilities to manufacture for varying customer requirements.
• Level IV fi rms are medium size fi rms with multiple plants and customers and are beginningto make the fi rst entry into global supply chains. These manufacturers produce to
order(s) as well as in anticipation of orders. These fi rms possess design capabilities and
are capable of modifying blueprints, which becomes a core competence for becoming
vendors for new customers. Since they supply to many customers, their manufacturing
facilities are amenable to cellular manufacturing layout with single piece fl ow that helps
them to reduce production lead times in a medium volume and medium to high product
variety environment.
• Level V fi rms are upper-medium or large fi rms and supply to the automobile OEMs as well
as in the replacement market and a large majority of these fi rms export and are part of
a global supply chain. They produce to fi rm orders as well as to stock, i.e. in anticipationof orders from customers. They supply many customers from multiple manufacturing
facilities located within the country and sometimes from manufacturing facilities located
outside the country.
The above categorisation of manufacturing capabilit ies defi nes the complexity of tasks that
an auto component fi rm may be able to perform and consequently indicates the nature of IT
solutions required. Low manufacturing capability fi rms are transaction oriented while those
with high capabilities will deploy sophisticated technologies and high-end decision making
tools. Most auto component fi rms (other than the Level V fi rms) are SMEs and are often low

8/7/2019 NASSCOM Report on IT Adoption in the Auto Component Industry
http://slidepdf.com/reader/full/nasscom-report-on-it-adoption-in-the-auto-component-industry 12/54
11
in capability. As one moves up the pyramid of capability, the number of fi rms in those higher categories of capabilities become small.
The IT strategy of auto component manufacturers at different Levels could be evolved from
these requirements appropriately. It would be effective to recognise that fi rms at different Levels
have varying needs and therefore it would be useful to design Level specifi c IT strategy.
The key to successful IT interventions lies in recognising that the Indian Auto Component Industry
comprises fi rms that are at different stages of industrial development. As a consequence, the
fi rms possess a heterogeneous mix of IT capabilities, ranging from low-tech with no or little
IT knowledge to very sophisticated, providing IT related services to its own fi rms and others.
The challenge is to design appropriate interventions for these different categories of fi rmswhich are both cost-effective and result oriented. This objective gets further complicated by
the fact that most fi rms in the auto component sector are tiny to small (and sometimes medium
enterprises) whose ability and sometimes desire to invest in building capabilities through IT
interventions is limited. In addition, strong IT systems are required to meet compliance and
regulatory requirements either from governments or customers.
Given that most auto component fi rms are tiny to small fi rms with low IT capabilities, and use
PCs and simple software products, the challenge for large IT fi rms is to devise a service model
that will generate revenues to cover its higher overheads while the challenge for small/mid
sized IT fi rms is to convince auto component fi rms that they can deliver solutions which create
strong capabilities in the auto component fi rms. Perhaps a hub and spoke model can becreated where large IT fi rms could be involved in setting up network platforms for collaboration
between large and small auto component fi rms while the ‘last mile connectivity’ required for
actual execution of IT implementation and after-sales service is done by small IT fi rms using
the large fi rm’s platforms, tools and design capabilities.
Looking ahead
The IT and Auto Component Industry must visualise themselves differently if they are to move
to another stage of industrial development and consequently competitiveness. The goal must
be to create a sector where IT is seen as integral to the competitiveness of the industry andnot as a service often provided by external sources.
Based on the current status of IT adoption in the Indian Auto Component Industry, fi rms may
not have followed the manufacturing capability – IT adoption trajectory and therefore may have
over or under invested in IT. For example, fi rms that did not require ERP may have invested
in ERP and so on. The IT and auto component fi rms will have to collaboratively think about
future IT investments in order to create an environment where IT becomes an integral part
of the manufacturing operation and becomes capable of delivering competitive advantage at
various levels.

8/7/2019 NASSCOM Report on IT Adoption in the Auto Component Industry
http://slidepdf.com/reader/full/nasscom-report-on-it-adoption-in-the-auto-component-industry 13/54
Chapter 1: Introduction
1 1 lakh = 0.1 million2 1 crore = 10 million3 Rs 41 = 1US$
12
1. The Indian Auto Component Industry
The automobile industry, one of the most dynamic constituents of India’s manufacturing
sector produces approximately 75 lakh1 vehicles per year with two-wheelers constituting more
than three-fourths of the total number of units. The turnover of the automobile industry is around
Rs 150,000 crores2 and has grown rapidly in recent years (2006-2007). With a total investment
of more than Rs 50,000 crores, the industry provides employment to about 1.3 crore people.
The industry contributes close to 20 per cent of indirect tax revenue and exports more than
Rs 10,000 crores. The automobile industry is a crucial sector for the overall Indian economy
due to its signifi cant linkages with the rest of the economy. Among the forward linkages, the
ones with insurance and oil industry are important. Linkages with components, rubber, steel,
plastics and electronics constitute signifi cant backward linkages. The industry has a largeinternational outsourcing potential, and investments to enhance the sector’s competitiveness
can go a long way in making this possible.
Riding this success, and capitalising on the spiralling demand of domestic automobile OEMs,
the Indian Automobile Components Industry has transformed into one of India’s fastest growing
manufacturing sectors, and is rapidly attaining global competitiveness. The sector comprises
fi rms that range from tiny (with a turnover of less than few lakh rupees) to large (with a turnover
above Rs 500 crores).
India’s competitive advantage in this sector does not come from costs alone, but from its capability
to manufacture the entire range of auto components, such as engine parts, drive, transmissionparts, suspension and braking parts, electrical parts, and body and chassis parts. India’s Top 500
Companies, published by Dun & Bradstreet in 2006, listed 22 auto component manufacturers
as top companies in India with a total turnover of US$ 3 billion (Rs 12,300 crores)3.
According to the Auto Component Manufacturers’ Association (ACMA), the Indian auto
component sector generated sales of about US$ 15 billion (Rs. 61,500 crores) in fi scal year
2006-07, including US$ 2.8 billion (Rs 11,480 crores) worth of exports. The industry has been
experiencing a high growth rate of over twenty per cent during the period 2000-05 and is
expected to grow at a CAGR of 17 per cent over the period 2006-14. Similarly, while growth
rate of exports has been 25 per cent during 2000-05, the exports are expected to grow by a
CAGR of 34 per cent during 2006-14.
While India’s share of the global auto components trade of US$ 185 billion (Rs 758,500 crores)
is only 0.4 per cent currently, India is estimated to have the potential to become one of the
top fi ve auto component economies by 2025. By 2015, the global Auto Component Industry is
potentially expected to source nearly US$ 700 billion (Rs 2,870,000 crores) worth of products
from low-cost countries like India.

8/7/2019 NASSCOM Report on IT Adoption in the Auto Component Industry
http://slidepdf.com/reader/full/nasscom-report-on-it-adoption-in-the-auto-component-industry 14/54
13
ACMA forecasts that industry sales will grow to US$ 40 billion (Rs 164,000 crores) by 2016with US$ 20 billion (Rs 82,000 crores) coming from exports. Around 70 per cent of the exports
are sourced by global majors such as General Motors, Ford Motor and DaimlerChrysler who
source critical components, with engine parts making up nearly a third of all exports. A break-
up of the constituency of the exports by the auto component sector is as follows:
• Engine parts (31 per cent)
• Drive transmission and steering parts (19 per cent)
• Body and chassis (12 per cent)
• Suspension and braking parts (12 per cent)
• Equipment (10 per cent)• Electrical parts (9 per cent)
• Others (7 per cent)
According to ACMA, more than a third (36 per cent) of Indian auto component exports head
for Europe, with North America featuring a close second at 26 per cent. The composition of
exports in terms of the proportion of Original Equipment Manufacturer (OEM) and aftermarket
has undergone a sweeping change since the past decade. The ratio of OEM to aftermarket
has changed from 35:65 in the 1990s to 75:25 in 2006.
The quality consciousness of the industry matches global standards now. This is corroborated
by the fact that nine Indian companies in the automotive sector have received the coveted
Deming Prize, which is the largest number outside Japan.
Recognising the potential of the Auto Component Industry, the Government of India has not
only provided an enabling policy framework but also invested substantially to provide state-of-
the-art infrastructure for the industry. Some of the key initiatives include the following:
• Automatic approval for foreign equity investment up to 100 per cent for the manufacture
of auto components.
• Manufacturing and imports in this sector is free from licensing and approvals.
• No local content regulation in the Auto Component Industry.
• A reduction in customs duty – maximum level of 7.5 per cent – on key metallic raw
materials and inputs for the Auto Component Industry.
• Reduction of peak rates of duty from 15 to 12.5 per cent.
• Finalisation of the Automotive Mission Plan (AMP) 2006-16 for making India a preferred
destination for design and manufacture of automobile and automotive components.
• Reduced excise duty on small cars to 16 per cent, a step which is intended to propel India
as a global manufacturing hub for small cars and directly enable the auto component
supplier industry to attain volumes.

8/7/2019 NASSCOM Report on IT Adoption in the Auto Component Industry
http://slidepdf.com/reader/full/nasscom-report-on-it-adoption-in-the-auto-component-industry 15/54
14
• Setting up of the National Automotive Testing and R&D Infrastructure Project (NATRIP)at a total cost of US$ 388.5 million for enabling the industry to usher in global standards
of vehicular safety, emission and performance standards.
• Setting up an automobile testing and homologation centre, International Centre for
Automotive Technology (iCAT), at an investment of US$ 15.23 million which would act
as an accredited agency to approve homologation standards for automobiles.
2. IT adoption in the Indian Auto Component Industry
Studies have shown that the adoption of IT based technologies can increase the performance
of fi rms. Despite these advantages, IT adoption among manufacturing fi rms in India is rather low. While policy initiatives to encourage adoption have been explored, it is equally important
to understand the process of IT adoption by fi rms along with the constraints faced by them.
The diversity in the Indian manufacturing sector is very high; apart from differences in fi rm size,
sector specifi c peculiarities can also play a role in the process of IT adoption. Given this huge
diversity, it is important that the right sub-segments are identifi ed for IT diffusion initiatives so
that they have appropriate demonstration and spill-over effects.
The auto component manufacturing sector in India has seen tremendous growth in recent years
and therefore one expects this sector to be ahead of others in IT adoption. An understanding
of IT adoption processes in this sector can be useful in defi ning adoption strategies for this aswell as other sectors. Given the linkages of the Auto Component Industry with other sectors
mentioned earlier in this chapter, faster growth of this sector can have signifi cant ripple effects
in the rest of the economy.
A large majority of the fi rms (over 85 per cent) in the Auto Component Industry are SMEs.
These fi rms serve both the OEM as well as replacement demands and work with a variety of
technologies in areas of machining, electronics, plastics & rubber moulding, welding, casting &
forging, etc. These SMEs also vary considerably in terms of their capabilities depending upon,
often, on the markets that they serve, i.e., exports or domestic and within domestic – national
or regional. Increasing IT penetration in the SME segment of the auto component sector is a
critical enabler for enhancing their competitiveness.
Detailed fi rm level interviews conducted during the study have highlighted that the key business
challenges faced by the auto component manufacturers relate to raw material availability
and their price fl uctuations, gaps in real-time availability of business information and lack of
smoothness in business processes. Once the fi rms develop smooth information channels,
it enables them to track costs as well as delays in the various functional processes of the
enterprise. The study also reveals that supply chain is one of the most critical components of
the auto component business and that it has to be integrated for the timely and orderly fl ow
of material as well as fi nished products.

8/7/2019 NASSCOM Report on IT Adoption in the Auto Component Industry
http://slidepdf.com/reader/full/nasscom-report-on-it-adoption-in-the-auto-component-industry 16/54
15
The need of organisations to integrate various functions and processes has driven themto implement ERP, SCM and other similar packages, and as a result, in fi rms that have
implemented IT, there has been a considerable increase in the productivity as well as revenues.
However, very few fi rms adopt a clutch of applications to maximise the potential of effi ciency
gains and this obviously has an adverse effect on the effi cacy of IT adoption. The current study
has also shown that while a large majority of the fi rms in the Auto Component Industry have
invested in IT, these fi rms are not convinced about the effectiveness of these IT investments.
While BU heads expect IT to be a key enabler for them to address their business challenge,
the IT heads believe that the IT investments are often not aligned with the business objectives
and given the long gestation period of IT investments, it becomes diffi cult for them to justify
the IT investments.
3. Study objectives and methodology
Given the qualitative insights discussed in the above section, the key objectives of the study
are to:
• Understand IT deployment and its usage patterns in the various segments of the auto
component fi rms
• Identify stages of IT adoption and relationship between IT adoption and decision domains
(or business processes) for performance improvements
• Evolve an IT adoption strategy for different tiers of the fi rms
This report seeks to address the following issues in order to achieve the above objectives:
• Understand the extent of IT adoption in the auto component sector
Identifi cation of sub-sectoral patterns of adoption within the industry
Postulation of the strategies currently followed by fi rms in adoption of IT
Identifi cation of characteristics of fi rms that adopt IT
Reasons for deployment
Areas of deployment
• Identifi cation of the drivers of IT adoption in the auto component sector
Factors that support adoption of IT
Reasons for non-deployment of IT
• Analysis of adoption within fi rms – region-wise
• Identifi cation of stages of IT implementation based on extent of adoption and its
effective utilisation
• Exploring relationship between adoption, business processes (or decision domains) and
performance of fi rms
• Develop a strategy for the future
1.
2.
3.
4.
5.
1.
2.
8/7/2019 NASSCOM Report on IT Adoption in the Auto Component Industry
http://slidepdf.com/reader/full/nasscom-report-on-it-adoption-in-the-auto-component-industry 17/54
16
Imperatives for growthImpediments and ways to overcome them
Linking IT fi rms’ strategies to manufacturing requirements
Future and challenges
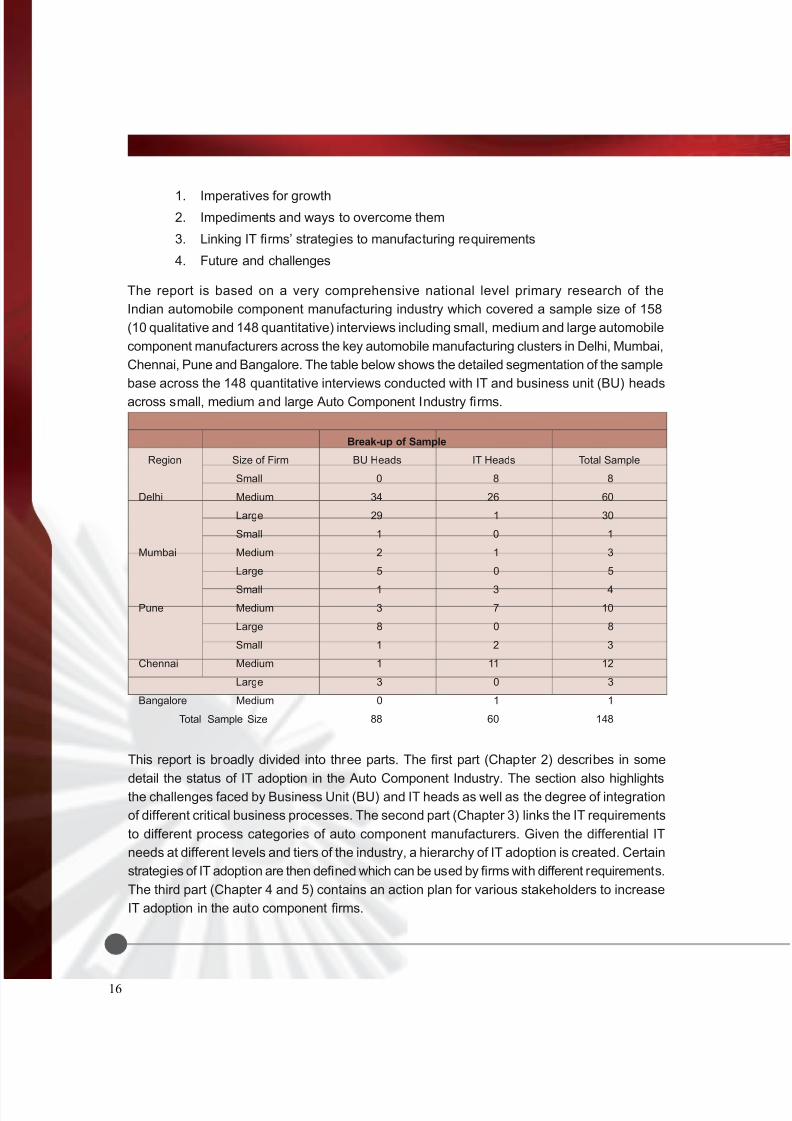
The report is based on a very comprehensive national level primary research of the
Indian automobile component manufacturing industry which covered a sample size of 158
(10 qualitative and 148 quantitative) interviews including small, medium and large automobile
component manufacturers across the key automobile manufacturing clusters in Delhi, Mumbai,
Chennai, Pune and Bangalore. The table below shows the detailed segmentation of the sample
base across the 148 quantitative interviews conducted with IT and business unit (BU) heads
across small, medium and large Auto Component Industry fi rms.
1.2.
3.
4.
Break-up of Sample
Region Size of Firm BU Heads IT Heads Total Sample
Delhi
Small 0 8 8
Medium 34 26 60
Large 29 1 30
Mumbai
Small 1 0 1
Medium 2 1 3
Large 5 0 5
Pune
Small 1 3 4
Medium 3 7 10
Large 8 0 8
Chennai
Small 1 2 3
Medium 1 11 12
Large 3 0 3
Bangalore Medium 0 1 1
Total Sample Size 88 60 148
This report is broadly divided into three parts. The fi rst part (Chapter 2) describes in some
detail the status of IT adoption in the Auto Component Industry. The section also highlights
the challenges faced by Business Unit (BU) and IT heads as well as the degree of integration
of different critical business processes. The second part (Chapter 3) links the IT requirements
to different process categories of auto component manufacturers. Given the differential IT
needs at different levels and tiers of the industry, a hierarchy of IT adoption is created. Certain
strategies of IT adoption are then defi ned which can be used by fi rms with different requirements.
The third part (Chapter 4 and 5) contains an action plan for various stakeholders to increase
IT adoption in the auto component fi rms.

8/7/2019 NASSCOM Report on IT Adoption in the Auto Component Industry
http://slidepdf.com/reader/full/nasscom-report-on-it-adoption-in-the-auto-component-industry 18/54
As mentioned in the previous chapter, a primary research of 148 auto component fi rms indifferent parts of the country was undertaken to collect information on their business challenges
and IT adoption. Of these, 46 fi rms were small (with a turnover between Rs 20-99 crores),
86 were of medium size (turnover in the range of Rs 100-299 crores) and 16 large (with
turnover between Rs 300-500 crores). In 88 fi rms, business heads were interviewed while in
the remaining 60, information was collected from IT heads. The discussion, in this section is
primarily based on the analysis of this dataset.
1. Challenges faced by business heads
Any investment decision in a fi rm is infl uenced by the challenges that the management faces
and IT related investments are no exception. Apart from maintaining price competitiveness and
meeting customer demand for product quality, availability and volatility in costs of raw material
seem to be the major challenges that business heads in Indian auto component fi rms face
(Figure 1). The cost of raw materials must be strictly controlled as it has a direct impact on the
overall cost of production and therefore competitiveness. Similarly, the procurement and the
timely availability of raw material also pose a concern for the surveyed fi rms as it affects their
ability to meet their customer’s demands within due dates. In addition, fi rms face problems
while responding quickly to the customer demands of consistent product quality within the
agreed delivery time.
Another important business challenge faced by the business heads is quick access to
business information. Apparently, the auto component manufacturers are faced with disparate
systems including manual paper based processes that lead to disconnect amongst the value
chain partners. This disjoint makes it diffi cult to develop and quickly share accurate business
information such as projection of demand and tracking the production schedule and the costs
associated with it.
Interestingly, the availability and the implementation of IT is not seen by the BU heads as a
critical business challenge. Similarly, resistance to the use of these technologies amongst theemployees of the company is also not a critical challenge.
Overall, some of the key components of Supply Chain Management (SCM) have been ranked
as the most critical challenge by business unit (BU) heads. These include fl uctuations in raw
material costs, meeting customer demands for product quality & timelines and procurement
of raw materials, reiterating the importance of the supply chain.
A key question is whether these challenges differ with fi rm characteristics? Table 1 below
provides some interesting insights. A few of these may be noted:
Chapter 2: Business challenges and
current state of IT adoption
17

8/7/2019 NASSCOM Report on IT Adoption in the Auto Component Industry
http://slidepdf.com/reader/full/nasscom-report-on-it-adoption-in-the-auto-component-industry 19/54
Figure 1: Challenges faced by Business Unit heads
18
Table 1: Average ranks of challenges faced by fi rms with different characteristics
Challenge Firm Size ForeignCollaboration Export
Small Medium Large Yes No Yes No
Meeting customer demand in product quality 6.44 7.03 6.33 6.14 6.89 6.25 7.92
Meeting customer demand in timeliness 6.20 7.53 4.00 6.32 6.86 6.06 8.50
Diffi culty in estimating demand 7.53 8.43 11.00 9.45 7.59 7.83 8.67
Quick/easy access to critical information 8.24 8.53 5.33 8.50 8.20 8.27 8.29
Maintaining price competitiveness 6.62 6.65 6.67 6.05 6.83 6.61 6.71
Fluctuations in raw material costs 5.27 6.18 7.67 5.68 5.79 6.03 5.04
Ease of procurement of raw material 8.71 8.80 9.00 8.95 8.70 8.86 8.50
Timely availability of raw material for production 8.22 8.73 7.33 7.95 8.58 8.63 7.88
Track/trace production timeliness across manufacturing cycle 7.91 8.75 6.67 8.23 8.26 8.05 8.79
Track/trace production costs across manufactur ing cycle 8.84 7.73 4.67 7.55 8.41 8.59 7.13
High attrition rates among employees 9.49 10.33 11.00 10.23 9.82 10.38 8.71
Training and development of employees 9.84 8.88 9.67 10.09 9.17 9.83 8.25
Availability of good IT technology for business 10.49 8.15 9.33 7.77 9.92 9.09 10.17
Implementing IT technology in business 10.62 9.80 12.67 10.23 10.35 10.13 10.83
Resistance to new IT technology among employees 11.00 9.93 10.00 10.95 10.32 10.45 10.54
Infrastructure bottlenecks 10.56 10.60 14.67 11.91 10.32 10.95 10.08

8/7/2019 NASSCOM Report on IT Adoption in the Auto Component Industry
http://slidepdf.com/reader/full/nasscom-report-on-it-adoption-in-the-auto-component-industry 20/54
• The main challenges faced by small and medium sized fi rms are similar-fl uctuationsin raw material costs, delivery of quality products in time and price competitiveness.
For large fi rms, while timeliness of delivery is the most important challenge, other
challenges include tracking of manufacturing costs and easy access to critical information.
The large fi rms seem to have reached a stage of IT adoption where signifi cant decisions
are taken on the basis of available real-time data, making quick access to information
and tracking of costs critical. The other important feature refl ected in Table 1 is that there
is more heterogeneity of challenges among SMEs than among large fi rms; the average
ranks of the most important (top 5) challenges show a much higher consistency of
responses among large fi rms than among SMEs. On average, non-availability of good
IT technology for business is felt more by medium fi rms, followed by large ones and theleast by small ones.
• Auto component fi rms with or without foreign collaboration face similar major (top 4-5)
challenges. But there are other interesting differences. Availability of good IT solutions
for business is more of a challenge for fi rms with foreign collaboration than for the ones
without it. Presumably, the former are looking for such technologies more actively. In a
similar vein, tracking production costs is more of a concern for collaborating fi rms, while
estimation of demand is more challenging for fi rms without foreign collaboration.
• Dealing with fl uctuations in raw material costs is the most important challenge for both
exporting and non-exporting fi rms but it is somewhat more critical for the latter. Timeliness
of delivery and product quality on average are more critical for exporting fi rms while
tracking production costs is more of an issue for non-exporting fi rms.
Given these business challenges, what do BU heads expect from IT?
Figure 2: Expectations of Business Unit heads from IT
19

8/7/2019 NASSCOM Report on IT Adoption in the Auto Component Industry
http://slidepdf.com/reader/full/nasscom-report-on-it-adoption-in-the-auto-component-industry 21/54
Figure 2 suggests that BU heads expect IT to play an important role in addressing most of their business challenges. The key expectations of the BU heads from IT are meeting customer
requirements for timely delivery and product quality, tracking production costs and quick
access to business information. Interestingly, several of these expectations are inter-linked.
For example, maintaining price competitiveness is an important expectation which can partly
be achieved by reducing production costs (or improving operational effi ciency), which in turn
requires tracking these costs and quick access to real-time business information.
2. Challenges faced by IT heads
The expectations of the BU heads in a fi rm will not be adequately met if the IT function of the
fi rm is not able to implement IT initiatives appropriately. But IT heads face their own challenges
in IT implementation. The survey responses (Figure 3) reveal that the most critical challenge
faced by the IT heads is the lack of alignment between business goals and IT initiatives.
At times, it also becomes diffi cult for the IT head to justify the current levels of investments
in any IT initiative, as the time for the complete deployment of the initiative is quite long
compared to many other business function initiatives. Besides, the impact of these IT initiatives
and their effectiveness is also felt after a period of time. Linked to this is the diffi culty faced
by the IT heads of proving the value of IT. While some IT spending lends itself to somewhat
Figure 3: Challenges faced by IT heads
20

8/7/2019 NASSCOM Report on IT Adoption in the Auto Component Industry
http://slidepdf.com/reader/full/nasscom-report-on-it-adoption-in-the-auto-component-industry 22/54
straightforward cost-benefi t analysis, most IT investments do not. Typically, new IT investmentssuch as implementation of supply chain management applications are made in conjunction with
non-IT investments, such as new process design and training. The combined inputs of the
two create measurable value, but allocation of value created by the two types of investment is
virtually impossible. Studies have shown that in order to maximise the impact of IT investment,
it needs to be combined effectively with other elements of the business architecture including
organisational change, ability of managers to use the knowledge made available through IT
and the functional knowledge of business among IT related employees.
3. Factors infl uencing IT adoption
In a situation where the impact of IT investments cannot be easily seen, what factors infl uence
IT adoption by the auto component manufacturers and how is the effectiveness of such
investments measured? Evidently, the need of having better control over the inventory is the
most important reason to implement IT systems in a fi rm (Figure 4). This is followed by the
need to improve business process fl ows and increase operational effi ciency in the processes
because streamlined business process fl ows improve delivery time and reduce bottlenecks.
These processes may be internal (manufacturing or operational) or external (processes related
to suppliers and customers). This business process integration can be achieved by a variety
of technology solutions, some of which can be partial while others can be comprehensive and
integrated. The impact would actually depend on the nature of solutions used. This issue isdiscussed later in the report.
Figure 4: Factors infl uencing IT adoption
21

8/7/2019 NASSCOM Report on IT Adoption in the Auto Component Industry
http://slidepdf.com/reader/full/nasscom-report-on-it-adoption-in-the-auto-component-industry 23/54
4. Measuring IT adoption effectiveness
The most common measure of IT effectiveness, amongst the auto component manufacturers
is increased productivity (Figures 5a and 5b). While the measure of increased productivity for
IT effectiveness is the most preferred choice for both BU heads as well as IT heads of fi rms
of all sizes, it is not entirely clear as to how it is measured. It may be recalled that one of the
key expectations of business heads from IT is to meet the customer requirements of product
quality and timelines. This results in increased customer satisfaction, which is also a key
measure for evaluating IT effectiveness by auto component manufacturers.
Interestingly, in many fi rms, none of the measures that were mentioned are actually used to
fi nd out the IT effectiveness. The primary reason probably is that there are many IT related
investments for which a cost-benefi t analysis is not possible. Similarly, calculating the
value of ongoing IT operations spending on hardware, system and software is even more
diffi cult, because the discrete investments made in IT become a part of the broader business
environment after a period of time.
Figure 5a: Measuring IT effectiveness by size of fi rm
22

8/7/2019 NASSCOM Report on IT Adoption in the Auto Component Industry
http://slidepdf.com/reader/full/nasscom-report-on-it-adoption-in-the-auto-component-industry 24/54
5. Criticality of business processesAnother way to approach issues of IT adoption in a fi rm is to identify processes that are
critical to the fi rm and then ascertain how IT can enhance the effi ciency of these processes.
Figure 6 illustrates some of the most critical business processes identifi ed by the auto
component manufacturers. The top three critical processes are:
Order receipt and demand management
Production planning and scheduling
Order processing
The survey reveals some variance in the criticality of business processes by fi rm size. While
for medium and large fi rms, the three processes mentioned above remain the most critical,
for small fi rms, order processing is replaced by material handling (Figure 7). Interestingly, the
three least critical processes for small and medium fi rms are the same – invoice generation/
payment collection, traceability compliance requirements and bank reconciliation. For large
fi rms, however, bank reconciliation is the only process that is least critical alongwith customer
service management and HR & payroll systems. Most of these fi rms have already gone through
their IT implementation for these processes and hence don’t fi nd it very critical at this juncture.
The survey provides some interesting insights on how smoothly do these critical processes
work in the auto component fi rms.
1.
2.
3.
Figure 5b: Measuring IT effectiveness by BU and IT heads
23

8/7/2019 NASSCOM Report on IT Adoption in the Auto Component Industry
http://slidepdf.com/reader/full/nasscom-report-on-it-adoption-in-the-auto-component-industry 25/54
Figure 6: Critical business processes across fi rms
Figure 7: Criticality of processes by size of fi rm
24

8/7/2019 NASSCOM Report on IT Adoption in the Auto Component Industry
http://slidepdf.com/reader/full/nasscom-report-on-it-adoption-in-the-auto-component-industry 26/54
Table 2: Smoothness of critical business processes
ProcessPercentage of fi rms reporting level of smoothness
High Medium Average Low Poor
A. Order receipt and Demand management
Capturing orders in least time 26 53 14 5 2
Ensure and manage supply terms with customers 34 36 25 3 1
Analyse impact of demand variation and take
decision in the interest of supply chain 17 45 26 10 1
B. Order processing and production planning
Recording, sorting and prioritisation of orders 49 25 19 6 1
Processing orders with respect to checks and constraints 28 41 22 7 2
C. Material scheduling
Plan for material requirements at various levels effi ciently
fl oor using Kanban24 42 26 8 0
Material scheduling including WIP etc. in the shop 22 39 26 8 5
Vendor relationship and purchase terms 22 42 26 8 5
Manage sub-contracting 31 38 25 6 0
D. Accounting
Track profi t margins to take pre-emptive corrective action 22 38 17 16 7
Real-time visibility into actual vs. real budget to take
corrective action11 35 30 14 9
Annual 3-months rolling plan to manage
budgeting against actual13 45 25 11 5
Sample: Business Heads - 88
Order receipt and Demand management
This process combines receiving the orders, providing a timeline for the delivery of the fi nished
products and the projection of the demand, a majority of auto component manufacturers have
extremely smooth processes for receiving orders (Table 2). This is achieved without manual
intervention, by the use of IT as in most of the companies, this process is fully or partially IT
enabled (Table 3). The auto component manufacturers are also able to effectively manage the
supply terms with the customers as the system accepts orders through the extranet, reducing the
time taken to receive the orders considerably. However, the ability of the companies to project
and analyse the impact of demand variation and to manage the supply chain accordingly is not
smooth enough (Table 2). Similarly, the validation of orders in auto component manufacturers
is also not IT enabled in a signifi cant proportion of the fi rms.
25

8/7/2019 NASSCOM Report on IT Adoption in the Auto Component Industry
http://slidepdf.com/reader/full/nasscom-report-on-it-adoption-in-the-auto-component-industry 27/54
Table 3: IT enablement of critical business processes
Process Percentage of Firms
FullyEnabled
PartiallyEnabled
Not ITEnabled
A. Order receipt and Demand management
System to accept orders from OEMs(without manual intervention) through extranet
20 69 11
Automatic validation of orders 29 43 29
B. Order processing
Ability to confi rm orders online 24 62 14
Seamless integration with production planning,scheduling and order receipt
28 55 17
Capability of information exchange withOEMs in case of order processing variation
17 69 14
C. Production planning and scheduling
Production plan visibility to self and OEM at various horizons 24 64 12
Day-wise, shop/job-wise scheduling for shorter horizons 27 61 12
Monitoring system for execution w.r.t. plan,manage changes and measure variances from plan
24 58 18
D. Material scheduling
Well defi ned error-free bill of material (BOM) structures 43 48 10
Vendor wise specifi c material requirements 33 57 10
Established electronic links with suppliers 29 43 29
Capability to share requirements with OEMsfor collective buying/electronic auctions
29 43 29
E. Accounting
Budgeting and variance monitoring system 29 67 4
Ability to carry out accounting based on theoperational system from other related systems
42 42 17
Ability to generate fi nancial systems online (B/S, P&L) 29 63 8
Sample: IT Heads – 60
26
Order processing
The auto component manufacturers prioritise orders and schedule production based upon the
fi rm’s shop fl oor capacity and customer delivery dates. A majority of auto component fi rms
have smooth processes related to order processing, wherein orders are effi ciently recorded,
sorted and prioritised (Table 2). These processes consume less time because of IT enablement
as the orders are received and confi rmed online in most organisations (Table 3). Once the

8/7/2019 NASSCOM Report on IT Adoption in the Auto Component Industry
http://slidepdf.com/reader/full/nasscom-report-on-it-adoption-in-the-auto-component-industry 28/54
orders are received, they are checked against the constraints related to production, as theorder processing system is integrated with the production planning and scheduling facility
through IT in most fi rms (Table 3). The ability to evaluate and check the orders and to provide
a feedback to the OEMs, especially in case of any changes in the plan, is IT enabled (at least
partially) in a large majority of fi rms.
Production planning and scheduling
As indicated earlier, production planning is one of the most critical processes for the auto
component manufacturers. Earning and retaining the business of a larger number of customers
underscores the need for suppliers to effectively manage the production schedules to reduce
delays in delivery to the customers. Additionally, suppliers must be able to manage a regular
fl ow of changes to production schedules and quantities by having a robust production
planning system. Through IT adoption, a majority of auto component manufacturers make
the production plan visible at various horizons internally as well as to the customer. Similarly,
day-wise shop / job-wise scheduling for shorter horizons are also IT enabled by most of the
auto component manufacturers (Table 3).
Overall, while IT enablement of critical processes has resulted in smoothening of these
processes, the fact remains that a large proportion of fi rms have not yet achieved full
IT enablement. In fact, for several processes like automatic validation of orders, electroniclinkages with suppliers, etc. more than 25 per cent fi rms do not have any IT support. There is
tremendous scope, for the auto component manufacturing fi rms to increase IT adoption.
6. IT adoption – implemented applications/systems
Enterprise Resource Planning (ERP) is the most widely adopted IT application among auto
component fi rms. Some effort is also being undertaken to integrate the fi rm’s production
facilities with the other constituents of the supply chain, so that real-time accurate information
on the inventory, production schedule and materials is available as and when required. In order
to have better access to business information, many auto component fi rms have deployed
intranets which are made available to all the relevant in-house business functions and enable
effective planning and scheduling. A signifi cant proportion of fi rms that were surveyed have also
implemented wireless LANs to achieve this, whereas large organisations have also deployed
Virtual Private Networks (Figures 8-10). Broadly, large fi rms are ahead of small and medium
fi rms in the adoption of all application systems except Customer Relationship Management
(CRM) and Sales Force Automation (SFA) where adoption rates are similar. In the adoption
of networking and groupware systems also, large fi rms are generally ahead of the small and
medium fi rms.
27

8/7/2019 NASSCOM Report on IT Adoption in the Auto Component Industry
http://slidepdf.com/reader/full/nasscom-report-on-it-adoption-in-the-auto-component-industry 29/54
Figure 8: Adoption of IT applications/systems
Figure 9: Adoption of IT applications/systems by fi rm size
28

8/7/2019 NASSCOM Report on IT Adoption in the Auto Component Industry
http://slidepdf.com/reader/full/nasscom-report-on-it-adoption-in-the-auto-component-industry 30/54
One interesting insight that emerges from a more detailed analysis of the IT adoption data
is that very few fi rms adopt a clutch of applications to maximise the potential of effi ciency
gains. As shown in Table 4, only about 34 per cent fi rms having ERP also adopt SCM and the
proportion of ERP based fi rms adopting CRM is even lower (30 per cent). Similarly, Table 5
shows that only about 28 per cent ERP adopters integrate plants to the head offi ce. In fact,
only about 3 per cent fi rms combine CRM, SCM and IT enabled integration of plant systems
with ERP. This obviously has an adverse effect on the effi cacy of IT adoption. It also shows
that the surveyed sample comprises fi rms that are at very different levels of implementation
of IT and that the IT strategy of many fi rms is not based on a judicious process improvement
strategy. For instance, implementing a SCM module without integrating the manufacturing
facilities to the fi rm’s headquarter or with suppliers would not yield commensurate returns
on investment in an SCM application package, except in the exceptional situation of single
plant/supplier fi rms.
Figure 10: Adoption of IT infrastructure by size
29

8/7/2019 NASSCOM Report on IT Adoption in the Auto Component Industry
http://slidepdf.com/reader/full/nasscom-report-on-it-adoption-in-the-auto-component-industry 31/54
Table 4: Percentage of fi rms adopting different applications and networking systems
ERP SCM CRM SFA EL IT BWIDTH LANS VPNS SAN/NAS
INTRANET GPWARE
ERP (47) 100.0 34.0 29.8 8.5 31.9 27.7 31.9 40.4 12.8 87.2 44.7 23.4
SCM (24) 66.7 100.0 41.7 25.0 29.2 29.2 45.8 45.8 16.7 75.0 41.7 29.2
CRM (19) 73.7 126.3 100.0 26.3 52.6 36.8 47.4 52.6 15.8 68.4 68.4 31.6
SFA (10) 40.0 60.0 50.0 100.0 40.0 30.0 40.0 50.0 10.0 70.0 70.0 20.0
EL (22) 68.2 31.8 45.5 18.2 100.0 45.5 50.0 54.6 13.6 81.8 59.1 36.4
IT (22) 59.1 31.8 31.8 13.6 45.5 100.0 40.9 40.9 18.2 81.8 40.9 22.7
BWIDTH (26) 57.7 42.3 34.6 15.4 42.3 34.6 100.0 46.2 15.4 73.1 53.9 34.6
LANS (30) 63.3 36.7 33.3 16.7 40.0 30.0 40.0 100.0 16.7 83.3 60.0 36.7
VPNS (8) 75.0 50.0 37.5 12.5 37.5 50.0 50.0 62.5 100.0 50.0 62.5 50.0
SAN/NAS (76) 53.9 23.7 17.1 9.2 23.7 23.7 25.00 32.9 5.3 100.0 31.6 14.5
INTRANET (55) 38.2 18.2 23.6 12.7 23.6 16.4 25.5 32.7 9.1 43.6 100.0 21.8
GPWARE (15) 73.3 46.7 40.0 13.3 53.3 33.3 60.0 73.3 26.7 73.3 80.0 100.0
ERP – Enterprise Resource Planning; SCM – Supply Chain Management; CRM – Customer Relationship Management;SFA – Sales Force Automation; EL – Electronic Linkages with customers & suppliers; IT – Integrating plants/factoriesIT systems to the corporate office IT systems on the internet; BWIDTH – Bandwidth up-gradation for data networking;LANS – Implementing wireless LANs; VPN – Deploying Virtual Private Networks; SAN/NAS – Enhancing/adding network storagecapabilities; INTRANET – Intranet deployment and expansion; GPWARE – Deploying and expanding groupware/workfl ow applications(lotus notes, project management)
30
Table 5: Combinations of selected applications adopted by sample fi rms – mutually exclusive cases
Combinations of select applications adopted Frequency %
ERP, SCM, CRM and IT (Integration of plants to HO) 3 3.4
ERP, SCM, CRM but not IT (Integration of plants to HO) 5 5.7
ERP, SCM and IT but no CRM 1 1.1
ERP, CRM and IT but no SCM 1 1.1
SCM, CRM and IT but no ERP 1 1.1
ERP and SCM but not CRM and IT 7 8.0
ERP and IT but not SCM and CRM 8 9.1
CRM and IT but not ERP and SCM 2 2.3
ERP and CRM but not SCM and IT 5 5.7SCM and IT but not ERP and CRM 2 2.3
SCM and CRM but not ERP and IT 1 1.1
Only ERP 17 19.3
Only SCM 4 4.5
Only CRM 1 1.1
Only IT 4 4.5
None of ERP, SCM, CRM, and IT 26 29.5
Total 88 100.0

8/7/2019 NASSCOM Report on IT Adoption in the Auto Component Industry
http://slidepdf.com/reader/full/nasscom-report-on-it-adoption-in-the-auto-component-industry 32/54
Figure 11: Future investment plans for enterprise application systems
Will the future IT adoption plans help auto component fi rms reap synergies across variousIT applications? Including the investment plans of the next one to two years, a large majority
of fi rms would like to implement ERP and SCM packages and would like to integrate plants
with the head offi ce through IT enabled systems (Figure 11). Evidently, adoption of these three
applications is a priority for the companies which have not yet implemented them. CRM and
SCM implementation may only pick up in the next fi ve years. This is particularly true for CRM.
Figure 12 summarises the main highlights of IT related investment plans for both applications
and networking systems for fi rms of different sizes. Upgrading groupware, CRM and upgrading
bandwidth are on top of the priority list. These investments may eventually result in some
synergies being reaped.
31

8/7/2019 NASSCOM Report on IT Adoption in the Auto Component Industry
http://slidepdf.com/reader/full/nasscom-report-on-it-adoption-in-the-auto-component-industry 33/54
Figure 12: A perspective for future plans by size of company for IT adoption
32
7. IT budgets
During the year 2005-06, a majority of auto component manufacturers that were surveyed had
their annual IT budgets to the tune of Rs 20 lakhs. Hardware maintenance forms the major
proportion of the current IT investments for the auto component manufacturers (Figure 13). This
component includes the expansion of intranet to integrate the various in-house functions for
increasing effi ciency, as well as the upgradation of bandwidth for data networking to increase
the sharing of real-time business information between the auto component manufacturers, their
suppliers as well as customers. Signifi cant investments were made by the auto component
manufacturers, related to the purchase of new hardware.
The investments made by the auto component manufacturers in terms of software include
purchase of new software/applications as well as the software maintenance cost. As noted
earlier, software application packages such as ERP and SCM have been implemented by
a signifi cant proportion of auto component manufacturers (perhaps the larger ones in the
surveyed sample). The solution cost for these software packages includes the license cost,
maintenance and up gradation cost as well as the cost of training and consulting.

8/7/2019 NASSCOM Report on IT Adoption in the Auto Component Industry
http://slidepdf.com/reader/full/nasscom-report-on-it-adoption-in-the-auto-component-industry 34/54
Figure 13: Annual IT budget
33
The annual IT budget is expected to increase for a majority (90 per cent) of auto component
manufacturers in the coming year. The signifi cant contributors to this increase are expected
to be:
Branded hardware
Vertical specifi c applications
Upgradation of the networking facilities such as wireless LANs, bandwidth for data
networking as well as implementation of Virtual Private Networks (VPN)
Implementation and upgradation of enterprise application software packages such
as SCM and CRM
8. IT workforce and outsourcing
In a majority of auto component manufacturing companies that participated in the survey, less
than 10 full time employees take care of the IT service and support function, across all locations.
(In Figure 14, the numbers indicate total number of full time employees across all locations).
The distribution of fi rms by number of servers, workstation and nodes is provided in Figure 15.
Most fi rms on average have 1-5 servers, 50-199 workstations and 10-99 network nodes.
1.
2.
3.
4.

8/7/2019 NASSCOM Report on IT Adoption in the Auto Component Industry
http://slidepdf.com/reader/full/nasscom-report-on-it-adoption-in-the-auto-component-industry 35/54
34
Figure 14: Full-time employees across locations handling IT service and support
Figure 15: IT infrastructure in auto component fi rms
Outsourcing offers a wide range of potential advantages. Many auto component fi rms have
implemented or are considering outsourcing various functions within IT. Outsourcing can provide
companies cost savings for transactional work, particularly if sourced to lower-cost vendors.
It can improve effectiveness as outsourcing companies have talent, methods and content that
can be leveraged. As illustrated by Figure 16, hardware maintenance appears to be the most
outsourced IT service by the auto component fi rms.

8/7/2019 NASSCOM Report on IT Adoption in the Auto Component Industry
http://slidepdf.com/reader/full/nasscom-report-on-it-adoption-in-the-auto-component-industry 36/54
35
Figure 16: Outsourcing of IT services by auto component fi rms
The outsourced activities related to hardware maintenance include management and functioning
of offi ce hardware such as PCs, laptops, etc. Another important IT service outsourced by the
auto component manufacturers is software maintenance. This includes the implementation and
up gradation costs of the software packages such as the enterprise application systems like
ERP, SCM and CRM. These services are being outsourced to external vendors, who study the
internal processes, implement software modules as per the requirement, train the employees
and also upgrade the software whenever needed.
9. Key features of IT adoption in auto component fi rms
Raw material price fl uctuations and maintaining price competitiveness fi gure as major
challenges for BU heads in auto component fi rms. IT heads do not seem to perceive their
function as an integral part of organisation goals and fi nd it diffi cult to prove the value of IT
in their companies. Despite this perception, BU heads do expect IT to be a strong enabler
to meet changing customer requirements, track production costs and gain access to critical
business information for better decision making.
While the larger companies are more positively disposed towards IT solutions (constant
upgradation, branded IT solutions, etc), the small ones are trying to get their basic
IT infrastructure in place.

8/7/2019 NASSCOM Report on IT Adoption in the Auto Component Industry
http://slidepdf.com/reader/full/nasscom-report-on-it-adoption-in-the-auto-component-industry 37/54
36
The responses of the survey suggest that key driver to increase IT adoption is streamlining of processes. The top fi ve key business processes are as follows:
Order receipt and demand management
Production planning
Order processing
Material scheduling
Accounting
While the basic procedures with respect to order receipts and processing seem to be running
smoothly, a need is felt by the BU heads for real-time visibility of certain key information. ERP
systems have either been implemented or are on the short-term IT investment horizon of mostfi rms. The need for real-time data capture, applications that cater to shop fl oor operations and
those having a greater focus the key business processes defi ned above have driven the advent
of PLCs, shop fl oor automation applications and Manufacturing Execution Systems (MES).
As fi rms expand their IT application portfolio and move to an automated real-time information
system, these are likely to gain in popularity.
Most fi rms seem to have planned their IT deployment only in the short run. There are very
few companies with a concrete long-term plan for IT deployment. Outsourcing is a familiar
option as a majority of auto component manufacturers have outsourced IT functions such as
hardware maintenance and software maintenance.
The fi ndings of this survey reveal that different fi rms appear to be devising differing strategies
for IT adoption and size of the fi rm seems to be defi ning the trajectory that a fi rm will adopt
for IT adoption. The next section of the report characterises these different types of fi rms in
the auto component manufacturing sector and maps the supply chain decisions (including the
manufacturing and distribution processes) they seem to be facing. Once the fi rms understand
these key manufacturing processes, they could design their strategy appropriately to add value
through IT investments.
1.
2.
3.
4.
5.

8/7/2019 NASSCOM Report on IT Adoption in the Auto Component Industry
http://slidepdf.com/reader/full/nasscom-report-on-it-adoption-in-the-auto-component-industry 38/54
37
Chapter 3: Mapping supply chain strategies
for auto component fi rms
The auto component manufacturers in India come in a variety of sizes – mostly micro, small andmid-size and a few large ones. While the micro and small fi rms may be struggling to get their
products in the replacement markets, the large fi rms are looking towards developing products
for the automobile OEMs. Therefore their capabilities and complexities vary considerably.
This section describes the linkage between various capability stages at which these differently
sized fi rms are and the nature of managerial practices they require to succeed. The next section
of the report outlines the IT strategy required to support implementation of these manufacturing
practices in the different types of auto component fi rms.
1. Linking capability levels to manufacturing practices
Firms in the Auto Component Industry, globally, grow by producing more complex products
that have higher value add. The situation in India is no different, especially with the changes in
the product technology. However, the auto component supply chain comprises tiny and small
producers that supply both to the suppliers of OEMs as well as in the replacement market.
As a result, there is enormous diversity in the intent and strategies of the fi rms in the auto
component sector. While operational excellence is acknowledged as the key requirement
for winning orders, the state of fi rms on this dimension varies tremendously. Often, bigger
fi rms compete on their supplier ’s ability to generate low-cost operation through low wages to
low skilled operators, less robust equipment, evasion of cost of utilities, etc. and not through
effective manufacturing. This, however, turns out to be a temporal advantage that takes the
focus away from operations to clever accounting practices.
What fi rms require is a good understanding of how they can compete by building distinct
competitive capabilities. There is no one answer to building their capabilities through adoption
of world-class practices and IT. However there is a trajectory through which fi rms in this sector
could look to building capabilities and develop distinct competitive stances. This trajectory
can be defi ned in terms of various stages or Levels with each Level being defi ned by certain
operational characteristics. The competitiveness of a fi rm, at an operational Level, is a function
of the following:
Operational characteristics of the Level to which the fi rms belong
Nature of managerial practices that the fi rms have implemented
Extent of adoption of IT to support the improvements in decision making
Table 6 describes how fi rms at different Levels of the supply chain can build up their
manufacturing effectiveness.
1.
2.
3.

8/7/2019 NASSCOM Report on IT Adoption in the Auto Component Industry
http://slidepdf.com/reader/full/nasscom-report-on-it-adoption-in-the-auto-component-industry 39/54
38
Manufacturer Category Manufacturer Characteristics
ManufacturingManagement
Distribution Process
Level I(Tier 3 Supplier)
• Order processed by thehigher tier
• Production planning bythe customer
• Blueprint provided bythe customer
• Dedicated supplier • Single plant
• Housekeeping – 5S• Quality inspection –
100% OK plant dispatch• Traceability of materials/
orders to batches
• Pick-up by the customer • Local delivery
Level Ii(Tier 3 Supplier)
• Order processed by thehigher tier
• Production planning bythe customer
• Blueprint provided by
the customer • Dedicated supplier • Single plant
• Process analysis for capacity evaluation
• Establish time standards(industrial engineering)
• Establish process
capabilities• Preventive maintenance
• Pick-up by the customer • Local delivery
Level III(Tier 2 Supplier)
• Order processed by thehigher tier
• Production planning bycustomers
• Blueprint provided bythe customer
• Dedicated capacity for several customers
• Single plant
• ISO certifi cation• Value engineering• Quality control• WIP control• Standard containers,
poke yoke• Design support• Costing• Supervisor training
• Pick-up by the customer • Local delivery
Level IV(Tier 2 Supplier)
• Order processing &production planning by
the manufacturer • Forecasting orders• Modifi cation to
blueprints• Multiple customers• Multiple plants• Global delivery
• Cellular layout• Single piece fl ow
• Multiple machineoperators• Statistical process
control• Total productive
maintenance (initiation)• Environment quality• Design department
– multiple requirements,design modifi cations &CAD drawings
• Operator training
• Delivery to customer locations
• National vendors• Require inventorymanagement
Level V(Tier 1 Supplier)
• Order processing &production planning bythe manufacturer
• Forecasting orders• Own designs &
blueprints• Multiple customers• Multiple plants• JIT or pull delivery• Part of global supply
chains
• Total productivemaintenance
• Lean manufacturing• JIT or pull production• Quick response• Environment quality
– QS• Strong design
department – libraryor designs, proprietarydesigns, IPR on designs,prototype laboratory,CAD/CAM systems
• Extensive operator training
• National supply chain• JIT delivery• Need to manage national
warehouses• Logistics function• OEM & replacement
markets• Warranty & product
recall systems• Strong supply chain
coordination
Table 6: Map of the manufacturing & distribution processes for different categories of auto component fi rms

8/7/2019 NASSCOM Report on IT Adoption in the Auto Component Industry
http://slidepdf.com/reader/full/nasscom-report-on-it-adoption-in-the-auto-component-industry 40/54
39
There are two categories of Tier-3 suppliers differentiated by the extent of shop fl oor interventionthat they may have undertaken to improve their processes. Firms at Level I represent one
category of Tier-3 suppliers – essentially producers that perform job work. Level I fi rms receive
material from their customers (typically, Tier-2 suppliers) and they produce to the blueprint
provided by them. Most often, these are tiny to small in size and turnover and produce
exclusively for their customer from a single facility. The operators in these fi rms are often
migrant workers who have experience in farms to which they return during cropping seasons.
These types of producers require housekeeping skills for managing Work-in-Progress (WIP)
or fi nished products, raw material as well as toolings on the shop fl oor. Good inspection and
re-work capabilities help them maintain a high dispatch quality to their customers. Very often,
the process technology employed in these fi rms is old and the equipment is second hand and
obsolete. The customers deliver the raw material to the manufacturing premises of these fi rms.
The fi nished products are either picked up by the customers or the fi rms deliver the fi nished
products to the customer locally.
Level II fi rms are also Tier-3 suppliers and possess the same characteristics as Level I fi rms
except that they have more experience in contract manufacturing and are slightly larger in
turnover as compared to their Level I counterparts. The Level II fi rms also typically perform
some key operations hence may often be the sole supplier for their customer. Consequently, the
customer has a need to control their (i.e., Level II fi rm’s) operations more tightly both in terms
of quality and costs as compared to the Level I fi rms. Therefore, performing process capability
studies on the manufacturing machines of Level II is crucial to control quality. The Level II
fi rms struggle to establish time standards which become essential to estimate capacity and
plan for production. These fi rms tend to expand slowly with similar kinds of technologies and
look for preventive maintenance to maintain the health of their equipment in order to increase
the equipments availability for their customers. Since these fi rms might be the sole suppliers
to their customers, the uptime of machines plays an important role in their customer’s ability
to meet their delivery schedules. The Level II fi rms are also increasingly being asked by their
customers to keep records of their production batches and be able to trace the raw material
and intermediate products used in specifi c production batches that make up an order.
Level III auto component fi rms are essentially Tier-2 suppliers in the automotive component
supply chain. While the Tier-3 supplier may be performing machining operations, the
Level III manufacturers produce a part or whole of a component for the industry. Level III fi rms
also receive blueprints from their customers and are similar to Level II fi rms in terms of the
order they may be processing for their customers. Many of these fi rms may not be dedicated
to a single customer and produce similar components for different customers. As a result, they
need to develop systems for maintaining various designs as well as capabilities to manufacture
varying requirements. These fi rms are also often small in size but on the verge of entering

8/7/2019 NASSCOM Report on IT Adoption in the Auto Component Industry
http://slidepdf.com/reader/full/nasscom-report-on-it-adoption-in-the-auto-component-industry 41/54
40
medium scale. To make this transition, Level III fi rms need to lay the foundations of competitivemanufacturing facilities. Shop fl oor improvement practices like value engineering, poke yoke,
etc. are implemented in the manufacturing operations. The fi rms also get ISO certifi ed or at
least get ready for an ISO certifi cation. The customers of Level III fi rms demand better quality
and a time bound reduction in cost from the suppliers. Consequently, the need for controlling
WIP and having a proper costing system becomes important. These fi rms will employ
supervisors with experience and perhaps formal education for their shop fl oor operations.
The need to coordinate across orders from various customers will require their employees
to undergo training in shop fl oor planning and scheduling. The fi nished product distribution
processes remain the same as for Level I and Level II fi rms.
The world becomes very competitive and demanding for Level IV suppliers and of course,
more remunerative as well. These Tier-2 suppliers are medium size fi rms with multiple plants
and customers and make the fi rst entry into global supply chains. The Level IV manufacturers
make to order(s) as well as in anticipation of orders. Some fi rms produce to stock and
deliver just-in-time to national and international customers. These producers are capable of
modifying blueprints which becomes their source of becoming vendors for new customers.
Since they supply to many customers, their manufacturing facilities are amenable to cellular
manufacturing layout with single piece fl ow. This helps them reduce production lead times in
a medium volume and medium to high product variety environment. These fi rms are ready to
implement various productivity enhancing programmes that are aimed at increasing availabilityof equipment through TPM (Total Productive Maintenance), better control of processes on the
shop fl oor through SQC (Statistical Quality Control), higher operator effi ciency (through multiple
machine operations by each operator) and enhanced operator training on manufacturing
management aspects. These fi rms also start focusing on environmental issues within and
outside the plant.
Level IV suppliers grow to become Tier-1 suppliers. Design and production engineering become
very crucial in the ability of these fi rms to service multiple customers. Better tools like CAD
systems are needed as there are skilled engineers and supervisors. These fi rms are vendors
to national and international fi rms and many have warehouses for servicing their customers.
Inventory management, both for raw material procurement as well as fi nished goods is an
important area of concern.
Tier-1 suppliers can also be categorised as Level V fi rms. They supply to the automobile OEMs
as well as in the replacement market. Most of the Level V manufacturers are upper-medium
or large fi rms and have a national network – a large majority of these fi rms export and are
part of a global supply chain. They produce to fi rm orders as well as stock, .i.e. in anticipation
of orders from customers. This requires the Level V fi rms to develop capabilities which
enable accurate demand forecasting to remain profi table. In the Indian context, many of the

8/7/2019 NASSCOM Report on IT Adoption in the Auto Component Industry
http://slidepdf.com/reader/full/nasscom-report-on-it-adoption-in-the-auto-component-industry 42/54
41
Level V fi rms produce to a customer’s requirement but they are expected to develop newer designs and their own blueprints, thereby requiring strong design and prototyping capabilities.
Strong IPR regimes help them generate revenue from proprietary product and process
technologies. They also diversify their business around these new technologies. They supply
to many customers from multiple manufacturing facilities located within the country and
sometimes from manufacturing facilities located outside the country. Often their customers
require them to deliver just-in-time which in many cases they do by establishing a warehouse
closer to the customer’s manufacturing facilities. Some even re-locate their plants closer to
the customer’s assembly location. On the shop fl oor, Level V fi rms implement lean production
systems and strengthen the availability of equipment through TPM. They also establish
separate production lines for small orders with variety and large standard orders. Operatorsare trained very extensively to make decisions based on data available from the shop fl oor.
Firms that address environmental concerns have a better chance of winning orders globally.
Level V fi rms establish an extensive national distribution network through which they supply
to the replacement markets. Most serve OEM customers directly from their manufacturing
facilities. Strong supply chain management and logistics processes are required to manage
these diverse linkages between suppliers, producers and customers. These fi rms, however,
have to manage the warranty process across the supply chain and have to have systems that
will enable swift respones in case of any product recall. Moreover, such warranty systems
have to be linked to product/process design as well as the purchase systems so as to provide
a feedback in order to make the product robust. These fi rms are supposed to have strong
quality systems where the focus is on enhancing process capabilities.
Through an effective deployment of IT, an auto component fi rm has the potential to come up
with better decisions to address operational challenges across various processes which in
turn improves performance and meets the customer’s requirement to satisfaction. Whether the
IT solutions will be able to help manage these disparate but inter-linked process will depend
on whether the IT strategy can be aligned into a cogent trajectory for different types of fi rms.
The next section of the report discusses this aspect in more detail.

8/7/2019 NASSCOM Report on IT Adoption in the Auto Component Industry
http://slidepdf.com/reader/full/nasscom-report-on-it-adoption-in-the-auto-component-industry 43/54
42
Chapter 4: Evolving an IT strategy for different levels
Developing an IT strategy which is aligned to the manufacturing requirements of theauto component sector requires an understanding of the needs of fi rms at each Level. Only
then can effective IT interventions be designed which can help these fi rms become competitive
and grow.
1. Aligning IT strategy with manufacturing capabilities
Table 6 in chapter three highlights the capability continuum of the auto component manufacturing
fi rms and the consequent challenges faced by IT fi rms in effectively playing a role to build the
IT capabilities of auto component fi rms. The key to successful IT interventions lies in recognising
that the Indian Auto Component Industry comprises fi rms that are at different stages of industrial
development. As a consequence, the fi rms possess a heterogeneous mix of IT capabilities,
ranging from low-tech with no or little IT knowledge to very sophisticated, providing IT related
services to its own fi rms and others. The challenge is to design appropriate interventions
for these different categories of fi rms which are both cost-effective and result oriented.
This objective gets further complicated by the fact that most fi rms in the auto component sector
are tiny to small (and sometimes medium enterprises) whose ability and sometimes desire to
invest in building capabilities through IT interventions is limited. In addition, strong IT systems
are required to meet compliance and regulatory requirements either from governments or
customers. Such IT systems support the related documentation, traceability, replicability, and
for making involved decision making. Obviously, it becomes a public policy challenge, as well,
to develop an IT driven smart auto component sector.
The table takes into account the manufacturing processes and managerial decision making
environment in various category of fi rms. It highlights the nature of decision making that could
be enhanced with IT enablement as well as establishes a requirement for IT fi rms to develop
new products and services for the auto component fi rms. The IT strategy of auto component
manufacturers at different Levels could be evolved from these requirements appropriately.
It would be effective to recognise that fi rms at different Levels have varying needs and therefore
it would be useful to design Level-specifi c IT strategy.
Many IT projects fail when there is a mismatch between the needs of the manufacturing
customer and what the IT fi rm offers and this is more pronounced in small auto component
fi rms which lead to further hesitation in looking at IT as a solution.
Level I and II fi rms are very basic in terms of their IT requirements – mostly transaction oriented
and that too of the very rudimentary kind – one that supports tracking of information related
to quality and some in accounts and perhaps human resources.

8/7/2019 NASSCOM Report on IT Adoption in the Auto Component Industry
http://slidepdf.com/reader/full/nasscom-report-on-it-adoption-in-the-auto-component-industry 44/54
43
Role of IT IT Requirements (Software) IT Requirements (Hardware) IT Strategy
Level I Laying the foundat ion • Traceabi li ty
• Capture external
transactions
• Stand alone PC
• Mobile application
• Laying the foundation
Level I I Support qual ity • Error f ree Bil l of Material
• Auto-validation of orders
• Inform status of orders to
customers – shop loading
• Invoice generation
• Maintenance analysis
• Basic statistics tools for QC
• Stand alone PC & email
• Mobile application
• Linkage with external
environment
• Ensuring accuracy in
data
Level I II Support planning • Order receipt systems
• Statistics tools for QC
• Company based localtransactional systems
• Production planning, daily
schedules, generating
production visibility
• Variance monitoring
• Product costing
• System for material release
to vendors
• System for payment to
vendors
• Error free information on
inventory
• Limited capability local
network
• Network dial in bymanufacturer into
customer’s system
• Ensure robust
planning
• Functional support
Level IV Support reduction in costs
& productivity gains
• Forecasting model &
system
• Design Decision Support
System/Engineering design
system
• Company based local
system to support DSS
• Real-time scheduling
system
• HR & payroll systems
• Automated capture of shop
fl oor data
• Financial accounting
including Bank
reconciliation
• LAN
• IT system to integrate
plants
• Intranet deployment
• Few high-end engineering
work stations
• PLC based systems
• Company-wide
training on IT tools
• Support improved
decision making
LEVEL V IT based competitive
advantage
• Customer response
gathering systems
• ERP
• SCM
• Electronic communication
link with vendors• Share shop fl oor loading
with buyer
• Manufacturing by wire
(simulation of new designs)
• Automated training modules
• Auctions/Collective buying
with OEMs
• Activity based costing
• Documentation of
innovation through a
knowledge system
• Electronic linkages with
suppliers & distributors
• Network storage
capabilities
• Secure servers
• Upgrading bandwidth for data networking
• High-end engineering
design stations
• Integration of ERP with
MES
• Innovative structures
for demand
management – use of
call centre for linking
customers request to
delivery practices• IT on shop fl oor
– data capturing from
machines
• Manufacturing &
supply chain analytics
• Market analytics
• Computer based
learning – content on
shop fl oors & del ivery
Table 7: Role that IT needs to play for fi rms that are at different Levels in terms of capabilities and markets

8/7/2019 NASSCOM Report on IT Adoption in the Auto Component Industry
http://slidepdf.com/reader/full/nasscom-report-on-it-adoption-in-the-auto-component-industry 45/54
44
Level I fi rms (especially the tiny ones) would often not have any process that is supportedby IT. Moreover, they would not have any IT related skills in their workforce. Typically, it’s the
owner or the child of the owner or a young employee (e.g., an accountant) who is the key user
of the IT infrastructure. The challenge in this scenario is to establish the value proposition for
investing in an offi ce computer confi guration, establish some rudimentary processes using basic
spreadsheets, use the computer for offi cial transactions and use internet for communicating
with customers.Therefore the objective of the IT strategy of such fi rms is to lay the foundation
of an IT programme in the fi rm with a focus on tracking of information and ensuring accuracy of
data and also establish the role of email based transaction between the fi rm and its customers.
The IT investment has to be low, the approach for managing these processes has to be simple
and the benefi ts have to be apparent. The idea would be to initiate these fi rms to IT usage
while developing an appreciation for data capturing formally. Many transactions between these
fi rms and their customers are oral – in person or over the phone. The next stage for such a
fi rm, after this basic infrastructure is established, is to focus on capturing external transactions
– purchase, dispatches, invoices, etc. so that traceability is embodied as a process in itself
that is supported by IT.
Level II fi rms are trying to build on their basic IT infrastructure. With them an IT fi rm can focus
on reducing transaction errors – in purchasing, in bill of material, in invoicing, in dispatches,
etc., and the role of IT would be to support this objective while building systems. This focus
on data accuracy could become a very useful platform for future evolution of IT adoption inLevel II fi rms. The role of building a database in the future needs to be emphasised both from
regulatory perspective (e.g., demand of traceability by the government and customers) as
well from a cost control perspective. These are also fi rms that are establishing their quality
systems. Any IT support that helps in this endeavour would be worthwhile, e.g., training on
basic statistics and ability to use data for simple operational analysis. It may be recognised
that statistics is the new competitive tool for manufacturing and IT fi rms could leverage it to
develop value adding solutions for the auto component manufacturers.
The most important lever of change that works with both Level I and II fi rms is ‘customer
orders’. Pro-active customers could demand certain Level of IT based transactions. In that, an
IT strategy that links customers and suppliers together could yield benefi ts. Similarly, while most
owners of Level I and II fi rms (as they are the key decision makers regarding IT investments)
may not be comfortable with IT usage, they use mobile phones with ease. Consequently,
simple applications using the mobile platform will be more acceptable and will perhaps promote
straightforward data-based analysis at enterprise level in the future – a pre-requisite for any
use of IT for competitive advantage.
Level III fi rms require IT enablement to establish and implement the planning function in their
fi rms as robust planning is the foundation for better decision making. Such a system lays

8/7/2019 NASSCOM Report on IT Adoption in the Auto Component Industry
http://slidepdf.com/reader/full/nasscom-report-on-it-adoption-in-the-auto-component-industry 46/54
45
the foundation for data based decision making in the fi rm ranging from daily and monthlyplanning, organising data for use of statistical methods on the shop fl oor for better production
and quality control, nascent inventory management system (including ensuring that error in
inventory shown in the books and in the warehouse or shop fl oor is minimised), and identifying
variances in actual cost and production from their planned values. This is the most crucial
stage for IT adoption. If done properly, auto component manufacturers at this stage would
become ready to take-off with other detailed decision support systems that would help them
perform well on cost, quality, delivery and fl exibility parameters. If a fi rm misses this stage,
it would get locked into making suboptimal decisions with the consequent impediments in the
future growth of the fi rm. Therefore, tools and processes to reduce errors in information could
fi nd a sizeable market amongst small enterprises. Level III fi rms are typically SMEs and any
IT support systems offered to them will have to be either local and developed for their limited
application or accessible in a network through dial-up technology on low-cost public networks.
They would depend tremendously for access and support on application software from large
customers, i.e., higher tier producers.
Level IV and V auto component fi rms are essentially mid-size or large manufacturing fi rms
who actually use IT for delivering competitive advantage to their customers. Level IV fi rms
establish their IT systems to help them make quicker and better decisions by using customised
software. At this stage, these fi rms must also experiment with automated data collection from
the machines on the shop fl oor through PLC controllers. The Level IV fi rms will also need to
prepare for an enterprise-wide IT implementation through internal LAN and IT systems that
will allow data transfer between multiple locations comprising plants, warehouse, offi ce, etc.
All of this, however, will require capital investment of a much higher level. IT fi rms will have
to offer customised solutions at this stage at reduced costs so that the auto component fi rms
can start using IT enabled decision support systems and start receiving the attendant benefi ts.
These fi rms will be looking to put their various functions, i.e., forecasting & sales planning,
design, production & material, HR, etc. on some kind of computer supported system. This
would help the auto component fi rms to reduce their costs and improve their productivity. In
addition, some of these Level IV fi rms will be starting to acquire a few high-end workstations
for design or computational work as they would develop their own CAD design libraries. This
would lead to new service opportunities for IT fi rms both in terms of hardware maintenance as
well as package and solution offerings. A Level IV fi rm will have to invest in extensive training
of its employees to enhance IT related as well domain knowledge with attendant requirements
of advanced HR systems that tie in with the employee training needs. IT based self learning
material is becoming a growing need for fi rms, an opportunity that is ill-served in India.
Level V fi rms use IT for enabling its supply chain by improving the coordination between the
supply chain stakeholders, suppliers, its manufacturing facilities, distribution network and

8/7/2019 NASSCOM Report on IT Adoption in the Auto Component Industry
http://slidepdf.com/reader/full/nasscom-report-on-it-adoption-in-the-auto-component-industry 47/54
46
customers. Each of these stakeholders may have different requirements – the suppliers mayrequire production plans, the fi rm’s manufacturing facilities may require forecasts and material
shipment schedules, channel partners may require off-take and receipt information along with
accurate inventory systems and the customers may require visibility on production and delivery
schedules, decisions on last minute production or design changes, batch traceability, etc.
Customers may also demand shop loading schedules and cost related data. Some fi rms may
put in place an activity based costing system on their shop fl oor or design their procurement
system to manage online auctions – each requiring sophisticated cost measurement and
allocation algorithms.
At this stage, the Level V fi rm’s IT systems are also being driven by those of the customer’s
hence the fi rms may have multiple sub-systems (or islands of systems) which may need to be
integrated into a single enterprise system for increased effi ciency. The IT strategy for these
fi rms involves working with different vendors for different IT products as well as consultants
who would help provide specifi c solution or coordinate different functions. Since these fi rms
will be involved with continuous innovation, their IT systems must be able to support related
managerial initiatives like Six Sigma, Process Analysis, SQC, TPM, Pull Control with Digital
Kanbans, etc. IT hardware and software may be networked with a strong focus on data
security, network storage capabilities and ability to transfer large quantities of data. Moreover,
IT support for back offi ce functions like teleconferencing/videoconferencing, ERP & SCM, R&D
and testing with machine data transfer would be crucial.
The IT strategy for Level V fi rms could include organising enterprise-wide IT system either
through an ERP or a customised solution, linking the internal with the external e.g., use of
call centre for order and dispatch management, providing systems (including bandwidth) for
large quality and quick update of data, tools to support use of data analytics within decision
support systems (to support various decisions), market analytics, and computer based learning.
Utilising the shop fl oor data for controlling machines becomes as important as its automated
capture from machines through a link between the ERP and the MES (Manufacturing Execution
Systems). This is also crucial in terms of traceability of components as well as providing inputs
to design.

8/7/2019 NASSCOM Report on IT Adoption in the Auto Component Industry
http://slidepdf.com/reader/full/nasscom-report-on-it-adoption-in-the-auto-component-industry 48/54
47
2. The MSC perspective
Firms in the auto component sector could be categorised further by the markets
they serve (M), their inherent size (S) and the manufacturing capabilities (C) that they carry.
Table 8 superimposes the MSC classifi cation on to the Level based categorisation of auto
component fi rms.
Firm Markets Firm Size ManufacturingCapabilities
LEVEL I Predominantly Domestic Tiny to Small Low
LEVEL II Predominantly Domestic Small Low
LEVEL III Predominantly Domestic Small to Medium Low to Medium
LEVEL IV Predominantly Domestic,Some Export
Medium Medium
LEVEL V Domestic and/or Export Medium to Large Medium to High
Table 8: The market-size-capabilities classifi cation of Auto component fi rms.
Two issues arise out of this categorisation, who can serve the requirements of each category
of fi rms and what could be the institutional structure for serving a particular fi rm type.
Auto component fi rms serving the domestic market will have to be very value conscious and
their strategy has to be driven by providing high return for low investments. Export markets
and large domestic OEMs drive the IT strategy and capability agenda of the auto component
fi rms by defi ning the integration interface between the OEMs and their supplier’s systems.
Customers to these fi rms often prefer IT suppliers that already supply to their global supply
chain, thereby requiring standard packages and services. Overseas customers as well as OEMs
are important drivers of IT adoption in Level V auto component fi rms. The Level V fi rms, in
turn, impose a similar requirement on their suppliers. It would indeed be useful for IT fi rms to
understand these inter-linkages in the Auto Component Industry in order to map opportunities
for different tiers of the industry appropriately.
Manufacturing capabilities defi ne the complexity of tasks that an auto component fi rm may
be able to perform and consequently the nature of IT solutions required. Low manufacturing
capability firms are transaction oriented while those with high capabilities will deploy
sophisticated technologies and high-end decision making tools. Most auto component fi rms,
other than the Level V fi rms), are SMEs and are often low in capability. As one moves up the
pyramid of capability, the number of fi rms in those higher categories of capabilities become
small. Many of these tiny to small fi rms with low IT capabilities, however, represent tremendous
opportunity for a basic level of IT implementation, often using PC and simple software.
It is imperative for the IT fi rms to develop new solutions and business models to address this
segment as long-term returns are going to be immense.

8/7/2019 NASSCOM Report on IT Adoption in the Auto Component Industry
http://slidepdf.com/reader/full/nasscom-report-on-it-adoption-in-the-auto-component-industry 49/54
48
The challenge for large IT fi rms is to devise a service model that will generate revenues tocover its higher overheads while the challenge for small/mid-sized IT fi rms is to convince
auto component fi rms that they can deliver solutions which create strong capabilities in
the auto component fi rms. Perhaps a hub and spoke model can be created where large
IT fi rms could be involved in setting up network platforms for collaboration between large and
small auto component fi rms while the ‘last mile connectivity’ required for actual execution
of IT implementation and after-sales service is done by small IT fi rms using the large fi rm’s
platforms, tools and design capabilities. A related issue is the mode of service delivery, as
auto component fi rms move from small to large, they become more amenable to moving from
virtual pay-as-you-use applications with secured sharing of servers to proprietary networks
and client resident software.
The implication of the above approach is as follows:
• When IT fi rms start to evolve their own business strategies for the Indian Auto Component
Industry, they must understand the varied nature of the different tiers of Auto Component
Industry and the business perspectives of each tier before proposing solution or service
offering to a particular fi rm, i.e., align business strategy of the IT fi rms with the IT strategy
of the customer fi rm
• Understand clearly the characteristics and capabilities (both technical and business) of
auto component fi rms before embarking on designing solutions
• Understand linkages between various manufacturing improvement programmes
and provide solutions for related programmes/activities together to get more out
of investments
• Emphasise solutions to business and technical problems and not packages or services
• Ensure that preparing customer’s workforce to use IT for generation of solutions to
problems must become part of building/improving domain capabilities
• For a large majority of auto component fi rms, the big constraint to accepting IT based
decision making is investment in hardware & software and hiring of dedicated IT staff – new
business and service models must be evolved to take into account this constraint.

8/7/2019 NASSCOM Report on IT Adoption in the Auto Component Industry
http://slidepdf.com/reader/full/nasscom-report-on-it-adoption-in-the-auto-component-industry 50/54
49
Chapter 5: Looking ahead
The key challenge for the auto component fi rms is to locate themselves appropriately in themanufacturing needs - IT needs hierarchy. Once this location is identifi ed, fi rms can broadly
benchmark themselves in terms of current IT adoption status as well as future IT needs and
accordingly design their IT strategy. The details given in Table 7 can become guiding principles.
At the same time, IT fi rms need to understand the stage or Level to which a particular auto
component fi rm belongs, before suggesting an IT related intervention. This hierarchy can
also be used by industry associations to highlight the trajectory that fi rms are likely to follow.
This trajectory might help fi rms at different stages visualise their future IT needs while their
current decisions are pre-dominantly based on immediate requirements.
However, there is a larger issue that needs to be addressed by fi rms and industry associations.
Why is IT adoption not a key challenge and priority of auto component fi rms? This is despite
the fact that BU heads of these fi rms expect IT to address most of their business challenges.
Does it have something to do with the way they perceive the effectiveness of IT? Most fi rms
that have a measure of effectiveness in mind prefer to use return on investment, productivity
changes and customer satisfaction as key measures of effectiveness. Of course, several do
not have a measure. Why do fi rms use measures that are diffi cult to estimate or which require
longer time horizons to take effect? Since the main reasons for IT adoption is to improve
processes like inventory control, timely delivery, etc. it may be more useful to focus on process
improvement measures as a proxy of effectiveness, especially those which are considered to
be critical. If the inability to clearly see returns is one of the constraints on IT adoption, such
an approach may, in fact, enhance adoption.
The other issue that needs to be highlighted relates to complementarities between different
IT applications and systems. It is critical for fi rms to understand that certain IT applications
and systems will only lead to tangible benefi ts when integrated with other IT applications and
systems. The reaping of these synergies is very important for enhancing competitiveness of
the auto component fi rms through IT adoption.
1. Call for action: Strategies for stakeholders
The IT and Auto Component Industry must visualise themselves differently if they are to moveto another stage of industrial development and consequently competitiveness. The goal must
be to create a sector where IT is seen as integral to the competitiveness of the industry and
not as a service often provided by external sources. Some initiatives that various stakeholders
can undertake are given below.
Manufacturing industry: OEM and auto component fi rms
• Creation of IT requirements and standards by OEM and large auto component fi rms
(typically Level I and Level 2) for their suppliers

8/7/2019 NASSCOM Report on IT Adoption in the Auto Component Industry
http://slidepdf.com/reader/full/nasscom-report-on-it-adoption-in-the-auto-component-industry 51/54
50
• Develop a data based decision making perspective and see IT as more than atransaction system
• Work closely with IT fi rms to enable them understand the manufacturing and logistics
processes that require improvement in different tiers of the industry
• Identify services like sample preparation & delivery, payment processes, transport &
dispatch processes, etc. that will help a fi rm win orders through use of IT
• Focus on reducing lead times in all activities using IT processes and tools as this will
reduce costs dramatically
IT industry• Create a network of small and large IT fi rms for creating IT infrastructure and for providing
services at competitive costs to SMEs – develop synergies between large and small
IT fi rms
• Develop service models that provide fl exibility and choice to customers both on hardware
options and software applications that will reduce the cost of upfront investment – web based
pay as you use options, lowering the load on client resident hardware/software options, low
cost-limited module service options (i.e, vanilla software and hardware models), etc.
• Shifting focus from intervention in a single manufacturing fi rm to its entire supply chain –
will create more value for the customer fi rm, thereby evincing higher IT investments
• Integrate IT solutions with domain value addition – most IT fi rms are seen as technicalproviders of hardware/software rather than those that help solve domain problems for
manufacturing fi rms
• Develop fi rm specifi c focus based on its capabilities
Industry associations
• Impart domain knowledge through IT based learning platforms
• Organise exhibitions and marketing efforts for small fi rms as well as fi rms that are not
located in clusters
• Create support for domestic IT fi rms, especially in smaller towns, that provide IT hardwareand hardware maintenance services
• Invest in creating an ‘innovation in manufacturing’ fund where IT (especially where there
is an interplay of both hardware and software) plays a signifi cant role – in other words,
IT must get merged with domain related innovation in auto component manufacturing
• Establish IT based manufacturing programmes in ITIs that prepare students on
PLC systems and data manipulation, robotics and IT manipulation, engineering services
automation and design, fl y-by-wire simulation, etc. – this could be a cluster effort jointly
implemented by the auto component and IT industry associations

8/7/2019 NASSCOM Report on IT Adoption in the Auto Component Industry
http://slidepdf.com/reader/full/nasscom-report-on-it-adoption-in-the-auto-component-industry 52/54
51
• Use the hierarchy of IT and manufacturing needs presented in the report to convey tothe auto component fi rms the utility of IT at different stages
Government
• Develop a perspective on IT investment and related policies as one that will enhance the
productivity of individuals and fi rms
• Create escrow fund with tax money that a fi rm can withdraw only for new skill building
and skill upgradation programmes
• Establish a fund for enabling investment in IT solutions by SMEs, similar to the Technology
Upgradation Fund (TUF) established for the textile industry
• Enable cluster initiatives to reduce fi xed cost of investment with strong linkages with
incubators to feed innovating entrepreneurial ventures in the incubators into clusters
• Provide special benefi ts by way of reduction in import tariffs, low interest loans, etc. for
Indian fi rms that are innovative and have a focus on the domestic market
Based on the current status of IT adoption in the Auto Component Industry, fi rms may not have
followed the above trajectory and therefore may have over or under-invested in IT. For example,
fi rms that did not require ERP may have invested in ERP and so on. Therefore, IT fi rms may
need to look at existing investments to help auto component fi rms devise IT strategies. The IT
and auto component fi rms will have to collaboratively think about future IT investments given
the initial investments, in order to create an environment where IT becomes an integral part
of the manufacturing operation and becomes capable of delivering competitive advantage at
various Levels of the Indian auto component manufacturing industry.

8/7/2019 NASSCOM Report on IT Adoption in the Auto Component Industry
http://slidepdf.com/reader/full/nasscom-report-on-it-adoption-in-the-auto-component-industry 53/54
Several persons and organisations have played a very important role in the creation of thisreport and we are very grateful for their contributions.
We would like to thank all member companies of the Auto Component Manufacturers
Association (ACMA) who participated in the primary research phase for sharing data and their
valuable experiences with us. We would also like to take this opportunity to acknowledge the
efforts of the AC Nielsen team during the primary research phase.
We would also like to specially thank the following for their contributions and guidance which
has made this report possible.
Rakesh Basant
Professor of
Economics,
Indian Institute
of Management,
Ahmedabad
Rajdeep Sahrawat
Vice President,
NASSCOM
Pankaj Chandra
Professor of Production &
Operations Management and
Director, Indian Institute of
Management, Bangalore
Acknowledgements
Neelam Dhawan
Managing Director,
Microsoft India
Anil VargheseHead – SME Cluster
Development,
Microsoft India
Arvind GuptaDirector,
ACMA
Ravi Venkatesan
Chairman,
Microsoft India
Rajesh Rege
Director – Sales,
Sun Microsystems
India
Rajeev Ranjan
Chief,
National Manufacturing
Competitiveness Council
Rajesh Uppal
Chief General Manager – IT,
Maruti Udyog Limited
Deep KapuriaChairman &
Managing Director,
Hi-Tech Gears Limited
Vishnu Mathur
Executive Director,
ACMA
Authors
52

8/7/2019 NASSCOM Report on IT Adoption in the Auto Component Industry
http://slidepdf.com/reader/full/nasscom-report-on-it-adoption-in-the-auto-component-industry 54/54