national 911 program2016 national 911 progress report about the national 911 program. about the...
TRANSCRIPT

i 2016 National 911 Progress Report
2016 National 911 Progress Report National 911 Program
December 2016

2016 National 911 Progress Report About the National 911 Program
About the National 911 Program
The mission of the National 911 Program is to provide Federal leadership to support and promote optimal 911 services. The program was created to help coordinate activities among 911 stakeholders and to provide information that can be used to improve the 911 system. The National 911 Program has developed a variety of tools and resources, including tools that can be used to plan and implement Next Generation (NG) 911.
The National 911 Program is housed within the Office of Emergency Medical Services at the National Highway Traffic Safety Administration (NHTSA), which is part of the U.S. Department of Transportation (USDOT).
The data within the National 911 Progress Report was collected as part of a project titled, the “911 Resource Center” which is operated by Booz Allen Hamilton under a contract with NHTSA.
DISCLAIMER
This publication is distributed by the USDOT, NHTSA, in the interest of information exchange. The opinions, findings, and conclusions expressed in this publication are those of the authors and not necessarily those of the USDOT or NHTSA. The United States Government assumes no liability for its contents or use thereof.
U.S. Department of Transportation 1200 New Jersey Ave SE Washington, DC 20590
ii 2016 National 911 Progress Report
2016 National 911 Progress Report Table of Contents
CONTENTS
ACRONYM LIST .................................................................................................................................. IX
EXECUTIVE SUMMARY ....................................................................................................................... 1
INTRODUCTION ................................................................................................................................... 5
National 911 Program and Resource Center 5
Profile Database 5
Data Dictionary ........................................................................................................................................... 6 Data Collection and Reporting Process ..................................................................................................... 6 State Participation ...................................................................................................................................... 7 Accuracy of the Data ................................................................................................................................ 10 Challenges and Lessons Learned ........................................................................................................... 10
DATA ELEMENT RESPONSES .......................................................................................................... 11
Baseline Data and Progress Benchmarks Elements 11
BASELINE DATA: 3.1.1: DATA ELEMENT GROUP: ADMINISTRATIVE DATA ............................. 15
3.1.1.1: Year for which Data is being Reported by State 15
Data Finding: ............................................................................................................................................. 15 3.1.1.2: Public Availability of State 911 Data 17
2016 Finding: ........................................................................................................................................... 17 Dataset Shift ............................................................................................................................................. 17
3.1.2: DATA ELEMENT GROUP: SYSTEM DATA ............................................................................ 18
3.1.2.1: Total Number of 911 Calls Delivered, Based on Local and Regional 911 Authority Data, and Aggregated at the State Level 18
2016 Finding ............................................................................................................................................ 19 Dataset Shift ............................................................................................................................................. 19
3.1.2.2: Data Element Sub-Group: Call Volume by Type 20
3.1.2.2.1: Number of Wireline Calls ........................................................................................................ 20 3.1.2.2.2: Number of Cellular Calls ......................................................................................................... 21 2016 Finding ............................................................................................................................................ 21 Dataset Shift ............................................................................................................................................. 21 3.1.2.2.3: Number of Voice over Internet Protocol (VoIP) Calls ............................................................. 22 2016 Finding ............................................................................................................................................ 22 Dataset Shift ............................................................................................................................................. 22 3.1.2.2.4: Number of Multi-line Telephone System (MLTS) Calls .......................................................... 23 2016 Finding ............................................................................................................................................ 23
iii 2016 National 911 Progress Report

2016 National 911 Progress Report Table of Contents
Dataset Shift ............................................................................................................................................. 23 3.1.2.2.5: Number of Text-to-911 Messages ......................................................................................... 24 2016 Finding ............................................................................................................................................ 24 Dataset Shift ............................................................................................................................................. 24 2016 Finding ............................................................................................................................................ 25 Dataset Shift ............................................................................................................................................. 26
3.1.2.4: Data Element Sub-Group: Level of Service (LOS) Provided/Available, and Organized by Sub-State 911 Authority 27
3.1.2.4.1: No 911 Authority – Calls to 911 are Remote Call Forwarded Only ..................................... 27 2016 Finding ............................................................................................................................................ 27 Dataset Shift ............................................................................................................................................. 27 3.1.2.4.2: Number of 911 Authorities Where LOS is Limited to Basic 911.......................................... 28 2016 Finding ............................................................................................................................................ 28 Dataset Shift ............................................................................................................................................. 28 3.1.2.4.3: Number of 911 Authorities with Enhanced 911 LOS ........................................................... 29 2016 Finding ............................................................................................................................................ 30 Dataset Shift ............................................................................................................................................. 30 3.1.2.4.4: Number of 911 Authorities with Wireless Phase I LOS as the Highest LOS Available ........ 31 2016 Finding ............................................................................................................................................ 31 Dataset Shift ............................................................................................................................................. 31 3.1.2.4.5: Number of 911 Authorities with Wireless Phase II LOS as the Highest LOS Available ....... 32 2016 Finding ............................................................................................................................................ 32 Dataset Shift ............................................................................................................................................. 32 3.1.2.4.6: Number of 911 Authorities that Provide Enhanced 911 LOS for VoIP ................................ 33 2016 Finding ............................................................................................................................................ 33 Dataset Shift ............................................................................................................................................. 33
3.1.2.5: Data Element Sub-Group: Percentage of Population and Land Area Served by Each Defined LOS 34
3.1.2.5.1: Percentage of Population with No 911 Authority .................................................................. 34 2016 Finding ............................................................................................................................................ 34 Dataset Shift ............................................................................................................................................. 34 3.1.2.5.2: Percentage of Population Served by 911 Authorities with Basic 911 LOS Only ................. 35 2016 Finding ............................................................................................................................................ 35 Dataset Shift ............................................................................................................................................. 35 3.1.2.5.3: Percentage of Population Served by 911 Authorities that Provide Enhanced 911 LOS .... 36 2016 Finding ............................................................................................................................................ 36 Dataset Shift ............................................................................................................................................. 36 3.1.2.5.4: Percentage of Population Served by 911 Authorities that Provide Wireless Phase I (WPI)
LOS as the Highest LOS Available .................................................................................................... 37 2016 Finding ............................................................................................................................................ 37
iv 2016 National 911 Progress Report

2016 National 911 Progress Report Table of Contents
Dataset Shift ............................................................................................................................................. 37 3.1.2.5.5: Percentage of Population Served by 911 Authorities that Provide Wireless Phase II (WPII)
LOS as the Highest LOS Available .................................................................................................... 38 2016 Finding ............................................................................................................................................ 38 Dataset Shift ............................................................................................................................................. 38 3.1.2.5.6: Percentage of Population Served by 911 Authorities that Provide Enhanced 911 LOS for
VoIP .................................................................................................................................................... 39 2016 Finding ............................................................................................................................................ 39 Dataset Shift ............................................................................................................................................. 39 3.1.2.5.7: Percentage of Geographic Area with No 911 Authority ........................................................ 40 2016 Finding ............................................................................................................................................ 40 Dataset Shift ............................................................................................................................................. 40 3.1.2.5.8: Percentage of Geographic Area Served by 911 Authorities with Basic 911 LOS Only ....... 41 2016 Finding ............................................................................................................................................ 41 Dataset Shift ............................................................................................................................................. 41 3.1.2.5.9: Percentage of Geographic Area Served by 911 Authorities that Provide Enhanced 911 LOS
............................................................................................................................................................ 42 2016 Finding .............................................................................................................................................. 42 Dataset Shift ............................................................................................................................................. 42 3.1.2.5.10: Percentage of Geographic Area Served by 911 Authorities that Provide Wireless Phase I
(WPI) LOS as the Highest LOS Available .......................................................................................... 43 2016 Finding ............................................................................................................................................ 43 Dataset Shift ............................................................................................................................................. 43 3.1.2.5.11: Percentage of Geographic Area Served by 911 Authorities that Provide Wireless Phase II
(WPII) LOS as the Highest LOS Available ......................................................................................... 44 2016 Finding ............................................................................................................................................ 44 Dataset Shift ............................................................................................................................................. 45 3.1.2.5.12: Percentage of Geographic Area Served by 911 Authorities that Provide Enhanced 911
LOS for VoIP ....................................................................................................................................... 46 2015 Finding ............................................................................................................................................ 46 Dataset Shift ............................................................................................................................................. 46
3.1.2.6: State Adoption of its Own Common Definitions for Each LOS 47
2016 Finding ............................................................................................................................................ 48 Dataset Shift ............................................................................................................................................. 48 2016 Finding ............................................................................................................................................ 50 Dataset Shift ............................................................................................................................................. 50
3.1.2.8: Data Element Sub-Group: Total Number of Primary and Secondary PSAPs within a State 51
3.1.2.8.1: Total Number of Primary PSAPs within a State ..................................................................... 51 2016 Finding ............................................................................................................................................ 51 Dataset Shift ............................................................................................................................................. 51
v 2016 National 911 Progress Report

2016 National 911 Progress Report Table of Contents
3.1.2.8.2: Total Number of Secondary PSAPs within a State ................................................................ 52 2016 Finding ............................................................................................................................................ 52 Dataset Shift ............................................................................................................................................. 52
3.1.3: DATA ELEMENT GROUP: FINANCIAL DATA ....................................................................... 53
3.1.3.1: Financial Data Reporting Period Type 53
2016 Finding ............................................................................................................................................ 54 Dataset Shift ............................................................................................................................................. 54
3.1.3.2: Annual Revenue for All 911 Authorities 55
2016 Finding ............................................................................................................................................ 55 Dataset Shift ............................................................................................................................................. 55 3.1.3.2.1: Annual Revenue by 911 Authority Source ............................................................................. 56 2016 Finding ............................................................................................................................................ 59 Dataset Shift ............................................................................................................................................. 59
3.1.3.3: Annual Costs by 911 Authority 60
2016 Finding ............................................................................................................................................ 60 Dataset Shift ............................................................................................................................................. 60
PROGRESS BENCHMARKS: 3.2.1: DATA ELEMENT GROUP: PLANNING ................................. 61
3.2.1.1: Statewide NG911 Plan Adopted 61
2016 Finding ............................................................................................................................................ 62 Dataset Shift ............................................................................................................................................. 62
3.2.1.2: Sub-State 911 Authority NG911 Plan Adopted 63
2016 Finding ............................................................................................................................................ 63 Dataset Shift ............................................................................................................................................. 63
3.2.1.3: Statewide NG911 Concept of Operations Developed 64
2016 Finding ............................................................................................................................................ 65 Dataset Shift ............................................................................................................................................. 65
3.2.1.4: Sub-State 911 Authority Concept of Operations Developed 66
2016 Finding ............................................................................................................................................ 66 Dataset Shift ............................................................................................................................................. 66
3.2.2: DATA ELEMENT GROUP: PROCUREMENT ......................................................................... 67
3.2.2.1: Statewide Request for Proposal Released 67
2016 Finding ............................................................................................................................................ 68 Dataset Shift ............................................................................................................................................. 68
3.2.2.2: 911 Authority RFP Released 69
2016 Finding ............................................................................................................................................ 69 Dataset Shift ............................................................................................................................................. 69
vi 2016 National 911 Progress Report

2016 National 911 Progress Report Table of Contents
3.2.2.3: Statewide Components Specified for Procurement 70
2016 Finding ............................................................................................................................................ 72 Dataset Shift ............................................................................................................................................. 72
3.2.2.4: Sub-State 911 Authority Components Being Procured 73
2016 Finding ............................................................................................................................................ 75 Dataset Shift ............................................................................................................................................. 75
3.2.2.5: State Award of Contract for Components Being Procured 76
2016 Finding ............................................................................................................................................ 76 Dataset Shift ............................................................................................................................................. 76
3.2.2.6: Number of 911 Authorities Statewide that have Awarded a Contract for these System Components, Parts, and/or Functions 77
2016 Finding ............................................................................................................................................ 77 Dataset Shift ............................................................................................................................................. 77
3.2.2.7: Statewide Installation and Testing 78
2016 Finding ............................................................................................................................................ 79 Dataset Shift ............................................................................................................................................. 79
3.2.2.8: Number of Sub-State 911 Authorities Statewide that Have Installed and Tested These System Components and/or Functions 80
2016 Finding ............................................................................................................................................ 80 Dataset Shift ............................................................................................................................................. 80
3.2.2.9: Data Element Sub-Group: Agreements (Capacity and Service Level) that Have/Have Not Been Reached with Originating Service Providers 81
3.2.2.9.1: List of (Capacity and Service Level) that Have Been Reached with Telecommunications Carriers/Providers ............................................................................................................................. 81
2016 Finding ............................................................................................................................................ 83 Dataset Shift ............................................................................................................................................. 83 3.2.2.9.2: Providers with No Agreements in Place ................................................................................. 84 2016 Finding ............................................................................................................................................ 84 Dataset Shift ............................................................................................................................................. 84
3.2.3: DATA ELEMENT GROUP: TRANSITION ............................................................................... 85
3.2.3.1: Percentage of NG911 Authority Systems that Can Process and Interpret Location and Caller Information 85
2016 Finding ............................................................................................................................................ 85 Dataset Shift ............................................................................................................................................. 85
3.2.3.2: Percentage of the Total State Population Served by NG911 Capable Services 87
2016 Finding ............................................................................................................................................ 87 Dataset Shift ............................................................................................................................................. 87
3.2.3.3: Percentage of the Geographical Area of a State Served by NG911 Capable Services 88
vii 2016 National 911 Progress Report
2016 National 911 Progress Report Table of Contents
2016 Finding ............................................................................................................................................ 88 Dataset Shift ............................................................................................................................................. 88
3.2.4: DATA ELEMENT GROUP: OPERATIONS .............................................................................. 89
3.2.4.1: ESInet Connected PSAPs 89
2016 Finding ............................................................................................................................................ 89 Dataset Shift ............................................................................................................................................. 89
3.2.4.2: CPE Handling IP Calls 90
2016 Finding ............................................................................................................................................ 90 Dataset Shift ............................................................................................................................................. 90
3.2.4.3: Number of Operational ESInets Deployed within the State 91
2016 Finding ............................................................................................................................................ 91 Dataset Shift ............................................................................................................................................. 91
3.2.4.4: Percentage of the Master Street Address Guide (MSAG) to Geographic Information System (GIS) Data Synchronization Progress 92
2016 Finding ............................................................................................................................................ 92 Dataset Shift ............................................................................................................................................. 92
CONCLUSION ..................................................................................................................................... 95
viii 2016 National 911 Progress Report

2016 National 911 Progress Report Acronym List
ACRONYM LIST Table 1 below includes a list of acronyms used throughout this report.
TABLE 1. LIST OF ACRONYMS
Acronym Definition
ALI Automatic Location Identification ANI Automatic Number Identification BCF Border Control Function
DHCP Dynamic Host Configuration Protocol DNS Domain Name System E911 Enhanced 911 ECRF Emergency Call Routing Function
ESInet Emergency Services IP Network ESRP Emergency Services Routing Proxy FCC Federal Communications Commission GIS Geographic Information Systems IP Internet Protocol
LOS Level of Service LoST Location-to-Service Translation Protocol MLTS Multi-line Telephone System NENA National Emergency Number Association
NG911 Next Generation 911 NHTSA National Highway Traffic Safety Administration
NRC National 911 Resource Center PSAP Public Safety Answering Point RFP Request for Proposal SR Selective Router
USDOT United States Department of Transportation VoIP Voice over Internet Protocol
ix 2016 National 911 Progress Report

2016 National 911 Progress Report Executive Summary
EXECUTIVE SUMMARY The National 911 Program was created to provide Federal leadership and coordination in promoting optimal 911 services. The program is part of the U.S. Department of Transportation (USDOT) and is housed within the Office of Emergency Medical Services at the National Highway Traffic Safety Administration (NHTSA). The National 911 Program is responsible for developing, collecting, and disseminating information concerning practices, procedures, and technology used in the implementation of 911 services. The program operates and maintains a “National 911 Profile Database” (Profile Database) for collecting and analyzing data that can be used to characterize the status of the statewide 911 systems that comprise the National 911 system.
The Profile Database contains information that can be used to characterize the status and basic functions of State 911 agencies as well as to measure and report on their progress in implementing advanced 911 systems using innovative technology and operations. This data is useful to States and 911 stakeholders in the development of effective policies, planning, and implementation strategies at all levels of government.
The National 911 Program has worked with the National Association of State 911 Administrators (NASNA) to encourage States to voluntarily share their data. This State data provides an updated picture of Next Generation 911 (NG911) progress across the country. A total of 46 States and territories provided data during the 2016 data collection effort, which is an increase from 42 States in 2015. Please note that data collected during the calendar year 2016 reflects the previous year’s data (i.e., data collected in 2016 is 2015 data).1
Also, for the purposes of the Profile Database, States, territories, and the District of Columbia are all referred to as “States.” The map in Figure 1 reflects participation by State.
FIGURE 1. NATIONAL 911 PROFILE DATABASE PROGRESS MAP
1 This data collection effort is in compliance with the Paperwork Reduction Act of 1995 (44 U.S.C. 3501 et seq.), which requires NHTSA to receive approval from the Office of Management and Budget (OMB) (OMB Control #2127-0679).
1
1 2016 National 911 Progress Report

2016 National 911 Progress Report Executive Summary
In consideration of the 46 reporting States, State designees worked with local and regional Public Safety Answering Points (PSAPs) to accumulate data information. In an effort to identify and quantify the source of this data, the National 911 Profile Database records information through Data Element Sup-Group 3.1.2.8, which refers to the Total Number of Primary and Secondary PSAPs within a State. The National Emergency Number Association (NENA) defines a primary PSAP as, “A PSAP to which 911 calls are routed directly from the 911 Control Office.” Of 43 States who reported data for this element, the total number of primary PSAPS is 4,195. The number of call centers per regional locale differs by State and jurisdictional authority. Many States reroute calls to secondary PSAPs. Of 38 States who reported data for this element, the total number of secondary PSAPs is 1,080.
Analysis of the data collected during 2016 identified multiple key findings:
Finding 1: The Majority of 911 Calls Are Increasingly Received from Cellular Phones
According to States who submitted 2015 data, the majority of 911 calls are from cellular phones. As seen in Figure 2, 2015 data from reporting States shows that about 80 percent of consumers are using cellular phones to make 911 calls while about 16 percent are using wireline phones. This is similar to 2014 data, which showed that 76 percent of consumers used cellular phones to make 911 calls and about 21 percent used wireline phones. Furthermore, Voice over Internet Protocol (VoIP)2, Multi-Line Telephone Systems (MLTS)3, and text-to-911 are being used in increasing volumes. Wireline phones were the only method of emergency contact that decreased in usage volume from 2014 to 2015. More specifically, when comparing 2014 and 2015 data, the following emergency contact utilization shifts emerge: wireline phone usage decreased by 8 percent, cellular phone usage increased by 31 percent, VoIP usage increased by 78 percent, MLTS usage increased by 127 percent, and text-to-911 usage increased by 3442 percent. As new technologies emerge and develop, it is important to recognize trends in consumer usage. Data elements 3.1.2.1 – 3.1.2.2.5 represent the total 911 call volume by call type (e.g., wireline, cellular, VoIP, MLTS, and text-to-911), even if the call was not answered or no dispatch occurred.
FIGURE 2. CALL VOLUME BY TYPE
2 NENA Master Glossary of 911 Terminology, NENA ADM-000.17, September 9, 2013, p. 134, http://c.ymcdn. com/sites/www.nena.org/resource/collection/625EAB1D-49B3-4694-B037-8E854B43CA16/NENA-ADM-000.17_Master_Glossary_20130909.pdf 3 Ibidem, p. 86.
2
2 2016 National 911 Progress Report

2016 National 911 Progress Report Executive Summary
Finding 2: Progress is Being Made Towards Implementing Next Generation 911
Implementation towards NG911 shows improvement from previous reports in all related categories with 44 reporting States in the 2015 data collection. This progress is reported in Table 2 below. Data collected for this finding is defined by the following data elements: 3.2.1.1, 3.2.1.3, 3.2.2.1, 3.2.2.5, 3.2.2.7.
TABLE 2. IMPLEMENTING NEXT GENERATION 911
Data Element 2011 Data by Reporting States
2013 Data by Reporting States
2014 Data by Reporting States
2015 Data by Reporting States
Statewide NG911 Plan Adopted
9 of 27 15 of 39 19 of 42 20 of 46
Statewide Request for Proposal Released
Not Reported 13 of 36 18 of 42 19 of 46
State Contract Has Been Awarded
Not Reported 13 of 29 16 of 42 18 of 46
Statewide Installation and Testing
Not Reported 9 of 30 11 of 42 17 of 46
To track progress towards NG911, a question was added to the 2015 survey regarding the number of ESInets in each State. Many States are now developing either statewide or regional ESInets that PSAPs and 911 authorities can access. Data element 3.2.4.3 presents information on ESInets, by State. Future National Progress Reports will identify the growth in ESInets over time.
Finding 3: NG911 Systems are Operational in 26 Percent of Reporting States
In many cases, States have implemented NG911 networks incrementally, as circumstances enable deployment (e.g., regionally). For the purposes of this data collection, States that have operational NG911 systems are defined as those systems that can process Internet Protocol (IP)-based emergency call requests and are capable of processing NG911 emergency calls for all service types (wireline, wireless, VoIP) using NG911 infrastructure. Figure 3 depicts the level of NG911 operation by reporting States. In the Profile Database, 45 States reported data on the Percentage of their NG911 Authority Systems that Can Process and Interpret Location and Caller Information. 12 of the 45 States (22 percent) maintain a NG911 system which is operational in 100 percent of the State and is capable of processing and interpreting location and caller information. 18 of 45 (41 percent) of the reporting States are 0 percent operational. 6 of 45 (15 percent) of the reporting States responded with a range of anywhere from 1 to 80 percent of the State as operational. 9 of 45 (22 percent) of reporting States responded that their NG911 operational status was “unknown.” Data collected for this finding is defined by data element 3.2.3.1.
3
3 2016 National 911 Progress Report

2016 National 911 Progress Report Executive Summary
FIGURE 3. NG911 SYSTEMS BY REPORTING STATES
Executive Summary: In Closing
The data contained in the National 911 Profile Database can serve as a resource to States, to garner support for the development of NG911 networks and to facilitate the process of sharing best practices and collaborating on initiatives for the advancement of 911 services. The data can help to identify and justify opportunities for collaboration and serve as a basis for proposals to seek the resources necessary to achieve the technical and operational changes essential to full migration to NG911.
Lessons learned from this data collection illustrate the difficulties States and territories have in collecting and submitting the requested data due to a lack of resources and legal authority. However, even collecting data on the nature of these difficulties can provide useful information. By identifying challenges and their prevalence, actions can be taken to overcome barriers and support States in collecting the necessary data to understand their own status and measure their own progress. As with any data collection effort, additional training and refining the data collection process and questions can improve future collection efforts and result in increased participation and more precise data.
4
4 2016 National 911 Progress Report

2016 National 911 Progress Report Introduction
INTRODUCTION Historically, there has been a general lack of data depicting the status of 911 and NG911 implementation nationwide to enable 911 stakeholders to answer basic questions such as:
• How many primary public safety answering points (PSAPs) does a specific State have?
• How many wireline and wireless 911 calls are answered per year?
• How many States have issued a request for proposals (RFPs) for NG911 procurements?
• How many PSAPS are capable of processing 911 calls using infrastructure?
In an effort to acquire data that is valuable to 911 stakeholders, the National 911 Program worked with the National Association of State 911 Administrators (NASNA) to develop a database whose data elements are both useful and feasible to collect. The National 911 Profile Database was developed, containing 56 data elements. NASNA also assisted with efforts to develop a Data Dictionary and an online data submission tool, which was trial tested in 2010.
During calendar year 2012, data from 2011 was successfully collected from a total of 27 States. During the summer of 2014, the National 911 Program repeated the data collection effort for by collecting 2013 data from 39 States to achieve an updated picture of NG911 implementation across the country. In the summer of 2015, the program again repeated data collection efforts, this time receiving data from a total of 42 States. In 2016, the National 911 Program collected data from 46 States.
The purpose of this report is to provide a summary of the data collected during early 2016. Data collected during this most recent effort reflects 2015 data and highlights the status of State progression toward NG911, as well as essential 911 statistics that will be valuable for 911 stakeholders. This report provides State-by-State data, thus providing a wealth of information and allowing States to utilize the data for collaborative purposes. States with similar attributes may want to work together to identify and implement workable strategies for deploying NG911. Neighboring States may want to compare data to understand the issues inherent in creating interstate NG911 connections. National and Federal partners may want to create an overall picture of the status of NG911 implementation and provide opportunities for communities with identified deployment challenges.
National 911 Program and Resource Center
The National 911 Program was created to provide Federal leadership and coordination in promoting optimal 911 services. More specifically, the Program is responsible for developing, collecting, and disseminating information concerning practices, procedures, and technology used in the implementation of 911 services. To collect and disseminate this information, the National 911 Program houses the National 911 Resource Center (NRC). The purpose of the Resource Center is to provide useful information and resources to the 911 community. The NRC operates and maintains a “National 911 Profile Database” (Profile Database) for collecting and compiling data which can be used to characterize the demographics of the statewide 911 systems that comprise the national 911 network. It can also be used to measure and report on the progress of 911 authorities to enhance their existing systems and to implement NG911.
Profile Database
The Profile Database was designed to collect information to assist the 911 community by providing basic demographic information on the characteristics of the National 911 system, as well as progress on implementation of NG911. Data related to operations, finance, and progress toward NG911 at the State level will be useful to 911 stakeholders in the development of effective policies, planning, and implementation
5
5 2016 National 911 Progress Report
2016 National 911 Progress Report Introduction
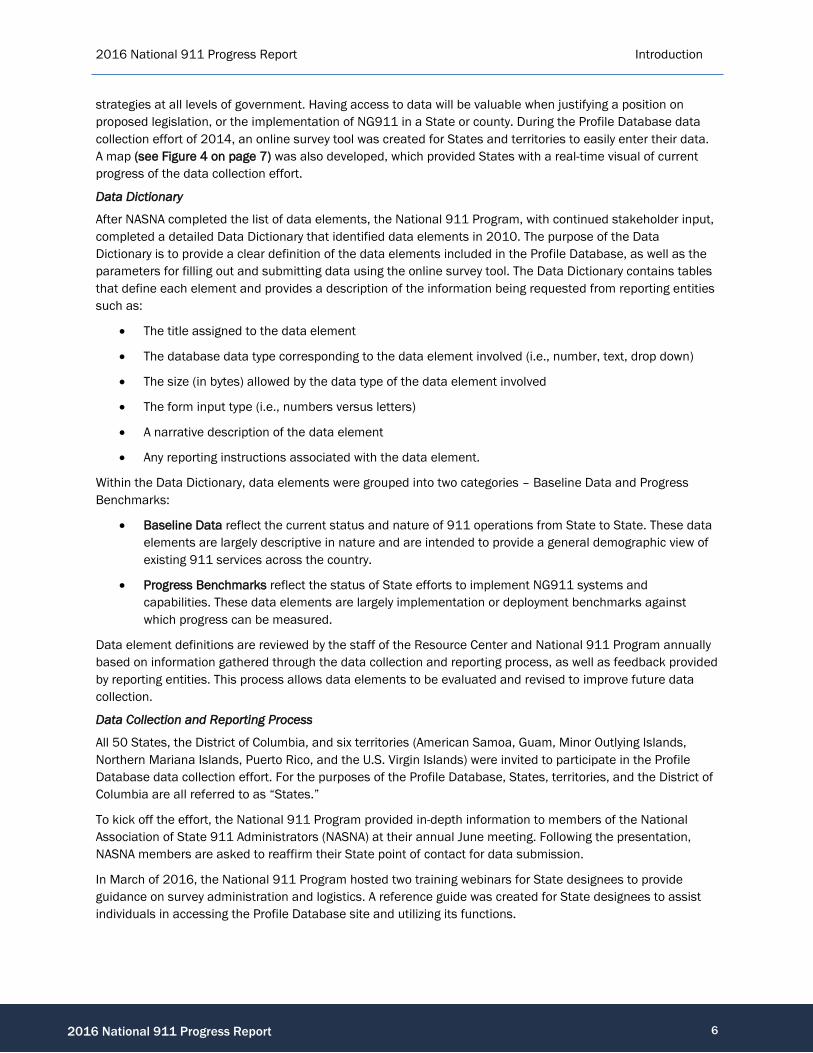
strategies at all levels of government. Having access to data will be valuable when justifying a position on proposed legislation, or the implementation of NG911 in a State or county. During the Profile Database data collection effort of 2014, an online survey tool was created for States and territories to easily enter their data. A map (see Figure 4 on page 7) was also developed, which provided States with a real-time visual of current progress of the data collection effort.
Data Dictionary
After NASNA completed the list of data elements, the National 911 Program, with continued stakeholder input, completed a detailed Data Dictionary that identified data elements in 2010. The purpose of the Data Dictionary is to provide a clear definition of the data elements included in the Profile Database, as well as the parameters for filling out and submitting data using the online survey tool. The Data Dictionary contains tables that define each element and provides a description of the information being requested from reporting entities such as:
• The title assigned to the data element
• The database data type corresponding to the data element involved (i.e., number, text, drop down)
• The size (in bytes) allowed by the data type of the data element involved
• The form input type (i.e., numbers versus letters)
• A narrative description of the data element
• Any reporting instructions associated with the data element.
Within the Data Dictionary, data elements were grouped into two categories – Baseline Data and Progress Benchmarks:
• Baseline Data reflect the current status and nature of 911 operations from State to State. These data elements are largely descriptive in nature and are intended to provide a general demographic view of existing 911 services across the country.
• Progress Benchmarks reflect the status of State efforts to implement NG911 systems and capabilities. These data elements are largely implementation or deployment benchmarks against which progress can be measured.
Data element definitions are reviewed by the staff of the Resource Center and National 911 Program annually based on information gathered through the data collection and reporting process, as well as feedback provided by reporting entities. This process allows data elements to be evaluated and revised to improve future data collection.
Data Collection and Reporting Process
All 50 States, the District of Columbia, and six territories (American Samoa, Guam, Minor Outlying Islands, Northern Mariana Islands, Puerto Rico, and the U.S. Virgin Islands) were invited to participate in the Profile Database data collection effort. For the purposes of the Profile Database, States, territories, and the District of Columbia are all referred to as “States.”
To kick off the effort, the National 911 Program provided in-depth information to members of the National Association of State 911 Administrators (NASNA) at their annual June meeting. Following the presentation, NASNA members are asked to reaffirm their State point of contact for data submission.
In March of 2016, the National 911 Program hosted two training webinars for State designees to provide guidance on survey administration and logistics. A reference guide was created for State designees to assist individuals in accessing the Profile Database site and utilizing its functions.
6
6 2016 National 911 Progress Report

2016 National 911 Progress Report Introduction
In April and May of 2016, the online survey tool was opened for input of State data. After the online survey tool was closed for submissions, the National 911 Program evaluated the data, followed up with States for clarification on specific data elements, and produced this report. The data collection effort greatly benefited from the support of NASNA and its members in advocating for data submission and promoting the benefits the data will provide to the 911 community. In addition, the National Emergency Number Association (NENA) assisted in analyzing the data and provided valuable insights on key findings and overall accuracy.
The National 911 Program obtained formal clearance from the Office of Management and Budget (OMB) for this data collection (OMB Control Number 2127-0679). 4
State Participation
The National 911 Profile Database Progress Map in Figure 4 depicts State participation for the 2016 Profile Database data collection effort. State participation is represented by three colors on the map. Blue indicates no data provided, yellow indicates a State did not complete their data collection submission, and green indicates States completed their data collection and submission. In 2016, all States who collected data also fully completed their submission. As illustrated in Table 3 (see page 8), the number of participating States has improved from previous years. In 2016, 46 States submitted data, compared to 42 in 2015, 39 in 2014, and 27 in 2012.
FIGURE 4. 2016 NATIONAL 911 PROFILE DATABASE PROGRESS MAP
4 Ibid.
7
7 2016 National 911 Progress Report

2016 National 911 Progress Report Introduction
TABLE 3. STATE DATA SUBMISSION
Year Complete Not Complete No Data Provided
2012 27 1 28
2014 39 1 16
2015 42 0 15
2016 44 2 11
Although all 57 States and territories were invited to participate in the 2016 data collection effort, not all were able to submit data. Points of contact for these States were contacted to ascertain the reasons for their inability to provide data. As depicted in Table 4 (see page 9), these responses were collected and categorized. Furthermore, some States were unable to provide data for multiple collection efforts. Reasons for State inability to provide data are also listed.
8
8 2016 National 911 Progress Report

2016 National 911 Progress Report Introduction
TABLE 4. STATE CATEGORIZATION FOR NO DATA PROVIDED, X=2014 REPORT, O=2015 REPORT, I=2016 REPORT CATEGORY AS DE GU LA MO MP MS NV NY RI UM VI VT5 WV WY
Unable To Submit Data Due To Lack Of Statutory Authority To Collect Data From Local 911 Authorities
X O X
Unable To Submit Data Due To Lack Of Resources To Collect And/Or Aggregate Data
X XOI X XOI OI XOI O* X
State Point Of Contact Is New To Position/In Transition OI O O
Contacted State Point Of Contact, But No Response Received OI XOI OI X OI
State Point of Contact was responding to an emergency situation during the data collection period
I
No State Point Of Contact XOI XOI
5 The State of Vermont POC noted that the State was in the process of implementing a new statewide system during the period of the 2015 data collection effort.
9
9 2016 National 911 Progress Report
2016 National 911 Progress Report Introduction
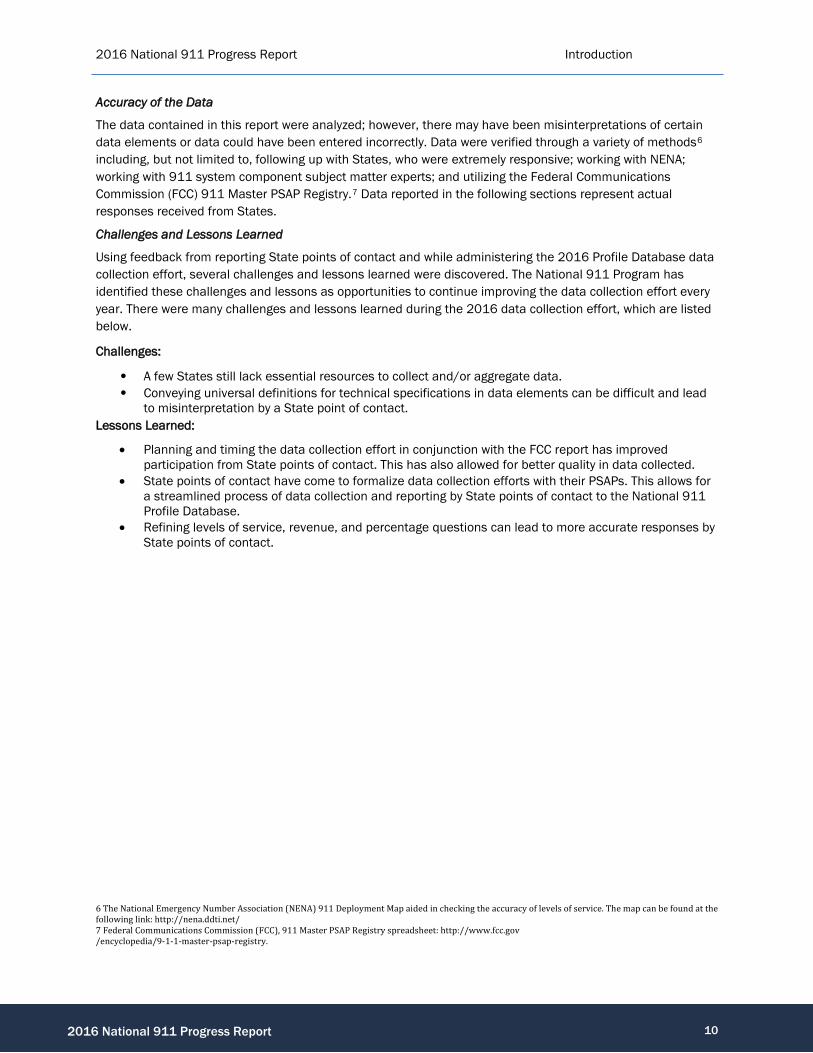
Accuracy of the Data
The data contained in this report were analyzed; however, there may have been misinterpretations of certain data elements or data could have been entered incorrectly. Data were verified through a variety of methods6 including, but not limited to, following up with States, who were extremely responsive; working with NENA; working with 911 system component subject matter experts; and utilizing the Federal Communications Commission (FCC) 911 Master PSAP Registry.7 Data reported in the following sections represent actual responses received from States.
Challenges and Lessons Learned
Using feedback from reporting State points of contact and while administering the 2016 Profile Database data collection effort, several challenges and lessons learned were discovered. The National 911 Program has identified these challenges and lessons as opportunities to continue improving the data collection effort every year. There were many challenges and lessons learned during the 2016 data collection effort, which are listed below.
Challenges:
• A few States still lack essential resources to collect and/or aggregate data. • Conveying universal definitions for technical specifications in data elements can be difficult and lead
to misinterpretation by a State point of contact. Lessons Learned:
• Planning and timing the data collection effort in conjunction with the FCC report has improved participation from State points of contact. This has also allowed for better quality in data collected.
• State points of contact have come to formalize data collection efforts with their PSAPs. This allows for a streamlined process of data collection and reporting by State points of contact to the National 911 Profile Database.
• Refining levels of service, revenue, and percentage questions can lead to more accurate responses by State points of contact.
6 The National Emergency Number Association (NENA) 911 Deployment Map aided in checking the accuracy of levels of service. The map can be found at the following link: http://nena.ddti.net/ 7 Federal Communications Commission (FCC), 911 Master PSAP Registry spreadsheet: http://www.fcc.gov /encyclopedia/9-1-1-master-psap-registry.
10 2016 National 911 Progress Report

2016 National 911 Progress Report Introduction
DATA ELEMENT RESPONSES The National Profile Database survey included two sections, Baseline Data and Progress Benchmarks. The following tables provide detailed responses by State for each data element within the survey. The data collected during calendar year 2016 reflects 2015 data, the data collected in 2015 reflects data from 2014, the data collected in 2014 reflects data from 2013, and the data collected during calendar year 2012 reflects data from 2011.
Baseline Data and Progress Benchmarks Elements
The 56 data elements were categorized as either Baseline Data or Progress Benchmarks. Baseline Data elements reflect the current status of State 911 operations and also provide a snapshot of 911 service levels nationwide. Progress Benchmarks capture State advancements in implementing NG911 systems and capabilities. Table 5 below reflects the number of responses per data element. The “unknown” responses indicate that States reviewed the questions, but did not have the data requested or did not provide the data requested. For ease of comprehension, the format of data listed below varies by data element.
TABLE 5. RESPONSE BY DATA ELEMENT
Data Element Number
Data Element Description Reported
Data
Did Not Respond/Response
“Unknown”
Total Reported
3.1.1.1 Year for which Data are Reported by Reporting State
46 0 46
3.1.1.2 Public Availability of State 911 Data 45 1 46
3.1.2.1 Total Number of 911 Calls Received Based on Local and Regional 911 Authority Data, and Aggregated at the State Level
36 10 46
3.1.2.2.1 Number of Wireline Calls 34 12 46
3.1.2.2.2 Number of Cellular Calls 34 12 46
3.1.2.2.3 Number of Voice over Internet Protocol (VoIP) Calls
21 25 46
3.1.2.2.4 Number of Multi-line Telephone System (MLTS) Calls
11 35 46
3.1.2.2.5 Number of Text-to-911 Messages 25 21 46
3.1.2.3 Total Number of Sub-State 911 Authorities in a State
42 4 46
3.1.2.4.1 No 911 Authority 41 5 46
11 2016 National 911 Progress Report

2016 National 911 Progress Report Introduction
Data Element Number
Data Element Description Reported
Data
Did Not Respond/Response
“Unknown”
Total Reported
3.1.2.4.2 Number of 911 Authorities with Basic 911 44 2 46
3.1.2.4.3 Number of 911 Authorities with Enhanced 911 LOS
44 2 46
3.1.2.4.4 Number of 911 Authorities with Wireless Phase I LOS
44 2 46
3.1.2.4.5 Number of 911 Authorities with Wireless Phase II LOS
44 2 46
3.1.2.4.6 Number of 911 Authorities that Provide Enhanced 911 LOS for VoIP
37 9 46
3.1.2.5.1 Percentage of Population with No 911 Authority 41 5 46
3.1.2.5.2 Percentage of Population Served by 911 Authorities with Basic 911 LOS
39 7 46
3.1.2.5.3 Percentage of Population Served by 911 Authorities that Provide Enhanced 911 LOS
40 6 46
3.1.2.5.4 Percentage of Population Served by 911 Authorities that Provide Wireless Phase I LOS
39 7 46
3.1.2.5.5 Percentage of Population Served by 911 Authorities that Provide Wireless Phase II LOS
40 6 46
3.1.2.5.6 Percentage of Population Served by 911 Authorities that Provide Enhanced 911 LOS for VoIP
36 10 46
3.1.2.5.7 Percentage of Geographic Area with No 911 Authority
41 5 46
3.1.2.5.8 Percentage of Geographic Area with Basic 911 LOS
39 7 46
3.1.2.5.9 Percentage of Geographic Area Served by 911 Authorities that Provide Enhanced 911 LOS
40 6 46
3.1.2.5.10 Percentage of Geographic Area Served by 911 Authorities that Provide Wireless Phase I LOS
41 5 46
3.1.2.5.11 Percentage of Geographic Area Served by 911 Authorities that Provide Wireless Phase II LOS
39 7 46
12 2016 National 911 Progress Report

2016 National 911 Progress Report Introduction
Data Element Number
Data Element Description Reported
Data
Did Not Respond/Response
“Unknown”
Total Reported
3.1.2.5.12 Percentage of Geographic Area Served by 911 Authorities that Provide Enhanced 911 LOS for VoIP
37 9 46
3.1.2.6 State Adoption of Common Definitions for Each LOS
43 3 46
3.1.2.7 Nationally Standardized Service Level Definitions 41 5 46
3.1.2.8.1 Total Number of Primary PSAPs within a State 43 3 46
3.1.2.8.2 Total Number of Secondary PSAPs within a State 38 8 46
3.1.3.1 Financial Data Reporting Period Type 42 4 46
3.1.3.2 Annual Revenue for All 911 Authorities 37 9 46
3.1.3.2.1 Annual Revenue by 911 Authority Source 41 5 46
3.1.3.3 Annual Costs by 911 Authority 30 16 46
3.2.1.1 Statewide NG911 Plan Adopted 43 3 46
3.2.1.2 Sub-State 911 Authority NG911 Plan Adopted 36 10 46
3.2.1.3 Statewide NG911 Concept of Operations Developed
42 4 46
3.2.1.4 Sub-State 911 Authority Concept of Operations Developed
35 11 46
3.2.2.1 Statewide Request for Proposal Released 41 5 46
3.2.2.2 911 Authority RFP Released 35 11 46
3.2.2.3 Statewide Components Specified for Procurement
19 27 46
3.2.2.4 Sub-State 911 Authority Components Being Procured
27 19 46
3.2.2.5 State Award of Contract for Components Being Procured
41 5 46
13 2016 National 911 Progress Report

2016 National 911 Progress Report Introduction
Data Element Number
Data Element Description Reported
Data
Did Not Respond/Response
“Unknown”
Total Reported
3.2.2.6 Number of 911 Authorities Statewide that Have Awarded a Contract for these System Components and/or Functions
31 15 46
3.2.2.7 Statewide Installation and Testing 41 5 46
3.2.2.8 Number of Sub-State 911 Authorities Statewide that Have Installed and Tested These System Components and/or Functions
33 13 46
3.2.2.9.1 List of (Capacity and Service Level) that Have Been Reached with Telecommunications Carriers/Providers
22 24 46
3.2.2.9.2 Providers With No Agreements in Place 7 39 46
3.2.3.1 Percentage of NG911 Authority Systems that Can Process and Interpret Location and Caller Information
35 11 46
3.2.3.2 Percentage of Total State Population Served by NG911 Services
35 11 46
3.2.3.3 Percentage of the Geographical Area of a State Served by NG911 Services
35 11 46
3.2.4.1 ESInet connected PSAPs 39 7 46
3.2.4.2 CPE handing IP calls 34 12 46
3.2.4.3 Number of Operational ESInets Deployed Within the State
37 9 46
3.2.4.4 Percentage of the Master Street Address Guide (MSAG) to Geographic Information
29 17 46
N/A Open-ended response given by State 17 29 46
14 2016 National 911 Progress Report

2016 National 911 Progress Report Data Element Responses
BASELINE DATA: 3.1.1: DATA ELEMENT GROUP: ADMINISTRATIVE DATA
3.1.1.1: Year for which Data is being Reported by State
Question: Select the year for which data are being reported by your State. Definition: The calendar year (January 1 through December 31) on which information or data was initially entered and/or updated. Data entered for a particular calendar year must apply to that calendar year. In addition to that date, the system will automatically maintain a history of changes to data elements, up to and including the last update. This is important because it indicates how old the information in the database is. It is recognized that fiscal data entered may reflect a reporting State’s fiscal year and not a calendar year.
Data Finding: The map below depicts State participation for the 2016 Profile Database data collection effort. States that fully participated in the 2016 data collection effort are represented in green. The State data that are part of the 2016 report was recorded during calendar year 2015.
FIGURE 5. 2016 NATIONAL 911 PROFILE DATABASE PROGRESS MAP
15 2016 National 911 Progress Report

2016 National 911 Progress Report Data Element Responses
TABLE 6. DATASET SHIFT FOR NUMBER OF STATES PROVIDING DATA
Report Year Complete Not Complete No Data Provided
2012 27 1 29
2014 39 1 17
2015 42 0 15
2016 44 2 11
16 2016 National 911 Progress Report

2016 National 911 Progress Report Data Element Responses
3.1.1.2: Public Availability of State 911 Data
Question: Is your data publicly available? Definition: This element asserts that a State’s 911 data are or are not available to the public.
TABLE 6. DATA ELEMENT RESPONSES BROKEN DOWN BY STATE
FIGURE 6. 2016 PUBLIC AVAILABILITY OF STATE 911 DATA
2016 Finding:
Of all reporting U.S. States and territories: • 39 have declared data is publicly available • 6 have declared data is not publicly available.
Dataset Shift • 2015 Finding: 34 States declared that data is publicly available • 2014 Finding: 39 States declared that data is publicly available.
Response State Yes AL, AR, AZ, CA, CO, CT, DC, FL, GA, HI, IA, ID, IL, IN, KS, KY, MA, MD, ME, MI, MN, MT, NC,
ND, NE, NM, OH, OR, PA, PR, SC, SD, TN, TX, UT, VA, VI, VT, WA No AK, NH, NJ, OK, WI, WY Did Not Report AS, DE, GU, LA, MO, MP, MS, NV, NY, RI, UM, WV
17 2016 National 911 Progress Report

2016 National 911 Progress Report Data Element Responses
3.1.2: DATA ELEMENT GROUP: SYSTEM DATA
3.1.2.1: Total Number of 911 Calls Delivered, Based on Local and Regional 911 Authority Data, and Aggregated at the State Level
Question: Enter the total number of 911 calls delivered to “primary” PSAPs in your State, even if not answered or no dispatch occurred. Definition: Total number of calls delivered to 911 authorities for the calendar year, aggregated to the State level.8
TABLE 8. TOTAL NUMBER OF 911 CALLS DELIVERED TO “PRIMARY” PSAPS
State Response State Response AK 404,266 MN 2,898,976 AR 2,409,958 MT 423,900 AZ 5,181,612 NC 7,731,791 CA 26,712,201 ND 239,184 CO 6,542,771 NE 1,110,908 CT 2,356,886 NH 491,442 DC 1,464,934 NM 1,424,220 FL 23,719,774 OR 1,727,249 HI 1,390,443 PA 9,007,427 IA 827,205 PR 2,571,856 IL 11,217,073 SC 5,722,700 IN 5,102,772 SD 332,645 KS 2,262,489 TX 26,220,810 KY 3,468,482 UT 1,054,068 MA 3,896,857 VA 4,487,588 MD 5,158,378 VI 213,282 ME 584,828 VT 206,401 MI 6,887,494 WA 6,267,309
Reported Unknown: AL, GA, ID, NJ, OH, OK, TN, WI, WY Did Not Report Data: AS, DE, GU, LA, MO, MP, MS, NV, NY, RI, UM, WV
8 NENA Master Glossary of 911 Terminology, NENA ADM-000.17, September 9, 2013, p. 98, http://c.ymcdn.com /sites/www.nena.org/resource/collection/625EAB1D-49B3-4694-B037-8E854B43CA16/NENA-ADM-000.17_Master_Glossary_20130909.pdf.
18 2016 National 911 Progress Report

2016 National 911 Progress Report Data Element Responses
2016 Finding
Of all U.S. States and territories: • The total number of delivered 911 calls based on 36 reporting States was 181,720,179 • 9 of 45 reporting States chose “unknown” – data is unknown by State • 12 States did not complete survey.
Dataset Shift
• 2015 Finding: Of 31 reporting States, the total number of calls was 177,664,405 • 2015 Finding: 11 of 42 States chose “unknown.” • 2014 Finding: Of 30 reporting States the total number of calls was 147,690,005 • 2014 Finding: 10 of 40 reporting States chose “unknown.”
19 2016 National 911 Progress Report

2016 National 911 Progress Report Data Element Responses
3.1.2.2: Data Element Sub-Group: Call Volume by Type
3.1.2.2.1: Number of Wireline Calls
Question: Enter the number of incoming wireline calls delivered to “primary” PSAPs in your State, even if not answered or no dispatch occurred. If the total number is unknown, check the “unknown” box. Definition: Number of incoming wireline calls, aggregated to the State level.
TABLE 7. NUMBER OF INCOMING WIRELINE CALLS DELIVERED TO “PRIMARY” PSAPS
State Response State Response AK 66,917 MI 1,371,621 AR 333,210 MN 703,295 AZ 945,863 NC 1,427,027 CA 4,004,411 ND 45,036 CO 371,196 NE 271,301 CT 357,689 NH 72,885 DC 442,917 NM 236,502 FL 2,446,096 OR 337,386 HI 320,449 PA 2,522,080 IL 4,098,614 PR 556,987 IN 1,219,984 SC 1,430,675 KS 727,672 TX 2,270,588 KY 656,664 UT 98,500 MA 864,767 VA 1,146,214 MD 1,429,626 VT 43,580 ME 132,628 WA 999,536
Reported Unknown: AL, GA, IA, ID, MT, NJ, OH, OK, SD, TN, VI, WI, WY Did Not Report Data: AS, DE, GU, LA, MO, MP, MS, NV, NY, RI, UM, WV
2016 Finding
Of all U.S. States and territories: • The total number of wireline calls based on 32 reporting States was 31,951,916 • 13 of 45 reporting States chose “unknown” – data is unknown by State. Dataset Shift
• 2015 Finding: The total number of wireline calls based on 28 reporting States was 36,960,787 • 2015 Finding: 14 of 42 reporting States chose “unknown” – data is unknown by State • 2014 Finding: The total number of wireline calls based on 24 reporting States was 37,440,826 • 2014 Finding: 16 of 40 reporting States chose “unknown” • 2012 Finding: 11 of 27 reporting States chose “unknown.”
20 2016 National 911 Progress Report

2016 National 911 Progress Report Data Element Responses
3.1.2.2.2: Number of Cellular Calls
Question: Enter the number of incoming cellular calls delivered to “primary” PSAPs in your State, even if not answered or no dispatch occurred. If the total number is unknown, check the “unknown” box. Definition: Number of incoming cellular calls, aggregated to the State level.
TABLE 8. NUMBER OF CELLULAR CALLS DELIVERED TO “PRIMARY” PSAPS
State Response State Response AK 337,349 MI 5,173,010 AR 2,097,344 MN 2,143,558 AZ 4,235,749 NC 5,744,890 CA 21,249,991 ND 194,148 CO 5,895,735 NE 839,083 CT 1,871,845 NH 354,330 DC 1,022,017 NM 1,187,718 FL 19,070,052 OR 1,310,832 HI 1,020,565 PA 6,125,050 IA 827,205 PR 2,002,118 IL 7,117,806 SC 4,292,025 IN 3,787,054 TN 3,120,000 KS 1,498,473 TX 23,130,752 KY 2,811,818 UT 904,773 MA 3,032,090 VA 3,341,374 MD 3,728,697 VT 136,361 ME 395,869 WA 4,906,647
Reported Unknown: AL, GA, ID, MT, NJ, OH, OK, SD, VI, WI, WY Did Not Report Data: AS, DE, GU, LA, MO, MP, MS, NV, NY, RI, UM, WV
2016 Finding
Of all U.S. States and territories: • The total number of cellular calls based on 34 reporting States was 144,906,328 • 11 of 45 reporting States chose “unknown” – data is unknown by State.
Dataset Shift
• 2015 Finding: The total number of cellular calls based on 30 reporting States was 129,116,609 • 2015 Finding: 12 of 42 reporting States chose “unknown” – data is unknown by State • 2014 Finding: The total number of cellular calls based on 27 reporting States was 104,022,868 • 2014 Finding: 13 of 40 reporting States chose “unknown” • 2012 Finding: 6 of 27 reporting States chose “unknown.”
21 2016 National 911 Progress Report

2016 National 911 Progress Report Data Element Responses
3.1.2.2.3: Number of Voice over Internet Protocol (VoIP) Calls Question: Enter the number of incoming VoIP calls delivered to “primary” PSAPs in your State, even if not answered or no dispatch occurred. If the total number is unknown, check the “unknown” box. Definition: Number of incoming VoIP calls, aggregated to the State level.
TABLE 9. NUMBER OF VOIP CALLS DELIVERED TO “PRIMARY” PSAPS
State Response State Response CA 778,750 NC 559,874 CO 171,642 NH 4,034 CT 127,352 NM 21,604 FL 461,144 OR 79,031 HI 49,429 PA 360,297 IN 89,691 PR 12,555 KS 27,831 TX 602,272 KY 36,438 UT 31,483 ME 49,734 VT 18,366 MI 340,049 WA 360,298 MN 52,074
Reported Unknown: AK, AL, AR, AZ, DC, GA, IA, ID, IL, MA, MD, MT, ND, NE, NJ, OH, OK, SC, SD, TN, VA, VI, WI, WY Did Not Report Data: AS, DE, GU, LA, MO, MP, MS, NV, NY, RI, UM, WV
2016 Finding
Of all U.S. States and territories: • The total number of VoIP calls based on 21 reporting States was 4,233,948 • 24 of 45 reporting States chose “unknown” – data is unknown by State.
Dataset Shift • 2015 Finding: The total number of VoIP calls based on 18 reporting States was 3,503,867 • 2015 Finding: 24 of 42 reporting States chose “unknown” – data is unknown by State • 2014 Finding: The total number of VoIP calls based on 16 reporting States was 2,862,533 • 2014 Finding: 24 of 40 reporting States chose “unknown” • 2012 Finding: 10 of 27 reporting States chose “unknown.”
22 2016 National 911 Progress Report

2016 National 911 Progress Report Data Element Responses
3.1.2.2.4: Number of Multi-line Telephone System (MLTS) Calls
Question: Enter the number of incoming MLTS calls received, even if not answered or no dispatch occurred. If the total number is unknown, check the “unknown” box. Definition: Number of incoming MLTS calls, aggregated to the State level.
TABLE 10. NUMBER OF MLTS CALLS RECEIVED
State Response State Response CA 674,719 MN 80,676 CO 104,198 NH 0 FL 229,936 NM 49,249 KS 8,376 TX 375,802 KY 976 UT 19,312 ME 5,955
Reported Unknown: AK, AL, AR, AZ, CT, DC, GA, HI, IA, ID, IL, IN, LA, MA, MD, MI, MT, NC, ND, NE, NJ, OH, OK, OR, PA, PR, SC, SD, TN, VA, VI, WA, WI, WY Did Not Report Data: AS, DE, GU, LA, MO, MP, MS, NV, NY, RI, UM, WV
2016 Finding
Of all U.S. States and territories: • The total number of MLTS messages based on 11 reporting States was 1,549,199 • 34 of 45 reporting States chose “unknown” – data is unknown by State.
Dataset Shift • 2015 Finding: The total number of MLTS calls based on 10 reporting States was 1,101,146 • 2015 Finding: 32 of 42 reporting States chose “unknown” – data is unknown by State • 2014 Finding: The total number of MLTS calls based on 7 reporting States was 851,871 • 2014 Finding: 33 of 40 reporting States chose “unknown” • 2012 Finding: 17 of 27 reporting States chose “unknown.”
23 2016 National 911 Progress Report
2016 National 911 Progress Report Data Element Responses
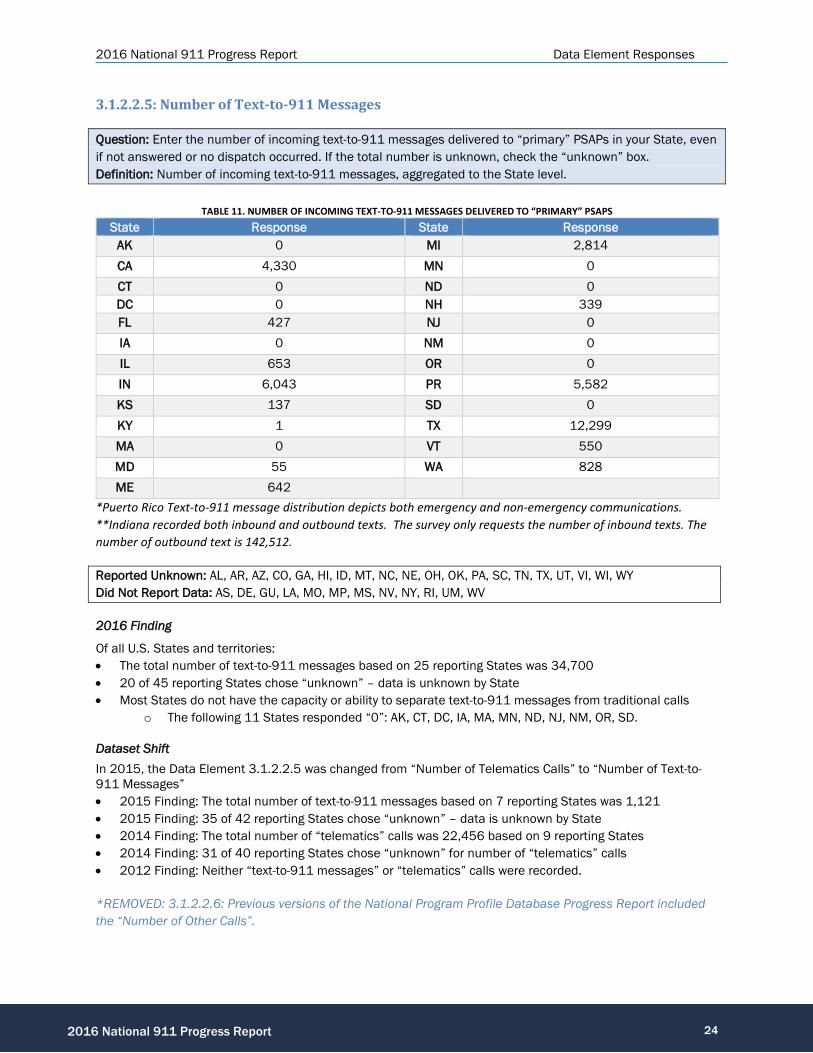
3.1.2.2.5: Number of Text-to-911 Messages Question: Enter the number of incoming text-to-911 messages delivered to “primary” PSAPs in your State, even if not answered or no dispatch occurred. If the total number is unknown, check the “unknown” box. Definition: Number of incoming text-to-911 messages, aggregated to the State level.
TABLE 11. NUMBER OF INCOMING TEXT-TO-911 MESSAGES DELIVERED TO “PRIMARY” PSAPS
State Response State Response AK 0 MI 2,814 CA 4,330 MN 0 CT 0 ND 0 DC 0 NH 339 FL 427 NJ 0 IA 0 NM 0 IL 653 OR 0 IN 6,043 PR 5,582 KS 137 SD 0 KY 1 TX 12,299 MA 0 VT 550 MD 55 WA 828 ME 642
*Puerto Rico Text-to-911 message distribution depicts both emergency and non-emergency communications. **Indiana recorded both inbound and outbound texts. The survey only requests the number of inbound texts. The number of outbound text is 142,512.
Reported Unknown: AL, AR, AZ, CO, GA, HI, ID, MT, NC, NE, OH, OK, PA, SC, TN, TX, UT, VI, WI, WY Did Not Report Data: AS, DE, GU, LA, MO, MP, MS, NV, NY, RI, UM, WV
2016 Finding
Of all U.S. States and territories: • The total number of text-to-911 messages based on 25 reporting States was 34,700 • 20 of 45 reporting States chose “unknown” – data is unknown by State • Most States do not have the capacity or ability to separate text-to-911 messages from traditional calls
o The following 11 States responded “0”: AK, CT, DC, IA, MA, MN, ND, NJ, NM, OR, SD.
Dataset Shift In 2015, the Data Element 3.1.2.2.5 was changed from “Number of Telematics Calls” to “Number of Text-to-911 Messages” • 2015 Finding: The total number of text-to-911 messages based on 7 reporting States was 1,121 • 2015 Finding: 35 of 42 reporting States chose “unknown” – data is unknown by State • 2014 Finding: The total number of “telematics” calls was 22,456 based on 9 reporting States • 2014 Finding: 31 of 40 reporting States chose “unknown” for number of “telematics” calls • 2012 Finding: Neither “text-to-911 messages” or “telematics” calls were recorded.
*REMOVED: 3.1.2.2.6: Previous versions of the National Program Profile Database Progress Report included the “Number of Other Calls”.
24 2016 National 911 Progress Report
2016 National 911 Progress Report Data Element Responses
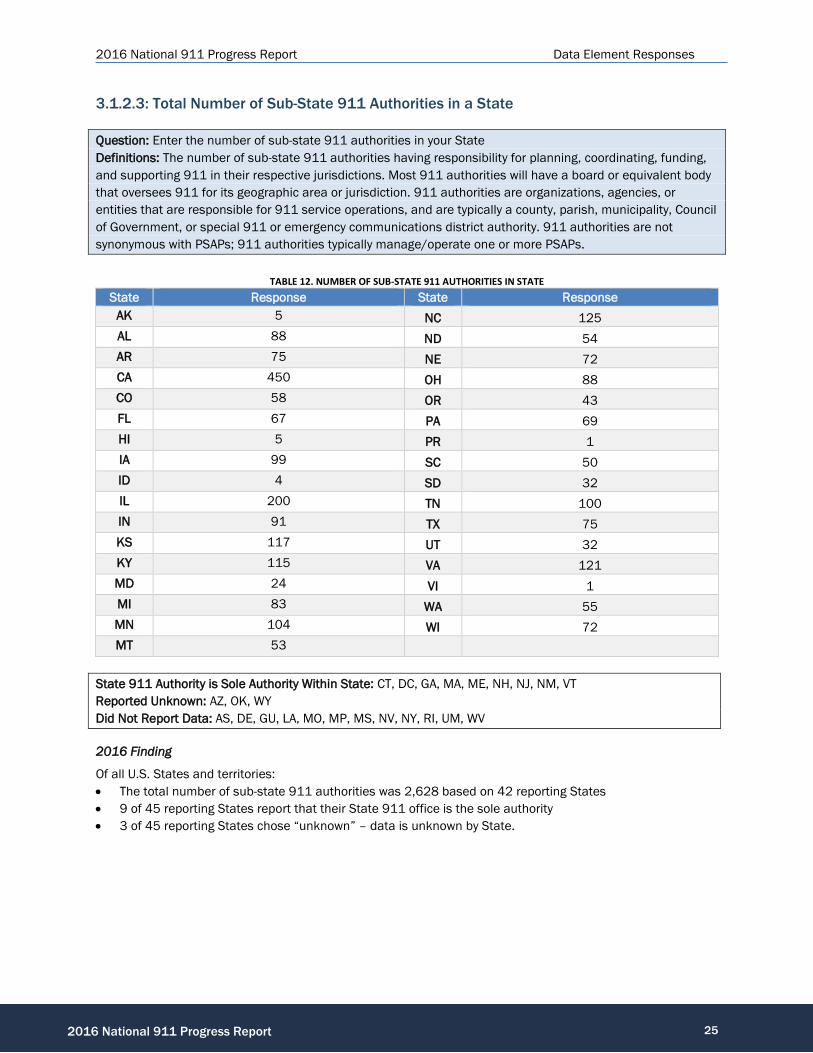
3.1.2.3: Total Number of Sub-State 911 Authorities in a State
Question: Enter the number of sub-state 911 authorities in your State Definitions: The number of sub-state 911 authorities having responsibility for planning, coordinating, funding, and supporting 911 in their respective jurisdictions. Most 911 authorities will have a board or equivalent body that oversees 911 for its geographic area or jurisdiction. 911 authorities are organizations, agencies, or entities that are responsible for 911 service operations, and are typically a county, parish, municipality, Council of Government, or special 911 or emergency communications district authority. 911 authorities are not synonymous with PSAPs; 911 authorities typically manage/operate one or more PSAPs.
TABLE 12. NUMBER OF SUB-STATE 911 AUTHORITIES IN STATE State Response State Response
AK 5 NC 125 AL 88 ND 54 AR 75 NE 72 CA 450 OH 88 CO 58 OR 43 FL 67 PA 69 HI 5 PR 1 IA 99 SC 50 ID 4 SD 32 IL 200 TN 100 IN 91 TX 75 KS 117 UT 32 KY 115 VA 121 MD 24 VI 1 MI 83 WA 55 MN 104 WI 72 MT 53
State 911 Authority is Sole Authority Within State: CT, DC, GA, MA, ME, NH, NJ, NM, VT Reported Unknown: AZ, OK, WY Did Not Report Data: AS, DE, GU, LA, MO, MP, MS, NV, NY, RI, UM, WV
2016 Finding
Of all U.S. States and territories: • The total number of sub-state 911 authorities was 2,628 based on 42 reporting States • 9 of 45 reporting States report that their State 911 office is the sole authority • 3 of 45 reporting States chose “unknown” – data is unknown by State.
25 2016 National 911 Progress Report
2016 National 911 Progress Report Data Element Responses
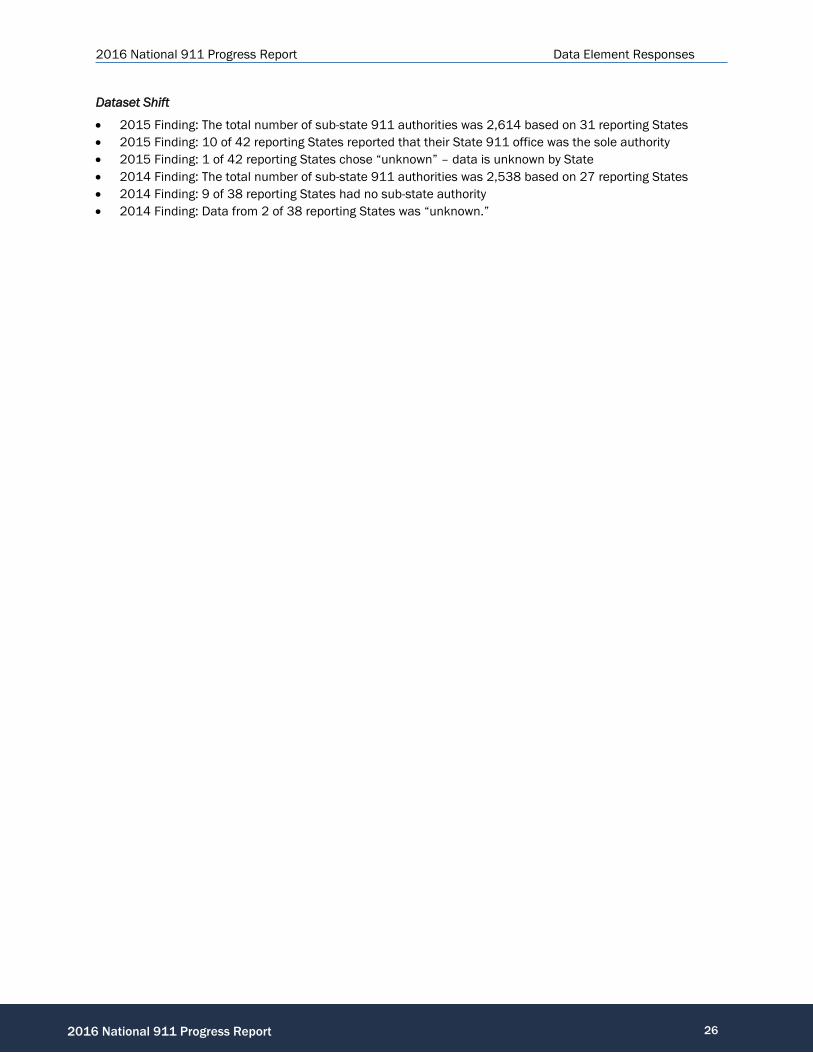
Dataset Shift
• 2015 Finding: The total number of sub-state 911 authorities was 2,614 based on 31 reporting States • 2015 Finding: 10 of 42 reporting States reported that their State 911 office was the sole authority • 2015 Finding: 1 of 42 reporting States chose “unknown” – data is unknown by State • 2014 Finding: The total number of sub-state 911 authorities was 2,538 based on 27 reporting States • 2014 Finding: 9 of 38 reporting States had no sub-state authority • 2014 Finding: Data from 2 of 38 reporting States was “unknown.”
26 2016 National 911 Progress Report

2016 National 911 Progress Report Data Element Responses
3.1.2.4: Data Element Sub-Group: Level of Service (LOS) Provided/Available, and Organized by Sub-State 911 Authority
3.1.2.4.1: No 911 Authority – Calls to 911 are Remote Call Forwarded Only
Question: Enter the number of counties in your State that have no 911 authority. Definition: The number of counties where there is no 911 service and where the telecommunications service providers, in compliance with the Federal Communications Commission’s (FCC) Fifth Report & Order, direct 911 calls to a PSAP in areas where one has been designated or, in areas where a PSAP has not been designated, to an existing statewide default answering point or another appropriate local emergency authority. The intent of this Order was to ensure that all 911 calls would be answered. These types of arrangements do not use dedicated 911 trunks. Carriers comply by using remote call forwarding. Remote call forwarding simply forwards a 911 call to a 10-digit telephone number, usually an existing emergency telephone number for the local or county law enforcement agency. This arrangement does not constitute 911 “service.”
The States that contain counties that do not have a 911 Authority are Illinois (IL) and Georgia (GA). Illinois responded to this data element with “13” counties and Georgia responded with “1” county. All Counties Have 911 Authority: AL, AR, CA, CO, CT, DC, FL, HI, IA, ID, IN, KS, KY, MA, MD, ME, MI, MN, MT, NC, ND, NE, NH, NJ, NM, OH, OR, PA, PR, SC, SD, TN, TX, UT, VA, VI, VT, WA, WI Reported Unknown: AK, AZ, OK, WY Did Not Report Data: AS, DE, GU, LA, MO, MP, MS, NV, NY, RI, UM, WV
2016 Finding
Of all U.S. States and territories: • The total number of counties with no 911 authority is 14 based on 45 reporting States • 39 of 45 reporting States are completely covered by one or more 911 authorities • Data from 4 of 45 reporting States is “unknown” – State did not respond to this data element.
Dataset Shift
• 2015 Finding: The total number of counties with no 911 authority was 13 based on 1 reporting State • 2015 Finding: 39 of 42 reporting States were completely covered by one or more 911 authorities • 2015 Finding: Data from 2 of 42 reporting States was “unknown” – State did not respond to this data
element • 2014 Finding: The total number of counties with no 911 authority was 10 based on 1 reporting State • 2014 Finding: 38 of 40 reporting States were completely covered by one or more 911 authorities • 2014 Finding: Data from 1 of 40 reporting States was “unknown.”
27 2016 National 911 Progress Report

2016 National 911 Progress Report Data Element Responses
3.1.2.4.2: Number of 911 Authorities Where LOS is Limited to Basic 911 Question: Enter the number of 911 authorities in your State that are limited to Basic 911. Definition: The number of 911 authorities where the “level of service” (LOS) is limited to Basic 911. NENA defines Basic 911 as, “An emergency telephone system which automatically connects 911 callers to a designated answering point. Call routing is determined by originating central office only. Basic 911 may or may not support ANI (automatic number identification) and/or ALI (automatic location identification).”
TABLE 13. NUMBER OF 911 AUTHORITIES IN STATE THAT ARE LIMITED TO BASIC 911
State Response State Response AR 4 KY 4 AZ 2 OK 18 GA 2 SD 2 IL 1
Not Limited to Basic 911: AK, AL, CA, CO, CT, DC, FL, HI, IA, ID, IN, KS, MA, MD, ME, MI, MN, MT, NC, ND, NE, NH, NJ, NM, OH, OR, PA, PR, SC, TN, TX, UT, VA, VI, VT, WA, WI Reported Unknown: WY Did Not Report Data: AS, DE, GU, LA, MO, MP, MS, NV, NY, RI, UM, WV
2016 Finding
Of all U.S. States and territories: • The total number of authorities limited to Basic 911 is 33 based on 45 reporting States • 37 of 45 reporting States are not limited to Basic 911.
Dataset Shift
• 2015 Finding: The total number of authorities limited to Basic 911 was 34 based on 7 reporting States • 2015 Finding: 35 of 42 reporting States were not limited to Basic 911 • 2014 Finding: The total number of authorities limited to Basic 911 was 29 based on 7 reporting States • 2014 Finding: 30 of 39 reporting States were not limited to Basic 911 • 2014 Finding: Data from 1 of 39 reporting States was “unknown.”
28 2016 National 911 Progress Report

2016 National 911 Progress Report Data Element Responses
3.1.2.4.3: Number of 911 Authorities with Enhanced 911 LOS
Question: Enter the number of 911 authorities in your State with Enhanced 911. *Note: The purpose of this question is to identify how many authorities have E911, and not imply that it is the “highest level” of 911 on a false continuum of Level of Service. Due to a lack of clarity in this question and definition, the data below may not be accurate. Definition: The number of 911 Authorities where the LOS is Enhanced 911 (E911). NENA defines E911 as, “a telephone system which includes network switching, data base and Public Safety Answering Point premise elements capable of providing automatic location identification data, selective routing, selective transfer, fixed transfer, and a call back number. The term also includes any E911 service so designated by the FCC in its Report and Order in WC Docket Nos. 04-36 and 05-196, or any successor proceeding.”9
TABLE 14. NUMBER OF 911 AUTHORITIES WITH ENHANCED 911
State Response State Response State Response
AK 5 KS 2 OK 74 AL 0 KY 0 OR 43 AR 75 MA 0 PA 69 AZ 17 MD 24 PR 0 CA 450 ME 1 SC 50 CO 0 MI 83 SD 30 CT 110 MN 104 TN 0 DC 1 MT 2 TX 0 FL 67 NC 0 UT 0 GA 4 ND 54 VA 121 HI 0 NE 72 VI 2 IA 0 NH 1 VT 0 ID 0 NJ 0 WA 12 IL 199 NM 1 WI 72 IN 91 OH 0
Did Not Report Data: AS, DE, GU, LA, MO, MP, MS, NV, NY, RI, UM, WV Reported Unknown: WY
9 Ibidem, p. 53.
29 2016 National 911 Progress Report

2016 National 911 Progress Report Data Element Responses
2016 Finding
Of all U.S. States and territories: • The total number of authorities with Enhanced 911 is 1,836 based on 45 reporting States • 15 of 45 reporting States have portions of their State without Enhanced 911 service.
Dataset Shift
• 2015 Finding: The total number of authorities with Enhanced 911 was 2,839 based on 39 reporting States
• 2015 Finding: 3 of 42 reporting States had portions of their State without Enhanced 911 service • 2014 Finding: The total number of authorities with Enhanced 911 was 1,918 based on 34 reporting
States • 2014 Finding: 4 of 39 reporting States had portions of their State without Enhanced 911 service • 2014 Finding: Data from 1 of 39 reporting States was “unknown.”
30 2016 National 911 Progress Report

2016 National 911 Progress Report Data Element Responses
3.1.2.4.4: Number of 911 Authorities with Wireless Phase I LOS as the Highest LOS Available
Question: Enter the number of 911 authorities in your State that provide Wireless Phase I (WPI) level of service, but do not include Wireless Phase II level of service. Definition: The number of 911 authorities that are capable of processing Wireless Phase I LOS calls as the highest level of wireless service available, but not capable of Wireless Phase II LOS. NENA defines Wireless Phase I as, “Required by FCC Report and Order 96-264 pursuant to Notice of Proposed Rulemaking (NPRM) 94-102. The delivery of a wireless 911 call with callback number and identification of the cell-tower from which the call originated. Call routing is usually determined by cell sector.”10
TABLE 15. NUMBER OF 911 AUTHORITIES WITH WPI AS HIGHEST LEVEL OF SERVICE State Response State Response
AZ 1 MT 2 CO 1 OK 18 GA 9 VI 2 IL 1
Do Not Provide WPI as the Highest LOS: AK, AL, AR, CA, CT, DC, FL, HI, IA, ID, IN, KS, KY, MA, MD, ME, MI, MN, NC, ND, NE, NH, NJ, NM, OH, OR, PA, PR, SC, SD, TN, TX, UT, VA, VT, WA, WI Did Not Report Data: AS, DE, GU, LA, MO, MP, MS, NV, NY, RI, UM, WV
2016 Finding Of all U.S. States and territories: • The total number of 911 authorities providing WPI as the highest LOS is 34 based on 45 reporting States.
Dataset Shift
• 2015 Finding: The total number of 911 authorities providing WPI as the highest LOS was 188 based on 9 reporting States
• 2014 Finding: The total number of authorities providing WPI as the highest LOS was 239 based on 8 reporting States
• This trend indicates that a majority of States have migrated to Wireless Phase II.
10 Ibidem p. 136.
31 2016 National 911 Progress Report

2016 National 911 Progress Report Data Element Responses
3.1.2.4.5: Number of 911 Authorities with Wireless Phase II LOS as the Highest LOS Available Question: Enter the number of 911 authorities in your State that provide Wireless Phase II (WPII) level of service. Definition: The number of 911 authorities that are capable of processing Wireless Phase II LOS calls as the Highest LOS available. NENA defines Wireless Phase II as, “Required by FCC Report and Order 96-264 pursuant to Notice of Proposed Rulemaking (NPRM) 94-102. The delivery of a wireless 911 call with Phase I requirements, plus location of the caller within 125 meters 67% of the time and Selective Routing based upon those coordinates. Subsequent FCC rulings have redefined the accuracy requirements.”
TABLE 16. NUMBER OF 911 AUTHORITIES WITH WPII AS THE HIGHEST LOS AVAILABLE State Response State Response State Response
AK 5 KS 115 OK 17 AL 88 KY 115 OR 43 AR 75 MA 1 PA 69 AZ 15 MD 24 PR 1 CA 450 ME 1 SC 50 CO 57 MI 83 SD 30 CT 110 MN 104 TN 100 DC 1 MT 51 TX 0 FL 67 NC 125 UT 32 GA 139 ND 54 VA 121 HI 5 NE 72 VI 2 IA 99 NH 1 VT 1 ID 46 NJ 1 WA 43 IL 199 NM 1 WI 71 IN 91 OH 88
Reported Unknown: WY Did Not Report Data: AS, DE, GU, LA, MO, MP, MS, NV, NY, RI, UM, WV
2016 Finding
Of all U.S. States and territories: • The total number of 911 authorities providing WPII as the highest LOS is 2,863 based on 45 reporting
States • Data from 1 of 45 reporting States is “unknown” – State did not respond to this data element.
Dataset Shift
• 2015 Finding: The total number of 911 authorities providing WPII as the highest LOS was 2,907 based on 41 reporting States
• 2015 Finding: Data from 1 of 42 reporting States is “unknown” – State did not respond to this data element
• 2014 Finding: Number of 911 authorities providing WPII as the highest LOS based on 36 reporting States was 2,247
• 2014 Finding: Data from 1 of 39 reporting States was “unknown.”
32 2016 National 911 Progress Report

2016 National 911 Progress Report Data Element Responses
3.1.2.4.6: Number of 911 Authorities that Provide Enhanced 911 LOS for VoIP
Question: Enter the number of 911 authorities in your State that provide E911 level of service for VoIP. Definition: The number of 911 authorities that provide E911 LOS for VoIP. NENA defines VoIP as, “Provides distinct packetized voice information in digital format using the Internet Protocol. The Internet Protocol (IP) address assigned to the user’s telephone number may be static or dynamic.” This category assumes the 911 authority provides a LOS that includes E911 for landline subscribers, Wireless Phase I and II to wireless subscribers.
TABLE 17. NUMBER OF 911 AUTHORITIES THAT PROVIDE E911 LOS FOR VOIP
State Response State Response State Response AK 1 KS 117 OR 43 AR 75 KY 115 PA 69 AZ 17 MA 1 PR 1 CA 450 MD 24 SC 50 CO 58 ME 1 SD 30 CT 110 MI 83 TN 100 DC 1 MN 104 TX 75 FL 67 NC 125 UT 32 HI 5 ND 54 VA 121 IA 99 NE 0 VT 1 ID 46 NH 1 WA 55 IL 199 NJ 1 IN 91 NM 1
Reported Unknown: AL, GA, MT, OH, OK, VI, WI, WY Did Not Report Data: AS, DE, GU, LA, MO, MP, MS, NV, NY, RI, UM, WV
2016 Finding Of all U.S. States and territories: • The total number of authorities providing E911 LOS for VoIP based on 45 reporting States is 2,423 • 1 of 45 responding States do not provide E911 LOS for VoIP • Data from 8 of 45 reporting States is “unknown” – State did not respond to this data element.
Dataset Shift
• 2015 Finding: The total number of authorities providing E911 LOS for VoIP based on 34 reporting States was 2,309
• 2015 Finding: 2 of 42 responding States do not provide E911 LOS for VoIP • 2015 Finding: Data from 6 of 42 reporting States is “unknown” – State did not respond to this data
element • 2014 Finding: The total number of authorities providing E911 LOS for VoIP based on 30 reporting States
was 1,773 • 2014 Finding: 3 of 39 responding States did not provide E911 LOS for VoIP • 2014 Finding: Data from 6 of 39 reporting States was “unknown.”
33 2016 National 911 Progress Report

2016 National 911 Progress Report Data Element Responses
3.1.2.5: Data Element Sub-Group: Percentage of Population and Land Area Served by Each Defined LOS
3.1.2.5.1: Percentage of Population with No 911 Authority
Question: Enter the percentage of population served with no 911 authority. Definition: Percentage of the State’s population residing in counties where there is no 911 service and where the telecommunications companies, in compliance with the FCC’s Fifth Report & Order, direct 911 calls to a PSAP in areas where one has been designated or, in areas where a PSAP has not been designated, to an existing statewide default answering point or another appropriate local emergency authority. The intent of this Order was to ensure that all 911 calls would get answered. These types of arrangements do not use dedicated 911 trunks. Carriers comply by using remote call forwarding. Remote call forwarding simply forwards a 911 call to a 10-digit telephone number, usually an existing emergency telephone number for the local or county law enforcement agency. This arrangement does not constitute 911 “service.”
TABLE 18. PERCENTAGE OF POPULATION WITH NO 911 AUTHORITY State Response (%) State Response (%)
AK 20 IL 1.07 AZ 1.00 NM 4.00
Provide 911 Service: AL, AR, CA, CO, CT, DC, FL, HI, IA, ID, IN, KS, KY, MA, MD, ME, MI, MN, MT, NC, ND, NE, NH, OH, OR, PA, PR, SC, SD, TN, TX, UT, VA, VI, VT, WA, WI Reported Unknown: GA, OK, WY Did Not Report Data: AS, DE, GU, LA, MO, MP, MS, NJ, NV, NY, RI, UM, WV
2016 Finding
Of all U.S. States and territories: • 4 of 44 reporting States partially rely on “remote call forwarding” • 37 of 44 reporting States do not rely on “remote call forwarding” • Data from 3 of 44 reporting States is “unknown” – State did not respond to this data element.
Dataset Shift
• 2015 Finding: 3 of 42 reporting States partially relied on “remote call forwarding” • 2015 Finding: 36 of 42 reporting States did not rely on “remote call forwarding” • 2015 Finding: Data from 3 of 42 reporting States was “unknown” – State did not respond to this data
element • 2014 Finding: 4 of 39 reporting States partially relied on “remote call forwarding” • 2014 Finding: 33 of 39 reporting States did not rely on “remote call forwarding” • 2014 Finding: Data from 2 of 39 reporting States was “unknown” • 2012 Finding: 17 of 27 reporting States did not rely on “remote call forwarding.”
34 2016 National 911 Progress Report

2016 National 911 Progress Report Data Element Responses
3.1.2.5.2: Percentage of Population Served by 911 Authorities with Basic 911 LOS Only
Question: Enter the percentage of population served by 911 authorities with Basic 911 LOS only. Definition: Percentage of population served by 911 authorities limited to Basic 911 LOS only. NENA defines Basic 911 as, “An emergency telephone system which automatically connects 911 callers to a designated answering point. Call routing is determined by originating central office only. Basic 911 may or may not support ANI and/or ALI.” 11
TABLE 19. PERCENTAGE OF POPULATION SERVED BY 911 AUTHORITIES WITH BASIC 911 LOS ONLY
State Response (%) State Response (%) AR 1.24 KY 1.00 IL 0.17 SD 1.4
Not limited to Basic 911 LOS: AK, AL, CA, CO, CT, DC, FL, HI, IA, ID, IN, KS, MA, MD, ME, MI, MN, NC, ND, NE, NH, NM, OH, OR, PA, PR, SC, TN, TX, UT, VA, VI, VT, WA, WI Reported Unknown: AZ, GA, MT, OK, WY Did Not Report Data: AS, DE, GU, LA, MO, MP, MS, NJ, NV, NY, RI, UM, WV
2016 Finding
A majority of States have migrated to E911. Of all U.S. States and territories: • 3 of 44 reporting States contain a population that relies on Basic 911 LOS only • 36 of 44 reporting States do not have 911 authorities with Basic 911 only • Data from 5 of 44 reporting States is “unknown” – State did not respond to this data element.
Dataset Shift
• 2015 Finding: 4 of 42 reporting States contained a population that relied on Basic 911 LOS only • 2015 Finding: 35 of 42 reporting States had no 911 authorities with Basic 911 only • 2015 Finding: Data from 3 of 42 reporting States was “unknown” – State did not respond to this data
element • 2014 Finding: 4 of 39 reporting States contained a population that relied on Basic 911 LOS only • 2014 Finding: 30 of 39 reporting States had no 911 authorities with Basic 911 only • 2014 Finding: Data from 5 of 39 reporting States was “unknown” • 2012 Finding: 17 of 27 reporting States did not have 911 authorities with Basic 911 only.
11 Ibidem, p. 23.
35 2016 National 911 Progress Report

2016 National 911 Progress Report Data Element Responses
3.1.2.5.3: Percentage of Population Served by 911 Authorities that Provide Enhanced 911 LOS
Question: Enter the percentage of population served by 911 authorities that provide Enhanced 911 LOS. Definition: Percentage of population served by 911 authorities that provide Enhanced 911 LOS. NENA defines E911 as, “A telephone system which includes network switching, data base and Public Safety Answering Point premise elements capable of providing automatic location identification data, selective routing, selective transfer, fixed transfer, and a call back number. The term also includes any E911 service so designated by the Federal Communications Commission in its Report and Order in WC Docket Nos. 04-36 and 05-196, or any successor proceeding.”12
TABLE 20. PERCENTAGE OF POPULATION SERVED BY 911 AUTHORITIES THAT PROVIDE ENHANCED 911 LOS
State Response (%) State Response (%) AK 80.00 NM 96.10 AZ 99.00 SD 98.60 NE 99.99
100% Population Served: CA, DC, FL, IA, IN, MD, ME, MI, MN, ND, NE, NH, OR, PA, TN, UT, VA, VI, WI Reported Unknown: GA, MT, OK, WY Did Not Report Data: AS, DE, GU, LA, MO, MP, MS, NJ, NV, NY, RI, UM, WV
2016 Finding
Of all U.S. States and territories: • 19 of 44 reporting States provide E911 LOS to 100% of its population • 4 of 44 reporting States provide E911 LOS to at least 80% of its population • Data from 4 of 44 reporting States is “unknown” – State did not respond to this data element.
Dataset Shift
• 2015 Finding: 32 of 42 reporting States provided E911 LOS to 100% of its population • 2015 Finding: 7 of 42 reporting States provided E911 LOS to at least 80% of its population • 2015 Finding: Data from 3 of 42 reporting States was “unknown” – State did not respond to this data
element • 2014 Finding: 28 of 39 reporting States provided E911 LOS to 100% of its population • 2014 Finding: 8 of 39 reporting States provided E911 LOS to at least 80% of its population • 2014 Finding: Data from 3 of 39 reporting States was “unknown.”
12 Ibidem, p. 53.
36 2016 National 911 Progress Report

2016 National 911 Progress Report Data Element Responses
3.1.2.5.4: Percentage of Population Served by 911 Authorities that Provide Wireless Phase I (WPI) LOS as the Highest LOS Available Question: Enter the percentage of population served by 911 authorities that provide Wireless Phase I (WPI) LOS, but do not include Wireless Phase II LOS. Definition: Percentage of population served by 911 authorities that provide Phase I LOS, but not Wireless Phase II LOS. NENA defines Wireless Phase I as, “Required by FCC Report and Order 96-264 pursuant to Notice of Proposed Rulemaking (NPRM) 94-102. The delivery of a wireless 911 call with callback number and identification of the cell-tower from which the call originated. Call routing is usually determined by cell sector.”13
TABLE 21. POPULATION PERCENTAGE SERVED BY 911 AUTHORITIES THAT PROVIDE WPI LOS, BUT NOT WPII LOS
State Response (%) State Response (%) AZ 10 IL 0.17 CO 0.08 VI 100
Provide WPI: AK, AL, AR, CA, CT, DC, FL, HI, IA, IN, KS, KY, MA, MD, ME, MI, MN, NC, ND, NE, NH, NJ, NM, OH, OR, PA, PR, SC, SD, TN, TX, UT, VA, WA, WI Reported Unknown: GA, MT, OK, WA, WY Did Not Report Data: AS, DE, GU, LA, MO, MP, MS, NJ, NV, NY, RI, UM, WV
2016 Finding
Of all U.S. States and territories: • 1 of 44 reporting States provide WPI LOS to 100% or nearly 100% of its population • 3 of 44 reporting States provide only WPI LOS to at most 10% of its population • Data from 5 of 44 reporting States is “unknown” – State did not respond to this data element.
Dataset Shift
• 2015 Finding: 4 of 42 reporting States provided only WPI LOS to at most 1% of its population • 2015 Finding: Data from 3 of 42 reporting States was “unknown” – State did not respond to this data
element • 2014 Finding: 30 of 39 reporting States provided WPI LOS to 95-100% of its population • 2014 Finding: 3 of 39 reporting States provided WPI LOS to at most 2% of its population • 2014 Finding: Data from 3 of 39 reporting States was “unknown.”
13 Ibidem, p. 136.
37 2016 National 911 Progress Report

2016 National 911 Progress Report Data Element Responses
3.1.2.5.5: Percentage of Population Served by 911 Authorities that Provide Wireless Phase II (WPII) LOS as the Highest LOS Available Question: Enter the percentage of population served by 911 authorities that provide Wireless Phase II (WPII) LOS as the Highest LOS available. Definition: Percentage of population served by 911 authorities that provide Wireless Phase II LOS. NENA defines Wireless Phase II as, “Required by FCC Report and Order 96-264 pursuant to Notice of Proposed Rulemaking (NPRM) 94-102. The delivery of a wireless 911 call with Phase I requirements, plus location of the caller within 125 meters 67% of the time and Selective Routing based upon those coordinates. Subsequent FCC rulings have redefined the accuracy requirements.” This category assumes the 911 authority provides a LOS that includes E911 for landline subscribers, Wireless Phase I and II to wireless subscribers.14
TABLE 22. PERCENTAGE OF POPULATION SERVED BY 911 AUTHORITIES THAT PROVIDE WPII LOS AS HIGHEST LOS State Response (%) State Response (%)
AK 80.00 NE 99.99 AR 75.00 NM 99.00 AZ 95.00 PR 1.00 CO 99.92 SD 98.60 IL 98.93 WI 99.50
100% Population Served: AL, CA, CT, DC, FL, HI, IA, ID, IN, KS, KY, MA, MD, ME, MI, MN, NC, ND, NH, OH, OR, PA, SC, TN, TX, UT, VA, VT, WA Reported Unknown: GA, MT, OK, WY Did Not Report Data: AS, DE, GU, LA, MO, MP, MS, NJ, NV, NY, RI, UM, WV
2016 Finding
All States are served by WPII. Of all U.S. States and territories: • 38 of 44 reporting States provide WPII LOS to 100% or at least 75% of its population (29 reporting States
provide WPII LOS to 100% of its population; another 6 States provide WPII LOS to 98.6% or more of its population, and 3 reporting States provide WPII LOS to 75% or more of its population)
• Data from 4 of 44 reporting States is “unknown” – State did not respond to this data element.
Dataset Shift
• 2015 Finding: 38 of 42 reporting States provided WPII LOS to 100% or nearly 100% of its population • 2015 Finding: 1 of 42 reporting States provided WPII LOS to at least 80% of its population • 2015 Finding: Data from 3 of 42 reporting States was “unknown” – State did not respond to this data
element • 2014 Finding: 24 of 39 reporting States provided WPII LOS to 100% of its population • 2014 Finding: 8 of 39 reporting States provided WPII LOS to at least 80% of its population • 2014 Finding: Data from 4 of 39 reporting States was “unknown” • 2012 Finding: 3 of 39 reporting States provided WPII LOS to 0-8% of its population.
14 Ibidem, p. 137.
38 2016 National 911 Progress Report

2016 National 911 Progress Report Data Element Responses
3.1.2.5.6: Percentage of Population Served by 911 Authorities that Provide Enhanced 911 LOS for VoIP Question: Enter the percentage of population served by 911 authorities that provide Enhanced 911 LOS for VoIP. Definition: Percentage of population served by 911 authorities limited to Wireless Phase II and VoIP LOS. NENA defines Wireless Phase I and II as defined in elements 3.1.2.5.4 and 3.1.2.5.5 above, and VoIP as, “Provides distinct packetized voice information in digital format using the Internet Protocol. The IP address assigned to the user’s telephone number may be static or dynamic.”15 This category assumes the 911 authority provides a LOS that includes E911 for landline subscribers, Wireless Phase I and II to wireless subscribers.
TABLE 23. PERCENTAGE OF POPULATION SERVED BY 911 AUTHORITIES THAT PROVIDE ENHANCED 911 LOS FOR VOIP
State Response (%) State Response (%) AK 41.00 NM 99.00 AZ 95.00 PR 1.00 ID 80.00 SD 98.6 IL 98.93 VI 0.00 KY 99.00
100% Population Served: AR, CA, CO, CT, DC, FL, HI, IA, IN, KS, MA, MD, ME, MI, MN, NC, ND, NH, OR, PA, SC, TN, TX, UT, VA, VT, WA Reported Unknown: AL, GA, MT, NE, OH, OK, WI, WY Did Not Report Data: AS, DE, GU, LA, MO, MP, MS, NJ, NV, NY, RI, UM, WV
2016 Finding
Of all U.S. States and territories: • 27 of 44 reporting States provide E911 LOS for VoIP to 100% of its population • 6 of 44 reporting States provide E911 LOS for VoIP to at least 80% of its population • 3 of 44 reporting States provide E911 LOS for VoIP to 41% or less of its population • Data from 8 of 44 reporting States is “unknown” – State did not respond to this data element.
Dataset Shift
• 2015 Finding: 28 of 42 reporting States provided E911 LOS for VoIP to 100% of its population • 2015 Finding: 5 of 42 reporting States provided E911 LOS for VoIP to at least 96% of its population • 2015 Finding: 3 of 42 reporting States provided E911 LOS for VoIP to 0-40% of its population • 2015 Finding: Data from 6 of 42 reporting States was “unknown” • 2014 Finding: 30 of 39 reporting States provided E911 LOS for VoIP to 100% of its population • 2014 Finding: 4 of 39 reporting States provided E911 LOS for VoIP to at least 90% of its population • 2014 Finding: Data from 7 of 39 reporting States was “unknown” • 2012 Finding: 4 of 39 reporting States provided E911 LOS for VoIP to 0-5.45% of its population.
15 Ibidem, p. 134.
39 2016 National 911 Progress Report

2016 National 911 Progress Report Data Element Responses
3.1.2.5.7: Percentage of Geographic Area with No 911 Authority
Question: Enter the percentage of geographic area with no 911 authority. Definition: Percentage of geographic area with no 911 authority is where there is no 911 service and where the telecommunications companies, in compliance with the FCC’s Fifth Report & Order, direct 911 calls to a PSAP in areas where one has been designated or, in areas where a PSAP has not been designated, to an existing statewide default answering point or another appropriate local emergency authority. The intent of this Order was to ensure that all 911 calls would be answered. These types of arrangements do not use dedicated 911 trunks. Carriers comply by using remote call forwarding. Remote call forwarding simply forwards a 911 call to a 10-digit telephone number, usually an existing emergency telephone number for the local or county law enforcement agency. This arrangement does not constitute 911 “service.”
TABLE 24. PERCENTAGE OF GEOGRAPHIC AREA WITH NO 911 AUTHORITY
State Response (%) State Response (%) AK 92 IL 9.7 AZ 2.0 NM 4.7
100% of Geographic Area has 911 Authority: AL, AR, CA, CO, CT, DC, FL, HI, IA, ID, IN, KS, KY, MA, MD, ME, MI, MN, NC, ND, NE, NH, NJ, OH, OR, PA, SC, SD, TN, TX, UT, VA, VI, VT, WA, WI Reported Unknown: GA, MT, OK, WY Did Not Report Data: AS, DE, GU, LA, MO, MP, MS, NV, NY, RI, UM, WV
2016 Finding
Of all U.S. States and territories: • 4 of 45 reporting States rely on “Remote Call Forwarding” • 37 of 45 reporting States do not rely on “Remote Call Forwarding.”
Dataset Shift
• 2015 Finding: 5 of 42 reporting States relied on “Remote Call Forwarding” • 2015 Finding: 34 of 42 reporting States did not rely on “Remote Call Forwarding” • 2014 Finding: 4 of 39 reporting States relied on “Remote Call Forwarding” • 2014 Finding: 33 of 39 reporting States did not rely on “Remote Call Forwarding” • 2014 Finding: Data from 2 of 39 reporting States was “unknown.”
40 2016 National 911 Progress Report

2016 National 911 Progress Report Data Element Responses
3.1.2.5.8: Percentage of Geographic Area Served by 911 Authorities with Basic 911 LOS Only Question: Enter the percentage of geographic area served by 911 authorities with Basic 911 LOS only. Definition: Percentage of geographic area served by 911 authorities limited to Basic 911 LOS only. NENA defines Basic 911 as, “An emergency telephone system which automatically connects 911 callers to a designated answering point. Call routing is determined by originating central office only. Basic 911 may or may not support ANI and/or ALI.”16
TABLE 25. PERCENTAGE OF GEOGRAPHIC AREA SERVED BY 911 AUTHORITIES WITH BASIC LOS ONLY
State Response (%) State Response (%) IL 0.01 NM 4.70 KY 3.47 SD 2.40
Not limited to Basic 911 LOS: AK, AL, CA, CO, CT, DC, FL, HI, IA, ID, IN, KS, MA, MD, ME, MI, MN, NC, ND, NE, NH, NJ, OH, OR, PA, PR, SC, TN, TX, UT, VA, VI, VT, WA, WI Reported Unknown: AR, AZ, GA, MT, OK, WY Did Not Report Data: AS, DE, GU, LA, MO, MP, MS, NV, NY, RI, UM, WV
2016 Finding
A majority of States have migrated to E911. Of all U.S. States and territories: • 4 of 45 reporting States contain a geographic area that relies on Basic 911 LOS only • 35 of 45 reporting States do not rely on Basic 911 LOS only • Data from 6 of 45 reporting States is “unknown” – State did not respond to this data element.
Dataset Shift
• 2015 Finding: 5 of 42 reporting States contained a geographic area that relies on Basic 911 LOS only • 2015 Finding: 33 of 42 reporting States did not rely on Basic 911 LOS only • 2015 Finding: Data from 4 of 42 reporting States was “unknown” – State did not respond to this data
element • 2014 Finding: 5 of 39 reporting States contained a geographic area that relied on Basic 911 LOS only • 2014 Finding: 32 of 39 reporting States did not rely on Basic 911 LOS only • 2014 Finding: Data from 2 of 39 reporting States was “unknown.”
16 Ibidem, p 23.
41 2016 National 911 Progress Report
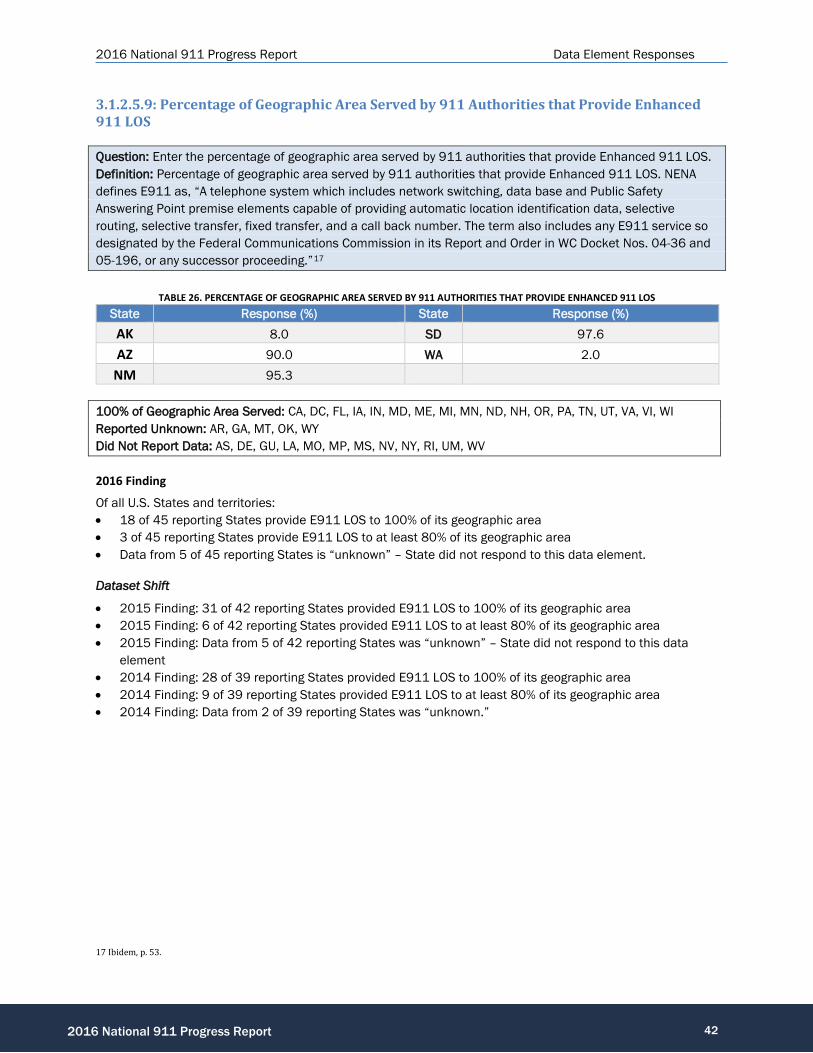
2016 National 911 Progress Report Data Element Responses
3.1.2.5.9: Percentage of Geographic Area Served by 911 Authorities that Provide Enhanced 911 LOS Question: Enter the percentage of geographic area served by 911 authorities that provide Enhanced 911 LOS. Definition: Percentage of geographic area served by 911 authorities that provide Enhanced 911 LOS. NENA defines E911 as, “A telephone system which includes network switching, data base and Public Safety Answering Point premise elements capable of providing automatic location identification data, selective routing, selective transfer, fixed transfer, and a call back number. The term also includes any E911 service so designated by the Federal Communications Commission in its Report and Order in WC Docket Nos. 04-36 and 05-196, or any successor proceeding.”17
TABLE 26. PERCENTAGE OF GEOGRAPHIC AREA SERVED BY 911 AUTHORITIES THAT PROVIDE ENHANCED 911 LOS
State Response (%) State Response (%) AK 8.0 SD 97.6 AZ 90.0 WA 2.0
NM 95.3
100% of Geographic Area Served: CA, DC, FL, IA, IN, MD, ME, MI, MN, ND, NH, OR, PA, TN, UT, VA, VI, WI Reported Unknown: AR, GA, MT, OK, WY Did Not Report Data: AS, DE, GU, LA, MO, MP, MS, NV, NY, RI, UM, WV
2016 Finding
Of all U.S. States and territories: • 18 of 45 reporting States provide E911 LOS to 100% of its geographic area • 3 of 45 reporting States provide E911 LOS to at least 80% of its geographic area • Data from 5 of 45 reporting States is “unknown” – State did not respond to this data element.
Dataset Shift
• 2015 Finding: 31 of 42 reporting States provided E911 LOS to 100% of its geographic area • 2015 Finding: 6 of 42 reporting States provided E911 LOS to at least 80% of its geographic area • 2015 Finding: Data from 5 of 42 reporting States was “unknown” – State did not respond to this data
element • 2014 Finding: 28 of 39 reporting States provided E911 LOS to 100% of its geographic area • 2014 Finding: 9 of 39 reporting States provided E911 LOS to at least 80% of its geographic area • 2014 Finding: Data from 2 of 39 reporting States was “unknown.”
17 Ibidem, p. 53.
42 2016 National 911 Progress Report

2016 National 911 Progress Report Data Element Responses
3.1.2.5.10: Percentage of Geographic Area Served by 911 Authorities that Provide Wireless Phase I (WPI) LOS as the Highest LOS Available Question: Enter the percentage of geographic area served by 911 authorities that provide Wireless Phase I (WPI) LOS, but do not include Wireless Phase II LOS. Definition: Percentage of geographic area served by 911 authorities that provide Wireless Phase I LOS, but not Wireless Phase II LOS. NENA defines Wireless Phase I as, “Required by FCC Report and Order 96-264 pursuant to Notice of Proposed Rulemaking (NPRM) 94-102. The delivery of a wireless 911 call with callback number and identification of the cell-tower from which the call originated. Call routing is usually determined by cell sector.”18
TABLE 27. PERCENTAGE OF GEOGRAPHIC AREA SERVED BY 911 AUTHORITIES THAT PROVIDE WPI LOS, BUT NOT WPII
State Response (%) State Response (%) AZ 0.01 VI 100.00 CO 0.66 WA 2.00 IL 0.01
Provide WPI to 100% of Geographic Area: VI Reported Unknown: GA, MT, OK, WY Did Not Report Data: AS, DE, GU, LA, MO, MP, MS, NV, NY, RI, UM, WV
2016 Finding Of all U.S. States and territories: • 1 of 45 reporting States provide WPI LOS to 100% of its geographic area as the highest LOS available • 4 of 45 reporting States only provide WPI LOS to at most 2% of its geographic area • Data from 4 of 45 reporting States is “unknown” – State did not respond to this data element.
Dataset Shift
• 2015 Finding: 35 of 42 reporting States provided WPI LOS to 100% of its geographic area • 2015 Finding: 3 of 42 reporting States only provided WPI LOS to at most 2% of its geographic area • 2015 Finding: Data from 4 of 42 reporting States was “unknown” – State did not respond to this data
element • 2014 Finding: 33 of 39 reporting States provided WPI LOS to 100% of its geographic area • 2014 Finding: 4 of 39 reporting States only provided WPI LOS to at most 2% of its geographic area • 2014 Finding: Data from 2 of 39 reporting States was “unknown.”
18 Ibidem p. 136
43 2016 National 911 Progress Report

2016 National 911 Progress Report Data Element Responses
3.1.2.5.11: Percentage of Geographic Area Served by 911 Authorities that Provide Wireless Phase II (WPII) LOS as the Highest LOS Available Question: Enter the percentage of geographic area served by 911 authorities that provide Wireless Phase II (WPII) LOS as the Highest LOS available. Definition: Percentage of geographic area served by 911 authorities that provide Wireless Phase II LOS. NENA defines Wireless Phase II as, “Required by FCC Report and Order 96-264 pursuant to Notice of Proposed Rulemaking (NPRM) 94-102. The delivery of a wireless 911 call with Phase I requirements, plus location of the caller within 125 meters 67% of the time and Selective Routing based upon those coordinates. Subsequent FCC rulings have redefined the accuracy requirements.” 19
TABLE 28. PERCENTAGE OF GEOGRAPHIC AREA SERVED BY 911 AUTHORITIES THAT PROVIDE WPII LOS AS HIGHEST LOS
State Response (%) State Response (%) AK 8.00 NM 99.00 AR 75.00 PR 1.00 AZ 95.00 SD 97.60 CO 99.34 VI 0.00 IL 99.99 WA 98.00 NE 99.99
100% Geographic Area Served: AL, CA, CT, DC, FL, IA, ID, IN, KS, KY, MA, MD, ME, MI, MN, NC, ND, NH, NJ, OH, OR, PA, SC, TN, TX, UT, VA, VT Reported Unknown: GA, HI, MT, OK, WI, WY Did Not Report Data: AS, DE, GU, LA, MO, MP, MS, NV, NY, RI, UM, WV
2016 Finding
A majority of States are served by WPII. Of all U.S. States and territories: • 28 of 45 reporting States provide WPII LOS to 100% of its geographic area • 6 of 45 reporting States provide WPII LOS to at least 96% of its geographic area • 2 of 45 reporting States provide WPII LOS to less than 96%, but more than 8% of its geographic area • 3 of 45 reporting States provide WPII LOS to 0-8% of its geographic area • Data from 6 of 45 reporting States is “unknown” – State did not respond to this data element.
19 Ibidem, p. 137.
44 2016 National 911 Progress Report

2016 National 911 Progress Report Data Element Responses
Dataset Shift
• 2015 Finding: 29 of 42 reporting States provided WPII LOS to 100% of its geographic area • 2015 Finding: 6 of 42 reporting States provided WPII LOS to at least 96% of its geographic area • 2015 Finding: 3 of 42 reporting States provided WPII LOS to 0-8% of its geographic area • 2015 Finding: Data from 4 of 42 reporting States was “unknown” • 2014 Finding: 26 of 39 reporting States provided WPII LOS to 100% of its geographic area • 2014 Finding: 9 of 39 reporting States provided WPII LOS to at least 80% of its geographic area • 2014 Finding: 2 of 39 reporting States provided WPII LOS to 0% of its geographic area • 2014 Finding: Data from 2 of 39 reporting States was “unknown.”
45 2016 National 911 Progress Report

2016 National 911 Progress Report Data Element Responses
3.1.2.5.12: Percentage of Geographic Area Served by 911 Authorities that Provide Enhanced 911 LOS for VoIP Question: Enter the percentage of geographic area served by 911 Authorities that provide Enhanced 911 LOS for VoIP. Definition: Percentage of geographic area served by 911 Authorities that provide E911 LOS to VoIP users. NENA defines VoIP as, “Provides distinct packetized voice information in digital format using the Internet Protocol. The IP address assigned to the user’s telephone number may be static or dynamic.” This category assumes the 911 authority provides a LOS that includes E911 for landline subscribers, Wireless Phase I and II to wireless subscribers.20
TABLE 29. PERCENTAGE OF GEOGRAPHIC AREA SERVED BY 911 AUTHORITIES THAT PROVIDE E911 LOS FOR VOIP
State Response (%) State Response (%) AK 0.30 KY 96.53 AZ 95.00 NM 95.30 ID 80.00 SD 97.60 IL 99.99
100% Geographic Area Served: AR, CA, CO, CT, DC, FL, HI, IA, IN, KS, MA, MD, ME, MI, MN, NC, ND, NH, NJ, OR, PA, SC, TN, TX, UT, VA, VT, WA Reported Unknown: AL, GA, MT, NE, OH, OK, WI, WY Did Not Report Data: AS, DE, GU, LA, MO, MP, MS, NV, NY, RI, UM, WV
2015 Finding
Of all U.S. States and territories: • 29 of 45 reporting States provide E911 LOS for VoIP to 100% of its geographic area • 4 of 45 reporting States provide E911 LOS for VoIP to at least 90% of its geographic area • 4 of 45 reporting States provide E911 LOS for VoIP to 0-80% of its geographic area • Data from 8 of 45 reporting States is “unknown” – State did not respond to this data element.
Dataset Shift
• 2015 Finding: 28 of 42 reporting States provided E911 LOS for VoIP to 100% of its geographic area • 2015 Finding: 5 of 42 reporting States provided E911 LOS for VoIP to at least 90% of its geographic area • 2015 Finding: 3 of 42 reporting States provided E911 LOS for VoIP to 0-5.45% of its geographic area • 2015 Finding: Data from 6 of 42 reporting States was “unknown” – State did not respond to this data
element • 2014 Finding: 24 of 39 reporting States provided E911 LOS for VoIP to 100% of its geographic area • 2014 Finding: 4 of 39 reporting States provided E911 LOS for VoIP to at least 95% of its geographic area • 2014 Finding: Data from 7 of 39 reporting States was “unknown” • 2012 Finding: 4 of 39 reporting States provided E911 LOS for VoIP to 0-41% of its geographic area.
20 Ibidem, p. 134.
46 2016 National 911 Progress Report

2016 National 911 Progress Report Data Element Responses
3.1.2.6: State Adoption of Common Definitions for Each LOS
Question: Has your State adopted commonly used definitions for each level of service? Definition: This element asserts that a State has adopted commonly used definitions for LOS categories.
FIGURE 7. STATE RESPONSES REGARDING ADOPTION OF COMMONLY USED DEFINITIONS
TABLE 30. STATE RESPONSES REGARDING ADOPTION OF COMMONLY USED DEFINITIONS
Response State
Yes AL, AZ, CA, CO, CT, DC, FL, GA, IA, ID, IL, IN, KY, MA, MD, ME, MN, NC, NH, NM, OH, OR, PA, SC, SD, TN, TX, UT, VA, VT, WA, WI
No AK, AR, HI, KS, MT, ND, NE, NJ, OK, PR, VI
Reported Unknown MI, WY
Did Not Report Data AS, DE, GU, LA, MO, MP, MS, NV, NY, RI, UM, WV
47 2016 National 911 Progress Report

2016 National 911 Progress Report Data Element Responses
2016 Finding
Of all U.S. States and territories: • 28 of 45 reporting States have adopted their own common definition of each level of service • 14 of 45 reporting States have not adopted their own common definition of each level of service • 2 of 45 reporting States are “unknown” – State did not respond to this data element.
Dataset Shift
• 2015 Finding: 26 of 42 reporting States adopted their own common definition of each level of service • 2015 Finding: 14 of 42 reporting States did not adopt their own common definition of each level of service • 2015 Finding: 2 of 42 reporting States were “unknown” – State did not respond to this data element • 2015 Finding: Findings show about half of all U.S. States and territories adopted common definitions for
each level of service. • 2014 Finding: 25 of 39 reporting States adopted their own common definition • 2014 Finding: 10 of 39 reporting States did not adopt their own common definition • 2014 Finding: 4 of 39 reporting States were “unknown” – State did not respond to this data element • 2012 Finding: 15 of 26 reporting States adopted their own common definition.
48 2016 National 911 Progress Report

2016 National 911 Progress Report Data Element Responses
3.1.2.7: Nationally Standardized Service Level Definitions
Question: Has your State utilized nationally standardized definitions for each level of service? Definition: This element asserts that the State has utilized nationally standardized service level definitions.
FIGURE 8. STATE RESPONSES REGARDING NATIONALLY STANDARIZED SERVICE LEVEL DEFINITIONS
TABLE 31. STATE RESPONSES REGARDING NATIONALLY STANDARDIZED DEFINITIONS
Response State
Yes AL, AR, AZ, CA, CT, DC, FL, HI, IA, ID, IL, KY, MD, ME, MN, MT, NC, ND, NH, NJ, OH, OR, PA, PR, SC, TN, TX, UT, VT, WA
No AK, CO, IN, KS, MA, NE, NM, OK, SD, VA, VI
Reported Unknown GA, MI, WI, WY
Did Not Report Data AS, DE, GU, LA, MO, MP, MS, NV, NY, RI, UM, WV
49 2016 National 911 Progress Report

2016 National 911 Progress Report Data Element Responses
2016 Finding Of all U.S. States and territories: • 30 of 46 reporting States have utilized nationally standardized definitions for each level of service • 11 of 46 reporting States have not utilized nationally standardized definitions for each level of service • 4 of 46 reporting States are “unknown” – State did not respond to this data element • Findings show more than half of all U.S. States and territories have utilized nationally standardized
definitions for each level of service.
Dataset Shift
• 2015 Finding: 29 of 42 reporting States utilized nationally standardized definitions for each level of service
• 2015 Finding: 10 of 42 reporting States did not utilize nationally standardized definitions for each level of service
• 2015 Finding: 3 of 42 reporting States were “unknown” – State did not respond to this data element • 2014 Finding: 27 of 39 reporting States utilized nationally standardized definitions • 2014 Finding: 8 of 39 reporting States did not utilize nationally standardized definitions • 2014 Finding: 4 of 39 reporting States were “unknown” – State did not respond to this data element • 2012 Finding: 17 of 26 reporting States utilized nationally standardized definitions.
50 2016 National 911 Progress Report

2016 National 911 Progress Report Data Element Responses
3.1.2.8: Data Element Sub-Group: Total Number of Primary and Secondary PSAPs within a State
3.1.2.8.1: Total Number of Primary PSAPs within a State
Question: Enter the number of primary PSAPs within your State. Definition: NENA defines a primary PSAP as, “A PSAP to which 911 calls are routed directly from the 911 Control Office.” 21
TABLE 32. NUMBER OF PRIMARY PSAPS State Response State Response State Response
AK 33 KS 117 OR 43 AL 118 KY 115 PA 69 AR 103 MA 249 PR 2 AZ 87 MD 24 SC 75 CA 399 ME 26 SD 32 CO 89 MI 145 TN 140 CT 107 MN 99 TX 469 DC 1 MT 53 UT 32 FL 154 NC 125 VA 121 GA 135 ND 21 VI 2 HI 6 NE 72 VT 6 IA 113 NH 2 WA 57 ID 46 NM 43 WY 49 IL 253 OH 128 IN 91 OK 144
Total Primary PSAPs: 4,195
Reported Unknown: NJ, WI Did Not Report Data: AS, DE, GU, LA, MO, MP, MS, NV, NY, RI, UM, WV
2016 Finding
Of all U.S. States and territories: • 0 of 45 reporting States indicated they do not have primary PSAPs • 2 of 45 reporting States are “unknown” – State did not respond to this data element.
Dataset Shift
• 2015 Finding: 7 of 42 reporting States indicated they did not have secondary PSAPs • 2015 Finding: 6 of 42 reporting States were “unknown” – State did not respond to this data element • 2014 Finding: 8 of 32 reporting States indicated they did not have secondary PSAPs • 2014 Finding: 7 of 32 reporting States were “unknown” – State did not respond to this data element.
21 Ibidem, p. 98.
51 2016 National 911 Progress Report
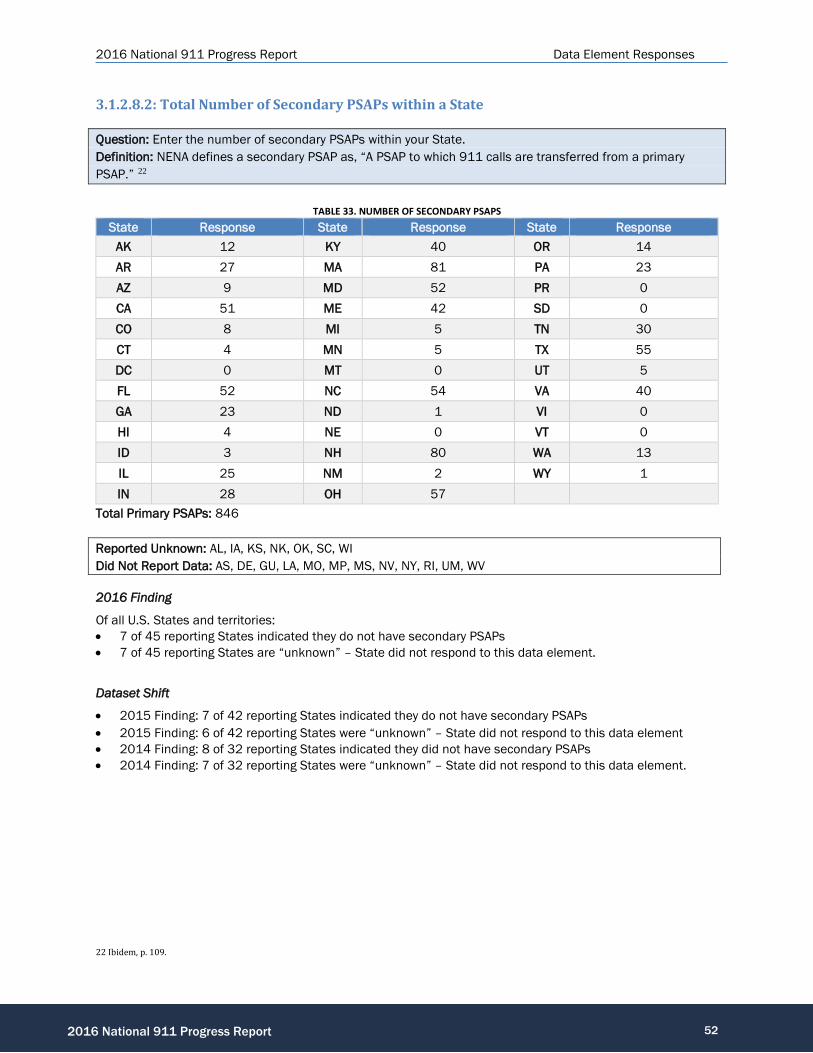
2016 National 911 Progress Report Data Element Responses
3.1.2.8.2: Total Number of Secondary PSAPs within a State
Question: Enter the number of secondary PSAPs within your State. Definition: NENA defines a secondary PSAP as, “A PSAP to which 911 calls are transferred from a primary PSAP.” 22
TABLE 33. NUMBER OF SECONDARY PSAPS
State Response State Response State Response AK 12 KY 40 OR 14 AR 27 MA 81 PA 23 AZ 9 MD 52 PR 0 CA 51 ME 42 SD 0 CO 8 MI 5 TN 30 CT 4 MN 5 TX 55 DC 0 MT 0 UT 5 FL 52 NC 54 VA 40 GA 23 ND 1 VI 0 HI 4 NE 0 VT 0 ID 3 NH 80 WA 13 IL 25 NM 2 WY 1 IN 28 OH 57
Total Primary PSAPs: 846
Reported Unknown: AL, IA, KS, NK, OK, SC, WI Did Not Report Data: AS, DE, GU, LA, MO, MP, MS, NV, NY, RI, UM, WV
2016 Finding
Of all U.S. States and territories: • 7 of 45 reporting States indicated they do not have secondary PSAPs • 7 of 45 reporting States are “unknown” – State did not respond to this data element. Dataset Shift
• 2015 Finding: 7 of 42 reporting States indicated they do not have secondary PSAPs • 2015 Finding: 6 of 42 reporting States were “unknown” – State did not respond to this data element • 2014 Finding: 8 of 32 reporting States indicated they did not have secondary PSAPs • 2014 Finding: 7 of 32 reporting States were “unknown” – State did not respond to this data element.
22 Ibidem, p. 109.
52 2016 National 911 Progress Report
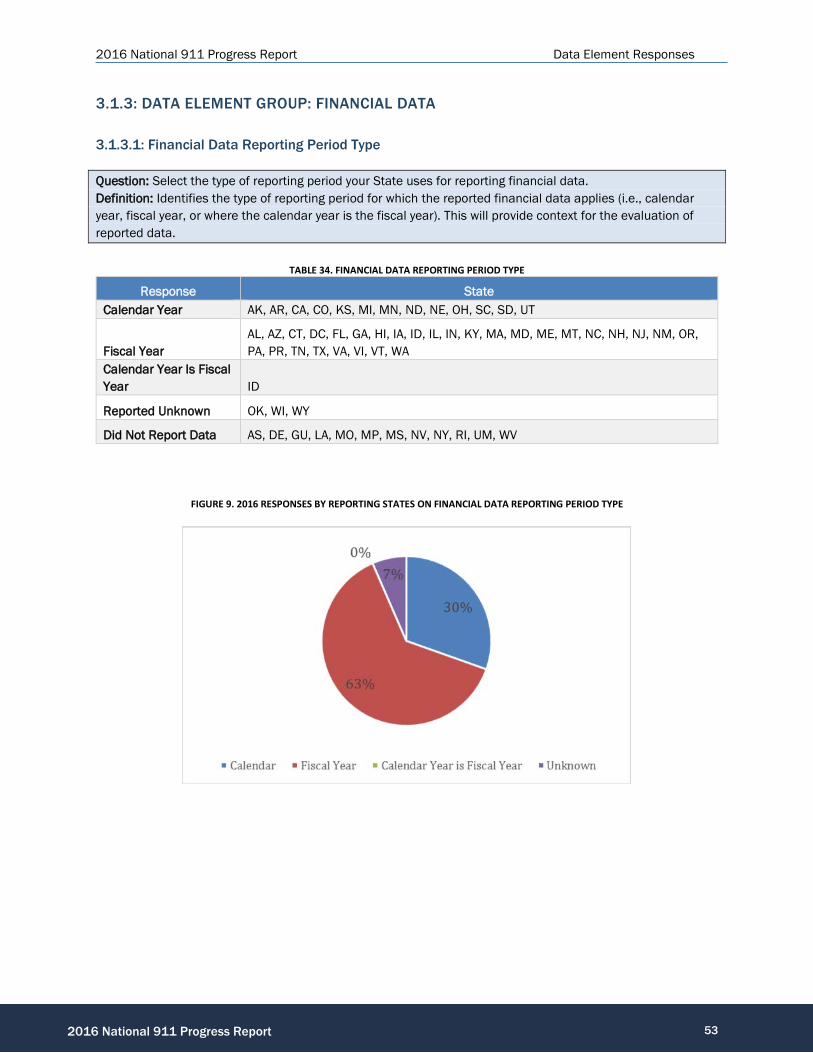
2016 National 911 Progress Report Data Element Responses
3.1.3: DATA ELEMENT GROUP: FINANCIAL DATA
3.1.3.1: Financial Data Reporting Period Type
Question: Select the type of reporting period your State uses for reporting financial data. Definition: Identifies the type of reporting period for which the reported financial data applies (i.e., calendar year, fiscal year, or where the calendar year is the fiscal year). This will provide context for the evaluation of reported data.
TABLE 34. FINANCIAL DATA REPORTING PERIOD TYPE
Response State Calendar Year AK, AR, CA, CO, KS, MI, MN, ND, NE, OH, SC, SD, UT
Fiscal Year AL, AZ, CT, DC, FL, GA, HI, IA, ID, IL, IN, KY, MA, MD, ME, MT, NC, NH, NJ, NM, OR, PA, PR, TN, TX, VA, VI, VT, WA
Calendar Year Is Fiscal Year ID
Reported Unknown OK, WI, WY
Did Not Report Data AS, DE, GU, LA, MO, MP, MS, NV, NY, RI, UM, WV
FIGURE 9. 2016 RESPONSES BY REPORTING STATES ON FINANCIAL DATA REPORTING PERIOD TYPE
53 2016 National 911 Progress Report

2016 National 911 Progress Report Data Element Responses
2016 Finding
Of all U.S. States and territories: • 13 of 45 reporting States follow a calendar year to report financial data • 29 of 45 reporting States follow a fiscal year to report financial data • 0 of 45 reporting States indicate their calendar year is equivalent to their fiscal year • 3 of 45 reporting States are “unknown” – State did not respond to this data element.
Dataset Shift
• 2015 Finding: 14 of 42 reporting States followed a calendar year to report financial data • 2015 Finding: 23 of 42 reporting States followed a fiscal year to report financial data • 2015 Finding: 1 of 42 reporting States indicated their calendar year is equivalent to their fiscal year • 2015 Finding: 4 of 42 reporting States were “unknown” – State did not respond to this data element • 2014 Finding: 13 of 35 reporting States followed a calendar year to report financial data • 2014 Finding: 22 of 35 reporting States followed a fiscal year to report financial data • 2014 Finding: 4 of 35 reporting States were “unknown” – State did not respond to this data element.
54 2016 National 911 Progress Report

2016 National 911 Progress Report Data Element Responses
3.1.3.2: Annual Revenue for All 911 Authorities
Question: Enter the total annual revenue (e.g., special emergency communications taxes, agency fees) for the current reporting year (2015) for all 911 authorities within your State. Definition: Total annual revenue for the current reporting year (2015) for all 911 authorities in a State (local, county, regional, and State) derived from all sources, including, but not limited to 911 surcharges or service fees, and aggregated to the State level.
TABLE 35. ANNUAL REVENUE FOR ALL 911 AUTHORITIES
State Response State Response State Response AK $12,837,114 IN $79,108,858 OR $117,161,961 AL $116,058,532 KS $20,821,974 PA $175,739,957 AR $49,350,482 KY $120,281,475 PR $21,225,570 AZ $17,100,000 MA $75,701,137 SD $14,794,290 CA $87,838,234 MD $53,314,406 TN $78,729,854 CO $52,257,085 ME $8,353,235 TX $246,037,241 CT $35,718,000 MI $251,982,293 UT $27,130,873 DC $40,400,000 MN $62,110,858 VA $59,245,942 FL $204,524,675 MT $13,000,000 VI $514,557 GA $17,659,037 ND $12,814,684 VT $4,600,000 IA $40,547,767 NH $10,000,000 WA $94,445,461 ID $20,952,379 NJ $121,000,000 IL $192,584,350 NM $11,303,146
Total Annual Revenue: $2,567,245,428 Reported Unknown: HI, NC, NE, OH, OK, SC, WI, WY Did Not Report Data: AS, DE, GU, LA, MO, MP, MS, NV, NY, RI, UM, WV
2016 Finding
Of all U.S. States and territories: • The total combined annual revenue from 37 of 45 reporting States is $2,567,245,428 • 8 of 45 reporting States are “unknown” – State did not respond to this data element.
Dataset Shift
• 2015 Finding: The total combined annual revenue from 33 of 42 reporting States was $2,394,886,101.33
• 2015 Finding: 9 of 42 reporting States were “unknown” – State did not respond to this data element • 2014 Finding: The total combined annual revenue from 29 of 39 reporting States was $1,785,259,469 • 2014 Finding: 10 reporting States are “unknown” – State did not respond to this data element.
55 2016 National 911 Progress Report

2016 National 911 Progress Report Data Element Responses
3.1.3.2.1: Annual Revenue by 911 Authority Source
Question: Enter sources of the total annual revenue for the current reporting year (2015) for all 911 authorities within your State. Definition: Identifies the source(s) of annual revenue for the current reporting year (2015) for all 911 authorities in a State (local, county, regional, and State), including, but not limited to 911 surcharges or service fees, and aggregated to the State level.
TABLE 36. ANNUAL REVENUE BY 911 AUTHORITY SOURCE
State Response AK Wireline and wireless surcharge ranging from $0.75 to $2.00 per line AL Alabama's sole source of revenue is a statewide flat rate service charge accessed to each connection from all service providers.
AR Wireline 911 Surcharge – 5%-12% of Monthly Access Wireless & VoIP 911 Surcharge – $0.65 per subscriber per month Prepaid - $0.65 per transaction AR Act 442 (High Cost Fund) General Fund Contribution
AZ Emergency Telecommunication Services Excise Tax and 911 Pre-paid Wireless Tax CA California Emergency Telephone Users Surcharge Fee
CO
It is unknown precisely how much is collected by 911 Authorities statewide. 911 surcharges are set locally and vary from jurisdiction to jurisdiction and are remitted directly to local 911 Authorities by telecommunications company on behalf of wireline postpaid wireless and VoIP customers. Prepaid wireless customers pay 911 surcharges through a Point-of-Sale mechanism. The figure provided in 3.1.3.2 is an estimate based on a sample of 911 Authority budgets.
CT E911 Surcharge Fees FY 13/14.
DC 911 Fees 911 prepaid fees and Local funds. The OUC did not include local funds for question 3.1.3.2 last year. It only listed collected 911 fees.
FL Total E911 Fee Revenue: $107,004,892; Interest: $667,136; Other Income: $1,474,502 in 2014-15 Florida Fiscal Reporting Year and (Non-dedicated Funds) Counties' General Funds: $95,378,140.
GA
The total amount collected in pre-paid wireless 911 fees by the State of Georgia Department of Revenue for the annual period (July 1, 2014- June 30, 2015: Georgia State Fiscal Year) was $17,659,037.41. Landline and post-paid wireless 911 fees are collected by local governments providing 911 service. There is no central tracking mechanism in place to compile a total amount of fees imposed or collected by local governments.
IA $12,390,169 wireline Surcharge reported by County E911 Service Boards whom directly receive wireline Surcharge. $26,124,016.75 Received in Wireless surcharge by the State authority $2,033,581.44 Received in Prepaid Wireless $78,829.18 Received in Interest.
ID $1.00 per connective line that can contact 911. In 39 Counties they have enacted a Grant fee of $0.25 additional for every line that can connect to 911.
IL Wireline Wireless Pre-Paid Wireless and VoIP. IN 911 surcharge on communication devices property taxes county option income tax local option income tax racino funds.
56 2016 National 911 Progress Report
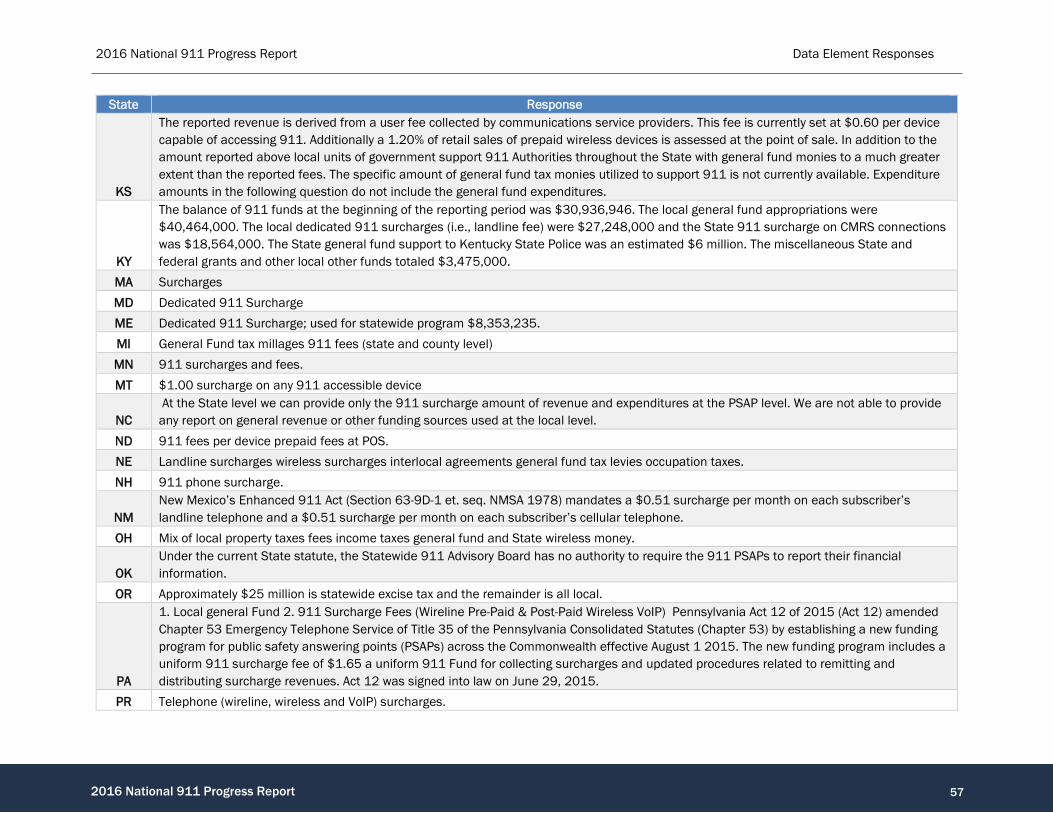
2016 National 911 Progress Report Data Element Responses
State Response
KS
The reported revenue is derived from a user fee collected by communications service providers. This fee is currently set at $0.60 per device capable of accessing 911. Additionally a 1.20% of retail sales of prepaid wireless devices is assessed at the point of sale. In addition to the amount reported above local units of government support 911 Authorities throughout the State with general fund monies to a much greater extent than the reported fees. The specific amount of general fund tax monies utilized to support 911 is not currently available. Expenditure amounts in the following question do not include the general fund expenditures.
KY
The balance of 911 funds at the beginning of the reporting period was $30,936,946. The local general fund appropriations were $40,464,000. The local dedicated 911 surcharges (i.e., landline fee) were $27,248,000 and the State 911 surcharge on CMRS connections was $18,564,000. The State general fund support to Kentucky State Police was an estimated $6 million. The miscellaneous State and federal grants and other local other funds totaled $3,475,000.
MA Surcharges MD Dedicated 911 Surcharge ME Dedicated 911 Surcharge; used for statewide program $8,353,235. MI General Fund tax millages 911 fees (state and county level) MN 911 surcharges and fees. MT $1.00 surcharge on any 911 accessible device
NC At the State level we can provide only the 911 surcharge amount of revenue and expenditures at the PSAP level. We are not able to provide any report on general revenue or other funding sources used at the local level.
ND 911 fees per device prepaid fees at POS. NE Landline surcharges wireless surcharges interlocal agreements general fund tax levies occupation taxes. NH 911 phone surcharge.
NM New Mexico’s Enhanced 911 Act (Section 63-9D-1 et. seq. NMSA 1978) mandates a $0.51 surcharge per month on each subscriber’s landline telephone and a $0.51 surcharge per month on each subscriber’s cellular telephone.
OH Mix of local property taxes fees income taxes general fund and State wireless money.
OK Under the current State statute, the Statewide 911 Advisory Board has no authority to require the 911 PSAPs to report their financial information.
OR Approximately $25 million is statewide excise tax and the remainder is all local.
PA
1. Local general Fund 2. 911 Surcharge Fees (Wireline Pre-Paid & Post-Paid Wireless VoIP) Pennsylvania Act 12 of 2015 (Act 12) amended Chapter 53 Emergency Telephone Service of Title 35 of the Pennsylvania Consolidated Statutes (Chapter 53) by establishing a new funding program for public safety answering points (PSAPs) across the Commonwealth effective August 1 2015. The new funding program includes a uniform 911 surcharge fee of $1.65 a uniform 911 Fund for collecting surcharges and updated procedures related to remitting and distributing surcharge revenues. Act 12 was signed into law on June 29, 2015.
PR Telephone (wireline, wireless and VoIP) surcharges.
57 2016 National 911 Progress Report

2016 National 911 Progress Report Data Element Responses
State Response
SD State 911 Surcharge Funds PSAP Host City Subsidy Emergency Management Performance Grant Homeland Security grant other Federal grants State grants other intergovernmental revenue.
TN 911 surcharge on all telecommunication services capable of reaching a PSAP by dialing 911. Local emergency communications districts may also receive funding from local governments and investments.
TX 911 Service Fees and Equalization Surcharge fees. UT $0.76 total on every Landline wireless & VoIP access line. State Sales Tax is 1.9%
VA
VA revenues come from two sources; prepaid and postpaid wireless fees. We have a monthly $0.75 fee on postpaid wireless bills. And we have a $0.50 fee added to any prepaid wireless transaction (basically when somebody adds minutes to their phone). Those revenues have been in the neighborhood of $55 million per year.
VI
Act No. 6333 Section 29 in effect since December 2, 1999 authorized the levy of a $1.00 fee on each monthly landline telephone in the Territory. As a result the Government of the Virgin Islands established as special fund designated as the Emergency Service Fund held by the Commissioner of Finance on behalf of the Government of the Virgin Islands which is separate and apart from all other funds. Act. No. 7261 enacted July 5, 2011 expanded the authorization to levy the $1.00 monthly surcharge to mobile telephone numbers prepaid wireless and VOIP lines.
VT Vermont Universal Service Fund.
WA
All Washington State Counties are authorized by Revised Code of Washington 82.14B.030(i) to impose a county enhanced 911 excise tax on the use of switched access lines radio access lines and voice over IP access lines. As of July 1, 2013, all counties in Washington State had implemented the maximum 911 fee of $0.70 per month per subscriber for wireline wireless and VoIP services and $0.70 per pre-paid wireless retail transaction. The State also implemented the maximum statewide fee of $0.25 per month per subscriber for wireline wireless and VoIP services and $0.25 per pre-paid wireless retail transaction. These fees are authorized by Revised Code of Washington 82.14B.030. The State and County fees are collected by the carriers and are submitted to the Department of Revenue who then deposits them into the State and counties' Enhanced 911 accounts. The funding collected from the 911 excise taxes is less than the total funding required to operate Enhanced / Next Generation 911 in Washington State. The remaining support comes from other local government sources.
WI
In Wisconsin, no portion of the amount collected from the 911 surcharge that appears on monthly telephone bills is shared with State county or municipal governments. The 911 surcharge is limited to the recovery of telecommunications network expenses for the 911 service. The proceeds from the 911 surcharge collection are retained in full by the participating local exchange carriers. The amount of the collection is not reported to the State.
Reported Unknown: HI, NJ, SC, WV Did Not Report Data: AS, DE, GU, LA, MO, MP, MS, NV, NY, RI, UM, WV
58 2016 National 911 Progress Report
2016 National 911 Progress Report Data Element Responses
2016 Finding
Of all U.S. States and territories: • 41 of 45 reporting States indicated that primary sources of income included wireline and wireless surcharges, along with some additional income
from taxes and prepaid wireless • 4 of 45 reporting States are “unknown” – State did not respond to this data element. Dataset Shift
• 2015 Finding: 38 of 42 reporting States submitted a response • 2015 Finding: 4 of 42 reporting States were “unknown” – State did not respond to this data element • 2014 Finding: 35 of 39 reporting States submitted a response • 2014 Finding: 4 of 39 reporting States were “unknown” – State did not respond to this data element.
59 2016 National 911 Progress Report

2016 National 911 Progress Report Data Element Responses
3.1.3.3: Annual Costs by 911 Authority
Question: Enter the total annual costs for the current reporting year (2015) for all 911 Authorities within your State. Definition: Total annual costs for the current reporting year (2015) for all 911 Authorities in a State (local, county, regional, and State), aggregated to the State level
TABLE 37. TOTAL ANNUAL COSTS FOR ALL 911 AUTHORITIES WITHIN STATE State Response State Response State Response
AL $112,163,211 KS $16,750,908 OH $146,788,779 AR $49,008,811 KY $97,576,465 OR $113,914,742 AZ $15,869,000 MA $85,786,640 PA $159,452,791 CA $87,954,600 MD $98,489,586 PR $11,419,565 CO $77,835,212 ME $7,455,048 SD $19,121,361 CT $36,220,000 MI $237,858,773 TN $89,000,000 DC $41,607,447 MN $26,535,646 TX $137,070,116 FL $197,937,530 ND $19,237,437 VI $463,692 IA $143,193,598 NJ $14,000,000 VT $4,600,000 IL $271,617,884 NM $10,881,501 WA $108,612,280
Total Annual Costs: $2,438,422,623 Reported Unknown: AK, GA, HI, ID, IN, MT, NC, NE, NH, OK, SC, UT, VA, WI, WY Did Not Report Data: AS, DE, GU, LA, MO, MP, MS, NV, NY, RI, UM, WV
* MN: The increase in annual cost reported this year is the result of a discrepancy in prior year Minnesota reporting.
2016 Finding
Of all U.S. States and territories: • The total combined annual costs from 30 of 45 reporting States is $2,438,422,623 • 15 of 45 reporting States are “unknown” – State did not respond to this data element.
Dataset Shift
• 2015 Finding: The total combined annual costs from 24 of 42 reporting States was $2,372,002,861.40 • 2015 Finding: 18 of 42 reporting States were “unknown” – State did not respond to this data element • 2014 Finding: The total combined annual costs from 23 of 39 reporting States was $1,534,152,643 • 2014 Finding: 16 of 39 reporting States were “unknown” – State did not respond to this data element.
60 2016 National 911 Progress Report

2016 National 911 Progress Report Data Element Responses
PROGRESS BENCHMARKS: 3.2.1: DATA ELEMENT GROUP: PLANNING
3.2.1.1: Statewide NG911 Plan Adopted
Question: Has your State developed and adopted a statewide NG911 Plan to include governance, funding, system components (IP network, ESInet, NG911 software services, security architecture, user identity management, database architecture, and PSAP configurations), and operations? Definition: Identify whether or not your State developed and adopted a statewide NG911 Plan, including governance, funding, system components (IP network, Emergency Services IP network (ESInet), NG911 software services, security architecture, user identity management, database architecture, and PSAP configuration), and operations. NENA defines NG911 as, “an Internet Protocol (IP)-based system comprised of managed Emergency Services IP networks (ESInets), functional elements (applications), and databases that replicate traditional E911 features and functions and provides additional capabilities. NG911 is designed to provide access to emergency services from all connected communications sources, and provide multimedia data capabilities for PSAPs and other emergency service organizations.”23
FIGURE 10. 2016 RESPONSES ON STATEWIDE NG911 PLAN ADOPTION
23 Ibidem, p. 90.
61 2016 National 911 Progress Report

2016 National 911 Progress Report Data Element Responses
TABLE 38. STATEWIDE NG911 PLAN ADOPTED
Response State
Yes CT, DC, IA, ID, IN, KS, KY, MA, ME, MN, ND, NH, NJ, SD, TN, UT, VA, VT, WA
No AK, AL, AR, AZ, CA, CO, FL, HI, IL, MD, MI, MT, NC, NE, NM, OH, OK, OR, PA, SC, VI, WI, WY
Reported Unknown AZ, GA,
Did Not Report Data AS, DE, GU, LA, MP, MS, MO, NV, NY, RI, UM, VI, VT, WV, WY
* Wyoming does not currently have a statewide 911 plan. All PSAPs are locally administered and funded.
2016 Finding
Of all U.S. States and territories: • 20 of 45 reporting States have adopted a statewide plan • 22 of 45 reporting States have not adopted a statewide plan • 2 of 45 reporting States are “unknown” – State did not respond to this data element.
Dataset Shift
• 2015 Finding: 19 of 42 reporting States had adopted a statewide plan • 2015 Finding: 21 of 42 reporting States had not adopted a statewide plan • 2015 Finding: 2 of 42 reporting States were “unknown” – State did not respond to this data element • 2014 Finding: 15 of 39 reporting States had adopted a statewide plan • 2012 Finding: 9 of 27 reporting States had adopted a statewide plan.
62 2016 National 911 Progress Report

2016 National 911 Progress Report Data Element Responses
3.2.1.2: Sub-State 911 Authority NG911 Plan Adopted
Question: Enter the number of regional or local 911 Authorities within your State who have developed and adopted NG911 Plans for their area independent of the State. Definition: Indicate the number of regional or local 911 Authorities within the State who have developed and adopted NG911 Plans for their area.
TABLE 39. SUB-STATE AUTHORITY NG911 PLAN ADOPTION
State Response State Response CO 3 SC 6 IA 99 TN 100 IL 13 TX 13 MI 15 UT 20 MN 104 VA 7 NC 1 WA 100 NH 100
No Sub-State Plan Adopted: AK, AR, CA, CT, DC, HI, ID, KS, MA, MD, ME, MT, ND, NE, NJ, NM, OR, PA, PR, SD, VI, VT, WY Reported Unknown: AL, AZ, FL, GA, IN, KY, OH, OK, WI Did Not Report Data: AS, DE, GU, LA, MO, MP, MS, NV, NY, RI, UM, WV
2016 Finding
Of all U.S. States and territories: • 13 of 45 reporting States indicate that sub-state areas have adopted 911 plans • 23 of 45 reporting States indicate that sub-state areas have not adopted a 911 plan • 9 of 45 reporting States are “unknown” – State did not respond to this data element.
Dataset Shift
• 2015 Finding: 12 of 42 reporting States adopted a sub-State plan • 2015 Finding: 20 of 42 reporting States did not adopt a sub-State plan • 2015 Finding: 10 of 42 reporting States were “unknown” – State did not respond to this data element • 2014 Finding: 5 of 39 reporting States had adopted a sub-State plan • 2014 Finding: 6 of 39 reporting States had marginally adopted a sub-State plan • 2014 Finding: 20 of 39 reporting States had not adopted a sub-State plan • 2014 Finding: 8 of 39 reporting States were “unknown” – State did not respond to this data element.
63 2016 National 911 Progress Report

2016 National 911 Progress Report Data Element Responses
3.2.1.3: Statewide NG911 Concept of Operations (CONOPS) Developed
Question: Has your State established a statewide CONOPS document, including operations for NG911 and related architecture? Definition: Is there a statewide NG911 CONOPS document, including operations for NG911 and related architecture? A CONOPS is a user-oriented document that describes the desired characteristics for a proposed system from a user's perspective and how its implementation will enhance the user’s current operation. The CONOPS would include, for example: user-oriented operational description for NG911 and related architecture; operational needs and use cases; system overview and desired outcomes of users deploying the system; and clear statement of responsibilities and authorities delegated.
FIGURE 11. 2016 RESPONSES BY REPORTING STATES ON ESTABLISHMENT OF NG911 CONOPS
TABLE 40. STATEWIDE ESTABLISHMENT OF NG911 CONOPS
Response State
Yes AZ, CT, DC, IA, KS, MA, ME, MN, NC, NH, TN, UT, VT, WA
No AK, AL, AR, CA, CO, FL. HI, ID, IL, IN, KY, MD, MI, MT, ND, NE, NJ, NM, OH, OK, OR, PA, SC, SD, TX, VA, VI, WY
Reported Unknown GA, PR, WI
Did Not Report Data AS, DE, GU, LA, MO, MP, MS, NV, NY, RI, UM, WV
64 2016 National 911 Progress Report

2016 National 911 Progress Report Data Element Responses
2016 Finding
Of all U.S. States and territories: • 14 of 45 reporting States have established a statewide concept of operations • 28 of 45 reporting States have not established a statewide concept of operations • 3 of 45 reporting States are “unknown” – State did not respond to this data element.
Dataset Shift
• 2015 Finding: 16 of 42 reporting States established a statewide concept of operations • 2015 Finding: 24 of 42 reporting States did not establish a statewide concept of operations • 2015 Finding: 2 of 42 reporting States were “unknown” – State did not respond to this data element • 2014 Finding: 12 of 36 reporting States established a statewide concept of operations • 2014 Finding: 21 of 36 reporting States did not establish a statewide concept of operations • 2014 Finding: 3 of 36 reporting States were “unknown” – State did not respond to this data element • 2012 Finding: 3 of 27 reporting States established a statewide concept of operations.
65 2016 National 911 Progress Report

2016 National 911 Progress Report Data Element Responses
3.2.1.4: Sub-State 911 Authority Concept of Operations Developed
Question: Enter the number of regional or local 911 authorities within your State who have developed an NG911 concept of operations for their area. Definition: Indicate the number of regional or local 911 Authorities within the State who have developed a concept of operations for their area.
TABLE 41. NUMBER OF SUB-STATE 911 AUTHORITIES WITH ESTABLISHED NG911 CONOPS State Response State Response
IA 99 SC 20 IL 1 TN 100
MD 1 TX 8 MI 25 UT 32 MN 104 VA 7 NC 6 WA 100
No Sub-State Concept Developed: AK, AR, CA, CT, DC, HI, ID, KS, MA, ME, MT, ND, NE, NH, NJ, NM, OR, PA, PR, SD, VI, VT, WY Reported Unknown: AL, AZ, CO, FL, GA, IN, KY, OH, OK, WI Did Not Report Data: AS, DE, GU, LA, MO, MP, MS, NV, NY, RI, UM, WV
2016 Finding
Of all U.S. States and territories: • 12 of 45 reporting States indicate that sub-state areas have developed sub-state concept of operations • 23 of 45 reporting States have not developed a sub-State concept of operations • 10 of 45 reporting States are “unknown” – State did not respond to this data element.
Dataset Shift
• 2015 Finding: 11 of 42 reporting States developed a sub-State concept of operations • 2015 Finding: 20 of 42 reporting States did not develop a sub-State concept of operations • 2015 Finding: 11 of 42 reporting States were “unknown” – State did not respond to this data element • 2014 Finding: 4 of 39 reporting States developed a sub-State concept of operations • 2014 Finding: 5 of 39 reporting States had marginally developed a sub-State concept of operations • 2014 Finding: 20 of 39 reporting States had not developed a sub-State concept of operations • 2014 Finding: 10 of 39 reporting States were “unknown” – State did not respond to this data element.
66 2016 National 911 Progress Report
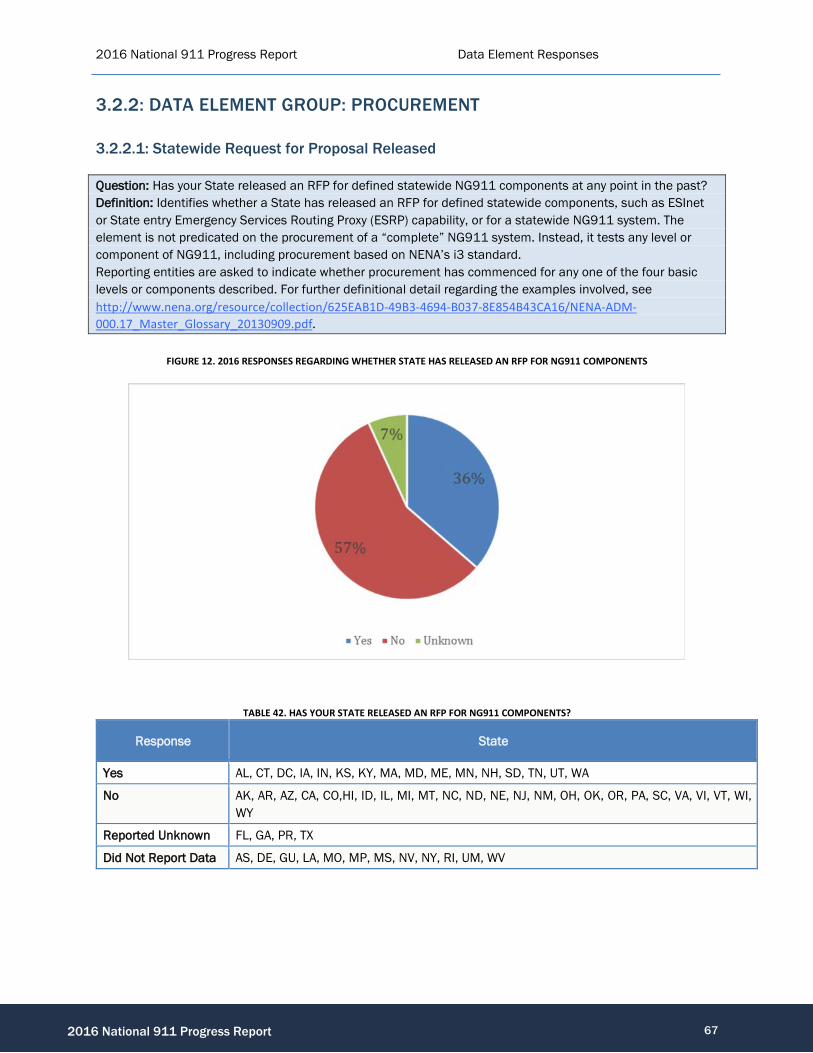
2016 National 911 Progress Report Data Element Responses
3.2.2: DATA ELEMENT GROUP: PROCUREMENT
3.2.2.1: Statewide Request for Proposal Released
Question: Has your State released an RFP for defined statewide NG911 components at any point in the past? Definition: Identifies whether a State has released an RFP for defined statewide components, such as ESInet or State entry Emergency Services Routing Proxy (ESRP) capability, or for a statewide NG911 system. The element is not predicated on the procurement of a “complete” NG911 system. Instead, it tests any level or component of NG911, including procurement based on NENA’s i3 standard. Reporting entities are asked to indicate whether procurement has commenced for any one of the four basic levels or components described. For further definitional detail regarding the examples involved, see http://www.nena.org/resource/collection/625EAB1D-49B3-4694-B037-8E854B43CA16/NENA-ADM-000.17_Master_Glossary_20130909.pdf.
FIGURE 12. 2016 RESPONSES REGARDING WHETHER STATE HAS RELEASED AN RFP FOR NG911 COMPONENTS
TABLE 42. HAS YOUR STATE RELEASED AN RFP FOR NG911 COMPONENTS?
Response State
Yes AL, CT, DC, IA, IN, KS, KY, MA, MD, ME, MN, NH, SD, TN, UT, WA
No AK, AR, AZ, CA, CO,HI, ID, IL, MI, MT, NC, ND, NE, NJ, NM, OH, OK, OR, PA, SC, VA, VI, VT, WI, WY
Reported Unknown FL, GA, PR, TX
Did Not Report Data AS, DE, GU, LA, MO, MP, MS, NV, NY, RI, UM, WV
67 2016 National 911 Progress Report

2016 National 911 Progress Report Data Element Responses
2016 Finding
Of all U.S. States and territories: • 19 of 45 reporting States have released an RFP • 23 of 45 reporting States have not released an RFP • 3 of 45 reporting States are “unknown” – State did not respond to this data element.
Dataset Shift
• 2015 Finding: 18 of 42 reporting States had released an RFP • 2015 Finding: 21 of 42 reporting States had not released an RFP • 2015 Finding: 3 of 42 reporting States were “unknown” – State did not respond to this data element • 2014 Finding: 13 of 39 reporting States had released an RFP • 2014 Finding: 23 of 39 reporting States had not released an RFP • 2014 Finding: 3 of 39 reporting States were “unknown” – State did not respond to this data element.
68 2016 National 911 Progress Report

2016 National 911 Progress Report Data Element Responses
3.2.2.2: 911 Authority RFP Released
Question: Enter the number of regional or local 911 Authorities within your State who have released an RFP for NG911 components for their area, regardless of the date the RFP was released. Definition: Identifies the number of regional or local 911 Authorities within your State who have released an RFP for NG911 components for their area, regardless of the date the RFP was released.
TABLE 43. NUMBER OF 911 AUTHORITIES WHO HAVE RELEASED AN RFP FOR NG911 COMPONENTS
State Response State Response AK 3 OH 4 IL 32 PA 15 KY 2 PR 1 MI 26 TN 100 MN 104 TX 12 NC 20 UT 99 NH 2 VA 5
No RFP Released: AL, AR, AZ, CA, CT, DC, ID, KS, MA, ME, MT, ND, NE, NJ, NM, OR, SD, VI, VT, WA, WY Reported Unknown: CO, FL, GA, IN, MD, NC, OH, OK, PR, WI Did Not Report Data: AS, DE, GU, LA, MO, MP, MS, NV, NY, RI, UM, WV
2016 Finding
Of all U.S. States and territories: • 14 of 45 reporting States have released a 911 Authority RFP • 21 of 45 reporting States have not released a 911 Authority RFP • 10 of 45 reporting States are “unknown” – State did not respond to this data element.
Dataset Shift
• 2015 Finding: 15 of 42 reporting States had released a 911 Authority RFP • 2015 Finding: 17 of 42 reporting States had not released a 911 Authority RFP • 2015 Finding: 10 of 42 reporting States were “unknown” – State did not respond to this data element • 2014 Finding: 10 of 39 reporting States had marginally released a 911 Authority RFP • 2014 Finding: 19 of 39 reporting States had not released a 911 Authority RFP • 2014 Finding: 10 of 39 reporting States were “unknown” – State did not respond to this data element.
69 2016 National 911 Progress Report

2016 National 911 Progress Report Data Element Responses
3.2.2.3: Statewide Components Specified for Procurement
Question: If the response to 3.2.2.1 is "Yes," list which parts, functions, or components of NG911 are being procured in your State. Definition: Based upon a positive response to element 3.2.2.1, this element provides detail on what parts, functions, or components for NG911 are being procured. Parts, functions, or components are described in data element 3.2.2.1 above.
State Response
AL
The following components have been procured in the specified categories: 1. Basic IP Network •Routers •Firewalls •Domain Name System (DNS) servers •Dynamic Host Configuration Protocol (DHCP) servers 2. ESInet •Emergency Call Routing Function (ECRF) •“Agency locator” functions 3. NG911 Applications •Location Validation Function (LVF) •PSAP and other emergency agencies credentialing authority (core service) •Emergency entity name/IP address service •Logging services •Emergency service routing proxies (ESRPs) •Bridging services •Authentication service (core service) 4. NG911 Transition components •Legacy service gateway •Legacy PSAP gateway •Legacy SR gateway
CA
Basic IP Network (general purpose, common to any outsourced IP network). •Routers: every IP network is the routers and the links between the routers •Firewalls •Time/clock servers 4. NG911 Transition components. •Legacy service gateway •Legacy PSAP gateway •Legacy SR gateway
CO N/A - We have not issued an RFP. In Colorado, 911 service is a tariffed product, so unless that changes we will be accepting tariff proposals from potential 911 SSPs rather than issuing RFPs.
CT
ESInet, NG911 Applications - hardware and software, NG911 Transition Components, all will use the Connecticut Public Safety Network - an ultra-high speed and flexible fiber optic data network that will serve as a base transport infrastructure and interconnectivity pathway for public safety related applications and services throughout the State. Its primary purpose is to provide the required connectivity for the upcoming implementation of Next Generation (NG911) service.
DC
The OUC' procurement will be through a competed contract vehicle that went through a RFP process. The OUC is using the HGAC (Houston-Galveston Area Council) TX contract vehicle. 1. Basic IP Network (general purpose, common to any outsourced IP network). Examples include: Routers: every IP network is the routers and the links between the routers Firewalls Domain Name System (DNS) servers Dynamic Host Configuration Protocol (DHCP) servers Time/clock servers Email servers Possibly Web servers 2. ESInet (hardware, software, databases unique to an Emergency Services IP Network, supports specific emergency services applications, whether it supports NG911 or not). Examples include: "Forest Guide” Emergency Call Routing Function (ECRF) "Agency locator" functions 3. NG911 Applications (e.g., hardware, software, databases unique or necessary to NG911 services) such as: Location Validation Function (LVF) PSAP and other emergency agencies credentialing authority (core service) Emergency entity name/IP address service Data/service rights management (core service) Logging services (system wide, from gateways and Border Control Functions [BCF] through PSAPs and other emergency entities) Emergency service routing proxies (ESRPs) Geographic Information Systems (GIS) - provides validation and routing data layer info to Location-to-Service Translation Protocol (LoST) Servers Bridging services Authentication service (core service) Policy store/editor The rest of the BCF (not included with the firewall) 4. NG911 Transition components; Legacy network gateway
70 2016 National 911 Progress Report

2016 National 911 Progress Report Data Element Responses
State Response
IA 3. NG911 Applications (e.g., hardware, software, databases unique or necessary to NG911 services).
IN All ESInet fund NG911 features listed.
KS IP Network connectivity between PSAPs, statewide hosted call handling solution, GIS data remediation. Additional elements will be added to this base system to migrate to full NG911.
KY RFP for statewide ESInet was pulled after initial responses received were deemed inadequate. Has not been reissued.
MA All four.
MD ESInet related items to be part of Maryland's statewide IP network (Network Maryland). This network will become the main platform of a statewide ESInet.
ME 1,2,3,4, Full Service Provider
MN All 104 MN PSAPs are connected to a statewide ESInet. State of MN is in the process of creating a GIS statewide center line for loading into an ECRF and LVF.
NH
Basic IP Network, ESInet, NG911 Applications Location Validation Function (LVF) Logging services (system wide, from gateways and Border Control Functions [BCF] through PSAPs and other emergency entities) Emergency service routing proxies (ESRPs) Geographic Information Systems (GIS) - provides validation and routing data layer info to Location-to-Service Translation Protocol (LoST) Servers Bridging services The rest of the BCF (not included with the firewall) Legacy service gateway Legacy PSAP gateway
SD We have procured levels 1, 2, 3, and 4.
TN
Tennessee has procured services at all 4 levels described in data element 3.2.2.1 for the deployment, operation and management of a state-wide IP-based NG911 Network, including routers, firewalls and all other software and hardware necessary to operate/transition to the NG911 network, provide a comprehensive GIS mapping system and a state-wide ALI database.
UT Level 2
WA
In late September 2015, the State of Washington released an RFP for a statewide, NENA Standard, i3-based NG911 System, to replace the current interim NG911 ESInet. The requested solution will include all four of the functional categories: Basic IP Network (general purpose, common to any outsourced IP network); ESInet (hardware, software, databases unique to an Emergency Services IP Network, supports specific emergency services applications, whether it supports NG911 or not); NG911 Applications (e.g., hardware, software, databases unique or necessary to NG911 services); NG911 Transition components.
WI None are being procured in Wisconsin.
None, N/A, or Reported Unknown: AK, AR, AZ, CA, CO, CT, DC, FL, GA, HI, IA, ID, IL, IN, KS, KY, MA, MD, ME, MI, MN, MT, NC, ND, NE, NH, NJ, NM, OH, OK, OR, PA, PR, SC, SD, TN, TX, UT, VA, VI, VT, WA, WI, WY Did Not Report Data: AS, DE, GU, LA, MO, MP, MS, NV, NY, RI, UM, WV
71 2016 National 911 Progress Report
2016 National 911 Progress Report Data Element Responses
2016 Finding
Of all U.S. States and territories: • 10 of 45 reporting States submitted an extended response • 44 of 45 reporting States listed “none,” “N/A,” or are “unknown” – State did not respond to this data
element.
Dataset Shift
• 2015 Finding: 14 of 42 reporting States submitted an extended response • 2015 Finding: 28 of 42 reporting States listed “none,” “N/A,” or are “unknown” – State did not respond to
this data element • 2014 Finding: 17 of 39 reporting States submitted an extended response • 2014 Finding: 22 of 39 reporting States listed “none,” “N/A,” or are “unknown” – State did not respond to
this data element.
72 2016 National 911 Progress Report

2016 National 911 Progress Report Data Element Responses
3.2.2.4: Sub-State 911 Authority Components Being Procured
Question: If the response to 3.2.2.1 is "Yes," list which parts, functions, or components of NG911 are being procured by regional or local 911 authorities within your State. Definition: Based upon sub-State 911 Authorities within a reporting State that have released RFPs (see element 3.2.2.2), this element requests States to summarize what parts, functions, or components for NG911 are being procured by regional or local 911 Authorities. Said parts, functions, or components are described in data element 3.2.2.1 above.
TABLE 44. SUB-STATE AUTHORITY COMPONENTS PROCURED
State Response
AL
The following components have been procured in the specified categories: 1. Basic IP Network •Routers •Firewalls •Domain Name System (DNS) servers •Dynamic Host Configuration Protocol (DHCP) servers 2. ESInet •Emergency Call Routing Function (ECRF) •“Agency locator” functions 3. NG911 Applications •Location Validation Function (LVF) •PSAP and other emergency agencies credentialing authority (core service) •Emergency entity name/IP address service •Logging services •Emergency service routing proxies (ESRPs) •Bridging services •Authentication service (core service) 4. NG911 Transition components •Legacy service gateway •Legacy PSAP gateway •Legacy SR gateway
CA
Basic IP Network (general purpose, common to any outsourced IP network). •Routers: every IP network is the routers and the links between the routers •Firewalls •Time/clock servers 4. NG911 Transition components. •Legacy service gateway •Legacy PSAP gateway •Legacy SR gateway
CT
ESInet, NG911 Applications - hardware and software, NG911 Transition Components, all will use the Connecticut Public Safety Network - an ultra-high speed and flexible fiber optic data network that will serve as a base transport infrastructure and interconnectivity pathway for public safety related applications and services throughout the State. Its primary purpose is to provide the required connectivity for the upcoming implementation of Next Generation (NG911) service.
DC
The OUC' procurement will be through a competed contract vehicle that went through a RFP process. The OUC is using the HGAC (Houston-Galveston Area Council) TX contract vehicle. 1. Basic IP Network (general purpose, common to any outsourced IP network). Examples include: Routers: every IP network is the routers and the links between the routers Firewalls Domain Name System (DNS) servers Dynamic Host Configuration Protocol (DHCP) servers Time/clock servers Email servers Possibly Web servers 2. ESInet (hardware, software, databases unique to an Emergency Services IP Network, supports specific emergency services applications, whether it supports NG911 or not). Examples include: "Forest Guide" Emergency Call Routing Function (ECRF) "Agency locator" functions 3. NG911 Applications (e.g., hardware, software, databases unique or necessary to NG911 services) such as: Location Validation Function (LVF) PSAP and other emergency agencies credentialing authority (core service) Emergency entity name/IP address service Data/service rights management (core service) Logging services (system wide, from gateways and Border Control Functions [BCF] through PSAPs and other emergency entities) Emergency service routing proxies (ESRPs) Geographic Information Systems (GIS) - provides validation and routing data layer info to Location-to-Service
73 73 73
73

2016 National 911 Progress Report Data Element Responses
State Response Translation Protocol (LoST) Servers Bridging services Authentication service (core service) Policy store/editor The rest of the BCF (not included with the firewall) 4. NG911 Transition components; Legacy network gateway
IA 3. NG911 Applications (e.g., hardware, software, databases unique or necessary to NG911 services). IN All ESInet fund NG911 features listed.
KS IP Network connectivity between PSAPs, statewide hosted call handling solution, GIS data remediation. Additional elements will be added to this base system to migrate to full NG911.
KY RFP for statewide ESInet was pulled after initial responses received were deemed inadequate. Has not been reissued. MA All four.
MD ESInet related items to be part of Maryland's statewide IP network (Network Maryland). This network will become the main platform of a statewide ESInet.
ME 1,2,3,4, Full Service Provider
MN All 104 MN PSAPs are connected to a statewide ESInet. State of MN is in the process of creating a GIS statewide center line for loading into an ECRF and LVF.
MT ESInet
NH
Basic IP Network, ESInet, NG911 Applications Location Validation Function (LVF) Logging services (system wide, from gateways and Border Control Functions [BCF] through PSAPs and other emergency entities) Emergency service routing proxies (ESRPs) Geographic Information Systems (GIS) - provides validation and routing data layer info to Location-to-Service Translation Protocol (LoST) Servers Bridging services The rest of the BCF (not included with the firewall) Legacy service gateway Legacy PSAP gateway
SD We have procured levels 1, 2, 3, and 4.
TN
Tennessee has procured services at all 4 levels described in data element 3.2.2.1 for the deployment, operation and management of a state-wide IP-based NG911 Network, including routers, firewalls and all other software and hardware necessary to operate/transition to the NG911 network, provide a comprehensive GIS mapping system and a state-wide ALI database .
TX Basic IP Network, ESInet, NG911 Applications including Location Validation Function Emergency entity name /IP address service, ESRPs, Geographic Information Services, the rest of the BCF and NG911 Transition components.
UT Level 2 VT 1, 2, 3, and 4.
WA
In late September 2015, the State of Washington released an RFP for a statewide, NENA Standard, i3-based NG911 System, to replace the current interim NG911 ESInet. The requested solution will include all four of the functional categories: Basic IP Network (general purpose, common to any outsourced IP network); ESInet (hardware, software, databases unique to an Emergency Services IP Network, supports specific emergency services applications, whether it supports NG911 or not); NG911 Applications (e.g., hardware, software, databases unique or necessary to NG911 services); NG911 Transition components.
74 74 74
74

2016 National 911 Progress Report Data Element Responses
None, N/A, or Reported Unknown: AK, AR, AZ, CO, FL, GA, HI, ID, IL, MI, NC, ND, NE, NJ, NM, OH, OK, OR, PA, PR, SC, VA, VI, WI, WY Did Not Report Data: AS, DE, GU, MO, MP, MS, NV, NY, RI, UM, LA, WV
2016 Finding
Of all U.S. States and territories: • 20 of 45 reporting States submitted an extended response • 25 of 45 reporting States listed “none,” “N/A,” or are “unknown” – State did not respond to this data element.
Dataset Shift
• 2015 Finding: 21 of 42 reporting States submitted an extended response • 2015 Finding: 21 of 42 reporting States listed “none,” “N/A,” or are “unknown” – State did not respond to this data element • 2014 Finding: 10 of 39 reporting States submitted an extended response • 2014 Finding: 29 of 39 reporting States listed “none,” “N/A,” or are “unknown” – State did not respond to this data element.
75 75 75
75

2016 National 911 Progress Report Data Element Responses
3.2.2.5: State Award of Contract for Components Being Procured
Question: Has your State awarded contracts for the procured components and/or functions defined in 3.2.2.3 either during this survey year or earlier? Definition: This data element specifically relates to the detail identified by data element 3.2.2.3 (i.e., the NG911 part, function, and/or component acknowledged), and solicits a “yes” or “no” response.
FIGURE 13. 2016 RESPONSES BY REPORTING STATES ON AWARDS OF STATE CONTRACTS FOR NG911
TABLE 45. STATE RESPONSES ON STATUS OF AWARDED CONTRACTS FOR NG911
Response State
Yes AL, CA, CT, IA, IN, KS, MA, MD, ME, MN, ND, NJ, PR, SD, TN, TX, UT, VT, WA
No AR, AZ, CO, DC, HI, ID, IL, KY, MI, MT, NC, NE, NJ, NM, OH, OK, OR, SC, VA, VI, WI, WY
Reported Unknown AK, FL, GA, PA
Did Not Report Data AS, DE, GU, LA, MO, MP, MS, NV, NY, RI, UM, WV 2016 Finding
Of all U.S. States and territories: • 19 of 45 reporting States have awarded a State contract • 22 of 45 reporting States have not awarded a State contract • 4 of 45 reporting States are “unknown” – State did not respond to this data element.
Dataset Shift
• 2015 Finding: 16 of 42 reporting States had awarded a State contract • 2015 Finding: 24 of 42 reporting States had not awarded a State contract • 2015 Finding: 2 of 42 reporting States were “unknown” – State did not respond to this data element • 2014 Finding: 13 of 39 reporting States had awarded a State contract • 2014 Finding: 22 of 39 reporting States had not awarded a State contract • 2014 Finding: 4 of 39 reporting States were “unknown” – State did not respond to this data element.
76 2016 National 911 Progress Report

2016 National 911 Progress Report Data Element Responses
3.2.2.6: Number of 911 Authorities Statewide that have Awarded a Contract for these System Components, Parts, and/or Functions
Question: Enter the number of 911 Authorities within your State that have awarded a contract of the system components and/or functions procured in 3.2.2.3 either during this survey year or earlier. Definition: This data element is the sub-State counterpart to the data element 3.2.2.5, and speaks to similar regional and local effort. The number involved is calculated against the total number of 911 Authorities in a State, as reported in Section 3.1.2.3.
TABLE 46. NUMBER OF 911 AUTHORITIES THAT HAVE AWARDED A CONTRACT FOR NG911
State Response State Response HI 5 ND 100 IA 100 NH 100 IL 13 PR 1 IN 3 TN 100 KY 44 UT 30 MI 32 VA 7 MN 100
No Contract Awarded: AL, AR, CA, CT, DC, ID, KS, MA, ME, NE, NJ, NM, OR, SD, TX, VI, VT, WA Reported Unknown: AK, FL, GA, PA, MD, AZ, CO, MT, NC, OH, OK, SC, WI, WV Did Not Report Data: AS, DE, GU, LA, MP, MO, MP, MS, NV, NY, RI, UM, WV
2016 Finding • 5 of 45 reporting States had awarded a contract • 8 of 45 reporting States had marginally awarded a contract • 18 of 45 reporting States had not awarded a contract • 14 of 45 reporting States were “unknown” – State did not respond to this data element
Due to some State points of contact misinterpreting the question, data reflected in element 3.2.2.6 may contain inaccuracies. This element requests information on how many 911 authorities have awarded a contract, as opposed to what percentage of authorities have awarded a contract.
Dataset Shift
• 2015 Finding: 4 of 42 reporting States had awarded a contract • 2015 Finding: 8 of 42 reporting States had marginally awarded a contract • 2015 Finding: 21 of 42 reporting States had not awarded a contract • 2015 Finding: 9 of 42 reporting States were “unknown” – State did not respond to this data element • 2014 Finding: 5 of 39 reporting States had awarded a contract • 2014 Finding: 7 of 39 reporting States had marginally awarded a contract • 2014 Finding: 16 of 39 reporting States had not awarded a contract • 2014 Finding: 11 of 39 reporting States were “unknown” – State did not respond to this data element.
77 2016 National 911 Progress Report

2016 National 911 Progress Report Data Element Responses
3.2.2.7: Statewide Installation and Testing
Question: Has the NG911 part, function, and/or component defined in 3.2.2.3 been installed/deployed and tested at the State level, regardless of when the part, function, and/or component was installed and tested? Definition: This data element specifically relates to the contract detail identified above, and solicits a “yes” or “no” response (i.e., it is asking reporting States to indicate whether the NG911 part, function, and/or component involved has been installed/deployed and tested), regardless of when the part, function, and/or component was installed and tested. From that, a list of States that reported they have met this milestone can be generated.
FIGURE 14. STATEWIDE INSTALLATION AND TESTING
TABLE 47. STATEWIDE INSTALLATION AND TESTING
Response State
Yes AL, CA, CT, IA, IL, IN, KS, ME, MN, MT, ND, NH, PR, SD, TN, UT, VT, WA
No AR, AZ, CO, DC, HI, ID, KY, MA, MD, MI, NC, NE, NJ, NM, OK, OR, PA, SC, TX, VA, VI, WI, WY
Reported Unknown AK, FL, GA, OH
Did Not Report Data AS, DE, GU, LA, MO, MP, MS, NV, NY, RI, UM, WV
78 2016 National 911 Progress Report
2016 National 911 Progress Report Data Element Responses
2016 Finding
Of all U.S. States and territories: • 18 of 45 reporting States have installed/deployed and tested • 23 of 45 reporting States have not installed/deployed and tested • 4 of 45 reporting States are “unknown” – State did not respond to this data element.
Dataset Shift
• 2015 Finding: 11 of 42 reporting States had installed/deployed and tested • 2015 Finding: 29 of 42 reporting States had not installed/deployed and tested • 2015 Finding: 2 of 42 reporting States were “unknown” – State did not respond to this data element • 2014 Finding: 9 of 39 reporting States had installed/deployed and tested • 2014 Finding: 27 of 39 reporting States had not installed/deployed and tested • 2014 Finding: 3 of 39 reporting States were “unknown” – State did not respond to this data element.
79 2016 National 911 Progress Report

2016 National 911 Progress Report Data Element Responses
3.2.2.8: Number of Sub-State 911 Authorities Statewide that Have Installed and Tested These System Components and/or Functions
Question: Enter the number of 911 Authorities within your State that have installed/deployed and tested the components and/or functions defined in 3.2.2.3. Definition: This is the sub-State counterpart to data element 3.2.2.7, and speaks to similar regional and local effort. The number involved is calculated against the total number of 911 Authorities in a State, as reported in Section 3.1.2.3.
TABLE 48. NUMBER OF SUB-STATE 911 AUTHORITIES THAT HAVE INSTALLED AND TESTED SYSTEM COMPONENTS AND FUNCTIONS
State Response State Response AL 86 MI 15 CA 37 MN 104 HI 5 MT 38 IA 99 PR 1 IL 13 TN 100 IN 91 TX 3 KS 11 UT 30 KY 47 VA 6
No Installation and Testing: AR, AZ, CO, CT, DC, ID, KS, MA, MD, ME, MI, MT, NC, ND, NE, NH, NJ, NM, OH, OR, PA, PR, WA Reported Unknown: FL, GA, HI, IA, OK, SD, WI Did Not Report Data: AS, DE, GU, LA, MP, MS, MO, NV, NY, RI, UM, VI, VT, WV, WY
2016 Finding
• 3 of 45 reporting States had installed/deployed and tested • 13 of 45 reporting States had marginally installed/deployed and tested • 23 of 45 reporting States had not installed/deployed and tested • 7 of 45 reporting States were “unknown” – State did not respond to this data element Table 48 above depicts the number of sub-state 911 authorities that have installed and tested system components and functions as reported by State points of contact. Dataset Shift
• 2015 Finding: 1 of 42 reporting States had installed/deployed and tested • 2015 Finding: 11 of 42 reporting States had marginally installed/deployed and tested • 2015 Finding: 23 of 42 reporting States had not installed/deployed and tested • 2015 Finding: 7 of 42 reporting States were “unknown” – State did not respond to this data element • 2014 Finding: 2 of 39 reporting States had installed/deployed and tested • 2014 Finding: 8 of 39 reporting States had marginally installed/deployed and tested • 2014 Finding: 20 of 39 reporting States had not installed/deployed and tested • 2014 Finding: 9 of 39 reporting States were “unknown” – State did not respond to this data element.
80 2016 National 911 Progress Report

2016 National 911 Progress Report Data Element Responses
3.2.2.9: Data Element Sub-Group: Agreements (Capacity and Service Level) that Have/Have Not Been Reached with Originating Service Providers
3.2.2.9.1: List of (Capacity and Service Level) that Have Been Reached with Telecommunications Carriers/Providers
Question: Provide a list of service providers that have executed agreements with your State. Enter information with comma or carriage returns below. Definition: The data element asks reporting States to provide a list of service providers with whom signed agreements have been reached for each State (or appropriate jurisdiction), where such agreements are necessary to ensure consistent and reliable NG911 service.
TABLE 49. LIST OF SERVICE PROVIDERS THAT HAVE EXECUTED AGREEMENTS WITH EACH RESPONDING STATE State Response
AL All wireless service providers serving Alabama, Alabama Supercomputer Authority, Bandwidth.com, Inc., Auburn University Montgomery CA AT&T Mobility, Verizon Wireless CO Currently, all 911 service to PSAPs is handled by CenturyLink, which has service level agreements in their 911 tariff.
DC
The District has a direct connect program with all carriers that provide 911 services. These carriers have been notified of the OUC' plan to transition from a TDM E911 selective router to a Legacy Network Gateway. Wireline Carriers 1. AT&T 2. Broadwing (merged with Level 3) 3. Broadview Networks 4. Cavalier (merged with Paetec/Windstream) 5. Cbeyond 6. Comcast (I2) 7. Global Crossing (merged with Level 3) 8. Level 3 (merged with Broadview Network, Global Crossing) 9. Earth Link (formerly CTC- One Comm) 10. Paetec (Windstream merged with PaeTec- McLean & Sterling) 11. RCN (formerly Starpower) 12. twtelecom (formerly Xspedius/Time Warner) 13. Verizon (ILEC) 14. Verizon Business (formerly MCI) 15. XO CMRS Wireless Carriers 1. AT&T Mobility 2. Cricket (Merged with AT&T Mobility -Prepaid) 3. Sprint/Nextel 4. Verizon Wireless 5. T-Mobile
HI Hawaiian Telcom
IA
The State collects wireless and prepaid surcharge remittance on a quarterly basis. The State passes 46% of the collected surcharge to the local service boards based on a formula of square mileage the service board is responsible for, and call counts. Wireless surcharge is also used to fund the administration of the E911 Program by Homeland Security and Emergency Management. The State also pays recurring costs for transport costs between selective router and PSAPs. The State pays for ALI database information on a quarterly basis. The State reimburses Wireless Carriers for up to 10% of surcharge generated to recover their actual costs associated with Phase 1 delivery. Once recurring costs are paid for, remaining surcharge goes into an Operating Surplus fund, that local service boards can access through a State managed grant program to fund PSAP improvements. The State has a contract with Comtech Telecommunications System for Next Gen upgrades to the PSAPs, ESInet monitoring and management of NG911 in Iowa. This includes two call logic centers The State utilizes the Iowa Communications Network for the ESInet/circuitry itself. The State has also entered into a GeoComm to provide end to end GIS services as part of Next Gen upgrades. During this reporting period, County Service Boards provided GeoComm with a second round of data for the baseline layer of county GIS data for analysis. Local jurisdictions are able to select vendors for their internal PSAP systems (CAD, CPE, recorder etc.) The State offers carryover grants in addition to the 46% pass through of all wireless surcharge funds. This amount was a
81 2016 National 911 Progress Report

2016 National 911 Progress Report Data Element Responses
State Response maximum of $100,000 per PSAP for PSAP or network improvements and receipt and disposition of 911 calls. These grants include the 3 Department of Public Safety operated PSAPs. HSEMD was tasked by the legislature with paying $4,000,000 towards the statewide interoperability radio platform within the scope of the Receipt and Disposition of the 911 language already in Code
IN AT&T, Indigital, ECaTS KS AT&T MA General Dynamics Information Technology MD Verizon ME FairPoint Communications MI Peninsula Fiber Network
MN There are too many service providers to list, but to the best of our knowledge, we have an agreement with all service providers doing business in the State of Minnesota.
MT CenturyLink ND CenturyLink PR All five (5) wireless service providers have completed their deployment of text to 911 service ATT, Claro, Sprint, TMobile, Open Mobile
SD
On 12-18-2014 the State of South Dakota entered into a contract with Comtech TCS (FKA NextGen Communications, Inc. or Telecommunications Systems). They are providing a statewide hosted CPE in all of the PSAPs in the state. In addition they will build, host and maintain our ESInet. On 11-15-2014 the State of South Dakota entered into a contract with GeoComm, Inc. They are creating the statewide GIS dataset for use in our NG911 system to route 911 calls geospatially. On 9-1-2014 the State of South Dakota entered into a contract with CDI Infrastructure (AKA L.R. Kimball) for NextGen 911 Project Management.
TN All service providers in Tennessee have executed user agreements to ensure consistent and secure service over the state's NG911 network. UT CenturyLink, West (Intrado), TCS, Synergem, Direct Technologies, Emergency CallWorks, Frontier Communications, Motorola
VT
AT&T Local Services Burlington Telephone Charter Communications Comcast Coverage Co, EarthLink/One Communications Fairpoint Communications Franklin Telephone HTJ Level3 National Mobile Communications Northland of Vermont Fairpoint Windstream/PAETEC Waitsfield and Champlain Valley Telecom Shoreham Telephone TDS Topsham Telephone Company, Inc. Vermont Telephone AT&T Mobility Metro PCS Verizon Wireless Sprint T-Mobile TracFone US Cellular
WA All regulated carriers and carriers with interconnect agreements operating within Washington State.
WI
In Wisconsin, the installation and maintenance of the 911 network in a given county is authorized by a contract that the county enters into with participating local exchange carriers. This contract specifies in detail the network design for the county 911 service, sets the amount of the 911 surcharge, and identifies the obligations of the parties to operate, maintain, and repair the 911 network. Wis. Stat. § 256.35(3)(b)3. No agreements between a State agency and originating service providers exist.
82 2016 National 911 Progress Report

2016 National 911 Progress Report Data Element Responses
None, N/A, or Reported Unknown: AK, AR, AZ, CT, FL, GA, ID, IL, KY, NC, NE, NH, NJ, NM, OH, OK, OR, PA, SC, TX, VA, VI, WY Did Not Report Data: AS, DE, GU, MO, MP, MS, NV, NY, RI, UM
2016 Finding
Of all U.S. States and territories: • 22 of 45 reporting States submitted an extended response • 23 of 45 reporting States listed “none,” “N/A,” or are “unknown” – State did not respond to this data element.
Dataset Shift
• 2015 Finding: 18 of 42 reporting States submitted an extended response • 2015 Finding: 24 of 42 reporting States listed “none,” “N/A,” or are “unknown” – State did not respond to this data element • 2014 Finding: 15 of 39 reporting States submitted an extended response • 2014 Finding: 24 of 39 reporting States listed “none,” “N/A,” or are “unknown” – State did not respond to this data element.
83 2016 National 911 Progress Report

2016 National 911 Progress Report Data Element Responses
3.2.2.9.2: Providers with No Agreements in Place
Question: Provide a list of service providers that have not executed agreements (capacity or service level) with your State. Enter information with comma or carriage returns below. Definition: This data element asks States to provide a list of service providers with whom no agreements (capacity or service level) are in place. This will vary from State to State. Data included from this element will be used to help identify States that are having difficulty with certain carriers/providers.
TABLE 50. LIST OF PROVIDERS WITH NO AGREEMENT IN PLACE State Response
IN Frontier, CenturyLink, Force 10 MT CenturyLink NM CenturyLink PR All five (5) wireless service providers have completed their deployment of text to 911 service VA Verizon, Century Link, Ntelos, Shentel
None, N/A, or Reported Unknown: AK, AL, AR, AZ, CA, CO, CT, DC, FL, GA, HI, IA, ID, IL, KS, KY, MA, ME, MI, MN, MT, NC, ND, NE, NH, NJ, NM, OH, OK, OR, PA, SC, SD, TN, TX, UT, WA, WI Did Not Report Data: AS, DE, GU, LA, MP, MS, MO, NV, NY, RI, UM, VI, VT, WV, WY
2016 Finding
Of all U.S. States and territories: • 5 of 45 reporting States submitted an extended response • 40 of 45 reporting States listed “none,” “N/A,” or are “unknown” – State did not respond to this data element.
Dataset Shift
• 2015 Finding: 4 of 42 reporting States submitted an extended response • 2015 Finding: 38 of 42 reporting States listed “none,” “N/A,” or are “unknown” – State did not respond to this data element • 2014 Finding: 3 of 39 reporting States submitted an extended response • 2014 Finding: 36 of 39 reporting States listed “none,” “N/A,” or are “unknown” – State did not respond to this data element.
84 2016 National 911 Progress Report
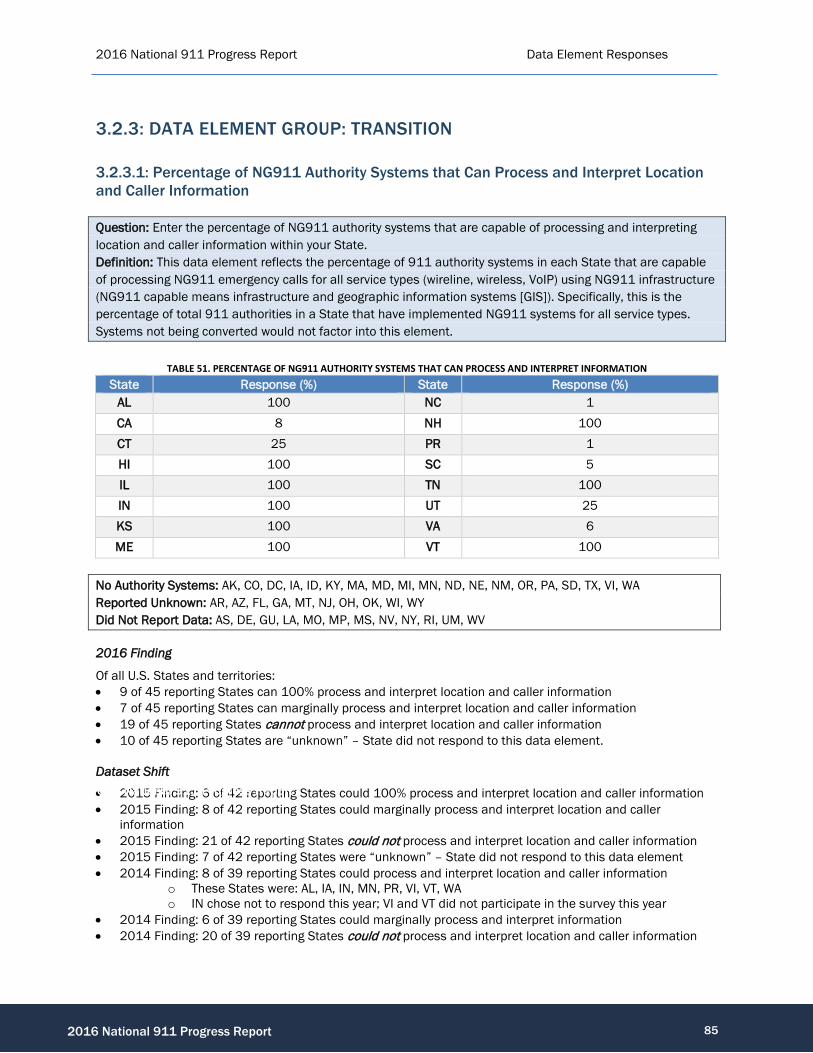
2016 National 911 Progress Report Data Element Responses
3.2.3: DATA ELEMENT GROUP: TRANSITION
3.2.3.1: Percentage of NG911 Authority Systems that Can Process and Interpret Location and Caller Information
Question: Enter the percentage of NG911 authority systems that are capable of processing and interpreting location and caller information within your State. Definition: This data element reflects the percentage of 911 authority systems in each State that are capable of processing NG911 emergency calls for all service types (wireline, wireless, VoIP) using NG911 infrastructure (NG911 capable means infrastructure and geographic information systems [GIS]). Specifically, this is the percentage of total 911 authorities in a State that have implemented NG911 systems for all service types. Systems not being converted would not factor into this element.
TABLE 51. PERCENTAGE OF NG911 AUTHORITY SYSTEMS THAT CAN PROCESS AND INTERPRET INFORMATION
State Response (%) State Response (%) AL 100 NC 1 CA 8 NH 100 CT 25 PR 1 HI 100 SC 5 IL 100 TN 100 IN 100 UT 25 KS 100 VA 6 ME 100 VT 100
No Authority Systems: AK, CO, DC, IA, ID, KY, MA, MD, MI, MN, ND, NE, NM, OR, PA, SD, TX, VI, WA Reported Unknown: AR, AZ, FL, GA, MT, NJ, OH, OK, WI, WY Did Not Report Data: AS, DE, GU, LA, MO, MP, MS, NV, NY, RI, UM, WV
2016 Finding
Of all U.S. States and territories: • 9 of 45 reporting States can 100% process and interpret location and caller information • 7 of 45 reporting States can marginally process and interpret location and caller information • 19 of 45 reporting States cannot process and interpret location and caller information • 10 of 45 reporting States are “unknown” – State did not respond to this data element.
Dataset Shift
• 2015 Finding: 6 of 42 reporting States could 100% process and interpret location and caller information • 2015 Finding: 8 of 42 reporting States could marginally process and interpret location and caller
information • 2015 Finding: 21 of 42 reporting States could not process and interpret location and caller information • 2015 Finding: 7 of 42 reporting States were “unknown” – State did not respond to this data element • 2014 Finding: 8 of 39 reporting States could process and interpret location and caller information
o These States were: AL, IA, IN, MN, PR, VI, VT, WA o IN chose not to respond this year; VI and VT did not participate in the survey this year
• 2014 Finding: 6 of 39 reporting States could marginally process and interpret information • 2014 Finding: 20 of 39 reporting States could not process and interpret location and caller information
85 2016 National 911 Progress Report
2016 National 911 Progress Report
2016 National 911 Progress Report Data Element Responses
• 2014 Finding: 5 of 39 reporting States were “unknown” – State did not respond to this data element.
86 2016 National 911 Progress Report
2016 National 911 Progress Report

2016 National 911 Progress Report Data Element Responses
3.2.3.2: Percentage of the Total State Population Served by NG911 Capable Services
Question: Enter the percentage of population receiving IP-delivered 911 calls within your State. Definition: Similar to data element 3.2.3.1, this element reflects the percentage of the population for a reporting State served by IP-capable 911 services meeting industry-accepted definitions for NG911. Note, using NENA’s i3 standard alone is not the same as an NG911 system. The i3 standard only describes the network, components, and interfaces required to establish NG911 service. To deploy a “full function” NG911 system, States will need equipment and software vendors, access network providers, and originating service providers, all elements not included in the i3 standard.
TABLE 52. PERCENTAGE OF STATE POPULATION SERVED BY NG911 CAPABLE SERVICES State Response (%) State Response (%)
CA 3 NH 100 HI 100 PR 1 IA 99 SC 3 IN 100 TN 100 KS 9 UT 80 ME 100 VA 13 MI 3 VI 100 MN 100 VT 100 NC 6 WA 100
No Population Served: AK, AR, CO, DC, ID, IL, KY, MA, MD, ND, NE, NJ, NM, OR, PA, SD, TX Reported Unknown: AL, AZ, CT, FL, GA, MT, OH, OK, WI, WY Did Not Report Data: AS, DE, GU, LA, MO, MP, MS, NV, NY, RI, UM, WV
2016 Finding
Of all U.S. States and territories: • 9 of 45 reporting States have 100% population served by NG911 capable services • 9 of 45 reporting States marginally have population served by NG911 capable services • 17 of 45 reporting States do not have population served by NG911 capable services • 10 of 45 reporting States are “unknown” – State did not respond to this data element.
Dataset Shift
• 2015 Finding: 4 of 42 reporting States had 100% population served by NG911 capable services • 2015 Finding: 12 of 42 reporting States marginally had population served by NG911 capable services • 2015 Finding: 19 of 42 reporting States did not have population served by NG911 capable services • 2015 Finding: 7 of 42 reporting States were “unknown” – State did not respond to this data element • 2014 Finding: 5 of 39 reporting States had 100% population served by NG911 capable services
o These States were: AL, IA, PR, VI, VT o AL chose not to respond this year; VI and VT did not participate in the survey this year
• 2014 Finding: 7 of 39 reporting States marginally had population served by NG911 capable services • 2014 Finding: 20 of 39 reporting States did not have population served by NG911 capable services • 2014 Finding: 7 of 39 reporting States were “unknown” – State did not respond to this data element.
87 2016 National 911 Progress Report
2016 National 911 Progress Report

2016 National 911 Progress Report Data Element Responses
3.2.3.3: Percentage of the Geographical Area of a State Served by NG911 Capable Services
Question: Enter the percentage of geographical area where PSAPs receive IP-delivered 911 calls within your State. Definition: Similar to data element 3.2.3.2, this data element specifically reflects the percentage of geographic area served (as opposed to population) by NG911 services. Data from this will help differentiate progress for those jurisdictions that have dense urban populations, and reflect IP-capable 911 services meeting industry-accepted definitions for NG911. They may be serving a large percentage of the population but may be serving a very small geographic portion of the State. This metric could indirectly help gauge progress for rural areas.
TABLE 53. PERCENTAGE OF GEOGRAPHICAL AREA SERVED BY NG911 CAPABLE SERVICES
State Response (%) State Response (%) CA 21 NH 100 HI 100 PR 1 IA 99 SC 8 IN 100 TN 100 KS 10 UT 15 ME 100 VA 9 MI 18 VI 100 MN 100 VT 100 NC 10 WA 98
No Geo. Area Served: AK, AR, CO, DC, ID, IL, KY, MA, MD, ND, NE, NJ, NM, OR, PA, SD, TX Reported Unknown: AL, AZ, CT, FL, GA, MT, OH, OK, WI, WY Did Not Report Data: AS, DE, GU, LA, MO, MP, MS, NV, NY, RI, UM, WV
2016 Finding
Of all U.S. States and territories: • 8 of 45 reporting States have 100% geographic area NG911 capable service • 10 of 45 reporting States marginally have geographic area NG911 capable service • 17 of 45 reporting States do not have geographic area NG911 capable service • 10 of 45 reporting States are “unknown” – State did not respond to this data element.
Dataset Shift
• 2015 Finding: 4 of 42 reporting States had 100% geographic area NG911 capable service • 2015 Finding: 11 of 42 reporting States marginally had geographic area NG911 capable service • 2015 Finding: 19 of 42 reporting States did not have geographic area NG911 capable service • 2015 Finding: 8 of 42 reporting States were “unknown” – State did not respond to this data element • 2014 Finding: 5 of 39 reporting States had 100% geographic area NG911 capable service
o These States were: AL, IA, PR, VI, VT • 2014 Finding: 7 of 39 reporting States marginally had geographic area NG911 capable service • 2014 Finding: 21 of 39 reporting States did not have geographic area NG911 capable service • 2014 Finding: 6 of 39 reporting States were “unknown” – State did not respond to this data element.
88 2016 National 911 Progress Report
2016 National 911 Progress Report

2016 National 911 Progress Report Data Element Responses
3.2.4: DATA ELEMENT GROUP: OPERATIONS
3.2.4.1: ESInet Connected PSAPs
Question: Enter the percentage of ESInet connected PSAPs in your State out of the total number of primary PSAPs in your State. Definition: This question is designed to track the progress of ESInet deployments and PSAP connectivity to ESInets for call delivery. This includes PSAPs that are receiving IP calls from an ESInet, but have a Legacy PSAP Gateway (LPG) converting the calls back into analog to be processed by the CPE.
TABLE 54. PERCENTAGE OF ESINET CONNECTED PSAPS
State Response (%) State Response (%) AL 100 MI 5 CA 8 MN 100 CT 100 MT 72 HI 100 ND 81 IA 100 NH 100 IL 7 TN 100 IN 100 UT 25 KS 9 VA 6 KY 20 VT 100 ME 100 WA 70
No ESInet Connected PSAPs: AK, AR, DC, GA, ID, MA, MD, NC, NE, NJ, NM, OH, OR, PA, PR, SC, SD, TX, WY Reported Unknown: AZ, CO, FL, OK, VI, WI Did Not Report Data: AS, DE, GU, LA, MO, MP, MS, NV, NY, RI, UM, WV
2016 Finding
Of all U.S. States and territories: • 10 of 45 reporting States have 100% ESInet connected PSAPs • 10 of 45 reporting States marginally have ESInet connected PSAPs • 19 of 45 reporting States do not have ESInet connected PSAPs • 6 of 45 reporting States are “unknown” – State did not respond to this data element.
Dataset Shift
• 2015 Finding: 6 of 42 reporting States had 100% ESInet connected PSAPs • 2015 Finding: 11 of 42 reporting States marginally had ESInet connected PSAPs • 2015 Finding: 29 of 42 reporting States did not have ESInet connected PSAPs • 2015 Finding: 6 of 42 reporting States were “unknown” – State did not respond to this data element • This data element was changed for 2015. The previous element and responses are as follows: Percentage
of the planned NG911 Systems (as identified in the State’s NG911 Plan) that are operational for NG911 call-taking.
• 2014 Finding: 8 of 39 reporting States were operational for NG911 call-taking o These States were: AL, CT, IA, MN, PR, VA, VI, VT
• 2014 Finding: 5 of 39 reporting States were marginally operational for NG911 call-taking • 2014 Finding: 20 of 39 reporting States were not operational for NG911 call-taking • 2014 Finding: 6 of 39 reporting States were “unknown” – State did not respond to this data element.
89 2016 National 911 Progress Report
2016 National 911 Progress Report
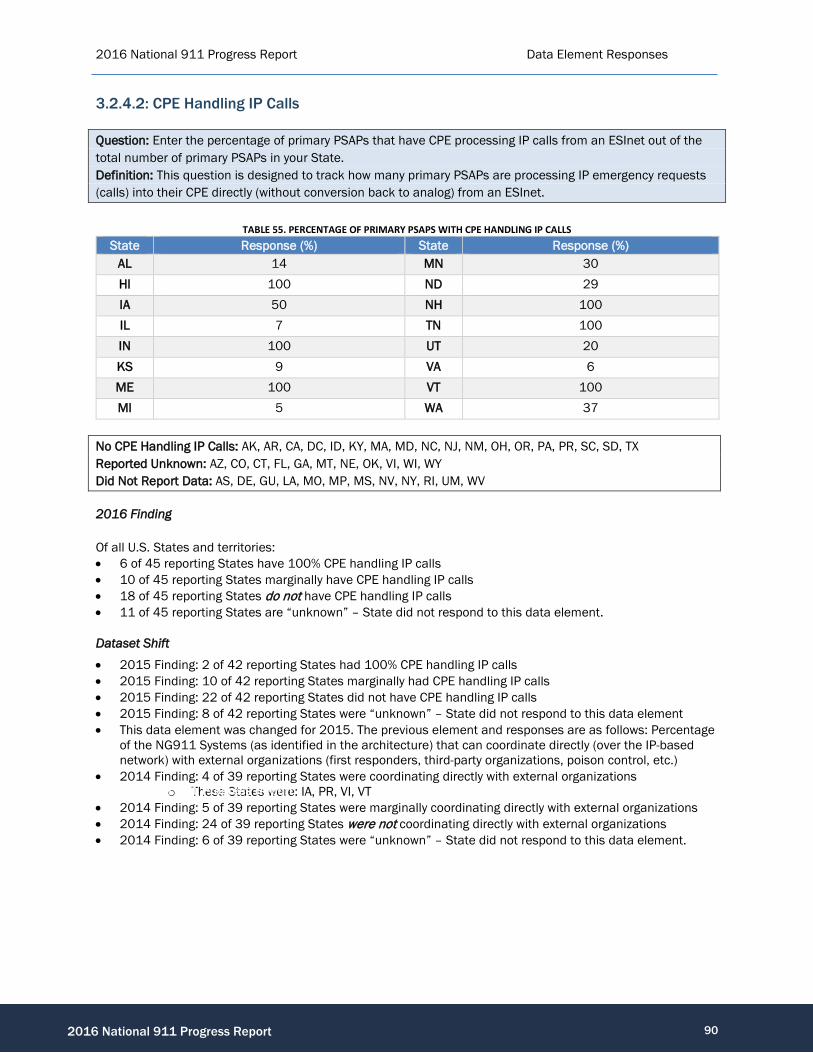
2016 National 911 Progress Report Data Element Responses
3.2.4.2: CPE Handling IP Calls
Question: Enter the percentage of primary PSAPs that have CPE processing IP calls from an ESInet out of the total number of primary PSAPs in your State. Definition: This question is designed to track how many primary PSAPs are processing IP emergency requests (calls) into their CPE directly (without conversion back to analog) from an ESInet.
TABLE 55. PERCENTAGE OF PRIMARY PSAPS WITH CPE HANDLING IP CALLS State Response (%) State Response (%)
AL 14 MN 30 HI 100 ND 29 IA 50 NH 100 IL 7 TN 100 IN 100 UT 20 KS 9 VA 6 ME 100 VT 100 MI 5 WA 37
No CPE Handling IP Calls: AK, AR, CA, DC, ID, KY, MA, MD, NC, NJ, NM, OH, OR, PA, PR, SC, SD, TX Reported Unknown: AZ, CO, CT, FL, GA, MT, NE, OK, VI, WI, WY Did Not Report Data: AS, DE, GU, LA, MO, MP, MS, NV, NY, RI, UM, WV
2016 Finding
Of all U.S. States and territories: • 6 of 45 reporting States have 100% CPE handling IP calls • 10 of 45 reporting States marginally have CPE handling IP calls • 18 of 45 reporting States do not have CPE handling IP calls • 11 of 45 reporting States are “unknown” – State did not respond to this data element.
Dataset Shift
• 2015 Finding: 2 of 42 reporting States had 100% CPE handling IP calls • 2015 Finding: 10 of 42 reporting States marginally had CPE handling IP calls • 2015 Finding: 22 of 42 reporting States did not have CPE handling IP calls • 2015 Finding: 8 of 42 reporting States were “unknown” – State did not respond to this data element • This data element was changed for 2015. The previous element and responses are as follows: Percentage
of the NG911 Systems (as identified in the architecture) that can coordinate directly (over the IP-based network) with external organizations (first responders, third-party organizations, poison control, etc.)
• 2014 Finding: 4 of 39 reporting States were coordinating directly with external organizations o These States were: IA, PR, VI, VT
• 2014 Finding: 5 of 39 reporting States were marginally coordinating directly with external organizations • 2014 Finding: 24 of 39 reporting States were not coordinating directly with external organizations • 2014 Finding: 6 of 39 reporting States were “unknown” – State did not respond to this data element.
90 2016 National 911 Progress Report
2016 National 911 Progress Report

2016 National 911 Progress Report Data Element Responses
3.2.4.3: Number of Operational ESInets Deployed within the State
Question: Enter the total number of operational ESInets deployed within your State. Definition: The number of ESInets deployed and operational within the State that are delivering IP calls to primary PSAPs. NENA defines an ESInet as a managed IP network that is used for emergency services communications, and which can be shared by all public safety agencies. It provides the IP transport infrastructure upon which independent application platforms and core functional processes can be deployed, including, but not restricted to, those necessary for providing NG911 services. ESInets may be constructed from a mix of dedicated and shared facilities. ESInets may be interconnected at local, regional, State, federal, national, and international levels to form an IP-based inter-network (network of networks).
TABLE 56. NUMBER OF OPERATIONAL ESINETS DEPLOYED WITHIN STATE
State Response State Response AL 1 MN 1 CA 1 MT 1 CT 1 ND 1 HI 5 NH 1 IA 2 SC 2 IL 1 TN 1 IN 1 UT 4 KS 2 VA 7 KY 2 VT 1 ME 1 WA 2 MI 1
No ESInets Deployed: AK, AR, DC, GA, ID, MA, MD, NE, NJ, NM, OH, OR, PR, SD, TX, WY Reported Unknown: AZ, CO, FL, NC, OK, PA, VI, WI Did Not Report Data: AS, DE, GU, LA, MO, MP, MS, NV, NY, RI, UM, WV
2016 Finding
Of all U.S. States and territories: • 8 of 45 reporting States have 2 or more operational ESInets deployed • 13 of 45 reporting States have 1 operational ESInet deployed • 16 of 45 reporting States do not have ESInet connected PSAPs • 8 of 45 reporting States are “unknown” – State did not respond to this data element.
Dataset Shift
• 2015 Finding: 5 of 42 reporting States had 2 or more operational ESInets deployed • 2015 Finding: 13 of 42 reporting States had at least 1 operational ESInet deployed • 2015 Finding: 18 of 42 reporting States do not have ESInet connected PSAPs • 2015 Finding: 6 of 42 reporting States are “unknown” – State did not respond to this data element.
91 2016 National 911 Progress Report
2016 National 911 Progress Report

2016 National 911 Progress Report Data Element Responses
3.2.4.4: Percentage of the Master Street Address Guide (MSAG) to Geographic Information System (GIS) Data Synchronization Progress
Question: Enter the percentage of address authorities within your State that have geocoded their addresses to a GIS ready format. Definition: The percentage of all the civic addresses in the State that have been geocoded into geospatial points. This occurs by synchronizing the Master Street Address Guide (MSAG) civic addresses to a geographic information system (GIS) geospatial database of road centerlines, site / structure locations, and related spatial databases. Converting civic addresses into GIS information enables NG911 systems to geospatially route calls and is necessary for other NG911 services.
TABLE 57. PERCENTAGE OF ADDRESSES THAT ARE GEOCODED
State Response (%) State Response (%) CT 100 MN 15 DC 100 ND 25 HI 83 NH 100 IA 93 OR 70 ID 10 SD 97 IN 100 TN 100 KS 89 UT 100 MA 99 VA 38 ME 100 VT 100 MI 36
No Geocoded Addresses: AR, MD, MT, NJ, NM, OH, PR, TX, VI, WA Reported Unknown: AK, AL, AZ, CA, CO, FL GA, IL, KY, NC, NE, OK, PA, SC, WI, WY Did Not Report Data: AS, DE, GU, LA, MO, MP, MS, NV, NY, RI, UM, WV
2016 Finding
Of all U.S. States and territories: • 8 of 45 reporting States have 100% geocoded addresses • 3 of 45 reporting States have 90-99% geocoded addresses • 5 of 45 reporting States have 5-51% geocoded addresses • 10 of 45 reporting States do not have geocoded addresses • 16 of 45 reporting States are “unknown” – State did not respond to this data element.
Dataset Shift
• 2015 Finding: 4 of 42 reporting States had 100% geocoded addresses • 2015 Finding: 4 of 42 reporting States had 90-99% geocoded addresses • 2015 Finding: 4 of 42 reporting States had 5-51% geocoded addresses • 2015 Finding: 11 of 42 reporting States did not have geocoded addresses • 2015 Finding: 19 of 42 reporting States were “unknown” – State did not respond to this data element.
92 2016 National 911 Progress Report
2016 National 911 Progress Report

2016 National 911 Progress Report Data Element Responses
Additional Comments Submitted by State Points of Contact
National 911 Profile Database State designees were given the option to provide any comments to supplement their data input. These comments have been added to this document as listed below of in the form of an asterisked comment added to its corresponding data element.
TABLE 58. ADDITIONAL COMMENTS SUBMITTED BY STATES
State Response
CO In Colorado, 911 is a very local service, so the collection of much of this data relies on voluntary reporting by PSAPs and local 911 Authorities.
TX Not all 911 entities are reflected in this response.
OK
Oklahoma has taken a giant step forward by the recent passage of a 911 Management Authority Act. The information that is requested in this survey as well as past survey by the 911.gov Resource Center has not and currently is not available due to the current statute that created the Statewide 911 Advisory Board. The newly passed legislation provides for the ability to create an office of a Statewide 911 Coordinator. This office will be able to coordinate the collection of the information that is being requested by the survey. The legislation, however, does not go into effect until November 1, 2016. That being said, it will take approximately 12 months to acquire the necessary funds to staff the office. But, there is very positive movement and things can begin to take shape prior to the funding of the coordinator's office.
FL
The E911 Board for the State of Florida is moving the Counties of Florida closer to 100% IP based systems and NG911 Statewide hardware capabilities. It is the desire of the Board to have the funding in the E911 Trust fund to be able to start funding systems upgrades statewide to current NG911 capable systems. In the meantime many of the Counties are moving forward with this on their own with the assistance in some cases with E911 Trust Fund based State or Rural County Grants. Currently those grant programs have limited funding, but the new NG911 State grant program based on funds coming from the newly collected Pre-paid fee revenue is gradually growing and will be the future basis for the purchase of NG911 Systems and ESInet support.
ID
The State submitted a survey to 46 PSAPs for the information requested as Idaho is a "home rule" state. Only 27 responses were received; consequently, data was not available for the "aggregated" State numbers requested. Some counties could not pull the required phone data as they did not have those report types loaded as a request. It is the hope that more counties will participate in the future as we move forward to provide accurate numbers. The income numbers are also questionable as I had to back into those numbers due to lack of response also. I will continue to request the data after the database has closed in the hope of having a baseline.
IL
Legislative Activity: The Illinois General Assembly passed the Emergency Telephone System Act (ETSA) on June 29, 2015. Article II which included NG911 Service, Consolidation, Consolidation Grants, Statewide Surcharge and 911 Fund was effective January 1, 2016. Policy Changes as a Result of the Legislation. The 911 Program was transitioned from the Illinois Commerce Commission to the Illinois State Police. Created an office of the Statewide 911 Administrator. Created a Statewide 911 Fund. Equalized surcharge to
93 93
2016 National 911 Progress Report

2016 National 911 Progress Report Data Element Responses
State Response $0.87 for landline, wireless and VoIP. Required Consolidation. Created a Consolidation Grant Program. Called for a Plan for a Statewide 911 Network. Established an implementation timeline for the NG911 System. Projects Consolidation Plans and Waivers are due July 1, 2016. An RFP to secure the services of a consultant to complete a feasibility study for a statewide NG911 Network to be issued by June 30, 2016. NG911 Legislation is calling for the implementation of a Statewide NG911 System by July 1, 2020.
MT Montana has an ESInet in place for 38 of its 53 PSAPs but current selective routers are not IP capable. The State of Montana through an RFP using grant funds installed an ESInet but since the contract between the State and Contractor has ended.
NE Nebraska has recently had legislation pass which will enable the Public Service Commission to develop a master plan for the implementation of Next Generation 911 in Nebraska. http://nebraskalegislature.gov/FloorDocs/Current/PDF/Final/LB938.pdf
OH
The data listed is from responses of 76 of Ohio's 88 counties. 12 counties did not respond and are not required by rule to respond until 2018. A data spreadsheet with detailed information from the 76 responses is available from the Ohio 911 Program Office ([email protected]). We have recently secured a NG911 consultant who will be assisting with an NG911 RFP in 2016 and provide a comprehensive report and recommendation on vendor, system and funding model by June of 2017.
TN
It should be noted that all PSAPs in Tennessee are Phase II capable and all are processing wireless calls over the state-wide IP-network. However, PSAPs in Tennessee are still transitioning to processing wireline calls over the network and some PSAPs still use gateways to process calls over next gen. Also, due to the ongoing full deployment of NG911 in Tennessee, certain PSAPs are rolled on and off the NG911 network at any given time. As such, the data reported regarding the percentage of PSAPs or local districts processing calls over the network is fluid and it fluctuates as we continue to transition off of the legacy network to the NG network.
94 94
2016 National 911 Progress Report

2016 National 911 Progress Report Data Element Responses
CONCLUSION
The data collected during 2015 for the 2016 report is notably different from data previously collected for the National Profile Database - both in quantity and character. The number of States submitting data increased from 42 to 46. Data is broken out by State, providing practical and useful information to the 911 community. This allows public and private 911 stakeholders to identify multiple comparable traits among States and reasons to collaborate on numerous issues.
Progress is being made towards implementation of Next Generation 911:
TABLE 59. PROGRESS IMPLEMENTING NG911
Data Element 2011 Data by Reporting States
2013 Data by Reporting States
2014 Data by Reporting States
2015 Data by Reporting States
Statewide NG911 Plan Adopted
9 of 27 15 of 39 19 of 42 20 of 46
Statewide Request for Proposal Released
Not Reported 13 of 36 18 of 42 19 of 46
State Contract Has Been Awarded
Not Reported 13 of 29 16 of 42 18 of 46
Statewide Installation and Testing
Not Reported 9 of 30 11 of 42 17 of 46
The data also provides valuable insight into the types of calls in each State, showing an overall decrease in the number of wireline calls, an increase in the number of wireless calls, and a nearly 100 percent availability of E911 and Wireless Phase II level of service.
A new question regarding the number of ESInets was added in the 2015 survey and the 2016 data showed 21 States with one or more ESInets. As NG911 progresses from year to year, the number of ESInets will increase, until most of the country will have ESInets to which PSAPs and 911 Authorities connect.
Further refinement of the data element questions and definitions is recommended based on the number of “unknown” responses. Many States do not collect or report the information requested for selected data elements, making it difficult or impossible for them to respond to the survey. As data definitions are revised and respondents’ challenges are addressed, the Profile Database can serve as a truly comprehensive resource for States to exchange information with each other and identify effective strategies to move towards NG911.
The National 911 Program gratefully acknowledges the invaluable contributions of NASNA members, as well as the staff of the respective State 911 Offices. Without their time, experience, and expertise, the National Profile Database would not be possible.
95 2016 National 911 Progress Report
2016 National 911 Progress Report