national bureau of economic research (2001), duffie and lando (2001), and others. important studies...
TRANSCRIPT

NBER WORKING PAPER SERIES
CORPORATE BOND DEFAULT RISK:A 150-YEAR PERSPECTIVE
Kay GieseckeFrancis A. Longstaff
Stephen SchaeferIlya Strebulaev
Working Paper 15848http://www.nber.org/papers/w15848
NATIONAL BUREAU OF ECONOMIC RESEARCH1050 Massachusetts Avenue
Cambridge, MA 02138March 2010
We are grateful for valuable comments and suggestions received from Navneet Arora, Vineer Bhansali,Richard Cantor, Josh Davis, Marvin Lieberman, Hanno Lustig, Scott Richardson, and Derek Schaeffer,and seminar participants at Blackrock, Brunel University, Copenhagen Business School, Exeter University,the Georgia Institute of Technology, New York University, PIMCO, The University of Alaska at Fairbanks,UCLA, and the Vienna School of Business and Finance. We are particularly grateful for extensiveresearch assistance provided by Priyank Gandhi, Xiaolong Cheng, Scott Cowin, Matthias Fleckenstein,Baeho Kim, Brent Longstaff, and Scott Longstaff. Strebulaev is grateful to the London Business School'sCenter for Corporate Governance (under ESRC contract number R060230004). All errors are our responsibility.The views expressed herein are those of the authors and do not necessarily reflect the views of theNational Bureau of Economic Research.
NBER working papers are circulated for discussion and comment purposes. They have not been peer-reviewed or been subject to the review by the NBER Board of Directors that accompanies officialNBER publications.
© 2010 by Kay Giesecke, Francis A. Longstaff, Stephen Schaefer, and Ilya Strebulaev. All rights reserved.Short sections of text, not to exceed two paragraphs, may be quoted without explicit permission providedthat full credit, including © notice, is given to the source.
Corporate Bond Default Risk: A 150-Year PerspectiveKay Giesecke, Francis A. Longstaff, Stephen Schaefer, and Ilya StrebulaevNBER Working Paper No. 15848March 2010JEL No. G12,G33
ABSTRACT
We study corporate bond default rates using an extensive new data set spanning the 1866–2008 period.We find that the corporate bond market has repeatedly suffered clustered default events much worsethan those experienced during the Great Depression. For example, during the railroad crisis of 1873–1875,total defaults amounted to 36 percent of the par value of the entire corporate bond market. We examinewhether corporate default rates are best forecast by structural, reduced-form, or macroeconomic creditmodels and find that variables suggested by structural models outperform the others. Default eventsare only weakly correlated with business downturns. We find that over the long term, credit spreadsare roughly twice as large as default losses, resulting in an average credit risk premium of about 80basis points. We also find that credit spreads do not adjust in response to realized default rates.
Kay GieseckeStanford [email protected]
Francis A. LongstaffUCLAAnderson Graduate School of Management110 Westwood Plaza, Box 951481Los Angeles, CA 90095-1481and [email protected]
Stephen SchaeferLondon Business SchoolRegents ParkLondon, NW14SAUnited [email protected]
Ilya StrebulaevStanford [email protected]

The longer you can look back, the farther you can look forward.
Winston S. Churchill
1. INTRODUCTION
This paper studies the properties of corporate bond default rates using an extensivenew data set covering the 1866−2008 period. This data set is comprised of both hand-collected data extracted from historical financial records such as the Commercial andFinancial Chronicle as well as tabulated data from a variety of sources including theNational Bureau of Economic Research (NBER), the Federal Reserve Board, Standardand Poor’s, and Moody’s Investors Services. In this study, we focus on the value-weighted default rates for U.S. nonfinancial bond issues. The reason for studyingnonfinancials is that while they have historically represented the majority of the bondmarket, they have generally received far less attention in the literature, particularlyduring the earlier part of the study period.1 Thus, the focus of this study is on “MainStreet” rather than on “Wall Street.”
In setting out on this study, a question that immediately raises itself is: How ishistorical corporate default experience dating back as far as the Civil War relevantto current financial research? After all, the corporate bond market of the 1860s wascomposed primarily of railroad, canal, and mining issues, which is a far cry from thecurrent composition of the market. We believe that there are at least four compellingreasons for studying the long-term default experience of the corporate bond market.First, while the names of the bond issuers and the industries they represent may changeand evolve over the centuries, the applicability of financial theory to the determinantsof default risk and the pricing of corporate bonds should not change. In other words,if a credit model such as Merton (1974) applies to bonds in the 21st Century, it shouldbe equally applicable in the 19th Century (albeit to a very different set of bonds).Second, the NBER dates business cycles back as far as the 1850s, and the study of these
1For example, there is an extensive literature documenting the failures of banks, se-curities firms, real estate trusts, and other financials during the Great Depression.These include Goldschmidt (1933), Galbraith (1955), Friedman and Schwartz (1963),Bernanke (1981, 1983), Kindleberger and Aliber (2005), Easley and O’Hara (1979),and many others. In contrast, there are relatively few sources describing failures ofnonfinancial firms during this period. We observe, however, that most recent cor-porate and credit risk empirical studies exclude financial and utility industries (forexample, see Eom, Helwege, and Huang (2004).
1

cycles has provided valuable insights into fundamental economic mechanisms. Indeed,business cycle data has been used extensively in macroeconomic research for parametercalibration. We believe that similar insights can be obtained by studying historicaldefault cycles. In addition, by identifying historical default cycles over the same timeperiod as NBER business cycles, we hope to shed light on the interaction betweenadverse credit market events and economic downturns. Third, in coming to grips withthe current financial market situation which has been termed a “historic crisis” or “theworst financial crisis since the Great Depression,” nothing is so valuable as actuallyhaving a long-term historical perspective. Fourth, there are many parallels betweenthe early part of the study period and recent credit market events. In particular,the latter part of the 19th Century was a period in which massive investment in anumber of exciting new technologies (railroads, electricity, etc.) was financed heavilyby debt. These technology booms were then followed by waves of financial crises andbond defaults, closely resembling patterns in the telecommunications and structured-credit-products cycles of the past decade.
To provide overall perspective on corporate default rates, we begin with a simpledescriptive analysis of the data. The U.S. experienced many severe clustered defaultevents during the study period. The worst event occurred in the 1870s when therailroad boom of the 1860s was followed by a disastrous decade of defaults. Duringthe three-year period from 1873−1875, the annual default rates total to 35.90 percentof the total par value of the corporate bond market. Several other three-year periodsin the study period experience comparable default rates. Surprisingly, the worst three-year period during the Great Depression with default rates totaling to 12.88 percentbarely makes it into the top five credit events for nonfinancials.2 On average, the annualcorporate default rate during the sample period is about 1.50 percent. Corporatedefaults, however, cluster significantly in time and the default rate is very persistent.Curiously, the correlation between credit events and NBER business downturns is onlyabout 26 percent.
Our primary focus is on understanding the determinants of corporate defaultrates. Theoretical work on the valuation of corporate bonds and default predictionfalls into three broad categories: structural models, reduced-form models, and macroe-conomic and/or accounting-based models. We explore the implications of each of theseframeworks and identify the economic factors that each suggests should drive corpo-rate default risk. Using available historical data, we apply a regression approach to
2This is consistent with the evidence given in Friedman and Schwartz (1963) that theactual financial losses incurred by debtholders during the 1930−1933 period were rel-atively modest as a percentage of total market capitalization. Friedman and Schwartzalso observe that “The impairment in the market values of assets held by banks . . .was the most important source of impairment in capital leading to bank suspensions,rather than the default of specific loans or of specific bond issues.” See Friedman andSchwartz, pp. 351-355.
2
examine which factors best forecast corporate default rates. We find that variablesimplied by the structural credit modeling framework have significant forecasting powerfor corporate default rates. In contrast, lagged corporate credit spreads have no pre-dictive power for default rates. These results complement and extend Collin-Dufresne,Goldstein, and Martin (2001), Elton, Gruber, Agrawal, and Mann (2001), Schaeferand Strebulaev (2008), and others who also find that credit spreads are significantlyinfluenced by factors that are difficult to link to credit fundamentals. Finally, we findthat the state of the economy as measured by a recession indicator variable has littleincremental predictive ability for corporate default rates.
Motivated by these results, we then explore the issue of how the market pricesdefault risk. Applying a 50-percent loss rate to the average default rate of about1.50 percent gives a back-of-the-envelope estimate of average annual credit losses ofroughly 75 basis points. Using the available data, however, we find that credit spreadsaverage about 153 basis points during the sample period. Thus, credit spreads havebeen approximately twice as large as expected default losses on average, implying anaverage premium of about 80 basis points for bearing default risk during the studyperiod. We again use a regression approach to examine whether increases in defaultrates map into higher credit spreads. We find little or no evidence that credit spreadsrespond to current or lagged default rates. Taken together, these counterintuitiveresults support the view that corporate credit spreads are driven largely by factorssuch as illiquidity, consistent with Collin-Dufresne, Goldstein, and Martin (2001),Elton, Gruber, Agrawal, and Mann (2001), Longstaff, Mithal, and Neis (2005), andothers.
In summary, this study provides four important results. First, we show thatthe historical default experience in the United States includes periods much worsethat those during the Great Depression. Second, the historical correlation of defaultcycles and economic downturns is surprisingly weak. Third, we find that variablessuggested by structural models of credit risk have significant forecasting power forcorporate defaults, while credit spreads and business cycle indicators do not. Fourth,we show that over the long-run, credit spreads appear to provide investors with amodest premium for bearing credit risk, but do not adjust to current or lagged realizeddefault rates. These results have many important implications for credit markets.
This paper contributes to the extensive literature on corporate credit risk andbond valuation. Key theoretical work in this area includes Black and Scholes (1973),Merton (1973, 1974), Black and Cox (1976), Leland (1994), Longstaff and Schwartz(1995), Jarrow and Turnbull (1995), Jarrow, Lando, and Turnbull (1997), Duffie andSingleton (1997, 1999), Collin-Dufresne and Goldstein (2001), Goldstein, Ju, and Le-land (2001), Duffie and Lando (2001), and others. Important studies focusing ondefault risk in corporate bonds include Altman (1968, 1989), Shumway (2001), Chava,and Jarrow (2004), Duffie, Saita, and Wang (2007), Almeida and Philippon (2007),and Campbell, Hilscher, and Szilagyi (2008). Research addressing the default premium
3

and the properties of corporate credit spreads includes Fons (1987), Sarig and Warga(1989), Kim, Ramaswamy, and Sundaresan (1993), Pedrosa and Roll (1998), Duffee(1999), Collin-Dufresne, Goldstein, and Martin (2001), Elton, Gruber, Agrawal, andMann (2001), Huang and Huang (2003), Eom, Helwege, and Huang (2004), Longstaff,Mithal, and Neis (2005), Driessen (2005), Berndt, Douglas, Duffie, Ferguson, andSchranz (2005), Jarrow, Lando, and Yu (2005), Davydenko and Strebulaev (2007),Schaefer and Strebulaev (2008), Bharath and Shumway (2008), and many others.This paper contributes to the literature by examining default risk and its relation tocredit spreads over a time period significantly longer than in any previous study.
The remainder of this paper is organized as follows. Section 2 describes the dataset used in the paper and explains how it is constructed. Section 3 describes some ofthe historical background for the study period. Section 4 explores the properties ofthe historical corporate default rates. Section 5 studies the determinants of corporatedefault risk. Section 6 examines how the market prices corporate bond default risk.Section 7 makes concluding remarks. The Appendix provides a detailed descriptionof the data collection process.
2. THE DATA
Our objective in this paper is to study the default rates that investors in the U.S.corporate bond markets have experienced historically. Specifically, our focus is on thebonds issued by U.S. firms in the nonfinancial sector. We limit our attention to U.S.corporate bonds since this allows us to study the relation between default rates and anumber of key financial and macroeconomic variables that are only available for theU.S. markets. As discussed above, we focus on the nonfinancial sector since it hasreceived much less attention in the literature than the financial sector. Furthermore,the nonfinancial sector has historically represented a much larger fraction of the marketfor long-term corporate debt than the financial sector. For example, financial issuersrepresented zero percent of all corporate bond issuers listed in the Commercial andFinancial Chronicle in 1870, 1.2 percent of all issuers listed in 1900, 6.9 percent of allissuers listed in 1930, and 1.8 percent of all issuers listed in 1969. Thus, the tendencyof financial firms to raise capital through the bond markets is a relatively recent onefrom a historical perspective.3
In measuring default rates, we focus on the fraction of the total par value of thecorporate bond market (the default rate) that enters into financial distress duringeach year in the sample period. Thus, our approach differs somewhat from that of
3Financial firms, of course, raise capital from other sources such as deposits, commer-cial paper, or the money markets. For a description of growth in the financial sector,see Philippon (2008) and Gandhi and Lustig (2009).
4

other surveys such as Moody’s Corporate Defaults and Recovery Rates, 1920−2008publication that are based on the fraction of issuers that enter into financial distresseach year.4 By studying the proportion of the total par value of bonds entering intofinancial distress, our results more closely reflect default rates from the perspective ofa representative investor holding the value-weighted portfolio of all corporate bonds.For brevity, we will refer to the domestic nonfinancial value-weighted default ratesimply as the default rate throughout the remainder of this paper.5
The collection of data for the study represented an extensive multi-year under-taking involving thousands of hours of research assistance. For example, obtainingcorporate bond market data for the 19th Century required obtaining original copies ofthe Commercial and Financial Chronicle, tabulating the number of corporate issuersand the number and par value of all corporate issues, and then painstakingly readingthough the pages of this source to identify news items providing information aboutissuers entering (or exiting) financial distress. The Commercial and Financial Chron-icle was founded in 1865 and was the first national business newspaper in the UnitedStates. The Commercial and Financial Chronicle published extensive lists of the cor-porate bonds that were available in the financial markets, including bonds traded onthe NYSE, the NYSE Curb Exchange, the AMEX, all of the regional exchanges, aswell as leading unlisted and inactive bonds.6
Our sample period begins with 1866 since this is the first full year that theCommercial and Financial Chronicle was published. The year 1866, however, is alogical starting point for a number of other reasons as well. First, 1866 is the first fullyear following the conclusion of the Civil War, thereby representing something of aregime shift in U.S. history. Second, the 1866−2008 sample period closely parallels the1857−2008 period covered by the NBER business-cycle-dating committee. Third, bybeginning with 1866, we are essentially matching the starting date of the classic studyof monetary history in the United States by Friedman and Schwartz (1963) whichbegins with 1867 (but also provides some discussion of events in earlier periods).
We also collected data from an extensive list of tabulated sources including thethree volumes of the Hickman (1953, 1958, 1960) NBER study of corporate bondmarkets. This study was sponsored by the Works Project Administration and theFederal Deposit Insurance Corporation during the 1940s and 1950s and involved atleast several dozen researchers over a number of years. We also obtained data fromthe NBER-sponsored study by Atkinson (1967) essentially extending the scope of
4Moody’s publishes some limited data on value-weighted default rates beginning with1994. See Table 45 in Moody’s Corporate Default and Recovery Rates, 1920−2008.5When the data allow, we also calculate equally-weighted issue and issuer default ratesand use these for a number of robustness checks.6For a description of the history of the Commercial and Financial Chronicle and itsfounder, see Steeples (2002).
5

the Hickman project by several decades. These studies were based on original dataobtained from industry sources but were cross checked with data from sources such asthe Securities and Exchange Commission, the Interstate Commerce Commission, andthe National Industrial Conference Board.7 For the latter part of the study period(1970-2008), we also used data provided to us by courtesy of Moody’s Default RiskServices and extracted from their extensive data set of corporate market issuers.
In addition to these sources, we also use data provided by the Federal ReserveBoard Flow of Funds Accounts of the United States, Standard and Poor’s Corporation,the Securities Industry and Financial Markets Association (SIFMA, formerly the BondMarket Association), Macaulay (1938), Homer and Sylla (1991), Carty (1997, 2000),and others.
It is important to emphasize that both the focus of our study and the natureof the data set used differ significantly from those in the well-known surveys of his-torical corporate default experience published by industry sources such as Moody’sInvestor Services Inc. and Standard and Poor’s Corporation. In particular, we focuson value-weighted default rates. In contrast, Moody’s Corporate Default and Recov-ery Rates, 1920−2008 publication focuses on the percentage of issuers that default.This distinction is an important one, however, since smaller firms tend to defaultmore frequently. Thus, issuer-weighted default rates can be numerically large whilenot economically large during some periods (including some years during the 1930s).Furthermore, the default rates in this Moody’s publication include defaults by globalissuers. In particular, as described by Carty and Lieberman (1997), Moody’s defaultrates were elevated by global events such as the German Transfer Moratorium in 1933in which 62 German firms were restricted from making foreign debt payments by thenewly installed Nazi government. These firms represent a large fraction of the totalnumber of defaulting firms during 1933 in the Moody’s sample. Carty and Liebermanalso report that similar defaults occurred through payment moratoriums in Austria,Czechoslovakia, Rhodesia, Chile, and Uruguay. In addition, default rates published byindustry sources are typically based on rated bonds. In contrast, our default statisticsfor the 1866−1969 period are based on the broader universe of all reported bonds(rated or unrated). Also, some of the earlier years in the Moody’s sample may haveless comprehensive coverage, perhaps because relatively few bond issues were rated.For example, Moody’s Corporate Default and Recovery Rates, 1920−2008 publicationimplies that there were about 1240 issuers in their sample in 1939.8 In contrast, therewere 2486 bond issuers listed in the Commercial and Financial Chronicle at the be-ginning of 1939. Finally, the earliest data on default rates available from Moody’sbegins with 1920. Thus, our data set extends 54 years further into the past, covering
7Sadly, the original data collected by Hickman and Atkinson seems to have been lost.8This follows from the number of defaults reported in Table 15 and the default per-centage reported in Table 36 of the Moody’s publication.
6

an additional 14 business cycles.
The specific data used in calculating the default rate consists of two time series.The first is the total par value of a snapshot of all nonfinancial corporate bondsincluded in the historical source at the beginning of each year. The second is thetotal par amount of the subset of bonds in the annual snapshot entering into financialdistress each year. The default rate is simply the ratio of the latter to the former.Note that for a default to be included in the numerator of this ratio, the bond needsto also be included in the denominator. This ensures that the estimated default rateis economically meaningful and bounded between zero and one.
Although we use a variety of data sources, the basic definition of financial distressremains fairly uniform throughout the study. In particular, financial distress includesevents such as a firm defaulting on a coupon or principal payment, an initial accountof a bondholder committee meeting, entering into receivership, bankruptcy, reorga-nization, etc. The Appendix provides details about the data sources, data collectionprotocols, and definitions of financial distress used in constructing these time series.
3. HISTORICAL BACKGROUND
In this section, we provide some selected background about the major historical trends,events, and legal environment influencing the corporate bond markets during the sam-ple period. In doing this, we focus primarily on the earlier part of our sample periodsince this is likely to be less familiar to the reader.9
3.1 The Railroad Boom and Crashes of the 19th Century
U.S. industrialization in the 19th Century was driven in large part by the transporta-tion revolution. In 1860, the American railroad network consisted of 30,000 miles oftrack in operation. By 1910, the U.S. had 351,767 miles of track, of which 266,000miles were main track (Hughes and Cain (2007)). As Hughes and Cain argue in theireconomic history,
“Constructing America’s railroads was such a giant effort that thestory of it has become simply overpowering in its influence uponAmerican history. . . . There had never before been anything likeit.” (p. 287).
9There are many excellent financial and economic histories of the United States forthe period covered by this study. Examples include Macaulay (1938), Friedman andSchwartz (1963), Snowden (1990), Homer and Sylla (1991), Markham (2001, 2002),and Hughes and Cain (2007).
7

There were three major waves of railroad construction in the late 19th Century: 1868–1873, 1879–1883, and 1886–1892 (Fishlow (1965)). Railroads were built mainly withborrowed money and it should not come as a surprise perhaps that each of these boomscorrespond to subsequent major crises and high default rates.
As discussed by Friedman and Schwartz (1963), and Homer and Sylla (1991), thelate 19th Century was also characterized by an enormous expansion in the size of U.S.debt markets, economic activity and productivity, the national banking system, aswell as the transportation system. Quoting from Friedman and Schwartz,
“There are many other signs of rapid economic growth. This wasa period of great railroad expansion dramatized by the linking of thecoasts by rail in 1869. The number of miles of track operated morethan doubled from 1867 to 1879, a rate of expansion not matchedsubsequently. . . . The political developments combined with thegreat cheapening in transportation to produce a rapid extension ofthe area under cultivation. The number of farms rose by over 50percent from 1870 to 1880 for the U.S. as whole. The average valueper acre apparently increased despite the sharp decline in the priceof farm products—clear evidence of a rise in economic productivity.”(Chapter 2, pg. 35).
The growth in economic activity was accompanied by a rapid expansion in thecorporate bond market. For example, the number of bond issuers listed in the Com-mercial and Financial Chronicle was 158 in 1866, but quickly reached 421 by 1872.The Commercial and Financial Chronicle from this period is often filled with enthu-siastic accounts about the promise of new technology,
“ . . . every well-built railroad if suitably located becomes a pro-ductive machine which adds to the wealth of the whole country . . .Our new railroads increase the value of farms and open new marketsfor their products. They lessen the time and cost of travel. Theygive a value to commodities otherwise almost worthless. They con-centrate population, stimulate production and raise wages by makinglabor more efficient. Our existing railroads are computed to createmore wealth every year than is absorbed for the construction of newrailroads.” (January 11, 1873).
The parallels between this period and the recent internet and dot-com era of the late
8
1990s and early 2000s are indeed striking.
However, later in the same year there was a major panic which led to a defaultrate of 14.3 percent in 1873. Contrast the buoyant spirit reflected in the previousquote with that evidenced by the following quote from the Commercial and FinancialChronicle exactly one year later.
“After such a panic as has, the past year, swept over the country, itbecomes a kind of melancholy pleasure to look over the field and findthat there are not quite so many dead and wounded lying about aswas anticipated. It was a fearful storm while it lasted, and althoughevery one of course can say now that he knew it was coming, yet thereal truth is, its breaking was terribly sudden and unexpected. . .. There are few people who allow themselves to remember long thelessons experience would teach them. If this were not so, there wouldbe many less failures in the world. . . . Almost all felt they werecarrying too much debt; they would henceforth be out of it. Thereare now, however, very evident signs that these resolutions have beenmostly forgotten. Overtrading, as it is called, is an evil that has everexisted, and pretty much the same epitaph can be written above eachbusiness prostration—here lies the result of an attempt to do toomuch with too little capital. Must history necessarily repeat itself?”(January 10, 1874).
Once again, the parallels between the leverage-related financial crisis of the 1870s andthe recent subprime-mortgage securitized-credit crisis are clear. Unfortunately, thestorm was far from over and history immediately repeated itself. Consider the follow-ing quote from a demoralized editorial in the Commercial and Financial Chronicle lessthan three years after the previous quote and following default rates of 16.3 percentin 1874, 5.3 percent in 1875, and 5.9 percent in 1876,
“This marks the depth of the present disease. It has not been sim-ply the falling out of reckless traders—not the end of an ordinarilywild speculation in which the failure is usually the result of individualindiscretion and rashness; but it is more a result of a wrong finan-cial system. We have been trading on a fictitious basis. The truththat it was not real, suddenly is forced upon every man. The houses,the stocks of goods, the factories we had produced and built and heldat high values, we see could now be duplicated at about two-thirds orone-half their cost.” (July 15, 1876).
9

Although written more than 130 years ago, both the qualitative and quantitativesentiments expressed in this quote are mirrored eerily in discussions and debates aboutthe current global financial crisis.
Financial history repeated itself several more times during the latter part of the19th Century. The number of issuers listed in the Commercial and Financial Chroniclecontinued to increase steadily throughout this period, reflecting a large demand fordebt capital by the railroads and a growing need by the emerging utility and industrialsectors (particularly the promising new technology of electricity).10 For example, in1880, the bonds listed in the Commercial and Financial Chronicle represented 339railroads, 12 canals, and 12 miscellaneous issuers. By 1899, the Commercial andFinancial Chronicle listed not only bonds for 404 railroads, 196 street railroads, 55gas and electric utilities, but also 200 miscellaneous issuers (primarily industrial firmsand other types of utilities). Despite the growth in the corporate bond market (orperhaps because of it), there were several other major default events during the 1880sand 1890s, although these were not as severe as those experienced during the decadeof the 1870s.
3.2 Bankruptcy and Receivership
In this subsection we review the main historical developments concerning legal issuesof corporate reorganizations. The main point that emerges from this discussion is thatfor most of the earlier period of our study, equity receivership rather than bankruptcywas the mechanism under which the consequences of default on corporate bonds wereplayed out.
3.2.1 Bankruptcy Law
There are many in-depth reviews of the history of bankruptcy law in the United Statesincluding Warren (1935), Tabb (1995), Skeel (2001), and Franks and Sussman (2003).In this section, we summarize some of the key events described in these sources whichare relevant for our study.
Tabb (1995) explains that U.S. bankruptcy law dates back to the ConstitutionalConvention of 1787 which empowered Congress to “pass uniform laws on the subjectof bankruptcy.” Quoting from Tabb,
“For over a century after the Constitution, however, the BankruptcyClause remained largely unexercised by Congress. During those peri-ods, many states stepped into the void and passed their own bankrupt-cy legislation. A Federal bankruptcy law was in existence only from1800 to 1803, from 1841 to 1843, and from 1867 to 1878. Permanent
10See Benmelech (2009) for an in-depth analysis of the debt maturity of railroads andthe marketability of railroad assets during this period.
10

Federal bankruptcy legislation did not go into effect until 1898. Thus,states were free to act in bankruptcy matters for all but 16 of thefirst 109 years after the Constitution was ratified. In each instanceof Federal action, the Federal legislation followed a major financialdisaster: the Act of 1800 followed the Panic of 1797, the Act of 1841came after the Panic of 1837; the 1867 Act followed the Panic of 1857and the Civil War; and finally the 1898 Act was passed in the wakeof the Panic of 1893.”
The passage of the Act of 1898 (the Nelson Act) represented the beginning ofpermanent Federal bankruptcy law. The Act was viewed as ushering in a regime char-acterized by liberal debtor treatment, although there were many restrictions placedon the ability of corporations to enter voluntary bankruptcy. From 1898 to the pas-sage of the Act of 1938 (the Chandler Act), there were many amendments made tothe 1898 Act, typically in an effort to mitigate its extreme pro-debtor nature. It isimportant to observe, however, that the early part of the 1930s saw the passage of anumber of pro-debtor amendments and laws by Congress that favored rehabilitationrather the liquidation of defaulting firms. A number of these amendments were struckdown by the Supreme Court, but then reworked and reenacted by Congress in a waythat survived judicial review. The Chandler Act represented a major overhaul of the1898 Act and formalized many of the corporate reorganization mechanisms that hadbeen passed by Congress during the earlier part of the 1930s (such as the railroadreorganization laws of 1933 and 1935).
The Chandler Act effectively transferred power in bankruptcy away from man-agers and towards independent trustees. As a result, as Skeel (2001) suggests, the1938 Act discouraged managers of large firms from filing for bankruptcy (under Chap-ter 10 designed originally for large corporations) if there was any way to avoid it. Inlater decades, managers used all manner of tricks to file under Chapter 11 (designedoriginally for small businesses) which left the management intact.
Bankruptcy law in its current form was ushered in through the Bankruptcy Re-form Act of 1978. This Act introduced many major changes to the bankruptcy process,combined several of the earlier types of reorganization into a Chapter 11 process, andre-introduced debtor-in-possession procedures and trustees, etc. The most recent ma-jor revision to bankruptcy law was the Bankruptcy Abuse Prevention and ConsumerProtection Act of 2005 which made sweeping changes to the ability of consumers andbusiness to file for voluntary bankruptcy.
3.2.2 Equity Receivership
The lack of a Federal bankruptcy law during most of the latter part of the 19thCentury proved to be a challenge for corporate bondholders since most of the defaultsduring this period were for railroads, almost all of which (especially the large ones)
11

were interstate. As Tabb (1995) says,
“Given the interstate nature of virtually all of the railroads, stateremedies were entirely inadequate. The creative solution achieved wasto invoke the power of the Federal courts to supervise the restructuringof the railroad. Court-supervised receiverships remained the predomi-nant means of corporate reorganization for about a half century, untilFederal reorganization laws were enacted during the Depression.”
“A receivership was commenced when a creditor petitioned the Federalcourt to exercise its equity jurisdiction to appoint a receiver to takecontrol of the corporate debtor’s assets. The receiver then would beable to continue to run the railroad, while looking for a buyer for theassets. Eventually the assets would be sold in a foreclosure sale, andthe creditors would be paid out of the proceeds of the sale. Since thebusiness could be sold as a going concern, a higher price could berealized.”
It is important to stress that various bankruptcy acts sporadically introduced inthe 19th Century (including the more permanent 1898 Act) were meant mainly forsmall businesses rather than large corporations. For example, the 1867 BankruptcyAct assumed that bankrupt corporations would simply be shut down and their assetsliquidated. Such an approach did not make sense for railroads, since everyone agreedthat it was important to keep the railroads running. By the final decades of the19th Century the courts had developed a judicial reorganization technique known asequity receivership, which became the basis for modern corporate reorganization. Asexplained in detail in Skeel (2001), equity receivership was effectively cobbled togetherby various claimholders and courts from two powers that did have an establishedcommon-law pedigree: courts’ equitable authority to appoint receivers and the rightof a mortgage holder to foreclose on a mortgaged property if the debtor defaults. Theoldest case, the Munroe Railroad and Banking Company, dates from 1848. The courtsuggested that it made more sense to preserve the troubled railroad than to dismemberit. Quoting from Skeel (2001),
“What disastrous consequences would have resulted,” the court ex-claimed, “if each judgement creditor had been allowed to seize andsell separate portions of the road, at different sales in the six differentCounties through which it passed and to different purchasers? Wouldnot this valuable property have been utterly sacrificed?” (p. 57).
12

In another watershed case, the 1884 Wabash railroad reorganization, thepresiding judge concluded that
“An expenditure [must] be made for the benefit of all parties in interest. . . in order that [the railroad] shall be made a going concern.Otherwise, in the expressive language of a distinguished friend, youhave nothing else but a streak of iron-rust on the prairie.” (Skeel(2001), pp. 62–63).
As Skeel further explains, by analogy to current bankruptcy law, appointing areceiver served the same purpose as the automatic stay does now. Several importantcases further modified the equity receivership procedure. In one such case, the courtapproved a “receiver’s certificate” by allowing priority to be given to investors whocontributed new funds (because railroads needed financing to cover operating costs).This is similar to the current practice of debtor-in-possession financing in Chapter 11.In the 1884 Wabash receivership equityholders (lead by Jay Gould, a robber baron)filed for receivership themselves before defaulting and were appointed the receivers.Indeed, in a study of 150 receiverships between 1870 and 1898, Henry Swain (1898)found that insiders were appointed as receivers in 138 of the cases. To give yet anotherexample, in the 1913 case of Northern Pacific v. Boyd the Supreme Court announcedthe “fixed principle” that outlined the rights of unsecured creditors and eventuallywould become bankruptcy’s absolute priority rule.
Importantly, certain industries (such as railroads) were treated differently underthe 1938 Chandler Act. In particular, the Act had new railroad provisions (Section77), which provided for a binding two-thirds vote by classes of creditors and for nation-wide jurisdiction but still left the reorganization process itself entirely to the partiesthemselves.
3.3 Development of Financial Markets
The massive capital investments in steam and street railroads, canals, and later utilitiesin the 19th Century were financed mainly by private means. Existing evidence suggeststhat capital was raised using securities with features that are very similar to modernfinancial instruments: common and preferred equity, and secured (and later unsecured)coupon-bearing debt.11 This gave rise to a liquid and active secondary market forrailroad and other securities, with corporate bonds actively traded on NYSE and
11It is unclear at present how the cross-section of corporate leverage ratios looked inthe 19th Century. Some very preliminary evidence we collected for one year (1889),suggests that book leverage ratios were higher than observed today (on the order of40-50 percent) and that there is a substantial cross-sectional variation with some firmshaving only common equity and many others exhibiting very high leverage ratios. A
13

other exchanges.
The NYSE by the 1860s already resembled its 20th Century counterpart in manyimportant respects and was also quick to implement technological novelties. For ex-ample, as early as September 1882 the NYSE introduced stock tickers (electric tickersbased on Edison’s invention). The telephone was installed in 1879 and the electricannunciator board in 1881. These innovations led to a substantial increase in tradingvolume and liquidity.
Investors, and particularly bond investors, had access to a wide range of reputablesources of information. The Commercial and Financial Chronicle has already beenmentioned. In addition to a weekly newspaper, subscribers received a monthly bulletinof all the recorded prices on major exchanges and quarterly or semi-annual supplementswhich listed all the major companies and gave detailed information on securities issuedby them. Henry Poor’s annual railroad manuals (which included industrial firmsas well) contained detailed information about all large companies, including balancesheets, income statements, details on collateral for most bond issues as well as carefullydrawn railroad maps.
A sizable industry of financial analysts providing second-hand assessment of thedevelopment of financial markets and investment advice developed quickly and wasnot dissimilar to what we observe today. To give one example, in his memoirs WilliamMcAdoo, President Wilson’s Secretary of the Treasury during the First World War,recalled the early days of his career when he started selling investment securities inNew York in 1892 (McAdoo (1931)):
“I became a walking encyclopedia of railroad statistics . . . I couldgive the capitalization, earnings, and general characteristics of everywell known railroad in the United States. . . . The drawers ofmy desk were crammed full of railroad maps. I studied them dayand night. After a while I had a mental picture of every importantrailroad system; I could take a map of the United States and markwith a pencil the main line and principal branches of any railroad onemight name.” (pp. 56-57).
McAdoo’s picturesque memoirs stand out, but from what we can judge, his experiencewas a typical one. In a nutshell, all the evidence suggests that by the second half ofthe 19th Century, the U.S. financial markets were already highly developed.
more detailed study of leverage is beyond this paper.
14

4. CORPORATE DEFAULT RATES
As a first step in the analysis, we begin by providing a long-term historical perspec-tive on corporate default experience in the United States. Table 1 reports summarystatistics for the annual default rates for the 1866−2008 period. Figure 1 plots thetime series of these annual default rates.
1880 1900 1920 1940 1960 1980 20000
2
4
6
8
10
12
14
16
18
Val
ue−
Wei
ghte
d D
efau
lt R
ate
(Per
cent
)
Figure 1. Historical Default Rates. This graph plots the annual value-weighted percentage default rates for bonds issued by domestic nonfinancialfirms for the 1866−2008 period.
As shown, the U.S. has experienced many severe default events during the studyperiod. The most dramatic of these was clearly the catastrophic railroad crisis of the1870s that followed the enormous boom in railroad construction of the 1860s. Thisrailroad crisis lasted an entire decade, and two years during this period had default
15

rates on the order of 15 percent. In fact, default rates during the three-year 1873−1875period totaled 35.90 percent. In contrast, default rates for the worst three-year periodduring the Great Depression only totaled 12.88 percent, and this three-year periodonly ranks in fourth place among the worst three-year default periods during thestudy period.
From Table 1, the long-run average default rate is 1.517 percent. Figure 1, how-ever, shows that the distribution of defaults is far from uniform. Rather, the historicalexperience is characterized by long periods with relatively few defaults following byepisodes of significant clustering of defaults. This is also evident from the varia-tion in summary statistics across the three subperiods, 1866−1899, 1900−1945, and1946−2008. The result is a distribution of default rates that is highly skewed towardslarge values. As a result, the median default rate of 0.545 percent is significantly lessthan the mean default rate of 1.517 percent. The standard deviation of default ratesis 2.414 percent. Figure 2 plots the histogram of annual default rates.
The time series of default rates shows that there is wide variation in the historicalexperience. The first half of the study period is characterized by a series of severe andprolonged credit episodes. In contrast, the second half of the study period experiencedfar fewer major credit events. This pattern parallels the well-known evidence that,from 1857 (when the NBER data begins) to today, business cycles have generallybecome more infrequent and less severe.
These similarities between default events and business cycles motivate examiningand contrasting their properties in more depth. Table 2 reports summary statisticsfor the major default cycles during the study period, where a default cycle is definedas a single year or a contiguous period of more than one year during which the defaultrate each year exceeds the mean rate of 1.517 percent. Table 2 shows that there were13 of these default cycles during the study period. In contrast, the NBER identifies31 distinct recessions during the same period.12 Thus, while there are only about40 percent as many default cycles as recessions, the fact that the economy spendsabout the same amount of time in both states illustrates the more persistent nature ofdefault cycles. The NBER data imply that the average duration of a recession duringthe sample period is about 1.5 years. In comparison, the default cycles identified inTable 2 have an average duration of about 3.2 years, which is more than double thatfor the NBER recessions.
To explore this latter point further, we define an annual dummy variable thattakes a value of one if any part of the year includes a recession, and zero otherwise.
12While the definition of a default cycle is somewhat arbitrary, it has the consequencethat the total number of years identified as belonging to a default cycle (42) is al-most precisely equal to the number of recession years (42.4) identified by the NBERduring the same period. For a more formal treatment of default cycles, see Giesecke,Longstaff, Schaefer, and Strebulaev (2010).
16

0 2 4 6 8 10 12 14 160
10
20
30
40
50
60
70
Cou
nt
Value−Weighted Default Rate (Percent)
Figure 2. Histogram of Historical Default Rates. This figure showsthe histogram of annual value-weighted percentage default rates for bondsissued by domestic nonfinancial firms for the 1866−2008 period.
Similarly, we define an annual dummy variable that takes a value of one if the year isincluded in a default cycle as identified in Table 2, and zero otherwise. The first orderserial correlations for these two time series are 0.267 and 0.574, respectively. Thus,while default cycles are less common that business cycle downturns, they tend to besignificantly more persistent. For a detailed analysis of the relation between defaultcycle and business cycles using this data set, see Giesecke, Longstaff, Schaefer, andStrebulaev (2010).
As an alternative way of looking at major default events, we tabulate total creditlosses over all three-year periods throughout the sample period. Table 3 provides
17

summary statistics for the most significant three-year non-overlapping default eventsranked by their severity.13 As described above, the worst three-year period is the1873−75 period in which the default rates total to 35.90 percent. The 1892−1894and 1883−1885 periods resulted in total default rates of 18.69 and 16.06 percent,respectively. The 1933−1935 period during the Great Depression ranks a distantfourth with a total default rate of 12.88 percent. Thus, while the Great Depressionmay have been the worst economic period during the sample period, it is actually veryfar from being the worst credit event experienced in the corporate bond market. Thefifth and sixth worst three-year periods have total default rates that are very similarto that of the 1933−1935 period. Observe that the 2000−2002 period is the onlypost-World-War-II period in the top twelve three-year periods listed in Table 3. Wenote that the year-to-date corporate nonfinancial default rate for 2009 as of the endof September is 2.46 percent (per Moody’s). Thus, however large the current financialcrisis may appear, the 2009 default rate is unlikely to affect any of the rankings of thethree-year period shown in Table 3.
Table 3 also reports the average stock market return for each of these three-year periods. The annual stock market return time series is given by combining themonthly data for 1802−1929 provided by Schwert (1990) with CRSP value-weighteddata for the subsequent period (data provided by Ken French). Of the 12 periods, 8have average stock market returns that are below the overall average of 10.33 percent.The average return over the 12 periods is 8.66 percent. Given the volatility of stockreturns, however, we cannot reject the hypothesis that the average return for the 12periods is not significantly less than the overall average of 10.33 percent.
Table 3 also reports the average fraction for each three-year period that the econ-omy is in a downturn based on its NBER business cycle identification. As shown, theaverage fractions range from 0.08 to 1.00. Averaging over all 12 periods, the overallaverage is 0.43. This is slightly higher than the unconditional average over the entiresample period of 0.32. These results hint at the evidence documented in Giesecke,Longstaff, Schaefer, and Strebulaev (2010) that business cycles and credit cycles areonly moderately correlated. For example, the simple correlation between the annualdummy variables for business cycles and default cycles described above is only 0.263.We will return to this issue in the next section as we study the historical determinantsof default risk in the corporate bond market.
5. THE DETERMINANTS OF DEFAULT RISK
In this section, we use variables suggested by a number of theoretical credit models
13The sum over three years can include a few issuers that default more than once.These issuers, however, represent a very small fraction of the total.
18

to study the determinants of corporate default rates. In doing this, we first reviewthese models and consider their empirical implications for realized default rates. Wethen describe the variables we use in the empirical analysis. Finally, we report theregression results and discuss their implications.
5.1 Modeling Corporate Default Risk
There is a large theoretical literature on modeling corporate default risk, the valuationof corporate bonds, and default prediction that is far too extensive for us to review fullyhere. In general, however, this literature can be divided into three broad categories:structural models, reduced-form models, and macroeconomic/accounting-based mod-els. We consider each of these three frameworks in turn below. It is important toacknowledge, however, that these three frameworks are not necessarily mutually ex-clusive and that specific variables may be implied by more than one framework. Forexample, many of the variables suggested by the structural framework can easily beincorporated into a reduced-form framework as well (for example, see Chava and Jar-row (2004), Duffie, Saita, and Wang (2007)). Thus, our analysis should be viewed asan exploratory investigation into the determinants of default risk, and not as a test ofany specific credit model.
5.1.1 Structural credit models
This class of models was introduced by the important early series of papers on optionpricing theory and its applications including Black and Scholes (1973) and Merton(1973, 1974). Significant extensions of the basic structural credit framework includeBlack and Cox (1976), Geske (1977), Leland (1994, 2004), Longstaff and Schwartz(1995), Goldstein, Ju, and Leland (2001), Collin-Dufresne and Goldstein (2001), andmany others.
In this class of models, corporate bonds represent contingent claims on the under-lying assets of a firm. By modeling the asset-value dynamics and the events triggeringdefault, contingent claims valuation technology can be applied to the debt claims ofa firm. An important dimension of this credit framework is that it identifies keyfactors that may drive corporate bond values. For example, as discussed by Collin-Dufresne, Goldstein, and Martin (2001) who investigate the determinants of creditspread changes, the structural framework implies that corporate credit spreads shouldbe driven by variables such as firm value, leverage, interest rates, the slope of theterm structure, and volatility. Factors driving credit spreads should also be relevantfor determining corporate default probabilities.
In light of this, our approach will be to examine whether realized corporate defaultrates can be forecast on the basis of ex ante variables suggested by structural models.Rather than doing this at the individual firm level (which would clearly not be feasiblegiven the scope of the study), we adopt a macro perspective and study default ratesat the aggregate level. Specifically, we use a regression approach to test whether mar-ketwide “structural” variables have explanatory power for subsequent realized default
19

rates.
Identifying structural variables that are available throughout the 1866−2008study period is a very challenging task given the lack of data during the early yearsof the sample. Despite this, however, we were able to extract a number of time seriesfrom the historical record that parallel those used in Collin-Dufresne, Goldstein, andMartin (2001). Specifically, we include as explanatory variables in the regression theannual stock market return, the annual stock market return variance, the yield onriskless government bonds, and the slope of the yield curve. The annual stock returnsare obtained from the sources described in Section 4. The annual stock return varianceis estimated by simply computing the variance of the twelve monthly returns for eachyear.
The yields on government bonds are obtained from data provided by Homer andSylla (1991) for 1866−1989, and from the Federal Reserve Board’s Selected InterestRates H.15 statistical release for the annual ten-year constant maturity Treasury ratefor the 1990−2008 period. Homer and Sylla argue that because government bondswere distorted by gold premiums and liquidity issues, “market yields on governmentsmust be disregarded altogether from 1863 until 1918 as a guide to American long-terminterest rates.” Accordingly, we use the yields on high-grade New England municipalbonds from 1866−1914, and the yield for the high-grade Bond Buyer municipal bondindex from 1915−1918 as proxies for the riskless government yield during these peri-ods.14 For the 1919−1989 period, we use the average of long-term government bondsprovided by Homer and Sylla (which is taken from the Federal Reserve, see the sourceslisted in Homer and Sylla, Table 50). The data are taken from Homer and Sylla Tables42, 43, 45, 48, and 51.
To estimate the slope of the credit curve, we take the difference between the yieldon high-quality long-term corporate bonds and a measure of the yield on short-termcorporate commercial paper. The yields for commercial paper for the 1866−1989period are taken from Homer and Sylla (1991) Tables 44, 49, and 53. The yieldsfor commercial paper for the 1990−2008 period are taken from the Federal ReserveBoard’s Selected Interest Rates H.15 statistical release for the three-month maturity(nonfinancial). As a measure of the yield on high-quality corporate bonds for the1866−1899 period, we use the annual yields on high-grade railroad bonds given inTables 42 and 43 of Homer and Sylla. For the 1900−1989 period, we use the year-endyields for prime corporate bonds given in Tables 45, 47, and 50 of Homer and Sylla.For the 1990−2008 period, we use the annual Moody’s Aaa index as reported by theFederal Reserve Board’s Selected Interest Rates H.15 statistical release. An importantadvantage of using the high-grade railroad and prime corporate bond indexes reportedby Homer and Sylla is that they allow us to measure corporate yields annually overmore than a century while holding the definition of the index composition relatively
14Shiller (1989) adopts the same approach in identifying historical interest rates.
20

fixed over time.
5.1.2 Reduced-form credit models
Another important class of credit models approaches the valuation of corporate bondsfrom the perspective of financial distress being triggered by the realization of a jumpor Poisson process. In this framework, the intensity of the Poisson process plays acentral role and is directly linked to the credit spread of a corporate bond. Importantpapers in this area include Jarrow and Turnbull (1995), Duffie and Singleton (1997,1999), and many others.
Because of the link between credit spreads and the intensity of the underlyingprocess triggering default, corporate credit spreads contain information about theprobability of default. Specifically, credit spreads can be expressed in terms of theactual probabilities of default (under the objective or P -measure) plus a componentrepresenting a risk premium compensating investors for bearing credit risk.15 A directimplication of the reduced-form modeling framework is that corporate credit spreadsmay contain information useful in forecasting future realized default rates.
To examine this implication, we will include the spread between the yield on thehigh-quality corporate bonds and the yield on riskless government bonds with similarmaturities. This data is described in the previous subsection.
5.1.3 Macroeconomic and Accounting-Based models
These studies focus primarily on the relation between business cycles and the financialhealth of bond issuers. For example, Fama and French (1993), Dichev (1998), Chavaand Jarrow (2004), Vassalou and Xing (2004), Campbell, Hilscher, and Szilagyi (2008),and others consider the extent to which credit risk represents a systematic risk in themacroeconomic environment that is priced in financial markets (see, for example,Bhamra, Kuhn, and Strebulaev (2010a, 2010b)). Accounting-based examples includeBeaver (1966), Altman (1968), Ohlson (1980), Beaver, McNichols, and Rhie (2005),and others that focus on earnings and accounting ratios (which reflect the sales, ex-penses, growth, liquidity, etc. of the firm, which in turn derive from the economic andbusiness environment the firm faces) and their ability to forecast defaults for individ-ual firms. The common theme throughout this literature is that corporate defaults aredirectly related to the broader macroeconomic environment. Specifically, the currentstate of the economy should impact the likelihood that a firm will enter into financialdistress in the near future.
To examine the link between economic downturns and subsequent corporate de-fault rates, we construct an annual indicator variable representing the percentage of
15In general, the risk premium component in a credit spread will be an increasingbut nonlinear function of the objective default probability, and so the overall relationbetween credit spreads and default probabilities would also be nonlinear.
21

the year that the U.S. economy is in recession as determined by the NBER (data pro-vided on the NBER website). For example, the NBER recession beginning in January1980 and ending in June 1980 would result in the indicator taking a value of 0.50 for1980.
5.2 The Results for Default Rates
Table 4 provides summary statistics for all of the variables described above. In par-ticular, we report summary statistics for the entire 1866−2008 period as well as forthe three subperiods 1866−1899, 1900−1945, and 1946−2008.
In examining the empirical implications of these credit-modeling frameworks, ourapproach will be to estimate a simple regression specification with three lagged valuesof the variables. In doing this, it is helpful to first apply a log transform to the defaultrate. The reason for this is simply that default rates are bounded between zero andone, inclusive. This increases the likelihood that without the log transformation, theregression residuals will not satisfy the usual normality assumption. Thus, to improvethe regression specification, we use the natural logarithm of the default rate (plus onebasis point since some values of the default rate are zero) as the measure of realizeddefault rates.16
In estimating the regressions, we use four different specifications. In the first, weuse only the structural variables. In the second, we use only the credit spread. Inthe third, we use only the NBER recession indicator. In the fourth, we use all of thevariables. Table 5 reports the results from estimating these specifications. The firstset of four columns in Table 5 reports the coefficient estimates; the second set of fourcolumns reports the Newey-West t-statistics for the coefficients.
Focusing first on the structural specification, Table 5 shows that the first and thirdlagged default rate variables are highly significant in all four specifications. This isconsistent with earlier results showing that default rates display significant persistence.The first lagged value of the stock return is negative and highly significant. Thisnegative sign is consistent with the implications of the structural framework in whichan increase in the value of the underlying assets leads to an increase in the valueof equity and a decrease in the probability of default. Similarly, the variance ofstock returns is positive and significant. Again, this is consistent with the structuralframework which implies that as volatility increases, the risk of a default increases.17
The other structural variables are not significant in this specification.
16We reestimate the regressions using the untransformed default rate instead andobtain results very similar to those reported.17Indeed, it is the total volatility of the firm, which consists of both systematic andidiosyncratic components, that matters for default rate prediction. Therefore, it islikely that our measure of volatility which proxies for systematic stock volatility un-derestimates the total volatility effect.
22

The results for the reduced-form specification again demonstrate that the firstand third lagged default rate variables are highly significant. In contrast, the laggedcorporate credit spreads have no incremental forecasting power for default rates andare not significant. This result parallels and complements the findings in Collin-Dufresne, Goldstein, and Martin (2001) who show that a considerable part of thetime variation in credit spreads does not appear to be closely related to economicfundamentals driving default risk. Our findings suggest that the converse propositionholds: that credit spreads have little explanatory power for default risk. One possibleinterpretation of these results is that time variation in credit spreads is driven primarilyby changes in credit and liquidity risk premia, and only marginally by changes in theactual probability of default.
The results for the macroeconomic specification are slightly stronger than for thereduced-form specification. In particular, the same lagged default rate variables areagain significant. The first lagged value of the NBER recession indicator variableis positive and significant at the ten-percent level, suggesting that experiencing arecession during the current year weakly increases the default rate for the subsequentyear.
Finally, by combining all of the variables into a single specification, we can di-rectly compare their incremental forecasting power for default rates. As shown, threeof the four structural variables are significant in this combined specification. In par-ticular, the stock return is again negative in sign, consistent with the implications ofthe structural framework. The variance of the stock return again has a positive andsignificant effect on the default rate. In contrast, neither the lagged corporate creditspreads nor the NBER recession indicators are significant in the combined specifica-tion. Taken together, these results imply that the structural variables best describethe long-run behavior of default rates in the United States.
6. HOW DOES THE MARKET VALUE DEFAULT RISK?
Given this evidence about the determinants of corporate default risk, a logical nextstep is to examine whether corporate bonds are priced in a way that is consistentwith the properties of realized default rates. In this section, we again use a regressionframework to test whether recent default experience in the market maps into higherdefault spreads in the future.
6.1 Default Losses and Credit Spreads
As a preliminary to the analysis, it is interesting to first contrast long-run corporatedefault experience with historical corporate spreads. Recall that over the entire sam-ple period, the average default rate is about 1.50 percent. Making the broad-brushassumption that corporate defaults only result in a 50 percent loss on average, a sim-
23

ple back-of-the-envelope computation suggests that average historical default lossesduring the study period are on the order of 75 basis points per year.18 This esti-mate is surprisingly similar to the average default rate of 91.3 basis points for the1982−2008 period reported in Table 29 of Moody’s Corporate Default and RecoveryRates, 1920−2008.19
Ideally, we would like to compare the average default loss with the average yieldspreads for the bonds in the sample. Note that the credit spread for high-qualitybonds used in the regressions in the previous section, although providing a consis-tent measure of the historical variation in credit spreads, may understate the averagespread for all bonds in the annual snapshot (since not all bonds are high-quality).Although we do not have yield data for the individual bonds in the annual snapshot,we approximate the average yield in the following way. For the 1866−1899 period,Macaulay (1938) reports yield data for a sample of long-term high-quality railroadbonds. Since his sample is tilted towards bonds with lower yields (although there isconsiderable variation in the yields reported), we use the maximum yield for the setof bonds included in his sample each year as the proxy for the value-weighted averageyield for all bonds. For the 1900−1918 period, we use the quadrennial information inTable 49 of Hickman (1960) to calculate the weighted-average yield for all the bonds inmarket.20 For the 1919−2008 period, we use the simple average of Moody’s Aaa andBaa bond indexes (implicitly assuming that the average bond has a spread midway
18Hickman (1960) Table 152 implies that the average recovery rate of defaulted issuesduring the 1900−1944 period is about 62.5 percent of par value. Table 26 of Moody’sCorporate Default and Recovery Rates, 1920−2008 implies an average recovery rateof 41.4 percent for the 1982-2008 period. Thus, an assumed 50 percent recovery rateis broadly consistent with the historical experience.19It is important to acknowledge that assuming a constant loss rate of 50 percent maynot fully capture the economics of credit losses. One reason for this is that loss ratesmay vary over time as bankruptcy laws change, as the industry composition of thecross-section of issuers evolves, and as the degree of collateralization associated withbond issues varies. In addition, Altman, Brady, Resti, and Sironi (2005) have sug-gested that default rates are negatively correlated with recovery rates and, therefore,calculating expected loss from the mean values of these two variables could lead toan underestimation. Nevertheless, this assumption should provide a reasonable firstapproximation.20Because of the quadrennial nature of the data, we cannot use it for purposes ofestimating the regressions as in the previous section; the high-quality corporate bondindex used in the previous section is much more appropriate for estimating the regres-sions because of its consistent composition over time. For the purposes of estimatingthe average value-weighted yield in the market, however, the Hickman data should bemore representative of the market.
24

between these two indexes). As a robustness check for methodology used in obtain-ing the 1866−1899 estimates, we apply the methodology to Macaulay’s data for 1900and contrast it with that given by using the Hickman data. The resulting estimatesfor 1900 are very similar, giving average yields of 4.19 and 4.28 percent, respectively.Similarly, as a robustness check for the use of the average of the Moody’s indexes, wecontrast this average with the average yield implied by the Hickman data for 1920,1924, and 1928. The average values of the yields given by the two methodologies overthis period are nearly identical. We define the yield spread as the difference betweenour measure of corporate yields and the risk-free rate proxy described in Section 5.1.1.
This time series results in an average corporate yield spread over the 1866−2008period of 153.3 basis points. Thus, the average yield spread is about 78 basis pointshigher than our back-of-the-envelope estimate of the historical default losses. Thisimplies that the market appears to incorporate a risk premium of roughly 80 basispoints into corporate bond prices. The standard deviation of the mean yield spreadis 4.18 basis points. Thus, the difference between the mean yield spread of 153.3 andan expected loss rate of 75 basis points is highly statistically significant.
Alternatively, we can estimate the ratio of the expected risk-neutral credit lossesto actual credit losses (the ratio of Q- and P -measure expected losses) by dividingthe average yield spread of 153.3 basis points by the estimated average credit lossof 75 basis points, giving a value of 2.04. This ratio is often used in the empiricalcredit literature as a measure of the size of the credit premium (including both thepremium for the event of default or jump risk and the premium for changes in theprobability that default occurs). For example, Driessen (2005) estimates the ratio ofthe risk-neutral and actual intensities for a sample of 104 U.S. firms for the 1991−2000period. He finds that the ratio for AA-rated, A-rated, and BBB-rated firms are 1.83,2.61, and 2.37, respectively. Similarly, Berndt, Douglas, Duffie, Ferguson, and Schranz(2005) estimate the ratio for a sample of 94 U.S. firms using CDS spreads and KMVexpected default frequencies for the 2000−2004 period. The mean of their estimatedratios is 2.8; the median of their estimated ratios is 2.0. Thus, our estimated ratio of2.04 for the 1866−2008 period closely parallels the results in the literature based onmuch shorter time periods.21
It is important to provide a number of caveats in interpreting these results. First,we cannot assert that the corporate credit spreads implied by the data describedabove match precisely the credit spreads for the specific snapshot of bonds on whichour estimates of defaults are based. Second, as discussed previously, the historicalgovernment bond yield data in Homer and Sylla (1991) does include data for Staterather than Federal bond issues for some periods during the late 19th and early 20thCenturies. To the extent that these State issues carry more credit risk than Federal
21These results are also consistent with those implied by Almeida and Philippon(2007).
25

issues, then the estimated credit spreads could slightly underestimate the actual creditspread. Despite these caveats, however, these results provide intriguing evidence thatthe pricing of credit risk by financial markets is remarkably consistent over time. Toinvestigate these results further, there is an urgent need for reliable long-run data oncorporate credit pricing.
6.2 The Results for Credit Spreads
Motivated by the results above, we again use a regression framework to examine theextent to which corporate credit spreads respond to realized default rates and othermarket and macroeconomic variables. Specifically, we test whether credit spreadscan be forecast on the basis of previous default rates, stock market returns, andNBER recession indicators. In theory, credit spreads should reflect changes in expecteddefault rates over time, plus whatever risk/liquidity premia the market demands oncorporate bonds. Given the strong persistence in default rates as they cluster overtime, we would anticipate that the realized default rate for the current year wouldbe informative about expected future default rates and, therefore, reflected in currentand future credit spreads. In this analysis, we use the same variable definitions anddata sources as described in Section 5.
Table 6 reports the results from four different specifications. The first includesonly current and lagged default rate variables. The second includes only currentand lagged stock market returns. The third includes only current and lagged NBERrecession indicators. The fourth includes all of these variables. As before, the firstset of four columns in Table 6 reports the coefficient estimates; the second set of fourcolumns reports the Newey-West t-statistics for the coefficients.
The first lagged value of the credit spread is highly significant in each of the fourspecifications in Table 6. This is consistent with the highly persistent nature of creditspreads; the first order serial correlation coefficient for the credit spread during thesample period is 0.883.
Table 6 shows, however, that the current and lagged values of the default ratevariables are not significant in either the separate or combined specifications. Thus,there is no evidence that credit spreads respond to the information in realized de-fault rates (to the extent that such information is not already impounded into laggedspreads).
In contrast, Table 6 shows that there is a significant contemporaneous relationbetween credit spreads and the stock market return. The negative sign implies thatspreads tighten as the stock market increases in value. This is again broadly consistentwith the implications of the structural credit modeling framework. Finally, althoughseveral of the lagged NBER recession indicators are significant in the recession speci-fication, none of these lagged values are significant in the combined specification.
26

7. CONCLUSION
We study the nature of corporate bond default risk using an extensive new data setcovering the 1866−2008 period. This data set extends by nearly a century the horizonover which corporate bond default risk can be studied (relative to previous academicresearch in the literature).
A number of important findings emerge from this analysis. We find that thecorporate bond markets have suffered many clustered default cycles, and that some ofthese have been much more severe than those experienced during the Great Depression.Default cycles tend to be less frequent but more persistent that NBER economicdownturns. This is perhaps one reason why the correlation between the two types ofcycles appears relatively weak.
Second, we study the determinants of corporate default risk using a number ofvariables suggested by theoretical models of credit risk. The results indicate thatthe variables suggested by structural models have significant forecasting power forcorporate default rates. In particular, stock market returns and stock market returnvolatility have significant predictive ability. Surprisingly, credit spreads and the stateof the economy as measured by an NBER-recession indicator do not have incrementalforecasting power.
Finally, we consider how the market values credit risk over the long-term. Wefind that average credit spreads are roughly twice the estimated average default losseson corporate bonds. Thus, the ratio of risk-neutral to actual default losses is roughlytwo, consistent with a number of recent studies based on shorter sample periods.Furthermore, we find that credit spreads tend to be largely unaffected by recent defaultexperience in the corporate bond market. This evidence is consistent with recentwork by Collin-Dufresne, Goldstein, and Martin (2001) showing that credit spreadsare driven by factors difficult to explain by standard credit models.
27
APPENDIX
In measuring the default rate, we focus on the set of corporate bonds that satisfythe following criteria. First, we include only bonds issued by U.S. corporations in thesample. This criterion excludes bonds issued by firms domiciled in other countries.Second, we include only bonds of nonfinancial corporations in the sample. Specifically,bonds for corporations in the banking, securities, real estate, insurance, mortgage, etc.industries are not included in the sample. This criterion also excludes the mortgagebonds that were widely used during the first part of the 20th Century to finance majorhotels, office buildings, etc. Third, we include only bonds issued by private for-profitcorporations; bonds issued by eleemosynary entities such as religious organizationsand universities are excluded as are bonds issued by public sector entities such assovereigns, states, and municipalities. Note, however, that bonds issued by utilities andstreet railroads are included since these issuers are in the private sector. As describedbelow, a few additional criteria are imposed on the set of corporate bonds includedin the sample during several of the subperiods. In each of these cases, however, thesame criteria are applied to both the numerator and denominator of the default ratecalculation. Thus, these additional restrictions likely have little effect on the estimateddefault rates.
A. Primary Data Sources
The data for the 1866−1899 period are extracted from the Commercial and FinancialChronicle. This weekly newspaper was founded in 1865 and was the first nationalbusiness newspaper in the United States. During the 1866−1899 period, the Com-mercial and Financial Chronicle published extensive lists of the corporate bonds thatwere available in the financial markets, including bonds traded on the NYSE, all of theregional exchanges, as well as leading unlisted and inactive bonds. Thus, the listing ofbonds in the Commercial and Financial Chronicle is far more extensive than simplythe bonds actively traded at the major exchanges. In addition to providing listingsof issuers and their bonds, the Commercial and Financial Chronicle also reported onkey news items relating to these issuers and bonds such as missed coupons, defaults,bondholder committees, receiverships, reorganizations, bankruptcies, etc. As far aswe can determine, the coverage of these news items appears to have been relativelycomprehensive. In particular, the Commercial and Financial Chronicle reported newsabout financial distress not only for the issuers included in the annual snapshot, butalso for many much smaller firms as well. Poor’s manuals were used to cross-checksome of the data obtained from the Commercial and Financial Chronicle.
The data for the 1900−1965 period are taken directly from two NBER sources.The first is a three-volume report on an extensive NBER research project during the1940s and 1950s sponsored by the Works Project Administration and the FederalDeposit Insurance Corporation. This massive project was headed by W. BraddockHickman and involved the efforts of more than two dozen researchers and research
28

assistants. The stated objectives of the project were, first, to provide basic statisticaltime series data on corporate bond financing that might be useful to researchers and,second, to analyze and interpret the data. As part of this research, extensive datawere collected on both the par amounts of outstanding bonds and bonds entering intodefault each year. The scope, methodology, and results of this research project arethoroughly documented in Hickman (1953, 1958, 1960). The second source is basedon a subsequent NBER project in which Hickman’s study was extended to cover the1944−1965 period using essentially the same methodology. This research project isextensively documented in Atkinson (1967). The Commercial and Financial Chroniclewas used to cross-check data for some years in this subperiod.
The data for the 1966−2008 period comes from three different sources. The firstis data on the par amount of all domestic nonfinancial bonds and is tabulated by theFederal Reserve. This data is based on industry sources and is computed by tabulatingthe total amount of new corporate bond issuance and extinguishments each year. Thesecond source for this period is again the Commercial and Financial Chronicle which isused in identifying firms entering into default during the 1966−1969 period. The thirdsource is a data set provided to us by Moody’s covering the 1970−2008 period and isextracted from the data underlying Moody’s Corporate Default and Recovery Rates,1920−2008 publication. Specifically, we extract default amounts for U.S. nonfinancialfirms from the larger Moody’s data set of bonds for all issuers (including global andfinancial issuers). The data and methodology used by Moody’s in determining thesenumbers are also described in this publication.
B. The Annual Time Series
The annual default rate is computed as the ratio of the annual default amount tothe par value of all bonds in the annual snapshot. Recall that the annual snapshotconsists of all bonds listed in the historical data source at the beginning of the year.The annual default amount is the total par amount of the subset of bonds that areincluded in the annual snapshot and whose issuers enter into financial distress duringthe year.
For the 1866−1877 period, the annual snapshot consists of all bonds includedin the first weekly Bond List published by the Commercial and Financial Chronicleeach year. For several years, this source is missing. In these cases, we use the prioryear’s snapshot as that year’s snapshot. The annual default amounts are obtained bytotaling the par amounts of bonds for issuers entering financial distress, where theseissuers are identified by reports provided in the Commercial and Financial Chronicle.
For the 1878−1899 period, a comprehensive listing of corporate bonds appearsin the January supplement to the Commercial and Financial Chronicle. The listingof corporate issuers in this supplement is titled General Quotations of Bonds andStocks. The Commercial and Financial Chronicle describes this listing as providingquotations for “all securities listed on any Stock Exchange in the United States, and
29

for all leading unlisted and inactive securities for which we are able to obtain reliableprices.” In general, the number of issuers in this listing is typically several times aslarge as the number of issuers with bonds that are actively traded on the NYSE.
Although comprehensive, this listing of bonds does not provide par amounts forthe bonds for the 1878−1899 period. Thus, we use the following algorithm in estimat-ing the default rates for this period. First, we count the number of bond issues listedin the supplement at the beginning of each year during this period. An analysis usingdata for 1876 indicates that there is a very high correlation between the par amountof debt of a corporate issuer and the number of bond issues for that issuer. This highcorrelation holds since the vast majority of bond issuers during this period are in therailroad industry. Second, for each year, we count the number of bonds included inthat year’s snapshot that enter into financial distress. To calculate the default ratefor these years, we then divide the total number of defaulted bond issues by the totalnumber of bond issues in the supplement. As a robustness check for this methodology,we apply it to several of the years during the 1866−1878 period. We find that thismethodology results in estimates of the default rates for these years that are very closeto those obtained based on par values.
For the 1900−1943 period, the total par amount of the bonds in the annualsnapshot comes from the total par amounts for U.S. nonfinancial firms that appearin Table A-6 of Hickman (1953). As described in Hickman, the scope of his studydoes not include a 100-percent tabulation of all corporate bonds. Rather, Hickmantabulates par values for all bond issues with aggregate par amount of $5 million ormore (the large issues sample), and then tabulates additional par values for a ten-percent random sample of the remainder of bonds for which data are available. Thepar value of the bonds included in the large issues sample, however, represents theoverwhelming majority of the estimated total par value of all corporate bonds. Thus,there is little loss of generality from limiting our attention to the large issues sampleof bonds that is exhaustively tabulated by Hickman (as opposed to the small issuessample that is only statistically sampled). The total par value of bonds that defaulteach year (and are included in the total value of all bonds at the beginning of the year)is given as the all industries total in the large issues section of Table 136 of Hickman(1960).
We observe that the Hickman study focuses on straight bonds (single-maturityobligations), and excludes several other categories of bonds such as equipment trustbonds, income bonds, convertible bonds, and serial bonds. As discussed by Hickman,however, these other categories of bonds represent only a small fraction of total parvalue of bonds in his sample. Since both the total par value of bonds in the snapshotand the par value of defaulted bonds are based on the same categories of bonds, thereshould be little impact on the estimated default rate as a result of Hickman’s focuson straight bonds.
For the 1944 to 1965 period, the total par value of corporate bonds at the be-
30

ginning of each year and the total par value of corporate bonds defaulting during theyear are provided in Table 21 of Atkinson (1967). As is described in Atkinson, hisstudy closely follows the methodology used in Hickman (1953, 1958, 1960). The keydifference between the two studies is that Atkinson broadens his focus to include mostcategories of corporate bonds (rather than just straight bonds).
As robustness checks for both the Hickman (1953, 1960) and Atkinson (1967)data, we tabulated the total number of bond issuers at the beginning of each yearduring this period as well as the number of bond issuers entering into financial dis-tress each year using the Commercial and Financial Chronicle and a methodologysimilar to that described above for the 1866−1899 period. The default rates based onissuers were very similar to those obtained using the Hickman and Atkinson data. Inaddition, we compared the default rates implied by the Hickman and Atkinson datawith those reported in the Moody’s Corporate Default and Recovery Rates, 1920−2008publication. Even though the Moody’s results include both foreign issuers and finan-cial issuers, there was generally close agreement between their results and those impliedby the Hickman and Atkinson data sets. See Carty and Lieberman (1997) for a dis-cussion of how differences between Hickman’s results and those of Moody’s can bereconciled. Appendix C of Hickman (1953) also conducts an in-depth comparison oftheir data with a number of other contemporary sources including the Commercialand Financial Chronicle, the Journal of Commerce, and estimates provided by theSecurities and Exchange Commission, the Interstate Commerce Commission, and theNational Industrial Conference Board.
For the 1966−2008 period, the total par value of corporate bonds at the beginningof each year is given from line 7 of Table L.2 Credit Market Debt Owed by NonfinancialSectors of the Federal Reserve Board’s Flow of Funds Accounts of the United StatesZ.1 statistical release (see historical statistical releases for earlier data) for the end ofthe preceeding year. As a robustness check, we compared the Federal Reserve datawith that of Atkinson for the mid-1960s and found that the two estimates of the totalpar value of the corporate bonds were very similar. Furthermore, we compared theFederal Reserve estimates with those reported by the Securities Industry and FinancialMarkets Association (SIFMA) for the 1995−2008 period and found close agreementbetween the two sources.
In determining the total par value of defaulted bonds for the 1966−2008 period,we used two different sources. For the 1966−1969 period, we again examined theCommercial and Financial Chronicle for news reports about firms entering into finan-cial distress. For the 1970−2008 period, we used the data set described above thatwas provided to us by Moody’s and extracted the par amounts of defaulted bonds fordomestic nonfinancial issuers.
During the middle to latter part of the 19th Century, the corporate bond marketconsisted primarily of railroad and canal bonds. During this period, however, therewere also a number of industrial and financial bond issues in the market. For exam-
31

ple, the 1866 Commercial and Financial Chronicle lists 138 railroad bond issuers, 14canal bond issuers, and 6 industrial bond issuers. The set of industrial bond issuersincludes Western Union, three coal and mining firms, and two bridges. Near the endof the 19th Century, the corporate bonds included in the sample consisted of railroadbonds, street railroad bonds, gas and other utility bonds, and numerous miscellaneousindustrial bonds. After World War I, the corporate bonds were recategorized simplyas railroad, utility, and industrial bonds. For detailed descriptions composition ofthe corporate bond market by industry, see Hickman (1953), Atkinson (1967), andMoody’s classifications of corporate bonds
C. The Definition of Financial Distress
To identify the bonds included in the snapshot that enter into financial distress eachyear, we use the following procedure. For each year from 1866 to 1899, we examinedeach weekly issue of the Commercial and Financial Chronicle. Whenever a news itemis reported relating to the financial distress of an issuer, we check whether bonds ofthat issuer are included in the sample for that year. As is standard in the literatureon estimating default rates, a parent firm is assumed to enter financial distress whenany of its subsidiaries enter financial distress. Typical reports include such eventsas missed coupon payments, defaults, bondholder committee meetings, entering intoreceivership, bankruptcy, reorganization, etc. If the issuer is represented in the sample,then we determine whether the report represents the initial indication of financialdistress for that issuer. For example, imagine that an issuer is first reported in 1873as defaulting on a bond issue. Then subsequent reports of entering into receivership in1874, of the scheduling of a bondholders committee meeting in 1875, and a bankruptcyor reorganization in 1876 would not be included as initial events of financial distress.
To provide a uniform standard for identifying initial events of financial distress forthe 1866−1899 period, we use the following algorithm. If there have been no previousreports of financial distress for the issuer, then the report is viewed as an initial event.If more than five years have elapsed since a previous report for the issuer appeared,then the new report is identified as an initial event, unless the previous report clearlyindicates that the firm has exiting financial distress (bankruptcy, reorganization, orreaching an accord with the bondholders). For each year, we total the par value ofbonds (or the number of bond issues) of distinct issuers entering into financial distressbased on this algorithm and use this number as the numerator in determining thepercentage of defaults for that year. We follow the same procedure for the 1966−1969period.
The definition of financial distress used by Hickman is described in Chapter 5 ofHickman (1953). Atkinson (1967) uses a similar definition of financial distress in hisextension of Hickman’s study. Moody’s definition of financial distress is documentedin the Appendix to Moody’s Corporate Default and Recovery Rates, 1920−2008 pub-lication.
32

REFERENCES
Almeida, Hector, and Thomas Philippon, 2007, The Risk-Adjusted Cost of FinancialDistress, Journal of Finance 62, 2557-2586.
Altman, Edward I., 1968, Financial Ratios, Discriminant Analysis, and the Predictionof Corporate Bankruptcy, Journal of Finance 23, 589-609.
Altman, Edward I., 1989, Measuring Corporate Bond Mortality and Performance, Jour-nal of Finance 44, 909-922.
Altman, Edward I., Brooks Brady, Andrea Resti, and Andrea Sironi, 2005, The LinkBetween Default and Recovery Rates: Theory, Empirical Evidence, and Implications,Journal of Business 78, 2203-2227.
Atkinson, Thomas R., 1967, Trends in Corporate Bond Quality, National Bureau ofEconomic Research, Studies in Corporate Bond Financing, Columbia UniversityPress, New York, NY.
Beaver, William H., 1966, Financial Ratios as Predictors of Failure, Journal of Account-ing Research 4, 71-111.
Beaver, William H., Maureen F. McNichols, and Jung-Wu Rhie, 2005, Have FinancialStatements Become Less Informative? Evidence from the Ability of Financial Ratiosto Predict Bankruptcy, Review of Accounting Studies 10, 93-122.
Benmelech, Efraim, 2009, Asset Salability and Debt Maturity: Evidence from Nine-teenth-Century American Railroads, Review of Financial Studies 22, 1545-1584.
Berndt, Antje, Rohan Douglas, Darrell Duffie, Mark Ferguson, and David Schranz,2005, Measuring Default Risk Premia from Default Swap Rates and EDFs, Workingpaper, Stanford University.
Bhamra, Hajoat S., Lars-Alexander Kuhn, and Ilya A. Strebulaev, 2010a, The Aggre-gate Dynamics of Capital Structure and Macroeconomic Risk, Review of FinancialStudies, forthcoming.
Bhamra, Hajoat S., Lars-Alexander Kuhn, and Ilya A. Strebulaev, 2010b, The Lev-ered Equity Risk Premium and Credit Spreads: A Unified Framework, Review ofFinancial Studies, forthcoming.
Bharath, Sreedhar, and Tyler Shumway, 2008, Forecasting Default with the MertonDistance to Default Model, Review of Financial Studies 20, 1339-1369.
Black, Fischer, and John C. Cox, 1976, Valuing Corporate Securities: Some Effects ofBond Indenture Provisions, The Journal of Finance 31, 351-367.
33

Black, Fischer, and Myron Scholes, 1973, The Pricing of Options and Corporate Liabil-ities, The Journal of Political Economy 81, 637-654.
Bernanke, Ben S., 1981, Bankruptcy, Liquidity, and Recession, American EconomicReview Proceedings 71, 155-159.
Bernanke, Ben S., 1983, Nonmonetary Effects of the Financial Crisis in the Propagationof the Great Depression, American Economic Review 73, 257-275.
Campbell, John, Jens Hilscher, and Jan Szilagyi, 2008, In Search of Distress Risk,Journal of Finance 63, 2899-2939.
Carty, Lea V., 1997, Three Essays on Capital Market Imperfections, Ph.D. dissertation,Columbia University.
Carty, Lea V., 2000, Corporate Credit-Risk Dynamics, Financial Analysts JournalJuly/August, 67-81.
Carty, Lea V., and Dana Lieberman, 1997, Corporate Bond Defaults and Default Rates,1938-1996, Moody’s Special Comment, January.
Chava, Sudheer, and Robert Jarrow, 2004, Bankruptcy Prediction With Industry Ef-fects, Review of Finance 8, 537-569.
Collin-Dufresne, Pierre, and Robert S. Goldstein, 2001, Do Credit Spreads Reflect Sta-tionary Leverage Ratios? The Journal of Finance 56, 1929-1957.
Collin-Dufresne, Pierre, Robert S. Goldstein, and J. Spencer Martin, 2001, The Deter-minants of Credit Spread Changes, Journal of Finance 56, 2177-2208.
Davydenko, Sergei, and Ilya A. Strebulaev, 2007, Strategic Actions and Credit Spreads:An Empirical Investigation, Journal of Finance 62, 2633-2671.
Dichev, Ilia, 1998, Is the Risk of Bankruptcy a Systematic Risk?, Journal of Finance53, 1141-1148.
Driessen, Joost, 2005, Is Default Event Risk Priced in Corporate Bonds? Review ofFinancial Studies 18, 165-195.
Duffee, Gregory, 1999, Estimating the Price of Default Risk, Review of Financial Studies12, 197-226.
Duffie, Darrell, and David Lando, 2001, Term Structures of Credit Spread With Incom-plete Accounting Information, Econometrica 69, 633-664.
Duffie, Darrell, Leandro Saita, and Ke Wang, 2007, Multi-period Corporate DefaultPrediction with Stochastic Covariates, Journal of Financial Economics 83, 635-665.
34

Duffie, Darrell, and Kenneth J. Singleton, 1997, An Econometric Model of the TermStructure of Interest Rate Swap Yields, Journal of Finance 52, 1287-1323.
Duffie, Darrell, and Kenneth J. Singleton, 1999, Modeling Term Structures of Default-able Bonds, The Review of Financial Studies 12, 687-720.
Easley, David, and Maureen O’Hara, 1979, The Postal System in the Depression, Journalof Economic History 39, 741-753.
Elton, Edwin, Martin Gruber, Deepak Agrawal, and Christopher Mann, 2001, Explain-ing the Rate Spread on Corporate Bonds, Journal of Finance 56, 247-277.
Eom, Young Ho, Jean Helwege, and Jing-Zhi Huang, 2004, Structural Models of Corpo-rate Bond Pricing: An Empirical Analysis, Review of Financial Studies 17, 499-544.
Fama, Eugene F., and Kenneth R. French, 1993, Common Risk Factors in the Returnson Stocks and Bonds, Journal of Financial Economics 33, 3-56.
Fishlow, Albert, 1965, American Railroads and the Transformation of the Ante-BellumEconomy, Harvard University Press, Cambridge, MA.
Fons, Jerome, 1987, The Default Premium and Corporate Bond Experience, Journal ofFinance 42, 81-97.
Franks, Julian, and Loren Sussman, 2005, Financial Innovations and Corporate Bank-ruptcy, Journal of Financial Intermediation 4, 283-317.
Friedman, Milton, and Anna J. Schwartz, 1963, A Monetary History of the UnitedStates, 1867-1960, Princeton University Press, Princeton, NJ.
Gandhi, Priyank, and Hanno Lustig, 2009, Size Anomalies in US Bank Stock Returns:Your Tax Dollars at Work?, Working paper, UCLA.
Galbraith, John K., 1955, The Great Crash, 1929, Houghton Mifflin, Boston, MA.,
Geske, Robert, 1977, The Valuation of Corporate Liabilities as Compound Options,Journal of Financial and Quantitative Analysis 12, 541-552.
Giesecke, Kay, Francis A. Longstaff, Stephen Schaefer, and Ilya Strebulaev, 2010, Busi-ness Cycles and Credit Cycles: A 150-Year Perspective, Working paper, UCLA.
Goldschmidt, Robert W., 1933, The Changing Structure of American Banking, Rout-ledge, London, UK.
Goldstein, Robert, Nengjiu Ju, and Hayne E. Leland, 2001, An EBIT-Based Model ofDynamic Capital Structure, Journal of Business, 76, 483-512.
Hickman, W. Braddock, 1953, The Volume of Corporate Bond Financing Since 1900,
35

National Bureau of Economic Research, Studies in Corporate Bond Financing,Princeton University Press, Princeton, NJ.
Hickman, W. Braddock, 1958, Corporate Bond Quality and Investor Experience, Na-tional Bureau of Economic Research, Studies in Corporate Bond Financing, Prince-ton University Press, Princeton, NJ.
Hickman, W. Braddock, 1960, Statistical Measures of Corporate Bond Financing Since1900, National Bureau of Economic Research, Studies in Corporate Bond Financing,Princeton University Press, Princeton, NJ.
Homer, Sidney, and Richard Sylla, 1991, A History of Interest Rates, Rutgers UniversityPress, New Brunswick, NJ.
Huang, Jay, and Ming Huang, 2003, How Much of the Corporate-Treasury Yield Spreadis Due to Credit Risk? Working paper, Cornell University.
Hughes, Jonathan, and Louis P. Cain, 2007, American Economic History, 7th. Ed.,Pearson, New York, NY.
Jarrow, Robert A., David Lando, and Stuart M. Turnbull, 1997, A Markov Model forthe Term Structure of Credit Risk Spreads, The Review of Financial Studies 10,481-523.
Jarrow, Robert A., David Lando, and Fan Yu, 2005, Default Risk and Diversification:Theory and Empirical Implications, Mathematical Finance 15, 1-26.
Jarrow, Robert A., and Stuart M. Turnbull, 1995, Pricing Derivatives on FinancialSecurities Subject to Credit Risk, The Journal of Finance 50, 53-85.
Kindleberger, Charles P., and Robert Aliber, 2005, Manias, Panics, and Crashes, 5thedition, John Wiley and Sons, Inc., Hoboken, NJ.
Kim, In Joon, Krishna Ramaswamy, and Suresh Sundaresan, 1993, Does Default Riskin Coupons Affect the Valuation of Corporate Bonds?, Financial Management 22,117-131.
Leland, Hayne E., 1994, Corporate Debt Value, Bond Covenants, and Optimal CapitalStructure, The Journal of Finance 49, 1213-1252.
Leland, Hayne E., 2004, Predictions of Default Probabilities in Structural Models ofDebt, Journal of Investment Management 2, 5-20.
Longstaff, Francis A., and Eduardo S. Schwarz, 1995, A Simple Approach to ValuingRisky Fixed and Floating Rate Debt, Journal of Finance 50, 789-819.
Longstaff, Francis A., Sanjay Mithal, and Eric Neis, 2005, Corporate Yields Spreads:
36

Default Risk or Liquidity? New Evidence from the Credit Default Swap Market,Journal of Finance 60, 2213-2253.
Macaulay, Frederick, 1938, Some Theoretical Problems Suggested by the Movementsof Interest Rates, Bond Yields, and Stock Prices in the United States since 1856,National Bureau of Economic Research.
Markham, Jerry W., 2001, A Financial History of the United States, Vol. I, M. E.Sharpe, Inc., Armonk, New York.
Markham, Jerry W., 2002, A Financial History of the United States, Vol. II, M. E.Sharpe, Inc., Armonk, New York.
McAdoo, William G., 1931, Crowded Years, Houghton-Mifflin, Boston, MA.
Merton, Robert C., 1973, The Theory of Rational Option Pricing, Bell Journal ofEconomics and Management Science 4, 141-183.
Merton, Robert C., 1974, On the Pricing of Corporate Debt: The Risk Structure ofInterest Rates, Journal of Finance 29, 449-470.
Moody’s Investors Services, 2009, Corporate Default and Recovery Rates, 1920-2008.Moody’s Global Credit Policy Special Comment, Annual update.
Ohlson, James A., 1980, Financial Ratios and the Probabilistic Prediction of Bank-ruptcy, Journal of Accounting Research 18, 109-131.
Pedrosa, Monica, and Richard Roll, 1998, Systematic Risk in Corporate Bond CreditSpreads, Journal of Fixed Income 8, 7-26.
Philippon, Thomas, 2008, The Evolution of the U. S. Financial Industry for 1860 to2007: Theory and Evidence, Working paper, New York University.
Sarig, Oded and Arthur Warga, 1989, Some Empirical Estimates of the Risk Structureof Interest Rates, Journal of Finance 44, 1351-1360
Schaefer, Stephen, M. and Ilya A. Strebulaev, 2008, Structural Models of Credit Riskare Useful: Evidence from Hedge Ratios on Corporate Bonds, Journal of FinancialEconomics 90, 1-19.
Schwert, G. William, 1990, Indexes of U.S. Stock Prices from 1802 to 1987, The Journalof Business 63, 399-426.
Shiller, Robert J., 1989, Market Volatility, MIT Press, Cambridge, MA.
Shumway, Tyler, 2001, Forecasting Bankruptcy More Accurately: A Simple HazardModel, Journal of Business 74, 101-124.
37

Skeel, David A., 2001, Debt’s Dominion: A History of Bankruptcy Law in America,Princeton University Press, Princeton, NJ.
Snowden, Kenneth A., 1990, Historical Returns and Security Market Development,1872-1925, Explorations in Economic History 27, 381-420.
Steeples, Douglas, 2002, Advocate for American Enterprise: William Buck Dana andthe Commercial and Financial Chronicle, 1865-1910, Greenwood, Westport, CT.
Swaine, Henry H., 1898, Economic Aspects of Railroad Receiverships, Proceedings ofthe American Economic Association 3.
Tabb, Charles J., 1995, A Brief History of Bankruptcy Law, American BankruptcyInstitute Law Review 3, 5-51.
Vassalou, Maria, and Yuhang Xing, 2004, Default Risk in Equity Returns, Journal ofFinance 59, 831-868.
Warren, Charles, 1935, Bankruptcy in United States History, President and Fellows ofHarvard College, Cambridge, MA.
38
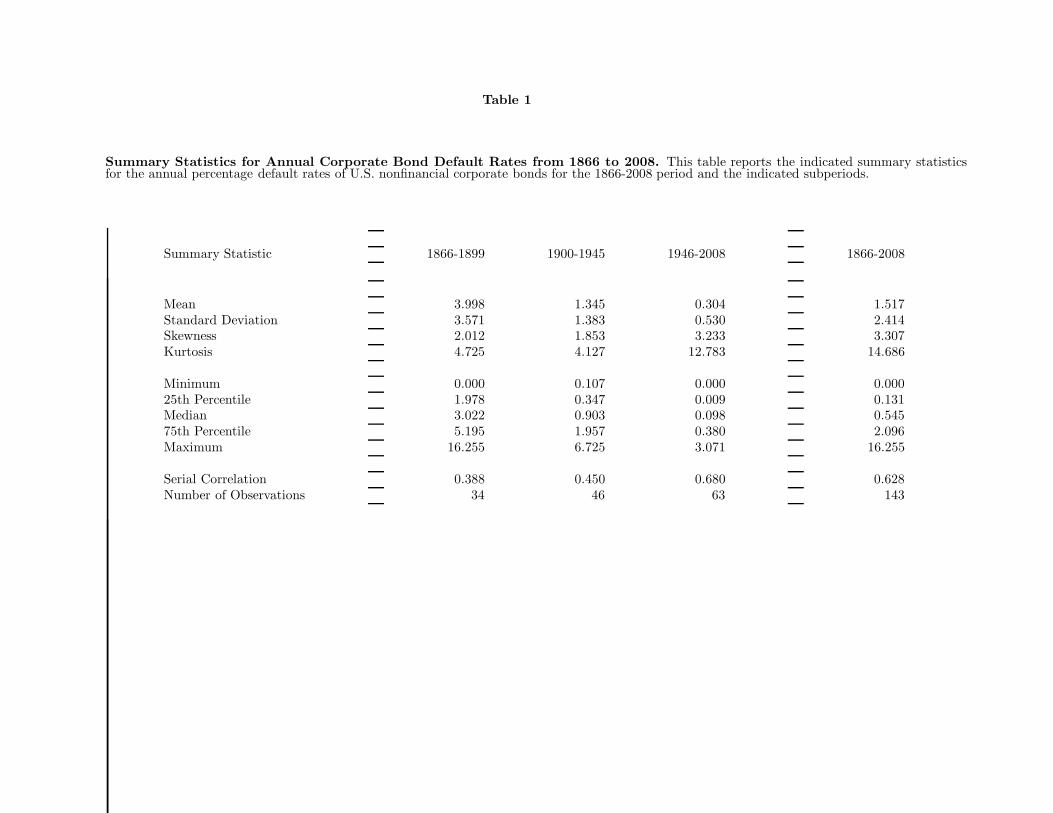
Table 1
Summary Statistics for Annual Corporate Bond Default Rates from 1866 to 2008. This table reports the indicated summary statisticsfor the annual percentage default rates of U.S. nonfinancial corporate bonds for the 1866-2008 period and the indicated subperiods.
Summary Statistic 1866-1899 1900-1945 1946-2008 1866-2008
Mean 3.998 1.345 0.304 1.517Standard Deviation 3.571 1.383 0.530 2.414Skewness 2.012 1.853 3.233 3.307Kurtosis 4.725 4.127 12.783 14.686
Minimum 0.000 0.107 0.000 0.00025th Percentile 1.978 0.347 0.009 0.131Median 3.022 0.903 0.098 0.54575th Percentile 5.195 1.957 0.380 2.096Maximum 16.255 6.725 3.071 16.255
Serial Correlation 0.388 0.450 0.680 0.628Number of Observations 34 46 63 143

Table 2
Default Cycles. This table lists the dates for the default cycles during the 1866-2008 sample period, where a default cycle is defined as a contiguousperiod during which annual default rates exceed the unconditional mean default rate of 1.517 percent. The length of the default cycle is measured inyears. Default rates are expressed as percentages.
Date of Length of Average Maximum HistoricalCycle Cycle Default Rate Default Rate Background
1866-1866 1 2.54 2.54 Post Civil War adjustment1869-1869 1 7.13 7.13 Linking of coasts by railroad1871-1880 10 6.04 16.25 Railroad boom and crash1883-1889 7 3.68 6.37 Major bank panic of 18841891-1898 8 4.36 9.32 Major bank panic of 18931904-1904 1 2.97 2.97 Roosevelt, Panama Canal1908-1908 1 2.10 2.10 Stock market panic1914-1915 2 4.19 4.48 First World War1919-1919 1 2.23 2.23 Post First World War adjustment1931-1935 5 3.67 6.73 Great Depression1938-1939 2 2.67 2.84 Great Depression1990-1990 1 1.56 1.56 Junk bond defaults2001-2002 2 2.54 3.07 Dot-com crisis

Table 3
The Most-Severe Three-Year Default Periods. This table lists the dates for the 12 top three-year default periods during the 1866-2008 sampleperiod. Total default is the sum of the annual default rates during each three-year period. Stock return is the sum of the annual stock market returnsfor each three-year period. NBER Fraction is the proportion of time during each three-year period that the economy was in an NBER-designatedbusiness downturn. Default rates are expressed as percentages.
Total Maximum Stock NBERRank Period Default Default Return Fraction
1 1873-1875 35.90 16.25 1.50 0.722 1892-1894 18.69 9.32 −5.46 0.473 1883-1885 16.06 6.38 5.36 0.814 1933-1935 12.88 6.73 35.54 0.085 1876-1878 12.51 5.94 −1.29 1.006 1869-1871 11.41 4.14 10.06 0.507 1914-1916 9.59 4.48 15.98 0.338 1896-1898 8.91 3.73 18.74 0.509 1887-1889 7.71 2.91 5.17 0.3610 1938-1940 6.67 2.84 7.61 0.1711 1879-1881 6.16 3.14 26.14 0.0812 2000-2002 6.15 3.07 −14.40 0.22
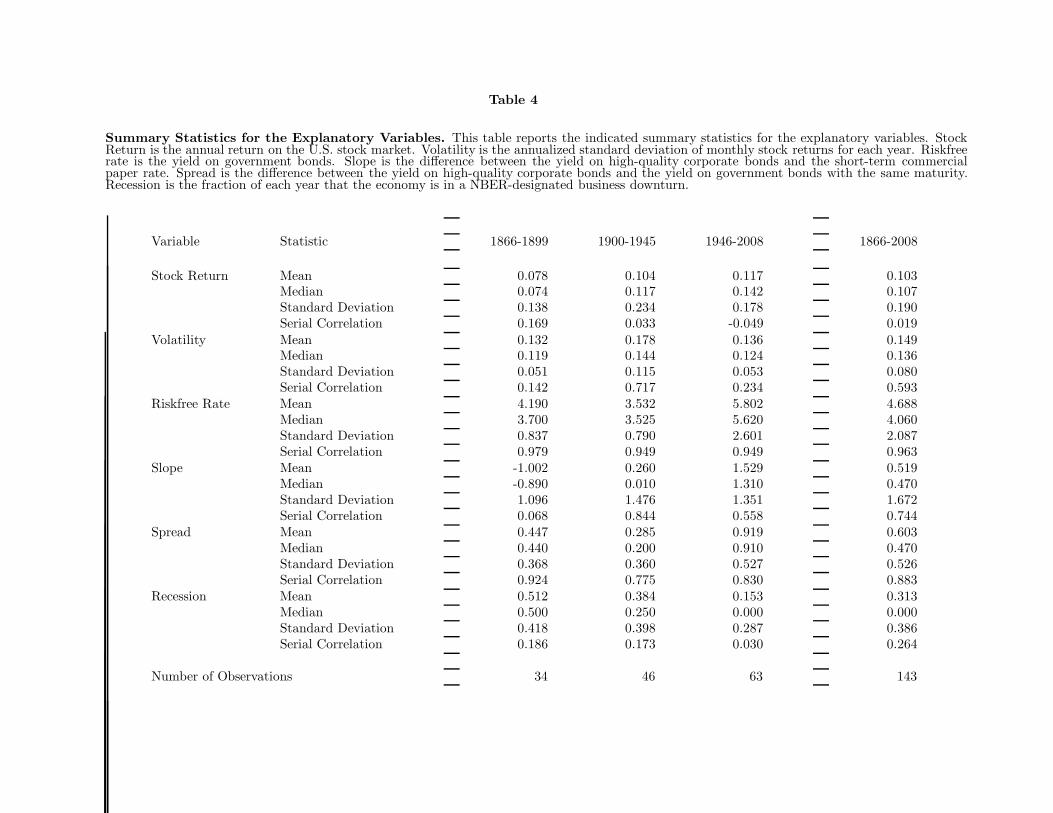
Table 4
Summary Statistics for the Explanatory Variables. This table reports the indicated summary statistics for the explanatory variables. StockReturn is the annual return on the U.S. stock market. Volatility is the annualized standard deviation of monthly stock returns for each year. Riskfreerate is the yield on government bonds. Slope is the difference between the yield on high-quality corporate bonds and the short-term commercialpaper rate. Spread is the difference between the yield on high-quality corporate bonds and the yield on government bonds with the same maturity.Recession is the fraction of each year that the economy is in a NBER-designated business downturn.
Variable Statistic 1866-1899 1900-1945 1946-2008 1866-2008
Stock Return Mean 0.078 0.104 0.117 0.103Median 0.074 0.117 0.142 0.107Standard Deviation 0.138 0.234 0.178 0.190Serial Correlation 0.169 0.033 -0.049 0.019
Volatility Mean 0.132 0.178 0.136 0.149Median 0.119 0.144 0.124 0.136Standard Deviation 0.051 0.115 0.053 0.080Serial Correlation 0.142 0.717 0.234 0.593
Riskfree Rate Mean 4.190 3.532 5.802 4.688Median 3.700 3.525 5.620 4.060Standard Deviation 0.837 0.790 2.601 2.087Serial Correlation 0.979 0.949 0.949 0.963
Slope Mean -1.002 0.260 1.529 0.519Median -0.890 0.010 1.310 0.470Standard Deviation 1.096 1.476 1.351 1.672Serial Correlation 0.068 0.844 0.558 0.744
Spread Mean 0.447 0.285 0.919 0.603Median 0.440 0.200 0.910 0.470Standard Deviation 0.368 0.360 0.527 0.526Serial Correlation 0.924 0.775 0.830 0.883
Recession Mean 0.512 0.384 0.153 0.313Median 0.500 0.250 0.000 0.000Standard Deviation 0.418 0.398 0.287 0.386Serial Correlation 0.186 0.173 0.030 0.264
Number of Observations 34 46 63 143
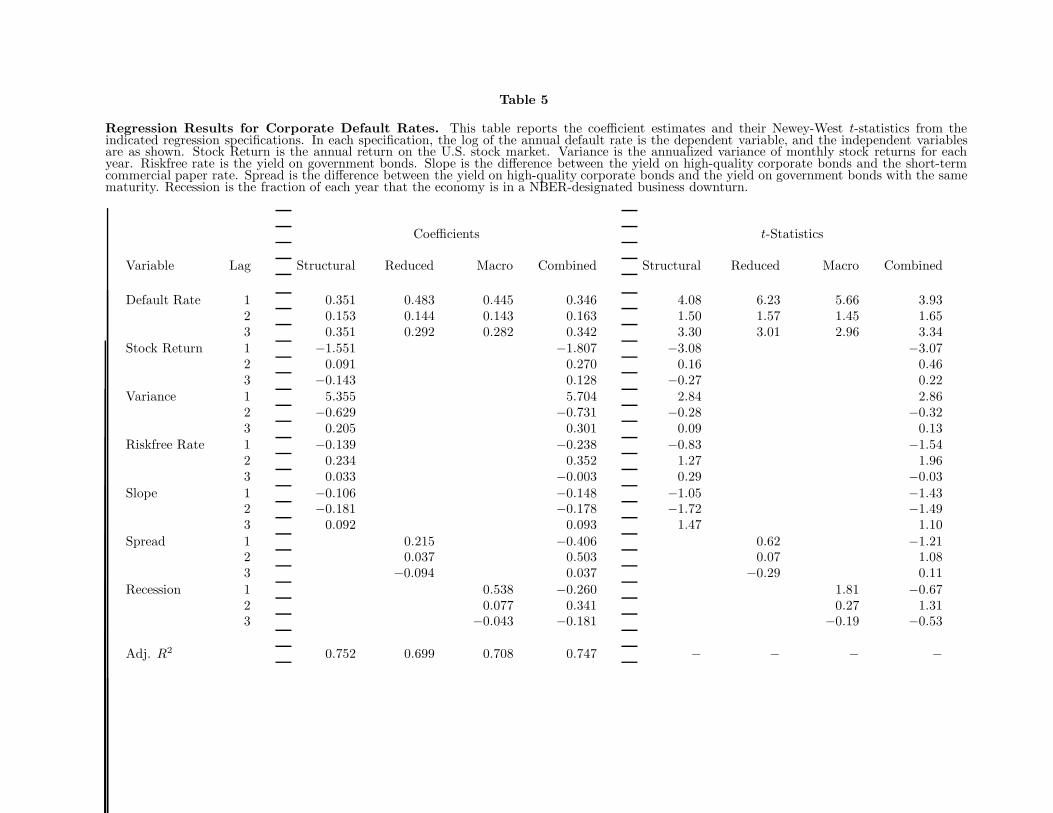
Table 5
Regression Results for Corporate Default Rates. This table reports the coefficient estimates and their Newey-West t-statistics from theindicated regression specifications. In each specification, the log of the annual default rate is the dependent variable, and the independent variablesare as shown. Stock Return is the annual return on the U.S. stock market. Variance is the annualized variance of monthly stock returns for eachyear. Riskfree rate is the yield on government bonds. Slope is the difference between the yield on high-quality corporate bonds and the short-termcommercial paper rate. Spread is the difference between the yield on high-quality corporate bonds and the yield on government bonds with the samematurity. Recession is the fraction of each year that the economy is in a NBER-designated business downturn.
Coefficients t-Statistics
Variable Lag Structural Reduced Macro Combined Structural Reduced Macro Combined
Default Rate 1 0.351 0.483 0.445 0.346 4.08 6.23 5.66 3.932 0.153 0.144 0.143 0.163 1.50 1.57 1.45 1.653 0.351 0.292 0.282 0.342 3.30 3.01 2.96 3.34
Stock Return 1 −1.551 −1.807 −3.08 −3.072 0.091 0.270 0.16 0.463 −0.143 0.128 −0.27 0.22
Variance 1 5.355 5.704 2.84 2.862 −0.629 −0.731 −0.28 −0.323 0.205 0.301 0.09 0.13
Riskfree Rate 1 −0.139 −0.238 −0.83 −1.542 0.234 0.352 1.27 1.963 0.033 −0.003 0.29 −0.03
Slope 1 −0.106 −0.148 −1.05 −1.432 −0.181 −0.178 −1.72 −1.493 0.092 0.093 1.47 1.10
Spread 1 0.215 −0.406 0.62 −1.212 0.037 0.503 0.07 1.083 −0.094 0.037 −0.29 0.11
Recession 1 0.538 −0.260 1.81 −0.672 0.077 0.341 0.27 1.313 −0.043 −0.181 −0.19 −0.53
Adj. R2 0.752 0.699 0.708 0.747 − − − −

Table 6
Regression Results for Corporate Credit Spreads. This table reports the coefficient estimates and their Newey-West t-statistics from theindicated regression specifications. In each specification, the credit spread is the dependent variable, and the independent variables are as shown.Spread is the difference between the yield on high-quality corporate bonds and the yield on government bonds with the same maturity. Default rateis the log of the annual default rate. Stock Return is the annual return on the U.S. stock market. Recession is the fraction of each year that theeconomy is in a NBER-designated business downturn.
Coefficients t-Statistics
Variable Lag Default Return Recession Combined Default Return Recession Combined
Credit Spread1 0.786 0.781 0.787 0.753 8.04 7.77 7.78 7.052 0.122 0.205 0.168 0.212 1.30 1.80 1.72 1.783 −0.020 −0.073 −0.055 −0.066 −0.28 −1.03 −0.81 −0.92
Default Rate 0 0.010 0.010 0.46 0.481 −0.014 −0.010 −0.73 −0.512 −0.010 −0.007 −0.72 −0.453 −0.007 −0.008 −0.46 −0.45
Stock Return 0 −0.333 −0.282 −2.42 −2.131 0.135 0.187 1.31 1.682 0.108 0.095 1.15 0.683 0.201 0.154 1.93 1.18
Recession 0 0.137 0.111 1.63 1.281 −0.133 −0.048 −2.37 −0.612 0.010 0.039 0.21 0.663 −0.130 −0.109 −1.88 −1.58
Adj. R2 0.775 0.792 0.787 0.792 − − − −