national bureau of economic research does … · does the private insurance market reduce...
TRANSCRIPT

NBER WORKING PAPER SERIES
RISK-BASED PRICING AND RISK-REDUCING EFFORT:DOES THE PRIVATE INSURANCE MARKET REDUCE ENVIRONMENTAL ACCIDENTS?
Haitao YinHoward Kunreuther
Matthew White
Working Paper 15100http://www.nber.org/papers/w15100
NATIONAL BUREAU OF ECONOMIC RESEARCH1050 Massachusetts Avenue
Cambridge, MA 02138June 2009
Thanks to Lucas Davis, Nancy Rose, and participants at the 2008 NBER IO/EEE Conference in PaloAlto for discussion and comments. Special thanks for technical information to Carol Amend (US EnvironmentalProtection Agency), Mark Barolo, William Foskett, Paul Miller, Sammy Ng, and Jerry Parker (USEPA, Office of Underground Storage Tanks), Jan Spoor (Illinois Office of the State Fire Marshall),Jeff Tanner and Kevin Wieber (Michigan Department of Environmental Quality), and Michele Schroeder(Zurich Company N.A.). This project received financial support from the Wharton Risk Managementand Decision Processes Center and the Russell Ackoff Award at the University of Pennsylvania. Yinthanks the University of Michigan’s Erb Institute for its hospitality and support. The views expressedherein are those of the author(s) and do not necessarily reflect the views of the National Bureau ofEconomic Research.
NBER working papers are circulated for discussion and comment purposes. They have not been peer-reviewed or been subject to the review by the NBER Board of Directors that accompanies officialNBER publications.
© 2009 by Haitao Yin, Howard Kunreuther, and Matthew White. All rights reserved. Short sectionsof text, not to exceed two paragraphs, may be quoted without explicit permission provided that fullcredit, including © notice, is given to the source.

Risk-Based Pricing and Risk-Reducing Effort: Does the Private Insurance Market ReduceEnvironmental Accidents?Haitao Yin, Howard Kunreuther, and Matthew WhiteNBER Working Paper No. 15100June 2009JEL No. D8,H23,K32
ABSTRACT
This paper examines whether risk-based pricing promotes risk-reducing effort. Such mechanismsare common in private insurance markets, but are rarely incorporated in government assurance programs.We analyze accidental underground fuel tank leaks--a source of environmental damage to water supplies--overa fourteen-year period, using disaggregate (facility-level) data and policy variation in financing thecleanup of tank leaks over time. The data suggest that eliminating a state-level government assuranceprogram and switching to private insurance markets to finance cleanups reduced the frequency of costlyunderground fuel tank leaks by more than 20 percent. This corresponds to more than 3,000 avoidedfuel-tank release accidents over eight years in one state alone, a benefit in avoided cleanup costs andenvironmental harm exceeding $400 million. These benefits arise because private insurers mitigatemoral hazard by providing financial incentives for tank owners to close or replace leak-prone tanksprior to costly accidents.
Haitao YinAntai College of Economics and ManagementShanghai JiaoTong [email protected]
Howard KunreutherOperations and Information ManagementThe Wharton SchoolUniversity of Pennsylvania3730 Walnut Street, 500 JMHHPhiladelphia, PA 19104-6366and [email protected]
Matthew WhiteThe Wharton SchoolUniversity of Pennsylvania3620 Locust Walk, Suite 1400Philadelphia, PA 19104-6372and [email protected]
1
I. INTRODUCTION
Many risks facing firms and individuals are spread across the economy through govern-
ment assurance programs. Prominent examples include bank deposit insurance, pension
benefit guarantee funds, and hazardous material cleanup funds. A salient feature of many
government assurance programs is the absence of risk-based pricing.1 Instead, they protect
beneficiaries from adverse events for a price that does not vary with the insured’s likeli-
hood of loss. A common concern is that this practice may exacerbate moral hazard, raising
the frequency of adverse events by lessening incentives for risk-reducing effort (Kareken
and Wallace, 1978; Cooper and Ross, 1998; Brown, 2008).
In contrast, risk-based pricing is widely employed in private insurance contracts.
This can attenuate moral hazard problems by rewarding firms with premium discounts for
risk-reducing activities (Freeman and Kunreuther, 1997; Boyd, 1997). In this paper, we
investigate whether the absence of risk-based pricing in one class of government assurance
programs results in less risk-reducing activity—and more frequent adverse outcomes—
than occurs when comparable insurance is arranged in private markets. The policy varia-
tion between states in financing the cleanup of underground fuel tank leaks provides an
important setting in which to examine this question.
In the late 1980s, new federal regulations required gas stations and other owners of
underground fuel tanks to demonstrate they are financially capable of (i) cleaning up un-
derground fuel leaks and (ii) compensating third parties for consequential damages. Mich-
igan, Illinois, and Indiana soon created state assurance programs to subsidize firms’ costs
of complying with the new federal regulations. Although the risk of an underground fuel
tank leak varies greatly with a tank owner’s operating and investment decisions, the price
to participate in these state cleanup assurance funds did not vary with the station’s risk.
Consequently, station owners can have costly tank leaks and their consequential damages
covered at state expense, while facing little program-related incentive to “take care” to
prevent such leaks.
By the mid-1990s, Michigan’s and Illinois’ assurance funds became insolvent.
1By risk-based prices, we mean insurance premia that (1) are based on an assessment of the insured party’s risk of future losses, and (2) vary with the insured party’s loss history (experience rating).

2
However, these states took radically different approaches to their insolvency crises. While
Illinois raised its gasoline excise tax to restore its program’s solvency, the Michigan legis-
lature terminated its state assurance program. Tank owners in Michigan subsequently
turned to the emerging market for commercial cleanup and liability coverage in order to
comply with the federal financial responsibility requirements. In contrast to state assur-
ance funds, the price structure for market-based insurance gives tank owners incentives to
invest in equipment that reduces the chance of accidental fuel tank leaks. This provides an
opportunity to evaluate whether switching from a government assurance program to the
private insurance market promotes risk-reducing activity and lowers the frequency of these
adverse events.
Despite its importance, there are few studies that directly evaluate the performance
of private versus public-sector insurance programs in addressing moral hazard. The empir-
ical difficulty is that moral hazard is typically confounded with selection effects. For ex-
ample, Wheelock and Wilson (1995) found that banks that were members of the Kansas
state deposit insurance system had a higher probability of failure than non-members. As
they point out, however, it is unclear whether insurance attracted the most risk-prone banks
(adverse selection), or banks tended to become more risk-taking once insured (moral ha-
zard).2
Several attributes make our research setting more conducive to the study of moral
hazard. First, the federal financial-responsibility regulations require firms either to pur-
chase private insurance or to participate in a state assurance fund. Because the two sys-
tems provide comparable insurance benefits but a state fund’s cost is (largely) paid by tax-
payers, it is a dominant strategy for any tank owner—whether low or high risk—to use the
state assurance fund. Only when a state fund is not available do tank owners acquire pri-
vate insurance. Consequently, there is no sorting between private and public-sector insur-
ance based on a firm’s private information about its risk propensity or its cost of risk-
reducing effort.
Second, there is little reason to take a “reverse causality” interpretation of the data, 2 Empirical studies of private- versus public-sector insurance have proved more successful analyzing adverse selection, particularly in health care contexts. Hopkins and Kidd (1996) and Sapelli and Torche (2001) argue that adverse selection is more severe for insurers that are restricted from practicing price discrimination, which prevents premiums from varying with an insured party’s risk.
3
in which accident rates in Michigan would have declined (relative to surrounding states)
even if that state had not switched to private market insurance. In fact, the evidence avail-
able indicates Michigan should—and did—expect to have a larger future tank cleanup
problem than other states at the time it closed its public assurance program (PSC, 1995).
This makes it difficult to interpret Michigan’s policy change as a consequence, rather than
a cause, of changes in accident rates.
The findings are quite striking. After Michigan’s policy change the fraction of un-
derground fuel tanks with accidental releases dropped by more than 20 percent, relative to
surrounding states that maintained state assurance fund programs. This reduction corres-
ponds to more than 3,000 avoided fuel tank releases in Michigan over the following eight
years. At an average cleanup cost of $125,000 per release (GAO 2007), this represents an
aggregate cleanup cost savings for that state on the order of $400 million.
These findings have a practical policy implication. The US Environmental Protec-
tion Agency estimates that 12,000 new underground fuel tank releases occur each year in
the United States.3 Gasoline and other petroleum products that leak underground tend to
enter groundwater flows; if undetected, this can pose a public health hazard by contaminat-
ing public drinking water supplies, and require costly remediation. For the more than thir-
ty states that presently operate state assurance fund programs, it would appear that adopt-
ing the risk-based pricing mechanisms used in private insurance markets may alleviate on-
going solvency crises and reduce the costly burden of future accidents.
II. TECHNOLOGY AND RISK-REDUCING ACTIVITY
To understand the effects of the government assurance programs we study, it is useful to
briefly summarize the underlying technology, the risks it entails, and what “taking care” to
prevent accidents means in this setting.
3 US EPA Office of Underground Storage Tanks, 2006 Corrective Action Performance Measures Data.
4
A. Technology
Most underground fuel tanks are located at retail gasoline stations. A small gas station
typically has two tanks, a large station may have five or six. From a regulatory and an in-
surance standpoint, they are treated as one system consisting of the tanks and underground
piping, pumps, and ancillary equipment. The most common and serious cause of acciden-
tal underground fuel leaks is long-term corrosion (oxidation) of the tank or pipes, catalyzed
by groundwater in the surrounding soil.4
While leaks underground are not directly visible, they are readily detected by sev-
eral means. These include inventory monitoring and reconciliation, automatic leak sensors
located in the tank system, and groundwater or soil monitoring wells located near the tank
system. Since 1993 all tank systems in the United States have been required to have some
leak detection system in place. Tank system owners can invest in more accurate detection
systems than the minimum regulatory requirement, which enables a leak to be identified
and rectified more rapidly.
Rapid detection of a leak is essential to minimize its cost and consequential damage
to water supplies and adjacent property. Small leaks can be resolved by removing the re-
maining fuel, replacing the tank and piping, and cleaning (excavating or pumping) sur-
rounding contaminated soil. Although total costs vary, in the early-to-mid 1990’s typical
cleanup costs in these situations ranged from $60,000 to $100,000 (EID, 1993; Soesilo and
Wilson, 1997). In contrast, a leak that remains unresolved will not stop on its own accord
and tends to grow progressively worse over time, spreading into groundwater systems
beyond the station site. In severe cases, fuel from leaking tanks can contaminate drinking
water sources, forcing the permanent closure of municipal and private wells and acquisi-
tion of new water supplies.5 For these reasons, investing in equipment and operating prac-
tices that can prevent accidental underground leaks—and detecting and remediating leaks
with alacrity—is desirable to minimize the total social costs of underground fuel storage. 4 Other causes include improper installation, structural collapse, and uncontained surface spills during delive-ries. 5 Benzene and other compounds in gasoline are hemotoxic and neurotoxic to humans in high doses, and car-cinogenic with long-term, low-exposure levels. See ASTDR (2005). Benton (1990) examines cleanup costs with groundwater contamination.

5
B. Preventing Leaks: Maintenance and Capital Investment
Since the mid-1980s, new technologies have enabled tank system owners to greatly reduce
the likelihood of an underground fuel leak. Prior to 1990, near all underground fuel tanks
were single-walled and constructed of bare steel that is prone to corrode. Two types of
capital investments can greatly reduce this risk. The first, and most effective, is to replace
a steel tank with one constructed of, or coated with, non-corroding material (such as rein-
forced fiberglass). Installing a double-walled tank will further reduce the corrosion risk, to
negligible levels. Short of replacing an existing bare steel tank, a tank system owner can
invest in corrosion-attenuating equipment that will reduce the likelihood of underground
tank leaks. Several anti-corrosion technologies are available, with more effective systems
carrying higher installation and ongoing maintenance costs (see EPA, 2008, for details).
Tank system leaks can also be reduced, in severity and in likelihood, through assi-
duous operations and maintenance activities. These include regularly pressure testing the
tank system, calibrating inventory monitoring systems after each fuel delivery, replacing
underground sacrificial anodes (a common means of corrosion resistance in steel tanks),
operating impressed-current anti-corrosion devices, and the like. All of these activities are
costly, and some require periodic closure of the station and attendant lost revenue.6
III. REGULATION AND ITS INCENTIVES
During the 1980s and 1990s, changes in federal and state regulations altered the incentives
for tank owners to undertake risk-reducing measures. We describe these changes next.
A. Federal Regulations and Owners’ Responsibilities
In response to mounting scientific evidence and public concern over adverse health conse-
quences of leaking underground fuel tanks, in 1984 Congress directed the US Environmen-
tal Protection Agency (EPA) to regulate public and private underground fuel storage
6 The technical literature on leak prevention practices is extensive; see, e.g., Kreiger (2000) or Noyes (1992).

6
tanks.7 The EPA’s final regulations, issued in 1988, had three distinct provisions: Finan-
cial responsibility requirements, tank-system technical standards, and disclosure and cor-
rective action obligations. The first of these provisions is the impetus for the state-level
policy variation we examine.
Financial Responsibility Requirements. The EPA’s financial responsibility require-
ments require tank system owners either to (i) purchase environmental liability and site
remediation insurance for fuel tank leaks from a qualified insurer, with a minimum cover-
age of $1 million per occurrence, or (ii) participate in a state-administered underground
storage tank financial assurance program providing comparable coverage.8 State and fed-
eral regulators believe that compliance with financial responsibility requirements is (essen-
tially) universal.9
In creating these new obligations, Congress did not alter any tort system remedy
available to third parties injured by a tank leak. Rather, Congress effectively concluded
that such remedies alone are apt to be (i) administratively and socially costly relative to
prophylactic regulation, and (ii) that the desired incentive effect of a pure liability rule for
owners to “take care” to avoid leaks may be adversely tempered by the limited liability
provisions of the bankruptcy code (Boyd, 1997).10 This second concern is particularly
acute with respect to the risk posed by underground fuel storage tank leaks at gasoline sta-
tions, as many are small businesses and the cost of cleaning up a substantial leak can easily
exceed the present value of a station’s profit stream.11
7 40 CFR §280-281, implementing the Resource Conservation and Recovery Act, Subtitle 1, Amendments of 1984. Underground fuel tanks were not a public concern until the early 1980s; in 1983, the CBS program 60 Minutes story “Check the Water” brought national attention to the health consequences of leaking under-ground gasoline storage. 8 Large petroleum marketers can self-insure, after satisfying stringent financial tests specified by the US EPA (40 CFR §280.95). This is rare if a state assurance fund exists (EPA, 1995), for reasons noted below. 9 Email communications with Sammy Ng (US EPA Office of Underground Storage Tanks, 5/19/2006) and Kevin Wieber (Michigan Department of Environmental Quality, 6/15/2006). 10 The administrative inefficiency of a pure liability rule rests on the observation that tank leak litigation cen-ters on competing expert testimony in geology, epidemiology, engineering, and other scientific areas that courts are often ill-equipped to evaluate. In addition, Congress recognized that time is of the essence in act-ing to resolve an underground fuel storage tank leak, for the reasons in §II.A. This makes corrective action and assured financing for it stipulated a priori by a regulatory agency preferable to the delay of judicial deci-sions regarding cleanup programs made in the course of civil litigation or a bankruptcy proceeding. 11 Questions commonly arise regarding the allocation of liability between owner and operator at franchised gasoline stations. Effective liability varies, depending upon who holds title to the tank system and any provi-

7
Technical Requirements. Although changes in tank-system technical standards are not
the focus of our analysis, they affect the data interpretation and merit brief discussion here.
The EPA chose compliance deadlines for technical standards that differed for new versus
existing (“grandfathered”) underground fuel tanks. Any new tank installed after 1988 was
required to have one or more leak detection systems and to meet a basic requirement for
corrosion resistance. In contrast, existing (grandfathered) tanks were obligated to meet the
leak detection technology requirement within five years (by December 1993) and the cor-
rosion-resistance requirement within ten years (by December 1998). The corrosion resis-
tance requirement could be met by retrofitting an existing steel tank with technology readi-
ly available in 1988.
The principal consequence of these technical standards is that, even in the absence
of any state-level policy variation, we would expect the frequency of underground tank
leaks to decrease over time as older, sub-standard tanks are closed or upgraded to meet the
1998 deadline.
Reporting and Corrective Action Requirements. The 1988 federal regulations stipulate
prompt reporting of underground storage tank leaks in any detectable quantity to federal
and/or state regulatory agencies, and specify required corrective actions in detail. Impor-
tantly for our purposes, the penalty for failing to report a suspected underground tank leak
is extraordinarily high, at $11,000 per day (42 USC 6991(e)). We discuss this and other
incentives facing owners to report and remediate tank leaks in Section IV.C below. It is
useful first to summarize state policy responses to these federal regulations.
B. State Responses: Government Assurance Funds
The federal financial responsibility requirements generated a storm of political protest
from gasoline retailers and small-business advocates. They argued many stations would
not survive because private insurance was not widely available in the 1980s, and expensive
sions regarding these contingencies in the specific franchise agreement.

8
when available.12 In response to these political pressures, many state legislatures created
financial assurance funds for underground fuel tank leaks.
State assurance funds function as a publicly-financed insurance program for tank
owners. In the event of a tank leak, the state assurance fund pays for the cost of cleanup at
the site and third-party consequential damages. To participate in a state assurance fund
program, a tank system owner must (1) pay a nominal registration fee (typically $100 per
tank per annum); (2) comply with applicable technical standards for tank systems; and (3)
promptly report (usually within 24 hours) any detected or suspected underground fuel
leaks. Most state assurance fund programs were crafted so that participation enables tank
owners to comply with their federal financial responsibility requirement.
Two features of these programs are important. First, most states’ assurance funds
are financed by an incremental excise tax on motor fuel (typically about one cent per gal-
lon). The nominal registration fee that a tank system owner pays to participate in a state
assurance fund is a small fraction of the actuarially-fair price of underground fuel leak
cleanup and liability insurance. As a consequence, in states with assurance fund programs
the participation rate is effectively 100 percent.
Second, the fee that tank owners pay to qualify for state fund benefits is the same
for everyone. It does not vary with respect to the age of the tank being insured, its capacity,
prior leak history, groundwater proximity, whether or not the tank system has been retrofit
with advanced corrosion protection equipment, whether or not it is single- or double-
walled to contain a leak, or with any of a host of quantifiable factors that directly affect the
chance of a leak and the cost of remediating it. Consequently, the structure of state fund
programs provides little incentive for an owner to invest in or maintain leak prevention
equipment beyond the minimum necessary to meet federal technical standards.
Indeed, it is possible that state assurance fund programs actually attenuate tank
owners’ incentives to comply with tank-system technical standards. Our discussions with
regulatory officials indicated that while state assurance funds nominally require partici-
pants to comply with federal technical standards, that requirement is not well-enforced.
12 See GAO (1987) or Boyd and Kunreuther (1997). Commercial insurers frequently declined to cover tank systems that did not meet the EPA’s new technical standards, even though these standards were (nominally) not binding on grandfathered facilities until 1998.

9
William Foskett, an official at the EPA’s Office of Underground Storage Tanks, indicates
how administrators view the problem:
Anecdotes that have come to my attention indicate that where a state has the authority to limit coverage based on compliance, that authority is not necessarily exercised. Withholding payment for non-compliance poses state fund administrators two very practical problems: 1) both the owner/operator and state legislators tend to think of payment for cleanups as an entitlement, except in the most egregious violations; and 2) the public interest (public welfare) purpose of protecting the environment and health by cleaning up release sites is not served if the public monies allocated for cleanups are not in fact applied to accomplishing that public goal expeditiously. … Assured financ-ing for cleanups is a higher goal than bringing non-compliers to justice.13
In practice, this perspective has a potential to create mal-aligned incentives for tank owners
to comply with tank-system technical standards. Still, whether or not the absence of strong
incentives to prevent accidental leaks among state assurance fund participants is manifest
in more adverse outcomes is an empirical matter. We now turn to the policy variation that
informs this question.
IV. STATE POLICY VARIATION AND MARKET INSURANCE
A. State Assurance Fund Changes
We examine three states for which comprehensive station- and tank-level data are available:
Michigan, Illinois, and Indiana. All three established substantively-identical state assur-
ance fund programs in 1988 or 1989. Indiana initially chose a high (relative to subsequent
claims) gasoline excise tax to finance its assurance fund, and has operated its program
without major changes since that time. However, claims in both Michigan and Illinois sig-
nificantly exceeded their initial funding levels and rendered both states’ assurance funds
insolvent by the mid-1990’s.
In response, Illinois raised its (wholesale) motor fuels tax by 0.8 cents by gallon
and continued to operate its state assurance fund. Studies performed in Michigan at the
time concluded a similar increase in funding would be necessary to restore that state’s fund
13Email communication with William Foskett, US EPA, August 18, 2004.
10
solvency (PSC, 1995). Facing public opposition to further gasoline taxes, Michigan’s leg-
islature elected to close its state assurance fund program to new claims.14 All tank owners
operating in Michigan needed to obtain private-market insurance starting July 1, 1995.
B. Market Insurance and Incentives
Environmental liability and cleanup insurance for underground fuel tank releases is availa-
ble on similar terms from a number of commercial insurance companies. In contrast to
state assurance fund programs, these commercial insurance policies are explicitly struc-
tured to encourage risk reduction efforts. For example, insurance premiums reward owners
for replacing tanks constructed of corrosive-prone material (bare steel) and aging tanks
generally. A review of several major insurers’ policies indicates that the primary factors
determining commercial tank insurance premiums are the age of the tank system, tank and
piping material and coatings, construction (single- or double-walled), contents, capacity,
and the history of prior leaks at the facility. Premiums are also based on the number and
types of leak detection systems in place, with lower premiums offered for more sophisti-
cated detection systems.
Some evidence on the magnitudes involved is summarized in Tables 1 and 2. Ta-
ble 1 lists several rate factors for one major commercial environmental liability insurer (the
Zurich Company, N.A.).15 Base premia vary with tank construction and age by a factor of
ten, from $185 per annum (p.a.) for a new, double-walled tank to $1850 p.a. for a single-
walled, 35+ year-old tank. Premiums are discounted by 10% each for installation of an
advanced leak detection system, additional corrosion protection equipment, and other pre-
ventive measures that exceed federal technical standards. Table 2 shows insurance premia
for several common three-tank system configurations of different vintages as of 1997,
which is approximately the mid-point of our study period. Comparing the rows of Table 2
shows that premiums vary significantly: Lower premiums apply if owners invest in
equipment that is less likely to corrode and leak, and that have better monitoring and in-
14Michigan Public Act No. 451 of 1994 (Michigan Compiled Laws §324.21101 et seq.) 15 Prices as of 2004. Discussions with Zurich indicate its premia during the mid-1990’s were generally high-er but structured similarly with respect to tank attributes. See also EPA (1997) and PSC (1995).
11
ventory control.
A second contrast to state assurance funds is that commercial insurance contracts
provide incentives for tank owners to “take care” due to experience-rated pricing. For in-
stance, the bottom row of Table 1 indicates that a prior accidental fuel release (a tank leak,
or surface spill exceeding 25 gallons) will increase the premium per tank charged by this
insurer by 10-to-20 percent per annum. To our knowledge, no state assurance fund pro-
gram incorporates experience rating—the most basic form of risk-related information—
into its program participation fee.
Last, private market insurers engage in a variety of activities designed to promote
risk-reducing activities by tank system owners. Some insurers issue newsletters that iden-
tify cost-effective technologies to prevent or detect leaks, which could conceivably reduce
owners’ costs of searching for and processing technical information. Insurers also offer
premium discounts and rebates to tank owners who purchase leak detection and tank sys-
tem maintenance services from specific third-party providers. For example, the American
Insurance Group’s Environmental Insurance unit provides premium discounts to tank sys-
tem owners who purchase compliance management and monitoring services from Tank-
nology-NDE International, a firm that specializes in tank system engineering and monitor-
ing equipment (NPN, 1998). Insurers view these third-party services as a means to reduce
moral hazard in maintenance and operations activities by gasoline retailers.
In sum, because the price of commercial insurance is closely tied to tank systems’
attributes, leak history, and risk-reducing activities at the station level, we hypothesize that
stations with commercial insurance are less likely to have accidental fuel tank leaks than
stations participating in state assurance fund programs. Before turning to the data that in-
form this conjecture, however, it is important first to describe how leaks are reported.
C. About Leak Disclosure Compliance
The data we examine include all underground tank fuel leaks and spills (formally known as
accidental releases) reported to, or discovered by, state regulatory agencies and commer-
cial insurers. The issue we confront is whether the true number of releases discovered by

12
tank system owners differs from the reported number of releases. This poses a concern for
our study if under-reporting is more prevalent with private insurance than public insurance.
Three observations argue against this possibility: (1) The likelihood a non-reported
release is ultimately detected is high; (2) the costs imposed by the marketplace and the le-
gal system upon discovery of a non-reported release are severe; and (3) the costs of report-
ing an insured accidental release are comparatively small. These imply a tank owner’s in-
terests are best served by reporting and cleaning up any leaks promptly, regardless of in-
surance system.
As to (1), there are two mechanisms at work: routine inspections and on-site test-
ing when a tank is replaced, or a facility is closed. Routine facility inspections by state
tank regulators occur every two to three years; their primary purpose is to detect previously
unreported leaks. Furthermore, whenever a facility owner closes or replaces a tank, state
regulators require its removal and inspection for leaks. The site assessment at closure is
designed to be diagnostic—that is, highly unlikely to erroneously conclude a site is clean if
a release has in fact occurred.
Regarding (2), market mechanisms provide considerable incentive to report and
clean up leaks. It is standard practice for a prospective buyer of any site with underground
fuel storage tanks to have the site tested prior to purchase (via direct soil sampling and
monitoring wells). A facility that does not test clean becomes difficult, if not impossible,
to sell and to insure by a future owner (absent cleanup). Consequently, unless the market
value of the site is already negligible before an accidental release, it is in the facility own-
er’s best interest to have any leak cleaned up promptly—at the current insurer’s expense—
so as to preserve the asset’s future value.
The legal consequences if a tank owner fails to report an accidental release take two
forms. First, as noted earlier, federal law stipulates that a tank owner or operator who fails
to report a suspected accidental release within 24 hours is subject to civil penalties of
$11,000 per day (RCRA Subtitle I §9006(d)2). Second, to renew commercial tank insur-
ance a facility owner must make a detailed declaration of whether it experienced an acci-
dental release in the past. Non-disclosure of a prior release is a breach for which the insur-
er may legally rescind coverage, leaving the tank owner liable for the full cost of the

13
cleanup. In that event, a tank system owner may well declare bankruptcy. In contrast, by
reporting the release promptly, a facility owner can avoid this loss and have the release
cleaned up at the insurer’s expense.
As for (3), even an insured facility owner bears some cost after an accidental re-
lease occurs. However, much of this cost is the same under either insurance system. The
major costs to the owner are the insurance policy deductible, future increases in expe-
rience-rated commercial premiums, any uninsured business interruption losses during
cleanup, and the cost of accelerated replacement of the tank system. Since the public in-
surance programs do not cover business interruption losses or replacement equipment, only
the experience-rating and (possibly) deductible amounts differ between commercial and
public insurance systems.
The totality of these considerations leaves both us and regulatory officials skeptical
that tank owners with private insurance are systematically less likely to report an acciden-
tal release than owners participating in state assurance fund programs.16 Nevertheless,
hard data on the prevalence of unreported tank leaks remain elusive; we are aware (from
EPA staff) of only two such incidents during our study period. EPA officials who oversee
compliance policies nationally assert there is no evidence tank owners using state assur-
ance funds and those using commercial insurance differ in reporting accidental releases.17
V. DATA AND MEASUREMENT
A. Data
We examine accidental release rates over a fourteen year period at all facilities in Michigan,
Illinois, and Indiana. These states are informative for several reasons. As noted earlier, all
three states adopted substantively-identical assurance fund programs at the same time (ei-
ther in 1988 or 1989). Second, each of these states maintains comprehensive data on all
16 In fact, it is conceivable that reporting might increase after a state switches to commercial insurance, since private insurers provide financial incentives (premium discounts) for station owners to install more sophisti-cated leak detection systems and to use third-party leak monitoring services. 17 Email communications with Sammy Ng (Director, US EPA Office of Underground Storage Tanks) and Mark Barolo (US EPA Office of Underground Storage Tanks), May 25, 2005.

14
underground fuel storage tanks and accidental releases in the state. These databases have
been continuously updated for over twenty years as old tanks exit and new tanks enter ser-
vice.18 Third, each of these states’ on-site inspections of tank facilities show a high rate of
compliance with leak detection system installation requirements (GAO, 2000), indicating
little difference among these states in tank owners’ abilities to detect leaks that do occur.
Last, these neighboring states have similar winter climates and precipitation levels, contri-
buting long-term factors to tank system corrosion and failures.
Two databases are maintained by each state’s environmental protection and tank
regulatory agencies. One is the tank database, which reports each tank’s installation date,
closure date (if applicable), facility, and location. The second database contains informa-
tion on all reported releases in the state, including the facility, release date, and clean-up
progress.19 A central feature of all three states’ databases is that they retain information on
tanks closed since 1986. Information on closed facilities allows us to avoid attrition and
survivor biases that would otherwise confound measurement of release rate changes over
time. In total, there are approximately 236,000 individual underground fuel storage tanks
in the data.20
Our analysis of release rates is conducted at the facility level. Release data record
only the facility at which a leak occurs, not which individual tank (if any) at the facility
had a leak. This is a technological limitation: leak detection systems often do not distin-
guish which tank is leaking if several are located near the detector, and leaks can occur in
piping systems rather than from a specific tank. The states we examine began collecting
comprehensive release data in 1990, upon implementation of their assurance funds pro-
grams.
Table 3 summaries various facility attributes and trends by state. Michigan and Il- 18 The US EPA also maintains a national Corrective Action Database of underground storage tanks and re-leases, based on data voluntarily supplied by state regulatory agencies. Couch and Young (2001, p. 18) re-port this national database contains errors and inconsistencies for numerous states that are extensive enough to “compromise the validity of regression analyses performed on it.” This shortcoming of the national data motivates our attention to three states that maintain higher-quality data on tanks and release events. 19 In separate work, we are examining how releases and closure decisions vary with facility ownership and type (e.g., independent gas station s versus branded gas stations). Inferring ownership type is difficult, how-ever, because owners are often listed as franchisees or individuals without further identification. 20 The data (and state and federal tank insurance regulations) also include underground fuel storage tanks at airports, railroad yards, car dealerships, municipal service lots, manufacturing plants, and other sites. Federal law excludes residential heating-oil tanks from financial responsibility regulations; these are not in our data.

15
linois are quite similar with respect to the number of facilities with underground fuel sto-
rage tanks, vehicle miles traveled (an indicator of fuel storage demand), and most tank-
level attributes. Indiana, which has two-thirds as many residents, has commensurately
fewer facilities and vehicle-miles but similar tank-level attributes. All three states exhibit
similar growth rates (within one percentage point) on these dimensions over our fourteen-
year study period. One noteworthy difference in Table 3 is that Michigan’s tanks are
slightly older than adjacent states. We come back to this in section VI.C.
A striking feature of the data is the dramatic facility exit rate in all three states.
Sixty-five percent of the 25,253 active facilities in Michigan in 1990 closed permanently
over the following 14 years. Entry (that is, de novo new facilities) was slight over this pe-
riod, resulting in a net facility exit rate of 61% from 1990 through 2003. Net exit rates are
similarly high in Illinois and Indiana over the same period (61 and 56 percent, respective-
ly). There has also been a trend to larger stations: the mean tank capacity of active facili-
ties increased steadily over time, by 4-to-5 percent per year. These trends mirror the indus-
try’s view that only the most profitable, high-volume gas stations can cover the fixed cost
of upgrading their tank systems to meet the regulatory requirements phased-in during the
1990s.
B. Measuring Facility Release Risk
The empirical task is to measure whether accidental tank release rates changed differently
across states after Michigan switched to private insurance. To do so, we compute two
measures of accidental release risk. These two measures are distinguished by whether or
not they condition on a facility’s status: An active tank stores fuel during the current (ca-
lendar) year, while a closed tank has been removed or rendered unusable in situ.21 A facili-
ty is active if it has at least one active tank.
This distinction is important because there are two ‘margins’ on which a facility
owner might respond to risk-based insurance pricing. One is to make capital investments
and improve maintenance practices, as described in section II.B, that reduce the chance of 21 Tanks that are de facto unused but have not been officially closed remain subject to technical regulations, reporting requirements, and insurance requirements.

16
a tank system leak. Such actions are not obligatory, however; a station owner might
choose simply to pay higher insurance premiums and not undertake any risk-reducing ac-
tivities. The second ‘margin’ is that a station owner might opt to close a leak-prone facility
entirely. This avoids the need for additional capital expenditures and/or higher insurance
expenses after a state requires commercial insurance, and will be preferred if these ex-
penses are high relative to the station’s profit stream.
Our data enable us to determine whether the policy shift to risk-based pricing af-
fected only release rates at active facilities, or whether it is manifest primarily through the
closure of facilities. To be precise, some notation is needed. Let Aft indicate if the status
of facility f in year t is active, and Rft indicate if an accidental release occurs. 22 A state’s
total release rate in year t is P(Rft), where the probability P corresponds to drawing a facili-
ty at random from the population of all (active and closed) facilities in the state. A state’s
active release rate is P(Rft | Aft), the chance an active facility has an accidental release. Be-
cause we observe the history of closures and releases at both active and closed facilities,
we measure these rates directly from the data:
,)(Pfacilitiesofnumbertotal
tyearinreleaseawithfacilitiesofnumberftR = (1)
and
.)|(Ptyearinfacilitiesactiveofnumber
tyearinreleaseawithfacilitiesactiveofnumberftft AR = (2)
These two measures are related by Bayes’ law, which implies
P(Rft) = P(Rft | Aft) P(Aft) + P(Rft ∩ ~Aft) , (3)
where ~Aft indicates a non-active (closed) facility. The last term on the right in (3) is non-
zero, but an order of magnitude smaller than the total release rate. (Newly discovered re-
leases at closed facilities are rare, but it can occur if a site is retested before redevelopment.)
As a result, changes in the total release rate P(Rft) are overwhelmingly determined by
22 Rft indicates at least one release in year t. However, it is exceptionally rare for a facility to report more than one release in the same year.

17
changes in the active release rate, P(Rft | Aft), and active status rate, P(Aft).
One implementation issue is to define the population of facilities, which enters the
denominator of (1). The databases we employ contain reliable information (that is, a cen-
sus of) tanks in the ground after 1986, when underground fuel tank reporting requirements
were originally enacted (40 CFR §280.22). In contrast, it is not possible to know (with any
accuracy) how many tanks were removed in the 1970s or earlier. Cognizant of this, we
define the total facility population as the set of facilities that were active at least once after
1986. According to this definition, if a facility was closed and had all its tanks removed
before 1986, it is excluded from the population and from our analyses. This restriction is
unlikely to materially affect our conclusions regarding the effects of risk-based insurance
pricing, as a decision to close a facility before 1986 amply predates any of the tank regula-
tions, insurance requirements, and state policies studied here.
One limitation of the data is that for some tanks we do not observe the installation
year or, to a lesser extent, its closure year. Specifically, installation dates are missing for
14% of the tanks in Michigan, 53% in Illinois, and 64% in Indiana (see Appendix Table A).
While this does not impair measurement of the number of releases, it does complicate
measurement of release rates. We address this issue using a stratification and imputation
procedure. The basic idea is that if a particular tank was closed in year s but its installation
date is unrecorded, we set the tank’s active status indicator, Ait, t < s, equal to the relative
frequency of active status among all tanks in the same state that closed in the same year but
with an observed installation date. This yields a time-varying estimated probability in
place of the unobserved active-or-closed status of the tank. We use this probability to
compute the facility-level active status counts in equation (2). The precise imputation pro-
cedure, which conditions on additional facility characteristics, is detailed in the Appendix.
This probabilistic imputation procedure rests on a conditional independence as-
sumption: the conditional distribution of tanks’ installation years within a state, given the
observed closing year, is the same whether or not the installation year was recorded in the
data. Some support for this assumption comes from discussions with state database admin-
istrators in Illinois, who indicated that the major reason for missing data is that installation
dates are not considered essential to their enforcement activities and have not been com-

18
pletely coded into their databases.23 This suggests that missing installation dates (in Illi-
nois) may well be random, or at least unrelated to a tank’s release propensity. However, in
the Indiana data it appears that observed installation and closure dates are for disproportio-
nately newer tanks (installed from the 1990s onward). This does not affect the usefulness
of the Indiana data on total releases, but means data for Indiana relating to facility status
and tank age should be interpreted cautiously. Overall we will place our primary emphasis
on comparisons between Michigan and Illinois, with comparisons to Indiana serving as
supplemental corroborative evidence.
VI. RESULTS
This section presents empirical evidence indicating that after the policy change to a private
insurance market, overall release rates fell in Michigan by 20 percent more than adjacent
states. The data also suggest that after the change, tank owners in Michigan tended to
“take care” of their tanks more than in Illinois.
A. Changes in Total Release Rates
Table 4 summarizes the three states’ average annual release rates before and after 1995,
when Michigan’s transition to private insurance occurred. It omits 1995 because Michi-
gan’s policy change took effect mid-year (we report 1995 separately below).
The data indicate that on an average annual basis, Michigan’s total release rate fell
from 6.51 to 2.56 per 100 facilities before-versus-after the policy change, a drop of 60.6
percent. By contrast, the total release rate in Illinois was lower initially and declined by
less: 5.23 to 2.82 per 100 facilities, a reduction of 46.2 percent. The ratio of relative risk
changes (60.6 / 46.2), known generally as the etiologic ratio, is 1.31. It indicates that
Michigan’s relative risk reduction exceeded Illinois’ by 31 percent. The relative risk re-
duction in Michigan exceeded Indiana’s by a similar amount, 24 percent.
23 Interview with Jan Spoor, Database Administrator, Illinois Office of State Fire Marshall, May 19, 2005.
19
Reductions in environmental risks should also be considered in absolute terms. On
an average annual basis, Michigan’s total release rate fell by 3.95 per 100 facilities after its
policy change. In contrast, the total release rate in Illinois declined by only 2.42 per 100
facilities. The absolute risk reduction in Michigan exceeds that in Illinois by a difference
of 1.53 (or 3.95 – 2.42) releases per 100 facilities, which is 23% of Michigan’s initial
(1990-1994) average annual release rate.
In economic terms, is a reduction of 1.53 releases for every 100 facilities important?
Yes. The number of facilities in Michigan after its policy change averages approximately
26,000 (see Figure 2). So an annual reduction of 1.53 releases per 100 facilities corres-
ponds to about 400 fewer accidental releases per year and approximately 3,200 fewer re-
leases over our eight-year post-transition study period. Table 4 also indicates that Michi-
gan’s ‘excess’ absolute risk reduction (the difference-in-differences) is even greater com-
pared to Indiana: 2.18 releases per 100 facilities annually. Taken together, these data sug-
gest that Michigan had some three-to-four thousand fewer underground tank leaks over the
eight years following its policy change than the number predicted by neighboring states’
experience over the same time period. Given an average cleanup cost of $125,000 per re-
lease (GAO 2007), this represents an aggregate cleanup cost savings for that state on the
order of $400 million over eight years.
Figure 1 shows the difference in total release rates between Michigan and Illinois at
an annual frequency. It indicates that the greater drop in Michigan’s pre- versus post-
period release rate, relative to the change in Illinois, is not driven by the data for any one
particular year. Michigan’s total release rate was consistently higher than Illinois’ through
1995. The difference in release rates between the two states falls in 1996, after Michigan
requires private insurance. (A drop is also observed in 1993, the federal deadline to install
or upgrade leak detection at “grandfathered” facilities. All states’ release rates fell that
year, Michigan’s slightly more than the others). After Michigan’s policy change in 1995,
its release rate not only falls relative to Illinois but is actually lower than Illinois’ most
years thereafter.
Are these differences statistically significant? Since we have a census of the facili-
ties in each state, errors in mean release rates arise from mis-measurement, not sampling

20
variation. The standard error of the mean if binary outcomes are recorded with misclassi-
fication errors is a concave function of the misclassification probability. For our sample
sizes, the standard errors of mean release rates due to misclassification error are bounded
above by 0.0014. (This assumes independent errors across facilities). That means even
with extraordinary measurement error in recording release events—e.g., a 50 percent error
rate—differences in observed release rates larger than about 0.3 per 100 facilities are statis-
tically significant. In administrative data like these, misclassification rates of 50% stretch
credulity; the standard errors we report in Table 4 are based on a lower misclassification
rate of 5%. Adjusting for within-facility correlation in release events over time (i.e., clus-
tering on facility) yields de minimus changes in the standard errors, as few facilities have
more than one release during the fourteen-year span of our data.
B. Mechanisms and Closure Rates
Why did accidental release rates fall more in Michigan than neighboring states after 1995?
Conceptually, it is useful to distinguish among three distinct mechanisms:
(i) Greater facility closure rate. Because releases at closed facilities are rare,
shifting facilities from active to closed status will tend to reduce a state’s overall re-
lease rate. A greater closure rate in Michigan—for any reason—would tend to re-
duce its total release rate more than neighboring states.
(ii) Greater selective attrition of the most leak-prone facilities into closed status
in Michigan than in adjacent states. Note that selective attrition may reduce release
rates in Michigan more than other states even if overall facility exit rates are simi-
lar—that is, even if explanation (i) does not hold.
(iii) Greater risk-reducing effort at active (surviving) facilities in Michigan than
in adjacent states. Tangibly, this means replacing or re-lining older tanks, improving
maintenance practices, installing anti-corrosion equipment, and similar activities after
Michigan’s insurance policy change.
The first of these explanations is potentially problematic for conclusions about the role of
insurance pricing. Conceivably, high closure rates of gas stations during the 1990’s could

21
have come about for a number of reasons unrelated to insurance reform: adverse demand
conditions, the federal tank-system technical standards phased-in during the 1990s (section
III.B), the industry’s trend to replace smaller stations with larger facilities that have higher-
profit convenience stores, and so on. These pose a potential concern if they resulted in
higher facility closure rates in Michigan than in comparison states after 1995. We consider
this possibility in light of the data next, and explanations (ii) and (iii) subsequently.
Facility Closings. Figure 2 displays the total number of facilities and the number
of active facilities from 1986 to 2003 for Michigan and Illinois. A state’s total and active
facilities are the same in 1986, when record-keeping requirements began. In both states the
total number of facilities (solid lines) grows incrementally over time, due to modest de no-
vo entry by new gasoline stations. However, the number of active facilities (dashed lines)
plummets in both states. The decline in Indiana’s active facilities is substantively the same
(see Table 3).
Figure 2 reveals several important points. First, the decline in the number of active
facilities commences in 1988-89, when the EPA issued its final regulations regarding fi-
nancial responsibility requirements (effective in 1988) and tank technical requirements (ef-
fective a decade later, in 1998, for existing facilities). Second, there is an abrupt drop in
the number of active facilities in Illinois (and in Indiana) in 1999, the year after the “grand-
fathering” of existing facilities ends. We do not observe a similar decline in Michigan
(more about this presently). Third, there is a slightly greater rate of de novo entry in Illi-
nois than in Michigan. Since newly-installed tanks are unlikely to corrode and must meet
federal tank-system technical standards upon installation (for corrosion resistance and leak
prevention), this difference in entry rates should tend to reduce Illinois’ overall release rate
relative to Michigan’s over time. That is, the difference in new entry rates does not help
account for Michigan’s greater drop in release rates—it makes Michigan’s greater decline
more remarkable.
Last, and perhaps most importantly, there is little evidence that closure rates in
Michigan exceeded those in Illinois. From 1990 to 2003, the proportion of facilities that
were active—that is, )(ˆitAP in equation (1)—declined by essentially identical amounts in
both states: 56 percentage points (from .90 to .34) in Michigan and 57 percentage points
22
(from .88 to .34) in Illinois. The proportion of active facilities fell 69 percentage points
(from .97 to .38) in Indiana over the same period, a greater closure rate than in Michigan.
These data support two intermediate conclusions: (a) The net exit of stations in
Michigan over time was not induced by that state’s private-market insurance requirement
in 1995; and (b) The difference in absolute risk reductions between Michigan and its
neighbors is not attributable to a greater rate of facility closure over time in Michigan. The
second implication is important, as it argues against the possibility that there exist con-
founding factors—that is, something other than insurance reform—that caused different
release rate changes between states by inducing different facility closure rates.
It is (perhaps) puzzling that Michigan’s overall closure rate from 1996 to 2003 is
essentially the same as in Illinois, and smaller yet than in Indiana. After all, the cost of op-
erating a facility increased in Michigan when its state assurance program closed in mid-
1995; there was no analogous fixed-cost increase in the two neighboring states. Why not
greater exit after a cost shock? The likely explanation lies in the magnitudes. After Mich-
igan’s policy change, insurance costs for a typical three-tank facility that complies with the
1998 federal technical standards are in the range of $1,000 to 3,000 annually (Table 2,
rows 1-3). These amounts may be too small to have a significant impact on facility exit
rates among compliant facilities—which are apt to be better-managed, more-profitable es-
tablishments. The insurance cost increase at older, non-compliant facilities could be sub-
stantially higher, and perhaps high enough to drive out marginally-profitable establish-
ments ceteris paribus. This may explain why Michigan’s exit rate declines comparatively
smoothly over the 1995-1999 period in Figure 2, but Illinois exhibits an abrupt drop in the
number of active facilities from 1998 to 1999. Both states’ non-compliant facilities could
not operate after the federal “grandfathering” provision expired in 1998 (without costly
upgrades), but in Illinois there was little incentive to close a non-compliant facility before
1998.
C. Changes in Active Release Rates
Explanations (ii) and (iii) above point to the possibility of changes in release rates at active

23
facilities as a result of insurance reform. Table 5 summarizes each state’s active facility
release rate, or )1|(ˆ =ftft ARP , calculated using equation (2). Note this is not a fixed set of
establishments; the number of active facilities declines steadily over time (Figure 2).
After 1995, Michigan’s active release rate falls by 3 percentage points, from 8.81 to
5.78 per 100 active facilities. By contrast, Illinois’ release rate declines by slightly more
than 1 percentage point and Indiana’s falls by less than one. The “excess” absolute risk
reduction among active facilities in Michigan versus Illinois is 1.78 per 100 facilities, and
2.09 per 100 facilities compared to Indiana.
The active facility release rate changes and the total release rate changes in Table 4
are mechanically related: A greater decline in the total release rate in Michigan than other
states implies a greater decline in the active facility release rate, and vice versa. (This fol-
lows from equation (1) and two facts: facility closure rates are similar in Michigan and Il-
linois (Table 3 and Figure 2), and changes in releases reported at closed facilities are em-
pirically negligible.24) Thus, the new information content in Table 5 lies not in the magni-
tudes but in their interpretation.
Because the set of active facilities is declining steadily over time in each state,
changes in active facility release rates may arise from two conceptually different mechan-
isms. The first is direct risk-reducing effort at facilities that continue to operate. This is
the earlier explanation (iii), and involves investment in risk-reducing technologies and
their maintenance. Alternatively (or in combination), selective attrition of the most leak-
prone active facilities over time would result in a progressively lower-risk set of surviving
active facilities. Note the latter mechanism would reduce active release rates, as measured
in Table 5, even if firms made no efforts at all to reduce release risks at ongoing establish-
ments.
Which of these mechanisms accounts for the larger reduction in release rates in
Michigan, relative to the other states, after its policy change? Ideally, the most compelling 24In the data, the release rate at closed facilities in Michigan during 1990-1994 is 0.0027 and during 1996-2003 is 0.0018, a decrease of 9 releases for every 10,000 closed facilities. The decrease in the release rate at closed facilities in Illinois is <1 per 10,000 closed facilities, and there is a small increase for Indiana of 9 re-leases for every 10,000 closed facilities. For all three states, the changes in release rates at closed facilities are two orders of magnitude smaller than the changes in the total and active release rates—far too small to help explain the overall decline in either.

24
data to address this question would be information on facility-level investments in specific
risk-reducing technologies before and after 1995 (such as cathodic anti-corrosion protec-
tion equipment, tank re-linings, maintenance logs showing more frequent pressure testing,
and so on). To our knowledge such data have not been systematically collected, and we
are skeptical they could now be assembled reliably in retrospect. Nevertheless, we can
draw some useful inferences about whether or not these activities must have occurred by
examining surviving and attriting facilities separately.
Risk-Reducing Activity. The majority of the facilities active at the end of our study pe-
riod were active since (at least) 1990. Table 6 summarizes the average annual release rates
for these continuously-operated facilities.25 The average annual release rate in Michigan
decreases by 4.57 releases per 100 facilities after 1995 (from 8.08 to 3.51). In contrast, the
rate in Illinois falls by about half as much: 2.55 per 100 facilities (from 6.27 to 3.72). The
situation in Indiana is similar, with a decline of only 2.20 per 100 facilities (from 6.04 to
3.84). In absolute terms, the reduction in Michigan’s release risk exceeds that in Illinois
and in Indiana by 2.02 and 2.37 per 100 facilities, respectively, and the relative risk falls
39 percent and 55 percent more in Michigan than the adjacent states. These magnitudes
are substantial, exceeding the excess absolute risk reduction and etiologic ratios for the fa-
cility population overall (see Table 4).26
The facilities in Table 6 are unlikely to be representative of all facilities, as surviv-
ing facilities are apt to be more profitable than average. Still, these facilities operated un-
derground fuel storage tanks in the same location, with the original or replacement tanks
and equipment, for many years before and after Michigan’s policy changed. It leaves three
possible explanations for Michigan’s substantially greater decline in release rates among
the three states’ continuously-operated facilities:
25 Tables 6 and 7 omit facilities operating in 2004 for which operational status in 1990 is unknown due to missing tank installation year data. Similar calculations (not shown here) treating these facilities as conti-nuously-operated do not materially change these results. Information on the prevalence of missing installa-tion years is provided in Appendix Table A. 26 The decline in absolute release rates at continuously-operated facilities in Indiana and Illinois (presumably) results from periodic replacement of old tanks with new tanks, since new tanks are constructed to higher leak-prevention standards (section III.A).

25
(a) Greater direct risk-reducing activity among facilities in Michigan, whether
through closing or replacing old tanks, re-lining existing tanks, installing anti-
corrosion equipment, improving maintenance practices, or similar efforts;
(b) Greater non-disclosure of releases that do occur in Michigan after 1995, fi-
nancial penalties and insurer monitoring efforts notwithstanding; or
(c) A change in the rate at which steel tanks corrode underground in Michigan
relative to other Midwest states, for some other reason.
Some additional evidence favors explanation (a), as noted presently. Although we
cannot completely rule out (b), we find it difficult to support for the reasons discussed in
section IV.C: The facilities in Table 6 are long-term operators at (presumably) profitable
locations, and therefore should have high opportunity costs of violating federal reporting
requirements—including the substantial civil penalties for non-disclosure and loss of
commercial insurance coverage. We can identify no evidence (nor reason) to support ex-
planation (c), which would seem to require a heretofore-undocumented change in Michi-
gan’s geology—and in the same year as its insurance policy reform.
Tank closure data offer further, albeit narrow, supporting evidence for explanation
(a). Table 7 Panel A shows that after 1995, the number of tanks in service at continuously-
operated facilities in Michigan falls 16 percent (from 3.6 to 3.1). In contrast, the corres-
ponding changes are close to zero in Illinois and in Indiana (2.9 to 2.9 and 3.0 to 3.1, re-
spectively). Continuously-operated facilities in Michigan thus reduced the number of
tanks in service—in absolute number and relative to adjacent states—as one would expect
after their tank insurance costs increased.
More pointedly, Panel B shows the number of older tanks in service (per facility) at
continuously-operated facilities. Column (4) indicates that prior to 1995, facilities in
Michigan had nearly twice as many tanks over 20 years old in service (per facility) as Illi-
nois. Michigan had 70 percent more than Indiana. The greater prevalence of older tanks in
service helps explain Michigan’s higher initial release rate, as noted in Tables 4, 5, and 6.27
27 The reasons tank age is a statistically useful predictor of leaks are two. First, corrosion takes time (years) to develop. Second, regulatory changes after 1989 required new tanks to meet higher leak resistance standards. This means there is a pure vintage effect that results in most leaks occurring at older tank installations. On these points, the evidence in the technical literature is unequivocal: A detailed engineering study of the caus-

26
The final row in Panel B reveals that after 1995, this ratio declines 23 percent (from 1.9 to
1.5) relative to Illinois and 13 percent (from 1.7 to 1.5) relative to Indiana. In sum, after
Michigan’s policy change the continuously-operated facilities in Michigan closed not only
more tanks overall, but disproportionately more of their older—ostensibly more leak-
prone—tanks than Illinois and Indiana.
Interestingly, the proportion of active tanks over 20 years old increases in both Illi-
nois and Indiana, but not in Michigan. This seems consistent with (i) increases in new tank
installation costs during the 1990s (section III.A), and (ii) the limited incentive to replace
old tanks under a public insurance system, relative to the incentives to replace old tanks
(Tables 1 and 2) under the commercial insurance system adopted in Michigan in 1995.
Selective Facility Attrition. The foregoing leaves open the possibility that part of Michi-
gan’s greater overall risk reduction is due to selective facility attrition. In precise terms,
selective attrition means facilities that ultimately closed in Michigan were more leak-prone
(prior to closure) than facilities that closed in Illinois or Indiana:
PMI (Rft | Aft , ~Af,2004) > POtherState (Rft | Aft , ~Af,2004) , t < 2004 . (4)
Table 8 tabulates empirical frequencies that address (4). It reveals that the facilities that
ultimately closed in Michigan had significantly higher historical release rates: Over 6 per-
centage points higher than Illinois (18.11 versus 10.07 releases per 100 facilities), and 4.5
percentage points higher than Indiana (18.11 versus 13.67 releases per 100 facilities).
Note these frequencies do not say how much selective attrition may have occurred
among facilities that closed before 1995, nor how much this contributed to the overall ab-
solute risk reduction in Tables 4 and 5. For this we require a more detailed decomposition
of the relative magnitudes.28
es of accidental tank leaks at several hundred facilities in California indicated that over 75% of all leaks oc-curred in tanks (or piping systems) over 15 years old (Couch and Young, 2001). An independent study con-ducted for the Michigan Department of Environmental Quality in 1995 reached similar conclusions, finding that tanks over 20 years old or with unknown age accounted for a disproportionate 64% of accidental tank releases (DEQ 1995). 28 We have also estimated survival curves for each state, with generally uninformative results. On theoretical grounds, the usefulness of survival modeling in this context is questionable: Standard models assume transi-tion probabilities vary with time-at-risk but are invariant with respect to calendar time. This stationarity as-

27
Relative Magnitudes. In principle, we can decompose a state’s absolute risk reduction
into the release rate changes at continuously-operated facilities (stayers), at facilities that
ultimately close (attritants), and at new facilities (entrants), weighted by their population
shares:
∆P (Rft ) = ss × ∆P(Rft | stayer ) + sa × ∆P(Rft | attrittant ) + se × ∆P(Rft | entrant ) (5)
Note that the facility groups and population shares are time invariant: only the conditional
release rates are changing over time. (Population shares are defined as a proportion of cu-
mulative births through 2004, a fixed denominator). The left-hand term is the change in a
state’s total release rate, as shown in Table 4.
A few simple calculations imply that selective attrition accounts for at least half of
Michigan’s excess absolute risk reduction over adjacent states. Empirically, the last term
in (5) is negligible: There are few entrants and their release rates do not change much.
The “stayer” share is ss ≈ ⅓ in each state (c.f. Figure 2), and Table 6 reports ∆P(Rft | stayer).
It declines by 4.6 in Michigan versus only 2.5 and 2.2 in Illinois and Indiana (per 100 facil-
ities). Thus the first term on the right in (5) accounts for an excess absolute risk reduction
in Michigan over Illinois of about ⅓ × (4.6 – 2.5) = .7 per 100 facilities—which is half
Michigan’s excess absolute risk reduction (Table 4). The remaining half is attributable to a
greater reduction in release rates at attriting facilities.
Table 9 steps through the detailed calculations. Here we include an additional
group of “unknown” facilities that are operational in 2004 but have missing en-
try/installation data (thus cannot be unambiguously categorized as entrants or stayers).
Panel A shows the conditional release rate changes for each group, on an average annual
basis, before v. after 1995. The declines are broadly similar for both attritants and stayers,
although there is some variation between the states.
The attritants’ release rates in Panel A are decreasing, yet in Table 8 are increasing
over time. They measure different things: Table 8 estimates P(Rft | Aft , ~Af,2004), while
Panel A of Table 9 (in column 2) shows changes in P(Rft | ~Af,2004). Empirically,
sumption does not hold here (due to vintage effects and changing tank technical standards), which renders it unclear what distribution standard survival curves are estimating.
28
P(Rft | ~Af,2004) = αt P(Rft | Aft , ~Af,2004) + negligible terms,
where αt is the proportion of facilities closing by 2004 that are still active at t < 2004. Over
time αt falls faster than P(Rft | Aft , ~Af,2004) rises, and particularly faster in Michigan. Mich-
igan is shuttering its comparatively more leak-prone facilities faster after 1995 than adja-
cent states—resulting in its greater risk reduction among attritants in Panel A.
Panel B weights each group’s conditional release rate reduction by its population
share, corresponding to the products terms on the right in equation (5). The share-
weighted reduction in the attritants’ release rates exceeds that of the continuously-operated
facilities for each state, and by a factor of two or more. This is not unexpected insofar as
approximately two-thirds of all facilities are attritants (Figure 2).
Subtracting the rows in Panel B and expressing the difference by group as a percen-
tage of Michigan’s overall excess risk reduction gives the decomposition in Panel C. It
shows that half of Michigan’s excess absolute risk reduction over Illinois is attributable to
the greater risk reduction at continuously-operated facilities in Table 6. The balance is at-
tributable to the fact that facilities that ultimately closed in Michigan had higher historical
release rates than did closing facilities in Illinois. The proportions for Indiana are some-
what greater for attritants and smaller for stayers. (Combining the “unknown” group with
the stayers they most likely represent would with lower the stayer contribution to about
one quarter). As noted earlier we view the comparisons to Indiana as generally indicative,
but less reliable, than results based on the higher quality data from Illinois and Michigan.
We conclude that not only did ongoing establishments make greater risk-reducing
efforts in Michigan than in other states after 1995, but tank owners in Michigan tended to
permanently close facilities that had a higher propensity to leak. Note this second, selec-
tive attrition mechanism is not based on overall facility closure rates—which the data indi-
cate were similar in each state (section VI.B). Rather, it attributes part of the differential
change in total release rates between Michigan and neighboring states to which facilities
were closed. Greater sorting of leak-prone tanks into closure in Michigan than neighbor-
ing states seems a particularly plausible outcome of the switch to private-market insurance
in that state, since tank attributes that predict future accidental releases (such as tank age)
are a major determinant of commercial insurance premiums (Tables 1 and 2).

29
VII. ALTERNATIVE EXPLANATIONS
Observational studies of policy changes confront two fundamental questions: Did out-
comes of interest change significantly after the policy did, and was the policy change the
(only) cause? The data appear to answer the first question unequivocally. By any measure,
the fraction of establishments that reported an accidental fuel tank release declined dramat-
ically in Michigan relative to surrounding states after 1995. As a consequence, the number
of costly accidental release cleanups in that state declined by thousands in subsequent
years. The second question is more difficult to answer conclusively, however. Our pre-
ferred explanation—the adoption of risk-based insurance pricing in Michigan—stems from
its theoretical appeal and ability to explain the empirical evidence assembled here. Still,
there are some other potential explanations for these changes and some perspective on
these is worthwhile.
A. Michigan Expected Less of a Tank Problem
Is it possible that the Michigan legislature made its policy change because it expected to
have less of a problem with tank releases after 1995, and therefore believed its state assur-
ance fund program was no longer needed? If so, then Michigan’s decline in accidental re-
leases (relative to other states) after its policy change may not be attributable to the switch
to risk-based insurance pricing. That is, perhaps cause and effect are reversed.
State-projected tank release claims in Michigan during the mid-1990s are not espe-
cially supportive of this interpretation. The impetus for Michigan’s policy change was the
fact that its state assurance fund was insolvent. Documents prepared for the state’s regula-
tory enforcement agency at the time indicated that “the current MUSTFA [Michigan Un-
derground Storage Tank Financial Assurance Fund] is already insolvent, with an expected
shortfall of $235.34 million to meet expected costs for existing claims.” (PSC, 1995).
More importantly, actuarial estimates of future liabilities predicted more than 3000
additional claims for reimbursement between March 1995 and December 1998. This is

30
nearly the same number as during the state fund program’s operations in 1993 and 1994,
and is a higher projected release rate after 1995 than actually occurred in Michigan—or
even in Illinois, for that matter.
In sum, we find no basis to conclude that Michigan expected to have fewer releases
in the future, or that it closed its public assurance fund because it believed claims would
have declined in any event. The record indicates Michigan closed its assurance fund be-
cause the program was insolvent, its actuaries forecasted a growing net liability under the
status quo, and its legislature elected not to fund the escalating public subsidy.
B. Michigan Enforced Technical Standards
Tank system anti-corrosion requirements can help reduce tank releases. Conceivably, an
alternative explanation for greater decline in release rates in Michigan is that its regulatory
authorities made greater efforts to enforce tank engineering and maintenance standards,
especially after 1995.
In 2000, the U.S. Government Accountability Office (GAO) conducted a survey of
state underground storage tank inspection programs. As summarized in Table 10, this sur-
vey showed that Michigan, Illinois and Indiana made similar efforts to enforce technical
standards. Facilities in all three states exhibited similar compliance rates with the installa-
tion of required leak detection equipment, ranging from 91 to 95 percent. With regard to
nominal inspection frequency, a tank is inspected by the state every two years in Illinois,
but every three years in Michigan and Indiana. In practice, the GAO found that Michigan
inspected between 30 and 40 percent of facilities in the state annually, and a similar per-
centage for Illinois. Indiana inspected fewer than either of the other states during the late
1990s (less than 20 percent). Although the quantitative evidence on inspections and en-
forcement activity is limited, there appears to be little basis for attributing Michigan’s
greater decline in release rates to the conjecture that it may do a better job enforcing tech-
nical standards.

31
IX. CONCLUSIONS
This study shows that after Michigan’s transition to private-market environmental liability
insurance, overall accidental release rates from underground fuel storage tank systems de-
clined by over 20 percent, or about 1.5 releases per 100 facilities, more than adjacent states.
This is a substantial change, amounting to three-to-four thousand fewer accidental releases
over the following eight-year period. At an average cleanup cost of approximately
$125,000 per release, this corresponds to aggregate avoided cleanup costs exceeding $400
million in that state. Those are the direct costs of cleaning up affected sites, and do not
include business interruption costs associated with cleanup activities. More importantly, it
also excludes the cost of any adverse health effects of contaminated water supplies. This is
not because the public health consequences are apt to be negligible, but because studies of
their magnitude remain few and their representativeness highly uncertain (see Jenkins, Ko-
pits, and Simpson (2006) for a review).29
Is Michigan’s policy change and the adoption of risk-based insurance pricing the
cause of Michigan’s greater decline in accidental release rates? The evidence on causality
is necessarily imperfect; there is no true element of randomization in our study design.
Still, it seems difficult to identify any other theory capable of explaining all of the availa-
ble evidence. We believe the most compelling case, and one that may be particularly valu-
able given the policy implications at stake, would be achieved by replication of these find-
ings elsewhere. Specifically, nine states have since followed Michigan’s lead in closing
their state-fund assurance programs to new claims.30 Since federal financial responsibility
requirements are obligatory, this forces tank system owners to switch to commercial envi-
ronmental liability contracts like those in Michigan. If the main findings we report are
confirmed independently for other states undertaking similar insurance reforms, the policy
ramifications would be difficult to ignore.
29 Simons, et al. (1999) estimate that a leaking (commercial) underground storage tank reduces the price of residential property within one block by 17%, and reduces the price of commercial property by 28-42%. Their study uses detailed data for ten leaking gas station sites in one Ohio county. 30These states (and assurance-fund discontinuation dates) are Wisconsin (1996), Texas (1998), Florida (1999), West Virginia (2000), Iowa (2000), Delaware (2001), Alaska (2004), Arizona (2006), and Maryland (2007).

32
With the desirability of replication in mind, we tentatively proffer some of these
policy ramifications. According to the State Financial Assurance Funds Survey 2007,
eight states’ underground storage tank financial assurance funds are insolvent with out-
standing liabilities totaling $2 billion. Moreover, the US EPA estimates that 12,000 new
underground fuel tank releases occur annually.31 It would appear that adopting risk-based
pricing structures similar to those studied here may alleviate these ongoing solvency crises,
and reduce the frequency of costly release accidents.
We would be remiss not to observe parallels with other government assurance pro-
grams, such as deposit insurance and pension benefit guaranty programs. The fact that
these programs are commonly subsidized with general tax revenue and exclude risk-based
pricing mechanisms can lead to two adverse outcomes. First, moral hazard becomes a
prominent concern. With pension benefit guaranty funds, for example, Cooper and Ross
(1999) argue that unions and firms may have an incentive to agree to more lucrative em-
ployee retirement benefit packages if the government will cover pension liabilities in the
event of bankruptcy. Similarly, banks and other financial intermediaries may take greater
financial risks than they would be willing to hold in the absence of federal deposit insur-
ance (Kareken and Wallace, 1978; Wheelock and Wilson, 1995; but see Akerlof and Ro-
mer, 1993, for another perspective).32 The second shortcoming is that because participa-
tion in government assurance programs is usually subsidized, its existence may preclude
the development of private insurance markets that may identify more efficient risk-
reduction practices.
Several related questions remain for future research. First, this paper focused on an
ex ante moral hazard problem, that is, whether a tank owner takes extra risk reduction ef-
forts in response to risk-based pricing. There is also an ex post moral hazard problem,
wherein a tank system owner has an incentive to exaggerate losses when making an insur-
ance claim. Since a small but significant share of tank systems are self-insured under the
private-market regime but few-to-none are self-insured if a state assurance fund is availa-
31 US EPA Office of Underground Storage Tanks, 2006 Corrective Action Performance Measures Data. 32 One early policy change proposed to address moral hazard in this setting was to condition federal deposit insurance premiums (paid by banks) on a measure of portfolio risk (Meltzer, 1967). According to this prin-ciple, the 1991 Federal Deposit Insurance Corporation Improvement Act required the FDIC to implement a system where each bank’s premium reflects the risk it poses to the insurance fund.

33
ble, it would be useful to determine whether the ex post moral hazard problem is more se-
vere with government assurance funds. Last, there are also hybrid public-private reinsur-
ance arrangements. For example, the state of Washington offers state-financed reinsurance
at below-market prices to commercial tank insurers. The commercial insurers are required
to pass this discount on to tank system owners. It would be desirable to know whether this
public-private system is as effective in reducing accidental releases as the fully private in-
surance market studied here.

TECHNICAL APPENDIX
This appendix summarizes the methods we employ to address missing data on tank and facility installationand closure dates. Missing transition dates affect the calculation of release rates in equations (1) and (2),and the number of facilities and active facilities reported in Figure 2. Appendix Table A indicates theextent of missing installation and closure dates for each state.
In general, if a tank’s status (active or closed) is unknown, we estimate it with a probability of beingactive that varies by tank and by year.
Number of Active Facilities. Let i index tanks and f index facilities. A tank is active between itsinstallation year (Ii) and closure year (Ci), inclusive:
Tit =
1 if Ii ≤ t ≤Ci
0 if otherwise.
A facility is active at t if it has at least one active tank:
A f t =
1 if maxi at fTit= 1
0 if otherwise.
Figure 2 reports an estimate of
total # active facilities in year t = ∑ f A f t (A-1)
Difficulties arise if either Ii or Ci is unobserved for a tank at facility f . For such facilities, we first estimate
A f t = Pr(A f t = 1|Ω f )
= Pr(
maxi at fTit= 1|Ω f
)where Ω f denotes information available to us about facility f . We then replace A f t with A f t in (A-1).
Estimating Active Status. Let i = 1,2, . . . ,n f be an (arbitrary) enumeration of all tanks, both activeand closed, at facility f . Then
A f t = 1−Pr(T1t = 0,T2t = 0, . . . ,Tn f t = 0|Ω f )
= 1−n f
∏i=2
Pr(Tit = 0|Ti−1,t = 0, . . . ,T1t = 0,Ω f )Pr(T1t = 0|Ω f )
When Tit is unobserved, we estimate its conditional probability using a stratified matching procedure. LetT−it be the event that all tanks with an index less than i are inactive at facility f , or
T−it = Ti−1,t = 0, Ti−2,t = 0, . . . , T1t = 0.
(If i = 1, let T−it = /0). For notational convenience, set
pit = Pr(Tit = 0|T−it ,Ω f )
so A f t = 1− p1t p2t · · · pn f t . To estimate an unobserved facility’s status A f t , we require (an estimate of)pit for each tank. Here t runs from 1990 to 2003, annual periods.

In the data, we observe every tank’s current (as of 2004) status. (Current status, which matters forenforcement purposes, is recorded in the data even if the installation and (if applicable) closure yearsare missing.) This implies that if Ii is recorded and either Ci is recorded or Ci > 2004 (a right-censoredsurvival time), then pit is known and either 0 or 1, a degenerate case:
Case 0: Ii observed, and either Ci observed or Ci > 2004 (right censored). Then
pit =
0 if Ii ≤ t ≤minCi,20041 if otherwise
If a tank’s status is not directly observable, then it must be estimated and one of four mutually exclusivecases apply:
Case 1: Ii unobserved, Ci observed. (This implies Ci ≤ 2004). Then
pit = Pr(Tit = 0| Ii unobserved, Ci, n f ,T−it)
=
Pr(Ii > t| Ii unobserved, Ci, n f ,T−it) , t ≤Ci
1 , t > Ci
which we estimate with
pit =
F(Ii > t| Ii observed, Ci, n f ,T−it) , t ≤Ci
1 , t > Ci .
where F(Y |X) denotes the observed relative frequency of tanks with attribute Y in set X .
Thus, if tank i at (say) a three-tank facility has an observed closing year Ci but an unknown in-stallation date, then we estimate i’s probability of active status in year t with the observed relativefrequency of active status for the ith tank at all three-tank facilities in which
• tank i’s installation year is known;
• tank i’s closure year is the same, Ci, and
• tanks 1 through (i−1) are known to be inactive in year t.
When a tank’s closing date is unknown, the generalization is straightforward:
Case 2: Ii unobserved, Ci > 2004 (right-censored). Then, for t ≤ 2004,
pit = Pr(Ait = 0| Ii unobserved, Ci > 2004, n f ,T−it)= Pr(Ii > t| Ii unobserved, Ci > 2004, n f ,T−it)
which we estimate with
pit = F(Ii > t| Ii observed, Ci > 2004, n f ,T−it) .
Case 3: Ii observed, Ci unobserved, Ci ≤ 2004 (not right-censored). Then
pit = Pr(Ait = 0| Ii, Ci unobserved, Ci ≤ 2004, n f ,T−it)
=
1 , t < Ii
Pr(Ci < t| Ii, Ci unobserved, Ci ≤ 2004, n f ,T−it) , t ≥ Ii
which we estimate with
pit =
1 , t < Ii
F(Ci < t| Ii, Ci observed, Ci ≤ 2004, n f ,T−it) , t ≥ Ii .
Case 4: Ii unobserved, Ci unobserved, Ci ≤ 2004 (not right-censored). Then, for t ≤ 2004,
pit = Pr(Ait = 0| Ii unobserved, Ci unobserved, Ci ≤ 2004, n f ,T−it)= 1−Pr(Ii ≤ t ≤Ci| Ii unobserved, Ci unobserved, Ci ≤ 2004, n f ,T−it)
which we estimate with
pit = 1− F(Ii ≤ t ≤Ci| Ii observed, Ci observed, Ci ≤ 2004, n f ,T−it) .
The f th summand in (A-1) is then calculated as A f t = 1−n f
∏i=1
pit .
Remark. As indicated in the main text, our procedure for estimating the number of active facilitiesand other statistics dependent on tank status is reasonable if the true (unknown) distribution of tanks’installation and/or closure dates, given current status (2004), is conditionally independent of whether ornot the transition dates were recorded in the data. Some support for this assumption comes from ourinterview with Jan Spoor, the database manager at the Illinois office of the State Fire Marshall, whoindicated the major reason for missing date information is that her office is understaffed and the missedinformation is not considered essential (May 19, 2005). She also noted that when a tank owner or operatorreports obviously wrong information (e.g., an installation year of 2040), her office codes it as missing.This suggests that the distribution of true installation and closure dates, given tanks with identical currentstatus (in 2004), may be similar regardless of whether it was recorded in our data.
However, our analysis of the Indiana data seems to suggest there are too few old tanks among thesubgroup for which we have complete installation data. This makes statistics involving active releaserates and facility status for Indiana suspect, and is the reason we are circumspect in reporting them in thetext.
Total Number of Facilities. The total number of facilities reported by year in Figure 2 and used in thedenominator of equation (1) is the cumulative number “born” on or before year t, or
Nt = ∑ f 1(
mini at fIi ≤ t
)(A-2)
where 1(·) denotes the indicator function. The sum is over all facilities ever alive before t. If the installa-tion year Ii is unobserved for tank i at facility f , we replace the f th summand with
Pr(
mini at fIi ≤ 1|Ω f
)= 1−
n f
∏i=2
Pr(Ii > t|I−i,Ω f )Pr(I1 > t|Ω f )
where I−i denotes the event that all tanks at facility f with an index less than i were installed after yeart, or
I−i = Ii−1 > t, Ii−2 > t, . . . , I1 > t = 0.
When tank i’s installation year is unobserved, the matching procedure we use to evaluate the installationconditional probabilities qi ≡ Pr(Ii > t|I−i,Ω f ) here is analogous to the procedure for estimating tanks’active status probabilities above:

Case 1: Ci observed. (This implies Ci ≤ 2004.) Then
Pr(Ii > t|I−i,Ω f ) = Pr(Ii > t| Ii unobserved, Ci, n f ,I−i)
which we estimate with
qi =
1 , t < Ci
F(Ii > t| Ii observed, Ci, n f ,I−i) , t ≥Ci .
Case 2: Ci > 2004 (right-censored). Then, for t < 2004,
Pr(Ii > t|I−i,Ω f ) = Pr(Ii > t| Ii unobserved, Ci > 2004, n f ,I−i)
which we estimate with
qi = F(Ii > t| Ii observed, Ci > 2004, n f ,I−i) .
Case 3: Ci unobserved, Ci ≤ 2004 (not right-censored). Then
Pr(Ii > t|I−i,Ω f ) = Pr(Ii > t| Ii unobserved, Ci unobserved, Ci ≤ 2004, n f ,I−i) .
which we estimate with
qi = F(Ii > t| Ii observed, Ci observed, Ci ≤ 2004, n f ,I−i) .
Last, we set qi equal to either 1 or 0, as appropriate, if tank i’s installation year is recorded in the data. Thisis common in the data for Michigan and Illinois, less common in Indiana (Table A). The f th summand in(A-2) is then calculated as
1−n f
∏i=1
qi .
Active Release Rates. To evaluate a state’s active release rate using equation (2), the denominator re-quires the statistic in equation (A-1) and the numerator requires
# releases at active facilities in year t = ∑ f 1(R f t |A f t = 1) (A-3)
where R f t indicates a release a facility f in year t and 1(·) the indicator function. If either Ii or Ci isunobserved for a tank at facility f , we replace the f th summand in (A-3) with an estimate of Pr(R f t |A f t =1). Since A f t is not directly observed in this case, we use Bayes’ rule,
Pr(R f t |A f t = 1) =Pr(R f t)Pr(A f t)
Pr(A f t |R f t = 1) ,
which we evaluate using estimates of each term appearing on the right-hand side:
Pr(R f t |A f t = 1) =R f t
A f tAR f t ,
where A f t is the active status probability calculated earlier, R f t is observed in the data (it is either 0 or1), and AR f t = Pr(A f t |R f t = 1,Ω f ). We calculate AR f t using the same procedure for A f t described above,with one minor modification: the tank-level probabilities pit in cases 0 through 4 are calculated amongfacilities with releases only, that is, conditional on R f t = 1 at t.

REFERENCES
Akerlof, George A. and Paul M. Romer (1993). Looting: The Economic Underworld of Bankruptcy for Prof-it. Brookings Papers on Economic Activity, (2): 1-73.
ASTDR (2005). Toxicological Profile for Benzene. Agency for Toxic Substances and Disease Registry. Atlanta, GA: U.S. Public Health Service.
Benton, Charles L. (1990). Report of the Governor's Task Force on Underground Storage Tanks. Maryland State Law Library, Report # Un55:2/B/990.
Boyd, James. (1997). 'Green Money' in the Bank: Firm Responses to Environmental Financial Responsibility
Rules. Managerial and Decision Economics, 18(6): 491-506. Boyd, J. and H. C. Kunreuther (1997). Retroactive Liability or the Public Purse? Journal of Regulatory Eco-
nomics, 11: 79-90. Brown, Jeffrey R. (2008). Guaranteed Trouble: The Economic Effects of the Pension Benefit Guaranty Cor-
poration. Journal of Economic Perspectives, 22(1): 177-98. Cooper, R. and T. W. Ross (1998). Bank Runs: Liquidity Costs and Investment Distortions, Journal of Mon-
etary Economics, 41(1): 27-38. Cooper, R. and T. W. Ross (1999). Public and Private Guarantee Funds with Market Fragility. The Journal
of Risk and Insurance, 66(2):163-184. Couch, Kevin and Thomas Young (2001). Leaking Underground Storage Tanks as Point Sources of MTBE
to Groundwater. Research Report, University of California at Davis, Department of Civil and Envi-ronmental Engineering.
Cowans, D. S. (1995). State Assurance Funds Faltering: Recent Developments Cast Doubt on Reliability of
State Funds. Business Insurance, 29 (40): 3-4. Durgin, Philip B, and Thomas M. Young, Eds. (1993). Leak Detection for Underground Storage Tanks.
Philadelphia: American Society for Testing Materials. EID (1993). Environmental Information Digest (August). Edina, MN : Environnemental Information, Ltd. EPA (1995). Musts for USTs. US Environmental Protection Agency, Report #510-K-95-002. EPA (1997). State Funds in Transition: Models for Underground Storage Tank Assurance Funds. US Envi-
ronmental Protection Agency, Report #510-B-97-002. EPA (2004). Underground Storage Tanks: Building on the Past to Protect the Future. US Environmental
Protection Agency, Report #510-R-04-001. EPA (2008). Meeting Underground Storage Tank System Requirements. US Environmental Protection
Agency, Office of Underground Storage Tanks. At http://www.epa.gov/oust/ustsystm/index.htm (ac-cessed 2/13/2008).
Freeman, P. K. and H. C. Kunreuther (1997). Managing Environmental Risk through Insurance. Boston:
Kluwer Academic Publishers.
GAO (1987). Availability of Insurance for Petroleum Underground Storage Tanks. Washington, DC: Gen-
eral Accounting Office, Report GAO/T-RCED-88-9. GAO (2007). Leaking Underground Storage Tanks. Washington DC: General Accounting Office, Report
GAO-07-152. Kreiger, Gary R (2000). Accident Prevention Manual: Environmental Management, 2nd Ed. Chicago: Na-
tional Safety Council. Hopkins, S. and M. Kidd (1996). The Determinants of the Demand for Private Health Insurance Under Med-
icare. Applied Economics, 28: 1623-1632. Kareken, J. and N. Wallace (1978). Deposit Insurance and Bank Regulation: A Partial-Equilibrium Exposi-
tion. The Journal of Business, 51(3): 413-438. Jenkins, Robin, Elizabeth Kopits, and David Simpson (2006). Measuring the Social Benefits of EPA Land
Cleanup and Reuse Programs. National Center for Environmental Economics Working Paper #06-03. Washington, DC: US Environmental Protection Agency.
Meltzer, Allan H. (1967). Major Issues in the Regulation of Financial Institutions. The Journal of Political
Economy, 75 (4): 482-501. NPN (1998). AIG Environmental offers reductions for Tanknology customers. National Petroleum News,
90(12): 9. Noyes, Robert, Ed (1992). Handbook of Leak, Spill and Accidental Release Prevention. William Andrew
Publishers, Inc. PSC (1995). An Analysis of the Michigan Underground Storage Tank Financial Assurance Program: As-
sessment of Solvency, Opportunities for Cost Containment, and Future Options. Public Sector Con-sultants, Report to the Michigan Department of Environmental Quality.
Sapelli, C. and A. Torche (2001). The Mandatory Health Insurance System in Chile: Explaining the Choice
between Public and Private Insurance. International Journal of Health Care Finance and Economics, 1(2): 97- 110.
Simons, Robert A., William M Bowen, and Arthur J. Sementeilli. The Price and Liquidity Effects of UST
Leaks from Contaminated Sites. The Appraisal Journal 67(2): 186-194. Wheelock, D. and P. W. Wilson (1995). Explaining Bank Failures: Deposit Insurance, Regulation, and Effi-
ciency. The Review of Economics and Statistics, 77 (4), 689-700.

Figure 1. Difference in Overall Release Rates for Michigan – Illinois, 1990-2003
-1.0
-0.5
0.0
0.5
1.0
1.5
2.0
1990 1991 1992 1993 1994 1995 1996 1997 1998 1999 2000 2001 2002 2003
Rel
ease
s per
100
Fac
ilitie
s
Dashed lines show averages:Before 1995: +1.28After 1995: – 0.26
Figure 2. Number of Facilities and Active Facilities in Illinois and Michigan, 1986-2003
0
5
10
15
20
25
30
1986 1988 1990 1992 1994 1996 1998 2000 2002
Thou
sand
s
Michigan Active
Michigan Total
Illinois Total
Illinois Active
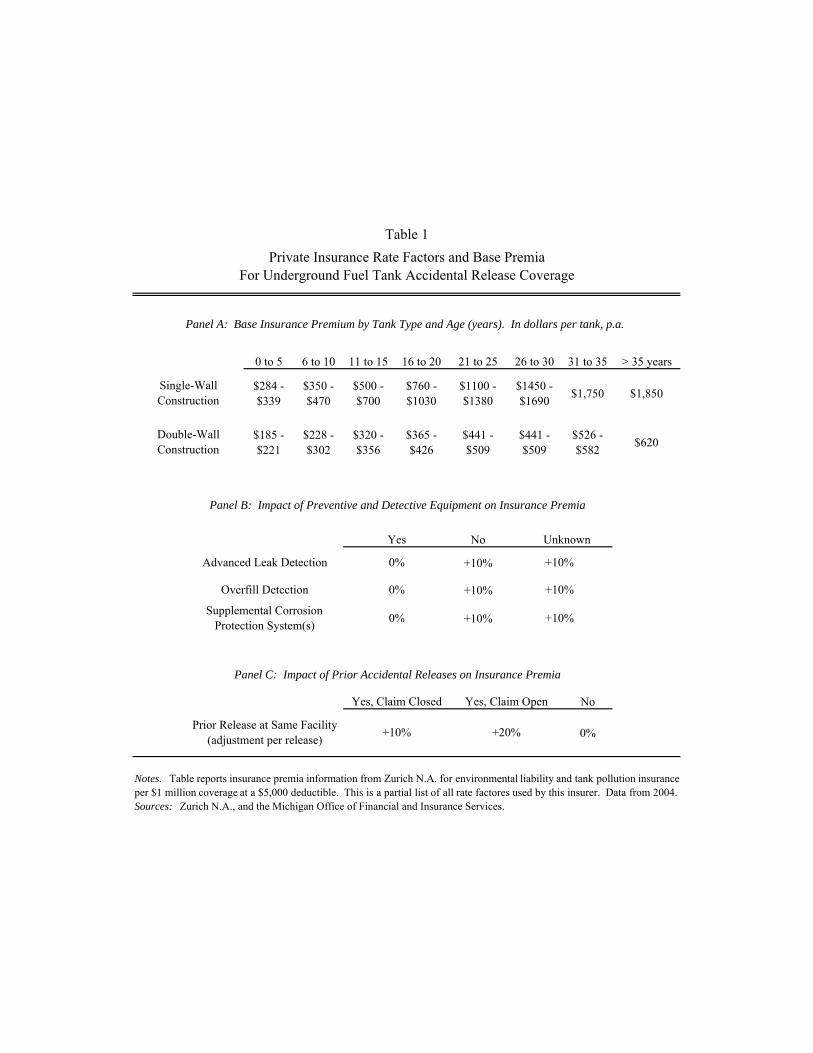
0 to 5 6 to 10 11 to 15 16 to 20 21 to 25 26 to 30 31 to 35 > 35 years
$284 - $339
$350 - $470
$500 - $700
$760 - $1030
$1100 - $1380
$1450 - $1690 $1,750 $1,850
$185 - $221
$228 - $302
$320 - $356
$365 - $426
$441 - $509
$441 - $509
$526 - $582 $620
No
+10%
+10%
+10%
No
0%
Notes. Table reports insurance premia information from Zurich N.A. for environmental liability and tank pollution insuranceper $1 million coverage at a $5,000 deductible. This is a partial list of all rate factores used by this insurer. Data from 2004.Sources: Zurich N.A., and the Michigan Office of Financial and Insurance Services.
Prior Release at Same Facility(adjustment per release)
Panel C: Impact of Prior Accidental Releases on Insurance Premia
+10% +20%
Table 1Private Insurance Rate Factors and Base Premia
For Underground Fuel Tank Accidental Release Coverage
Yes, Claim Open
Panel A: Base Insurance Premium by Tank Type and Age (years). In dollars per tank, p.a.
Yes, Claim Closed
0% +10%
0% +10%
Single-WallConstruction
Double-WallConstruction
UnknownYes
Advanced Leak Detection
Overfill Detection
Supplemental Corrosion Protection System(s)
Panel B: Impact of Preventive and Detective Equipment on Insurance Premia
0% +10%

VintageTank
MaterialPiping
ConstructionAnti-Corrosion
EquipmentOverfill
ProtectionInventory
Monitoring Insurer A Insurer B Insurer C
1997 Reinforced Fiberglass
DoubleWall N/A Yes Automated $1,350
($5K ded.)$825
($5K ded.)$1,320
($10K ded.)
1991 Coated Steel
SingleWall Yes Yes Automated $1,500
($5K ded.)$1,250
($5K ded.)$1,320
($10K ded.)
1985 BareSteel
SingleWall Yes No Manual $3,500
($10K ded.)$1,500
($5K ded.)$2,563
($10K ded.)
1975 BareSteel
SingleWall No No Manual Decline
Coverage$3,800
($5K ded.)$5,610
($10K ded.)
For Typical Tank System Configurations of Several VintagesVariation in Private Insurance Premia in 1997
Table 2
Notes. Minimum deductibles noted in parentheses (where K=1000). All tanks are single-walled construction. Anti-corrosion equipment (cathodic) appliesonly to steel tanks. Source: EPA (1997).
Tank System Attributes Insurance Premia for a 3-Tank System (1997 $)

Michigan Illinois Indiana
81.1 83.3 53.7
Growth Rate, 1990 to 2003 (p.a.) 2% 2% 2%
Number of Active Facilities, 1990 25,253 22,809 17,089
Growth Rate, 1990 to 2003 (p.a.) -7% -7% -6%
Average No. Tanks per Facility, 1990 2.8 2.7 2.4Growth Rate, 1990 to 2003 (p.a.) -0.2% 0.8% -0.4%
Average Tank Capacity (in gallons), 1990 4,428 4,732 4,248
Growth Rate, 1990 to 2003 (p.a.) 5% 4% 5%
Median Active Tank Age (in years)1990 14 11 102003 16 13 13
Table 3Facility Statistics and Trends by State
Vehicle Miles Traveled (in billions), 1990
Notes. Growth rates are average annual compound rates from 1990 to 2003. Tank-level attributes aremeans for active facilities. Sources. Authors' calculations (see text) and Highway Statistics 1990,2003, Table VM-2.
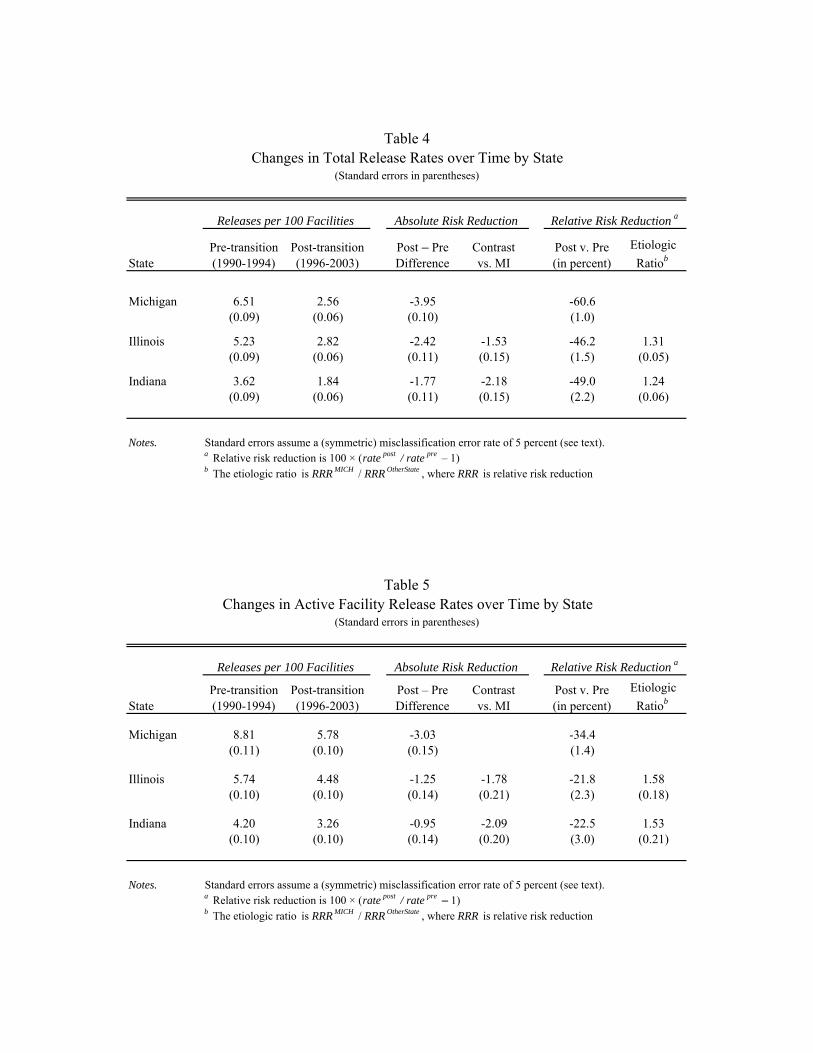
StatePre-transition (1990-1994)
Post-transition (1996-2003)
Post – PreDifference
Contrastvs. MI
Post v. Pre(in percent)
Etiologic Ratiob
Michigan 6.51 2.56 -3.95 -60.6(0.09) (0.06) (0.10) (1.0)
Illinois 5.23 2.82 -2.42 -1.53 -46.2 1.31(0.09) (0.06) (0.11) (0.15) (1.5) (0.05)
Indiana 3.62 1.84 -1.77 -2.18 -49.0 1.24(0.09) (0.06) (0.11) (0.15) (2.2) (0.06)
Notes. Standard errors assume a (symmetric) misclassification error rate of 5 percent (see text).a Relative risk reduction is 100 × (rate post / rate pre – 1)b The etiologic ratio is RRR MICH / RRR OtherState , where RRR is relative risk reduction
StatePre-transition (1990-1994)
Post-transition (1996-2003)
Post – PreDifference
Contrastvs. MI
Post v. Pre(in percent)
Etiologic Ratiob
Michigan 8.81 5.78 -3.03 -34.4(0.11) (0.10) (0.15) (1.4)
Illinois 5.74 4.48 -1.25 -1.78 -21.8 1.58(0.10) (0.10) (0.14) (0.21) (2.3) (0.18)
Indiana 4.20 3.26 -0.95 -2.09 -22.5 1.53(0.10) (0.10) (0.14) (0.20) (3.0) (0.21)
Notes. Standard errors assume a (symmetric) misclassification error rate of 5 percent (see text).a Relative risk reduction is 100 × (rate post / rate pre – 1)b The etiologic ratio is RRR MICH / RRR OtherState , where RRR is relative risk reduction
(Standard errors in parentheses)
Releases per 100 Facilities Relative Risk Reduction aAbsolute Risk Reduction
Table 4Changes in Total Release Rates over Time by State
(Standard errors in parentheses)
Changes in Active Facility Release Rates over Time by StateTable 5
Releases per 100 Facilities Absolute Risk Reduction Relative Risk Reduction a

StatePre-transition(1990-1994)
Post-transition(1996-2003)
Post – PreDifference
Contrastvs. MI
Post v. Pre(in percent)
EtiologicRatiob
Michigan 8.08 3.51 -4.57 -56.6n = 6985 (0.18) (0.12) (0.21) (1.7)
Illinois 6.27 3.72 -2.55 -2.02 -40.6 1.39n = 4103 (0.22) (0.15) (0.26) (0.34) (3.2) (0.12)
Indiana 6.04 3.84 -2.20 -2.37 -36.4 1.55n = 2606 (0.27) (0.19) (0.33) (0.42) (4.3) (0.19)
Notes. Standard errors assume a (symmetric) misclassification error rate of 5 percent (see text).a Relative risk reduction is 100 × (rate post / rate pre – 1)b The etiologic ratio is RRR MICH / RRR OtherState , where RRR is relative risk reduction
Table 6Release Rates at Continuously-Operated Facilities 1990-2003
(Standard errors in parentheses)
Releases per 100 Facilities Absolute Risk Reduction Relative Risk Reduction a
Michigan Illinois Indiana MI / IL Ratio MI / IN Ratio(1) (2) (3) (4) (5)
Pre (1990-1994) 3.6 2.9 3.0 1.2 1.2Post (1996-2003) 3.1 2.9 3.1 1.1 1.0
Percent change -16% -1% 3% -15% -18%
Pre (1990-1994) 1.0 0.5 0.6 1.9 1.7Post (1996-2003) 1.0 0.7 0.7 1.5 1.5
Percent change 0% 31% 15% -23% -13%
Notes. Figures are annual averages. Percentages calculated before rounding.
Panel B: Active Tanks Over 20 Years Old per Facility
Number of Tanks in Serviceat Continuously-Operated Facilities, 1990-2003
Panel A: Active Tanks per Facility
Table 7

Release Rates at Attriting FacilitiesTable 8
(S b l f f iliti l d b 2004 R l 100 ti f iliti )
Michigan Illinois Indiana MI / IL ratio MI / IN ratio(1) (2) (3) (4) (5)
Overall Rate, 1990-2003 18.11 10.07 13.67 1.8 1.3
(Subsample of facilities closed by 2004. Releases per 100 active facilities)
Pre-transition (1990-1994) 9.89 5.86 5.37 1.7 1.8
Post-transition (1996-2003) 24.25 13.41 19.59 1.8 1.2
Figures are annual averages for each period.
Michigan Indiana
91 - 95 91 - 95
21 6
Every 3 years Every 3 years
30 - 40% 10 - 20 %
Source: Government Accounting Office (2000)
Table 10Regulatory Compliance and Inspection Rates by State
30 - 40 %
Number of full-time employees that conduct field UST inspections
Frequency of state UST inspections(nominally)
Fraction of tanks inspected annually(actual)
Illinois
91 - 95
23
Every 2 years
Percent of active tanks with required leak detection equipment installed

All Attritants Stayers Entrants Unknowna
(1) (2) (3) (4) (5)
Panel A: Absolute Risk Reduction by Group, Post 1995 – Pre 1995. Rate per 100 facilities.
Michigan -3.95 -4.63 -4.57 0.31 -2.98Illinois -2.42 -3.19 -2.55 0.06 -1.18Indiana -1.77 -1.70 -2.20 0.17 -2.49
Panel B: Contribution of Each Group to Total Risk Reduction by State. Rate per 100 facilities.
Michigan -3.95 -2.70 -1.21 0.01 -0.05Illinois 2 42 1 91 0 42 0 00 0 08
Table 9Decomposition of Absolute Risk Reduction by Facility Duration Status 1990-2003
Illinois -2.42 -1.91 -0.42 0.00 -0.08Indiana -1.77 -1.03 -0.30 0.01 -0.43
Panel C: Decomposition of 'Excess' Absolute Risk Reduction in Michigan by Group
Michigan – Illinois 51% 51% -1% -2%
Michigan – Indiana 76% 42% 0% -17%
Notes. a. "Unknown" are facilities operational in 2004 but that cannot be definitively classified as entrantsor as stayers from 1990-2003 due to missing installation year data. These are 2% (MI), 7% (IL), and17% (IN) of each state's total (active and closed) facilities.
b. Panels A and B decompose equation (5) in the text: A reports conditional release rate changes∆P(R ft | group ), and B reports share-weighted changes, s group × ∆P(R ft | group ).
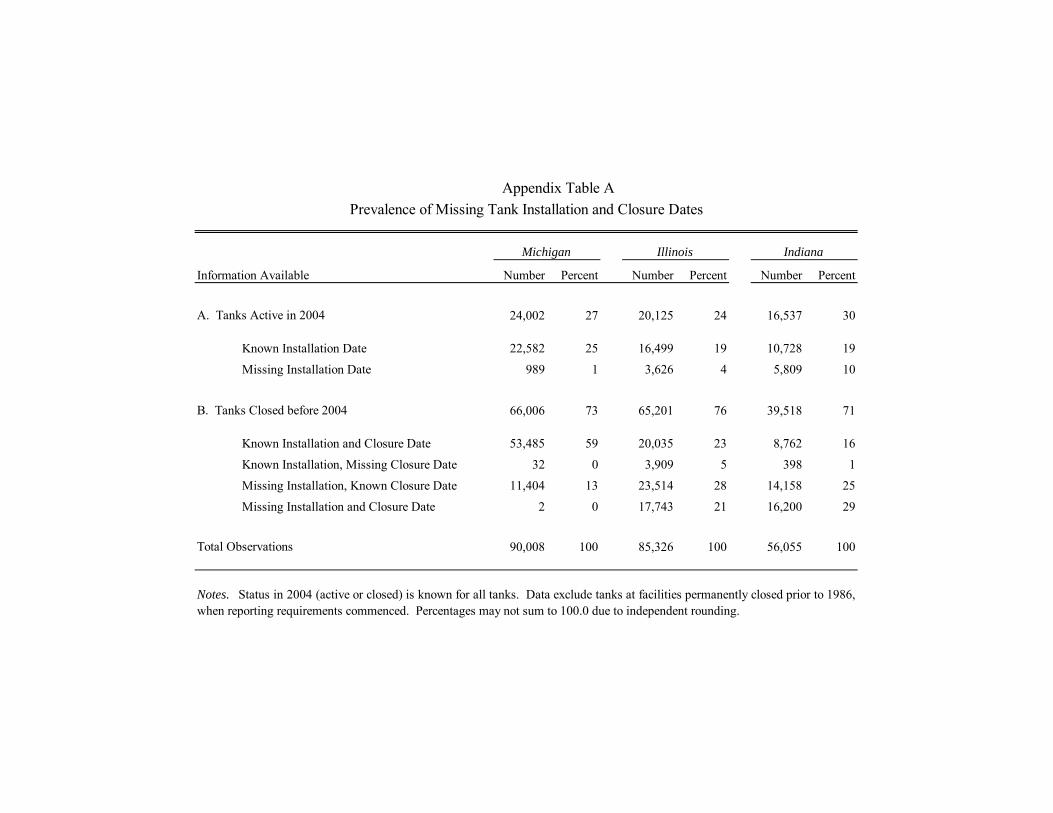
Information Available Number Percent Number Percent Number Percent
24,002 27 20,125 24 16,537 30
Known Installation Date 22,582 25 16,499 19 10,728 19
Missing Installation Date 989 1 3,626 4 5,809 10
66,006 73 65,201 76 39,518 71
Known Installation and Closure Date 53,485 59 20,035 23 8,762 16
Known Installation, Missing Closure Date 32 0 3,909 5 398 1
Missing Installation, Known Closure Date 11,404 13 23,514 28 14,158 25
Missing Installation and Closure Date 2 0 17,743 21 16,200 29
90,008 100 85,326 100 56,055 100
Notes. Status in 2004 (active or closed) is known for all tanks. Data exclude tanks at facilities permanently closed prior to 1986,when reporting requirements commenced. Percentages may not sum to 100.0 due to independent rounding.
Appendix Table APrevalence of Missing Tank Installation and Closure Dates
Michigan Illinois Indiana
A. Tanks Active in 2004
Total Observations
B. Tanks Closed before 2004