national bureau of statistics office of chief government ... · the united republic of tanzania...
TRANSCRIPT

The United Republic of Tanzania
Basic Demographic and Socio-Economic Profile
Statistical Tables
Tanzania Mainland
and
April, 2014
Office of Chief Government Statistician
Ministry of State, President’s Office, State
House and Good Governance
Zanzibar
National Bureau of Statistics
Ministry of Finance
Dar es Salaam

i
Contents
Chapter One .................................................................................................................................. 1
Population Growth, Size and Distribution .................................................................................. 1
Chapter Two .................................................................................................................................. 4
Age and Sex Profile ....................................................................................................................... 4
Chapter Three ............................................................................................................................. 18
Household Composition .............................................................................................................. 18
Chapter Four ............................................................................................................................... 23
Marital Status ................................................................................................................................ 23
Chapter Five ................................................................................................................................ 30
Citizenship and Birth Registration ............................................................................................. 30
Chapter Six .................................................................................................................................. 36
Survival of Parents (Orphan hood) ............................................................................................. 36
Chapter Seven ............................................................................................................................. 45
Diaspora ........................................................................................................................................ 45
Chapter Eight .............................................................................................................................. 51
Literacy and Education ................................................................................................................ 51
Chapter Nine ............................................................................................................................... 89
Economic Activity ........................................................................................................................ 89
Chapter Ten ............................................................................................................................... 120
Disability ..................................................................................................................................... 120
Chapter Eleven.......................................................................................................................... 127
Housing Conditions; Household Assets and Amenities ........................................................ 127
Chapter Twelve ......................................................................................................................... 148
Agriculture and Livestock ......................................................................................................... 148

i
List of Tables
Table 1.1: Enumerated Population by Record Type, Rural and Urban Areas; Tanzania
Mainland, 2012 Census ------------------------------------------------------------------------ 2
Table 1.2: Enumerated Population by Record Type and Sex; Tanzania Mainland, 2012 Census 2
Table 1. 3: Population Distribution by Region, Rural and Urban Areas; Tanzania Mainland,
2012 Census ------------------------------------------------------------------------------------- 3
Table 2.1: Population Distribution by Five Year Age Group and Sex; Tanzania Mainland , 2012
Census -------------------------------------------------------------------------------------------- 5
Table 2.2: Population Distribution by Five Year Age Group and Sex; Tanzania Mainland Rural,
2012 Census ------------------------------------------------------------------------------------- 6
Table 2. 3: Population Distribution by Five Year Age Group and Sex; Tanzania Mainland
Urban, 2012 Census ---------------------------------------------------------------------------- 7
Table 2.4: Population Distribution of Key Age Groups; Tanzania Mainland, 2012 Census ------ 8
Table 2.5: Distribution of Young Population (0 - 14 Years) by Region; Tanzania Mainland,
2012 Census ------------------------------------------------------------------------------------- 9
Table 2.6: Distribution of Youth Population (15 - 24 Years) by Region; Tanzania Mainland,
2012 Census ------------------------------------------------------------------------------------ 10
Table 2.7: Distribution of Youth Population (15 - 35 Years) by Region; Tanzania Mainland,
2012 Census ------------------------------------------------------------------------------------ 11
Table 2.8: Distribution of Primary School Age Population (7 - 13 Years) by Region; Tanzania
Mainland, 2012 Census ----------------------------------------------------------------------- 12
Table 2.9: Distribution of Secondary School Age Population (14 - 17 Years); Tanzania
Mainland, 2012 Census ----------------------------------------------------------------------- 13
Table 2.10: Distribution of Working Age Population (15 - 64 Years) by Region; Tanzania
Mainland, 2012 Census ----------------------------------------------------------------------- 14
Table 2.11: Distribution of Elderly Population (60+ Years) by Region; Tanzania Mainland, 2012
Census ------------------------------------------------------------------------------------------- 15
Table 2.12: Distribution of Elderly Population (65+ Years) by Region; Tanzania Mainland, 2012
Census ------------------------------------------------------------------------------------------- 16
Table 2.13: Distribution of Dependent Population (0 - 14 and 65+ Years) by Region; Tanzania
Mainland, 2012 Census ----------------------------------------------------------------------- 17
Table 3.1: Total Number of Private Households in Rural and Urban Areas by Age and Sex of
Head of Household; Tanzania Mainland, 2012 Census ---------------------------------- 19

ii
Table 3.2: Distribution of Private Households by Region, Rural and Urban Areas; Tanzania
Mainland, 2012 Census ----------------------------------------------------------------------- 20
Table 3. 3: Population Size, Number of Private Households and Average Household Size;
Tanzania Mainland, 2012 Census ----------------------------------------------------------- 21
Table 3. 4: Number of Private Households and Average Size of Households by Sex of
Household Head and Region; Tanzania Mainland, 2012 Census ----------------------- 22
Table 4.1: Total Population Aged 15 Years and Above by Five Year Age Group and Marital
Status; Tanzania Mainland, 2012 Census -------------------------------------------------- 24
Table 4.2: Total Male Population Aged 15 Years and Above by Five Year Age Group and
Marital Status; Tanzania Mainland, 2012 Census ----------------------------------------- 24
Table 4.3: Total Female Population Aged 15 Years and Above by Five Year Age Group and
Marital Status; Tanzania Mainland, 2012 Census ----------------------------------------- 25
Table 4.4: Total Population Aged 15 Years and Above by Five Year Age Group and Marital
Status; Tanzania Mainland Rural, 2012 Census ------------------------------------------- 25
Table 4.5: Total Male Population Aged 15 Years and Above by Five Year Age Group and
Marital Status; Tanzania Mainland Rural, 2012 Census --------------------------------- 26
Table 4.6: Total Female Population Aged 15 Years and Above by Five Year Age Group and
Marital Status; Tanzania Mainland Rural, 2012 Census --------------------------------- 26
Table 4.7: Total Population Aged 15 Years and Above by Five Year Age Group and Marital
Status; Tanzania Mainland Urban, 2012 Census ------------------------------------------ 27
Table 4.8: Total Male Population Aged 15 Years and Above by Five Year Age Group and
Marital Status; Tanzania Mainland Urban, 2012 Census -------------------------------- 27
Table 4.9: Total Female Population Aged 15 Years and Above by Five Year Age Group and
Marital Status; Tanzania Mainland Urban, 2012 Census -------------------------------- 28
Table 4.10: Total Population Aged 15 Years and Above by Region and Marital Status; Tanzania
Mainland, 2012 Census ----------------------------------------------------------------------- 29
Table 5.1: Distribution of Enumerated Population by Citizenship, Sex, Rural and Urban;
Tanzania Mainland, 2012 Census ----------------------------------------------------------- 31
Table 5. 2: Population Distribution by Status of Birth Certificate, Five Year Age Group and Sex;
Tanzania Mainland, 2012 Census ----------------------------------------------------------- 32
Table 5. 3: Population Distribution by Status of Birth Certificate, Five Year Age Group and Sex;
Tanzania Mainland Rural, 2012 Census ---------------------------------------------------- 33
Table 5. 4: Population Distribution by Status of Birth Certificate, Five Year Age Group and Sex;
Tanzania Mainland Urban, 2012 Census --------------------------------------------------- 34
iii
Table 5. 5: Population Distribution by Status of Birth Certificate, Region and Sex; Tanzania
Mainland, 2012 Census. ----------------------------------------------------------------------- 35
Table 6.1: Population Distribution by Selected Age Groups and Survival of Parents; Tanzania
Mainland, 2012 Census ----------------------------------------------------------------------- 37
Table 6.2: Male Population by Selected Age Groups and Survival of Parents; Tanzania
Mainland, 2012 Census ----------------------------------------------------------------------- 37
Table 6.3: Female Population by Selected Age Groups and Survival of Parents; Tanzania
Mainland, 2012 Census ----------------------------------------------------------------------- 37
Table 6.4: Population Distribution by Selected Age Groups and Survival of Parents; Tanzania
Mainland Rural, 2012 Census ---------------------------------------------------------------- 38
Table 6.5: Population Distribution by Selected Age Groups and Survival of Parents; Tanzania
Mainland Urban, 2012 Census --------------------------------------------------------------- 38
Table 6.6: Population of Children below 18 Years of Age by Survival of Parents and Region;
Tanzania Mainland, 2012 Census ----------------------------------------------------------- 39
Table 6.7: Male Children below 18 Years of Age by Survival Status of Parents and Region;
Tanzania Mainland, 2012 Census ----------------------------------------------------------- 40
Table 6.8: Female Children below 18 Years of Age by Survival of Parents and Region;
Tanzania Mainland, 2012 Census ----------------------------------------------------------- 41
Table 6.9: Population of Children Age below 18 Years of Age by Survival Status of Parents and
Region; Tanzania Mainland Rural, 2012 Census ------------------------------------------ 42
Table 6.10: Population of Children below 18 Years of Age by Survival Status of Parents and
Region; Tanzania Mainland Urban, 2012 Census ----------------------------------------- 43
Table 6.11: Distribution of Children below 18 Years of Age by Survival of Parents and Region;
Tanzania Mainland, 2012 Census ----------------------------------------------------------- 44
Table 7.1: Number of Households with Diaspora by Region; Tanzania Mainland, 2012 Census
---------------------------------------------------------------------------------------------------- 46
Table 7. 2: Number of Households with Diaspora by Number of Persons Living Abroad and
Region; Tanzania Mainland, 2012 Census ------------------------------------------------- 47
Table 7.3: Number of Persons Living Outside Tanzania by Place of Origin (Rural and Urban
Areas); Tanzania Mainland, 2012 Census -------------------------------------------------- 48
Table 7.4: Number Persons Living Outside Tanzania by Country of Residence and Sex;
Tanzania Mainland, 2012 Census ----------------------------------------------------------- 49
Table 7.5: Diaspora and Persons Sending Remittance from Abroad by Country of Residence;
Tanzania Mainland, 2012 Census ----------------------------------------------------------- 50

iv
Table 8.1: Distribution of Population Aged Five Years and Above by Five Year Age Group and
Literacy Status; Tanzania Mainland, 2012 Census ---------------------------------------- 52
Table 8.2: Distribution of Population Aged Five Years and Above by Five Year Age Group and
Literacy Status; Tanzania Mainland Rural, 2012 Census -------------------------------- 52
Table 8.3: Distribution of Population Aged Five Years and Above by Five Year Age Group and
Literacy Status; Tanzania Mainland Urban, 2012 Census ------------------------------- 53
Table 8.4: Distribution of Male Population Aged Five Years and Above by Five Year Age
Group and Literacy Status; Tanzania Mainland , 2012 Census ------------------------- 53
Table 8.5: Distribution of Male Population Aged Five Years and Above by Five Year Age
Group and Literacy Status; Tanzania Mainland Rural, 2012 Census ------------------ 54
Table 8.6: Distribution of Male Population Aged Five Years and Above by Five Year Age
Group and Literacy Status; Tanzania Mainland Urban, 2012 Census ------------------ 54
Table 8.7: Distribution of Female Population Aged Five Years and Above by Five Year Age
Group and Literacy Status; Tanzania Mainland, 2012 Census -------------------------- 55
Table 8.8: Distribution of Female Population Aged Five Years and Above by Five Year Age
Group and Literacy Status; Tanzania Mainland Rural, 2012 Census ------------------ 55
Table 8.9: Distribution of Female Population Aged Five Years and Above by Five Year Age
Group and Literacy Status; Tanzania Mainland Urban, 2012 Census ------------------ 56
Table 8.10: Total Population Aged Five Years and Above by Age Group and School Attendance
Status; Tanzania Mainland, 2012 Census -------------------------------------------------- 57
Table 8.11: Total Population Aged Five Years and Above by Age Group and School Attendance
Status; Tanzania Mainland Rural, 2012 Census ------------------------------------------- 58
Table 8.12: Total Population Aged Five Years and Above by Age Group and School Attendance
Status; Tanzania Mainland Urban, 2012 Census ------------------------------------------ 59
Table 8.13: Distribution of Male Population Aged Five Years and Above by Age Group and
School Attendance Status; Tanzania Mainland, 2012 Census --------------------------- 60
Table 8.14: Distribution of Female Population Aged Five Years and Above by Age Group and
School Attendance Status; Tanzania Mainland, 2012 Census --------------------------- 61
Table 8.15: Distribution of Male Population Aged Five Years and Above by Age Group and
School Attendance Status; Tanzania Mainland Rural, 2012 Census ------------------- 62
Table 8.16: Distribution of Female Population Aged Five Years and Above by Age Group and
School Attendance Status; Tanzania Mainland Rural, 2012 Census ------------------ 63
Table 8.17: Distribution of Male Population Aged Five Years and Above by Age Group and
School Attendance Status; Tanzania Mainland Urban, 2012 Census ------------------ 64

v
Table 8.18: Distribution of Female Population Aged Five Years and Above by Age Group and
School Attendance Status; Tanzania Mainland Urban, 2012 Census ------------------ 65
Table 8.19: Distribution of Population Aged Five Years and Above Attending School by Age
and Level of Attending; Tanzania Mainland, 2012 Census ------------------------------ 66
Table 8.20: Distribution of Population Aged Five Years and Above Attending School by Age and
Level of Attending; Tanzania Mainland Rural, 2012 Census --------------------------- 67
Table 8.21: Distribution of Population Aged Five Years and Above Attending School by Age and
Level of Attending; Tanzania Mainland Urban, 2012 Census -------------------------- 68
Table 8.22: Distribution of Male Population Aged Five Years and Above Attending School by
Age and Level of Attending; Tanzania Mainland, 2012 Census ------------------------ 69
Table 8.23: Distribution of Female Population Aged Five Years and Above Attending School by
Age and Level of Attending; Tanzania Mainland, 2012 Census ------------------------ 70
Table 8.24: Distribution of Male Population Aged Five Years and Above Attending School by
Age and Level of Attending; Tanzania Mainland Rural, 2012 Census ---------------- 71
Table 8.25: Distribution of Female Population Aged Five Years and Above Attending School by
Age and Level of Attending; Tanzania Mainland Rural, 2012 Census ---------------- 72
Table 8.26: Distribution of Male Population Aged Five Years and Above Attending School by
Age and Level of Attending; Tanzania Mainland Urban, 2012 Census---------------- 73
Table 8.27: Distribution of Female Population Aged Five Years and Above Attending School by
Age and Level of Attending; Tanzania Mainland Urban, 2012 Census---------------- 74
Table 8.28: Distribution of Population Aged Five Years and Above Who Completed School by
Age and Level Attained; Tanzania Mainland, 2012 Census ----------------------------- 75
Table 8.29: Distribution of Population Aged Five Years and above who Completed School by
Age and Level attained; Tanzania Mainland Rural, 2012 Census ---------------------- 76
Table 8.30: Distribution of Population Aged Five Years and above who Completed School by
Age and Level attained; Tanzania Mainland Urban, 2012 Census --------------------- 77
Table 8.31:Distribution of Male Population Aged Five Years and above who Completed School
by Age and Level attained; Tanzania Mainland, 2012 Census -------------------------- 78
Table 8.32: Distribution of Female Population Aged Five Years and above who Completed
School by Age and Level attained; Tanzania Mainland, 2012 Census ----------------- 79
Table 8.33: Distribution of Male Population Aged Five Years and above who Completed School
by Age and Level attained; Tanzania Mainland Rural, 2012 Census ------------------ 80
Table 8.34: Distribution of Female Population Aged Five Years and above who Completed
School by Age and Level attained; Tanzania Mainland Rural, 2012 Census --------- 81

vi
Table 8.35: Male Population Aged Five Years and above who Completed School by Age and
Level attained; Tanzania Mainland Urban, 2012 Census -------------------------------- 82
Table 8.36: Female Population Aged Five Years and above who Completed School by Age and
Level attained; Tanzania Mainland Urban, 2012 Census -------------------------------- 83
Table 8.37: Distribution Population Aged Five Years and above who Dropped Out of School by
Age and Level Attained; Tanzania Mainland, 2012 Census ----------------------------- 84
Table 8.38: Distribution of Population Aged Five Years and above who Dropped Out of School
by Age and Level Attained; Tanzania Mainland Rural, 2012 Census ------------------ 85
Table 8.39: Distribution of Population Aged Five Years and above who Dropped Out of School
by Age and Level Attained; Tanzania Mainland Urban, 2012 Census ----------------- 86
Table 8.40: Distribution of Male Population Aged Five Years and above who Dropped Out of
School by Age and Level Attained; Tanzania Mainland Males, 2012 Census -------- 87
Table 8.41: Distribution of Female Population Aged Five Years and above who Dropped Out of
School by Age and Level Attained; Tanzania Females, 2012 Census ----------------- 88
Table 9.1: Distribution of Population Aged 10 Years and Above by Five Year Age Group and
Type of Usual Activity; Tanzania Mainland, 2012 Census ------------------------------ 90
Table 9.2: Distribution of Population Aged 10 Years and Above by Five Year Age Group and
Type of Usual Activity; Tanzania Mainland Rural, 2012 Census ---------------------- 90
Table 9.3: Distribution of Population Aged 10 Years and Above by Five Year Age Group and
Type of Usual Activity; Tanzania Mainland Urban, 2012 Census --------------------- 91
Table 9.4: Distribution of Male Population Aged 10 Years and Above by Five Year Age Group
and Type of Usual Activity; Tanzania Mainland, 2012 Census ------------------------- 91
Table 9.5: Distribution of Female Population Aged 10 Years and Above by Five Year Age
Group and Type of Usual Activity; Tanzania Mainland, 2012 Census ---------------- 92
Table 9.6: Distribution of Population Aged 10 Years and Above by Type of Usual Economic
Activity (Last 12 Months) and Region; Tanzania Mainland, 2012 Census ----------- 93
Table 9.7: Distribution of Population Aged 10 Years and Above by Five Year Age Group and
Type of Current Activity; Tanzania Mainland, 2012 Census ---------------------------- 94
Table 9.8: Distribution of Population Aged 10 Years and Above by Five Year Age Group and
Type of Current Activity; Tanzania Mainland Rural, 2012 Census -------------------- 94
Table 9.9: Distribution of Population Aged 10 Years and Above by Five Year Age Group and
Type of Current Activity; Tanzania Mainland Urban, 2012 Census ------------------- 95
Table 9.10: Distribution of Male Population Aged 10 Years and Above by Five Year Age Group
and Type of Current Activity; Tanzania Mainland, 2012 Census----------------------- 95
vii
Table 9.11: Distribution of Female Population Aged 10 Years and Above by Five Year Age
Group and Type of Current Activity; Tanzania Mainland, 2012 Census -------------- 96
Table 9.12: Distribution of Population Aged 10 Years and Above by Type of Current Activity
(Last 7 Days) and Region; Tanzania Mainland, 2012 Census --------------------------- 97
Table 9.13: Distribution of Employed Population Aged 10 Years and Above by Five Year Age
Group and Employment Status; Tanzania Mainland, 2012 Census -------------------- 98
Table 9.14: Distribution of Employed Population Aged 10 Years and Above by Five Year Age
Group and Employment Status; Tanzania Mainland Rural, 2012 Census ------------- 98
Table 9.15: Distribution of Employed Population Aged 10 Years and Above by Five Year Age
Group and Employment Status; Tanzania Mainland Urban, 2012 Census ------------ 99
Table 9.16: Distribution of Male Employed Population Aged 10 Years and Above by Five Year
Age Group and Employment Status; Tanzania Mainland, 2012 Census --------------- 99
Table 9.17: Distribution of Female Population Aged 10 Years and Above by Five Year Age
Group and Employment Status; Tanzania Mainland, 2012 Census ------------------ 100
Table 9.18: Distribution of Employed Population Aged 10 Years and Above by Employment
Status and Region; Tanzania Mainland, 2012 Census ---------------------------------- 101
Table 9.19: Distribution of Employed Population Aged 10 Five Years and Above by Five Year
Age Group and Main Occupation; Tanzania Mainland, 2012 Census --------------- 102
Table 9.20: Distribution of Employed Population Aged 10 Years and Above by Five Year Age
Group and Main Occupation; Tanzania Mainland Rural, 2012 Census -------------- 103
Table 9.21: Distribution of Employed Population Aged 10 Years and Above by Five Year Age
Group and Main Occupation; Tanzania Mainland Urban, 2012 Census ------------- 104
Table 9.22: Distribution of Employed Male Population Aged 10 Years and Above by Five Year
Age Group and Main Occupation; Tanzania Mainland, 2012 Census --------------- 105
Table 9.23: Distribution of Employed Female Population Aged 10 Years and Above by Five
Year Age Group and Main Occupation; Tanzania Mainland, 2012 Census --------- 106
Table 9.24: Distribution of Employed Population Aged 10 Years and Above by Five Year Age
Group, Main Occupation and Region; Tanzania Mainland, 2012 Census ----------- 107
Table 9.25: Distribution of Employed Population Aged 10 Years and Above by Five Year Age
Group and Main Industry; Tanzania Mainland, 2012 Census ------------------------- 108
Table 9.26: Distribution of Employed Population Aged 10 Years and Above by Five Year Age
Group and Main Industry; Tanzania Mainland Rural, 2012 Census ----------------- 109
Table 9.27: Distribution of Employed Population Aged 10 Years and Above by Five Year Age
Group and Main Industry; Tanzania Mainland Urban, 2012 Census ----------------- 110
viii
Table 9.28: Distribution of Employed Male Population Aged 10 Years and Above by Five Year
Age Group and Main Industry; Tanzania Mainland, 2012 Census ------------------- 111
Table 9.29: Distribution of Employed Female Population Aged 10 Years and Above by Five
Year Age Group and Main Industry; Tanzania Mainland, 2012 Census------------- 112
Table 9.30: Employed Population Aged 10 Years and Above by Five Year Age Group and Main
Industry and Region; Tanzania Mainland, 2012 Census ------------------------------- 113
Table 9.31: Distribution of Employed Population Aged 10 Years and Above by Occupation and
Employment Status; Tanzania Mainland, 2012 Census -------------------------------- 115
Table 9.32: Distribution of Employed Population Aged 10 Years and Above by Occupation and
Employment Status; Tanzania Mainland Rural, 2012 Census ------------------------- 116
Table 9.33: Distribution of Employed Population Aged 10 Years and Above by Occupation and
Employment Status; Tanzania Mainland Urban, 2012 Census ------------------------ 117
Table 9.34: Distribution of Employed Male Population Aged 10 Years and Above by
Occupation and Employment Status; Tanzania Mainland, 2012 Census ------------ 118
Table 9.35: Distribution of Employed Female Population Aged 10 Years and Above by
Occupation and Employment Status; Tanzania Mainland, 2012 Census ------------ 119
Table 10.1: Number of Persons with Disability by Type of Disability and Region; Tanzania
Mainland, 2012 Census --------------------------------------------------------------------- 121
Table 10.2: Number of Persons with Albinism by Five Year Age Group and Sex; Tanzania
Mainland, 2012 Census --------------------------------------------------------------------- 122
Table 10.3: Number of Persons with Albinism by Five Year Age Group and Sex; Tanzania
Mainland Rural, 2012 Census -------------------------------------------------------------- 122
Table 10.4: Number of Persons with Albinism by Five Year Age Group and Sex; Tanzania
Mainland Urban, 2012 Census ------------------------------------------------------------- 123
Table 10.5: Distribution of Disabled Population by Sex, 10 Year Age Group , Sex and Type of
Disability; Tanzania Mainland, 2012 Census -------------------------------------------- 124
Table 10.6: Distribution of Disabled Population by Sex, 10 Year Age Group, Sex and Type of
Disability; Tanzania Mainland Rural, 2012 Census ------------------------------------ 124
Table 10.7: Distribution of Disabled Population by 10 Year Age Group, Sex and Type of
Disability; Tanzania Mainland Urban, 2012 Census ------------------------------------ 125
Table 10.8: Population by Type of Disability, Sex and Level of Difficulty; Tanzania Mainland,
2012 Census ---------------------------------------------------------------------------------- 125
Table 10.9: Population by Type of Disability, Sex and Level of Difficulty; Tanzania Mainland
Rural, 2012 Census -------------------------------------------------------------------------- 126

ix
Table 10.10:Population by Type of Disability, Sex and Level of Difficulty; Tanzania Mainland
Urban 2012 Census -------------------------------------------------------------------------- 126
Table 11.1: Number of Households in Rural and Urban Areas by Ownership Status of the Main
Dwelling; Tanzania Mainland, 2012 Census --------------------------------------------- 128
Table 11.2: Number of Households by Tenure Status of the Main Dwelling and Age; Tanzania
Mainland, 2012 Census --------------------------------------------------------------------- 128
Table 11.3: Number of Households by Type of Legal Right over the Ownership of the Land
where the Main Dwelling is Built and Region; Tanzania Mainland, 2012 Census - 129
Table 11.4: Number of Households by Region and Type of Materials Used for Roofing; Tanzania
Mainland, 2012 Census --------------------------------------------------------------------- 130
Table 11.5: Number of Households by Region and Main Materials Used for Flooring; Tanzania
Mainland, 2012 Census --------------------------------------------------------------------- 131
Table 11.6: Number of Households by Region and Type of Wall Materials Used; Tanzania
Mainland, 2012 Census --------------------------------------------------------------------- 132
Table 11.7: Number of Households by Number of Rooms for Sleeping and Region; Tanzania
Mainland, 2012 Census --------------------------------------------------------------------- 133
Table 11.8: Number of Households by Region and Main Source of Drinking Water; Tanzania
Mainland, 2012 Census --------------------------------------------------------------------- 134
Table 11.9: Number of Households by Region and Main Source of Energy for Lighting;
Tanzania Mainland, 2012 Census --------------------------------------------------------- 136
Table 11.10:Number of Households by Region and Main Source of Energy for Cooking;
Tanzania Mainland, 2012 Census --------------------------------------------------------- 138
Table 11.11:Number of Households by Region and Type of Toilet Facility; Tanzania Mainland,
2012 Census ---------------------------------------------------------------------------------- 140
Table 11.12:Number of Households by Type of Refuse Disposal and Region; Tanzania
Mainland, 2012 Census --------------------------------------------------------------------- 142
Table 11.13:Number of Households by Type of Assets Owned, Sex of the Household Head and
Region; Tanzania Mainland, 2012 Census ----------------------------------------------- 143
Table 11.14:Number of Households with Members of Social Security Schemes by Region;
Tanzania Mainland, 2012 Census --------------------------------------------------------- 147
Table 12.1: Number of Households Engaged in Agriculture during 2011/12 Agricultural Year by
Region, Rural and Urban Areas; Tanzania Mainland, 2012 Census ------------------ 149
Table 12.2: Total Number of Households Growing Maize, Paddy, Cassava, Banana and Other
Crops during 2011/12 Agricultural Year by Region, Rural and Urban Areas;
Tanzania Mainland, 2012 Census --------------------------------------------------------- 150
x
Table 12.3: Number of Households Growing Maize and Paddy during the 2011/12 Agricultural
Year by Region, Rural and Urban Areas; Tanzania Mainland, 2012 Census ------- 151
Table 12.4: Number of Households Keeping Cattle, Goats, Sheep, and Poultry during 2011/12
Agricultural Year by Region, Rural and Urban Areas; Tanzania Mainland, 2012
Census ----------------------------------------------------------------------------------------- 152
Table 12.5: Number of Households Keeping Cattle, Sheep, Goats, Poultry during 2011/12
Agricultural Year by Region, Rural and Urban Areas; Tanzania Mainland, 2012
Census ----------------------------------------------------------------------------------------- 153
Table 12.6: Number of Households Keeping Cattle, Sheep, Goats or Chicken by Region and Sex
of the Household head; Tanzania Mainland, 2012 Census----------------------------- 154
Table 12.7: Number of Cattle, Goats, Sheep and Poultry Kept by Private Households as of 26th
August 2012 by Region and Sex of the Household Head Tanzania Mainland, 2012
Census ----------------------------------------------------------------------------------------- 155
Table 12.8: Number of Cattle, Sheep, Goats and Poultry Kept by Private Households as of 26th
August 2012 by Region Rural and Urban Areas, Tanzania Mainland, 2012 Census
-------------------------------------------------------------------------------------------------- 156
Table 12.9: Number of Households Involved in Fish Farming by Region by Rural and Urban
Areas; Tanzania Mainland, 2012 Census ------------------------------------------------- 157

1
Chapter One
Population Growth, Size and Distribution
Tables in this chapter show the distribution of the total population by record type,
sex, urban and rural areas.

2
Table 1.1: Enumerated Population by Record Type, Rural and Urban Areas; Tanzania Mainland, 2012 Census
Record Type Total Rural Urban
Tanzania Mainland 43,625,354 30,924,116 12,701,238
Private Households 42,764,449 30,410,180 12,354,269
Special Institutions 35,465 18,145 17,320
Inmates Institutions 33,502 5,830 27,672
Hotel and Tourist Camps 86,609 22,894 63,715
Refugee Camps 117,493 116,628 865
Homeless Person 24,095 17,449 6,646
Travellers/In transit 23,291 9,132 14,159
Health Institutions/Facilities 39,191 13,659 25,532
Educational Institutions 116,535 44,706 71,829
Orphanage Centres 10,621 3,701 6,920
Cloves /Fishing/Timber/Camps etc. 374,103 261,792 112,311
Table 1.2: Enumerated Population by Record Type and Sex; Tanzania Mainland, 2012 Census
Record Type Both Sexes Male Female
Tanzania Mainland 43,625,354 21,239,313 22,386,041
Private Households 42,764,449 20,765,147 21,999,302
Special Institutions 35,465 24,720 10,745
Inmates Institutions 33,502 31,506 1,996
Hotel and Tourist Camps 86,609 61,491 25,118
Refugee Camps 117,493 58,283 59,210
Homeless People 24,095 17,474 6,621
Travellers/In transit 23,291 15,081 8,210
Health Institutions/Facilities 39,191 13,368 25,823
Educational Institutions 116,535 56,374 60,161
Orphanage Centres 10,621 5,367 5,254
Cloves /Fishing/Timber/Camps 374,103 190,502 183,601

3
Table 1. 3: Population Distribution by Region, Rural and Urban Areas; Tanzania Mainland, 2012 Census
Region Total Rural Urban
Tanzania Mainland 43,625,354 30,924,116 12,701,238
Dodoma 2,083,588 1,762,394 321,194
Arusha 1,694,310 1,135,188 559,122
Kilimanjaro 1,640,087 1,242,712 397,375
Tanga 2,045,205 1,604,297 440,908
Morogoro 2,218,492 1,582,434 636,058
Pwani 1,098,668 738,297 360,371
Dar es Salaam 4,364,541 N/A 4,364,541
Lindi 864,652 702,603 162,049
Mtwara 1,270,854 979,350 291,504
Ruvuma 1,376,891 1,038,071 338,820
Iringa 941,238 684,890 256,348
Mbeya 2,707,410 1,809,298 898,112
Singida 1,370,637 1,199,936 170,701
Tabora 2,291,623 2,004,114 287,509
Rukwa 1,004,539 768,002 236,537
Kigoma 2,127,930 1,762,669 365,261
Shinyanga 1,534,808 1,280,137 254,671
Kagera 2,458,023 2,231,033 226,990
Mwanza 2,772,509 1,848,288 924,221
Mara 1,743,830 1,440,418 303,412
Manyara 1,425,131 1,231,913 193,218
Njombe 702,097 536,189 165,908
Katavi 564,604 407,532 157,072
Simiyu 1,584,157 1,473,639 110,518
Geita 1,739,530 1,460,712 278,818

4
Chapter Two
Age and Sex Profile
Tables in this chapter show the distribution of subpopulations by five year age group and sex.

5
Table 2.1: Population Distribution by Five Year Age Group and Sex; Tanzania Mainland , 2012 Census
Age Group Both Sexes Male Female Sex Ratio
Total 43,625,354 21,239,313 22,386,041 94.9
0 - 4 7,069,895 3,535,673 3,534,222 100.0
5 - 9 6,475,364 3,242,111 3,233,253 100.3
10 - 14 5,625,848 2,809,113 2,816,735 99.7
15 - 19 4,466,674 2,171,355 2,295,319 94.6
20 - 24 3,831,098 1,737,849 2,093,249 83.0
25 - 29 3,292,866 1,503,841 1,789,025 84.1
30 - 34 2,827,482 1,342,110 1,485,372 90.4
35 - 39 2,369,100 1,149,418 1,219,682 94.2
40 - 44 1,840,336 916,020 924,316 99.1
45 - 49 1,453,465 694,318 759,147 91.5
50 - 54 1,172,559 587,555 585,004 100.4
55 - 59 751,410 379,627 371,783 102.1
60 - 64 749,132 368,814 380,318 97.0
65 - 69 481,271 232,811 248,460 93.7
70 - 74 466,077 220,651 245,426 89.9
75 - 79 287,096 141,974 145,122 97.8
80+ 465,681 206,073 259,608 79.4
Median Age 18.0 17.4 18.5

6
Table 2.2: Population Distribution by Five Year Age Group and Sex; Tanzania Mainland Rural, 2012 Census
Age Group Both Sexes Male Female Sex Ratio
Total 30,924,116 15,119,036 15,805,080 95.7
0 - 4 5,392,159 2,695,697 2,696,462 100.0
5 - 9 4,979,659 2,503,450 2,476,209 101.1
10 - 14 4,210,158 2,130,863 2,079,295 102.5
15 - 19 2,991,709 1,513,002 1,478,707 102.3
20 - 24 2,388,099 1,092,683 1,295,416 84.3
25 - 29 2,041,241 924,065 1,117,176 82.7
30 - 34 1,787,650 834,325 953,325 87.5
35 - 39 1,555,790 739,045 816,745 90.5
40 - 44 1,254,331 609,813 644,518 94.6
45 - 49 1,011,926 478,928 532,998 89.9
50 - 54 845,834 414,583 431,251 96.1
55 - 59 542,847 268,485 274,362 97.9
60 - 64 564,826 272,695 292,131 93.3
65 - 69 374,198 178,110 196,088 90.8
70 - 74 371,855 176,235 195,620 90.1
75 - 79 231,772 115,334 116,438 99.1
80+ 380,062 171,723 208,339 82.4
Median Age 16.5 15.8 17.2
7
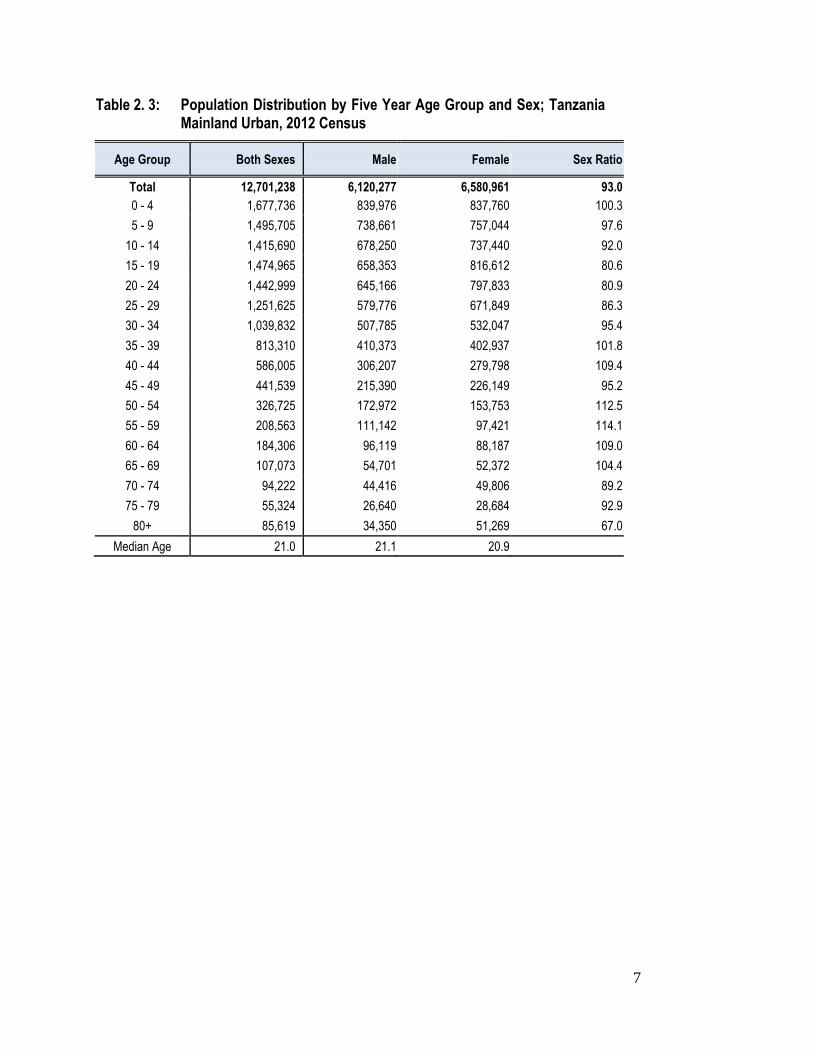
Table 2. 3: Population Distribution by Five Year Age Group and Sex; Tanzania Mainland Urban, 2012 Census
Age Group Both Sexes Male Female Sex Ratio
Total 12,701,238 6,120,277 6,580,961 93.0
0 - 4 1,677,736 839,976 837,760 100.3
5 - 9 1,495,705 738,661 757,044 97.6
10 - 14 1,415,690 678,250 737,440 92.0
15 - 19 1,474,965 658,353 816,612 80.6
20 - 24 1,442,999 645,166 797,833 80.9
25 - 29 1,251,625 579,776 671,849 86.3
30 - 34 1,039,832 507,785 532,047 95.4
35 - 39 813,310 410,373 402,937 101.8
40 - 44 586,005 306,207 279,798 109.4
45 - 49 441,539 215,390 226,149 95.2
50 - 54 326,725 172,972 153,753 112.5
55 - 59 208,563 111,142 97,421 114.1
60 - 64 184,306 96,119 88,187 109.0
65 - 69 107,073 54,701 52,372 104.4
70 - 74 94,222 44,416 49,806 89.2
75 - 79 55,324 26,640 28,684 92.9
80+ 85,619 34,350 51,269 67.0
Median Age 21.0 21.1 20.9

8
Table 2.4: Population Distribution of Key Age Groups; Tanzania Mainland, 2012 Census
Population Group Tanzania Mainland Rural Urban
Total Population 43,625,354 30,924,116 12,701,238
Male 21,239,313 15,119,036 6,120,277
Female 22,386,041 15,805,080 6,580,961
Children (Under 1 year) 1,457,151 1,077,979 379,172
Male 726,536 537,058 189,478
Female 730,615 540,921 189,694
Children (0–4 years) 7,069,895 5,392,159 1,677,736
Male 3,535,673 2,695,697 839,976
Female 3,534,222 2,696,462 837,760
Young Population (0–14 years) 19,171,107 14,581,976 4,589,131
Male 9,586,897 7,330,010 2,256,887
Female 9,584,210 7,251,966 2,332,244
Young Population (0–17 years) 21,866,258 16,423,183 5,443,075
Male 10,922,412 8,284,873 2,637,539
Female 10,943,846 8,138,310 2,805,536
Youth Population (15–24 years) 8,297,772 5,379,808 2,917,964
Male 3,909,204 2,605,685 1,303,519
Female 4,388,568 2,774,123 1,614,445
Youth Population (15–35 years) 15,115,987 9,673,568 5,442,419
Male 7,096,862 4,585,827 2,511,035
Female 8,019,125 5,087,741 2,931,384
School-Age Population
Primary school (7–13 years) 8,341,701 6,332,377 2,009,324
Male 4,166,593 3,188,323 978,270
Female 4,175,108 3,144,054 1,031,054
Secondary School (14–17 years) 3,699,137 2,572,701 1,126,436
Male 1,833,040 1,327,068 505,972
Female 1,866,097 1,245,633 620,464
Working Age Population (15–64 years) 22,754,122 14,984,253 7,769,869
Male 10,850,907 7,147,624 3,703,283
Female 11,903,215 7,836,629 4,066,586
Women of Reproductive Age (15–49 years) 10,566,110 6,838,885 3,727,225
Elderly Population (60+ years) 2,449,257 1,922,713 526,544
Male 1,170,323 914,097 256,226
Female 1,278,934 1,008,616 270,318
Elderly Population (65+ years) 1,700,125 1,357,887 342,238
Male 801,509 641,402 160,107
Female 898,616 716,485 182,131
Age-Dependency Ratio 92 106.4 63.5

9
Table 2.5: Distribution of Young Population (0 - 14 Years) by Region; Tanzania Mainland, 2012 Census
Region Both Sexes M ale Female
Tanzania Mainland 19,171,107 9,586,897 9,584,210
Rural 14,581,976 7,330,010 7,251,966
Urban 4,589,131 2,256,887 2,332,244
Dodoma 948,359 476,803 471,556
Arusha 706,036 353,723 352,313
Kilimanjaro 620,681 311,080 309,601
Tanga 886,473 445,931 440,542
Morogoro 916,884 458,463 458,421
Pwani 438,640 221,357 217,283
Dar es Salaam 1,377,946 678,454 699,492
Lindi 340,027 170,552 169,475
Mtwara 489,475 245,275 244,200
Ruvuma 591,685 293,253 298,432
Iringa 394,917 196,727 198,190
Mbeya 1,165,216 577,571 587,645
Singida 643,460 325,885 317,575
Tabora 1,108,045 557,997 550,048
Rukwa 506,993 250,765 256,228
Kigoma 1,037,758 518,548 519,210
Shinyanga 730,944 365,826 365,118
Kagera 1,171,789 584,204 587,585
Mwanza 1,294,788 647,229 647,559
Mara 864,791 434,323 430,468
Manyara 671,288 339,597 331,691
Njombe 294,147 146,404 147,743
Katavi 279,318 139,373 139,945
Simiyu 812,567 406,978 405,589
Geita 878,880 440,579 438,301

10
Table 2.6: Distribution of Youth Population (15 - 24 Years) by Region; Tanzania Mainland, 2012 Census
Region Both sexes M ale Female
Tanzania Mainland 8,297,772 3,909,204 4,388,568
Rural 5,379,808 2,605,685 2,774,123
Urban 2,917,964 1,303,519 1,614,445
Dodoma 364,255 178,255 186,000
Arusha 349,309 159,631 189,678
Kilimanjaro 307,529 148,059 159,470
Tanga 353,395 168,261 185,134
Morogoro 410,125 196,497 213,628
Pwani 197,623 93,226 104,397
Dar es Salaam 1,038,498 453,892 584,606
Lindi 136,788 65,258 71,530
Mtwara 203,423 94,270 109,153
Ruvuma 246,481 116,815 129,666
Iringa 181,369 89,463 91,906
Mbeya 537,090 250,485 286,605
Singida 236,705 120,319 116,386
Tabora 438,767 208,774 229,993
Rukwa 185,306 84,910 100,396
Kigoma 393,039 184,793 208,246
Shinyanga 299,847 141,614 158,233
Kagera 439,394 212,512 226,882
Mwanza 542,365 258,603 283,762
Mara 316,614 149,187 167,427
Manyara 256,911 127,587 129,324
Njombe 132,260 62,737 69,523
Katavi 104,924 48,963 55,961
Simiyu 296,272 137,033 159,239
Geita 329,483 158,060 171,423

11
Table 2.7: Distribution of Youth Population (15 - 35 Years) by Region; Tanzania Mainland, 2012 Census
Region Both Sexes M ale Female
Tanzania Mainland 15,115,987 7,096,862 8,019,125
Rural 9,673,568 4,585,827 5,087,741
Urban 5,442,419 2,511,035 2,931,384
Dodoma 667,815 316,809 351,006
Arusha 640,055 293,097 346,958
Kilimanjaro 532,447 254,032 278,415
Tanga 668,658 307,058 361,600
Morogoro 781,843 374,194 407,649
Pwani 379,646 177,359 202,287
Dar es Salaam 2,043,216 945,944 1,097,272
Lindi 275,502 127,176 148,326
Mtwara 402,887 181,134 221,753
Ruvuma 464,316 220,303 244,013
Iringa 331,750 159,282 172,468
Mbeya 966,569 449,872 516,697
Singida 420,209 206,195 214,014
Tabora 765,455 362,038 403,417
Rukwa 333,165 154,820 178,345
Kigoma 683,078 316,566 366,512
Shinyanga 518,916 244,707 274,209
Kagera 793,756 381,514 412,242
Mwanza 950,447 452,734 497,713
Mara 548,028 251,964 296,064
Manyara 461,034 227,131 233,903
Njombe 242,571 111,867 130,704
Katavi 188,890 89,505 99,385
Simiyu 490,149 221,555 268,594
Geita 565,585 270,006 295,579

12
Table 2.8: Distribution of Primary School Age Population (7 - 13 Years) by Region; Tanzania Mainland, 2012 Census
Region Both Sexes M ale Female
Tanzania Mainland 8,341,701 4,166,593 4,175,108
Rural 6,332,377 3,188,323 3,144,054
Urban 2,009,324 978,270 1,031,054
Dodoma 427,613 215,445 212,168
Arusha 316,793 158,366 158,427
Kilimanjaro 307,070 153,581 153,489
Tanga 408,745 205,558 203,187
Morogoro 407,961 203,825 204,136
Pwani 196,973 99,564 97,409
Dar es Salaam 579,872 282,663 297,209
Lindi 160,704 80,895 79,809
Mtwara 227,825 114,390 113,435
Ruvuma 266,634 129,923 136,711
Iringa 185,893 92,244 93,649
Mbeya 514,966 255,001 259,965
Singida 275,139 139,646 135,493
Tabora 462,640 233,644 228,996
Rukwa 209,858 103,881 105,977
Kigoma 428,535 213,672 214,863
Shinyanga 304,894 152,058 152,836
Kagera 502,786 250,952 251,834
Mwanza 543,383 271,464 271,919
Mara 364,212 183,352 180,860
Manyara 287,649 145,707 141,942
Njombe 141,157 70,037 71,120
Katavi 113,481 56,720 56,761
Simiyu 338,072 169,110 168,962
Geita 368,846 184,895 183,951

13
Table 2.9: Distribution of Secondary School Age Population (14 - 17 Years); Tanzania Mainland, 2012 Census
Region Both Sexes M ale Female
Tanzania Mainland 3,699,137 1,833,040 1,866,097
Rural 2,572,701 1,327,068 1,245,633
Urban 1,126,436 505,972 620,464
Dodoma 166,233 86,033 80,200
Arusha 152,917 73,007 79,910
Kilimanjaro 157,115 76,421 80,694
Tanga 166,173 84,715 81,458
Morogoro 181,149 92,146 89,003
Pwani 86,543 43,268 43,275
Dar es Salaam 349,387 149,240 200,147
Lindi 62,592 32,859 29,733
Mtwara 91,285 46,657 44,628
Ruvuma 116,499 60,517 55,982
Iringa 84,936 43,586 41,350
Mbeya 238,773 116,699 122,074
Singida 113,515 61,287 52,228
Tabora 197,775 99,407 98,368
Rukwa 83,150 40,690 42,460
Kigoma 186,910 92,829 94,081
Shinyanga 135,220 67,055 68,165
Kagera 213,802 108,311 105,491
Mwanza 242,154 119,479 122,675
Mara 145,965 74,278 71,687
Manyara 120,332 62,010 58,322
Njombe 63,217 31,771 31,446
Katavi 47,480 23,311 24,169
Simiyu 142,115 69,782 72,333
Geita 153,900 77,682 76,218

14
Table 2.10: Distribution of Working Age Population (15 - 64 Years) by Region; Tanzania Mainland, 2012 Census
Region Both Sexes M ale Female
Tanzania Mainland 22,754,122 10,850,907 11,903,215
Rural 14,984,253 7,147,624 7,836,629
Urban 7,769,869 3,703,283 4,066,586
Dodoma 1,033,802 492,205 541,597
Arusha 933,471 441,336 492,135
Kilimanjaro 904,346 429,320 475,026
Tanga 1,059,773 497,183 562,590
Morogoro 1,206,792 589,390 617,402
Pwani 591,975 284,813 307,162
Dar es Salaam 2,893,355 1,400,829 1,492,526
Lindi 470,028 217,744 252,284
Mtwara 696,593 316,131 380,462
Ruvuma 729,570 347,984 381,586
Iringa 504,622 238,306 266,316
Mbeya 1,433,975 670,736 763,239
Singida 662,195 320,599 341,596
Tabora 1,102,265 531,591 570,674
Rukwa 471,772 224,067 247,705
Kigoma 1,011,507 474,889 536,618
Shinyanga 753,156 360,875 392,281
Kagera 1,199,285 582,475 616,810
Mwanza 1,393,880 672,175 721,705
Mara 817,922 378,274 439,648
Manyara 699,908 350,821 349,087
Njombe 375,448 170,054 205,394
Katavi 270,536 132,690 137,846
Simiyu 721,019 329,578 391,441
Geita 816,927 396,842 420,085

15
Table 2.11: Distribution of Elderly Population (60+ Years) by Region; Tanzania Mainland, 2012 Census
Region Both Sexes M ale Female
Tanzania Mainland 2,449,257 1,170,323 1,278,934
Rural 1,922,713 914,097 1,008,616
Urban 526,544 256,226 270,318
Dodoma 139,363 63,863 75,500
Arusha 80,084 39,065 41,019
Kilimanjaro 159,654 73,649 86,005
Tanga 141,453 71,285 70,168
Morogoro 139,809 67,667 72,142
Pwani 93,716 44,147 49,569
Dar es Salaam 151,812 79,541 72,271
Lindi 77,573 37,435 40,138
Mtwara 120,384 54,574 65,810
Ruvuma 83,073 39,953 43,120
Iringa 59,445 24,599 34,846
Mbeya 153,677 71,079 82,598
Singida 89,070 43,682 45,388
Tabora 115,569 57,750 57,819
Rukwa 39,533 19,402 20,131
Kigoma 112,812 51,401 61,411
Shinyanga 72,704 35,075 37,629
Kagera 125,089 57,154 67,935
Mwanza 121,943 60,638 61,305
Mara 88,183 40,063 48,120
Manyara 75,918 37,856 38,062
Njombe 46,705 18,653 28,052
Katavi 22,854 11,842 11,012
Simiyu 74,379 34,775 39,604
Geita 64,455 35,175 29,280

16
Table 2.12: Distribution of Elderly Population (65+ Years) by Region; Tanzania Mainland, 2012 Census
Region Both Sexes M ale Female
Tanzania Mainland 1,700,125 801,509 898,616
Rural 1,357,887 641,402 716,485
Urban 342,238 160,107 182,131
Dodoma 101,427 45,966 55,461
Arusha 54,803 26,223 28,580
Kilimanjaro 115,060 52,740 62,320
Tanga 98,959 49,233 49,726
Morogoro 94,816 45,449 49,367
Pwani 68,053 31,656 36,397
Dar es Salaam 93,240 46,503 46,737
Lindi 54,597 26,211 28,386
Mtwara 84,786 38,242 46,544
Ruvuma 55,636 27,447 28,189
Iringa 41,699 17,019 24,680
Mbeya 108,219 49,431 58,788
Singida 64,982 31,511 33,471
Tabora 81,313 40,142 41,171
Rukwa 25,774 12,479 13,295
Kigoma 78,665 35,557 43,108
Shinyanga 50,708 24,140 26,568
Kagera 86,949 39,004 47,945
Mwanza 83,841 40,977 42,864
Mara 61,117 27,423 33,694
Manyara 53,935 26,667 27,268
Njombe 32,502 12,901 19,601
Katavi 14,750 7,619 7,131
Simiyu 50,571 23,335 27,236
Geita 43,723 23,634 20,089

17
Table 2.13: Distribution of Dependent Population (0 - 14 and 65+ Years) by Region; Tanzania Mainland, 2012 Census
Region Both Sexes M ale Female
Tanzania Mainland 20,871,232 10,388,406 10,482,826
Rural 15,939,863 7,971,412 7,968,451
Urban 4,931,369 2,416,994 2,514,375
Dodoma 1,049,786 522,769 527,017
Arusha 760,839 379,946 380,893
Kilimanjaro 735,741 363,820 371,921
Tanga 985,432 495,164 490,268
Morogoro 1,011,700 503,912 507,788
Pwani 506,693 253,013 253,680
Dar es Salaam 1,471,186 724,957 746,229
Lindi 394,624 196,763 197,861
Mtwara 574,261 283,517 290,744
Ruvuma 647,321 320,700 326,621
Iringa 436,616 213,746 222,870
Mbeya 1,273,435 627,002 646,433
Singida 708,442 357,396 351,046
Tabora 1,189,358 598,139 591,219
Rukwa 532,767 263,244 269,523
Kigoma 1,116,423 554,105 562,318
Shinyanga 781,652 389,966 391,686
Kagera 1,258,738 623,208 635,530
Mwanza 1,378,629 688,206 690,423
Mara 925,908 461,746 464,162
Manyara 725,223 366,264 358,959
Njombe 326,649 159,305 167,344
Katavi 294,068 146,992 147,076
Simiyu 863,138 430,313 432,825
Geita 922,603 464,213 458,390
18
Chapter Three
Household Composition
The tables in this chapter present the distribution of private households by region, age/sex of
household head, rural and urban areas.
19
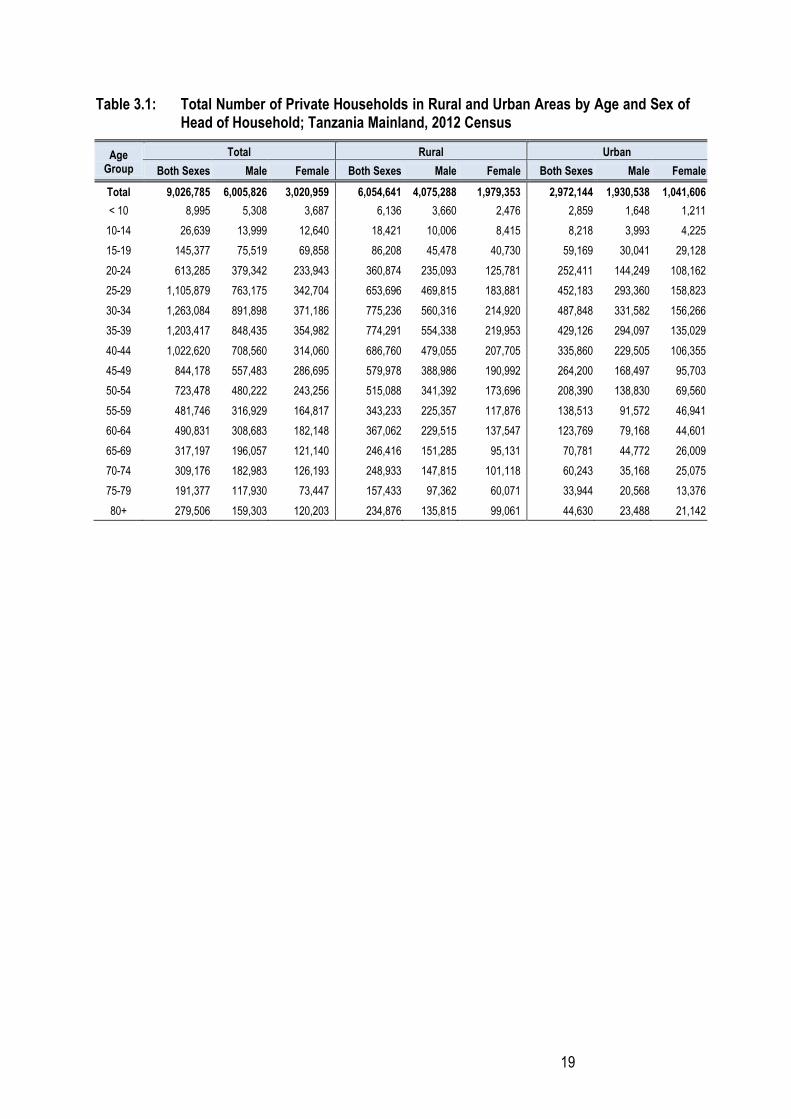
Table 3.1: Total Number of Private Households in Rural and Urban Areas by Age and Sex of Head of Household; Tanzania Mainland, 2012 Census
Age Group
Total Rural Urban
Both Sexes Male Female Both Sexes Male Female Both Sexes Male Female
Total 9,026,785 6,005,826 3,020,959 6,054,641 4,075,288 1,979,353 2,972,144 1,930,538 1,041,606
< 10 8,995 5,308 3,687 6,136 3,660 2,476 2,859 1,648 1,211
10-14 26,639 13,999 12,640 18,421 10,006 8,415 8,218 3,993 4,225
15-19 145,377 75,519 69,858 86,208 45,478 40,730 59,169 30,041 29,128
20-24 613,285 379,342 233,943 360,874 235,093 125,781 252,411 144,249 108,162
25-29 1,105,879 763,175 342,704 653,696 469,815 183,881 452,183 293,360 158,823
30-34 1,263,084 891,898 371,186 775,236 560,316 214,920 487,848 331,582 156,266
35-39 1,203,417 848,435 354,982 774,291 554,338 219,953 429,126 294,097 135,029
40-44 1,022,620 708,560 314,060 686,760 479,055 207,705 335,860 229,505 106,355
45-49 844,178 557,483 286,695 579,978 388,986 190,992 264,200 168,497 95,703
50-54 723,478 480,222 243,256 515,088 341,392 173,696 208,390 138,830 69,560
55-59 481,746 316,929 164,817 343,233 225,357 117,876 138,513 91,572 46,941
60-64 490,831 308,683 182,148 367,062 229,515 137,547 123,769 79,168 44,601
65-69 317,197 196,057 121,140 246,416 151,285 95,131 70,781 44,772 26,009
70-74 309,176 182,983 126,193 248,933 147,815 101,118 60,243 35,168 25,075
75-79 191,377 117,930 73,447 157,433 97,362 60,071 33,944 20,568 13,376
80+ 279,506 159,303 120,203 234,876 135,815 99,061 44,630 23,488 21,142

20
Table 3.2: Distribution of Private Households by Region, Rural and Urban Areas; Tanzania Mainland, 2012 Census
Region Total Rural Urban
Tanzania Mainland 9,026,785 6,054,641 2,972,144
Dodoma 450,305 377,320 72,985
Arusha 376,336 235,827 140,509
Kilimanjaro 381,526 284,601 96,925
Tanga 435,583 338,875 96,708
Morogoro 501,794 350,458 151,336
Pwani 254,810 169,937 84,873
Dar es Salaam 1,083,381 N/A 1,083,381
Lindi 224,316 180,289 44,027
Mtwara 342,165 264,596 77,569
Ruvuma 300,005 222,994 77,011
Iringa 220,776 159,618 61,158
Mbeya 630,593 417,310 213,283
Singida 255,613 218,621 36,992
Tabora 379,770 316,065 63,705
Rukwa 198,011 148,698 49,313
Kigoma 370,374 299,351 71,023
Shinyanga 258,981 202,172 56,809
Kagera 521,028 465,595 55,433
Mwanza 481,107 293,904 187,203
Mara 308,483 248,001 60,482
Manyara 271,050 228,012 43,038
Njombe 168,982 128,712 40,270
Katavi 100,350 69,476 30,874
Simiyu 227,862 205,495 22,367
Geita 283,584 228,714 54,870

21
Table 3. 3: Population Size, Number of Private Households and Average Household Size; Tanzania Mainland, 2012 Census
Region Total Population Number of
Households Average Household
Size
Tanzania Mainland 42,764,449 9,026,785 4.7
Rural 30,410,180 6,054,641 5.0
Urban 12,354,269 2,972,144 4.2
Dodoma 2,050,672 450,305 4.6
Arusha 1,662,618 376,336 4.4
Kilimanjaro 1,601,106 381,526 4.2
Tanga 2,020,221 435,583 4.6
Morogoro 2,175,011 501,794 4.3
Pwani 1,073,170 254,810 4.2
Dar es Salaam 4,279,032 1,083,381 3.9
Lindi 852,658 224,316 3.8
Mtwara 1,249,766 342,165 3.7
Ruvuma 1,346,966 300,005 4.5
Iringa 920,776 220,776 4.2
Mbeya 2,671,117 630,593 4.2
Singida 1,345,531 255,613 5.3
Tabora 2,250,921 379,770 5.9
Rukwa 991,912 198,011 5.0
Kigoma 1,984,358 370,374 5.4
Shinyanga 1,510,029 258,981 5.8
Kagera 2,423,142 521,028 4.7
Mwanza 2,719,487 481,107 5.7
Mara 1,706,891 308,483 5.5
Manyara 1,405,957 271,050 5.2
Njombe 689,846 168,982 4.1
Katavi 555,339 100,350 5.5
Simiyu 1,566,578 227,862 6.9
Geita 1,711,345 283,584 6.0

22
Table 3. 4: Number of Private Households and Average Size of Households by Sex of Household Head and Region; Tanzania Mainland, 2012 Census
Region Household Headship Average Household Size
Both Sexes Male Female Total Male Headed Female Headed
Tanzania Mainland 9,026,785 6,005,826 3,020,959 4.7 3.5 7.3
Dodoma 450,305 305,156 145,149 4.6 3.3 7.3
Arusha 376,336 238,396 137,940 4.4 3.4 6.2
Kilimanjaro 381,526 242,064 139,462 4.2 3.2 5.9
Tanga 435,583 290,418 145,165 4.6 3.4 7.2
Morogoro 501,794 348,709 153,085 4.3 3.1 7.2
Pwani 254,810 176,902 77,908 4.2 3.0 7.1
Dar es Salaam 1,083,381 706,493 376,888 3.9 2.9 5.8
Lindi 224,316 147,926 76,390 3.8 2.8 5.8
Mtwara 342,165 224,476 117,689 3.7 2.6 5.6
Ruvuma 300,005 213,059 86,946 4.5 3.1 8.0
Iringa 220,776 140,241 80,535 4.2 3.1 6.0
Mbeya 630,593 401,587 229,006 4.2 3.2 6.1
Singida 255,613 174,014 81,599 5.3 3.8 8.3
Tabora 379,770 266,117 113,653 5.9 4.2 10.1
Rukwa 198,011 142,816 55,195 5.0 3.4 9.3
Kigoma 370,374 238,971 131,403 5.4 4.0 7.8
Shinyanga 258,981 178,778 80,203 5.8 4.1 9.6
Kagera 521,028 354,744 166,284 4.7 3.3 7.4
Mwanza 481,107 321,312 159,795 5.7 4.1 8.7
Mara 308,483 191,624 116,859 5.5 4.3 7.6
Manyara 271,050 179,541 91,509 5.2 3.9 7.7
Njombe 168,982 104,804 64,178 4.1 3.1 5.7
Katavi 100,350 73,050 27,300 5.5 3.8 10.3
Simiyu 227,862 141,428 86,434 6.9 5.3 9.4
Geita 283,584 203,200 80,384 6.0 4.2 10.8

23
Chapter Four
Marital Status
Tables in this chapter give distribution of population aged 15 years and above by five
year age groups, sex, rural-urban and marital status.

24
Table 4.1: Total Population Aged 15 Years and Above by Five Year Age Group and Marital Status; Tanzania Mainland, 2012 Census
Age Group
Total Marital Status
Never Married Married Living Together Separated Divorced Widowed
Total 23,858,866 8,465,009 12,155,757 1,573,992 230,755 683,617 749,736
15 – 19 4,354,613 3,811,637 491,649 49,112 907 1,308 -
20 – 24 3,696,040 2,073,791 1,317,157 203,836 7,060 91,627 2,569
25 – 29 3,203,422 978,564 1,849,683 324,825 17,902 31,135 1,313
30 – 34 2,759,831 509,998 1,834,503 259,204 27,810 125,195 3,121
35 – 39 2,316,062 313,249 1,649,423 207,895 31,498 109,238 4,759
40 – 44 1,799,971 204,757 1,330,503 145,128 30,949 56,858 31,776
45 – 49 1,425,492 119,946 1,050,133 102,104 28,067 52,039 73,203
50 – 54 1,150,210 111,497 828,898 74,460 24,384 46,268 64,703
55 – 59 738,208 75,799 484,372 61,784 16,292 48,673 51,288
60 – 64 737,241 86,350 479,074 50,735 16,207 42,364 62,511
65 – 69 474,731 36,975 302,186 40,276 9,813 27,973 57,508
70 – 74 459,643 52,865 255,249 29,944 8,651 28,235 84,699
75 – 79 283,580 29,716 126,595 11,075 4,876 9,781 101,537
80+ 459,822 59,865 156,332 13,614 6,339 12,923 210,749
Table 4.2: Total Male Population Aged 15 Years and Above by Five Year Age Group and Marital Status; Tanzania Mainland, 2012 Census
Age Group
Total Marital Status
Never Married Married Living Together Separated Divorced Widowed
Total 11,310,935 4,333,580 5,696,126 736,609 75,761 254,858 214,001
15 - 19 2,118,995 1,953,097 160,322 5,165 163 248 -
20 - 24 1,661,799 1,139,088 421,162 52,916 1,627 45,602 1,404
25 - 29 1,448,116 541,744 749,004 143,099 5,064 8,479 726
30 - 34 1,299,453 263,814 842,349 129,955 8,646 53,111 1,578
35 - 39 1,116,104 152,302 797,738 110,517 10,136 43,075 2,336
40 - 44 890,663 93,104 675,289 80,277 9,870 17,802 14,321
45 - 49 676,961 46,902 522,314 55,868 8,799 15,869 27,209
50 - 54 574,318 41,899 443,058 43,651 8,206 14,884 22,620
55 - 59 371,919 26,185 275,486 32,350 5,634 15,894 16,370
60 - 64 362,372 26,215 271,742 28,096 5,705 13,289 17,325
65 - 69 229,408 11,083 171,102 19,638 3,666 8,914 15,005
70 - 74 217,389 13,957 155,286 16,234 3,256 8,732 19,924
75 - 79 140,155 8,179 92,010 8,300 2,246 4,003 25,417
80+ 203,283 16,011 119,264 10,543 2,743 4,956 49,766
25
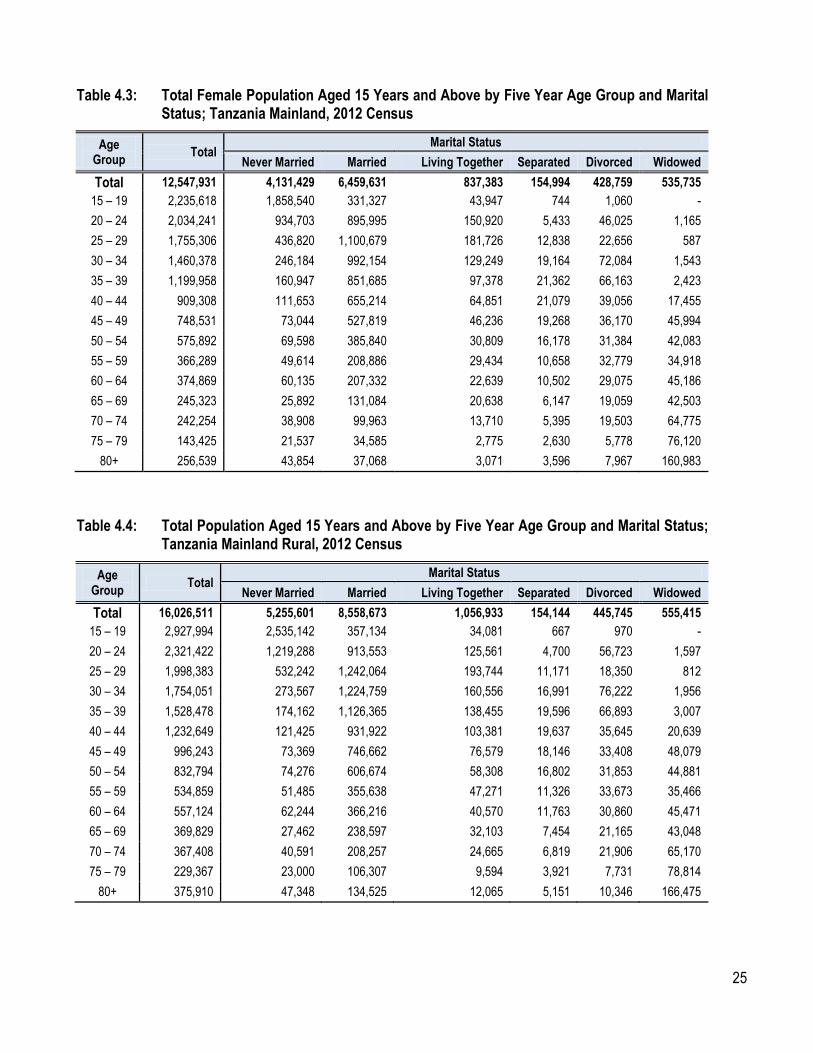
Table 4.3: Total Female Population Aged 15 Years and Above by Five Year Age Group and Marital Status; Tanzania Mainland, 2012 Census
Age Group
Total Marital Status
Never Married Married Living Together Separated Divorced Widowed
Total 12,547,931 4,131,429 6,459,631 837,383 154,994 428,759 535,735
15 – 19 2,235,618 1,858,540 331,327 43,947 744 1,060 -
20 – 24 2,034,241 934,703 895,995 150,920 5,433 46,025 1,165
25 – 29 1,755,306 436,820 1,100,679 181,726 12,838 22,656 587
30 – 34 1,460,378 246,184 992,154 129,249 19,164 72,084 1,543
35 – 39 1,199,958 160,947 851,685 97,378 21,362 66,163 2,423
40 – 44 909,308 111,653 655,214 64,851 21,079 39,056 17,455
45 – 49 748,531 73,044 527,819 46,236 19,268 36,170 45,994
50 – 54 575,892 69,598 385,840 30,809 16,178 31,384 42,083
55 – 59 366,289 49,614 208,886 29,434 10,658 32,779 34,918
60 – 64 374,869 60,135 207,332 22,639 10,502 29,075 45,186
65 – 69 245,323 25,892 131,084 20,638 6,147 19,059 42,503
70 – 74 242,254 38,908 99,963 13,710 5,395 19,503 64,775
75 – 79 143,425 21,537 34,585 2,775 2,630 5,778 76,120
80+ 256,539 43,854 37,068 3,071 3,596 7,967 160,983
Table 4.4: Total Population Aged 15 Years and Above by Five Year Age Group and Marital Status; Tanzania Mainland Rural, 2012 Census
Age Group
Total Marital Status
Never Married Married Living Together Separated Divorced Widowed
Total 16,026,511 5,255,601 8,558,673 1,056,933 154,144 445,745 555,415
15 – 19 2,927,994 2,535,142 357,134 34,081 667 970 -
20 – 24 2,321,422 1,219,288 913,553 125,561 4,700 56,723 1,597
25 – 29 1,998,383 532,242 1,242,064 193,744 11,171 18,350 812
30 – 34 1,754,051 273,567 1,224,759 160,556 16,991 76,222 1,956
35 – 39 1,528,478 174,162 1,126,365 138,455 19,596 66,893 3,007
40 – 44 1,232,649 121,425 931,922 103,381 19,637 35,645 20,639
45 – 49 996,243 73,369 746,662 76,579 18,146 33,408 48,079
50 – 54 832,794 74,276 606,674 58,308 16,802 31,853 44,881
55 – 59 534,859 51,485 355,638 47,271 11,326 33,673 35,466
60 – 64 557,124 62,244 366,216 40,570 11,763 30,860 45,471
65 – 69 369,829 27,462 238,597 32,103 7,454 21,165 43,048
70 – 74 367,408 40,591 208,257 24,665 6,819 21,906 65,170
75 – 79 229,367 23,000 106,307 9,594 3,921 7,731 78,814
80+ 375,910 47,348 134,525 12,065 5,151 10,346 166,475
26
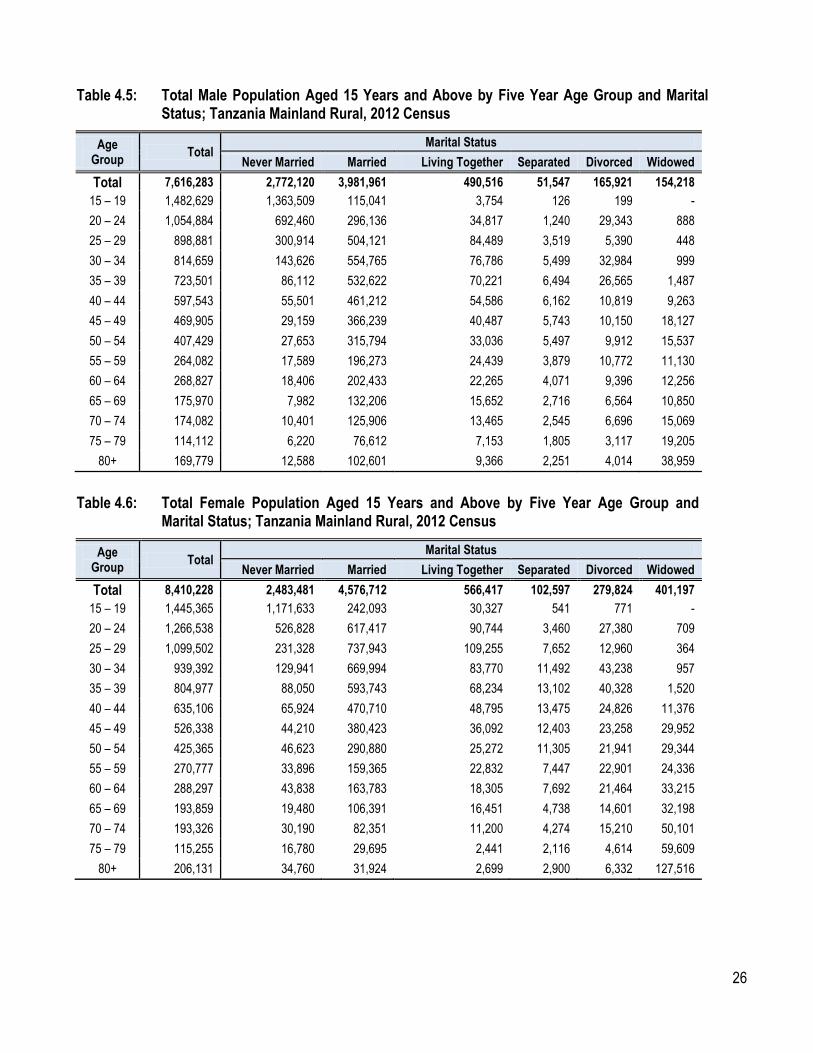
Table 4.5: Total Male Population Aged 15 Years and Above by Five Year Age Group and Marital Status; Tanzania Mainland Rural, 2012 Census
Age Group
Total Marital Status
Never Married Married Living Together Separated Divorced Widowed
Total 7,616,283 2,772,120 3,981,961 490,516 51,547 165,921 154,218
15 – 19 1,482,629 1,363,509 115,041 3,754 126 199 -
20 – 24 1,054,884 692,460 296,136 34,817 1,240 29,343 888
25 – 29 898,881 300,914 504,121 84,489 3,519 5,390 448
30 – 34 814,659 143,626 554,765 76,786 5,499 32,984 999
35 – 39 723,501 86,112 532,622 70,221 6,494 26,565 1,487
40 – 44 597,543 55,501 461,212 54,586 6,162 10,819 9,263
45 – 49 469,905 29,159 366,239 40,487 5,743 10,150 18,127
50 – 54 407,429 27,653 315,794 33,036 5,497 9,912 15,537
55 – 59 264,082 17,589 196,273 24,439 3,879 10,772 11,130
60 – 64 268,827 18,406 202,433 22,265 4,071 9,396 12,256
65 – 69 175,970 7,982 132,206 15,652 2,716 6,564 10,850
70 – 74 174,082 10,401 125,906 13,465 2,545 6,696 15,069
75 – 79 114,112 6,220 76,612 7,153 1,805 3,117 19,205
80+ 169,779 12,588 102,601 9,366 2,251 4,014 38,959
Table 4.6: Total Female Population Aged 15 Years and Above by Five Year Age Group and
Marital Status; Tanzania Mainland Rural, 2012 Census
Age Group
Total Marital Status
Never Married Married Living Together Separated Divorced Widowed
Total 8,410,228 2,483,481 4,576,712 566,417 102,597 279,824 401,197
15 – 19 1,445,365 1,171,633 242,093 30,327 541 771 -
20 – 24 1,266,538 526,828 617,417 90,744 3,460 27,380 709
25 – 29 1,099,502 231,328 737,943 109,255 7,652 12,960 364
30 – 34 939,392 129,941 669,994 83,770 11,492 43,238 957
35 – 39 804,977 88,050 593,743 68,234 13,102 40,328 1,520
40 – 44 635,106 65,924 470,710 48,795 13,475 24,826 11,376
45 – 49 526,338 44,210 380,423 36,092 12,403 23,258 29,952
50 – 54 425,365 46,623 290,880 25,272 11,305 21,941 29,344
55 – 59 270,777 33,896 159,365 22,832 7,447 22,901 24,336
60 – 64 288,297 43,838 163,783 18,305 7,692 21,464 33,215
65 – 69 193,859 19,480 106,391 16,451 4,738 14,601 32,198
70 – 74 193,326 30,190 82,351 11,200 4,274 15,210 50,101
75 – 79 115,255 16,780 29,695 2,441 2,116 4,614 59,609
80+ 206,131 34,760 31,924 2,699 2,900 6,332 127,516
27
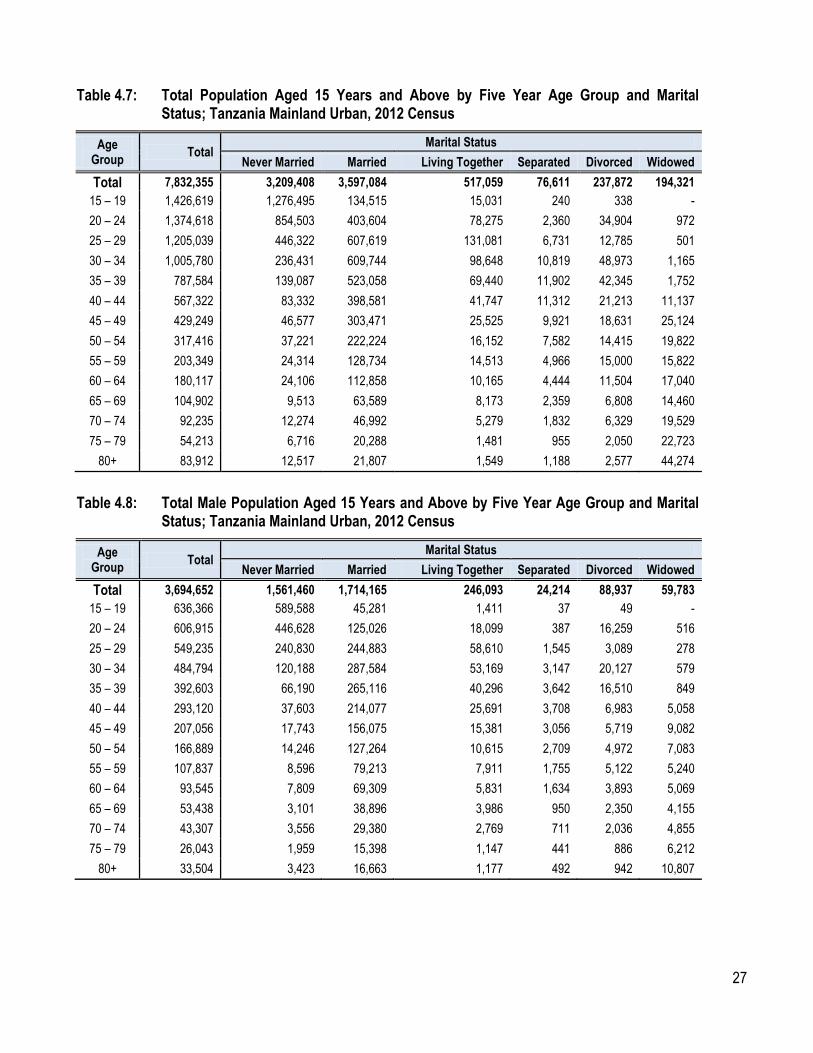
Table 4.7: Total Population Aged 15 Years and Above by Five Year Age Group and Marital Status; Tanzania Mainland Urban, 2012 Census
Age Group
Total Marital Status
Never Married Married Living Together Separated Divorced Widowed
Total 7,832,355 3,209,408 3,597,084 517,059 76,611 237,872 194,321
15 – 19 1,426,619 1,276,495 134,515 15,031 240 338 -
20 – 24 1,374,618 854,503 403,604 78,275 2,360 34,904 972
25 – 29 1,205,039 446,322 607,619 131,081 6,731 12,785 501
30 – 34 1,005,780 236,431 609,744 98,648 10,819 48,973 1,165
35 – 39 787,584 139,087 523,058 69,440 11,902 42,345 1,752
40 – 44 567,322 83,332 398,581 41,747 11,312 21,213 11,137
45 – 49 429,249 46,577 303,471 25,525 9,921 18,631 25,124
50 – 54 317,416 37,221 222,224 16,152 7,582 14,415 19,822
55 – 59 203,349 24,314 128,734 14,513 4,966 15,000 15,822
60 – 64 180,117 24,106 112,858 10,165 4,444 11,504 17,040
65 – 69 104,902 9,513 63,589 8,173 2,359 6,808 14,460
70 – 74 92,235 12,274 46,992 5,279 1,832 6,329 19,529
75 – 79 54,213 6,716 20,288 1,481 955 2,050 22,723
80+ 83,912 12,517 21,807 1,549 1,188 2,577 44,274
Table 4.8: Total Male Population Aged 15 Years and Above by Five Year Age Group and Marital
Status; Tanzania Mainland Urban, 2012 Census
Age Group
Total Marital Status
Never Married Married Living Together Separated Divorced Widowed
Total 3,694,652 1,561,460 1,714,165 246,093 24,214 88,937 59,783
15 – 19 636,366 589,588 45,281 1,411 37 49 -
20 – 24 606,915 446,628 125,026 18,099 387 16,259 516
25 – 29 549,235 240,830 244,883 58,610 1,545 3,089 278
30 – 34 484,794 120,188 287,584 53,169 3,147 20,127 579
35 – 39 392,603 66,190 265,116 40,296 3,642 16,510 849
40 – 44 293,120 37,603 214,077 25,691 3,708 6,983 5,058
45 – 49 207,056 17,743 156,075 15,381 3,056 5,719 9,082
50 – 54 166,889 14,246 127,264 10,615 2,709 4,972 7,083
55 – 59 107,837 8,596 79,213 7,911 1,755 5,122 5,240
60 – 64 93,545 7,809 69,309 5,831 1,634 3,893 5,069
65 – 69 53,438 3,101 38,896 3,986 950 2,350 4,155
70 – 74 43,307 3,556 29,380 2,769 711 2,036 4,855
75 – 79 26,043 1,959 15,398 1,147 441 886 6,212
80+ 33,504 3,423 16,663 1,177 492 942 10,807
28
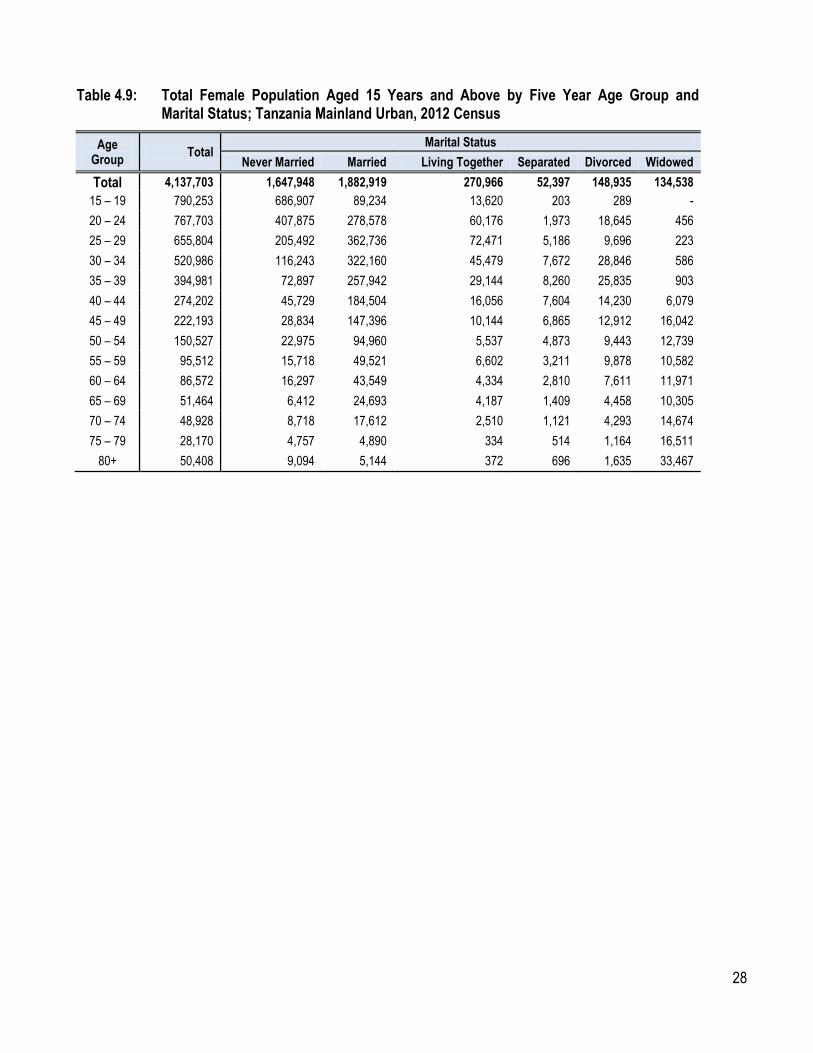
Table 4.9: Total Female Population Aged 15 Years and Above by Five Year Age Group and Marital Status; Tanzania Mainland Urban, 2012 Census
Age Group
Total Marital Status
Never Married Married Living Together Separated Divorced Widowed
Total 4,137,703 1,647,948 1,882,919 270,966 52,397 148,935 134,538
15 – 19 790,253 686,907 89,234 13,620 203 289 -
20 – 24 767,703 407,875 278,578 60,176 1,973 18,645 456
25 – 29 655,804 205,492 362,736 72,471 5,186 9,696 223
30 – 34 520,986 116,243 322,160 45,479 7,672 28,846 586
35 – 39 394,981 72,897 257,942 29,144 8,260 25,835 903
40 – 44 274,202 45,729 184,504 16,056 7,604 14,230 6,079
45 – 49 222,193 28,834 147,396 10,144 6,865 12,912 16,042
50 – 54 150,527 22,975 94,960 5,537 4,873 9,443 12,739
55 – 59 95,512 15,718 49,521 6,602 3,211 9,878 10,582
60 – 64 86,572 16,297 43,549 4,334 2,810 7,611 11,971
65 – 69 51,464 6,412 24,693 4,187 1,409 4,458 10,305
70 – 74 48,928 8,718 17,612 2,510 1,121 4,293 14,674
75 – 79 28,170 4,757 4,890 334 514 1,164 16,511
80+ 50,408 9,094 5,144 372 696 1,635 33,467

29
Table 4.10: Total Population Aged 15 Years and Above by Region and Marital Status; Tanzania Mainland, 2012 Census
Region Total Marital Status
Never Married Married Living Together Separated Divorced Widowed
Tanzania Mainland 23,858,866 8,465,009 12,155,757 1,573,992 230,755 683,617 749,736
Rural 16,026,511 5,255,601 8,558,673 1,056,933 154,144 445,745 555,415
Urban 7,832,355 3,209,408 3,597,084 517,059 76,611 237,872 194,321
Dodoma 1,110,829 335,935 620,491 69,447 14,079 32,577 38,300
Arusha 962,795 355,802 512,048 40,885 8,144 19,948 25,968
Kilimanjaro 989,805 353,497 525,021 30,807 9,406 26,436 44,638
Tanga 1,139,029 378,557 623,371 48,458 9,297 35,865 43,481
Morogoro 1,267,534 429,259 584,950 155,491 13,043 44,413 40,378
Pwani 640,738 211,647 334,562 37,347 5,002 26,359 25,821
Dar es Salaam 2,920,622 1,298,536 1,270,318 164,169 24,525 96,912 66,162
Lindi 515,460 151,432 264,322 54,268 4,238 23,636 17,564
Mtwara 767,499 214,850 413,300 70,441 7,446 36,606 24,856
Ruvuma 763,449 239,819 406,501 71,334 4,907 19,352 21,536
Iringa 530,685 184,889 255,217 55,867 5,534 9,879 19,299
Mbeya 1,514,532 499,368 800,982 111,341 17,817 34,188 50,836
Singida 709,699 237,087 379,443 42,060 7,734 16,032 27,343
Tabora 1,155,507 425,765 557,281 96,336 10,095 32,417 33,613
Rukwa 489,415 140,493 288,260 35,847 5,357 9,244 10,214
Kigoma 1,017,015 369,064 496,446 71,049 12,922 28,787 38,747
Shinyanga 787,501 295,576 395,961 43,336 6,635 23,313 22,680
Kagera 1,261,142 396,596 668,271 104,268 18,861 34,395 38,751
Mwanza 1,438,016 556,997 697,021 84,969 13,585 44,395 41,049
Mara 854,867 302,280 472,659 26,415 6,810 17,351 29,352
Manyara 739,929 257,320 396,901 36,731 7,010 17,165 24,802
Njombe 398,282 133,661 214,113 24,631 3,589 7,187 15,101
Katavi 279,558 91,677 153,618 19,582 2,612 5,649 6,420
Simiyu 760,960 305,544 387,985 20,379 4,526 18,923 23,603
Geita 843,998 299,358 436,715 58,534 7,581 22,588 19,222

30
Chapter Five
Citizenship and Birth Registration
The tables in this chapter give the distribution of enumerated population by citizenship, sex, rural and
urban areas also population in private households by status of birth certificate, five year age group, sex,
region, rural and urban areas.
31
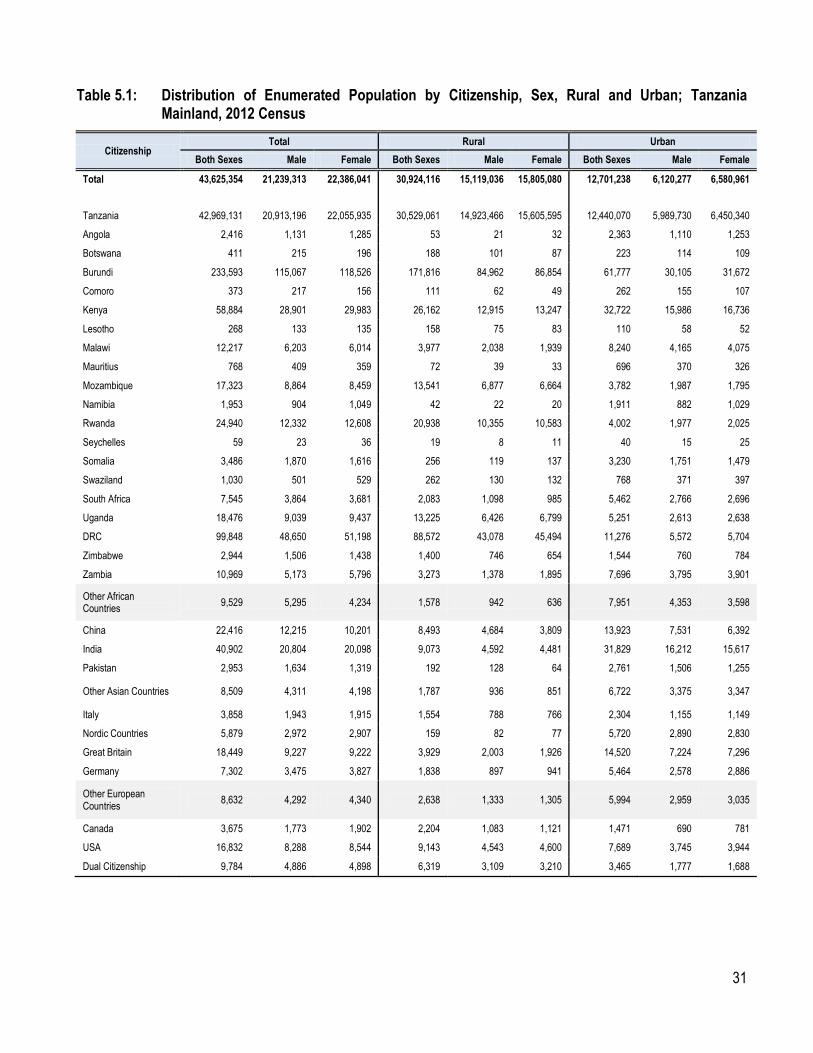
Table 5.1: Distribution of Enumerated Population by Citizenship, Sex, Rural and Urban; Tanzania Mainland, 2012 Census
Citizenship Total Rural Urban
Both Sexes Male Female Both Sexes Male Female Both Sexes Male Female
Total 43,625,354 21,239,313 22,386,041 30,924,116 15,119,036 15,805,080 12,701,238 6,120,277 6,580,961
Tanzania 42,969,131 20,913,196 22,055,935 30,529,061 14,923,466 15,605,595 12,440,070 5,989,730 6,450,340
Angola 2,416 1,131 1,285 53 21 32 2,363 1,110 1,253
Botswana 411 215 196 188 101 87 223 114 109
Burundi 233,593 115,067 118,526 171,816 84,962 86,854 61,777 30,105 31,672
Comoro 373 217 156 111 62 49 262 155 107
Kenya 58,884 28,901 29,983 26,162 12,915 13,247 32,722 15,986 16,736
Lesotho 268 133 135 158 75 83 110 58 52
Malawi 12,217 6,203 6,014 3,977 2,038 1,939 8,240 4,165 4,075
Mauritius 768 409 359 72 39 33 696 370 326
Mozambique 17,323 8,864 8,459 13,541 6,877 6,664 3,782 1,987 1,795
Namibia 1,953 904 1,049 42 22 20 1,911 882 1,029
Rwanda 24,940 12,332 12,608 20,938 10,355 10,583 4,002 1,977 2,025
Seychelles 59 23 36 19 8 11 40 15 25
Somalia 3,486 1,870 1,616 256 119 137 3,230 1,751 1,479
Swaziland 1,030 501 529 262 130 132 768 371 397
South Africa 7,545 3,864 3,681 2,083 1,098 985 5,462 2,766 2,696
Uganda 18,476 9,039 9,437 13,225 6,426 6,799 5,251 2,613 2,638
DRC 99,848 48,650 51,198 88,572 43,078 45,494 11,276 5,572 5,704
Zimbabwe 2,944 1,506 1,438 1,400 746 654 1,544 760 784
Zambia 10,969 5,173 5,796 3,273 1,378 1,895 7,696 3,795 3,901
Other African Countries
9,529 5,295 4,234 1,578 942 636 7,951 4,353 3,598
China 22,416 12,215 10,201 8,493 4,684 3,809 13,923 7,531 6,392
India 40,902 20,804 20,098 9,073 4,592 4,481 31,829 16,212 15,617
Pakistan 2,953 1,634 1,319 192 128 64 2,761 1,506 1,255
Other Asian Countries 8,509 4,311 4,198 1,787 936 851 6,722 3,375 3,347
Italy 3,858 1,943 1,915 1,554 788 766 2,304 1,155 1,149
Nordic Countries 5,879 2,972 2,907 159 82 77 5,720 2,890 2,830
Great Britain 18,449 9,227 9,222 3,929 2,003 1,926 14,520 7,224 7,296
Germany 7,302 3,475 3,827 1,838 897 941 5,464 2,578 2,886
Other European Countries
8,632 4,292 4,340 2,638 1,333 1,305 5,994 2,959 3,035
Canada 3,675 1,773 1,902 2,204 1,083 1,121 1,471 690 781
USA 16,832 8,288 8,544 9,143 4,543 4,600 7,689 3,745 3,944
Dual Citizenship 9,784 4,886 4,898 6,319 3,109 3,210 3,465 1,777 1,688

32
Table 5. 2: Population Distribution by Status of Birth Certificate, Five Year Age Group and Sex; Tanzania Mainland, 2012 Census
Age Group
Total Has a Birth Certificate Has a Birth Notification Has no Birth Certificate/Notification Doesn't Know
Both Sexes Male Female Both Sexes Male Female Both
Sexes Male Female
Both Sexes
Male Female Both
Sexes Male Female
Total 42,764,449 20,765,147 21,999,302 5,699,722 2,854,351 2,845,371 2,352,395 1,172,035 1,180,360 33,705,438 16,230,497 17,474,941 1,006,894 508,264 498,630
0 - 4 6,973,946 3,487,411 3,486,535 902,702 454,924 447,778 783,562 392,370 391,192 5,168,794 2,581,158 2,587,636 118,888 58,959 59,929
5 - 9 6,391,588 3,199,902 3,191,686 866,154 434,202 431,952 527,350 264,349 263,001 4,882,876 2,444,730 2,438,146 115,208 56,621 58,587
10 - 14 5,539,980 2,766,874 2,773,106 771,853 377,932 393,921 366,574 184,160 182,414 4,295,043 2,153,100 2,141,943 106,510 51,682 54,828
15 - 19 4,354,621 2,119,000 2,235,621 733,089 338,575 394,514 207,174 105,118 102,056 3,314,831 1,628,516 1,686,315 99,527 46,791 52,736
20 - 24 3,696,044 1,661,802 2,034,242 685,137 329,978 355,159 121,560 58,534 63,026 2,798,600 1,228,465 1,570,135 90,747 44,825 45,922
25 - 29 3,203,434 1,448,123 1,755,311 515,249 259,983 255,266 84,501 39,759 44,742 2,518,463 1,102,533 1,415,930 85,221 45,848 39,373
30 - 34 2,759,838 1,299,455 1,460,383 369,710 192,880 176,830 65,703 31,630 34,073 2,247,855 1,031,467 1,216,388 76,570 43,478 33,092
35 - 39 2,316,072 1,116,109 1,199,963 269,178 141,635 127,543 50,941 24,942 25,999 1,931,704 913,119 1,018,585 64,249 36,413 27,836
40 - 44 1,799,981 890,665 909,316 187,155 102,324 84,831 37,105 18,501 18,604 1,524,140 740,406 783,734 51,581 29,434 22,147
45 - 49 1,425,499 676,961 748,538 133,018 70,862 62,156 28,479 13,827 14,652 1,223,689 571,127 652,562 40,313 21,145 19,168
50 - 54 1,150,215 574,318 575,897 96,813 55,372 41,441 22,180 11,036 11,144 997,161 489,910 507,251 34,061 18,000 16,061
55 - 59 738,213 371,920 366,293 60,284 35,218 25,066 14,312 7,213 7,099 641,437 318,315 323,122 22,180 11,174 11,006
60 - 64 737,242 362,372 374,870 43,710 25,515 18,195 13,865 6,853 7,012 654,653 318,272 336,381 25,014 11,732 13,282
65 - 69 474,731 229,408 245,323 22,912 13,134 9,778 8,372 4,052 4,320 426,145 204,621 221,524 17,302 7,601 9,701
70 - 74 459,643 217,389 242,254 17,810 9,570 8,240 7,762 3,654 4,108 414,449 195,876 218,573 19,622 8,289 11,333
75 - 79 283,580 140,155 143,425 10,426 5,482 4,944 4,939 2,443 2,496 255,329 126,620 128,709 12,886 5,610 7,276
80+ 459,822 203,283 256,539 14,522 6,765 7,757 8,016 3,594 4,422 410,269 182,262 228,007 27,015 10,662 16,353

33
Table 5. 3: Population Distribution by Status of Birth Certificate, Five Year Age Group and Sex; Tanzania Mainland Rural, 2012 Census
Age Group
Total Has a Birth Certificate Has a Birth Notification Has no Birth Certificate/Notification Doesn't Know
Both Sexes
Male Female Both
Sexes Male Female
Both Sexes
Male Female Both
Sexes Male Female
Both Sexes
Male Female
Total 30,410,180 14,846,931 15,563,249 1,787,806 917,155 870,651 1,701,890 852,263 849,627 26,272,314 12,759,278 13,513,036 648,170 318,235 329,935
0 - 4 5,318,797 2,658,873 2,659,924 358,088 180,530 177,558 549,947 275,335 274,612 4,318,627 2,157,195 2,161,432 92,135 45,813 46,322
5 - 9 4,913,803 2,470,210 2,443,593 328,859 166,110 162,749 407,071 204,542 202,529 4,092,649 2,057,200 2,035,449 85,224 42,358 42,866
10 - 14 4,151,069 2,101,565 2,049,504 267,570 134,325 133,245 284,352 143,941 140,411 3,525,954 1,786,530 1,739,424 73,193 36,769 36,424
15 - 19 2,927,994 1,482,629 1,445,365 202,658 99,734 102,924 151,004 78,859 72,145 2,518,000 1,275,914 1,242,086 56,332 28,122 28,210
20 - 24 2,321,422 1,054,884 1,266,538 173,949 87,482 86,467 81,172 40,007 41,165 2,017,239 904,115 1,113,124 49,062 23,280 25,782
25 - 29 1,998,383 898,881 1,099,502 126,061 67,728 58,333 53,267 25,297 27,970 1,774,867 783,814 991,053 44,188 22,042 22,146
30 - 34 1,754,051 814,659 939,392 87,115 47,047 40,068 40,789 19,463 21,326 1,586,089 727,155 858,934 40,058 20,994 19,064
35 - 39 1,528,478 723,501 804,977 65,593 34,961 30,632 32,476 15,555 16,921 1,395,507 654,569 740,938 34,902 18,416 16,486
40 - 44 1,232,649 597,543 635,106 48,155 26,588 21,567 24,411 11,982 12,429 1,130,213 543,200 587,013 29,870 15,773 14,097
45 - 49 996,243 469,905 526,338 36,921 20,057 16,864 19,283 9,312 9,971 915,504 428,462 487,042 24,535 12,074 12,461
50 - 54 832,794 407,429 425,365 29,989 16,972 13,017 15,304 7,470 7,834 764,795 371,761 393,034 22,706 11,226 11,480
55 - 59 534,859 264,082 270,777 19,352 11,537 7,815 9,950 4,939 5,011 490,230 240,506 249,724 15,327 7,100 8,227
60 - 64 557,124 268,827 288,297 15,352 9,037 6,315 10,064 4,839 5,225 513,180 246,687 266,493 18,528 8,264 10,264
65 - 69 369,829 175,970 193,859 8,605 4,827 3,778 6,288 2,971 3,317 341,371 162,402 178,969 13,565 5,770 7,795
70 - 74 367,408 174,082 193,326 7,647 4,137 3,510 6,075 2,867 3,208 337,887 160,439 177,448 15,799 6,639 9,160
75 - 79 229,367 114,112 115,255 4,729 2,576 2,153 3,977 1,978 1,999 210,114 104,945 105,169 10,547 4,613 5,934
80+ 375,910 169,779 206,131 7,163 3,507 3,656 6,460 2,906 3,554 340,088 154,384 185,704 22,199 8,982 13,217
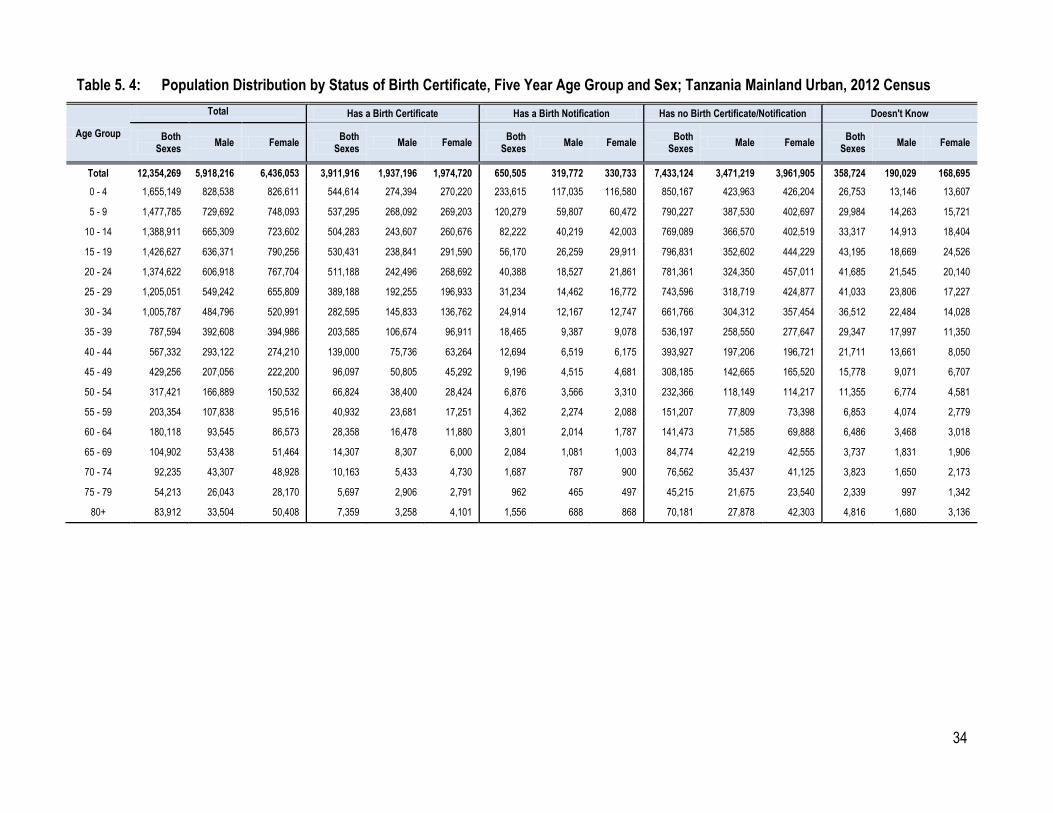
34
Table 5. 4: Population Distribution by Status of Birth Certificate, Five Year Age Group and Sex; Tanzania Mainland Urban, 2012 Census
Age Group
Total Has a Birth Certificate Has a Birth Notification Has no Birth Certificate/Notification Doesn't Know
Both Sexes
Male Female Both
Sexes Male Female
Both Sexes
Male Female Both
Sexes Male Female
Both Sexes
Male Female
Total 12,354,269 5,918,216 6,436,053 3,911,916 1,937,196 1,974,720 650,505 319,772 330,733 7,433,124 3,471,219 3,961,905 358,724 190,029 168,695
0 - 4 1,655,149 828,538 826,611 544,614 274,394 270,220 233,615 117,035 116,580 850,167 423,963 426,204 26,753 13,146 13,607
5 - 9 1,477,785 729,692 748,093 537,295 268,092 269,203 120,279 59,807 60,472 790,227 387,530 402,697 29,984 14,263 15,721
10 - 14 1,388,911 665,309 723,602 504,283 243,607 260,676 82,222 40,219 42,003 769,089 366,570 402,519 33,317 14,913 18,404
15 - 19 1,426,627 636,371 790,256 530,431 238,841 291,590 56,170 26,259 29,911 796,831 352,602 444,229 43,195 18,669 24,526
20 - 24 1,374,622 606,918 767,704 511,188 242,496 268,692 40,388 18,527 21,861 781,361 324,350 457,011 41,685 21,545 20,140
25 - 29 1,205,051 549,242 655,809 389,188 192,255 196,933 31,234 14,462 16,772 743,596 318,719 424,877 41,033 23,806 17,227
30 - 34 1,005,787 484,796 520,991 282,595 145,833 136,762 24,914 12,167 12,747 661,766 304,312 357,454 36,512 22,484 14,028
35 - 39 787,594 392,608 394,986 203,585 106,674 96,911 18,465 9,387 9,078 536,197 258,550 277,647 29,347 17,997 11,350
40 - 44 567,332 293,122 274,210 139,000 75,736 63,264 12,694 6,519 6,175 393,927 197,206 196,721 21,711 13,661 8,050
45 - 49 429,256 207,056 222,200 96,097 50,805 45,292 9,196 4,515 4,681 308,185 142,665 165,520 15,778 9,071 6,707
50 - 54 317,421 166,889 150,532 66,824 38,400 28,424 6,876 3,566 3,310 232,366 118,149 114,217 11,355 6,774 4,581
55 - 59 203,354 107,838 95,516 40,932 23,681 17,251 4,362 2,274 2,088 151,207 77,809 73,398 6,853 4,074 2,779
60 - 64 180,118 93,545 86,573 28,358 16,478 11,880 3,801 2,014 1,787 141,473 71,585 69,888 6,486 3,468 3,018
65 - 69 104,902 53,438 51,464 14,307 8,307 6,000 2,084 1,081 1,003 84,774 42,219 42,555 3,737 1,831 1,906
70 - 74 92,235 43,307 48,928 10,163 5,433 4,730 1,687 787 900 76,562 35,437 41,125 3,823 1,650 2,173
75 - 79 54,213 26,043 28,170 5,697 2,906 2,791 962 465 497 45,215 21,675 23,540 2,339 997 1,342
80+ 83,912 33,504 50,408 7,359 3,258 4,101 1,556 688 868 70,181 27,878 42,303 4,816 1,680 3,136

35
Table 5. 5: Population Distribution by Status of Birth Certificate, Region and Sex; Tanzania Mainland, 2012 Census.
Region
Total Has a Birth Certificate Has a Birth Notification Has no Birth Certificate/Notification Doesn't Know
Both Sexes
Male Female Both
Sexes Male Female
Both Sexes
Male Female Both
Sexes Male Female
Both Sexes
Male Female
Tanzania Mainland 42,764,449 20,765,147 21,999,302 5,699,722 2,854,351 2,845,371 2,352,395 1,172,035 1,180,360 33,705,438 16,230,497 17,474,941 1,006,894 508,264 498,630
Dodoma 2,050,672 996,184 1,054,488 166,520 84,188 82,332 91,621 46,487 45,134 1,745,343 842,449 902,894 47,188 23,060 24,128
Arusha 1,662,618 802,426 860,192 359,950 177,216 182,734 82,317 41,054 41,263 1,179,606 563,809 615,797 40,745 20,347 20,398
Kilimanjaro 1,601,106 774,202 826,904 342,503 169,636 172,867 162,326 81,082 81,244 1,059,780 505,110 554,670 36,497 18,374 18,123
Tanga 2,020,221 977,798 1,042,423 200,913 100,493 100,420 94,765 47,438 47,327 1,685,948 810,264 875,684 38,595 19,603 18,992
Morogoro 2,175,011 1,067,719 1,107,292 238,788 120,267 118,521 101,603 51,127 50,476 1,775,196 865,431 909,765 59,424 30,894 28,530
Pwani 1,073,170 523,464 549,706 155,348 78,623 76,725 67,665 34,170 33,495 818,836 394,432 424,404 31,321 16,239 15,082
Dar es Salaam 4,279,032 2,077,246 2,201,786 1,729,568 856,751 872,817 302,964 149,236 153,728 2,084,741 985,304 1,099,437 161,759 85,955 75,804
Lindi 852,658 407,310 445,348 61,412 31,390 30,022 24,486 12,157 12,329 744,749 353,224 391,525 22,011 10,539 11,472
Mtwara 1,249,766 588,386 661,380 89,683 45,383 44,300 35,779 17,790 17,989 1,097,938 512,632 585,306 26,366 12,581 13,785
Ruvuma 1,346,966 653,290 693,676 89,084 45,451 43,633 75,604 37,306 38,298 1,154,330 556,775 597,555 27,948 13,758 14,190
Iringa 920,776 441,214 479,562 107,661 54,512 53,149 35,334 17,305 18,029 764,763 362,705 402,058 13,018 6,692 6,326
Mbeya 2,671,117 1,276,804 1,394,313 300,593 150,480 150,113 65,314 32,094 33,220 2,256,842 1,070,690 1,186,152 48,368 23,540 24,828
Singida 1,345,531 664,437 681,094 102,883 52,310 50,573 88,054 44,868 43,186 1,119,655 549,941 569,714 34,939 17,318 17,621
Tabora 2,250,921 1,107,020 1,143,901 178,028 90,017 88,011 101,281 50,915 50,366 1,900,375 930,437 969,938 71,237 35,651 35,586
Rukwa 991,912 480,368 511,544 65,357 33,339 32,018 36,002 17,730 18,272 866,695 417,468 449,227 23,858 11,831 12,027
Kigoma 1,984,358 956,451 1,027,907 171,199 87,634 83,565 123,501 61,188 62,313 1,656,695 791,648 865,047 32,963 15,981 16,982
Shinyanga 1,510,029 737,181 772,848 133,718 67,601 66,117 65,234 32,592 32,642 1,277,826 620,206 657,620 33,251 16,782 16,469
Kagera 2,423,142 1,186,037 1,237,105 300,638 150,473 150,165 254,394 125,458 128,936 1,831,880 891,949 939,931 36,230 18,157 18,073
Mwanza 2,719,487 1,328,132 1,391,355 358,295 178,976 179,319 136,789 68,034 68,755 2,170,843 1,053,563 1,117,280 53,560 27,559 26,001
Mara 1,706,891 819,776 887,115 139,596 71,933 67,663 78,608 39,531 39,077 1,460,780 694,681 766,099 27,907 13,631 14,276
Manyara 1,405,957 705,868 700,089 123,482 63,228 60,254 121,580 61,777 59,803 1,126,948 563,577 563,371 33,947 17,286 16,661
Njombe 689,846 323,481 366,365 58,883 29,872 29,011 15,966 7,835 8,131 604,715 281,019 323,696 10,282 4,755 5,527
Katavi 555,339 274,393 280,946 36,744 19,003 17,741 13,998 7,008 6,990 493,769 242,689 251,080 10,828 5,693 5,135
Simiyu 1,566,578 750,225 816,353 70,089 35,448 34,641 95,048 46,901 48,147 1,362,762 649,064 713,698 38,679 18,812 19,867
Geita 1,711,345 845,735 865,610 118,787 60,127 58,660 82,162 40,952 41,210 1,464,423 721,430 742,993 45,973 23,226 22,747

36
Chapter Six
Survival of Parents (Orphan hood)
Tables on survival of parents present the population in private households by sex, age group, rural and
urban areas. They also show the survival of parents for children below the age of 18 years by region,
sex, rural and urban areas.

37
Table 6.1: Population Distribution by Selected Age Groups and Survival of Parents; Tanzania Mainland, 2012 Census
Age Group
Total Father Alive
Mother Alive Father Alive
Mother Dead Father Dead Mother Alive
Father Dead Mother Dead
Total 42,764,449 29,887,109 1,942,676 5,643,588 5,291,076
< 1 1,434,567 1,404,428 8,053 17,353 4,733
1 - 4 5,539,379 5,353,732 47,470 115,022 23,155
5 - 9 6,391,588 5,993,355 97,704 251,412 49,116
10 - 14 5,539,980 4,925,347 148,662 376,225 89,746
15 - 19 4,354,621 3,542,533 193,696 473,653 144,739
20 - 24 3,696,044 2,655,279 235,934 586,961 217,871
25+ 15,808,270 6,012,435 1,211,159 3,822,963 4,761,714
Table 6.2: Male Population by Selected Age Groups and Survival of Parents; Tanzania Mainland, 2012 Census
Age Group
Total Father Alive
Mother Alive Father Alive
Mother Dead Father Dead Mother Alive
Father Dead Mother Dead
Total 20,765,147 14,686,768 928,648 2,712,953 2,436,778
< 1 715,187 700,035 4,053 8,705 2,393
1 - 4 2,772,224 2,680,355 23,547 57,131 11,191
5 - 9 3,199,902 3,000,224 48,979 126,528 24,171
10 - 14 2,766,874 2,461,700 74,039 187,420 43,716
15 - 19 2,119,000 1,735,283 90,356 225,413 67,948
20 - 24 1,661,802 1,213,492 100,494 256,269 91,547
25+ 7,530,158 2,895,678 587,180 1,851,487 2,195,813
Table 6.3: Female Population by Selected Age Groups and Survival of Parents; Tanzania Mainland, 2012 Census
Age Group
Total Father Alive
Mother Alive Father Alive
Mother Dead Father Dead Mother Alive
Father Dead Mother Dead
Total 21,999,302 15,200,341 1,014,029 2,930,634 2,854,297
< 1 719,380 704,393 4,000 8,648 2,340
1 - 4 2,767,155 2,673,378 23,922 57,891 11,964
5 - 9 3,191,686 2,993,131 48,725 124,884 24,946
10 - 14 2,773,106 2,463,647 74,624 188,806 46,030
15 - 19 2,235,621 1,807,249 103,340 248,241 76,791
20 - 24 2,034,242 1,441,788 135,439 330,691 126,324
25+ 8,278,112 3,116,756 623,981 1,971,475 2,565,902

38
Table 6.4: Population Distribution by Selected Age Groups and Survival of Parents; Tanzania Mainland Rural, 2012 Census
Age Group
Total Father Alive
Mother Alive Father Alive
Mother Dead Father Dead Mother Alive
Father Dead Mother Dead
Total 27,501,202 19,604,104 1,117,095 3,376,577 3,403,426
< 1 969,784 949,392 5,260 11,964 3,167
1 - 4 3,913,303 3,783,321 31,803 82,732 15,447
5 - 9 4,498,927 4,228,401 64,867 173,946 31,713
10 - 14 3,765,990 3,372,689 93,507 246,466 53,327
15 - 19 2,617,297 2,172,565 104,230 268,759 71,743
20 - 24 2,065,714 1,525,702 119,537 317,897 102,577
25+ 9,670,187 3,572,033 697,892 2,274,811 3,125,453
Table 6.5: Population Distribution by Selected Age Groups and Survival of Parents; Tanzania Mainland Urban, 2012 Census
Age Group
Total Father Alive
Mother Alive Father Alive
Mother Dead Father Dead Mother Alive
Father Dead Mother Dead
Total 15,263,247 10,283,006 825,581 2,267,011 1,887,650
< 1 464,783 455,036 2,793 5,388 1,566
1 - 4 1,626,076 1,570,412 15,666 32,290 7,709
5 - 9 1,892,661 1,764,954 32,837 77,467 17,404
10 - 14 1,773,990 1,552,658 55,155 129,759 36,418
15 - 19 1,737,324 1,369,968 89,466 204,894 72,996
20 - 24 1,630,330 1,129,577 116,396 269,063 115,294
25+ 6,138,083 2,440,401 513,268 1,548,152 1,636,262

39
Table 6.6: Population of Children below 18 Years of Age by Survival of Parents and Region; Tanzania Mainland, 2012 Census
Region Total Population
of Age 0-17 Years Father Alive
Mother Alive Father Alive
Mother Dead Father Dead Mother Alive
Father Dead Mother Dead
Tanzania Mainland 21,537,848 19,878,144 404,537 1,017,818 237,349
Rural 16,187,357 15,013,052 280,361 736,848 157,096
Urban 5,350,491 4,865,092 124,176 280,970 80,253
Dodoma 1,059,399 985,686 18,109 46,192 9,412
Arusha 810,089 753,425 10,405 39,850 6,408
Kilimanjaro 719,521 663,932 13,059 34,994 7,536
Tanga 1,000,956 928,837 19,280 42,957 9,882
Morogoro 1,035,482 960,126 20,953 43,414 10,989
Pwani 491,158 450,805 11,065 23,376 5,912
Dar es Salaam 1,623,600 1,478,766 41,287 79,876 23,671
Lindi 381,394 353,347 8,083 16,434 3,531
Mtwara 546,621 508,642 10,649 22,420 4,910
Ruvuma 662,678 616,376 12,535 27,130 6,636
Iringa 449,419 384,843 15,169 36,655 12,753
Mbeya 1,328,576 1,184,577 31,757 85,111 27,131
Singida 714,335 669,770 10,671 28,405 5,489
Tabora 1,235,337 1,160,023 22,071 42,559 10,684
Rukwa 561,403 524,944 8,972 22,265 5,222
Kigoma 1,092,015 1,028,502 14,392 42,312 6,809
Shinyanga 819,005 762,070 15,652 32,697 8,585
Kagera 1,314,058 1,207,039 23,624 69,521 13,874
Mwanza 1,456,360 1,352,398 26,435 63,072 14,455
Mara 955,335 860,358 16,030 68,309 10,638
Manyara 751,131 707,095 9,946 29,701 4,389
Njombe 335,741 289,532 9,236 28,437 8,536
Katavi 309,522 288,567 6,069 11,636 3,249
Simiyu 907,004 842,278 13,155 43,140 8,431
Geita 977,709 916,207 15,933 37,354 8,215
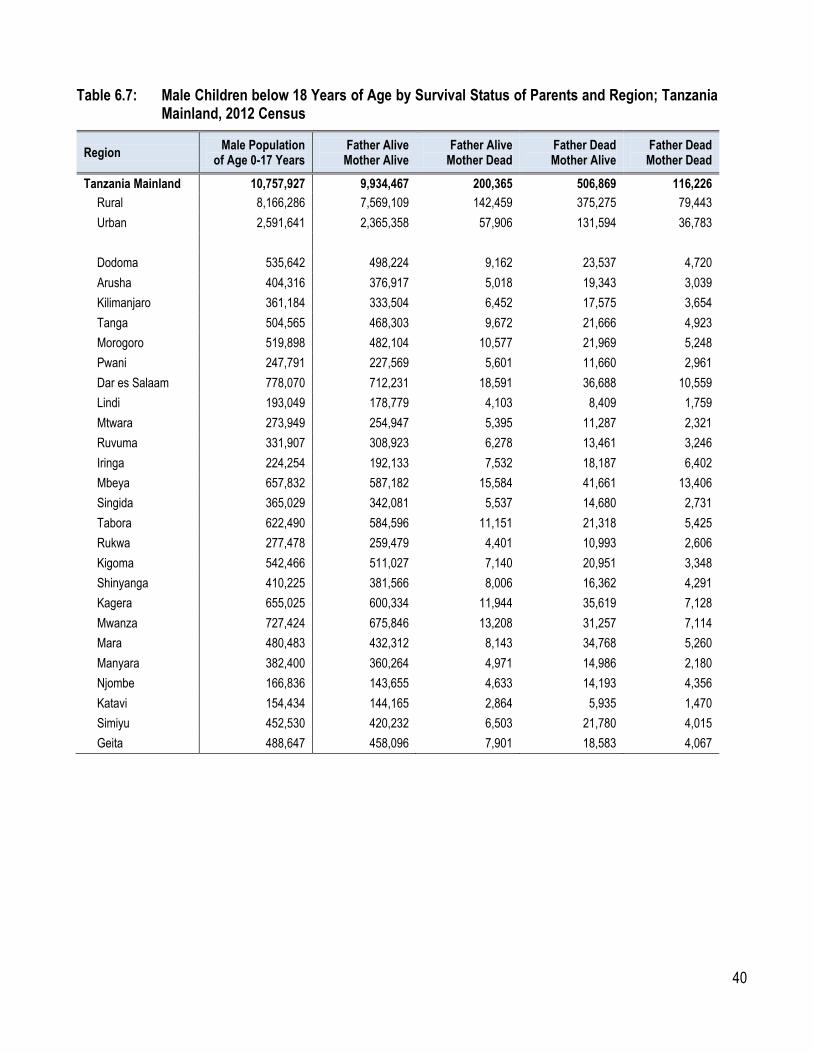
40
Table 6.7: Male Children below 18 Years of Age by Survival Status of Parents and Region; Tanzania Mainland, 2012 Census
Region Male Population
of Age 0-17 Years Father Alive
Mother Alive Father Alive
Mother Dead Father Dead Mother Alive
Father Dead Mother Dead
Tanzania Mainland 10,757,927 9,934,467 200,365 506,869 116,226
Rural 8,166,286 7,569,109 142,459 375,275 79,443
Urban 2,591,641 2,365,358 57,906 131,594 36,783
Dodoma 535,642 498,224 9,162 23,537 4,720
Arusha 404,316 376,917 5,018 19,343 3,039
Kilimanjaro 361,184 333,504 6,452 17,575 3,654
Tanga 504,565 468,303 9,672 21,666 4,923
Morogoro 519,898 482,104 10,577 21,969 5,248
Pwani 247,791 227,569 5,601 11,660 2,961
Dar es Salaam 778,070 712,231 18,591 36,688 10,559
Lindi 193,049 178,779 4,103 8,409 1,759
Mtwara 273,949 254,947 5,395 11,287 2,321
Ruvuma 331,907 308,923 6,278 13,461 3,246
Iringa 224,254 192,133 7,532 18,187 6,402
Mbeya 657,832 587,182 15,584 41,661 13,406
Singida 365,029 342,081 5,537 14,680 2,731
Tabora 622,490 584,596 11,151 21,318 5,425
Rukwa 277,478 259,479 4,401 10,993 2,606
Kigoma 542,466 511,027 7,140 20,951 3,348
Shinyanga 410,225 381,566 8,006 16,362 4,291
Kagera 655,025 600,334 11,944 35,619 7,128
Mwanza 727,424 675,846 13,208 31,257 7,114
Mara 480,483 432,312 8,143 34,768 5,260
Manyara 382,400 360,264 4,971 14,986 2,180
Njombe 166,836 143,655 4,633 14,193 4,356
Katavi 154,434 144,165 2,864 5,935 1,470
Simiyu 452,530 420,232 6,503 21,780 4,015
Geita 488,647 458,096 7,901 18,583 4,067

41
Table 6.8: Female Children below 18 Years of Age by Survival of Parents and Region; Tanzania Mainland, 2012 Census
Region Female Population of Age 0-17 Years
Father Alive Mother Alive
Father Alive Mother Dead
Father Dead Mother Alive
Father Dead Mother Dead
Tanzania Mainland 10,779,921 9,943,677 204,172 510,949 121,123
Rural 8,021,071 7,443,944 137,901 361,573 77,653
Urban 2,758,850 2,499,734 66,271 149,376 43,470
Dodoma 523,757 487,462 8,947 22,655 4,692
Arusha 405,773 376,509 5,387 20,507 3,370
Kilimanjaro 358,337 330,428 6,607 17,419 3,882
Tanga 496,391 460,534 9,608 21,290 4,960
Morogoro 515,584 478,022 10,375 21,446 5,740
Pwani 243,367 223,236 5,464 11,716 2,951
Dar es Salaam 845,530 766,534 22,696 43,187 13,112
Lindi 188,345 174,568 3,980 8,025 1,772
Mtwara 272,672 253,696 5,254 11,133 2,590
Ruvuma 330,771 307,453 6,257 13,669 3,391
Iringa 225,165 192,710 7,637 18,467 6,351
Mbeya 670,744 597,395 16,173 43,450 13,725
Singida 349,306 327,690 5,134 13,724 2,759
Tabora 612,847 575,426 10,920 21,241 5,260
Rukwa 283,925 265,465 4,572 11,272 2,617
Kigoma 549,549 517,475 7,252 21,361 3,461
Shinyanga 408,780 380,504 7,646 16,335 4,294
Kagera 659,033 606,705 11,680 33,902 6,746
Mwanza 728,936 676,553 13,226 31,815 7,341
Mara 474,852 428,046 7,887 33,541 5,378
Manyara 368,731 346,831 4,976 14,715 2,209
Njombe 168,905 145,877 4,603 14,244 4,180
Katavi 155,088 144,402 3,206 5,701 1,779
Simiyu 454,474 422,046 6,652 21,360 4,416
Geita 489,062 458,111 8,032 18,771 4,149

42
Table 6.9: Population of Children Age below 18 Years of Age by Survival Status of Parents and Region; Tanzania Mainland Rural, 2012 Census
Region Rural Population
of Age 0-17 Years Father Alive
Mother Alive Father Alive
Mother Dead Father Dead Mother Alive
Father Dead Mother Dead
Tanzania Mainland 16,187,357 15,013,052 280,361 736,848 157,096
Dodoma 925,029 863,353 15,069 38,983 7,625
Arusha 584,589 543,773 6,675 30,013 4,129
Kilimanjaro 555,886 512,373 9,991 27,835 5,687
Tanga 810,069 755,220 14,437 33,334 7,078
Morogoro 769,311 717,728 14,343 30,137 7,103
Pwani 340,984 314,258 7,335 15,815 3,576
Dar es Salaam N/A N/A N/A N/A N/A
Lindi 315,279 293,238 6,427 12,961 2,653
Mtwara 427,839 399,950 7,996 16,434 3,459
Ruvuma 507,554 475,435 9,061 18,768 4,290
Iringa 341,566 294,053 11,292 27,223 8,998
Mbeya 919,652 824,660 21,169 56,777 17,046
Singida 640,133 602,029 9,011 24,655 4,439
Tabora 1,110,780 1,046,558 18,876 36,482 8,864
Rukwa 438,337 412,676 6,477 15,613 3,571
Kigoma 908,686 858,869 11,292 33,568 4,957
Shinyanga 707,937 660,651 13,173 27,002 7,111
Kagera 1,212,184 1,114,751 21,502 63,647 12,284
Mwanza 1,022,992 954,324 17,798 41,344 9,525
Mara 806,057 725,435 13,218 58,998 8,406
Manyara 664,742 626,367 8,569 26,233 3,573
Njombe 262,442 227,774 6,806 21,777 6,086
Katavi 227,508 213,778 4,217 7,420 2,093
Simiyu 853,343 793,356 12,099 40,208 7,680
Geita 834,458 782,445 13,528 31,621 6,865
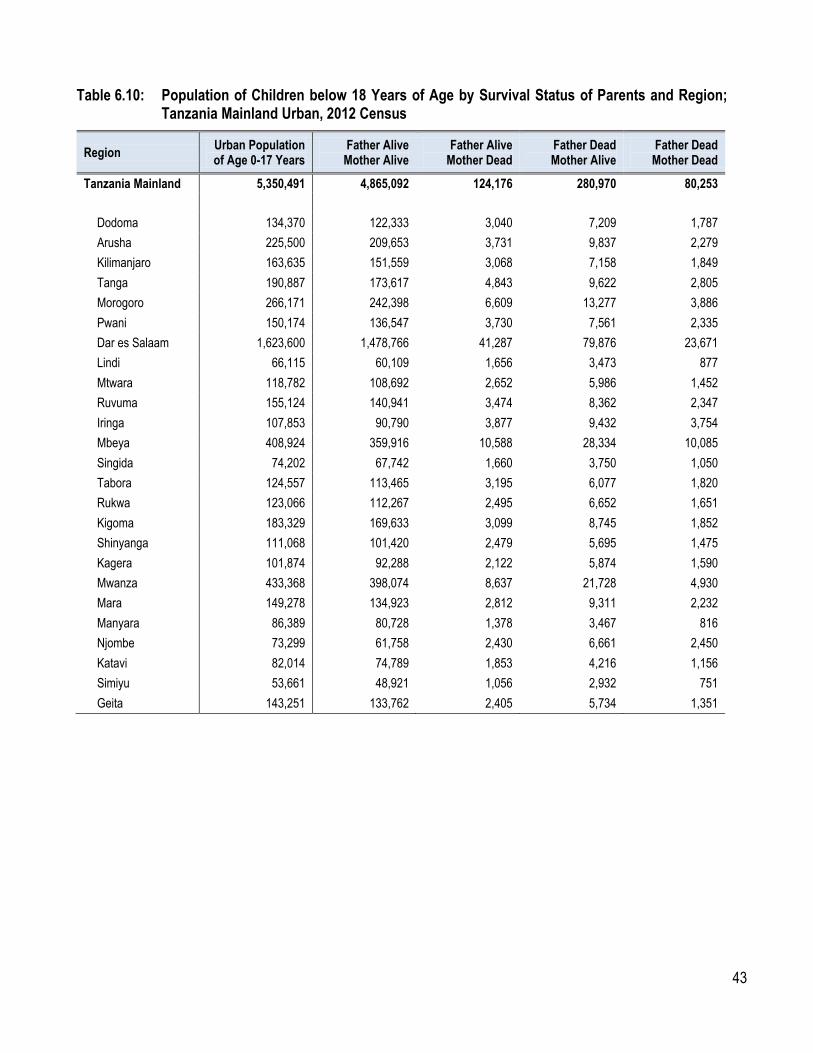
43
Table 6.10: Population of Children below 18 Years of Age by Survival Status of Parents and Region; Tanzania Mainland Urban, 2012 Census
Region Urban Population of Age 0-17 Years
Father Alive Mother Alive
Father Alive Mother Dead
Father Dead Mother Alive
Father Dead Mother Dead
Tanzania Mainland 5,350,491 4,865,092 124,176 280,970 80,253
Dodoma 134,370 122,333 3,040 7,209 1,787
Arusha 225,500 209,653 3,731 9,837 2,279
Kilimanjaro 163,635 151,559 3,068 7,158 1,849
Tanga 190,887 173,617 4,843 9,622 2,805
Morogoro 266,171 242,398 6,609 13,277 3,886
Pwani 150,174 136,547 3,730 7,561 2,335
Dar es Salaam 1,623,600 1,478,766 41,287 79,876 23,671
Lindi 66,115 60,109 1,656 3,473 877
Mtwara 118,782 108,692 2,652 5,986 1,452
Ruvuma 155,124 140,941 3,474 8,362 2,347
Iringa 107,853 90,790 3,877 9,432 3,754
Mbeya 408,924 359,916 10,588 28,334 10,085
Singida 74,202 67,742 1,660 3,750 1,050
Tabora 124,557 113,465 3,195 6,077 1,820
Rukwa 123,066 112,267 2,495 6,652 1,651
Kigoma 183,329 169,633 3,099 8,745 1,852
Shinyanga 111,068 101,420 2,479 5,695 1,475
Kagera 101,874 92,288 2,122 5,874 1,590
Mwanza 433,368 398,074 8,637 21,728 4,930
Mara 149,278 134,923 2,812 9,311 2,232
Manyara 86,389 80,728 1,378 3,467 816
Njombe 73,299 61,758 2,430 6,661 2,450
Katavi 82,014 74,789 1,853 4,216 1,156
Simiyu 53,661 48,921 1,056 2,932 751
Geita 143,251 133,762 2,405 5,734 1,351

44
Table 6.11: Distribution of Children below 18 Years of Age by Survival of Parents and Region; Tanzania Mainland, 2012 Census
Region Total Population of Age 0-17 Years Father Alive Mother Dead Father Dead Mother Alive Father Dead Mother Dead One or Both Parents Dead
Both Sexes Male Female Both Sexes Male Female Both Sexes Male Female Both Sexes Male Female Both Sexes Male Female
Tanzania Mainland 21,537,848 10,757,927 10,779,921 404,537 200,365 204,172 1,017,818 506,869 510,949 237,349 116,226 121,123 1,659,704 823,460 836,244
Rural 16,187,357 8,166,286 8,021,071 280,361 142,459 137,901 736,848 375,275 361,573 157,096 79,443 77,653 1,174,305 597,177 577,127
Urban 5,350,491 2,591,641 2,758,850 124,176 57,906 66,271 280,970 131,594 149,376 80,253 36,783 43,470 485,399 226,283 259,117
Dodoma 1,059,399 535,642 523,757 18,109 9,162 8,947 46,192 23,537 22,655 9,412 4,720 4,692 73,713 37,419 36,294
Arusha 810,089 404,316 405,773 10,405 5,018 5,387 39,850 19,343 20,507 6,409 3,039 3,370 56,664 27,400 29,264
Kilimanjaro 719,521 361,184 358,337 13,059 6,452 6,607 34,994 17,575 17,419 7,536 3,654 3,882 55,589 27,681 27,908
Tanga 1,000,956 504,565 496,391 19,280 9,672 9,608 42,956 21,666 21,290 9,883 4,923 4,960 72,119 36,261 35,858
Morogoro 1,035,482 519,898 515,584 20,952 10,577 10,375 43,415 21,969 21,446 10,988 5,248 5,740 75,355 37,794 37,561
Pwani 491,158 247,791 243,367 11,065 5,601 5,464 23,376 11,660 11,716 5,912 2,961 2,951 40,353 20,222 20,131
Dar es Salaam 1,623,600 778,070 845,530 41,287 18,591 22,696 79,875 36,688 43,187 23,671 10,559 13,112 144,833 65,838 78,995
Lindi 381,394 193,049 188,345 8,083 4,103 3,980 16,434 8,409 8,025 3,531 1,759 1,772 28,048 14,271 13,777
Mtwara 546,621 273,949 272,672 10,649 5,395 5,254 22,420 11,287 11,133 4,911 2,321 2,590 37,980 19,003 18,977
Ruvuma 662,678 331,907 330,771 12,535 6,278 6,257 27,130 13,461 13,669 6,637 3,246 3,391 46,302 22,985 23,317
Iringa 449,419 224,254 225,165 15,169 7,532 7,637 36,654 18,187 18,467 12,753 6,402 6,351 64,576 32,121 32,455
Mbeya 1,328,576 657,832 670,744 31,757 15,584 16,173 85,111 41,661 43,450 27,131 13,406 13,725 143,999 70,651 73,348
Singida 714,335 365,029 349,306 10,671 5,537 5,134 28,404 14,680 13,724 5,490 2,731 2,759 44,565 22,948 21,617
Tabora 1,235,337 622,490 612,847 22,071 11,151 10,920 42,559 21,318 21,241 10,685 5,425 5,260 75,315 37,894 37,421
Rukwa 561,403 277,478 283,925 8,973 4,401 4,572 22,265 10,993 11,272 5,223 2,606 2,617 36,461 18,000 18,461
Kigoma 1,092,015 542,466 549,549 14,392 7,140 7,252 42,312 20,951 21,361 6,809 3,348 3,461 63,513 31,439 32,074
Shinyanga 819,005 410,225 408,780 15,652 8,006 7,646 32,697 16,362 16,335 8,585 4,291 4,294 56,934 28,659 28,275
Kagera 1,314,058 655,025 659,033 23,624 11,944 11,680 69,521 35,619 33,902 13,874 7,128 6,746 107,019 54,691 52,328
Mwanza 1,456,360 727,424 728,936 26,434 13,208 13,226 63,072 31,257 31,815 14,455 7,114 7,341 103,961 51,579 52,382
Mara 955,335 480,483 474,852 16,030 8,143 7,887 68,309 34,768 33,541 10,638 5,260 5,378 94,977 48,171 46,806
Manyara 751,131 382,400 368,731 9,947 4,971 4,976 29,701 14,986 14,715 4,389 2,180 2,209 44,037 22,137 21,900
Njombe 335,741 166,836 168,905 9,236 4,633 4,603 28,437 14,193 14,244 8,536 4,356 4,180 46,209 23,182 23,027
Katavi 309,522 154,434 155,088 6,070 2,864 3,206 11,636 5,935 5,701 3,249 1,470 1,779 20,955 10,269 10,686
Simiyu 907,004 452,530 454,474 13,155 6,503 6,652 43,140 21,780 21,360 8,431 4,015 4,416 64,726 32,298 32,428
Geita 977,709 488,647 489,062 15,933 7,901 8,032 37,354 18,583 18,771 8,216 4,067 4,149 61,503 30,551 30,952

45
Chapter Seven
Diaspora
Tables on diaspora give the distribution of diaspora and households with diasporas by region,
place of origin, number of persons living abroad, sex, country of residence, rural-urban and
remittance status.

46
Table 7.1: Number of Households with Diaspora by Region; Tanzania Mainland, 2012 Census
Region
Total Households Rural
Urban
Total
Households
Total Households
with Diaspora
Total Households
Total Households
with Diaspora
Total Households
Total Households
with Diaspora
Tanzania Mainland 9,026,785 107,021 6,054,641 53,740 2,972,144 53,281
Dodoma 450,305 1,685 377,320 909 72,985 776
Arusha 376,336 7,041 235,827 5,065 140,509 1,976
Kilimanjaro 381,526 8,656 284,601 7,071 96,925 1,585
Tanga 435,583 8,924 338,875 6,037 96,708 2,887
Morogoro 501,794 2,660 350,458 1,070 151,336 1,590
Pwani 254,810 1,792 169,937 879 84,873 913
Dar es Salaam 1,083,381 26,107 N/A N/A 1,083,381 26,107
Lindi 224,316 2,225 180,289 1,434 44,027 791
Mtwara 342,165 5,020 264,596 3,918 77,569 1,102
Ruvuma 300,005 2,838 222,994 1,718 77,011 1,120
Iringa 220,776 1,190 159,618 525 61,158 665
Mbeya 630,593 9,298 417,310 5,783 213,283 3,515
Singida 255,613 3,378 218,621 2,578 36,992 800
Tabora 379,770 1,557 316,065 716 63,705 841
Rukwa 198,011 2,584 148,698 1,857 49,313 727
Kigoma 370,374 2,149 299,351 1,184 71,023 965
Shinyanga 258,981 1,195 202,172 494 56,809 701
Kagera 521,028 7,894 465,595 6,697 55,433 1,197
Mwanza 481,107 3,534 293,904 931 187,203 2,603
Mara 308,483 3,663 248,001 2,659 60,482 1,004
Manyara 271,050 1,153 228,012 771 43,038 382
Njombe 168,982 543 128,712 293 40,270 250
Katavi 100,350 461 69,476 228 30,874 233
Simiyu 227,862 655 205,495 452 22,367 203
Geita 283,584 819 228,714 471 54,870 348

47
Table 7. 2: Number of Households with Diaspora by Number of Persons Living Abroad and Region; Tanzania Mainland, 2012 Census
Region Total 1 Person 2 -4
Persons 5 - 9
Persons 10+
Persons
Tanzania Mainland 107,021 76,602 26,805 3,303 311
Dodoma 1,685 1,280 357 43 5
Arusha 7,041 5,700 1,241 96 4
Kilimanjaro 8,656 6,260 2,150 236 10
Tanga 8,924 6,295 2,372 232 25
Morogoro 2,660 2,009 588 58 5
Pwani 1,792 1,351 393 41 7
Dar es Salaam 26,107 18,065 7,094 859 89
Lindi 2,225 1,587 544 83 11
Mtwara 5,020 3,682 1,131 187 20
Ruvuma 2,838 2,206 539 85 8
Iringa 1,190 941 227 20 2
Mbeya 9,298 6,495 2,499 280 24
Singida 3,378 2,392 953 31 2
Tabora 1,557 1,127 363 62 5
Rukwa 2,584 1,570 816 179 19
Kigoma 2,149 1,502 515 112 20
Shinyanga 1,195 900 253 41 1
Kagera 7,894 5,330 2,227 312 25
Mwanza 3,534 2,572 844 105 13
Mara 3,663 2,502 990 164 7
Manyara 1,153 916 226 11 0
Njombe 543 449 89 5 0
Katavi 461 333 100 26 2
Simiyu 655 529 116 8 2
Geita 819 609 178 27 5

48
Table 7.3: Number of Persons Living Outside Tanzania by Place of Origin (Rural and Urban Areas); Tanzania Mainland, 2012 Census
Country of Residence Total Rural Urban
Total 405,417 196,419 208,998
Angola 505 174 331
Botswana 2,880 837 2043
Burundi 9,679 7,183 2496
Comoro 1,680 763 917
Kenya 85,901 58,173 27,728
Lesotho 3,506 2,578 928
Malawi 16,987 9,619 7,368
Mauritius 420 175 245
Mozambique 40,078 27,346 12,732
Namibia 656 298 358
Rwanda 6,896 4,688 2208
Seychelles 345 132 213
Somalia 1,716 919 797
Swaziland 1,659 402 1257
South Africa 22,755 3,817 18,938
Uganda 31,064 21,401 9,663
Republic of Congo 11,708 5,568 6,140
Zimbabwe 1,762 683 1079
Zambia 32,298 21,617 10,681
Other African Countries 5,660 1435 4,225
China 2,408 462 1946
India 5,999 900 5,099
Pakistan 1,357 143 1214
Other Asian Countries 14,988 3,275 11,713
Italy 3,089 809 2280
Nordic Countries 7,238 1397 5,841
Great Britain 27,774 4,002 23,772
Germany 8,068 3,956 4,112
Other European Countries 8,757 1684 7,073
Canada 6,642 941 5,701
USA 36,957 7,926 29,031
Not Reported 3,985 3,116 869

49
Table 7.4: Number Persons Living Outside Tanzania by Country of Residence and Sex; Tanzania Mainland, 2012 Census
Country of Residence Total Male Diaspora Female Diaspora
Total 405,417 225,390 180,027
Angola 505 321 184
Botswana 2,880 1,773 1,107
Burundi 9,679 4,920 4,759
Comoro 1,680 1,017 663
Kenya 85,901 47,700 38,201
Lesotho 3,506 1,809 1,697
Malawi 16,987 9,180 7,807
Mauritius 420 241 179
Mozambique 40,078 22,718 17,360
Namibia 656 373 283
Rwanda 6,896 3,860 3,036
Seychelles 345 214 131
Somalia 1,716 973 743
Swaziland 1,659 934 725
South Africa 22,755 16,875 5,880
Uganda 31,064 16,071 14,993
DRC 11,708 6,423 5,285
Zimbabwe 1,762 908 854
Zambia 32,298 18,765 13,533
Other African Countries 5,660 3,369 2,291
China 2,408 1,393 1,015
India 5,999 3,148 2,851
Pakistan 1,357 724 633
Other Asian Countries 14,988 7,573 7,415
Italy 3,089 1,645 1,444
Nordic Countries 7,238 3,748 3,490
Great Britain 27,774 14,301 13,473
Germany 8,068 4,241 3,827
Other European Countries 8,757 4,966 3,791
Canada 6,642 3,458 3,184
USA 36,957 19,651 17,306
Not Reported 3,985 2,098 1,887

50
Table 7.5: Diaspora and Persons Sending Remittance from Abroad by Country of Residence; Tanzania Mainland, 2012 Census
Country of Residence Total
Diaspora Total
Remitting Males
Remitting Females
Remitting
Total 405,417 64,672 38,846 25,826
Angola 505 110 81 29
Botswana 2,880 540 353 187
Burundi 9,679 612 375 237
Comoro 1,680 236 146 90
Kenya 85,901 17,045 10,725 6,320
Lesotho 3,506 119 76 43
Malawi 16,987 2,086 1,157 929
Mauritius 420 63 42 21
Mozambique 40,078 4,575 2,927 1,648
Namibia 656 149 87 62
Rwanda 6,896 576 358 218
Seychelles 345 46 29 17
Somalia 1,716 123 68 55
Swaziland 1,659 325 196 129
South Africa 22,755 4,812 3,661 1,151
Uganda 31,064 3,831 2,082 1,749
Republic of Congo 11,708 1,024 748 276
Zimbabwe 1,762 233 137 96
Zambia 32,298 4,538 2,776 1,762
Other African Countries 5,660 1,057 652 405
China 2,408 491 315 176
India 5,999 634 339 295
Pakistan 1,357 225 114 111
Other Asian Countries 14,988 2,542 1,275 1,267
Italy 3,089 617 357 260
Nordic Countries 7,238 1,528 817 711
Great Britain 27,774 5,452 2,907 2,545
Germany 8,068 968 508 460
Other European Countries 8,757 1,601 907 694
Canada 6,642 1,213 670 543
USA 36,957 7,246 3,927 3,319
Not Reported 3,985 55 34 21

51
Chapter Eight
Literacy and Education
Tables on literacy show the distribution of the population aged five years and above by five year age
group, sex, literacy status, rural and urban areas.
Tables on education give the distribution of the total population aged five years and above by sex,
school attendance status, rural and urban areas.

52
Table 8.1: Distribution of Population Aged Five Years and Above by Five Year Age Group and Literacy Status; Tanzania Mainland, 2012 Census
Age Group
Literacy Status
Total Literacy In
Total Literate
Illiterate Kiswahili Only English Only
Both English and Kiswahili
Other Language(s)
Total 20,845,958 300,762 4,391,170 62,148 25,600,038 10,190,298 35,790,336
5-9 2,418,616 10,891 107,653 12,273 2,549,433 3,842,131 6,391,564
10 – 14 4,050,551 26,594 379,312 5,365 4,461,822 1,078,131 5,539,953
15 – 19 2,601,216 76,645 1,095,314 4,861 3,778,036 576,573 4,354,609
20 – 24 2,150,604 60,726 902,393 5,707 3,119,430 576,602 3,696,032
25 – 29 2,041,095 33,655 512,174 5,637 2,592,561 610,855 3,203,416
30 – 34 1,857,159 23,669 358,629 4,841 2,244,298 515,528 2,759,826
35 – 39 1,576,288 18,277 277,212 3,990 1,875,767 440,291 2,316,058
40 – 44 1,219,988 13,414 200,954 3,367 1,437,723 362,239 1,799,962
45 – 49 930,266 9,946 156,120 2,914 1,099,246 326,243 1,425,489
50 – 54 646,852 8,637 135,394 2,766 793,649 356,558 1,150,207
55 – 59 384,323 6,220 95,285 2,044 487,872 250,333 738,205
60 – 64 346,739 5,014 75,389 2,114 429,256 307,984 737,240
65 – 69 208,331 2,794 39,780 1,477 252,382 222,349 474,731
70 – 74 176,108 1,980 26,336 1,674 206,098 253,544 459,642
75 – 79 105,846 1,092 14,406 1,081 122,425 161,155 283,580
80+ 131,976 1,208 14,819 2,037 150,040 309,782 459,822
Table 8.2: Distribution of Population Aged Five Years and Above by Five Year Age Group and Literacy Status; Tanzania Mainland Rural, 2012 Census
Age Group
Literacy Status
Total Literacy In
Total Literate
Illiterate Kiswahili Only English Only
Both English and Kiswahili
Other Language(s)
Total 14,251,105 139,405 1,695,274 39,653 16,125,437 8,965,946 25,091,383
5-9 1,562,252 3,566 28,567 10,462 1,604,847 3,308,956 4,913,803
10 – 14 2,972,832 13,982 165,650 4,210 3,156,674 994,395 4,151,069
15 – 19 1,837,114 44,677 517,086 3,197 2,402,074 525,920 2,927,994
20 – 24 1,409,704 30,155 359,832 3,169 1,802,860 518,562 2,321,422
25 – 29 1,279,402 12,557 161,540 2,879 1,456,378 542,005 1,998,383
30 – 34 1,185,600 7,566 102,060 2,410 1,297,636 456,415 1,754,051
35 – 39 1,046,605 5,956 81,949 2,055 1,136,565 391,913 1,528,478
40 – 44 839,754 4,590 62,618 1,685 908,647 324,002 1,232,649
45 – 49 653,262 3,774 52,244 1,522 710,802 285,441 996,243
50 – 54 462,340 3,695 50,643 1,575 518,253 314,541 832,794
55 – 59 275,189 2,755 36,806 1,116 315,866 218,993 534,859
60 – 64 254,999 2,332 30,625 1,253 289,209 267,915 557,124
65 – 69 156,943 1,394 17,490 884 176,711 193,118 369,829
70 – 74 133,985 1,069 12,638 1,113 148,805 218,603 367,408
75 – 79 81,187 619 7,528 715 90,049 139,318 229,367
80+ 99,937 718 7,998 1,408 110,061 265,849 375,910

53
Table 8.3: Distribution of Population Aged Five Years and Above by Five Year Age Group and Literacy Status; Tanzania Mainland Urban, 2012 Census
Age
Group
Literacy Status
Total
Literacy In
Total Literate Illiterate Kiswahili only English Only
Both English and Kiswahili
Other Language(s)
Total 6,594,853 161,357 2,695,896 22,495 9,474,601 1,224,352 10,698,953
5-9 856,364 7,325 79,086 1,811 944,586 533,175 1,477,761
10 – 14 1,077,719 12,612 213,662 1,155 1,305,148 83,736 1,388,884
15 – 19 764,102 31,968 578,228 1,664 1,375,962 50,653 1,426,615
20 – 24 740,900 30,571 542,561 2,538 1,316,570 58,040 1,374,610
25 – 29 761,693 21,098 350,634 2,758 1,136,183 68,850 1,205,033
30 – 34 671,559 16,103 256,569 2,431 946,662 59,113 1,005,775
35 – 39 529,683 12,321 195,263 1,935 739,202 48,378 787,580
40 – 44 380,234 8,824 138,336 1,682 529,076 38,237 567,313
45 – 49 277,004 6,172 103,876 1,392 388,444 40,802 429,246
50 – 54 184,512 4,942 84,751 1,191 275,396 42,017 317,413
55 – 59 109,134 3,465 58,479 928 172,006 31,340 203,346
60 – 64 91,740 2,682 44,764 861 140,047 40,069 180,116
65 – 69 51,388 1,400 22,290 593 75,671 29,231 104,902
70 – 74 42,123 911 13,698 561 57,293 34,941 92,234
75 – 79 24,659 473 6,878 366 32,376 21,837 54,213
80+ 32,039 490 6,821 629 39,979 43,933 83,912
Table 8.4: Distribution of Male Population Aged Five Years and Above by Five Year Age Group and Literacy Status; Tanzania Mainland , 2012 Census
Age
Group
Literacy Status
Total Literacy In
Total Literate Illiterate Kiswahili only English Only
Both English and Kiswahili
Other Language(s)
Total 10,215,362 164,716 2,410,172 32,008 12,822,258 4,455,386 17,277,644
5-9 1,158,304 5,338 51,890 6,338 1,221,870 1,978,019 3,199,889
10 – 14 1,997,653 12,201 173,914 2,810 2,186,578 580,280 2,766,858
15 – 19 1,262,799 37,714 534,979 2,425 1,837,917 281,074 2,118,991
20 – 24 933,005 32,567 480,855 2,710 1,449,137 212,657 1,661,794
25 – 29 920,941 18,642 285,338 2,906 1,227,827 220,285 1,448,112
30 – 34 884,428 13,570 205,412 2,715 1,106,125 193,326 1,299,451
35 – 39 773,934 11,014 164,505 2,194 951,647 164,453 1,116,100
40 – 44 622,816 8,545 126,427 1,903 759,691 130,963 890,654
45 – 49 477,353 6,365 98,226 1,435 583,379 93,580 676,959
50 – 54 370,734 5,720 91,840 1,420 469,714 104,601 574,315
55 – 59 222,475 4,351 67,491 1,070 295,387 76,529 371,916
60 – 64 206,023 3,576 55,841 1,086 266,526 95,845 362,371
65 – 69 127,027 2,047 30,993 707 160,774 68,634 229,408
70 – 74 109,858 1,444 20,398 789 132,489 84,899 217,388
75 – 79 68,852 801 11,264 538 81,455 58,700 140,155
80+ 79,160 821 10,799 962 91,742 111,541 203,283

54
Table 8.5: Distribution of Male Population Aged Five Years and Above by Five Year Age Group and Literacy Status; Tanzania Mainland Rural, 2012 Census
Age Group
Literacy Status
Total Literacy In
Total Literate Illiterate Kiswahili only English Only
Both English and Kiswahili
Other Language(s)
Total 7,162,515 78,702 971,688 19,645 8,232,550 3,955,508 12,188,058
5-9 744,486 1,669 13,652 5,398 765,205 1,705,005 2,470,210
10 – 14 1,479,356 6,447 75,691 2,285 1,563,779 537,786 2,101,565
15 - 19 938,953 22,706 260,136 1,693 1,223,488 259,141 1,482,629
20 - 24 637,416 17,296 205,620 1,386 861,718 193,166 1,054,884
25 - 29 593,532 7,498 98,603 1,337 700,970 197,911 898,881
30 - 34 573,922 4,467 61,811 1,235 641,435 173,224 814,659
35 - 39 519,320 3,674 51,492 1,000 575,486 148,015 723,501
40 - 44 433,467 3,010 41,900 854 479,231 118,312 597,543
45 - 49 346,131 2,494 35,633 651 384,909 84,996 469,905
50 - 54 272,832 2,585 36,760 723 312,900 94,529 407,429
55 - 59 164,127 2,121 28,385 543 195,176 68,906 264,082
60 - 64 156,261 1,764 24,472 591 183,088 85,739 268,827
65 - 69 98,593 1,089 14,566 389 114,637 61,333 175,970
70 - 74 86,607 856 10,434 524 98,421 75,661 174,082
75 - 79 54,724 492 6,274 347 61,837 52,275 114,112
80+ 62,788 534 6,259 689 70,270 99,509 169,779
Table 8.6: Distribution of Male Population Aged Five Years and Above by Five Year Age
Group and Literacy Status; Tanzania Mainland Urban, 2012 Census
Age Group
Literacy Status
Total Literacy In
Total Literate Illiterate Kiswahili only English Only
Both English and Kiswahili
Other Language(s)
Total 3,052,847 86,014 1,438,484 12,363 4,589,708 499,878 5,089,586
5-9 413,818 3,669 38,238 940 456,665 273,014 729,679
10 – 14 518,297 5,754 98,223 525 622,799 42,494 665,293
15 - 19 323,846 15,008 274,843 732 614,429 21,933 636,362
20 - 24 295,589 15,271 275,235 1,324 587,419 19,491 606,910
25 - 29 327,409 11,144 186,735 1,569 526,857 22,374 549,231
30 - 34 310,506 9,103 143,601 1,480 464,690 20,102 484,792
35 - 39 254,614 7,340 113,013 1,194 376,161 16,438 392,599
40 - 44 189,349 5,535 84,527 1,049 280,460 12,651 293,111
45 - 49 131,222 3,871 62,593 784 198,470 8,584 207,054
50 - 54 97,902 3,135 55,080 697 156,814 10,072 166,886
55 - 59 58,348 2,230 39,106 527 100,211 7,623 107,834
60 - 64 49,762 1,812 31,369 495 83,438 10,106 93,544
65 - 69 28,434 958 16,427 318 46,137 7,301 53,438
70 - 74 23,251 588 9,964 265 34,068 9,238 43,306
75 - 79 14,128 309 4,990 191 19,618 6,425 26,043
80+ 16,372 287 4,540 273 21,472 12,032 33,504

55
Table 8.7: Distribution of Female Population Aged Five Years and Above by Five Year Age Group and Literacy Status; Tanzania Mainland, 2012 Census
Age Group
Literacy Status
Total Literacy In
Total Literate Illiterate Kiswahili only English Only
Both English and Kiswahili
Other Language(s)
Total 10,630,596 136,046 1,980,998 30,140 12,777,780 5,734,912 18,512,692
5-9 1,260,312 5,553 55,763 5,935 1,327,563 1,864,112 3,191,675
10 – 14 2,052,898 14,393 205,398 2,555 2,275,244 497,851 2,773,095
15 – 19 1,338,417 38,931 560,335 2,436 1,940,119 295,499 2,235,618
20 – 24 1,217,599 28,159 421,538 2,997 1,670,293 363,945 2,034,238
25 – 29 1,120,154 15,013 226,836 2,731 1,364,734 390,570 1,755,304
30 – 34 972,731 10,099 153,217 2,126 1,138,173 322,202 1,460,375
35 – 39 802,354 7,263 112,707 1,796 924,120 275,838 1,199,958
40 – 44 597,172 4,869 74,527 1,464 678,032 231,276 909,308
45 – 49 452,913 3,581 57,894 1,479 515,867 232,663 748,530
50 – 54 276,118 2,917 43,554 1,346 323,935 251,957 575,892
55 – 59 161,848 1,869 27,794 974 192,485 173,804 366,289
60 – 64 140,716 1,438 19,548 1,028 162,730 212,139 374,869
65 – 69 81,304 747 8,787 770 91,608 153,715 245,323
70 – 74 66,250 536 5,938 885 73,609 168,645 242,254
75 – 79 36,994 291 3,142 543 40,970 102,455 143,425
80+ 52,816 387 4,020 1,075 58,298 198,241 256,539
Table 8.8: Distribution of Female Population Aged Five Years and Above by Five Year Age
Group and Literacy Status; Tanzania Mainland Rural, 2012 Census
Age Group
Literacy Status
Total Literacy In
Total Literate
Illiterate Kiswahili only English Only
Both English and Kiswahili
Other Language(s)
Total 7,088,590 60,703 723,586 20,008 7,892,887 5,010,438 12,903,325
5-9 817,766 1,897 14,915 5,064 839,642 1,603,951 2,443,593
10 – 14 1,493,476 7,535 89,959 1,925 1,592,895 456,609 2,049,504
15 - 19 898,161 21,971 256,950 1,504 1,178,586 266,779 1,445,365
20 - 24 772,288 12,859 154,212 1,783 941,142 325,396 1,266,538
25 - 29 685,870 5,059 62,937 1,542 755,408 344,094 1,099,502
30 - 34 611,678 3,099 40,249 1,175 656,201 283,191 939,392
35 - 39 527,285 2,282 30,457 1,055 561,079 243,898 804,977
40 - 44 406,287 1,580 20,718 831 429,416 205,690 635,106
45 - 49 307,131 1,280 16,611 871 325,893 200,445 526,338
50 - 54 189,508 1,110 13,883 852 205,353 220,012 425,365
55 - 59 111,062 634 8,421 573 120,690 150,087 270,777
60 - 64 98,738 568 6,153 662 106,121 182,176 288,297
65 - 69 58,350 305 2,924 495 62,074 131,785 193,859
70 - 74 47,378 213 2,204 589 50,384 142,942 193,326
75 - 79 26,463 127 1,254 368 28,212 87,043 115,255
80+ 37,149 184 1,739 719 39,791 166,340 206,131

56
Table 8.9: Distribution of Female Population Aged Five Years and Above by Five Year Age Group and Literacy Status; Tanzania Mainland Urban, 2012 Census
Age Group
Literacy Status
Total Literacy In
Total Literate
Illiterate Kiswahili Only
English Only Both English and Kiswahili
Other Language(s)
Total 3,542,006 75,343 1,257,412 10,132 4,884,893 724,474 5,609,367
5-9 442,546 3,656 40,848 871 487,921 260,161 748,082
10 – 14 559,422 6,858 115,439 630 682,349 41,242 723,591
15 - 19 440,256 16,960 303,385 932 761,533 28,720 790,253
20 - 24 445,311 15,300 267,326 1,214 729,151 38,549 767,700
25 - 29 434,284 9,954 163,899 1,189 609,326 46,476 655,802
30 - 34 361,053 7,000 112,968 951 481,972 39,011 520,983
35 - 39 275,069 4,981 82,250 741 363,041 31,940 394,981
40 - 44 190,885 3,289 53,809 633 248,616 25,586 274,202
45 - 49 145,782 2,301 41,283 608 189,974 32,218 222,192
50 - 54 86,610 1,807 29,671 494 118,582 31,945 150,527
55 - 59 50,786 1,235 19,373 401 71,795 23,717 95,512
60 - 64 41,978 870 13,395 366 56,609 29,963 86,572
65 - 69 22,954 442 5,863 275 29,534 21,930 51,464
70 - 74 18,872 323 3,734 296 23,225 25,703 48,928
75 - 79 10,531 164 1,888 175 12,758 15,412 28,170
80+ 15,667 203 2,281 356 18,507 31,901 50,408

57
Table 8.10: Total Population Aged Five Years and Above by Age Group and School Attendance Status; Tanzania Mainland, 2012 Census
Age Total School Attendance Status
Attending Drop Out Completed Never Attended
Total 35,790,336 10,693,781 2,559,392 14,129,285 8,407,878
5 1,356,440 439,338 2,784 7,300 907,018
6 1,363,670 586,250 3,158 7,026 767,236
5-6 2,720,110 1,025,588 5,942 14,326 1,674,254
7 1,338,317 807,556 4,736 9,419 516,606
8 1,227,257 877,866 6,963 8,462 333,966
9 1,105,880 880,513 9,413 8,075 207,879
10 1,286,652 1,038,506 19,403 11,153 217,590
11 912,585 771,919 19,124 10,395 111,147
12 1,384,105 1,140,663 43,892 27,606 171,944
13 972,322 781,873 42,062 43,469 104,918
7-13 8,227,118 6,298,896 145,593 118,579 1,664,050
14 984,289 713,637 54,171 111,931 104,550
15 922,259 557,684 62,536 196,881 105,158
16 885,566 467,148 66,382 261,113 90,923
17 824,499 374,534 69,154 300,478 80,333
14 - 17 3,616,613 2,113,003 252,243 870,403 380,964
18 997,815 341,227 95,176 437,565 123,847
19 724,470 208,659 73,376 365,585 76,850
18 - 19 1,722,285 549,886 168,552 803,150 200,697
20 1,063,024 186,435 114,964 592,851 168,774
21 585,817 98,836 64,880 353,905 68,196
22 845,949 99,391 97,527 531,193 117,838
23 571,474 56,876 63,790 375,151 75,657
24 629,768 46,984 70,724 419,963 92,097
20 - 24 3,696,032 488,522 411,885 2,273,063 522,562
25+ 15,808,178 217,886 1,575,177 10,049,764 3,965,351

58
Table 8.11: Total Population Aged Five Years and Above by Age Group and School Attendance Status; Tanzania Mainland Rural, 2012 Census
Age Total School Attendance Status
Attending Drop Out Completed Never Attended
Total 25,091,383 7,106,641 1,947,043 8,576,293 7,461,406
5 1,043,991 257,067 2,337 4,592 779,995
6 1,053,765 368,734 2,631 4,278 678,122
5-6 2,097,756 625,801 4,968 8,870 1,458,117
7 1,028,110 547,289 3,879 5,572 471,370
8 947,451 625,341 5,784 5,288 311,038
9 840,486 633,604 7,988 4,952 193,942
10 991,434 763,355 16,699 7,493 203,887
11 680,578 554,288 16,229 6,781 103,280
12 1,043,336 827,040 37,329 18,464 160,503
13 716,695 555,965 35,365 28,172 97,193
7-13 6,248,090 4,506,882 123,273 76,722 1,541,213
14 719,026 500,326 45,386 76,549 96,765
15 659,666 372,349 51,662 139,038 96,617
16 605,123 286,439 53,550 182,084 83,050
17 538,899 207,837 54,041 203,755 73,266
14 - 17 2,522,714 1,366,951 204,639 601,426 349,698
18 666,998 187,679 73,706 292,065 113,548
19 457,308 106,696 54,468 226,663 69,481
18 - 19 1,124,306 294,375 128,174 518,728 183,029
20 704,050 92,052 86,932 371,770 153,296
21 360,817 43,575 47,624 208,508 61,110
22 530,928 41,201 71,322 312,690 105,715
23 341,841 20,525 45,348 208,693 67,275
24 383,786 17,116 50,405 234,419 81,846
20 - 24 2,321,422 214,469 301,631 1,336,080 469,242
25+ 10,777,095 98,163 1,184,358 6,034,467 3,460,107

59
Table 8.12: Total Population Aged Five Years and Above by Age Group and School Attendance Status; Tanzania Mainland Urban, 2012 Census
Age Total School Attendance Status
Attending Drop Out Completed Never Attended
Total 10,698,953 3,587,140 612,349 5,552,992 946,472
5 312,449 182,271 447 2,708 127,023
6 309,905 217,516 527 2,748 89,114
5-6 622,354 399,787 974 5,456 216,137
7 310,207 260,267 857 3,847 45,236
8 279,806 252,525 1,179 3,174 22,928
9 265,394 246,909 1,425 3,123 13,937
10 295,218 275,151 2,704 3,660 13,703
11 232,007 217,631 2,895 3,614 7,867
12 340,769 313,623 6,563 9,142 11,441
13 255,627 225,908 6,697 15,297 7,725
7-13 1,979,028 1,792,014 22,320 41,857 122,837
14 265,263 213,311 8,785 35,382 7,785
15 262,593 185,335 10,874 57,843 8,541
16 280,443 180,709 12,832 79,029 7,873
17 285,600 166,697 15,113 96,723 7,067
14 - 17 1,093,899 746,052 47,604 268,977 31,266
18 330,817 153,548 21,470 145,500 10,299
19 267,162 101,963 18,908 138,922 7,369
18 - 19 597,979 255,511 40,378 284,422 17,668
20 358,974 94,383 28,032 221,081 15,478
21 225,000 55,261 17,256 145,397 7,086
22 315,021 58,190 26,205 218,503 12,123
23 229,633 36,351 18,442 166,458 8,382
24 245,982 29,868 20,319 185,544 10,251
20 - 24 1,374,610 274,053 110,254 936,983 53,320
25+ 5,031,083 119,723 390,819 4,015,297 505,244

60
Table 8.13: Distribution of Male Population Aged Five Years and Above by Age Group and School Attendance Status; Tanzania Mainland, 2012 Census
Age Total School Attendance Status
Attending Drop Out Completed Never Attended
Total 17,277,644 5,363,118 1,329,617 7,011,286 3,573,623
5 686,888 215,948 1,521 3,731 465,688
6 682,234 282,798 1,623 3,473 394,340
5-6 1,369,122 498,746 3,144 7,204 860,028
7 675,251 391,908 2,455 4,922 275,966
8 606,061 420,064 3,719 4,285 177,993
9 549,455 427,895 5,204 4,071 112,285
10 644,653 511,326 11,131 5,665 116,531
11 449,521 376,001 10,858 5,144 57,518
12 699,392 568,496 25,843 13,704 91,349
13 485,235 385,115 24,897 19,823 55,400
7-13 4,109,568 3,080,805 84,107 57,614 887,042
14 488,057 351,956 32,068 49,513 54,520
15 466,286 282,177 37,992 90,111 56,006
16 433,587 235,523 37,803 115,491 44,770
17 406,594 195,893 38,207 133,701 38,793
14 - 17 1,794,524 1,065,549 146,070 388,816 194,089
18 479,308 186,843 49,337 189,391 53,737
19 333,216 119,179 35,293 148,068 30,676
18 - 19 812,524 306,022 84,630 337,459 84,413
20 470,351 112,384 54,069 242,862 61,036
21 271,765 60,193 31,891 153,548 26,133
22 381,565 61,490 47,415 230,128 42,532
23 256,168 34,750 31,222 162,875 27,321
24 281,945 28,917 35,132 185,853 32,043
20 - 24 1,661,794 297,734 199,729 975,266 189,065
25+ 7,530,112 114,262 811,937 5,244,927 1,358,986

61
Table 8.14: Distribution of Female Population Aged Five Years and Above by Age Group and School Attendance Status; Tanzania Mainland, 2012 Census
Age Total School Attendance Status
Attending Drop Out Completed Never Attended
Total 18,512,692 5,330,663 1,229,775 7,117,999 4,834,255
5 669,552 223,390 1,263 3,569 441,330
6 681,436 303,452 1,535 3,553 372,896
5-6 1,350,988 526,842 2,798 7,122 814,226
7 663,066 415,648 2,281 4,497 240,640
8 621,196 457,802 3,244 4,177 155,973
9 556,425 452,618 4,209 4,004 95,594
10 641,999 527,180 8,272 5,488 101,059
11 463,064 395,918 8,266 5,251 53,629
12 684,713 572,167 18,049 13,902 80,595
13 487,087 396,758 17,165 23,646 49,518
7-13 4,117,550 3,218,091 61,486 60,965 777,008
14 496,232 361,681 22,103 62,418 50,030
15 455,973 275,507 24,544 106,770 49,152
16 451,979 231,625 28,579 145,622 46,153
17 417,905 178,641 30,947 166,777 41,540
14 - 17 1,822,089 1,047,454 106,173 481,587 186,875
18 518,507 154,384 45,839 248,174 70,110
19 391,254 89,480 38,083 217,517 46,174
18 - 19 909,761 243,864 83,922 465,691 116,284
20 592,673 74,051 60,895 349,989 107,738
21 314,052 38,643 32,989 200,357 42,063
22 464,384 37,901 50,112 301,065 75,306
23 315,306 22,126 32,568 212,276 48,336
24 347,823 18,067 35,592 234,110 60,054
20 - 24 2,034,238 190,788 212,156 1,297,797 333,497
25+ 8,278,066 103,624 763,240 4,804,837 2,606,365

62
Table 8.15: Distribution of Male Population Aged Five Years and Above by Age Group and School Attendance Status; Tanzania Mainland Rural, 2012 Census
Age Total School Attendance Status
Attending Drop Out Completed Never Attended
Total 12,188,058 3,579,845 1,048,398 4,345,997 3,213,818
5 530,131 125,706 1,284 2,414 400,727
6 529,293 177,180 1,346 2,165 348,602
5-6 1,059,424 302,886 2,630 4,579 749,329
7 520,722 263,951 2,044 2,993 251,734
8 469,818 298,094 3,085 2,737 165,902
9 420,246 308,222 4,456 2,536 105,032
10 500,742 377,690 9,689 3,906 109,457
11 337,908 271,361 9,376 3,473 53,698
12 532,993 414,984 22,536 9,617 85,856
13 363,767 276,202 21,690 13,947 51,928
7-13 3,146,196 2,210,504 72,876 39,209 823,607
14 366,155 250,125 27,858 36,923 51,249
15 347,012 192,758 32,617 69,356 52,281
16 310,869 149,513 31,878 87,933 41,545
17 279,147 113,214 31,471 98,618 35,844
14 - 17 1,303,183 705,610 123,824 292,830 180,919
18 329,902 106,656 40,128 133,618 49,500
19 215,699 63,635 27,600 96,523 27,941
18 - 19 545,601 170,291 67,728 230,141 77,441
20 314,309 58,818 42,716 157,141 55,634
21 170,039 28,714 24,532 93,157 23,636
22 241,885 27,718 36,408 139,239 38,520
23 155,481 13,768 23,510 93,571 24,632
24 173,170 11,233 26,371 106,766 28,800
20 - 24 1,054,884 140,251 153,537 589,874 171,222
25+ 5,078,770 50,303 627,803 3,189,364 1,211,300

63
Table 8.16: Distribution of Female Population Aged Five Years and Above by Age Group and School Attendance Status; Tanzania Mainland Rural, 2012 Census
Age Total School Attendance Status
Attending Drop Out Completed Never Attended
Total 12,903,325 3,526,796 898,645 4,230,296 4,247,588
5 513,860 131,361 1,053 2,178 379,268
6 524,472 191,554 1,285 2,113 329,520
5-6 1,038,332 322,915 2,338 4,291 708,788
7 507,388 283,338 1,835 2,579 219,636
8 477,633 327,247 2,699 2,551 145,136
9 420,240 325,382 3,532 2,416 88,910
10 490,692 385,665 7,010 3,587 94,430
11 342,670 282,927 6,853 3,308 49,582
12 510,343 412,056 14,793 8,847 74,647
13 352,928 279,763 13,675 14,225 45,265
7-13 3,101,894 2,296,378 50,397 37,513 717,606
14 352,871 250,201 17,528 39,626 45,516
15 312,654 179,591 19,045 69,682 44,336
16 294,254 136,926 21,672 94,151 41,505
17 259,752 94,623 22,570 105,137 37,422
14 - 17 1,219,531 661,341 80,815 308,596 168,779
18 337,096 81,023 33,578 158,447 64,048
19 241,609 43,061 26,868 130,140 41,540
18 - 19 578,705 124,084 60,446 288,587 105,588
20 389,741 33,234 44,216 214,629 97,662
21 190,778 14,861 23,092 115,351 37,474
22 289,043 13,483 34,914 173,451 67,195
23 186,360 6,757 21,838 115,122 42,643
24 210,616 5,883 24,034 127,653 53,046
20 - 24 1,266,538 74,218 148,094 746,206 298,020
25+ 5,698,325 47,860 556,555 2,845,103 2,248,807

64
Table 8.17: Distribution of Male Population Aged Five Years and Above by Age Group and School Attendance Status; Tanzania Mainland Urban, 2012 Census
Age Total School Attendance Status
Attending Drop Out Completed Never Attended
Total 5,089,586 1,783,273 281,219 2,665,289 359,805
5 156,757 90,242 237 1,317 64,961
6 152,941 105,618 277 1,308 45,738
5-6 309,698 195,860 514 2,625 110,699
7 154,529 127,957 411 1,929 24,232
8 136,243 121,970 634 1,548 12,091
9 129,209 119,673 748 1,535 7,253
10 143,911 133,636 1,442 1,759 7,074
11 111,613 104,640 1,482 1,671 3,820
12 166,399 153,512 3,307 4,087 5,493
13 121,468 108,913 3,207 5,876 3,472
7-13 963,372 870,301 11,231 18,405 63,435
14 121,902 101,831 4,210 12,590 3,271
15 119,274 89,419 5,375 20,755 3,725
16 122,718 86,010 5,925 27,558 3,225
17 127,447 82,679 6,736 35,083 2,949
14 - 17 491,341 359,939 22,246 95,986 13,170
18 149,406 80,187 9,209 55,773 4,237
19 117,517 55,544 7,693 51,545 2,735
18 - 19 266,923 135,731 16,902 107,318 6,972
20 156,042 53,566 11,353 85,721 5,402
21 101,726 31,479 7,359 60,391 2,497
22 139,680 33,772 11,007 90,889 4,012
23 100,687 20,982 7,712 69,304 2,689
24 108,775 17,684 8,761 79,087 3,243
20 - 24 606,910 157,483 46,192 385,392 17,843
25+ 2,451,342 63,959 184,134 2,055,563 147,686

65
Table 8.18: Distribution of Female Population Aged Five Years and Above by Age Group and School Attendance Status; Tanzania Mainland Urban, 2012 Census
Age Total School Attendance Status
Attending Drop Out Completed Never Attended
Total 5,609,367 1,803,867 331,130 2,887,703 586,667
5 155,692 92,029 210 1,391 62,062
6 156,964 111,898 250 1,440 43,376
5-6 312,656 203,927 460 2,831 105,438
7 155,678 132,310 446 1,918 21,004
8 143,563 130,555 545 1,626 10,837
9 136,185 127,236 677 1,588 6,684
10 151,307 141,515 1,262 1,901 6,629
11 120,394 112,991 1,413 1,943 4,047
12 174,370 160,111 3,256 5,055 5,948
13 134,159 116,995 3,490 9,421 4,253
7-13 1,015,656 921,713 11,089 23,452 59,402
14 143,361 111,480 4,575 22,792 4,514
15 143,319 95,916 5,499 37,088 4,816
16 157,725 94,699 6,907 51,471 4,648
17 158,153 84,018 8,377 61,640 4,118
14 - 17 602,558 386,113 25,358 172,991 18,096
18 181,411 73,361 12,261 89,727 6,062
19 149,645 46,419 11,215 87,377 4,634
18 - 19 331,056 119,780 23,476 177,104 10,696
20 202,932 40,817 16,679 135,360 10,076
21 123,274 23,782 9,897 85,006 4,589
22 175,341 24,418 15,198 127,614 8,111
23 128,946 15,369 10,730 97,154 5,693
24 137,207 12,184 11,558 106,457 7,008
20 - 24 767,700 116,570 64,062 551,591 35,477
25+ 2,579,741 55,764 206,685 1,959,734 357,558

66
Table 8.19: Distribution of Population Aged Five Years and Above Attending School by Age and Level of Attending; Tanzania Mainland, 2012 Census
Age Total 0 Primary Education
TP PS Secondary Education
TS UN 1 2 3 4 5 6 7 8 9 10 11 12 13 14
Total 10,693,781 803,903 1,850,194 1,211,599 1,064,833 1,008,835 873,908 916,369 827,657 29,972 25,694 - 427,621 363,412 373,773 410,721 48,149 68,624 57,786 330,731
5 439,338 439,338 - - - - - - - - - - - - - - - - - -
6 586,250 364,565 221,685 - - - - - - - - - - - - - - - - -
7 807,556 - 807,556 - - - - - - - - - - - - - - - - -
8 877,866 - 435,537 442,329 - - - - - - - - - - - - - - - -
9 880,513 - 209,246 349,724 321,543 - - - - - - - - - - - - - - -
10 1,038,506 - 114,752 241,967 358,449 323,338 - - - - - - - - - - - - - -
11 771,919 - 34,459 87,299 171,237 258,599 220,325 - - - - - - - - - - - - -
12 1,140,663 - 26,959 71,097 147,363 264,694 341,661 288,889 - - - - - - - - - - - -
13 781,873 - - 19,183 46,377 94,176 160,358 261,890 197,196 2,693 - - - - - - - - - -
14 713,637 - - - 19,864 47,247 87,766 185,065 247,644 7,865 - - 118,186 - - - - - - -
15 557,684 - - - - 20,781 44,118 102,727 167,136 8,382 - - 123,235 91,305 - - - - - -
16 467,148 - - - - - 19,680 54,739 108,285 5,608 3,766 - 87,987 105,306 81,777 - - - - -
17 374,534 - - - - - - 23,059 60,950 3,222 - - 49,608 70,010 100,285 62,098 3,309 - 983 1,010
18 341,227 - - - - - - - 46,446 2,202 1,072 - 33,165 49,904 83,404 105,982 10,247 2,895 2,391 3,519
19 208,659 - - - - - - - - - 42 - 15,440 26,295 50,465 80,870 10,324 8,653 10,729 5,841
20 186,435 - - - - - - - - - 2,348 - - 20,592 39,183 77,424 9,747 14,046 8,604 14,491
21 98,836 - - - - - - - - - 1,258 - - - 18,659 39,781 5,300 10,870 6,779 16,189
22 99,391 - - - - - - - - - 1,519 - - - - 44,566 5,382 12,612 9,045 26,267
23 56,876 - - - - - - - - - 1,846 - - - - - 3,840 10,599 8,950 31,641
24 46,984 - - - - - - - - - 1,580 - - - - - - 8,949 1,781 34,674
25+ 217,886 - - - - - - - - - 12,263 - - - - - - - 8,524 197,099
NOTE: TP = Training after Primary School Education
PS = Pre-School Education
TS = Training after Secondary School Education
UN = University and Other Related Education
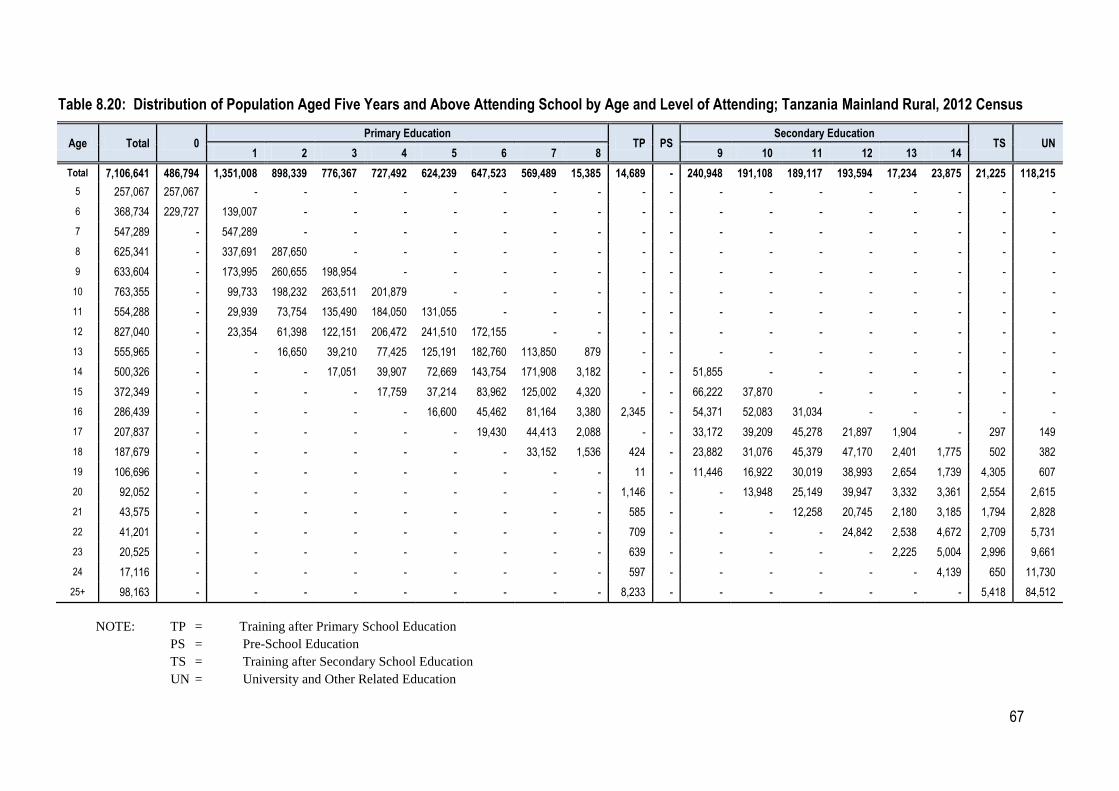
67
Table 8.20: Distribution of Population Aged Five Years and Above Attending School by Age and Level of Attending; Tanzania Mainland Rural, 2012 Census
Age Total 0 Primary Education
TP PS Secondary Education
TS UN 1 2 3 4 5 6 7 8 9 10 11 12 13 14
Total 7,106,641 486,794 1,351,008 898,339 776,367 727,492 624,239 647,523 569,489 15,385 14,689 - 240,948 191,108 189,117 193,594 17,234 23,875 21,225 118,215
5 257,067 257,067 - - - - - - - - - - - - - - - - - -
6 368,734 229,727 139,007 - - - - - - - - - - - - - - - - -
7 547,289 - 547,289 - - - - - - - - - - - - - - - - -
8 625,341 - 337,691 287,650 - - - - - - - - - - - - - - - -
9 633,604 - 173,995 260,655 198,954 - - - - - - - - - - - - - - -
10 763,355 - 99,733 198,232 263,511 201,879 - - - - - - - - - - - - - -
11 554,288 - 29,939 73,754 135,490 184,050 131,055 - - - - - - - - - - - - -
12 827,040 - 23,354 61,398 122,151 206,472 241,510 172,155 - - - - - - - - - - - -
13 555,965 - - 16,650 39,210 77,425 125,191 182,760 113,850 879 - - - - - - - - - -
14 500,326 - - - 17,051 39,907 72,669 143,754 171,908 3,182 - - 51,855 - - - - - - -
15 372,349 - - - - 17,759 37,214 83,962 125,002 4,320 - - 66,222 37,870 - - - - - -
16 286,439 - - - - - 16,600 45,462 81,164 3,380 2,345 - 54,371 52,083 31,034 - - - - -
17 207,837 - - - - - - 19,430 44,413 2,088 - - 33,172 39,209 45,278 21,897 1,904 - 297 149
18 187,679 - - - - - - - 33,152 1,536 424 - 23,882 31,076 45,379 47,170 2,401 1,775 502 382
19 106,696 - - - - - - - - - 11 - 11,446 16,922 30,019 38,993 2,654 1,739 4,305 607
20 92,052 - - - - - - - - - 1,146 - - 13,948 25,149 39,947 3,332 3,361 2,554 2,615
21 43,575 - - - - - - - - - 585 - - - 12,258 20,745 2,180 3,185 1,794 2,828
22 41,201 - - - - - - - - - 709 - - - - 24,842 2,538 4,672 2,709 5,731
23 20,525 - - - - - - - - - 639 - - - - - 2,225 5,004 2,996 9,661
24 17,116 - - - - - - - - - 597 - - - - - - 4,139 650 11,730
25+ 98,163 - - - - - - - - - 8,233 - - - - - - - 5,418 84,512
NOTE: TP = Training after Primary School Education
PS = Pre-School Education
TS = Training after Secondary School Education
UN = University and Other Related Education

68
Table 8.21: Distribution of Population Aged Five Years and Above Attending School by Age and Level of Attending; Tanzania Mainland Urban, 2012 Census
Age Total 0 Primary Education
TP PS Secondary Education
TS UN 1 2 3 4 5 6 7 8 9 10 11 12 13 14
Total 3,587,140 317,109 499,186 313,260 288,466 281,343 249,669 268,846 258,168 14,587 11,005 - 186,673 172,304 184,656 217,127 30,915 44,749 36,561 212,516
5 182,271 182,271 - - - - - - - - - - - - - - - - - -
6 217,516 134,838 82,678 - - - - - - - - - - - - - - - - -
7 260,267 - 260,267 - - - - - - - - - - - - - - - - -
8 252,525 - 97,846 154,679 - - - - - - - - - - - - - - - -
9 246,909 - 35,251 89,069 122,589 - - - - - - - - - - - - - - -
10 275,151 - 15,019 43,735 94,938 121,459 - - - - - - - - - - - - - -
11 217,631 - 4,520 13,545 35,747 74,549 89,270 - - - - - - - - - - - - -
12 313,623 - 3,605 9,699 25,212 58,222 100,151 116,734 - - - - - - - - - - - -
13 225,908 - - 2,533 7,167 16,751 35,167 79,130 83,346 1,814 - - - - - - - - - -
14 213,311 - - - 2,813 7,340 15,097 41,311 75,736 4,683 - - 66,331 - - - - - - -
15 185,335 - - - - 3,022 6,904 18,765 42,134 4,062 - - 57,013 53,435 - - - - - -
16 180,709 - - - - - 3,080 9,277 27,121 2,228 1,421 - 33,616 53,223 50,743 - - - - -
17 166,697 - - - - - - 3,629 16,537 1,134 - - 16,436 30,801 55,007 40,201 1,405 - 686 861
18 153,548 - - - - - - - 13,294 666 648 - 9,283 18,828 38,025 58,812 7,846 1,120 1,889 3,137
19 101,963 - - - - - - - - - 31 - 3,994 9,373 20,446 41,877 7,670 6,914 6,424 5,234
20 94,383 - - - - - - - - - 1,202 - - 6,644 14,034 37,477 6,415 10,685 6,050 11,876
21 55,261 - - - - - - - - - 673 - - - 6,401 19,036 3,120 7,685 4,985 13,361
22 58,190 - - - - - - - - - 810 - - - - 19,724 2,844 7,940 6,336 20,536
23 36,351 - - - - - - - - - 1,207 - - - - - 1,615 5,595 5,954 21,980
24 29,868 - - - - - - - - - 983 - - - - - - 4,810 1,131 22,944
25+ 119,723 - - - - - - - - - 4,030 - - - - - - - 3,106 112,587
NOTE: TP = Training after Primary School Education
PS = Pre-School Education
TS = Training after Secondary School Education
UN = University and Other Related Education

69
Table 8.22: Distribution of Male Population Aged Five Years and Above Attending School by Age and Level of Attending; Tanzania Mainland, 2012 Census
Age Total 0 Primary Education
TP PS Secondary Education
TS UN 1 2 3 4 5 6 7 8 9 10 11 12 13 14
Total 5,363,118 399,290 930,114 607,216 529,211 498,162 428,912 445,951 396,427 14,476 12,837 - 212,993 186,650 198,738 221,370 32,219 45,202 27,569 175,781
5 215,948 215,948 - - - - - - - - - - - - - - - - - -
6 282,798 183,342 99,456 - - - - - - - - - - - - - - - - -
7 391,908 - 391,908 - - - - - - - - - - - - - - - - -
8 420,064 - 220,137 199,927 - - - - - - - - - - - - - - - -
9 427,895 - 114,681 172,414 140,800 - - - - - - - - - - - - - - -
10 511,326 - 66,451 129,567 174,631 140,677 - - - - - - - - - - - - - -
11 376,001 - 20,761 50,099 89,908 123,077 92,156 - - - - - - - - - - - - -
12 568,496 - 16,720 42,951 83,047 138,447 163,495 123,836 - - - - - - - - - - - -
13 385,115 - - 12,258 28,051 53,609 83,883 124,245 81,960 1,109 - - - - - - - - - -
14 351,956 - - - 12,774 28,790 49,481 94,134 114,513 3,255 - - 49,009 - - - - - - -
15 282,177 - - - - 13,562 27,265 56,650 83,380 4,050 - - 58,512 38,758 - - - - - -
16 235,523 - - - - - 12,632 32,125 56,084 2,818 2,021 - 45,275 50,293 34,275 - - - - -
17 195,893 - - - - - - 14,961 33,932 1,861 - - 28,761 38,179 49,203 26,313 1,828 - 411 444
18 186,843 - - - - - - - 26,558 1,383 544 - 21,210 29,353 46,404 52,006 5,398 1,599 932 1,456
19 119,179 - - - - - - - - - 17 - 10,226 16,436 30,469 43,767 6,493 4,383 4,983 2,405
20 112,384 - - - - - - - - - 1,247 - - 13,631 25,548 45,990 6,970 8,370 3,830 6,798
21 60,193 - - - - - - - - - 682 - - - 12,839 24,445 4,162 7,372 3,045 7,648
22 61,490 - - - - - - - - - 839 - - - - 28,849 4,271 9,125 4,698 13,708
23 34,750 - - - - - - - - - 1,015 - - - - - 3,097 7,892 4,778 17,968
24 28,917 - - - - - - - - - 882 - - - - - - 6,461 949 20,625
25+ 114,262 - - - - - - - - - 5,590 - - - - - - - 3,943 104,729
NOTE: TP = Training after Primary School Education
PS = Pre-School Education
TS = Training after Secondary School Education
UN = University and Other Related Education

70
Table 8.23: Distribution of Female Population Aged Five Years and Above Attending School by Age and Level of Attending; Tanzania Mainland, 2012 Census
Age Total 0 Primary Education
TP PS Secondary Education
TS UN 1 2 3 4 5 6 7 8 9 10 11 12 13 14
Total 5,330,663 404,613 920,080 604,383 535,622 510,673 444,996 470,418 431,230 15,496 12,857 - 214,628 176,762 175,035 189,351 15,930 23,422 30,217 154,950
5 223,390 223,390 - - - - - - - - - - - - - - - - - -
6 303,452 181,223 122,229 - - - - - - - - - - - - - - - - -
7 415,648 - 415,648 - - - - - - - - - - - - - - - - -
8 457,802 - 215,400 242,402 - - - - - - - - - - - - - - - -
9 452,618 - 94,565 177,310 180,743 - - - - - - - - - - - - - - -
10 527,180 - 48,301 112,400 183,818 182,661 - - - - - - - - - - - - - -
11 395,918 - 13,698 37,200 81,329 135,522 128,169 - - - - - - - - - - - - -
12 572,167 - 10,239 28,146 64,316 126,247 178,166 165,053 - - - - - - - - - - - -
13 396,758 - - 6,925 18,326 40,567 76,475 137,645 115,236 1,584 - - - - - - - - - -
14 361,681 - - - 7,090 18,457 38,285 90,931 133,131 4,610 - - 69,177 - - - - - - -
15 275,507 - - - - 7,219 16,853 46,077 83,756 4,332 - - 64,723 52,547 - - - - - -
16 231,625 - - - - - 7,048 22,614 52,201 2,790 1,745 - 42,712 55,013 47,502 - - - - -
17 178,641 - - - - - - 8,098 27,018 1,361 - - 20,847 31,831 51,082 35,785 1,481 - 572 566
18 154,384 - - - - - - - 19,888 819 528 - 11,955 20,551 37,000 53,976 4,849 1,296 1,459 2,063
19 89,480 - - - - - - - - - 25 - 5,214 9,859 19,996 37,103 3,831 4,270 5,746 3,436
20 74,051 - - - - - - - - - 1,101 - - 6,961 13,635 31,434 2,777 5,676 4,774 7,693
21 38,643 - - - - - - - - - 576 - - - 5,820 15,336 1,138 3,498 3,734 8,541
22 37,901 - - - - - - - - - 680 - - - - 15,717 1,111 3,487 4,347 12,559
23 22,126 - - - - - - - - - 831 - - - - - 743 2,707 4,172 13,673
24 18,067 - - - - - - - - - 698 - - - - - - 2,488 832 14,049
25+ 103,624 - - - - - - - - - 6,673 - - - - - - - 4,581 92,370
NOTE: TP = Training after Primary School Education
PS = Pre-School Education
TS = Training after Secondary School Education
UN = University and Other Related Education

71
Table 8.24: Distribution of Male Population Aged Five Years and Above Attending School by Age and Level of Attending; Tanzania Mainland Rural, 2012 Census
Age Total 0 Primary Education
TP PS Secondary Education
TS UN 1 2 3 4 5 6 7 8 9 10 11 12 13 14
Total 3,579,845 239,927 682,356 452,059 387,072 360,790 307,127 317,161 277,542 7,610 7,558 - 122,925 101,099 103,744 109,102 12,322 17,013 10,715 63,723
5 125,706 125,706 - - - - - - - - - - - - - - - - - -
6 177,180 114,221 62,959 - - - - - - - - - - - - - - - - -
7 263,951 - 263,951 - - - - - - - - - - - - - - - - -
8 298,094 - 169,249 128,845 - - - - - - - - - - - - - - - -
9 308,222 - 95,220 126,835 86,167 - - - - - - - - - - - - - - -
10 377,690 - 58,037 105,917 126,525 87,211 - - - - - - - - - - - - - -
11 271,361 - 18,218 42,427 70,742 86,111 53,863 - - - - - - - - - - - - -
12 414,984 - 14,722 37,199 68,729 107,164 113,636 73,534 - - - - - - - - - - - -
13 276,202 - - 10,836 23,823 44,159 64,829 85,349 46,864 342 - - - - - - - - - -
14 250,125 - - - 11,086 24,379 40,949 72,400 78,644 1,334 - - 21,333 - - - - - - -
15 192,758 - - - - 11,766 23,052 46,222 62,697 2,030 - - 30,940 16,051 - - - - - -
16 149,513 - - - - - 10,798 26,874 43,295 1,714 1,335 - 27,911 24,574 13,012 - - - - -
17 113,214 - - - - - - 12,782 25,853 1,188 - - 19,450 21,502 21,808 9,279 1,119 - 158 75
18 106,656 - - - - - - - 20,189 1,002 226 - 15,502 18,583 25,286 23,132 1,298 1,043 230 165
19 63,635 - - - - - - - - - 6 - 7,789 10,842 18,311 21,511 1,733 945 2,239 259
20 58,818 - - - - - - - - - 665 - - 9,547 16,677 24,692 2,455 2,173 1,245 1,364
21 28,714 - - - - - - - - - 345 - - - 8,650 13,467 1,778 2,211 847 1,416
22 27,718 - - - - - - - - - 418 - - - - 17,021 2,066 3,581 1,436 3,196
23 13,768 - - - - - - - - - 377 - - - - - 1,873 3,928 1,672 5,918
24 11,233 - - - - - - - - - 348 - - - - - - 3,132 369 7,384
25+ 50,303 - - - - - - - - - 3,838 - - - - - - - 2,519 43,946
NOTE: TP = Training after Primary School Education
PS = Pre-School Education
TS = Training after Secondary School Education
UN = University and Other Related Education

72
Table 8.25: Distribution of Female Population Aged Five Years and Above Attending School by Age and Level of Attending; Tanzania Mainland Rural, 2012 Census
Age Total 0 Primary Education
TP PS Secondary Education
TS UN 1 2 3 4 5 6 7 8 9 10 11 12 13 14
Total 3,526,796 246,867 668,652 446,280 389,295 366,702 317,112 330,362 291,947 7,775 7,131 - 118,023 90,009 85,373 84,492 4,912 6,862 10,510 54,492
5 131,361 131,361 - - - - - - - - - - - - - - - - - -
6 191,554 115,506 76,048 - - - - - - - - - - - - - - - - -
7 283,338 - 283,338 - - - - - - - - - - - - - - - - -
8 327,247 - 168,442 158,805 - - - - - - - - - - - - - - - -
9 325,382 - 78,775 133,820 112,787 - - - - - - - - - - - - - - -
10 385,665 - 41,696 92,315 136,986 114,668 - - - - - - - - - - - - - -
11 282,927 - 11,721 31,327 64,748 97,939 77,192 - - - - - - - - - - - - -
12 412,056 - 8,632 24,199 53,422 99,308 127,874 98,621 - - - - - - - - - - - -
13 279,763 - - 5,814 15,387 33,266 60,362 97,411 66,986 537 - - - - - - - - - -
14 250,201 - - - 5,965 15,528 31,720 71,354 93,264 1,848 - - 30,522 - - - - - - -
15 179,591 - - - - 5,993 14,162 37,740 62,305 2,290 - - 35,282 21,819 - - - - - -
16 136,926 - - - - - 5,802 18,588 37,869 1,666 1,010 - 26,460 27,509 18,022 - - - - -
17 94,623 - - - - - - 6,648 18,560 900 - - 13,722 17,707 23,470 12,618 785 - 139 74
18 81,023 - - - - - - - 12,963 534 198 - 8,380 12,493 20,093 24,038 1,103 732 272 217
19 43,061 - - - - - - - - - 5 - 3,657 6,080 11,708 17,482 921 794 2,066 348
20 33,234 - - - - - - - - - 481 - - 4,401 8,472 15,255 877 1,188 1,309 1,251
21 14,861 - - - - - - - - - 240 - - - 3,608 7,278 402 974 947 1,412
22 13,483 - - - - - - - - - 291 - - - - 7,821 472 1,091 1,273 2,535
23 6,757 - - - - - - - - - 262 - - - - - 352 1,076 1,324 3,743
24 5,883 - - - - - - - - - 249 - - - - - - 1,007 281 4,346
25+ 47,860 - - - - - - - - - 4,395 - - - - - - - 2,899 40,566
NOTE: TP = Training after Primary School Education
PS = Pre-School Education
TS = Training after Secondary School Education
UN = University and Other Related Education

73
Table 8.26: Distribution of Male Population Aged Five Years and Above Attending School by Age and Level of Attending; Tanzania Mainland Urban, 2012 Census
Age Total 0 Primary Education
TP PS Secondary Education
TS UN 1 2 3 4 5 6 7 8 9 10 11 12 13 14
Total 1,783,273 159,363 247,758 155,157 142,139 137,372 121,785 128,790 118,885 6,866 5,279 - 90,068 85,551 94,994 112,268 19,897 28,189 16,854 112,058
5 90,242 90,242 - - - - - - - - - - - - - - - - - -
6 105,618 69,121 36,497 - - - - - - - - - - - - - - - - -
7 127,957 - 127,957 - - - - - - - - - - - - - - - - -
8 121,970 - 50,888 71,082 - - - - - - - - - - - - - - - -
9 119,673 - 19,461 45,579 54,633 - - - - - - - - - - - - - - -
10 133,636 - 8,414 23,650 48,106 53,466 - - - - - - - - - - - - - -
11 104,640 - 2,543 7,672 19,166 36,966 38,293 - - - - - - - - - - - - -
12 153,512 - 1,998 5,752 14,318 31,283 49,859 50,302 - - - - - - - - - - - -
13 108,913 - - 1,422 4,228 9,450 19,054 38,896 35,096 767 - - - - - - - - - -
14 101,831 - - - 1,688 4,411 8,532 21,734 35,869 1,921 - - 27,676 - - - - - - -
15 89,419 - - - - 1,796 4,213 10,428 20,683 2,020 - - 27,572 22,707 - - - - - -
16 86,010 - - - - - 1,834 5,251 12,789 1,104 686 - 17,364 25,719 21,263 - - - - -
17 82,679 - - - - - - 2,179 8,079 673 - - 9,311 16,677 27,395 17,034 709 - 253 369
18 80,187 - - - - - - - 6,369 381 318 - 5,708 10,770 21,118 28,874 4,100 556 702 1,291
19 55,544 - - - - - - - - - 11 - 2,437 5,594 12,158 22,256 4,760 3,438 2,744 2,146
20 53,566 - - - - - - - - - 582 - - 4,084 8,871 21,298 4,515 6,197 2,585 5,434
21 31,479 - - - - - - - - - 337 - - - 4,189 10,978 2,384 5,161 2,198 6,232
22 33,772 - - - - - - - - - 421 - - - - 11,828 2,205 5,544 3,262 10,512
23 20,982 - - - - - - - - - 638 - - - - - 1,224 3,964 3,106 12,050
24 17,684 - - - - - - - - - 534 - - - - - - 3,329 580 13,241
25+ 63,959 - - - - - - - - - 1,752 - - - - - - - 1,424 60,783
NOTE: TP = Training after Primary School Education
PS = Pre-School Education
TS = Training after Secondary School Education
UN = University and Other Related Education

74
Table 8.27: Distribution of Female Population Aged Five Years and Above Attending School by Age and Level of Attending; Tanzania Mainland Urban, 2012 Census
Age Total 0 Primary Education
TP PS Secondary Education
TS UN 1 2 3 4 5 6 7 8 9 10 11 12 13 14
Total 1,803,867 157,746 251,428 158,103 146,327 143,971 127,884 140,056 139,283 7,721 5,726 - 96,605 86,753 89,662 104,859 11,018 16,560 19,707 100,458
5 92,029 92,029 - - - - - - - - - - - - - - - - - -
6 111,898 65,717 46,181 - - - - - - - - - - - - - - - - -
7 132,310 - 132,310 - - - - - - - - - - - - - - - - -
8 130,555 - 46,958 83,597 - - - - - - - - - - - - - - - -
9 127,236 - 15,790 43,490 67,956 - - - - - - - - - - - - - - -
10 141,515 - 6,605 20,085 46,832 67,993 - - - - - - - - - - - - - -
11 112,991 - 1,977 5,873 16,581 37,583 50,977 - - - - - - - - - - - - -
12 160,111 - 1,607 3,947 10,894 26,939 50,292 66,432 - - - - - - - - - - - -
13 116,995 - - 1,111 2,939 7,301 16,113 40,234 48,250 1,047 - - - - - - - - - -
14 111,480 - - - 1,125 2,929 6,565 19,577 39,867 2,762 - - 38,655 - - - - - - -
15 95,916 - - - - 1,226 2,691 8,337 21,451 2,042 - - 29,441 30,728 - - - - - -
16 94,699 - - - - - 1,246 4,026 14,332 1,124 735 - 16,252 27,504 29,480 - - - - -
17 84,018 - - - - - - 1,450 8,458 461 - - 7,125 14,124 27,612 23,167 696 - 433 492
18 73,361 - - - - - - - 6,925 285 330 - 3,575 8,058 16,907 29,938 3,746 564 1,187 1,846
19 46,419 - - - - - - - - - 20 - 1,557 3,779 8,288 19,621 2,910 3,476 3,680 3,088
20 40,817 - - - - - - - - - 620 - - 2,560 5,163 16,179 1,900 4,488 3,465 6,442
21 23,782 - - - - - - - - - 336 - - - 2,212 8,058 736 2,524 2,787 7,129
22 24,418 - - - - - - - - - 389 - - - - 7,896 639 2,396 3,074 10,024
23 15,369 - - - - - - - - - 569 - - - - - 391 1,631 2,848 9,930
24 12,184 - - - - - - - - - 449 - - - - - - 1,481 551 9,703
25+ 55,764 - - - - - - - - - 2,278 - - - - - - - 1,682 51,804
NOTE: TP = Training after Primary School Education
PS = Pre-School Education
TS = Training after Secondary School Education
UN = University and Other Related Education

75
Table 8.28: Distribution of Population Aged Five Years and Above Who Completed School by Age and Level Attained; Tanzania Mainland, 2012 Census
Age Total 0 Primary Education
TP PS Secondary Education
TS UN 1 2 3 4 5 6 7 8 9 10 11 12 13 14
Total 14,129,285 11,064 45,516 61,906 37,881 407,655 34,487 39,586 11,013,357 113,204 104,197 1,817 20,750 32,449 20,858 1,576,018 5,516 163,505 114,922 324,597
5 7,300 7,300 - - - - - - - - - - - - - - - - - -
6 7,026 3,764 3,262 - - - - - - - - - - - - - - - - -
7 9,419 - 9,419 - - - - - - - - - - - - - - - - -
8 8,462 - 3,885 4,577 - - - - - - - - - - - - - - - -
9 8,075 - 1,526 3,035 3,514 - - - - - - - - - - - - - - -
10 11,153 - 1,018 2,024 3,861 4,250 - - - - - - - - - - - - - -
11 10,395 - 481 1,028 2,318 3,948 2,620 - - - - - - - - - - - - -
12 27,606 - 814 2,241 3,311 7,624 6,390 7,226 - - - - - - - - - - - -
13 43,469 - 110 208 365 919 750 1,165 39,834 71 35 12 - - - - - - - -
14 111,931 - 203 217 306 601 599 1,216 107,500 207 47 27 1,008 - - - - - - -
15 196,881 - 274 280 393 664 609 1,119 190,866 359 99 31 1,277 910 - - - - - -
16 261,113 - 327 396 357 661 554 972 253,748 309 294 21 1,225 1,241 1,008 - - - - -
17 300,478 - 369 508 337 693 535 817 279,323 333 249 28 1,039 1,130 1,347 12,871 - - 679 220
18 437,565 - 645 1,321 520 1,040 603 1,006 383,702 450 383 110 1,138 1,384 1,578 41,858 308 - 934 585
19 365,585 - 625 1,707 343 933 422 725 290,900 366 428 26 904 1,211 1,198 60,473 321 2,914 1,147 942
20 592,851 - 1,080 3,109 599 1,687 750 1,062 449,712 656 3,602 45 1,126 1,740 1,631 113,102 428 7,601 2,400 2,521
21 353,905 - 816 2,238 433 1,274 410 573 243,954 412 2,151 25 674 1,111 971 85,583 284 7,575 2,228 3,193
22 531,193 - 1,137 2,972 656 1,863 714 896 379,869 570 3,535 56 926 1,559 1,295 115,573 353 9,784 3,807 5,628
23 375,151 - 820 2,000 472 1,172 451 626 263,273 446 2,610 46 670 1,163 845 80,629 262 7,927 3,890 7,849
24 419,963 - 861 1,932 526 1,355 523 658 305,871 436 3,153 58 683 1,230 817 76,851 251 8,225 4,606 11,927
25+ 10,049,764 - 17,844 32,113 19,570 378,971 18,557 21,525 7,824,805 108,589 87,611 1,332 10,080 19,770 10,168 989,078 3,309 119,479 95,231 291,732
NOTE: TP = Training after Primary School Education
PS = Pre-School Education
TS = Training after Secondary School Education
UN = University and Other Related Education
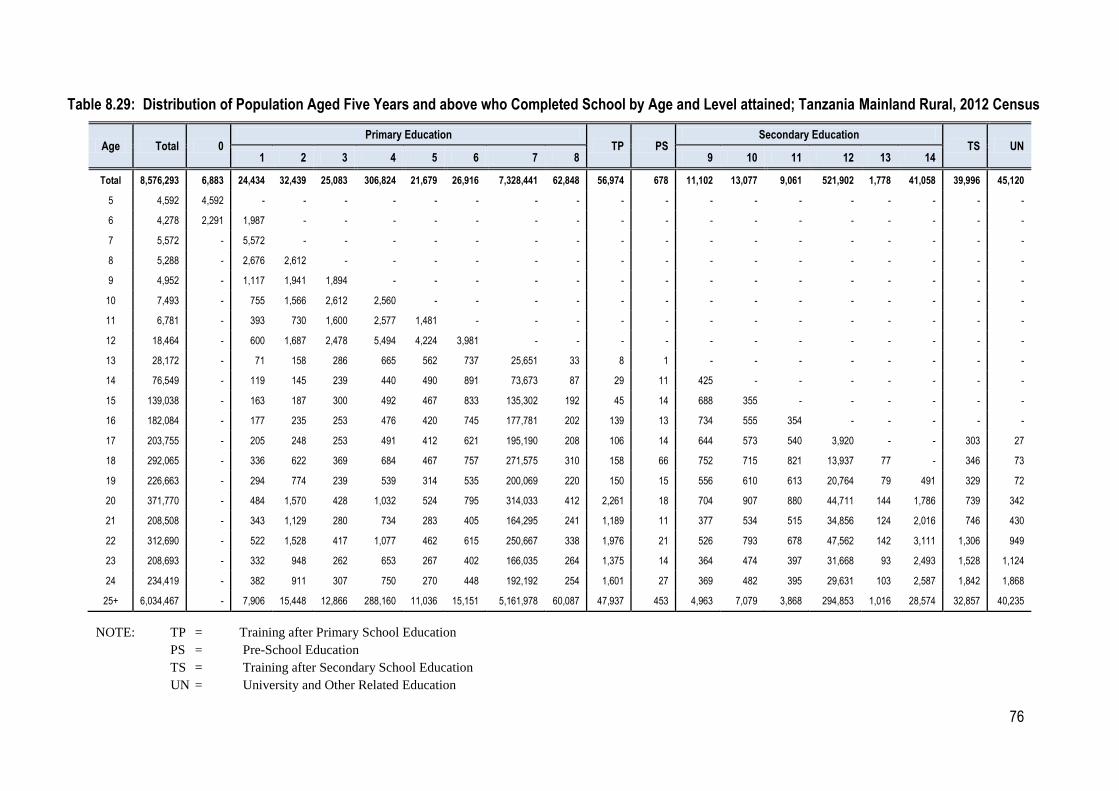
76
Table 8.29: Distribution of Population Aged Five Years and above who Completed School by Age and Level attained; Tanzania Mainland Rural, 2012 Census
Age Total 0 Primary Education
TP PS Secondary Education
TS UN 1 2 3 4 5 6 7 8 9 10 11 12 13 14
Total 8,576,293 6,883 24,434 32,439 25,083 306,824 21,679 26,916 7,328,441 62,848 56,974 678 11,102 13,077 9,061 521,902 1,778 41,058 39,996 45,120
5 4,592 4,592 - - - - - - - - - - - - - - - - - -
6 4,278 2,291 1,987 - - - - - - - - - - - - - - - - -
7 5,572 - 5,572 - - - - - - - - - - - - - - - - -
8 5,288 - 2,676 2,612 - - - - - - - - - - - - - - - -
9 4,952 - 1,117 1,941 1,894 - - - - - - - - - - - - - - -
10 7,493 - 755 1,566 2,612 2,560 - - - - - - - - - - - - - -
11 6,781 - 393 730 1,600 2,577 1,481 - - - - - - - - - - - - -
12 18,464 - 600 1,687 2,478 5,494 4,224 3,981 - - - - - - - - - - - -
13 28,172 - 71 158 286 665 562 737 25,651 33 8 1 - - - - - - - -
14 76,549 - 119 145 239 440 490 891 73,673 87 29 11 425 - - - - - - -
15 139,038 - 163 187 300 492 467 833 135,302 192 45 14 688 355 - - - - - -
16 182,084 - 177 235 253 476 420 745 177,781 202 139 13 734 555 354 - - - - -
17 203,755 - 205 248 253 491 412 621 195,190 208 106 14 644 573 540 3,920 - - 303 27
18 292,065 - 336 622 369 684 467 757 271,575 310 158 66 752 715 821 13,937 77 - 346 73
19 226,663 - 294 774 239 539 314 535 200,069 220 150 15 556 610 613 20,764 79 491 329 72
20 371,770 - 484 1,570 428 1,032 524 795 314,033 412 2,261 18 704 907 880 44,711 144 1,786 739 342
21 208,508 - 343 1,129 280 734 283 405 164,295 241 1,189 11 377 534 515 34,856 124 2,016 746 430
22 312,690 - 522 1,528 417 1,077 462 615 250,667 338 1,976 21 526 793 678 47,562 142 3,111 1,306 949
23 208,693 - 332 948 262 653 267 402 166,035 264 1,375 14 364 474 397 31,668 93 2,493 1,528 1,124
24 234,419 - 382 911 307 750 270 448 192,192 254 1,601 27 369 482 395 29,631 103 2,587 1,842 1,868
25+ 6,034,467 - 7,906 15,448 12,866 288,160 11,036 15,151 5,161,978 60,087 47,937 453 4,963 7,079 3,868 294,853 1,016 28,574 32,857 40,235
NOTE: TP = Training after Primary School Education
PS = Pre-School Education
TS = Training after Secondary School Education
UN = University and Other Related Education

77
Table 8.30: Distribution of Population Aged Five Years and above who Completed School by Age and Level attained; Tanzania Mainland Urban, 2012 Census
Age Total 0 Primary Education
TP PS Secondary Education
TS UN 1 2 3 4 5 6 7 8 9 10 11 12 13 14
Total 5,552,992 4,181 21,082 29,467 12,798 100,831 12,808 12,670 3,684,916 50,356 47,223 1,139 9,648 19,372 11,797 1,054,116 3,738 122,447 74,926 279,477
5 2,708 2,708 - - - - - - - - - - - - - - - - - -
6 2,748 1,473 1,275 - - - - - - - - - - - - - - - - -
7 3,847 - 3,847 - - - - - - - - - - - - - - - - -
8 3,174 - 1,209 1,965 - - - - - - - - - - - - - - - -
9 3,123 - 409 1,094 1,620 - - - - - - - - - - - - - - -
10 3,660 - 263 458 1,249 1,690 - - - - - - - - - - - - - -
11 3,614 - 88 298 718 1,371 1,139 - - - - - - - - - - - - -
12 9,142 - 214 554 833 2,130 2,166 3,245 - - - - - - - - - - - -
13 15,297 - 39 50 79 254 188 428 14,183 38 27 11 - - - - - - - -
14 35,382 - 84 72 67 161 109 325 33,827 120 18 16 583 - - - - - - -
15 57,843 - 111 93 93 172 142 286 55,564 167 54 17 589 555 - - - - - -
16 79,029 - 150 161 104 185 134 227 75,967 107 155 8 491 686 654 - - - - -
17 96,723 - 164 260 84 202 123 196 84,133 125 143 14 395 557 807 8,951 - - 376 193
18 145,500 - 309 699 151 356 136 249 112,127 140 225 44 386 669 757 27,921 231 - 588 512
19 138,922 - 331 933 104 394 108 190 90,831 146 278 11 348 601 585 39,709 242 2,423 818 870
20 221,081 - 596 1,539 171 655 226 267 135,679 244 1,341 27 422 833 751 68,391 284 5,815 1,661 2,179
21 145,397 - 473 1,109 153 540 127 168 79,659 171 962 14 297 577 456 50,727 160 5,559 1,482 2,763
22 218,503 - 615 1,444 239 786 252 281 129,202 232 1,559 35 400 766 617 68,011 211 6,673 2,501 4,679
23 166,458 - 488 1,052 210 519 184 224 97,238 182 1,235 32 306 689 448 48,961 169 5,434 2,362 6,725
24 185,544 - 479 1,021 219 605 253 210 113,679 182 1,552 31 314 748 422 47,220 148 5,638 2,764 10,059
25+ 4,015,297 - 9,938 16,665 6,704 90,811 7,521 6,374 2,662,827 48,502 39,674 879 5,117 12,691 6,300 694,225 2,293 90,905 62,374 251,497
NOTE: TP = Training after Primary School Education
PS = Pre-School Education
TS = Training after Secondary School Education
UN = University and Other Related Education
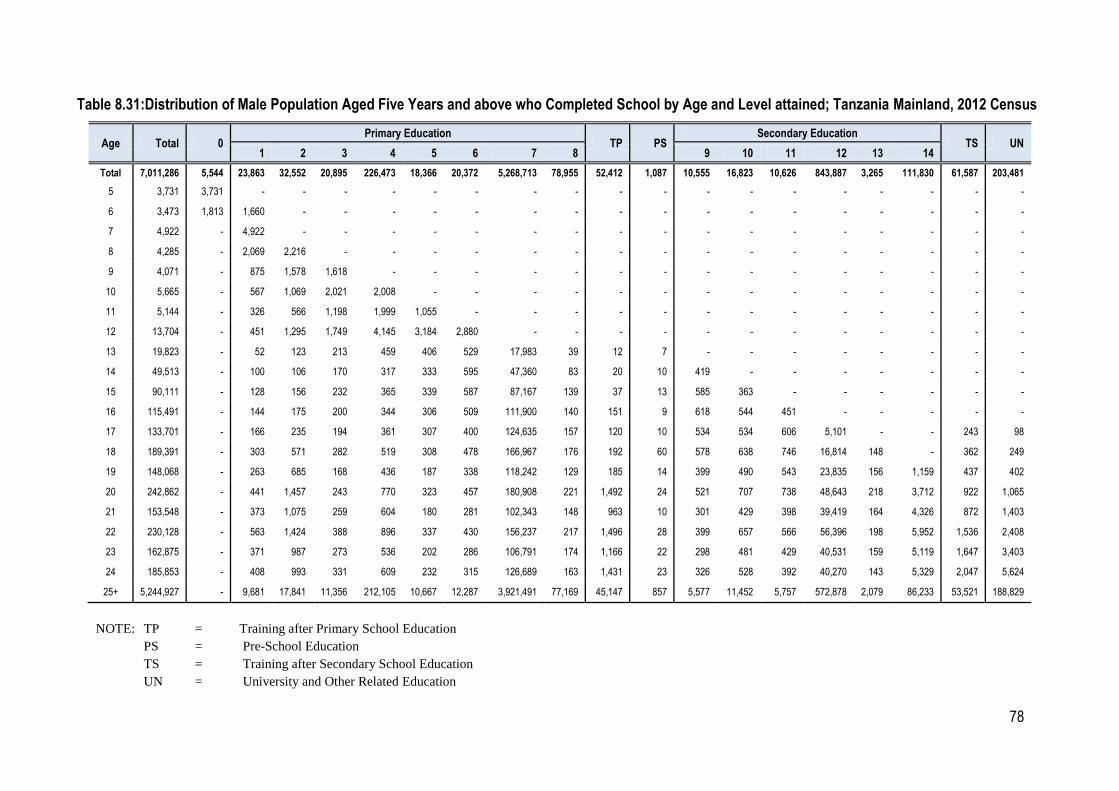
78
Table 8.31:Distribution of Male Population Aged Five Years and above who Completed School by Age and Level attained; Tanzania Mainland, 2012 Census
Age Total 0 Primary Education
TP PS Secondary Education
TS UN 1 2 3 4 5 6 7 8 9 10 11 12 13 14
Total 7,011,286 5,544 23,863 32,552 20,895 226,473 18,366 20,372 5,268,713 78,955 52,412 1,087 10,555 16,823 10,626 843,887 3,265 111,830 61,587 203,481
5 3,731 3,731 - - - - - - - - - - - - - - - - - -
6 3,473 1,813 1,660 - - - - - - - - - - - - - - - - -
7 4,922 - 4,922 - - - - - - - - - - - - - - - - -
8 4,285 - 2,069 2,216 - - - - - - - - - - - - - - - -
9 4,071 - 875 1,578 1,618 - - - - - - - - - - - - - - -
10 5,665 - 567 1,069 2,021 2,008 - - - - - - - - - - - - - -
11 5,144 - 326 566 1,198 1,999 1,055 - - - - - - - - - - - - -
12 13,704 - 451 1,295 1,749 4,145 3,184 2,880 - - - - - - - - - - - -
13 19,823 - 52 123 213 459 406 529 17,983 39 12 7 - - - - - - - -
14 49,513 - 100 106 170 317 333 595 47,360 83 20 10 419 - - - - - - -
15 90,111 - 128 156 232 365 339 587 87,167 139 37 13 585 363 - - - - - -
16 115,491 - 144 175 200 344 306 509 111,900 140 151 9 618 544 451 - - - - -
17 133,701 - 166 235 194 361 307 400 124,635 157 120 10 534 534 606 5,101 - - 243 98
18 189,391 - 303 571 282 519 308 478 166,967 176 192 60 578 638 746 16,814 148 - 362 249
19 148,068 - 263 685 168 436 187 338 118,242 129 185 14 399 490 543 23,835 156 1,159 437 402
20 242,862 - 441 1,457 243 770 323 457 180,908 221 1,492 24 521 707 738 48,643 218 3,712 922 1,065
21 153,548 - 373 1,075 259 604 180 281 102,343 148 963 10 301 429 398 39,419 164 4,326 872 1,403
22 230,128 - 563 1,424 388 896 337 430 156,237 217 1,496 28 399 657 566 56,396 198 5,952 1,536 2,408
23 162,875 - 371 987 273 536 202 286 106,791 174 1,166 22 298 481 429 40,531 159 5,119 1,647 3,403
24 185,853 - 408 993 331 609 232 315 126,689 163 1,431 23 326 528 392 40,270 143 5,329 2,047 5,624
25+ 5,244,927 - 9,681 17,841 11,356 212,105 10,667 12,287 3,921,491 77,169 45,147 857 5,577 11,452 5,757 572,878 2,079 86,233 53,521 188,829
NOTE: TP = Training after Primary School Education
PS = Pre-School Education
TS = Training after Secondary School Education
UN = University and Other Related Education
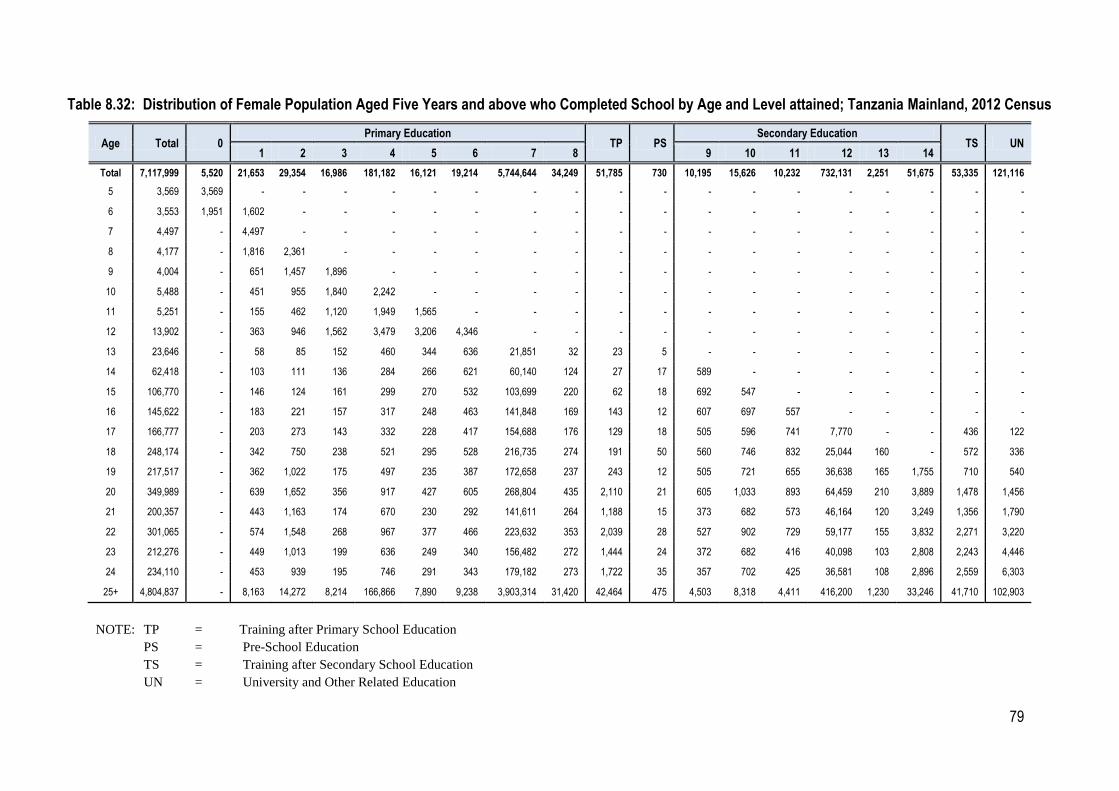
79
Table 8.32: Distribution of Female Population Aged Five Years and above who Completed School by Age and Level attained; Tanzania Mainland, 2012 Census
Age Total 0 Primary Education
TP PS Secondary Education
TS UN 1 2 3 4 5 6 7 8 9 10 11 12 13 14
Total 7,117,999 5,520 21,653 29,354 16,986 181,182 16,121 19,214 5,744,644 34,249 51,785 730 10,195 15,626 10,232 732,131 2,251 51,675 53,335 121,116
5 3,569 3,569 - - - - - - - - - - - - - - - - - -
6 3,553 1,951 1,602 - - - - - - - - - - - - - - - - -
7 4,497 - 4,497 - - - - - - - - - - - - - - - - -
8 4,177 - 1,816 2,361 - - - - - - - - - - - - - - - -
9 4,004 - 651 1,457 1,896 - - - - - - - - - - - - - - -
10 5,488 - 451 955 1,840 2,242 - - - - - - - - - - - - - -
11 5,251 - 155 462 1,120 1,949 1,565 - - - - - - - - - - - - -
12 13,902 - 363 946 1,562 3,479 3,206 4,346 - - - - - - - - - - - -
13 23,646 - 58 85 152 460 344 636 21,851 32 23 5 - - - - - - - -
14 62,418 - 103 111 136 284 266 621 60,140 124 27 17 589 - - - - - - -
15 106,770 - 146 124 161 299 270 532 103,699 220 62 18 692 547 - - - - - -
16 145,622 - 183 221 157 317 248 463 141,848 169 143 12 607 697 557 - - - - -
17 166,777 - 203 273 143 332 228 417 154,688 176 129 18 505 596 741 7,770 - - 436 122
18 248,174 - 342 750 238 521 295 528 216,735 274 191 50 560 746 832 25,044 160 - 572 336
19 217,517 - 362 1,022 175 497 235 387 172,658 237 243 12 505 721 655 36,638 165 1,755 710 540
20 349,989 - 639 1,652 356 917 427 605 268,804 435 2,110 21 605 1,033 893 64,459 210 3,889 1,478 1,456
21 200,357 - 443 1,163 174 670 230 292 141,611 264 1,188 15 373 682 573 46,164 120 3,249 1,356 1,790
22 301,065 - 574 1,548 268 967 377 466 223,632 353 2,039 28 527 902 729 59,177 155 3,832 2,271 3,220
23 212,276 - 449 1,013 199 636 249 340 156,482 272 1,444 24 372 682 416 40,098 103 2,808 2,243 4,446
24 234,110 - 453 939 195 746 291 343 179,182 273 1,722 35 357 702 425 36,581 108 2,896 2,559 6,303
25+ 4,804,837 - 8,163 14,272 8,214 166,866 7,890 9,238 3,903,314 31,420 42,464 475 4,503 8,318 4,411 416,200 1,230 33,246 41,710 102,903
NOTE: TP = Training after Primary School Education
PS = Pre-School Education
TS = Training after Secondary School Education
UN = University and Other Related Education
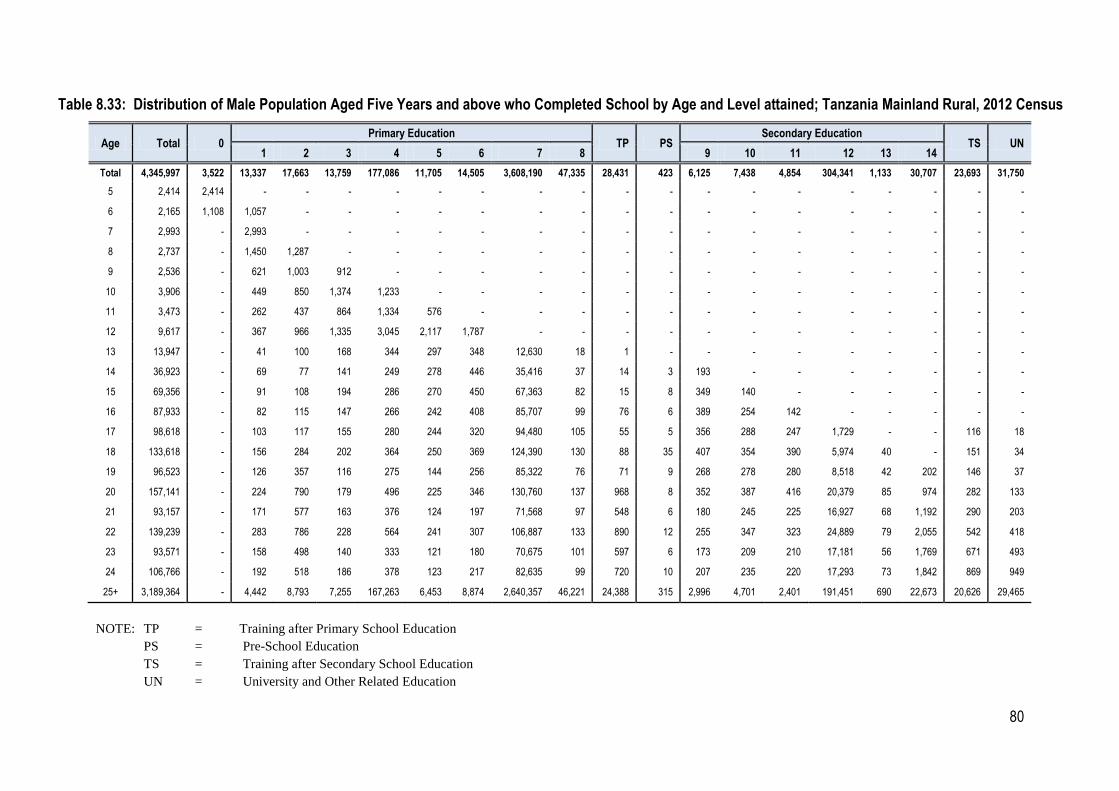
80
Table 8.33: Distribution of Male Population Aged Five Years and above who Completed School by Age and Level attained; Tanzania Mainland Rural, 2012 Census
Age Total 0 Primary Education
TP PS Secondary Education
TS UN 1 2 3 4 5 6 7 8 9 10 11 12 13 14
Total 4,345,997 3,522 13,337 17,663 13,759 177,086 11,705 14,505 3,608,190 47,335 28,431 423 6,125 7,438 4,854 304,341 1,133 30,707 23,693 31,750
5 2,414 2,414 - - - - - - - - - - - - - - - - - -
6 2,165 1,108 1,057 - - - - - - - - - - - - - - - - -
7 2,993 - 2,993 - - - - - - - - - - - - - - - - -
8 2,737 - 1,450 1,287 - - - - - - - - - - - - - - - -
9 2,536 - 621 1,003 912 - - - - - - - - - - - - - - -
10 3,906 - 449 850 1,374 1,233 - - - - - - - - - - - - - -
11 3,473 - 262 437 864 1,334 576 - - - - - - - - - - - - -
12 9,617 - 367 966 1,335 3,045 2,117 1,787 - - - - - - - - - - - -
13 13,947 - 41 100 168 344 297 348 12,630 18 1 - - - - - - - - -
14 36,923 - 69 77 141 249 278 446 35,416 37 14 3 193 - - - - - - -
15 69,356 - 91 108 194 286 270 450 67,363 82 15 8 349 140 - - - - - -
16 87,933 - 82 115 147 266 242 408 85,707 99 76 6 389 254 142 - - - - -
17 98,618 - 103 117 155 280 244 320 94,480 105 55 5 356 288 247 1,729 - - 116 18
18 133,618 - 156 284 202 364 250 369 124,390 130 88 35 407 354 390 5,974 40 - 151 34
19 96,523 - 126 357 116 275 144 256 85,322 76 71 9 268 278 280 8,518 42 202 146 37
20 157,141 - 224 790 179 496 225 346 130,760 137 968 8 352 387 416 20,379 85 974 282 133
21 93,157 - 171 577 163 376 124 197 71,568 97 548 6 180 245 225 16,927 68 1,192 290 203
22 139,239 - 283 786 228 564 241 307 106,887 133 890 12 255 347 323 24,889 79 2,055 542 418
23 93,571 - 158 498 140 333 121 180 70,675 101 597 6 173 209 210 17,181 56 1,769 671 493
24 106,766 - 192 518 186 378 123 217 82,635 99 720 10 207 235 220 17,293 73 1,842 869 949
25+ 3,189,364 - 4,442 8,793 7,255 167,263 6,453 8,874 2,640,357 46,221 24,388 315 2,996 4,701 2,401 191,451 690 22,673 20,626 29,465
NOTE: TP = Training after Primary School Education
PS = Pre-School Education
TS = Training after Secondary School Education
UN = University and Other Related Education

81
Table 8.34: Distribution of Female Population Aged Five Years and above who Completed School by Age and Level attained; Tanzania Mainland Rural, 2012 Census
Age Total 0 Primary Education
TP PS Secondary Education
TS UN 1 2 3 4 5 6 7 8 9 10 11 12 13 14
Total 4,230,296 3,361 11,097 14,776 11,324 129,738 9,974 12,411 3,720,251 15,513 28,543 255 4,977 5,639 4,207 217,561 645 10,351 16,303 13,370
5 2,178 2,178 - - - - - - - - - - - - - - - - - -
6 2,113 1,183 930 - - - - - - - - - - - - - - - - -
7 2,579 - 2,579 - - - - - - - - - - - - - - - - -
8 2,551 - 1,226 1,325 - - - - - - - - - - - - - - - -
9 2,416 - 496 938 982 - - - - - - - - - - - - - - -
10 3,587 - 306 716 1,238 1,327 - - - - - - - - - - - - - -
11 3,308 - 131 293 736 1,243 905 - - - - - - - - - - - - -
12 8,847 - 233 721 1,143 2,449 2,107 2,194 - - - - - - - - - - - -
13 14,225 - 30 58 118 321 265 389 13,021 15 7 1 - - - - - - - -
14 39,626 - 50 68 98 191 212 445 38,257 50 15 8 232 - - - - - - -
15 69,682 - 72 79 106 206 197 383 67,939 110 30 6 339 215 - - - - - -
16 94,151 - 95 120 106 210 178 337 92,074 103 63 7 345 301 212 - - - - -
17 105,137 - 102 131 98 211 168 301 100,710 103 51 9 288 285 293 2,191 - - 187 9
18 158,447 - 180 338 167 320 217 388 147,185 180 70 31 345 361 431 7,963 37 - 195 39
19 130,140 - 168 417 123 264 170 279 114,747 144 79 6 288 332 333 12,246 37 289 183 35
20 214,629 - 260 780 249 536 299 449 183,273 275 1,293 10 352 520 464 24,332 59 812 457 209
21 115,351 - 172 552 117 358 159 208 92,727 144 641 5 197 289 290 17,929 56 824 456 227
22 173,451 - 239 742 189 513 221 308 143,780 205 1,086 9 271 446 355 22,673 63 1,056 764 531
23 115,122 - 174 450 122 320 146 222 95,360 163 778 8 191 265 187 14,487 37 724 857 631
24 127,653 - 190 393 121 372 147 231 109,557 155 881 17 162 247 175 12,338 30 745 973 919
25+ 2,845,103 - 3,464 6,655 5,611 120,897 4,583 6,277 2,521,621 13,866 23,549 138 1,967 2,378 1,467 103,402 326 5,901 12,231 10,770
NOTE: TP = Training after Primary School Education
PS = Pre-School Education
TS = Training after Secondary School Education
UN = University and Other Related Education

82
Table 8.35: Male Population Aged Five Years and above who Completed School by Age and Level attained; Tanzania Mainland Urban, 2012 Census
Age Total 0 Primary Education
TP PS Secondary Education
TS UN 1 2 3 4 5 6 7 8 9 10 11 12 13 14
Total 2,665,289 2,022 10,526 14,889 7,136 49,387 6,661 5,867 1,660,523 31,620 23,981 664 4,430 9,385 5,772 539,546 2,132 81,123 37,894 171,731
5 1,317 1,317 - - - - - - - - - - - - - - - - - -
6 1,308 705 603 - - - - - - - - - - - - - - - - -
7 1,929 - 1,929 - - - - - - - - - - - - - - - - -
8 1,548 - 619 929 - - - - - - - - - - - - - - - -
9 1,535 - 254 575 706 - - - - - - - - - - - - - - -
10 1,759 - 118 219 647 775 - - - - - - - - - - - - - -
11 1,671 - 64 129 334 665 479 - - - - - - - - - - - - -
12 4,087 - 84 329 414 1,100 1,067 1,093 - - - - - - - - - - - -
13 5,876 - 11 23 45 115 109 181 5,353 21 11 7 - - - - - - - -
14 12,590 - 31 29 29 68 55 149 11,944 46 6 7 226 - - - - - - -
15 20,755 - 37 48 38 79 69 137 19,804 57 22 5 236 223 - - - - - -
16 27,558 - 62 60 53 78 64 101 26,193 41 75 3 229 290 309 - - - - -
17 35,083 - 63 118 39 81 63 80 30,155 52 65 5 178 246 359 3,372 - - 127 80
18 55,773 - 147 287 80 155 58 109 42,577 46 104 25 171 284 356 10,840 108 - 211 215
19 51,545 - 137 328 52 161 43 82 32,920 53 114 5 131 212 263 15,317 114 957 291 365
20 85,721 - 217 667 64 274 98 111 50,148 84 524 16 169 320 322 28,264 133 2,738 640 932
21 60,391 - 202 498 96 228 56 84 30,775 51 415 4 121 184 173 22,492 96 3,134 582 1,200
22 90,889 - 280 638 160 332 96 123 49,350 84 606 16 144 310 243 31,507 119 3,897 994 1,990
23 69,304 - 213 489 133 203 81 106 36,116 73 569 16 125 272 219 23,350 103 3,350 976 2,910
24 79,087 - 216 475 145 231 109 98 44,054 64 711 13 119 293 172 22,977 70 3,487 1,178 4,675
25+ 2,055,563 - 5,239 9,048 4,101 44,842 4,214 3,413 1,281,134 30,948 20,759 542 2,581 6,751 3,356 381,427 1,389 63,560 32,895 159,364
NOTE: TP = Training after Primary School Education
PS = Pre-School Education
TS = Training after Secondary School Education
UN = University and Other Related Education

83
Table 8.36: Female Population Aged Five Years and above who Completed School by Age and Level attained; Tanzania Mainland Urban, 2012 Census
Age Total 0 Primary Education
TP PS Secondary Education
TS UN 1 2 3 4 5 6 7 8 9 10 11 12 13 14
Total 2,887,703 2,159 10,556 14,578 5,662 51,444 6,147 6,803 2,024,393 18,736 23,242 475 5,218 9,987 6,025 514,570 1,606 41,324 37,032 107,746
5 1,391 1,391 - - - - - - - - - - - - - - - - - -
6 1,440 768 672 - - - - - - - - - - - - - - - - -
7 1,918 - 1,918 - - - - - - - - - - - - - - - - -
8 1,626 - 590 1,036 - - - - - - - - - - - - - - - -
9 1,588 - 155 519 914 - - - - - - - - - - - - - - -
10 1,901 - 145 239 602 915 - - - - - - - - - - - - - -
11 1,943 - 24 169 384 706 660 - - - - - - - - - - - - -
12 5,055 - 130 225 419 1,030 1,099 2,152 - - - - - - - - - - - -
13 9,421 - 28 27 34 139 79 247 8,830 17 16 4 - - - - - - - -
14 22,792 - 53 43 38 93 54 176 21,883 74 12 9 357 - - - - - - -
15 37,088 - 74 45 55 93 73 149 35,760 110 32 12 353 332 - - - - - -
16 51,471 - 88 101 51 107 70 126 49,774 66 80 5 262 396 345 - - - - -
17 61,640 - 101 142 45 121 60 116 53,978 73 78 9 217 311 448 5,579 - - 249 113
18 89,727 - 162 412 71 201 78 140 69,550 94 121 19 215 385 401 17,081 123 - 377 297
19 87,377 - 194 605 52 233 65 108 57,911 93 164 6 217 389 322 24,392 128 1,466 527 505
20 135,360 - 379 872 107 381 128 156 85,531 160 817 11 253 513 429 40,127 151 3,077 1,021 1,247
21 85,006 - 271 611 57 312 71 84 48,884 120 547 10 176 393 283 28,235 64 2,425 900 1,563
22 127,614 - 335 806 79 454 156 158 79,852 148 953 19 256 456 374 36,504 92 2,776 1,507 2,689
23 97,154 - 275 563 77 316 103 118 61,122 109 666 16 181 417 229 25,611 66 2,084 1,386 3,815
24 106,457 - 263 546 74 374 144 112 69,625 118 841 18 195 455 250 24,243 78 2,151 1,586 5,384
25+ 1,959,734 - 4,699 7,617 2,603 45,969 3,307 2,961 1,381,693 17,554 18,915 337 2,536 5,940 2,944 312,798 904 27,345 29,479 92,133
NOTE: TP = Training after Primary School Education
PS = Pre-School Education
TS = Training after Secondary School Education
UN = University and Other Related Education

84
Table 8.37: Distribution Population Aged Five Years and above who Dropped Out of School by Age and Level Attained; Tanzania Mainland, 2012 Census
Age Total 0 Primary Education
TP PS Secondary Education
TS UN 1 2 3 4 5 6 7 8 9 10 11 12 13 14
Total 2,559,392 4,249 159,811 321,743 454,590 590,303 325,699 227,329 76,536 10,550 26,648 813 103,958 158,801 77,043 12,775 4,611 1,501 755 1,677
5 2,784 2,784 - - - - - - - - - - - - - - - - - -
6 3,158 1,465 1,693 - - - - - - - - - - - - - - - - -
7 4,736 - 4,736 - - - - - - - - - - - - - - - - -
8 6,963 - 3,550 3,413 - - - - - - - - - - - - - - - -
9 9,413 - 3,472 3,800 2,141 - - - - - - - - - - - - - - -
10 19,403 - 4,964 5,871 4,635 3,933 - - - - - - - - - - - - - -
11 19,124 - 3,667 5,071 4,798 4,047 1,541 - - - - - - - - - - - - -
12 43,892 - 6,190 10,289 10,563 9,628 4,691 2,531 - - - - - - - - - - - -
13 42,062 - 3,995 8,094 10,052 9,568 5,973 3,772 567 33 6 2 - - - - - - - -
14 54,171 - 3,772 8,379 11,978 12,168 8,810 6,246 1,930 78 9 6 795 - - - - - - -
15 62,536 - 3,587 7,875 12,209 13,874 11,386 7,835 2,633 162 14 17 1,737 1,207 - - - - - -
16 66,382 - 3,061 6,754 11,375 13,321 12,174 9,100 3,010 277 15 30 3,244 2,964 1,057 - - - - -
17 69,154 - 2,717 6,234 10,448 12,775 11,658 8,742 3,278 405 14 38 5,076 5,268 2,232 244 - - 12 13
18 95,176 - 3,614 8,305 13,898 16,820 14,900 11,468 4,351 591 24 57 7,260 8,804 4,329 554 162 - 14 25
19 73,376 - 2,678 5,686 9,630 11,796 10,693 7,969 3,278 502 28 71 6,736 8,909 4,550 595 148 42 31 34
20 114,964 - 4,562 9,611 15,949 19,463 16,377 11,910 3,906 651 1,211 88 9,346 13,184 7,174 1,087 265 71 53 56
21 64,880 - 2,394 4,890 8,381 10,351 8,553 6,459 2,105 461 683 49 6,016 8,775 4,762 661 195 62 32 51
22 97,527 - 3,822 8,017 13,154 16,356 13,434 9,404 3,142 593 1,055 57 8,141 12,316 6,561 1,025 255 70 51 74
23 63,790 - 2,673 5,394 8,689 10,658 8,239 5,800 2,038 405 727 38 5,304 8,355 4,394 661 247 62 35 71
24 70,724 - 3,337 6,501 10,640 12,495 8,947 6,356 2,309 376 767 38 5,158 8,592 4,171 617 268 45 38 69
25+ 1,575,177 - 91,327 207,559 296,050 413,050 188,323 129,737 43,989 6,016 22,095 322 45,145 80,427 37,813 7,331 3,071 1,149 489 1,284

85
Table 8.38: Distribution of Population Aged Five Years and above who Dropped Out of School by Age and Level Attained; Tanzania Mainland Rural, 2012 Census
Age Total 0 Primary Education
TP PS Secondary Education
TS UN 1 2 3 4 5 6 7 8 9 10 11 12 13 14
Total 1,947,043 3,512 133,936 266,618 372,095 477,719 263,413 177,854 47,858 5,728 20,630 461 55,709 74,920 38,260 5,034 1,753 678 329 536
5 2,337 2,337 - - - - - - - - - - - - - - - - - -
6 2,631 1,175 1,456 - - - - - - - - - - - - - - - - -
7 3,879 - 3,879 - - - - - - - - - - - - - - - - -
8 5,784 - 3,052 2,732 - - - - - - - - - - - - - - - -
9 7,988 - 3,104 3,198 1,686 - - - - - - - - - - - - - - -
10 16,699 - 4,458 5,142 3,922 3,177 - - - - - - - - - - - - - -
11 16,229 - 3,269 4,386 4,094 3,341 1,139 - - - - - - - - - - - - -
12 37,329 - 5,537 8,970 9,071 8,169 3,730 1,852 - - - - - - - - - - - -
13 35,365 - 3,552 7,054 8,561 8,049 4,834 2,914 384 11 4 2 - - - - - - - -
14 45,386 - 3,306 7,209 10,255 10,287 7,312 5,026 1,478 43 3 5 462 - - - - - - -
15 51,662 - 3,110 6,845 10,389 11,726 9,473 6,315 1,935 102 10 12 1,133 612 - - - - - -
16 53,550 - 2,621 5,766 9,692 11,313 10,200 7,386 2,151 178 9 25 2,099 1,593 517 - - - - -
17 54,041 - 2,302 5,273 8,880 10,745 9,734 7,086 2,319 278 7 29 3,243 2,842 1,162 127 - - 7 7
18 73,706 - 3,062 7,061 11,784 14,153 12,444 9,275 3,066 359 14 37 4,705 4,907 2,485 269 65 - 9 11
19 54,468 - 2,202 4,753 8,002 9,754 8,797 6,288 2,170 306 19 37 4,162 4,961 2,594 294 79 15 19 16
20 86,932 - 3,740 8,142 13,387 16,149 13,503 9,493 2,587 408 952 63 5,919 7,590 4,234 556 130 27 26 26
21 47,624 - 1,949 4,042 6,933 8,403 6,980 5,112 1,354 265 513 33 3,758 5,014 2,776 346 88 22 15 21
22 71,322 - 3,115 6,616 10,799 13,270 10,971 7,402 1,933 363 780 32 4,819 6,771 3,768 496 112 34 20 21
23 45,348 - 2,155 4,364 7,082 8,651 6,653 4,411 1,213 222 521 21 2,962 4,282 2,377 291 84 29 13 17
24 50,405 - 2,607 5,346 8,625 10,014 7,295 4,890 1,316 211 604 18 2,768 4,109 2,166 264 109 16 22 25
25+ 1,184,358 - 75,460 169,719 238,933 330,518 150,348 100,404 25,952 2,982 17,194 147 19,679 32,239 16,181 2,391 1,086 535 198 392

86
Table 8.39: Distribution of Population Aged Five Years and above who Dropped Out of School by Age and Level Attained; Tanzania Mainland Urban, 2012 Census
Age Total 0 Primary Education
TP PS Secondary Education
TS UN 1 2 3 4 5 6 7 8 9 10 11 12 13 14
Total 612,349 737 25,875 55,125 82,495 112,584 62,286 49,475 28,678 4,822 6,018 352 48,249 83,881 38,783 7,741 2,858 823 426 1,141
5 447 447 - - - - - - - - - - - - - - - - - -
6 527 290 237 - - - - - - - - - - - - - - - - -
7 857 - 857 - - - - - - - - - - - - - - - - -
8 1,179 - 498 681 - - - - - - - - - - - - - - - -
9 1,425 - 368 602 455 - - - - - - - - - - - - - - -
10 2,704 - 506 729 713 756 - - - - - - - - - - - - - -
11 2,895 - 398 685 704 706 402 - - - - - - - - - - - - -
12 6,563 - 653 1,319 1,492 1,459 961 679 - - - - - - - - - - - -
13 6,697 - 443 1,040 1,491 1,519 1,139 858 183 22 2 - - - - - - - - -
14 8,785 - 466 1,170 1,723 1,881 1,498 1,220 452 35 6 1 333 - - - - - - -
15 10,874 - 477 1,030 1,820 2,148 1,913 1,520 698 60 4 5 604 595 - - - - - -
16 12,832 - 440 988 1,683 2,008 1,974 1,714 859 99 6 5 1,145 1,371 540 - - - - -
17 15,113 - 415 961 1,568 2,030 1,924 1,656 959 127 7 9 1,833 2,426 1,070 117 - - 5 6
18 21,470 - 552 1,244 2,114 2,667 2,456 2,193 1,285 232 10 20 2,555 3,897 1,844 285 97 - 5 14
19 18,908 - 476 933 1,628 2,042 1,896 1,681 1,108 196 9 34 2,574 3,948 1,956 301 69 27 12 18
20 28,032 - 822 1,469 2,562 3,314 2,874 2,417 1,319 243 259 25 3,427 5,594 2,940 531 135 44 27 30
21 17,256 - 445 848 1,448 1,948 1,573 1,347 751 196 170 16 2,258 3,761 1,986 315 107 40 17 30
22 26,205 - 707 1,401 2,355 3,086 2,463 2,002 1,209 230 275 25 3,322 5,545 2,793 529 143 36 31 53
23 18,442 - 518 1,030 1,607 2,007 1,586 1,389 825 183 206 17 2,342 4,073 2,017 370 163 33 22 54
24 20,319 - 730 1,155 2,015 2,481 1,652 1,466 993 165 163 20 2,390 4,483 2,005 353 159 29 16 44
25+ 390,819 - 15,867 37,840 57,117 82,532 37,975 29,333 18,037 3,034 4,901 175 25,466 48,188 21,632 4,940 1,985 614 291 892

87
Table 8.40: Distribution of Male Population Aged Five Years and above who Dropped Out of School by Age and Level Attained; Tanzania Mainland Males, 2012 Census
Age Total 0 Primary Education
TP PS Secondary Education
TS UN 1 2 3 4 5 6 7 8 9 10 11 12 13 14
Total 1,329,617 2,271 80,078 163,454 243,062 318,730 171,782 117,464 36,964 5,964 11,840 413 52,040 75,738 38,088 6,740 2,751 919 372 947
5 1,521 1,521 - - - - - - - - - - - - - - - - - -
6 1,623 750 873 - - - - - - - - - - - - - - - - -
7 2,455 - 2,455 - - - - - - - - - - - - - - - - -
8 3,719 - 1,994 1,725 - - - - - - - - - - - - - - - -
9 5,204 - 2,028 2,066 1,110 - - - - - - - - - - - - - - -
10 11,131 - 2,900 3,415 2,688 2,128 - - - - - - - - - - - - - -
11 10,858 - 2,114 2,942 2,740 2,293 769 - - - - - - - - - - - - -
12 25,843 - 3,755 6,077 6,385 5,664 2,620 1,342 - - - - - - - - - - - -
13 24,897 - 2,414 4,793 6,106 5,705 3,508 2,062 289 16 3 1 - - - - - - - -
14 32,068 - 2,226 4,991 7,296 7,350 5,226 3,532 1,021 36 4 2 384 - - - - - - -
15 37,992 - 2,193 4,902 7,751 8,789 6,944 4,460 1,455 67 10 9 842 570 - - - - - -
16 37,803 - 1,660 3,967 7,014 8,075 7,128 5,035 1,544 140 7 11 1,590 1,239 393 - - - - -
17 38,207 - 1,510 3,671 6,444 7,634 6,718 4,884 1,685 212 5 16 2,326 2,144 855 92 - - 4 7
18 49,337 - 1,879 4,526 7,989 9,583 8,135 6,040 2,019 293 8 20 3,343 3,592 1,580 250 65 - 4 11
19 35,293 - 1,283 2,959 5,133 6,269 5,477 3,966 1,479 215 16 36 2,989 3,477 1,612 264 65 20 13 20
20 54,069 - 2,033 4,634 8,099 9,928 8,045 5,656 1,723 293 586 42 4,169 5,368 2,824 489 102 27 16 35
21 31,891 - 1,133 2,434 4,449 5,532 4,364 3,187 1,021 235 336 26 2,875 3,770 2,047 307 107 33 11 24
22 47,415 - 1,719 3,851 6,773 8,433 6,755 4,668 1,405 299 476 24 3,858 5,485 2,974 492 114 41 20 28
23 31,222 - 1,209 2,533 4,467 5,533 4,121 2,949 898 205 345 22 2,563 3,742 2,073 353 113 46 16 34
24 35,132 - 1,495 3,078 5,526 6,604 4,546 3,155 1,021 192 359 22 2,561 3,954 2,056 316 156 28 22 41
25+ 811,937 - 43,205 100,890 153,092 219,210 97,426 66,528 21,404 3,761 9,685 182 24,540 42,397 21,674 4,177 2,029 724 266 747

88
Table 8.41: Distribution of Female Population Aged Five Years and above who Dropped Out of School by Age and Level Attained; Tanzania Females, 2012 Census
Age Total 0 Primary Education
TP PS Secondary Education
TS UN 1 2 3 4 5 6 7 8 9 10 11 12 13 14
Total 1,229,775 1,978 79,733 158,289 211,528 271,573 153,917 109,865 39,572 4,586 14,808 400 51,918 83,063 38,955 6,035 1,860 582 383 730
5 1,263 1,263 - - - - - - - - - - - - - - - - - -
6 1,535 715 820 - - - - - - - - - - - - - - - - -
7 2,281 - 2,281 - - - - - - - - - - - - - - - - -
8 3,244 - 1,556 1,688 - - - - - - - - - - - - - - - -
9 4,209 - 1,444 1,734 1,031 - - - - - - - - - - - - - - -
10 8,272 - 2,064 2,456 1,947 1,805 - - - - - - - - - - - - - -
11 8,266 - 1,553 2,129 2,058 1,754 772 - - - - - - - - - - - - -
12 18,049 - 2,435 4,212 4,178 3,964 2,071 1,189 - - - - - - - - - - - -
13 17,165 - 1,581 3,301 3,946 3,863 2,465 1,710 278 17 3 1 - - - - - - - -
14 22,103 - 1,546 3,388 4,682 4,818 3,584 2,714 909 42 5 4 411 - - - - - - -
15 24,544 - 1,394 2,973 4,458 5,085 4,442 3,375 1,178 95 4 8 895 637 - - - - - -
16 28,579 - 1,401 2,787 4,361 5,246 5,046 4,065 1,466 137 8 19 1,654 1,725 664 - - - - -
17 30,947 - 1,207 2,563 4,004 5,141 4,940 3,858 1,593 193 9 22 2,750 3,124 1,377 152 - - 8 6
18 45,839 - 1,735 3,779 5,909 7,237 6,765 5,428 2,332 298 16 37 3,917 5,212 2,749 304 97 - 10 14
19 38,083 - 1,395 2,727 4,497 5,527 5,216 4,003 1,799 287 12 35 3,747 5,432 2,938 331 83 22 18 14
20 60,895 - 2,529 4,977 7,850 9,535 8,332 6,254 2,183 358 625 46 5,177 7,816 4,350 598 163 44 37 21
21 32,989 - 1,261 2,456 3,932 4,819 4,189 3,272 1,084 226 347 23 3,141 5,005 2,715 354 88 29 21 27
22 50,112 - 2,103 4,166 6,381 7,923 6,679 4,736 1,737 294 579 33 4,283 6,831 3,587 533 141 29 31 46
23 32,568 - 1,464 2,861 4,222 5,125 4,118 2,851 1,140 200 382 16 2,741 4,613 2,321 308 134 16 19 37
24 35,592 - 1,842 3,423 5,114 5,891 4,401 3,201 1,288 184 408 16 2,597 4,638 2,115 301 112 17 16 28
25+ 763,240 - 48,122 106,669 142,958 193,840 90,897 63,209 22,585 2,255 12,410 140 20,605 38,030 16,139 3,154 1,042 425 223 537
89
Chapter Nine
Economic Activity
Tables on economic activity present distribution of population aged 10 years and above by sex,
region, economic activity, rural and urban areas. Economic activity had the following six categories;
usual economic activity, current economic activity, employment status, main occupation and main
industry.

90
Table 9.1: Distribution of Population Aged 10 Years and Above by Five Year Age Group and Type of Usual Activity; Tanzania Mainland, 2012 Census
Age Group Total Employed Unemployed Home Maintenance
(cooking/hygiene/caring) Full-time Students Unable
Total 29,398,908 18,792,193 777,564 2,812,479 6,049,375 967,295
10 - 14 5,539,980 996,459 25,254 634,713 3,738,706 144,848
15 - 19 4,354,614 1,883,512 90,623 506,859 1,792,886 80,735
20 - 24 3,696,044 2,529,458 159,235 460,698 517,783 28,869
25 - 29 3,203,434 2,627,634 209,331 345,171 - 21,298
30 - 34 2,759,838 2,396,708 96,750 247,126 - 19,254
35 - 39 2,316,072 2,061,284 63,078 175,805 - 15,905
40 - 44 1,799,981 1,623,615 42,703 118,896 - 14,766
45 - 49 1,425,499 1,281,193 28,717 90,707 - 24,882
50 - 54 1,150,215 1,032,656 21,371 70,305 - 25,883
55 - 59 738,213 657,042 12,118 44,407 - 24,646
60 - 64 737,242 618,389 12,015 46,724 - 60,114
65 - 69 474,731 378,578 6,714 28,919 - 60,520
70 - 74 459,643 321,645 6,245 26,921 - 104,831
75 - 79 283,580 182,670 3,344 14,923 - 82,643
80 + 459,822 201,350 66 305 - 258,101
Table 9.2: Distribution of Population Aged 10 Years and Above by Five Year Age Group and Type of Usual Activity; Tanzania Mainland Rural, 2012 Census
Age Group Total Employed Unemployed Home Maintenance
(cooking/hygiene/caring) Full-time Students Unable
Total 20,177,573 13,845,099 333,641 1,541,533 3,760,099 697,206
10 - 14 4,151,069 912,754 19,577 535,126 2,565,838 117,775
15 - 19 2,927,987 1,550,411 42,606 294,533 990,942 49,494
20 - 24 2,321,422 1,852,208 58,724 188,754 203,319 18,418
25 - 29 1,998,383 1,779,651 74,403 130,794 - 13,535
30 - 34 1,754,051 1,606,686 38,541 96,228 - 12,597
35 - 39 1,528,478 1,415,186 28,085 74,584 - 10,622
40 - 44 1,232,649 1,146,820 20,962 54,875 - 9,992
45 - 49 996,243 925,563 14,675 41,494 - 14,510
50 - 54 832,794 768,737 11,762 35,066 - 17,229
55 - 59 534,859 490,486 6,837 22,080 - 15,458
60 - 64 557,124 485,899 6,951 24,836 - 39,439
65 - 69 369,829 308,021 4,215 16,579 - 41,015
70 - 74 367,408 270,276 3,968 16,733 - 76,431
75 - 79 229,367 156,357 2,296 9,663 - 61,052
80 + 375,910 176,044 39 188 - 199,639

91
Table 9.3: Distribution of Population Aged 10 Years and Above by Five Year Age Group and Type of Usual Activity; Tanzania Mainland Urban, 2012 Census
Age Group Total Employed Unemployed Home Maintenance
(cooking/hygiene/caring) Full-time Students Unable
Total 9,221,335 4,947,096 443,923 1,270,947 2,289,275 270,095
10 - 14 1,388,911 83,705 5,677 99,587 1,172,868 27,074
15 - 19 1,426,627 333,100 48,015 212,326 801,944 31,241
20 - 24 1,374,622 677,250 100,512 271,944 314,463 10,452
25 - 29 1,205,051 847,983 134,928 214,377 - 7,763
30 - 34 1,005,787 790,022 58,209 150,898 - 6,657
35 - 39 787,594 646,097 34,993 101,222 - 5,283
40 - 44 567,332 476,795 21,741 64,021 - 4,774
45 - 49 429,256 355,630 14,042 49,213 - 10,372
50 - 54 317,421 263,920 9,609 35,239 - 8,655
55 - 59 203,354 166,558 5,281 22,327 - 9,189
60 - 64 180,118 132,490 5,064 21,888 - 20,676
65 - 69 104,902 70,558 2,499 12,340 - 19,505
70 - 74 92,235 51,368 2,277 10,188 - 28,401
75 - 79 54,213 26,314 1,049 5,260 - 21,591
80 + 83,912 25,306 27 117 - 58,462
Table 9.4: Distribution of Male Population Aged 10 Years and Above by Five Year Age Group and Type of Usual Activity; Tanzania Mainland, 2012 Census
Age Group Total Employed Unemployed Home Maintenance
(cooking/hygiene/caring) Full-time Students Unable
Total 14,077,830 9,492,458 435,545 663,992 3,094,374 391,454
10 - 14 2,766,874 527,411 14,757 299,656 1,846,964 78,086
15 - 19 2,118,996 931,319 51,200 159,016 932,812 44,648
20 - 24 1,661,802 1,170,682 87,264 74,721 314,598 14,537
25 - 29 1,448,123 1,279,678 122,164 36,129 - 10,152
30 - 34 1,299,455 1,215,147 51,982 22,799 - 9,526
35 - 39 1,116,109 1,058,322 33,470 16,527 - 7,790
40 - 44 890,665 846,480 24,237 12,698 - 7,249
45 - 49 676,961 645,976 15,531 8,958 - 6,495
50 - 54 574,318 544,858 11,935 8,399 - 9,126
55 - 59 371,920 350,716 7,190 5,609 - 8,405
60 - 64 362,372 329,051 7,048 6,857 - 19,414
65 - 69 229,408 201,286 3,826 4,574 - 19,722
70 - 74 217,389 174,472 3,229 4,974 - 34,714
75 - 79 140,155 105,408 1,678 3,038 - 30,031
80 + 203,283 111,652 34 37 - 91,559

92
Table 9.5: Distribution of Female Population Aged 10 Years and Above by Five Year Age Group and Type of Usual Activity; Tanzania Mainland, 2012 Census
Age Group Total Employed Unemployed Home Maintenance
(cooking/hygiene/caring) Full-time Students Unable
Total 15,321,077 9,299,736 342,016 2,148,487 2,955,000 575,841
10 - 14 2,773,106 469,049 10,496 335,057 1,891,742 66,762
15 - 19 2,235,617 952,193 39,423 347,843 860,073 36,087
20 - 24 2,034,242 1,358,777 71,971 385,977 203,185 14,332
25 - 29 1,755,311 1,347,956 87,167 309,042 - 11,146
30 - 34 1,460,383 1,181,562 44,767 224,327 - 9,728
35 - 39 1,199,963 1,002,962 29,608 159,279 - 8,114
40 - 44 909,316 777,135 18,466 106,198 - 7,517
45 - 49 748,538 635,217 13,185 81,749 - 18,387
50 - 54 575,897 487,797 9,436 61,906 - 16,757
55 - 59 366,293 306,326 4,928 38,798 - 16,241
60 - 64 374,870 289,337 4,967 39,866 - 40,700
65 - 69 245,323 177,292 2,888 24,345 - 40,798
70 - 74 242,254 147,173 3,017 21,947 - 70,118
75 - 79 143,425 77,262 1,665 11,885 - 52,612
80 + 256,539 89,698 32 268 - 166,542

93
Table 9.6: Distribution of Population Aged 10 Years and Above by Type of Usual Economic Activity (Last 12 Months) and Region; Tanzania Mainland, 2012 Census
Region Total Employed Unemployed Home Maintenance
(cooking/hygiene/caring) Full-time Students
Unable
Tanzania Mainland 29,398,908 18,792,195 777,564 2,812,477 6,049,373 967,297
Rural 20,177,573 519,283 766,691 12,559,125 146,541 187,100
Urban 9,221,335 4,947,096 443,923 1,270,947 2,289,275 270,095
Male 14,077,830 9,492,458 435,545 663,992 3,094,374 391,454
Female 15,321,077 9,299,736 342,016 2,148,487 2,955,000 575,841
Dodoma 1,383,789 936,904 24,751 118,523 257,277 46,333
Arusha 1,175,236 673,966 37,620 145,775 286,002 31,874
Kilimanjaro 1,206,556 735,431 27,829 122,017 270,972 50,308
Tanga 1,410,333 892,274 28,940 84,288 354,763 50,068
Morogoro 1,543,240 1,060,928 35,314 107,211 290,258 49,530
Pwani 771,674 469,859 24,314 90,893 152,588 34,021
Dar es Salaam 3,320,389 1,713,042 214,496 564,252 732,129 96,470
Lindi 622,410 447,156 10,161 34,980 105,221 24,891
Mtwara 919,978 650,215 21,083 49,523 161,106 38,052
Ruvuma 941,916 651,846 17,470 50,211 191,492 30,897
Iringa 660,196 426,954 10,340 37,151 168,151 17,600
Mbeya 1,863,324 1,193,851 45,325 121,418 449,413 53,316
Singida 890,725 600,059 17,162 86,104 150,992 36,406
Tabora 1,458,173 984,671 29,537 180,295 217,115 46,556
Rukwa 624,872 432,970 7,601 43,729 123,697 16,875
Kigoma 1,286,598 880,014 23,033 78,273 262,939 42,339
Shinyanga 988,735 632,584 24,128 116,704 182,320 32,999
Kagera 1,596,594 1,107,014 21,039 105,827 323,849 38,865
Mwanza 1,797,560 1,055,590 47,827 177,088 456,318 60,736
Mara 1,091,272 677,183 29,468 107,105 236,490 41,026
Manyara 928,879 584,935 26,084 130,832 146,401 40,627
Njombe 496,292 336,691 5,397 30,835 108,526 14,843
Katavi 353,468 251,504 6,035 38,419 47,348 10,161
Simiyu 982,063 650,707 19,647 93,447 184,554 33,707
Geita 1,084,636 745,847 22,963 97,577 189,452 28,797
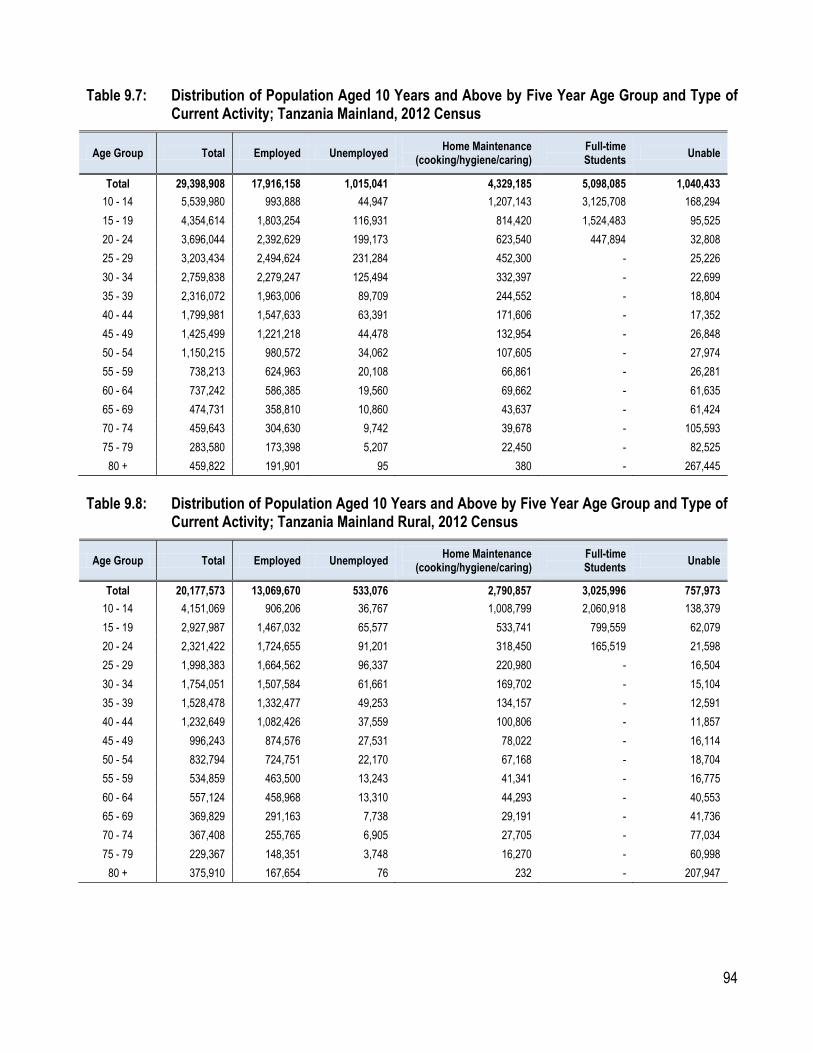
94
Table 9.7: Distribution of Population Aged 10 Years and Above by Five Year Age Group and Type of Current Activity; Tanzania Mainland, 2012 Census
Age Group Total Employed Unemployed Home Maintenance
(cooking/hygiene/caring) Full-time Students
Unable
Total 29,398,908 17,916,158 1,015,041 4,329,185 5,098,085 1,040,433
10 - 14 5,539,980 993,888 44,947 1,207,143 3,125,708 168,294
15 - 19 4,354,614 1,803,254 116,931 814,420 1,524,483 95,525
20 - 24 3,696,044 2,392,629 199,173 623,540 447,894 32,808
25 - 29 3,203,434 2,494,624 231,284 452,300 - 25,226
30 - 34 2,759,838 2,279,247 125,494 332,397 - 22,699
35 - 39 2,316,072 1,963,006 89,709 244,552 - 18,804
40 - 44 1,799,981 1,547,633 63,391 171,606 - 17,352
45 - 49 1,425,499 1,221,218 44,478 132,954 - 26,848
50 - 54 1,150,215 980,572 34,062 107,605 - 27,974
55 - 59 738,213 624,963 20,108 66,861 - 26,281
60 - 64 737,242 586,385 19,560 69,662 - 61,635
65 - 69 474,731 358,810 10,860 43,637 - 61,424
70 - 74 459,643 304,630 9,742 39,678 - 105,593
75 - 79 283,580 173,398 5,207 22,450 - 82,525
80 + 459,822 191,901 95 380 - 267,445
Table 9.8: Distribution of Population Aged 10 Years and Above by Five Year Age Group and Type of
Current Activity; Tanzania Mainland Rural, 2012 Census
Age Group Total Employed Unemployed Home Maintenance
(cooking/hygiene/caring) Full-time Students
Unable
Total 20,177,573 13,069,670 533,076 2,790,857 3,025,996 757,973
10 - 14 4,151,069 906,206 36,767 1,008,799 2,060,918 138,379
15 - 19 2,927,987 1,467,032 65,577 533,741 799,559 62,079
20 - 24 2,321,422 1,724,655 91,201 318,450 165,519 21,598
25 - 29 1,998,383 1,664,562 96,337 220,980 - 16,504
30 - 34 1,754,051 1,507,584 61,661 169,702 - 15,104
35 - 39 1,528,478 1,332,477 49,253 134,157 - 12,591
40 - 44 1,232,649 1,082,426 37,559 100,806 - 11,857
45 - 49 996,243 874,576 27,531 78,022 - 16,114
50 - 54 832,794 724,751 22,170 67,168 - 18,704
55 - 59 534,859 463,500 13,243 41,341 - 16,775
60 - 64 557,124 458,968 13,310 44,293 - 40,553
65 - 69 369,829 291,163 7,738 29,191 - 41,736
70 - 74 367,408 255,765 6,905 27,705 - 77,034
75 - 79 229,367 148,351 3,748 16,270 - 60,998
80 + 375,910 167,654 76 232 - 207,947

95
Table 9.9: Distribution of Population Aged 10 Years and Above by Five Year Age Group and Type of Current Activity; Tanzania Mainland Urban, 2012 Census
Age Group Total Employed Unemployed Home Maintenance
(cooking/hygiene/caring) Full-time Students Unable
Total 9,221,335 4,846,491 481,966 1,538,329 2,072,089 282,462
10 - 14 1,388,911 87,683 8,180 198,344 1,064,790 29,915
15 - 19 1,426,627 336,223 51,354 280,679 724,924 33,446
20 - 24 1,374,622 667,975 107,972 305,090 282,375 11,210
25 - 29 1,205,051 830,061 134,947 231,320 - 8,722
30 - 34 1,005,787 771,663 63,833 162,695 - 7,596
35 - 39 787,594 630,530 40,457 110,395 - 6,212
40 - 44 567,332 465,206 25,832 70,799 - 5,495
45 - 49 429,256 346,643 16,946 54,932 - 10,735
50 - 54 317,421 255,821 11,892 40,437 - 9,271
55 - 59 203,354 161,463 6,866 25,521 - 9,505
60 - 64 180,118 127,417 6,250 25,369 - 21,082
65 - 69 104,902 67,646 3,122 14,446 - 19,689
70 - 74 92,235 48,865 2,838 11,973 - 28,559
75 - 79 54,213 25,048 1,458 6,180 - 21,527
80 + 83,912 24,247 19 149 - 59,498
Table 9.10: Distribution of Male Population Aged 10 Years and Above by Five Year Age Group and Type of Current Activity; Tanzania Mainland, 2012 Census
Age Group Total Employed Unemployed Home Maintenance
(cooking/hygiene/caring) Full-time Students Unable
Total 14,077,830 9,173,676 589,314 1,268,702 2,612,066 434,072
10 - 14 2,766,874 528,181 25,583 574,907 1,546,675 91,529
15 - 19 2,118,996 905,406 67,873 298,925 793,707 53,087
20 - 24 1,661,802 1,127,645 113,110 133,049 271,684 16,314
25 - 29 1,448,123 1,234,250 136,302 65,382 - 12,189
30 - 34 1,299,455 1,172,520 70,972 44,741 - 11,222
35 - 39 1,116,109 1,020,957 50,824 34,912 - 9,415
40 - 44 890,665 816,771 37,893 27,426 - 8,574
45 - 49 676,961 623,030 25,933 20,119 - 7,879
50 - 54 574,318 524,559 20,543 18,952 - 10,264
55 - 59 371,920 337,735 12,807 12,011 - 9,367
60 - 64 362,372 315,449 12,287 13,826 - 20,810
65 - 69 229,408 192,889 6,604 9,129 - 20,786
70 - 74 217,389 166,597 5,608 9,366 - 35,818
75 - 79 140,155 100,740 2,937 5,906 - 30,572
80 + 203,283 106,947 38 51 - 96,246

96
Table 9.11: Distribution of Female Population Aged 10 Years and Above by Five Year Age Group and Type of Current Activity; Tanzania Mainland, 2012 Census
Age Group Total Employed Unemployed Home Maintenance
(cooking/hygiene/caring) Full-time Students Unable
Total 15,321,077 8,742,482 425,727 3,060,485 2,486,020 606,361
10 - 14 2,773,106 465,708 19,364 632,236 1,579,033 76,765
15 - 19 2,235,617 897,849 49,059 515,495 730,777 42,438
20 - 24 2,034,242 1,264,984 86,064 490,491 176,210 16,494
25 - 29 1,755,311 1,260,374 94,982 386,917 - 13,037
30 - 34 1,460,383 1,106,728 54,522 287,656 - 11,477
35 - 39 1,199,963 942,049 38,885 209,640 - 9,389
40 - 44 909,316 730,860 25,497 144,180 - 8,778
45 - 49 748,538 598,187 18,545 112,836 - 18,970
50 - 54 575,897 456,014 13,520 88,653 - 17,710
55 - 59 366,293 287,227 7,301 54,851 - 16,914
60 - 64 374,870 270,936 7,273 55,836 - 40,825
65 - 69 245,323 165,921 4,255 34,508 - 40,638
70 - 74 242,254 138,032 4,134 30,313 - 69,775
75 - 79 143,425 72,659 2,269 16,544 - 51,953
80 + 256,539 84,954 57 329 - 171,198
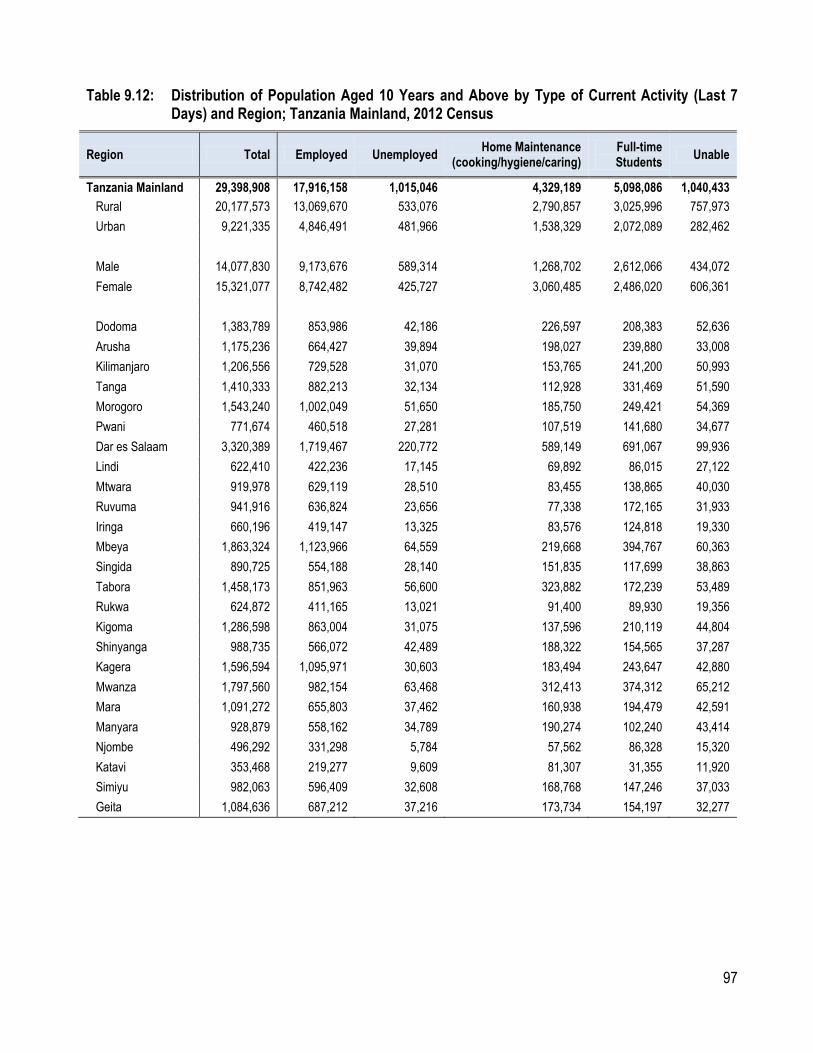
97
Table 9.12: Distribution of Population Aged 10 Years and Above by Type of Current Activity (Last 7 Days) and Region; Tanzania Mainland, 2012 Census
Region Total Employed Unemployed Home Maintenance
(cooking/hygiene/caring) Full-time Students
Unable
Tanzania Mainland 29,398,908 17,916,158 1,015,046 4,329,189 5,098,086 1,040,433
Rural 20,177,573 13,069,670 533,076 2,790,857 3,025,996 757,973
Urban 9,221,335 4,846,491 481,966 1,538,329 2,072,089 282,462
Male 14,077,830 9,173,676 589,314 1,268,702 2,612,066 434,072
Female 15,321,077 8,742,482 425,727 3,060,485 2,486,020 606,361
Dodoma 1,383,789 853,986 42,186 226,597 208,383 52,636
Arusha 1,175,236 664,427 39,894 198,027 239,880 33,008
Kilimanjaro 1,206,556 729,528 31,070 153,765 241,200 50,993
Tanga 1,410,333 882,213 32,134 112,928 331,469 51,590
Morogoro 1,543,240 1,002,049 51,650 185,750 249,421 54,369
Pwani 771,674 460,518 27,281 107,519 141,680 34,677
Dar es Salaam 3,320,389 1,719,467 220,772 589,149 691,067 99,936
Lindi 622,410 422,236 17,145 69,892 86,015 27,122
Mtwara 919,978 629,119 28,510 83,455 138,865 40,030
Ruvuma 941,916 636,824 23,656 77,338 172,165 31,933
Iringa 660,196 419,147 13,325 83,576 124,818 19,330
Mbeya 1,863,324 1,123,966 64,559 219,668 394,767 60,363
Singida 890,725 554,188 28,140 151,835 117,699 38,863
Tabora 1,458,173 851,963 56,600 323,882 172,239 53,489
Rukwa 624,872 411,165 13,021 91,400 89,930 19,356
Kigoma 1,286,598 863,004 31,075 137,596 210,119 44,804
Shinyanga 988,735 566,072 42,489 188,322 154,565 37,287
Kagera 1,596,594 1,095,971 30,603 183,494 243,647 42,880
Mwanza 1,797,560 982,154 63,468 312,413 374,312 65,212
Mara 1,091,272 655,803 37,462 160,938 194,479 42,591
Manyara 928,879 558,162 34,789 190,274 102,240 43,414
Njombe 496,292 331,298 5,784 57,562 86,328 15,320
Katavi 353,468 219,277 9,609 81,307 31,355 11,920
Simiyu 982,063 596,409 32,608 168,768 147,246 37,033
Geita 1,084,636 687,212 37,216 173,734 154,197 32,277

98
Table 9.13: Distribution of Employed Population Aged 10 Years and Above by Five Year Age Group and Employment Status; Tanzania Mainland, 2012 Census
Age Group Total Employer Employee Own Non -
Agriculture Own
Agriculture Family Worker
Apprentices Other
Total 17,916,158 73,136 2,022,232 3,085,821 11,360,392 1,285,848 37,450 51,279
10 - 14 993,888 838 32,288 33,920 248,403 661,509 4,109 12,821
15 - 19 1,803,254 4,215 161,136 211,293 1,213,189 190,958 13,091 9,371
20 - 24 2,392,629 8,479 290,896 430,993 1,531,491 114,706 9,702 6,362
25 - 29 2,494,624 10,464 372,864 539,431 1,488,467 74,818 3,926 4,654
30 - 34 2,279,248 11,394 319,665 511,742 1,374,133 56,527 2,079 3,708
35 - 39 1,963,006 9,797 245,760 425,974 1,231,779 45,273 1,321 3,102
40 - 44 1,547,632 7,583 183,999 308,945 1,009,839 34,139 843 2,285
45 - 49 1,221,218 5,953 142,591 213,146 829,039 27,726 683 2,081
50 - 54 980,573 4,567 121,364 145,835 685,441 21,348 449 1,569
55 - 59 624,963 2,913 80,630 86,447 440,082 13,426 337 1,128
60 - 64 586,385 2,739 37,264 74,391 455,316 15,169 292 1,213
65 - 69 358,809 1,479 15,752 39,884 291,748 9,097 180 670
70 - 74 304,630 1,128 9,686 30,387 253,665 8,767 161 836
75 - 79 173,398 745 4,449 15,984 146,091 5,430 102 597
80 + 191,901 843 3,888 17,450 161,709 6,957 175 881
Table 9.14: Distribution of Employed Population Aged 10 Years and Above by Five Year Age Group and Employment Status; Tanzania Mainland Rural, 2012 Census
Age Group Total Employer Employee Own Non -
Agriculture Own
Agriculture Family Worker
Apprentices Other
Total 13,069,669 34,109 585,994 1,227,300 10,050,691 1,120,306 19,720 31,549
10 - 14 906,206 642 16,404 25,621 234,499 615,219 3,196 10,626
15 - 19 1,467,032 2,787 48,750 120,530 1,117,433 164,223 7,092 6,216
20- 24 1,724,654 3,885 79,687 175,117 1,369,884 88,983 3,953 3,145
25 - 29 1,664,562 4,387 98,511 190,353 1,310,826 56,693 1,632 2,160
30 - 34 1,507,584 4,400 81,619 176,340 1,199,404 43,135 985 1,700
35 - 39 1,332,477 3,930 65,770 149,554 1,075,700 35,308 815 1,400
40 - 44 1,082,426 3,308 51,964 114,467 883,714 27,393 469 1,110
45 - 49 874,576 2,755 42,985 81,964 723,233 22,164 401 1,075
50 - 54 724,752 2,282 42,058 61,565 599,745 17,928 293 881
55 - 59 463,500 1,400 30,801 37,035 382,629 10,919 219 498
60 - 64 458,967 1,533 13,185 34,658 396,427 12,259 221 685
65 - 69 291,163 852 5,842 20,683 255,511 7,734 137 404
70 - 74 255,764 834 4,227 17,703 224,730 7,599 113 558
75 - 79 148,351 511 2,083 9,917 130,715 4,657 80 387
80 + 167,655 603 2,108 11,793 146,241 6,092 114 704
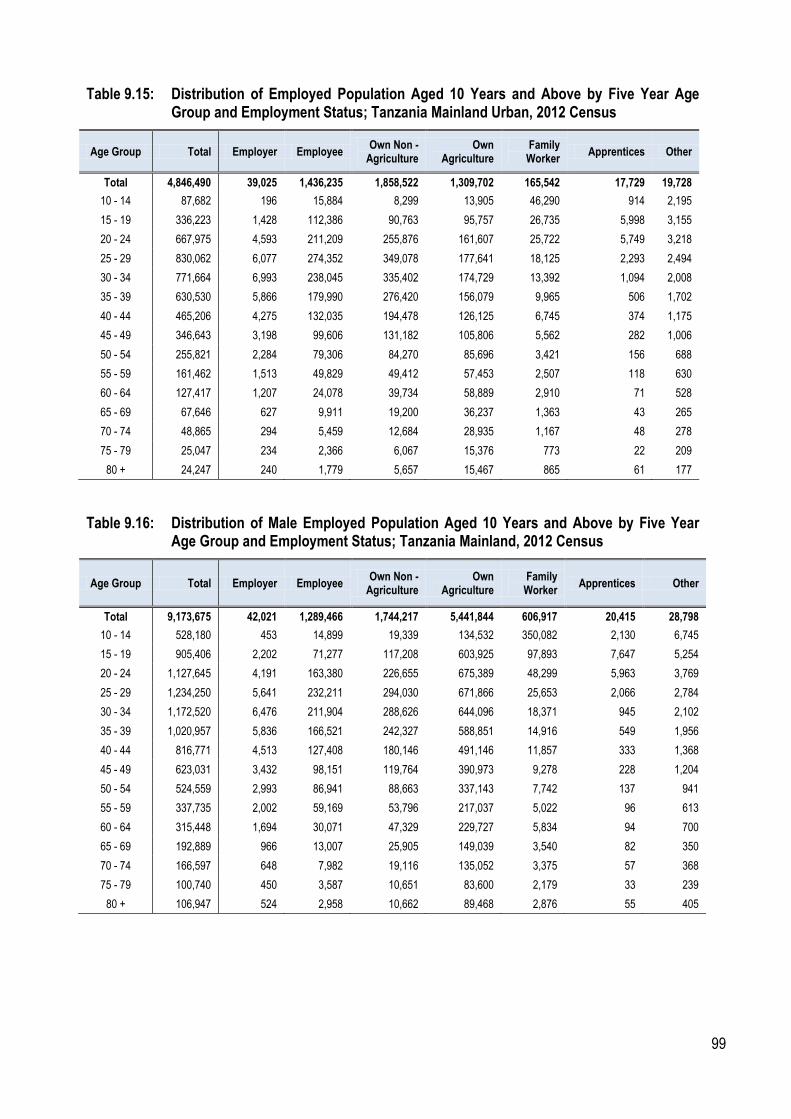
99
Table 9.15: Distribution of Employed Population Aged 10 Years and Above by Five Year Age Group and Employment Status; Tanzania Mainland Urban, 2012 Census
Age Group Total Employer Employee Own Non -
Agriculture Own
Agriculture Family Worker
Apprentices Other
Total 4,846,490 39,025 1,436,235 1,858,522 1,309,702 165,542 17,729 19,728
10 - 14 87,682 196 15,884 8,299 13,905 46,290 914 2,195
15 - 19 336,223 1,428 112,386 90,763 95,757 26,735 5,998 3,155
20 - 24 667,975 4,593 211,209 255,876 161,607 25,722 5,749 3,218
25 - 29 830,062 6,077 274,352 349,078 177,641 18,125 2,293 2,494
30 - 34 771,664 6,993 238,045 335,402 174,729 13,392 1,094 2,008
35 - 39 630,530 5,866 179,990 276,420 156,079 9,965 506 1,702
40 - 44 465,206 4,275 132,035 194,478 126,125 6,745 374 1,175
45 - 49 346,643 3,198 99,606 131,182 105,806 5,562 282 1,006
50 - 54 255,821 2,284 79,306 84,270 85,696 3,421 156 688
55 - 59 161,462 1,513 49,829 49,412 57,453 2,507 118 630
60 - 64 127,417 1,207 24,078 39,734 58,889 2,910 71 528
65 - 69 67,646 627 9,911 19,200 36,237 1,363 43 265
70 - 74 48,865 294 5,459 12,684 28,935 1,167 48 278
75 - 79 25,047 234 2,366 6,067 15,376 773 22 209
80 + 24,247 240 1,779 5,657 15,467 865 61 177
Table 9.16: Distribution of Male Employed Population Aged 10 Years and Above by Five Year Age Group and Employment Status; Tanzania Mainland, 2012 Census
Age Group Total Employer Employee Own Non -
Agriculture Own
Agriculture Family Worker
Apprentices Other
Total 9,173,675 42,021 1,289,466 1,744,217 5,441,844 606,917 20,415 28,798
10 - 14 528,180 453 14,899 19,339 134,532 350,082 2,130 6,745
15 - 19 905,406 2,202 71,277 117,208 603,925 97,893 7,647 5,254
20 - 24 1,127,645 4,191 163,380 226,655 675,389 48,299 5,963 3,769
25 - 29 1,234,250 5,641 232,211 294,030 671,866 25,653 2,066 2,784
30 - 34 1,172,520 6,476 211,904 288,626 644,096 18,371 945 2,102
35 - 39 1,020,957 5,836 166,521 242,327 588,851 14,916 549 1,956
40 - 44 816,771 4,513 127,408 180,146 491,146 11,857 333 1,368
45 - 49 623,031 3,432 98,151 119,764 390,973 9,278 228 1,204
50 - 54 524,559 2,993 86,941 88,663 337,143 7,742 137 941
55 - 59 337,735 2,002 59,169 53,796 217,037 5,022 96 613
60 - 64 315,448 1,694 30,071 47,329 229,727 5,834 94 700
65 - 69 192,889 966 13,007 25,905 149,039 3,540 82 350
70 - 74 166,597 648 7,982 19,116 135,052 3,375 57 368
75 - 79 100,740 450 3,587 10,651 83,600 2,179 33 239
80 + 106,947 524 2,958 10,662 89,468 2,876 55 405

100
Table 9.17: Distribution of Female Population Aged 10 Years and Above by Five Year Age Group and Employment Status; Tanzania Mainland, 2012 Census
Age Group Total Employer Employee Own Non -
Agriculture Own
Agriculture Family Worker
Apprentices Other
Total 8,742,483 31,114 732,769 1,341,603 5,918,551 678,934 17,033 22,481
10 - 14 465,708 385 17,389 14,581 113,872 311,427 1,979 6,076
15 - 19 897,848 2,014 89,860 94,085 609,265 93,065 5,443 4,117
20 - 24 1,264,984 4,288 127,516 204,338 856,102 66,407 3,739 2,594
25 - 29 1,260,374 4,823 140,653 245,401 816,601 49,166 1,860 1,870
30 - 34 1,106,728 4,918 107,761 223,116 730,037 38,156 1,134 1,606
35 - 39 942,049 3,960 79,239 183,647 642,928 30,356 772 1,146
40 - 44 730,861 3,070 56,591 128,799 518,693 22,282 510 917
45 - 49 598,188 2,520 44,440 93,382 438,066 18,448 455 878
50 - 54 456,014 1,574 34,423 57,172 348,298 13,607 312 628
55 - 59 287,227 911 21,461 32,650 223,045 8,404 241 515
60 - 64 270,936 1,045 7,193 27,062 225,589 9,335 198 513
65 - 69 165,921 514 2,746 13,978 142,710 5,557 97 319
70 - 74 138,033 479 1,705 11,271 118,613 5,392 105 468
75 - 79 72,658 295 862 5,333 62,491 3,251 68 358
80 + 84,954 318 930 6,788 72,241 4,081 120 476

101
Table 9.18: Distribution of Employed Population Aged 10 Years and Above by Employment Status and Region; Tanzania Mainland, 2012 Census
Region Total Employer Employee Own Non -
Agriculture Own
Agriculture Family Worker
Apprentices Other
Tanzania Mainland 17,916,158 73,136 2,022,232 3,085,821 11,360,392 1,285,848 37,450 51,279
Rural 13,069,669 34,109 585,994 1,227,300 10,050,691 1,120,306 19,720 31,549
Urban 4,846,490 39,025 1,436,235 1,858,522 1,309,702 165,542 17,729 19,728
Male 9,173,675 42,021 1,289,466 1,744,217 5,441,844 606,917 20,415 28,798
Female 8,742,483 31,114 732,769 1,341,603 5,918,551 678,934 17,033 22,481
Dodoma 853,986 2,695 57,978 111,640 613,000 66,412 1,008 1,254
Arusha 664,427 3,205 138,873 212,579 262,962 44,746 1,041 1,020
Kilimanjaro 729,528 3,452 107,857 120,052 453,079 41,233 1,853 2,001
Tanga 882,213 3,093 72,869 119,615 664,068 20,602 1,110 856
Morogoro 1,002,049 3,514 84,869 121,627 734,199 53,808 1,816 2,217
Pwani 460,517 1,721 48,138 108,955 283,577 16,383 597 1,147
Dar es Salaam 1,719,466 24,685 733,388 830,035 65,241 49,112 7,243 9,762
Lindi 422,236 1,276 21,092 39,684 341,779 16,559 809 1,036
Mtwara 629,119 1,893 31,562 49,541 520,667 22,905 1,174 1,377
Ruvuma 636,823 1,269 37,859 53,894 513,106 27,876 1,611 1,208
Iringa 419,148 1,078 48,552 51,086 294,859 21,626 1,018 929
Mbeya 1,123,967 3,401 86,035 197,105 762,993 68,227 2,310 3,895
Singida 554,188 1,688 27,935 76,905 380,422 63,410 966 2,863
Tabora 851,963 2,515 48,570 121,449 566,618 108,588 1,352 2,870
Rukwa 411,165 810 21,324 51,829 296,946 38,849 629 779
Kigoma 863,004 2,236 47,515 76,332 673,199 59,767 1,480 2,476
Shinyanga 566,072 1,403 42,075 91,859 364,052 64,100 1,192 1,392
Kagera 1,095,970 2,832 90,096 88,091 832,405 77,809 2,254 2,482
Mwanza 982,154 2,988 106,086 176,768 636,184 57,187 1,521 1,419
Mara 655,803 1,691 45,018 84,807 458,497 61,745 2,067 1,977
Manyara 558,162 1,282 35,214 92,434 325,764 100,913 669 1,886
Njombe 331,297 773 24,395 27,124 266,336 11,402 576 691
Katavi 219,277 636 12,344 34,992 145,077 25,364 398 466
Simiyu 596,409 1,114 19,563 55,563 439,464 76,708 1,410 2,586
Geita 687,213 1,886 33,025 91,854 465,897 90,515 1,347 2,689
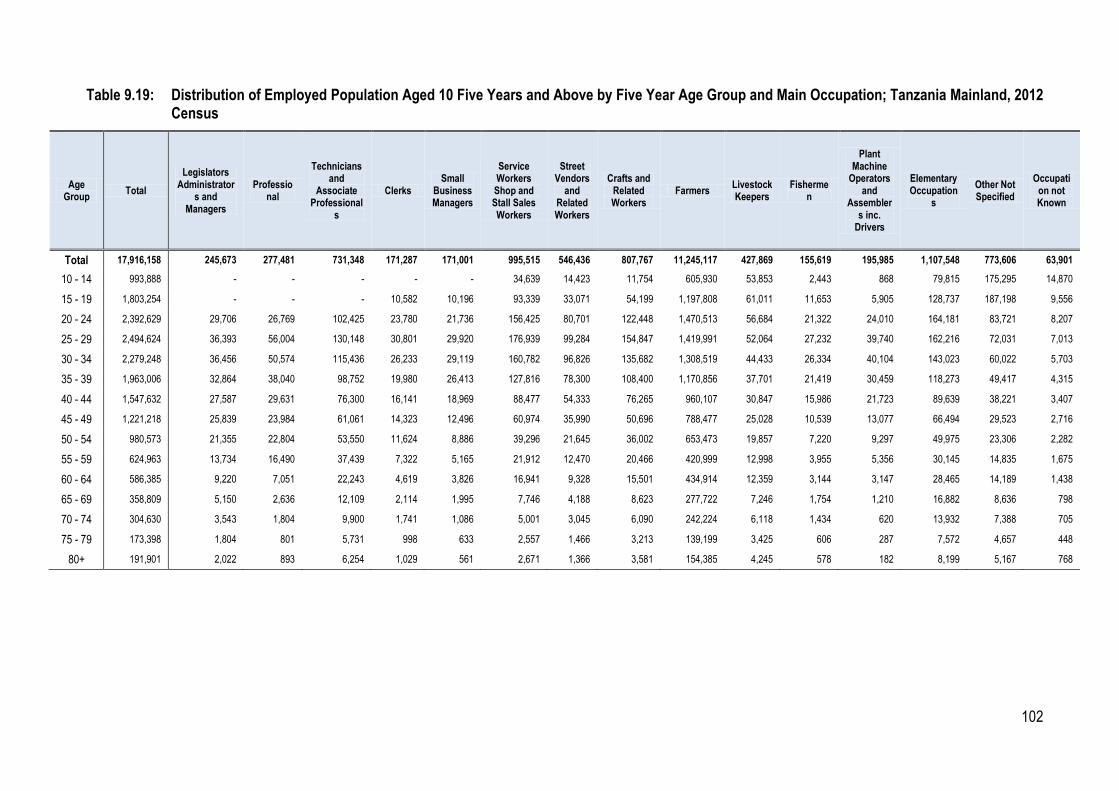
102
Table 9.19: Distribution of Employed Population Aged 10 Five Years and Above by Five Year Age Group and Main Occupation; Tanzania Mainland, 2012 Census
Age Group
Total
Legislators Administrator
s and Managers
Professional
Technicians and
Associate Professional
s
Clerks Small
Business Managers
Service Workers Shop and Stall Sales Workers
Street Vendors
and Related Workers
Crafts and Related Workers
Farmers Livestock Keepers
Fishermen
Plant Machine
Operators and
Assemblers inc.
Drivers
Elementary Occupation
s
Other Not Specified
Occupation not Known
Total 17,916,158 245,673 277,481 731,348 171,287 171,001 995,515 546,436 807,767 11,245,117 427,869 155,619 195,985 1,107,548 773,606 63,901
10 - 14 993,888 - - - - - 34,639 14,423 11,754 605,930 53,853 2,443 868 79,815 175,295 14,870
15 - 19 1,803,254 - - - 10,582 10,196 93,339 33,071 54,199 1,197,808 61,011 11,653 5,905 128,737 187,198 9,556
20 - 24 2,392,629 29,706 26,769 102,425 23,780 21,736 156,425 80,701 122,448 1,470,513 56,684 21,322 24,010 164,181 83,721 8,207
25 - 29 2,494,624 36,393 56,004 130,148 30,801 29,920 176,939 99,284 154,847 1,419,991 52,064 27,232 39,740 162,216 72,031 7,013
30 - 34 2,279,248 36,456 50,574 115,436 26,233 29,119 160,782 96,826 135,682 1,308,519 44,433 26,334 40,104 143,023 60,022 5,703
35 - 39 1,963,006 32,864 38,040 98,752 19,980 26,413 127,816 78,300 108,400 1,170,856 37,701 21,419 30,459 118,273 49,417 4,315
40 - 44 1,547,632 27,587 29,631 76,300 16,141 18,969 88,477 54,333 76,265 960,107 30,847 15,986 21,723 89,639 38,221 3,407
45 - 49 1,221,218 25,839 23,984 61,061 14,323 12,496 60,974 35,990 50,696 788,477 25,028 10,539 13,077 66,494 29,523 2,716
50 - 54 980,573 21,355 22,804 53,550 11,624 8,886 39,296 21,645 36,002 653,473 19,857 7,220 9,297 49,975 23,306 2,282
55 - 59 624,963 13,734 16,490 37,439 7,322 5,165 21,912 12,470 20,466 420,999 12,998 3,955 5,356 30,145 14,835 1,675
60 - 64 586,385 9,220 7,051 22,243 4,619 3,826 16,941 9,328 15,501 434,914 12,359 3,144 3,147 28,465 14,189 1,438
65 - 69 358,809 5,150 2,636 12,109 2,114 1,995 7,746 4,188 8,623 277,722 7,246 1,754 1,210 16,882 8,636 798
70 - 74 304,630 3,543 1,804 9,900 1,741 1,086 5,001 3,045 6,090 242,224 6,118 1,434 620 13,932 7,388 705
75 - 79 173,398 1,804 801 5,731 998 633 2,557 1,466 3,213 139,199 3,425 606 287 7,572 4,657 448
80+ 191,901 2,022 893 6,254 1,029 561 2,671 1,366 3,581 154,385 4,245 578 182 8,199 5,167 768

103
Table 9.20: Distribution of Employed Population Aged 10 Years and Above by Five Year Age Group and Main Occupation; Tanzania Mainland Rural, 2012 Census
Age Group Total
Legislators
Administrators and Managers
Professional
Technicians and
Associate Professional
s
Clerks Small
Business Managers
Service Workers Shop and Stall Sales Workers
Street Vendors
and Related Workers
Crafts and Related Workers
Farmers Livestock Keepers
Fishermen
Plant Machine
Operators and
Assemblers inc.
Drivers
Elementary Occupation
s
Other Not Specified
Occupation not
Known
Total 13,069,669 130,416 96,369 381,690 63,407 39,102 255,131 121,856 271,666 9,953,032 384,585 108,270 29,944 680,788 512,212 41,199
10 - 14 906,206 - - - - - 23,343 10,267 7,936 576,822 51,806 2,064 263 69,001 152,001 12,703
15 - 19 1,467,032 - - - 6,475 4,439 28,813 11,492 23,133 1,102,121 56,443 9,082 1,415 87,708 129,238 6,674
20 - 24 1,724,654 17,901 12,138 56,840 9,201 5,889 37,484 17,158 40,030 1,311,068 51,386 14,891 4,426 95,125 46,715 4,401
25 - 29 1,664,562 18,341 19,954 63,535 9,548 6,270 38,371 18,985 43,903 1,246,096 46,440 19,058 5,804 87,214 37,330 3,713
30 - 34 1,507,584 17,450 15,271 54,332 7,964 5,796 35,157 18,605 40,146 1,139,328 39,365 17,923 5,766 76,480 31,130 2,872
35 - 39 1,332,477 16,598 11,513 47,438 6,720 5,022 29,347 14,857 33,609 1,020,496 32,850 14,642 4,042 66,279 26,842 2,222
40 - 44 1,082,426 14,413 8,992 37,634 5,606 3,606 20,981 10,972 25,589 837,486 26,946 10,803 3,038 53,110 21,377 1,872
45 - 49 874,576 13,203 7,606 31,714 5,014 2,646 14,288 7,037 17,837 686,137 21,623 7,063 2,082 39,728 17,164 1,434
50 - 54 724,752 11,009 8,281 29,928 3,991 1,850 10,115 4,688 13,254 570,059 17,327 4,960 1,344 32,196 14,336 1,413
55 - 59 463,500 7,122 6,401 21,558 2,708 973 5,556 2,588 7,777 364,780 11,094 2,614 869 19,521 8,810 1,129
60 - 64 458,967 5,497 2,842 14,034 2,190 987 4,794 2,096 6,897 377,451 10,505 2,150 484 19,305 8,797 937
65 - 69 291,163 3,234 1,210 8,171 1,273 586 2,537 1,165 4,119 242,888 6,187 1,186 216 12,053 5,826 512
70 - 74 255,764 2,597 1,045 7,220 1,170 380 2,055 898 3,148 214,330 5,581 1,011 101 10,537 5,241 450
75 - 79 148,351 1,448 486 4,245 733 347 966 492 1,906 124,511 3,067 422 60 5,997 3,346 325
80+ 167,655 1,603 630 5,041 814 311 1,324 556 2,382 139,459 3,965 401 34 6,534 4,059 542

104
Table 9.21: Distribution of Employed Population Aged 10 Years and Above by Five Year Age Group and Main Occupation; Tanzania Mainland Urban, 2012 Census
Age Group Total
Legislators Administra
tors and Managers
Professional
Technicians and
Associate Professional
s
Clerks
Small Business Manager
s
Service Workers
Shop and Stall Sales
Workers
Street Vendors
and Related
Workers
Crafts and
Related Workers
Farmers Livestoc
k Keepers
Fishermen
Plant Machine
Operators and
Assemblers inc.
Drivers
Elementary Occupation
s
Other Not Specified
Occupation not
Known
Total 4,846,490 115,258 181,114 349,661 107,877 131,900 740,387 424,577 536,099 1,292,087 43,282 47,350 166,039 426,760 261,395 22,702
10 - 14 87,682 - - - - - 11,297 4,155 3,817 29,108 2,047 379 605 10,813 23,294 2,166
15 - 19 336,223 - - - 4,107 5,757 64,525 21,579 31,066 95,687 4,568 2,571 4,490 41,029 57,960 2,882
20 - 24 667,975 11,805 14,632 45,584 14,579 15,848 118,942 63,543 82,418 159,445 5,298 6,431 19,583 69,056 37,006 3,806
25 - 29 830,062 18,052 36,050 66,613 21,253 23,650 138,569 80,299 110,944 173,896 5,624 8,175 33,935 75,003 34,701 3,300
30 - 34 771,664 19,006 35,303 61,104 18,269 23,323 125,625 78,221 95,536 169,191 5,068 8,411 34,338 66,543 28,892 2,832
35 - 39 630,530 16,266 26,527 51,315 13,259 21,391 98,469 63,443 74,791 150,360 4,851 6,777 26,417 51,995 22,575 2,094
40 - 44 465,206 13,173 20,639 38,666 10,535 15,362 67,496 43,361 50,676 122,622 3,901 5,183 18,685 36,528 16,844 1,535
45 - 49 346,643 12,636 16,378 29,347 9,309 9,850 46,685 28,953 32,859 102,341 3,405 3,476 10,995 26,766 12,359 1,282
50 - 54 255,821 10,346 14,523 23,623 7,633 7,035 29,182 16,957 22,748 83,414 2,530 2,260 7,953 17,779 8,970 869
55 - 59 161,462 6,613 10,089 15,881 4,614 4,192 16,356 9,882 12,689 56,219 1,904 1,341 4,487 10,624 6,025 546
60 - 64 127,417 3,723 4,210 8,209 2,429 2,839 12,147 7,231 8,604 57,463 1,853 994 2,663 9,160 5,392 500
65 - 69 67,646 1,916 1,426 3,938 841 1,409 5,209 3,023 4,504 34,834 1,059 568 994 4,829 2,810 286
70 - 74 48,865 946 759 2,680 570 706 2,946 2,146 2,942 27,894 536 423 519 3,395 2,147 255
75 - 79 25,047 357 315 1,487 264 287 1,592 973 1,307 14,687 358 184 227 1,575 1,312 123
80+ 24,247 419 263 1,214 215 251 1,347 811 1,198 14,926 280 177 148 1,665 1,108 226
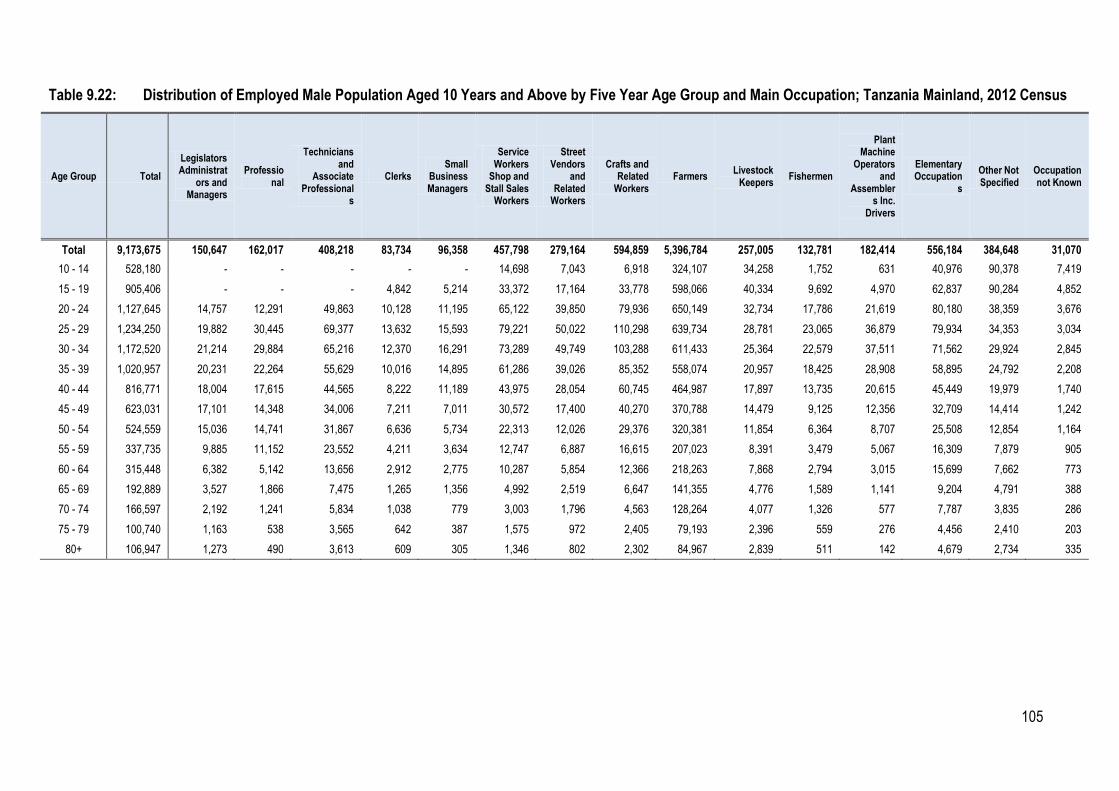
105
Table 9.22: Distribution of Employed Male Population Aged 10 Years and Above by Five Year Age Group and Main Occupation; Tanzania Mainland, 2012 Census
Age Group Total
Legislators Administrat
ors and Managers
Professional
Technicians and
Associate Professional
s
Clerks Small
Business Managers
Service Workers
Shop and Stall Sales
Workers
Street Vendors
and Related
Workers
Crafts and Related
Workers Farmers
Livestock Keepers
Fishermen
Plant Machine
Operators and
Assemblers Inc.
Drivers
Elementary Occupation
s
Other Not Specified
Occupation not Known
Total 9,173,675 150,647 162,017 408,218 83,734 96,358 457,798 279,164 594,859 5,396,784 257,005 132,781 182,414 556,184 384,648 31,070
10 - 14 528,180 - - - - - 14,698 7,043 6,918 324,107 34,258 1,752 631 40,976 90,378 7,419
15 - 19 905,406 - - - 4,842 5,214 33,372 17,164 33,778 598,066 40,334 9,692 4,970 62,837 90,284 4,852
20 - 24 1,127,645 14,757 12,291 49,863 10,128 11,195 65,122 39,850 79,936 650,149 32,734 17,786 21,619 80,180 38,359 3,676
25 - 29 1,234,250 19,882 30,445 69,377 13,632 15,593 79,221 50,022 110,298 639,734 28,781 23,065 36,879 79,934 34,353 3,034
30 - 34 1,172,520 21,214 29,884 65,216 12,370 16,291 73,289 49,749 103,288 611,433 25,364 22,579 37,511 71,562 29,924 2,845
35 - 39 1,020,957 20,231 22,264 55,629 10,016 14,895 61,286 39,026 85,352 558,074 20,957 18,425 28,908 58,895 24,792 2,208
40 - 44 816,771 18,004 17,615 44,565 8,222 11,189 43,975 28,054 60,745 464,987 17,897 13,735 20,615 45,449 19,979 1,740
45 - 49 623,031 17,101 14,348 34,006 7,211 7,011 30,572 17,400 40,270 370,788 14,479 9,125 12,356 32,709 14,414 1,242
50 - 54 524,559 15,036 14,741 31,867 6,636 5,734 22,313 12,026 29,376 320,381 11,854 6,364 8,707 25,508 12,854 1,164
55 - 59 337,735 9,885 11,152 23,552 4,211 3,634 12,747 6,887 16,615 207,023 8,391 3,479 5,067 16,309 7,879 905
60 - 64 315,448 6,382 5,142 13,656 2,912 2,775 10,287 5,854 12,366 218,263 7,868 2,794 3,015 15,699 7,662 773
65 - 69 192,889 3,527 1,866 7,475 1,265 1,356 4,992 2,519 6,647 141,355 4,776 1,589 1,141 9,204 4,791 388
70 - 74 166,597 2,192 1,241 5,834 1,038 779 3,003 1,796 4,563 128,264 4,077 1,326 577 7,787 3,835 286
75 - 79 100,740 1,163 538 3,565 642 387 1,575 972 2,405 79,193 2,396 559 276 4,456 2,410 203
80+ 106,947 1,273 490 3,613 609 305 1,346 802 2,302 84,967 2,839 511 142 4,679 2,734 335

106
Table 9.23: Distribution of Employed Female Population Aged 10 Years and Above by Five Year Age Group and Main Occupation; Tanzania Mainland, 2012 Census
Age Group
Total Legislators
Administrators and Managers
Professional
Technicians and
Associate Professionals
Clerks Small
Business Managers
Service Workers
Shop and Stall
Sales Workers
Street Vendors
and Related
Workers
Crafts and
Related Workers
Farmers Livestock
Keepers Fisherm
en
Plant Machine
Operators and
Assemblers
including Drivers
Elementary Occupations
Other Not Specified
Occupation not Known
Total 8,742,483 95,025 115,466 323,131 87,554 74,642 537,720 267,270 212,912 5,848,334 170,863 22,838 13,569 551,365 388,960 32,834
10 - 14 465,708 - - - - - 19,942 7,379 4,836 281,823 19,595 691 237 38,838 84,917 7,451
15 - 19 897,848 - - - 5,740 4,982 59,967 15,906 20,422 599,742 20,677 1,961 935 65,900 96,914 4,704
20 - 24 1,264,984 14,949 14,478 52,562 13,651 10,541 91,304 40,850 42,513 820,364 23,950 3,536 2,391 84,002 45,363 4,531
25 - 29 1,260,374 16,510 25,559 60,771 17,169 14,328 97,719 49,262 44,549 780,257 23,283 4,167 2,860 82,283 37,678 3,979
30 - 34 1,106,728 15,242 20,690 50,219 13,864 12,828 87,493 47,077 32,394 697,086 19,070 3,755 2,593 71,461 30,098 2,859
35 - 39 942,049 12,633 15,777 43,124 9,963 11,518 66,530 39,274 23,048 612,782 16,744 2,994 1,551 59,378 24,625 2,107
40 - 44 730,861 9,582 12,016 31,735 7,919 7,779 44,502 26,280 15,521 495,120 12,949 2,252 1,107 44,190 18,242 1,667
45 - 49 598,188 8,739 9,636 27,055 7,113 5,485 30,401 18,590 10,426 417,690 10,549 1,414 721 33,786 15,109 1,474
50 - 54 456,014 6,319 8,063 21,683 4,989 3,151 16,984 9,619 6,627 333,092 8,002 856 590 24,467 10,452 1,118
55 - 59 287,227 3,850 5,338 13,887 3,111 1,531 9,165 5,583 3,851 213,976 4,607 476 289 13,835 6,956 771
60 - 64 270,936 2,838 1,910 8,588 1,707 1,050 6,654 3,473 3,135 216,651 4,490 350 132 12,766 6,527 664
65 - 69 165,921 1,623 769 4,634 849 639 2,754 1,670 1,977 136,367 2,470 165 69 7,678 3,846 411
70 - 74 138,033 1,351 564 4,066 703 307 1,998 1,249 1,527 113,960 2,041 108 43 6,145 3,553 420
75 - 79 72,658 641 263 2,166 356 247 982 494 808 60,006 1,029 47 11 3,116 2,247 245
80+ 84,954 748 403 2,641 420 256 1,325 564 1,278 69,418 1,407 66 40 3,520 2,433 433

107
Table 9.24: Distribution of Employed Population Aged 10 Years and Above by Five Year Age Group, Main Occupation and Region; Tanzania Mainland, 2012 Census
Region Total
Legislators Administrat
ors and Managers
Professionals
Technicians and
Associate Professio
nals
Clerks Small
Business Managers
Service Workers
Shop and Stall Sales
Workers
Street Vendors
and Related
Workers
Crafts and
Related Workers
Farmers Livestock
Keepers Fishermen
Plant Machine
Operators and
Assemblers Inc.
Drivers
Elementary Occupation
s
Other Not Specified
Occupation not
Known
Tanzania Mainland 17,916,158 245,673 277,481 731,348 171,287 171,001 995,515 546,436 807,767 11,245,117 427,869 155,619 195,985 1,107,548 773,606 63,901
Rural 13,069,669 130,416 96,369 381,690 63,407 39,102 255,131 121,856 271,666 9,953,032 384,585 108,270 29,944 680,788 512,212 41,199
Urban 4,846,490 115,258 181,114 349,661 107,877 131,900 740,387 424,577 536,099 1,292,087 43,282 47,350 166,039 426,760 261,395 22,702
Male 9,173,675 150,647 162,017 408,218 83,734 96,358 457,798 279,164 594,859 5,396,784 257,005 132,781 182,414 556,184 384,648 31,070
Female 8,742,483 95,025 115,466 323,131 87,554 74,642 537,720 267,270 212,912 5,848,334 170,863 22,838 13,569 551,365 388,960 32,834
Dodoma 853,986 8,436 9,028 25,420 5,741 5,348 42,011 13,779 27,273 621,747 19,198 1,541 3,856 39,186 29,629 1,793
Arusha 664,427 11,471 16,854 26,225 7,354 9,075 76,550 21,919 48,090 259,007 107,740 718 15,251 46,631 16,532 1,011
Kilimanjaro 729,528 11,938 16,394 33,421 7,400 6,745 42,638 20,556 32,492 459,095 20,149 3,471 8,901 38,743 24,861 2,724
Tanga 882,213 7,490 9,233 22,866 4,984 5,734 42,109 11,994 29,744 678,618 21,039 6,385 8,449 23,711 9,304 553
Morogoro 1,002,049 14,321 11,497 40,258 8,461 6,814 39,679 17,774 31,769 733,685 17,729 1,457 5,940 39,774 29,567 3,322
Pwani 460,517 6,345 6,920 18,617 3,215 4,284 29,460 13,416 19,499 284,543 11,129 14,963 5,245 27,026 15,026 830
Dar es Salaam 1,719,466 52,735 79,341 149,717 54,705 73,515 334,997 243,316 237,008 64,481 15,541 13,783 90,682 172,950 126,120 10,575
Lindi 422,236 4,457 2,908 12,085 2,168 1,175 10,516 5,264 9,841 336,001 762 7,418 1,508 15,918 10,658 1,558
Mtwara 629,119 6,510 5,012 21,601 4,612 1,628 11,429 6,808 15,802 505,273 814 5,114 2,166 26,029 14,330 1,991
Ruvuma 636,823 9,397 5,992 25,949 3,732 2,156 13,838 7,736 16,258 509,207 2,743 5,060 2,711 16,699 13,850 1,493
Iringa 419,148 4,833 5,458 13,585 3,618 2,387 17,918 7,622 15,420 299,826 5,603 2,450 4,359 24,291 10,831 946
Mbeya 1,123,967 15,552 16,302 47,885 11,060 7,911 50,573 38,863 52,161 713,522 17,301 4,639 8,090 81,228 53,002 5,878
Singida 554,188 6,444 6,022 23,077 4,413 3,358 15,588 8,543 18,853 367,637 21,530 2,019 1,396 37,765 34,551 2,993
Tabora 851,963 9,776 8,948 32,534 5,645 5,001 33,471 14,309 33,134 537,416 30,751 1,734 2,887 71,081 60,975 4,298
Rukwa 411,165 3,779 3,634 12,332 2,440 1,486 15,513 6,526 12,945 294,320 5,059 8,084 1,604 26,553 15,870 1,022
Kigoma 863,004 9,644 8,835 35,487 5,507 3,212 19,924 11,069 21,045 672,731 2,654 7,245 2,786 33,001 27,245 2,619
Shinyanga 566,072 7,316 6,604 22,761 3,878 5,164 25,760 12,443 26,724 345,480 12,054 537 4,444 57,881 32,668 2,359
Kagera 1,095,970 11,455 8,897 32,233 7,498 3,658 31,500 12,072 28,393 826,453 9,255 11,822 5,448 71,812 33,208 2,265
Mwanza 982,154 9,278 16,290 32,594 7,518 8,939 54,670 27,198 44,234 638,494 8,172 29,279 9,926 67,157 26,112 2,294
Mara 655,803 7,456 7,961 27,589 4,840 4,276 20,888 11,774 18,029 465,045 8,701 14,104 2,783 34,287 24,813 3,257
Manyara 558,162 6,196 7,225 13,173 2,580 2,468 16,509 5,995 16,977 319,220 62,658 2,158 2,043 31,929 68,145 885
Njombe 331,297 3,373 3,317 8,709 1,744 875 10,759 3,386 8,546 270,973 1,220 1,216 1,807 9,921 4,853 599
Katavi 219,277 3,303 2,046 9,551 2,138 953 7,587 4,292 10,080 135,702 4,005 2,890 860 18,715 15,685 1,471
Simiyu 596,409 5,453 4,205 18,061 2,762 2,456 11,674 6,473 7,889 447,647 19,069 2,477 812 36,739 27,823 2,869
Geita 687,213 8,716 8,560 25,620 3,274 2,384 19,960 13,307 25,558 458,996 2,992 5,055 2,030 58,521 47,948 4,294

108
Table 9.25: Distribution of Employed Population Aged 10 Years and Above by Five Year Age Group and Main Industry; Tanzania Mainland, 2012 Census
Age Group
Total
Agriculture-Commercial, Food Crops
and Forestry
Fishing Huntin
g Livestock and Other
Related
Mining and
Quarrying
Manufacturing
Electricity Gas and
Steam
Services for
Clean Water
Sewage and
Environment
Construction
Raw Food Sales
(Uncooked
Food)
Trade and
Commerce
Haulage and
Storage
Services for food
Hotels and
Lodges
Information and Communication
Financial Institutio
n and Insuranc
e
Public Admini
stration and
Security
Services
Education
Services
Health and
Social Welfare Service
s
Domestic Services
Other Activities not listed
Total 17,916,158 11,226,296 622,660 470,148 551,874 67,565 150,741 423,586 583,446 1,121,373 233,514 311,328 68,352 135,136 188,805 259,742 92,129 996,353 413,111
10 - 14 993,888 607,769 61,966 24,671 8,251 4,107 6,129 14,321 11,518 44,098 5,113 5,267 1,933 - - - - 143,581 55,166
15 - 19 1,803,254 1,191,404 74,456 43,266 35,713 4,348 13,437 28,990 36,712 96,623 10,861 24,080 3,346 - - - - 178,195 61,825
20 - 24 2,392,629 1,464,984 81,778 65,223 84,133 7,834 23,295 58,639 84,315 159,255 29,218 51,174 10,521 19,963 20,688 28,727 8,842 146,454 47,587
25 - 29 2,494,624 1,421,103 85,765 70,380 109,114 12,084 25,155 72,783 105,214 176,216 42,692 57,677 14,447 26,649 29,756 57,843 13,876 115,495 58,373
30 - 34 2,279,248 1,310,600 76,764 62,837 91,812 10,209 22,777 72,796 102,342 164,290 42,772 53,083 12,263 24,063 28,564 45,702 14,155 93,370 50,846
35 - 39 1,963,006 1,172,839 63,277 54,042 72,643 8,928 18,504 58,273 83,378 137,301 33,874 43,131 9,044 18,595 24,443 33,085 13,166 77,804 40,679
40 - 44 1,547,632 960,148 50,726 41,691 49,772 6,261 13,560 43,168 57,897 100,777 24,761 29,062 6,327 14,349 22,914 24,190 11,404 60,814 29,811
45 - 49 1,221,218 786,094 38,318 31,559 35,511 4,947 9,771 28,105 39,299 74,633 16,105 20,205 3,906 10,938 21,034 19,485 11,021 48,513 21,775
50 - 54 980,573 653,872 29,718 24,304 25,036 4,034 6,805 18,855 25,453 53,958 11,218 11,453 2,884 7,919 17,732 23,770 8,593 37,562 17,406
55 - 59 624,963 420,176 18,787 15,525 14,756 2,324 4,092 10,645 14,120 32,828 6,998 6,335 1,934 5,210 10,749 19,091 6,300 24,260 10,833
60 - 64 586,385 431,571 15,817 13,705 11,018 1,305 3,018 7,658 10,526 30,870 4,852 4,575 976 3,363 6,275 4,656 2,772 25,318 8,111
65 - 69 358,809 275,996 9,067 7,646 5,732 455 1,661 4,174 5,187 17,614 2,304 2,208 338 1,559 3,023 1,632 815 15,203 4,197
70 - 74 304,630 239,917 7,469 6,768 4,158 326 1,386 2,687 3,564 14,560 1,221 1,619 252 1,210 1,834 883 659 13,134 2,981
75 - 79 173,398 137,753 3,865 4,044 2,047 217 578 1,407 1,944 8,490 808 738 124 628 1,025 295 232 7,456 1,747
80+ 191,901 152,070 4,887 4,487 2,178 186 573 1,085 1,977 9,860 717 721 57 690 768 383 294 9,194 1,774
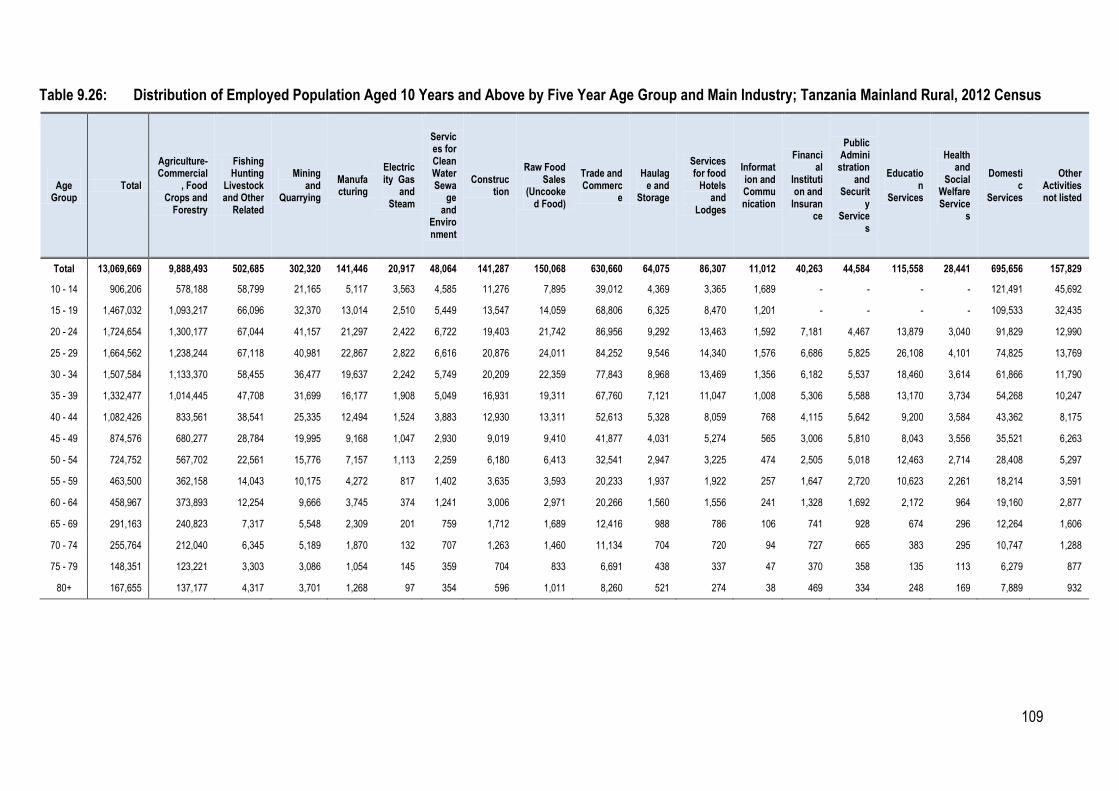
109
Table 9.26: Distribution of Employed Population Aged 10 Years and Above by Five Year Age Group and Main Industry; Tanzania Mainland Rural, 2012 Census
Age
Group Total
Agriculture-Commercial
, Food Crops and
Forestry
Fishing Hunting
Livestock and Other
Related
Mining and
Quarrying
Manufacturing
Electricity Gas
and Steam
Services for Clean Water Sewa
ge and
Environment
Construction
Raw Food Sales
(Uncooked Food)
Trade and Commerc
e
Haulage and
Storage
Services for food
Hotels and
Lodges
Information and Communication
Financial
Institution and
Insurance
Public Admini
stration and
Security
Services
Education
Services
Health and
Social Welfare Service
s
Domestic
Services
Other Activities not listed
Total 13,069,669 9,888,493 502,685 302,320 141,446 20,917 48,064 141,287 150,068 630,660 64,075 86,307 11,012 40,263 44,584 115,558 28,441 695,656 157,829
10 - 14 906,206 578,188 58,799 21,165 5,117 3,563 4,585 11,276 7,895 39,012 4,369 3,365 1,689 - - - - 121,491 45,692
15 - 19 1,467,032 1,093,217 66,096 32,370 13,014 2,510 5,449 13,547 14,059 68,806 6,325 8,470 1,201 - - - - 109,533 32,435
20 - 24 1,724,654 1,300,177 67,044 41,157 21,297 2,422 6,722 19,403 21,742 86,956 9,292 13,463 1,592 7,181 4,467 13,879 3,040 91,829 12,990
25 - 29 1,664,562 1,238,244 67,118 40,981 22,867 2,822 6,616 20,876 24,011 84,252 9,546 14,340 1,576 6,686 5,825 26,108 4,101 74,825 13,769
30 - 34 1,507,584 1,133,370 58,455 36,477 19,637 2,242 5,749 20,209 22,359 77,843 8,968 13,469 1,356 6,182 5,537 18,460 3,614 61,866 11,790
35 - 39 1,332,477 1,014,445 47,708 31,699 16,177 1,908 5,049 16,931 19,311 67,760 7,121 11,047 1,008 5,306 5,588 13,170 3,734 54,268 10,247
40 - 44 1,082,426 833,561 38,541 25,335 12,494 1,524 3,883 12,930 13,311 52,613 5,328 8,059 768 4,115 5,642 9,200 3,584 43,362 8,175
45 - 49 874,576 680,277 28,784 19,995 9,168 1,047 2,930 9,019 9,410 41,877 4,031 5,274 565 3,006 5,810 8,043 3,556 35,521 6,263
50 - 54 724,752 567,702 22,561 15,776 7,157 1,113 2,259 6,180 6,413 32,541 2,947 3,225 474 2,505 5,018 12,463 2,714 28,408 5,297
55 - 59 463,500 362,158 14,043 10,175 4,272 817 1,402 3,635 3,593 20,233 1,937 1,922 257 1,647 2,720 10,623 2,261 18,214 3,591
60 - 64 458,967 373,893 12,254 9,666 3,745 374 1,241 3,006 2,971 20,266 1,560 1,556 241 1,328 1,692 2,172 964 19,160 2,877
65 - 69 291,163 240,823 7,317 5,548 2,309 201 759 1,712 1,689 12,416 988 786 106 741 928 674 296 12,264 1,606
70 - 74 255,764 212,040 6,345 5,189 1,870 132 707 1,263 1,460 11,134 704 720 94 727 665 383 295 10,747 1,288
75 - 79 148,351 123,221 3,303 3,086 1,054 145 359 704 833 6,691 438 337 47 370 358 135 113 6,279 877
80+ 167,655 137,177 4,317 3,701 1,268 97 354 596 1,011 8,260 521 274 38 469 334 248 169 7,889 932

110
Table 9.27: Distribution of Employed Population Aged 10 Years and Above by Five Year Age Group and Main Industry; Tanzania Mainland Urban, 2012 Census
Age Group
Total
Agriculture-
Commercial, Food
Crops and
Forestry
Fishing Huntin
g Livestock and Other
Related
Mining and
Quarrying
Manufacturing
Electricity Gas
and Steam
Services for
Clean Water
Sewage and
Environment
Construction
Raw Food Sales
(Uncooked
Food)
Trade and Commerc
e
Haulage and
Storage
Services for food
Hotels and
Lodges
Information and
Communication
Financial Institutio
n and Insurance
Public Admini
stration and
Security
Services
Education
Services
Health and
Social Welfar
e Servic
es
Domestic
Services
Other Activitie
s not listed
Total 4,846,490 1,337,802 119,975 167,825 410,428 46,649 102,675 282,299 433,381 490,714 169,442 225,022 57,339 94,871 144,223 144,183 63,684 300,698 255,279
10 - 14 87,682 29,580 3,167 3,506 3,133 545 1,544 3,045 3,623 5,086 744 1,902 244 - - - - 22,090 9,474
15 - 19 336,223 98,188 8,360 10,895 22,699 1,839 7,988 15,442 22,653 27,817 4,536 15,610 2,144 - - - - 68,662 29,389
20 - 24 667,975 164,807 14,734 24,065 62,836 5,412 16,572 39,237 62,573 72,299 19,926 37,710 8,929 12,782 16,221 14,847 5,802 54,624 34,597
25 - 29 830,062 182,859 18,647 29,399 86,247 9,262 18,540 51,906 81,203 91,964 33,147 43,338 12,871 19,963 23,931 31,735 9,776 40,670 44,604
30 - 34 771,664 177,230 18,309 26,360 72,176 7,967 17,027 52,586 79,984 86,448 33,804 39,614 10,907 17,881 23,027 27,242 10,540 31,505 39,056
35 - 39 630,530 158,394 15,570 22,342 56,466 7,020 13,456 41,343 64,067 69,541 26,753 32,084 8,035 13,288 18,855 19,916 9,431 23,536 30,432
40 - 44 465,206 126,586 12,185 16,356 37,278 4,737 9,677 30,238 44,587 48,164 19,432 21,003 5,559 10,234 17,272 14,989 7,820 17,452 21,636
45 - 49 346,643 105,817 9,534 11,565 26,343 3,901 6,841 19,086 29,888 32,756 12,075 14,931 3,341 7,932 15,224 11,443 7,465 12,991 15,512
50 - 54 255,821 86,170 7,158 8,528 17,879 2,922 4,546 12,675 19,040 21,417 8,272 8,228 2,411 5,414 12,714 11,307 5,878 9,155 12,109
55 - 59 161,462 58,018 4,744 5,350 10,484 1,506 2,689 7,011 10,528 12,596 5,061 4,413 1,677 3,562 8,030 8,468 4,038 6,047 7,242
60 - 64 127,417 57,678 3,563 4,038 7,273 930 1,777 4,652 7,555 10,604 3,292 3,019 734 2,035 4,584 2,484 1,808 6,158 5,234
65 - 69 67,646 35,173 1,749 2,098 3,423 253 902 2,462 3,499 5,198 1,316 1,422 233 818 2,095 957 519 2,938 2,590
70 - 74 48,865 27,877 1,123 1,579 2,288 194 679 1,424 2,104 3,426 517 900 158 483 1,169 499 364 2,387 1,693
75 - 79 25,047 14,532 562 958 993 72 218 703 1,111 1,799 370 401 76 258 667 160 119 1,178 869
80+ 24,247 14,893 570 786 910 89 219 489 966 1,599 197 447 20 221 434 136 124 1,305 842
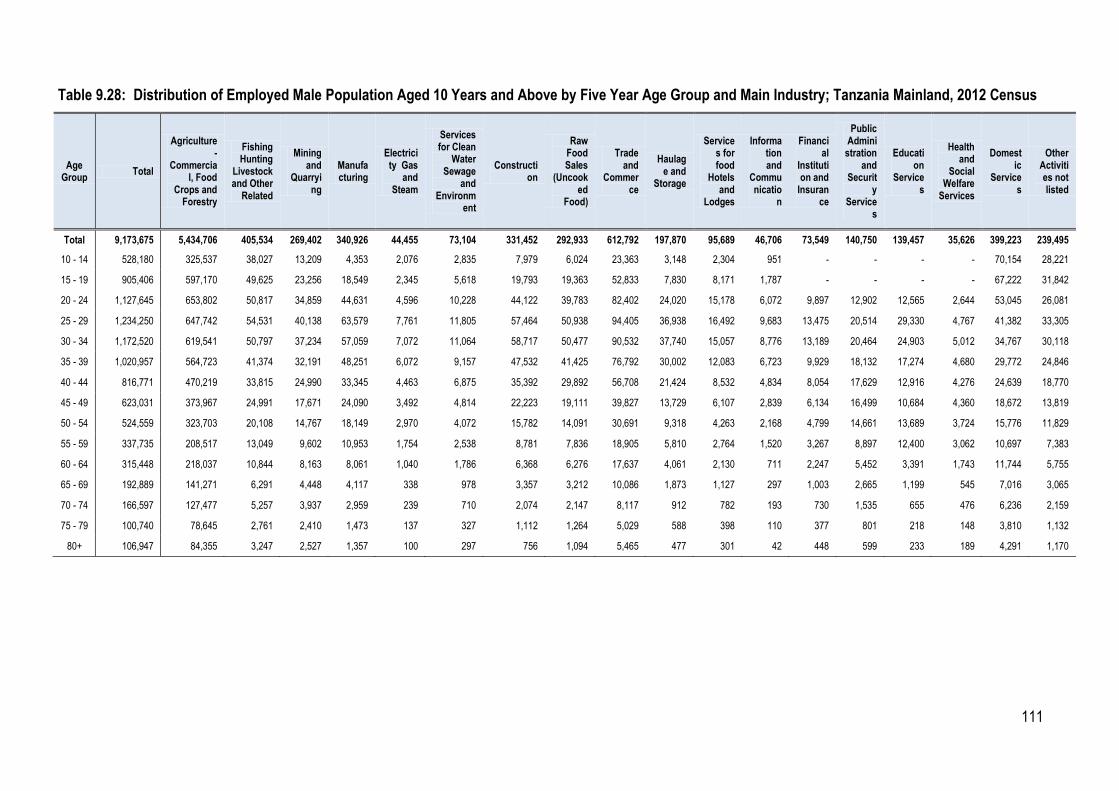
111
Table 9.28: Distribution of Employed Male Population Aged 10 Years and Above by Five Year Age Group and Main Industry; Tanzania Mainland, 2012 Census
Age Group
Total
Agriculture-
Commercial, Food
Crops and Forestry
Fishing Hunting
Livestock and Other
Related
Mining and
Quarrying
Manufacturing
Electricity Gas
and Steam
Services for Clean
Water Sewage
and Environm
ent
Construction
Raw Food Sales
(Uncooked
Food)
Trade and
Commerce
Haulage and
Storage
Services for food
Hotels and
Lodges
Information and
Communicatio
n
Financial
Institution and
Insurance
Public Admini
stration and
Security
Services
Education
Services
Health and
Social Welfare
Services
Domestic
Services
Other Activities not listed
Total 9,173,675 5,434,706 405,534 269,402 340,926 44,455 73,104 331,452 292,933 612,792 197,870 95,689 46,706 73,549 140,750 139,457 35,626 399,223 239,495
10 - 14 528,180 325,537 38,027 13,209 4,353 2,076 2,835 7,979 6,024 23,363 3,148 2,304 951 - - - - 70,154 28,221
15 - 19 905,406 597,170 49,625 23,256 18,549 2,345 5,618 19,793 19,363 52,833 7,830 8,171 1,787 - - - - 67,222 31,842
20 - 24 1,127,645 653,802 50,817 34,859 44,631 4,596 10,228 44,122 39,783 82,402 24,020 15,178 6,072 9,897 12,902 12,565 2,644 53,045 26,081
25 - 29 1,234,250 647,742 54,531 40,138 63,579 7,761 11,805 57,464 50,938 94,405 36,938 16,492 9,683 13,475 20,514 29,330 4,767 41,382 33,305
30 - 34 1,172,520 619,541 50,797 37,234 57,059 7,072 11,064 58,717 50,477 90,532 37,740 15,057 8,776 13,189 20,464 24,903 5,012 34,767 30,118
35 - 39 1,020,957 564,723 41,374 32,191 48,251 6,072 9,157 47,532 41,425 76,792 30,002 12,083 6,723 9,929 18,132 17,274 4,680 29,772 24,846
40 - 44 816,771 470,219 33,815 24,990 33,345 4,463 6,875 35,392 29,892 56,708 21,424 8,532 4,834 8,054 17,629 12,916 4,276 24,639 18,770
45 - 49 623,031 373,967 24,991 17,671 24,090 3,492 4,814 22,223 19,111 39,827 13,729 6,107 2,839 6,134 16,499 10,684 4,360 18,672 13,819
50 - 54 524,559 323,703 20,108 14,767 18,149 2,970 4,072 15,782 14,091 30,691 9,318 4,263 2,168 4,799 14,661 13,689 3,724 15,776 11,829
55 - 59 337,735 208,517 13,049 9,602 10,953 1,754 2,538 8,781 7,836 18,905 5,810 2,764 1,520 3,267 8,897 12,400 3,062 10,697 7,383
60 - 64 315,448 218,037 10,844 8,163 8,061 1,040 1,786 6,368 6,276 17,637 4,061 2,130 711 2,247 5,452 3,391 1,743 11,744 5,755
65 - 69 192,889 141,271 6,291 4,448 4,117 338 978 3,357 3,212 10,086 1,873 1,127 297 1,003 2,665 1,199 545 7,016 3,065
70 - 74 166,597 127,477 5,257 3,937 2,959 239 710 2,074 2,147 8,117 912 782 193 730 1,535 655 476 6,236 2,159
75 - 79 100,740 78,645 2,761 2,410 1,473 137 327 1,112 1,264 5,029 588 398 110 377 801 218 148 3,810 1,132
80+ 106,947 84,355 3,247 2,527 1,357 100 297 756 1,094 5,465 477 301 42 448 599 233 189 4,291 1,170

112
Table 9.29: Distribution of Employed Female Population Aged 10 Years and Above by Five Year Age Group and Main Industry; Tanzania Mainland, 2012 Census
Age Group
Total
Agriculture-
Commercial, Food
Crops and
Forestry
Fishing Hunting Livestoc
k and Other
Related
Mining and
Quarrying
Manufacturing
Electricity Gas and
Steam
Services for Clean Water Sewa
ge and
Environment
Construction
Raw Food Sales
(Uncooked
Food)
Trade and Commerce
Haulage and
Storage
Services for food
Hotels and
Lodges
Information and Com
munication
Financial
Institution and
Insurance
Public Administrati
on and
Security
Services
Education
Services
Health and
Social Welfar
e Servic
es
Domestic
Services
Other Activities not listed
Total 8,742,483 5,791,588 217,126 200,745 210,952 23,106 77,637 92,131 290,516 508,583 35,641 215,640 21,649 61,588 48,057 120,284 56,500 597,132 173,614
10 - 14 465,708 282,231 23,939 11,462 3,898 2,031 3,294 6,342 5,495 20,735 1,964 2,963 982 - - - - 73,427 26,945
15 - 19 897,848 594,234 24,831 20,010 17,164 2,003 7,819 9,196 17,349 43,789 3,030 15,909 1,559 - - - - 110,973 29,983
20 - 24 1,264,984 811,182 30,961 30,364 39,503 3,237 13,066 14,517 44,532 76,853 5,198 35,996 4,449 10,065 7,786 16,162 6,198 93,409 21,506
25 - 29 1,260,374 773,360 31,234 30,242 45,536 4,322 13,351 15,318 54,276 81,812 5,754 41,185 4,764 13,175 9,242 28,513 9,109 74,113 25,068
30 - 34 1,106,728 691,060 25,967 25,604 34,753 3,137 11,713 14,078 51,865 73,759 5,032 38,026 3,487 10,874 8,100 20,799 9,142 58,604 20,728
35 - 39 942,049 608,116 21,903 21,850 24,393 2,856 9,347 10,741 41,953 60,509 3,872 31,048 2,321 8,665 6,311 15,812 8,486 48,032 15,833
40 - 44 730,861 489,929 16,911 16,701 16,428 1,797 6,685 7,776 28,005 44,069 3,336 20,531 1,493 6,296 5,286 11,273 7,128 36,176 11,041
45 - 49 598,188 412,127 13,327 13,888 11,421 1,455 4,957 5,882 20,188 34,807 2,376 14,098 1,067 4,804 4,534 8,801 6,661 29,840 7,955
50 - 54 456,014 330,169 9,610 9,537 6,887 1,064 2,733 3,074 11,361 23,267 1,900 7,189 717 3,120 3,071 10,081 4,869 21,786 5,577
55 - 59 287,227 211,659 5,738 5,923 3,804 570 1,554 1,864 6,285 13,923 1,188 3,571 414 1,943 1,852 6,691 3,238 13,563 3,450
60 - 64 270,936 213,533 4,973 5,542 2,956 264 1,231 1,290 4,251 13,233 791 2,445 265 1,116 823 1,265 1,028 13,575 2,356
65 - 69 165,921 134,725 2,776 3,197 1,615 116 684 816 1,975 7,528 431 1,082 42 557 358 433 270 8,186 1,132
70 - 74 138,033 112,440 2,212 2,831 1,199 88 676 613 1,417 6,443 309 837 59 480 299 228 183 6,898 822
75 - 79 72,658 59,108 1,104 1,634 574 81 251 295 681 3,461 220 340 14 251 225 76 83 3,647 614
80+ 84,954 67,715 1,640 1,960 821 85 276 329 883 4,395 240 420 16 242 170 150 105 4,903 604

113
Table 9.30: Employed Population Aged 10 Years and Above by Five Year Age Group and Main Industry and Region; Tanzania Mainland, 2012 Census
Region Total
Agriculture-Commercial, Food Crops
and Forestry
Fishing Hunting Livestoc
k and Other
Related
Mining and
Quarrying
Manufacturing
Electricity Gas
and Steam
Services for Clean
Water Sewage
and Environme
nt
Construction
Raw Food Sales
(Uncooked Food)
Trade and Commerc
e
Haulage and
Storage
Services for food
Hotels and
Lodges
Information and Communication
Financial
Institution and
Insurance
Public Admini
stration and
Security
Services
Education
Services
Health and
Social Welfare Service
s
Domestic Services
Other Activities not listed
Tanzania 17,916,158 11,226,296 622,660 470,148 551,874 67,565 150,741 423,586 583,446 1,121,373 233,514 311,328 68,352 135,136 188,805 259,742 92,129 996,353 413,111
Rural 13,069,669 9,888,493 502,685 302,320 141,446 20,917 48,064 141,287 150,068 630,660 64,075 86,307 11,012 40,263 44,584 115,558 28,441 695,656 157,829
Urban 4,846,490 1,337,802 119,975 167,825 410,428 46,649 102,675 282,299 433,381 490,714 169,442 225,022 57,339 94,871 144,223 144,183 63,684 300,698 255,279
Male 9,173,675 5,434,706 405,534 269,402 340,926 44,455 73,104 331,452 292,933 612,792 197,870 95,689 46,706 73,549 140,750 139,457 35,626 399,223 239,495
Female 8,742,483 5,791,588 217,126 200,745 210,952 23,106 77,637 92,131 290,516 508,583 35,641 215,640 21,649 61,588 48,057 120,284 56,500 597,132 173,614
Dodoma 853,986 606,739 22,408 15,734 15,403 2,326 6,442 15,515 19,166 44,745 7,290 8,704 1,408 4,247 7,546 10,727 3,375 49,385 12,827
Arusha 664,427 271,153 105,633 8,738 33,490 2,608 7,281 21,605 39,134 40,870 17,645 20,333 4,252 6,774 10,324 16,238 4,593 34,089 19,666
Kilimanjaro 729,528 444,588 24,322 15,874 17,460 3,036 6,128 17,581 24,840 43,969 9,963 8,764 2,540 5,869 7,452 16,451 4,877 51,080 24,732
Tanga 882,213 682,054 29,231 8,377 22,519 2,006 3,312 10,082 19,795 31,393 9,924 14,234 1,805 2,900 6,744 13,857 3,874 12,207 7,899
Morogoro 1,002,049 727,683 21,527 29,952 22,577 3,561 7,810 14,208 19,612 60,374 6,618 10,894 2,058 4,160 7,714 11,159 4,529 32,309 15,303
Pwani 460,517 292,373 25,819 8,125 12,161 1,496 4,555 10,722 18,145 23,753 6,625 13,552 1,531 3,757 6,300 7,006 2,510 13,451 8,638
Dar es Salaam 1,719,466 91,525 43,461 58,482 211,072 25,055 50,634 151,622 192,318 201,831 93,605 117,584 34,511 50,737 67,683 44,000 23,544 124,519 137,282
Lindi 422,236 336,164 10,302 9,030 6,473 608 1,473 4,080 6,403 18,474 1,515 5,273 432 1,141 2,642 3,506 1,488 8,356 4,876
Mtwara 629,119 509,536 7,244 13,472 11,237 1,019 1,697 6,382 8,645 28,700 2,239 4,462 756 2,154 3,791 5,687 1,866 14,455 5,777
Ruvuma 636,823 487,311 9,812 18,387 9,788 1,238 3,020 7,081 8,951 47,031 3,300 3,691 803 2,144 3,269 7,536 2,939 13,523 7,000
Iringa 419,148 308,018 8,021 3,666 11,697 1,038 1,742 7,786 8,439 24,462 4,398 5,111 892 2,353 3,047 7,053 2,184 12,754 6,487
Mbeya 1,123,967 719,094 21,374 47,575 27,891 4,261 9,827 23,018 38,978 80,725 9,673 11,871 2,694 8,210 8,618 16,990 5,084 64,906 23,179
Singida 554,188 346,316 23,129 21,250 9,351 1,732 3,322 9,764 9,960 32,315 4,348 4,188 554 2,448 3,627 5,893 1,828 62,789 11,376
Tabora 851,963 558,875 28,071 24,442 17,407 1,556 7,072 18,143 21,931 47,772 5,630 10,314 1,140 4,140 5,271 8,637 2,974 73,665 14,924
Rukwa 411,165 303,950 15,675 4,552 6,005 829 1,728 7,099 12,622 20,408 2,087 3,405 492 1,520 1,953 4,486 1,376 18,584 4,392
Kigoma 863,004 654,833 15,932 25,447 13,145 1,507 4,267 9,262 14,154 52,679 4,007 6,926 880 3,389 4,952 9,389 3,182 25,746 13,308
Shinyanga 566,072 344,540 9,610 22,029 12,745 3,456 4,330 11,658 17,632 37,910 6,046 6,647 1,408 4,323 4,435 7,088 2,239 58,928 11,047
Kagera 1,095,970 836,558 26,473 20,975 16,075 1,652 3,997 14,938 12,352 59,020 6,575 8,723 1,465 4,580 6,253 12,137 3,344 47,219 13,635
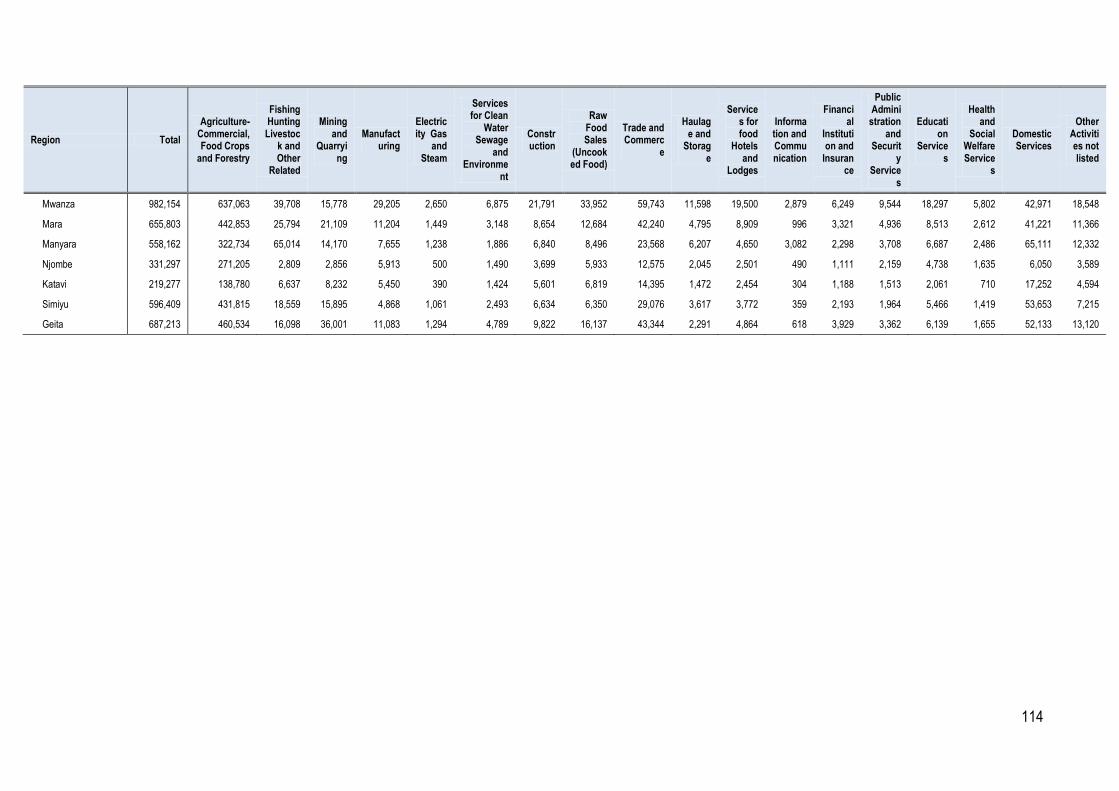
114
Region Total
Agriculture-Commercial, Food Crops
and Forestry
Fishing Hunting Livestoc
k and Other
Related
Mining and
Quarrying
Manufacturing
Electricity Gas
and Steam
Services for Clean
Water Sewage
and Environme
nt
Construction
Raw Food Sales
(Uncooked Food)
Trade and Commerc
e
Haulage and
Storage
Services for food
Hotels and
Lodges
Information and Communication
Financial
Institution and
Insurance
Public Admini
stration and
Security
Services
Education
Services
Health and
Social Welfare Service
s
Domestic Services
Other Activities not listed
Mwanza 982,154 637,063 39,708 15,778 29,205 2,650 6,875 21,791 33,952 59,743 11,598 19,500 2,879 6,249 9,544 18,297 5,802 42,971 18,548
Mara 655,803 442,853 25,794 21,109 11,204 1,449 3,148 8,654 12,684 42,240 4,795 8,909 996 3,321 4,936 8,513 2,612 41,221 11,366
Manyara 558,162 322,734 65,014 14,170 7,655 1,238 1,886 6,840 8,496 23,568 6,207 4,650 3,082 2,298 3,708 6,687 2,486 65,111 12,332
Njombe 331,297 271,205 2,809 2,856 5,913 500 1,490 3,699 5,933 12,575 2,045 2,501 490 1,111 2,159 4,738 1,635 6,050 3,589
Katavi 219,277 138,780 6,637 8,232 5,450 390 1,424 5,601 6,819 14,395 1,472 2,454 304 1,188 1,513 2,061 710 17,252 4,594
Simiyu 596,409 431,815 18,559 15,895 4,868 1,061 2,493 6,634 6,350 29,076 3,617 3,772 359 2,193 1,964 5,466 1,419 53,653 7,215
Geita 687,213 460,534 16,098 36,001 11,083 1,294 4,789 9,822 16,137 43,344 2,291 4,864 618 3,929 3,362 6,139 1,655 52,133 13,120
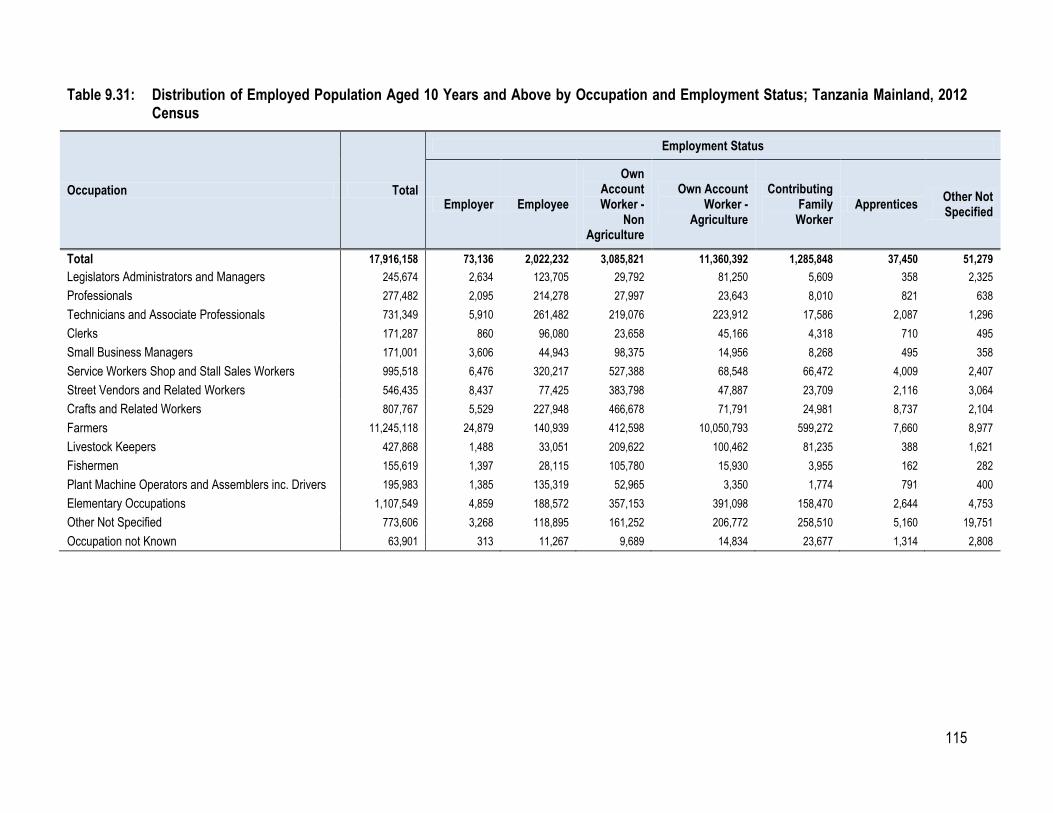
115
Table 9.31: Distribution of Employed Population Aged 10 Years and Above by Occupation and Employment Status; Tanzania Mainland, 2012 Census
Occupation Total
Employment Status
Employer Employee
Own Account Worker -
Non Agriculture
Own Account Worker -
Agriculture
Contributing Family Worker
Apprentices Other Not Specified
Total 17,916,158 73,136 2,022,232 3,085,821 11,360,392 1,285,848 37,450 51,279
Legislators Administrators and Managers 245,674 2,634 123,705 29,792 81,250 5,609 358 2,325
Professionals 277,482 2,095 214,278 27,997 23,643 8,010 821 638
Technicians and Associate Professionals 731,349 5,910 261,482 219,076 223,912 17,586 2,087 1,296
Clerks 171,287 860 96,080 23,658 45,166 4,318 710 495
Small Business Managers 171,001 3,606 44,943 98,375 14,956 8,268 495 358
Service Workers Shop and Stall Sales Workers 995,518 6,476 320,217 527,388 68,548 66,472 4,009 2,407
Street Vendors and Related Workers 546,435 8,437 77,425 383,798 47,887 23,709 2,116 3,064
Crafts and Related Workers 807,767 5,529 227,948 466,678 71,791 24,981 8,737 2,104
Farmers 11,245,118 24,879 140,939 412,598 10,050,793 599,272 7,660 8,977
Livestock Keepers 427,868 1,488 33,051 209,622 100,462 81,235 388 1,621
Fishermen 155,619 1,397 28,115 105,780 15,930 3,955 162 282
Plant Machine Operators and Assemblers inc. Drivers 195,983 1,385 135,319 52,965 3,350 1,774 791 400
Elementary Occupations 1,107,549 4,859 188,572 357,153 391,098 158,470 2,644 4,753
Other Not Specified 773,606 3,268 118,895 161,252 206,772 258,510 5,160 19,751
Occupation not Known 63,901 313 11,267 9,689 14,834 23,677 1,314 2,808

116
Table 9.32: Distribution of Employed Population Aged 10 Years and Above by Occupation and Employment Status; Tanzania Mainland Rural, 2012 Census
Occupation Total
Employment Status
Employer Employee Own Account Worker - Non
Agriculture
Own Account Worker -
Agriculture
Contributing Family Worker
Apprentices Other Not Specified
Total 13,069,669 34,108 585,996 1,227,299 10,050,689 1,120,306 19,720 31,550
Legislators Administrators and Managers 130,417 828 37,239 15,695 70,942 4,527 208 978
Professionals 96,369 529 60,309 8,577 20,608 5,866 300 180
Technicians and Associate Professionals 381,689 1,779 96,201 77,012 193,476 11,797 905 520
Clerks 63,408 329 15,219 8,151 36,478 2,697 258 276
Small Business Managers 39,101 347 5,508 16,871 11,034 5,065 193 84
Service Workers Shop and Stall Sales Workers 255,132 1,047 49,626 111,276 48,251 42,352 1,790 790
Street Vendors and Related Workers 121,858 940 10,513 63,332 30,937 13,834 961 1,341
Crafts and Related Workers 271,667 1,350 57,567 139,104 52,346 17,385 3,011 903
Farmers 9,953,032 20,974 100,054 308,036 8,943,008 566,872 6,485 7,602
Livestock Keepers 384,585 1,068 20,465 190,352 92,405 78,519 343 1,434
Fishermen 108,268 981 18,372 71,833 13,647 3,162 77 196
Plant Machine Operators and Assemblers inc. Drivers 29,944 126 18,967 8,231 1,768 655 143 54
Elementary Occupations 680,787 2,421 63,748 137,341 341,419 131,650 1,435 2,773
Other Not Specified 512,213 1,268 28,067 67,698 182,673 217,108 2,843 12,555
Occupation not Known 41,199 120 4,140 3,790 11,699 18,817 768 1,866

117
Table 9.33: Distribution of Employed Population Aged 10 Years and Above by Occupation and Employment Status; Tanzania Mainland Urban, 2012 Census
Occupation Total
Employment Status
Employer Employee Own Account Worker - Non
Agriculture
Own Account Worker -
Agriculture
Contributing Family Worker
Apprentices Other Not Specified
Total 4,846,489 39,027 1,436,236 1,858,522 1,309,703 165,542 17,730 19,729
Legislators Administrators and Managers 115,257 1,806 86,466 14,097 10,308 1,082 149 1,348
Professionals 181,113 1,566 153,968 19,420 3,035 2,144 521 459
Technicians and Associate Professionals 349,660 4,131 165,281 142,064 30,436 5,789 1,182 776
Clerks 107,878 531 80,861 15,507 8,688 1,621 452 219
Small Business Managers 131,901 3,259 39,436 81,504 3,922 3,203 302 274
Service Workers Shop and Stall Sales Workers 740,386 5,430 270,590 416,112 20,298 24,120 2,219 1,617
Street Vendors and Related Workers 424,577 7,497 66,911 320,466 16,950 9,875 1,155 1,723
Crafts and Related Workers 536,100 4,178 170,380 327,574 19,445 7,596 5,725 1,201
Farmers 1,292,086 3,904 40,885 104,562 1,107,785 32,401 1,175 1,375
Livestock Keepers 43,283 420 12,586 19,271 8,058 2,716 45 187
Fishermen 47,351 416 9,743 33,946 2,283 793 85 86
Plant Machine Operators and Assemblers inc. Drivers 166,040 1,259 116,352 44,734 1,582 1,119 648 346
Elementary Occupations 426,761 2,438 124,824 219,812 49,679 26,820 1,208 1,980
Other Not Specified 261,394 1,999 90,827 93,554 24,099 41,402 2,316 7,196
Occupation not Known 22,703 192 7,127 5,900 3,135 4,860 546 942
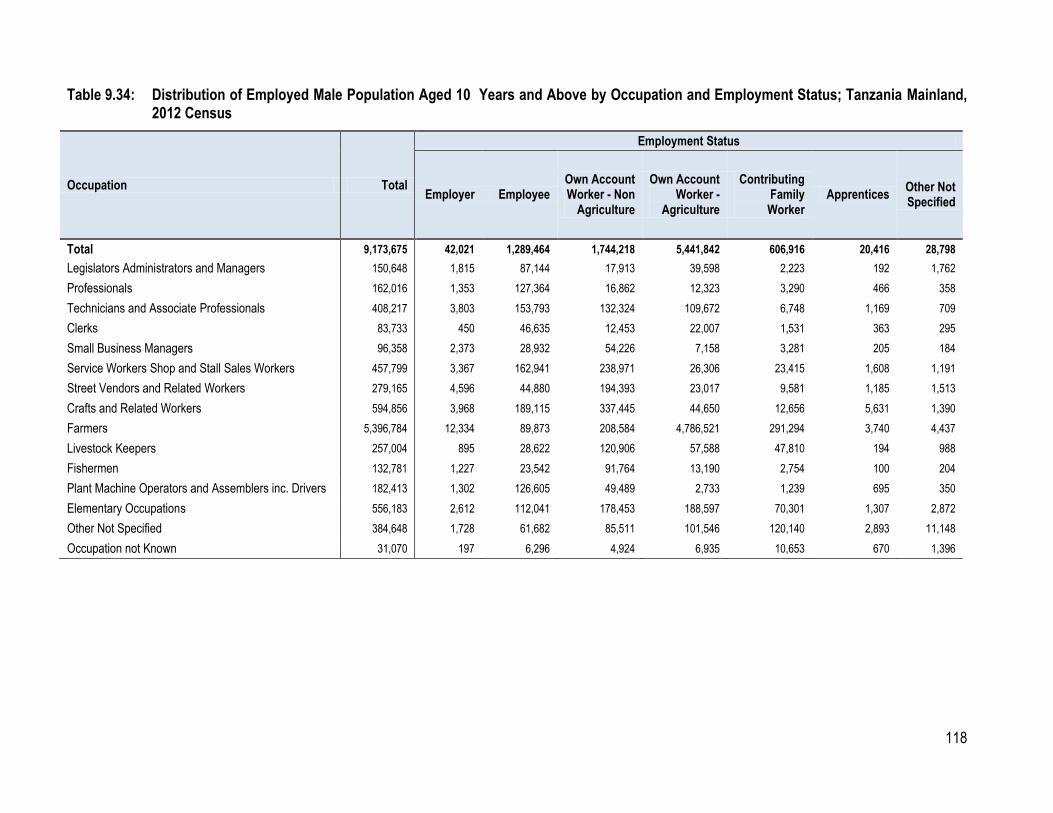
118
Table 9.34: Distribution of Employed Male Population Aged 10 Years and Above by Occupation and Employment Status; Tanzania Mainland, 2012 Census
Occupation Total
Employment Status
Employer Employee Own Account Worker - Non
Agriculture
Own Account Worker -
Agriculture
Contributing Family Worker
Apprentices Other Not Specified
Total 9,173,675 42,021 1,289,464 1,744,218 5,441,842 606,916 20,416 28,798
Legislators Administrators and Managers 150,648 1,815 87,144 17,913 39,598 2,223 192 1,762
Professionals 162,016 1,353 127,364 16,862 12,323 3,290 466 358
Technicians and Associate Professionals 408,217 3,803 153,793 132,324 109,672 6,748 1,169 709
Clerks 83,733 450 46,635 12,453 22,007 1,531 363 295
Small Business Managers 96,358 2,373 28,932 54,226 7,158 3,281 205 184
Service Workers Shop and Stall Sales Workers 457,799 3,367 162,941 238,971 26,306 23,415 1,608 1,191
Street Vendors and Related Workers 279,165 4,596 44,880 194,393 23,017 9,581 1,185 1,513
Crafts and Related Workers 594,856 3,968 189,115 337,445 44,650 12,656 5,631 1,390
Farmers 5,396,784 12,334 89,873 208,584 4,786,521 291,294 3,740 4,437
Livestock Keepers 257,004 895 28,622 120,906 57,588 47,810 194 988
Fishermen 132,781 1,227 23,542 91,764 13,190 2,754 100 204
Plant Machine Operators and Assemblers inc. Drivers 182,413 1,302 126,605 49,489 2,733 1,239 695 350
Elementary Occupations 556,183 2,612 112,041 178,453 188,597 70,301 1,307 2,872
Other Not Specified 384,648 1,728 61,682 85,511 101,546 120,140 2,893 11,148
Occupation not Known 31,070 197 6,296 4,924 6,935 10,653 670 1,396
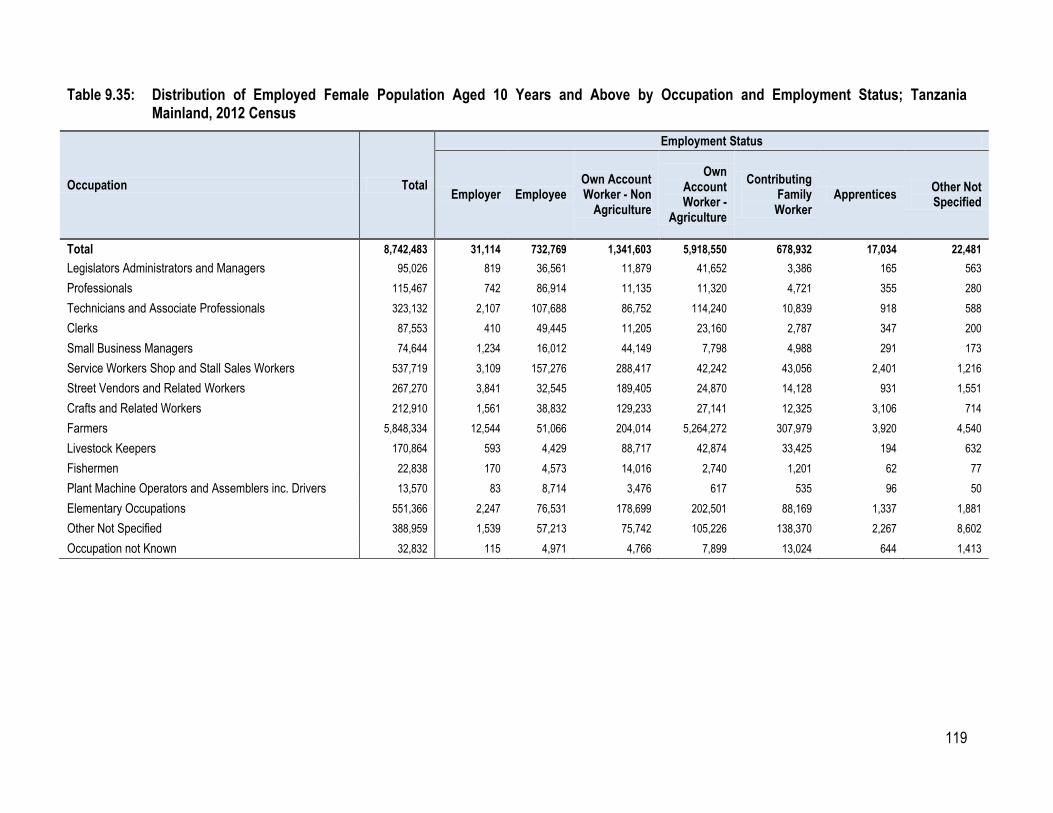
119
Table 9.35: Distribution of Employed Female Population Aged 10 Years and Above by Occupation and Employment Status; Tanzania Mainland, 2012 Census
Occupation Total
Employment Status
Employer Employee Own Account Worker - Non
Agriculture
Own Account Worker -
Agriculture
Contributing Family Worker
Apprentices Other Not Specified
Total 8,742,483 31,114 732,769 1,341,603 5,918,550 678,932 17,034 22,481
Legislators Administrators and Managers 95,026 819 36,561 11,879 41,652 3,386 165 563
Professionals 115,467 742 86,914 11,135 11,320 4,721 355 280
Technicians and Associate Professionals 323,132 2,107 107,688 86,752 114,240 10,839 918 588
Clerks 87,553 410 49,445 11,205 23,160 2,787 347 200
Small Business Managers 74,644 1,234 16,012 44,149 7,798 4,988 291 173
Service Workers Shop and Stall Sales Workers 537,719 3,109 157,276 288,417 42,242 43,056 2,401 1,216
Street Vendors and Related Workers 267,270 3,841 32,545 189,405 24,870 14,128 931 1,551
Crafts and Related Workers 212,910 1,561 38,832 129,233 27,141 12,325 3,106 714
Farmers 5,848,334 12,544 51,066 204,014 5,264,272 307,979 3,920 4,540
Livestock Keepers 170,864 593 4,429 88,717 42,874 33,425 194 632
Fishermen 22,838 170 4,573 14,016 2,740 1,201 62 77
Plant Machine Operators and Assemblers inc. Drivers 13,570 83 8,714 3,476 617 535 96 50
Elementary Occupations 551,366 2,247 76,531 178,699 202,501 88,169 1,337 1,881
Other Not Specified 388,959 1,539 57,213 75,742 105,226 138,370 2,267 8,602
Occupation not Known 32,832 115 4,971 4,766 7,899 13,024 644 1,413

120
Chapter Ten
Disability
The tables in this chapter give distribution of population with disability by type of disability,
level of difficulty, age, sex and region. The tables also present persons with albinism by age
group, sex, rural and urban areas.

121
Table 10.1: Number of Persons with Disability by Type of Disability and Region; Tanzania Mainland, 2012 Census
Region
Type of Disability
Albinism Seeing Hearing Walking Remembering Self-care Other
Disabilities
Tanzania Mainland 16,127 821,213 410,182 513,558 391,281 317,224 97,503
Dodoma 1,034 41,985 22,512 23,124 17,759 16,006 7,980
Arusha 732 19,095 8,976 12,584 7,351 6,692 2,595
Kilimanjaro 734 48,170 17,125 29,193 20,738 14,453 6,922
Tanga 703 45,786 20,437 27,434 19,526 15,048 231
Morogoro 947 49,688 23,995 30,119 23,705 18,014 8,427
Pwani 457 39,359 16,670 21,414 16,729 10,112 3,873
Dar es Salaam 1,637 71,576 25,059 30,403 22,145 16,416 319
Lindi 356 26,028 11,422 12,528 11,219 10,325 136
Mtwara 438 40,485 17,630 20,901 19,720 16,091 5,437
Ruvuma 532 20,735 12,391 15,950 14,000 13,243 4,648
Iringa 374 20,961 11,001 15,549 10,797 7,985 4,702
Mbeya 747 52,511 26,884 37,734 30,036 20,675 303
Singida 572 28,906 15,447 21,045 14,318 15,088 206
Tabora 797 33,069 18,585 23,077 16,677 14,715 6,049
Rukwa 268 15,905 9,217 10,885 9,556 7,682 3,335
Kigoma 694 31,685 19,041 25,965 20,364 15,041 7,476
Shinyanga 637 16,176 9,444 11,025 6,688 6,328 2,932
Kagera 536 60,138 35,850 33,019 31,488 21,226 12,702
Mwanza 1,063 37,017 20,018 23,340 16,022 14,276 335
Mara 749 34,118 16,494 24,208 18,545 17,912 5,611
Manyara 463 22,766 12,286 15,636 10,225 9,976 3,859
Njombe 257 13,106 7,597 11,153 7,852 5,241 3,551
Katavi 214 9,504 5,836 6,735 5,137 4,761 1,846
Simiyu 549 19,107 12,281 15,045 9,631 9,556 3,819
Geita 637 23,337 13,984 15,492 11,053 10,362 209
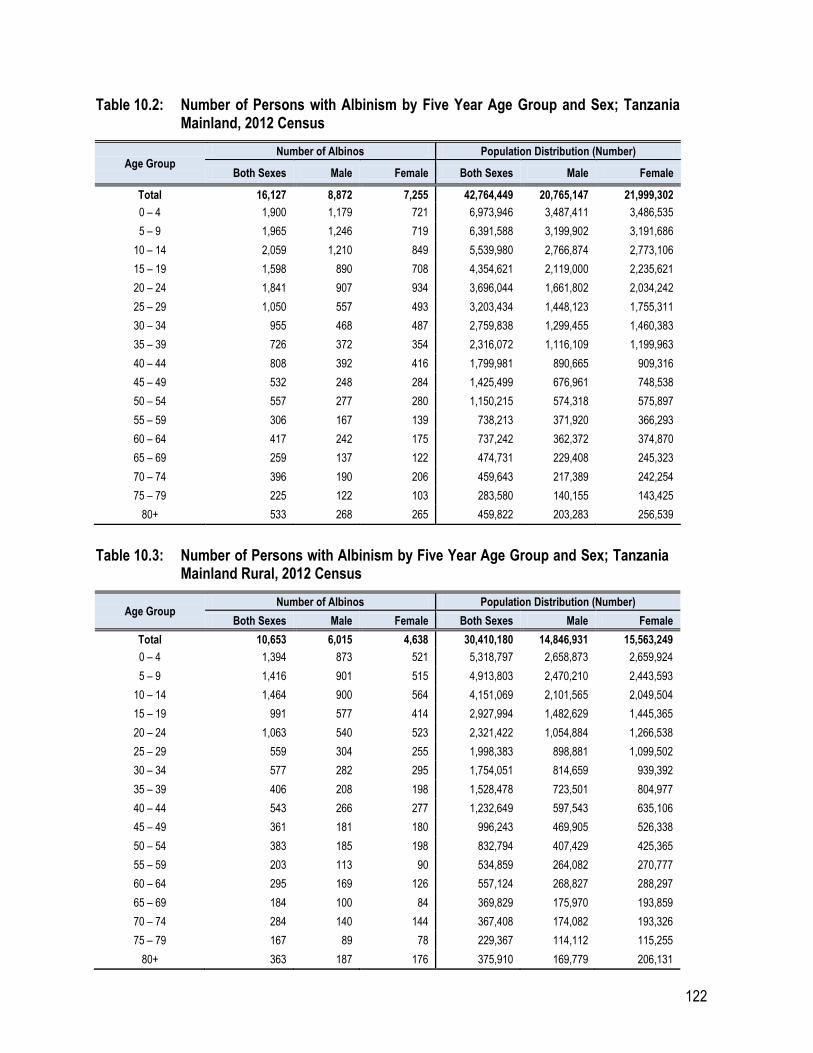
122
Table 10.2: Number of Persons with Albinism by Five Year Age Group and Sex; Tanzania Mainland, 2012 Census
Age Group Number of Albinos Population Distribution (Number)
Both Sexes Male Female Both Sexes Male Female
Total 16,127 8,872 7,255 42,764,449 20,765,147 21,999,302
0 – 4 1,900 1,179 721 6,973,946 3,487,411 3,486,535
5 – 9 1,965 1,246 719 6,391,588 3,199,902 3,191,686
10 – 14 2,059 1,210 849 5,539,980 2,766,874 2,773,106
15 – 19 1,598 890 708 4,354,621 2,119,000 2,235,621
20 – 24 1,841 907 934 3,696,044 1,661,802 2,034,242
25 – 29 1,050 557 493 3,203,434 1,448,123 1,755,311
30 – 34 955 468 487 2,759,838 1,299,455 1,460,383
35 – 39 726 372 354 2,316,072 1,116,109 1,199,963
40 – 44 808 392 416 1,799,981 890,665 909,316
45 – 49 532 248 284 1,425,499 676,961 748,538
50 – 54 557 277 280 1,150,215 574,318 575,897
55 – 59 306 167 139 738,213 371,920 366,293
60 – 64 417 242 175 737,242 362,372 374,870
65 – 69 259 137 122 474,731 229,408 245,323
70 – 74 396 190 206 459,643 217,389 242,254
75 – 79 225 122 103 283,580 140,155 143,425
80+ 533 268 265 459,822 203,283 256,539
Table 10.3: Number of Persons with Albinism by Five Year Age Group and Sex; Tanzania Mainland Rural, 2012 Census
Age Group Number of Albinos Population Distribution (Number)
Both Sexes Male Female Both Sexes Male Female
Total 10,653 6,015 4,638 30,410,180 14,846,931 15,563,249
0 – 4 1,394 873 521 5,318,797 2,658,873 2,659,924
5 – 9 1,416 901 515 4,913,803 2,470,210 2,443,593
10 – 14 1,464 900 564 4,151,069 2,101,565 2,049,504
15 – 19 991 577 414 2,927,994 1,482,629 1,445,365
20 – 24 1,063 540 523 2,321,422 1,054,884 1,266,538
25 – 29 559 304 255 1,998,383 898,881 1,099,502
30 – 34 577 282 295 1,754,051 814,659 939,392
35 – 39 406 208 198 1,528,478 723,501 804,977
40 – 44 543 266 277 1,232,649 597,543 635,106
45 – 49 361 181 180 996,243 469,905 526,338
50 – 54 383 185 198 832,794 407,429 425,365
55 – 59 203 113 90 534,859 264,082 270,777
60 – 64 295 169 126 557,124 268,827 288,297
65 – 69 184 100 84 369,829 175,970 193,859
70 – 74 284 140 144 367,408 174,082 193,326
75 – 79 167 89 78 229,367 114,112 115,255
80+ 363 187 176 375,910 169,779 206,131
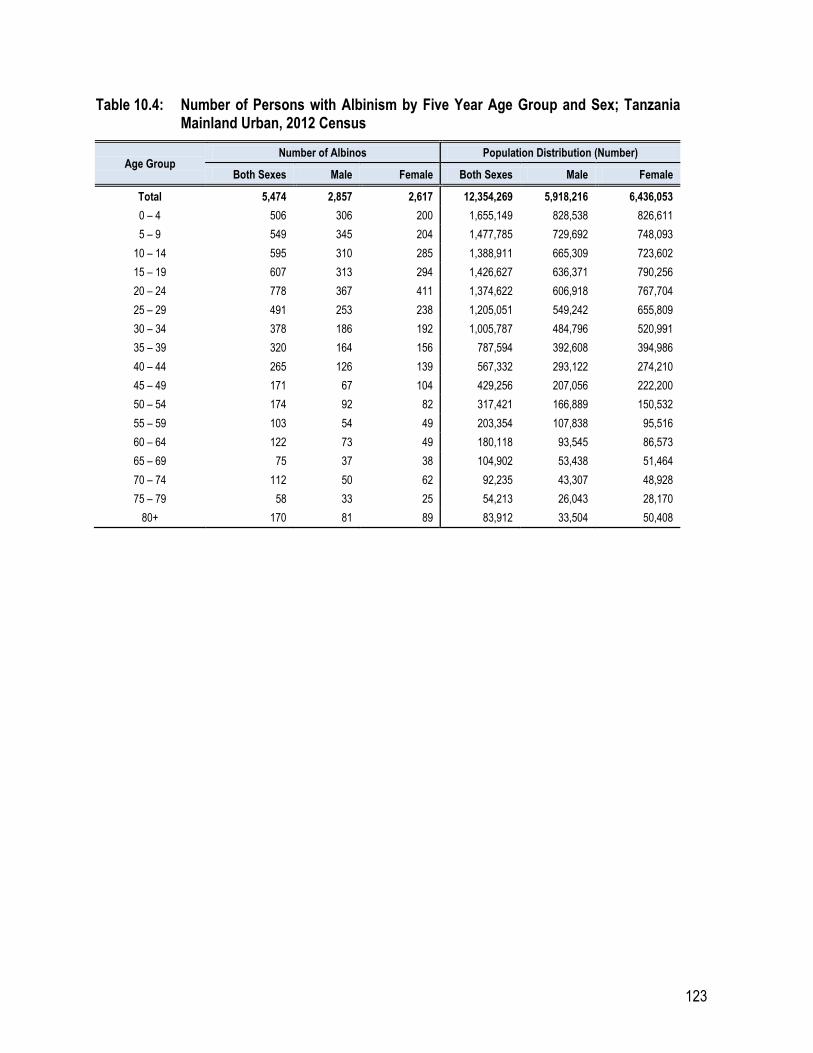
123
Table 10.4: Number of Persons with Albinism by Five Year Age Group and Sex; Tanzania Mainland Urban, 2012 Census
Age Group Number of Albinos Population Distribution (Number)
Both Sexes Male Female Both Sexes Male Female
Total 5,474 2,857 2,617 12,354,269 5,918,216 6,436,053
0 – 4 506 306 200 1,655,149 828,538 826,611
5 – 9 549 345 204 1,477,785 729,692 748,093
10 – 14 595 310 285 1,388,911 665,309 723,602
15 – 19 607 313 294 1,426,627 636,371 790,256
20 – 24 778 367 411 1,374,622 606,918 767,704
25 – 29 491 253 238 1,205,051 549,242 655,809
30 – 34 378 186 192 1,005,787 484,796 520,991
35 – 39 320 164 156 787,594 392,608 394,986
40 – 44 265 126 139 567,332 293,122 274,210
45 – 49 171 67 104 429,256 207,056 222,200
50 – 54 174 92 82 317,421 166,889 150,532
55 – 59 103 54 49 203,354 107,838 95,516
60 – 64 122 73 49 180,118 93,545 86,573
65 – 69 75 37 38 104,902 53,438 51,464
70 – 74 112 50 62 92,235 43,307 48,928
75 – 79 58 33 25 54,213 26,043 28,170
80+ 170 81 89 83,912 33,504 50,408
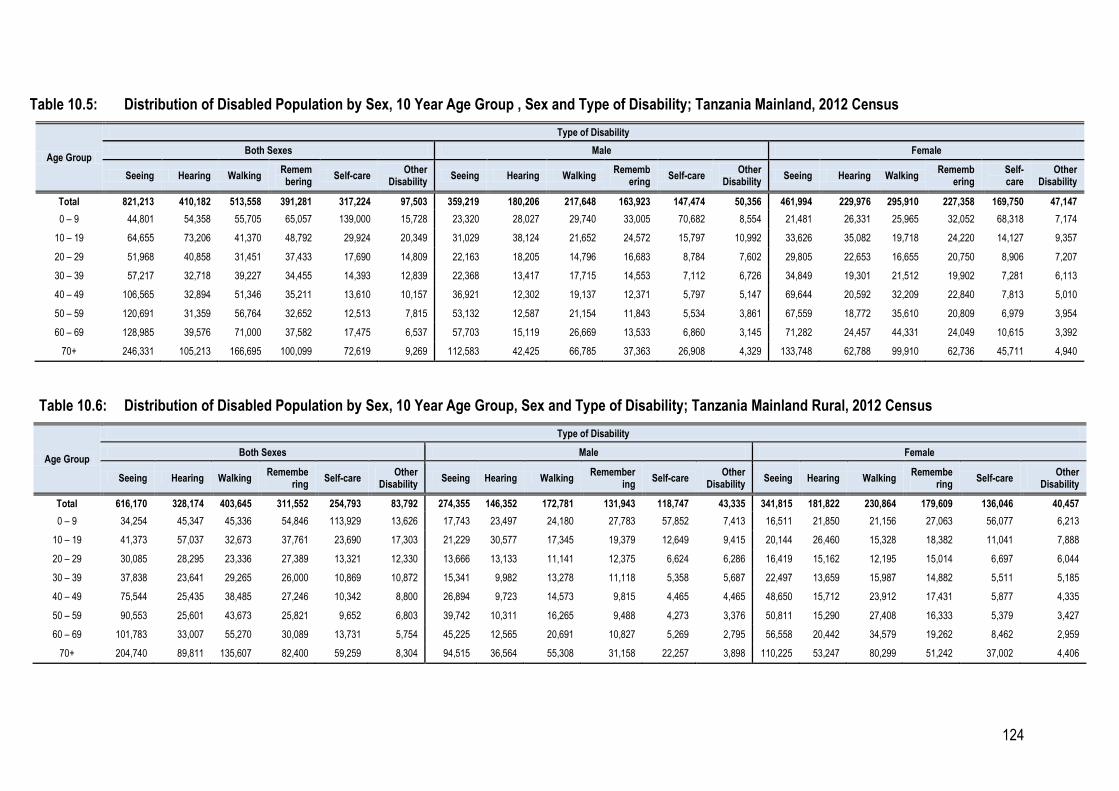
124
Table 10.5: Distribution of Disabled Population by Sex, 10 Year Age Group , Sex and Type of Disability; Tanzania Mainland, 2012 Census
Age Group
Type of Disability
Both Sexes Male Female
Seeing Hearing Walking Remembering
Self-care Other
Disability Seeing Hearing Walking
Remembering
Self-care Other
Disability Seeing Hearing Walking
Remembering
Self-care
Other Disability
Total 821,213 410,182 513,558 391,281 317,224 97,503 359,219 180,206 217,648 163,923 147,474 50,356 461,994 229,976 295,910 227,358 169,750 47,147
0 – 9 44,801 54,358 55,705 65,057 139,000 15,728 23,320 28,027 29,740 33,005 70,682 8,554 21,481 26,331 25,965 32,052 68,318 7,174
10 – 19 64,655 73,206 41,370 48,792 29,924 20,349 31,029 38,124 21,652 24,572 15,797 10,992 33,626 35,082 19,718 24,220 14,127 9,357
20 – 29 51,968 40,858 31,451 37,433 17,690 14,809 22,163 18,205 14,796 16,683 8,784 7,602 29,805 22,653 16,655 20,750 8,906 7,207
30 – 39 57,217 32,718 39,227 34,455 14,393 12,839 22,368 13,417 17,715 14,553 7,112 6,726 34,849 19,301 21,512 19,902 7,281 6,113
40 – 49 106,565 32,894 51,346 35,211 13,610 10,157 36,921 12,302 19,137 12,371 5,797 5,147 69,644 20,592 32,209 22,840 7,813 5,010
50 – 59 120,691 31,359 56,764 32,652 12,513 7,815 53,132 12,587 21,154 11,843 5,534 3,861 67,559 18,772 35,610 20,809 6,979 3,954
60 – 69 128,985 39,576 71,000 37,582 17,475 6,537 57,703 15,119 26,669 13,533 6,860 3,145 71,282 24,457 44,331 24,049 10,615 3,392
70+ 246,331 105,213 166,695 100,099 72,619 9,269 112,583 42,425 66,785 37,363 26,908 4,329 133,748 62,788 99,910 62,736 45,711 4,940
Table 10.6: Distribution of Disabled Population by Sex, 10 Year Age Group, Sex and Type of Disability; Tanzania Mainland Rural, 2012 Census
Age Group
Type of Disability
Both Sexes Male Female
Seeing Hearing Walking Remembe
ring Self-care
Other Disability
Seeing Hearing Walking Remember
ing Self-care
Other Disability
Seeing Hearing Walking Remembe
ring Self-care
Other Disability
Total 616,170 328,174 403,645 311,552 254,793 83,792 274,355 146,352 172,781 131,943 118,747 43,335 341,815 181,822 230,864 179,609 136,046 40,457
0 – 9 34,254 45,347 45,336 54,846 113,929 13,626 17,743 23,497 24,180 27,783 57,852 7,413 16,511 21,850 21,156 27,063 56,077 6,213
10 – 19 41,373 57,037 32,673 37,761 23,690 17,303 21,229 30,577 17,345 19,379 12,649 9,415 20,144 26,460 15,328 18,382 11,041 7,888
20 – 29 30,085 28,295 23,336 27,389 13,321 12,330 13,666 13,133 11,141 12,375 6,624 6,286 16,419 15,162 12,195 15,014 6,697 6,044
30 – 39 37,838 23,641 29,265 26,000 10,869 10,872 15,341 9,982 13,278 11,118 5,358 5,687 22,497 13,659 15,987 14,882 5,511 5,185
40 – 49 75,544 25,435 38,485 27,246 10,342 8,800 26,894 9,723 14,573 9,815 4,465 4,465 48,650 15,712 23,912 17,431 5,877 4,335
50 – 59 90,553 25,601 43,673 25,821 9,652 6,803 39,742 10,311 16,265 9,488 4,273 3,376 50,811 15,290 27,408 16,333 5,379 3,427
60 – 69 101,783 33,007 55,270 30,089 13,731 5,754 45,225 12,565 20,691 10,827 5,269 2,795 56,558 20,442 34,579 19,262 8,462 2,959
70+ 204,740 89,811 135,607 82,400 59,259 8,304 94,515 36,564 55,308 31,158 22,257 3,898 110,225 53,247 80,299 51,242 37,002 4,406

125
Table 10.7: Distribution of Disabled Population by 10 Year Age Group, Sex and Type of Disability; Tanzania Mainland Urban, 2012 Census
Age Group
Type of Disability
Both Sexes Male Female
Seeing Hearing Walking Remembering
Self-care
Other Disability
Seeing Hearing Walking Remembe
ring Self-care
Other Disability
Seeing Hearing Walking Remembe
ring Self-care
Other Disability
Total 205,043 82,008 109,913 79,729 62,431 13,711 84,864 33,854 44,867 31,980 28,727 7,021 120,179 48,154 65,046 47,749 33,704 6,690
0 – 9 10,547 9,011 10,369 10,211 25,071 2,102 5,577 4,530 5,560 5,222 12,830 1,141 4,970 4,481 4,809 4,989 12,241 961
10 – 19 23,282 16,169 8,697 11,031 6,234 3,046 9,800 7,547 4,307 5,193 3,148 1,577 13,482 8,622 4,390 5,838 3,086 1,469
20 – 29 21,883 12,563 8,115 10,044 4,369 2,479 8,497 5,072 3,655 4,308 2,160 1,316 13,386 7,491 4,460 5,736 2,209 1,163
30 – 39 19,379 9,077 9,962 8,455 3,524 1,967 7,027 3,435 4,437 3,435 1,754 1,039 12,352 5,642 5,525 5,020 1,770 928
40 – 49 31,021 7,459 12,861 7,965 3,268 1,357 10,027 2,579 4,564 2,556 1,332 682 20,994 4,880 8,297 5,409 1,936 675
50 – 59 30,138 5,758 13,091 6,831 2,861 1,012 13,390 2,276 4,889 2,355 1,261 485 16,748 3,482 8,202 4,476 1,600 527
60 – 69 27,202 6,569 15,730 7,493 3,744 783 12,478 2,554 5,978 2,706 1,591 350 14,724 4,015 9,752 4,787 2,153 433
70+ 41,591 15,402 31,088 17,699 13,360 965 18,068 5,861 11,477 6,205 4,651 431 23,523 9,541 19,611 11,494 8,709 534
Table 10.8: Population by Type of Disability, Sex and Level of Difficulty; Tanzania Mainland, 2012 Census
Type of Disability
Level of Difficulty
Both Sexes Male Female
No Difficulty
Some Difficulty
A lot of Difficulty
Unable Not
Applicable No
Difficulty Some
Difficulty A lot of
Difficulty Unable
Not Applicable
No Difficulty
Some Difficulty
A lot of Difficulty
Unable Not
Applicable
Seeing 41,943,236 669,348 119,579 32,286 - 20,405,928 290,976 53,426 14,817 - 21,537,308 378,372 66,153 17,469 -
Hearing 42,354,267 309,070 69,594 31,518 - 20,584,941 133,727 31,416 15,063 - 21,769,326 175,343 38,178 16,455 -
Walking 42,250,891 348,344 114,740 50,474 - 20,547,499 142,891 50,935 23,822 - 21,703,392 205,453 63,805 26,652 -
Remembering 42,373,168 273,599 75,526 42,156 - 20,601,224 110,944 32,697 20,282 - 21,771,944 162,655 42,829 21,874 -
Self-care 40,640,440 137,995 53,316 125,913 1,806,785 19,715,207 61,886 24,876 60,712 902,466 20,925,233 76,109 28,440 65,201 904,319

126
Table 10.9: Population by Type of Disability, Sex and Level of Difficulty; Tanzania Mainland Rural, 2012 Census
Type of Disability
Level of Difficulty
Both Sexes Male Female
No Difficulty
Some Difficulty
A lot of Difficulty
Unable Not
Applicable No Difficulty
Some Difficulty
A lot of Difficulty
Unable Not
Applicable No Difficulty
Some Difficulty
A lot of Difficulty
Unable Not
Applicable
Seeing 29,794,010 498,491 91,630 26,049 - 14,572,576 220,617 41,846 11,892 - 15,221,434 277,874 49,784 14,157 -
Hearing 30,082,006 247,116 55,793 25,265 - 14,700,579 108,572 25,629 12,151 - 15,381,427 138,544 30,164 13,114 -
Walking 30,006,535 275,794 89,008 38,843 - 14,674,150 114,342 40,071 18,368 - 15,332,385 161,452 48,937 20,475 -
Remembering 30,098,628 217,219 59,592 34,741 - 14,714,988 89,176 26,059 16,708 - 15,383,640 128,043 33,533 18,033 -
Self-care 28,782,253 112,230 42,560 100,003 1,373,134 14,043,091 50,474 19,921 48,352 685,093 14,739,162 61,756 22,639 51,651 688,041
Table 10.10: Population by Type of Disability, Sex and Level of Difficulty; Tanzania Mainland Urban 2012 Census
Type of Disability
Level of Difficulty
Both Sexes Male Female
No Difficulty
Some Difficulty
A lot of Difficulty
Unable Not
Applicable No
Difficulty Some
Difficulty A lot of
Difficulty Unable
Not Applicable
No Difficulty
Some Difficulty
A lot of Difficulty
Unable Not
Applicable
Seeing 12,149,226 170,857 27,949 6,237 - 5,833,352 70,359 11,580 2,925 - 6,315,874 100,498 16,369 3,312 -
Hearing 12,272,261 61,954 13,801 6,253 - 5,884,362 25,155 5,787 2,912 - 6,387,899 36,799 8,014 3,341 -
Walking 12,244,356 72,550 25,732 11,631 - 5,873,349 28,549 10,864 5,454 - 6,371,007 44,001 14,868 6,177 -
Remembering 12,274,540 56,380 15,934 7,415 - 5,886,236 21,768 6,638 3,574 - 6,388,304 34,612 9,296 3,841 -
Self-care 11,858,187 25,765 10,756 25,910 433,651 5,672,116 11,412 4,955 12,360 217,373 6,186,071 14,353 5,801 13,550 216,278

127
Chapter Eleven
Housing Conditions; Household Assets and Amenities
The tables show the distribution of private households by region, availability of
amenities, rural and urban areas.

128
Table 11.1: Number of Households in Rural and Urban Areas by Ownership Status of the Main Dwelling; Tanzania Mainland, 2012 Census
Total
Households Owned by
Household
Living without Paying any
Rent
Rented Privately
Rented by Employer
Rented by Government
at Subsidized Rent
Owned by Employer
(Free)
Owned by Employer
(Rent)
Total 9,026,785 6,709,672 380,378 1,678,601 71,893 74,787 88,588 22,866
Rural 6,054,641 5,314,935 241,179 383,066 27,417 23,330 54,590 10,125
Urban 2,972,144 1,394,737 139,200 1,295,536 44,477 51,456 33,998 12,741
Table 11.2: Number of Households by Tenure Status of the Main Dwelling and Age; Tanzania Mainland, 2012 Census
Age of Head of
Household
Total Households
Owned by Household
Living without Paying any
Rent
Rented Privately
Rented by
Employer
Rented by Government at
Subsidized Rent
Owned by Employer
(Free)
Owned by Employer
(Rent)
Total 9,026,785 6,709,672 380,378 1,678,601 71,893 74,787 88,588 22,866
<15 24,813 17,697 1,416 4,824 231 266 298 81
15 – 19 137,707 78,272 10,470 42,840 1,847 1,912 1,846 520
20 – 24 613,329 322,355 40,562 221,820 8,371 9,893 7,988 2,340
25 – 29 1,110,199 617,822 59,444 382,999 14,181 16,536 14,934 4,283
30 – 34 1,262,973 807,197 57,915 352,683 12,753 14,638 14,132 3,654
35 – 39 1,206,079 866,248 50,530 253,274 9,770 10,697 12,336 3,224
40 – 44 1,024,369 799,192 39,732 158,192 7,502 7,168 10,058 2,525
45 – 49 924,671 760,457 33,088 108,368 6,318 5,354 9,100 1,986
50 – 54 705,325 600,903 24,940 62,069 4,640 3,427 7,633 1,715
55 – 59 468,210 407,964 15,729 33,679 3,085 2,077 4,566 1,110
60 – 64 480,835 433,856 14,848 26,464 1,524 1,198 2,369 577
65+ 1,068,274 997,709 31,704 31,390 1,672 1,620 3,328 851
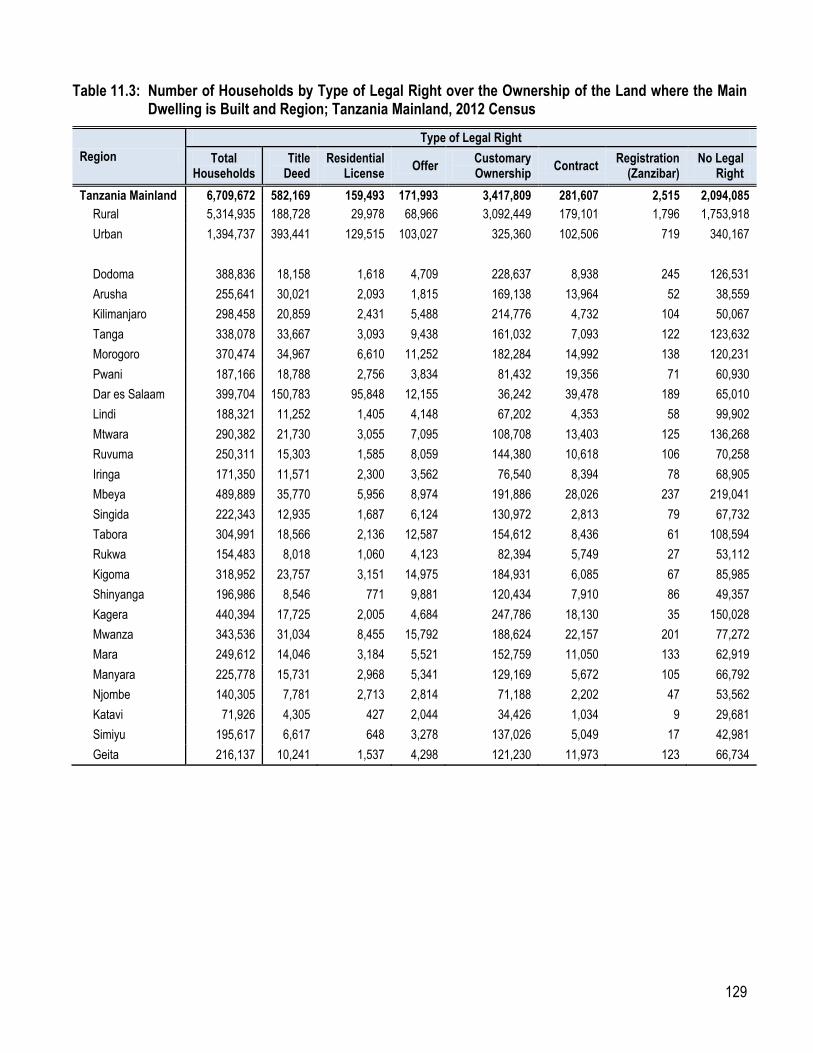
129
Table 11.3: Number of Households by Type of Legal Right over the Ownership of the Land where the Main Dwelling is Built and Region; Tanzania Mainland, 2012 Census
Region
Type of Legal Right
Total Households
Title Deed
Residential License
Offer Customary Ownership
Contract Registration
(Zanzibar) No Legal
Right
Tanzania Mainland 6,709,672 582,169 159,493 171,993 3,417,809 281,607 2,515 2,094,085
Rural 5,314,935 188,728 29,978 68,966 3,092,449 179,101 1,796 1,753,918
Urban 1,394,737 393,441 129,515 103,027 325,360 102,506 719 340,167
Dodoma 388,836 18,158 1,618 4,709 228,637 8,938 245 126,531
Arusha 255,641 30,021 2,093 1,815 169,138 13,964 52 38,559
Kilimanjaro 298,458 20,859 2,431 5,488 214,776 4,732 104 50,067
Tanga 338,078 33,667 3,093 9,438 161,032 7,093 122 123,632
Morogoro 370,474 34,967 6,610 11,252 182,284 14,992 138 120,231
Pwani 187,166 18,788 2,756 3,834 81,432 19,356 71 60,930
Dar es Salaam 399,704 150,783 95,848 12,155 36,242 39,478 189 65,010
Lindi 188,321 11,252 1,405 4,148 67,202 4,353 58 99,902
Mtwara 290,382 21,730 3,055 7,095 108,708 13,403 125 136,268
Ruvuma 250,311 15,303 1,585 8,059 144,380 10,618 106 70,258
Iringa 171,350 11,571 2,300 3,562 76,540 8,394 78 68,905
Mbeya 489,889 35,770 5,956 8,974 191,886 28,026 237 219,041
Singida 222,343 12,935 1,687 6,124 130,972 2,813 79 67,732
Tabora 304,991 18,566 2,136 12,587 154,612 8,436 61 108,594
Rukwa 154,483 8,018 1,060 4,123 82,394 5,749 27 53,112
Kigoma 318,952 23,757 3,151 14,975 184,931 6,085 67 85,985
Shinyanga 196,986 8,546 771 9,881 120,434 7,910 86 49,357
Kagera 440,394 17,725 2,005 4,684 247,786 18,130 35 150,028
Mwanza 343,536 31,034 8,455 15,792 188,624 22,157 201 77,272
Mara 249,612 14,046 3,184 5,521 152,759 11,050 133 62,919
Manyara 225,778 15,731 2,968 5,341 129,169 5,672 105 66,792
Njombe 140,305 7,781 2,713 2,814 71,188 2,202 47 53,562
Katavi 71,926 4,305 427 2,044 34,426 1,034 9 29,681
Simiyu 195,617 6,617 648 3,278 137,026 5,049 17 42,981
Geita 216,137 10,241 1,537 4,298 121,230 11,973 123 66,734

130
Table 11.4: Number of Households by Region and Type of Materials Used for Roofing; Tanzania Mainland, 2012 Census
Region Total
Households
Roofing Material of Main Dwelling Unit
Iron Sheets
Tiles Concrete Asbestos Grass/
Leaves Mud and
Leaves Plastics/
Box Tent
Tanzania Mainland 9,026,785 5,872,877 36,062 20,676 22,824 2,315,153 728,000 20,047 11,146
Rural 6,054,641 3,165,243 12,429 1,700 14,560 2,136,641 699,467 17,011 7,590
Urban 2,972,144 2,707,634 23,633 18,976 8,264 178,512 28,533 3,035 3,556
Dodoma 450,305 282,593 608 356 859 21,978 142,618 761 531
Arusha 376,336 277,261 1,737 392 721 65,603 29,400 891 330
Kilimanjaro 381,526 350,126 1,312 529 616 21,551 5,336 1,717 339
Tanga 435,583 257,889 6,666 490 1,448 134,297 25,235 9,248 310
Morogoro 501,794 319,243 1,365 119 1,919 154,751 23,220 796 381
Pwani 254,810 147,656 335 118 912 92,069 13,109 244 367
Dar es Salaam 1,083,381 1,041,123 12,855 15,813 3,292 5,649 1,512 311 2,825
Lindi 224,316 74,159 197 87 666 139,381 9,435 293 99
Mtwara 342,165 128,674 674 221 1,307 202,219 8,426 503 141
Ruvuma 300,005 170,106 375 56 1,030 120,391 7,718 225 103
Iringa 220,776 150,498 1,414 80 542 54,277 12,865 372 728
Mbeya 630,593 456,051 596 240 1,358 156,870 14,464 326 687
Singida 255,613 113,118 239 43 152 12,018 129,342 367 333
Tabora 379,770 139,427 558 56 809 185,213 53,323 191 193
Rukwa 198,011 87,991 352 14 520 102,684 6,151 51 248
Kigoma 370,374 195,735 1,490 19 742 151,143 20,963 93 189
Shinyanga 258,981 130,032 1,485 732 696 71,970 53,712 203 151
Kagera 521,028 376,179 703 86 596 124,254 17,939 622 649
Mwanza 481,107 338,543 1,088 614 1,390 121,888 15,708 990 885
Mara 308,483 178,979 496 234 1,076 105,836 20,869 673 320
Manyara 271,050 143,026 908 140 681 77,105 47,952 443 796
Njombe 168,982 132,392 241 41 318 33,615 2,205 126 45
Katavi 100,350 39,382 33 4 272 54,904 5,540 65 150
Simiyu 227,862 155,443 171 37 216 23,080 48,684 122 109
Geita 283,584 187,251 162 155 685 82,408 12,273 412 239
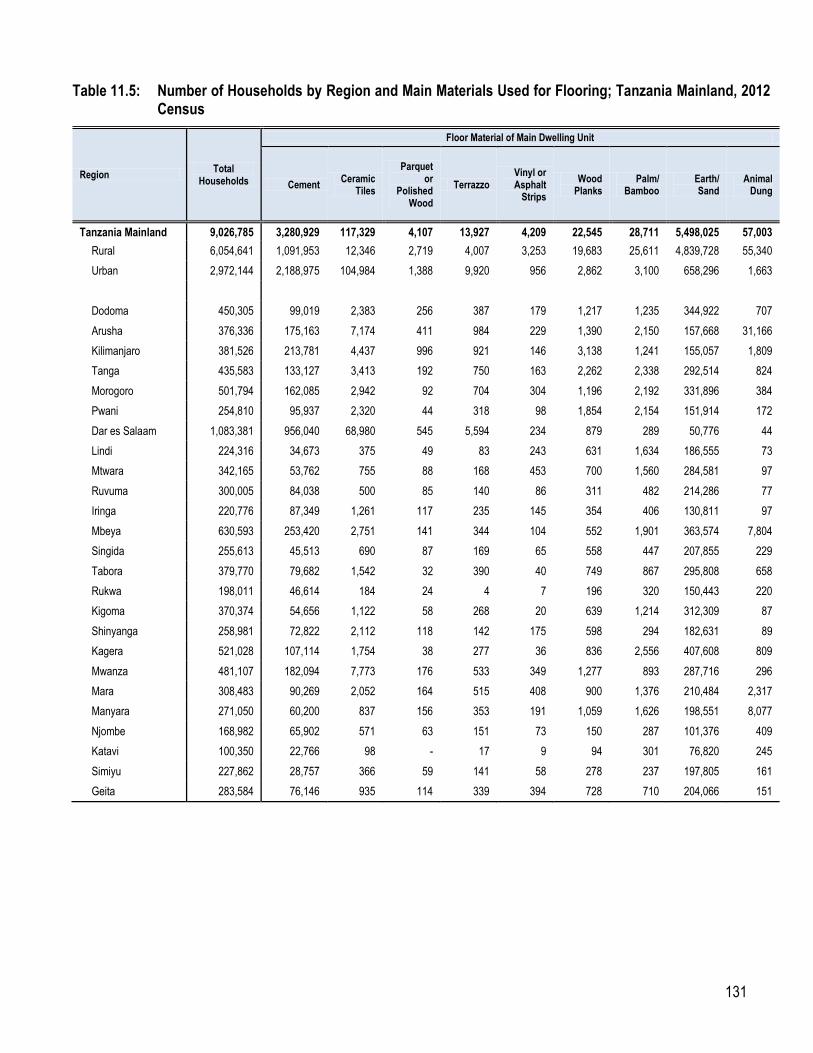
131
Table 11.5: Number of Households by Region and Main Materials Used for Flooring; Tanzania Mainland, 2012 Census
Region Total
Households
Floor Material of Main Dwelling Unit
Cement Ceramic
Tiles
Parquet or
Polished Wood
Terrazzo Vinyl or Asphalt
Strips
Wood Planks
Palm/ Bamboo
Earth/ Sand
Animal Dung
Tanzania Mainland 9,026,785 3,280,929 117,329 4,107 13,927 4,209 22,545 28,711 5,498,025 57,003
Rural 6,054,641 1,091,953 12,346 2,719 4,007 3,253 19,683 25,611 4,839,728 55,340
Urban 2,972,144 2,188,975 104,984 1,388 9,920 956 2,862 3,100 658,296 1,663
Dodoma 450,305 99,019 2,383 256 387 179 1,217 1,235 344,922 707
Arusha 376,336 175,163 7,174 411 984 229 1,390 2,150 157,668 31,166
Kilimanjaro 381,526 213,781 4,437 996 921 146 3,138 1,241 155,057 1,809
Tanga 435,583 133,127 3,413 192 750 163 2,262 2,338 292,514 824
Morogoro 501,794 162,085 2,942 92 704 304 1,196 2,192 331,896 384
Pwani 254,810 95,937 2,320 44 318 98 1,854 2,154 151,914 172
Dar es Salaam 1,083,381 956,040 68,980 545 5,594 234 879 289 50,776 44
Lindi 224,316 34,673 375 49 83 243 631 1,634 186,555 73
Mtwara 342,165 53,762 755 88 168 453 700 1,560 284,581 97
Ruvuma 300,005 84,038 500 85 140 86 311 482 214,286 77
Iringa 220,776 87,349 1,261 117 235 145 354 406 130,811 97
Mbeya 630,593 253,420 2,751 141 344 104 552 1,901 363,574 7,804
Singida 255,613 45,513 690 87 169 65 558 447 207,855 229
Tabora 379,770 79,682 1,542 32 390 40 749 867 295,808 658
Rukwa 198,011 46,614 184 24 4 7 196 320 150,443 220
Kigoma 370,374 54,656 1,122 58 268 20 639 1,214 312,309 87
Shinyanga 258,981 72,822 2,112 118 142 175 598 294 182,631 89
Kagera 521,028 107,114 1,754 38 277 36 836 2,556 407,608 809
Mwanza 481,107 182,094 7,773 176 533 349 1,277 893 287,716 296
Mara 308,483 90,269 2,052 164 515 408 900 1,376 210,484 2,317
Manyara 271,050 60,200 837 156 353 191 1,059 1,626 198,551 8,077
Njombe 168,982 65,902 571 63 151 73 150 287 101,376 409
Katavi 100,350 22,766 98 - 17 9 94 301 76,820 245
Simiyu 227,862 28,757 366 59 141 58 278 237 197,805 161
Geita 283,584 76,146 935 114 339 394 728 710 204,066 151

132
Table 11.6: Number of Households by Region and Type of Wall Materials Used; Tanzania Mainland, 2012 Census
Region Total
Households
Wall Material of Main Dwelling Unit
Stones Cement
Bricks Sundried
Bricks Baked Bricks
Timber Timber
and Iron Sheets
Poles and Mud
Grass Tent
Tanzania Mainland 9,026,785 55,557 1,743,695 2,434,368 2,441,336 54,604 23,955 2,117,593 147,227 8,451
Rural 6,054,641 24,011 231,598 1,994,728 1,697,974 45,949 17,742 1,900,179 137,362 5,097
Urban 2,972,144 31,545 1,512,097 439,640 743,362 8,655 6,212 217,414 9,864 3,354
Dodoma 450,305 1,848 39,950 204,437 99,795 273 883 97,781 5,085 254
Arusha 376,336 3,694 117,558 29,212 54,104 10,097 2,215 149,635 9,419 402
Kilimanjaro 381,526 8,030 127,750 44,938 85,214 33,275 3,245 76,522 2,341 211
Tanga 435,583 4,146 64,807 41,574 63,882 561 1,389 252,025 7,001 198
Morogoro 501,794 1,604 36,251 65,197 241,691 569 857 145,636 9,720 269
Pwani 254,810 2,003 70,343 8,356 5,753 171 942 156,674 10,289 279
Dar es Salaam 1,083,381 12,121 1,029,624 10,776 2,991 767 2,702 20,751 812 2,836
Lindi 224,316 3,274 11,103 33,589 35,171 264 408 132,799 7,642 68
Mtwara 342,165 1,629 21,692 120,775 47,753 185 552 143,446 6,027 105
Ruvuma 300,005 516 3,069 39,605 231,472 268 275 21,512 3,242 47
Iringa 220,776 734 4,434 56,414 81,568 314 324 74,498 2,056 434
Mbeya 630,593 762 14,854 227,286 335,320 471 644 44,685 6,060 512
Singida 255,613 585 13,282 166,034 36,410 65 330 35,868 2,842 198
Tabora 379,770 417 20,716 211,413 57,052 111 413 81,061 8,422 166
Rukwa 198,011 82 1,106 45,425 143,112 48 86 4,341 3,669 143
Kigoma 370,374 386 6,425 93,143 191,416 254 289 70,892 7,478 92
Shinyanga 258,981 755 26,358 186,241 31,382 128 286 10,854 2,895 82
Kagera 521,028 1,878 8,836 81,146 125,343 1,686 3,214 282,250 16,263 413
Mwanza 481,107 4,452 84,185 260,566 92,828 3,101 1,854 26,899 6,768 454
Mara 308,483 2,775 14,903 85,732 108,293 469 982 87,570 7,467 293
Manyara 271,050 1,335 7,511 37,138 77,232 685 1,085 135,775 9,689 600
Njombe 168,982 636 1,508 33,932 122,967 246 114 8,727 833 19
Katavi 100,350 93 1,270 26,039 53,346 69 38 15,403 4,002 91
Simiyu 227,862 336 11,077 186,210 23,389 71 331 4,390 1,974 85
Geita 283,584 1,467 5,084 139,193 93,853 456 496 37,601 5,231 203

133
Table 11.7: Number of Households by Number of Rooms for Sleeping and Region; Tanzania Mainland, 2012 Census
Region Total
Households
Number of Rooms for Sleeping
1 2 3 4 5
Tanzania Mainland 9,026,785 2,599,330 3,012,984 1,961,290 865,189 587,993
Male headed households 6,005,826 1,670,903 1,976,759 1,344,014 601,090 413,061
Female headed households 3,020,959 928,428 1,036,225 617,275 264,099 174,932
Rural 6,054,641 1,338,359 2,297,022 1,446,099 600,487 372,674
Urban 2,972,144 1,174,482 773,178 546,440 268,206 209,838
Dodoma 450,305 110,805 181,366 102,823 35,266 20,045
Arusha 376,336 119,023 147,160 73,339 25,185 11,629
Kilimanjaro 381,526 74,585 123,228 99,759 51,355 32,598
Tanga 435,583 132,397 153,756 92,365 35,307 21,757
Morogoro 501,794 146,955 181,190 97,852 46,916 28,882
Pwani 254,810 59,192 88,942 62,511 30,189 13,976
Dar es Salaam 1,083,381 541,246 222,299 165,862 80,123 73,851
Lindi 224,316 41,111 90,432 69,445 15,161 8,167
Mtwara 342,165 56,914 142,139 112,888 19,273 10,951
Ruvuma 300,005 41,804 77,677 101,253 48,581 30,690
Iringa 220,776 47,815 72,326 56,057 26,019 18,559
Mbeya 630,593 218,689 214,804 112,249 51,561 33,290
Singida 255,613 57,634 102,502 60,000 21,588 13,889
Tabora 379,770 87,534 147,549 72,659 39,230 32,796
Rukwa 198,011 65,091 79,925 32,692 12,054 8,250
Kigoma 370,374 58,960 133,126 101,587 47,708 28,994
Shinyanga 258,981 58,843 95,128 55,482 27,070 22,458
Kagera 521,028 107,465 163,400 142,430 73,000 34,734
Mwanza 481,107 133,313 169,250 98,718 46,026 33,799
Mara 308,483 100,258 103,319 58,055 26,773 20,078
Manyara 271,050 70,868 120,299 49,592 20,064 10,228
Njombe 168,982 22,812 49,012 50,440 27,179 19,538
Katavi 100,350 38,942 32,934 15,471 6,992 6,011
Simiyu 227,862 40,172 78,702 53,937 29,209 25,842
Geita 283,584 80,413 99,735 55,071 26,865 21,500

134
Table 11.8: Number of Households by Region and Main Source of Drinking Water; Tanzania Mainland, 2012 Census
Region Total
Households
Main Source of Drinking Water
Piped Water into dwelling
Piped Water to yard/plot
Public tap/ standpipe
Tube well/ borehole
Protected dug well
Unprotected dug well
Protected Spring
Tanzania Mainland 9,026,785 1,005,330 691,707 1,535,006 720,663 689,114 1,740,021 202,586
Male headed households 6,005,826 651,664 449,880 991,515 480,730 459,171 1,200,863 133,045
Female headed households 3,020,959 353,666 241,827 543,491 239,934 229,943 539,157 69,541
Rural 6,054,641 346,000 189,311 975,833 422,699 425,881 1,527,451 166,696
Urban 2,972,144 659,330 502,395 559,173 297,964 263,233 212,570 35,890
Dodoma 450,305 46,716 27,350 121,111 25,708 17,452 138,277 2,489
Arusha 376,336 72,020 62,272 133,631 4,993 14,142 10,867 6,127
Kilimanjaro 381,526 121,012 82,385 94,536 6,279 5,441 5,223 5,559
Tanga 435,583 52,247 38,399 75,708 14,937 24,302 90,138 4,653
Morogoro 501,794 58,800 38,152 105,569 75,807 38,774 77,874 2,130
Pwani 254,810 24,931 19,801 36,747 16,058 27,595 88,425 1,063
Dar es Salaam 1,083,381 218,019 139,834 203,878 205,016 82,715 45,274 2,900
Lindi 224,316 14,149 5,855 22,988 12,352 17,036 102,558 1,877
Mtwara 342,165 25,722 8,404 62,036 6,269 11,327 71,782 2,912
Ruvuma 300,005 36,114 28,104 53,410 25,950 28,908 50,109 10,190
Iringa 220,776 18,283 17,036 50,682 11,432 17,965 28,792 3,562
Mbeya 630,593 97,518 65,859 104,467 20,422 46,371 92,956 12,796
Singida 255,613 11,688 4,299 35,316 23,675 18,246 87,640 1,210
Tabora 379,770 9,377 7,868 14,699 17,136 44,404 221,646 1,273
Rukwa 198,011 12,398 3,480 25,177 21,599 13,661 44,212 6,426
Kigoma 370,374 29,116 17,751 74,143 18,672 30,789 39,153 51,691
Shinyanga 258,981 19,608 18,899 22,361 14,113 29,140 65,018 979
Kagera 521,028 14,375 13,577 62,726 27,369 26,581 51,834 55,259
Mwanza 481,107 50,987 46,430 58,511 55,652 50,941 109,478 8,844
Mara 308,483 16,776 11,311 16,425 15,188 24,381 72,845 6,278
Manyara 271,050 19,754 14,253 66,485 16,953 11,665 48,153 3,147
Njombe 168,982 22,049 15,294 48,042 1,413 9,919 18,699 5,579
Katavi 100,350 1,657 860 9,038 22,478 7,295 30,662 891
Simiyu 227,862 7,671 3,484 20,256 41,548 40,200 39,725 449
Geita 283,584 4,342 751 17,063 19,644 49,864 108,680 4,305

135
Continue... Table 11.8: Number of Households by Region and Main Source of Drinking Water; Tanzania Mainland, 2012 Census
Region Total
Households
Main Source of Drinking Water
Unprotected Spring
Rain water collection
Bottled water Cart with small tank/drum Tanker truck Surface water (river,
dam lake etc.)
Tanzania Mainland 9,026,785 935,153 110,155 26,561 234,308 126,685 1,009,496
Male headed households 6,005,826 629,165 70,580 19,029 154,554 84,856 680,773
Female headed households 3,020,959 305,988 39,575 7,531 79,754 41,829 328,723
Rural 6,054,641 864,636 89,678 7,421 89,201 25,872 923,960
Urban 2,972,144 70,517 20,477 19,140 145,107 100,812 85,536
Dodoma 450,305 21,270 1,403 1,019 23,073 1,400 23,038
Arusha 376,336 24,806 1,183 859 10,094 1,121 34,221
Kilimanjaro 381,526 33,271 1,701 482 5,298 770 19,570
Tanga 435,583 58,305 3,738 640 5,681 8,048 58,787
Morogoro 501,794 37,579 544 659 6,464 3,079 56,363
Pwani 254,810 8,614 1,732 327 2,945 2,584 23,987
Dar es Salaam 1,083,381 2,478 856 13,528 76,069 91,500 1,314
Lindi 224,316 16,404 4,253 441 2,924 1,163 22,317
Mtwara 342,165 24,833 68,405 962 6,548 797 52,169
Ruvuma 300,005 43,702 127 179 125 93 22,992
Iringa 220,776 36,265 146 316 5,094 222 30,980
Mbeya 630,593 94,215 577 673 4,957 459 89,323
Singida 255,613 30,282 835 263 3,457 259 38,442
Tabora 379,770 17,256 520 338 10,683 227 34,344
Rukwa 198,011 36,344 45 168 710 185 33,605
Kigoma 370,374 39,995 263 194 6,026 540 62,040
Shinyanga 258,981 16,188 787 501 16,575 562 54,250
Kagera 521,028 158,327 10,928 896 2,027 327 96,803
Mwanza 481,107 47,075 1,270 936 4,710 559 45,714
Mara 308,483 58,744 8,719 1,046 2,160 973 73,637
Manyara 271,050 29,520 864 950 14,501 10,873 33,933
Njombe 168,982 33,531 152 154 116 155 13,879
Katavi 100,350 7,303 17 95 2,769 119 17,166
Simiyu 227,862 10,731 412 212 2,651 350 60,173
Geita 283,584 48,116 677 722 18,648 321 10,450

136
Table 11.9: Number of Households by Region and Main Source of Energy for Lighting; Tanzania Mainland, 2012 Census
Region Total
Households
Main Source of Energy for Lighting
Electricity (TANESCO/
ZECO)
Solar Energy
Generator (Private Source)
Gas (Industrial)
Gas (Biogas)
Electricity (Wind)
Tanzania Mainland 9,026,785 1,702,212 130,766 30,207 1,416 2,426 3,781
Male headed households 6,005,826 1,121,159 98,374 22,939 1,033 1,790 2,543
Female headed households 3,020,959 581,053 32,392 7,268 383 636 1,238
Rural 6,054,641 328,045 102,079 18,295 655 1,565 2,649
Urban 2,972,144 1,374,166 28,687 11,912 761 861 1,132
Dodoma 450,305 46,468 7,478 627 66 167 368
Arusha 376,336 92,374 14,670 1,323 117 207 352
Kilimanjaro 381,526 101,733 13,270 840 64 110 316
Tanga 435,583 66,598 3,351 895 50 185 152
Morogoro 501,794 71,117 4,261 3,254 153 104 157
Pwani 254,810 38,213 4,181 1,228 19 125 84
Dar es Salaam 1,083,381 687,007 7,654 2,348 176 194 101
Lindi 224,316 27,840 2,331 335 93 63 161
Mtwara 342,165 20,225 4,646 453 94 76 132
Ruvuma 300,005 25,933 5,682 1,444 29 41 85
Iringa 220,776 34,468 3,619 723 21 53 131
Mbeya 630,593 84,092 6,212 1,966 41 119 80
Singida 255,613 25,738 3,694 479 11 49 62
Tabora 379,770 39,594 7,085 850 15 37 89
Rukwa 198,011 10,744 2,519 585 3 21 14
Kigoma 370,374 25,381 4,725 1,807 52 28 37
Shinyanga 258,981 32,634 3,867 780 46 159 126
Kagera 521,028 38,286 6,504 1,771 45 8 55
Mwanza 481,107 109,064 4,947 1,315 71 131 187
Mara 308,483 34,185 4,125 719 74 173 276
Manyara 271,050 28,040 3,912 547 101 93 262
Njombe 168,982 18,550 4,984 1,419 26 74 117
Katavi 100,350 9,373 2,217 288 6 7 6
Simiyu 227,862 17,346 2,908 162 23 17 43
Geita 283,584 17,207 1,924 4,051 21 185 387

137
Continue…Table 11.9: Number of Households by Region and Main Source of Energy for Lighting; Tanzania Mainland, 2012 Census
Region Total
Households
Main Source of Energy for Lighting
Acetylene Lamp
Kerosene (lantern/
Chimney)
Kerosene (Wick
Lamps) Candles Firewood
Torch/ Rechargeable
Lamps
Tanzania Mainland 9,026,785 239,321 1,603,788 3,666,483 120,975 180,167 1,345,243
Male headed households 6,005,826 156,438 1,072,061 2,385,295 81,833 108,211 954,152
Female headed households 3,020,959 82,884 531,727 1,281,188 39,143 71,956 391,092
Rural 6,054,641 169,799 927,879 3,070,373 58,444 171,219 1,203,639
Urban 2,972,144 69,522 675,909 596,110 62,531 8,948 141,604
Dodoma 450,305 8,914 65,763 174,340 3,302 14,418 128,393
Arusha 376,336 9,189 124,685 88,432 3,966 16,137 24,886
Kilimanjaro 381,526 12,191 117,775 121,143 2,772 2,203 9,111
Tanga 435,583 15,649 48,339 273,883 3,549 3,879 19,053
Morogoro 501,794 13,117 94,876 230,296 4,881 5,575 74,005
Pwani 254,810 8,180 28,619 151,679 2,733 2,150 17,601
Dar es Salaam 1,083,381 24,349 184,532 102,721 31,560 789 41,951
Lindi 224,316 5,359 18,978 128,779 1,733 6,077 32,567
Mtwara 342,165 12,282 35,269 185,793 2,853 11,543 68,800
Ruvuma 300,005 7,308 96,362 110,674 1,825 5,126 45,494
Iringa 220,776 4,383 85,798 61,150 2,475 2,946 25,008
Mbeya 630,593 16,558 112,287 286,081 8,801 10,158 104,198
Singida 255,613 8,345 25,347 117,632 2,560 9,885 61,810
Tabora 379,770 11,969 29,856 167,085 3,101 10,776 109,313
Rukwa 198,011 4,814 23,226 118,632 1,561 3,179 32,714
Kigoma 370,374 9,245 34,195 229,909 3,496 19,647 41,851
Shinyanga 258,981 6,098 31,392 90,707 4,080 5,484 83,609
Kagera 521,028 17,226 46,825 353,392 6,701 9,627 40,588
Mwanza 481,107 9,591 108,750 166,275 8,446 3,577 68,752
Mara 308,483 8,501 91,654 146,820 3,335 3,578 15,044
Manyara 271,050 10,292 53,139 106,884 3,392 14,696 49,693
Njombe 168,982 3,008 69,521 43,573 2,586 4,424 20,701
Katavi 100,350 2,178 10,242 35,796 741 2,700 36,796
Simiyu 227,862 4,426 28,675 70,966 2,558 6,890 93,848
Geita 283,584 6,151 37,683 103,841 7,971 4,703 99,460

138
Table 11.10: Number of Households by Region and Main Source of Energy for Cooking; Tanzania Mainland, 2012 Census
Region Total
Households
Main Source of Energy for Cooking
Electricity (TANESCO/
ZECO)
Solar Energy
Generator/ Private
Sources
Gas (Industrial)
Gas (Biogas)
Electricity (Wind)
Tanzania Mainland 9,026,785 135,763 5,772 4,837 78,709 3,275 2,737
Male headed households 6,005,826 90,565 4,166 3,451 53,615 2,218 1,902
Female headed households 3,020,959 45,198 1,607 1,386 25,094 1,057 835
Rural 6,054,641 11,690 3,643 2,722 8,307 1,387 1,747
Urban 2,972,144 124,073 2,129 2,115 70,402 1,888 990
Dodoma 450,305 2,166 247 228 1,122 141 339
Arusha 376,336 7,392 617 321 16,263 780 209
Kilimanjaro 381,526 6,413 537 189 5,809 327 149
Tanga 435,583 4,868 232 168 1,574 161 70
Morogoro 501,794 6,561 247 618 1,159 61 108
Pwani 254,810 2,218 155 129 1,029 90 45
Dar es Salaam 1,083,381 77,852 675 458 41,997 655 186
Lindi 224,316 1,078 120 70 187 51 137
Mtwara 342,165 1,051 241 103 409 27 65
Ruvuma 300,005 836 184 147 273 24 27
Iringa 220,776 1,399 95 89 796 69 56
Mbeya 630,593 6,886 249 280 1,494 96 30
Singida 255,613 943 115 43 247 12 49
Tabora 379,770 1,161 196 96 294 - 17
Rukwa 198,011 273 45 34 88 7 3
Kigoma 370,374 866 161 228 238 18 11
Shinyanga 258,981 3,263 220 97 541 83 67
Kagera 521,028 1,700 156 100 389 9 19
Mwanza 481,107 3,600 273 221 2,565 139 186
Mara 308,483 1,922 299 204 890 173 223
Manyara 271,050 1,022 179 171 799 147 141
Njombe 168,982 747 158 132 169 39 49
Katavi 100,350 470 62 25 24 - 3
Simiyu 227,862 539 144 51 210 25 37
Geita 283,584 540 163 637 142 143 512

139
Continue… Table 11.10: Number of Households by Region and Main Source of Energy for Cooking; Tanzania Mainland, 2012 Census
Region Total
Households
Main Source of Energy for Cooking
Paraffin Coal Charcoal Firewood Wood/Farm
Residuals Not
Applicable
Tanzania Mainland 9,026,785 219,751 12,216 2,311,471 6,192,436 20,217 5,794
Male headed households 6,005,826 155,034 8,039 1,504,010 4,135,711 13,312 3,308
Female headed households 3,020,959 64,717 4,177 807,462 2,056,725 6,905 2,486
Rural 6,054,641 61,055 4,495 466,291 5,462,881 17,359 5,412
Urban 2,972,144 158,696 7,721 1,845,180 729,555 2,858 382
Dodoma 450,305 3,902 703 72,350 366,582 1,478 303
Arusha 376,336 50,895 784 60,596 233,985 1,055 2,044
Kilimanjaro 381,526 18,786 683 41,675 304,546 1,115 258
Tanga 435,583 6,572 429 84,761 334,934 524 157
Morogoro 501,794 5,911 681 138,910 344,678 1,283 104
Pwani 254,810 4,340 281 75,056 170,476 220 53
Dar es Salaam 1,083,381 72,841 2,949 796,671 71,798 329 10
Lindi 224,316 2,139 243 29,622 189,541 248 97
Mtwara 342,165 3,917 339 33,695 301,119 346 141
Ruvuma 300,005 3,274 261 46,395 247,808 393 38
Iringa 220,776 1,647 277 34,013 181,661 333 68
Mbeya 630,593 8,318 681 142,869 467,659 751 148
Singida 255,613 1,918 166 32,377 212,937 6,139 108
Tabora 379,770 3,395 253 78,010 295,362 314 132
Rukwa 198,011 1,350 134 41,658 153,935 184 10
Kigoma 370,374 3,934 152 58,955 304,992 439 33
Shinyanga 258,981 2,372 303 65,955 184,709 381 201
Kagera 521,028 5,462 217 68,673 443,073 544 36
Mwanza 481,107 5,057 787 156,431 309,997 511 250
Mara 308,483 3,771 559 55,697 243,318 596 320
Manyara 271,050 4,196 357 35,944 225,013 1,471 557
Njombe 168,982 1,004 239 22,453 143,531 276 59
Katavi 100,350 848 82 30,944 67,613 110 23
Simiyu 227,862 1,456 140 20,665 203,124 669 492
Geita 283,584 2,445 519 87,096 190,047 508 149
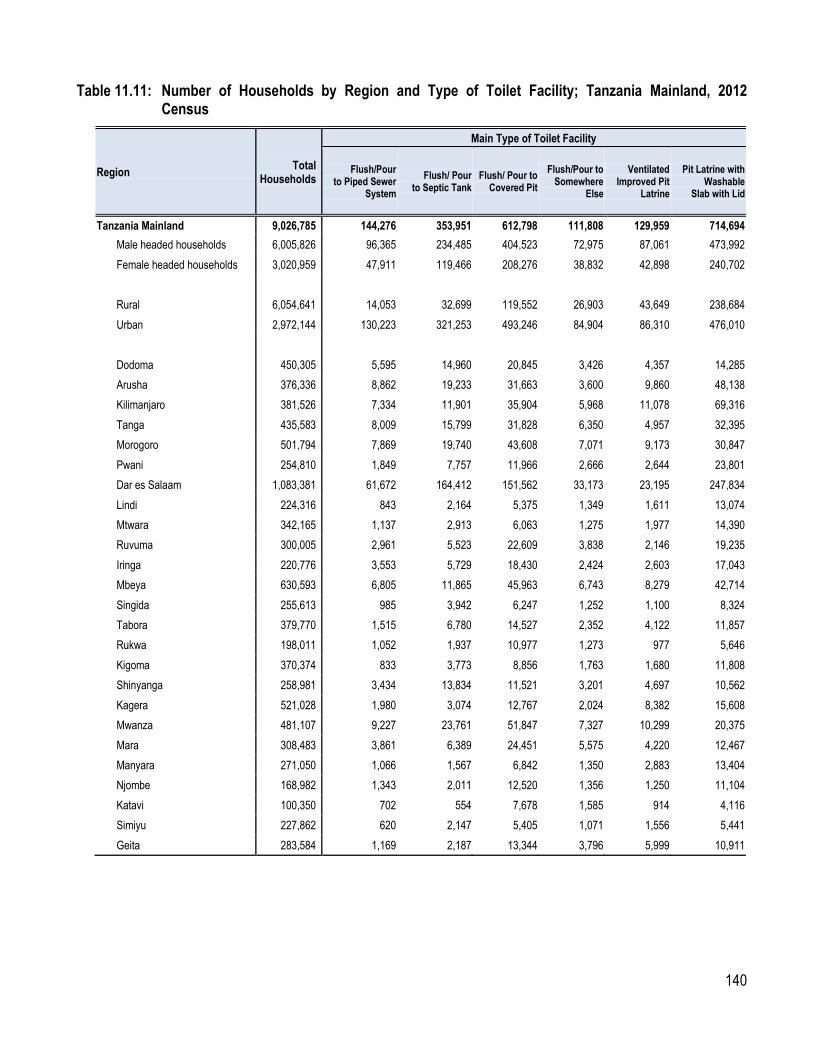
140
Table 11.11: Number of Households by Region and Type of Toilet Facility; Tanzania Mainland, 2012 Census
Region Total
Households
Main Type of Toilet Facility
Flush/Pour to Piped Sewer
System
Flush/ Pour to Septic Tank
Flush/ Pour to Covered Pit
Flush/Pour to Somewhere
Else
Ventilated Improved Pit
Latrine
Pit Latrine with Washable
Slab with Lid
Tanzania Mainland 9,026,785 144,276 353,951 612,798 111,808 129,959 714,694
Male headed households 6,005,826 96,365 234,485 404,523 72,975 87,061 473,992
Female headed households 3,020,959 47,911 119,466 208,276 38,832 42,898 240,702
Rural 6,054,641 14,053 32,699 119,552 26,903 43,649 238,684
Urban 2,972,144 130,223 321,253 493,246 84,904 86,310 476,010
Dodoma 450,305 5,595 14,960 20,845 3,426 4,357 14,285
Arusha 376,336 8,862 19,233 31,663 3,600 9,860 48,138
Kilimanjaro 381,526 7,334 11,901 35,904 5,968 11,078 69,316
Tanga 435,583 8,009 15,799 31,828 6,350 4,957 32,395
Morogoro 501,794 7,869 19,740 43,608 7,071 9,173 30,847
Pwani 254,810 1,849 7,757 11,966 2,666 2,644 23,801
Dar es Salaam 1,083,381 61,672 164,412 151,562 33,173 23,195 247,834
Lindi 224,316 843 2,164 5,375 1,349 1,611 13,074
Mtwara 342,165 1,137 2,913 6,063 1,275 1,977 14,390
Ruvuma 300,005 2,961 5,523 22,609 3,838 2,146 19,235
Iringa 220,776 3,553 5,729 18,430 2,424 2,603 17,043
Mbeya 630,593 6,805 11,865 45,963 6,743 8,279 42,714
Singida 255,613 985 3,942 6,247 1,252 1,100 8,324
Tabora 379,770 1,515 6,780 14,527 2,352 4,122 11,857
Rukwa 198,011 1,052 1,937 10,977 1,273 977 5,646
Kigoma 370,374 833 3,773 8,856 1,763 1,680 11,808
Shinyanga 258,981 3,434 13,834 11,521 3,201 4,697 10,562
Kagera 521,028 1,980 3,074 12,767 2,024 8,382 15,608
Mwanza 481,107 9,227 23,761 51,847 7,327 10,299 20,375
Mara 308,483 3,861 6,389 24,451 5,575 4,220 12,467
Manyara 271,050 1,066 1,567 6,842 1,350 2,883 13,404
Njombe 168,982 1,343 2,011 12,520 1,356 1,250 11,104
Katavi 100,350 702 554 7,678 1,585 914 4,116
Simiyu 227,862 620 2,147 5,405 1,071 1,556 5,441
Geita 283,584 1,169 2,187 13,344 3,796 5,999 10,911

141
Continue… Table 11.11: Number of Households by Region and Type of Toilet Facility; Tanzania Mainland, 2012 Census
Region Total
Households
Main Type of Toilet Facility
Pit Latrine with Washable Slab
without Lid
Pit Latrine without
Washable Slab/ Soil Slab
Pit Latrine without
Slab/Open Pit
Composting/ Ecoson Latrine
Bucket
No Facility
(bush /field/beach)
Tanzania Mainland 9,026,785 991,298 2,785,331 2,484,761 17,445 1,757 678,707
Male headed households 6,005,826 651,201 1,881,711 1,672,660 11,875 1,214 417,763
Female headed households 3,020,959 340,098 903,620 812,101 5,569 543 260,944
Rural 6,054,641 385,514 2,353,346 2,171,305 14,349 1,273 653,315
Urban 2,972,144 605,785 431,985 313,456 3,096 484 25,392
Dodoma 450,305 26,896 159,838 159,059 1,101 166 39,777
Arusha 376,336 67,901 61,924 46,771 817 130 77,437
Kilimanjaro 381,526 56,326 101,743 71,314 695 34 9,913
Tanga 435,583 43,660 144,437 107,748 654 79 39,668
Morogoro 501,794 40,794 175,580 149,228 918 84 16,882
Pwani 254,810 33,597 76,102 73,878 424 33 20,094
Dar es Salaam 1,083,381 317,477 48,793 32,376 284 150 2,452
Lindi 224,316 14,447 105,898 65,248 362 93 13,850
Mtwara 342,165 20,064 155,147 127,960 970 36 10,232
Ruvuma 300,005 25,461 136,914 79,126 476 23 1,692
Iringa 220,776 15,971 106,256 46,201 295 29 2,241
Mbeya 630,593 62,944 234,772 190,072 989 44 19,404
Singida 255,613 13,106 92,765 101,734 507 35 25,617
Tabora 379,770 22,269 128,374 117,290 636 27 70,019
Rukwa 198,011 13,353 106,366 44,180 208 14 12,029
Kigoma 370,374 24,854 157,579 148,736 550 8 9,935
Shinyanga 258,981 19,489 84,222 68,571 592 107 38,751
Kagera 521,028 36,921 152,591 265,678 1,930 68 20,004
Mwanza 481,107 34,714 116,024 163,655 1,374 111 42,394
Mara 308,483 21,641 67,122 95,747 1,027 163 65,820
Manyara 271,050 26,337 76,841 86,732 714 81 53,233
Njombe 168,982 11,403 95,678 31,401 377 11 528
Katavi 100,350 7,992 36,344 26,756 106 9 13,594
Simiyu 227,862 12,295 79,961 80,424 551 100 38,291
Geita 283,584 21,388 84,059 104,877 887 119 34,849

142
Table 11.12: Number of Households by Type of Refuse Disposal and Region; Tanzania Mainland, 2012 Census
Region Total
Households Regularly collected
Irregularly collected
Burnt Roadside Dumping
Burying/Pit Other
Dumping
Tanzania Mainland 9,026,785 471,038 280,812 2,049,915 112,406 3,340,402 2,772,211
Male headed households 6,005,826 299,638 175,694 1,360,068 72,000 2,266,662 1,831,764
Female headed households 3,020,959 171,401 105,118 689,847 40,406 1,073,740 940,447
Rural 6,054,641 7,279 9,918 1,386,605 65,004 2,299,839 2,285,995
Urban 2,972,144 463,759 270,894 663,310 47,402 1,040,563 486,217
Dodoma 450,305 8,980 3,287 92,028 4,877 174,336 166,797
Arusha 376,336 36,090 23,697 139,939 2,975 67,476 106,159
Kilimanjaro 381,526 13,850 4,693 180,743 1,908 78,752 101,580
Tanga 435,583 12,959 6,816 119,771 6,068 153,542 136,429
Morogoro 501,794 17,681 6,177 128,556 5,248 232,559 111,573
Pwani 254,810 3,644 2,914 87,274 2,427 118,470 40,081
Dar es Salaam 1,083,381 280,398 186,177 182,285 18,604 181,187 234,730
Lindi 224,316 3,774 1,339 40,919 2,112 92,752 83,421
Mtwara 342,165 2,768 1,231 80,376 4,129 171,909 81,753
Ruvuma 300,005 3,975 1,528 45,360 3,492 170,669 74,980
Iringa 220,776 7,236 2,273 32,656 944 139,031 38,637
Mbeya 630,593 17,068 7,004 92,688 4,522 401,746 107,565
Singida 255,613 2,807 1,817 56,050 2,089 84,527 108,323
Tabora 379,770 8,628 3,468 72,231 6,810 100,286 188,347
Rukwa 198,011 1,209 844 28,697 2,610 110,596 54,055
Kigoma 370,374 5,206 3,828 56,165 8,738 111,506 184,931
Shinyanga 258,981 9,685 2,660 77,559 4,684 61,623 102,771
Kagera 521,028 4,254 1,747 87,290 3,343 206,625 217,768
Mwanza 481,107 16,490 9,866 135,757 6,830 184,795 127,371
Mara 308,483 4,500 2,549 96,096 4,201 101,087 100,050
Manyara 271,050 2,479 1,734 72,625 3,843 73,208 117,161
Njombe 168,982 2,565 757 15,878 654 118,345 30,783
Katavi 100,350 758 479 15,718 1,180 51,970 30,246
Simiyu 227,862 2,919 1,022 62,334 4,052 67,803 89,731
Geita 283,584 1,115 2,906 50,920 6,068 85,602 136,972

143
Table 11.13: Number of Households by Type of Assets Owned, Sex of the Household Head and Region; Tanzania Mainland, 2012 Census
Region Total
Households Radio
Telephone (Land Line)
Mobile Phone Bicycle Motor vehicle
Tanzania Mainland 9,026,785 5,539,545 95,026 5,725,937 3,590,797 226,936
Male headed households 6,005,826 4,066,953 66,031 4,033,916 2,797,972 170,829
Female headed households 3,020,959 1,472,592 28,995 1,692,022 792,826 56,107
Rural 6,054,641 3,508,623 36,053 3,254,919 2,767,661 52,021
Urban 2,972,144 2,030,922 58,973 2,471,019 823,136 174,915
Dodoma 450,305 232,754 3,338 223,122 181,726 6,776
Arusha 376,336 242,073 5,778 283,132 70,218 19,051
Kilimanjaro 381,526 287,411 4,883 301,290 97,537 14,868
Tanga 435,583 276,570 4,652 281,925 159,984 8,266
Morogoro 501,794 319,006 4,663 306,395 228,275 7,862
Pwani 254,810 165,078 2,290 174,644 92,121 4,763
Dar es Salaam 1,083,381 735,219 28,320 969,366 136,598 87,859
Lindi 224,316 118,697 1,686 97,107 103,086 1,548
Mtwara 342,165 183,809 2,224 142,390 168,671 2,902
Ruvuma 300,005 177,141 2,232 151,749 97,557 4,062
Iringa 220,776 144,493 1,468 130,699 84,109 5,018
Mbeya 630,593 391,885 4,603 366,597 250,387 11,285
Singida 255,613 148,916 1,770 139,931 117,135 2,587
Tabora 379,770 243,382 2,716 240,407 267,068 4,502
Rukwa 198,011 101,303 1,041 80,683 69,613 1,323
Kigoma 370,374 220,155 2,384 177,445 161,284 3,651
Shinyanga 258,981 159,327 2,223 173,016 175,663 4,495
Kagera 521,028 328,886 2,767 298,448 195,506 7,681
Mwanza 481,107 295,550 4,692 335,377 236,115 10,525
Mara 308,483 180,819 3,483 197,309 130,700 4,950
Manyara 271,050 139,922 2,067 173,158 113,202 4,395
Njombe 168,982 107,297 948 96,594 69,267 2,942
Katavi 100,350 64,073 679 61,598 59,338 872
Simiyu 227,862 106,132 1,636 138,024 145,973 1,839
Geita 283,584 169,648 2,486 185,531 179,665 2,915

144
Continue… Table 11.13: Number of Households by Type of Assets Owned, Sex of the Household Head and Region; Tanzania Mainland, 2012 Census
Region Total
Households Motorcycle
/Vespa Tricycle (Guta)
Tri motorcycle (Bajaji)
Television Electric Iron
Tanzania Mainland 9,026,785 438,459 16,551 25,214 1,362,241 861,571
Male headed households 6,005,826 355,173 12,117 18,167 942,845 574,225
Female headed households 3,020,959 83,286 4,434 7,047 419,396 287,346
Rural 6,054,641 254,999 7,145 6,575 229,109 103,432
Urban 2,972,144 183,460 9,406 18,638 1,133,132 758,139
Dodoma 450,305 19,042 583 811 36,709 22,795
Arusha 376,336 20,025 923 1,589 83,768 59,781
Kilimanjaro 381,526 28,077 1,066 1,323 74,213 57,707
Tanga 435,583 28,024 662 1,033 51,159 32,680
Morogoro 501,794 25,416 963 971 52,221 30,262
Pwani 254,810 13,480 473 579 31,059 17,788
Dar es Salaam 1,083,381 49,237 4,136 9,222 574,471 404,768
Lindi 224,316 6,963 250 339 12,433 6,716
Mtwara 342,165 12,341 435 790 15,570 8,792
Ruvuma 300,005 18,128 283 412 23,312 8,408
Iringa 220,776 11,774 271 460 26,314 15,814
Mbeya 630,593 26,867 836 1,107 68,944 38,494
Singida 255,613 8,846 402 332 15,960 8,639
Tabora 379,770 19,585 530 647 31,930 14,990
Rukwa 198,011 5,856 130 88 10,623 4,004
Kigoma 370,374 10,167 320 324 19,917 8,724
Shinyanga 258,981 12,025 505 525 27,427 14,708
Kagera 521,028 36,681 473 518 36,438 17,534
Mwanza 481,107 17,636 744 1,328 71,555 42,713
Mara 308,483 17,391 778 1,013 29,329 15,457
Manyara 271,050 15,290 509 627 18,122 10,602
Njombe 168,982 8,326 254 365 15,096 7,979
Katavi 100,350 4,596 139 112 8,286 2,732
Simiyu 227,862 10,869 406 244 9,641 4,975
Geita 283,584 11,817 482 457 17,743 4,510

145
Continue… Table 11.13: Number of Households by Type of Assets Owned, Sex of the Household Head and Region; Tanzania Mainland, 2012 Census
Region Total
Households Charcoal Iron
Cooker (Electric or Gas)
Computer /Laptop
Internet Facility
Plough Power tiller
Tanzania Mainland 9,026,785 1,843,464 281,395 573,328 240,765 425,134 834,503
Male headed households 6,005,826 1,305,159 192,244 383,410 175,055 301,851 622,417
Female headed households 3,020,959 538,305 89,151 189,918 65,710 123,283 212,085
Rural 6,054,641 1,062,959 38,870 52,795 30,024 203,857 790,143
Urban 2,972,144 780,505 242,525 520,532 210,742 221,277 44,359
Dodoma 450,305 68,798 6,664 14,254 6,819 12,604 65,841
Arusha 376,336 96,245 34,888 31,336 18,653 28,099 43,956
Kilimanjaro 381,526 151,094 21,886 29,333 10,812 18,118 5,732
Tanga 435,583 77,966 9,673 22,466 7,419 13,710 2,378
Morogoro 501,794 86,791 9,811 24,517 8,758 10,106 11,314
Pwani 254,810 42,690 5,253 14,540 5,117 7,299 762
Dar es Salaam 1,083,381 222,350 126,551 307,723 113,194 104,977 2,525
Lindi 224,316 26,653 1,412 4,636 1,709 3,563 334
Mtwara 342,165 42,867 2,089 5,773 2,816 6,377 321
Ruvuma 300,005 61,768 2,266 4,225 3,046 7,373 362
Iringa 220,776 52,555 4,554 5,862 4,953 9,199 19,162
Mbeya 630,593 161,958 10,461 17,427 10,495 29,661 66,687
Singida 255,613 44,672 2,129 4,577 2,217 9,189 74,385
Tabora 379,770 69,878 3,396 10,759 4,299 11,852 87,988
Rukwa 198,011 28,562 830 1,474 1,379 6,121 57,891
Kigoma 370,374 52,099 2,054 5,159 3,126 9,192 1,284
Shinyanga 258,981 54,034 5,615 10,709 4,379 22,425 66,631
Kagera 521,028 97,683 4,503 7,281 5,272 36,018 3,646
Mwanza 481,107 111,242 14,053 27,614 12,127 19,467 50,019
Mara 308,483 80,444 5,127 9,229 4,464 9,039 66,593
Manyara 271,050 54,293 3,520 5,191 2,880 7,185 59,656
Njombe 168,982 44,642 1,684 1,755 2,153 6,620 16,438
Katavi 100,350 17,630 429 1,573 993 4,402 15,582
Simiyu 227,862 45,717 1,375 2,909 1,546 15,520 85,570
Geita 283,584 50,833 1,168 3,004 2,138 17,016 29,446

146
Continue… Table 11.13: Number of Households by Type of Assets Owned, Sex of the Household Head and Region; Tanzania Mainland, 2012 Census
Region Total
Households Hand hoe Wheelbarrow Oxen
Donkey/ Camel
House Land/Farm
Tanzania Mainland 9,026,785 6,760,257 421,226 856,164 285,771 6,752,418 6,423,155
Male headed households 6,005,826 4,573,287 314,137 637,888 182,315 4,536,650 4,346,508
Female headed households 3,020,959 2,186,970 107,088 218,276 103,456 2,215,768 2,076,648
Rural 6,054,641 5,373,607 270,177 809,101 267,789 5,380,963 5,240,245
Urban 2,972,144 1,386,650 151,049 47,063 17,983 1,371,455 1,182,911
Dodoma 450,305 393,351 25,492 67,673 31,007 390,028 378,928
Arusha 376,336 223,568 35,748 49,783 80,630 257,570 229,332
Kilimanjaro 381,526 309,804 40,623 7,527 12,974 303,412 292,852
Tanga 435,583 355,620 7,926 3,702 8,999 341,677 342,691
Morogoro 501,794 415,041 10,079 13,162 4,573 374,091 366,069
Pwani 254,810 188,966 6,571 1,560 1,863 187,260 182,086
Dar es Salaam 1,083,381 219,637 45,889 2,064 2,266 359,298 257,464
Lindi 224,316 190,776 1,932 742 826 190,830 191,028
Mtwara 342,165 292,114 2,515 878 1,355 298,462 298,209
Ruvuma 300,005 260,664 4,342 1,066 1,190 254,543 263,558
Iringa 220,776 191,686 8,160 18,753 4,186 175,687 176,073
Mbeya 630,593 518,403 23,256 67,999 11,087 498,053 476,336
Singida 255,613 225,834 23,586 76,525 19,363 224,390 220,310
Tabora 379,770 325,226 31,216 86,723 6,715 310,111 298,666
Rukwa 198,011 173,126 5,998 61,146 6,358 157,330 161,588
Kigoma 370,374 319,812 3,184 2,705 1,057 324,512 320,172
Shinyanga 258,981 207,923 24,601 65,502 6,128 198,395 176,985
Kagera 521,028 453,443 9,472 5,799 1,268 453,720 454,985
Mwanza 481,107 355,043 20,818 51,485 3,385 345,339 301,872
Mara 308,483 251,416 12,315 57,988 11,898 251,484 241,490
Manyara 271,050 223,263 25,118 66,271 55,052 225,736 212,197
Njombe 168,982 151,568 5,371 15,934 3,679 144,204 148,645
Katavi 100,350 85,925 4,780 16,186 698 74,034 74,897
Simiyu 227,862 201,635 31,011 83,982 4,684 196,896 173,792
Geita 283,584 226,414 11,221 31,009 4,530 215,355 182,932

147
Table 11.14: Number of Households with Members of Social Security Schemes by Region; Tanzania Mainland, 2012 Census
Region
Social Security Schemes
NSSF ZSSF PPF PSPF GEPF LAPF NHF/CHF Other
Fund
Tanzania Mainland 223,305 4,248 73,617 163,746 22,531 38,827 507,717 89,972
Rural 49,500 1,803 15,437 74,536 6,167 15,062 317,945 59,885
Urban 173,805 2,445 58,180 89,210 16,364 23,765 189,772 30,087
Dodoma 4,889 119 1,860 7,086 1,081 2,277 66,154 2,996
Arusha 16,883 150 4,817 6,367 785 1,413 12,026 3,288
Kilimanjaro 11,810 154 3,153 9,877 1,183 1,824 50,199 5,819
Tanga 10,518 351 2,627 8,399 982 2,254 18,709 3,231
Morogoro 13,396 173 6,644 9,085 1,159 1,850 26,368 6,634
Pwani 4,281 94 1,877 5,200 641 1,223 12,999 2,449
Dar es Salaam 87,058 1,339 29,440 22,591 4,924 4,526 42,186 9,999
Lindi 1,523 98 613 3,478 628 1,275 13,541 2,797
Mtwara 3,138 118 1,173 4,168 885 1,327 12,173 4,573
Ruvuma 2,926 56 993 5,128 770 1,532 16,788 7,778
Iringa 8,563 77 2,504 5,390 702 1,378 17,729 2,148
Mbeya 9,022 406 2,753 9,903 1,148 2,434 37,244 6,103
Singida 2,803 323 1,043 4,069 785 1,147 37,364 3,921
Tabora 4,612 76 1,374 5,866 839 1,575 19,736 1,394
Rukwa 1,811 77 540 3,409 500 894 8,046 884
Kigoma 3,339 74 919 4,896 716 1,327 20,978 2,554
Shinyanga 5,445 55 1,096 5,722 318 995 9,127 1,440
Kagera 6,891 93 2,056 9,032 858 2,006 15,343 4,746
Mwanza 10,705 140 3,758 10,835 983 2,344 18,720 7,057
Mara 4,808 65 1,557 6,117 817 1,079 9,209 1,636
Manyara 1,867 41 687 3,600 534 1,051 9,632 2,709
Njombe 2,269 25 528 3,504 317 988 13,681 1,529
Katavi 689 24 323 1,484 223 381 5,908 415
Simiyu 1,113 41 446 4,445 419 949 8,725 2,295
Geita 2,946 79 836 4,095 334 778 5,132 1,577
148
Chapter Twelve
Agriculture and Livestock
The tables show the distribution of private households by crops grown and livestock kept.
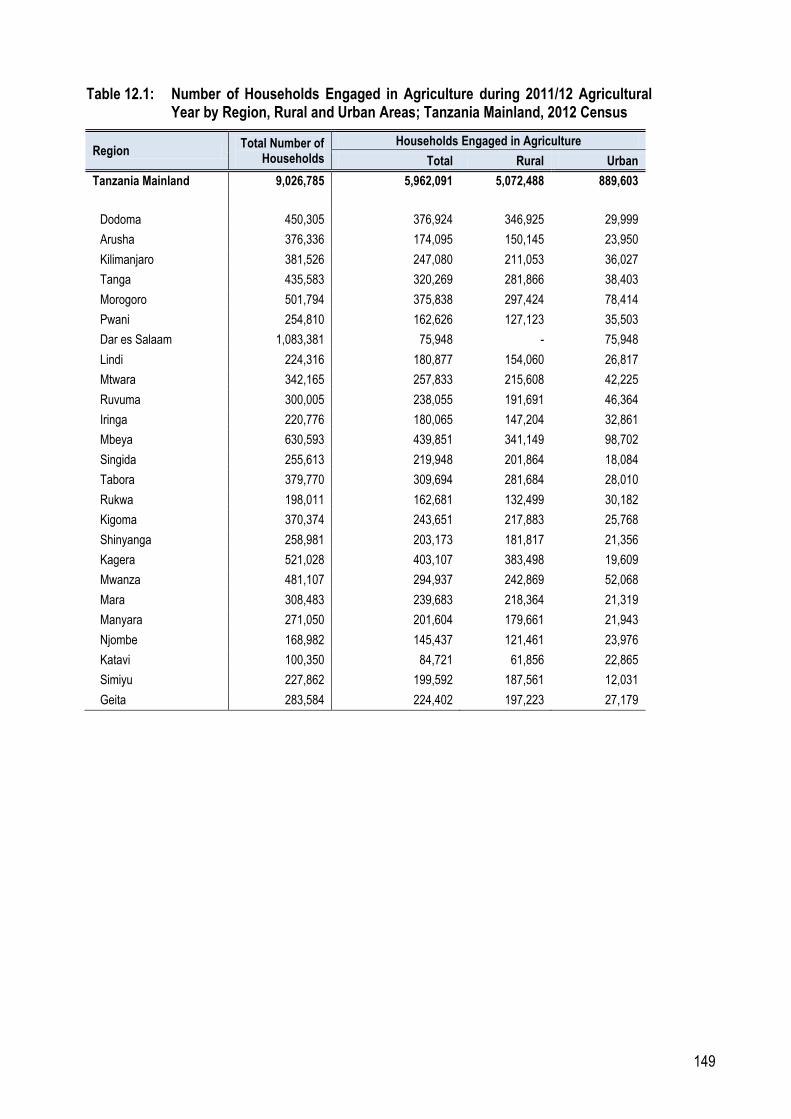
149
Table 12.1: Number of Households Engaged in Agriculture during 2011/12 Agricultural Year by Region, Rural and Urban Areas; Tanzania Mainland, 2012 Census
Region Total Number of
Households
Households Engaged in Agriculture
Total Rural Urban
Tanzania Mainland 9,026,785 5,962,091 5,072,488 889,603
Dodoma 450,305 376,924 346,925 29,999
Arusha 376,336 174,095 150,145 23,950
Kilimanjaro 381,526 247,080 211,053 36,027
Tanga 435,583 320,269 281,866 38,403
Morogoro 501,794 375,838 297,424 78,414
Pwani 254,810 162,626 127,123 35,503
Dar es Salaam 1,083,381 75,948 - 75,948
Lindi 224,316 180,877 154,060 26,817
Mtwara 342,165 257,833 215,608 42,225
Ruvuma 300,005 238,055 191,691 46,364
Iringa 220,776 180,065 147,204 32,861
Mbeya 630,593 439,851 341,149 98,702
Singida 255,613 219,948 201,864 18,084
Tabora 379,770 309,694 281,684 28,010
Rukwa 198,011 162,681 132,499 30,182
Kigoma 370,374 243,651 217,883 25,768
Shinyanga 258,981 203,173 181,817 21,356
Kagera 521,028 403,107 383,498 19,609
Mwanza 481,107 294,937 242,869 52,068
Mara 308,483 239,683 218,364 21,319
Manyara 271,050 201,604 179,661 21,943
Njombe 168,982 145,437 121,461 23,976
Katavi 100,350 84,721 61,856 22,865
Simiyu 227,862 199,592 187,561 12,031
Geita 283,584 224,402 197,223 27,179
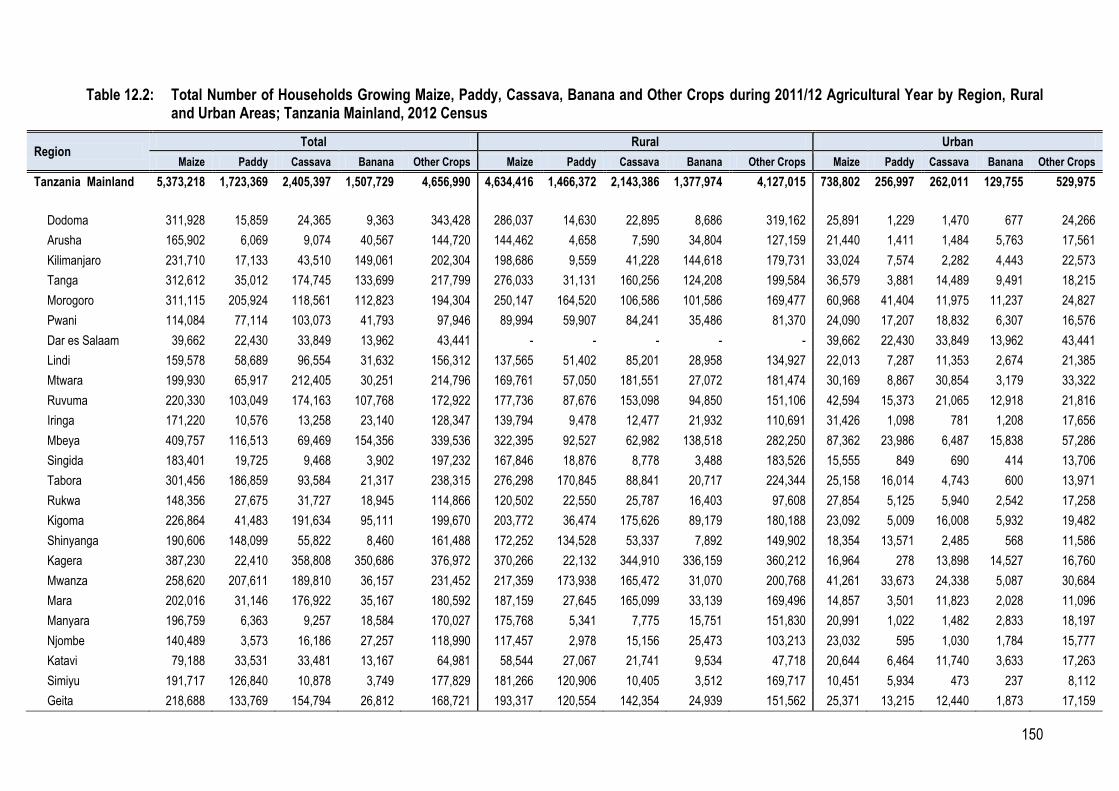
150
Table 12.2: Total Number of Households Growing Maize, Paddy, Cassava, Banana and Other Crops during 2011/12 Agricultural Year by Region, Rural and Urban Areas; Tanzania Mainland, 2012 Census
Region Total Rural Urban
Maize Paddy Cassava Banana Other Crops Maize Paddy Cassava Banana Other Crops Maize Paddy Cassava Banana Other Crops
Tanzania Mainland 5,373,218 1,723,369 2,405,397 1,507,729 4,656,990 4,634,416 1,466,372 2,143,386 1,377,974 4,127,015 738,802 256,997 262,011 129,755 529,975
Dodoma 311,928 15,859 24,365 9,363 343,428 286,037 14,630 22,895 8,686 319,162 25,891 1,229 1,470 677 24,266
Arusha 165,902 6,069 9,074 40,567 144,720 144,462 4,658 7,590 34,804 127,159 21,440 1,411 1,484 5,763 17,561
Kilimanjaro 231,710 17,133 43,510 149,061 202,304 198,686 9,559 41,228 144,618 179,731 33,024 7,574 2,282 4,443 22,573
Tanga 312,612 35,012 174,745 133,699 217,799 276,033 31,131 160,256 124,208 199,584 36,579 3,881 14,489 9,491 18,215
Morogoro 311,115 205,924 118,561 112,823 194,304 250,147 164,520 106,586 101,586 169,477 60,968 41,404 11,975 11,237 24,827
Pwani 114,084 77,114 103,073 41,793 97,946 89,994 59,907 84,241 35,486 81,370 24,090 17,207 18,832 6,307 16,576
Dar es Salaam 39,662 22,430 33,849 13,962 43,441 - - - - - 39,662 22,430 33,849 13,962 43,441
Lindi 159,578 58,689 96,554 31,632 156,312 137,565 51,402 85,201 28,958 134,927 22,013 7,287 11,353 2,674 21,385
Mtwara 199,930 65,917 212,405 30,251 214,796 169,761 57,050 181,551 27,072 181,474 30,169 8,867 30,854 3,179 33,322
Ruvuma 220,330 103,049 174,163 107,768 172,922 177,736 87,676 153,098 94,850 151,106 42,594 15,373 21,065 12,918 21,816
Iringa 171,220 10,576 13,258 23,140 128,347 139,794 9,478 12,477 21,932 110,691 31,426 1,098 781 1,208 17,656
Mbeya 409,757 116,513 69,469 154,356 339,536 322,395 92,527 62,982 138,518 282,250 87,362 23,986 6,487 15,838 57,286
Singida 183,401 19,725 9,468 3,902 197,232 167,846 18,876 8,778 3,488 183,526 15,555 849 690 414 13,706
Tabora 301,456 186,859 93,584 21,317 238,315 276,298 170,845 88,841 20,717 224,344 25,158 16,014 4,743 600 13,971
Rukwa 148,356 27,675 31,727 18,945 114,866 120,502 22,550 25,787 16,403 97,608 27,854 5,125 5,940 2,542 17,258
Kigoma 226,864 41,483 191,634 95,111 199,670 203,772 36,474 175,626 89,179 180,188 23,092 5,009 16,008 5,932 19,482
Shinyanga 190,606 148,099 55,822 8,460 161,488 172,252 134,528 53,337 7,892 149,902 18,354 13,571 2,485 568 11,586
Kagera 387,230 22,410 358,808 350,686 376,972 370,266 22,132 344,910 336,159 360,212 16,964 278 13,898 14,527 16,760
Mwanza 258,620 207,611 189,810 36,157 231,452 217,359 173,938 165,472 31,070 200,768 41,261 33,673 24,338 5,087 30,684
Mara 202,016 31,146 176,922 35,167 180,592 187,159 27,645 165,099 33,139 169,496 14,857 3,501 11,823 2,028 11,096
Manyara 196,759 6,363 9,257 18,584 170,027 175,768 5,341 7,775 15,751 151,830 20,991 1,022 1,482 2,833 18,197
Njombe 140,489 3,573 16,186 27,257 118,990 117,457 2,978 15,156 25,473 103,213 23,032 595 1,030 1,784 15,777
Katavi 79,188 33,531 33,481 13,167 64,981 58,544 27,067 21,741 9,534 47,718 20,644 6,464 11,740 3,633 17,263
Simiyu 191,717 126,840 10,878 3,749 177,829 181,266 120,906 10,405 3,512 169,717 10,451 5,934 473 237 8,112
Geita 218,688 133,769 154,794 26,812 168,721 193,317 120,554 142,354 24,939 151,562 25,371 13,215 12,440 1,873 17,159

151
Table 12.3: Number of Households Growing Maize and Paddy during the 2011/12 Agricultural Year by Region, Rural and Urban Areas; Tanzania Mainland, 2012 Census
Region Total Number of
Households
Households Growing Maize and Paddy
Total Rural Urban
Tanzania Mainland 9,026,785 1,516,441 1,324,222 192,219
Dodoma 450,305 11,942 11,109 833
Arusha 376,336 4,914 3,931 983
Kilimanjaro 381,526 14,555 8,488 6,067
Tanga 435,583 33,435 29,786 3,649
Morogoro 501,794 149,877 123,500 26,377
Pwani 254,810 53,121 41,206 11,915
Dar es Salaam 1,083,381 12,812 - 12,812
Lindi 224,316 53,093 47,599 5,494
Mtwara 342,165 56,080 48,716 7,364
Ruvuma 300,005 92,822 80,230 12,592
Iringa 220,776 4,849 4,201 648
Mbeya 630,593 95,735 79,968 15,767
Singida 255,613 16,898 16,213 685
Tabora 379,770 181,135 167,316 13,819
Rukwa 198,011 23,098 19,064 4,034
Kigoma 370,374 39,992 35,450 4,542
Shinyanga 258,981 140,050 128,793 11,257
Kagera 521,028 21,890 21,657 233
Mwanza 481,107 192,275 164,881 27,394
Mara 308,483 25,728 23,190 2,538
Manyara 271,050 5,204 4,472 732
Njombe 168,982 2,980 2,589 391
Katavi 100,350 29,786 24,720 5,066
Simiyu 227,862 123,664 118,739 4,925
Geita 283,584 130,506 118,404 12,102

152
Table 12.4: Number of Households Keeping Cattle, Goats, Sheep, and Poultry during 2011/12 Agricultural Year by Region, Rural and Urban Areas; Tanzania Mainland, 2012 Census
Region Total Number of
Households
Households Keeping Cattle, Goats, Sheep, and Poultry
Total Rural Urban
Tanzania Mainland 9,026,785 3,813,833 3,316,647 497,186
Dodoma 450,305 197,509 184,363 13,146
Arusha 376,336 172,432 151,811 20,621
Kilimanjaro 381,526 209,380 182,332 27,048
Tanga 435,583 216,061 190,485 25,576
Morogoro 501,794 189,769 159,633 30,136
Pwani 254,810 89,574 73,172 16,402
Dar es Salaam 1,083,381 84,631 - 84,631
Lindi 224,316 98,839 86,737 12,102
Mtwara 342,165 135,188 116,154 19,034
Ruvuma 300,005 150,069 127,693 22,376
Iringa 220,776 112,252 96,189 16,063
Mbeya 630,593 271,798 223,495 48,303
Singida 255,613 155,614 147,263 8,351
Tabora 379,770 183,541 174,633 8,908
Rukwa 198,011 100,708 84,319 16,389
Kigoma 370,374 137,992 124,154 13,838
Shinyanga 258,981 137,757 127,654 10,103
Kagera 521,028 242,871 232,552 10,319
Mwanza 481,107 197,338 165,444 31,894
Mara 308,483 173,522 160,363 13,159
Manyara 271,050 152,075 140,068 12,007
Njombe 168,982 90,430 79,063 11,367
Katavi 100,350 45,178 35,334 9,844
Simiyu 227,862 144,084 138,659 5,425
Geita 283,584 125,221 115,077 10,144

153
Table 12.5: Number of Households Keeping Cattle, Sheep, Goats, Poultry during 2011/12 Agricultural Year by Region, Rural and Urban Areas;
Tanzania Mainland, 2012 Census
Region Total
Rural
Urban
Cattle Goats Sheep Poultry Cattle Goats Sheep Poultry Cattle Goats Sheep Poultry
Tanzania Mainland 1,462,279 1,673,857 640,007 3,321,818 1,355,378 1,548,517 609,475 2,886,664 106,901 125,340 30,532 435,154
Dodoma 86,105 96,532 41,576 166,896 82,528 92,039 40,367 155,858 3,577 4,493 1,209 11,038
Arusha 124,380 115,762 86,722 105,717 115,559 108,665 82,403 89,138 8,821 7,097 4,319 16,579
Kilimanjaro 119,863 109,528 57,584 179,244 112,125 99,861 52,281 155,448 7,738 9,667 5,303 23,796
Tanga 72,629 86,410 45,088 187,889 65,921 77,855 43,433 165,603 6,708 8,555 1,655 22,286
Morogoro 24,800 38,975 12,145 178,836 22,034 35,126 11,306 150,927 2,766 3,849 839 27,909
Pwani 9,415 11,401 3,293 85,186 7,666 9,060 2,909 69,910 1,749 2,341 384 15,276
Dar es Salaam 10,805 12,944 2,055 77,166 - - - - 10,805 12,944 2,055 77,166
Lindi 2,709 14,272 942 94,242 1,980 11,734 773 83,237 729 2,538 169 11,005
Mtwara 4,709 34,343 2,971 125,706 3,635 31,480 2,604 108,044 1,074 2,863 367 17,662
Ruvuma 25,603 70,314 7,505 138,962 21,484 62,689 7,011 118,670 4,119 7,625 494 20,292
Iringa 20,461 16,416 5,283 107,513 18,144 14,488 4,788 92,454 2,317 1,928 495 15,059
Mbeya 127,929 85,399 12,454 246,017 111,807 76,348 10,969 204,383 16,122 9,051 1,485 41,634
Singida 93,364 81,580 49,064 139,241 90,430 78,755 47,881 132,404 2,934 2,825 1,183 6,837
Tabora 92,710 86,747 39,611 167,713 91,171 84,728 39,006 160,086 1,539 2,019 605 7,627
Rukwa 51,270 36,455 4,159 82,204 44,928 31,859 3,624 68,681 6,342 4,596 535 13,523
Kigoma 20,932 74,264 14,026 107,789 19,752 69,848 13,140 96,459 1,180 4,416 886 11,330
Shinyanga 72,046 64,659 30,170 124,761 69,347 61,733 29,372 116,603 2,699 2,926 798 8,158
Kagera 46,041 150,227 20,003 186,023 43,773 146,813 19,584 177,961 2,268 3,414 419 8,062
Mwanza 89,984 98,880 24,520 173,844 82,450 89,009 22,826 146,463 7,534 9,871 1,694 27,381
Mara 87,091 90,447 38,222 154,512 84,246 85,921 37,097 143,373 2,845 4,526 1,125 11,139
Manyara 110,234 105,731 74,650 124,956 104,408 100,042 71,955 115,139 5,826 5,689 2,695 9,817
Njombe 24,217 26,131 5,187 85,527 21,361 23,875 4,826 75,011 2,856 2,256 361 10,516
Katavi 13,205 20,137 3,583 41,058 12,121 16,034 3,174 32,291 1,084 4,103 409 8,767
Simiyu 84,921 78,023 48,640 131,417 83,488 76,381 48,058 126,950 1,433 1,642 582 4,467
Geita 46,856 68,280 10,554 109,399 45,020 64,174 10,088 101,571 1,836 4,106 466 7,828

154
Table 12.6: Number of Households Keeping Cattle, Sheep, Goats or Chicken by Region and Sex of the Household head; Tanzania Mainland, 2012 Census
Region Total Male Headed Households Female Headed Households
Cattle Goats Sheep Poultry Cattle Goats Sheep Poultry Cattle Goats Sheep Poultry
Tanzania Mainland 1,462,279 1,673,857 640,007 3,321,818 1,083,681 1,219,731 453,302 2,371,126 378,598 454,126 186,705 950,692
Dodoma 86,105 96,532 41,576 166,896 69,040 75,678 33,123 122,715 17,065 20,854 8,453 44,181
Arusha 124,380 115,762 86,722 105,717 77,530 70,353 51,848 73,086 46,850 45,409 34,874 32,631
Kilimanjaro 119,863 109,528 57,584 179,244 83,255 75,041 39,835 121,523 36,608 34,487 17,749 57,721
Tanga 72,629 86,410 45,088 187,889 53,959 64,048 31,724 133,183 18,670 22,362 13,364 54,706
Morogoro 24,800 38,975 12,145 178,836 19,169 29,988 9,060 131,927 5,631 8,987 3,085 46,909
Pwani 9,415 11,401 3,293 85,186 7,341 9,015 2,478 64,009 2,074 2,386 815 21,177
Dar es Salaam 10,805 12,944 2,055 77,166 8,473 10,303 1,636 57,942 2,332 2,641 419 19,224
Lindi 2,709 14,272 942 94,242 1,963 10,387 682 66,156 746 3,885 260 28,086
Mtwara 4,709 34,343 2,971 125,706 3,572 26,130 2,265 90,478 1,137 8,213 706 35,228
Ruvuma 25,603 70,314 7,505 138,962 21,816 57,262 6,490 107,940 3,787 13,052 1,015 31,022
Iringa 20,461 16,416 5,283 107,513 15,675 12,512 3,999 71,789 4,786 3,904 1,284 35,724
Mbeya 127,929 85,399 12,454 246,017 98,796 64,218 9,596 168,397 29,133 21,181 2,858 77,620
Singida 93,364 81,580 49,064 139,241 72,428 62,262 37,445 101,059 20,936 19,318 11,619 38,182
Tabora 92,710 86,747 39,611 167,713 72,083 66,556 30,050 124,353 20,627 20,191 9,561 43,360
Rukwa 51,270 36,455 4,159 82,204 42,062 28,984 3,158 63,203 9,208 7,471 1,001 19,001
Kigoma 20,932 74,264 14,026 107,789 16,657 53,890 10,541 78,665 4,275 20,374 3,485 29,124
Shinyanga 72,046 64,659 30,170 124,761 54,030 47,473 21,793 89,747 18,016 17,186 8,377 35,014
Kagera 46,041 150,227 20,003 186,023 37,297 111,928 15,955 136,769 8,744 38,299 4,048 49,254
Mwanza 89,984 98,880 24,520 173,844 67,759 71,805 17,935 124,245 22,225 27,075 6,585 49,599
Mara 87,091 90,447 38,222 154,512 62,513 61,741 26,602 101,176 24,578 28,706 11,620 53,336
Manyara 110,234 105,731 74,650 124,956 75,670 71,974 50,098 87,501 34,564 33,757 24,552 37,455
Njombe 24,217 26,131 5,187 85,527 18,829 19,138 4,000 56,847 5,388 6,993 1,187 28,680
Katavi 13,205 20,137 3,583 41,058 10,164 15,743 2,682 31,526 3,041 4,394 901 9,532
Simiyu 84,921 78,023 48,640 131,417 56,804 51,040 32,198 84,603 28,117 26,983 16,442 46,814
Geita 46,856 68,280 10,554 109,399 36,796 52,262 8,109 82,287 10,060 16,018 2,445 27,112

155
Table 12. 7: Number of Cattle, Goats, Sheep and Poultry Kept by Private Households as of 26th August 2012 by Region and Sex of the Household Head Tanzania Mainland, 2012 Census
Region
Total Male Headed household Female Headed Household
Cattle Goats Sheep Poultry Cattle Goats Sheep Poultry Cattle Goats Sheep Poultry
Tanzania Mainland 23,967,902 14,913,515 4,388,877 35,675,796 18,010,922 10,954,283 3,096,641 26,597,550 5,956,980 3,959,232 1,292,236 9,078,246
Dodoma 1,504,632 1,025,756 258,011 1,549,452 1,172,525 833,120 207,448 1,178,864 332,107 192,636 50,563 370,588
Arusha 1,605,735 1,884,783 842,453 1,094,205 1,023,325 1,202,976 504,725 814,757 582,410 681,807 337,728 279,448
Kilimanjaro 654,468 693,824 246,210 1,640,672 501,525 487,722 173,711 1,177,090 152,943 206,102 72,499 463,582
Tanga 772,600 816,588 223,149 1,765,218 586,331 621,804 163,693 1,334,988 186,269 194,784 59,456 430,230
Morogoro 881,766 489,060 128,360 2,077,975 650,576 368,510 95,698 1,595,322 231,190 120,550 32,662 482,653
Pwani 535,289 191,472 43,395 1,271,132 398,315 152,211 32,674 994,534 136,974 39,261 10,721 276,598
Dar es Salaam 272,937 160,367 17,043 1,957,649 191,990 125,249 13,596 1,460,026 80,947 35,118 3,447 497,623
Lindi 264,163 98,328 6,968 1,125,695 225,044 73,308 5,307 833,146 39,119 25,020 1,661 292,549
Mtwara 167,200 226,077 15,886 1,134,864 97,095 172,256 12,296 864,080 70,105 53,821 3,590 270,784
Ruvuma 465,058 315,626 25,828 1,456,422 363,368 257,763 22,289 1,157,108 101,690 57,863 3,539 299,314
Iringa 664,272 201,648 43,147 1,131,241 475,729 156,766 32,888 808,900 188,543 44,882 10,259 322,341
Mbeya 1,452,698 557,030 76,967 2,452,569 1,037,871 430,356 59,594 1,793,590 414,827 126,674 17,373 658,979
Singida 1,371,975 829,155 292,579 1,387,484 1,085,003 645,257 227,796 1,047,807 286,972 183,898 64,783 339,677
Tabora 2,227,637 953,991 269,456 2,477,071 1,774,586 748,962 207,508 1,900,945 453,051 205,029 61,948 576,126
Rukwa 640,014 233,399 35,488 747,384 544,624 186,354 27,268 587,390 95,390 47,045 8,220 159,994
Kigoma 506,929 361,526 53,137 796,001 389,981 273,886 40,788 604,608 116,948 87,640 12,349 191,393
Shinyanga 1,299,261 620,795 196,998 1,634,373 1,040,839 460,898 144,226 1,216,292 258,422 159,897 52,772 418,081
Kagera 845,449 730,300 75,478 1,172,304 717,798 569,288 60,957 890,536 127,651 161,012 14,521 281,768
Mwanza 1,333,569 574,942 129,678 1,829,259 1,058,031 425,816 96,674 1,346,921 275,538 149,126 33,004 482,338
Mara 1,651,355 757,428 342,892 1,612,672 1,181,640 536,840 246,529 1,113,321 469,715 220,588 96,363 499,351
Manyara 1,807,094 1,542,414 581,246 1,103,236 1,240,642 1,054,906 382,270 799,131 566,452 487,508 198,976 304,105
Njombe 267,681 113,681 21,747 851,730 200,259 86,792 17,223 614,335 67,422 26,889 4,524 237,395
Katavi 363,036 177,808 25,703 550,571 284,290 134,181 19,523 432,756 78,746 43,627 6,180 117,815
Simiyu 1,595,889 929,895 389,366 1,673,455 1,125,962 619,887 265,138 1,117,388 469,927 310,008 124,228 556,067
Geita 817,195 427,622 47,692 1,183,162 643,573 329,175 36,822 913,715 173,622 98,447 10,870 269,447

156
Table 12. 8: Number of Cattle, Sheep, Goats and Poultry Kept by Private Households as of 26th August 2012 by Region Rural and Urban Areas, Tanzania Mainland, 2012 Census
Region Total Rural Urban
Cattle Goats Sheep Poultry Cattle Goats Sheep Poultry Cattle Goats Sheep Poultry
Tanzania Mainland 23,967,902 14,913,515 4,388,877 35,675,796 21,961,988 13,886,905 4,202,423 28,886,711 2,005,914 1,026,610 186,454 6,789,085 Dodoma 1,504,632 1,025,756 258,011 1,549,452 1,451,770 973,895 250,889 1,379,141 52,862 51,861 7,122 170,311
Arusha 1,605,735 1,884,783 842,453 1,094,205 1,480,396 1,813,845 816,051 806,303 125,339 70,938 26,402 287,902
Kilimanjaro 654,468 693,824 246,210 1,640,672 549,346 608,111 216,013 1,305,845 105,122 85,713 30,197 334,827
Tanga 772,600 816,588 223,149 1,765,218 706,089 737,635 212,617 1,472,800 66,511 78,953 10,532 292,418
Morogoro 881,766 489,060 128,360 2,077,975 793,257 444,611 120,918 1,664,454 88,509 44,449 7,442 413,521
Pwani 535,289 191,472 43,395 1,271,132 485,664 164,488 39,772 992,780 49,625 26,984 3,623 278,352
Dar es Salaam 272,937 160,367 17,043 1,957,649 - - - - 272,937 160,367 17,043 1,957,649
Lindi 264,163 98,328 6,968 1,125,695 213,126 77,105 5,815 1,010,488 51,037 21,223 1,153 115,207
Mtwara 167,200 226,077 15,886 1,134,864 138,264 209,517 13,673 966,808 28,936 16,560 2,213 168,056
Ruvuma 465,058 315,626 25,828 1,456,422 419,082 280,686 23,452 1,176,297 45,976 34,940 2,376 280,125
Iringa 664,272 201,648 43,147 1,131,241 623,146 169,242 38,907 864,408 41,126 32,406 4,240 266,833
Mbeya 1,452,698 557,030 76,967 2,452,569 1,237,264 500,763 67,315 1,860,735 215,434 56,267 9,652 591,834
Singida 1,371,975 829,155 292,579 1,387,484 1,343,527 805,187 285,710 1,309,191 28,448 23,968 6,869 78,293
Tabora 2,227,637 953,991 269,456 2,477,071 2,202,962 932,075 265,641 2,361,040 24,675 21,916 3,815 116,031
Rukwa 640,014 233,399 35,488 747,384 559,400 203,572 31,178 584,697 80,614 29,827 4,310 162,687
Kigoma 506,929 361,526 53,137 796,001 462,356 340,111 50,007 685,043 44,573 21,415 3,130 110,958
Shinyanga 1,299,261 620,795 196,998 1,634,373 1,203,366 594,302 192,237 1,519,406 95,895 26,493 4,761 114,967
Kagera 845,449 730,300 75,478 1,172,304 825,578 713,851 73,653 1,100,247 19,871 16,449 1,825 72,057
Mwanza 1,333,569 574,942 129,678 1,829,259 1,149,766 516,025 121,167 1,468,745 183,803 58,917 8,511 360,514
Mara 1,651,355 757,428 342,892 1,612,672 1,537,033 723,954 334,319 1,486,010 114,322 33,474 8,573 126,662
Manyara 1,807,094 1,542,414 581,246 1,103,236 1,723,725 1,503,308 568,568 1,011,352 83,369 39,106 12,678 91,884
Njombe 267,681 113,681 21,747 851,730 218,715 103,006 19,874 668,125 48,966 10,675 1,873 183,605
Katavi 363,036 177,808 25,703 550,571 321,111 155,001 23,700 463,860 41,925 22,807 2,003 86,711
Simiyu 1,595,889 929,895 389,366 1,673,455 1,551,598 913,283 385,302 1,623,553 44,291 16,612 4,064 49,902
Geita 817,195 427,622 47,692 1,183,162 765,447 403,332 45,645 1,105,383 51,748 24,290 2,047 77,779

157
Table 12.9: Number of Households Involved in Fish Farming by Region by Rural and Urban
Areas; Tanzania Mainland, 2012 Census
Region Total Number of
Households
Households Involved in Fish Farming
Total Rural Urban
Tanzania Mainland 9,026,785 44,701 36,098 8,603
Dodoma 450,305 1,290 1,105 185
Arusha 376,336 1,196 905 291
Kilimanjaro 381,526 1,833 1,526 307
Tanga 435,583 2,263 1,865 398
Morogoro 501,794 2,334 1,884 450
Pwani 254,810 1,129 787 342
Dar es Salaam 1,083,381 1,788 - 1,788
Lindi 224,316 876 682 194
Mtwara 342,165 1,085 848 237
Ruvuma 300,005 5,494 4,515 979
Iringa 220,776 1,304 1,108 196
Mbeya 630,593 5,104 4,467 637
Singida 255,613 1,093 978 115
Tabora 379,770 1,627 1,484 143
Rukwa 198,011 1,798 1,539 259
Kigoma 370,374 1,656 1,436 220
Shinyanga 258,981 1,120 956 164
Kagera 521,028 2,993 2,754 239
Mwanza 481,107 2,056 1,537 519
Mara 308,483 1,852 1,623 229
Manyara 271,050 950 782 168
Njombe 168,982 1,203 1,040 163
Katavi 100,350 539 377 162
Simiyu 227,862 958 877 81
Geita 283,584 1,160 1,023 137