national central cooling company pjsc - tabreed.ae · saudi tabreed district cooling company ......
TRANSCRIPT
National Central Cooling Company PJSC(DFM:TABREED)
Q4 2017 and Full Year Earnings Presentation31 January 2018
NATIONAL CENTRAL COOLING COMPANY PJSC
• These materials have been prepared by and are the sole responsibility of theNational Central Cooling Company PJSC, ‘Tabreed’ (the “Company”). Thesematerials have been prepared solely for your information and for use at thecall/presentation to be made on 31 January, 2018. By attending themeeting/call where this presentation is made, or by reading the presentationslides, you agree to be bound by the following limitations
• These materials are confidential and may not be further distributed or passedon to any other person or published or reproduced, in whole or in part, by anymedium or in any form for any purpose. The distribution of these materials inother jurisdictions may be restricted by law, and persons into whose possessionthis presentation comes should inform themselves about, and observe, anysuch restrictions
• These materials are for information purposes only and do not constitute aprospectus, offering memorandum or offering circular or an offer to sell anysecurities and are not intended to provide the basis for any credit or any thirdparty evaluation of any securities or any offering of them and should not beconsidered as a recommendation that any investor should subscribe for orpurchase any securities. The information contained herein has not beenverified by the Company, its advisers or any other person and is subject tochange without notice and past performance is not indicative of future results.The Company is under no obligation to update or keep current the informationcontained herein
• No person shall have any right of action (except in case of fraud) against theCompany or any other person in relation to the accuracy or completeness ofthe information contained herein. Whilst the Company has taken all reasonablesteps to ensure the accuracy of all information, the Company cannot acceptliability for any inaccuracies or omissions. All the information is provided on an“as is” basis and without warranties, representations or conditions of any kind,either express or implied, and as such warranties, representation andconditions are hereby excluded to the maximum extent permitted by law
• The merits or suitability of any securities to any investor's particular situationshould be independently determined by such investor. Any such determinationshould involve inter alia, an assessment of the legal, tax, accounting,regulatory, financial, credit and other related aspects of any securities
• No person is authorized to give any information or to make any representationnot contained in and not consistent with these materials and, if given or made,such information or representation must not be relied upon as having beenauthorized by or on behalf of the Company
• These materials are not intended for publication or distribution to, or use byany person or entity in any jurisdiction or country where such distribution oruse would be contrary to local law or regulation. The securities discussed inthis presentation have not been and will not be registered under the U.S.Securities Act of 1933, as amended (the Securities Act) and may not be offeredor sold except under an exemption from, or transaction not subject to, theregistration requirements of the Securities Act. In particular, these materialsare not intended for publication or distribution, except to certain persons inoffshore transactions outside the United States in reliance on Regulation Sunder the Securities Act
• These materials contain information regarding the past performance of theCompany and its subsidiaries. Such performance may not be representative ofthe entire performance of the Company and its subsidiaries. Past performanceis neither a guide to future returns nor to the future performance of theCompany and its subsidiaries
• These materials contain, or may be deemed to contain, forward-lookingstatements. By their nature, forward- looking statements involve risks anduncertainties because they relate to events and depend on circumstances thatmay or may not occur in the future. The future results of the Company mayvary from the results expressed in, or implied by, the following forward lookingstatements, possibly to a material degree. Any investment in securities issubject to various risks, such risks should be carefully considered byprospective investors before they make any investment decisions. The directorsdisclaim any obligation to update their view of such risks and uncertainties orto publicly announce the result of any revision to the forward-lookingstatements made herein, except where it would be required to do so underapplicable law
Disclaimer
2

NATIONAL CENTRAL COOLING COMPANY PJSC
Agenda
1. Introduction and Performance Highlights
2. Financial Results
3. Conclusion
3

1. Introduction and Performance Highlights
NATIONAL CENTRAL COOLING COMPANY PJSC
Performance Highlights
5
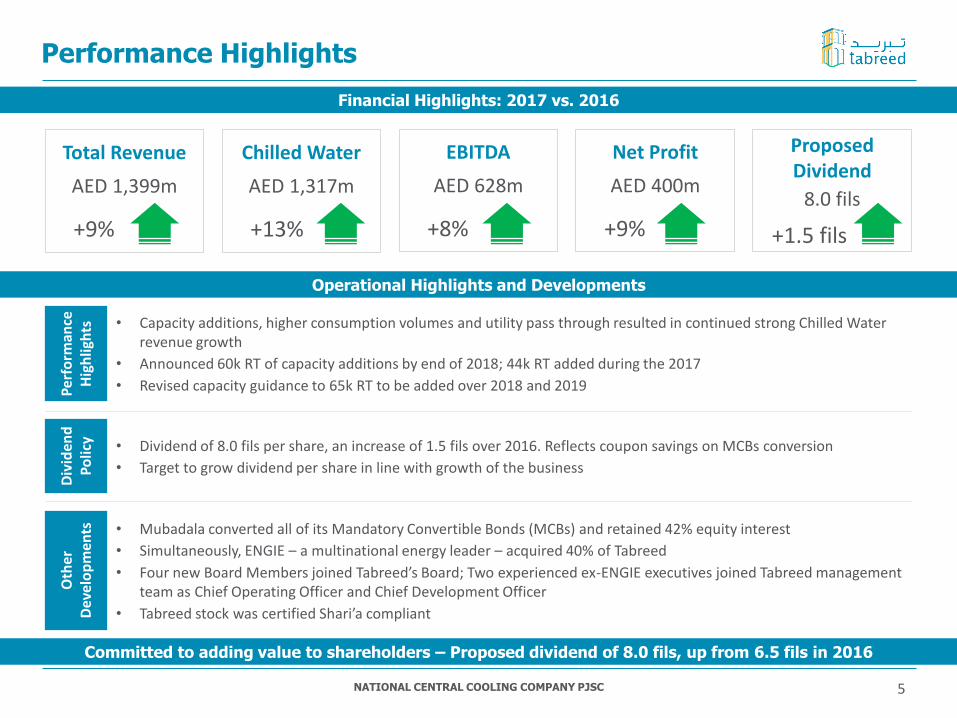
Financial Highlights: 2017 vs. 2016
Total Revenue
AED 1,399m
+9%
Chilled Water
AED 1,317m
+13%
EBITDA
AED 628m
+8%
Proposed Dividend
8.0 fils
+1.5 fils
Operational Highlights and Developments
Per
form
ance
H
igh
ligh
ts • Capacity additions, higher consumption volumes and utility pass through resulted in continued strong Chilled Water revenue growth
• Announced 60k RT of capacity additions by end of 2018; 44k RT added during the 2017
• Revised capacity guidance to 65k RT to be added over 2018 and 2019
Committed to adding value to shareholders – Proposed dividend of 8.0 fils, up from 6.5 fils in 2016
Div
iden
d
Po
licy • Dividend of 8.0 fils per share, an increase of 1.5 fils over 2016. Reflects coupon savings on MCBs conversion
• Target to grow dividend per share in line with growth of the business
Oth
er
Dev
elo
pm
ents • Mubadala converted all of its Mandatory Convertible Bonds (MCBs) and retained 42% equity interest
• Simultaneously, ENGIE – a multinational energy leader – acquired 40% of Tabreed
• Four new Board Members joined Tabreed’s Board; Two experienced ex-ENGIE executives joined Tabreed management team as Chief Operating Officer and Chief Development Officer
• Tabreed stock was certified Shari’a compliant
Net Profit
AED 400m
+9%
NATIONAL CENTRAL COOLING COMPANY PJSC
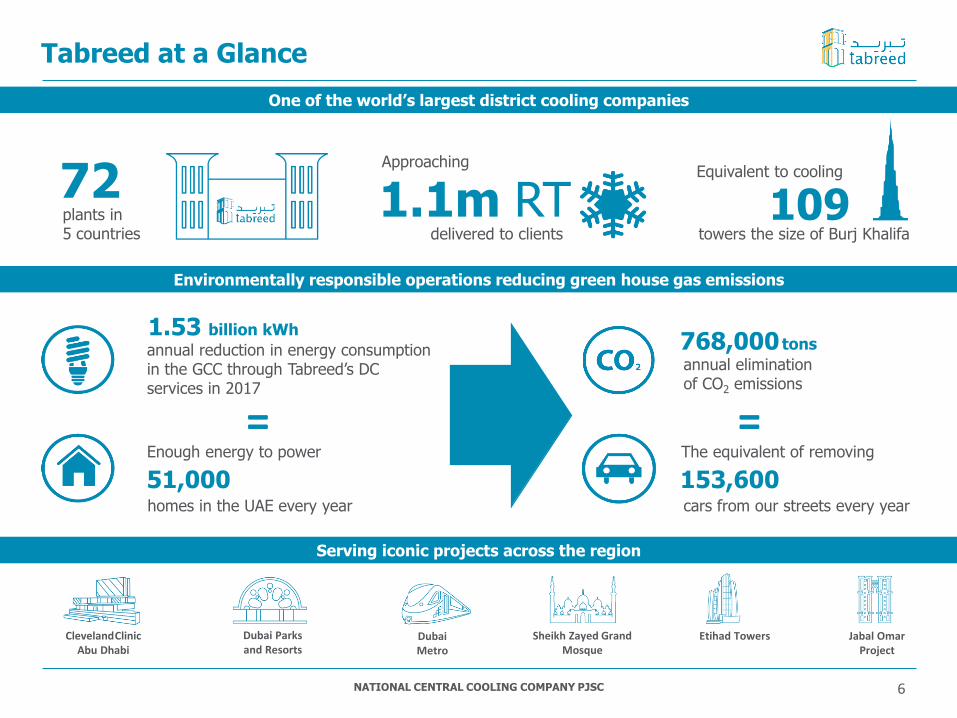
Tabreed at a Glance
6
Environmentally responsible operations reducing green house gas emissions
annual reduction in energy consumption in the GCC through Tabreed’s DC services in 2017
Enough energy to power
Serving iconic projects across the region
51,000homes in the UAE every year
=
1.53 billion kWh768,000 tons
annual elimination of CO2 emissions
=The equivalent of removing
153,600cars from our streets every year
1.1m RT
One of the world’s largest district cooling companies
109
DubaiMetro
ClevelandClinic Abu Dhabi
Jabal Omar Project
Sheikh Zayed Grand Mosque
Dubai Parks and Resorts
Etihad Towers
plants in 5 countries
72Approaching
delivered to clients
Equivalent to cooling
towers the size of Burj Khalifa
NATIONAL CENTRAL COOLING COMPANY PJSC
Regional Presence
7
Bahrain26k RTDiplomatic Area – 1
Qatar199k RTWest Bay – 2Pearl – 1
UAE771k RTAbu Dhabi – 38Dubai – 18Northern Emirates – 7
Oman17k RTKOM – 1 Lulu – 1Remal Castle – 1KSA
79k RTAramco – 1 Jabal Omar – 1
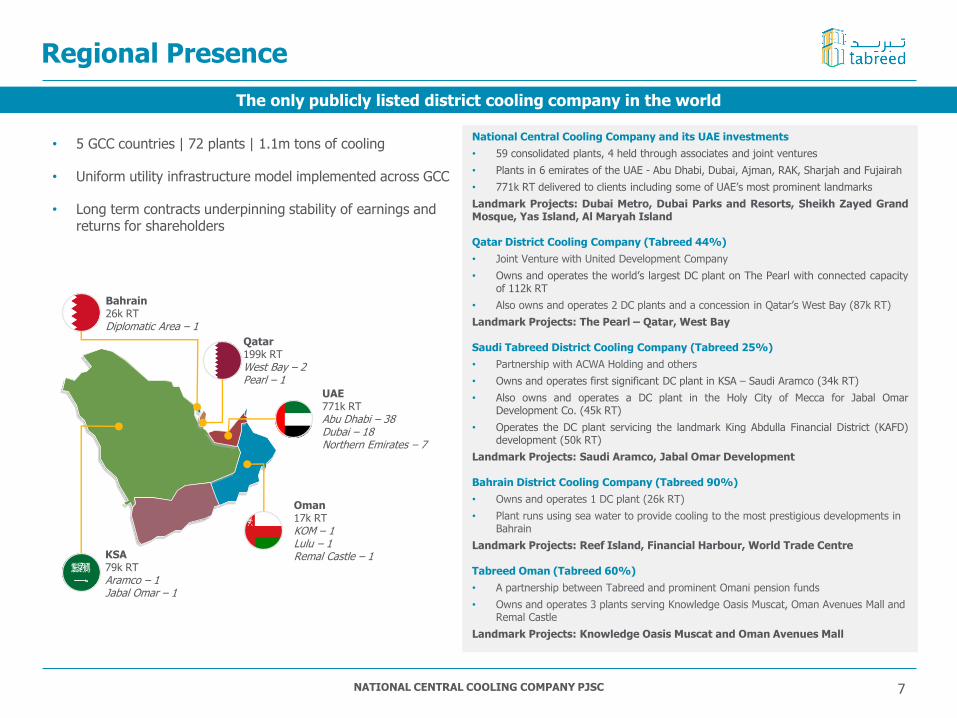
• 5 GCC countries | 72 plants | 1.1m tons of cooling
• Uniform utility infrastructure model implemented across GCC
• Long term contracts underpinning stability of earnings and returns for shareholders
National Central Cooling Company and its UAE investments
• 59 consolidated plants, 4 held through associates and joint ventures
• Plants in 6 emirates of the UAE - Abu Dhabi, Dubai, Ajman, RAK, Sharjah and Fujairah
• 771k RT delivered to clients including some of UAE’s most prominent landmarks
Landmark Projects: Dubai Metro, Dubai Parks and Resorts, Sheikh Zayed GrandMosque, Yas Island, Al Maryah Island
Qatar District Cooling Company (Tabreed 44%)
• Joint Venture with United Development Company
• Owns and operates the world’s largest DC plant on The Pearl with connected capacityof 112k RT
• Also owns and operates 2 DC plants and a concession in Qatar’s West Bay (87k RT)
Landmark Projects: The Pearl – Qatar, West Bay
Saudi Tabreed District Cooling Company (Tabreed 25%)
• Partnership with ACWA Holding and others
• Owns and operates first significant DC plant in KSA – Saudi Aramco (34k RT)
• Also owns and operates a DC plant in the Holy City of Mecca for Jabal OmarDevelopment Co. (45k RT)
• Operates the DC plant servicing the landmark King Abdulla Financial District (KAFD)development (50k RT)
Landmark Projects: Saudi Aramco, Jabal Omar Development
Bahrain District Cooling Company (Tabreed 90%)
• Owns and operates 1 DC plant (26k RT)
• Plant runs using sea water to provide cooling to the most prestigious developments in Bahrain
Landmark Projects: Reef Island, Financial Harbour, World Trade Centre
Tabreed Oman (Tabreed 60%)
• A partnership between Tabreed and prominent Omani pension funds
• Owns and operates 3 plants serving Knowledge Oasis Muscat, Oman Avenues Mall and Remal Castle
Landmark Projects: Knowledge Oasis Muscat and Oman Avenues Mall
The only publicly listed district cooling company in the world
NATIONAL CENTRAL COOLING COMPANY PJSC
Connected Capacity
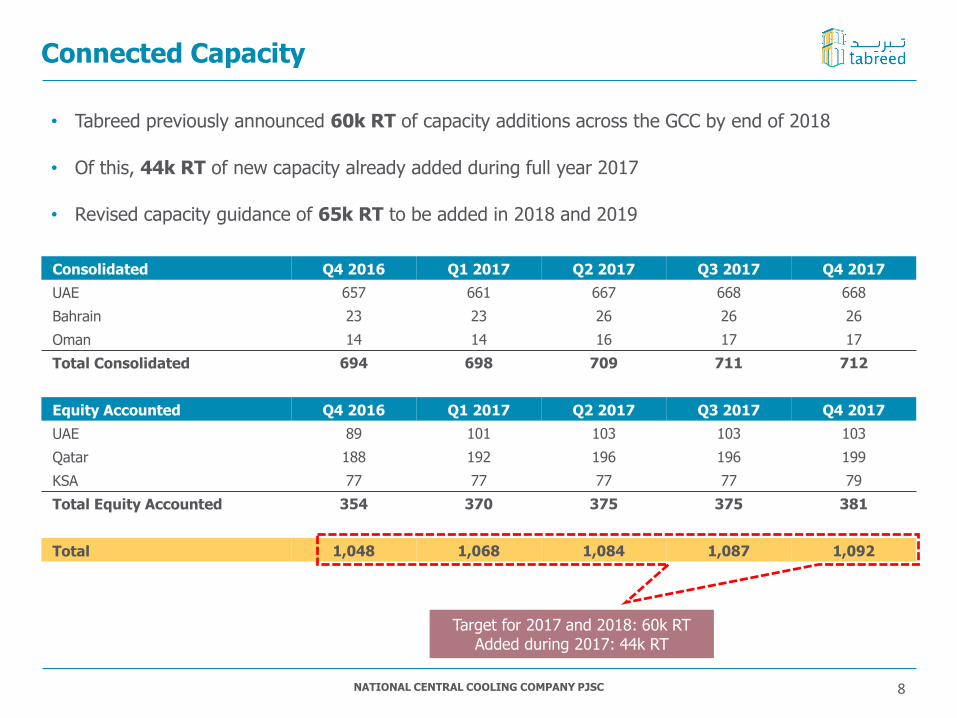
• Tabreed previously announced 60k RT of capacity additions across the GCC by end of 2018
• Of this, 44k RT of new capacity already added during full year 2017
• Revised capacity guidance of 65k RT to be added in 2018 and 2019
8
Consolidated Q4 2016 Q1 2017 Q2 2017 Q3 2017 Q4 2017
UAE 657 661 667 668 668
Bahrain 23 23 26 26 26
Oman 14 14 16 17 17
Total Consolidated 694 698 709 711 712
Equity Accounted Q4 2016 Q1 2017 Q2 2017 Q3 2017 Q4 2017
UAE 89 101 103 103 103
Qatar 188 192 196 196 199
KSA 77 77 77 77 79
Total Equity Accounted 354 370 375 375 381
Total 1,048 1,068 1,084 1,087 1,092
Target for 2017 and 2018: 60k RTAdded during 2017: 44k RT
NATIONAL CENTRAL COOLING COMPANY PJSC
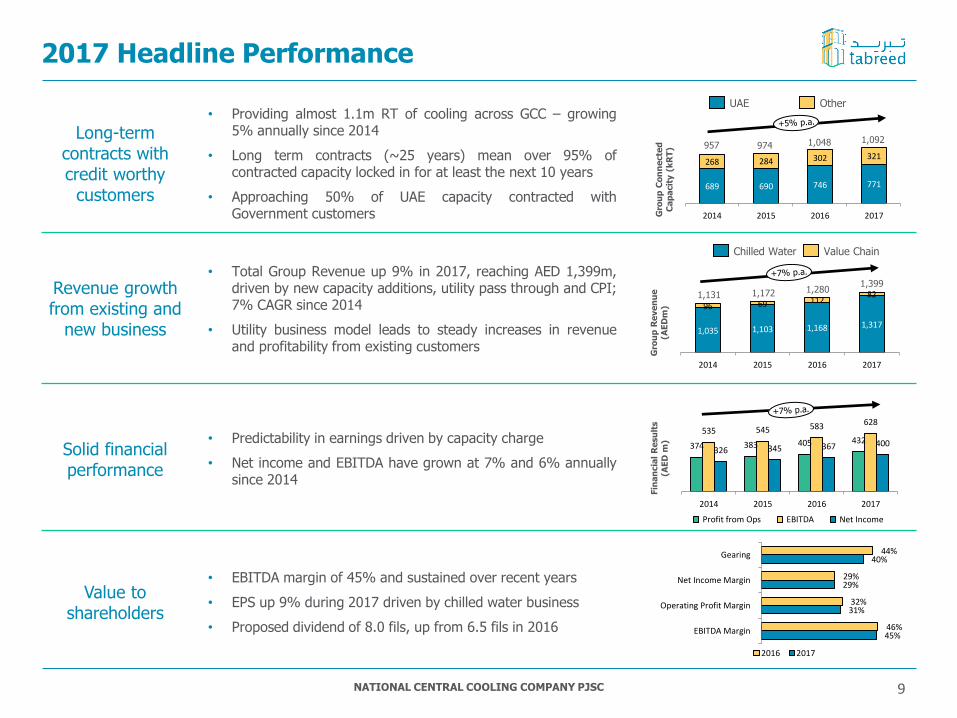
1,035 1,103 1,168 1,317
96 69 112 82
2014 2015 2016 2017
2017 Headline Performance
1,3991,1721,131
1,280
1,0921,048957 974
Fin
an
cia
l R
esu
lts
(AE
D m
)
Gro
up
Re
ve
nu
e
(AE
Dm
)G
rou
p C
on
ne
cte
d
Ca
pa
cit
y (
kR
T)
Chilled Water Value Chain
Revenue growth from existing and
new business
• Total Group Revenue up 9% in 2017, reaching AED 1,399m,driven by new capacity additions, utility pass through and CPI;7% CAGR since 2014
• Utility business model leads to steady increases in revenueand profitability from existing customers
Solid financial performance
• Predictability in earnings driven by capacity charge
• Net income and EBITDA have grown at 7% and 6% annuallysince 2014
Long-term contracts with credit worthy
customers
• Providing almost 1.1m RT of cooling across GCC – growing5% annually since 2014
• Long term contracts (~25 years) mean over 95% ofcontracted capacity locked in for at least the next 10 years
• Approaching 50% of UAE capacity contracted withGovernment customers
Value to shareholders
• EBITDA margin of 45% and sustained over recent years
• EPS up 9% during 2017 driven by chilled water business
• Proposed dividend of 8.0 fils, up from 6.5 fils in 2016
9
374 383 405 432 535 545 583 628
326 345 367 400
2014 2015 2016 2017
Profit from Ops EBITDA Net Income
45%
31%
29%
40%
46%
32%
29%
44%
EBITDA Margin
Operating Profit Margin
Net Income Margin
Gearing
2016 2017
689 690 746 771
268 284 302 321
2014 2015 2016 2017
UAE Other
2. Financial Results
NATIONAL CENTRAL COOLING COMPANY PJSC
2017 Income Statement
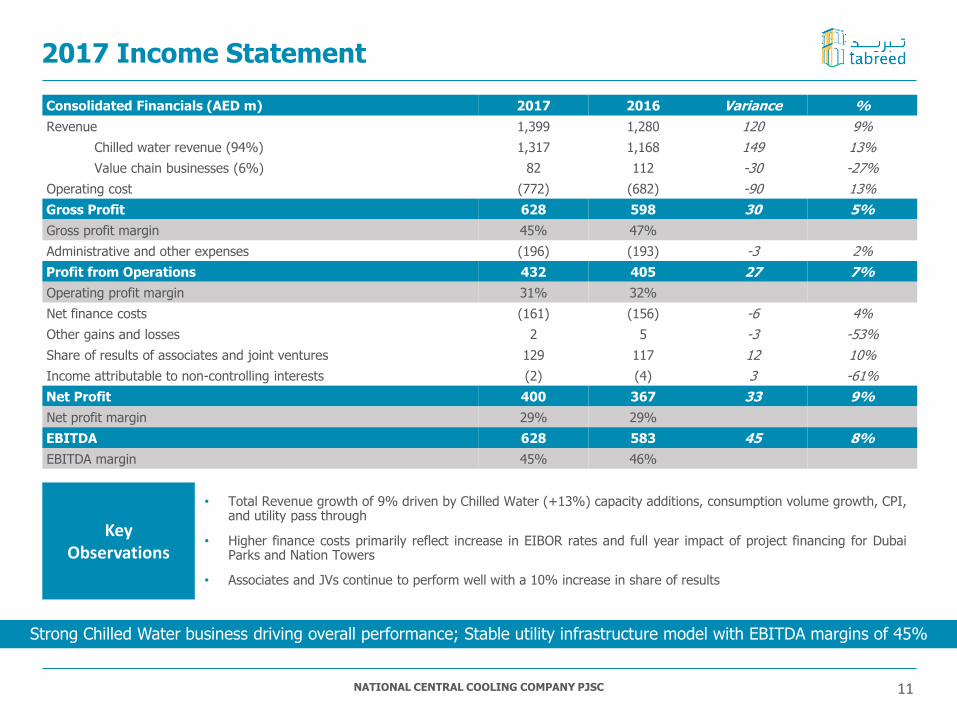
• Total Revenue growth of 9% driven by Chilled Water (+13%) capacity additions, consumption volume growth, CPI,and utility pass through
• Higher finance costs primarily reflect increase in EIBOR rates and full year impact of project financing for DubaiParks and Nation Towers
• Associates and JVs continue to perform well with a 10% increase in share of results
11
Consolidated Financials (AED m) 2017 2016 Variance %
Revenue 1,399 1,280 120 9%
Chilled water revenue (94%) 1,317 1,168 149 13%
Value chain businesses (6%) 82 112 -30 -27%
Operating cost (772) (682) -90 13%
Gross Profit 628 598 30 5%
Gross profit margin 45% 47%
Administrative and other expenses (196) (193) -3 2%
Profit from Operations 432 405 27 7%
Operating profit margin 31% 32%
Net finance costs (161) (156) -6 4%
Other gains and losses 2 5 -3 -53%
Share of results of associates and joint ventures 129 117 12 10%
Income attributable to non-controlling interests (2) (4) 3 -61%
Net Profit 400 367 33 9%
Net profit margin 29% 29%
EBITDA 628 583 45 8%
EBITDA margin 45% 46%
Strong Chilled Water business driving overall performance; Stable utility infrastructure model with EBITDA margins of 45%
Key Observations
NATIONAL CENTRAL COOLING COMPANY PJSC
2017 Financial Position
12
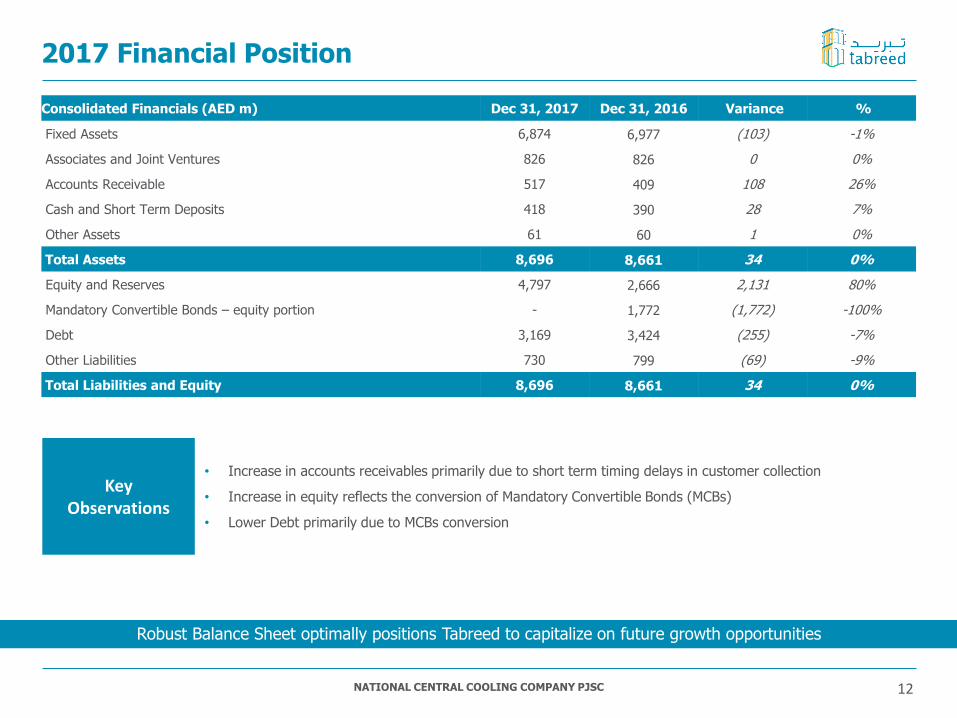
• Increase in accounts receivables primarily due to short term timing delays in customer collection
• Increase in equity reflects the conversion of Mandatory Convertible Bonds (MCBs)
• Lower Debt primarily due to MCBs conversion
Robust Balance Sheet optimally positions Tabreed to capitalize on future growth opportunities
Consolidated Financials (AED m) Dec 31, 2017 Dec 31, 2016 Variance %
Fixed Assets 6,874 6,977 (103) -1%
Associates and Joint Ventures 826 826 0 0%
Accounts Receivable 517 409 108 26%
Cash and Short Term Deposits 418 390 28 7%
Other Assets 61 60 1 0%
Total Assets 8,696 8,661 34 0%
Equity and Reserves 4,797 2,666 2,131 80%
Mandatory Convertible Bonds – equity portion - 1,772 (1,772) -100%
Debt 3,169 3,424 (255) -7%
Other Liabilities 730 799 (69) -9%
Total Liabilities and Equity 8,696 8,661 34 0%
Key Observations

NATIONAL CENTRAL COOLING COMPANY PJSC 13
• Operating cash generation remains strong due to higher profitability
• Capital expenditure included AED 100m paid to ICT for the acquisition of Nation Towers plant
• Higher interest payments due to increase in EIBOR rates and full year impact of project financing for DubaiParks and Nation Towers
• Healthy cash balance of AED 418m at the end of 2017
Strong cash flow generation from long term price certain contracts enabling investment in growth
Consolidated Financials (AED m) 2017 2016 Variance %
Profit from Operations 432 405 27 7%
Finance lease amortization 56 48 7 15%
Depreciation 140 129 11 8%
Working Capital and Other adjustments (73) (30) (43) 146%
Net cash flows from Operating Activities 555 554 2 0%
Capital expenditure incurred (198) (196) (2) 1%
Investments in JVs - (92) 92 -100%
Dividends and interest income received 123 76 46 61%
Proceeds from land sale in Oman - 11 (11) -100%
Net cash flows from Investing Activities (74) (200) 126 -63%
Loans drawn down and principal repayments (net) (67) 217 (283) -131%
Interest payments (144) (122) (22) 18%
MCB cash coupon paid (43) (86) 43 -50%
Others (199) (166) (33) 20%
Net cash flows from Financing Activities (453) (157) (295) 188%
Net Movement in Cash and Cash Equivalents 28 197 (169) -86%
Cash and Cash Equivalents at the start of the period 390 193 197 102%
Cash and Cash Equivalents at 31 December 418 390 28 7%
2017 Cash Flow Statement
Key Observations
NATIONAL CENTRAL COOLING COMPANY PJSC
Debt Portfolio
14
Net Debt Profile (AED m)
Net Debt to EBITDA (x) Debt Maturity Profile (AED m)
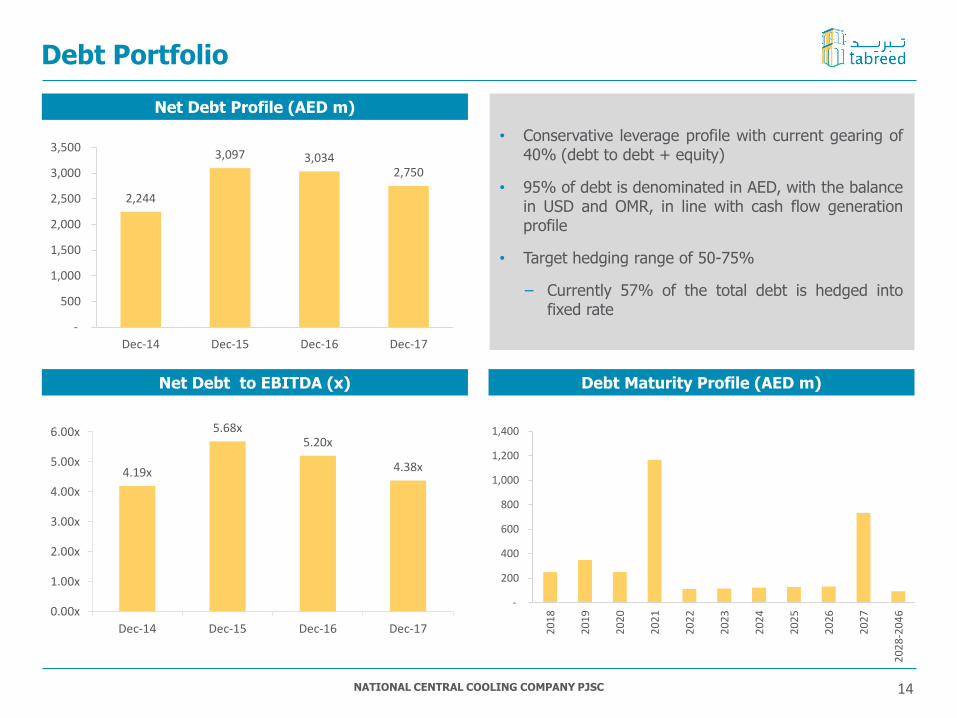
• Conservative leverage profile with current gearing of40% (debt to debt + equity)
• 95% of debt is denominated in AED, with the balancein USD and OMR, in line with cash flow generationprofile
• Target hedging range of 50-75%
− Currently 57% of the total debt is hedged intofixed rate
2,244
3,097 3,034 2,750
-
500
1,000
1,500
2,000
2,500
3,000
3,500
Dec-14 Dec-15 Dec-16 Dec-17
4.19x
5.68x5.20x
4.38x
0.00x
1.00x
2.00x
3.00x
4.00x
5.00x
6.00x
Dec-14 Dec-15 Dec-16 Dec-17
-
200
400
600
800
1,000
1,200
1,400
20
18
20
19
20
20
20
21
20
22
20
23
20
24
20
25
20
26
20
27
20
28
-20
46

3. Conclusion

NATIONAL CENTRAL COOLING COMPANY PJSC
Why Tabreed?
• One of the largest district cooling companies in the world with experienced management team
• 20 years of excellent operational performance, on-time delivery of projects and expertise in financing DC assets
• Relationships with Government and key real estate developers across the region
• A strong shareholder base with Mubadala and ENGIE providing support to operations and growth
• Shari’a complaint status to Tabreed stock could potentially enhance liquidity and shareholder base
Seeking and investing in
opportunities across GCC
• Focus on stable Chilled Water leading to enhanced value from existing plants and increasing operational efficiencies
• Seeking and investing in organic and inorganic projects across the GCC
• De-risking projects by using “take or pay” fixed date contracts and ring-fenced project financing
Robust Financial Results
• Sustainable, stable and predictable results, low operating risk business model with strong margins
• Net income and EBITDA growth of 7% and 6% annually since 2014, driven by capacity additions and CPI pass through
• Stable utility infrastructure business model enables consistent YTD performance with ~45% EBITDA margins
Track record of delivering
capacity growth
• 131k RT capacity added since 2014
• 60k RT of signed up capacity additions expected by the end of 2018, 44k RT delivered in 2017
• Regional footprint allows access to varied growth opportunities
• Operational track record, customer relationships and financial strength to benefit from growth in the region
Why District Cooling?
• District Cooling is a critical part of the growing GCC infrastructure
• District Cooling is 50% more efficient in consuming electricity than conventional cooling reducing energy consumption,carbon footprint, and state subsidies while also being 16% cheaper for the customer
Unique GCC-wide Infrastructure Assets Company
16

NATIONAL CENTRAL COOLING COMPANY PJSC
Management looks forward to engaging with shareholders and investors at the following events
EFG - The 14th Annual One on One Conference, Dubai 5 March – 7 March 2018
First quarter earnings call End of April 2018
Second quarter earnings call End of July 2018
Third quarter earnings call End of October 2018
Arqaam Investors Conference November 2018
Saket Somani Churchgate Partners
Tel: +971 4 3132432Email: [email protected]
Richard RoseVP – Finance
Rachel EmmettSr. Manager – Treasury & IR
Leila Al Marashi VP – Corporate Communications
Tel: +971 2 2020400
Email: [email protected]
Tel: +971 2 2020433
Email: [email protected]
Tel: +971 2 2020399
Email: [email protected]
Contact Us

Appendices

NATIONAL CENTRAL COOLING COMPANY PJSC
Stable Core Business Model Delivering Consistent
Performance
Chilled WaterCapacity (fixed)
Consumption (variable) Total
Revenue, net of amortization 60 40 100
Utility Costs (35) (35)
Plant operation & maintenance (11) (11)
Depreciation (9) (9)
Gross Profit 40 5 45
Corporate overheads (13) (13)
Profit from Operations 27 5 32
Add: Depreciation & amortisation 14 14
EBITDA 42 5 47
EBITDA Margin 69% 13% 47%
2017 Profit Statement (% of revenue)
• Tabreed bills customers for capacity
(fixed) charges and consumption
(variable) charges
• Capacity charges reflect the cooling
capacity (in RT) reserved for the
customer and are generally fixed,
subject to escalation based on
country CPI every year
• Consumption charges recover the
cost of cooling consumed.
Contractually, any change in
variable cost is generally passed
through to the customers
• Tabreed’s EBITDA is driven by
capacity charges allowing recovery
of plant operation cost, corporate
overheads and providing a strong
return on capital invested
Billing structure and profitability
60% 40%
60% of the revenue
is fixed
Only 33% of the cost is against fixed
revenue, rest is passed through
Hence, 89% of the EBITDA
is from capacity revenue
ConsumptionCapacity
19
33% 67% 89% 11%