national climate change impact survey 2016cbs.gov.np/image/data/2017/national climate change...
TRANSCRIPT

National Climate Change Impact Survey 2016A Statistical Report
Government of NepalNational Planning Commission Secretariat
Central Bureau of Statistics

Government of NepalNational Planning Commission Secretariat
Central Bureau of Statistics
National Climate Change Impact Survey 2016A Statistical Report

Published byGovernment of NepalCentral Bureau of StatisticsP.O. Box: 11031Ramshah Path, ThapathaliKathmandu, Nepal
Phone: 4245946, 4245947, 4245948 Fax: 977-1-4227720E-mail: [email protected]: www.cbs.gov.np
ISBN: 978-9937-0-2573-7
Design and Print: Print Communication Pvt. Ltd.Thapathali, Kathmandu, Nepal, [email protected]
Printed in Nepal
April, 2017 (500 Copies)
Suggested Citation:CBS, 2017. National Climate Change Impact Survey 2016. A Statistical Report. Central Bureau of Statistics, Kathmandu, Nepal
Technical support:
For more information, please email [email protected] visit our website at www.actiononclimate.today
ACT (Action on Climate Today) is a UK Department for International Development (DFID) funded initiative that aims to work in partnership with the governments of Afghanistan, Bangladesh, India, Nepal and Pakistan. Over the next two years, the programme will help these countries to integrate climate change into policies, plans and budgets, and to attract further climate change investment from the public and private sector. Managed by Oxford Policy management, ACT brings together two DFID programmes: the Climate Proofing Growth and Development (CPGD) programme and the Climate Change Innovation programme (CCIP). In Nepal, it is led by Practical Action.

Message
It is my pleasure to note that first time a publication on the National Climate Change Impact Survey has been published by the Central Bureau of Statistics. Indeed, the Report is a great contribution to the analysis of impact of climate change in Nepal. The climate related data and information play a key role in the preparation and implementation of plans, policies, programmes and projects in the country. Furthermore, this analytical report would also provide a comprehensive picture of the climatic situation of the country and presents an important instrument for policy integration and assist in informed decision making.
As the country is committed to the Sustainable Development Goals (SDGs), this report could be important source of information to develop indicators related to some of the SDGs set.
On behalf of the National Planning Commission, I would like to extend my sincere thanks to Central Bureau of Statistics and all those who have contributed directly and indirectly in the preparation of this report.
Dr. Prabhu Budhathoki Member
National Planning Commission
April, 2017

iv | National Climate Change Impact Survey 2016

Foreword
April, 2017
Tel: 4211032, 4211143, 4211053, 4211053, Fax: 4211700, E-mail: [email protected] Website: www.npc.gov.np
Environment is a cross cutting issue and plays a pivotal role in achieving sustainable development goals. As it is widely acknowledged, climate change is one of the major issues of the environment management. The report of the National Climate Change Impact Survey aims to serve as a solid reference material for policy makers and professionals of the fields of environment to increase awareness and knowledge of the climate change situation of the country. The need for improvements in the field of data and statistics to monitor status and progress on the Sustainable Development Goals (SDGs) and the associated need for statistical capacity building in developing countries have been highly recognized.
The environmental problems in Nepal are as diverse as its geography and climate. The Government of Nepal has accorded high priority to environmental issues since they trigger profound and multiplier impact on the livelihood of the millions of people who depend on ecosystem services. Accordingly, the government has formulated policies, strategies and programmes keeping in mind the notion of sustainable development.
I am delighted to know that the Report on National Climate Change Impact Survey conducted by the Central Bureau of Statistics has captured almost all aspects of climate change, their imapcts on the socio-economic and other aspect of human lives and livlihoods in the context of Nepal is committed to the Post 2015 Development Agenda and SDGs and is in the course of their implementation through the 14th Three Year Periodic Plan(2073/74-2075/76). In this backdrop, it is very much expected that of this report findings of this report would be immensely useful for the government and other development stakeholders who are involved in policy arena. Likewise, the findings may be beneficial to researches associated in the relevant domain.
I would like to thank the Central Bureau of Statistics, the members of the Technical Committee and many others who in various ways contributed to the preparation of this report up to this mark.
Chandra Kumar Ghimire Secretary
National Planning Commission Secretariat

vi | National Climate Change Impact Survey 2016

National Climate Change Impact Survey 2016 | vii
The Government of Nepal is committed to combating climate change and achieving Sustainable Development Goals (SDGs). Robust indicators are prerequisite to measure the progress on government’s efforts towards reducing climate change impacts and progress on development.
The Central Bureau of Statistics (CBS) conducted a National Climate Change Impact Survey (NCCIS) in 2016 to complement the Government of Nepal’s initiatives in sustainable development and climate change adaptation.The survey aimed at addressing the data gap as well as providing information on climate change making it available for different users. The data obtained from the survey is expected to be useful for different initiatives in the national development plan and programs. It is also expected that the information provided by this report would be helpful for assessing impact of climate induced events on people’s livelihood and their adaptive capacity.
On behalf of CBS, I would like to extend my sincere gratitude to all the respondents who generously spared their time and cooperated with us by supplying their intimate information to make the survey a success. Members of the Technical Committee have provided invaluable inputs in all phases of the survey, I am equally thankful to them.
I would like to thank Dr. Rudra Suwal, Deputy Director General of the bureau for his overall guidance and supervision of the NCCIS programme. Mr. Sushil Kumar Sharma, Director, Environment Statistics Section deserves special thanks for working hard to accomplish the tasks of the survey and bringing out this publication on time. I would like to thank Mr. Dhundi Raj Lamichhane, Director of the Environment Statistics Section for his contribution. My sincere thanks go to Mr. Dol Naraya Shrestha, Computer Officer, Statistical Officers Mr. Tulasi Prasad Paudel and Mr. Tej Kumar Darlami and Statistical Assistant Mr. Bhim Bahadur Shakha for their sincere involvement in different phases of the survey operations. Similarly, my appreciation goes to all the members of data collection teams and other personnel from CBS and Statistics Offices who contributed to the survey. I also would like to express my sincere thanks to the thematic experts team led by Mr. Madhu Sudan Gautam for their inputs in various stages of the survey.
I appreciate the funding and technical support provided by ACT—Action on Climate Today - a UK AID funded initiative led by Oxford Policy Management Limited and Practical Action in Nepal.
Finally, I would like to request all users to provide any valuable comments and suggestions for improving our publications in future.
Suman Raj AryalDirector General
Central Bureau of Statistics
Preface
April, 2017

viii | National Climate Change Impact Survey 2016
ABBREVIATIONS x
EXECUTIVE SUMMARY xi
1. INTRODUCTION 1
2. THEMATIC SECTORS 3
3. METHODOLOGY 6 3.1. Introduction 6 3.2. Objectives of the Survey 6 3.3. Survey Framework 6 3.4. Survey Scope 7 3.5. Statistical Unit 7 3.6. Coverage 7 3.7. Sample Design 7 3.8. Weights 10 3.9. Pre-Survey Activities 11 3.10. Field Work Organisation 12 3.11. Data Management 12 3.12. Analytical Domains 13
4. HOUSEHOLD AND POPULATION CHARACTERISTICS 14 4.1. Summary of Findings 14 4.2. Personal and Household Information 16 4.3. Socioeconomic Characteristics 19
5. PERCEPTION OF CLIMATE CHANGE 30 5.1. Summary of Findings 30 5.2. Perception on Climate Change 31 5.3. Changes in Monsoon and Winter Precipitation 37 5.4. Changes in Summer and Winter Temperature 39 5.5. Changes in Onset of Summer and Winter Season 42 5.6. Changes in Monsoon And Winter Precipitation 44
Table of Contents

National Climate Change Impact Survey 2016 | ix
6. CLIMATE INDUCED DISASTERS AND IMPACT 46 6.1. Summary of Findings 46 6.2. Changes in Climate Induced Disasters 47 6.3. Impacts of Climate Induced Disasters 56 6.4. Reasons of Climate Induced Disasters 71 6.5. Impacts of Climate Induced Disasters in Daily Life 82 6.6. Food Scarcity 105 6.7. Economic Loss due to Climate Induced Disasters 113
7. CLIMATE CHANGE IMPACT ON HUMAN HEALTH, CROPS, AND LIVESTOCK 116 7.1. Summary of Findings 116 7.2. Impacts on Crops 117 7.3. Impacts on Livestock 120 7.4. Impacts on Human Health 122
8. CLIMATE CHANGE AND NATURAL RESOURCES: WATER AND BIODIVERSITY 128 8.1. Summary of Findings 128 8.2. Impacts on Water Resources 130 8.3. Impacts on Plant and Animal Species 142 8.4. Emergence of New Invasive Plant Species 160
9. CLIMATE CHANGE AND TOURISM 183 9.1. Summary of Findings 183 9.2. Description of Results 183
10. ADAPTATION MEASURES 188 10.1. Summary of Findings 188 10.2. Farm Based Adaptation 189 10.3. Off-farm Based Adaptation 210
REFERENCES 217
ANNEXES 218 ANNEX 1. Glossary of Terminologies 218 ANNEX 2. Survey Questionnaire 221

x | National Climate Change Impact Survey 2016
CBS Central Bureau of Statistics EFLG Environment-Friendly Local GovernanceGDP Gross Domestic ProductGLOF Glacial Lake Outburst FloodGoN Government of NepalHa HectareHHs HouseholdsIPCC Intergovernmental Panel on Climate ChangeKm KilometreLAPA Local Adaptation Plans for ActionMoPE Ministry of Population and EnvironmentMW Mega WattNAP National Adaptation PlanNAPA National Adaptation Programme of ActionNCCIS National Climate Change Impact SurveyNPC National Planning CommissionNRREP National Rural Renewable Energy ProgrammeNTFPs Non Timber Forest ProductsNRM Natural Resource ManagementNRs Nepalese RupeesPPS Probability Proportionate to SizePSUs Primary Sampling UnitsREDD+ Reducing Emissions from Deforestation and Forest DegradationSDGs Sustainable Development GoalsSLC School Leaving CertificateSO Statistics OfficeSPSS Statistical Package for the Social SciencesUNFCCC United Nations Framework Convention on Climate Change
Abbreviations

National Climate Change Impact Survey 2016 | xi
Climate change impacts have become highly visible affecting different aspects of human society and ecosystem across the globe. Climate change impact has been experienced in different sectors in Nepal including agriculture, forests and biodiversity, water resources and energy. While several policies have been devised at the central level, effective implementation of such policies and plans at local and community level is a challenge due to limitations including lack of availability of integrated and reliable data and information on different facets of climate change impacts. Aiming to contribute on bridging such gap and making it available while needed for regular planning process, under Central Bureau of Statistics (CBS) of Government of Nepal (GoN) conducted a National Climate Change Impact Survey (NCCIS) from July to December, 2016.
The survey provides data and knowledge on impact and effect of climate change considering multiple dimensions. The data includes broad topics such as demography, household income, level of education, knowledge and perception about climate change, climate induced disasters and socioeconomic impacts, natural resources and bio-diversity (changes in the floristic behavior, water resources, invasion species, etc.), climate change and health (animals and humans), and adaptation practices (farm and off-farm) adopted by households to cope with adverse situation created due to changing climate.
For the survey, 75 districts were grouped into three ecological belts running from north to south – the mountains, the hills and the Terai. Each ecological belt was further divided into five development regions – eastern, central, western, mid-western and far-western region. Thus, 15 eco-development regions (or inter-regions) were formed by the cross combination of three ecological belts and five development regions. Kathmandu Valley was treated as separate stratum and as a whole 16 strata was formed. To get reliable information on climate change, households which had respondents aged 45 or above and living in the same locality for at least 25 years were only considered eligible for the survey. The survey enumerated 5,060 sample
EXECUTIVE SUMMARY
households from 253 Primary Sampling Units (PSUs) from all 16 strata of the country.
This survey shows that female population (52.40%) is higher than male population (47.60%). The total average household size was 5.05 in which percentage of male (81.65%) as household head is higher than female (18.35%). Illiterate respondents are 45.31 per cent. Similarly, agriculture is found to be the major occupation as well as main source of income of households. Majority of households (87.1%) resides within 5 km of motorable road. 88.9 per cent households reported that nearest health institution is within 5 km from their residence. Similarly, 92.1 per cent households reported that it takes up to 5 km to reach nearest high school and 69.8 per cent reported that it takes up to 5 km to reach nearest market centre. Further, 84.8 per cent households of urban area are within 5 km distance from the nearest agriculture centre whereby this figure diminishes to 59.7 per cent households in rural areas. Further result shows that 63.4 per cent households do not use any kind of machinery in agriculture.
The survey reveals that 49.33 per cent households have heard about climate change out of which 42.82 per cent households got information on climate change through radio while 27.63 per cent through television. Majority of the respondents observed that deforestation, natural disaster, and human intervention as major causes for climate change.
Overall, maximum percentage of households (86.1%) reported experiencing drought in past 25 years. Similarly, most of the households have observed change in temperature as well as decrease in monsoon duration and winter rain. Highest percentage of households (84.58%) reported the monsoon is delayed by 1 to 4 weeks while 57.14 per cent households observed delay on winter rain by 1 to four weeks.
Almost all households (99.33%) reported that they have observed increase in drought as climate induced disaster in past 25 years. Similarly, 97.69 per cent households observed increase in disease/insects and sporadic rain. Additionally, 78.12
xii | National Climate Change Impact Survey 2016
per cent households have observed an increase on incidence of landslides in 25 years. All the households in central mountain region reported an increase in cold wave while all of them in central hill observed a decrease in cold wave. Likewise, 56.25 per cent of eastern Terai households have observed an increase in hot wave whereas none in eastern hill reported so.
Similarly, 100 per cent of sub-alpine households perceived an increase in drought, landslide, avalanche, and Disease/insect whereby majority (64.05%) in temperate zone observed an increase in fire in settlement in the last 25 years.
The survey reveals that maximum households (60.25%) have observed new Disease emerging on crops. Moreover, maximum households (66.09%) observed appearance of new insects. Similarly, 45.98 per cent households observed appearance of new Disease in livestock. Furthermore, nearly one fifth (18.59%) of the households stated that they frequently suffer from vector borne Disease whereas one fifth (20.67%) of the households are suffering from waterborne Disease.
The survey result shows that 74.29 per cent of total households have observed changes in water sources whereby 84.47 per cent observed decrease in amount of surface water. On the other hand, 79.64 per cent households in urban area and 68.12 per cent in rural area reported decrease in water quality. Likewise, majority of households (74.56%) in mountain region have reported complete drying up of surface water and high percentage (48.81%) in hill area observed complete drying up of the underground water sources. Such changes in water sources have been reported due to insufficient rainfall. Majority of households from all climatic zones perceived that trees, shrubs, medicinal herbs, non-timber products, aquatic animals, aquatic plants, wild animals, and birds are decreasing whereas grass and insects are increasing.
Majority of households have reported an increase in invasive species of shrubs. Highest percentage of households (92.03%) observed invasive creepers in agricultural land among which 92.03 per cent of households perceived that it has contributed to decrease in their income. Highest proportion of households of first quintile (86.3%) and fifth quintile
(89.8%) income group reported that creepers on land have decreased household income. Households opined that those invasive species have spread due to natural causes rather than human activities.
Likewise, majority of households across all regions and strata observed early flowering/fruiting of plants. Across all the climatic zones, 50.63 per cent of households observed early flowering/fruiting in fruit species in temperate zone followed by 40.83 per cent in sub-tropical.
Only 20.61 per cent households reported that touristic sites lie in their areas out of which 95 per cent households have reported having touristic sites from sub-alpine zone. Majority of households (62.68%) have observed an increase in the number of tourists in the last 25 years. Households who observed a decrease in length of stay of tourists have opined that lack of proper hotel facilities is the major reason for such decrease.
The survey result demonstrates that households have been adopting various climate change adaptation measures during the past 25 years. Among the 25 farm and 7 off-farm based adaptation measures identified, most of the households reported use of chemical fertilisers, additional investment to protect livestock from Disease, mixed cropping, and trying to cultivate improved crops varieties. Majority of rural households have been using more adaptation practices in comparison to urban households. Whereas more households of urban setting are seen adopting several adaptation techniques. Among the urban households, 13.9 per cent received skill development trainings; only 1 per cent insured agricultural crops and 5 per cent relied only on livestock as adaptation measure. The highest proportion of illiterate (65.46%) and first quintile (69.38%) respondents reported using chemical fertiliser in their farmland as adaptation measure.
Majority of households have also taken different off-farm based adaptation techniques. A total of 70.64 per cent households reported that they have changed the food consumption habit to adapt to climate change impacts while 49.86 per cent have involved in road infrastructure improvement whereas 56.72 per cent engaged in community based natural resource management.

National Climate Change Impact Survey 2016 | 1
Climate change impacts have become highly visible affecting different aspects of human society and ecosystem across the globe. Rapid increase in earth’s surface temperature and changing precipitation pattern has resulted in direct implication to multiple sectors and livelihood of communities. The poorest and vulnerable people are being affected the most.
The Intergovernmental Panel on Climate Change (IPCC) has predicted 3.7 to 4.8 °C of warming if the business as usual continues (IPCC, 2014). The continuous increase in greenhouse gas emission due to anthropogenic pressure would further amplify the rate of increase in temperature and intensify the frequency of extreme weather events including floods, droughts, changing rainfall pattern, water resources depletion, and severe heat/cold waves. It has posed the global communities specially the poorest households more vulnerable to climate change.
A number of international intergovernmental policy instruments have been set up to tackle climate risks and hazards. These initiatives include establishment of IPCC, enforcement of United Nations Framework Convention on Climate Change (UNFCCC), and its subsequent decisions including the Paris Agreement in 2015.
Nepal has experienced direct impacts of climate change and is one of the most vulnerable countries to climate change in the world. The data trend from 1975 to 2005 shows that the mean annual temperature has been increasing by 0.06 °C while the mean rainfall has been decreasing by 3.7 mm (-3.2%) per month per decade (MoPE, 2016). Similarly, mean annual temperature is predicted to be increased between 1.3 °C to 3.8 °C by the 2060’s and 1.8 °C to 5.8 °C by the 2090’s while annual precipitation could reduce by the range of 10 to 20 per cent across the country (MoPE, 2010).
Climate change impact has been experienced in different sectors in Nepal. One of the visible impacts is observed in the glaciers and glacial lakes in the
Himalayas which are changing in an unprecedented rate. Studies have shown that Himalayan glaciers are retreating fast with the annual rate of about 10 to 60 m that has caused vanishing of small glaciers of less than 0.2 km2. Similarly, change in different climatic variables has caused increased frequency of disasters including flash floods posing more than 1.9 million people to high vulnerability and exposing additional 10 million people to the risks of climate induced disasters (MoPE, 2012).
Climate change has also wide range of impacts on other natural resources and biodiversity causing threats to forest conservation, species extinction and occurrence of pests and Disease (IPCC, 2007). It has further amplified impacts on health sector; extended scope and increase in the frequencies of vectorborne Disease such as typhoid, malaria, encephalitis, dengue, and meningitis (IIED, 2008). It has further claimed that different waterborne Disease such as typhoid, cholera and other diarrheal Disease are being more frequent mainly due to extreme drought, flooding, and poor sanitation (IIED, 2008). Moreover, change in rainfall pattern, insufficient water supply for crops, extreme weather incidents, spread of pests and crop Disease have been directly affecting agricultural crops production and hence on food security. The Economic Impact Assessment of Climate Change in Key Sectors (2013) has estimate that the current climate variability and extreme events has costs equivalent to 1.5 to 2 per cent of current GDP (approximately $ 270 to 360 million a year) and much higher in extreme years1.
Nepal government has devised a number of policy instruments to enhance community resiliency along with contribution to reduce greenhouse gas emission. The government, with the leadership of Ministry of Population and Environment (MoPE) as the focal ministry for climate change, has developed National Adaptation Programme of Action (NAPA) to Climate Change (2010) to address the most urgent and immediate needs for adaptation followed by National Framework on
INTRODUCTION
CHAPTER 1
1 See: https://cdkn.org/wp-content/uploads/2013/01/Inception-Report-vs-8-summaryfinall.pdf

2 | National Climate Change Impact Survey 2016
Local Adaptation Plans for Action (LAPA) (2011) to ensure integration of adaptation and resilience into local to national planning processes, and Climate Change Policy (2011). Moreover, Climate Change Budget Code has been introduced in 2012 aiming to promote integration of climate change issues in budget and expenditure management (NPC, 2012)2. Meanwhile, different sectors strategies and policy documents including National Rural Renewable Energy Programme (NRREP) (2011), Forestry Sector Strategy (2016-2025), Nepal Biodiversity Strategy and Action Plan (2014-2020), Environment-Friendly Local Governance (EFLG) Framework (2013), and Environment-Friendly Vehicle and Transport Policy (2014) have been developed to contribute to climate change mitigation, adaptation and integration. Whilst, additional sectoral policy instruments such as National Reducing Emissions from Deforestation and Forest Degradation (REDD+) Strategy and Low Carbon Economic Development Strategy (LCEDS) are on the finalisation process. Nepal has launched a process to formulate and implement National Adaptation Plan (NAP) to address medium and long-term adaptation options.
While several policies have been devised at the central level, effective implementation of such policies and plans at local and community level is a challenge due to various limitations including lack of availability of integrated and reliable data and information on different facets of climate change impacts. Aiming to contribute on bridging such gap
and avail reliable data and information for regular planning process, CBS of Nepal has conducted a National Climate Change Impact Survey (NCCIS) from July to December, 2016. The data is expected to be the milestone to integrate climate change initiatives in the national development program, evidence based adaptation plan formulation, and financing adaptation programmes.
This survey report is organised in ten chapters. Followed by this introductory chapter, chapter two offers brief thematic review and associated indicators that are part of survey questionnaire. Chapter three encompasses a detail methodological explanation. Chapter four offers demographic and socioeconomic characteristics. This chapter captures the information related to age, sex, occupation, household services, landholding information, and access to socioeconomic services of the households. Chapter five presents perception on climate change. It presents the survey results whether respondents have heard about climate change and the source of such information. It also presents respondents’ observation on change on different climatic variables. Similarly, chapter six presents survey result on climate induced disasters and impact. Moreover, chapter seven, eight and nine depicts climate change impacts on health, natural resources, and tourism sectors respectively. Lastly, chapter 10 offers different farm and off-farm adaptation measures being adopted by the households.
2 http://www.npc.gov.np/images/category/Climate-change-budget-code.pdf
National Climate Change Impact Survey 2016 | 3
Climate change impacts different socioeconomic activities and services. The NCCIS considered eight thematic sectors based on their importance in Nepal as climate sensitive sectors. The thematic sectors includes: Water Resources and Energy, Health, Forest, Agriculture, Disaster, Tourism, Gender and Urban sectors. The indicators for all these thematic sectors were reviewed and integrated in the survey questionnaire. This chapter presents brief overview of impact of climate change in the thematic sectors which is followed by discussion of broad indicators included in the survey relevant to impact of climate change.
Water Resources and EnergyIPCC (2007) stated, “Water and its availability and quality will be the main pressures on, and issues for, societies and the environment under climate change.” Extreme climatic events like droughts, flooding, and erratic rainfall have a severe impact on availability and usability of water resources. In Nepal, water resources are depleting and the quality of available water is deteriorating. Over 5,500 glaciers and glacier lakes of Nepal Himalayas (WECS, 2011) are under threat of a total meltdown within this century if the present situation of climate change persists (Chaulagain, 2009).
With climate change, more precipitation rather than snow is expected and more droughts will be observed. According to the precipitation trend analysis in Nepal, there is no definite trend in the annual precipitation amount, but the national annual average precipitation is decreasing at the rate of 9.8 mm per decade3. Overall 80 per cent of annual precipitation occurs during monsoon season (June to September) whilst winter season (December to February) is the driest of all with 3.5 per cent annual precipitation (WECS, 2011). This results in frequent water shortages. Likewise, as rain flows faster than melting snow, higher levels of soil moisture and groundwater recharge are less likely to occur augmenting the water scarcity. This will
severely impact every other economic sector from agriculture to industry to daily sustenance.
Climate change impact on water resources is directly linked to the energy sector, particularly hydropower development in context of Nepal. As most of the hydropower plants in Nepal are designed based on 65 per cent dependability on flow of rivers, impact of climate change will have adverse effects on the energy sector.
In this survey, changes in the different water sources and water quality as observed by the respondents are captured. In addition to the changes observed by the respondents, this survey includes the lived experiences of reasons of change. Results on change in water sources are produced for various analytical domains that provide comparison across the domains.
HealthClimate change affects the social and environmental determinants of health such as clean air, safe drinking water, sufficient food, and secure shelter. Nepal is vulnerable to health impacts of climate change as the country has low adaptive capacity due to weak health infrastructure and services. Researches show that deaths and morbidity associated with extreme and erratic weather are increasing in Nepal.
There have been outbreaks of malaria, Kala-azar, and Japanese encephalitis in the country side of Nepal and all seem to be associated with changes in temperature (Regmi et. al., 2008). Respiratory allergies such as asthma and reactive airway Disease have become more prevalent because of increased human exposure to pollen due to altered growing seasons, molds from extreme or more frequent precipitation and air pollutant dusts by droughts. A study conducted at the Patan Hospital at Lalitpur, Nepal showed that typhoid fever has strong relation with increased temperature and is in proliferating trend. This shows alarming trend of climate change impact on human health and wellbeing.
THEMATIC SECTORS
CHAPTER 2
3 See: http://www.wecs.gov.np/uploaded/water-recource-climate-change.pdf

4 | National Climate Change Impact Survey 2016
The survey included impact of climate change on human health, crops and livestock. The incidences of climate induced Disease are recorded for the past 25 years’ period. In case of human health, incidence of vector borne and waterborne Disease and their names are recorded. While in crops and livestock, survey captured the emergence of new Disease, pests or insects and their names. The data so obtained is used to estimate the percentage response across the analytical domains.
ForestNepal is already observing visible consequences of climate change in its forest and ecosystem. Climate change has impacted both plant and animal biodiversity. Forest ecosystem has been impacted much due to increased dryness in temperature. It has resulted in increasing forest fire incidents destroying forest products such as timber, fuel wood, Non Timber Forest Products (NTFPs), wildlife and plants. Likewise, physical disturbance in forests and biodiversity occurring from erratic rain, landslides and erosion has further altered natural life cycles of plants as well as animal biodiversity.
It is also observed that wild life which normally comes down in low altitude grass land in winter is retained in high altitude due to rise in temperature in such areas which favors growth of grasses even in winter. Similarly, rangeland ecosystem is also impacted from reduced availability of NTFPs due to drought and rise in temperature, in high altitude grasslands. Local communities have experienced availability of less herbs and NTFPs in grasslands. As a result, livestock, wild lives and local communities depending on those resources are affected.
In this survey, impact of climate change on forest based biodiversity is included. This comprises of information on declining and increasing plant and animal species. In addition to this, information on appearance of new species and those which have extinct are also incorporated. Changes in the fruiting or flowering pattern of various plant species are also part of this study. Furthermore, incidences of infestation of invasive plant species are also included.
AgricultureThe impact of climate change in agriculture has directly affected economy and lives of people in Nepal. Research studies have shown mixed immediate effect of climate change in agricultural production in Nepal. For instance, while increase in temperature leads to damage on agricultural production in low land (Terai region), rising temperature has resulted in high yield in high land (hills and mountains). Experiments have shown that enriched CO2 level has positive impact in major crops production like rice and wheat in all geographical regions of Nepal. On the other hand, studies reveal that increase in temperature and CO2 levels can lead to hunger problems in future by lowering essential nutrient contents in crops (Malla, 2008). Similarly, climate change particularly rising temperature would affect health of livestock which is an integral part of agriculture sector. Smallholder farmers in agriculture sector are likely to be worse impacted due to projected climate change in future. Smallholders tend to have poor livelihood assets, generate low income, have less education/awareness and limited access to agro-services. They are mostly rely on rain-fed agriculture and hold land prone to climatic hazards like floods, landslides, and drought.
There is no separate section of agriculture included in this survey. However, the impact of climate induced disasters in crops and livestock is addressed. The loss in agriculture due to climate induced disasters during past five years is covered in the survey. Respondents stated valuation of loss in Nepalese currency is captured in this study. Survey also includes information on ‘farm and off-farm based adaptation measures’ adapted by the households.
DisasterThe incidence of climate induced disaster such as (floods, landslides, drought, Disease, etc.) are increasing and becoming unpredictable. Data show that climate induced disasters claimed more than 4,000 lives during last 10 years which added economic loss of up to nearly USD 5.34 billion (MoPE 2010)4. The impact is differential across
4 http://www.mope.gov.np/download/Newsletter%20NAPA.pdf.fb8f3b6cd4017fc4c302e535eb4e8bff , Accessed February 10, 2017

National Climate Change Impact Survey 2016 | 5
gender and different socioeconomic groups. The key sectors that are affected or have potential to be affected by climate induced disasters in Nepal include agriculture, health, water and energy use, infrastructures, biodiversity, ecosystem services, and tourism.
In this survey climate induced disasters or events and their impacts are considered. These include flood, landslide, inundation, inferno, drought, cold waves, hot waves, storm, and Disease, among others. Information on changes in these climate induced events over the period of 25 years is covered. The impact of any of these events over the period of 5 years is captured. The stated loss in agriculture and business is then valuated in Nepalese currency.
TourismClimate change poses more risks in global tourism. Tourism has intrinsic relation with climate particularly the nature based tourism. Most of the nature based tourism activities in the Himalayas are weather sensitive. For example, rain and foggy conditions significantly decrease the quality of the trekking experience in the Himalaya (Neupane and Chhetri, 2009). Frequent changes on climatic variables has adverse impact on tourism as tourists might change the travel pattern or destination in future if weather continues affecting their travel plans. Likewise, climate change is expected to increase the risk of illness while travelling and consequently discourage tourism.
The household level information on tourism was difficult to capture in this survey. However, based on information from the respondents, changes in flow of tourist and length of stay are affected which is also included in this survey. Further, factors affecting change in length of stay are also covered.
GenderIt is widely accepted that climate change affects women and men differently because of socially driven roles and responsibilities. Accelerated climate change impact has intense impact on women’s health, livelihoods and gender roles. NAPA 2010 states that womens’ access to water resources would decrease, leading to an increase in their workload with detrimental effects on their reproductive health. It also states that climate induced resource conflicts increase social violence, anxiety and depression in women. The effect of climate change on agriculture and migration of men in search of better income result in women taking on additional burdens.
Gender related data in this survey has been assessed at the respondent level. Gender is one of the analytical domains. The impact of climate change on various sectors, such as, health, water sources, forest, and agriculture, among other is analysed based on gender of the respondent. This provides the gender differentiated information of climate change and its impact.
Urban Nepal is one of the fastest urbanising countries in South Asia. Urban centres are the places of most economic activity. In the face of extreme weather, cities and towns are most vulnerable places.
In this survey, urban areas are considered as one of the analytical domains. The data on climate change and its impact is assessed across the rural and urban areas. The differentiated data on climate change across rural and urban area is analysed in each of the chapters.

6 | National Climate Change Impact Survey 2016
3.1. IntroductionThe CBS, for the first time, conducted NCCIS whose specific aim is to understand impacts and effects of climate change on social, economic and environmental dynamics at national level. The survey is a milestone towards addressing data gaps, strengthening information on climate change and making it available for use of information for regular plan and programme development. It allows possibilities to integrate climate change data in national socioeconomic statistics being undertaken by CBS like decennial population census, agriculture census, residing standard surveys, labor force surveys, among others. The survey also tries to establish linkages with indicators related to climate change and environment in Sustainable Development goals (SDGs).
3.2. Objectives of the SurveyThe major objectives of the NCCIS include:
1. Understanding and acquiring knowledge on effects and impact of climate change from socioeconomic and environmental perspective
2. Exploring how the respondents are developing or making adoptive capacity to confront the impact of climate change and
3. Establishing linkage of climate change and environment related indicators with the SDG (Goal 13) for taking urgent action to combat climate change and its impact
3.3. Survey Framework Climate change is leading to an increase in frequency and severity of hazards and stresses, with detrimental effects on livelihoods, and an increasing frequency of disasters. In addition, climate change impacts bring gradual changes to seasonal patterns and intensify pests and Disease that directly affect livelihood, especially farming, and which are perhaps too complex for those who are most vulnerable to understand. Facing this uncertainty about what the future might bring, people struggle to adapt to the changes in their environment.
With the uncertainty brought about by climate change for its impact on national development efforts, academic and development practitioners are using different approaches to assess climate impacts and understand vulnerability to livelihoods building on earlier work on disaster risk reduction, food security, poverty analysis, sustainable livelihoods and related fields. The relevance of livelihoods, disaster and climate risk management approaches to understand and address the impacts of climate change is therefore becoming increasingly clear. With the IPCC third assessment report in 2001, the definition of vulnerability and understanding impact of climate change have gained rapid attention in number of evolving assessment methods framed at being consistent with the determinants proposed.
The IPCC defines, “vulnerability as the degree to which a system is susceptible to or unable to cope with, adverse effects of climate change, including climate variability and extremes. It is a function of the character, magnitude, and rate of climate variation to which a system is exposed, its sensitivity, and its adaptive capacity’” (IPCC, 2001). In simpler term, vulnerability is the function of exposure, sensitivity and adaptive capacity in which
Exposure refers to the nature and degree to which a system is exposed to significant climatic variations. The climate variation includes average climate change and the extreme climate variability.
Sensitivity refers to the degree to which a system is affected, either adversely or beneficially, by climate related stimuli. The effect may be direct (e.g. a change in crop yield in response to a change in the mean, range, or variability of temperature or damages caused by an increase in the frequency of coastal flooding due to sea level rise (IPCC, 2007).
Adaptive Capacity refers to the ability of a system (in this report the “household” or “community”) to adjust to climate change (including climate variability and extremes) to moderate potential damages, to take advantage of opportunities, or to cope with the consequences (IPCC, 2007).
METHODOLOGY
CHAPTER 3

National Climate Change Impact Survey 2016 | 7
Adaptive capacity (A) of a system helps the system to adjust to climate change and moderate the impacts of climate change. The more a community (system) is endowed with resources, has access to and control over resources, the more it has the capacity to adjust to climate change and moderate the impacts of climate change. Community resources can be assessed through assessment of livelihood assets of the community.
Adaptive capacity can also be understood as the ability to shift strategies as conditions change and as pre-existing livelihoods, ecosystems, institutions, infrastructure, among others no longer provide the services on which system depends upon.
Vulnerability
Figure 3-1: Household Level Climate Change Vulnerability and Its Defining Concept
(Source: Modified from Allen Consulting, 2005)
Potential impact Exposure
SensitivityAdaptative capacity
Understanding vulnerability and its impact is complex and has many dimensions: economic, social, demographic, political, and psychological that can have overlapping effects that pose difficulty to precisely confirm the cause and effect relationship. The NCCIS considered capturing vulnerability observed at the household level depending upon specific socioeconomics situations. The vulnerability aspect at the household level is derived from potential impacts of climate change and their adaptive capacity to respond to the impact (Figure 3-1).
3.4. Survey ScopeThe survey provides data and knowledge on impact and effect of climate change considering multiple dimensions. The survey covers broad topics such as demography, household income, level of education, knowledge and perception about climate change, climate induced disasters and impacts (socioeconomic), natural resources and biodiversity (changes in the floristic behavior, water resources, invasion species, etc.), climate change and health (animals and humans), and adaptation practices (farm and off-farm) adopted by households to cope with adverse situation created due to changing climate.
3.5. Statistical Unit The statistical unit or enumeration unit of the survey is basic entity for which the required data items are covered. The NCCIS is a household survey and its enumeration unit is the household. The definition of a household for the survey is primarily adopted from the guidelines laid down by the United Nations in its “Principles and Recommendations for Population and Housing Censuses, (UN, 2008). According to the guidelines, the concept of household is based on the “arrangements made by persons, individually or in groups, for providing themselves with food or other essentials for residing”. A household may consist of one person or a group of two or more persons. The persons in the group may pool their incomes, may have a common budget, may be related, unrelated or may constitute a combination of persons both related and unrelated.
3.6. CoverageThe survey covers the whole country, including both rural and urban areas. Nepal is divided into 75 administrative districts. These 75 districts are grouped into three ecological belts running from north to south – the mountains, the hills and the Terai. Each ecological belt is further divided into five development regions – eastern, central, western, mid-western and far-western region. Thus 15 eco-development regions (or inter-regions) are formed by the cross combination of three ecological belts and five development regions. Kathmandu Valley is treated as separate domain so the total of 16 major analytical domains was formed.
NCCIS is a special survey in which the information of long period of time is required. Hence, all households in the country were not considered eligible for selection in the survey. Those households which had the respondent aged 45 or more and residing in that locality since 25 years are only considered eligible. The household members were determined on the basis of usual location of their residence.
The survey enumerated 5,060 households from 253 PSUs from all 16 analytical domains of the country.
3.7. Sample DesignIntroductionThe survey collected both quantitative and qualitative data based on sample selection strategy adopted for this survey (see below for sample
8 | National Climate Change Impact Survey 2016
selection strategy). Firstly, questionnaire was delivered to the households, where the eligible household member responded on behalf of the household. Secondly, the open checklist was given to the respondent that captured qualitative information not included in the questionnaire survey. On the basis of the response, enumerators captured similar or distinct qualitative information for each of the PSU. Qualitative information was captured basically on change on climate parameters (perception), impact of climate change on various sectors and adaptation practices of the households that was not derived from quantitative part.
Population of InterestBefore adopting sample selection strategy, the population of interest to meet the survey objectives was determined. In case of NCCIS, the 2,996,516 household populations (as of 2016, July to November) of Nepal were of interest for the survey and thus included in the sample frame. The following sections will provide description on selection process of the representative sample of household for the entire country.
Level of InterestEach five development regions of Nepal was divided into three ecological belt areas – Terai, mountain and hill. This survey produced results for each of the ecological belts (ecobelts) within each development regions, resulting in 15 areas of interest. Kathmandu Valley, located in the Central development region, was treated separately.
This has generated results for 16 different geographical areas across Nepal:
1) Kathmandu Valley 2) Central Terai3) Central Mountain 4) Central Hill 5) Eastern Terai6) Eastern Mountain 7) Eastern Hill8) Far-western Terai 9) Far-western Mountain 10) Far-western Hill 11) Mid-western Terai12) Mid-western Mountain 13) Mid-western Hill 14) Western Terai 15) Western Mountain 16) Western Hill
Each of these 16 areas is referred as a domain of interest, for which survey estimate was produced.
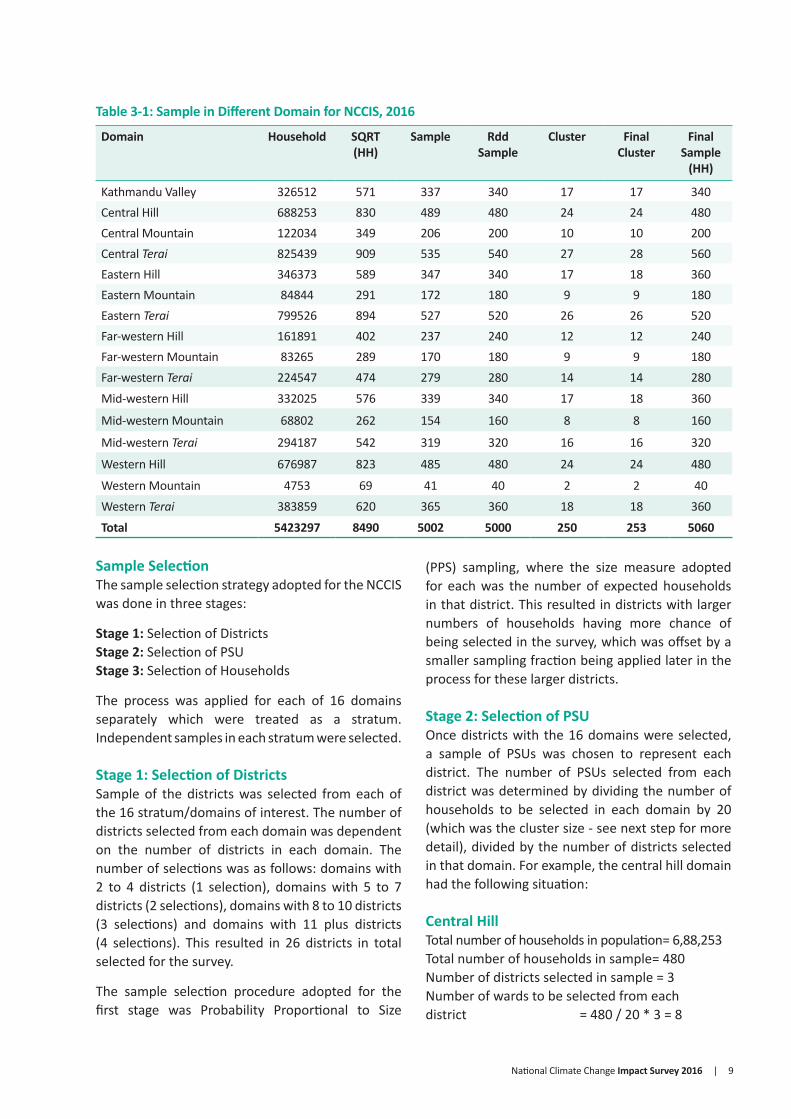
Sample Size and AllocationTotal sample size of this survey was 5,060 households. In order to ensure suitable level of accuracy for each domain of interest, smaller domains (with respect to the number of households) received a higher sample fraction than larger domains. This was achieved by allocating 5,000 samples proportional to the square root of the population of each domain.
Rounding of the sample was then applied to enable workloads of 20 households per selected PSU (see the following sample selection table 3-1), which was then modified further so that domains which had more than one village selected, had an equal number of PSU selected from each to ensure equal probability of selection of households within each domain. The resulting sample can be seen in the following Table 3-1:
National Climate Change Impact Survey 2016 | 9
Table 3-1: Sample in Different Domain for NCCIS, 2016
Domain Household SQRT (HH)
Sample Rdd Sample
Cluster Final Cluster
Final Sample
(HH)
Kathmandu Valley 326512 571 337 340 17 17 340Central Hill 688253 830 489 480 24 24 480Central Mountain 122034 349 206 200 10 10 200Central Terai 825439 909 535 540 27 28 560Eastern Hill 346373 589 347 340 17 18 360Eastern Mountain 84844 291 172 180 9 9 180Eastern Terai 799526 894 527 520 26 26 520Far-western Hill 161891 402 237 240 12 12 240Far-western Mountain 83265 289 170 180 9 9 180Far-western Terai 224547 474 279 280 14 14 280Mid-western Hill 332025 576 339 340 17 18 360
Mid-western Mountain 68802 262 154 160 8 8 160
Mid-western Terai 294187 542 319 320 16 16 320
Western Hill 676987 823 485 480 24 24 480
Western Mountain 4753 69 41 40 2 2 40Western Terai 383859 620 365 360 18 18 360
Total 5423297 8490 5002 5000 250 253 5060
Sample SelectionThe sample selection strategy adopted for the NCCIS was done in three stages:
Stage 1: Selection of DistrictsStage 2: Selection of PSUStage 3: Selection of Households
The process was applied for each of 16 domains separately which were treated as a stratum. Independent samples in each stratum were selected.
Stage 1: Selection of DistrictsSample of the districts was selected from each of the 16 stratum/domains of interest. The number of districts selected from each domain was dependent on the number of districts in each domain. The number of selections was as follows: domains with 2 to 4 districts (1 selection), domains with 5 to 7 districts (2 selections), domains with 8 to 10 districts (3 selections) and domains with 11 plus districts (4 selections). This resulted in 26 districts in total selected for the survey.
The sample selection procedure adopted for the first stage was Probability Proportional to Size
(PPS) sampling, where the size measure adopted for each was the number of expected households in that district. This resulted in districts with larger numbers of households having more chance of being selected in the survey, which was offset by a smaller sampling fraction being applied later in the process for these larger districts.
Stage 2: Selection of PSUOnce districts with the 16 domains were selected, a sample of PSUs was chosen to represent each district. The number of PSUs selected from each district was determined by dividing the number of households to be selected in each domain by 20 (which was the cluster size - see next step for more detail), divided by the number of districts selected in that domain. For example, the central hill domain had the following situation:
Central HillTotal number of households in population = 6,88,253Total number of households in sample = 480Number of districts selected in sample = 3Number of wards to be selected from each district = 480 / 20 * 3 = 8

10 | National Climate Change Impact Survey 2016
The sample selection procedure adopted for this stage was once again PPS sampling, with the size measure being the number of households within each PSU. In total, 253 PSUs were selected as sample across Nepal from 26 districts.
Stage 3: Selection of HouseholdsBefore selection of households, a household listing was produced from each selected PSU. Listing was based on the eligibility of households i.e. potential respondent was 45 years or older and residing in the community for at least 25 years. Large PSUs were sub-divided into more manageable size and one of these sub-divided PSU was selected to represent the whole PSU using PPS sampling. As a rule of thumb, PSUs with more than 500 households were sub-divided into smaller units. Likewise, the interval was run through the list in a systematic manner to select 20 households from each, which represents an enumerator workload for that area. The skip for each area was simply the number of households in that area divided by 20. A random start between one and the interval was also generated to determine the starting point of the selection process in each area.
Justification of Sampling MethodThe sampling approach adopted in this survey is a common approach adopted for household surveys as it ensures that the households have roughly the same chance of selection within each domain. Given the 16 domains have quite different sample fractions based on their size (with respect to HHs), the probability of selection of households differs a lot from one domain to another, but it should be similar within domains which is a good property to have for a survey of this nature.
3.8. WeightsAs addressed in the above coverage section, not all households of Nepal were considered in scope of the survey. The survey was administered to only those households which had an occupant that met both the following two criteria:
a) Was 45 years of age or olderb) Had lived in the area for 25 years or more
As such, the population of interest for the survey is only those households which met these criteria, and as such, weights were generated to reflect
this population only. Similarly, the computational procedure was adopted for calculating the household weights.
Initial Set of WeightsFor the sample design adopted for this survey, three stages of sample selection process were adopted: selection of districts, selection of PSUs, and selection of households. Similarly, the probability of a household being selected in the survey was computed by multiplying the probability of the district being selected at stage one, by the probability of PSU being selected at stage two, and by probability of the household being selected at stage three, as such:
Pr(HH selection) = Pr (PSU selection at stage 1) * Pr(PSU selction at stage 2) *Pr(HH selction at stage 3)
The inverse of this probability was used as the starting point for the weight:
Weight= 1/Pr (HH selction)
In order to accommodate the probabilities of selection of each household in the weight calculations two factors were applied. The first factor was to adjust number of households across Nepal since the last population census in 2011. The second factor was to account for the fact that survey’s population of interest is only those households in Nepal which had a member aged 45 years and above, and residing in the area for at least 25 years.
Factor 1: Adjusting Growth Since 2011 CensusTo estimate the amount of growth that had taken place since 2011 population census, simple projections were computed assuming that the same growth rate witnessed between 2001 and 2011 population censuses continued on 2016 when the climate change survey was conducted. A factor to account for this growth since 2011 census was then applied to the weights at the stratum level, to reflect a more realistic population of households in 2016. This factor was calculated as follows:
Estimated number of households in 2016Actual number of households in 2011
F1=Growth factor=

National Climate Change Impact Survey 2016 | 11
Factor 2: Adjusting for all Households not Being in Scope
As mentioned above only those households with a member aged 45 years and above, and lived in the area for at least 25 years, were included in the survey. To adjust with this reduced scope, another factor was applied to the weights for the fact that only a proportion of households across Nepal met this criterion. To estimate the proportion of households which were in scope, interviewers undertaking the listing exercise in the field first listed all households in the selected PSU, and then flagged those households which were in scope of the survey. A sample of 20 households was then chosen from those households which were in scope of survey.
The adjustment factor to reduce the weights for a smaller in-scope population was generated at the PSU level, and calculated as follows:
estimated number of households in PSU
number of households in PSU
F2=scope reduction factor=
Final Set of Weights Adopted For the SurveyThe final weights applied to the household survey data was computed separately for each PSU and calculated as follows:
Weight final(HH) =Weight initial(HH) *(F1*F2)
Using this approach to derive the household weight resulted in the sum of weights for all 5,060 households selected in the survey coming to 2,996,516. This means it was estimated that approximately 3 million households across Nepal met the criteria of having at least one person 45 years and above who had lived in the area for 25 years or more, at the time of the climate change survey in late 2016.
3.9. Pre Survey Activities
Pilot SurveyA set of questionnaire was developed and the pilot survey was conducted in five districts. The criteria for selection of the district for pilot survey were as follows:1. One district from each of the five development
region2. Survey area from the ecological zone (Mountain,
Hill and Terai)
3. Districts were identified referring to district vul-nerability mapping in NAPA.
The pilot survey was carried out in five districts (Kathmandu, Saptari, Mustang, Dailekh and Kailali) utilising above criteria. The following procedures were used for the pilot survey: nPurposive selection of 10 VDCs/Municipalities
from each district; n Five households were surveyed from each VDC/
municipalitiesnA total of 250 households were surveyed; n In addition, two representatives from organisa-
tions (government or non-government) working in the environment sector were also surveyed.
The data obtained from pilot survey was analysed and survey report was developed for the internal purpose. The feedback of the pilot survey was incorporated in full scale survey.
Survey QuestionnairesFirstly, a draft questionnaire was developed based on the questionnaire used in pilot survey. The following activities were undertaken to finalise the questionnaire:
Desk Review of the Pilot Survey Questionnaire
The pilot survey questionnaire was reviewed by the survey team of the environment section in CBS and by subject experts in light of available climate related documents.
Intensive WorkshopIn order to reach consensus on reliable and improvised provision of data generation on vulnerability, and finalise the theme based questionnaire, the survey team conducted a one day intensive workshop with thematic experts. Feedback and comments from the workshops were reflected in finalising the questionnaire.
Thematic WorkshopThere are eight thematic areas on the questionnaire. A series of workshops and meetings were conducted to finalise the respective thematic questionnaire.
International Expert ReviewThe revised climate change survey questionnaire was sent to international climate change expert for review and input. The input was used to revise and finalise the questionnaire.
12 | National Climate Change Impact Survey 2016
Pre-test of the QuestionnaireThe questionnaire was pre-tested to examine its overall performance. The pre-test examined the time required to complete the interview. It also tested its reliability by examining whether the questionnaire captured the desired information as well as consistency by checking whether the collected information serves the purpose of the survey. The pre-test was also utilised to assess the logistics required for the survey.
The questionnaire was pre-tested several times to assess its usage under actual field conditions in various parts of the country comprising mountain, hill and Terai. Both paper based and tablet based pre-test of questionnaire was conducted in sample districts and some inconsistences observed in the questionnaire were corrected after the pre-test.
Finalisation of the QuestionnaireFollowing the pre-tests and feedbacks obtained from potential data users and subject experts, the questionnaire was tabled at the technical committee for approval. The committee provided final observations and opinions, which were subsequently addressed and the questionnaire was finalised.
Manual PreparationThe manual was drafted at the time of pre-test as a survey guideline for field work. The manual aimed to clarify concepts, content, and terms used in questionnaire for understanding of the enumerators, supervisor, and respondents. It was modified incorporating the feedback from pre-test and finalised after the questionnaire was endorsed by the technical committee.
3.10. Field Work OrganisationTraining ProgramA total of 36 field staffs were trained for the survey through 33 Statistics Offices (SOs). The comprehensive five day training was conduted in June 2016 in Lumle, Kaski District. Different methods of training were adopted including reflection of the questionnaire and reference manual, classroom sessions, class exercise sessions, mock interviews, field visits, practices and discussion sessions.
Selection of the Enumerators Fifteen field teams collected data from the field. Each team consisted of 2 enumerators and covered 15 to 20 PSUs. Each team was equipped with two tablets, power packs, and other logistics required in the field. Additional six enumerators were kept in reserve for replacement if required. Each team was responsible for a particular area of the country. The teams were based in appropriate SO of the CBS.
Data Collection and SupervisionThe data collection was primarily based on recall method. The respondents provided information related to change in temperature, precipitation, and seasonal shift in the last 25 years and that on the impact of climate induced disasters in last 5 years.
The data collection was undertaken between July and December of 2016. There were 15 field teams/groups, each with two enumerators from the SOs. During the survey period, the field work was constantly supervised and monitored by the core team members. Supervision was done at two levels. The CBS had the central supervision team. A list of instructions was prepared for the central supervision. Similarly, the chief of the SOs was also the supervisor at field. A supervision form was developed for field supervision.
Enumeration areas were assigned to the enumerators in three phases. After completing first phase, a three day mid-term review was conducted for reflection and quality control in next phases of the survey.
3.11. Data ManagementData collection was carried out using tablets so there was no extra time needed for data entry. The data entry program was pre-designed for controlling and avoiding errors of the data collection. The process of real time entry of data in the field reduced time lag between data collection and processing. After completion of the survey from each PSU, the data was synced to national server. The synced data was then transformed into Statistical Package for the Social Sciences (SPSS) and Stata database for further editing and analysis. The appropriate coding was also assigned to the qualitative data generated during the survey.

National Climate Change Impact Survey 2016 | 13
The final data set was used to estimate percentage and frequency tables for each of analytical domains.
3.12. Analytical DomainsThe survey provides estimate of the following 16 eco-development regions called the analytical domains of the country.
Table 3-2: Eco-Development Regions as the Analytical Domain
Mountain Hill Terai
1. Eastern Mountain
2. Eastern Hill 3. Eastern Terai
4. Central Mountain
5. Central Hill 6. Central Terai
7. Western Mountain
8. Western Hill 9. Western Terai
10. Mid-western Mountain
11. Mid-western Hill
12. Mid-western Terai
13. Far-Western Mountain
14. Far-western Hill
15. Far-western Terai
16. Kathmandu Valley
Aiming to capture Nepal’s diverse climatic variations and vulnerabilities, additional analytical domains were included. These additional analytical domains are based on NAPA climate vulnerability mapping (MoE, 2010) and bio-climatic zones. The details of additional domains are given in the Table 3-3.
Table 3-3: Additional Analytical Domain
NAPA Combined vulnerability Index
Very high High Moderate Low Very low
(0.787-1.000)
0.601-0.786
0.356-0.600
0.181-0.355
0.000-0.180
Bio-Climatic Zones:
1. Tropical (<1000m)
2. Sub-tropical (1000m-2000m)
3. Temperate (2000m -3000 m)
4. Sub-alpine (3000m-4000m)
5. Alpine (4000m-5000m)

14 | National Climate Change Impact Survey 2016
4.1. Summary of FindingsThe households under the criteria for NCCIS show higher percentage of female population (52.40%) than male (47.60%). The average household size of the population is 5.05. There is a discrepancy in the literacy of respondents across different categories. Overall percentage of illiterate respondents is 45.31 per cent in which female respondents are more illiterate than male respondents. The major occupation of households is agriculture. Majority of households (79.5%) reported agriculture as the main source of household income. Overall 48.9 per cent households have access to piped water system
HOUSEHOLD AND POPULATION CHARACTERISTICS
CHAPTER 4
for drinking water. Overall 88.7 per cent households reported use of firewood for cooking. Similarly, 80.07 per cent households use electricity as major source of light. Majority of households (43.57%) in central Terai do not have toilet in their homes.
Households within a reach of five km distance for selected services like motorable road, health institution, high school, local market, and agriculture service centre are 87.1, 88.9, 92.1, 69.8, and 84.8 per cent respectively. As a whole, 23.3 per cent households reported that they are adopting some kind of farm mechanisation.
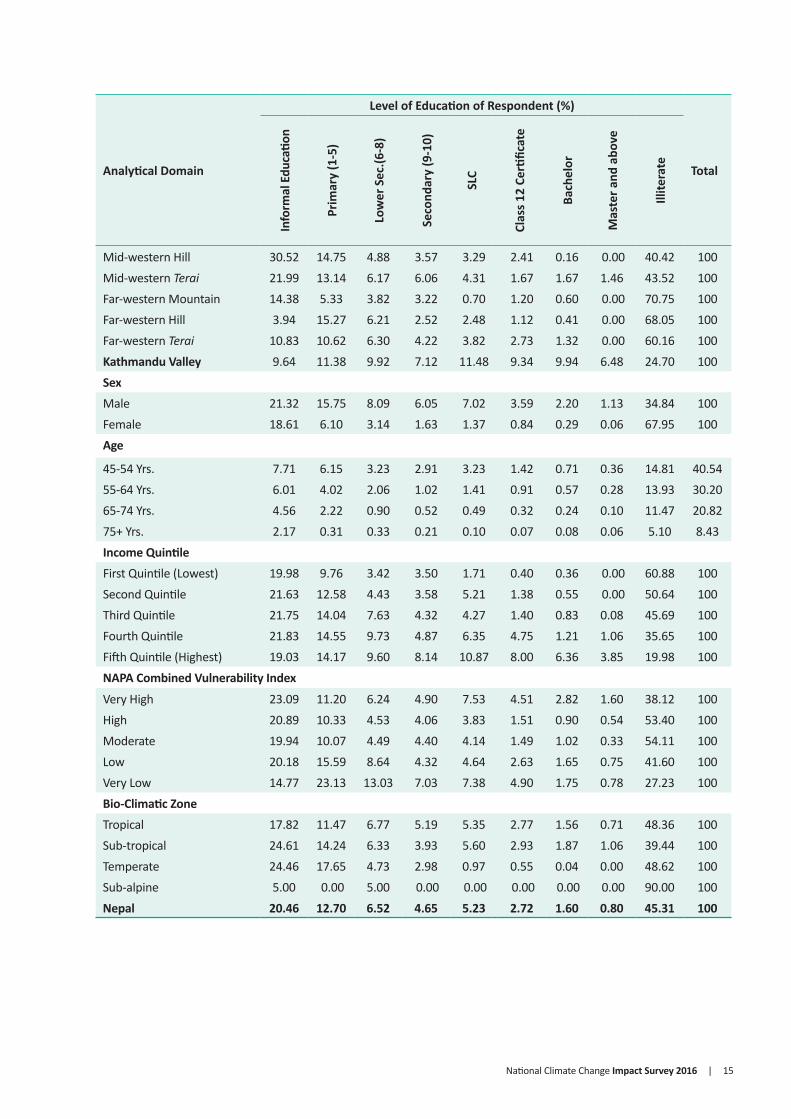
Table 4-1: Distribution of Household by Level of Education of Respondent
Analytical Domain
Level of Education of Respondent (%)
Total
Info
rmal
Edu
catio
n
Prim
ary
(1-5
)
Low
er S
ec.(6
-8)
Seco
ndar
y (9
-10)
SLC
Clas
s 12
Certi
ficat
e
Bach
elor
Mas
ter a
nd a
bove
Illite
rate
Urban/RuralUrban 17.76 12.43 8.49 6.99 7.38 5.56 3.65 1.81 35.93 100Rural 21.58 12.81 5.71 3.69 4.34 1.55 0.75 0.38 49.19 100Ecological BeltMountain 26.60 9.66 3.73 2.97 3.30 1.42 0.53 0.00 51.79 100Hill 25.29 16.04 6.28 4.99 5.45 2.83 1.71 1.03 36.38 100Terai 14.62 9.91 7.24 4.60 5.36 2.84 1.67 0.70 53.06 100Eco-Development RegionEastern Mountain 36.21 15.59 5.56 3.40 5.35 3.36 0.43 0.00 30.10 100Eastern Hill 34.31 14.61 6.06 3.50 5.49 1.63 0.53 0.54 33.33 100Eastern Terai 16.70 13.49 9.95 5.30 6.49 4.05 2.10 1.05 40.86 100Central Mountain 32.69 10.71 2.96 2.35 4.16 0.45 0.46 0.00 46.21 100Central Hill 31.37 13.16 3.38 4.52 5.53 2.71 2.56 1.07 35.72 100Central Terai 11.35 2.57 3.09 2.53 3.63 1.13 1.07 0.16 74.47 100Western Mountain 2.80 2.20 7.20 6.61 2.20 4.40 2.20 0.00 72.38 100Western Hill 19.51 21.85 9.13 7.18 5.56 2.70 0.62 0.70 32.76 100Western Terai 14.83 19.50 13.76 8.07 9.06 5.71 2.47 1.08 25.52 100Mid-western Mountain 16.80 5.03 2.59 3.13 1.81 0.85 0.66 0.00 69.13 100
National Climate Change Impact Survey 2016 | 15
Analytical Domain
Level of Education of Respondent (%)
Total
Info
rmal
Edu
catio
n
Prim
ary
(1-5
)
Low
er S
ec.(6
-8)
Seco
ndar
y (9
-10)
SLC
Clas
s 12
Certi
ficat
e
Bach
elor
Mas
ter a
nd a
bove
Illite
rate
Mid-western Hill 30.52 14.75 4.88 3.57 3.29 2.41 0.16 0.00 40.42 100Mid-western Terai 21.99 13.14 6.17 6.06 4.31 1.67 1.67 1.46 43.52 100Far-western Mountain 14.38 5.33 3.82 3.22 0.70 1.20 0.60 0.00 70.75 100Far-western Hill 3.94 15.27 6.21 2.52 2.48 1.12 0.41 0.00 68.05 100Far-western Terai 10.83 10.62 6.30 4.22 3.82 2.73 1.32 0.00 60.16 100Kathmandu Valley 9.64 11.38 9.92 7.12 11.48 9.34 9.94 6.48 24.70 100SexMale 21.32 15.75 8.09 6.05 7.02 3.59 2.20 1.13 34.84 100Female 18.61 6.10 3.14 1.63 1.37 0.84 0.29 0.06 67.95 100Age
45-54 Yrs. 7.71 6.15 3.23 2.91 3.23 1.42 0.71 0.36 14.81 40.5455-64 Yrs. 6.01 4.02 2.06 1.02 1.41 0.91 0.57 0.28 13.93 30.2065-74 Yrs. 4.56 2.22 0.90 0.52 0.49 0.32 0.24 0.10 11.47 20.8275+ Yrs. 2.17 0.31 0.33 0.21 0.10 0.07 0.08 0.06 5.10 8.43Income QuintileFirst Quintile (Lowest) 19.98 9.76 3.42 3.50 1.71 0.40 0.36 0.00 60.88 100Second Quintile 21.63 12.58 4.43 3.58 5.21 1.38 0.55 0.00 50.64 100Third Quintile 21.75 14.04 7.63 4.32 4.27 1.40 0.83 0.08 45.69 100Fourth Quintile 21.83 14.55 9.73 4.87 6.35 4.75 1.21 1.06 35.65 100Fifth Quintile (Highest) 19.03 14.17 9.60 8.14 10.87 8.00 6.36 3.85 19.98 100NAPA Combined Vulnerability Index
Very High 23.09 11.20 6.24 4.90 7.53 4.51 2.82 1.60 38.12 100High 20.89 10.33 4.53 4.06 3.83 1.51 0.90 0.54 53.40 100Moderate 19.94 10.07 4.49 4.40 4.14 1.49 1.02 0.33 54.11 100Low 20.18 15.59 8.64 4.32 4.64 2.63 1.65 0.75 41.60 100Very Low 14.77 23.13 13.03 7.03 7.38 4.90 1.75 0.78 27.23 100Bio-Climatic ZoneTropical 17.82 11.47 6.77 5.19 5.35 2.77 1.56 0.71 48.36 100Sub-tropical 24.61 14.24 6.33 3.93 5.60 2.93 1.87 1.06 39.44 100Temperate 24.46 17.65 4.73 2.98 0.97 0.55 0.04 0.00 48.62 100Sub-alpine 5.00 0.00 5.00 0.00 0.00 0.00 0.00 0.00 90.00 100Nepal 20.46 12.70 6.52 4.65 5.23 2.72 1.60 0.80 45.31 100
16 | National Climate Change Impact Survey 2016
Table 4-1 represents the percentage distribution of household by level of education of respondents under different categories. Respondent’s education level is higher in urban and hill areas including that of male respondents. Substantial proportions of the respondent are illiterate (45.31%). Illiteracy rate among the respondents is higher in central Terai (74.47%) followed by western mountain (72.38%), mid-western mountain (69.13%), far-western hill (60.16%), and far-western Terai (60.16%). Highest percentage of illiterate respondents (60.88%) belongs to the lowest income quintile group whereas illiteracy percentage of respondents is higher in the moderate to very high vulnerable areas based on NAPA combined vulnerability index.
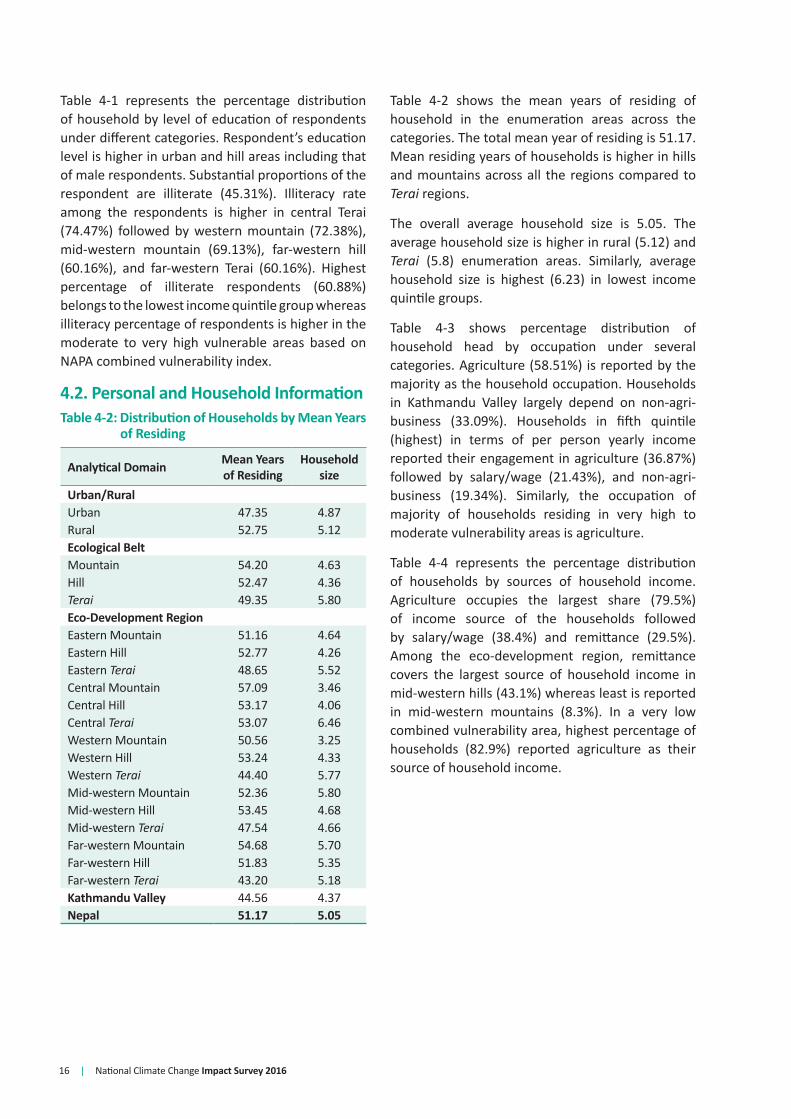
4.2. Personal and Household InformationTable 4-2: Distribution of Households by Mean Years
of Residing
Analytical Domain Mean Years of Residing
Household size
Urban/Rural Urban 47.35 4.87Rural 52.75 5.12Ecological BeltMountain 54.20 4.63Hill 52.47 4.36Terai 49.35 5.80Eco-Development RegionEastern Mountain 51.16 4.64Eastern Hill 52.77 4.26Eastern Terai 48.65 5.52Central Mountain 57.09 3.46Central Hill 53.17 4.06Central Terai 53.07 6.46Western Mountain 50.56 3.25Western Hill 53.24 4.33Western Terai 44.40 5.77Mid-western Mountain 52.36 5.80Mid-western Hill 53.45 4.68Mid-western Terai 47.54 4.66Far-western Mountain 54.68 5.70Far-western Hill 51.83 5.35Far-western Terai 43.20 5.18Kathmandu Valley 44.56 4.37Nepal 51.17 5.05
Table 4-2 shows the mean years of residing of household in the enumeration areas across the categories. The total mean year of residing is 51.17. Mean residing years of households is higher in hills and mountains across all the regions compared to Terai regions.
The overall average household size is 5.05. The average household size is higher in rural (5.12) and Terai (5.8) enumeration areas. Similarly, average household size is highest (6.23) in lowest income quintile groups.
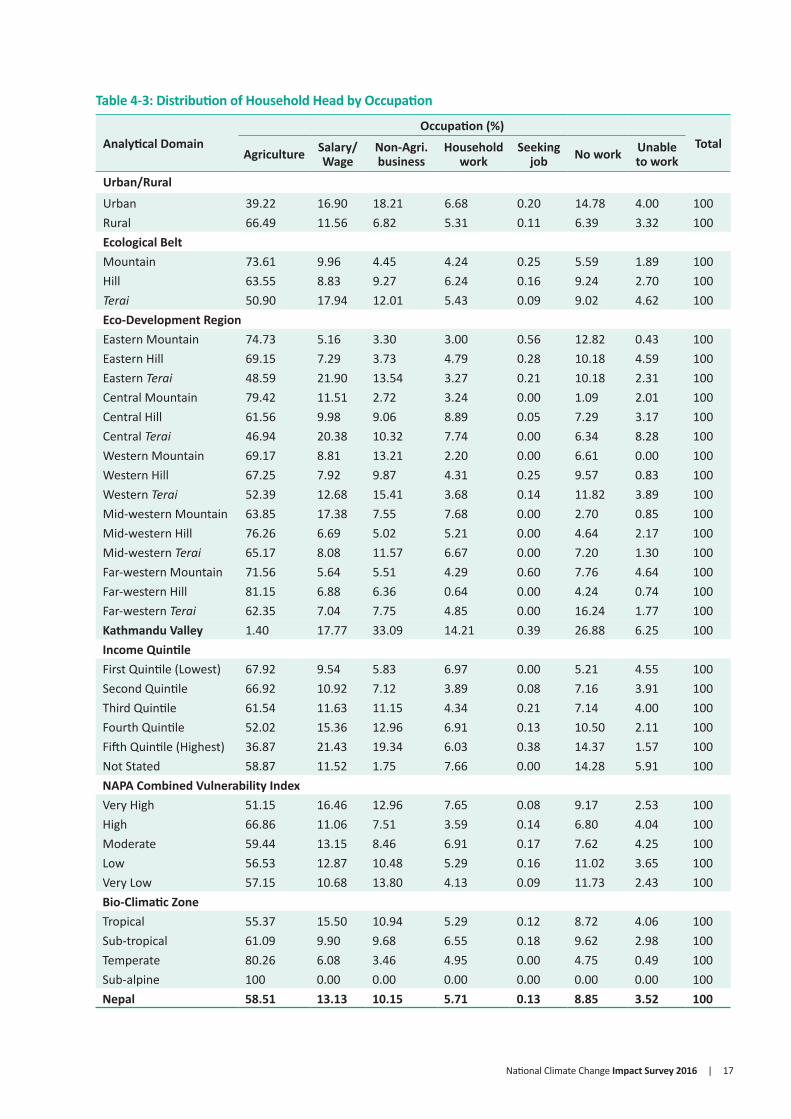
Table 4-3 shows percentage distribution of household head by occupation under several categories. Agriculture (58.51%) is reported by the majority as the household occupation. Households in Kathmandu Valley largely depend on non-agri-business (33.09%). Households in fifth quintile (highest) in terms of per person yearly income reported their engagement in agriculture (36.87%) followed by salary/wage (21.43%), and non-agri- business (19.34%). Similarly, the occupation of majority of households residing in very high to moderate vulnerability areas is agriculture.
Table 4-4 represents the percentage distribution of households by sources of household income. Agriculture occupies the largest share (79.5%) of income source of the households followed by salary/wage (38.4%) and remittance (29.5%). Among the eco-development region, remittance covers the largest source of household income in mid-western hills (43.1%) whereas least is reported in mid-western mountains (8.3%). In a very low combined vulnerability area, highest percentage of households (82.9%) reported agriculture as their source of household income.
National Climate Change Impact Survey 2016 | 17
Table 4-3: Distribution of Household Head by Occupation
Analytical DomainOccupation (%)
TotalAgriculture Salary/
WageNon-Agri. business
Household work
Seeking job No work Unable
to workUrban/Rural
Urban 39.22 16.90 18.21 6.68 0.20 14.78 4.00 100Rural 66.49 11.56 6.82 5.31 0.11 6.39 3.32 100Ecological BeltMountain 73.61 9.96 4.45 4.24 0.25 5.59 1.89 100Hill 63.55 8.83 9.27 6.24 0.16 9.24 2.70 100Terai 50.90 17.94 12.01 5.43 0.09 9.02 4.62 100Eco-Development RegionEastern Mountain 74.73 5.16 3.30 3.00 0.56 12.82 0.43 100Eastern Hill 69.15 7.29 3.73 4.79 0.28 10.18 4.59 100Eastern Terai 48.59 21.90 13.54 3.27 0.21 10.18 2.31 100Central Mountain 79.42 11.51 2.72 3.24 0.00 1.09 2.01 100Central Hill 61.56 9.98 9.06 8.89 0.05 7.29 3.17 100Central Terai 46.94 20.38 10.32 7.74 0.00 6.34 8.28 100Western Mountain 69.17 8.81 13.21 2.20 0.00 6.61 0.00 100Western Hill 67.25 7.92 9.87 4.31 0.25 9.57 0.83 100Western Terai 52.39 12.68 15.41 3.68 0.14 11.82 3.89 100Mid-western Mountain 63.85 17.38 7.55 7.68 0.00 2.70 0.85 100Mid-western Hill 76.26 6.69 5.02 5.21 0.00 4.64 2.17 100Mid-western Terai 65.17 8.08 11.57 6.67 0.00 7.20 1.30 100Far-western Mountain 71.56 5.64 5.51 4.29 0.60 7.76 4.64 100Far-western Hill 81.15 6.88 6.36 0.64 0.00 4.24 0.74 100Far-western Terai 62.35 7.04 7.75 4.85 0.00 16.24 1.77 100Kathmandu Valley 1.40 17.77 33.09 14.21 0.39 26.88 6.25 100Income QuintileFirst Quintile (Lowest) 67.92 9.54 5.83 6.97 0.00 5.21 4.55 100Second Quintile 66.92 10.92 7.12 3.89 0.08 7.16 3.91 100Third Quintile 61.54 11.63 11.15 4.34 0.21 7.14 4.00 100Fourth Quintile 52.02 15.36 12.96 6.91 0.13 10.50 2.11 100Fifth Quintile (Highest) 36.87 21.43 19.34 6.03 0.38 14.37 1.57 100Not Stated 58.87 11.52 1.75 7.66 0.00 14.28 5.91 100NAPA Combined Vulnerability IndexVery High 51.15 16.46 12.96 7.65 0.08 9.17 2.53 100High 66.86 11.06 7.51 3.59 0.14 6.80 4.04 100Moderate 59.44 13.15 8.46 6.91 0.17 7.62 4.25 100Low 56.53 12.87 10.48 5.29 0.16 11.02 3.65 100Very Low 57.15 10.68 13.80 4.13 0.09 11.73 2.43 100Bio-Climatic ZoneTropical 55.37 15.50 10.94 5.29 0.12 8.72 4.06 100Sub-tropical 61.09 9.90 9.68 6.55 0.18 9.62 2.98 100Temperate 80.26 6.08 3.46 4.95 0.00 4.75 0.49 100Sub-alpine 100 0.00 0.00 0.00 0.00 0.00 0.00 100Nepal 58.51 13.13 10.15 5.71 0.13 8.85 3.52 100

18 | National Climate Change Impact Survey 2016
Table 4-4: Distribution of Households by Income Sources
Analytical DomainIncome Sources (%)5
AgricultureSalary/wage
Non agri-business Remittance Others
Urban/RuralUrban 56.3 45.8 31.4 22.9 17.3Rural 89.1 35.3 15.3 32.2 9.3Ecological BeltMountain 95.2 38.4 12.2 13.6 6.8Hill 83.2 32.1 18.0 29.3 15.1Terai 73.2 44.6 23.4 32.4 9.0Eco-Development RegionEastern Mountain 97.0 16.0 8.2 14.6 1.3Eastern Hill 90.8 21.9 10.8 24.7 5.6Eastern Terai 65.3 50.1 24.9 26.8 8.9Central Mountain 97.2 52.7 5.2 9.2 2.9Central Hill 88.0 34.9 17.1 14.0 8.5Central Terai 74.4 43.3 21.6 34.8 5.9Western Mountain 84.6 39.4 40.6 15.6 4.4Western Hill 85.1 30.9 18.0 42.0 27.5Western Terai 81.2 45.9 31.7 36.3 14.1Mid-western Mountain 88.5 46.0 24.9 8.3 12.8Mid-western Hill 94.2 35.2 12.8 43.1 13.8Mid-western Terai 80.6 35.2 17.3 39.9 9.7Far-western Mountain 96.4 32.3 15.7 25.5 15.2Far-western Hill 97.6 24.2 11.4 36.9 4.4Far-western Terai 81.9 34.4 19.0 29.8 17.8Kathmandu Valley 2.2 53.6 55.7 18.0 29.1Income QuintileFirst Quintile (Lowest) 89.9 34.3 13.6 18.4 7.1Second Quintile 87.6 32.9 17.6 28.9 10.6Third Quintile 81.2 40.7 20.2 34.9 11.6Fourth Quintile 74.4 43.5 25.4 38.4 12.7Fifth Quintile (Highest) 59.1 47.7 32.7 38.0 17.6NAPA Combined Vulnerability IndexVery High 71.1 45.2 22.3 17.9 10.3High 86.1 26.8 14.5 36.6 8.0Moderate 84.4 39.6 19.6 30.1 13.3Low 74.0 42.7 21.0 30.3 12.0Very Low 82.9 38.7 27.6 37.1 19.5Bio-Climatic ZoneTropical 77.0 41.3 21.8 32.6 10.4Sub-tropical 81.9 33.9 18.0 25.2 14.0Temperate 94.6 34.6 11.7 21.0 10.6Sub-alpine 100.0 35.0 45.0 20.0 0.00Nepal 79.5 38.4 20.0 29.5 11.6
5 The result is based on multiple response
National Climate Change Impact Survey 2016 | 19
4.3. Socioeconomic Characteristics
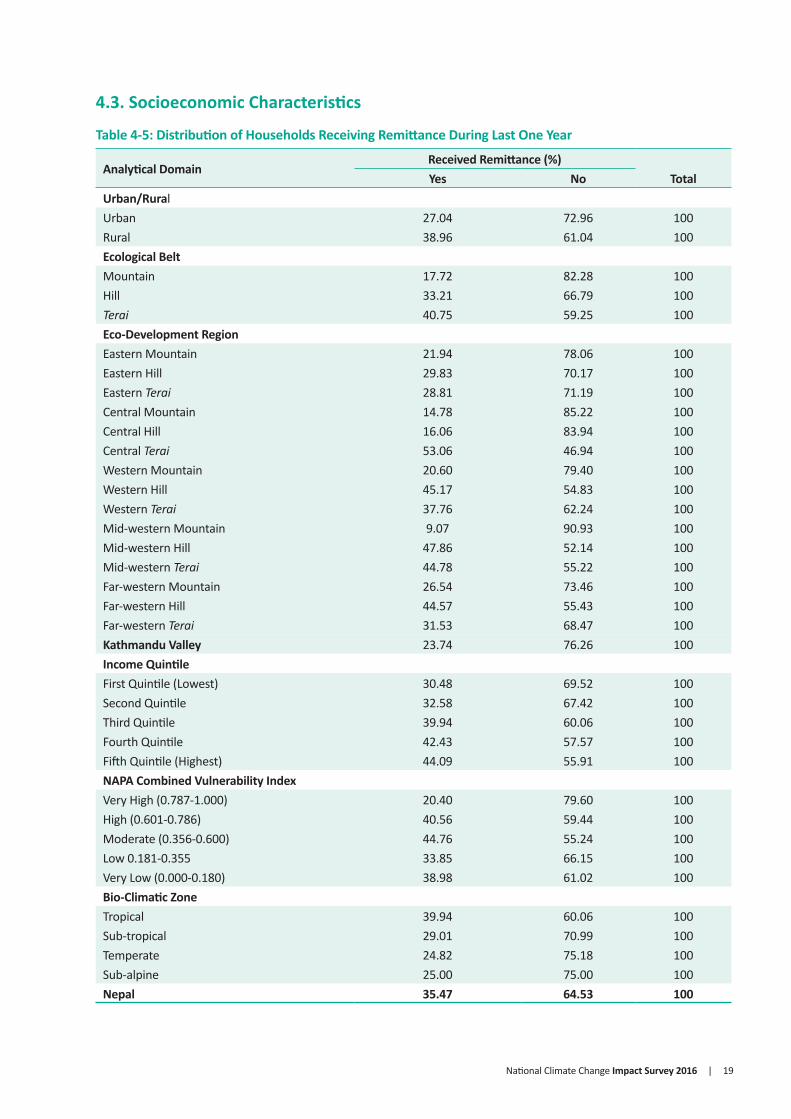
Table 4-5: Distribution of Households Receiving Remittance During Last One Year
Analytical DomainReceived Remittance (%)
TotalYes NoUrban/RuralUrban 27.04 72.96 100Rural 38.96 61.04 100Ecological BeltMountain 17.72 82.28 100Hill 33.21 66.79 100Terai 40.75 59.25 100Eco-Development RegionEastern Mountain 21.94 78.06 100Eastern Hill 29.83 70.17 100Eastern Terai 28.81 71.19 100Central Mountain 14.78 85.22 100Central Hill 16.06 83.94 100Central Terai 53.06 46.94 100Western Mountain 20.60 79.40 100Western Hill 45.17 54.83 100Western Terai 37.76 62.24 100Mid-western Mountain 9.07 90.93 100Mid-western Hill 47.86 52.14 100Mid-western Terai 44.78 55.22 100Far-western Mountain 26.54 73.46 100Far-western Hill 44.57 55.43 100Far-western Terai 31.53 68.47 100Kathmandu Valley 23.74 76.26 100Income QuintileFirst Quintile (Lowest) 30.48 69.52 100Second Quintile 32.58 67.42 100Third Quintile 39.94 60.06 100Fourth Quintile 42.43 57.57 100Fifth Quintile (Highest) 44.09 55.91 100NAPA Combined Vulnerability IndexVery High (0.787-1.000) 20.40 79.60 100High (0.601-0.786) 40.56 59.44 100Moderate (0.356-0.600) 44.76 55.24 100Low 0.181-0.355 33.85 66.15 100Very Low (0.000-0.180) 38.98 61.02 100Bio-Climatic ZoneTropical 39.94 60.06 100Sub-tropical 29.01 70.99 100Temperate 24.82 75.18 100Sub-alpine 25.00 75.00 100Nepal 35.47 64.53 100
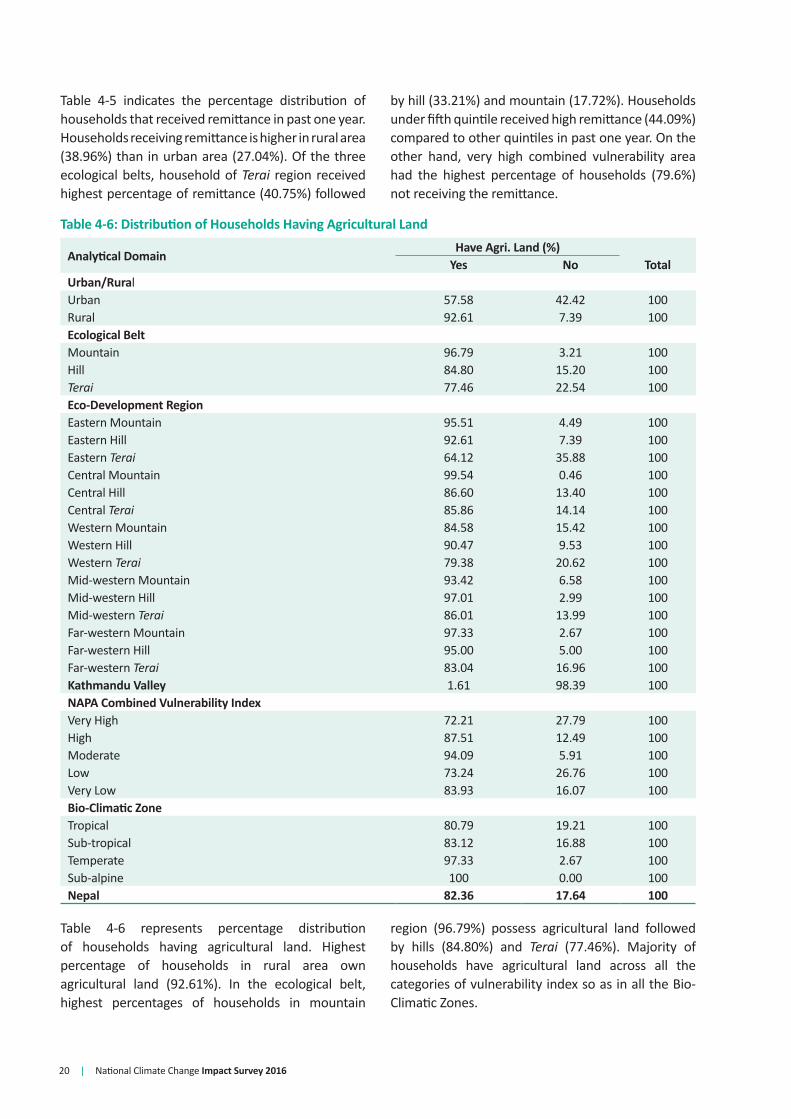
20 | National Climate Change Impact Survey 2016
Table 4-5 indicates the percentage distribution of households that received remittance in past one year. Households receiving remittance is higher in rural area (38.96%) than in urban area (27.04%). Of the three ecological belts, household of Terai region received highest percentage of remittance (40.75%) followed
by hill (33.21%) and mountain (17.72%). Households under fifth quintile received high remittance (44.09%) compared to other quintiles in past one year. On the other hand, very high combined vulnerability area had the highest percentage of households (79.6%) not receiving the remittance.
Table 4-6: Distribution of Households Having Agricultural Land
Analytical DomainHave Agri. Land (%)
TotalYes NoUrban/RuralUrban 57.58 42.42 100Rural 92.61 7.39 100Ecological BeltMountain 96.79 3.21 100Hill 84.80 15.20 100Terai 77.46 22.54 100Eco-Development RegionEastern Mountain 95.51 4.49 100Eastern Hill 92.61 7.39 100Eastern Terai 64.12 35.88 100Central Mountain 99.54 0.46 100Central Hill 86.60 13.40 100Central Terai 85.86 14.14 100Western Mountain 84.58 15.42 100Western Hill 90.47 9.53 100Western Terai 79.38 20.62 100Mid-western Mountain 93.42 6.58 100Mid-western Hill 97.01 2.99 100Mid-western Terai 86.01 13.99 100Far-western Mountain 97.33 2.67 100Far-western Hill 95.00 5.00 100Far-western Terai 83.04 16.96 100Kathmandu Valley 1.61 98.39 100NAPA Combined Vulnerability IndexVery High 72.21 27.79 100High 87.51 12.49 100Moderate 94.09 5.91 100Low 73.24 26.76 100Very Low 83.93 16.07 100Bio-Climatic ZoneTropical 80.79 19.21 100Sub-tropical 83.12 16.88 100Temperate 97.33 2.67 100Sub-alpine 100 0.00 100Nepal 82.36 17.64 100
Table 4-6 represents percentage distribution of households having agricultural land. Highest percentage of households in rural area own agricultural land (92.61%). In the ecological belt, highest percentages of households in mountain
region (96.79%) possess agricultural land followed by hills (84.80%) and Terai (77.46%). Majority of households have agricultural land across all the categories of vulnerability index so as in all the Bio-Climatic Zones.
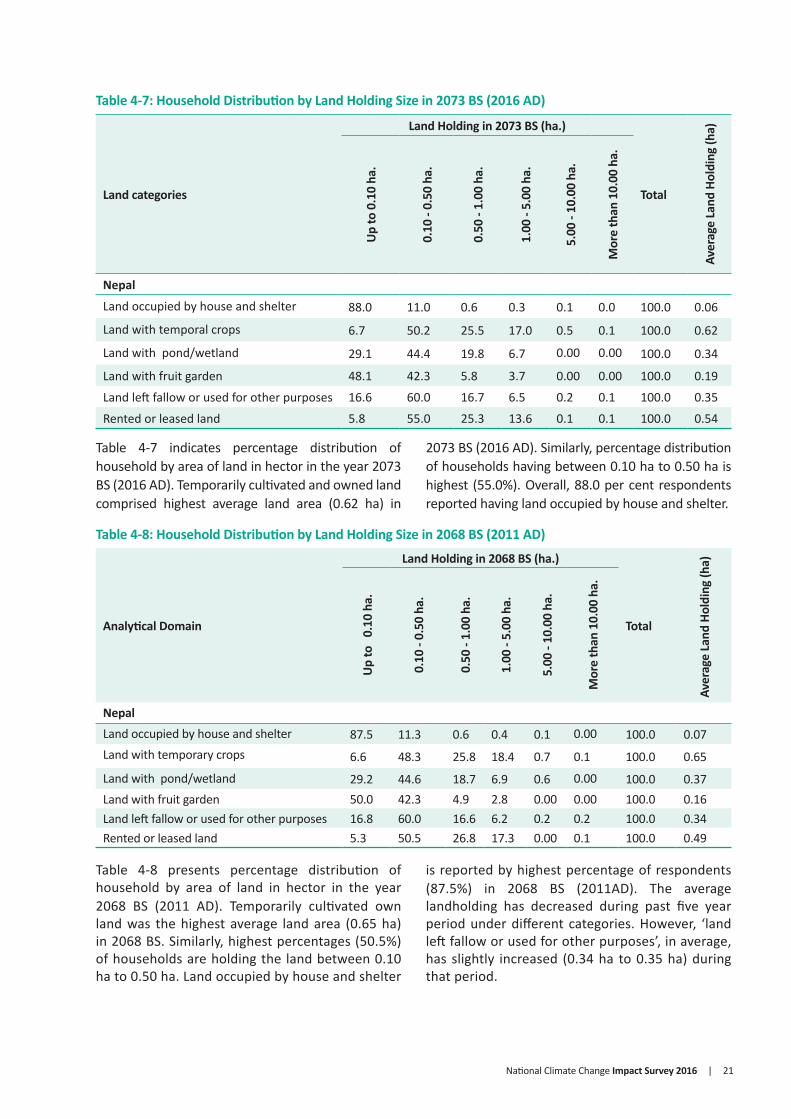
National Climate Change Impact Survey 2016 | 21
Table 4-7: Household Distribution by Land Holding Size in 2073 BS (2016 AD)
Land categories
Land Holding in 2073 BS (ha.)
Total
Aver
age
Land
Hol
ding
(ha)
Up
to 0
.10
ha.
0.10
- 0.
50 h
a.
0.50
- 1.
00 h
a.
1.00
- 5.
00 h
a.
5.00
- 10
.00
ha.
Mor
e th
an 1
0.00
ha.
Nepal
Land occupied by house and shelter 88.0 11.0 0.6 0.3 0.1 0.0 100.0 0.06
Land with temporal crops 6.7 50.2 25.5 17.0 0.5 0.1 100.0 0.62
Land with pond/wetland 29.1 44.4 19.8 6.7 0.00 0.00 100.0 0.34
Land with fruit garden 48.1 42.3 5.8 3.7 0.00 0.00 100.0 0.19
Land left fallow or used for other purposes 16.6 60.0 16.7 6.5 0.2 0.1 100.0 0.35
Rented or leased land 5.8 55.0 25.3 13.6 0.1 0.1 100.0 0.54
Table 4-8 presents percentage distribution of household by area of land in hector in the year 2068 BS (2011 AD). Temporarily cultivated own land was the highest average land area (0.65 ha) in 2068 BS. Similarly, highest percentages (50.5%) of households are holding the land between 0.10 ha to 0.50 ha. Land occupied by house and shelter
is reported by highest percentage of respondents (87.5%) in 2068 BS (2011AD). The average landholding has decreased during past five year period under different categories. However, ‘land left fallow or used for other purposes’, in average, has slightly increased (0.34 ha to 0.35 ha) during that period.
Table 4-8: Household Distribution by Land Holding Size in 2068 BS (2011 AD)
Analytical Domain
Land Holding in 2068 BS (ha.)
Total
Aver
age
Land
Hol
ding
(ha)
Up
to
0.10
ha.
0.10
- 0.
50 h
a.
0.50
- 1.
00 h
a.
1.00
- 5.
00 h
a.
5.00
- 10
.00
ha.
Mor
e th
an 1
0.00
ha.
NepalLand occupied by house and shelter 87.5 11.3 0.6 0.4 0.1 0.00 100.0 0.07Land with temporary crops 6.6 48.3 25.8 18.4 0.7 0.1 100.0 0.65
Land with pond/wetland 29.2 44.6 18.7 6.9 0.6 0.00 100.0 0.37Land with fruit garden 50.0 42.3 4.9 2.8 0.00 0.00 100.0 0.16Land left fallow or used for other purposes 16.8 60.0 16.6 6.2 0.2 0.2 100.0 0.34Rented or leased land 5.3 50.5 26.8 17.3 0.00 0.1 100.0 0.49
Table 4-7 indicates percentage distribution of household by area of land in hector in the year 2073 BS (2016 AD). Temporarily cultivated and owned land comprised highest average land area (0.62 ha) in
2073 BS (2016 AD). Similarly, percentage distribution of households having between 0.10 ha to 0.50 ha is highest (55.0%). Overall, 88.0 per cent respondents reported having land occupied by house and shelter.
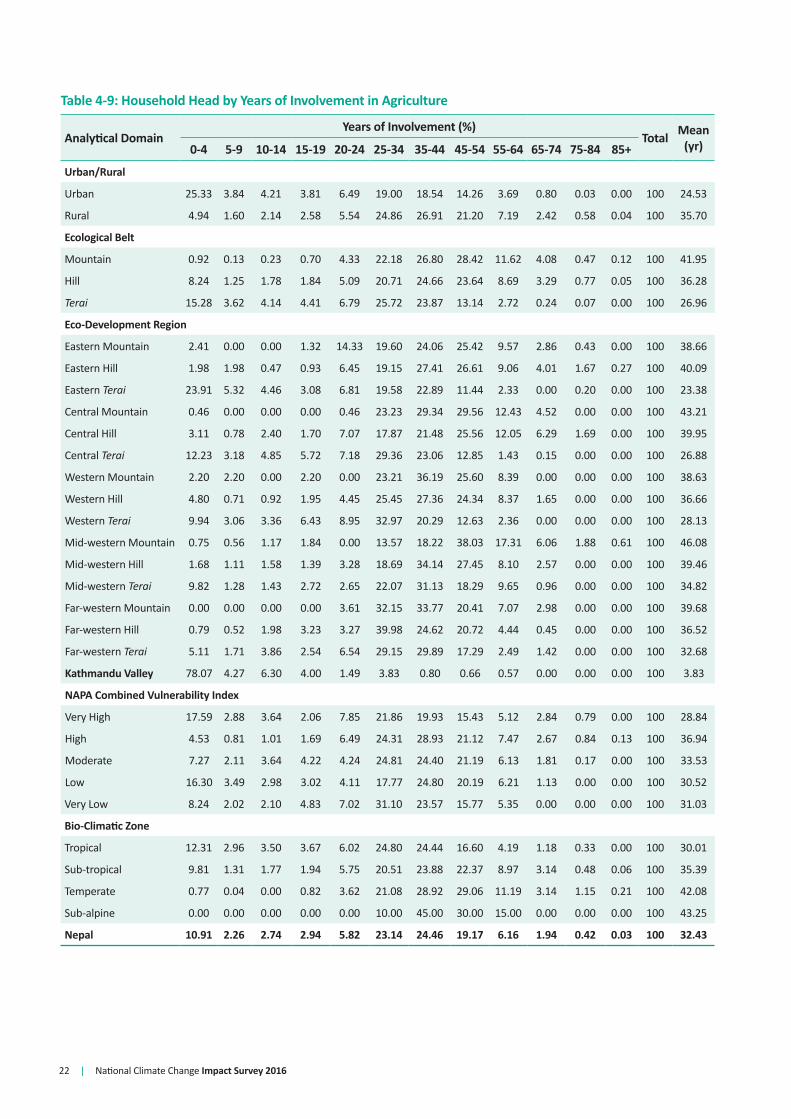
22 | National Climate Change Impact Survey 2016
Table 4-9: Household Head by Years of Involvement in Agriculture
Analytical DomainYears of Involvement (%)
Total Mean (yr)0-4 5-9 10-14 15-19 20-24 25-34 35-44 45-54 55-64 65-74 75-84 85+
Urban/Rural
Urban 25.33 3.84 4.21 3.81 6.49 19.00 18.54 14.26 3.69 0.80 0.03 0.00 100 24.53
Rural 4.94 1.60 2.14 2.58 5.54 24.86 26.91 21.20 7.19 2.42 0.58 0.04 100 35.70
Ecological Belt
Mountain 0.92 0.13 0.23 0.70 4.33 22.18 26.80 28.42 11.62 4.08 0.47 0.12 100 41.95
Hill 8.24 1.25 1.78 1.84 5.09 20.71 24.66 23.64 8.69 3.29 0.77 0.05 100 36.28
Terai 15.28 3.62 4.14 4.41 6.79 25.72 23.87 13.14 2.72 0.24 0.07 0.00 100 26.96
Eco-Development Region
Eastern Mountain 2.41 0.00 0.00 1.32 14.33 19.60 24.06 25.42 9.57 2.86 0.43 0.00 100 38.66
Eastern Hill 1.98 1.98 0.47 0.93 6.45 19.15 27.41 26.61 9.06 4.01 1.67 0.27 100 40.09
Eastern Terai 23.91 5.32 4.46 3.08 6.81 19.58 22.89 11.44 2.33 0.00 0.20 0.00 100 23.38
Central Mountain 0.46 0.00 0.00 0.00 0.46 23.23 29.34 29.56 12.43 4.52 0.00 0.00 100 43.21
Central Hill 3.11 0.78 2.40 1.70 7.07 17.87 21.48 25.56 12.05 6.29 1.69 0.00 100 39.95
Central Terai 12.23 3.18 4.85 5.72 7.18 29.36 23.06 12.85 1.43 0.15 0.00 0.00 100 26.88
Western Mountain 2.20 2.20 0.00 2.20 0.00 23.21 36.19 25.60 8.39 0.00 0.00 0.00 100 38.63
Western Hill 4.80 0.71 0.92 1.95 4.45 25.45 27.36 24.34 8.37 1.65 0.00 0.00 100 36.66
Western Terai 9.94 3.06 3.36 6.43 8.95 32.97 20.29 12.63 2.36 0.00 0.00 0.00 100 28.13
Mid-western Mountain 0.75 0.56 1.17 1.84 0.00 13.57 18.22 38.03 17.31 6.06 1.88 0.61 100 46.08
Mid-western Hill 1.68 1.11 1.58 1.39 3.28 18.69 34.14 27.45 8.10 2.57 0.00 0.00 100 39.46
Mid-western Terai 9.82 1.28 1.43 2.72 2.65 22.07 31.13 18.29 9.65 0.96 0.00 0.00 100 34.82
Far-western Mountain 0.00 0.00 0.00 0.00 3.61 32.15 33.77 20.41 7.07 2.98 0.00 0.00 100 39.68
Far-western Hill 0.79 0.52 1.98 3.23 3.27 39.98 24.62 20.72 4.44 0.45 0.00 0.00 100 36.52
Far-western Terai 5.11 1.71 3.86 2.54 6.54 29.15 29.89 17.29 2.49 1.42 0.00 0.00 100 32.68
Kathmandu Valley 78.07 4.27 6.30 4.00 1.49 3.83 0.80 0.66 0.57 0.00 0.00 0.00 100 3.83
NAPA Combined Vulnerability Index
Very High 17.59 2.88 3.64 2.06 7.85 21.86 19.93 15.43 5.12 2.84 0.79 0.00 100 28.84
High 4.53 0.81 1.01 1.69 6.49 24.31 28.93 21.12 7.47 2.67 0.84 0.13 100 36.94
Moderate 7.27 2.11 3.64 4.22 4.24 24.81 24.40 21.19 6.13 1.81 0.17 0.00 100 33.53
Low 16.30 3.49 2.98 3.02 4.11 17.77 24.80 20.19 6.21 1.13 0.00 0.00 100 30.52
Very Low 8.24 2.02 2.10 4.83 7.02 31.10 23.57 15.77 5.35 0.00 0.00 0.00 100 31.03
Bio-Climatic Zone
Tropical 12.31 2.96 3.50 3.67 6.02 24.80 24.44 16.60 4.19 1.18 0.33 0.00 100 30.01
Sub-tropical 9.81 1.31 1.77 1.94 5.75 20.51 23.88 22.37 8.97 3.14 0.48 0.06 100 35.39
Temperate 0.77 0.04 0.00 0.82 3.62 21.08 28.92 29.06 11.19 3.14 1.15 0.21 100 42.08
Sub-alpine 0.00 0.00 0.00 0.00 0.00 10.00 45.00 30.00 15.00 0.00 0.00 0.00 100 43.25
Nepal 10.91 2.26 2.74 2.94 5.82 23.14 24.46 19.17 6.16 1.94 0.42 0.03 100 32.43

National Climate Change Impact Survey 2016 | 23
Table 4-9 indicates the distribution of household heads by years of involvement in agriculture. The result shows that the highest percentages of household heads (24.4%) are involved in agriculture for 35 to 44 years followed by 23.1 per cent households for 25 to 34 years and 19.17 per cent for 45 to 54 years. Highest mean year of involvement is found in mid-western mountain (46.08%).
In ecological belt, majority of household heads in mountains, and hills have (25 to 34), (35 to
44), and (45 to 54) years of involvement in agriculture. Across the eco-development region, the result reveals that high percentage of household (78.07%) in Kathmandu Valley have least involvement in agriculture (0 to 4 years). In areas with very high vulnerability index, the highest years of involvement in agriculture was found to be 35 to 44 years. Mean years of involvement in agriculture is highest (43.25 years) in sub-alpine climatic zone.
Table 4-10: Households with Membership of Co-operatives and Saving Groups
Analytical DomainMembership of Co-operatives and Saving Groups (%)
TotalYes No Not applicable
Urban/RuralUrban 53.57 46.27 0.16 100Rural 46.36 53.40 0.24 100Ecological BeltMountain 64.52 34.27 1.21 100Hill 48.21 51.59 0.20 100Terai 45.97 53.97 0.06 100Eco-Development RegionEastern Mountain 62.33 37.67 0.00 100Eastern Hill 41.80 57.65 0.55 100Eastern Terai 48.55 51.45 0.00 100Central Mountain 78.08 21.92 0.00 100Central Hill 57.70 42.30 0.00 100Central Terai 41.93 57.90 0.17 100Western Mountain 51.01 48.99 0.00 100Western Hill 42.62 57.38 0.00 100Western Terai 43.02 56.98 0.00 100Mid-western Mountain 46.45 47.40 6.15 100Mid-western Hill 57.49 42.51 0.00 100Mid-western Terai 64.20 35.80 0.00 100Far-western Mountain 61.14 38.86 0.00 100Far-western Hill 40.24 59.76 0.00 100Far-western Terai 33.06 66.94 0.00 100Kathmandu Valley 38.03 60.48 1.49 100NAPA Combined Vulnerability IndexVery High 47.84 51.95 0.21 100High 48.65 50.95 0.41 100Moderate 44.21 55.47 0.31 100Low 54.52 45.48 0.00 100Very Low 47.16 52.84 0.00 100Bio-Climatic ZoneTropical 49.44 50.51 0.05 100Sub-tropical 47.20 52.53 0.27 100Temperate 45.16 52.75 2.09 100Sub-alpine 40.00 60.00 0.00 100Nepal 48.47 51.31 0.22 100

24 | National Climate Change Impact Survey 2016
Table 4-10 represents the percentage distribution of household by membership of co-operative/small savings group. Overall percentage distribution shows that 51.31 per cent households do not have any membership of co-operative/small savings group. More households with membership reside in urban area (53.57%) in comparison to rural area (46.36%). In ecological belts, households of mountain region
have highest percentage of membership (64.52%) while lowest (45.97%) in Terai. Mid-western mountain shows almost equal percentage of households having membership (46.45%) and not having membership (47.40%) of co-operative/small savings group. Significant percentage of households (51.95%) residing in very high combined vulnerability area do not have membership of cooperative or small saving groups.
Table 4-11: Household Saving Regularly in Co-operatives and Saving Groups in Past 12 Months
Analytical DomainSaving Regularly (%)
TotalYes No Not applicable
Urban/RuralUrban 58.50 41.22 0.28 100Rural 50.53 49.21 0.26 100Ecological BeltMountain 63.91 34.89 1.21 100Hill 55.82 44.02 0.16 100Terai 48.03 51.76 0.21 100Eco-Development RegionEastern Mountain 58.78 41.22 0.00 100Eastern Hill 48.01 51.71 0.28 100Eastern Terai 47.11 52.70 0.20 100Central Mountain 76.70 23.30 0.00 100Central Hill 70.11 29.89 0.00 100Central Terai 42.80 56.83 0.37 100Western Mountain 46.01 53.99 0.00 100Western Hill 49.46 50.54 0.00 100Western Terai 56.45 43.55 0.00 100Mid-western Mountain 47.23 46.62 6.15 100Mid-western Hill 56.87 43.13 0.00 100Mid-western Terai 64.79 35.21 0.00 100Far-western Mountain 64.42 35.58 0.00 100Far-western Hill 54.93 45.07 0.00 100Far-western Terai 41.67 58.33 0.00 100Kathmandu Valley 42.99 55.38 1.64 100NAPA Combined Vulnerability IndexVery High 53.88 45.89 0.23 100High 52.03 47.42 0.55 100Moderate 46.46 53.32 0.22 100Low 56.73 43.12 0.15 100Very Low 60.73 39.27 0.00 100Bio-Climatic ZoneTropical 52.38 47.46 0.16 100Sub-tropical 54.20 45.58 0.22 100Temperate 49.29 48.63 2.09 100Sub-alpine 35.00 65.00 0.00 100Nepal 52.86 46.87 0.27 100

National Climate Change Impact Survey 2016 | 25
Table 4-11 represents the percentage distribution of household saving regularly in co-operatives/small saving group in past 12 months. The total of 52.86 per cent of households are saving regularly while 46.87 per cent are not doing so. The highest saving group is from mountain belt (63.91%) in which central mountain is the highest (76.70%). Larger percentage (51.76%) of households in Terai do not have regular savings with highest being the far-western Terai (58.33%).
As a whole, 60.73 per cent of households residing in very low vulnerability area are engaged in regular saving whereas households in moderate vulnerability are not engaged in regular saving (53.32%). The percentage of households who have regular saving is found higher in tropical (52.38%), sub-tropical (54.20%) and temperate (49.29%) climatic zones.
Table 4-12: Households’ Involvement in Community Organisation
Analytical DomainInvolvement in Community Organisation (%)
TotalYes No Not applicable
Urban/RuralUrban 38.11 61.72 0.17 100Rural 37.63 62.16 0.20 100Ecological BeltMountain 39.76 60.24 0.00 100Hill 44.43 55.41 0.16 100Terai 30.82 68.92 0.27 100Eco-Development RegionEastern Mountain 62.51 37.49 0.00 100Eastern Hill 47.42 52.31 0.27 100Eastern Terai 18.53 81.04 0.42 100Central Mountain 34.24 65.76 0.00 100Central Hill 44.39 55.61 0.00 100Central Terai 30.37 69.31 0.32 100Western Mountain 38.81 61.19 0.00 100Western Hill 49.13 50.87 0.00 100Western Terai 47.10 52.90 0.00 100Mid-western Mountain 41.82 58.18 0.00 100Mid-western Hill 52.17 47.83 0.00 100Mid-western Terai 52.59 47.41 0.00 100Far-western Mountain 19.36 80.64 0.00 100Far-western Hill 29.52 70.48 0.00 100Far-western Terai 34.96 65.04 0.00 100Kathmandu Valley 16.52 81.91 1.58 100NAPA Combined Vulnerability IndexVery High 35.41 64.22 0.37 100High 31.61 68.28 0.11 100Moderate 40.97 58.90 0.12 100Low 35.47 64.26 0.27 100Very Low 56.54 43.46 0.00 100Bio-Climatic ZoneTropical 34.74 65.06 0.20 100Sub-tropical 43.39 56.40 0.21 100Temperate 35.83 64.17 0.00 100Sub-alpine 30.00 70.00 0.00 100Nepal 37.77 62.03 0.20 100

26 | National Climate Change Impact Survey 2016
Table 4-12 shows the percentage of household in terms of involvement in community organisations that include community forest user groups and water users’ committee, and farmers’ groups. It reveals that a total of 62.03 per cent households are not involved in community organisations. Significant percentage of households both in urban (61.72%) and rural (62.16%) are not involved in any
of the community organisations. However, majority of households in eastern mountain (62.51%) were found to be involved in community organisations while in Kathmandu Valley only 16.52 per cent were involved. Similarly, households in high combined vulnerability areas have relatively high percentage (68.28 %) of non-involvement in community organisation.
Table 4-13: Households Receiving Support from Agriculture Service Centre in Last 12 Months
Analytical DomainReceived Support (%)
TotalYes No Not applicable
Urban/RuralUrban 18.62 59.28 22.10 100Rural 20.80 77.62 1.58 100Ecological BeltMountain 24.24 74.80 0.96 100Hill 20.49 71.65 7.86 100Terai 19.14 72.40 8.46 100Eco-Development RegionEastern Mountain 39.12 60.03 0.85 100Eastern Hill 31.11 68.89 0.00 100Eastern Terai 10.07 76.08 13.85 100Central Mountain 13.00 87.00 0.00 100Central Hill 18.45 76.03 5.52 100Central Terai 28.69 68.04 3.27 100Western Mountain 39.82 55.77 4.40 100Western Hill 18.54 78.21 3.26 100Western Terai 8.00 78.00 14.00 100Mid-western Mountain 23.57 74.93 1.50 100Mid-western Hill 30.63 68.96 0.41 100Mid-western Terai 25.33 70.58 4.09 100Far-western Mountain 26.35 71.51 2.14 100Far-western Hill 7.73 91.99 0.28 100Far-western Terai 23.52 70.36 6.11 100Kathmandu Valley 0.40 22.38 77.22 100NAPA Combined Vulnerability IndexVery High 14.37 68.65 16.98 100High 19.31 78.13 2.56 100Moderate 28.75 69.60 1.65 100Low 20.03 71.22 8.75 100Very Low 14.38 75.32 10.30 100Bio-Climatic ZoneTropical 20.93 72.07 7.00 100Sub-tropical 19.39 70.98 9.63 100Temperate 15.79 84.13 0.07 100Sub-alpine 20.00 80.00 0.00 100Nepal 20.16 72.25 7.59 100

National Climate Change Impact Survey 2016 | 27
Table 4-14: Average Distance to Nearest Facilities and Service Centres
Analytical Domain
Dist
ance
to
Mot
orab
le R
oad
(km
)
Dist
ance
to H
ealth
Ce
ntre
(km
)
Dist
ance
to N
eare
st
High
Sch
ool (
km)
Dist
ance
to Lo
cal
Mar
ket (
km)
Dist
ance
to
Agric
ultu
re S
ervi
ce
Cent
re (k
m)
Urban/RuralUrban 0.83 1.76 1.39 2.23 3.25Rural 3.39 3.12 2.76 6.48 6.33Ecological BeltMountain 10.47 3.28 3.09 9.09 6.07Hill 2.88 3.31 2.67 6.52 6.71Terai 1.05 2.05 1.93 3.29 4.04Eco-Development RegionEastern Mountain 13.24 4.28 4.27 9.05 7.81Eastern Hill 5.84 3.86 3.21 6.88 6.83Eastern Terai 1.46 2.61 2.14 3.47 4.82Central Mountain 1.29 3.80 3.47 6.13 8.33Central Hill 2.08 2.53 2.15 5.93 6.19Central Terai 0.38 1.37 1.75 2.37 2.58Western Mountain 0.11 1.37 1.74 1.37 1.40Western Hill 0.90 3.90 2.13 9.06 6.43Western Terai 0.54 1.63 1.34 1.79 3.35Mid-western Mountain 23.98 1.19 1.13 14.39 2.11Mid-western Hill 3.58 4.46 5.29 5.83 9.75Mid-western Terai 1.80 2.90 2.65 8.44 6.69Far-western Mountain 10.87 3.32 2.98 9.67 3.92Far-western Hill 8.29 3.18 2.60 5.60 9.23Far-western Terai 2.77 2.59 1.90 2.67 5.79Kathmandu Valley 0.01 0.43 0.32 0.16 1.38NAPA Combined Vulnerability IndexVery High 1.13 2.38 2.35 3.94 4.76High 5.08 3.20 3.12 5.46 5.90Moderate 2.15 2.83 2.33 6.06 4.62Low 2.93 2.72 1.95 5.67 7.08Very Low 0.68 2.08 1.41 4.72 4.26Bio-Climatic ZoneTropical 1.43 2.39 2.16 3.81 4.70Sub-tropical 3.73 3.22 2.59 6.75 6.50Temperate 10.38 3.43 3.30 12.77 7.06Sub-alpine 0.20 2.45 2.20 2.45 2.50Nepal 2.64 2.73 2.36 5.23 5.43
Table 4-13 indicates the percentage of households receiving agricultural extension support or services from Agriculture Service Centre in past 12 months. The result depicts the highest percentage (72.25%) of households have not received any service from agri-culture service centres in past one year. Among the households which received support, highest percent-
age of households are in western mountain (39.82%) followed by eastern mountain (39.12%).
Overall, the survey result shows that majority of re-spondents in all analytical domains reported of not receiving any kind of agricultural extension services.
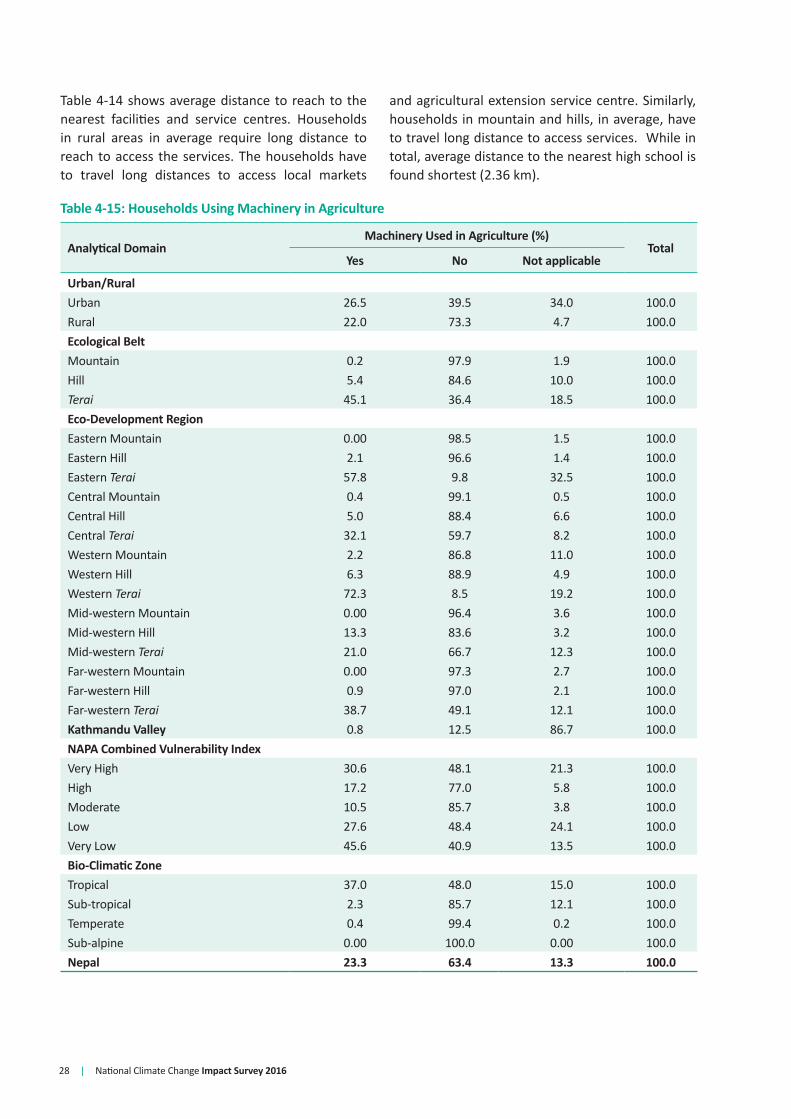
28 | National Climate Change Impact Survey 2016
Table 4-14 shows average distance to reach to the nearest facilities and service centres. Households in rural areas in average require long distance to reach to access the services. The households have to travel long distances to access local markets
and agricultural extension service centre. Similarly, households in mountain and hills, in average, have to travel long distance to access services. While in total, average distance to the nearest high school is found shortest (2.36 km).
Table 4-15: Households Using Machinery in Agriculture
Analytical DomainMachinery Used in Agriculture (%)
TotalYes No Not applicable
Urban/RuralUrban 26.5 39.5 34.0 100.0Rural 22.0 73.3 4.7 100.0Ecological BeltMountain 0.2 97.9 1.9 100.0Hill 5.4 84.6 10.0 100.0Terai 45.1 36.4 18.5 100.0Eco-Development RegionEastern Mountain 0.00 98.5 1.5 100.0Eastern Hill 2.1 96.6 1.4 100.0Eastern Terai 57.8 9.8 32.5 100.0Central Mountain 0.4 99.1 0.5 100.0Central Hill 5.0 88.4 6.6 100.0Central Terai 32.1 59.7 8.2 100.0Western Mountain 2.2 86.8 11.0 100.0Western Hill 6.3 88.9 4.9 100.0Western Terai 72.3 8.5 19.2 100.0Mid-western Mountain 0.00 96.4 3.6 100.0Mid-western Hill 13.3 83.6 3.2 100.0Mid-western Terai 21.0 66.7 12.3 100.0Far-western Mountain 0.00 97.3 2.7 100.0Far-western Hill 0.9 97.0 2.1 100.0Far-western Terai 38.7 49.1 12.1 100.0Kathmandu Valley 0.8 12.5 86.7 100.0NAPA Combined Vulnerability IndexVery High 30.6 48.1 21.3 100.0High 17.2 77.0 5.8 100.0Moderate 10.5 85.7 3.8 100.0Low 27.6 48.4 24.1 100.0Very Low 45.6 40.9 13.5 100.0Bio-Climatic ZoneTropical 37.0 48.0 15.0 100.0Sub-tropical 2.3 85.7 12.1 100.0Temperate 0.4 99.4 0.2 100.0Sub-alpine 0.00 100.0 0.00 100.0Nepal 23.3 63.4 13.3 100.0
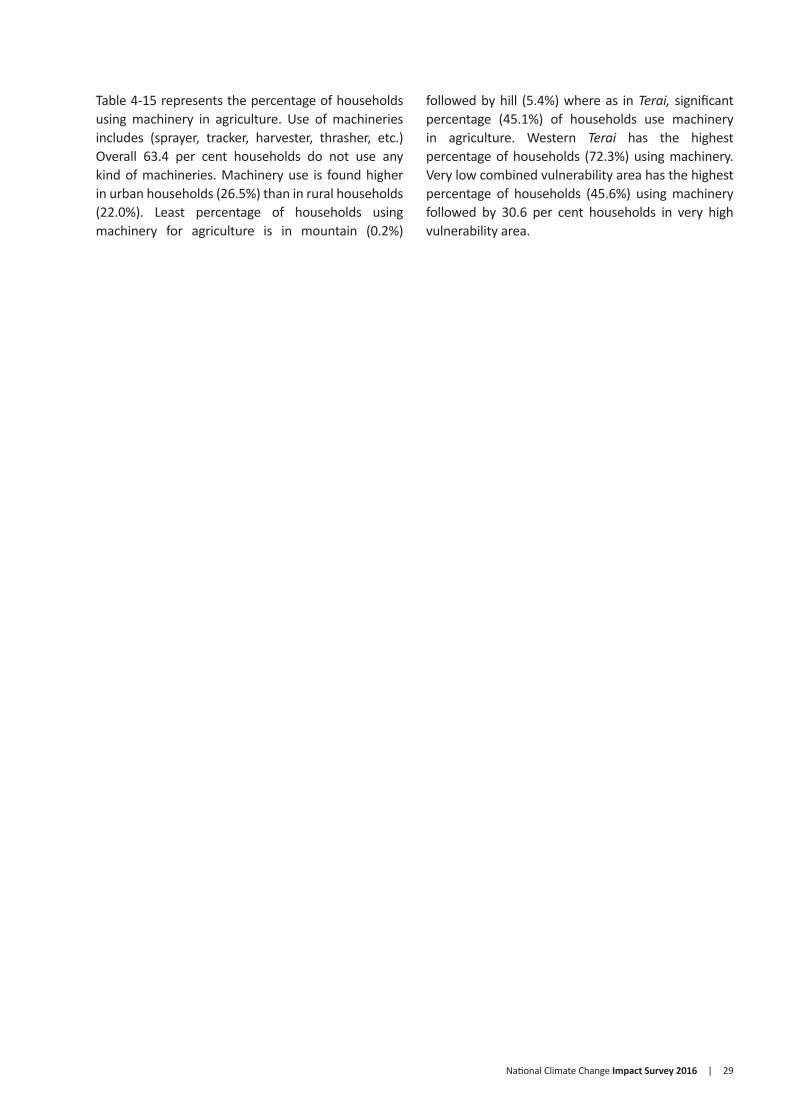
National Climate Change Impact Survey 2016 | 29
Table 4-15 represents the percentage of households using machinery in agriculture. Use of machineries includes (sprayer, tracker, harvester, thrasher, etc.) Overall 63.4 per cent households do not use any kind of machineries. Machinery use is found higher in urban households (26.5%) than in rural households (22.0%). Least percentage of households using machinery for agriculture is in mountain (0.2%)
followed by hill (5.4%) where as in Terai, significant percentage (45.1%) of households use machinery in agriculture. Western Terai has the highest percentage of households (72.3%) using machinery. Very low combined vulnerability area has the highest percentage of households (45.6%) using machinery followed by 30.6 per cent households in very high vulnerability area.

30 | National Climate Change Impact Survey 2016
5.1. Summary of FindingsThe survey indicates that about half of the households (49.33%) have heard about climate change. Majority of households in the mountain (63.59%) and female respondents (60.92%) are found to have not heard about it. Based on ecological belt, up to 80.35 per cent of the households in Mid-western mountain have not heard about climate change. Households from Terai ecological belt (51%) are found to be more informed (Figure 5-1).
PERCEPTION OF CLIMATE CHANGE
CHAPTER 5
Figure 5-1: Households’ Knowledge on Climate Change
0.00
10.00
20.00
30.00
40.00
50.00
60.00
70.00
Ecological Belt Sex Total
Resp
onse
(%)
Respondent's category
Yes
No
Figure 5-2: Main Source of Information About Climate Change
Family member
Nighbour / friends
Local agencies / official
A wareness program
News paper
Television
Radio
0 10 20 30 40 50
Sour
ce o
f inf
orm
ation
Responese (%)
Households reported significant change in monsoon, winter rainfall and temperature over the period of past 25 years. As a whole, 91 per cent of respondent said that monsoon is decreasing while only 3 per cent said it is increasing and 5 per cent said there is no change in monsoon. Similarly, 90 per cent of the respondents said winter rainfall has been decreasing. Likewise, 89 per cent of the respondents reported that they have felt increasing temperature over the period of past 25 years (Figure 5-3).
91 90
Figure 5-3: Change on Climatic Variables in Last 25 years
The source of information about climate change varies (Figure 5-2). Majority of the households (42.8%) said that they have received information on climate change from radio and the second most (27.63%) information source was television.
People have different perceptions on the effects of climate change as 86.1, 43.4, 32.5, and 28.1 per cent of the households believed that drought, Disease/insects, hailstorm, and flood respectively are the main effects of climate change (Figure 5-4).
Figure 5-4: Potential Results of Climate Change
86
19
15
281027
23
33
6
19
615
4
43Drought Fire (forest)
Fire (settlement) Flood
Innundation
Thunderstrome Hailstorm
Heavy rain Sporadic rain
Soil erosion Land slide
Heat wave Diseases / insect
Windstorm

National Climate Change Impact Survey 2016 | 31
Figure 5-5: People’s Perception on Reason of Climate Change
Table 5-1: Households Which Have Heard About Climate Change
Analytical DomainPerception (%)
TotalYes No
Urban/RuralUrban 56.79 43.21 100.00Rural 46.24 53.76 100.00Ecological BeltMountain 36.41 63.59 100.00Hill 49.53 50.47 100.00Terai 51.35 48.65 100.00Eco-Development RegionEastern Mountain 59.38 40.62 100.00Eastern Hill 61.28 38.72 100.00Eastern Terai 44.09 55.91 100.00Central Mountain 35.67 64.33 100.00Central Hill 59.06 40.94 100.00Central Terai 56.67 43.33 100.00Western Mountain 29.23 70.77 100.00Western Hill 42.73 57.27 100.00Western Terai 56.86 43.14 100.00Mid-western Mountain 19.65 80.35 100.00Mid-western Hill 28.92 71.08 100.00Mid-western Terai 50.40 49.60 100.00Far-western Mountain 26.32 73.68 100.00Far-western Hill 29.56 70.44 100.00Far-western Terai 49.88 50.12 100.00Kathmandu Valley 66.89 33.11 100.00SexMale 54.07 45.93 100.00Female 39.08 60.92 100.00Age Group 45-54 Yrs. 55.16 44.84 100.0055-64 Yrs. 47.61 52.39 100.0065-74 Yrs. 43.84 56.16 100.0075+ Yrs. 41.01 58.99 100.00
59
Natural cause, 41
Human
God's give, 11
Earthquake, 6 Others, 5
Don't know, 13
Majority of the households (59%) opined that deforestation was the main cause for climate change. While 41 per cent of households believed that it is caused by natural phenomenon, 33 per cent and 30 per cent of households think human interventions and urbanisation respectively are other major causes of climate change (Figure 5-5).
The detail analytical domain-wise statistical data of perception on public knowledge of climate change, source of information, changes on climatic variables, potential causes, and potential results has been described in sub-sections coming up next.
5.2. Perception on Climate Change
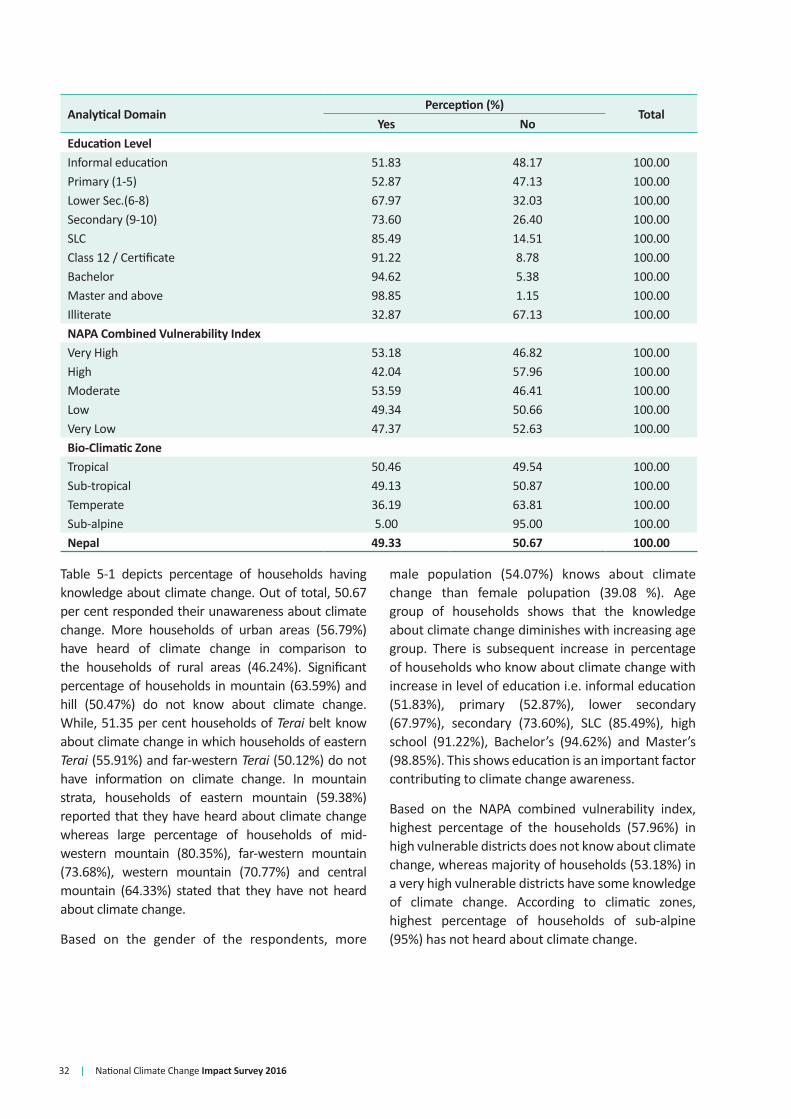
32 | National Climate Change Impact Survey 2016
Analytical DomainPerception (%)
TotalYes No
Education LevelInformal education 51.83 48.17 100.00Primary (1-5) 52.87 47.13 100.00Lower Sec.(6-8) 67.97 32.03 100.00Secondary (9-10) 73.60 26.40 100.00SLC 85.49 14.51 100.00Class 12 / Certificate 91.22 8.78 100.00Bachelor 94.62 5.38 100.00Master and above 98.85 1.15 100.00Illiterate 32.87 67.13 100.00NAPA Combined Vulnerability IndexVery High 53.18 46.82 100.00High 42.04 57.96 100.00Moderate 53.59 46.41 100.00Low 49.34 50.66 100.00Very Low 47.37 52.63 100.00Bio-Climatic ZoneTropical 50.46 49.54 100.00Sub-tropical 49.13 50.87 100.00Temperate 36.19 63.81 100.00Sub-alpine 5.00 95.00 100.00Nepal 49.33 50.67 100.00
Table 5-1 depicts percentage of households having knowledge about climate change. Out of total, 50.67 per cent responded their unawareness about climate change. More households of urban areas (56.79%) have heard of climate change in comparison to the households of rural areas (46.24%). Significant percentage of households in mountain (63.59%) and hill (50.47%) do not know about climate change. While, 51.35 per cent households of Terai belt know about climate change in which households of eastern Terai (55.91%) and far-western Terai (50.12%) do not have information on climate change. In mountain strata, households of eastern mountain (59.38%) reported that they have heard about climate change whereas large percentage of households of mid-western mountain (80.35%), far-western mountain (73.68%), western mountain (70.77%) and central mountain (64.33%) stated that they have not heard about climate change.
Based on the gender of the respondents, more
male population (54.07%) knows about climate change than female polupation (39.08 %). Age group of households shows that the knowledge about climate change diminishes with increasing age group. There is subsequent increase in percentage of households who know about climate change with increase in level of education i.e. informal education (51.83%), primary (52.87%), lower secondary (67.97%), secondary (73.60%), SLC (85.49%), high school (91.22%), Bachelor’s (94.62%) and Master’s (98.85%). This shows education is an important factor contributing to climate change awareness.
Based on the NAPA combined vulnerability index, highest percentage of the households (57.96%) in high vulnerable districts does not know about climate change, whereas majority of households (53.18%) in a very high vulnerable districts have some knowledge of climate change. According to climatic zones, highest percentage of households of sub-alpine (95%) has not heard about climate change.

National Climate Change Impact Survey 2016 | 33
Table 5-2: Distribution of Households by Sources of Climate Information
Analytical Domain
Source of Information About Climate Change (%)
TotalRadio Television News paper
Awareness programmes
Local agencies /official
Neighbor /friends
Family member
Others
Urban/RuralUrban 27.25 46.58 7.60 3.17 1.00 12.01 1.90 0.49 100.00Rural 50.72 17.99 1.18 6.18 1.33 21.02 1.08 0.50 100.00Ecological BeltMountain 68.10 10.86 0.12 7.10 1.16 10.45 2.22 0.00 100.00Hill 51.24 24.24 4.77 5.07 1.48 11.32 1.55 0.32 100.00Terai 31.65 32.91 2.37 5.02 0.98 25.28 1.07 0.73 100.00Eco-Development RegionEastern Mountain 86.01 3.89 0.00 1.75 0.00 3.90 4.44 0.00 100.00Eastern Hill 61.34 18.12 2.94 1.54 0.56 13.16 2.34 0.00 100.00Eastern Terai 24.16 44.37 3.63 0.00 1.43 22.28 2.07 2.07 100.00Central Mountain 66.12 19.96 0.00 9.34 0.00 4.57 0.00 0.00 100.00Central Hill 62.66 19.98 4.75 2.56 1.07 7.52 0.62 0.84 100.00Central Terai 43.06 9.56 0.97 7.42 1.35 37.64 0.00 0.00 100.00Western Mountain 15.07 47.25 15.07 22.61 0.00 0.00 0.00 0.00 100.00Western Hill 44.97 24.34 3.81 8.47 0.12 17.27 1.01 0.00 100.00Western Terai 9.72 79.13 1.65 7.85 0.00 1.66 0.00 0.00 100.00Mid-western Mountain 54.93 18.28 0.00 14.85 0.00 7.59 4.35 0.00 100.00
Mid-western Hill 45.94 20.25 1.45 11.68 6.31 11.63 2.74 0.00 100.00Mid-western Terai 27.14 42.72 4.73 6.67 0.00 17.36 0.92 0.47 100.00Far-western Mountain 35.22 0.00 0.00 9.85 8.31 46.62 0.00 0.00 100.00
Far-western Hill 52.90 0.00 0.00 16.31 12.61 10.61 7.56 0.00 100.00Far-western Terai 46.34 18.12 3.73 3.97 0.00 20.43 6.17 1.26 100.00Kathmandu Valley 6.93 66.50 16.32 3.50 0.00 5.31 0.94 0.50 100.00SexMale 43.85 27.18 4.04 5.14 1.31 17.19 0.86 0.43 100.00Female 39.67 28.97 1.27 5.23 0.95 20.36 2.85 0.70 100.00Education LevelInformal education 56.19 22.57 1.37 2.92 0.38 15.10 1.37 0.09 100.00Primary (1-5) 43.14 32.26 1.83 5.91 1.05 15.18 0.12 0.50 100.00Lower Sec.(6-8) 32.10 41.98 4.47 3.44 3.27 13.26 1.47 0.00 100.00Secondary (9-10) 36.54 35.01 4.39 9.50 1.30 11.50 1.45 0.31 100.00SLC 48.55 36.59 4.44 5.00 1.93 3.25 0.23 0.00 100.00Class 12 / Certificate 33.20 51.39 9.87 3.19 0.00 2.13 0.21 0.00 100.00Bachelor 23.35 46.95 22.79 3.71 0.00 0.61 0.33 2.27 100.00Master and above 10.49 60.35 24.59 3.21 0.0 0.0 0.0 1.36 100.00Illiterate 41.31 12.82 0.34 6.57 1.44 33.97 2.55 0.99 100.00Income Quintile First Quintile (Lowest) 49.37 9.55 0.67 5.49 2.80 31.01 1.00 0.11 100.00
Second Quintile 54.16 16.21 1.19 5.73 0.77 19.76 1.80 0.38 100.00Third Quintile 44.05 24.47 2.27 5.63 0.89 20.52 1.72 0.45 100.00Fourth Quintile 38.78 39.60 3.33 4.14 0.21 12.12 1.40 0.44 100.00Fifth Quintile (Highest) 30.88 48.18 8.85 4.43 0.95 5.43 0.72 0.56 100.00
NAPA Combined Vulnerability IndexVery High 54.94 27.54 5.23 2.69 1.18 6.97 1.36 0.09 100.00High 53.97 17.22 1.82 3.81 2.60 17.81 2.14 0.63 100.00

34 | National Climate Change Impact Survey 2016
Analytical Domain
Source of Information About Climate Change (%)
TotalRadio Television News paper
Awareness programmes
Local agencies /official
Neighbor /friends
Family member
Others
Moderate 47.56 10.41 1.92 8.69 1.34 28.90 1.18 0.00 100.00Low 21.49 44.13 4.78 3.98 0.28 22.26 1.39 1.71 100.00Very Low 18.76 64.84 2.44 7.50 0.00 6.46 0.00 0.00 100.00Bio-Climatic ZoneTropical 34.22 32.03 3.03 5.37 1.19 22.51 0.97 0.67 100.00Sub-tropical 54.85 21.57 4.22 5.02 1.39 10.61 2.11 0.23 100.00Temperate 78.74 7.95 0.21 2.73 0.00 9.57 0.80 0.00 100.00Sub-alpine 0.00 100.00 0.00 0.00 0.00 0.00 0.00 0.00 100.00Nepal 42.81 27.63 3.34 5.16 1.22 17.98 1.36 0.50 100.00
Table 5-2 depicts percentage of the response by source of information related to climate change. Overall, 42.81 per cent households heard about climate change through radio, 27.63 per cent through television, and 17.98 per cent through
neighbors or friends. The main source of information in rural areas was radio and neighbor or friends. The result shows that across all the analytical domains, the main source of climate information was radio, television followed by neighbor or friends.
Table 5-3: Households’ Perception on Change of Climate in Last 25 Years
Analytical DomainHouseholds (%)
TotalYes NoUrban/RuralUrban 96.01 3.99 100.00Rural 94.68 5.32 100.00Ecological BeltMountain 93.85 6.15 100.00Hill 92.46 7.54 100.00Terai 97.88 2.12 100.00Eco-Development RegionEastern Mountain 84.62 15.38 100.00Eastern Hill 97.32 2.68 100.00Eastern Terai 97.58 2.42 100.00Central Mountain 95.46 4.54 100.00Central Hill 93.09 6.91 100.00Central Terai 98.53 1.47 100.00Western Mountain 68.21 31.79 100.00Western Hill 86.28 13.72 100.00Western Terai 99.61 0.39 100.00Mid-western Mountain 98.14 1.86 100.00Mid-western Hill 93.22 6.78 100.00Mid-western Terai 95.79 4.21 100.00Far-western Mountain 99.40 0.60 100.00Far-western Hill 95.13 4.87 100.00Far-western Terai 95.46 4.54 100.00Kathmandu Valley 97.94 2.06 100.00Age Group45-54 Yrs. 95.64 4.36 100.0055-64 Yrs. 95.64 4.36 100.0065-74 Yrs. 93.19 6.81 100.0075+ Yrs. 94.96 5.04 100.00Nepal 95.07 4.93 100.00

National Climate Change Impact Survey 2016 | 35
Table 5-3 indicates percentage response on change of climate in past 25 years. Majority of the households said that the climate is changing in the last 25 years. However, significant percentage of households (31.79% and 15.38%) in western
mountain and eastern mountain respectively said that there was no change in the climate. There is not so much difference in responses across age-group of the households. The results confirm that majority of the households have observed change in climate.
Table 5-4: Perception on Reasons of Climate Change
Analytical Domain
Perception on Main Reason for Climate Change (%)6
Defo
rest
ation
Indu
stria
lisati
on
Urb
anisa
tion
Reso
urce
ex
ploi
tatio
n
God'
s will
Nat
ural
caus
e
Eart
hqua
ke
Oth
ers
Don'
t kno
w
Urban/RuralUrban 62.8 35.0 56.9 35.4 7.2 34.7 4.6 6.2 5.5Rural 57.6 20.0 18.2 32.4 12.2 43.4 6.6 5.0 15.6Ecological BeltMountain 49.8 4.0 15.3 30.3 12.7 52.6 11.4 2.8 11.4Hill 48.3 26.7 32.2 26.0 11.7 33.2 9.0 6.4 16.5Terai 70.8 25.6 29.7 40.7 9.5 46.0 2.3 4.7 9.1Eco-Development RegionEastern Mountain 14.9 7.3 29.4 44.5 15.6 54.0 31.7 0.00 10.0Eastern Hill 47.9 27.9 27.8 37.4 20.9 46.5 10.5 4.3 5.3Eastern Terai 74.0 38.5 49.2 41.6 5.5 38.0 1.4 5.7 2.6Central Mountain 34.9 3.1 19.4 6.2 17.0 61.0 12.0 7.7 7.1Central Hill 57.1 39.8 42.4 20.0 8.5 34.0 9.0 2.4 13.5Central Terai 59.9 19.6 10.0 40.9 11.4 50.3 2.0 1.2 19.4Western Mountain 22.6 6.5 0.00 9.7 4.1 58.4 12.9 31.1Western Hill 25.9 16.1 20.7 12.5 8.9 19.0 12.5 9.9 38.3Western Terai 85.5 13.4 33.6 31.6 10.3 63.7 4.6 9.1 0.1Mid-western Mountain 66.9 1.2 6.9 2.1 0.00 0.00 0.00 0.00 31.3Mid-western Hill 64.2 13.7 20.1 27.8 16.5 32.0 5.8 12.3 9.5Mid-western Terai 67.3 23.1 33.4 30.8 18.3 23.5 3.1 6.3 8.6Far-western Mountain 97.3 4.9 2.0 87.1 15.0 88.9 0.00 0.00 0.00Far-western Hill 87.1 5.5 6.4 70.7 8.2 74.8 5.1 2.8 5.5Far-western Terai 96.8 18.6 28.6 69.4 5.4 63.2 2.5 9.7 1.1Kathmandu Valley 30.0 53.7 89.9 23.2 4.0 11.7 2.1 7.3 3.3NAPA Combined Vulnerability IndexVery High 59.8 32.9 47.1 31.2 8.7 41.8 4.3 4.4 3.4High 56.7 15.7 16.3 43.8 15.4 36.3 8.6 3.9 14.0Moderate 47.7 16.6 11.6 23.8 10.8 44.6 6.9 4.8 26.7Low 71.3 37.5 46.5 37.8 8.1 38.4 4.0 6.8 4.5Very Low 66.1 15.6 28.8 26.0 9.6 45.5 5.6 9.5 13.9Bio-Climatic ZoneTropical 65.2 25.2 29.6 36.7 9.3 42.5 4.2 5.6 11.6Sub-tropical 49.6 24.8 32.5 29.2 12.7 38.2 8.9 5.4 12.9Temperate 49.0 10.4 9.9 18.4 16.2 37.3 8.8 2.1 22.8Sub-alpine 0.00 0.00 0.00 0.00 9.1 36.4 0.00 0.00 54.5Nepal 59.1 24.4 29.7 33.3 10.8 40.8 6.0 5.3 12.6
6 The result is based on multiple response

36 | National Climate Change Impact Survey 2016
Table 5-5: Main Climate Induced Disasters
Analytical Domain
Climate Induced Disasters Since Last 25 Years (%)7
Drou
ght
Fore
st F
ire
Fire
(sett
lem
ent)
Floo
d
Inun
datio
n
Win
dsto
rm
Thun
ders
torm
Hails
torm
Heav
y ra
in
Spor
adic
rain
Soil
eros
ion
Land
slid
e
Aval
anch
e
GLO
F
Hot w
ave
Cold
wav
e
Dise
ase
/ in
sect
Oth
ers
Urban/RuralUrban 85.5 14.3 11.1 25.9 14.7 23.9 25.7 27.1 9.7 24.9 4.3 11.6 0.0 0.0 6.9 25.0 41.2 1.9
Rural 86.3 21.0 16.9 29.1 8.3 27.9 22.1 34.8 4.2 16.2 7.1 16.3 0.2 0.0 3.1 25.4 44.3 0.9
Ecological BeltMountain 82.1 27.6 4.6 6.1 0.0 17.1 19.1 46.9 4.7 24.5 4.7 28.0 2.1 0.2 0.0 9.6 47.1 1.0
Hill 78.9 29.4 4.0 8.9 0.0 16.2 24.3 29.4 6.1 22.9 11.5 27.5 0.0 0.0 0.1 1.0 34.3 1.5
Terai 93.5 7.9 27.5 49.8 21.4 38.1 22.8 33.1 5.8 14.0 1.7 0.9 0.0 0.0 8.8 50.7 51.3 0.9
Eco-Development RegionEastern Mountain 30.4 2.1 5.6 12.5 0.0 3.3 25.4 57.8 18.8 6.5 17.7 49.4 4.7 0.8 0.0 38.7 39.1 2.4
Eastern Hill 91.4 26.8 10.4 13.5 0.0 21.4 18.3 23.2 12.3 19.7 1.9 18.3 0.0 0.0 0.0 5.2 37.9 2.6
Eastern Terai 94.8 5.5 26.5 40.9 28.4 51.2 35.2 21.7 5.8 12.4 1.7 1.6 0.0 0.0 1.5 41.2 51.9 0.4
Central Mountain 93.5 26.7 0.0 0.0 0.0 0.9 22.4 42.3 0.5 50.0 0.5 23.3 0.0 0.0 0.0 2.7 85.8 1.0
Central Hill 95.5 23.2 1.0 1.2 0.0 8.4 17.4 16.3 0.3 26.0 0.3 4.4 0.0 0.0 0.0 0.1 49.2 0.8
Central Terai 97.3 0.5 33.1 72.9 18.4 37.8 15.7 43.7 8.9 7.8 0.0 0.0 0.0 0.0 0.6 64.3 54.4 1.4
Western Mountain 67.5 3.2 0.0 0.0 0.0 35.5 0.0 37.3 6.5 0.0 41.0 36.4 32.8 0.0 0.0 0.0 66.6 6.5
Western Hill 40.8 31.1 1.6 2.6 0.0 8.7 36.5 34.2 8.0 20.8 29.2 39.8 0.0 0.0 0.0 0.0 12.2 1.3
Western Terai 92.5 18.3 33.7 7.4 8.5 3.3 16.0 24.7 0.0 37.6 0.6 0.2 0.0 0.0 57.2 75.4 56.4 0.3
Mid-Western Mountain
100 3.5 0.0 0.0 0.0 0.0 0.0 0.0 0.0 0.0 0.0 2.4 0.0 0.0 0.0 0.0 14.7 0.0
Mid-western Hill 84.0 41.9 6.1 33.3 0.0 43.8 24.0 37.2 7.7 11.6 14.9 55.6 0.0 0.0 0.6 0.0 43.2 0.3
Mid-western Terai 84.6 19.6 11.5 44.5 16.1 40.1 14.9 30.4 3.2 7.4 6.5 2.7 0.0 0.0 4.3 3.2 34.9 0.0
Far-western Mountain
99.6 81.3 16.3 16.6 0.0 77.2 26.3 90.9 1.9 23.6 1.8 39.0 4.1 0.0 0.0 0.9 18.3 0.0
Far-western Hill 94.9 62.2 3.7 1.4 0.0 6.4 28.8 73.9 0.7 1.7 22.7 76.4 0.0 0.0 0.0 0.4 48.6 0.4
Far-western Terai 77.5 27.7 10.0 50.9 35.7 35.1 23.5 53.1 1.7 24.8 6.8 1.3 0.0 0.0 8.3 43.2 43.2 2.2
Kathmandu Valley 93.4 0.7 3.1 8.9 0.0 14.7 20.2 23.9 6.5 66.8 0.0 0.0 0.0 0.0 0.0 0.0 17.0 5.7
Nepal 86.1 19.0 15.2 28.1 10.2 26.7 23.2 32.5 5.8 18.8 6.3 14.9 0.2 0.0 4.2 25.3 43.4 1.2
Table 5-4 shows the perception of households on the main reason behind climate change. Overall figure shows 59.1 per cent households attribute deforestation as the main cause of climate change followed by natural disaster (40.8%), industrialisation (24.4%), urbanisation (29.7%) and human intervention (33.3%) among other reasons. Perceiving deforestation as major cause of climate change is seen higher in urban households (62.8%) in comparison to rural (57.6%). Similarly, households of Kathmandu Valley observed industrialisation (53.7%) and urbanisation (89.9%) as the major contributor of climate change.
Exploitation of resources (43.8%) is observed to be the major reason for climate change in high vulnerable area where as deforestation (71.3%) in low vulnerability area. Similarly, 8.6 per cent in high vulnerable areas responded that earthquake was the major reason for climate change. Overall, higher percentage of households based on the NAPA combined vulnerability areas observed deforestation and natural causes as major reasons behind climate Change.
7 The result is based on the multiple response

National Climate Change Impact Survey 2016 | 37
Table 5-5 depicts the percentage distribution of households’ response by top climate induced disasters. Drought is observed as the top climate induced disaster (86.1%) by majority of households followed by hailstorm (32.5%) and flood (28.1%) among others. As a whole, 100 per cent households in mid-western mountain followed by far-western mountain (99.6%), central Terai (97.3%), central hill (95.5%), far-western hill (94.9%) and eastern Terai (94.8%) observed drought as the main climate induced disaster.
Similarly, forest fire is observed as main climate induced disasters mainly in far-western mountain (81.3%) followed by far-western hill (62.2%). Households in Terai ecological belt (49.8%) observe flood as main climate induced disaster with high percentage in central Terai (72.9%) as well as far-
western Terai (50.9%) and mid-western Terai (44.9%). Windstorm is another major climate induced disaster observed in Terai belt (38.1%) with high percentage of households in eastern Terai (51.2%) as well as central Terai (37.8%). In far-western mountain, majority of households (77.2%) observed windstorm as the main climate induced disaster. Similarly, hailstorm is observed as main climate induced disaster in far-western mountain (90.9%), far-western hill (73.9%) and eastern mountain (57.8%).
Further, 66.8 per cent households reported sporadic rain as major climate induced incidence in Kathmandu Valley. Landslide is observed in hilly region by majority of households in far-western hill (76.4%) and mid-western hill (55.6%) as the major disaster. Occurrence of Disease is observed high in Terai (51.3%) ecological belt.
5.3. Change in Monsoon and Winter PrecipitationTable 5-6: Change in Monsoon in the Last 25 Years
Analytical DomainChange in Monsoon Precipitation (%)
TotalIncreased Decreased No change
Urban/RuralUrban 3.56 91.81 4.63 100.00Rural 3.43 90.97 5.60 100.00Ecological BeltMountain 15.29 75.06 9.65 100.00Hill 3.77 87.11 9.12 100.00Terai 1.14 98.07 0.79 100.00Eco-Development RegionEastern Mountain 29.48 39.12 31.41 100.00Eastern Hill 6.04 86.59 7.38 100.00Eastern Terai 1.09 97.81 1.11 100.00Central Mountain 22.37 72.50 5.13 100.00Central Hill 2.26 96.15 1.60 100.00Central Terai 0.56 99.24 0.20 100.00Western Mountain 2.20 77.80 20.00 100.00Western Hill 3.93 72.47 23.60 100.00Western Terai 0.41 98.34 1.24 100.00Mid-western Mountain 0.0 100.00 0.0 100.00Mid-western Hill 4.31 91.87 3.82 100.00Mid-western Terai 4.08 94.77 1.15 100.00Far-western Mountain 0.46 99.54 0.0 100.00Far-western Hill 2.21 96.97 0.81 100.00Far-western Terai 1.69 97.11 1.20 100.00Kathmandu Valley 3.69 92.23 4.08 100.00

38 | National Climate Change Impact Survey 2016
Table 5-7: Change in Winter Precipitation in Last 25 Years
Analytical DomainChange in Winter Precipitation (%)
TotalIncreased Decreased No change
Urban/RuralUrban 1.17 90.78 8.05 100.00Rural 0.47 89.05 10.48 100.00Ecological BeltMountain 0.31 79.23 20.46 100.00Hill 0.87 91.57 7.56 100.00Terai 0.54 89.34 10.13 100.00Eco-Development RegionEastern Mountain 1.20 32.53 66.26 100.00Eastern Hill 0.97 84.22 14.81 100.00Eastern Terai 0.50 87.06 12.44 100.00Central Mountain 0.0 89.21 10.79 100.00Central Hill 0.84 95.94 3.22 100.00Central Terai 0.40 85.39 14.21 100.00Western Mountain 2.20 79.40 18.39 100.00Western Hill 0.42 87.84 11.74 100.00Western Terai 0.47 97.10 2.43 100.00Mid-western Mountain 0.0 98.29 1.71 100.00
Analytical DomainChange in Monsoon Precipitation (%)
TotalIncreased Decreased No change
NAPA Combined Vulnerability IndexVery High 4.38 93.85 1.78 100.00High 4.99 91.48 3.53 100.00Moderate 2.64 84.58 12.78 100.00Low 2.88 94.54 2.57 100.00Very Low 0.74 94.04 5.22 100.00Very Low 8.03 90.04 1.92 100.00Bio-Climatic ZoneTropical 1.61 95.40 3.00 100.00Sub-tropical 6.74 85.07 8.18 100.00Temperate 3.57 82.12 14.32 100.00Sub-alpine 0.0 80.00 20.00 100.00Nepal 3.47 91.22 5.31 100.00
Table 5-6 represents respondent’s perception of change in rainfall during monsoon as compared to past 25 years. Overall households (91.22%) reported decrease in monsoon rainfall in the recent years in comparison to past 25 years. In mid-western mountain, 100 per cent households observed decrease in monsoon rainfall. On the other hand, in eastern mountain, 31.41 per cent households observed no change in monsoon rainfall.
Majority of households disaggregated according to NAPA combined vulnerability index reported decrease in monsoon in past 25 years. Among the climatic zones, highest percentage of households at tropical zone (95.40%) reported decrease in monsoon followed by sub-tropical (85.07%), temperate (82.12%) and sub-alpine (80%) regions.

National Climate Change Impact Survey 2016 | 39
Analytical DomainChange in Winter Precipitation (%)
TotalIncreased Decreased No change
Mid-western Hill 1.40 94.62 3.99 100.00Mid-western Terai 0.83 97.50 1.67 100.00Far-western Mountain 0.0 100.00 0.0 100.00Far-western Hill 0.0 98.22 1.78 100.00Far-western Terai 1.23 97.75 1.03 100.00Kathmandu Valley 2.29 95.93 1.78 100.00NAPA Combined Vulnerability IndexVery High 0.91 88.95 10.14 100.00High 0.39 84.91 14.70 100.00Moderate 0.53 86.86 12.61 100.00Low 1.04 96.07 2.89 100.00Very Low 0.40 95.59 4.01 100.00Bio-Climatic ZoneTropical 0.76 89.68 9.56 100.00Sub-tropical 0.61 89.46 9.92 100.00Temperate 0.04 88.79 11.17 100.00Sub-alpine 0.0 75.00 25.00 100.00Nepal 0.67 89.56 9.77 100.00
5.4. Changes in Summer and Winter TemperatureTable 5-8: Change in Summer Temperature in the Last 25 Years
Analytical DomainChange in Summer Temperature (%)
TotalIncreased Decreased No change
Urban/RuralUrban 92.26 1.91 5.83 100.00Rural 88.00 2.92 9.08 100.00Ecological BeltMountain 86.47 0.91 12.61 100.00Hill 86.35 1.57 12.08 100.00Terai 92.60 3.97 3.43 100.00Eco-Development RegionEastern Mountain 75.64 1.20 23.15 100.00Eastern Hill 88.32 2.78 8.91 100.00Eastern Terai 92.68 3.50 3.82 100.00
Table 5-7 depicts households’ perception of change in winter rainfall as compared to past 25 years. Of the total households, 89.56 per cent reported decrease in winter rainfall in the recent years as compared to past 25 years. This figure is observed highest in far-western mountain whereby 100 per cent households observed decrease in winter rainfall.
On the other hand, highest percentage of households of eastern mountain (66.26%) observed no change in winter rainfall. Similarly, 95.93 per cent
households of Kathmandu Valley observed decrease in winter rainfall whilst 2.29 per cent reported increase and 1.78 per cent observed no change. Further, households of combined vulnerability area observed decrease in winter rainfall. Among the climatic zones, highest percentage of households (89.68%) from tropical zone observed decrease in winter precipitation followed by sub-tropical (89.46%), temperate (88.79%), and sub-alpine (75%) regions.

40 | National Climate Change Impact Survey 2016
Analytical DomainChange in Summer Temperature (%)
TotalIncreased Decreased No change
Central Mountain 79.69 1.40 18.91 100.00Central Hill 89.46 1.94 8.59 100.00Central Terai 92.62 6.05 1.33 100.00Western Mountain 90.60 0.0 9.40 100.00Western Hill 78.79 0.91 20.30 100.00Western Terai 94.36 1.62 4.02 100.00Mid-western Mountain 98.77 0.61 0.61 100.00Mid-western Hill 83.92 0.58 15.50 100.00Mid-western Terai 88.22 2.72 9.06 100.00Far-western Mountain 100.00 0.0 0.0 100.00Far-western Hill 93.11 2.79 4.10 100.00Far-western Terai 95.55 0.49 3.96 100.00Kathmandu Valley 97.47 0.40 2.13 100.00NAPA Combined Vulnerability IndexVery High 93.43 1.94 4.64 100.00High 89.35 2.46 8.19 100.00Moderate 87.86 3.76 8.37 100.00Low 88.21 2.51 9.28 100.00Very Low 84.50 2.02 13.47 100.00Bio-Climatic ZoneTropical 90.46 3.38 6.16 100.00Sub-tropical 86.88 1.35 11.76 100.00Temperate 90.92 2.16 6.93 100.00Sub-alpine 95.00 0.0 5.00 100.00Nepal 89.25 2.62 8.13 100.00
Table 5-8 represents the change in temperature during summer season as compared to past 25 years. Majority of the households (89.25%) observed increase in feeling of temperature during summer season whereas some households (8.13%) observed no change and few (2.62%) reported a decrease. Highest percentage of households stating an increase in temperature is observed in Terai (92.6%) among the ecological
Table 5-9: Change in Winter Temperature in Last 25 Years
Analytical DomainChange in Winter Temperature (%)
TotalIncreased Decreased No changeUrban/RuralUrban 27 58 15 100Rural 25 54 21 100Ecological BeltMountain 17 55 29 100Hill 28 48 24 100Terai 25 62 13 100
belts and in far-western mountain (100%) among the eco-development regions. Similarly, majority of households from combined vulnerability areas observed an increase of temperature. Among four climatic zones, highest percentage of households observing an increase in temperature is in sub-alpine (95%) followed by temperate (90.92%), tropical (90.46%), and sub-tropical (86.88%) region.
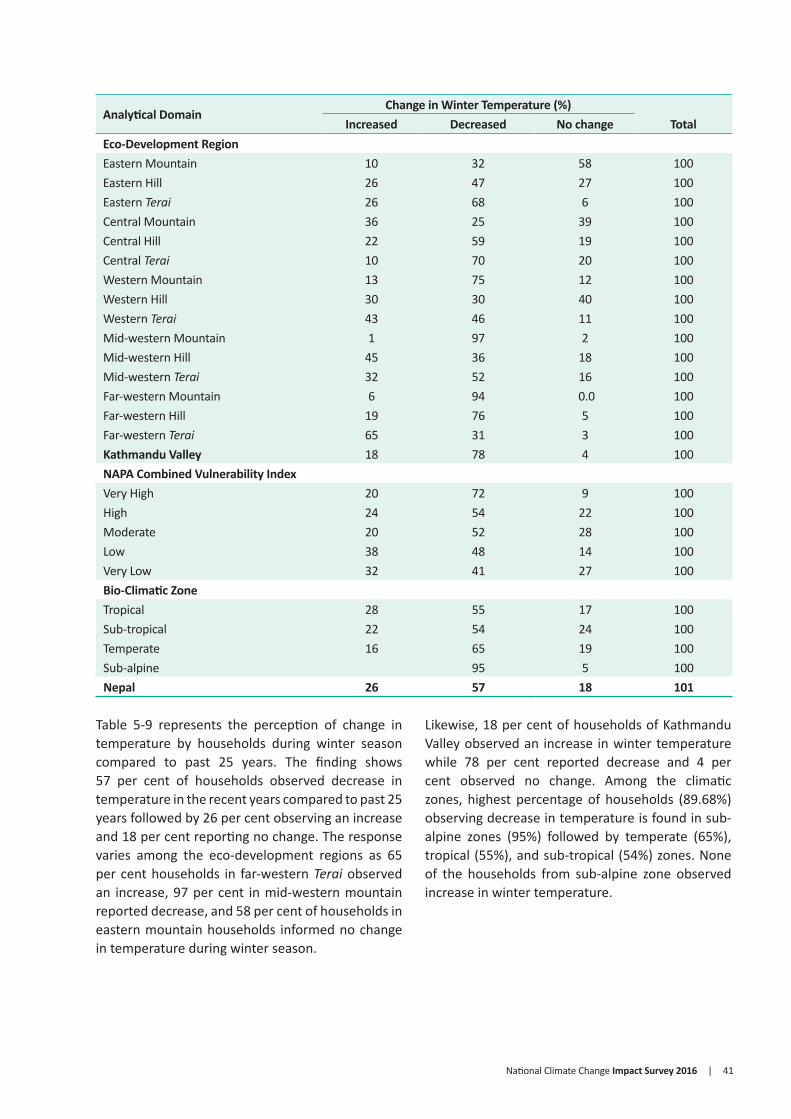
National Climate Change Impact Survey 2016 | 41
Analytical DomainChange in Winter Temperature (%)
TotalIncreased Decreased No changeEco-Development RegionEastern Mountain 10 32 58 100Eastern Hill 26 47 27 100Eastern Terai 26 68 6 100Central Mountain 36 25 39 100Central Hill 22 59 19 100Central Terai 10 70 20 100Western Mountain 13 75 12 100Western Hill 30 30 40 100Western Terai 43 46 11 100Mid-western Mountain 1 97 2 100Mid-western Hill 45 36 18 100Mid-western Terai 32 52 16 100Far-western Mountain 6 94 0.0 100Far-western Hill 19 76 5 100Far-western Terai 65 31 3 100Kathmandu Valley 18 78 4 100NAPA Combined Vulnerability IndexVery High 20 72 9 100High 24 54 22 100Moderate 20 52 28 100Low 38 48 14 100Very Low 32 41 27 100Bio-Climatic ZoneTropical 28 55 17 100Sub-tropical 22 54 24 100Temperate 16 65 19 100Sub-alpine 95 5 100Nepal 26 57 18 101
Table 5-9 represents the perception of change in temperature by households during winter season compared to past 25 years. The finding shows 57 per cent of households observed decrease in temperature in the recent years compared to past 25 years followed by 26 per cent observing an increase and 18 per cent reporting no change. The response varies among the eco-development regions as 65 per cent households in far-western Terai observed an increase, 97 per cent in mid-western mountain reported decrease, and 58 per cent of households in eastern mountain households informed no change in temperature during winter season.
Likewise, 18 per cent of households of Kathmandu Valley observed an increase in winter temperature while 78 per cent reported decrease and 4 per cent observed no change. Among the climatic zones, highest percentage of households (89.68%) observing decrease in temperature is found in sub-alpine zones (95%) followed by temperate (65%), tropical (55%), and sub-tropical (54%) zones. None of the households from sub-alpine zone observed increase in winter temperature.
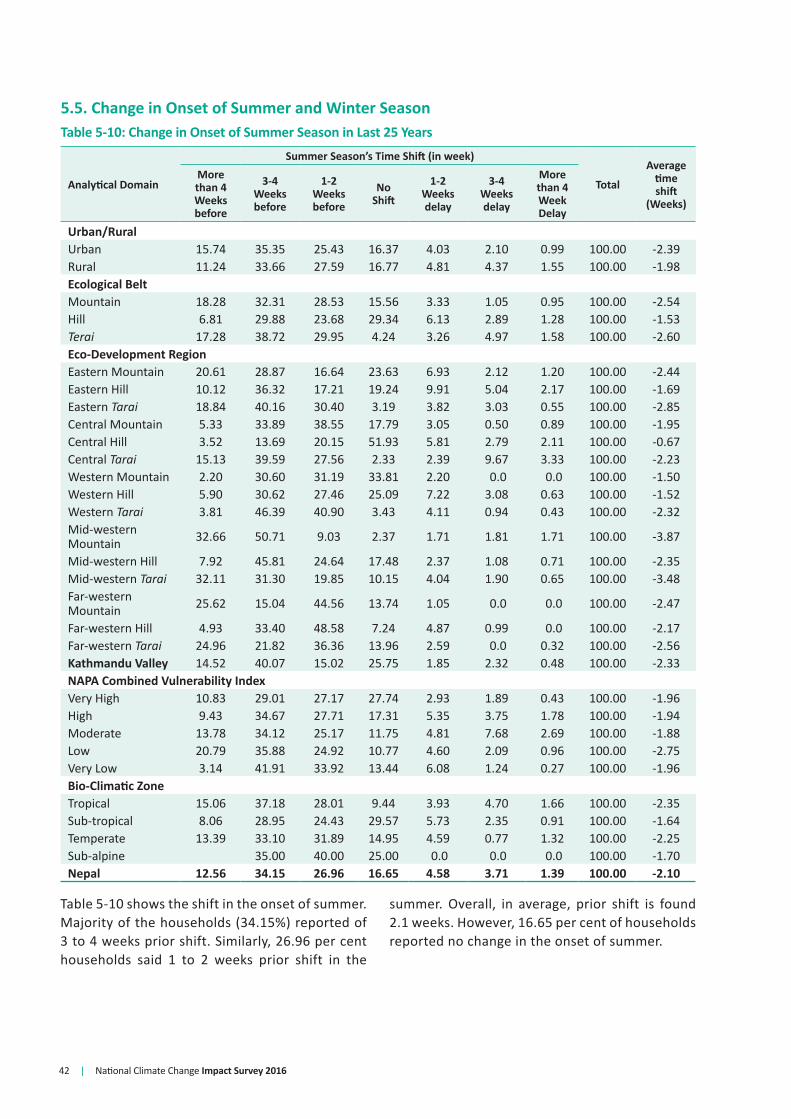
42 | National Climate Change Impact Survey 2016
5.5. Change in Onset of Summer and Winter SeasonTable 5-10: Change in Onset of Summer Season in Last 25 Years
Analytical Domain
Summer Season’s Time Shift (in week)
Total
Average time shift
(Weeks)
More than 4 Weeks before
3-4 Weeks before
1-2 Weeks before
No Shift
1-2 Weeks delay
3-4 Weeks delay
More than 4 Week Delay
Urban/RuralUrban 15.74 35.35 25.43 16.37 4.03 2.10 0.99 100.00 -2.39Rural 11.24 33.66 27.59 16.77 4.81 4.37 1.55 100.00 -1.98Ecological BeltMountain 18.28 32.31 28.53 15.56 3.33 1.05 0.95 100.00 -2.54Hill 6.81 29.88 23.68 29.34 6.13 2.89 1.28 100.00 -1.53Terai 17.28 38.72 29.95 4.24 3.26 4.97 1.58 100.00 -2.60Eco-Development RegionEastern Mountain 20.61 28.87 16.64 23.63 6.93 2.12 1.20 100.00 -2.44Eastern Hill 10.12 36.32 17.21 19.24 9.91 5.04 2.17 100.00 -1.69Eastern Tarai 18.84 40.16 30.40 3.19 3.82 3.03 0.55 100.00 -2.85Central Mountain 5.33 33.89 38.55 17.79 3.05 0.50 0.89 100.00 -1.95Central Hill 3.52 13.69 20.15 51.93 5.81 2.79 2.11 100.00 -0.67Central Tarai 15.13 39.59 27.56 2.33 2.39 9.67 3.33 100.00 -2.23Western Mountain 2.20 30.60 31.19 33.81 2.20 0.0 0.0 100.00 -1.50Western Hill 5.90 30.62 27.46 25.09 7.22 3.08 0.63 100.00 -1.52Western Tarai 3.81 46.39 40.90 3.43 4.11 0.94 0.43 100.00 -2.32Mid-western Mountain 32.66 50.71 9.03 2.37 1.71 1.81 1.71 100.00 -3.87
Mid-western Hill 7.92 45.81 24.64 17.48 2.37 1.08 0.71 100.00 -2.35Mid-western Tarai 32.11 31.30 19.85 10.15 4.04 1.90 0.65 100.00 -3.48Far-western Mountain 25.62 15.04 44.56 13.74 1.05 0.0 0.0 100.00 -2.47
Far-western Hill 4.93 33.40 48.58 7.24 4.87 0.99 0.0 100.00 -2.17Far-western Tarai 24.96 21.82 36.36 13.96 2.59 0.0 0.32 100.00 -2.56Kathmandu Valley 14.52 40.07 15.02 25.75 1.85 2.32 0.48 100.00 -2.33NAPA Combined Vulnerability IndexVery High 10.83 29.01 27.17 27.74 2.93 1.89 0.43 100.00 -1.96High 9.43 34.67 27.71 17.31 5.35 3.75 1.78 100.00 -1.94Moderate 13.78 34.12 25.17 11.75 4.81 7.68 2.69 100.00 -1.88Low 20.79 35.88 24.92 10.77 4.60 2.09 0.96 100.00 -2.75Very Low 3.14 41.91 33.92 13.44 6.08 1.24 0.27 100.00 -1.96Bio-Climatic ZoneTropical 15.06 37.18 28.01 9.44 3.93 4.70 1.66 100.00 -2.35Sub-tropical 8.06 28.95 24.43 29.57 5.73 2.35 0.91 100.00 -1.64Temperate 13.39 33.10 31.89 14.95 4.59 0.77 1.32 100.00 -2.25Sub-alpine 35.00 40.00 25.00 0.0 0.0 0.0 100.00 -1.70Nepal 12.56 34.15 26.96 16.65 4.58 3.71 1.39 100.00 -2.10
Table 5-10 shows the shift in the onset of summer. Majority of the households (34.15%) reported of 3 to 4 weeks prior shift. Similarly, 26.96 per cent households said 1 to 2 weeks prior shift in the
summer. Overall, in average, prior shift is found 2.1 weeks. However, 16.65 per cent of households reported no change in the onset of summer.
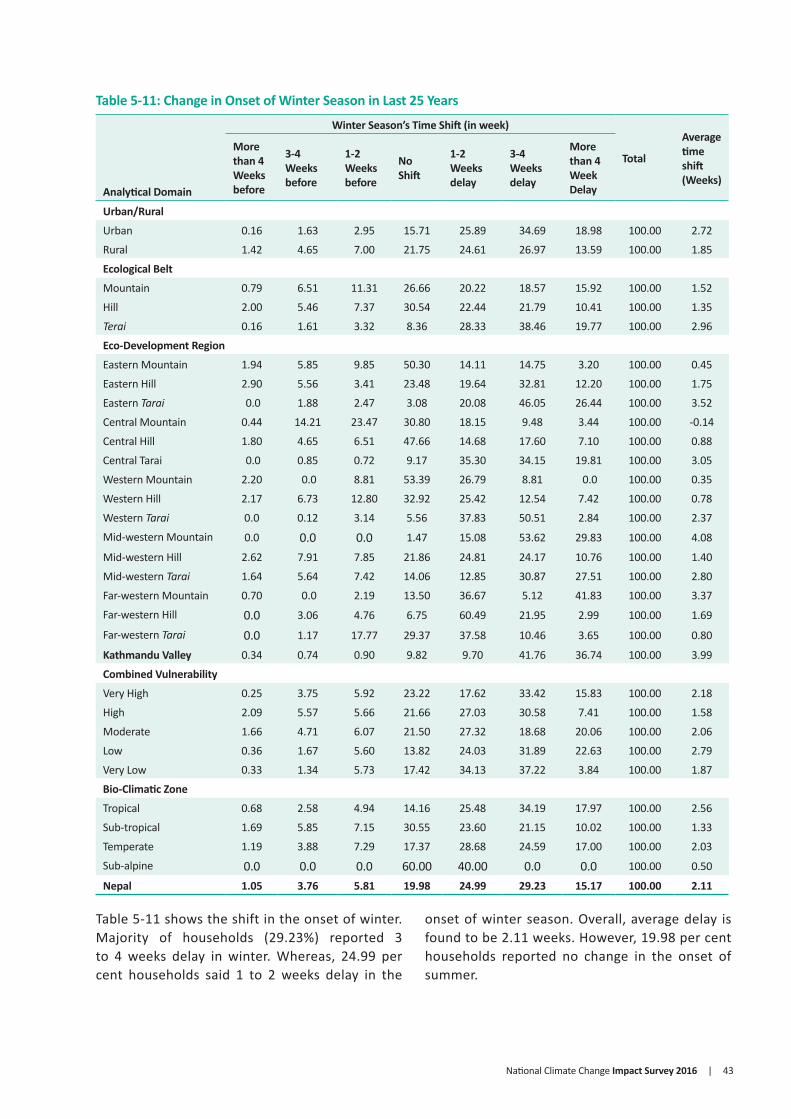
National Climate Change Impact Survey 2016 | 43
Table 5-11: Change in Onset of Winter Season in Last 25 Years
Analytical Domain
Winter Season’s Time Shift (in week)
Total
Average time shift (Weeks)
More than 4 Weeks before
3-4 Weeks before
1-2 Weeks before
No Shift
1-2 Weeks delay
3-4 Weeks delay
More than 4 Week Delay
Urban/Rural
Urban 0.16 1.63 2.95 15.71 25.89 34.69 18.98 100.00 2.72
Rural 1.42 4.65 7.00 21.75 24.61 26.97 13.59 100.00 1.85
Ecological Belt
Mountain 0.79 6.51 11.31 26.66 20.22 18.57 15.92 100.00 1.52
Hill 2.00 5.46 7.37 30.54 22.44 21.79 10.41 100.00 1.35
Terai 0.16 1.61 3.32 8.36 28.33 38.46 19.77 100.00 2.96
Eco-Development Region
Eastern Mountain 1.94 5.85 9.85 50.30 14.11 14.75 3.20 100.00 0.45
Eastern Hill 2.90 5.56 3.41 23.48 19.64 32.81 12.20 100.00 1.75
Eastern Tarai 0.0 1.88 2.47 3.08 20.08 46.05 26.44 100.00 3.52
Central Mountain 0.44 14.21 23.47 30.80 18.15 9.48 3.44 100.00 -0.14
Central Hill 1.80 4.65 6.51 47.66 14.68 17.60 7.10 100.00 0.88
Central Tarai 0.0 0.85 0.72 9.17 35.30 34.15 19.81 100.00 3.05
Western Mountain 2.20 0.0 8.81 53.39 26.79 8.81 0.0 100.00 0.35
Western Hill 2.17 6.73 12.80 32.92 25.42 12.54 7.42 100.00 0.78
Western Tarai 0.0 0.12 3.14 5.56 37.83 50.51 2.84 100.00 2.37
Mid-western Mountain 0.0 0.0 0.0 1.47 15.08 53.62 29.83 100.00 4.08
Mid-western Hill 2.62 7.91 7.85 21.86 24.81 24.17 10.76 100.00 1.40
Mid-western Tarai 1.64 5.64 7.42 14.06 12.85 30.87 27.51 100.00 2.80
Far-western Mountain 0.70 0.0 2.19 13.50 36.67 5.12 41.83 100.00 3.37
Far-western Hill 0.0 3.06 4.76 6.75 60.49 21.95 2.99 100.00 1.69
Far-western Tarai 0.0 1.17 17.77 29.37 37.58 10.46 3.65 100.00 0.80
Kathmandu Valley 0.34 0.74 0.90 9.82 9.70 41.76 36.74 100.00 3.99
Combined Vulnerability
Very High 0.25 3.75 5.92 23.22 17.62 33.42 15.83 100.00 2.18
High 2.09 5.57 5.66 21.66 27.03 30.58 7.41 100.00 1.58
Moderate 1.66 4.71 6.07 21.50 27.32 18.68 20.06 100.00 2.06
Low 0.36 1.67 5.60 13.82 24.03 31.89 22.63 100.00 2.79
Very Low 0.33 1.34 5.73 17.42 34.13 37.22 3.84 100.00 1.87
Bio-Climatic Zone
Tropical 0.68 2.58 4.94 14.16 25.48 34.19 17.97 100.00 2.56
Sub-tropical 1.69 5.85 7.15 30.55 23.60 21.15 10.02 100.00 1.33
Temperate 1.19 3.88 7.29 17.37 28.68 24.59 17.00 100.00 2.03
Sub-alpine 0.0 0.0 0.0 60.00 40.00 0.0 0.0 100.00 0.50
Nepal 1.05 3.76 5.81 19.98 24.99 29.23 15.17 100.00 2.11
Table 5-11 shows the shift in the onset of winter. Majority of households (29.23%) reported 3 to 4 weeks delay in winter. Whereas, 24.99 per cent households said 1 to 2 weeks delay in the
onset of winter season. Overall, average delay is found to be 2.11 weeks. However, 19.98 per cent households reported no change in the onset of summer.
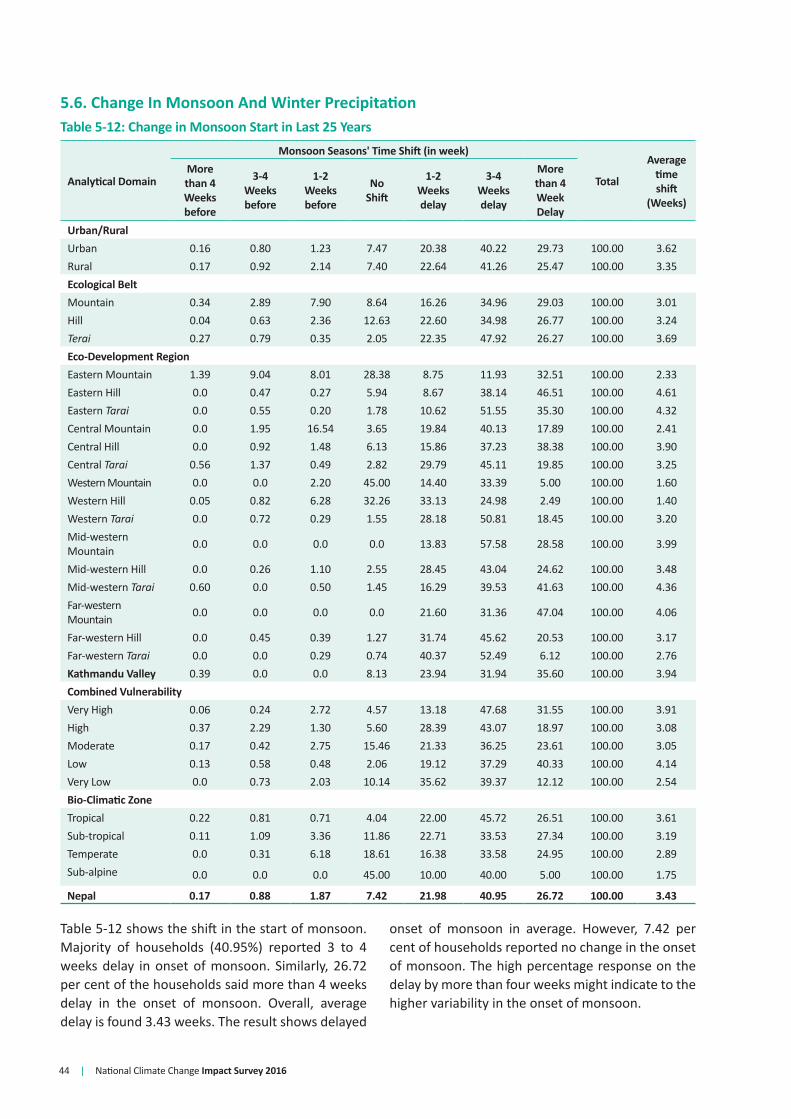
44 | National Climate Change Impact Survey 2016
5.6. Change In Monsoon And Winter PrecipitationTable 5-12: Change in Monsoon Start in Last 25 Years
Analytical Domain
Monsoon Seasons' Time Shift (in week)
Total
Average time shift
(Weeks)
More than 4 Weeks before
3-4 Weeks before
1-2 Weeks before
No Shift
1-2 Weeks delay
3-4 Weeks delay
More than 4 Week Delay
Urban/RuralUrban 0.16 0.80 1.23 7.47 20.38 40.22 29.73 100.00 3.62Rural 0.17 0.92 2.14 7.40 22.64 41.26 25.47 100.00 3.35Ecological BeltMountain 0.34 2.89 7.90 8.64 16.26 34.96 29.03 100.00 3.01Hill 0.04 0.63 2.36 12.63 22.60 34.98 26.77 100.00 3.24Terai 0.27 0.79 0.35 2.05 22.35 47.92 26.27 100.00 3.69Eco-Development RegionEastern Mountain 1.39 9.04 8.01 28.38 8.75 11.93 32.51 100.00 2.33Eastern Hill 0.0 0.47 0.27 5.94 8.67 38.14 46.51 100.00 4.61Eastern Tarai 0.0 0.55 0.20 1.78 10.62 51.55 35.30 100.00 4.32Central Mountain 0.0 1.95 16.54 3.65 19.84 40.13 17.89 100.00 2.41Central Hill 0.0 0.92 1.48 6.13 15.86 37.23 38.38 100.00 3.90Central Tarai 0.56 1.37 0.49 2.82 29.79 45.11 19.85 100.00 3.25Western Mountain 0.0 0.0 2.20 45.00 14.40 33.39 5.00 100.00 1.60Western Hill 0.05 0.82 6.28 32.26 33.13 24.98 2.49 100.00 1.40Western Tarai 0.0 0.72 0.29 1.55 28.18 50.81 18.45 100.00 3.20Mid-western Mountain 0.0 0.0 0.0 0.0 13.83 57.58 28.58 100.00 3.99
Mid-western Hill 0.0 0.26 1.10 2.55 28.45 43.04 24.62 100.00 3.48Mid-western Tarai 0.60 0.0 0.50 1.45 16.29 39.53 41.63 100.00 4.36Far-western Mountain 0.0 0.0 0.0 0.0 21.60 31.36 47.04 100.00 4.06
Far-western Hill 0.0 0.45 0.39 1.27 31.74 45.62 20.53 100.00 3.17Far-western Tarai 0.0 0.0 0.29 0.74 40.37 52.49 6.12 100.00 2.76Kathmandu Valley 0.39 0.0 0.0 8.13 23.94 31.94 35.60 100.00 3.94Combined VulnerabilityVery High 0.06 0.24 2.72 4.57 13.18 47.68 31.55 100.00 3.91High 0.37 2.29 1.30 5.60 28.39 43.07 18.97 100.00 3.08Moderate 0.17 0.42 2.75 15.46 21.33 36.25 23.61 100.00 3.05Low 0.13 0.58 0.48 2.06 19.12 37.29 40.33 100.00 4.14Very Low 0.0 0.73 2.03 10.14 35.62 39.37 12.12 100.00 2.54Bio-Climatic ZoneTropical 0.22 0.81 0.71 4.04 22.00 45.72 26.51 100.00 3.61Sub-tropical 0.11 1.09 3.36 11.86 22.71 33.53 27.34 100.00 3.19Temperate 0.0 0.31 6.18 18.61 16.38 33.58 24.95 100.00 2.89Sub-alpine 0.0 0.0 0.0 45.00 10.00 40.00 5.00 100.00 1.75
Nepal 0.17 0.88 1.87 7.42 21.98 40.95 26.72 100.00 3.43
Table 5-12 shows the shift in the start of monsoon. Majority of households (40.95%) reported 3 to 4 weeks delay in onset of monsoon. Similarly, 26.72 per cent of the households said more than 4 weeks delay in the onset of monsoon. Overall, average delay is found 3.43 weeks. The result shows delayed
onset of monsoon in average. However, 7.42 per cent of households reported no change in the onset of monsoon. The high percentage response on the delay by more than four weeks might indicate to the higher variability in the onset of monsoon.
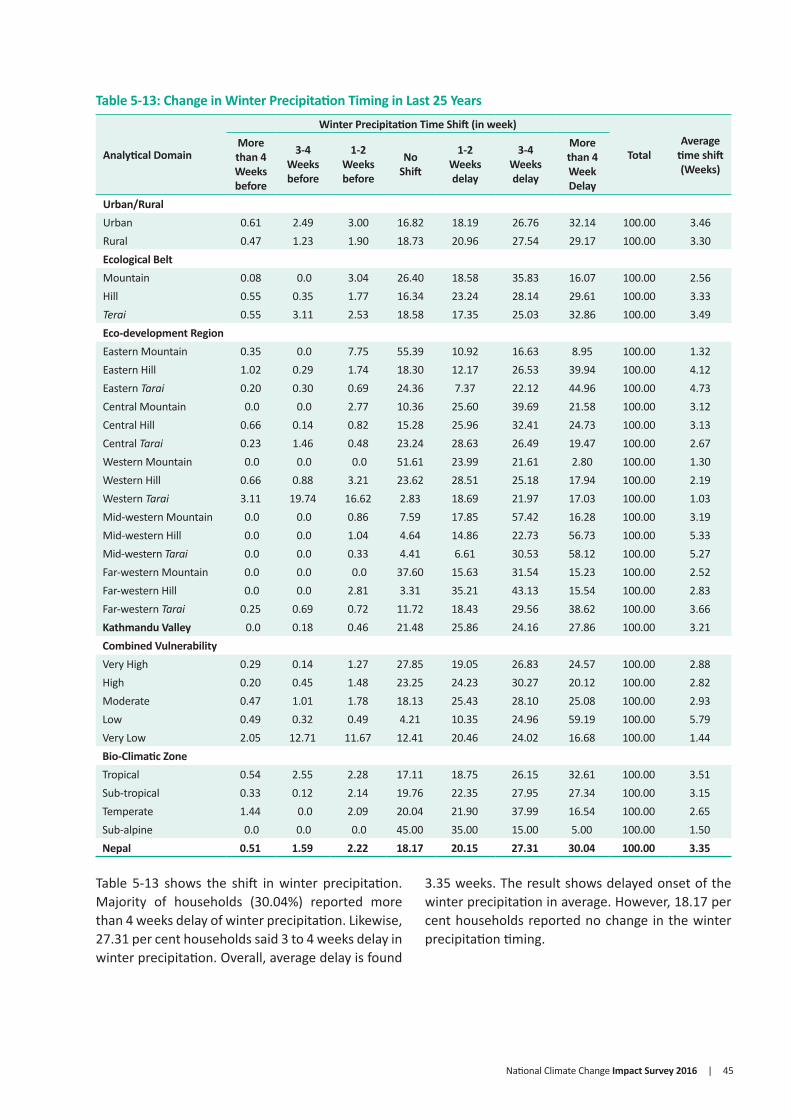
National Climate Change Impact Survey 2016 | 45
Table 5-13: Change in Winter Precipitation Timing in Last 25 Years
Analytical Domain
Winter Precipitation Time Shift (in week)
TotalAverage
time shift (Weeks)
More than 4 Weeks before
3-4 Weeks before
1-2 Weeks before
No Shift
1-2 Weeks delay
3-4 Weeks delay
More than 4 Week Delay
Urban/RuralUrban 0.61 2.49 3.00 16.82 18.19 26.76 32.14 100.00 3.46Rural 0.47 1.23 1.90 18.73 20.96 27.54 29.17 100.00 3.30Ecological BeltMountain 0.08 0.0 3.04 26.40 18.58 35.83 16.07 100.00 2.56Hill 0.55 0.35 1.77 16.34 23.24 28.14 29.61 100.00 3.33Terai 0.55 3.11 2.53 18.58 17.35 25.03 32.86 100.00 3.49Eco-development RegionEastern Mountain 0.35 0.0 7.75 55.39 10.92 16.63 8.95 100.00 1.32Eastern Hill 1.02 0.29 1.74 18.30 12.17 26.53 39.94 100.00 4.12Eastern Tarai 0.20 0.30 0.69 24.36 7.37 22.12 44.96 100.00 4.73Central Mountain 0.0 0.0 2.77 10.36 25.60 39.69 21.58 100.00 3.12Central Hill 0.66 0.14 0.82 15.28 25.96 32.41 24.73 100.00 3.13Central Tarai 0.23 1.46 0.48 23.24 28.63 26.49 19.47 100.00 2.67Western Mountain 0.0 0.0 0.0 51.61 23.99 21.61 2.80 100.00 1.30Western Hill 0.66 0.88 3.21 23.62 28.51 25.18 17.94 100.00 2.19Western Tarai 3.11 19.74 16.62 2.83 18.69 21.97 17.03 100.00 1.03Mid-western Mountain 0.0 0.0 0.86 7.59 17.85 57.42 16.28 100.00 3.19Mid-western Hill 0.0 0.0 1.04 4.64 14.86 22.73 56.73 100.00 5.33Mid-western Tarai 0.0 0.0 0.33 4.41 6.61 30.53 58.12 100.00 5.27Far-western Mountain 0.0 0.0 0.0 37.60 15.63 31.54 15.23 100.00 2.52Far-western Hill 0.0 0.0 2.81 3.31 35.21 43.13 15.54 100.00 2.83Far-western Tarai 0.25 0.69 0.72 11.72 18.43 29.56 38.62 100.00 3.66Kathmandu Valley 0.0 0.18 0.46 21.48 25.86 24.16 27.86 100.00 3.21Combined VulnerabilityVery High 0.29 0.14 1.27 27.85 19.05 26.83 24.57 100.00 2.88High 0.20 0.45 1.48 23.25 24.23 30.27 20.12 100.00 2.82Moderate 0.47 1.01 1.78 18.13 25.43 28.10 25.08 100.00 2.93Low 0.49 0.32 0.49 4.21 10.35 24.96 59.19 100.00 5.79Very Low 2.05 12.71 11.67 12.41 20.46 24.02 16.68 100.00 1.44Bio-Climatic ZoneTropical 0.54 2.55 2.28 17.11 18.75 26.15 32.61 100.00 3.51Sub-tropical 0.33 0.12 2.14 19.76 22.35 27.95 27.34 100.00 3.15Temperate 1.44 0.0 2.09 20.04 21.90 37.99 16.54 100.00 2.65Sub-alpine 0.0 0.0 0.0 45.00 35.00 15.00 5.00 100.00 1.50Nepal 0.51 1.59 2.22 18.17 20.15 27.31 30.04 100.00 3.35
Table 5-13 shows the shift in winter precipitation. Majority of households (30.04%) reported more than 4 weeks delay of winter precipitation. Likewise, 27.31 per cent households said 3 to 4 weeks delay in winter precipitation. Overall, average delay is found
3.35 weeks. The result shows delayed onset of the winter precipitation in average. However, 18.17 per cent households reported no change in the winter precipitation timing.

46 | National Climate Change Impact Survey 2016
6.1. Summary of FindingsSurvey results reveal that households are observing different climate induced disasters including flooding, landslides, drought, hailstorm, and Disease/insects in last 25 years. About 99 per cent respondents have observed the ascending incidences of drought in the last 25 years, followed by Disease/insects (97.69%), landslide (78.12%), and inundation (51.47%) (Figure 6-1).
The survey shows that households are observing impacts of different types of disasters in last 25 years. The results depicts that 38.3 per cent households have bear impacted by dry wind wave followed by landslides (35.2%), fire (in settlements) (31.8%), and flood (31.7%). However, less than 10 per cent household reported impact from heat wave, snow storm, sporadic rain, and forests fire (Figure 6-2).
Households are observing impacts of climate induced disasters on different aspects of livelihood in last 25 years. The survey result shows that households are missing their working days due to such disasters. Similarly, they also are experiencing the issue of food insecurity due to different climate induced disasters. About 32.86 per cent households reported that they are having food scarcity due to the drought while 26 per cent and 21.69 per cent reported so due to hailstorm and Disease/insects respectively. However, about 1 per cent reported that they are having food insecurity due to thunderstorm while about 2 per cent reported so from forest fire. Moreover, no one reported an impact on food insecurity due to heat wave, avalanche, and snow storm (Figure 6-3).
Different analytical domain wise response incidences of disaster, potential reasons, and impacts are presented in the following subsections.
CLIMATE INDUCED DISASTERS AND IMPACT
CHAPTER 6
Figure 6-1: Observed Change in Climate Induced Hazards/ Disasters in Last 25 Years
Figure 6-2: Households Affected by Disasters in Last 25 Years
Figure 6-3: Household Experiencing Food Insecurity Due to Disasters in Last Five Years
0
10
20
30
40
50
60
70
80
90
100
Drou
ght
Fire
(for
est)
Floo
d
Win
dsto
rm
Thun
ders
torm
Hails
torm
Heav
y ra
in
Spor
adic
rain
Soil
eros
ion
Land
slid
e
Snow
stor
m
Aval
anch
e
GLO
F
Heat
wav
e
Cold
wav
e
Dise
ases
/ in
sect
Decreased
Increased
DroughtFire (forest)
Flood
ThunderstromeHailstorm
Heavy rainSporadic rain
Soil erosionLand slide
Snow stormAvalancheHeat waveCold wave
Diseases / insect
Yes
No
DroughtFire (forest)
Flood
WindstormThunderstrom
HailstormHeavy rain
Sporadic rainSoil erosion
Land slideSnow stormAvalancheHeat waveCold wave
Diseases / insect
Yes
No
Notapplicable
Windstorm
Hazards
Haza
rds
Haza
rds
Response
Response (%)
Resp
onse
(%)
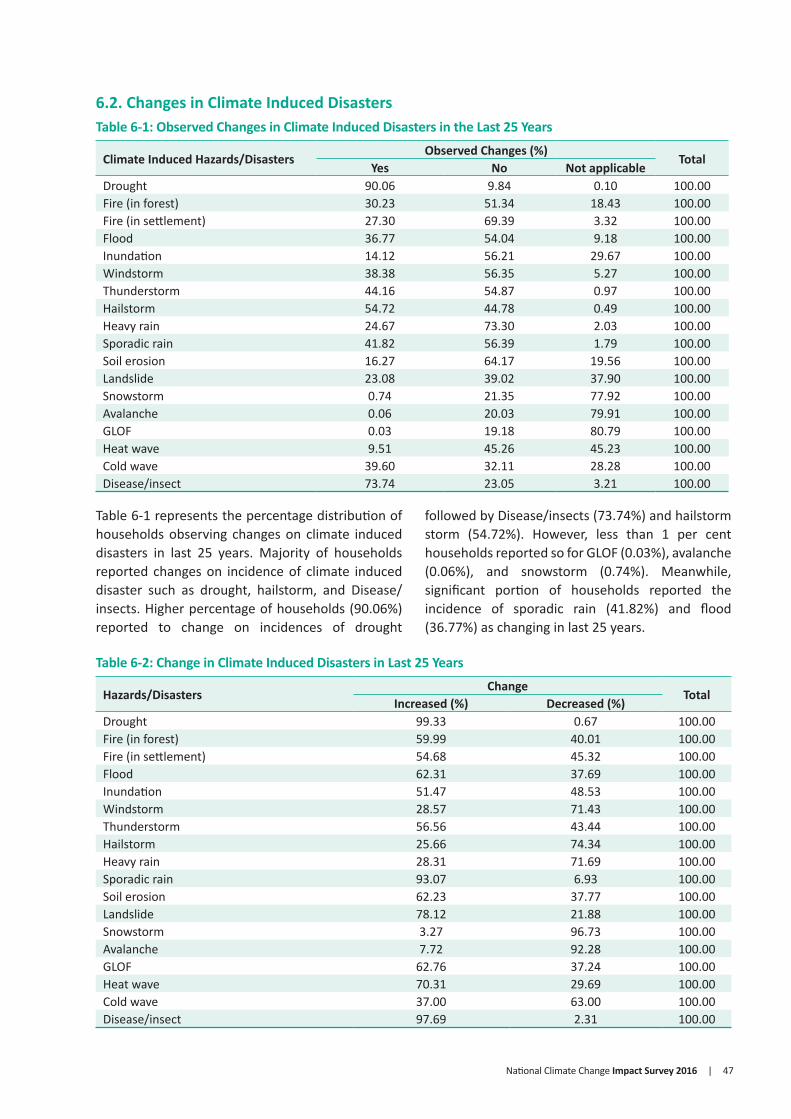
National Climate Change Impact Survey 2016 | 47
6.2. Changes in Climate Induced DisastersTable 6-1: Observed Changes in Climate Induced Disasters in the Last 25 Years
Climate Induced Hazards/DisastersObserved Changes (%)
TotalYes No Not applicable
Drought 90.06 9.84 0.10 100.00Fire (in forest) 30.23 51.34 18.43 100.00Fire (in settlement) 27.30 69.39 3.32 100.00Flood 36.77 54.04 9.18 100.00Inundation 14.12 56.21 29.67 100.00Windstorm 38.38 56.35 5.27 100.00Thunderstorm 44.16 54.87 0.97 100.00Hailstorm 54.72 44.78 0.49 100.00Heavy rain 24.67 73.30 2.03 100.00Sporadic rain 41.82 56.39 1.79 100.00Soil erosion 16.27 64.17 19.56 100.00Landslide 23.08 39.02 37.90 100.00Snowstorm 0.74 21.35 77.92 100.00Avalanche 0.06 20.03 79.91 100.00GLOF 0.03 19.18 80.79 100.00Heat wave 9.51 45.26 45.23 100.00Cold wave 39.60 32.11 28.28 100.00Disease/insect 73.74 23.05 3.21 100.00
Table 6-1 represents the percentage distribution of households observing changes on climate induced disasters in last 25 years. Majority of households reported changes on incidence of climate induced disaster such as drought, hailstorm, and Disease/insects. Higher percentage of households (90.06%) reported to change on incidences of drought
followed by Disease/insects (73.74%) and hailstorm storm (54.72%). However, less than 1 per cent households reported so for GLOF (0.03%), avalanche (0.06%), and snowstorm (0.74%). Meanwhile, significant portion of households reported the incidence of sporadic rain (41.82%) and flood (36.77%) as changing in last 25 years.
Table 6-2: Change in Climate Induced Disasters in Last 25 Years
Hazards/DisastersChange
TotalIncreased (%) Decreased (%)
Drought 99.33 0.67 100.00Fire (in forest) 59.99 40.01 100.00Fire (in settlement) 54.68 45.32 100.00Flood 62.31 37.69 100.00Inundation 51.47 48.53 100.00Windstorm 28.57 71.43 100.00Thunderstorm 56.56 43.44 100.00Hailstorm 25.66 74.34 100.00Heavy rain 28.31 71.69 100.00Sporadic rain 93.07 6.93 100.00Soil erosion 62.23 37.77 100.00Landslide 78.12 21.88 100.00Snowstorm 3.27 96.73 100.00Avalanche 7.72 92.28 100.00GLOF 62.76 37.24 100.00Heat wave 70.31 29.69 100.00Cold wave 37.00 63.00 100.00Disease/insect 97.69 2.31 100.00

48 | National Climate Change Impact Survey 2016
Table 6-2 depicts percentage of household observing an increase or decrease in climate induced disasters in last 25 years. The survey reveals that almost all households are observing an increase on incidence of drought (99.33%) in last 25 years followed by disease/insect (97.69%) and sporadic rain (93.07%). On the other hand, higher percentage of households
is observing the decrease in incidence of snowstorm (96.73%), avalanche (92.28%), heavy rain (71.69%), and windstorm (71.43%). However, households are divided about the change on incidence of inundation n last 25 years as 51.47 per cent households reported to an increase while 48.53 per cent observed to decrease.
Table 6-3: Changes in Climate Induced Disasters by Rural and Urban Area
UrbanChange (%)
Total RuralChange (%)
TotalIncreased Decreased Increased Decreased
Drought 99.31 0.69 100.00 Drought 99.34 0.66 100.00
Fire (forest) 60.09 39.91 100.00 Fire (forest) 59.96 40.04 100.00
Fire (settlement) 53.85 46.15 100.00 Fire (settlement) 55.00 45.00 100.00
Flood 56.45 43.55 100.00 Flood 64.56 35.44 100.00
Inundation 36.88 63.12 100.00 Inundation 59.89 40.11 100.00
Windstorm 18.79 81.21 100.00 Windstorm 32.48 67.52 100.00
Thunderstorm 52.89 47.11 100.00 Thunderstorm 58.27 41.73 100.00
Hailstorm 21.53 78.47 100.00 Hailstorm 27.13 72.87 100.00
Heavy rain 32.45 67.55 100.00 Heavy rain 26.65 73.35 100.00
Sporadic rain 94.54 5.46 100.00 Sporadic rain 92.40 7.60 100.00
Soil erosion 53.73 46.27 100.00 Soil erosion 64.88 35.12 100.00
Landslide 85.46 14.54 100.00 Landslide 76.07 23.93 100.00
Snowstorm 0.0 100.00 100.00 Snowstorm 3.76 96.24 100.00
Heat wave 0.0 33.34 100.00 Avalanche 7.72 92.28 100.00
Cold wave 40.44 59.56 100.00 GLOF 62.76 37.24 100.00
Disease/insect 97.68 2.32 100.00 Heat wave 73.39 26.61 100.00
Cold wave 35.39 64.61 100.00
Disease/ insect 97.69 2.31 100.00
Table 6-3 shows the percentage distribution of households observing changes in climate induced disasters in rural and urban area in last 25 years. Majority of households in both urban and rural areas are observing an increase on the incidences of drought, sporadic rain, landslide, and disease/
insect. Highest percentage of households reported such increase in disease/insect in both urban (97.68%) and rural (97.69%) areas in last 25 years. Similarly, all households (100%) in urban area and 96.24 per cent in rural area reported on decrease of incidences of snowstorm in last 25 years.

National Climate Change Impact Survey 2016 | 49
Table 6-4: Changes in Climate Induced Disasters by Eco-Development Regions
Hazards/DisastersChanges (%)
TotalIncreased Decreased
Eastern MountainDrought 100.0 0.0 100.00
Fire (forest) 68.64 31.36 100.00
Fire (settlement) 100.0 0.0 100.00
Flood 100.0 0.0 100.00
Windstorm 100.0 0.0 100.00
Thunderstorm 91.36 8.64 100.00
Hailstorm 90.41 9.59 100.00
Heavy rain 89.91 10.09 100.00
Sporadic rain 78.63 21.37 100.00
Soil erosion 96.87 3.13 100.00
Landslide (Glacier) 94.99 5.01 100.00
Snowstorm 0.0 100.0 100.00
Avalanche 0.0 100.0 100.00
GLOF 62.76 37.24 100.00
Cold wave 24.77 75.23 100.00
Disease/insect 97.18 2.82 100.00
Eastern Hill
Drought 99.71 0.29 100.00
Fire (forest) 67.08 32.92 100.00
Fire (settlement) 68.86 31.14 100.00
Flood 29.82 70.18 100.00
Windstorm 33.70 66.30 100.00
Thunderstorm 75.71 24.29 100.00
Hailstorm 25.41 74.59 100.00
Heavy rain 54.69 45.31 100.00
Sporadic rain 98.69 1.31 100.00
Soil erosion 20.86 79.14 100.00
Landslide 51.67 48.33 100.00
Heat wave 0.0 100.0 100.00
Cold wave 3.81 96.19 100.00
Disease/insect 98.57 1.43 100.00
Eastern Terai
Drought 99.38 0.62 100.00
Fire (forest) 62.65 37.35 100.00
Fire (settlement) 50.50 49.50 100.00
Flood 42.11 57.89 100.00
Inundation 30.39 69.61 100.00
Windstorm 14.35 85.65 100.00
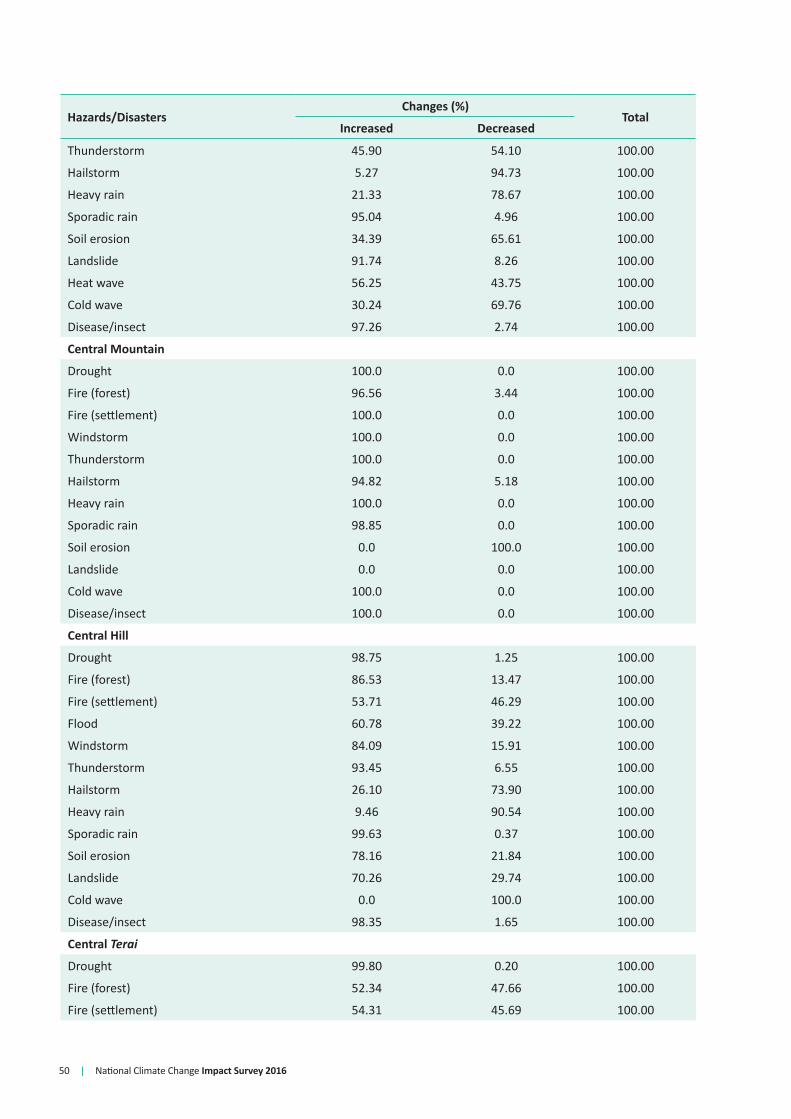
50 | National Climate Change Impact Survey 2016
Hazards/DisastersChanges (%)
TotalIncreased Decreased
Thunderstorm 45.90 54.10 100.00
Hailstorm 5.27 94.73 100.00
Heavy rain 21.33 78.67 100.00
Sporadic rain 95.04 4.96 100.00
Soil erosion 34.39 65.61 100.00
Landslide 91.74 8.26 100.00
Heat wave 56.25 43.75 100.00
Cold wave 30.24 69.76 100.00
Disease/insect 97.26 2.74 100.00
Central Mountain
Drought 100.0 0.0 100.00
Fire (forest) 96.56 3.44 100.00
Fire (settlement) 100.0 0.0 100.00
Windstorm 100.0 0.0 100.00
Thunderstorm 100.0 0.0 100.00
Hailstorm 94.82 5.18 100.00
Heavy rain 100.0 0.0 100.00
Sporadic rain 98.85 0.0 100.00
Soil erosion 0.0 100.0 100.00
Landslide 0.0 0.0 100.00
Cold wave 100.0 0.0 100.00
Disease/insect 100.0 0.0 100.00
Central Hill
Drought 98.75 1.25 100.00
Fire (forest) 86.53 13.47 100.00
Fire (settlement) 53.71 46.29 100.00
Flood 60.78 39.22 100.00
Windstorm 84.09 15.91 100.00
Thunderstorm 93.45 6.55 100.00
Hailstorm 26.10 73.90 100.00
Heavy rain 9.46 90.54 100.00
Sporadic rain 99.63 0.37 100.00
Soil erosion 78.16 21.84 100.00
Landslide 70.26 29.74 100.00
Cold wave 0.0 100.0 100.00
Disease/insect 98.35 1.65 100.00
Central Terai
Drought 99.80 0.20 100.00
Fire (forest) 52.34 47.66 100.00
Fire (settlement) 54.31 45.69 100.00

National Climate Change Impact Survey 2016 | 51
Hazards/DisastersChanges (%)
TotalIncreased Decreased
Flood 76.31 23.69 100.00
Inundation 62.79 37.21 100.00
Windstorm 1.97 98.03 100.00
Thunderstorm 14.50 85.50 100.00
Hailstorm 2.35 97.65 100.00
Heavy rain 0.78 99.22 100.00
Sporadic rain 86.51 13.49 100.00
Heat wave 32.04 67.96 100.00
Cold wave 28.07 71.93 100.00
Disease/insect 96.70 3.30 100.00
Western Mountain
Drought 100.0 0.0 100.00
Fire (forest) 100.0 0.0 100.00
Windstorm 100.0 0.0 100.00
Hailstorm 70.12 29.88 100.00
Heavy rain 100.00 0.0 100.00
Soil erosion 67.46 32.54 100.00
Landslide 100.00 35.29 100.00
Snowstorm 64.71 0.0 100.00
Avalanche 100.0 0.0 100.00
Disease/insect 100.0 0.0 100.00
Western Hill
Drought 97.30 2.70 100.00
Fire (forest) 59.86 40.14 100.00
Fire (settlement) 36.60 63.40 100.00
Flood 75.09 24.91 100.00
Windstorm 86.83 13.17 100.00
Thunderstorm 77.88 22.12 100.00
Hailstorm 54.00 46.00 100.00
Heavy rain 91.37 8.63 100.00
Sporadic rain 97.21 2.79 100.00
Soil erosion 87.82 12.18 100.00
Landslide 90.86 9.14 100.00
Cold wave 29.14 70.86 100.00
Disease/insect 98.93 1.07 100.00
Western Terai
Drought 100.00 0.0 100.00
Fire (forest) 47.62 52.38 100.00
Fire (settlement) 87.73 12.27 100.00
Flood 81.82 18.18 100.00
Inundation 82.94 17.06 100.00
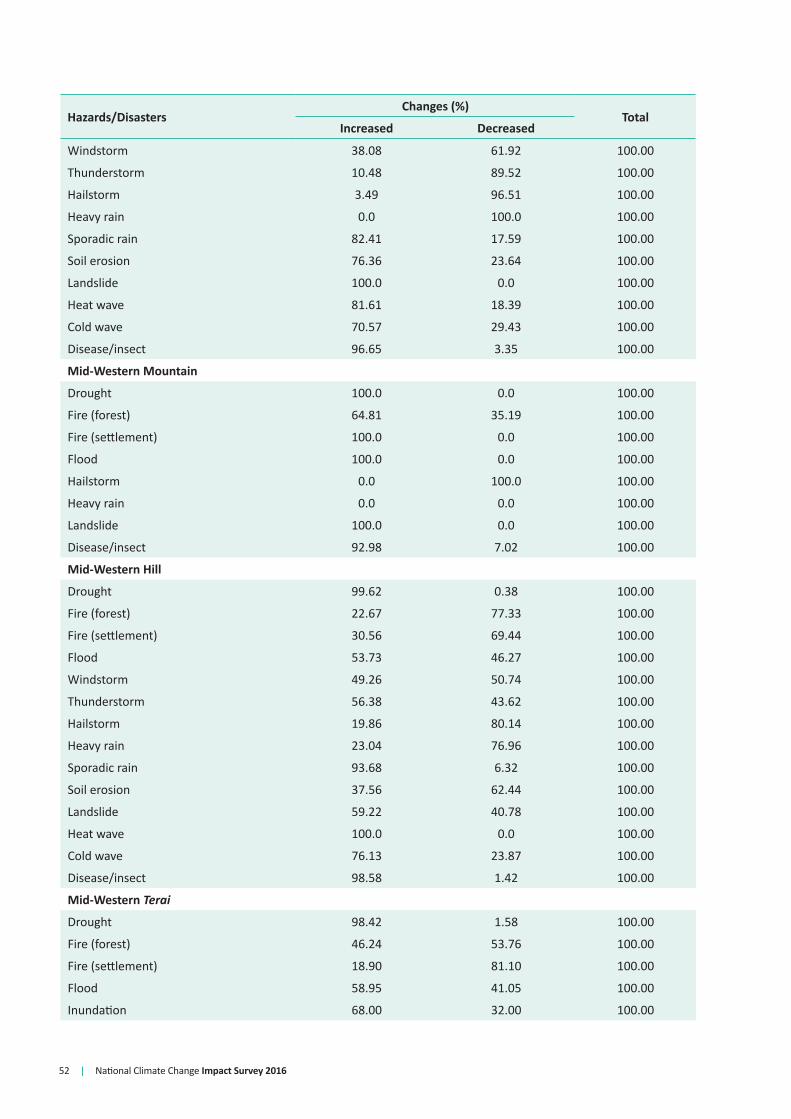
52 | National Climate Change Impact Survey 2016
Hazards/DisastersChanges (%)
TotalIncreased Decreased
Windstorm 38.08 61.92 100.00
Thunderstorm 10.48 89.52 100.00
Hailstorm 3.49 96.51 100.00
Heavy rain 0.0 100.0 100.00
Sporadic rain 82.41 17.59 100.00
Soil erosion 76.36 23.64 100.00
Landslide 100.0 0.0 100.00
Heat wave 81.61 18.39 100.00
Cold wave 70.57 29.43 100.00
Disease/insect 96.65 3.35 100.00
Mid-Western Mountain
Drought 100.0 0.0 100.00
Fire (forest) 64.81 35.19 100.00
Fire (settlement) 100.0 0.0 100.00
Flood 100.0 0.0 100.00
Hailstorm 0.0 100.0 100.00
Heavy rain 0.0 0.0 100.00
Landslide 100.0 0.0 100.00
Disease/insect 92.98 7.02 100.00
Mid-Western Hill
Drought 99.62 0.38 100.00
Fire (forest) 22.67 77.33 100.00
Fire (settlement) 30.56 69.44 100.00
Flood 53.73 46.27 100.00
Windstorm 49.26 50.74 100.00
Thunderstorm 56.38 43.62 100.00
Hailstorm 19.86 80.14 100.00
Heavy rain 23.04 76.96 100.00
Sporadic rain 93.68 6.32 100.00
Soil erosion 37.56 62.44 100.00
Landslide 59.22 40.78 100.00
Heat wave 100.0 0.0 100.00
Cold wave 76.13 23.87 100.00
Disease/insect 98.58 1.42 100.00
Mid-Western Terai
Drought 98.42 1.58 100.00
Fire (forest) 46.24 53.76 100.00
Fire (settlement) 18.90 81.10 100.00
Flood 58.95 41.05 100.00
Inundation 68.00 32.00 100.00
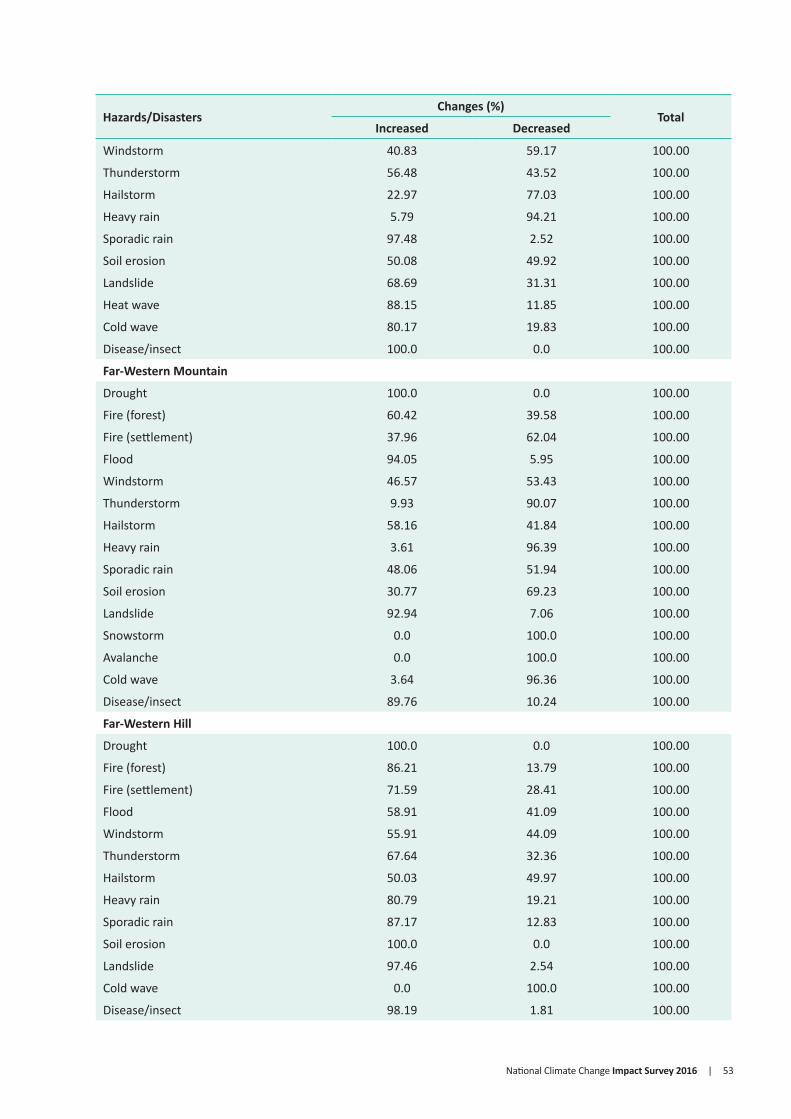
National Climate Change Impact Survey 2016 | 53
Hazards/DisastersChanges (%)
TotalIncreased Decreased
Windstorm 40.83 59.17 100.00
Thunderstorm 56.48 43.52 100.00
Hailstorm 22.97 77.03 100.00
Heavy rain 5.79 94.21 100.00
Sporadic rain 97.48 2.52 100.00
Soil erosion 50.08 49.92 100.00
Landslide 68.69 31.31 100.00
Heat wave 88.15 11.85 100.00
Cold wave 80.17 19.83 100.00
Disease/insect 100.0 0.0 100.00
Far-Western Mountain
Drought 100.0 0.0 100.00
Fire (forest) 60.42 39.58 100.00
Fire (settlement) 37.96 62.04 100.00
Flood 94.05 5.95 100.00
Windstorm 46.57 53.43 100.00
Thunderstorm 9.93 90.07 100.00
Hailstorm 58.16 41.84 100.00
Heavy rain 3.61 96.39 100.00
Sporadic rain 48.06 51.94 100.00
Soil erosion 30.77 69.23 100.00
Landslide 92.94 7.06 100.00
Snowstorm 0.0 100.0 100.00
Avalanche 0.0 100.0 100.00
Cold wave 3.64 96.36 100.00
Disease/insect 89.76 10.24 100.00
Far-Western Hill
Drought 100.0 0.0 100.00
Fire (forest) 86.21 13.79 100.00
Fire (settlement) 71.59 28.41 100.00
Flood 58.91 41.09 100.00
Windstorm 55.91 44.09 100.00
Thunderstorm 67.64 32.36 100.00
Hailstorm 50.03 49.97 100.00
Heavy rain 80.79 19.21 100.00
Sporadic rain 87.17 12.83 100.00
Soil erosion 100.0 0.0 100.00
Landslide 97.46 2.54 100.00
Cold wave 0.0 100.0 100.00
Disease/insect 98.19 1.81 100.00

54 | National Climate Change Impact Survey 2016
Hazards/DisastersChanges (%)
TotalIncreased Decreased
Far-Western Terai
Drought 100.0 0.0 100.00
Fire (forest) 54.43 45.57 100.00
Fire (settlement) 87.75 12.25 100.00
Flood 88.40 11.60 100.00
Inundation 78.12 21.88 100.00
Windstorm 51.73 48.27 100.00
Thunderstorm 45.32 54.68 100.00
Hailstorm 44.46 55.54 100.00
Heavy rain 26.81 73.19 100.00
Sporadic rain 90.10 9.90 100.00
Soil erosion 90.06 9.94 100.00
Landslide 88.08 11.92 100.00
Heat wave 92.45 7.55 100.00
Cold wave 80.69 19.31 100.00
Disease/insect 96.18 3.82 100.00
Kathmandu Valley
Drought 99.05 0.95 100.00
Fire (forest) 55.28 44.72 100.00
Fire (settlement) 22.80 77.20 100.00
Flood 45.61 54.39 100.00
Windstorm 24.13 75.87 100.00
Thunderstorm 28.60 71.40 100.00
Hailstorm 10.67 89.33 100.00
Heavy rain 59.16 40.84 100.00
Sporadic rain 94.41 5.59 100.00
Landslide 100.0 0.0 100.00
Disease/insect 98.40 1.60 100.00
Table 6-4 shows the percentage distribution of households observing changes in climate induced disasters across eco-development regions in last 25 years. Highest percentage of households in all eco-development regions reported an increase in drought followed by disease/insect in the last 25 years. Similarly, 100 per cent households of
central mountain region observed an increase in cold wave while another 100 per cent reported to decrease in such incidences in central hill. It is seen that 56.25 per cent of eastern Terai households are observing an increase in heat wave while none of the household are observing so in eastern hill.

National Climate Change Impact Survey 2016 | 55
Table 6-5: Changes in Climate Induced Disasters by Climatic Zone
Hazards/DisastersPerception in Changes (%)
TotalIncreased Decreased
TropicalDrought 99.60 0.40 100.00Fire (forest) 56.97 43.03 100.00Fire (settlement) 54.50 45.50 100.00Flood 63.81 36.19 100.00Inundation 51.47 48.53 100.00Windstorm 22.92 77.08 100.00Thunderstorm 44.98 55.02 100.00Hailstorm 17.23 82.77 100.00Heavy rain 16.34 83.66 100.00Sporadic rain 91.78 8.22 100.00Soil erosion 57.07 42.93 100.00Landslide 74.25 25.75 100.00Snowstorm 0.0 100.00 100.00Avalanche 0.0 100.00 100.00Heat wave 74.22 25.78 100.00Cold wave 38.56 61.44 100.00Disease/insect 97.54 2.46 100.00Sub-TropicalDrought 99.10 0.90 100.00Fire (forest) 62.73 37.27 100.00Fire (settlement)s 55.48 44.52 100.00Flood 51.88 48.12 100.00Windstorm 48.31 51.69 100.00Thunderstorm 74.72 25.28 100.00Hailstorm 36.78 63.22 100.00Heavy rain 56.91 43.09 100.00Sporadic rain 95.19 4.81 100.00Soil erosion 66.49 33.51 100.00Landslide 79.15 20.85 100.00Snowstorm 0.0 100.00 100.00Avalanche 0.0 100.00 100.00GLOF 62.76 37.24 100.00Heat wave 6.17 93.83 100.00Cold wave 16.28 83.72 100.00Disease/insect 98.35 1.65 100.00TemperateDrought 96.95 3.05 100.00Fire (forest) 71.23 28.77 100.00Fire (settlement) 64.05 35.95 100.00Flood 72.94 27.06 100.00Windstorm 65.60 34.40 100.00Thunderstorm 81.12 18.88 100.00Hailstorm 64.14 35.86 100.00Heavy rain 70.60 29.40 100.00Sporadic rain 96.02 3.98 100.00Soil erosion 75.69 24.31 100.00

56 | National Climate Change Impact Survey 2016
Hazards/DisastersPerception in Changes (%)
TotalIncreased Decreased
Landslide 92.00 8.00 100.00Snowstorm 0.0 100.00 100.00Avalanche 0.0 100.00 100.00Heat wave 0.0 100.00 100.00Cold wave 10.93 89.07 100.00Disease/insect 95.24 4.76 100.00Sub-AlpineDrought 100.00 0.0 100.00Hailstorm 20.00 80.00 100.00Soil erosion 70.59 29.41 100.00Landslide 100.00 0.0 100.00Snowstorm 64.71 35.29 100.00Avalanche 100.00 0.0 100.00Disease/insect 100.00 0.0 100.00
Table 6-5 shows percentage distribution of households observing changes in climate induced disasters by climatic zone in last 25 years. Highest percentage of the households reported an increase in the incidences of drought in all climatic zones. All households (100%) in sub-alpine zone are observing an increase in drought,
landslide, avalanche, and Disease/insect. Similarly, 63.81 per cent households are observing so in case of flood and 51.47 per cent in case of inundation in tropical zone. Highest percentage of households in temperate region (64.05%) reported an increase in incidence of fire in settlement.
6.3. Impacts of Climate Induced DisastersTable 6-6: Extent of Impact of Climate Induced Disaster in Last 25 Years
Hazards/DisastersMagnitude of Impact (%)
Total Average Impact(on scale 1 to 5)Extremely low
(1)Low(2)
Moderate(3)
High(4)
Extremely high(5)
Drought 17.59 19.36 30.19 24.99 7.87 100.00 2.9
Fire (forest) 39.76 28.94 27.34 3.75 0.22 100.00 2.0
Fire (settlement) 47.66 23.25 19.59 5.04 4.46 100.00 2.0
Flood 30.13 18.90 19.40 13.33 18.24 100.00 2.7
Inundation 37.36 21.05 20.42 5.36 15.81 100.00 2.4
Windstorm 44.46 17.08 25.83 7.36 5.26 100.00 2.1
Thunderstorm 52.41 20.72 22.05 4.58 0.23 100.00 1.8
Hailstorm 41.04 21.38 25.15 8.93 3.49 100.00 2.1
Heavy rain 30.83 19.54 25.11 21.22 3.30 100.00 2.5
Sporadic rain 31.83 28.58 29.04 9.83 0.72 100.00 2.2
Soil erosion 26.46 30.33 30.94 11.58 0.69 100.00 2.3
Landslide 28.45 22.67 36.92 10.66 1.30 100.00 2.3
Snowstorm 62.71 29.35 3.53 4.11 0.30 100.00 1.5
Avalanche 96.14 3.86 0.0 0.0 0.0 100.00 1.0
GLOF 62.76 37.24 0.0 0.0 0.0 100.00 1.4
Heat wave 18.92 42.54 34.24 3.97 0.33 100.00 2.2
Cold wave 29.19 23.72 23.81 9.13 14.15 100.00 2.6
Disease/insect 16.51 20.21 32.07 22.90 8.30 100.00 2.9
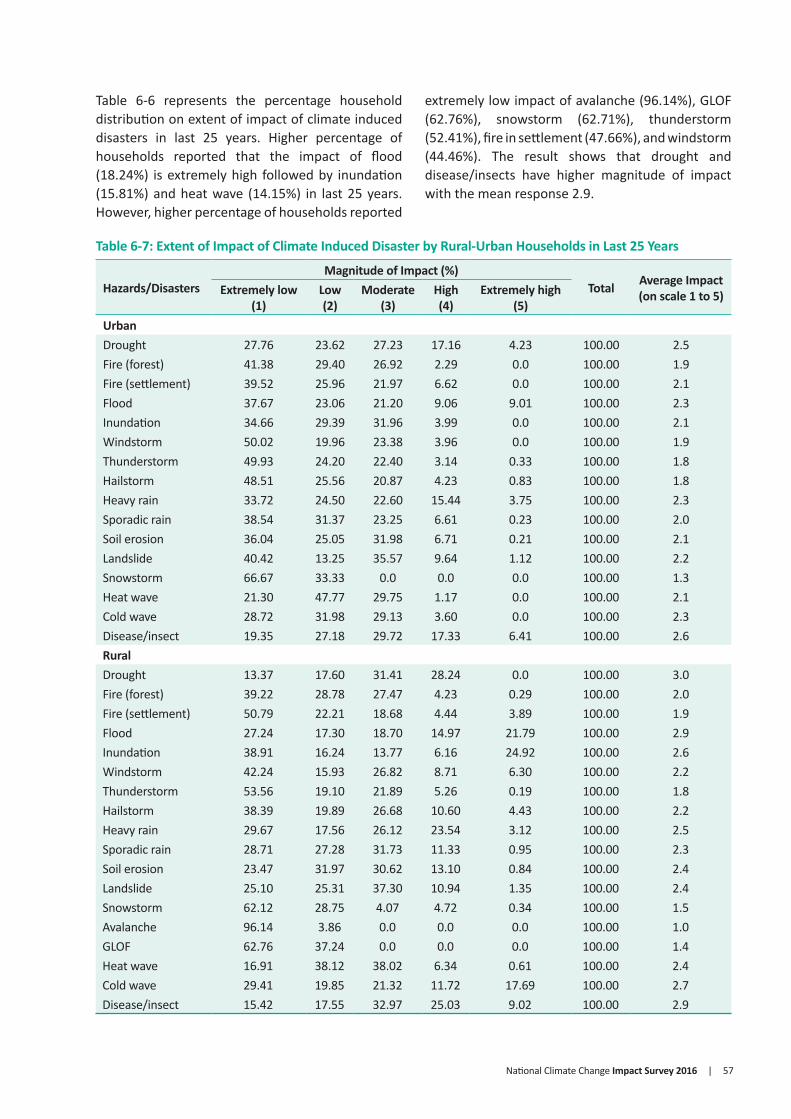
National Climate Change Impact Survey 2016 | 57
Table 6-6 represents the percentage household distribution on extent of impact of climate induced disasters in last 25 years. Higher percentage of households reported that the impact of flood (18.24%) is extremely high followed by inundation (15.81%) and heat wave (14.15%) in last 25 years. However, higher percentage of households reported
extremely low impact of avalanche (96.14%), GLOF (62.76%), snowstorm (62.71%), thunderstorm (52.41%), fire in settlement (47.66%), and windstorm (44.46%). The result shows that drought and disease/insects have higher magnitude of impact with the mean response 2.9.
Table 6-7: Extent of Impact of Climate Induced Disaster by Rural-Urban Households in Last 25 Years
Hazards/DisastersMagnitude of Impact (%)
Total Average Impact(on scale 1 to 5)Extremely low
(1)Low(2)
Moderate(3)
High(4)
Extremely high(5)
UrbanDrought 27.76 23.62 27.23 17.16 4.23 100.00 2.5Fire (forest) 41.38 29.40 26.92 2.29 0.0 100.00 1.9Fire (settlement) 39.52 25.96 21.97 6.62 0.0 100.00 2.1Flood 37.67 23.06 21.20 9.06 9.01 100.00 2.3Inundation 34.66 29.39 31.96 3.99 0.0 100.00 2.1Windstorm 50.02 19.96 23.38 3.96 0.0 100.00 1.9Thunderstorm 49.93 24.20 22.40 3.14 0.33 100.00 1.8Hailstorm 48.51 25.56 20.87 4.23 0.83 100.00 1.8Heavy rain 33.72 24.50 22.60 15.44 3.75 100.00 2.3Sporadic rain 38.54 31.37 23.25 6.61 0.23 100.00 2.0Soil erosion 36.04 25.05 31.98 6.71 0.21 100.00 2.1Landslide 40.42 13.25 35.57 9.64 1.12 100.00 2.2Snowstorm 66.67 33.33 0.0 0.0 0.0 100.00 1.3Heat wave 21.30 47.77 29.75 1.17 0.0 100.00 2.1Cold wave 28.72 31.98 29.13 3.60 0.0 100.00 2.3Disease/insect 19.35 27.18 29.72 17.33 6.41 100.00 2.6RuralDrought 13.37 17.60 31.41 28.24 0.0 100.00 3.0Fire (forest) 39.22 28.78 27.47 4.23 0.29 100.00 2.0Fire (settlement) 50.79 22.21 18.68 4.44 3.89 100.00 1.9Flood 27.24 17.30 18.70 14.97 21.79 100.00 2.9Inundation 38.91 16.24 13.77 6.16 24.92 100.00 2.6Windstorm 42.24 15.93 26.82 8.71 6.30 100.00 2.2Thunderstorm 53.56 19.10 21.89 5.26 0.19 100.00 1.8Hailstorm 38.39 19.89 26.68 10.60 4.43 100.00 2.2Heavy rain 29.67 17.56 26.12 23.54 3.12 100.00 2.5Sporadic rain 28.71 27.28 31.73 11.33 0.95 100.00 2.3Soil erosion 23.47 31.97 30.62 13.10 0.84 100.00 2.4Landslide 25.10 25.31 37.30 10.94 1.35 100.00 2.4Snowstorm 62.12 28.75 4.07 4.72 0.34 100.00 1.5Avalanche 96.14 3.86 0.0 0.0 0.0 100.00 1.0GLOF 62.76 37.24 0.0 0.0 0.0 100.00 1.4Heat wave 16.91 38.12 38.02 6.34 0.61 100.00 2.4Cold wave 29.41 19.85 21.32 11.72 17.69 100.00 2.7Disease/insect 15.42 17.55 32.97 25.03 9.02 100.00 2.9

58 | National Climate Change Impact Survey 2016
Table 6-7 shows the percentage distribution of households on extent of impact of climate induced disaster by rural-urban categories in last 25 years. Households are observing higher magnitude of impact of disasters such as droughts, Disease/insects, and flood in rural
area with mean response 2.9 while it is 2.7 in urban areas. Similarly, more than one fourth households in both urban (27.23%) and in rural (31.41%) areas are observing moderate level of impact of drought with mean response 2.5 and 3.0 respectively.
Table 6-8: Extent of Impact of Climate Induced Disaster by Sex of the Respondent in Last 25 Years
Hazards/DisasterMagnitude of Impact (%)
Total Average Impact(on scale 1 to 5)Extremely low
(1)Low (2)
Moderate (3)
High (4)
Extremely high (5)
MaleDrought 17.16 19.60 31.20 24.43 7.61 100.00 2.9Fire (forest) 39.49 28.65 28.26 3.45 0.15 100.00 2.0Fire (settlement) 47.67 23.15 19.89 4.78 4.51 100.00 2.0Flood 31.18 18.43 19.64 13.50 17.24 100.00 2.7Inundation 38.07 19.61 17.86 6.43 18.03 100.00 2.5Windstorm 45.26 16.67 25.66 7.31 5.10 100.00 2.1Thunderstorm 51.71 20.18 22.86 5.03 0.23 100.00 1.8Hailstorm 40.82 20.95 25.78 8.80 3.64 100.00 2.1Heavy rain 28.53 19.60 26.34 21.71 3.82 100.00 2.5Sporadic rain 31.02 28.50 30.05 9.78 0.65 100.00 2.2Soil erosion 25.76 29.40 33.56 10.90 0.39 100.00 2.3Landslide 26.49 23.04 38.06 11.21 1.20 100.00 2.4Snowstorm 59.82 30.05 4.86 4.82 0.45 100.00 1.6Avalanche 100.00 0.0 0.0 0.0 0.0 100.00 1.0GLOF 100.00 0.0 0.0 0.0 0.0 100.00 1.0Heat wave 18.35 43.02 34.56 4.07 0.0 100.00 2.2Cold wave 29.16 23.37 25.26 8.36 13.85 100.00 2.5Disease/insect 16.32 20.18 32.71 22.56 8.23 100.00 2.9Female
Drought 18.54 18.84 27.96 26.22 8.44 100.00 2.9Fire (forest) 40.44 29.68 24.98 4.49 0.41 100.00 1.9Fire (settlement) 47.64 23.55 18.70 5.82 4.29 100.00 2.0Flood 27.27 20.19 18.73 12.85 20.96 100.00 2.8Inundation 34.62 26.56 30.23 1.28 7.31 100.00 2.2Windstorm 42.48 18.11 26.27 7.48 5.67 100.00 2.2Thunderstorm 53.94 21.90 20.30 3.61 0.25 100.00 1.7Hailstorm 41.55 22.35 23.72 9.22 3.16 100.00 2.1Heavy rain 36.32 19.40 22.17 20.07 2.04 100.00 2.3Sporadic rain 34.08 28.78 26.23 9.98 0.93 100.00 2.1

National Climate Change Impact Survey 2016 | 59
Hazards/DisasterMagnitude of Impact (%)
Total Average Impact(on scale 1 to 5)Extremely low
(1)Low (2)
Moderate (3)
High (4)
Extremely high (5)
Soil erosion 28.51 33.00 23.37 13.57 1.56 100.00 2.3Landslide 33.02 21.80 34.29 9.37 1.53 100.00 2.2Snowstorm 68.49 27.95 0.89 2.67 0.0 100.00 1.4Avalanche 92.43 7.57 0.0 0.0 0.0 100.00 1.1GLOF 0.0 100.00 0.0 0.0 0.0 100.00 2.0Heat wave 20.47 41.22 33.37 3.70 1.23 100.00 2.2Cold wave 29.28 24.67 19.87 11.23 14.97 100.00 2.6Disease/insect 16.99 20.31 30.49 23.74 8.47 100.00 2.9
Table 6-8 depicts percentage distribution of households observing an extent of impact of climate induced disaster based on Sex of the respondents in last 25 years. The result demonstrates that both male and female are observing higher impact of
drought and Disease/insects with mean response 2.9. The similar magnitude of impact is observed by both male and female category with the mean response 2.7 and 2.8 respectively.
Table 6-9: Extent of Impact of Climate Induced Disaster by Eco-Development Regions in Last 25 Years
Hazards/DisastersMagnitude of Impact (%)
Total Average Impact(on scale 1 to 5)Extremely low
(1)Low(2)
Moderate(3)
High(4)
Extremely high(5)
Eastern MountainDrought 5.28 25.99 36.58 32.15 0.00 100.00 3.0Fire (forest) 45.70 31.96 0.00 22.34 0.00 100.00 2.0Fire (settlement) 49.07 32.68 11.84 3.20 3.20 100.00 1.8Flood 35.13 13.76 27.00 24.11 0.00 100.00 2.4Windstorm 10.00 50.00 40.00 0.00 0.00 100.00 2.3Thunderstorm 11.88 13.00 58.43 16.69 0.00 100.00 2.8Hailstorm 6.80 9.29 30.09 39.21 14.61 100.00 3.5Heavy rain 1.93 17.17 43.53 37.37 0.00 100.00 3.2Sporadic rain 5.94 42.25 46.61 5.19 0.00 100.00 2.5Soil erosion 10.36 17.06 50.97 21.61 0.00 100.00 2.8Landslide 17.85 14.63 36.31 26.87 4.34 100.00 2.9Snowstorm 51.80 22.09 12.47 13.64 0.00 100.00 1.9Avalanche 100.00 0.00 0.00 0.00 0.00 100.00 1.0GLOF 62.76 37.24 0.00 0.00 0.00 100.00 1.4Cold wave 33.15 19.05 28.37 16.76 2.67 100.00 2.4Disease/insect 4.13 12.90 36.28 43.41 3.28 100.00 3.3Eastern HillDrought 3.86 10.62 46.65 33.15 5.71 100.00 3.3Fire (forest) 8.13 10.43 77.42 3.44 0.58 100.00 2.8Fire (settlement) 3.09 12.29 76.16 7.43 1.03 100.00 2.9Flood 13.64 12.02 68.72 5.62 0.00 100.00 2.7Windstorm 1.39 6.56 79.29 12.76 0.00 100.00 3.0
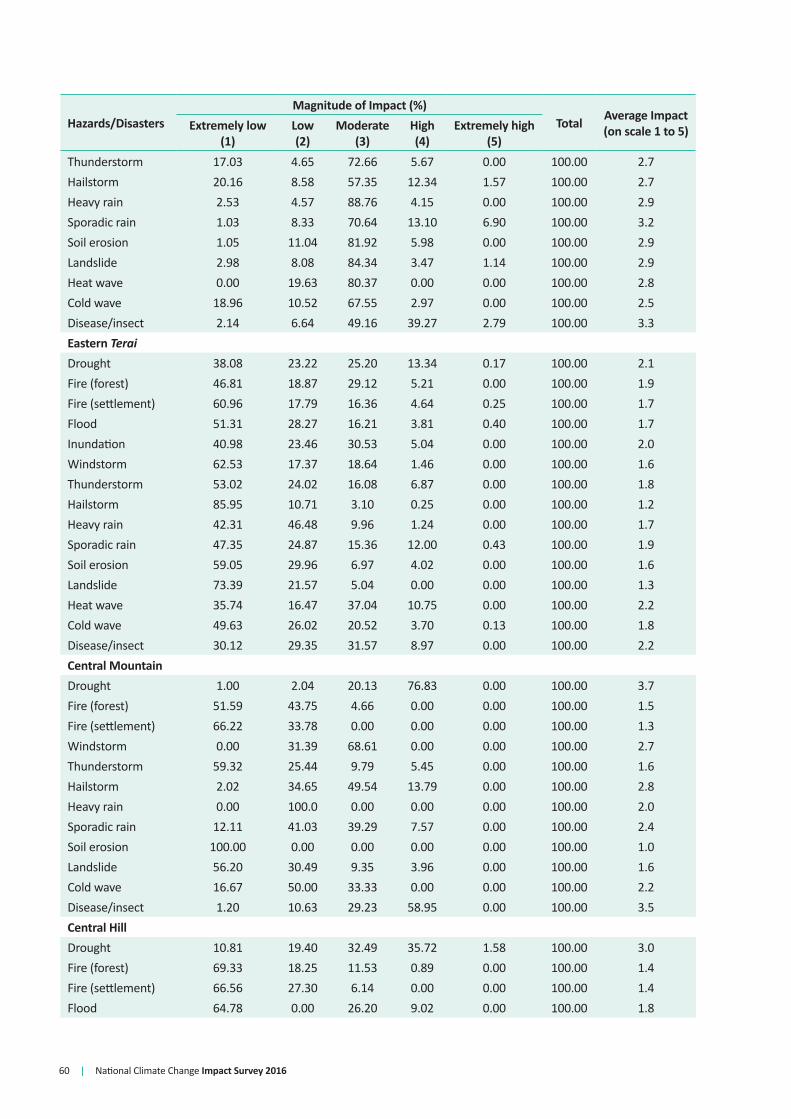
60 | National Climate Change Impact Survey 2016
Hazards/DisastersMagnitude of Impact (%)
Total Average Impact(on scale 1 to 5)Extremely low
(1)Low(2)
Moderate(3)
High(4)
Extremely high(5)
Thunderstorm 17.03 4.65 72.66 5.67 0.00 100.00 2.7Hailstorm 20.16 8.58 57.35 12.34 1.57 100.00 2.7Heavy rain 2.53 4.57 88.76 4.15 0.00 100.00 2.9Sporadic rain 1.03 8.33 70.64 13.10 6.90 100.00 3.2Soil erosion 1.05 11.04 81.92 5.98 0.00 100.00 2.9Landslide 2.98 8.08 84.34 3.47 1.14 100.00 2.9Heat wave 0.00 19.63 80.37 0.00 0.00 100.00 2.8Cold wave 18.96 10.52 67.55 2.97 0.00 100.00 2.5Disease/insect 2.14 6.64 49.16 39.27 2.79 100.00 3.3Eastern Terai
Drought 38.08 23.22 25.20 13.34 0.17 100.00 2.1Fire (forest) 46.81 18.87 29.12 5.21 0.00 100.00 1.9Fire (settlement) 60.96 17.79 16.36 4.64 0.25 100.00 1.7Flood 51.31 28.27 16.21 3.81 0.40 100.00 1.7Inundation 40.98 23.46 30.53 5.04 0.00 100.00 2.0Windstorm 62.53 17.37 18.64 1.46 0.00 100.00 1.6Thunderstorm 53.02 24.02 16.08 6.87 0.00 100.00 1.8Hailstorm 85.95 10.71 3.10 0.25 0.00 100.00 1.2Heavy rain 42.31 46.48 9.96 1.24 0.00 100.00 1.7Sporadic rain 47.35 24.87 15.36 12.00 0.43 100.00 1.9Soil erosion 59.05 29.96 6.97 4.02 0.00 100.00 1.6Landslide 73.39 21.57 5.04 0.00 0.00 100.00 1.3Heat wave 35.74 16.47 37.04 10.75 0.00 100.00 2.2Cold wave 49.63 26.02 20.52 3.70 0.13 100.00 1.8Disease/insect 30.12 29.35 31.57 8.97 0.00 100.00 2.2Central MountainDrought 1.00 2.04 20.13 76.83 0.00 100.00 3.7Fire (forest) 51.59 43.75 4.66 0.00 0.00 100.00 1.5Fire (settlement) 66.22 33.78 0.00 0.00 0.00 100.00 1.3Windstorm 0.00 31.39 68.61 0.00 0.00 100.00 2.7Thunderstorm 59.32 25.44 9.79 5.45 0.00 100.00 1.6Hailstorm 2.02 34.65 49.54 13.79 0.00 100.00 2.8Heavy rain 0.00 100.0 0.00 0.00 0.00 100.00 2.0Sporadic rain 12.11 41.03 39.29 7.57 0.00 100.00 2.4Soil erosion 100.00 0.00 0.00 0.00 0.00 100.00 1.0Landslide 56.20 30.49 9.35 3.96 0.00 100.00 1.6Cold wave 16.67 50.00 33.33 0.00 0.00 100.00 2.2Disease/insect 1.20 10.63 29.23 58.95 0.00 100.00 3.5Central HillDrought 10.81 19.40 32.49 35.72 1.58 100.00 3.0Fire (forest) 69.33 18.25 11.53 0.89 0.00 100.00 1.4Fire (settlement) 66.56 27.30 6.14 0.00 0.00 100.00 1.4Flood 64.78 0.00 26.20 9.02 0.00 100.00 1.8

National Climate Change Impact Survey 2016 | 61
Hazards/DisastersMagnitude of Impact (%)
Total Average Impact(on scale 1 to 5)Extremely low
(1)Low(2)
Moderate(3)
High(4)
Extremely high(5)
Windstorm 70.17 21.08 8.76 0.00 0.00 100.00 1.4Thunderstorm 90.10 5.94 1.81 2.15 0.00 100.00 1.2Hailstorm 88.50 8.80 2.70 0.00 0.00 100.00 1.1Heavy rain 100.00 0.00 0.00 0.00 0.00 100.00 1.0Sporadic rain 46.36 37.20 16.44 0.00 0.00 100.00 1.7Soil erosion 7.35 34.03 39.08 19.54 0.00 100.00 2.7Landslide 54.94 14.83 21.46 6.94 1.82 100.00 1.9Cold wave 100.00 0.00 0.00 0.00 0.00 100.00 1.0Disease/insect 15.24 10.83 29.97 39.78 4.18 100.00 3.1Central Terai
Drought 11.01 7.36 18.99 31.86 30.77 100.00 3.6Fire (forest) 47.95 17.83 34.21 0.00 0.00 100.00 1.9Fire (settlement) 46.87 16.31 13.22 9.04 14.56 100.00 2.3Flood 16.57 7.13 6.98 23.06 46.27 100.00 3.8Inundation 39.58 3.67 2.49 4.80 49.47 100.00 3.2Windstorm 37.87 6.15 9.45 22.01 24.53 100.00 2.9Thunderstorm 55.23 20.17 17.76 5.50 1.33 100.00 1.8Hailstorm 26.80 15.87 28.08 18.14 11.12 100.00 2.7Heavy rain 0.51 2.42 25.43 60.72 10.92 100.00 3.8Sporadic rain 27.05 12.38 34.76 24.91 0.90 100.00 2.6Heat wave 70.16 0.00 5.34 12.25 12.25 100.00 2.0Cold wave 21.94 7.81 10.97 19.13 40.15 100.00 3.5Disease/insect 11.99 6.15 19.55 24.49 37.83 100.00 3.7Western MountainDrought 15.73 38.86 41.41 4.00 0.00 100.00 2.3Fire (forest) 100.00 0.00 0.00 0.00 0.00 100.00 1.0Windstorm 41.67 0.00 0.00 0.00 0.00 100.00 1.9Hailstorm 37.05 27.22 35.72 0.00 0.00 100.00 2.0Heavy rain 100.00 0.00 0.00 0.00 0.00 100.00 1.0Soil erosion 21.29 5.62 56.22 16.87 0.00 100.00 2.7Landslide 62.09 18.14 19.77 0.00 0.00 100.00 1.6Snowstorm 35.29 29.41 11.76 17.65 5.88 100.00 2.3Avalanche 50.00 50.00 0.00 0.00 0.00 100.00 1.5Disease/insect 16.53 31.81 51.65 0.00 0.00 100.00 2.4Western HillDrought 22.13 29.62 41.13 5.93 1.19 100.00 2.3Fire (forest) 46.78 31.25 17.04 4.92 0.00 100.00 1.8Fire (settlement) 66.64 19.07 6.96 0.00 7.33 100.00 1.6Flood 63.68 25.84 10.49 0.00 0.00 100.00 1.5Windstorm 30.32 10.18 59.50 0.00 0.00 100.00 2.3Thunderstorm 57.39 20.07 18.49 3.57 0.49 100.00 1.7Hailstorm 27.45 31.54 31.86 4.65 4.50 100.00 2.3Heavy rain 57.66 20.19 16.40 5.75 0.00 100.00 1.7

62 | National Climate Change Impact Survey 2016
Hazards/DisastersMagnitude of Impact (%)
Total Average Impact(on scale 1 to 5)Extremely low
(1)Low(2)
Moderate(3)
High(4)
Extremely high(5)
Sporadic rain 37.86 37.47 13.41 10.87 0.39 100.00 2.0Soil erosion 25.22 40.16 16.08 17.51 1.03 100.00 2.3Landslide 26.47 30.62 28.10 13.35 1.46 100.00 2.3Cold wave 32.90 37.97 29.14 0.00 0.00 100.00 2.0Disease/insect 46.75 30.38 19.84 3.02 0.00 100.00 1.8Western Terai
Drought 12.36 60.25 27.39 0.00 0.00 100.00 2.2Fire (forest) 18.45 69.29 12.26 0.00 0.00 100.00 1.9Fire (settlement) 19.57 62.51 17.92 0.00 0.00 100.00 2.0Flood 22.67 60.87 16.46 0.00 0.00 100.00 1.9Inundation 21.18 60.27 18.54 0.00 0.00 100.00 2.0Windstorm 33.72 62.95 3.33 0.00 0.00 100.00 1.7Thunderstorm 18.04 66.09 15.88 0.00 0.00 100.00 2.0Hailstorm 11.11 72.10 16.79 0.00 0.00 100.00 2.1Heavy rain 38.54 47.44 14.02 0.00 0.00 100.00 1.8Sporadic rain 9.20 59.46 31.33 0.00 0.00 100.00 2.2Soil erosion 8.06 89.73 2.21 0.00 0.00 100.00 1.9Landslide 7.28 92.72 0.00 0.00 0.00 100.00 1.9Heat wave 14.10 65.18 20.54 0.18 0.00 100.00 2.1Cold wave 8.14 66.12 25.74 0.00 0.00 100.00 2.2Disease/insect 6.63 65.79 26.69 0.89 0.00 100.00 2.2Mid-Western MountainDrought 2.70 7.26 26.12 31.65 32.27 100.00 3.8Fire (forest) 0.00 39.81 35.19 25.00 0.00 100.00 2.9Fire (settlement) 0.00 0.00 100.00 0.00 0.00 100.00 3.0Flood 0.00 100.0 0.00 0.00 0.00 100.00 2.0Hailstorm 0.00 100.0 0.00 0.00 0.00 100.00 2.0Heavy rain 0.00 0.00 100.00 0.00 0.00 100.00 3.0Landslide 38.05 25.00 24.63 12.32 0.00 100.00 2.1Disease/insect 2.07 20.63 64.26 13.04 0.00 100.00 2.9Mid-Western HillDrought 22.34 16.87 38.44 22.35 0.00 100.00 2.6Fire (forest) 40.59 31.12 27.58 0.71 0.00 100.00 1.9Fire (settlement) 47.45 34.72 14.64 1.52 1.67 100.00 1.8Flood 32.53 19.36 36.90 11.22 0.00 100.00 2.3Windstorm 46.44 13.19 36.11 4.26 0.00 100.00 2.0Thunderstorm 31.03 27.59 39.53 1.85 0.00 100.00 2.1Hailstorm 44.61 31.21 21.88 2.30 0.00 100.00 1.8Heavy rain 47.27 17.58 30.17 4.98 0.00 100.00 1.9Sporadic rain 15.55 18.95 60.16 5.34 0.00 100.00 2.6Soil erosion 33.44 22.81 42.16 1.60 0.00 100.00 2.1Landslide 44.74 21.10 30.79 3.37 0.00 100.00 1.9Heat wave 10.90 0.00 78.20 10.90 0.00 100.00 2.9

National Climate Change Impact Survey 2016 | 63
Hazards/DisastersMagnitude of Impact (%)
Total Average Impact(on scale 1 to 5)Extremely low
(1)Low(2)
Moderate(3)
High(4)
Extremely high(5)
Cold wave 0.00 21.54 78.46 0.00 0.00 100.00 2.8Disease/insect 6.95 24.86 57.82 10.37 0.00 100.00 2.7Mid-Western Terai
Drought 13.16 27.24 37.31 21.37 0.91 100.00 2.7Fire (forest) 50.12 23.12 26.15 0.61 0.00 100.00 1.8Fire (settlement) 54.69 26.33 17.98 1.00 0.00 100.00 1.7Flood 25.62 22.74 36.59 14.47 0.58 100.00 2.4Inundation 41.04 27.76 20.45 10.75 0.00 100.00 2.0Windstorm 34.02 29.82 31.95 4.21 0.00 100.00 2.1Thunderstorm 49.63 26.70 23.67 0.00 0.00 100.00 1.7Hailstorm 45.95 17.19 25.49 9.71 1.66 100.00 2.0Heavy rain 45.20 19.42 35.38 0.00 0.00 100.00 1.9Sporadic rain 11.04 20.22 58.11 10.63 0.00 100.00 2.7Soil erosion 31.43 22.16 35.00 11.41 0.00 100.00 2.3Landslide 28.65 31.01 36.94 3.40 0.00 100.00 2.2Heat wave 0.00 18.80 72.07 9.13 0.00 100.00 2.9Cold wave 5.19 11.63 79.75 3.43 0.00 100.00 2.8Disease/insect 5.07 18.89 57.60 17.96 0.48 100.00 2.9Far-Western MountainDrought 1.16 1.40 8.48 58.97 29.99 100.00 4.2Fire (forest) 57.07 30.06 12.88 0.00 0.00 100.00 1.6Fire (settlement) 48.36 51.64 0.00 0.00 0.00 100.00 1.5Flood 35.42 28.13 8.45 28.01 0.00 100.00 2.3Windstorm 31.88 34.02 33.05 1.05 0.00 100.00 2.0Thunderstorm 76.87 22.10 1.03 0.00 0.00 100.00 1.2Hailstorm 14.80 14.60 55.02 15.13 0.45 100.00 2.7Heavy rain 37.12 51.16 11.72 0.00 0.00 100.00 1.7Sporadic rain 26.60 63.77 8.29 1.34 0.00 100.00 1.8Soil erosion 32.52 57.50 7.07 2.91 0.00 100.00 1.8Landslide 40.88 30.65 19.28 9.20 0.00 100.00 2.0Snowstorm 68.25 31.75 0.00 0.00 0.00 100.00 1.3Avalanche 100.00 0.00 0.00 0.00 0.00 100.00 1.0Cold wave 16.49 46.66 36.85 0.00 0.00 100.00 2.2Disease/insect 5.16 3.22 8.50 83.12 0.00 100.00 3.7Far-Western HillDrought 0.68 16.04 47.71 33.93 1.64 100.00 3.2Fire (forest) 1.20 32.13 41.17 23.24 2.27 100.00 2.9Fire (settlement) 3.61 26.36 54.83 15.19 0.00 100.00 2.8Flood 0.00 100.0 0.00 0.00 0.00 100.00 2.0Windstorm 2.44 44.57 40.18 12.81 0.00 100.00 2.6Thunderstorm 1.32 17.59 58.18 22.90 0.00 100.00 3.0Hailstorm 0.44 34.04 43.46 20.70 1.36 100.00 2.9Heavy rain 0.00 52.64 47.36 0.00 0.00 100.00 2.5Sporadic rain 0.00 0.00 37.97 62.03 0.00 100.00 3.6

64 | National Climate Change Impact Survey 2016
Hazards/DisastersMagnitude of Impact (%)
Total Average Impact(on scale 1 to 5)Extremely low
(1)Low(2)
Moderate(3)
High(4)
Extremely high(5)
Soil erosion 1.20 12.54 46.53 35.05 4.68 100.00 3.3Landslide 0.00 19.91 47.10 28.98 4.00 100.00 3.2Cold wave 0.00 0.00 0.00 100.0 0.00 100.00 4.0Disease/insect 1.60 11.68 60.98 25.74 0.00 100.00 3.1Far-Western Terai
Drought 8.57 16.36 49.31 25.23 0.53 100.00 2.9Fire (forest) 52.29 30.19 14.86 2.66 0.00 100.00 1.7Fire (settlement) 66.11 22.36 5.73 4.81 0.99 100.00 1.5Flood 29.65 24.32 31.28 13.98 0.78 100.00 2.3Inundation 18.94 32.95 38.74 9.37 0.00 100.00 2.4Windstorm 34.93 39.54 18.91 6.62 0.00 100.00 2.0Thunderstorm 59.52 24.18 14.34 1.96 0.00 100.00 1.6Hailstorm 20.37 30.39 34.09 15.15 0.00 100.00 2.4Heavy rain 45.45 31.92 22.63 0.00 0.00 100.00 1.8Sporadic rain 24.97 24.22 39.04 11.77 0.00 100.00 2.4Soil erosion 43.46 17.34 28.34 8.64 2.22 100.00 2.1Landslide 44.18 20.34 0.00 35.48 0.00 100.00 2.3Heat wave 34.07 37.24 25.19 3.50 0.00 100.00 2.0Cold wave 5.70 15.54 67.22 11.54 0.00 100.00 2.8Disease/insect 11.59 13.25 32.16 42.78 0.22 100.00 3.1Kathmandu ValleyDrought 67.41 21.62 10.97 0.00 0.00 100.00 1.4Fire (forest) 100.00 0.00 0.00 0.00 0.00 100.00 1.0Fire (settlement) 77.20 22.80 0.00 0.00 0.00 100.00 1.2Flood 37.16 58.26 3.27 1.32 0.00 100.00 1.7Windstorm 89.46 7.99 2.55 0.00 0.00 100.00 1.1Thunderstorm 94.65 4.20 1.14 0.00 0.00 100.00 1.1Hailstorm 92.33 6.06 1.61 0.00 0.00 100.00 1.1Heavy rain 89.79 10.21 0.00 0.00 0.00 100.00 1.1Sporadic rain 76.74 21.74 1.52 0.00 0.00 100.00 1.2Landslide 100.00 0.00 0.00 0.00 0.00 100.00 1.0Disease/insect 17.98 57.65 17.25 7.12 0.00 100.00 2.1
Table 6-9 depicts the percentage distribution of households on magnitude of climate induced disaster impact by eco-development regions in last 25 years. It is observed that households of Kathmandu Valley have lowest mean response for disasters and none of the households observed
extremely high magnitude of impact of any disasters. Highest mean response is observed in far-western mountain with 4.2 for drought. Similarly, 32.27 per cent households of mid-western mountain reported extremely high magnitude of impact of drought while no one reported so for other disasters.
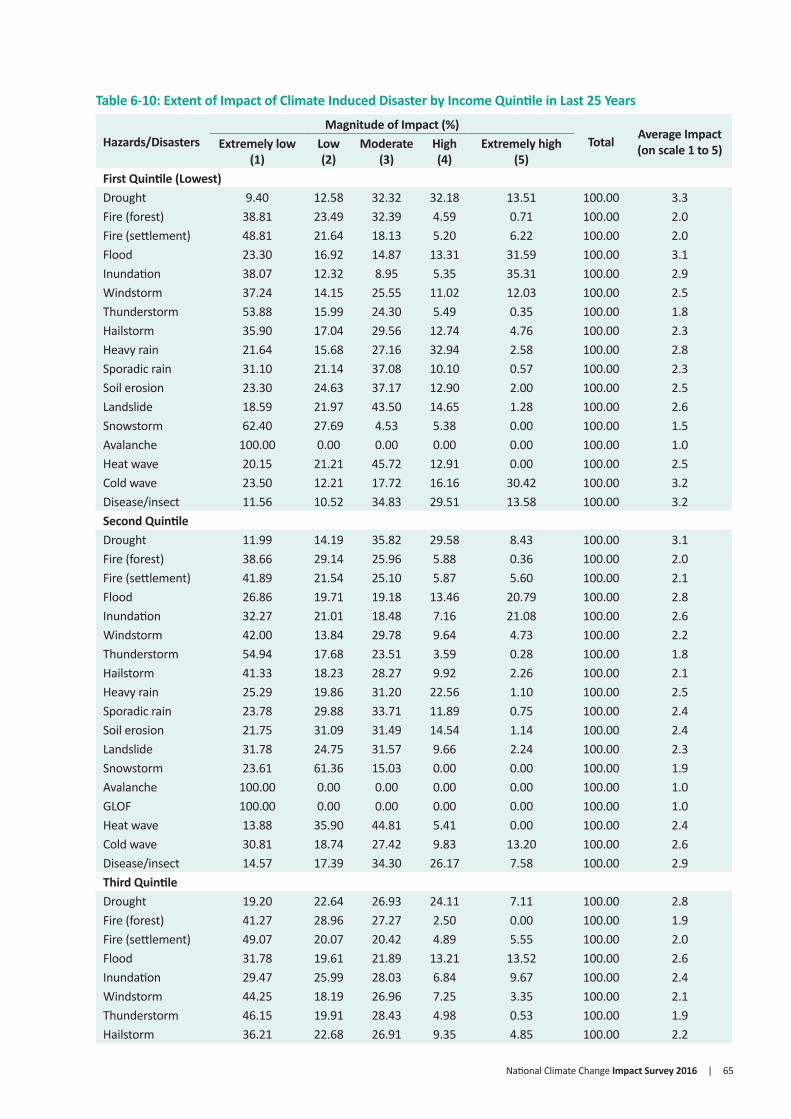
National Climate Change Impact Survey 2016 | 65
Table 6-10: Extent of Impact of Climate Induced Disaster by Income Quintile in Last 25 Years
Hazards/DisastersMagnitude of Impact (%)
Total Average Impact(on scale 1 to 5)Extremely low
(1)Low(2)
Moderate(3)
High(4)
Extremely high(5)
First Quintile (Lowest)Drought 9.40 12.58 32.32 32.18 13.51 100.00 3.3Fire (forest) 38.81 23.49 32.39 4.59 0.71 100.00 2.0Fire (settlement) 48.81 21.64 18.13 5.20 6.22 100.00 2.0Flood 23.30 16.92 14.87 13.31 31.59 100.00 3.1Inundation 38.07 12.32 8.95 5.35 35.31 100.00 2.9Windstorm 37.24 14.15 25.55 11.02 12.03 100.00 2.5Thunderstorm 53.88 15.99 24.30 5.49 0.35 100.00 1.8Hailstorm 35.90 17.04 29.56 12.74 4.76 100.00 2.3Heavy rain 21.64 15.68 27.16 32.94 2.58 100.00 2.8Sporadic rain 31.10 21.14 37.08 10.10 0.57 100.00 2.3Soil erosion 23.30 24.63 37.17 12.90 2.00 100.00 2.5Landslide 18.59 21.97 43.50 14.65 1.28 100.00 2.6Snowstorm 62.40 27.69 4.53 5.38 0.00 100.00 1.5Avalanche 100.00 0.00 0.00 0.00 0.00 100.00 1.0Heat wave 20.15 21.21 45.72 12.91 0.00 100.00 2.5Cold wave 23.50 12.21 17.72 16.16 30.42 100.00 3.2Disease/insect 11.56 10.52 34.83 29.51 13.58 100.00 3.2Second QuintileDrought 11.99 14.19 35.82 29.58 8.43 100.00 3.1Fire (forest) 38.66 29.14 25.96 5.88 0.36 100.00 2.0Fire (settlement) 41.89 21.54 25.10 5.87 5.60 100.00 2.1Flood 26.86 19.71 19.18 13.46 20.79 100.00 2.8Inundation 32.27 21.01 18.48 7.16 21.08 100.00 2.6Windstorm 42.00 13.84 29.78 9.64 4.73 100.00 2.2Thunderstorm 54.94 17.68 23.51 3.59 0.28 100.00 1.8Hailstorm 41.33 18.23 28.27 9.92 2.26 100.00 2.1Heavy rain 25.29 19.86 31.20 22.56 1.10 100.00 2.5Sporadic rain 23.78 29.88 33.71 11.89 0.75 100.00 2.4Soil erosion 21.75 31.09 31.49 14.54 1.14 100.00 2.4Landslide 31.78 24.75 31.57 9.66 2.24 100.00 2.3Snowstorm 23.61 61.36 15.03 0.00 0.00 100.00 1.9Avalanche 100.00 0.00 0.00 0.00 0.00 100.00 1.0GLOF 100.00 0.00 0.00 0.00 0.00 100.00 1.0Heat wave 13.88 35.90 44.81 5.41 0.00 100.00 2.4Cold wave 30.81 18.74 27.42 9.83 13.20 100.00 2.6Disease/insect 14.57 17.39 34.30 26.17 7.58 100.00 2.9Third QuintileDrought 19.20 22.64 26.93 24.11 7.11 100.00 2.8Fire (forest) 41.27 28.96 27.27 2.50 0.00 100.00 1.9Fire (settlement) 49.07 20.07 20.42 4.89 5.55 100.00 2.0Flood 31.78 19.61 21.89 13.21 13.52 100.00 2.6Inundation 29.47 25.99 28.03 6.84 9.67 100.00 2.4Windstorm 44.25 18.19 26.96 7.25 3.35 100.00 2.1Thunderstorm 46.15 19.91 28.43 4.98 0.53 100.00 1.9Hailstorm 36.21 22.68 26.91 9.35 4.85 100.00 2.2

66 | National Climate Change Impact Survey 2016
Hazards/DisastersMagnitude of Impact (%)
Total Average Impact(on scale 1 to 5)Extremely low
(1)Low(2)
Moderate(3)
High(4)
Extremely high(5)
Heavy rain 36.56 16.79 21.07 18.33 7.25 100.00 2.4Sporadic rain 27.01 29.74 30.19 11.72 1.33 100.00 2.3Soil erosion 28.59 33.13 28.50 9.78 0.00 100.00 2.2Landslide 27.49 21.25 39.53 9.76 1.97 100.00 2.4Snowstorm 65.94 29.54 0.00 4.51 0.00 100.00 1.4Avalanche 0.00 100.0 0.00 0.00 0.00 100.00 2.0Heat wave 21.22 37.68 38.98 2.12 0.00 100.00 2.2Cold wave 33.22 21.66 28.30 5.53 11.29 100.00 2.4Disease/insect 20.17 22.57 26.90 22.54 7.83 100.00 2.8Fourth QuintileDrought 25.44 22.70 26.26 21.00 4.60 100.00 2.6Fire (forest) 41.57 29.83 25.21 3.39 0.00 100.00 1.9Fire (settlement) 46.96 27.39 20.61 3.40 1.64 100.00 1.9Flood 30.69 21.40 24.90 15.57 7.45 100.00 2.5Inundation 26.51 30.15 35.93 5.63 1.77 100.00 2.3Windstorm 52.14 18.75 25.70 2.81 0.60 100.00 1.8Thunderstorm 50.28 24.38 20.23 5.11 0.00 100.00 1.8Hailstorm 44.76 23.72 21.54 6.50 3.48 100.00 2.0Heavy rain 34.98 24.45 21.25 16.89 2.42 100.00 2.3Sporadic rain 34.32 29.93 24.50 10.91 0.34 100.00 2.1Soil erosion 23.11 36.45 30.20 10.24 0.00 100.00 2.3Landslide 30.17 25.05 34.58 9.98 0.21 100.00 2.2Snowstorm 66.21 18.50 1.92 11.44 1.92 100.00 1.6Avalanche 100.00 0.00 0.00 0.00 0.00 100.00 1.0GLOF 0.00 100.0 0.00 0.00 0.00 100.00 2.0Heat wave 14.13 47.69 33.48 4.70 0.00 100.00 2.3Cold wave 34.52 29.04 27.04 4.67 4.73 100.00 2.2Disease/insect 21.74 25.55 27.79 19.15 5.77 100.00 2.6Fifth Quintile (Highest)Drought 28.03 27.87 24.78 16.32 3.01 100.00 2.4Fire (forest) 32.10 36.38 28.14 3.38 0.00 100.00 2.0Fire (settlement) 37.67 33.90 20.01 7.35 1.07 100.00 2.0Flood 30.89 26.27 25.52 9.17 8.15 100.00 2.4Inundation 30.48 39.12 29.62 0.77 0.00 100.00 2.0Windstorm 39.26 26.68 26.73 4.87 2.45 100.00 2.0Thunderstorm 47.38 28.75 18.97 4.90 0.00 100.00 1.8Hailstorm 39.54 34.78 21.25 3.36 1.07 100.00 1.9Heavy rain 42.42 24.12 23.88 8.56 1.02 100.00 2.0Sporadic rain 41.44 31.15 20.56 5.93 0.92 100.00 1.9Soil erosion 32.39 27.56 30.33 9.72 0.00 100.00 2.2Landslide 37.24 19.76 34.48 8.27 0.25 100.00 2.1Snowstorm 48.73 46.44 4.84 0.00 0.00 100.00 1.6Heat wave 21.09 56.97 21.06 0.88 0.00 100.00 2.0Cold wave 17.26 51.46 22.11 4.42 4.75 100.00 2.3Disease/insect 16.09 33.25 27.85 18.10 4.71 100.00 2.6
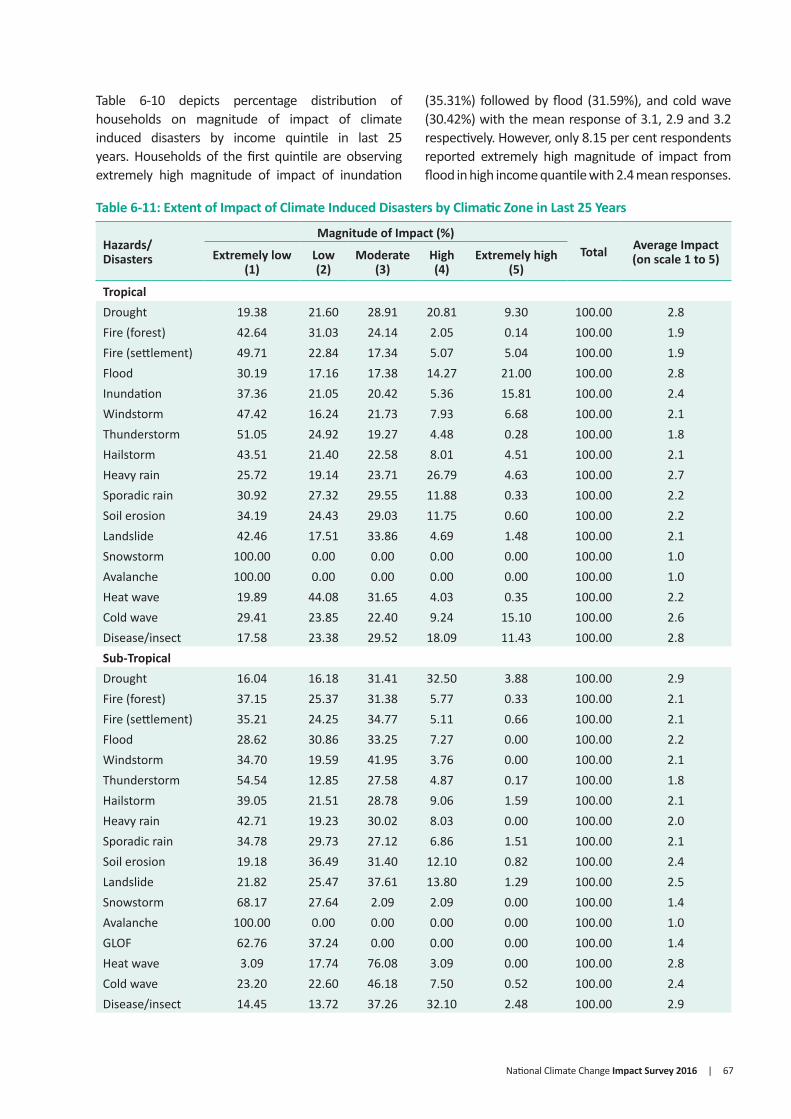
National Climate Change Impact Survey 2016 | 67
Table 6-10 depicts percentage distribution of households on magnitude of impact of climate induced disasters by income quintile in last 25 years. Households of the first quintile are observing extremely high magnitude of impact of inundation
(35.31%) followed by flood (31.59%), and cold wave (30.42%) with the mean response of 3.1, 2.9 and 3.2 respectively. However, only 8.15 per cent respondents reported extremely high magnitude of impact from flood in high income quantile with 2.4 mean responses.
Table 6-11: Extent of Impact of Climate Induced Disasters by Climatic Zone in Last 25 Years
Hazards/ Disasters
Magnitude of Impact (%)Total Average Impact
(on scale 1 to 5)Extremely low(1)
Low(2)
Moderate(3)
High(4)
Extremely high(5)
TropicalDrought 19.38 21.60 28.91 20.81 9.30 100.00 2.8Fire (forest) 42.64 31.03 24.14 2.05 0.14 100.00 1.9Fire (settlement) 49.71 22.84 17.34 5.07 5.04 100.00 1.9Flood 30.19 17.16 17.38 14.27 21.00 100.00 2.8Inundation 37.36 21.05 20.42 5.36 15.81 100.00 2.4Windstorm 47.42 16.24 21.73 7.93 6.68 100.00 2.1Thunderstorm 51.05 24.92 19.27 4.48 0.28 100.00 1.8Hailstorm 43.51 21.40 22.58 8.01 4.51 100.00 2.1Heavy rain 25.72 19.14 23.71 26.79 4.63 100.00 2.7Sporadic rain 30.92 27.32 29.55 11.88 0.33 100.00 2.2Soil erosion 34.19 24.43 29.03 11.75 0.60 100.00 2.2Landslide 42.46 17.51 33.86 4.69 1.48 100.00 2.1Snowstorm 100.00 0.00 0.00 0.00 0.00 100.00 1.0Avalanche 100.00 0.00 0.00 0.00 0.00 100.00 1.0Heat wave 19.89 44.08 31.65 4.03 0.35 100.00 2.2Cold wave 29.41 23.85 22.40 9.24 15.10 100.00 2.6Disease/insect 17.58 23.38 29.52 18.09 11.43 100.00 2.8Sub-TropicalDrought 16.04 16.18 31.41 32.50 3.88 100.00 2.9Fire (forest) 37.15 25.37 31.38 5.77 0.33 100.00 2.1Fire (settlement) 35.21 24.25 34.77 5.11 0.66 100.00 2.1Flood 28.62 30.86 33.25 7.27 0.00 100.00 2.2Windstorm 34.70 19.59 41.95 3.76 0.00 100.00 2.1Thunderstorm 54.54 12.85 27.58 4.87 0.17 100.00 1.8Hailstorm 39.05 21.51 28.78 9.06 1.59 100.00 2.1Heavy rain 42.71 19.23 30.02 8.03 0.00 100.00 2.0Sporadic rain 34.78 29.73 27.12 6.86 1.51 100.00 2.1Soil erosion 19.18 36.49 31.40 12.10 0.82 100.00 2.4Landslide 21.82 25.47 37.61 13.80 1.29 100.00 2.5Snowstorm 68.17 27.64 2.09 2.09 0.00 100.00 1.4Avalanche 100.00 0.00 0.00 0.00 0.00 100.00 1.0GLOF 62.76 37.24 0.00 0.00 0.00 100.00 1.4Heat wave 3.09 17.74 76.08 3.09 0.00 100.00 2.8Cold wave 23.20 22.60 46.18 7.50 0.52 100.00 2.4Disease/insect 14.45 13.72 37.26 32.10 2.48 100.00 2.9
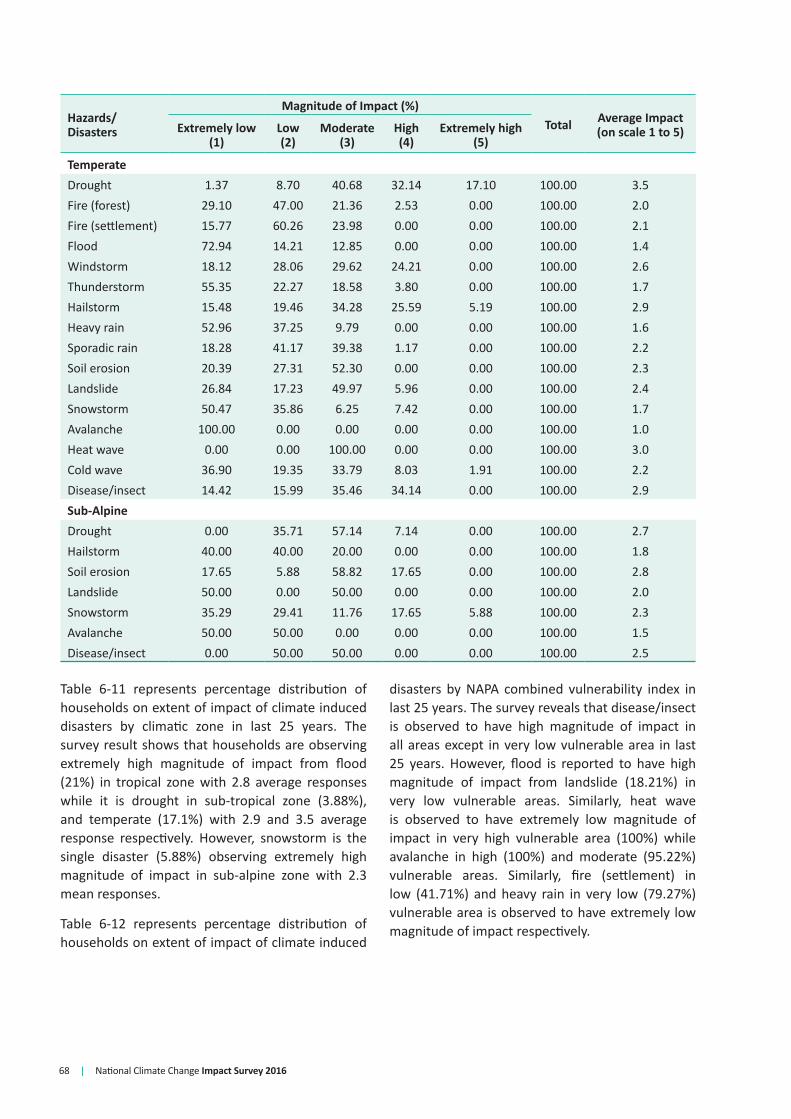
68 | National Climate Change Impact Survey 2016
Table 6-11 represents percentage distribution of households on extent of impact of climate induced disasters by climatic zone in last 25 years. The survey result shows that households are observing extremely high magnitude of impact from flood (21%) in tropical zone with 2.8 average responses while it is drought in sub-tropical zone (3.88%), and temperate (17.1%) with 2.9 and 3.5 average response respectively. However, snowstorm is the single disaster (5.88%) observing extremely high magnitude of impact in sub-alpine zone with 2.3 mean responses.
Table 6-12 represents percentage distribution of households on extent of impact of climate induced
disasters by NAPA combined vulnerability index in last 25 years. The survey reveals that disease/insect is observed to have high magnitude of impact in all areas except in very low vulnerable area in last 25 years. However, flood is reported to have high magnitude of impact from landslide (18.21%) in very low vulnerable areas. Similarly, heat wave is observed to have extremely low magnitude of impact in very high vulnerable area (100%) while avalanche in high (100%) and moderate (95.22%) vulnerable areas. Similarly, fire (settlement) in low (41.71%) and heavy rain in very low (79.27%) vulnerable area is observed to have extremely low magnitude of impact respectively.
Hazards/ Disasters
Magnitude of Impact (%)Total Average Impact
(on scale 1 to 5)Extremely low(1)
Low(2)
Moderate(3)
High(4)
Extremely high(5)
TemperateDrought 1.37 8.70 40.68 32.14 17.10 100.00 3.5Fire (forest) 29.10 47.00 21.36 2.53 0.00 100.00 2.0Fire (settlement) 15.77 60.26 23.98 0.00 0.00 100.00 2.1Flood 72.94 14.21 12.85 0.00 0.00 100.00 1.4Windstorm 18.12 28.06 29.62 24.21 0.00 100.00 2.6Thunderstorm 55.35 22.27 18.58 3.80 0.00 100.00 1.7Hailstorm 15.48 19.46 34.28 25.59 5.19 100.00 2.9Heavy rain 52.96 37.25 9.79 0.00 0.00 100.00 1.6Sporadic rain 18.28 41.17 39.38 1.17 0.00 100.00 2.2Soil erosion 20.39 27.31 52.30 0.00 0.00 100.00 2.3Landslide 26.84 17.23 49.97 5.96 0.00 100.00 2.4Snowstorm 50.47 35.86 6.25 7.42 0.00 100.00 1.7Avalanche 100.00 0.00 0.00 0.00 0.00 100.00 1.0Heat wave 0.00 0.00 100.00 0.00 0.00 100.00 3.0Cold wave 36.90 19.35 33.79 8.03 1.91 100.00 2.2Disease/insect 14.42 15.99 35.46 34.14 0.00 100.00 2.9Sub-AlpineDrought 0.00 35.71 57.14 7.14 0.00 100.00 2.7Hailstorm 40.00 40.00 20.00 0.00 0.00 100.00 1.8Soil erosion 17.65 5.88 58.82 17.65 0.00 100.00 2.8Landslide 50.00 0.00 50.00 0.00 0.00 100.00 2.0Snowstorm 35.29 29.41 11.76 17.65 5.88 100.00 2.3Avalanche 50.00 50.00 0.00 0.00 0.00 100.00 1.5Disease/insect 0.00 50.00 50.00 0.00 0.00 100.00 2.5
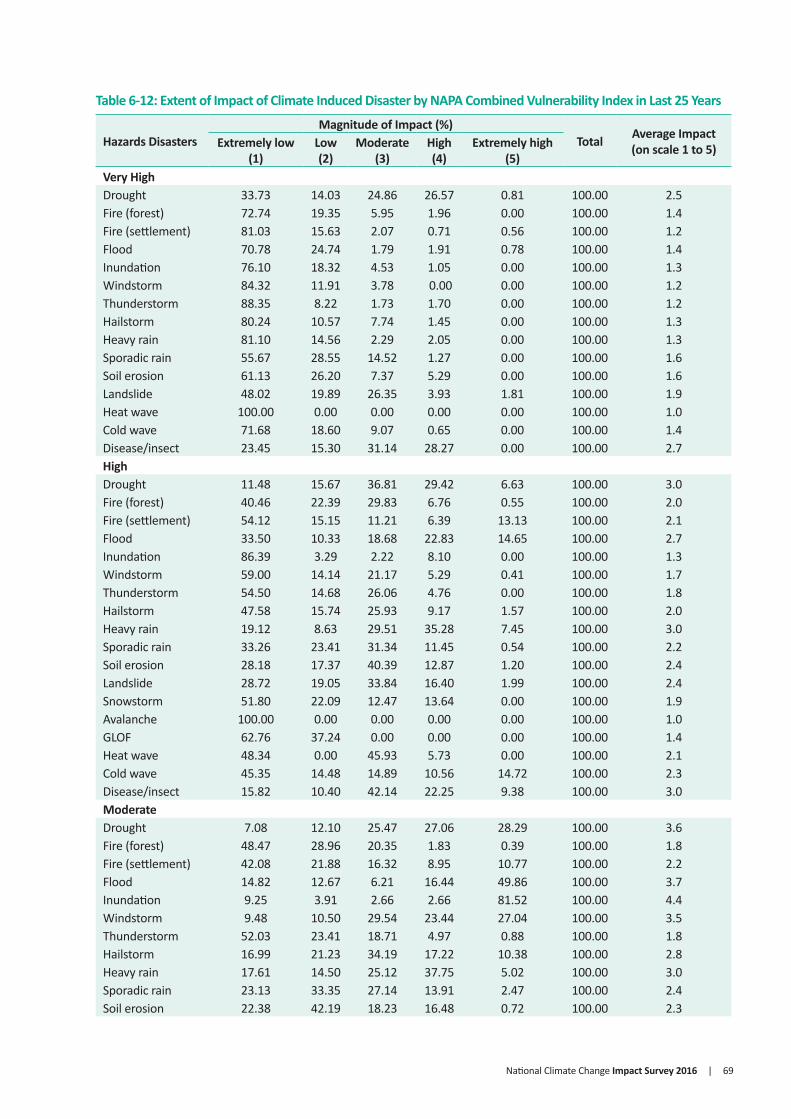
National Climate Change Impact Survey 2016 | 69
Table 6-12: Extent of Impact of Climate Induced Disaster by NAPA Combined Vulnerability Index in Last 25 Years
Hazards DisastersMagnitude of Impact (%)
Total Average Impact(on scale 1 to 5)Extremely low
(1)Low(2)
Moderate(3)
High(4)
Extremely high(5)
Very HighDrought 33.73 14.03 24.86 26.57 0.81 100.00 2.5Fire (forest) 72.74 19.35 5.95 1.96 0.00 100.00 1.4Fire (settlement) 81.03 15.63 2.07 0.71 0.56 100.00 1.2Flood 70.78 24.74 1.79 1.91 0.78 100.00 1.4Inundation 76.10 18.32 4.53 1.05 0.00 100.00 1.3Windstorm 84.32 11.91 3.78 0.00 0.00 100.00 1.2Thunderstorm 88.35 8.22 1.73 1.70 0.00 100.00 1.2Hailstorm 80.24 10.57 7.74 1.45 0.00 100.00 1.3Heavy rain 81.10 14.56 2.29 2.05 0.00 100.00 1.3Sporadic rain 55.67 28.55 14.52 1.27 0.00 100.00 1.6Soil erosion 61.13 26.20 7.37 5.29 0.00 100.00 1.6Landslide 48.02 19.89 26.35 3.93 1.81 100.00 1.9Heat wave 100.00 0.00 0.00 0.00 0.00 100.00 1.0Cold wave 71.68 18.60 9.07 0.65 0.00 100.00 1.4Disease/insect 23.45 15.30 31.14 28.27 0.00 100.00 2.7HighDrought 11.48 15.67 36.81 29.42 6.63 100.00 3.0Fire (forest) 40.46 22.39 29.83 6.76 0.55 100.00 2.0Fire (settlement) 54.12 15.15 11.21 6.39 13.13 100.00 2.1Flood 33.50 10.33 18.68 22.83 14.65 100.00 2.7Inundation 86.39 3.29 2.22 8.10 0.00 100.00 1.3Windstorm 59.00 14.14 21.17 5.29 0.41 100.00 1.7Thunderstorm 54.50 14.68 26.06 4.76 0.00 100.00 1.8Hailstorm 47.58 15.74 25.93 9.17 1.57 100.00 2.0Heavy rain 19.12 8.63 29.51 35.28 7.45 100.00 3.0Sporadic rain 33.26 23.41 31.34 11.45 0.54 100.00 2.2Soil erosion 28.18 17.37 40.39 12.87 1.20 100.00 2.4Landslide 28.72 19.05 33.84 16.40 1.99 100.00 2.4Snowstorm 51.80 22.09 12.47 13.64 0.00 100.00 1.9Avalanche 100.00 0.00 0.00 0.00 0.00 100.00 1.0GLOF 62.76 37.24 0.00 0.00 0.00 100.00 1.4Heat wave 48.34 0.00 45.93 5.73 0.00 100.00 2.1Cold wave 45.35 14.48 14.89 10.56 14.72 100.00 2.3Disease/insect 15.82 10.40 42.14 22.25 9.38 100.00 3.0ModerateDrought 7.08 12.10 25.47 27.06 28.29 100.00 3.6Fire (forest) 48.47 28.96 20.35 1.83 0.39 100.00 1.8Fire (settlement) 42.08 21.88 16.32 8.95 10.77 100.00 2.2Flood 14.82 12.67 6.21 16.44 49.86 100.00 3.7Inundation 9.25 3.91 2.66 2.66 81.52 100.00 4.4Windstorm 9.48 10.50 29.54 23.44 27.04 100.00 3.5Thunderstorm 52.03 23.41 18.71 4.97 0.88 100.00 1.8Hailstorm 16.99 21.23 34.19 17.22 10.38 100.00 2.8Heavy rain 17.61 14.50 25.12 37.75 5.02 100.00 3.0Sporadic rain 23.13 33.35 27.14 13.91 2.47 100.00 2.4Soil erosion 22.38 42.19 18.23 16.48 0.72 100.00 2.3
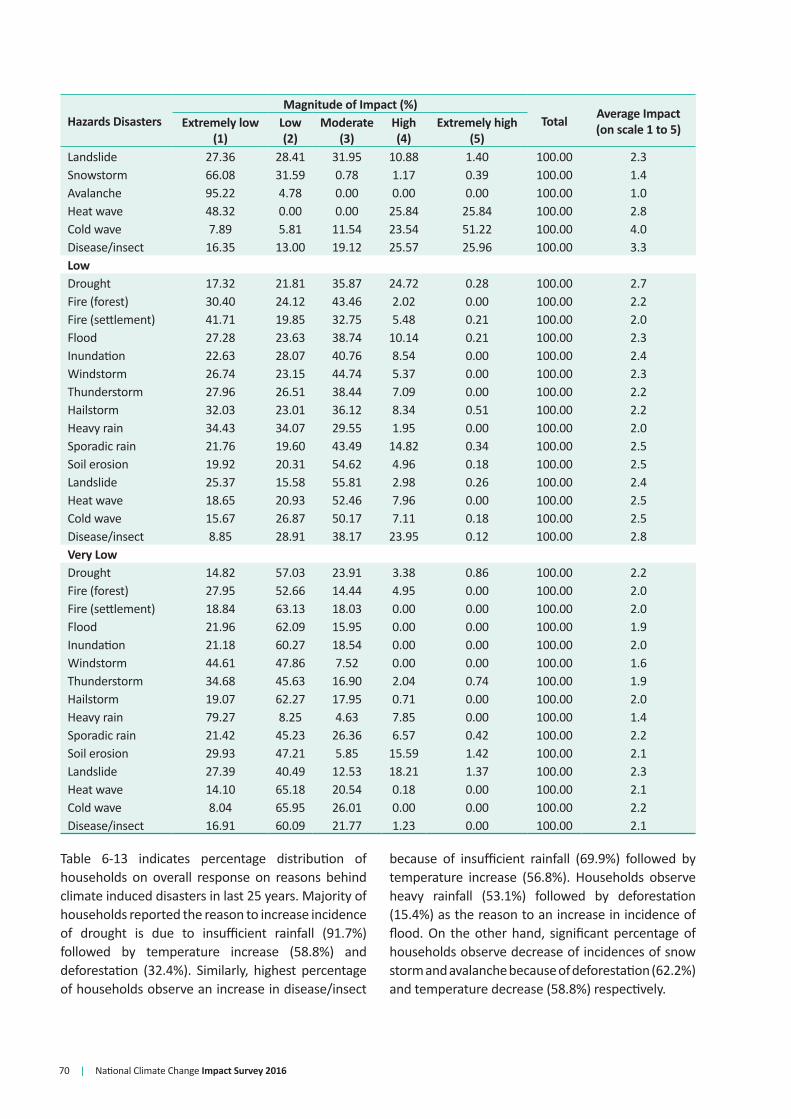
70 | National Climate Change Impact Survey 2016
Hazards DisastersMagnitude of Impact (%)
Total Average Impact(on scale 1 to 5)Extremely low
(1)Low(2)
Moderate(3)
High(4)
Extremely high(5)
Landslide 27.36 28.41 31.95 10.88 1.40 100.00 2.3Snowstorm 66.08 31.59 0.78 1.17 0.39 100.00 1.4Avalanche 95.22 4.78 0.00 0.00 0.00 100.00 1.0Heat wave 48.32 0.00 0.00 25.84 25.84 100.00 2.8Cold wave 7.89 5.81 11.54 23.54 51.22 100.00 4.0Disease/insect 16.35 13.00 19.12 25.57 25.96 100.00 3.3LowDrought 17.32 21.81 35.87 24.72 0.28 100.00 2.7Fire (forest) 30.40 24.12 43.46 2.02 0.00 100.00 2.2Fire (settlement) 41.71 19.85 32.75 5.48 0.21 100.00 2.0Flood 27.28 23.63 38.74 10.14 0.21 100.00 2.3Inundation 22.63 28.07 40.76 8.54 0.00 100.00 2.4Windstorm 26.74 23.15 44.74 5.37 0.00 100.00 2.3Thunderstorm 27.96 26.51 38.44 7.09 0.00 100.00 2.2Hailstorm 32.03 23.01 36.12 8.34 0.51 100.00 2.2Heavy rain 34.43 34.07 29.55 1.95 0.00 100.00 2.0Sporadic rain 21.76 19.60 43.49 14.82 0.34 100.00 2.5Soil erosion 19.92 20.31 54.62 4.96 0.18 100.00 2.5Landslide 25.37 15.58 55.81 2.98 0.26 100.00 2.4Heat wave 18.65 20.93 52.46 7.96 0.00 100.00 2.5Cold wave 15.67 26.87 50.17 7.11 0.18 100.00 2.5Disease/insect 8.85 28.91 38.17 23.95 0.12 100.00 2.8Very LowDrought 14.82 57.03 23.91 3.38 0.86 100.00 2.2Fire (forest) 27.95 52.66 14.44 4.95 0.00 100.00 2.0Fire (settlement) 18.84 63.13 18.03 0.00 0.00 100.00 2.0Flood 21.96 62.09 15.95 0.00 0.00 100.00 1.9Inundation 21.18 60.27 18.54 0.00 0.00 100.00 2.0Windstorm 44.61 47.86 7.52 0.00 0.00 100.00 1.6Thunderstorm 34.68 45.63 16.90 2.04 0.74 100.00 1.9Hailstorm 19.07 62.27 17.95 0.71 0.00 100.00 2.0Heavy rain 79.27 8.25 4.63 7.85 0.00 100.00 1.4Sporadic rain 21.42 45.23 26.36 6.57 0.42 100.00 2.2Soil erosion 29.93 47.21 5.85 15.59 1.42 100.00 2.1Landslide 27.39 40.49 12.53 18.21 1.37 100.00 2.3Heat wave 14.10 65.18 20.54 0.18 0.00 100.00 2.1Cold wave 8.04 65.95 26.01 0.00 0.00 100.00 2.2Disease/insect 16.91 60.09 21.77 1.23 0.00 100.00 2.1
Table 6-13 indicates percentage distribution of households on overall response on reasons behind climate induced disasters in last 25 years. Majority of households reported the reason to increase incidence of drought is due to insufficient rainfall (91.7%) followed by temperature increase (58.8%) and deforestation (32.4%). Similarly, highest percentage of households observe an increase in disease/insect
because of insufficient rainfall (69.9%) followed by temperature increase (56.8%). Households observe heavy rainfall (53.1%) followed by deforestation (15.4%) as the reason to an increase in incidence of flood. On the other hand, significant percentage of households observe decrease of incidences of snow storm and avalanche because of deforestation (62.2%) and temperature decrease (58.8%) respectively.
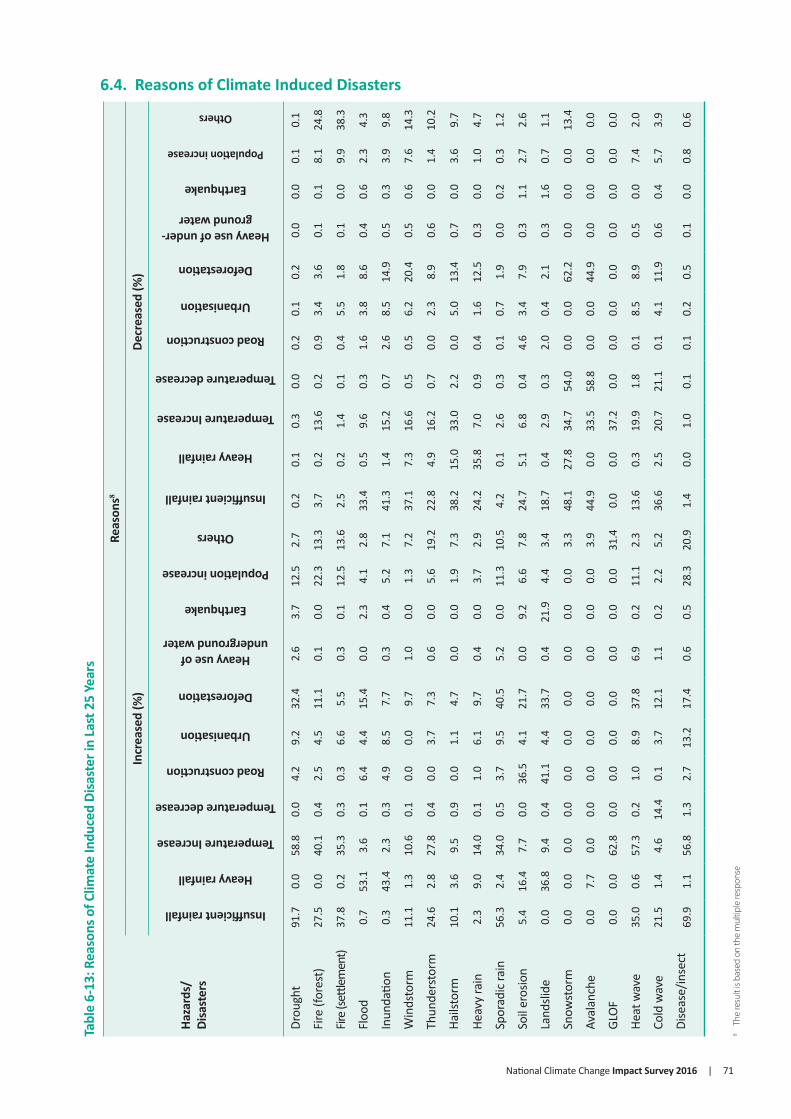
National Climate Change Impact Survey 2016 | 71
6.4. Reasons of Climate Induced DisastersTa
ble
6-13
: Rea
sons
of C
limat
e In
duce
d Di
sast
er in
Last
25
Year
s
Haza
rds/
Di
sast
ers
Reas
ons8
Incr
ease
d (%
)De
crea
sed
(%)
Insufficient rainfall
Heavy rainfall
Temperature Increase
Temperature decrease
Road construction
Urbanisation
Deforestation
Heavy use of underground water
Earthquake
Population increase
Others
Insufficient rainfall
Heavy rainfall
Temperature Increase
Temperature decrease
Road construction
Urbanisation
Deforestation
Heavy use of under-ground water
Earthquake
Population increase
Others
Drou
ght
91.7
0.0
58.8
0.0
4.2
9.2
32.4
2.6
3.7
12.5
2.7
0.2
0.1
0.3
0.0
0.2
0.1
0.2
0.0
0.0
0.1
0.1
Fire
(for
est)
27.5
0.0
40.1
0.4
2.5
4.5
11.1
0.1
0.0
22.3
13.3
3.7
0.2
13.6
0.2
0.9
3.4
3.6
0.1
0.1
8.1
24.8
Fire (
settl
emen
t)37
.80.
235
.30.
30.
36.
65.
50.
30.
112
.513
.62.
50.
21.
40.
10.
45.
51.
80.
10.
09.
938
.3
Floo
d0.
753
.13.
60.
16.
44.
415
.40.
02.
34.
12.
833
.40.
59.
60.
31.
63.
88.
60.
40.
62.
34.
3
Inun
datio
n0.
343
.42.
30.
34.
98.
57.
70.
30.
45.
27.
141
.31.
415
.20.
72.
68.
514
.90.
50.
33.
99.
8
Win
dsto
rm11
.11.
310
.60.
10.
00.
09.
71.
00.
01.
37.
237
.17.
316
.60.
50.
56.
220
.40.
50.
67.
614
.3
Thun
ders
torm
24.6
2.8
27.8
0.4
0.0
3.7
7.3
0.6
0.0
5.6
19.2
22.8
4.9
16.2
0.7
0.0
2.3
8.9
0.6
0.0
1.4
10.2
Hails
torm
10.1
3.6
9.5
0.9
0.0
1.1
4.7
0.0
0.0
1.9
7.3
38.2
15.0
33.0
2.2
0.0
5.0
13.4
0.7
0.0
3.6
9.7
Heav
y ra
in2.
39.
014
.00.
11.
06.
19.
70.
40.
03.
72.
924
.235
.87.
00.
90.
41.
612
.50.
30.
01.
04.
7
Spor
adic
rain
56.3
2.4
34.0
0.5
3.7
9.5
40.5
5.2
0.0
11.3
10.5
4.2
0.1
2.6
0.3
0.1
0.7
1.9
0.0
0.2
0.3
1.2
Soil
eros
ion
5.4
16.4
7.7
0.0
36.5
4.1
21.7
0.0
9.2
6.6
7.8
24.7
5.1
6.8
0.4
4.6
3.4
7.9
0.3
1.1
2.7
2.6
Land
slide
0.0
36.8
9.4
0.4
41.1
4.4
33.7
0.4
21.9
4.4
3.4
18.7
0.4
2.9
0.3
2.0
0.4
2.1
0.3
1.6
0.7
1.1
Snow
stor
m0.
00.
00.
00.
00.
00.
00.
00.
00.
00.
03.
348
.127
.834
.754
.00.
00.
062
.20.
00.
00.
013
.4
Aval
anch
e0.
07.
70.
00.
00.
00.
00.
00.
00.
00.
03.
944
.90.
033
.558
.80.
00.
044
.90.
00.
00.
00.
0
GLO
F0.
00.
062
.80.
00.
00.
00.
00.
00.
00.
031
.40.
00.
037
.20.
00.
00.
00.
00.
00.
00.
00.
0
Heat
wav
e35
.00.
657
.30.
21.
08.
937
.86.
90.
211
.12.
313
.60.
319
.91.
80.
18.
58.
90.
50.
07.
42.
0
Cold
wav
e21
.51.
44.
614
.40.
13.
712
.11.
10.
22.
25.
236
.62.
520
.721
.10.
14.
111
.90.
60.
45.
73.
9
Dise
ase/
inse
ct69
.91.
156
.81.
32.
713
.217
.40.
60.
528
.320
.91.
40.
01.
00.
10.
10.
20.
50.
10.
00.
80.
6
8 Th
e re
sult
is ba
sed
on th
e m
ultip
le re
spon
se

72 | National Climate Change Impact Survey 2016
Tabl
e 6-
14: R
easo
ns o
f Clim
ate
Indu
ced
Disa
ster
by
Eco-
Deve
lopm
ent R
egio
ns
Disa
ster
s
Reas
ons9
Incr
ease
d (%
)De
crea
sed
(%)
Insufficient rainfall
Heavy rainfall
Temperature Increase
Temperature decrease
Road construction
Urbanisation
Deforestation
Heavy use of underground water
Earthquake
Population increase
Others
Insufficient rainfall
Heavy rainfall
Temperature Increase
Temperature decrease
Road construction
Urbanisation
Deforestation
Heavy use of underground water
Earthquake
Population increase
East
ern
Mou
ntai
nDr
ough
t97
.10.
056
.50.
06.
72.
33.
70.
07.
71.
93.
70.
00.
00.
00.
00.
00.
00.
00.
00.
00.
0Fi
re (f
ores
t)22
.30.
022
.30.
00.
00.
011
.20.
00.
033
.535
.10.
00.
00.
00.
00.
00.
00.
00.
00.
00.
0Fi
re (s
ettle
men
t)13
.70.
05.
00.
00.
046
.70.
00.
00.
078
.146
.10.
00.
00.
00.
00.
00.
00.
00.
00.
00.
0Fl
ood
0.0
97.1
22.2
2.9
38.7
16.4
3.7
0.0
7.7
5.8
4.5
0.0
0.0
0.0
0.0
0.0
0.0
0.0
0.0
0.0
0.0
Win
dsto
rm
0.0
30.0
60.0
0.0
0.0
0.0
0.0
0.0
0.0
0.0
20.0
0.0
0.0
0.0
0.0
0.0
0.0
0.0
0.0
0.0
0.0
Thun
ders
torm
63.7
21.1
9.1
0.0
0.0
0.9
0.0
1.7
0.0
0.0
20.8
3.6
3.4
0.0
0.0
0.0
0.0
0.0
0.0
0.0
0.0
Hails
torm
74.8
2.8
14.1
1.0
0.0
0.0
0.0
0.0
0.0
0.0
22.7
6.1
2.6
0.9
0.0
0.0
0.0
0.0
0.0
0.0
0.0
Heav
y ra
in0.
089
.94.
00.
01.
01.
60.
01.
00.
00.
018
.62.
56.
30.
00.
00.
00.
02.
50.
00.
00.
0Sp
orad
ic ra
in78
.65.
25.
20.
00.
00.
05.
20.
00.
00.
010
.49.
50.
05.
90.
05.
20.
00.
00.
00.
00.
0So
il er
osio
n3.
463
.310
.90.
060
.112
.99.
30.
016
.54.
10.
00.
00.
00.
00.
03.
10.
00.
00.
00.
00.
0La
ndsli
de0.
077
.810
.40.
846
.49.
62.
71.
347
.12.
50.
72.
51.
30.
00.
01.
30.
00.
00.
00.
00.
0Sn
owst
orm
0.0
0.0
0.0
0.0
0.0
0.0
0.0
0.0
0.0
0.0
0.0
14.7
0.0
57.9
0.0
0.0
0.0
0.0
0.0
0.0
0.0
Aval
anch
e0.
00.
00.
00.
00.
00.
00.
00.
00.
00.
00.
00.
00.
010
0.0.
00.
00.
00.
00.
00.
00.
0GL
OF
0.0
0.0
62.8
0.0
0.0
0.0
0.0
0.0
0.0
0.0
31.4
0.0
0.0
37.2
0.0
0.0
0.0
0.0
0.0
0.0
0.0
Cold
wav
e17
.80.
01.
61.
30.
00.
00.
00.
00.
00.
06.
736
.60.
055
.21.
60.
01.
00.
00.
00.
02.
0Di
seas
e/in
sect
29.7
1.9
62.2
0.0
0.0
6.5
8.3
0.0
0.0
21.2
21.3
1.1
0.0
1.1
0.0
0.0
0.0
0.0
0.0
0.0
0.0
East
ern
Hill
Drou
ght
95.7
0.0
61.9
0.0
5.5
16.7
25.3
1.0
5.3
14.7
3.1
0.0
0.3
0.3
0.0
0.0
0.0
0.0
0.0
0.0
0.0
Fire
(for
est)
26.8
0.0
51.2
0.0
3.2
13.0
9.7
0.0
0.0
19.1
17.6
0.9
0.0
5.0
0.0
0.9
3.5
3.3
0.0
0.0
13.3
Fire
(sett
lem
ent)
62.7
0.0
25.2
0.0
0.7
23.3
13.4
0.0
0.0
23.3
6.3
0.0
0.0
0.0
0.0
0.0
12.2
0.0
0.0
0.0
13.3
Floo
d0.
012
.00.
80.
018
.36.
612
.80.
03.
05.
50.
056
.92.
126
.41.
78.
914
.923
.00.
04.
112
.3
8 Th
e re
sult
is ba
sed
on th
e m
ultip
le re
spon
se

National Climate Change Impact Survey 2016 | 73
Disa
ster
s
Reas
ons9
Incr
ease
d (%
)De
crea
sed
(%)
Insufficient rainfall
Heavy rainfall
Temperature Increase
Temperature decrease
Road construction
Urbanisation
Deforestation
Heavy use of underground water
Earthquake
Population increase
Others
Insufficient rainfall
Heavy rainfall
Temperature Increase
Temperature decrease
Road construction
Urbanisation
Deforestation
Heavy use of underground water
Earthquake
Population increase
Win
dsto
rm
21.4
0.5
15.6
0.0
0.0
0.0
6.2
0.5
0.0
2.7
1.9
53.9
0.7
40.5
0.6
0.0
11.9
20.5
0.0
0.0
13.6
Thun
ders
torm
45.2
0.6
56.0
0.0
0.0
11.6
18.6
0.0
0.0
20.6
7.2
18.1
0.7
12.3
0.7
0.0
7.3
4.7
0.0
0.0
2.9
Hails
torm
19.9
0.5
3.8
0.5
0.0
1.5
1.5
0.0
0.0
0.5
4.4
57.4
1.1
41.9
1.8
0.0
18.0
22.5
0.7
0.0
15.8
Heav
y ra
in18
.52.
636
.50.
00.
043
.527
.41.
30.
016
.90.
033
.60.
024
.80.
01.
09.
712
.91.
80.
03.
6Sp
orad
ic ra
in66
.53.
948
.50.
81.
522
.637
.41.
50.
019
.20.
00.
70.
00.
60.
00.
00.
00.
00.
00.
00.
6So
il er
osio
n1.
12.
02.
40.
016
.22.
24.
80.
05.
77.
62.
345
.20.
033
.61.
520
.823
.033
.50.
05.
916
.6La
ndsli
de0.
013
.810
.10.
034
.86.
923
.80.
027
.88.
80.
041
.40.
06.
60.
08.
10.
79.
40.
66.
63.
3He
at w
ave
0.0
0.0
0.0
0.0
0.0
0.0
0.0
0.0
0.0
0.0
0.0
77.7
3.4
50.2
0.0
0.0
17.4
31.9
0.0
0.0
42.5
Cold
wav
e3.
80.
00.
90.
00.
01.
61.
60.
00.
00.
00.
046
.11.
162
.40.
00.
033
.437
.10.
00.
921
.3Di
seas
e/in
sect
68.8
0.7
57.0
0.7
3.0
30.1
15.8
0.3
0.0
31.9
17.3
1.1
0.0
0.7
0.4
0.0
0.0
0.7
0.3
0.0
0.0
East
ern
Tera
i
Drou
ght
92.8
0.0
60.1
0.0
0.7
7.6
32.2
2.5
0.2
12.4
1.7
0.0
0.0
0.1
0.0
0.0
0.1
0.0
0.0
0.0
0.1
Fire
(for
est)
19.2
0.0
52.9
0.0
0.0
13.5
7.1
0.0
0.0
37.8
10.7
4.6
0.9
21.6
1.1
0.9
15.0
13.9
0.0
0.0
15.7
Fire
(sett
lem
ent)
43.8
0.6
36.4
0.6
0.0
6.6
4.4
0.4
0.0
6.0
9.3
1.1
0.4
1.2
0.2
0.6
11.0
1.3
0.2
0.0
11.3
Floo
d0.
033
.52.
70.
06.
04.
914
.00.
00.
06.
91.
951
.00.
314
.00.
80.
88.
710
.91.
10.
04.
3In
unda
tion
0.0
24.0
1.3
0.4
1.9
9.5
3.2
0.0
0.6
6.1
6.6
58.2
2.3
22.6
1.4
2.4
17.2
16.2
1.0
0.6
6.6
Win
dsto
rm
5.2
0.0
5.6
0.0
0.0
0.0
6.4
2.5
0.0
0.2
2.8
42.6
0.3
18.6
0.8
0.5
11.6
30.3
1.3
1.4
13.4
Thun
ders
torm
16.0
1.4
22.0
0.4
0.0
5.4
4.7
1.3
0.0
4.3
22.4
41.9
0.0
10.2
0.9
0.0
2.1
12.2
0.5
0.0
1.9
Hails
torm
3.8
0.0
3.1
0.0
0.0
0.0
1.1
0.0
0.0
0.5
0.7
68.0
5.2
21.1
5.6
0.0
10.7
23.3
1.0
0.0
6.7
Heav
y ra
in2.
66.
912
.10.
00.
09.
610
.40.
80.
05.
32.
221
.438
.51.
90.
00.
02.
412
.30.
90.
01.
4Sp
orad
ic ra
in77
.90.
327
.51.
80.
510
.839
.80.
50.
06.
09.
22.
40.
01.
30.
00.
00.
81.
30.
00.
00.
0
Soil
eros
ion
8.8
1.8
7.7
0.0
5.9
7.0
15.1
0.0
1.3
12.6
18.9
34.8
7.6
11.6
0.0
4.0
7.7
18.7
0.0
3.5
3.2
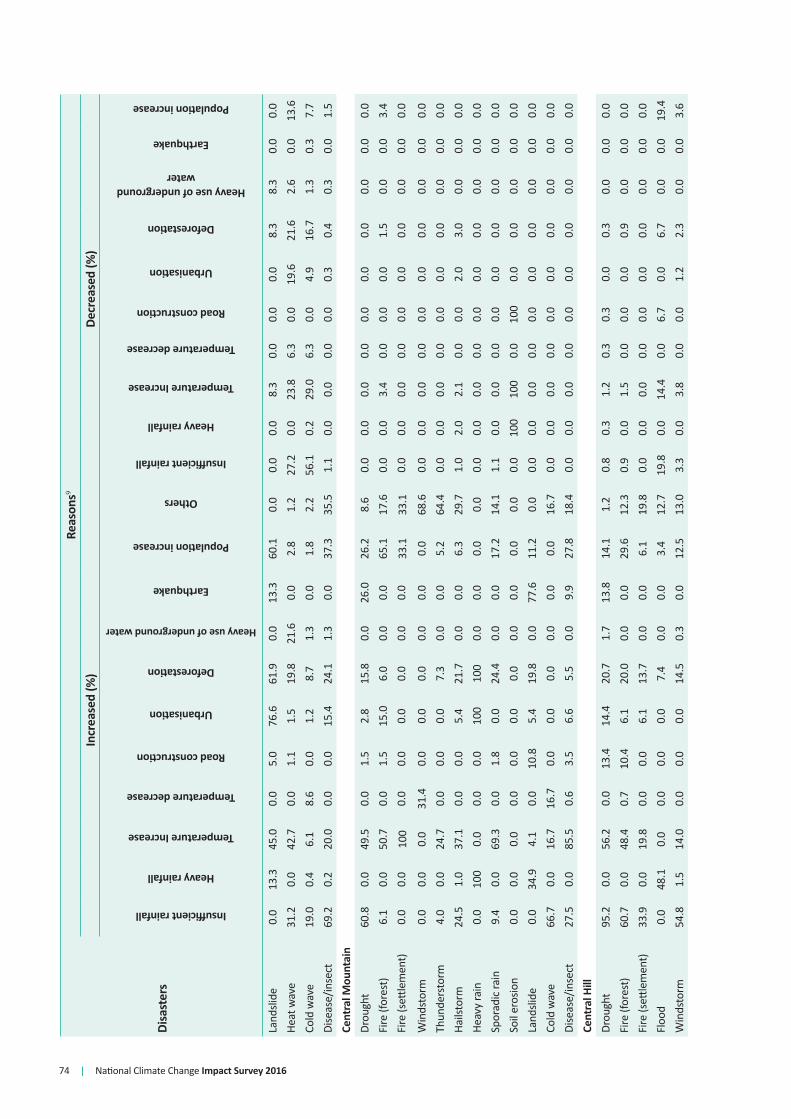
74 | National Climate Change Impact Survey 2016
Disa
ster
s
Reas
ons9
Incr
ease
d (%
)De
crea
sed
(%)
Insufficient rainfall
Heavy rainfall
Temperature Increase
Temperature decrease
Road construction
Urbanisation
Deforestation
Heavy use of underground water
Earthquake
Population increase
Others
Insufficient rainfall
Heavy rainfall
Temperature Increase
Temperature decrease
Road construction
Urbanisation
Deforestation
Heavy use of underground water
Earthquake
Population increase
Land
slide
0.0
13.3
45.0
0.0
5.0
76.6
61.9
0.0
13.3
60.1
0.0
0.0
0.0
8.3
0.0
0.0
0.0
8.3
8.3
0.0
0.0
Heat
wav
e31
.20.
042
.70.
01.
11.
519
.821
.60.
02.
81.
227
.20.
023
.86.
30.
019
.621
.62.
60.
013
.6Co
ld w
ave
19.0
0.4
6.1
8.6
0.0
1.2
8.7
1.3
0.0
1.8
2.2
56.1
0.2
29.0
6.3
0.0
4.9
16.7
1.3
0.3
7.7
Dise
ase/
inse
ct69
.20.
220
.00.
00.
015
.424
.11.
30.
037
.335
.51.
10.
00.
00.
00.
00.
30.
40.
30.
01.
5Ce
ntra
l Mou
ntai
nDr
ough
t60
.80.
049
.50.
01.
52.
815
.80.
026
.026
.28.
60.
00.
00.
00.
00.
00.
00.
00.
00.
00.
0Fi
re (f
ores
t)6.
10.
050
.70.
01.
515
.06.
00.
00.
065
.117
.60.
00.
03.
40.
00.
00.
01.
50.
00.
03.
4Fi
re (s
ettle
men
t)0.
00.
010
00.
00.
00.
00.
00.
00.
033
.133
.10.
00.
00.
00.
00.
00.
00.
00.
00.
00.
0
Win
dsto
rm
0.0
0.0
0.0
31.4
0.0
0.0
0.0
0.0
0.0
0.0
68.6
0.0
0.0
0.0
0.0
0.0
0.0
0.0
0.0
0.0
0.0
Thun
ders
torm
4.0
0.0
24.7
0.0
0.0
0.0
7.3
0.0
0.0
5.2
64.4
0.0
0.0
0.0
0.0
0.0
0.0
0.0
0.0
0.0
0.0
Hails
torm
24.5
1.0
37.1
0.0
0.0
5.4
21.7
0.0
0.0
6.3
29.7
1.0
2.0
2.1
0.0
0.0
2.0
3.0
0.0
0.0
0.0
Heav
y ra
in0.
010
00.
00.
00.
010
010
00.
00.
00.
00.
00.
00.
00.
00.
00.
00.
00.
00.
00.
00.
0Sp
orad
ic ra
in9.
40.
069
.30.
01.
80.
024
.40.
00.
017
.214
.11.
10.
00.
00.
00.
00.
00.
00.
00.
00.
0So
il er
osio
n0.
00.
00.
00.
00.
00.
00.
00.
00.
00.
00.
00.
010
010
00.
010
00.
00.
00.
00.
00.
0La
ndsli
de0.
034
.94.
10.
010
.85.
419
.80.
077
.611
.20.
00.
00.
00.
00.
00.
00.
00.
00.
00.
00.
0Co
ld w
ave
66.7
0.0
16.7
16.7
0.0
0.0
0.0
0.0
0.0
0.0
16.7
0.0
0.0
0.0
0.0
0.0
0.0
0.0
0.0
0.0
0.0
Dise
ase/
inse
ct27
.50.
085
.50.
63.
56.
65.
50.
09.
927
.818
.40.
00.
00.
00.
00.
00.
00.
00.
00.
00.
0Ce
ntra
l Hill
Drou
ght
95.2
0.0
56.2
0.0
13.4
14.4
20.7
1.7
13.8
14.1
1.2
0.8
0.3
1.2
0.3
0.3
0.0
0.3
0.0
0.0
0.0
Fire
(for
est)
60.7
0.0
48.4
0.7
10.4
6.1
20.0
0.0
0.0
29.6
12.3
0.9
0.0
1.5
0.0
0.0
0.0
0.9
0.0
0.0
0.0
Fire
(sett
lem
ent)
33.9
0.0
19.8
0.0
0.0
6.1
13.7
0.0
0.0
6.1
19.8
0.0
0.0
0.0
0.0
0.0
0.0
0.0
0.0
0.0
0.0
Floo
d0.
048
.10.
00.
00.
00.
07.
40.
00.
03.
412
.719
.80.
014
.40.
06.
70.
06.
70.
00.
019
.4W
inds
torm
54
.81.
514
.00.
00.
00.
014
.50.
30.
012
.513
.03.
30.
03.
80.
00.
01.
22.
30.
00.
03.
6

National Climate Change Impact Survey 2016 | 75
Disa
ster
s
Reas
ons9
Incr
ease
d (%
)De
crea
sed
(%)
Insufficient rainfall
Heavy rainfall
Temperature Increase
Temperature decrease
Road construction
Urbanisation
Deforestation
Heavy use of underground water
Earthquake
Population increase
Others
Insufficient rainfall
Heavy rainfall
Temperature Increase
Temperature decrease
Road construction
Urbanisation
Deforestation
Heavy use of underground water
Earthquake
Population increase
Thun
ders
torm
66.2
1.2
54.9
1.3
0.0
4.6
7.9
0.0
0.0
9.7
11.0
1.6
0.3
2.8
0.0
0.0
1.8
0.2
0.7
0.0
0.3
Hails
torm
16.3
0.9
11.8
0.0
0.0
0.0
5.4
0.0
0.0
8.2
0.8
54.3
0.0
38.5
1.2
0.0
7.7
6.0
0.9
0.0
1.6
Heav
y ra
in0.
09.
56.
30.
00.
00.
00.
00.
00.
03.
10.
062
.522
.361
.50.
00.
07.
85.
70.
00.
00.
0Sp
orad
ic ra
in69
.00.
037
.00.
720
.28.
829
.21.
30.
025
.110
.20.
00.
00.
00.
00.
00.
40.
40.
00.
00.
0So
il er
osio
n0.
078
.20.
00.
00.
00.
00.
00.
00.
00.
00.
00.
07.
30.
00.
014
.50.
014
.50.
00.
00.
0La
ndsli
de0.
042
.30.
00.
036
.81.
810
.90.
08.
40.
010
.228
.80.
00.
00.
00.
50.
90.
00.
00.
00.
0
Cold
wav
e0.
00.
00.
00.
00.
00.
00.
00.
00.
00.
00.
00.
00.
00.
00.
00.
033
.310
033
.30.
00.
0Di
seas
e/in
sect
78.9
1.3
73.0
1.4
8.7
18.8
13.4
0.1
0.4
15.3
9.9
0.8
0.0
1.2
0.4
0.4
0.0
0.0
0.0
0.0
0.2
Cent
ral T
erai
Drou
ght
99.8
0.0
71.6
0.0
0.0
0.5
22.3
0.4
0.2
4.4
2.3
0.2
0.2
0.0
0.0
0.0
0.0
0.2
0.0
0.0
0.0
Fire
(for
est)
12.0
0.0
52.3
0.0
0.0
0.0
12.0
0.0
0.0
16.4
0.0
17.8
0.0
0.0
0.0
0.0
0.0
12.0
0.0
0.0
17.8
Fire
(sett
lem
ent)
38.9
0.0
28.9
0.0
0.0
0.0
4.1
0.0
0.0
6.3
21.1
1.2
0.0
0.0
0.0
0.0
0.0
0.0
0.0
0.0
9.3
Floo
d0.
476
.30.
00.
00.
00.
02.
30.
00.
00.
00.
622
.60.
46.
10.
00.
00.
07.
30.
00.
00.
0
Inun
datio
n0.
861
.60.
00.
00.
00.
00.
90.
00.
00.
03.
535
.80.
613
.40.
00.
00.
019
.60.
00.
00.
0W
inds
torm
1.
80.
00.
60.
00.
00.
01.
40.
00.
00.
00.
242
.630
.37.
10.
00.
02.
319
.70.
00.
05.
3Th
unde
rsto
rm12
.21.
38.
00.
00.
00.
06.
30.
00.
00.
01.
647
.030
.238
.40.
00.
00.
021
.20.
00.
00.
0Ha
ilsto
rm0.
91.
00.
60.
00.
00.
00.
50.
00.
00.
00.
538
.856
.042
.50.
40.
00.
013
.30.
00.
00.
2He
avy
rain
0.0
0.8
0.0
0.0
0.0
0.0
0.4
0.0
0.0
0.0
0.0
15.1
83.2
0.7
0.0
0.0
0.0
4.1
0.0
0.0
0.0
Spor
adic
rain
82.2
0.5
19.2
0.0
0.0
0.2
45.9
0.0
0.0
0.4
3.7
11.5
0.0
0.0
0.0
0.0
0.0
3.2
0.0
0.0
0.0
Heat
wav
e26
.70.
032
.00.
00.
00.
00.
00.
00.
026
.70.
022
.90.
047
.411
.50.
00.
00.
00.
00.
00.
0
Cold
wav
e17
.32.
73.
414
.10.
00.
03.
00.
00.
00.
51.
434
.86.
315
.839
.10.
00.
27.
30.
00.
03.
3Di
seas
e/in
sect
89.3
1.5
60.3
4.4
0.0
0.5
4.3
0.7
0.0
8.8
25.6
2.7
0.0
1.2
0.0
0.0
0.0
0.0
0.0
0.0
1.6
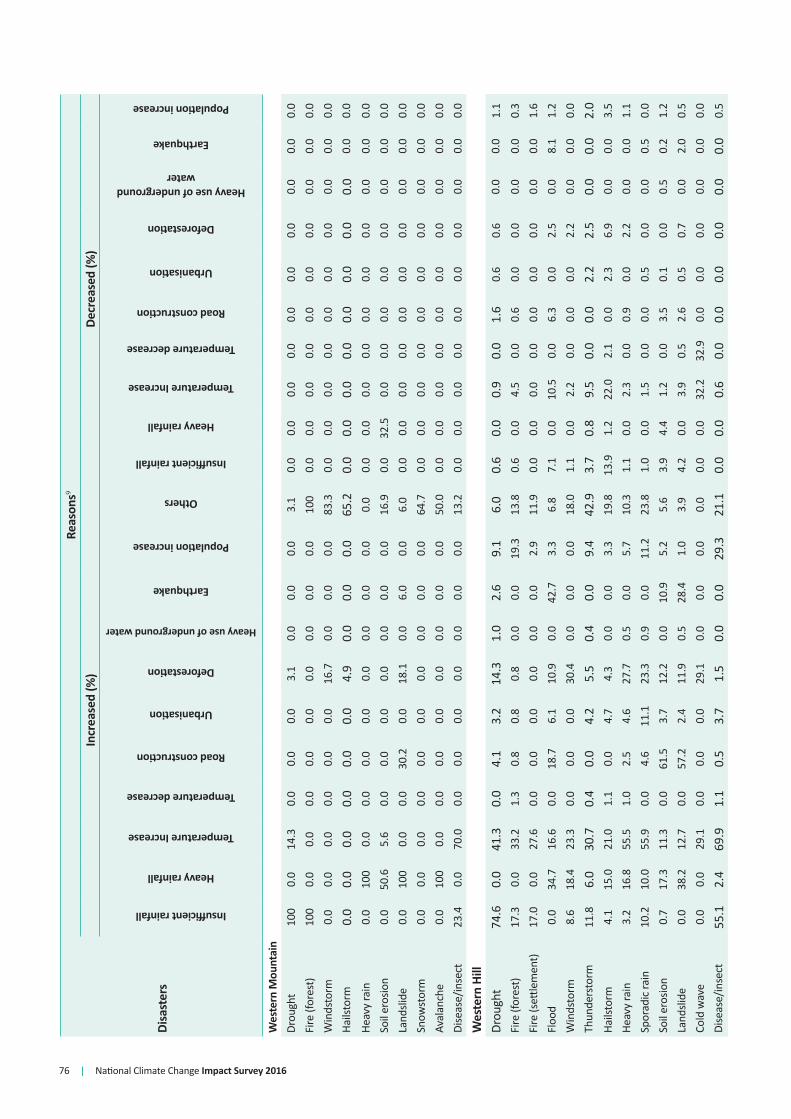
76 | National Climate Change Impact Survey 2016
Disa
ster
s
Reas
ons9
Incr
ease
d (%
)De
crea
sed
(%)
Insufficient rainfall
Heavy rainfall
Temperature Increase
Temperature decrease
Road construction
Urbanisation
Deforestation
Heavy use of underground water
Earthquake
Population increase
Others
Insufficient rainfall
Heavy rainfall
Temperature Increase
Temperature decrease
Road construction
Urbanisation
Deforestation
Heavy use of underground water
Earthquake
Population increase
Wes
tern
Mou
ntai
nDr
ough
t10
00.
014
.30.
00.
00.
03.
10.
00.
00.
03.
10.
00.
00.
00.
00.
00.
00.
00.
00.
00.
0Fi
re (f
ores
t)10
00.
00.
00.
00.
00.
00.
00.
00.
00.
010
00.
00.
00.
00.
00.
00.
00.
00.
00.
00.
0W
inds
torm
0.
00.
00.
00.
00.
00.
016
.70.
00.
00.
083
.30.
00.
00.
00.
00.
00.
00.
00.
00.
00.
0Ha
ilsto
rm0.
00.
00.
00.
00.
00.
04.
90.
00.
00.
065
.20.
00.
00.
00.
00.
00.
00.
00.
00.
00.
0
Heav
y ra
in0.
010
00.
00.
00.
00.
00.
00.
00.
00.
00.
00.
00.
00.
00.
00.
00.
00.
00.
00.
00.
0So
il er
osio
n0.
050
.65.
60.
00.
00.
00.
00.
00.
00.
016
.90.
032
.50.
00.
00.
00.
00.
00.
00.
00.
0La
ndsli
de0.
010
00.
00.
030
.20.
018
.10.
06.
00.
06.
00.
00.
00.
00.
00.
00.
00.
00.
00.
00.
0Sn
owst
orm
0.0
0.0
0.0
0.0
0.0
0.0
0.0
0.0
0.0
0.0
64.7
0.0
0.0
0.0
0.0
0.0
0.0
0.0
0.0
0.0
0.0
Aval
anch
e0.
010
00.
00.
00.
00.
00.
00.
00.
00.
050
.00.
00.
00.
00.
00.
00.
00.
00.
00.
00.
0Di
seas
e/in
sect
23.4
0.0
70.0
0.0
0.0
0.0
0.0
0.0
0.0
0.0
13.2
0.0
0.0
0.0
0.0
0.0
0.0
0.0
0.0
0.0
0.0
Wes
tern
Hill
Drou
ght
74.6
0.0
41.3
0.0
4.1
3.2
14.3
1.0
2.6
9.1
6.0
0.6
0.0
0.9
0.0
1.6
0.6
0.6
0.0
0.0
1.1
Fire
(for
est)
17.3
0.0
33.2
1.3
0.8
0.8
0.8
0.0
0.0
19.3
13.8
0.6
0.0
4.5
0.0
0.6
0.0
0.0
0.0
0.0
0.3
Fire
(sett
lem
ent)
17.0
0.0
27.6
0.0
0.0
0.0
0.0
0.0
0.0
2.9
11.9
0.0
0.0
0.0
0.0
0.0
0.0
0.0
0.0
0.0
1.6
Floo
d0.
034
.716
.60.
018
.76.
110
.90.
042
.73.
36.
87.
10.
010
.50.
06.
30.
02.
50.
08.
11.
2W
inds
torm
8.
618
.423
.30.
00.
00.
030
.40.
00.
00.
018
.01.
10.
02.
20.
00.
00.
02.
20.
00.
00.
0Th
unde
rsto
rm11
.86.
030
.70.
40.
04.
25.
50.
40.
09.
442
.93.
70.
89.
50.
00.
02.
22.
50.
00.
02.
0Ha
ilsto
rm4.
115
.021
.01.
10.
04.
74.
30.
00.
03.
319
.813
.91.
222
.02.
10.
02.
36.
90.
00.
03.
5He
avy
rain
3.2
16.8
55.5
1.0
2.5
4.6
27.7
0.5
0.0
5.7
10.3
1.1
0.0
2.3
0.0
0.9
0.0
2.2
0.0
0.0
1.1
Spor
adic
rain
10.2
10.0
55.9
0.0
4.6
11.1
23.3
0.9
0.0
11.2
23.8
1.0
0.0
1.5
0.0
0.0
0.5
0.0
0.0
0.5
0.0
Soil
eros
ion
0.7
17.3
11.3
0.0
61.5
3.7
12.2
0.0
10.9
5.2
5.6
3.9
4.4
1.2
0.0
3.5
0.1
0.0
0.5
0.2
1.2
Land
slide
0.0
38.2
12.7
0.0
57.2
2.4
11.9
0.5
28.4
1.0
3.9
4.2
0.0
3.9
0.5
2.6
0.5
0.7
0.0
2.0
0.5
Cold
wav
e0.
00.
029
.10.
00.
00.
029
.10.
00.
00.
00.
00.
00.
032
.232
.90.
00.
00.
00.
00.
00.
0Di
seas
e/in
sect
55.1
2.4
69.9
1.1
0.5
3.7
1.5
0.0
0.0
29.3
21.1
0.0
0.0
0.6
0.0
0.0
0.0
0.0
0.0
0.0
0.5
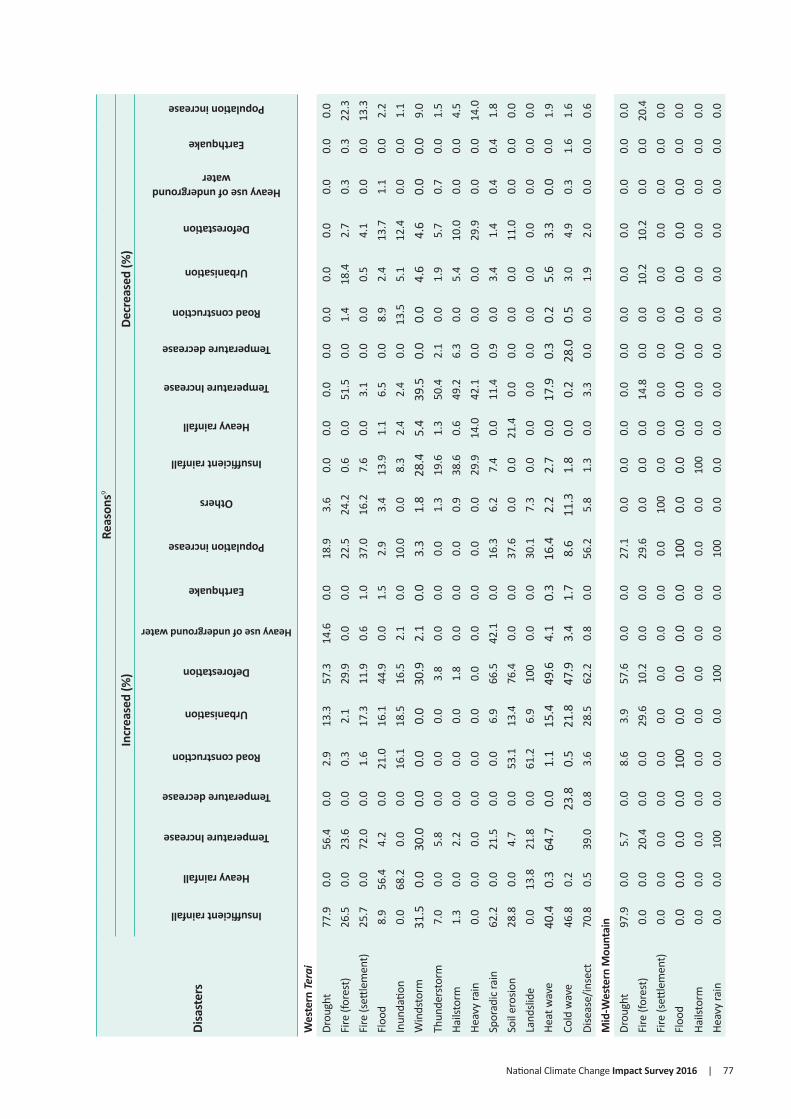
National Climate Change Impact Survey 2016 | 77
Disa
ster
s
Reas
ons9
Incr
ease
d (%
)De
crea
sed
(%)
Insufficient rainfall
Heavy rainfall
Temperature Increase
Temperature decrease
Road construction
Urbanisation
Deforestation
Heavy use of underground water
Earthquake
Population increase
Others
Insufficient rainfall
Heavy rainfall
Temperature Increase
Temperature decrease
Road construction
Urbanisation
Deforestation
Heavy use of underground water
Earthquake
Population increase
Wes
tern
Tera
i
Drou
ght
77.9
0.0
56.4
0.0
2.9
13.3
57.3
14.6
0.0
18.9
3.6
0.0
0.0
0.0
0.0
0.0
0.0
0.0
0.0
0.0
0.0
Fire
(for
est)
26.5
0.0
23.6
0.0
0.3
2.1
29.9
0.0
0.0
22.5
24.2
0.6
0.0
51.5
0.0
1.4
18.4
2.7
0.3
0.3
22.3
Fire
(sett
lem
ent)
25.7
0.0
72.0
0.0
1.6
17.3
11.9
0.6
1.0
37.0
16.2
7.6
0.0
3.1
0.0
0.0
0.5
4.1
0.0
0.0
13.3
Floo
d8.
956
.44.
20.
021
.016
.144
.90.
01.
52.
93.
413
.91.
16.
50.
08.
92.
413
.71.
10.
02.
2In
unda
tion
0.0
68.2
0.0
0.0
16.1
18.5
16.5
2.1
0.0
10.0
0.0
8.3
2.4
2.4
0.0
13.5
5.1
12.4
0.0
0.0
1.1
Win
dsto
rm
31.5
0.0
30.0
0.0
0.0
0.0
30.9
2.1
0.0
3.3
1.8
28.4
5.4
39.5
0.0
0.0
4.6
4.6
0.0
0.0
9.0
Thun
ders
torm
7.0
0.0
5.8
0.0
0.0
0.0
3.8
0.0
0.0
0.0
1.3
19.6
1.3
50.4
2.1
0.0
1.9
5.7
0.7
0.0
1.5
Hails
torm
1.3
0.0
2.2
0.0
0.0
0.0
1.8
0.0
0.0
0.0
0.9
38.6
0.6
49.2
6.3
0.0
5.4
10.0
0.0
0.0
4.5
Heav
y ra
in0.
00.
00.
00.
00.
00.
00.
00.
00.
00.
00.
029
.914
.042
.10.
00.
00.
029
.90.
00.
014
.0Sp
orad
ic ra
in62
.20.
021
.50.
00.
06.
966
.542
.10.
016
.36.
27.
40.
011
.40.
90.
03.
41.
40.
40.
41.
8So
il er
osio
n28
.80.
04.
70.
053
.113
.476
.40.
00.
037
.60.
00.
021
.40.
00.
00.
00.
011
.00.
00.
00.
0La
ndsli
de0.
013
.821
.80.
061
.26.
910
00.
00.
030
.17.
30.
00.
00.
00.
00.
00.
00.
00.
00.
00.
0He
at w
ave
40.4
0.3
64.7
0.0
1.1
15.4
49.6
4.1
0.3
16.4
2.2
2.7
0.0
17.9
0.3
0.2
5.6
3.3
0.0
0.0
1.9
Cold
wav
e46
.80.
223
.80.
521
.847
.93.
41.
78.
611
.31.
80.
00.
228
.00.
53.
04.
90.
31.
61.
6Di
seas
e/in
sect
70.8
0.5
39.0
0.8
3.6
28.5
62.2
0.8
0.0
56.2
5.8
1.3
0.0
3.3
0.0
0.0
1.9
2.0
0.0
0.0
0.6
Mid
-Wes
tern
Mou
ntai
nDr
ough
t97
.90.
05.
70.
08.
63.
957
.60.
00.
027
.10.
00.
00.
00.
00.
00.
00.
00.
00.
00.
00.
0Fi
re (f
ores
t)0.
00.
020
.40.
00.
029
.610
.20.
00.
029
.60.
00.
00.
014
.80.
00.
010
.210
.20.
00.
020
.4Fi
re (s
ettle
men
t)0.
00.
00.
00.
00.
00.
00.
00.
00.
00.
010
00.
00.
00.
00.
00.
00.
00.
00.
00.
00.
0Fl
ood
0.0
0.0
0.0
0.0
100
0.0
0.0
0.0
0.0
100
0.0
0.0
0.0
0.0
0.0
0.0
0.0
0.0
0.0
0.0
0.0
Hails
torm
0.0
0.0
0.0
0.0
0.0
0.0
0.0
0.0
0.0
0.0
0.0
100
0.0
0.0
0.0
0.0
0.0
0.0
0.0
0.0
0.0
Heav
y ra
in0.
00.
010
00.
00.
00.
010
00.
00.
010
00.
00.
00.
00.
00.
00.
00.
00.
00.
00.
00.
0

78 | National Climate Change Impact Survey 2016
Disa
ster
s
Reas
ons9
Incr
ease
d (%
)De
crea
sed
(%)
Insufficient rainfall
Heavy rainfall
Temperature Increase
Temperature decrease
Road construction
Urbanisation
Deforestation
Heavy use of underground water
Earthquake
Population increase
Others
Insufficient rainfall
Heavy rainfall
Temperature Increase
Temperature decrease
Road construction
Urbanisation
Deforestation
Heavy use of underground water
Earthquake
Population increase
Land
slide
0.0
50.4
0.0
0.0
12.7
0.0
62.3
0.0
0.0
25.0
0.0
0.0
0.0
0.0
0.0
0.0
0.0
0.0
0.0
0.0
0.0
Dise
ase/
inse
ct83
.80.
031
.30.
00.
07.
025
.20.
00.
021
.80.
00.
00.
02.
00.
00.
00.
02.
10.
00.
02.
9M
id-W
este
rn H
illDr
ough
t95
.20.
041
.60.
05.
04.
941
.30.
41.
38.
22.
90.
00.
40.
00.
00.
00.
00.
00.
00.
00.
0Fi
re (f
ores
t)18
.70.
011
.10.
00.
30.
07.
90.
00.
04.
38.
12.
00.
017
.30.
00.
61.
82.
10.
00.
05.
9Fi
re (s
ettle
men
t)10
.50.
021
.90.
00.
02.
61.
90.
00.
05.
310
.70.
00.
00.
00.
01.
90.
00.
00.
00.
00.
0Fl
ood
2.1
41.1
0.5
0.0
9.8
5.0
24.8
0.0
1.4
5.5
4.8
46.3
0.0
7.1
0.0
0.0
0.0
2.7
0.0
0.0
0.0
Win
dsto
rm
23.4
1.6
14.0
0.0
0.0
0.0
14.2
0.8
0.0
1.4
8.0
38.5
0.0
7.9
0.0
0.0
0.6
7.9
0.0
0.0
0.4
Thun
ders
torm
24.0
1.8
20.2
0.0
0.0
0.0
0.8
0.0
0.0
0.0
23.9
20.4
0.7
16.0
0.0
0.0
0.0
0.6
0.0
0.0
0.0
Hails
torm
8.0
2.8
8.7
1.2
0.0
0.0
4.0
0.0
0.0
0.0
2.8
35.3
7.6
41.7
2.7
0.0
0.0
0.9
0.0
0.0
0.5
Heav
y ra
in0.
59.
43.
10.
05.
24.
08.
40.
00.
03.
91.
152
.10.
04.
80.
00.
70.
029
.00.
00.
00.
6Sp
orad
ic ra
in59
.111
.90.
01.
51.
056
.50.
00.
03.
97.
14.
10.
05.
20.
60.
80.
00.
00.
00.
00.
8So
il er
osio
n14
.46.
53.
00.
015
.50.
028
.00.
09.
50.
06.
260
.91.
61.
60.
00.
00.
01.
40.
50.
00.
0La
ndsli
de0.
031
.52.
60.
425
.61.
139
.40.
010
.40.
73.
040
.50.
90.
00.
00.
00.
50.
30.
00.
0
Heat
wav
e74
.40.
080
.60.
00.
00.
054
.90.
00.
00.
00.
00.
00.
00.
00.
00.
00.
00.
00.
00.
00.
0Co
ld w
ave
59.5
0.0
17.9
8.3
0.0
0.0
0.0
0.0
0.0
0.0
8.3
0.0
0.0
0.0
23.9
0.0
0.0
0.0
0.0
0.0
0.0
Dise
ase/
inse
ct79
.92.
673
.80.
04.
74.
417
.00.
01.
819
.823
.10.
90.
20.
90.
00.
00.
00.
90.
00.
00.
0M
id-W
este
rn Te
rai
Drou
ght
93.1
0.0
43.2
0.0
4.3
16.5
46.6
1.0
0.2
12.0
4.8
0.2
0.3
0.2
0.0
0.0
0.0
0.2
0.3
0.0
0.0
Fire
(for
est)
21.4
0.0
34.8
0.0
0.7
1.4
0.8
0.7
0.0
7.5
15.6
0.9
0.0
5.8
0.0
0.0
0.6
0.7
0.0
0.0
0.7
Fire
(sett
lem
ent)
3.0
0.0
9.6
0.0
0.0
0.0
0.0
0.0
0.0
0.0
8.3
0.0
0.0
0.0
0.0
0.0
0.0
1.7
0.0
0.0
1.7
Floo
d0.
043
.94.
10.
04.
28.
434
.00.
04.
03.
88.
239
.20.
07.
10.
00.
00.
07.
10.
00.
00.
0In
unda
tion
0.0
49.8
0.4
0.0
3.1
8.6
14.0
0.0
0.0
5.0
18.9
26.1
0.0
2.3
0.0
1.3
1.3
1.2
0.0
0.0
1.3

National Climate Change Impact Survey 2016 | 79
Disa
ster
s
Reas
ons9
Incr
ease
d (%
)De
crea
sed
(%)
Insufficient rainfall
Heavy rainfall
Temperature Increase
Temperature decrease
Road construction
Urbanisation
Deforestation
Heavy use of underground water
Earthquake
Population increase
Others
Insufficient rainfall
Heavy rainfall
Temperature Increase
Temperature decrease
Road construction
Urbanisation
Deforestation
Heavy use of underground water
Earthquake
Population increase
Win
dsto
rm
5.2
0.0
21.2
0.0
0.0
0.0
13.3
0.5
0.0
0.0
15.3
33.4
0.5
12.0
0.0
0.0
2.6
6.8
0.0
0.0
2.3
Thun
ders
torm
11.8
3.0
26.0
0.0
0.0
0.7
2.8
0.0
0.0
0.0
22.0
12.8
1.1
7.2
0.6
0.0
0.0
1.8
0.0
0.0
0.0
Hails
torm
5.0
1.2
6.6
3.7
0.0
0.6
1.9
0.0
0.0
0.0
9.5
25.0
9.2
25.1
0.0
0.0
0.0
3.1
0.4
0.0
0.0
Heav
y ra
in0.
03.
21.
00.
00.
00.
01.
00.
00.
00.
01.
656
.34.
95.
80.
00.
01.
226
.20.
00.
01.
1Sp
orad
ic ra
in52
.30.
014
.40.
00.
910
.745
.41.
20.
03.
319
.51.
70.
00.
00.
00.
00.
00.
80.
00.
00.
0So
il er
osio
n0.
526
.20.
00.
08.
03.
321
.90.
02.
78.
012
.432
.712
.20.
00.
00.
00.
01.
30.
00.
01.
3La
ndsli
de0.
014
.80.
00.
024
.40.
058
.20.
00.
04.
26.
924
.30.
03.
40.
00.
00.
00.
00.
00.
00.
0He
at w
ave
50.9
0.0
81.8
0.0
0.0
0.0
31.5
0.0
0.0
1.6
6.1
0.0
0.0
1.2
0.0
0.0
0.0
0.0
0.0
0.0
1.5
Cold
wav
e19
.90.
020
.125
.70.
00.
04.
00.
00.
01.
819
.01.
80.
03.
33.
40.
00.
01.
40.
00.
01.
7Di
seas
e/in
sect
41.1
1.4
75.5
0.0
9.2
15.7
6.6
0.6
1.3
30.5
27.5
0.0
0.0
0.0
0.0
0.0
0.0
0.0
0.0
0.0
0.0
Far-w
este
rn M
ount
ain
Drou
ght
100
0.0
96.7
0.0
0.6
1.1
96.0
0.0
0.0
0.0
0.0
0.0
0.0
0.0
0.0
0.0
0.0
0.0
0.0
0.0
0.0
Fire
(for
est)
28.8
0.0
58.0
0.6
1.4
0.0
5.4
0.0
0.0
10.9
1.5
34.8
1.2
33.1
2.3
1.2
0.0
22.1
0.0
1.3
15.1
Fire
(sett
lem
ent)
35.7
0.0
35.8
0.0
0.0
0.0
12.6
0.0
0.0
29.8
0.0
62.0
0.0
37.9
3.9
0.0
2.7
45.9
0.0
0.0
33.7
Floo
d11
.543
.417
.66.
016
.81.
988
.10.
00.
07.
12.
52.
13.
86.
00.
00.
00.
06.
00.
00.
00.
0W
inds
torm
5.
10.
04.
50.
50.
00.
05.
10.
00.
00.
740
.839
.84.
333
.13.
83.
00.
039
.70.
01.
30.
0
Thun
ders
torm
1.2
0.0
1.2
0.0
0.0
0.0
1.2
0.0
0.0
0.0
8.8
37.4
19.0
41.7
7.8
0.0
0.0
50.7
0.0
0.0
0.0
Hails
torm
9.8
6.1
9.1
4.1
0.0
0.0
14.2
0.0
0.0
0.0
42.9
28.3
6.9
27.2
6.8
0.0
0.5
33.6
0.0
0.0
0.0
Heav
y ra
in1.
63.
60.
00.
00.
00.
03.
60.
00.
00.
00.
078
.518
.649
.740
.34.
61.
684
.30.
00.
03.
6Sp
orad
ic ra
in40
.07.
643
.01.
50.
02.
048
.10.
00.
00.
00.
046
.75.
236
.610
.94.
43.
147
.10.
01.
80.
0So
il er
osio
n2.
914
.56.
80.
02.
90.
030
.80.
00.
00.
00.
052
.533
.044
.810
.76.
90.
057
.60.
02.
20.
0La
ndsli
de0.
039
.125
.64.
05.
00.
689
.10.
03.
20.
01.
53.
35.
05.
23.
20.
00.
63.
30.
00.
50.
0Sn
owst
orm
0.0
0.0
0.0
0.0
0.0
0.0
0.0
0.0
0.0
0.0
0.0
62.5
39.0
29.5
75.7
0.0
0.0
87.1
0.0
0.0
0.0
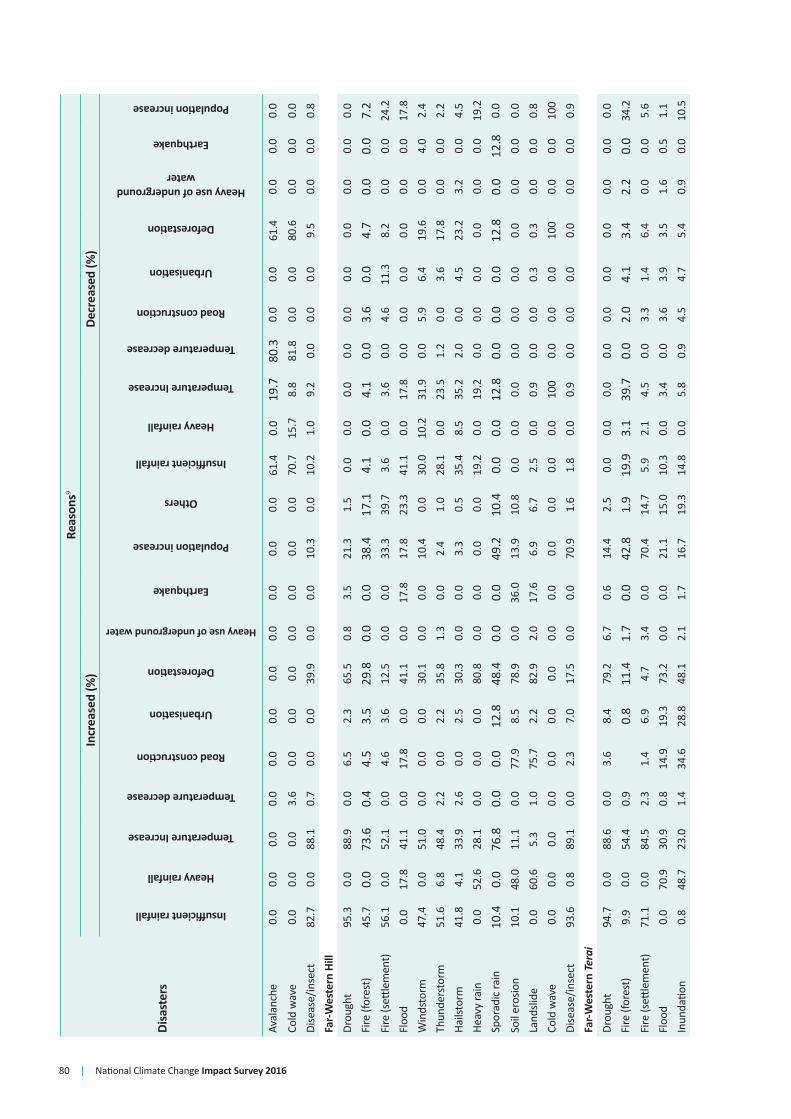
80 | National Climate Change Impact Survey 2016
Disa
ster
s
Reas
ons9
Incr
ease
d (%
)De
crea
sed
(%)
Insufficient rainfall
Heavy rainfall
Temperature Increase
Temperature decrease
Road construction
Urbanisation
Deforestation
Heavy use of underground water
Earthquake
Population increase
Others
Insufficient rainfall
Heavy rainfall
Temperature Increase
Temperature decrease
Road construction
Urbanisation
Deforestation
Heavy use of underground water
Earthquake
Population increase
Aval
anch
e0.
00.
00.
00.
00.
00.
00.
00.
00.
00.
00.
061
.40.
019
.780
.30.
00.
061
.40.
00.
00.
0
Cold
wav
e0.
00.
00.
03.
60.
00.
00.
00.
00.
00.
00.
070
.715
.78.
881
.80.
00.
080
.60.
00.
00.
0Di
seas
e/in
sect
82.7
0.0
88.1
0.7
0.0
0.0
39.9
0.0
0.0
10.3
0.0
10.2
1.0
9.2
0.0
0.0
0.0
9.5
0.0
0.0
0.8
Far-W
este
rn H
illDr
ough
t95
.30.
088
.90.
06.
52.
365
.50.
83.
521
.31.
50.
00.
00.
00.
00.
00.
00.
00.
00.
00.
0Fi
re (f
ores
t)45
.70.
073
.60.
44.
53.
529
.80.
00.
038
.417
.14.
10.
04.
10.
03.
60.
04.
70.
00.
07.
2Fi
re (s
ettle
men
t)56
.10.
052
.10.
04.
63.
612
.50.
00.
033
.339
.73.
60.
03.
60.
04.
611
.38.
20.
00.
024
.2Fl
ood
0.0
17.8
41.1
0.0
17.8
0.0
41.1
0.0
17.8
17.8
23.3
41.1
0.0
17.8
0.0
0.0
0.0
0.0
0.0
0.0
17.8
Win
dsto
rm
47.4
0.0
51.0
0.0
0.0
0.0
30.1
0.0
0.0
10.4
0.0
30.0
10.2
31.9
0.0
5.9
6.4
19.6
0.0
4.0
2.4
Thun
ders
torm
51.6
6.8
48.4
2.2
0.0
2.2
35.8
1.3
0.0
2.4
1.0
28.1
0.0
23.5
1.2
0.0
3.6
17.8
0.0
0.0
2.2
Hails
torm
41.8
4.1
33.9
2.6
0.0
2.5
30.3
0.0
0.0
3.3
0.5
35.4
8.5
35.2
2.0
0.0
4.5
23.2
3.2
0.0
4.5
Heav
y ra
in0.
052
.628
.10.
00.
00.
080
.80.
00.
00.
00.
019
.20.
019
.20.
00.
00.
00.
00.
00.
019
.2Sp
orad
ic ra
in10
.40.
076
.80.
00.
012
.848
.40.
00.
049
.210
.40.
00.
012
.80.
00.
00.
012
.80.
012
.80.
0
Soil
eros
ion
10.1
48.0
11.1
0.0
77.9
8.5
78.9
0.0
36.0
13.9
10.8
0.0
0.0
0.0
0.0
0.0
0.0
0.0
0.0
0.0
0.0
Land
slide
0.0
60.6
5.3
1.0
75.7
2.2
82.9
2.0
17.6
6.9
6.7
2.5
0.0
0.9
0.0
0.0
0.3
0.3
0.0
0.0
0.8
Cold
wav
e0.
00.
00.
00.
00.
00.
00.
00.
00.
00.
00.
00.
00.
010
00.
00.
00.
010
00.
00.
010
0Di
seas
e/in
sect
93.6
0.8
89.1
0.0
2.3
7.0
17.5
0.0
0.0
70.9
1.6
1.8
0.0
0.9
0.0
0.0
0.0
0.0
0.0
0.0
0.9
Far-W
este
rn Te
rai
Drou
ght
94.7
0.0
88.6
0.0
3.6
8.4
79.2
6.7
0.6
14.4
2.5
0.0
0.0
0.0
0.0
0.0
0.0
0.0
0.0
0.0
0.0
Fire
(for
est)
9.9
0.0
54.4
0.9
0.8
11.4
1.7
0.0
42.8
1.9
19.9
3.1
39.7
0.0
2.0
4.1
3.4
2.2
0.0
34.2
Fire
(sett
lem
ent)
71.1
0.0
84.5
2.3
1.4
6.9
4.7
3.4
0.0
70.4
14.7
5.9
2.1
4.5
0.0
3.3
1.4
6.4
0.0
0.0
5.6
Floo
d0.
070
.930
.90.
814
.919
.373
.20.
00.
021
.115
.010
.30.
03.
40.
03.
63.
93.
51.
60.
51.
1In
unda
tion
0.8
48.7
23.0
1.4
34.6
28.8
48.1
2.1
1.7
16.7
19.3
14.8
0.0
5.8
0.9
4.5
4.7
5.4
0.9
0.0
10.5

National Climate Change Impact Survey 2016 | 81
Disa
ster
s
Reas
ons9
Incr
ease
d (%
)De
crea
sed
(%)
Insufficient rainfall
Heavy rainfall
Temperature Increase
Temperature decrease
Road construction
Urbanisation
Deforestation
Heavy use of underground water
Earthquake
Population increase
Others
Insufficient rainfall
Heavy rainfall
Temperature Increase
Temperature decrease
Road construction
Urbanisation
Deforestation
Heavy use of underground water
Earthquake
Population increase
Win
dsto
rm
17.5
3.1
34.1
0.0
0.0
0.0
39.5
0.0
0.0
2.5
30.0
26.8
5.6
34.2
1.1
2.8
2.9
35.9
0.5
1.1
5.1
Thun
ders
torm
20.1
15.4
24.1
1.3
0.0
6.7
28.7
2.7
0.0
1.2
19.2
24.7
21.7
37.2
3.8
0.0
4.7
40.0
2.8
0.0
0.5
Hails
torm
8.7
16.3
18.5
4.8
0.0
2.3
17.4
0.0
0.0
2.2
27.7
20.9
25.1
39.1
0.5
0.0
3.3
39.5
1.4
0.0
2.8
Heav
y ra
in1.
511
.019
.80.
00.
03.
613
.90.
00.
07.
016
.117
.737
.454
.23.
94.
96.
036
.80.
00.
02.
1Sp
orad
ic ra
in45
.614
.963
.90.
04.
012
.885
.415
.60.
03.
719
.73.
81.
68.
30.
00.
00.
09.
90.
00.
00.
0So
il er
osio
n3.
663
.328
.60.
025
.619
.370
.80.
02.
510
.337
.62.
24.
11.
90.
04.
40.
09.
90.
00.
00.
0La
ndsli
de0.
088
.123
.80.
016
.90.
079
.78.
40.
011
.60.
00.
011
.911
.90.
00.
00.
011
.90.
00.
00.
0He
at w
ave
12.4
8.8
84.6
3.0
3.9
11.5
72.3
2.9
0.0
22.0
6.6
0.0
0.0
7.6
0.0
0.0
2.6
4.2
0.0
0.0
3.7
Cold
wav
e17
.66.
412
.554
.61.
44.
724
.63.
10.
04.
140
.25.
12.
08.
07.
90.
05.
94.
20.
90.
08.
4Di
seas
e/in
sect
30.9
1.2
82.7
0.4
4.3
17.9
60.2
1.7
0.0
66.8
10.8
3.8
0.0
0.7
0.0
0.0
0.3
3.5
0.0
0.0
2.4
Kath
man
du V
alle
y
Drou
ght
80.8
0.0
42.8
0.0
5.0
50.0
18.1
14.8
0.6
29.2
1.1
0.4
0.0
0.4
0.0
0.0
1.0
0.5
0.0
0.0
0.4
Fire
(for
est)
55.3
0.0
27.6
0.0
0.0
0.0
0.0
0.0
0.0
55.3
0.0
0.0
0.0
44.7
0.0
0.0
0.0
0.0
0.0
0.0
0.0
Fire
(sett
lem
ent)
0.0
0.0
15.2
0.0
0.0
7.6
0.0
0.0
0.0
22.8
0.0
0.0
0.0
0.0
0.0
0.0
77.2
0.0
0.0
0.0
15.2
Floo
d0.
038
.40.
00.
01.
95.
44.
30.
00.
00.
00.
949
.20.
03.
60.
03.
223
.40.
00.
00.
05.
9W
inds
torm
9.
62.
19.
00.
00.
00.
02.
91.
40.
05.
33.
97.
94.
617
.00.
03.
221
.023
.54.
20.
012
.8Th
unde
rsto
rm8.
20.
010
.20.
00.
02.
33.
14.
30.
04.
94.
726
.90.
721
.60.
00.
015
.26.
615
.60.
012
.5Ha
ilsto
rm6.
30.
83.
10.
70.
00.
00.
80.
00.
04.
41.
317
.43.
932
.82.
90.
020
.115
.29.
50.
010
.5He
avy
rain
0.0
31.9
13.9
0.0
0.0
3.2
15.1
0.0
0.0
0.0
0.0
2.6
24.1
6.2
0.0
0.0
7.9
3.4
0.0
0.0
0.0
Spor
adic
rain
36.6
0.5
38.9
1.0
2.0
32.8
30.7
11.5
0.0
28.5
10.4
1.3
0.0
0.9
0.0
0.0
1.8
2.7
0.0
0.0
0.5
Land
slide
0.0
0.0
0.0
0.0
100
0.0
0.0
0.0
100
0.0
0.0
0.0
0.0
0.0
0.0
0.0
0.0
0.0
0.0
0.0
0.0
Dise
ase/
inse
ct5.
60.
023
.51.
32.
669
.73.
50.
70.
071
.617
.50.
00.
00.
00.
00.
00.
00.
00.
00.
01.
6
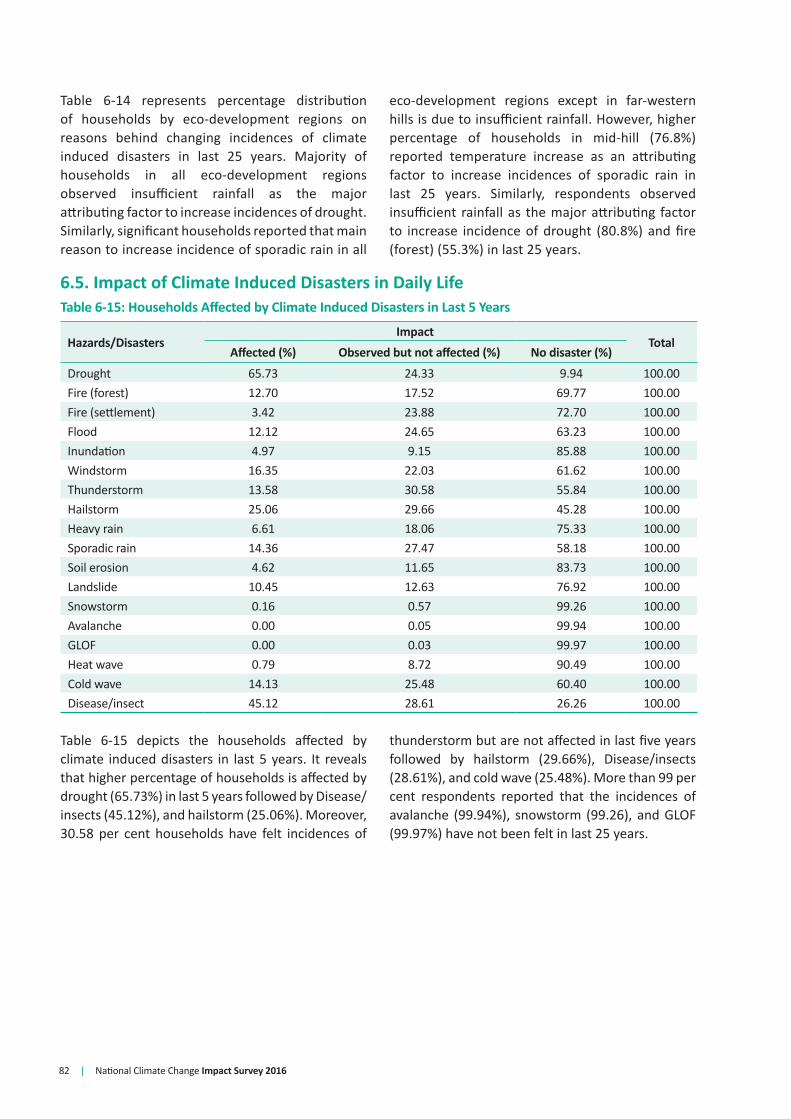
82 | National Climate Change Impact Survey 2016
Table 6-14 represents percentage distribution of households by eco-development regions on reasons behind changing incidences of climate induced disasters in last 25 years. Majority of households in all eco-development regions observed insufficient rainfall as the major attributing factor to increase incidences of drought. Similarly, significant households reported that main reason to increase incidence of sporadic rain in all
eco-development regions except in far-western hills is due to insufficient rainfall. However, higher percentage of households in mid-hill (76.8%) reported temperature increase as an attributing factor to increase incidences of sporadic rain in last 25 years. Similarly, respondents observed insufficient rainfall as the major attributing factor to increase incidence of drought (80.8%) and fire (forest) (55.3%) in last 25 years.
6.5. Impact of Climate Induced Disasters in Daily LifeTable 6-15: Households Affected by Climate Induced Disasters in Last 5 Years
Hazards/DisastersImpact
TotalAffected (%) Observed but not affected (%) No disaster (%)
Drought 65.73 24.33 9.94 100.00Fire (forest) 12.70 17.52 69.77 100.00Fire (settlement) 3.42 23.88 72.70 100.00Flood 12.12 24.65 63.23 100.00Inundation 4.97 9.15 85.88 100.00Windstorm 16.35 22.03 61.62 100.00Thunderstorm 13.58 30.58 55.84 100.00Hailstorm 25.06 29.66 45.28 100.00Heavy rain 6.61 18.06 75.33 100.00Sporadic rain 14.36 27.47 58.18 100.00Soil erosion 4.62 11.65 83.73 100.00Landslide 10.45 12.63 76.92 100.00Snowstorm 0.16 0.57 99.26 100.00Avalanche 0.00 0.05 99.94 100.00GLOF 0.00 0.03 99.97 100.00Heat wave 0.79 8.72 90.49 100.00Cold wave 14.13 25.48 60.40 100.00Disease/insect 45.12 28.61 26.26 100.00
Table 6-15 depicts the households affected by climate induced disasters in last 5 years. It reveals that higher percentage of households is affected by drought (65.73%) in last 5 years followed by Disease/insects (45.12%), and hailstorm (25.06%). Moreover, 30.58 per cent households have felt incidences of
thunderstorm but are not affected in last five years followed by hailstorm (29.66%), Disease/insects (28.61%), and cold wave (25.48%). More than 99 per cent respondents reported that the incidences of avalanche (99.94%), snowstorm (99.26), and GLOF (99.97%) have not been felt in last 25 years.

National Climate Change Impact Survey 2016 | 83
Table 6-16: Households Affected by Climate Induced Disasters by Eco-Development Region in Last Five Years
Hazards/DisasterImpact
TotalAffected (%) Observed but not affected (%) No disaster (%)
Eastern MountainDrought 28.76 5.12 66.13 100.00Fire (forest) 3.10 2.29 94.61 100.00Fire (settlement) 6.70 4.23 89.07 100.00Flood 12.95 5.79 81.27 100.00Inundation 0.00 0.00 100.00 100.00Windstorm 6.90 0.00 93.10 100.00Thunderstorm 30.12 10.71 59.16 100.00Hailstorm 60.17 3.76 36.07 100.00Heavy rain 33.35 1.10 65.54 100.00Sporadic rain 10.95 0.66 88.40 100.00Soil erosion 13.14 6.08 80.78 100.00Landslide 39.62 12.84 47.55 100.00Snowstorm 2.46 6.55 90.99 100.00Avalanche 0.00 0.56 99.44 100.00GLOF 0.00 1.79 98.21 100.00Heat wave 0.00 0.00 100.00 100.00Cold wave 24.16 17.93 57.90 100.00Disease/insect 33.84 21.29 44.87 100.00Eastern HillDrought 86.48 10.92 2.60 100.00Fire (forest) 12.05 33.45 54.50 100.00Fire (settlement) 3.25 22.33 74.43 100.00Flood 2.18 29.47 68.35 100.00Inundation 0.00 0.00 100.00 100.00Windstorm 14.24 23.49 62.26 100.00Thunderstorm 5.65 35.15 59.20 100.00Hailstorm 22.55 28.04 49.42 100.00Heavy rain 1.38 17.63 80.99 100.00Sporadic rain 11.05 22.36 66.59 100.00Soil erosion 1.47 20.66 77.87 100.00Landslide 6.89 32.79 60.32 100.00Snowstorm 0.00 0.00 100.00 100.00Avalanche 0.00 0.00 100.00 100.00GLOF 0.00 0.00 100.00 100.00Heat wave 0.00 8.57 91.43 100.00Cold wave 4.79 16.91 78.29 100.00Disease/insect 61.80 15.89 22.32 100.00Eastern Terai
Drought 71.12 27.41 1.46 100.00Fire (forest) 3.42 9.24 87.34 100.00Fire (settlement) 7.03 55.66 37.31 100.00Flood 28.67 28.18 43.15 100.00Inundation 19.52 20.27 60.20 100.00Windstorm 33.39 44.58 22.03 100.00
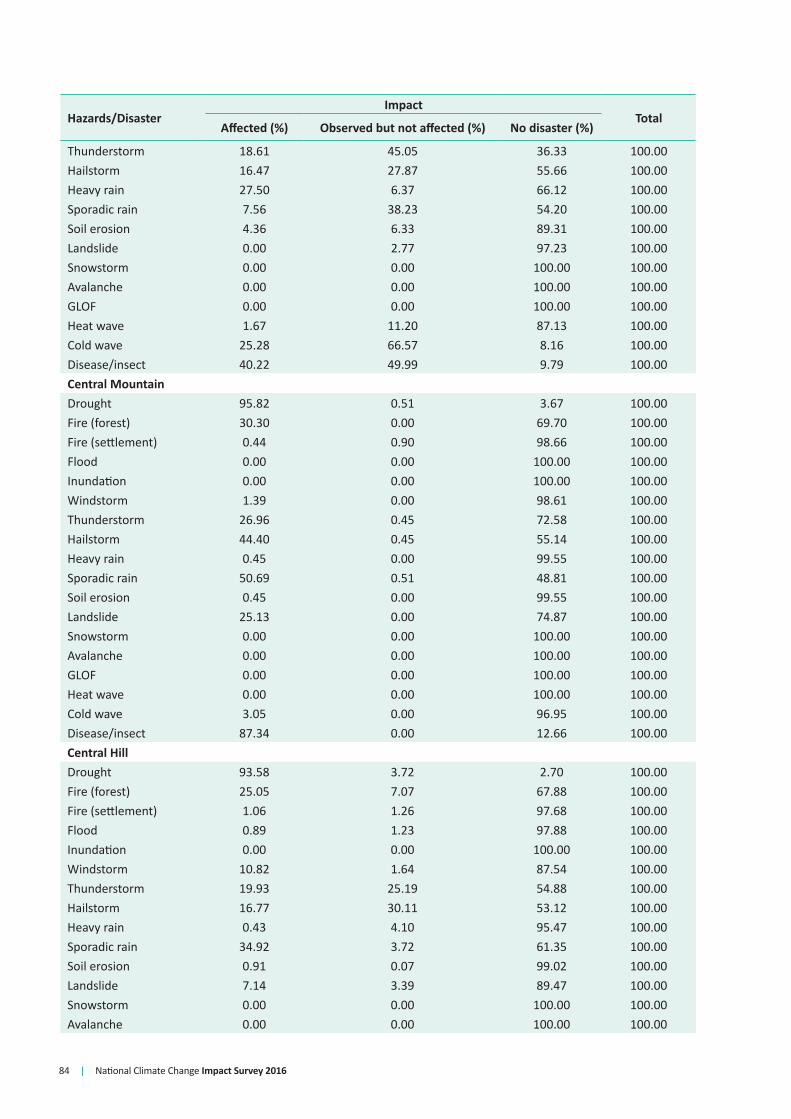
84 | National Climate Change Impact Survey 2016
Hazards/DisasterImpact
TotalAffected (%) Observed but not affected (%) No disaster (%)
Thunderstorm 18.61 45.05 36.33 100.00Hailstorm 16.47 27.87 55.66 100.00Heavy rain 27.50 6.37 66.12 100.00Sporadic rain 7.56 38.23 54.20 100.00Soil erosion 4.36 6.33 89.31 100.00Landslide 0.00 2.77 97.23 100.00Snowstorm 0.00 0.00 100.00 100.00Avalanche 0.00 0.00 100.00 100.00GLOF 0.00 0.00 100.00 100.00Heat wave 1.67 11.20 87.13 100.00Cold wave 25.28 66.57 8.16 100.00Disease/insect 40.22 49.99 9.79 100.00Central MountainDrought 95.82 0.51 3.67 100.00Fire (forest) 30.30 0.00 69.70 100.00Fire (settlement) 0.44 0.90 98.66 100.00Flood 0.00 0.00 100.00 100.00Inundation 0.00 0.00 100.00 100.00Windstorm 1.39 0.00 98.61 100.00Thunderstorm 26.96 0.45 72.58 100.00Hailstorm 44.40 0.45 55.14 100.00Heavy rain 0.45 0.00 99.55 100.00Sporadic rain 50.69 0.51 48.81 100.00Soil erosion 0.45 0.00 99.55 100.00Landslide 25.13 0.00 74.87 100.00Snowstorm 0.00 0.00 100.00 100.00Avalanche 0.00 0.00 100.00 100.00GLOF 0.00 0.00 100.00 100.00Heat wave 0.00 0.00 100.00 100.00Cold wave 3.05 0.00 96.95 100.00Disease/insect 87.34 0.00 12.66 100.00Central HillDrought 93.58 3.72 2.70 100.00Fire (forest) 25.05 7.07 67.88 100.00Fire (settlement) 1.06 1.26 97.68 100.00Flood 0.89 1.23 97.88 100.00Inundation 0.00 0.00 100.00 100.00Windstorm 10.82 1.64 87.54 100.00Thunderstorm 19.93 25.19 54.88 100.00Hailstorm 16.77 30.11 53.12 100.00Heavy rain 0.43 4.10 95.47 100.00Sporadic rain 34.92 3.72 61.35 100.00Soil erosion 0.91 0.07 99.02 100.00Landslide 7.14 3.39 89.47 100.00Snowstorm 0.00 0.00 100.00 100.00Avalanche 0.00 0.00 100.00 100.00

National Climate Change Impact Survey 2016 | 85
Hazards/DisasterImpact
TotalAffected (%) Observed but not affected (%) No disaster (%)
GLOF 0.00 0.00 100.00 100.00Heat wave 0.00 0.00 100.00 100.00Cold wave 0.00 0.15 99.85 100.00Disease/insect 81.19 3.84 14.98 100.00Central Terai
Drought 68.10 30.54 1.36 100.00Fire (forest) 0.00 1.11 98.89 100.00Fire (settlement) 5.21 36.99 57.80 100.00Flood 10.58 72.14 17.28 100.00Inundation 2.55 23.43 74.02 100.00Windstorm 22.25 25.19 52.57 100.00Thunderstorm 7.24 22.29 70.47 100.00Hailstorm 28.61 36.13 35.26 100.00Heavy rain 0.70 42.17 57.13 100.00Sporadic rain 6.68 28.77 64.55 100.00Soil erosion 0.00 0.00 100.00 100.00Landslide 0.00 0.00 100.00 100.00Snowstorm 0.00 0.00 100.00 100.00Avalanche 0.00 0.00 100.00 100.00GLOF 0.00 0.00 100.00 100.00Heat wave 0.00 1.48 98.52 100.00Cold wave 43.61 36.17 20.21 100.00Disease/insect 63.97 18.82 17.21 100.00Western MountainDrought 63.39 6.61 30.00 100.00Fire (forest) 0.00 2.20 97.80 100.00Fire (settlement) 0.00 0.00 100.00 100.00Flood 0.00 0.00 100.00 100.00Inundation 0.00 0.00 100.00 100.00Windstorm 15.42 11.01 73.57 100.00Thunderstorm 0.00 0.00 100.00 100.00Hailstorm 24.82 20.00 55.18 100.00Heavy rain 2.20 2.20 95.60 100.00Sporadic rain 0.00 0.00 100.00 100.00Soil erosion 2.80 46.96 50.24 100.00Landslide 17.62 18.81 63.57 100.00Snowstorm 33.57 13.99 52.44 100.00Avalanche 2.80 2.80 94.40 100.00GLOF 0.00 0.00 100.00 100.00Heat wave 0.00 0.00 100.00 100.00Cold wave 0.00 0.00 100.00 100.00Disease/insect 62.20 4.40 33.39 100.00Western HillDrought 34.21 15.90 49.89 100.00Fire (forest) 26.53 19.55 53.92 100.00Fire (settlement) 0.50 7.56 91.94 100.00
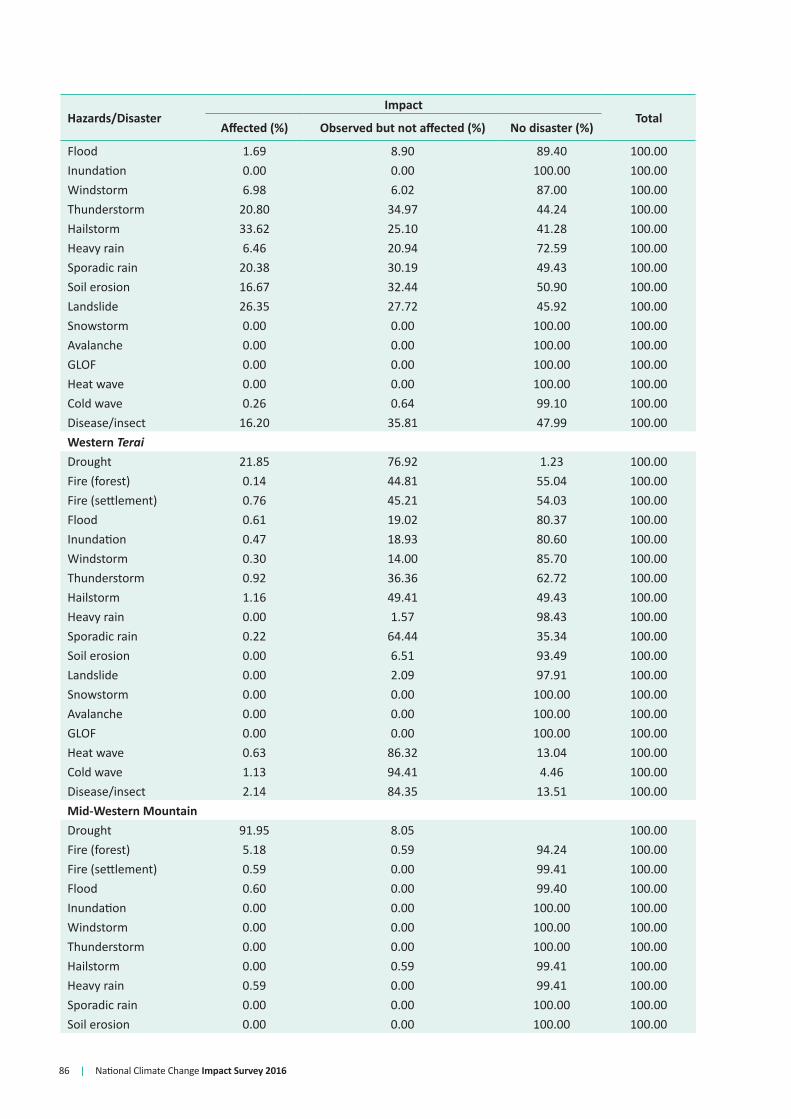
86 | National Climate Change Impact Survey 2016
Hazards/DisasterImpact
TotalAffected (%) Observed but not affected (%) No disaster (%)
Flood 1.69 8.90 89.40 100.00Inundation 0.00 0.00 100.00 100.00Windstorm 6.98 6.02 87.00 100.00Thunderstorm 20.80 34.97 44.24 100.00Hailstorm 33.62 25.10 41.28 100.00Heavy rain 6.46 20.94 72.59 100.00Sporadic rain 20.38 30.19 49.43 100.00Soil erosion 16.67 32.44 50.90 100.00Landslide 26.35 27.72 45.92 100.00Snowstorm 0.00 0.00 100.00 100.00Avalanche 0.00 0.00 100.00 100.00GLOF 0.00 0.00 100.00 100.00Heat wave 0.00 0.00 100.00 100.00Cold wave 0.26 0.64 99.10 100.00Disease/insect 16.20 35.81 47.99 100.00Western Terai
Drought 21.85 76.92 1.23 100.00Fire (forest) 0.14 44.81 55.04 100.00Fire (settlement) 0.76 45.21 54.03 100.00Flood 0.61 19.02 80.37 100.00Inundation 0.47 18.93 80.60 100.00Windstorm 0.30 14.00 85.70 100.00Thunderstorm 0.92 36.36 62.72 100.00Hailstorm 1.16 49.41 49.43 100.00Heavy rain 0.00 1.57 98.43 100.00Sporadic rain 0.22 64.44 35.34 100.00Soil erosion 0.00 6.51 93.49 100.00Landslide 0.00 2.09 97.91 100.00Snowstorm 0.00 0.00 100.00 100.00Avalanche 0.00 0.00 100.00 100.00GLOF 0.00 0.00 100.00 100.00Heat wave 0.63 86.32 13.04 100.00Cold wave 1.13 94.41 4.46 100.00Disease/insect 2.14 84.35 13.51 100.00Mid-Western MountainDrought 91.95 8.05 100.00Fire (forest) 5.18 0.59 94.24 100.00Fire (settlement) 0.59 0.00 99.41 100.00Flood 0.60 0.00 99.40 100.00Inundation 0.00 0.00 100.00 100.00Windstorm 0.00 0.00 100.00 100.00Thunderstorm 0.00 0.00 100.00 100.00Hailstorm 0.00 0.59 99.41 100.00Heavy rain 0.59 0.00 99.41 100.00Sporadic rain 0.00 0.00 100.00 100.00Soil erosion 0.00 0.00 100.00 100.00
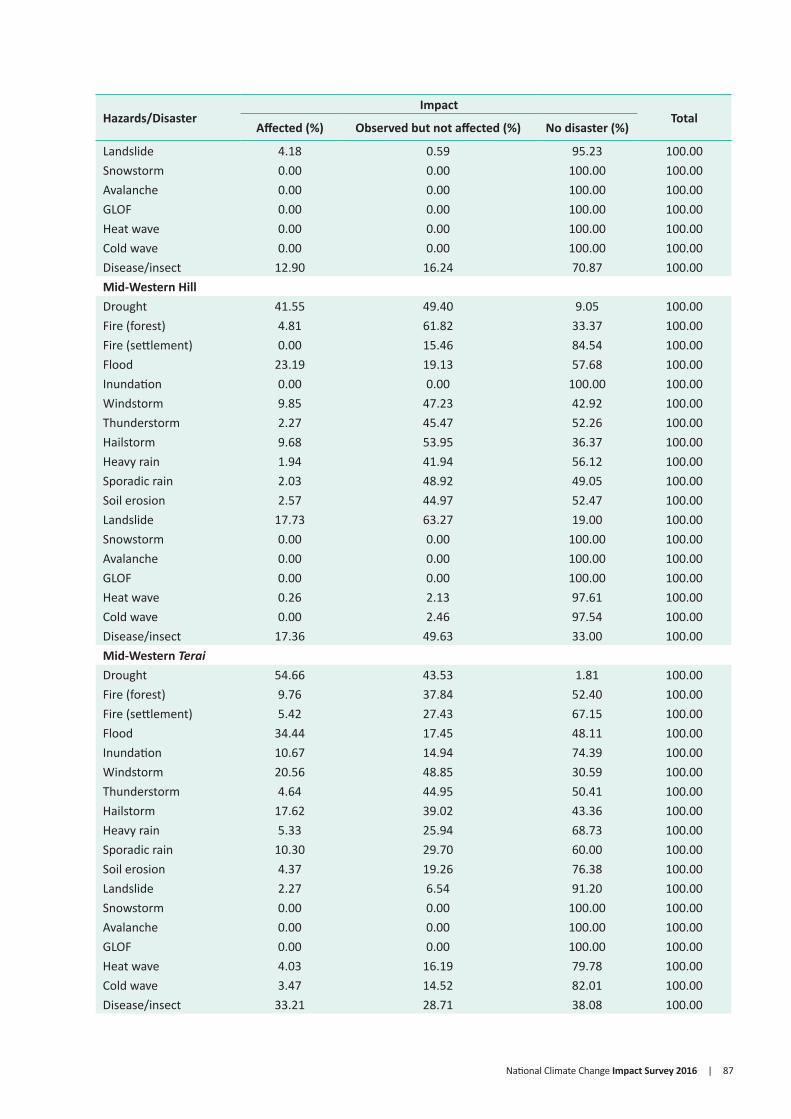
National Climate Change Impact Survey 2016 | 87
Hazards/DisasterImpact
TotalAffected (%) Observed but not affected (%) No disaster (%)
Landslide 4.18 0.59 95.23 100.00Snowstorm 0.00 0.00 100.00 100.00Avalanche 0.00 0.00 100.00 100.00GLOF 0.00 0.00 100.00 100.00Heat wave 0.00 0.00 100.00 100.00Cold wave 0.00 0.00 100.00 100.00Disease/insect 12.90 16.24 70.87 100.00Mid-Western HillDrought 41.55 49.40 9.05 100.00Fire (forest) 4.81 61.82 33.37 100.00Fire (settlement) 0.00 15.46 84.54 100.00Flood 23.19 19.13 57.68 100.00Inundation 0.00 0.00 100.00 100.00Windstorm 9.85 47.23 42.92 100.00Thunderstorm 2.27 45.47 52.26 100.00Hailstorm 9.68 53.95 36.37 100.00Heavy rain 1.94 41.94 56.12 100.00Sporadic rain 2.03 48.92 49.05 100.00Soil erosion 2.57 44.97 52.47 100.00Landslide 17.73 63.27 19.00 100.00Snowstorm 0.00 0.00 100.00 100.00Avalanche 0.00 0.00 100.00 100.00GLOF 0.00 0.00 100.00 100.00Heat wave 0.26 2.13 97.61 100.00Cold wave 0.00 2.46 97.54 100.00Disease/insect 17.36 49.63 33.00 100.00Mid-Western Terai
Drought 54.66 43.53 1.81 100.00Fire (forest) 9.76 37.84 52.40 100.00Fire (settlement) 5.42 27.43 67.15 100.00Flood 34.44 17.45 48.11 100.00Inundation 10.67 14.94 74.39 100.00Windstorm 20.56 48.85 30.59 100.00Thunderstorm 4.64 44.95 50.41 100.00Hailstorm 17.62 39.02 43.36 100.00Heavy rain 5.33 25.94 68.73 100.00Sporadic rain 10.30 29.70 60.00 100.00Soil erosion 4.37 19.26 76.38 100.00Landslide 2.27 6.54 91.20 100.00Snowstorm 0.00 0.00 100.00 100.00Avalanche 0.00 0.00 100.00 100.00GLOF 0.00 0.00 100.00 100.00Heat wave 4.03 16.19 79.78 100.00Cold wave 3.47 14.52 82.01 100.00Disease/insect 33.21 28.71 38.08 100.00
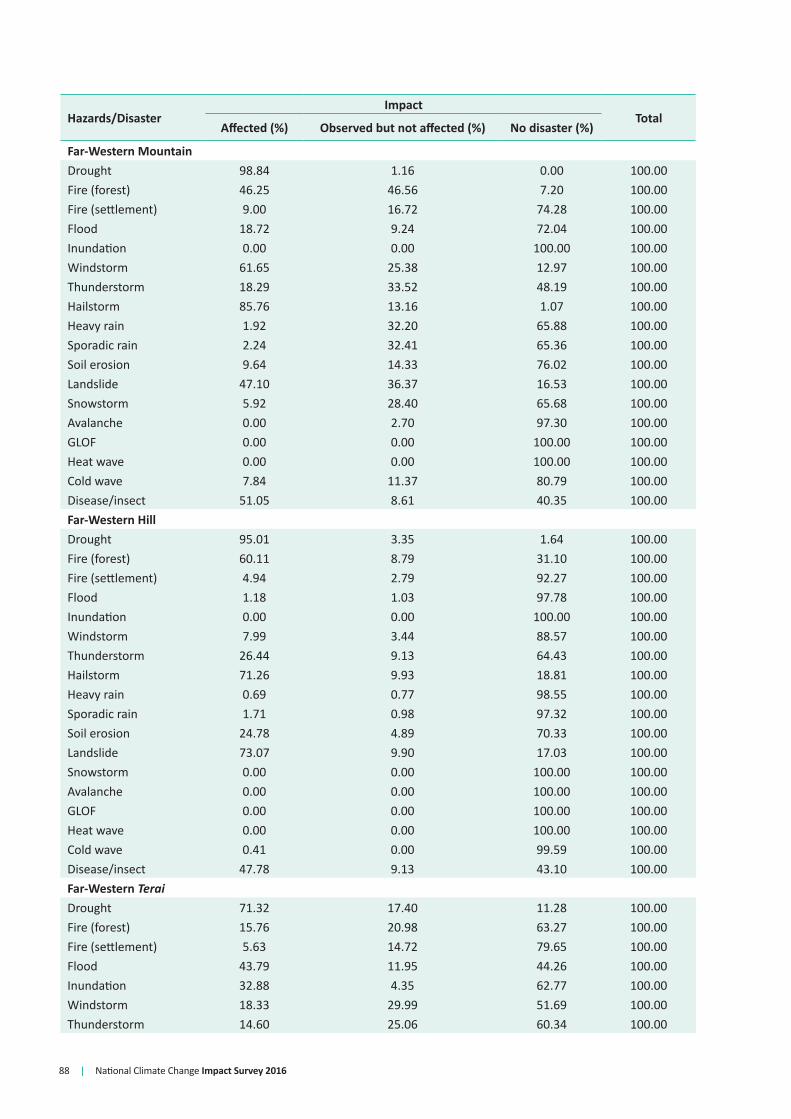
88 | National Climate Change Impact Survey 2016
Hazards/DisasterImpact
TotalAffected (%) Observed but not affected (%) No disaster (%)
Far-Western MountainDrought 98.84 1.16 0.00 100.00Fire (forest) 46.25 46.56 7.20 100.00Fire (settlement) 9.00 16.72 74.28 100.00Flood 18.72 9.24 72.04 100.00Inundation 0.00 0.00 100.00 100.00Windstorm 61.65 25.38 12.97 100.00Thunderstorm 18.29 33.52 48.19 100.00Hailstorm 85.76 13.16 1.07 100.00Heavy rain 1.92 32.20 65.88 100.00Sporadic rain 2.24 32.41 65.36 100.00Soil erosion 9.64 14.33 76.02 100.00Landslide 47.10 36.37 16.53 100.00Snowstorm 5.92 28.40 65.68 100.00Avalanche 0.00 2.70 97.30 100.00GLOF 0.00 0.00 100.00 100.00Heat wave 0.00 0.00 100.00 100.00Cold wave 7.84 11.37 80.79 100.00Disease/insect 51.05 8.61 40.35 100.00Far-Western HillDrought 95.01 3.35 1.64 100.00Fire (forest) 60.11 8.79 31.10 100.00Fire (settlement) 4.94 2.79 92.27 100.00Flood 1.18 1.03 97.78 100.00Inundation 0.00 0.00 100.00 100.00Windstorm 7.99 3.44 88.57 100.00Thunderstorm 26.44 9.13 64.43 100.00Hailstorm 71.26 9.93 18.81 100.00Heavy rain 0.69 0.77 98.55 100.00Sporadic rain 1.71 0.98 97.32 100.00Soil erosion 24.78 4.89 70.33 100.00Landslide 73.07 9.90 17.03 100.00Snowstorm 0.00 0.00 100.00 100.00Avalanche 0.00 0.00 100.00 100.00GLOF 0.00 0.00 100.00 100.00Heat wave 0.00 0.00 100.00 100.00Cold wave 0.41 0.00 99.59 100.00Disease/insect 47.78 9.13 43.10 100.00Far-Western Terai
Drought 71.32 17.40 11.28 100.00Fire (forest) 15.76 20.98 63.27 100.00Fire (settlement) 5.63 14.72 79.65 100.00Flood 43.79 11.95 44.26 100.00Inundation 32.88 4.35 62.77 100.00Windstorm 18.33 29.99 51.69 100.00Thunderstorm 14.60 25.06 60.34 100.00
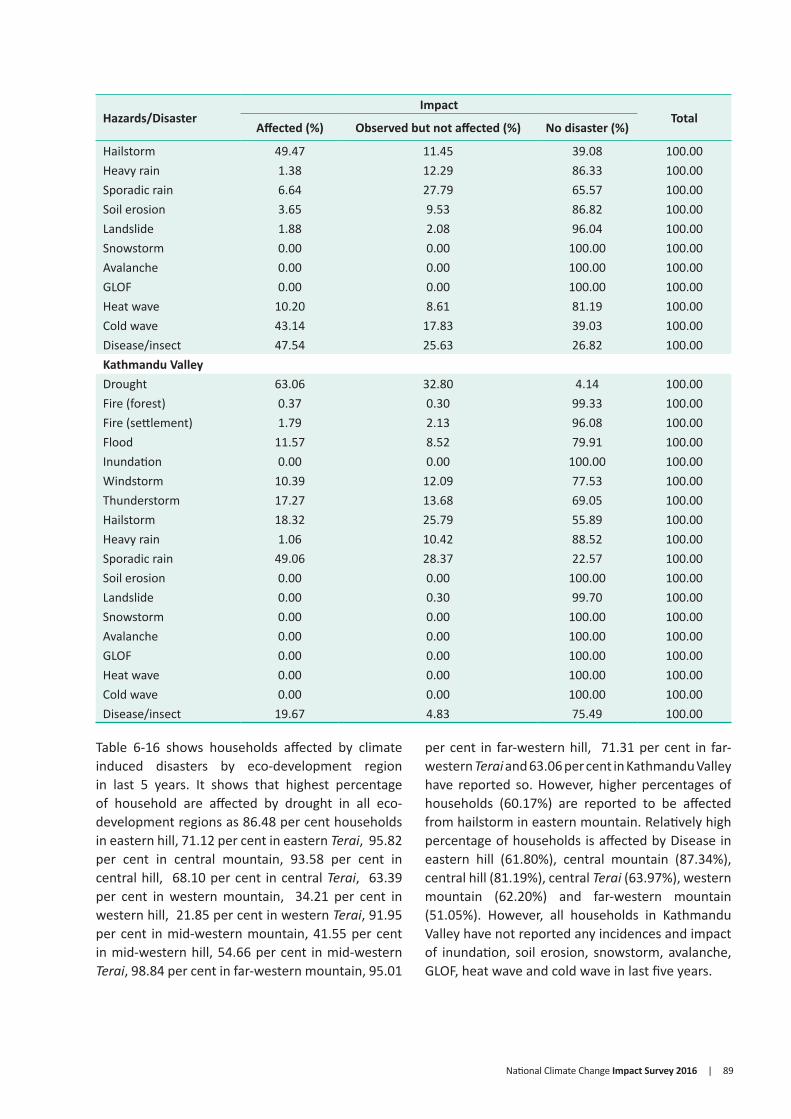
National Climate Change Impact Survey 2016 | 89
Hazards/DisasterImpact
TotalAffected (%) Observed but not affected (%) No disaster (%)
Hailstorm 49.47 11.45 39.08 100.00Heavy rain 1.38 12.29 86.33 100.00Sporadic rain 6.64 27.79 65.57 100.00Soil erosion 3.65 9.53 86.82 100.00Landslide 1.88 2.08 96.04 100.00Snowstorm 0.00 0.00 100.00 100.00Avalanche 0.00 0.00 100.00 100.00GLOF 0.00 0.00 100.00 100.00Heat wave 10.20 8.61 81.19 100.00Cold wave 43.14 17.83 39.03 100.00Disease/insect 47.54 25.63 26.82 100.00Kathmandu ValleyDrought 63.06 32.80 4.14 100.00Fire (forest) 0.37 0.30 99.33 100.00Fire (settlement) 1.79 2.13 96.08 100.00Flood 11.57 8.52 79.91 100.00Inundation 0.00 0.00 100.00 100.00Windstorm 10.39 12.09 77.53 100.00Thunderstorm 17.27 13.68 69.05 100.00Hailstorm 18.32 25.79 55.89 100.00Heavy rain 1.06 10.42 88.52 100.00Sporadic rain 49.06 28.37 22.57 100.00Soil erosion 0.00 0.00 100.00 100.00Landslide 0.00 0.30 99.70 100.00Snowstorm 0.00 0.00 100.00 100.00Avalanche 0.00 0.00 100.00 100.00GLOF 0.00 0.00 100.00 100.00Heat wave 0.00 0.00 100.00 100.00Cold wave 0.00 0.00 100.00 100.00Disease/insect 19.67 4.83 75.49 100.00
Table 6-16 shows households affected by climate induced disasters by eco-development region in last 5 years. It shows that highest percentage of household are affected by drought in all eco-development regions as 86.48 per cent households in eastern hill, 71.12 per cent in eastern Terai, 95.82 per cent in central mountain, 93.58 per cent in central hill, 68.10 per cent in central Terai, 63.39 per cent in western mountain, 34.21 per cent in western hill, 21.85 per cent in western Terai, 91.95 per cent in mid-western mountain, 41.55 per cent in mid-western hill, 54.66 per cent in mid-western Terai, 98.84 per cent in far-western mountain, 95.01
per cent in far-western hill, 71.31 per cent in far-western Terai and 63.06 per cent in Kathmandu Valley have reported so. However, higher percentages of households (60.17%) are reported to be affected from hailstorm in eastern mountain. Relatively high percentage of households is affected by Disease in eastern hill (61.80%), central mountain (87.34%), central hill (81.19%), central Terai (63.97%), western mountain (62.20%) and far-western mountain (51.05%). However, all households in Kathmandu Valley have not reported any incidences and impact of inundation, soil erosion, snowstorm, avalanche, GLOF, heat wave and cold wave in last five years.

90 | National Climate Change Impact Survey 2016
Table 6-17: Households Affected by Climate Induced Disasters by Income Quintile in Last Five Years
Hazards/DisastersImpact
TotalAffected (%) Observed but not affected (%) No disaster (%)
First Quintile (Lowest)
Drought 80.46 14.74 4.80 100.00
Fire (forest) 15.54 15.65 68.81 100.00
Fire (settlement) 4.47 25.91 69.63 100.00
Flood 13.54 33.14 53.33 100.00
Inundation 3.99 12.99 83.02 100.00
Windstorm 18.61 27.25 54.14 100.00
Thunderstorm 13.16 31.03 55.80 100.00
Hailstorm 35.05 33.15 31.80 100.00
Heavy rain 3.78 23.10 73.12 100.00
Sporadic rain 10.37 25.53 64.09 100.00
Soil erosion 4.76 12.64 82.60 100.00
Landslide 12.01 13.98 74.01 100.00
Snowstorm 0.43 0.75 98.82 100.00
Avalanche 0.00 0.12 99.88 100.00
GLOF 0.00 0.00 100.00 100.00
Heat wave 0.58 3.94 95.48 100.00
Cold wave 23.26 19.72 57.02 100.00
Disease/insect 54.71 22.72 22.58 100.00
Second Quintile
Drought 71.24 17.99 10.76 100.00
Fire (forest) 13.34 16.71 69.95 100.00
Fire (settlement) 3.69 21.61 74.70 100.00
Flood 11.89 24.12 63.99 100.00
Inundation 4.11 8.63 87.26 100.00
Windstorm 17.02 22.16 60.81 100.00
Thunderstorm 10.54 33.38 56.08 100.00
Hailstorm 24.70 31.30 44.00 100.00
Heavy rain 5.14 19.89 74.97 100.00
Sporadic rain 14.59 28.28 57.14 100.00
Soil erosion 4.91 13.18 81.90 100.00
Landslide 12.95 11.64 75.41 100.00
Snowstorm 0.06 0.30 99.64 100.00
Avalanche 0.00 0.05 99.95 100.00
GLOF 0.00 0.11 99.89 100.00
Heat wave 0.93 6.68 92.39 100.00
Cold wave 14.17 25.10 60.73 100.00
Disease/insect 49.91 26.03 24.06 100.00

National Climate Change Impact Survey 2016 | 91
Hazards/DisastersImpact
TotalAffected (%) Observed but not affected (%) No disaster (%)
Third Quintile
Drought 60.21 27.61 12.18 100.00
Fire (forest) 11.24 19.00 69.76 100.00
Fire (settlement) 2.80 24.71 72.49 100.00
Flood 11.62 24.83 63.55 100.00
Inundation 4.73 8.11 87.16 100.00
Windstorm 16.21 19.03 64.76 100.00
Thunderstorm 13.30 29.08 57.62 100.00
Hailstorm 22.23 26.40 51.37 100.00
Heavy rain 8.73 18.58 72.69 100.00
Sporadic rain 13.06 25.17 61.77 100.00
Soil erosion 6.18 12.34 81.49 100.00
Landslide 11.31 14.93 73.76 100.00
Snowstorm 0.04 0.43 99.53 100.00
Avalanche 0.00 0.01 99.99 100.00
GLOF 0.00 0.00 100.00 100.00
Heat wave 0.51 10.88 88.62 100.00
Cold wave 13.74 25.36 60.90 100.00
Disease/insect 43.67 30.56 25.78 100.00
Fourth Quintile
Drought 57.68 29.18 13.14 100.00
Fire (forest) 10.69 18.42 70.88 100.00
Fire (settlement) 3.36 21.85 74.79 100.00
Flood 11.66 19.40 68.94 100.00
Inundation 6.10 5.85 88.06 100.00
Windstorm 14.35 20.75 64.90 100.00
Thunderstorm 14.66 29.61 55.73 100.00
Hailstorm 20.99 24.41 54.60 100.00
Heavy rain 10.10 14.23 75.66 100.00
Sporadic rain 15.77 24.05 60.19 100.00
Soil erosion 3.33 10.35 86.33 100.00
Landslide 9.70 11.56 78.74 100.00
Snowstorm 0.14 0.47 99.39 100.00
Avalanche 0.01 0.04 99.94 100.00
GLOF 0.00 0.07 99.93 100.00
Heat wave 1.43 10.08 88.49 100.00
Cold wave 11.66 26.53 61.81 100.00
Disease/insect 41.43 29.65 28.92 100.00
Fifth Quintile (Highest)
Drought 48.71 39.63 11.66 100.00
Fire (forest) 9.83 21.37 68.81 100.00
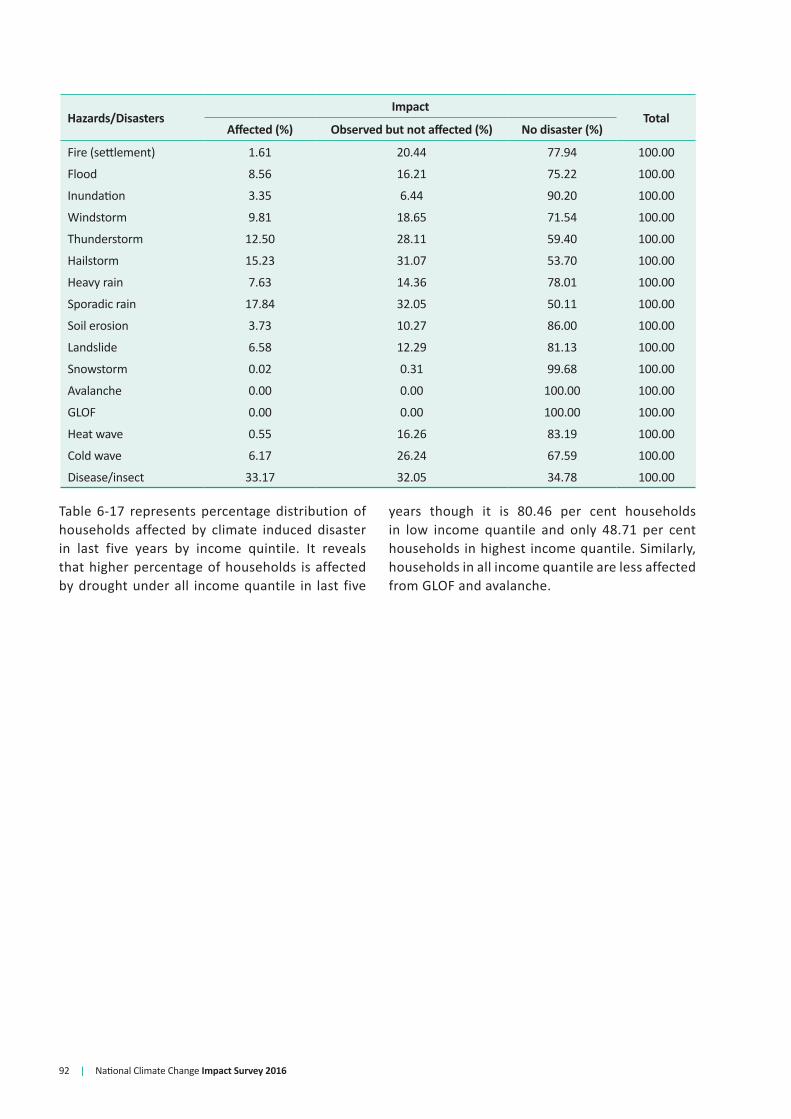
92 | National Climate Change Impact Survey 2016
Hazards/DisastersImpact
TotalAffected (%) Observed but not affected (%) No disaster (%)
Fire (settlement) 1.61 20.44 77.94 100.00
Flood 8.56 16.21 75.22 100.00
Inundation 3.35 6.44 90.20 100.00
Windstorm 9.81 18.65 71.54 100.00
Thunderstorm 12.50 28.11 59.40 100.00
Hailstorm 15.23 31.07 53.70 100.00
Heavy rain 7.63 14.36 78.01 100.00
Sporadic rain 17.84 32.05 50.11 100.00
Soil erosion 3.73 10.27 86.00 100.00
Landslide 6.58 12.29 81.13 100.00
Snowstorm 0.02 0.31 99.68 100.00
Avalanche 0.00 0.00 100.00 100.00
GLOF 0.00 0.00 100.00 100.00
Heat wave 0.55 16.26 83.19 100.00
Cold wave 6.17 26.24 67.59 100.00
Disease/insect 33.17 32.05 34.78 100.00
Table 6-17 represents percentage distribution of households affected by climate induced disaster in last five years by income quintile. It reveals that higher percentage of households is affected by drought under all income quantile in last five
years though it is 80.46 per cent households in low income quantile and only 48.71 per cent households in highest income quantile. Similarly, households in all income quantile are less affected from GLOF and avalanche.

National Climate Change Impact Survey 2016 | 93
Table 6-18: Households Affected by Climate Induced Disaster by Bio-Climatic Zone in Last Five Years
Hazards/DisastersImpact
TotalAffected (%) Observed but not affected (%) No disaster (%)
TropicalDrought 63.30 31.44 5.25 100.00Fire (forest) 8.70 17.04 74.26 100.00Fire (settlement) 4.24 34.64 61.12 100.00Flood 17.87 34.63 47.50 100.00Inundation 8.17 15.03 76.80 100.00Windstorm 20.73 28.94 50.32 100.00Thunderstorm 11.66 33.31 55.03 100.00Hailstorm 22.55 32.52 44.93 100.00Heavy rain 8.22 20.64 71.13 100.00Sporadic rain 10.68 32.53 56.80 100.00Soil erosion 3.00 9.91 87.09 100.00Landslide 3.29 8.54 88.18 100.00Snowstorm 0.00 0.01 99.99 100.00Avalanche 0.00 0.01 99.99 100.00GLOF 0.00 0.00 100.00 100.00Heat wave 1.27 13.46 85.27 100.00Cold wave 21.39 39.36 39.25 100.00Disease/insect 45.46 34.68 19.85 100.00Sub-TropicalDrought 69.71 13.79 16.50 100.00Fire (forest) 20.37 19.26 60.37 100.00Fire (settlement) 2.29 7.75 89.96 100.00Flood 3.60 10.02 86.37 100.00Inundation 0.00 0.00 100.00 100.00Windstorm 9.48 12.42 78.10 100.00Thunderstorm 16.84 26.50 56.67 100.00Hailstorm 29.67 26.79 43.54 100.00Heavy rain 4.42 14.68 80.90 100.00Sporadic rain 21.12 20.01 58.87 100.00Soil erosion 7.92 14.94 77.13 100.00Landslide 23.42 20.02 56.56 100.00Snowstorm 0.19 1.31 98.50 100.00Avalanche 0.00 0.08 99.92 100.00GLOF 0.00 0.10 99.90 100.00Heat wave 0.05 1.49 98.46 100.00Cold wave 2.35 3.66 94.00 100.00Disease/insect 44.79 18.87 36.34 100.00TemperateDrought 67.92 9.55 22.53 100.00Fire (forest) 8.26 11.05 80.68 100.00Fire (settlement) 1.01 2.66 96.33 100.00
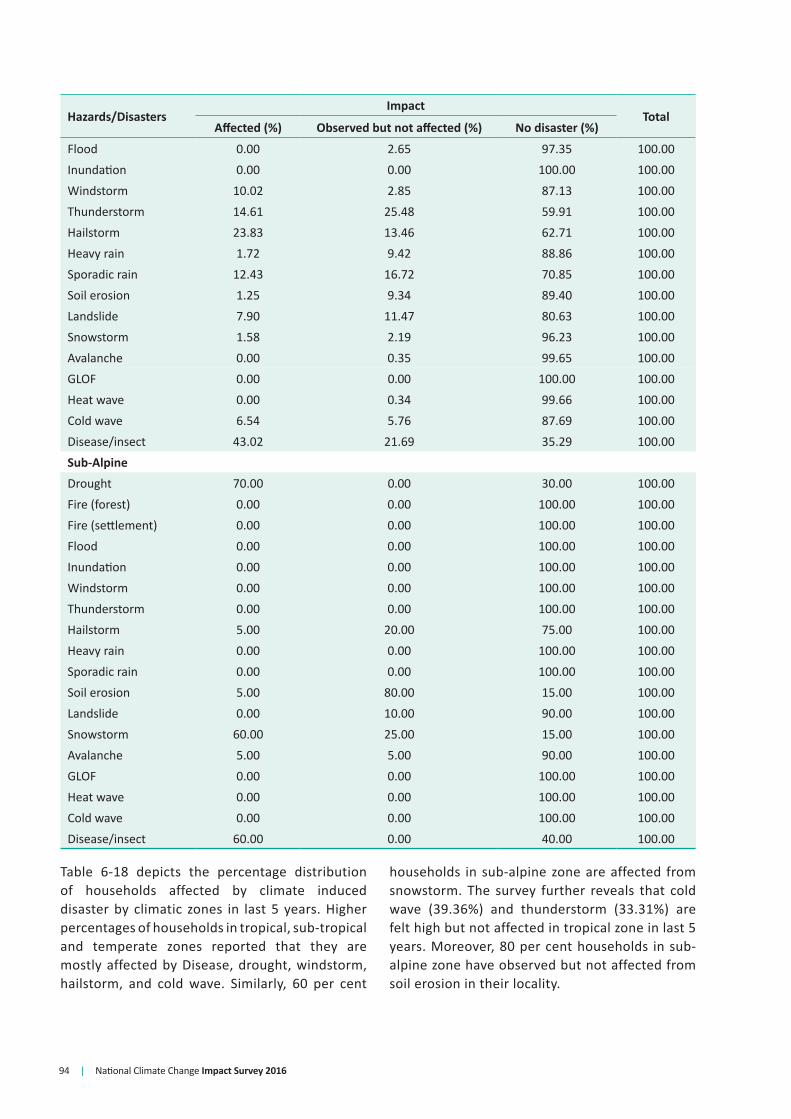
94 | National Climate Change Impact Survey 2016
Hazards/DisastersImpact
TotalAffected (%) Observed but not affected (%) No disaster (%)
Flood 0.00 2.65 97.35 100.00Inundation 0.00 0.00 100.00 100.00Windstorm 10.02 2.85 87.13 100.00Thunderstorm 14.61 25.48 59.91 100.00Hailstorm 23.83 13.46 62.71 100.00Heavy rain 1.72 9.42 88.86 100.00Sporadic rain 12.43 16.72 70.85 100.00Soil erosion 1.25 9.34 89.40 100.00Landslide 7.90 11.47 80.63 100.00Snowstorm 1.58 2.19 96.23 100.00Avalanche 0.00 0.35 99.65 100.00GLOF 0.00 0.00 100.00 100.00Heat wave 0.00 0.34 99.66 100.00Cold wave 6.54 5.76 87.69 100.00Disease/insect 43.02 21.69 35.29 100.00Sub-AlpineDrought 70.00 0.00 30.00 100.00Fire (forest) 0.00 0.00 100.00 100.00Fire (settlement) 0.00 0.00 100.00 100.00Flood 0.00 0.00 100.00 100.00Inundation 0.00 0.00 100.00 100.00Windstorm 0.00 0.00 100.00 100.00Thunderstorm 0.00 0.00 100.00 100.00Hailstorm 5.00 20.00 75.00 100.00Heavy rain 0.00 0.00 100.00 100.00Sporadic rain 0.00 0.00 100.00 100.00Soil erosion 5.00 80.00 15.00 100.00Landslide 0.00 10.00 90.00 100.00Snowstorm 60.00 25.00 15.00 100.00Avalanche 5.00 5.00 90.00 100.00GLOF 0.00 0.00 100.00 100.00Heat wave 0.00 0.00 100.00 100.00Cold wave 0.00 0.00 100.00 100.00Disease/insect 60.00 0.00 40.00 100.00
Table 6-18 depicts the percentage distribution of households affected by climate induced disaster by climatic zones in last 5 years. Higher percentages of households in tropical, sub-tropical and temperate zones reported that they are mostly affected by Disease, drought, windstorm, hailstorm, and cold wave. Similarly, 60 per cent
households in sub-alpine zone are affected from snowstorm. The survey further reveals that cold wave (39.36%) and thunderstorm (33.31%) are felt high but not affected in tropical zone in last 5 years. Moreover, 80 per cent households in sub-alpine zone have observed but not affected from soil erosion in their locality.
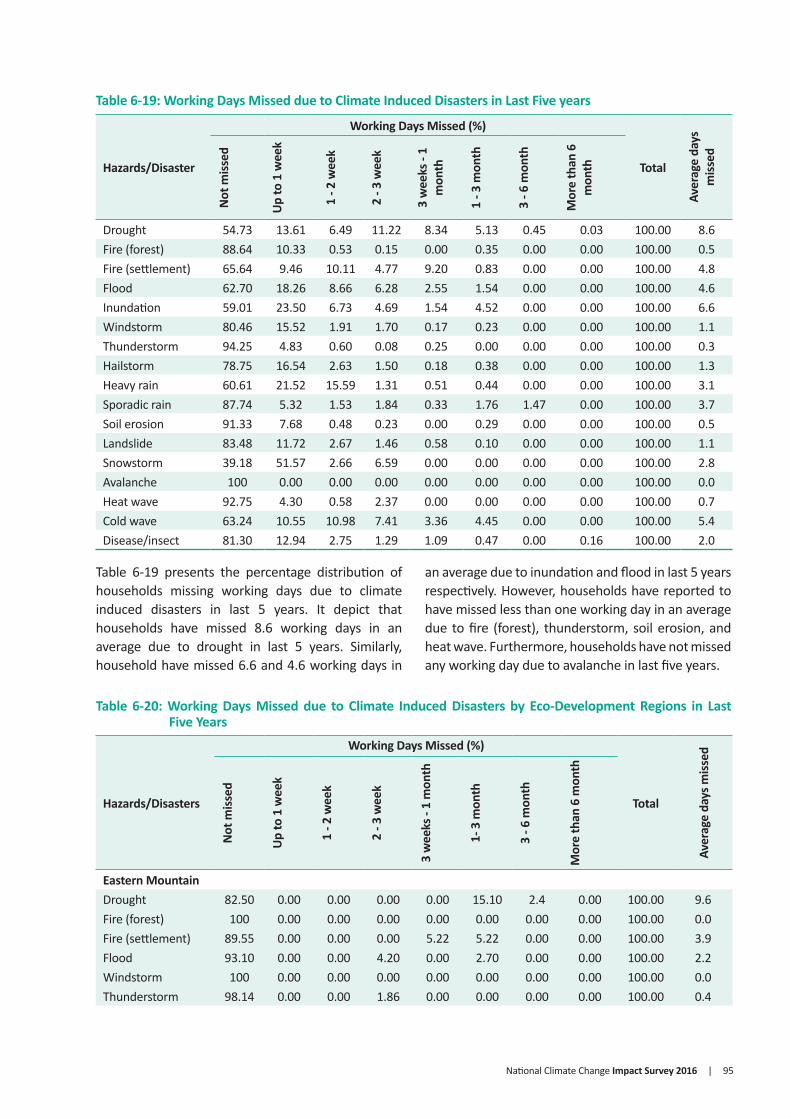
National Climate Change Impact Survey 2016 | 95
Table 6-19: Working Days Missed due to Climate Induced Disasters in Last Five years
Hazards/Disaster
Working Days Missed (%)
Total
Aver
age
days
m
issed
Not
miss
ed
Up
to 1
wee
k
1 - 2
wee
k
2 - 3
wee
k
3 w
eeks
- 1
mon
th
1 - 3
mon
th
3 - 6
mon
th
Mor
e th
an 6
m
onth
Drought 54.73 13.61 6.49 11.22 8.34 5.13 0.45 0.03 100.00 8.6Fire (forest) 88.64 10.33 0.53 0.15 0.00 0.35 0.00 0.00 100.00 0.5Fire (settlement) 65.64 9.46 10.11 4.77 9.20 0.83 0.00 0.00 100.00 4.8Flood 62.70 18.26 8.66 6.28 2.55 1.54 0.00 0.00 100.00 4.6Inundation 59.01 23.50 6.73 4.69 1.54 4.52 0.00 0.00 100.00 6.6Windstorm 80.46 15.52 1.91 1.70 0.17 0.23 0.00 0.00 100.00 1.1Thunderstorm 94.25 4.83 0.60 0.08 0.25 0.00 0.00 0.00 100.00 0.3Hailstorm 78.75 16.54 2.63 1.50 0.18 0.38 0.00 0.00 100.00 1.3Heavy rain 60.61 21.52 15.59 1.31 0.51 0.44 0.00 0.00 100.00 3.1Sporadic rain 87.74 5.32 1.53 1.84 0.33 1.76 1.47 0.00 100.00 3.7Soil erosion 91.33 7.68 0.48 0.23 0.00 0.29 0.00 0.00 100.00 0.5Landslide 83.48 11.72 2.67 1.46 0.58 0.10 0.00 0.00 100.00 1.1Snowstorm 39.18 51.57 2.66 6.59 0.00 0.00 0.00 0.00 100.00 2.8Avalanche 100 0.00 0.00 0.00 0.00 0.00 0.00 0.00 100.00 0.0Heat wave 92.75 4.30 0.58 2.37 0.00 0.00 0.00 0.00 100.00 0.7Cold wave 63.24 10.55 10.98 7.41 3.36 4.45 0.00 0.00 100.00 5.4Disease/insect 81.30 12.94 2.75 1.29 1.09 0.47 0.00 0.16 100.00 2.0
Table 6-19 presents the percentage distribution of households missing working days due to climate induced disasters in last 5 years. It depict that households have missed 8.6 working days in an average due to drought in last 5 years. Similarly, household have missed 6.6 and 4.6 working days in
an average due to inundation and flood in last 5 years respectively. However, households have reported to have missed less than one working day in an average due to fire (forest), thunderstorm, soil erosion, and heat wave. Furthermore, households have not missed any working day due to avalanche in last five years.
Table 6-20: Working Days Missed due to Climate Induced Disasters by Eco-Development Regions in Last Five Years
Hazards/Disasters
Working Days Missed (%)
Total
Aver
age
days
miss
ed
Not
miss
ed
Up
to 1
wee
k
1 - 2
wee
k
2 - 3
wee
k
3 w
eeks
- 1
mon
th
1- 3
mon
th
3 - 6
mon
th
Mor
e th
an 6
mon
th
Eastern MountainDrought 82.50 0.00 0.00 0.00 0.00 15.10 2.4 0.00 100.00 9.6Fire (forest) 100 0.00 0.00 0.00 0.00 0.00 0.00 0.00 100.00 0.0Fire (settlement) 89.55 0.00 0.00 0.00 5.22 5.22 0.00 0.00 100.00 3.9Flood 93.10 0.00 0.00 4.20 0.00 2.70 0.00 0.00 100.00 2.2Windstorm 100 0.00 0.00 0.00 0.00 0.00 0.00 0.00 100.00 0.0Thunderstorm 98.14 0.00 0.00 1.86 0.00 0.00 0.00 0.00 100.00 0.4
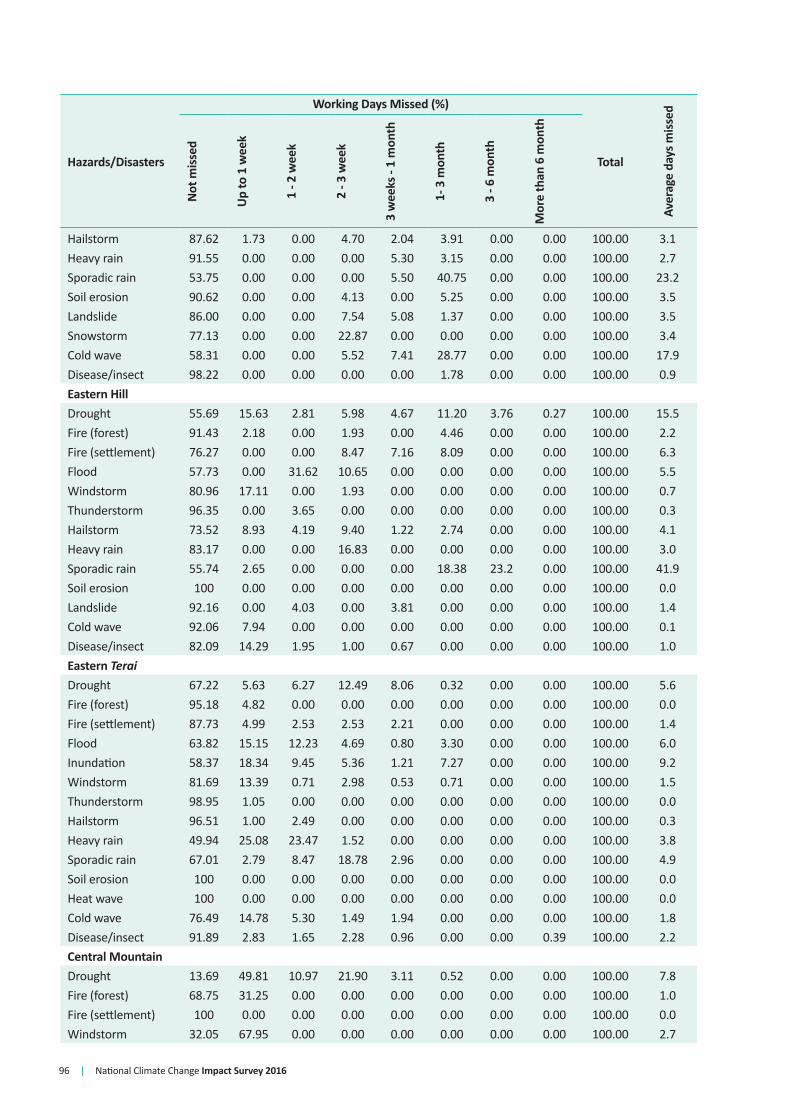
96 | National Climate Change Impact Survey 2016
Hazards/Disasters
Working Days Missed (%)
Total
Aver
age
days
miss
ed
Not
miss
ed
Up
to 1
wee
k
1 - 2
wee
k
2 - 3
wee
k
3 w
eeks
- 1
mon
th
1- 3
mon
th
3 - 6
mon
th
Mor
e th
an 6
mon
th
Hailstorm 87.62 1.73 0.00 4.70 2.04 3.91 0.00 0.00 100.00 3.1Heavy rain 91.55 0.00 0.00 0.00 5.30 3.15 0.00 0.00 100.00 2.7Sporadic rain 53.75 0.00 0.00 0.00 5.50 40.75 0.00 0.00 100.00 23.2Soil erosion 90.62 0.00 0.00 4.13 0.00 5.25 0.00 0.00 100.00 3.5Landslide 86.00 0.00 0.00 7.54 5.08 1.37 0.00 0.00 100.00 3.5Snowstorm 77.13 0.00 0.00 22.87 0.00 0.00 0.00 0.00 100.00 3.4Cold wave 58.31 0.00 0.00 5.52 7.41 28.77 0.00 0.00 100.00 17.9Disease/insect 98.22 0.00 0.00 0.00 0.00 1.78 0.00 0.00 100.00 0.9Eastern HillDrought 55.69 15.63 2.81 5.98 4.67 11.20 3.76 0.27 100.00 15.5Fire (forest) 91.43 2.18 0.00 1.93 0.00 4.46 0.00 0.00 100.00 2.2Fire (settlement) 76.27 0.00 0.00 8.47 7.16 8.09 0.00 0.00 100.00 6.3Flood 57.73 0.00 31.62 10.65 0.00 0.00 0.00 0.00 100.00 5.5Windstorm 80.96 17.11 0.00 1.93 0.00 0.00 0.00 0.00 100.00 0.7Thunderstorm 96.35 0.00 3.65 0.00 0.00 0.00 0.00 0.00 100.00 0.3Hailstorm 73.52 8.93 4.19 9.40 1.22 2.74 0.00 0.00 100.00 4.1Heavy rain 83.17 0.00 0.00 16.83 0.00 0.00 0.00 0.00 100.00 3.0Sporadic rain 55.74 2.65 0.00 0.00 0.00 18.38 23.2 0.00 100.00 41.9Soil erosion 100 0.00 0.00 0.00 0.00 0.00 0.00 0.00 100.00 0.0Landslide 92.16 0.00 4.03 0.00 3.81 0.00 0.00 0.00 100.00 1.4Cold wave 92.06 7.94 0.00 0.00 0.00 0.00 0.00 0.00 100.00 0.1Disease/insect 82.09 14.29 1.95 1.00 0.67 0.00 0.00 0.00 100.00 1.0Eastern Terai
Drought 67.22 5.63 6.27 12.49 8.06 0.32 0.00 0.00 100.00 5.6Fire (forest) 95.18 4.82 0.00 0.00 0.00 0.00 0.00 0.00 100.00 0.0Fire (settlement) 87.73 4.99 2.53 2.53 2.21 0.00 0.00 0.00 100.00 1.4Flood 63.82 15.15 12.23 4.69 0.80 3.30 0.00 0.00 100.00 6.0Inundation 58.37 18.34 9.45 5.36 1.21 7.27 0.00 0.00 100.00 9.2Windstorm 81.69 13.39 0.71 2.98 0.53 0.71 0.00 0.00 100.00 1.5Thunderstorm 98.95 1.05 0.00 0.00 0.00 0.00 0.00 0.00 100.00 0.0Hailstorm 96.51 1.00 2.49 0.00 0.00 0.00 0.00 0.00 100.00 0.3Heavy rain 49.94 25.08 23.47 1.52 0.00 0.00 0.00 0.00 100.00 3.8Sporadic rain 67.01 2.79 8.47 18.78 2.96 0.00 0.00 0.00 100.00 4.9Soil erosion 100 0.00 0.00 0.00 0.00 0.00 0.00 0.00 100.00 0.0Heat wave 100 0.00 0.00 0.00 0.00 0.00 0.00 0.00 100.00 0.0Cold wave 76.49 14.78 5.30 1.49 1.94 0.00 0.00 0.00 100.00 1.8Disease/insect 91.89 2.83 1.65 2.28 0.96 0.00 0.00 0.39 100.00 2.2Central MountainDrought 13.69 49.81 10.97 21.90 3.11 0.52 0.00 0.00 100.00 7.8Fire (forest) 68.75 31.25 0.00 0.00 0.00 0.00 0.00 0.00 100.00 1.0Fire (settlement) 100 0.00 0.00 0.00 0.00 0.00 0.00 0.00 100.00 0.0Windstorm 32.05 67.95 0.00 0.00 0.00 0.00 0.00 0.00 100.00 2.7
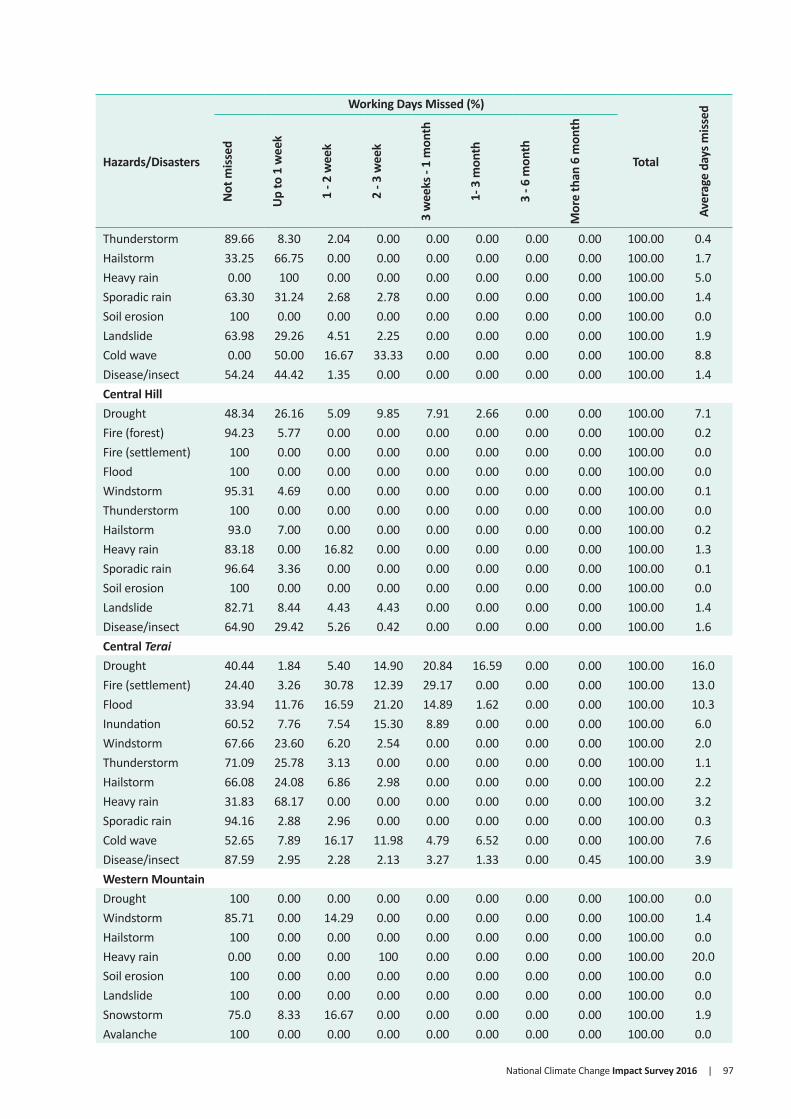
National Climate Change Impact Survey 2016 | 97
Hazards/Disasters
Working Days Missed (%)
Total
Aver
age
days
miss
ed
Not
miss
ed
Up
to 1
wee
k
1 - 2
wee
k
2 - 3
wee
k
3 w
eeks
- 1
mon
th
1- 3
mon
th
3 - 6
mon
th
Mor
e th
an 6
mon
th
Thunderstorm 89.66 8.30 2.04 0.00 0.00 0.00 0.00 0.00 100.00 0.4Hailstorm 33.25 66.75 0.00 0.00 0.00 0.00 0.00 0.00 100.00 1.7Heavy rain 0.00 100 0.00 0.00 0.00 0.00 0.00 0.00 100.00 5.0Sporadic rain 63.30 31.24 2.68 2.78 0.00 0.00 0.00 0.00 100.00 1.4Soil erosion 100 0.00 0.00 0.00 0.00 0.00 0.00 0.00 100.00 0.0Landslide 63.98 29.26 4.51 2.25 0.00 0.00 0.00 0.00 100.00 1.9Cold wave 0.00 50.00 16.67 33.33 0.00 0.00 0.00 0.00 100.00 8.8Disease/insect 54.24 44.42 1.35 0.00 0.00 0.00 0.00 0.00 100.00 1.4Central HillDrought 48.34 26.16 5.09 9.85 7.91 2.66 0.00 0.00 100.00 7.1Fire (forest) 94.23 5.77 0.00 0.00 0.00 0.00 0.00 0.00 100.00 0.2Fire (settlement) 100 0.00 0.00 0.00 0.00 0.00 0.00 0.00 100.00 0.0Flood 100 0.00 0.00 0.00 0.00 0.00 0.00 0.00 100.00 0.0Windstorm 95.31 4.69 0.00 0.00 0.00 0.00 0.00 0.00 100.00 0.1Thunderstorm 100 0.00 0.00 0.00 0.00 0.00 0.00 0.00 100.00 0.0Hailstorm 93.0 7.00 0.00 0.00 0.00 0.00 0.00 0.00 100.00 0.2Heavy rain 83.18 0.00 16.82 0.00 0.00 0.00 0.00 0.00 100.00 1.3Sporadic rain 96.64 3.36 0.00 0.00 0.00 0.00 0.00 0.00 100.00 0.1Soil erosion 100 0.00 0.00 0.00 0.00 0.00 0.00 0.00 100.00 0.0Landslide 82.71 8.44 4.43 4.43 0.00 0.00 0.00 0.00 100.00 1.4Disease/insect 64.90 29.42 5.26 0.42 0.00 0.00 0.00 0.00 100.00 1.6Central Terai
Drought 40.44 1.84 5.40 14.90 20.84 16.59 0.00 0.00 100.00 16.0Fire (settlement) 24.40 3.26 30.78 12.39 29.17 0.00 0.00 0.00 100.00 13.0Flood 33.94 11.76 16.59 21.20 14.89 1.62 0.00 0.00 100.00 10.3Inundation 60.52 7.76 7.54 15.30 8.89 0.00 0.00 0.00 100.00 6.0Windstorm 67.66 23.60 6.20 2.54 0.00 0.00 0.00 0.00 100.00 2.0Thunderstorm 71.09 25.78 3.13 0.00 0.00 0.00 0.00 0.00 100.00 1.1Hailstorm 66.08 24.08 6.86 2.98 0.00 0.00 0.00 0.00 100.00 2.2Heavy rain 31.83 68.17 0.00 0.00 0.00 0.00 0.00 0.00 100.00 3.2Sporadic rain 94.16 2.88 2.96 0.00 0.00 0.00 0.00 0.00 100.00 0.3Cold wave 52.65 7.89 16.17 11.98 4.79 6.52 0.00 0.00 100.00 7.6Disease/insect 87.59 2.95 2.28 2.13 3.27 1.33 0.00 0.45 100.00 3.9Western MountainDrought 100 0.00 0.00 0.00 0.00 0.00 0.00 0.00 100.00 0.0Windstorm 85.71 0.00 14.29 0.00 0.00 0.00 0.00 0.00 100.00 1.4Hailstorm 100 0.00 0.00 0.00 0.00 0.00 0.00 0.00 100.00 0.0Heavy rain 0.00 0.00 0.00 100 0.00 0.00 0.00 0.00 100.00 20.0Soil erosion 100 0.00 0.00 0.00 0.00 0.00 0.00 0.00 100.00 0.0Landslide 100 0.00 0.00 0.00 0.00 0.00 0.00 0.00 100.00 0.0Snowstorm 75.0 8.33 16.67 0.00 0.00 0.00 0.00 0.00 100.00 1.9Avalanche 100 0.00 0.00 0.00 0.00 0.00 0.00 0.00 100.00 0.0

98 | National Climate Change Impact Survey 2016
Hazards/Disasters
Working Days Missed (%)
Total
Aver
age
days
miss
ed
Not
miss
ed
Up
to 1
wee
k
1 - 2
wee
k
2 - 3
wee
k
3 w
eeks
- 1
mon
th
1- 3
mon
th
3 - 6
mon
th
Mor
e th
an 6
mon
th
Disease/insect 100 0.00 0.00 0.00 0.00 0.00 0.00 0.00 100.00 0.0Western HillDrought 76.12 8.74 13.48 1.66 0.00 0.00 0.00 0.00 100.00 2.1Fire (forest) 96.80 3.20 0.00 0.00 0.00 0.00 0.00 0.00 100.00 0.1Fire (settlement) 39.15 0.00 60.85 0.00 0.00 0.00 0.00 0.00 100.00 7.3Flood 91.45 0.00 0.00 8.55 0.00 0.00 0.00 0.00 100.00 1.3Windstorm 95.67 4.33 0.00 0.00 0.00 0.00 0.00 0.00 100.00 0.2Thunderstorm 93.15 5.58 0.00 0.00 1.27 0.00 0.00 0.00 100.00 0.5Hailstorm 93.73 2.67 3.60 0.00 0.00 0.00 0.00 0.00 100.00 0.4Heavy rain 90.64 9.36 0.00 0.00 0.00 0.00 0.00 0.00 100.00 0.5Sporadic rain 100 0.00 0.00 0.00 0.00 0.00 0.00 0.00 100.00 0.0Soil erosion 100 0.00 0.00 0.00 0.00 0.00 0.00 0.00 100.00 0.0Landslide 91.30 3.23 4.31 1.16 0.00 0.00 0.00 0.00 100.00 0.6Cold wave 100 0.00 0.00 0.00 0.00 0.00 0.00 0.00 100.00 0.0Disease/insect 98.13 0.00 1.87 0.00 0.00 0.00 0.00 0.00 100.00 0.2Western Terai
Drought 19.86 16.62 0.00 32.81 27.81 2.90 0.00 0.00 100.00 14.9Fire (forest) 100 0.00 0.00 0.00 0.00 0.00 0.00 0.00 100.00 0.0Fire (settlement) 80.95 19.05 0.00 0.00 0.00 0.00 0.00 0.00 100.00 0.8Flood 63.90 36.10 0.00 0.00 0.00 0.00 0.00 0.00 100.00 0.7Inundation 100 0.00 0.00 0.00 0.00 0.00 0.00 0.00 100.00 0.0Windstorm 0.00 0.00 100 0.00 0.00 0.00 0.00 0.00 100.00 10.0Thunderstorm 100 0.00 0.00 0.00 0.00 0.00 0.00 0.00 100.00 0.0Hailstorm 18.92 81.08 0.00 0.00 0.00 0.00 0.00 0.00 100.00 2.2Sporadic rain 100 0.00 0.00 0.00 0.00 0.00 0.00 0.00 100.00 0.0Heat wave 0.00 47.75 0.00 52.25 0.00 0.00 0.00 0.00 100.00 11.2Cold wave 26.79 0.00 73.21 0.00 0.00 0.00 0.00 0.00 100.00 7.3Disease/insect 47.83 52.17 0.00 0.00 0.00 0.00 0.00 0.00 100.00 2.1Mid-Western MountainDrought 36.19 0.00 4.53 40.19 11.95 7.14 0.00 0.00 100.00 13.9Fire (forest) 67.01 32.99 0.00 0.00 0.00 0.00 0.00 0.00 100.00 1.3Fire (settlement) 100 0.00 0.00 0.00 0.00 0.00 0.00 0.00 100.00 0.0Flood 100 0.00 0.00 0.00 0.00 0.00 0.00 0.00 100.00 0.0Heavy rain 0.00 0.00 0.00 0.00 0.00 100 0.00 0.00 100.00 40.0Landslide 100 0.00 0.00 0.00 0.00 0.00 0.00 0.00 100.00 0.0Disease/insect 78.77 11.17 10.06 0.00 0.00 0.00 0.00 0.00 100.00 1.7Mid-Western HillDrought 52.16 30.21 8.29 4.54 4.25 0.00 0.55 0.00 100.00 4.9Fire (forest) 95.10 4.90 0.00 0.00 0.00 0.00 0.00 0.00 100.00 0.1Flood 76.50 12.97 3.97 6.55 0.00 0.00 0.00 0.00 100.00 1.9Windstorm 82.64 14.56 2.80 0.00 0.00 0.00 0.00 0.00 100.00 0.7Thunderstorm 77.27 22.73 0.00 0.00 0.00 0.00 0.00 0.00 100.00 0.3

National Climate Change Impact Survey 2016 | 99
Hazards/Disasters
Working Days Missed (%)
Total
Aver
age
days
miss
ed
Not
miss
ed
Up
to 1
wee
k
1 - 2
wee
k
2 - 3
wee
k
3 w
eeks
- 1
mon
th
1- 3
mon
th
3 - 6
mon
th
Mor
e th
an 6
mon
th
Hailstorm 79.02 20.98 0.00 0.00 0.00 0.00 0.00 0.00 100.00 1.1Heavy rain 100 0.00 0.00 0.00 0.00 0.00 0.00 0.00 100.00 0.0Sporadic rain 70.56 29.44 0.00 0.00 0.00 0.00 0.00 0.00 100.00 1.3Soil erosion 100 0.00 0.00 0.00 0.00 0.00 0.00 0.00 100.00 0.0Landslide 92.49 7.51 0.00 0.00 0.00 0.00 0.00 0.00 100.00 0.2Heat wave 100 0.00 0.00 0.00 0.00 0.00 0.00 0.00 100.00 0.0Disease/insect 84.12 15.88 0.00 0.00 0.00 0.00 0.00 0.00 100.00 0.6Mid-Western Terai
Drought 77.09 13.00 1.73 5.95 1.64 0.58 0.00 0.00 100.00 2.6Fire (forest) 96.75 3.25 0.00 0.00 0.00 0.00 0.00 0.00 100.00 0.1Fire (settlement) 94.15 5.85 0.00 0.00 0.00 0.00 0.00 0.00 100.00 0.1Flood 62.70 34.56 2.74 0.00 0.00 0.00 0.00 0.00 100.00 1.7Inundation 71.04 28.96 0.00 0.00 0.00 0.00 0.00 0.00 100.00 1.0Windstorm 95.54 4.46 0.00 0.00 0.00 0.00 0.00 0.00 100.00 0.2Thunderstorm 100 0.00 0.00 0.00 0.00 0.00 0.00 0.00 100.00 0.0Hailstorm 47.65 50.58 1.77 0.00 0.00 0.00 0.00 0.00 100.00 2.1Heavy rain 47.53 52.47 0.00 0.00 0.00 0.00 0.00 0.00 100.00 2.0Sporadic rain 94.60 5.40 0.00 0.00 0.00 0.00 0.00 0.00 100.00 0.2Soil erosion 85.46 14.54 0.00 0.00 0.00 0.00 0.00 0.00 100.00 0.7Landslide 100 0.00 0.00 0.00 0.00 0.00 0.00 0.00 100.00 0.0Heat wave 90.79 9.21 0.00 0.00 0.00 0.00 0.00 0.00 100.00 0.4Cold wave 36.58 63.42 0.00 0.00 0.00 0.00 0.00 0.00 100.00 3.3Disease/insect 87.10 4.21 4.09 3.70 0.90 0.00 0.00 0.00 100.00 1.4Far-Western MountainDrought 15.30 4.37 37.49 38.36 4.47 0.00 0.00 0.00 100.00 11.9Fire (forest) 86.70 13.30 0.00 0.00 0.00 0.00 0.00 0.00 100.00 0.3Fire (settlement) 19.98 80.02 0.00 0.00 0.00 0.00 0.00 0.00 100.00 0.8Flood 90.23 9.77 0.00 0.00 0.00 0.00 0.00 0.00 100.00 0.2Windstorm 75.99 24.01 0.00 0.00 0.00 0.00 0.00 0.00 100.00 0.3Thunderstorm 100 0.00 0.00 0.00 0.00 0.00 0.00 0.00 100.00 0.0Hailstorm 60.0 40.00 0.00 0.00 0.00 0.00 0.00 0.00 100.00 0.6Heavy rain 36.40 63.60 0.00 0.00 0.00 0.00 0.00 0.00 100.00 3.5Sporadic rain 100 0.00 0.00 0.00 0.00 0.00 0.00 0.00 100.00 0.0Soil erosion 65.16 34.84 0.00 0.00 0.00 0.00 0.00 0.00 100.00 1.1Landslide 88.03 10.99 0.99 0.00 0.00 0.00 0.00 0.00 100.00 0.3Snowstorm 8.99 91.01 0.00 0.00 0.00 0.00 0.00 0.00 100.00 2.6Cold wave 47.44 14.42 22.95 15.19 0.00 0.00 0.00 0.00 100.00 5.9Disease/insect 100 0.00 0.00 0.00 0.00 0.00 0.00 0.00 100.00 0.0Far-Western HillDrought 75.81 19.59 4.27 0.33 0.00 0.00 0.00 0.00 100.00 1.2Fire (forest) 64.74 31.33 3.93 0.00 0.00 0.00 0.00 0.00 100.00 1.3Fire (settlement) 36.58 63.42 0.00 0.00 0.00 0.00 0.00 0.00 100.00 1.2
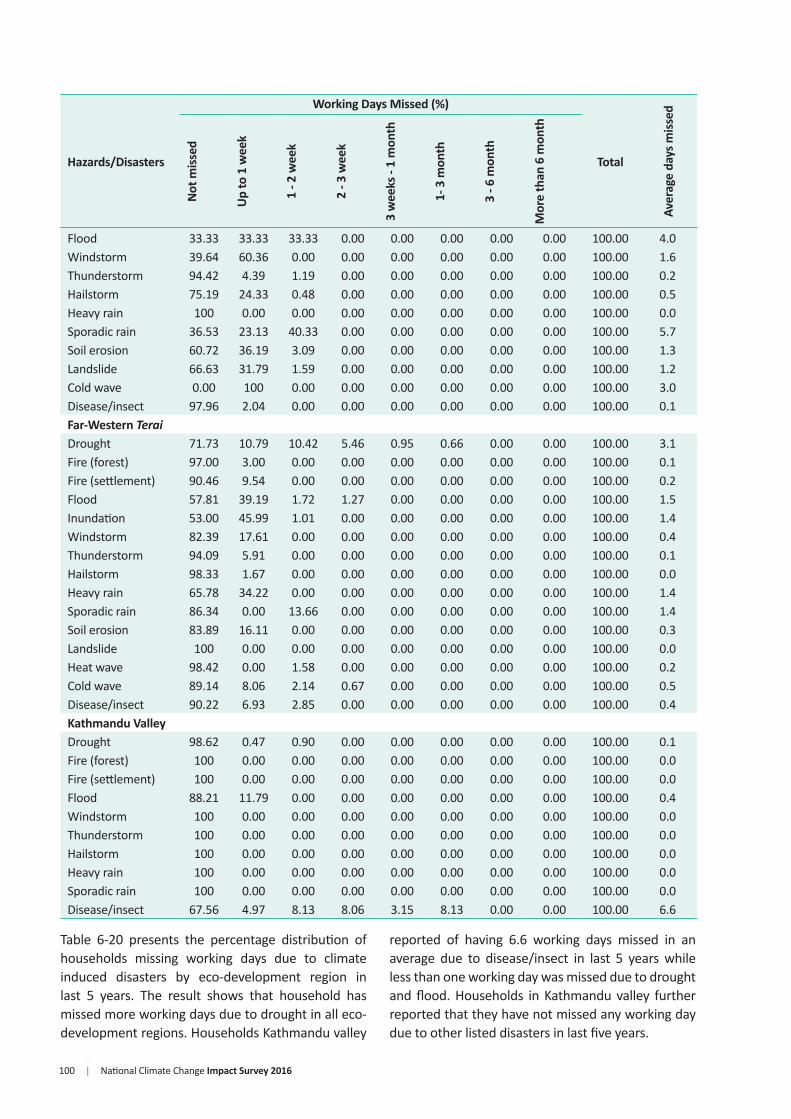
100 | National Climate Change Impact Survey 2016
Hazards/Disasters
Working Days Missed (%)
Total
Aver
age
days
miss
ed
Not
miss
ed
Up
to 1
wee
k
1 - 2
wee
k
2 - 3
wee
k
3 w
eeks
- 1
mon
th
1- 3
mon
th
3 - 6
mon
th
Mor
e th
an 6
mon
th
Flood 33.33 33.33 33.33 0.00 0.00 0.00 0.00 0.00 100.00 4.0Windstorm 39.64 60.36 0.00 0.00 0.00 0.00 0.00 0.00 100.00 1.6Thunderstorm 94.42 4.39 1.19 0.00 0.00 0.00 0.00 0.00 100.00 0.2Hailstorm 75.19 24.33 0.48 0.00 0.00 0.00 0.00 0.00 100.00 0.5Heavy rain 100 0.00 0.00 0.00 0.00 0.00 0.00 0.00 100.00 0.0Sporadic rain 36.53 23.13 40.33 0.00 0.00 0.00 0.00 0.00 100.00 5.7Soil erosion 60.72 36.19 3.09 0.00 0.00 0.00 0.00 0.00 100.00 1.3Landslide 66.63 31.79 1.59 0.00 0.00 0.00 0.00 0.00 100.00 1.2Cold wave 0.00 100 0.00 0.00 0.00 0.00 0.00 0.00 100.00 3.0Disease/insect 97.96 2.04 0.00 0.00 0.00 0.00 0.00 0.00 100.00 0.1Far-Western TeraiDrought 71.73 10.79 10.42 5.46 0.95 0.66 0.00 0.00 100.00 3.1Fire (forest) 97.00 3.00 0.00 0.00 0.00 0.00 0.00 0.00 100.00 0.1Fire (settlement) 90.46 9.54 0.00 0.00 0.00 0.00 0.00 0.00 100.00 0.2Flood 57.81 39.19 1.72 1.27 0.00 0.00 0.00 0.00 100.00 1.5Inundation 53.00 45.99 1.01 0.00 0.00 0.00 0.00 0.00 100.00 1.4Windstorm 82.39 17.61 0.00 0.00 0.00 0.00 0.00 0.00 100.00 0.4Thunderstorm 94.09 5.91 0.00 0.00 0.00 0.00 0.00 0.00 100.00 0.1Hailstorm 98.33 1.67 0.00 0.00 0.00 0.00 0.00 0.00 100.00 0.0Heavy rain 65.78 34.22 0.00 0.00 0.00 0.00 0.00 0.00 100.00 1.4Sporadic rain 86.34 0.00 13.66 0.00 0.00 0.00 0.00 0.00 100.00 1.4Soil erosion 83.89 16.11 0.00 0.00 0.00 0.00 0.00 0.00 100.00 0.3Landslide 100 0.00 0.00 0.00 0.00 0.00 0.00 0.00 100.00 0.0Heat wave 98.42 0.00 1.58 0.00 0.00 0.00 0.00 0.00 100.00 0.2Cold wave 89.14 8.06 2.14 0.67 0.00 0.00 0.00 0.00 100.00 0.5Disease/insect 90.22 6.93 2.85 0.00 0.00 0.00 0.00 0.00 100.00 0.4Kathmandu ValleyDrought 98.62 0.47 0.90 0.00 0.00 0.00 0.00 0.00 100.00 0.1Fire (forest) 100 0.00 0.00 0.00 0.00 0.00 0.00 0.00 100.00 0.0Fire (settlement) 100 0.00 0.00 0.00 0.00 0.00 0.00 0.00 100.00 0.0Flood 88.21 11.79 0.00 0.00 0.00 0.00 0.00 0.00 100.00 0.4Windstorm 100 0.00 0.00 0.00 0.00 0.00 0.00 0.00 100.00 0.0Thunderstorm 100 0.00 0.00 0.00 0.00 0.00 0.00 0.00 100.00 0.0Hailstorm 100 0.00 0.00 0.00 0.00 0.00 0.00 0.00 100.00 0.0Heavy rain 100 0.00 0.00 0.00 0.00 0.00 0.00 0.00 100.00 0.0Sporadic rain 100 0.00 0.00 0.00 0.00 0.00 0.00 0.00 100.00 0.0Disease/insect 67.56 4.97 8.13 8.06 3.15 8.13 0.00 0.00 100.00 6.6
Table 6-20 presents the percentage distribution of households missing working days due to climate induced disasters by eco-development region in last 5 years. The result shows that household has missed more working days due to drought in all eco-development regions. Households Kathmandu valley
reported of having 6.6 working days missed in an average due to disease/insect in last 5 years while less than one working day was missed due to drought and flood. Households in Kathmandu valley further reported that they have not missed any working day due to other listed disasters in last five years.

National Climate Change Impact Survey 2016 | 101
Table 6-21: Working Days Missed due to Climate Induced Disasters by Bio-Climatic Zone in Last Five Years
Hazards/Disasters
Working Days Missed (%)
Total
Aver
age
days
miss
ed
Not
miss
ed
Up
to 1
wee
k
1 - 2
wee
k
2 - 3
wee
k
3 w
eek
- 1 m
onth
1 - 3
mon
ths
3 - 6
mon
ths
Mor
e th
an 6
mon
ths
TropicalDrought 53.32 9.15 6.57 12.55 12.09 6.18 0.15 0.00 100.00 9.5Fire (forest) 93.87 5.73 0.00 0.00 0.00 0.41 0.00 0.00 100.00 0.3Fire (settlement) 64.39 4.76 13.39 5.44 11.19 0.84 0.00 0.00 100.00 5.7Flood 60.93 19.00 8.84 6.73 2.85 1.65 0.00 0.00 100.00 4.9Inundation 59.01 23.50 6.73 4.69 1.54 4.52 0.00 0.00 100.00 6.6Windstorm 79.54 15.58 2.33 2.02 0.22 0.30 0.00 0.00 100.00 1.3Thunderstorm 93.06 6.38 0.55 0.00 0.00 0.00 0.00 0.00 100.00 0.2Hailstorm 81.91 12.96 3.90 1.24 0.00 0.00 0.00 0.00 100.00 1.1Heavy rain 52.00 26.27 20.42 1.32 0.00 0.00 0.00 0.00 100.00 3.5Sporadic rain 89.68 3.33 2.48 3.46 0.55 0.18 0.33 0.00 100.00 1.5Soil erosion 96.27 3.73 0.00 0.00 0.00 0.00 0.00 0.00 100.00 0.1Landslide 83.84 5.98 7.16 1.94 1.08 0.00 0.00 0.00 100.00 1.3Heat wave 92.59 4.40 0.59 2.42 0.00 0.00 0.00 0.00 100.00 0.7Cold wave 63.08 10.66 11.60 7.49 3.38 3.80 0.00 0.00 100.00 5.1Disease/insect 86.35 6.91 2.77 1.58 1.58 0.53 0.00 0.27 100.00 2.5Sub-TropicalDrought 58.98 20.05 5.94 7.64 2.62 3.71 0.99 0.08 100.00 7.2Fire (forest) 85.98 12.46 0.97 0.27 0.00 0.32 0.00 0.00 100.00 0.7Fire (settlement) 71.24 21.78 0.00 2.86 3.27 0.85 0.00 0.00 100.00 2.1Flood 78.17 11.80 7.11 2.38 0.00 0.54 0.00 0.00 100.00 1.9Windstorm 82.22 16.56 0.53 0.69 0.00 0.00 0.00 0.00 100.00 0.5Thunderstorm 97.02 2.06 0.16 0.19 0.57 0.00 0.00 0.00 100.00 0.2Hailstorm 75.75 19.88 1.23 1.86 0.35 0.94 0.00 0.00 100.00 1.5Heavy rain 88.05 6.55 0.60 1.25 2.23 1.32 0.00 0.00 100.00 1.7Sporadic rain 88.14 4.81 0.62 0.35 0.16 3.31 2.60 0.00 100.00 5.7Soil erosion 87.84 10.48 0.81 0.38 0.00 0.49 0.00 0.00 100.00 0.7Landslide 82.74 13.56 1.68 1.41 0.48 0.13 0.00 0.00 100.00 1.1Snowstorm 28.95 71.05 0.00 0.00 0.00 0.00 0.00 0.00 100.00 2.1Heat wave 100 0.00 0.00 0.00 0.00 0.00 0.00 0.00 100.00 0.0Cold wave 60.69 11.81 3.40 6.25 2.92 14.93 0.00 0.00 100.00 10.1Disease/insect 73.53 22.13 2.76 0.83 0.35 0.40 0.00 0.00 100.00 1.4TemperateDrought 38.91 19.14 9.82 22.66 6.19 3.28 0.00 0.00 100.00 8.9Fire (forest) 64.88 35.12 0.00 0.00 0.00 0.00 0.00 0.00 100.00 1.0Fire (settlement) 39.78 60.22 0.00 0.00 0.00 0.00 0.00 0.00 100.00 0.6Windstorm 93.01 6.61 0.37 0.00 0.00 0.00 0.00 0.00 100.00 0.2Thunderstorm 82.77 12.36 4.87 0.00 0.00 0.00 0.00 0.00 100.00 0.7Hailstorm 67.11 30.35 0.00 1.55 0.99 0.00 0.00 0.00 100.00 1.3Heavy rain 76.17 10.09 0.00 2.17 0.00 11.56 0.00 0.00 100.00 5.7Sporadic rain 60.58 34.64 2.28 2.50 0.00 0.00 0.00 0.00 100.00 1.5
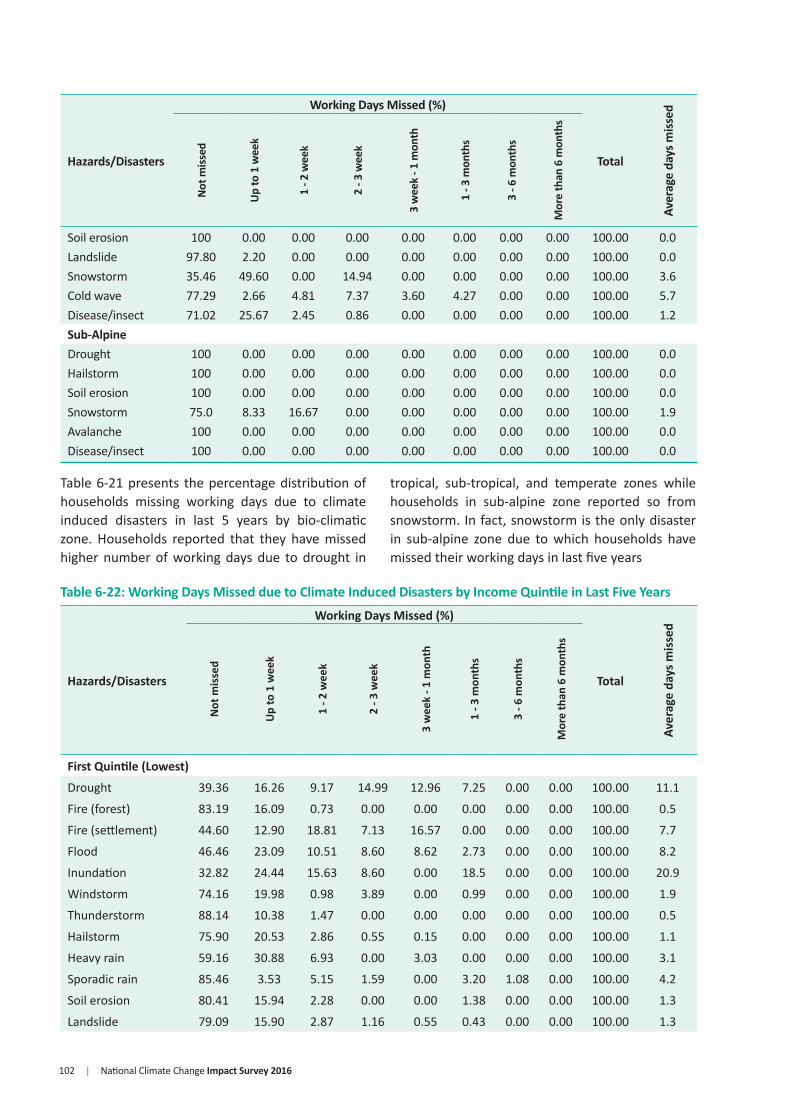
102 | National Climate Change Impact Survey 2016
Hazards/Disasters
Working Days Missed (%)
Total
Aver
age
days
miss
ed
Not
miss
ed
Up
to 1
wee
k
1 - 2
wee
k
2 - 3
wee
k
3 w
eek
- 1 m
onth
1 - 3
mon
ths
3 - 6
mon
ths
Mor
e th
an 6
mon
ths
Soil erosion 100 0.00 0.00 0.00 0.00 0.00 0.00 0.00 100.00 0.0Landslide 97.80 2.20 0.00 0.00 0.00 0.00 0.00 0.00 100.00 0.0Snowstorm 35.46 49.60 0.00 14.94 0.00 0.00 0.00 0.00 100.00 3.6Cold wave 77.29 2.66 4.81 7.37 3.60 4.27 0.00 0.00 100.00 5.7Disease/insect 71.02 25.67 2.45 0.86 0.00 0.00 0.00 0.00 100.00 1.2Sub-AlpineDrought 100 0.00 0.00 0.00 0.00 0.00 0.00 0.00 100.00 0.0Hailstorm 100 0.00 0.00 0.00 0.00 0.00 0.00 0.00 100.00 0.0Soil erosion 100 0.00 0.00 0.00 0.00 0.00 0.00 0.00 100.00 0.0Snowstorm 75.0 8.33 16.67 0.00 0.00 0.00 0.00 0.00 100.00 1.9Avalanche 100 0.00 0.00 0.00 0.00 0.00 0.00 0.00 100.00 0.0Disease/insect 100 0.00 0.00 0.00 0.00 0.00 0.00 0.00 100.00 0.0
Table 6-21 presents the percentage distribution of households missing working days due to climate induced disasters in last 5 years by bio-climatic zone. Households reported that they have missed higher number of working days due to drought in
tropical, sub-tropical, and temperate zones while households in sub-alpine zone reported so from snowstorm. In fact, snowstorm is the only disaster in sub-alpine zone due to which households have missed their working days in last five years
Table 6-22: Working Days Missed due to Climate Induced Disasters by Income Quintile in Last Five Years
Hazards/Disasters
Working Days Missed (%)
TotalAv
erag
e da
ys m
isse
d
Not
mis
sed
Up
to 1
wee
k
1 - 2
wee
k
2 - 3
wee
k
3 w
eek
- 1 m
onth
1 - 3
mon
ths
3 - 6
mon
ths
Mor
e th
an 6
mon
ths
First Quintile (Lowest)
Drought 39.36 16.26 9.17 14.99 12.96 7.25 0.00 0.00 100.00 11.1
Fire (forest) 83.19 16.09 0.73 0.00 0.00 0.00 0.00 0.00 100.00 0.5
Fire (settlement) 44.60 12.90 18.81 7.13 16.57 0.00 0.00 0.00 100.00 7.7
Flood 46.46 23.09 10.51 8.60 8.62 2.73 0.00 0.00 100.00 8.2
Inundation 32.82 24.44 15.63 8.60 0.00 18.5 0.00 0.00 100.00 20.9
Windstorm 74.16 19.98 0.98 3.89 0.00 0.99 0.00 0.00 100.00 1.9
Thunderstorm 88.14 10.38 1.47 0.00 0.00 0.00 0.00 0.00 100.00 0.5
Hailstorm 75.90 20.53 2.86 0.55 0.15 0.00 0.00 0.00 100.00 1.1
Heavy rain 59.16 30.88 6.93 0.00 3.03 0.00 0.00 0.00 100.00 3.1
Sporadic rain 85.46 3.53 5.15 1.59 0.00 3.20 1.08 0.00 100.00 4.2
Soil erosion 80.41 15.94 2.28 0.00 0.00 1.38 0.00 0.00 100.00 1.3
Landslide 79.09 15.90 2.87 1.16 0.55 0.43 0.00 0.00 100.00 1.3
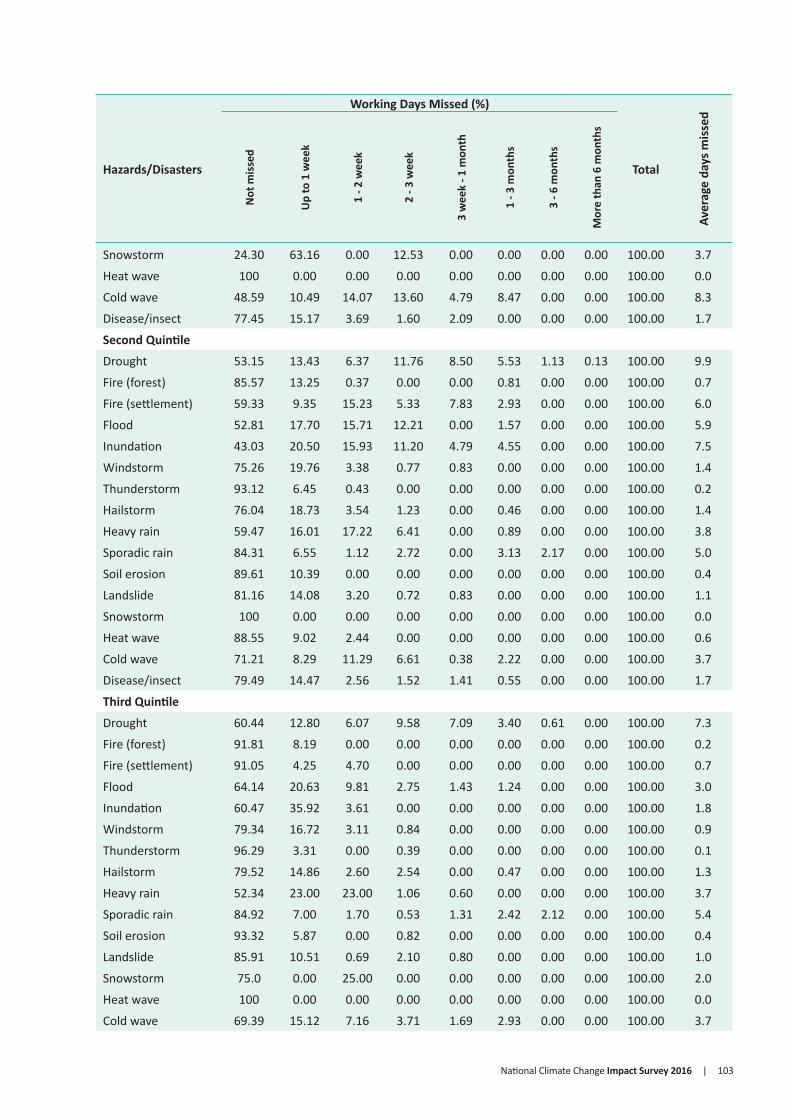
National Climate Change Impact Survey 2016 | 103
Hazards/Disasters
Working Days Missed (%)
Total
Aver
age
days
mis
sed
Not
mis
sed
Up
to 1
wee
k
1 - 2
wee
k
2 - 3
wee
k
3 w
eek
- 1 m
onth
1 - 3
mon
ths
3 - 6
mon
ths
Mor
e th
an 6
mon
ths
Snowstorm 24.30 63.16 0.00 12.53 0.00 0.00 0.00 0.00 100.00 3.7
Heat wave 100 0.00 0.00 0.00 0.00 0.00 0.00 0.00 100.00 0.0
Cold wave 48.59 10.49 14.07 13.60 4.79 8.47 0.00 0.00 100.00 8.3
Disease/insect 77.45 15.17 3.69 1.60 2.09 0.00 0.00 0.00 100.00 1.7
Second Quintile
Drought 53.15 13.43 6.37 11.76 8.50 5.53 1.13 0.13 100.00 9.9
Fire (forest) 85.57 13.25 0.37 0.00 0.00 0.81 0.00 0.00 100.00 0.7
Fire (settlement) 59.33 9.35 15.23 5.33 7.83 2.93 0.00 0.00 100.00 6.0
Flood 52.81 17.70 15.71 12.21 0.00 1.57 0.00 0.00 100.00 5.9
Inundation 43.03 20.50 15.93 11.20 4.79 4.55 0.00 0.00 100.00 7.5
Windstorm 75.26 19.76 3.38 0.77 0.83 0.00 0.00 0.00 100.00 1.4
Thunderstorm 93.12 6.45 0.43 0.00 0.00 0.00 0.00 0.00 100.00 0.2
Hailstorm 76.04 18.73 3.54 1.23 0.00 0.46 0.00 0.00 100.00 1.4
Heavy rain 59.47 16.01 17.22 6.41 0.00 0.89 0.00 0.00 100.00 3.8
Sporadic rain 84.31 6.55 1.12 2.72 0.00 3.13 2.17 0.00 100.00 5.0
Soil erosion 89.61 10.39 0.00 0.00 0.00 0.00 0.00 0.00 100.00 0.4
Landslide 81.16 14.08 3.20 0.72 0.83 0.00 0.00 0.00 100.00 1.1
Snowstorm 100 0.00 0.00 0.00 0.00 0.00 0.00 0.00 100.00 0.0
Heat wave 88.55 9.02 2.44 0.00 0.00 0.00 0.00 0.00 100.00 0.6
Cold wave 71.21 8.29 11.29 6.61 0.38 2.22 0.00 0.00 100.00 3.7
Disease/insect 79.49 14.47 2.56 1.52 1.41 0.55 0.00 0.00 100.00 1.7
Third Quintile
Drought 60.44 12.80 6.07 9.58 7.09 3.40 0.61 0.00 100.00 7.3
Fire (forest) 91.81 8.19 0.00 0.00 0.00 0.00 0.00 0.00 100.00 0.2
Fire (settlement) 91.05 4.25 4.70 0.00 0.00 0.00 0.00 0.00 100.00 0.7
Flood 64.14 20.63 9.81 2.75 1.43 1.24 0.00 0.00 100.00 3.0
Inundation 60.47 35.92 3.61 0.00 0.00 0.00 0.00 0.00 100.00 1.8
Windstorm 79.34 16.72 3.11 0.84 0.00 0.00 0.00 0.00 100.00 0.9
Thunderstorm 96.29 3.31 0.00 0.39 0.00 0.00 0.00 0.00 100.00 0.1
Hailstorm 79.52 14.86 2.60 2.54 0.00 0.47 0.00 0.00 100.00 1.3
Heavy rain 52.34 23.00 23.00 1.06 0.60 0.00 0.00 0.00 100.00 3.7
Sporadic rain 84.92 7.00 1.70 0.53 1.31 2.42 2.12 0.00 100.00 5.4
Soil erosion 93.32 5.87 0.00 0.82 0.00 0.00 0.00 0.00 100.00 0.4
Landslide 85.91 10.51 0.69 2.10 0.80 0.00 0.00 0.00 100.00 1.0
Snowstorm 75.0 0.00 25.00 0.00 0.00 0.00 0.00 0.00 100.00 2.0
Heat wave 100 0.00 0.00 0.00 0.00 0.00 0.00 0.00 100.00 0.0
Cold wave 69.39 15.12 7.16 3.71 1.69 2.93 0.00 0.00 100.00 3.7
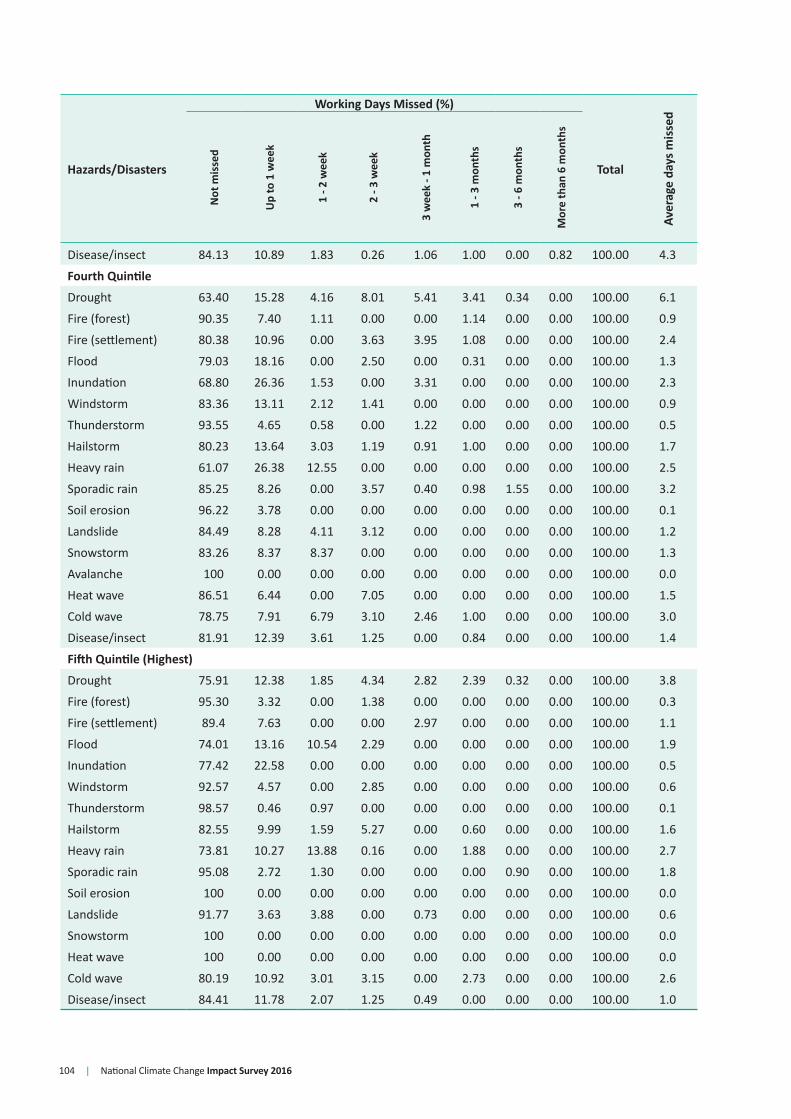
104 | National Climate Change Impact Survey 2016
Hazards/Disasters
Working Days Missed (%)
Total
Aver
age
days
mis
sed
Not
mis
sed
Up
to 1
wee
k
1 - 2
wee
k
2 - 3
wee
k
3 w
eek
- 1 m
onth
1 - 3
mon
ths
3 - 6
mon
ths
Mor
e th
an 6
mon
ths
Disease/insect 84.13 10.89 1.83 0.26 1.06 1.00 0.00 0.82 100.00 4.3
Fourth Quintile
Drought 63.40 15.28 4.16 8.01 5.41 3.41 0.34 0.00 100.00 6.1
Fire (forest) 90.35 7.40 1.11 0.00 0.00 1.14 0.00 0.00 100.00 0.9
Fire (settlement) 80.38 10.96 0.00 3.63 3.95 1.08 0.00 0.00 100.00 2.4
Flood 79.03 18.16 0.00 2.50 0.00 0.31 0.00 0.00 100.00 1.3
Inundation 68.80 26.36 1.53 0.00 3.31 0.00 0.00 0.00 100.00 2.3
Windstorm 83.36 13.11 2.12 1.41 0.00 0.00 0.00 0.00 100.00 0.9
Thunderstorm 93.55 4.65 0.58 0.00 1.22 0.00 0.00 0.00 100.00 0.5
Hailstorm 80.23 13.64 3.03 1.19 0.91 1.00 0.00 0.00 100.00 1.7
Heavy rain 61.07 26.38 12.55 0.00 0.00 0.00 0.00 0.00 100.00 2.5
Sporadic rain 85.25 8.26 0.00 3.57 0.40 0.98 1.55 0.00 100.00 3.2
Soil erosion 96.22 3.78 0.00 0.00 0.00 0.00 0.00 0.00 100.00 0.1
Landslide 84.49 8.28 4.11 3.12 0.00 0.00 0.00 0.00 100.00 1.2
Snowstorm 83.26 8.37 8.37 0.00 0.00 0.00 0.00 0.00 100.00 1.3
Avalanche 100 0.00 0.00 0.00 0.00 0.00 0.00 0.00 100.00 0.0
Heat wave 86.51 6.44 0.00 7.05 0.00 0.00 0.00 0.00 100.00 1.5
Cold wave 78.75 7.91 6.79 3.10 2.46 1.00 0.00 0.00 100.00 3.0
Disease/insect 81.91 12.39 3.61 1.25 0.00 0.84 0.00 0.00 100.00 1.4
Fifth Quintile (Highest)
Drought 75.91 12.38 1.85 4.34 2.82 2.39 0.32 0.00 100.00 3.8
Fire (forest) 95.30 3.32 0.00 1.38 0.00 0.00 0.00 0.00 100.00 0.3
Fire (settlement) 89.4 7.63 0.00 0.00 2.97 0.00 0.00 0.00 100.00 1.1
Flood 74.01 13.16 10.54 2.29 0.00 0.00 0.00 0.00 100.00 1.9
Inundation 77.42 22.58 0.00 0.00 0.00 0.00 0.00 0.00 100.00 0.5
Windstorm 92.57 4.57 0.00 2.85 0.00 0.00 0.00 0.00 100.00 0.6
Thunderstorm 98.57 0.46 0.97 0.00 0.00 0.00 0.00 0.00 100.00 0.1
Hailstorm 82.55 9.99 1.59 5.27 0.00 0.60 0.00 0.00 100.00 1.6
Heavy rain 73.81 10.27 13.88 0.16 0.00 1.88 0.00 0.00 100.00 2.7
Sporadic rain 95.08 2.72 1.30 0.00 0.00 0.00 0.90 0.00 100.00 1.8
Soil erosion 100 0.00 0.00 0.00 0.00 0.00 0.00 0.00 100.00 0.0
Landslide 91.77 3.63 3.88 0.00 0.73 0.00 0.00 0.00 100.00 0.6
Snowstorm 100 0.00 0.00 0.00 0.00 0.00 0.00 0.00 100.00 0.0
Heat wave 100 0.00 0.00 0.00 0.00 0.00 0.00 0.00 100.00 0.0
Cold wave 80.19 10.92 3.01 3.15 0.00 2.73 0.00 0.00 100.00 2.6
Disease/insect 84.41 11.78 2.07 1.25 0.49 0.00 0.00 0.00 100.00 1.0

National Climate Change Impact Survey 2016 | 105
Table 6-22 shows the percentage distribution of households missing working days due to climate induced disasters in last 5 years by income quintile. Households in all income quantile have reported to have missed higher number of working days due to drought in last five years. However, households under lowest income quantile have reported to have missed 11.1 days in an average due to drought
while it is reported that only 3.8 days in an average has been missed by the households under highest income quantile. Households under lower income quantile reported to have missed less than one working day due to forest fire, and thunderstorm while it was inundation, windstorm, thunderstorm, and windstorm for households under highest income quantile.
6.6. Food Scarcity Table 6-23: Households Facing Food Scarcity in Last Five Years
DisastersHouseholds Facing Food Scarcity (%)
TotalYes No Not applicable
Drought 32.86 65.99 1.15 100.00
Fire (forest) 2.27 95.61 2.12 100.00
Fire (settlement) 14.86 84.72 0.42 100.00
Flood 15.50 83.58 0.92 100.00
Inundation 14.71 84.90 0.39 100.00
Windstorm 10.10 89.04 0.86 100.00
Thunderstorm 0.89 96.73 2.39 100.00
Hailstorm 26.15 72.77 1.08 100.00
Heavy rain 4.20 95.56 0.24 100.00
Sporadic rain 20.78 76.49 2.72 100.00
Soil erosion 15.03 84.56 0.41 100.00
Landslide 12.21 87.04 0.75 100.00
Snowstorm 0.00 100.00 0.00 100.00
Avalanche 0.00 100.00 0.00 100.00
Heat wave 0.00 100.00 0.00 100.00
Cold wave 5.92 93.90 0.18 100.00
Disease/insect 21.69 77.99 0.32 100.00
Table 6-23 shows percentage distribution of households facing food scarcity due to climate induced disaster in last 5 years. Higher percentage of households are facing food scarcity due to drought (32.86%) followed by hailstorm (26.12%),
Disease/insect (21.69%), sporadic rain (20.78%), and flood (15.50%) in last 5 years. However, all respondents reported that they have not faced food scarcity due to snowstorm, avalanche, and heatwave.
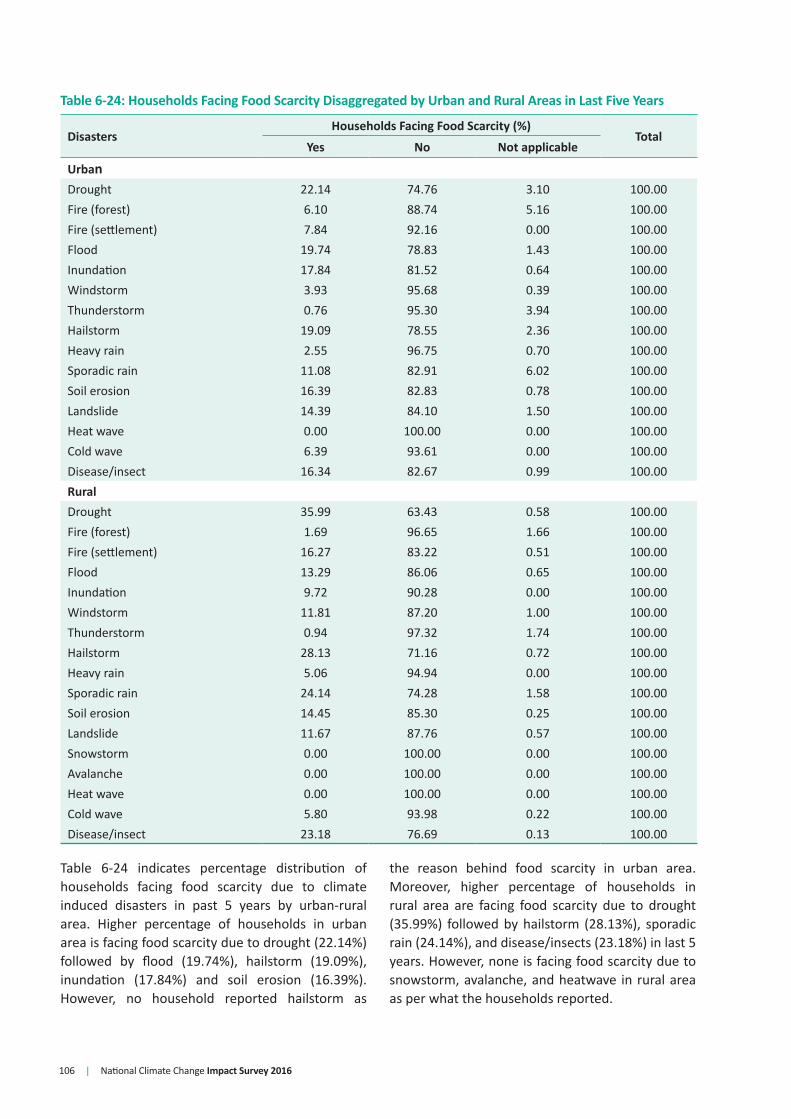
106 | National Climate Change Impact Survey 2016
Table 6-24: Households Facing Food Scarcity Disaggregated by Urban and Rural Areas in Last Five Years
DisastersHouseholds Facing Food Scarcity (%)
TotalYes No Not applicable
UrbanDrought 22.14 74.76 3.10 100.00Fire (forest) 6.10 88.74 5.16 100.00Fire (settlement) 7.84 92.16 0.00 100.00Flood 19.74 78.83 1.43 100.00Inundation 17.84 81.52 0.64 100.00Windstorm 3.93 95.68 0.39 100.00Thunderstorm 0.76 95.30 3.94 100.00Hailstorm 19.09 78.55 2.36 100.00Heavy rain 2.55 96.75 0.70 100.00Sporadic rain 11.08 82.91 6.02 100.00Soil erosion 16.39 82.83 0.78 100.00Landslide 14.39 84.10 1.50 100.00Heat wave 0.00 100.00 0.00 100.00Cold wave 6.39 93.61 0.00 100.00Disease/insect 16.34 82.67 0.99 100.00RuralDrought 35.99 63.43 0.58 100.00Fire (forest) 1.69 96.65 1.66 100.00Fire (settlement) 16.27 83.22 0.51 100.00Flood 13.29 86.06 0.65 100.00Inundation 9.72 90.28 0.00 100.00Windstorm 11.81 87.20 1.00 100.00Thunderstorm 0.94 97.32 1.74 100.00Hailstorm 28.13 71.16 0.72 100.00Heavy rain 5.06 94.94 0.00 100.00Sporadic rain 24.14 74.28 1.58 100.00Soil erosion 14.45 85.30 0.25 100.00Landslide 11.67 87.76 0.57 100.00Snowstorm 0.00 100.00 0.00 100.00Avalanche 0.00 100.00 0.00 100.00Heat wave 0.00 100.00 0.00 100.00Cold wave 5.80 93.98 0.22 100.00Disease/insect 23.18 76.69 0.13 100.00
Table 6-24 indicates percentage distribution of households facing food scarcity due to climate induced disasters in past 5 years by urban-rural area. Higher percentage of households in urban area is facing food scarcity due to drought (22.14%) followed by flood (19.74%), hailstorm (19.09%), inundation (17.84%) and soil erosion (16.39%). However, no household reported hailstorm as
the reason behind food scarcity in urban area. Moreover, higher percentage of households in rural area are facing food scarcity due to drought (35.99%) followed by hailstorm (28.13%), sporadic rain (24.14%), and disease/insects (23.18%) in last 5 years. However, none is facing food scarcity due to snowstorm, avalanche, and heatwave in rural area as per what the households reported.
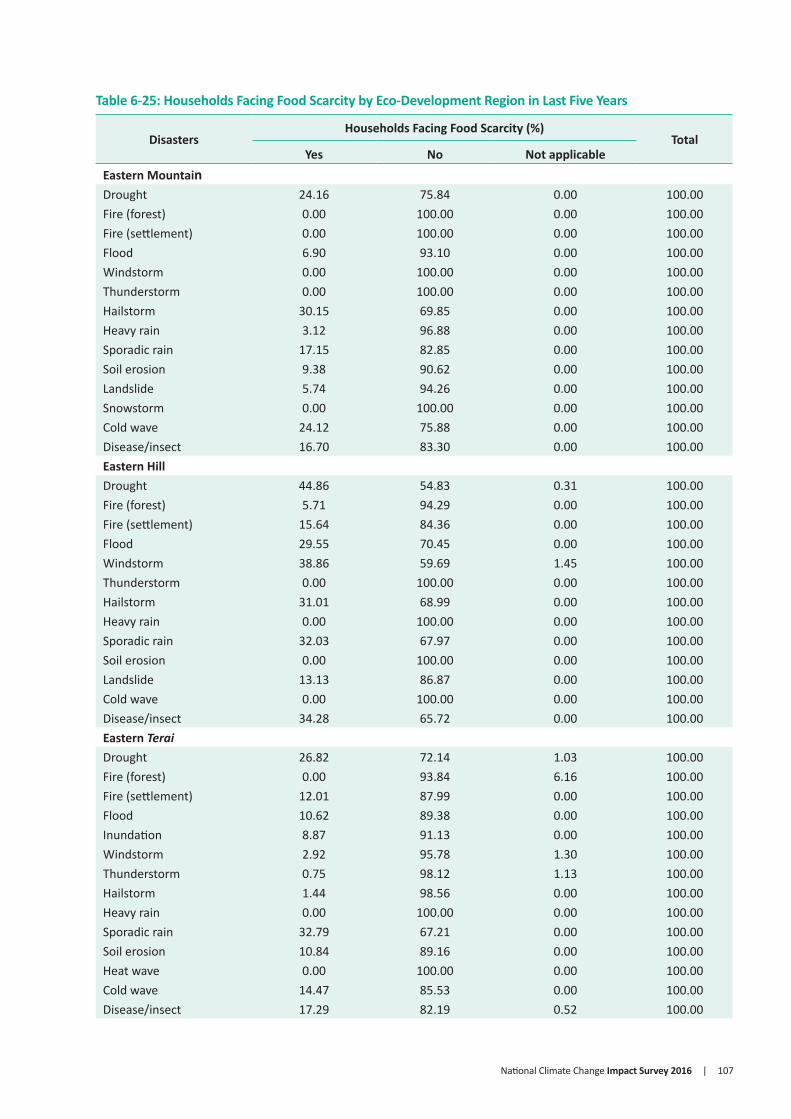
National Climate Change Impact Survey 2016 | 107
Table 6-25: Households Facing Food Scarcity by Eco-Development Region in Last Five Years
DisastersHouseholds Facing Food Scarcity (%)
TotalYes No Not applicable
Eastern MountainDrought 24.16 75.84 0.00 100.00Fire (forest) 0.00 100.00 0.00 100.00Fire (settlement) 0.00 100.00 0.00 100.00Flood 6.90 93.10 0.00 100.00Windstorm 0.00 100.00 0.00 100.00Thunderstorm 0.00 100.00 0.00 100.00Hailstorm 30.15 69.85 0.00 100.00Heavy rain 3.12 96.88 0.00 100.00Sporadic rain 17.15 82.85 0.00 100.00Soil erosion 9.38 90.62 0.00 100.00Landslide 5.74 94.26 0.00 100.00Snowstorm 0.00 100.00 0.00 100.00Cold wave 24.12 75.88 0.00 100.00Disease/insect 16.70 83.30 0.00 100.00Eastern HillDrought 44.86 54.83 0.31 100.00Fire (forest) 5.71 94.29 0.00 100.00Fire (settlement) 15.64 84.36 0.00 100.00Flood 29.55 70.45 0.00 100.00Windstorm 38.86 59.69 1.45 100.00Thunderstorm 0.00 100.00 0.00 100.00Hailstorm 31.01 68.99 0.00 100.00Heavy rain 0.00 100.00 0.00 100.00Sporadic rain 32.03 67.97 0.00 100.00Soil erosion 0.00 100.00 0.00 100.00Landslide 13.13 86.87 0.00 100.00Cold wave 0.00 100.00 0.00 100.00Disease/insect 34.28 65.72 0.00 100.00Eastern Terai
Drought 26.82 72.14 1.03 100.00Fire (forest) 0.00 93.84 6.16 100.00Fire (settlement) 12.01 87.99 0.00 100.00Flood 10.62 89.38 0.00 100.00Inundation 8.87 91.13 0.00 100.00Windstorm 2.92 95.78 1.30 100.00Thunderstorm 0.75 98.12 1.13 100.00Hailstorm 1.44 98.56 0.00 100.00Heavy rain 0.00 100.00 0.00 100.00Sporadic rain 32.79 67.21 0.00 100.00Soil erosion 10.84 89.16 0.00 100.00Heat wave 0.00 100.00 0.00 100.00Cold wave 14.47 85.53 0.00 100.00Disease/insect 17.29 82.19 0.52 100.00

108 | National Climate Change Impact Survey 2016
DisastersHouseholds Facing Food Scarcity (%)
TotalYes No Not applicable
Central MountainDrought 94.50 5.50 0.00 100.00Fire (forest) 4.80 95.20 0.00 100.00Fire (settlement) 0.00 100.00 0.00 100.00Windstorm 0.00 100.00 0.00 100.00Thunderstorm 4.08 95.92 0.00 100.00Hailstorm 95.32 4.68 0.00 100.00Heavy rain 100.00 0.00 0.00 100.00Sporadic rain 74.44 25.56 0.00 100.00Soil erosion 0.00 100.00 0.00 100.00Landslide 7.16 92.84 0.00 100.00Cold wave 16.67 83.33 0.00 100.00Disease/insect 84.60 15.40 0.00 100.00Central HillDrought 24.46 75.39 0.15 100.00Fire (forest) 1.14 98.34 0.52 100.00Fire (settlement) 0.00 100.00 0.00 100.00Flood 32.15 67.85 0.00 100.00Windstorm 2.40 97.60 0.00 100.00Thunderstorm 0.00 98.41 1.59 100.00Hailstorm 0.85 99.15 0.00 100.00Heavy rain 0.00 100.00 0.00 100.00Sporadic rain 19.43 80.17 0.41 100.00Soil erosion 0.00 100.00 0.00 100.00Landslide 12.86 87.14 0.00 100.00Disease/insect 21.24 78.76 0.00 100.00Central Terai
Drought 10.34 88.63 1.03 100.00Fire (settlement) 28.24 71.76 0.00 100.00Flood 4.77 90.88 4.35 100.00Inundation 7.76 89.14 3.11 100.00Windstorm 2.38 97.26 0.36 100.00Thunderstorm 0.00 100.00 0.00 100.00Hailstorm 1.64 97.39 0.97 100.00Heavy rain 0.00 100.00 0.00 100.00Sporadic rain 0.00 100.00 0.00 100.00Cold wave 0.00 100.00 0.00 100.00Disease/insect 5.62 94.38 0.00 100.00Western MountainDrought 0.00 100.00 0.00 100.00Windstorm 0.00 100.00 0.00 100.00Hailstorm 0.00 100.00 0.00 100.00Heavy rain 0.00 100.00 0.00 100.00Soil erosion 0.00 100.00 0.00 100.00Landslide 0.00 100.00 0.00 100.00Snowstorm 0.00 100.00 0.00 100.00

National Climate Change Impact Survey 2016 | 109
DisastersHouseholds Facing Food Scarcity (%)
TotalYes No Not applicable
Avalanche 0.00 100.00 0.00 100.00Disease/insect 0.00 100.00 0.00 100.00Western HillDrought 17.84 79.30 2.87 100.00Fire (forest) 0.00 99.16 0.84 100.00Fire (settlement) 60.85 39.15 0.00 100.00Flood 0.00 96.94 3.06 100.00Windstorm 51.01 48.99 0.00 100.00Thunderstorm 1.26 90.62 8.12 100.00Hailstorm 26.20 69.65 4.15 100.00Heavy rain 19.46 78.58 1.95 100.00Sporadic rain 2.77 90.55 6.68 100.00Soil erosion 5.85 93.64 0.51 100.00Landslide 5.61 93.46 0.93 100.00Cold wave 0.00 100.00 0.00 100.00Disease/insect 12.50 85.07 2.43 100.00Western Terai
Drought 21.57 78.43 0.00 100.00Fire (forest) 0.00 100.00 0.00 100.00Fire (settlement) 0.00 100.00 0.00 100.00Flood 0.00 100.00 0.00 100.00Inundation 0.00 100.00 0.00 100.00Windstorm 0.00 100.00 0.00 100.00Thunderstorm 0.00 100.00 0.00 100.00Hailstorm 18.92 81.08 0.00 100.00Sporadic rain 0.00 100.00 0.00 100.00Heat wave 0.00 100.00 0.00 100.00Cold wave 26.79 73.21 0.00 100.00Disease/insect 0.00 100.00 0.00 100.00Mid-Western MountainDrought 67.77 32.23 0.00 100.00Fire (forest) 0.00 100.00 0.00 100.00Fire (settlement) 0.00 100.00 0.00 100.00Flood 0.00 100.00 0.00 100.00Heavy rain 100.00 0.00 0.00 100.00Landslide 14.05 85.95 0.00 100.00Disease/insect 13.66 86.34 0.00 100.00Mid-Western HillDrought 50.54 49.46 0.00 100.00Fire (forest) 0.00 100.00 0.00 100.00Flood 19.22 80.78 0.00 100.00Windstorm 12.52 87.48 0.00 100.00Thunderstorm 0.00 100.00 0.00 100.00Hailstorm 35.58 64.42 0.00 100.00Heavy rain 0.00 100.00 0.00 100.00Sporadic rain 0.00 100.00 0.00 100.00

110 | National Climate Change Impact Survey 2016
DisastersHouseholds Facing Food Scarcity (%)
TotalYes No Not applicable
Soil erosion 18.12 81.88 0.00 100.00Landslide 5.72 94.28 0.00 100.00Heat wave 0.00 100.00 0.00 100.00Disease/insect 10.97 89.03 0.00 100.00Mid-Western Terai
Drought 36.00 64.00 0.00 100.00Fire (forest) 0.00 100.00 0.00 100.00Fire (settlement) 0.00 94.15 5.85 100.00Flood 30.65 69.35 0.00 100.00Inundation 18.38 81.62 0.00 100.00Windstorm 9.54 90.46 0.00 100.00Thunderstorm 0.00 100.00 0.00 100.00Hailstorm 30.09 69.91 0.00 100.00Heavy rain 23.99 76.01 0.00 100.00Sporadic rain 13.06 86.94 0.00 100.00Soil erosion 20.13 79.87 0.00 100.00Landslide 0.00 100.00 0.00 100.00Heat wave 0.00 100.00 0.00 100.00Cold wave 0.00 100.00 0.00 100.00Disease/insect 16.41 83.59 0.00 100.00Far-Western MountainDrought 86.77 11.70 1.53 100.00Fire (forest) 0.00 88.15 11.85 100.00Fire (settlement) 0.00 100.00 0.00 100.00Flood 20.44 79.56 0.00 100.00Windstorm 11.30 87.12 1.59 100.00Thunderstorm 0.00 100.00 0.00 100.00Hailstorm 43.85 55.01 1.14 100.00Heavy rain 36.40 63.60 0.00 100.00Sporadic rain 52.01 47.99 0.00 100.00Soil erosion 18.28 76.20 5.52 100.00Landslide 8.46 89.28 2.26 100.00Snowstorm 0.00 100.00 0.00 100.00Cold wave 0.00 100.00 0.00 100.00Disease/insect 7.67 92.33 0.00 100.00Far-Western HillDrought 78.11 20.98 0.91 100.00Fire (forest) 8.93 90.39 0.68 100.00Fire (settlement) 21.14 78.86 0.00 100.00Flood 33.33 66.67 0.00 100.00Windstorm 50.16 49.84 0.00 100.00Thunderstorm 3.44 94.07 2.49 100.00Hailstorm 72.75 26.70 0.55 100.00Heavy rain 40.57 59.43 0.00 100.00Sporadic rain 63.47 36.53 0.00 100.00Soil erosion 46.43 53.57 0.00 100.00

National Climate Change Impact Survey 2016 | 111
DisastersHouseholds Facing Food Scarcity (%)
TotalYes No Not applicable
Landslide 30.57 67.94 1.48 100.00Cold wave 0.00 0.00 100.00 100.00Disease/insect 79.04 20.11 0.86 100.00Far-Western Terai
Drought 42.40 55.06 2.54 100.00Fire (forest) 0.00 78.64 21.36 100.00Fire (settlement) 5.12 94.88 0.00 100.00Flood 29.48 68.51 2.00 100.00Inundation 35.93 63.46 0.62 100.00Windstorm 15.06 79.79 5.15 100.00Thunderstorm 1.97 93.58 4.45 100.00Hailstorm 45.68 52.96 1.36 100.00Heavy rain 0.00 100.00 0.00 100.00Sporadic rain 69.66 23.23 7.11 100.00Soil erosion 44.62 55.38 0.00 100.00Landslide 49.72 50.28 0.00 100.00Heat wave 0.00 100.00 0.00 100.00Cold wave 9.30 89.61 1.09 100.00Disease/insect 9.41 90.59 0.00 100.00Kathmandu ValleyDrought 1.55 85.76 12.69 100.00Fire (forest) 0.00 100.00 0.00 100.00Fire (settlement) 0.00 100.00 0.00 100.00Flood 2.29 97.71 0.00 100.00Windstorm 0.00 100.00 0.00 100.00Thunderstorm 0.00 100.00 0.00 100.00Hailstorm 0.00 100.00 0.00 100.00Heavy rain 0.00 100.00 0.00 100.00Sporadic rain 1.16 86.84 12.00 100.00Disease/insect 0.00 92.33 7.67 100.00
The table 6-25 indicates percentage distribution of households facing food scarcity in last 5 years by eco-development regions. All households (100%) in central mountain attributed heavy rainfall as major cause of food scarcity followed by hailstorm (95.32%), drought (94.50%) and disease/insect (84.60%), among others. Likewise, all households (100%) in
mid-western mountain reported to have faced food scarcity due to heavy rainfall followed by drought. On the other hand, all households in the same region are not facing food scarcity due to fire and flood. Similarly, all households in Kathmandu Valley are not facing food scarcity due to fire, windstorm, thunderstorm, hailstorm, heavy rain, and disease/insects.
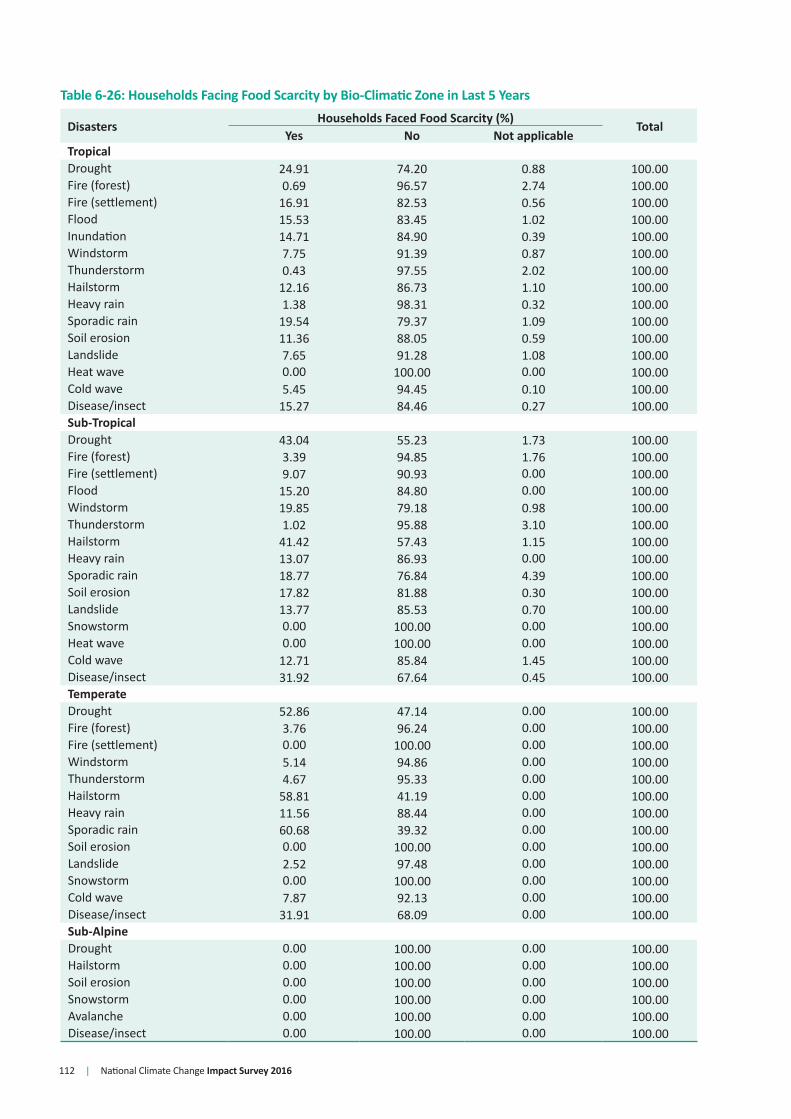
112 | National Climate Change Impact Survey 2016
Table 6-26: Households Facing Food Scarcity by Bio-Climatic Zone in Last 5 Years
DisastersHouseholds Faced Food Scarcity (%)
TotalYes No Not applicable
TropicalDrought 24.91 74.20 0.88 100.00Fire (forest) 0.69 96.57 2.74 100.00Fire (settlement) 16.91 82.53 0.56 100.00Flood 15.53 83.45 1.02 100.00Inundation 14.71 84.90 0.39 100.00Windstorm 7.75 91.39 0.87 100.00Thunderstorm 0.43 97.55 2.02 100.00Hailstorm 12.16 86.73 1.10 100.00Heavy rain 1.38 98.31 0.32 100.00Sporadic rain 19.54 79.37 1.09 100.00Soil erosion 11.36 88.05 0.59 100.00Landslide 7.65 91.28 1.08 100.00Heat wave 0.00 100.00 0.00 100.00Cold wave 5.45 94.45 0.10 100.00Disease/insect 15.27 84.46 0.27 100.00Sub-TropicalDrought 43.04 55.23 1.73 100.00Fire (forest) 3.39 94.85 1.76 100.00Fire (settlement) 9.07 90.93 0.00 100.00Flood 15.20 84.80 0.00 100.00Windstorm 19.85 79.18 0.98 100.00Thunderstorm 1.02 95.88 3.10 100.00Hailstorm 41.42 57.43 1.15 100.00Heavy rain 13.07 86.93 0.00 100.00Sporadic rain 18.77 76.84 4.39 100.00Soil erosion 17.82 81.88 0.30 100.00Landslide 13.77 85.53 0.70 100.00Snowstorm 0.00 100.00 0.00 100.00Heat wave 0.00 100.00 0.00 100.00Cold wave 12.71 85.84 1.45 100.00Disease/insect 31.92 67.64 0.45 100.00TemperateDrought 52.86 47.14 0.00 100.00Fire (forest) 3.76 96.24 0.00 100.00Fire (settlement) 0.00 100.00 0.00 100.00Windstorm 5.14 94.86 0.00 100.00Thunderstorm 4.67 95.33 0.00 100.00Hailstorm 58.81 41.19 0.00 100.00Heavy rain 11.56 88.44 0.00 100.00Sporadic rain 60.68 39.32 0.00 100.00Soil erosion 0.00 100.00 0.00 100.00Landslide 2.52 97.48 0.00 100.00Snowstorm 0.00 100.00 0.00 100.00Cold wave 7.87 92.13 0.00 100.00Disease/insect 31.91 68.09 0.00 100.00Sub-AlpineDrought 0.00 100.00 0.00 100.00Hailstorm 0.00 100.00 0.00 100.00Soil erosion 0.00 100.00 0.00 100.00Snowstorm 0.00 100.00 0.00 100.00Avalanche 0.00 100.00 0.00 100.00Disease/insect 0.00 100.00 0.00 100.00

National Climate Change Impact Survey 2016 | 113
Table 6-26 indicates percentage distribution of households facing food scarcity due to climate induced disasters by climatic zone in last 5 years. Majority of households in different climatic zones reported that they are not been facing food scarcity due to climate induced disasters. However, 60.68 per cent households and 58.81 per cent households in temperate zone are
facing food scarcity due to sporadic rain and hailstorm respectively. Similarly, 43.04 per cent households and 41.42 per cent households in sub-tropical zone are facing food scarcity due to drought and hailstorm respectively in last five years. None in the sub-alpine zone have faced food scarcity due to climate induced disasters in last five years.
6.7 Economic Loss Due to Climate Induced DisastersTable 6-27: Households’ Economic Loss in Last Five Years
DisastersEconomic Loss (%)
TotalYes No
Drought 43.17 56.83 100.00
Fire (forest) 0.82 99.18 100.00
Fire (settlement) 0.98 99.02 100.00
Flood 5.50 94.50 100.00
Inundation 1.93 98.07 100.00
Windstorm 9.57 90.43 100.00
Thunderstorm 1.99 98.01 100.00
Hailstorm 15.17 84.83 100.00
Heavy rain 1.73 98.27 100.00
Sporadic rain 3.19 96.81 100.00
Soil erosion 1.54 98.46 100.00
Landslide 4.92 95.08 100.00
Snowstorm 0.03 99.97 100.00
Avalanche 0.00 100.00 100.00
GLOF 0.00 100.00 100.00
Heat wave 0.06 99.94 100.00
Cold wave 5.39 94.61 100.00
Disease/insect 33.01 66.99 100.00
Table 6-27 depicts the percentage distribution of households having economic loss due to climate induced disasters in last 5 years. The results reveals that higher percentage of households have economic loss due to drought (43.17%) followed by disease/insect (33.01%) and hailstorm
(15%). Majority of households in overall did not perceive climate induced disasters as major cause of their economic loss. However, majority of households reported that they do not have economic loss due to climate induced disasters in last five years.

114 | National Climate Change Impact Survey 2016
Table 6-28: Economic Loss of Households Due to Climate Induced Disasters in Last 5 Years
Analytical Domain
Household (%)
Total
No
loss
Belo
w N
PR 1
5,00
0
NPR
15,
001-
30,0
00
NPR
30,
001-
45,0
00
NPR
45,
001-
60,0
00
Mor
e th
an N
PR 6
0,00
0
Urban/RuralUrban 0.5 29.7 18.5 9.6 8.6 33.0 100.0Rural 0.2 25.0 20.2 11.6 10.6 32.3 100.0Ecological BeltMountain 0.00 11.7 14.5 10.5 11.0 52.3 100.0Hill 0.00 32.4 21.7 12.0 9.3 24.7 100.0Terai 0.6 23.4 19.4 10.6 10.9 35.1 100.0
Eco-Development RegionEastern Mountain 0.00 1.8 5.5 5.9 7.3 79.6 100.0Eastern Hill 0.00 19.2 17.4 10.8 10.9 41.7 100.0Eastern Tarai 1.8 17.5 15.7 9.4 12.7 42.9 100.0Central Mountain 0.00 1.0 7.4 14.1 15.2 62.2 100.0Central Hill 0.00 37.0 29.3 16.8 7.9 9.1 100.0Central Tarai 0.00 29.9 20.6 10.9 10.3 28.3 100.0Western Mountain 0.00 56.9 15.0 6.8 6.0 15.2 100.0Western Hill 0.00 41.7 19.2 10.3 9.6 19.3 100.0Western Tarai 0.00 9.2 30.1 24.2 16.7 19.7 100.0Mid-western Mountain 0.00 43.1 35.8 7.5 5.6 7.9 100.0Mid-western Hill 0.00 30.4 15.5 9.3 11.5 33.4 100.0Mid-western Tarai 0.00 21.7 28.3 12.7 7.8 29.5 100.0Far-western Mountain 0.00 17.4 21.3 10.1 10.4 40.7 100.0Far-western Hill 0.00 26.5 28.2 11.3 5.6 28.5 100.0Far-western Tarai 0.4 21.0 13.7 5.8 6.1 52.9 100.0Kathmandu Valley 0.00 30.0 25.6 0.00 0.00 44.5 100.0Combined VulnerabilityVery High 1.2 20.2 14.7 8.5 13.7 41.6 100.0High 0.00 21.3 23.5 11.9 9.5 33.8 100.0Moderate 0.00 31.3 19.7 12.0 8.5 28.6 100.0Low 0.3 26.0 18.9 11.7 10.3 32.8 100.0Very Low 0.00 43.3 24.6 10.8 9.9 11.4 100.0Bio-Climatic ZoneTropical 0.5 23.9 20.6 11.8 10.4 32.7 100.0Sub-tropical 0.00 30.0 18.8 10.4 9.2 31.6 100.0Temperate 0.00 23.1 18.0 8.6 14.5 35.8 100.0Sub-alpine 0.00 68.8 0.00 6.3 0.00 25.0 100.0Nepal 0.3 26.0 19.9 11.2 10.2 32.5 100.0
National Climate Change Impact Survey 2016 | 115
Table 6-28 depicts the percentage distribution of households having economic loss due to climate induced disasters by different analytical domain in last 5 years. The survey result reveals that higher percentage of households in mountain region (52.3%) have lost more than NPR 60,000 in last 5 years followed by Terai (35.1%) and hill (24.7%). Similarly, 79.6 per cent households in eastern mountain have lost more than NPR 60,000 in last 5 years while only 7.9 per cent reported so in mid-western mountain region. Similarly, higher percentage of households in very high vulnerable area (41.6%) under NAPA
combined vulnerability index have lost more than NPR 60,000 in last 5 years while only 11.4 per cent reported so in very low vulnerable area. Moreover, higher percentage of households in temperate zone (35.8%) have lost more than NPR 60,000 due to climate induced disasters in last 5 years followed by tropical (32.7%), sub-alpine (32.5%), sub-tropical (31.6%), and temperate zone (25.0%) respectively. Overall, 32.5 per cent households have reported to lost more than NPR 60,000 due to climate induced disasters while only 0.3 per cent households have reported no economic loss in last 5 years.

116 | National Climate Change Impact Survey 2016
7.1. Summary of FindingsHouseholds are observing range of impacts on human health, crops, and livestock due to changes in climatic condition in last 25 years. The survey result reveals that 60.25 per cent households are observing emergence of new Disease in crops. Similarly, majority of the households (66.09%) have observed the appearance of new insects/pests in crops while 45.98 per cent households observed appearance of new Disease in livestock (Figure 7.1).
The survey result shows that households are observing climate change impact on human health. Substantial percentage of households (40.12%) reported that incidence of Disease on human health is increasing in last 25 years. An 18.6 per cent household reported that the vector-borne Disease and its frequencies are ascending in last 25 years’ time while 20.7 per cent households reported so for waterborne Disease (Figure 7-3).
The survey result reveals that households are observing an increase in the frequency of 14 different types of Disease out of 19 identified and listed in the questionnaire. A 38.6 per cent household observed that cough and its frequency went higher in last 25 years followed by fever (35%) and diarrhea (21.5%) (Figure 7-3).
The different analytical domain wise survey findings on climate change impact on human health, crops, and livestock are depicted in following sub-sections.
CLIMATE CHANGE IMPACT ON HUMAN HEALTH, CROPS, AND LIVESTOCK
CHAPTER 7
Figure 7-1: Climate Change Impact on Crops and Livestock in Last 25 Years
Figure 7-2: Climate Change Impacts on Human Health in Last 25 Years
Figure 7-3: Main Disease and Frequency of Increment in Last 25 Years
DiarrheaDysentery
MalariaSkin diseases
CoughFever
TyphoidAsthma
Jaundice
Psychological
Water/Food borne diseases
Emergence of Disease in crops
Emergence of new insects/pests in crops
Emergence of new Disease in livestocks
Increase the incidence of vectore borne Disease
Increase the incidence of water borne Disease
Yes
Yes
70605040302010
0
90
80
70
60
50
40
30
20
10
0
No
No
Not applicable
10 20 30 40 50 60 70 80 90 100
Resp
onse
(%)
Resp
onse
(%)
Maj
or d
isea
ses
Observation
Perception
Response (HH, (%)

National Climate Change Impact Survey 2016 | 117
7.2. Impact on CropsTable 7-1: Emergence of New Disease in Crops in Last 25 Years
Analytical DomainNew Disease (HH, %)
TotalYes No Not applicable
Urban/RuralUrban 45.47 23.76 30.77 100.00Rural 66.37 26.95 6.69 100.00Ecological BeltMountain 78.32 19.29 2.38 100.00Hill 52.16 39.06 8.77 100.00Terai 65.17 14.22 20.62 100.00Eco-Development RegionEastern Mountain 67.46 30.27 2.26 100.00Eastern Hill 70.73 25.28 3.99 100.00Eastern Terai 61.47 9.07 29.46 100.00Central Mountain 92.19 7.23 0.59 100.00Central Hill 67.79 29.32 2.89 100.00Central Terai 67.46 15.84 16.69 100.00Western Mountain 17.62 80.18 2.20 100.00Western Hill 25.76 70.47 3.77 100.00Western Terai 71.04 10.17 18.79 100.00Mid-western Mountain 51.32 43.14 5.55 100.00Mid-western Hill 66.79 30.65 2.56 100.00Mid-western Terai 56.08 30.68 13.23 100.00Far-western Mountain 96.78 0.55 2.67 100.00Far-western Hill 70.57 25.92 3.50 100.00Far-western Terai 74.59 14.74 10.67 100.00Kathmandu Valley 1.13 17.49 81.38 100.00NAPA Combined Vulnerability IndexVery High 68.94 12.00 19.06 100.00High 67.08 25.32 7.59 100.00Moderate 55.95 36.15 7.90 100.00Low 52.69 25.31 22.00 100.00Very Low 49.14 37.70 13.16 100.00Bio-Climatic ZoneTropical 63.29 20.22 16.49 100.00Sub-tropical 53.80 35.58 10.62 100.00Temperate 68.96 30.21 0.83 100.00Sub-alpine 0.00 100.00 0.00 100.00Nepal 60.25 26.01 13.74 100.00
Table 7-1 presents the percentage distribution of households on emergence of new Disease on crops in last 25 years. In total, 60.25 per cent households have reported of having observed emergence of new disease in crops while 26.01 per cent households stated the opposite. Highest percentage of households in far-western mountain (96.78%) have observed an emergence of new Disease in crops while only 1.13 per cent households reported
in Kathmandu Valley. Similarly, higher percentage of households in the very high vulnerable area (68.94%) under NAPA combined vulnerability index reported emergence of Disease in crops while 49.14 per cent reported so in very low vulnerable area. Moreover, higher percentage of households in temperate zone (68.96%) has reported in emergence of new disease in crops in last 25 years compared to other climatic zones.
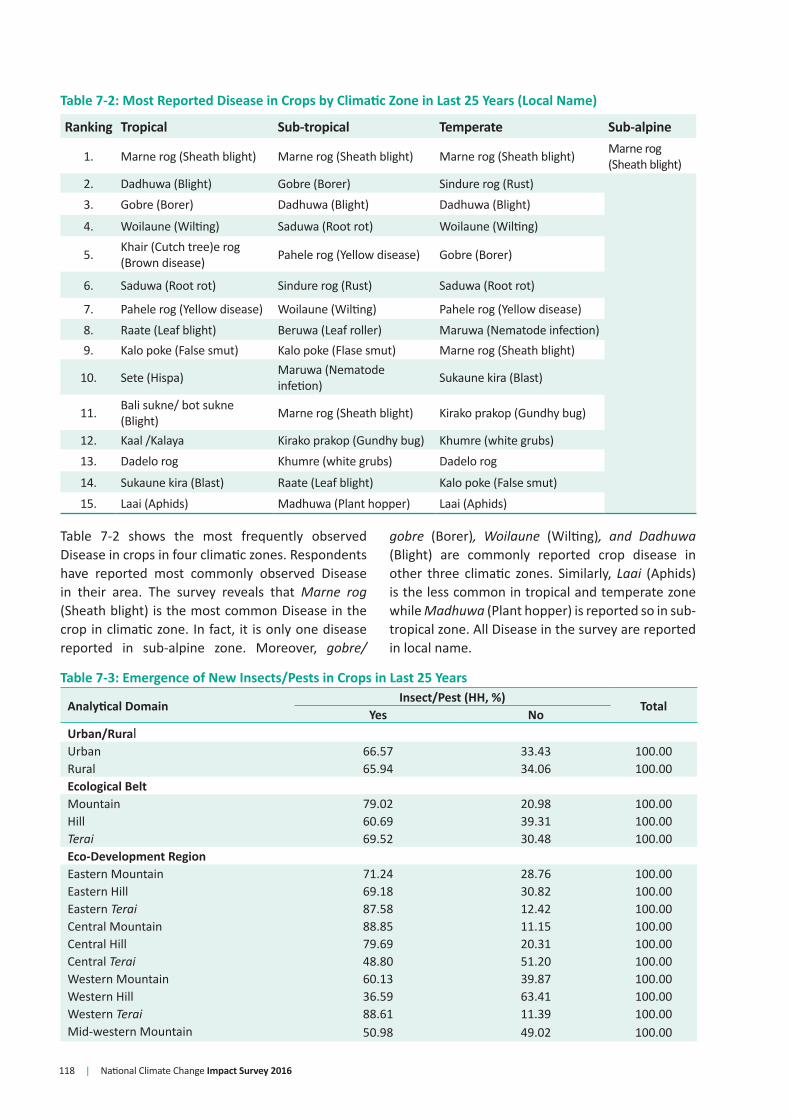
118 | National Climate Change Impact Survey 2016
Table 7-2: Most Reported Disease in Crops by Climatic Zone in Last 25 Years (Local Name)
Ranking Tropical Sub-tropical Temperate Sub-alpine
1. Marne rog (Sheath blight) Marne rog (Sheath blight) Marne rog (Sheath blight) Marne rog (Sheath blight)
2. Dadhuwa (Blight) Gobre (Borer) Sindure rog (Rust)3. Gobre (Borer) Dadhuwa (Blight) Dadhuwa (Blight)
4. Woilaune (Wilting) Saduwa (Root rot) Woilaune (Wilting)
5. Khair (Cutch tree)e rog (Brown disease) Pahele rog (Yellow disease) Gobre (Borer)
6. Saduwa (Root rot) Sindure rog (Rust) Saduwa (Root rot)
7. Pahele rog (Yellow disease) Woilaune (Wilting) Pahele rog (Yellow disease)8. Raate (Leaf blight) Beruwa (Leaf roller) Maruwa (Nematode infection)9. Kalo poke (False smut) Kalo poke (Flase smut) Marne rog (Sheath blight)
10. Sete (Hispa) Maruwa (Nematode infetion) Sukaune kira (Blast)
11. Bali sukne/ bot sukne (Blight) Marne rog (Sheath blight) Kirako prakop (Gundhy bug)
12. Kaal /Kalaya Kirako prakop (Gundhy bug) Khumre (white grubs)13. Dadelo rog Khumre (white grubs) Dadelo rog
14. Sukaune kira (Blast) Raate (Leaf blight) Kalo poke (False smut)15. Laai (Aphids) Madhuwa (Plant hopper) Laai (Aphids)
Table 7-2 shows the most frequently observed Disease in crops in four climatic zones. Respondents have reported most commonly observed Disease in their area. The survey reveals that Marne rog (Sheath blight) is the most common Disease in the crop in climatic zone. In fact, it is only one disease reported in sub-alpine zone. Moreover, gobre/
gobre (Borer), Woilaune (Wilting), and Dadhuwa (Blight) are commonly reported crop disease in other three climatic zones. Similarly, Laai (Aphids) is the less common in tropical and temperate zone while Madhuwa (Plant hopper) is reported so in sub-tropical zone. All Disease in the survey are reported in local name.
Table 7-3: Emergence of New Insects/Pests in Crops in Last 25 Years
Analytical DomainInsect/Pest (HH, %)
TotalYes No
Urban/RuralUrban 66.57 33.43 100.00Rural 65.94 34.06 100.00Ecological BeltMountain 79.02 20.98 100.00Hill 60.69 39.31 100.00Terai 69.52 30.48 100.00Eco-Development RegionEastern Mountain 71.24 28.76 100.00Eastern Hill 69.18 30.82 100.00Eastern Terai 87.58 12.42 100.00Central Mountain 88.85 11.15 100.00Central Hill 79.69 20.31 100.00Central Terai 48.80 51.20 100.00Western Mountain 60.13 39.87 100.00Western Hill 36.59 63.41 100.00Western Terai 88.61 11.39 100.00Mid-western Mountain 50.98 49.02 100.00

National Climate Change Impact Survey 2016 | 119
Analytical DomainInsect/Pest (HH, %)
TotalYes No
Mid-western Hill 66.24 33.76 100.00Mid-western Terai 66.42 33.58 100.00Far-western Mountain 98.82 1.18 100.00Far-western Hill 57.20 42.80 100.00Far-western Terai 78.50 21.50 100.00Kathmandu Valley 6.08 93.92 100.00NAPA Combined Vulnerability IndexVery High 84.96 15.04 100.00High 70.65 29.35 100.00Moderate 43.83 56.17 100.00Low 66.81 33.19 100.00Very Low 70.54 29.46 100.00Bio-Climatic ZoneTropical 68.34 31.66 100.00Sub-tropical 62.78 37.22 100.00Temperate 63.58 36.42 100.00Sub-alpine 50.00 50.00 100.00Nepal 66.09 33.91 100.00
Table 7-3 depicts the percentage distribution of households observing an emergence of new insects/pests in crops in last 25 years. The results reveal that 66.09 per cent households are observing emergence of new pests/insects in their area whereas 33.91 per cent have not observed so in last 25 years. Almost similar percentage of households in urban (66.57%) and rural (65.94%) areas are observing emergence of insects/pests in crops. Moreover, higher percentage of
households in far-western mountain (98.82%) eco-development region are observing emergence of new insects/pests in crops while only 36.59 per cent households in western hill and 6.08 per cent in Kathmandu Valley reported so. Similarly, higher percentage of households in very high vulnerable area (84.96%) under NAPA combined vulnerability index are observing such incidences while only 43.83 per cent households reported so in moderately vulnerable area.
Table 7-4: Most Reported Insects/Pests in Crops by Climatic Zone in Last 25 Years (Local Name)
Ranking Tropical Sub-tropical Temperate Sub-alpine1. Sankhe kira (Snail) Khumle kira (White grubs) Khumle kira (White grubs)2. Patera (Sting bugs) Jhusile (Hairy caterpillar) Kamila (Ant)3. Phatangra (Grass hopper) Kalo kira (Hispa) Laai (Aphids)4. Jhusile (Hairy caterpillar) Kamila (Ant) Banselu (White grub)5. Laai (Aphids) Laai (Aphids) Jhusile (Hairy caterpillar)6. Gaandhi / gaandi (Sting bug) Rato kira (Lady bird beetle) Phatangra (Grass hopper)
7. Hariyo kira (Semi looper) Phatangra (Grass hopper) Kalo kira (Hispa)
8. Gabaaro (Borer) Patera (Sting bugs) Kage kira (Blister beetle)9. Sete (Hispa) Hariyo kira (Semi looper) Gabaaro (Borer)
10. Kalo kira (Hispa) Gabaaro (Borer) Rato kira (Lady bird beetle)
11. Seto putali (Borer) Kage kira (Blister beetle) Hariyo kira (Semi looper)
12. Chiple kira Banselu (White grub) Chepto kira (Snail)
13. Khumle kira (white grubs) Seto putali (Borer) Sukaune kira (Blast)
14. Rato kira (Lady bird beetle) Sete (Hispa) Seto putali (Borer)15. Gube kira (Shoot borer) Dhamira (White ants) Dhamira (White ants)

120 | National Climate Change Impact Survey 2016
7.3. Impact on LivestockTable 7-5: Emergence of New Disease in Livestock in Last 25 Years
Analytical DomainNew Disease (HH, %)
TotalYes No
Urban/RuralUrban 45.40 54.60 100.00Rural 46.16 53.84 100.00Ecological BeltMountain 61.06 38.94 100.00Hill 40.52 59.48 100.00Terai 49.04 50.96 100.00Eco-Development RegionEastern Mountain 52.23 47.77 100.00Eastern Hill 52.23 47.77 100.00Eastern Terai 70.78 29.22 100.00Central Mountain 77.69 22.31 100.00Central Hill 51.21 48.79 100.00Central Terai 21.17 78.83 100.00Western Mountain 14.73 85.27 100.00Western Hill 15.34 84.66 100.00Western Terai 63.99 36.01 100.00Mid-western Mountain 4.48 95.52 100.00Mid-western Hill 66.06 33.94 100.00Mid-western Terai 64.18 35.82 100.00Far-western Mountain 98.82 1.18 100.00Far-western Hill 21.53 78.47 100.00Far-western Terai 61.81 38.19 100.00Kathmandu Valley 3.06 96.94 100.00NAPA Combined Vulnerability IndexVery High 73.99 26.01 100.00High 38.39 61.61 100.00Moderate 23.96 76.04 100.00Low 55.62 44.38 100.00Very Low 43.97 56.03 100.00Very Low 50.60 49.40 100.00Bio-Climatic ZoneTropical 46.25 53.75 100.00Sub-tropical 45.00 55.00 100.00Temperate 49.96 50.04 100.00Sub-alpine 10.00 90.00 100.00Total 45.98 54.02 100.00
Table 7-4 shows the most frequently observed insects/pests in crops in four climatic zones. Respondents have reported most commonly observed Disease in their area. The survey result depicts that Sankhe kira (Snail), Patera (Sting bugs), and Phatangra (Grass hopper) are most commonly observed insects/pests in tropical zone while Khumle kira (White grubs), Rato kira (Lady bird beetle), and Gube kira (Shoot borer) are observed less. Similarly, Khumle kira (White grubs), Jhusile (Hairy caterpillar), and Kalo kira
(Hispa) are most commonly observed insects/pest in crops in sub-tropical zone while seto kira, Sete (Hispa), and Dhamira (White ants) are observed less in last 25 years. Khumle kira (white grubs), Kamila (Ant), and Laai (Aphids) are most commonly reported pests/insects in temperate zone while no any insects/pests species are reported in sub-alpine zone. Similarly, Khumle kira (White grubs), and Kalo kira (Hispa) are commonly reported insects/pests in all three climatic zone except in sub-alpine.

National Climate Change Impact Survey 2016 | 121
Table 7-5 shows the percentage distribution of households observing an emergence of new Disease in livestock in last 25 years. Interestingly, total 45.98 per cent of households are observing such emergence while 54.02 per cent have not reported so. Almost similar percentage of households in urban (45.40%) and rural (46.16%) area are observing emergence of new Disease in livestock in last 25 years. Similarly, highest percentage of respondents in far-western mountain
eco-development region (98.82%) are observing emergence of new Disease on livestock in last 25 years while only 3.06 per cent respondents reported so in Kathmandu Valley. Likewise, 73.99 per cent households in very high vulnerable areas under NAPA combined vulnerability index reported an emergence of new Disease in livestock. Almost half of the total respondents (49.96%) reported such observation in temperate zone while only 10 per cent did so in sub-alpine zone.
Table 7-6: Most Reported New Disease in Livestock in Last 25 Years (Local Name)
Ranking Tropical Sub-tropical Temperate Sub-alpine1. Khoret (Mites) Khoret (Mites) Khoret (Mites) Luto (Mange)2. Cheruwa (Diarrhea) Cheruwa (Diarrhea) Cheruwa (Diarrhea) Khoret (Mites)3. Paralysis Sunine (Swelling) Pet fulne (Tempany)
4.Bhyagute ( Haemorhagic saepltcaemia) Khoki (Coughing) Khoki (Coughing)
5. Pet fulne (Tempany) Pet fulne (Tempany) Juka (Worm)
6. Jworo (Fever) Juka (Worm) Ryal kadne (Poisoning)
7. Galkatta/Ghumaune (Grid) Ryal kadne (Poisoning) Luto (Mange)
8 Sunine (Swelling) Bhyagute (Haemorhagic saepltcaemia) Sunine (Swelling)
9. Matae rog (Liver fluke) Paknne rog (Wound infection)
Bhyagute (Haemorhagic saepltcaemia)
10. Juka (Worm) Namle (Liver fluke) Paralysis
11.Charchare (Black quarter disease)
Charchare (Black quarter disease)
Paknne rog (Wound infection)
12. Khoki (Coughing) Paralysis Jworo (Fever)13. Daam (Asthma) Jworo (Fever) Fever14. Jhokrayera marne Fever15. Daam (asthma)
Table 7-6 demonstrates most frequently observed Disease on livestock in four climatic zones in last 25 years. Respondents have reported most commonly observed Disease in their area. Respondents in tropical and sub-tropical zone have ranked 13 most prevalent Disease in livestock while only 12 Disease are identified in temperate zones and only two in sub-alpine zone. Respondents in all four climatic
zones reported Khoret (Mites) as most prevalent disease in livestock in last 25 years. Similarly, Cheruwa (Diarrhea) is reported second most prevalent disease in tropical, sub-tropical, and temperate zones while Luto (Mange) is ranked so in sub-alpine zone. Asthma is also ranked as less prevalent disease in tropical zone while Jworo (Fever) is reported so in temperate and sub-tropical zone.

122 | National Climate Change Impact Survey 2016
7-4. Impact on Human HealthTable 7-7: Increase in Incidence of Disease in Last 25 Years
Analytical DomainIncreased Incidence of Disease (HH, %)
TotalYes No
Urban/RuralUrban 39.96 60.04 100.00Rural 40.19 59.81 100.00Ecological BeltMountain 53.85 46.15 100.00Hill 29.31 70.69 100.00Terai 48.49 51.51 100.00Eco-Development RegionEastern Mountain 42.27 57.73 100.00Eastern Hill 10.37 89.63 100.00Eastern Terai 54.61 45.39 100.00Central Mountain 47.00 53.00 100.00Central Hill 15.49 84.51 100.00Central Terai 41.61 58.39 100.00Western Mountain 11.01 88.99 100.00Western Hill 32.87 67.13 100.00Western Terai 73.66 26.34 100.00Mid-western Mountain 55.46 44.54 100.00Mid-western Hill 53.41 46.59 100.00Mid-western Terai 25.98 74.02 100.00Far-western Mountain 81.72 18.28 100.00Far-western Hill 64.47 35.53 100.00Far-western Terai 42.24 57.76 100.00Kathmandu Valley 39.93 60.07 100.00NAPA Combined Vulnerability IndexVery High 39.82 60.18 100.00High 42.79 57.21 100.00Moderate 33.59 66.41 100.00Low 33.93 66.07 100.00Very Low 65.37 34.63 100.00Bio-Climatic ZoneTropical 43.10 56.90 100.00Sub-tropical 34.76 65.24 100.00Temperate 41.29 58.71 100.00Sub-alpine 0.00 100.00 100.00Nepal 40.12 59.88 100.00
Table 7-7 indicates the percentage distribution of households observing an increase in the incidence of disease in human in last 25 years. The survey reveals that 40.12 per cent respondents are observing an increase of incidence of Disease in human in last 25 years while 59.88 per cent are not observing so. The highest percentage of households in far-western mountain eco-development region (81.72%) are observing such increase while only 10.37 per cent respondents reported so in eastern hill. Similarly, 39.93 per cent respondent in Kathmandu Valley
reported of increment in disease in last 25 years. The survey result further depicts that 65.37 per cent respondents in very low vulnerable areas under NAPA combined vulnerability index are observing increase in incidence of Disease in last 25 years while only 33.93 per cent respondents reported so in low vulnerable areas. Moreover, high percentages of households in tropical zone (43.10%) have reported an increase of incidence of Disease in human in last 25 years while total respondents in sub-alpine zone (100%) reported the opposite.
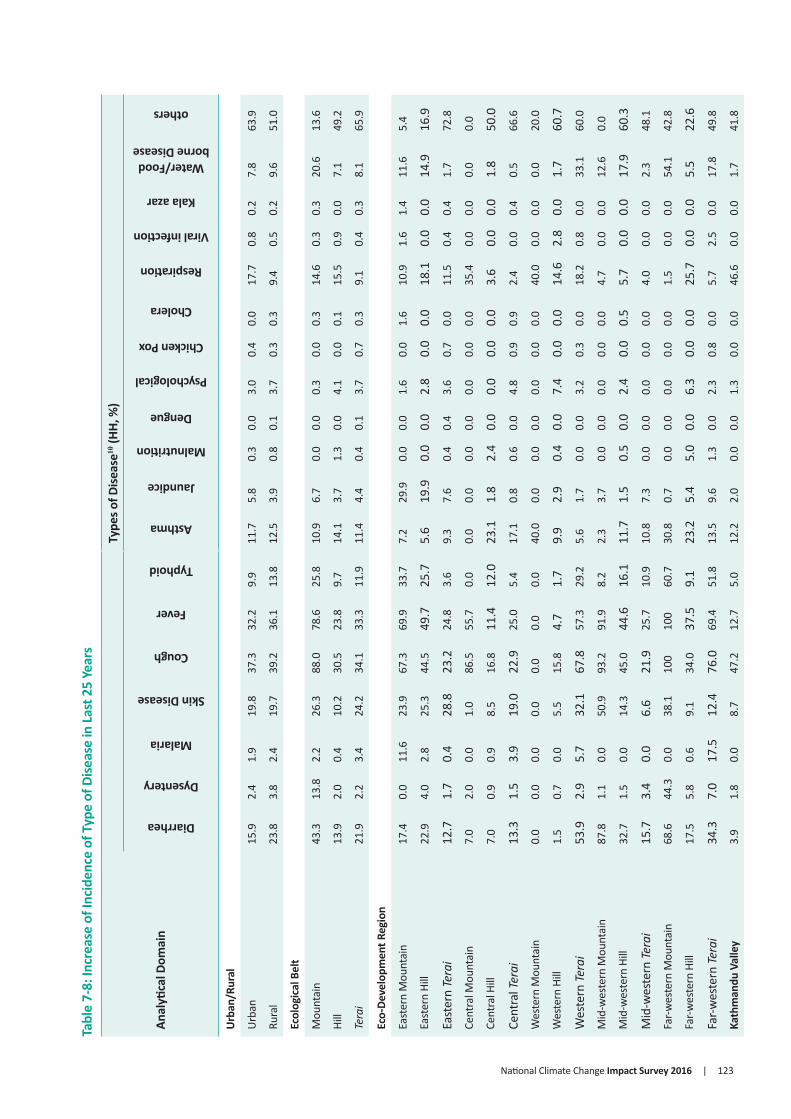
National Climate Change Impact Survey 2016 | 123
Tabl
e 7-
8: In
crea
se o
f Inc
iden
ce o
f Typ
e of
Dise
ase
in La
st 2
5 Ye
ars
Anal
ytica
l Dom
ain
Type
s of D
iseas
e10 (H
H, %
)
Diarrhea
Dysentery
Malaria
Skin Disease
Cough
Fever
Typhoid
Asthma
Jaundice
Malnutrition
Dengue
Psychological
Chicken Pox
Cholera
Respiration
Viral infection
Kala azar
Water/Food borne Disease
others
Urb
an/R
ural
Urb
an15
.92.
41.
919
.837
.332
.29.
911
.75.
80.
30.
03.
00.
40.
017
.70.
80.
27.
863
.9
Rura
l23
.83.
82.
419
.739
.236
.113
.812
.53.
90.
80.
13.
70.
30.
39.
40.
50.
29.
651
.0
Ecol
ogic
al B
elt
Mou
ntai
n43
.313
.82.
226
.388
.078
.625
.810
.96.
70.
00.
00.
30.
00.
314
.60.
30.
320
.613
.6
Hill
13.9
2.0
0.4
10.2
30.5
23.8
9.7
14.1
3.7
1.3
0.0
4.1
0.0
0.1
15.5
0.9
0.0
7.1
49.2
Tera
i21
.92.
23.
424
.234
.133
.311
.911
.44.
40.
40.
13.
70.
70.
39.
10.
40.
38.
165
.9
Eco -
Deve
lopm
ent R
egio
n
East
ern
Mou
ntai
n17
.40.
011
.623
.967
.369
.933
.77.
229
.90.
00.
01.
60.
01.
610
.91.
61.
411
.65.
4
East
ern
Hill
22.9
4.0
2.8
25.3
44.5
49.7
25.7
5.6
19.9
0.0
0.0
2.8
0.0
0.0
18.1
0.0
0.0
14.9
16.9
East
ern
Tera
i12
.71.
70.
428
.823
.224
.83.
69.
37.
60.
40.
43.
60.
70.
011
.50.
40.
41.
772
.8
Cent
ral M
ount
ain
7.0
2.0
0.0
1.0
86.5
55.7
0.0
0.0
0.0
0.0
0.0
0.0
0.0
0.0
35.4
0.0
0.0
0.0
0.0
Cent
ral H
ill7.
00.
90.
98.
516
.811
.412
.023
.11.
82.
40.
00.
00.
00.
03.
60.
00.
01.
850
.0
Cent
ral T
erai
13.3
1.5
3.9
19.0
22.9
25.0
5.4
17.1
0.8
0.6
0.0
4.8
0.9
0.9
2.4
0.0
0.4
0.5
66.6
Wes
tern
Mou
ntai
n0.
00.
00.
00.
00.
00.
00.
040
.00.
00.
00.
00.
00.
00.
040
.00.
00.
00.
020
.0
Wes
tern
Hill
1.5
0.7
0.0
5.5
15.8
4.7
1.7
9.9
2.9
0.4
0.0
7.4
0.0
0.0
14.6
2.8
0.0
1.7
60.7
Wes
tern
Tera
i53
.92.
95.
732
.167
.857
.329
.25.
61.
70.
00.
03.
20.
30.
018
.20.
80.
033
.160
.0
Mid
-wes
tern
Mou
ntai
n87
.81.
10.
050
.993
.291
.98.
22.
33.
70.
00.
00.
00.
00.
04.
70.
00.
012
.60.
0
Mid
-wes
tern
Hill
32.7
1.5
0.0
14.3
45.0
44.6
16.1
11.7
1.5
0.5
0.0
2.4
0.0
0.5
5.7
0.0
0.0
17.9
60.3
Mid
-wes
tern
Tera
i15
.73.
40.
06.
621
.925
.710
.910
.87.
30.
00.
00.
00.
00.
04.
00.
00.
02.
348
.1
Far-w
este
rn M
ount
ain
68.6
44.3
0.0
38.1
100
100
60.7
30.8
0.7
0.0
0.0
0.0
0.0
0.0
1.5
0.0
0.0
54.1
42.8
Far-w
este
rn H
ill17
.55.
80.
69.
134
.037
.59.
123
.25.
45.
00.
06.
30.
00.
025
.70.
00.
05.
522
.6
Far-w
este
rn Te
rai
34.3
7.0
17.5
12.4
76.0
69.4
51.8
13.5
9.6
1.3
0.0
2.3
0.8
0.0
5.7
2.5
0.0
17.8
49.8
Kath
man
du V
alle
y3.
91.
80.
08.
747
.212
.75.
012
.22.
00.
00.
01.
30.
00.
046
.60.
00.
01.
741
.8
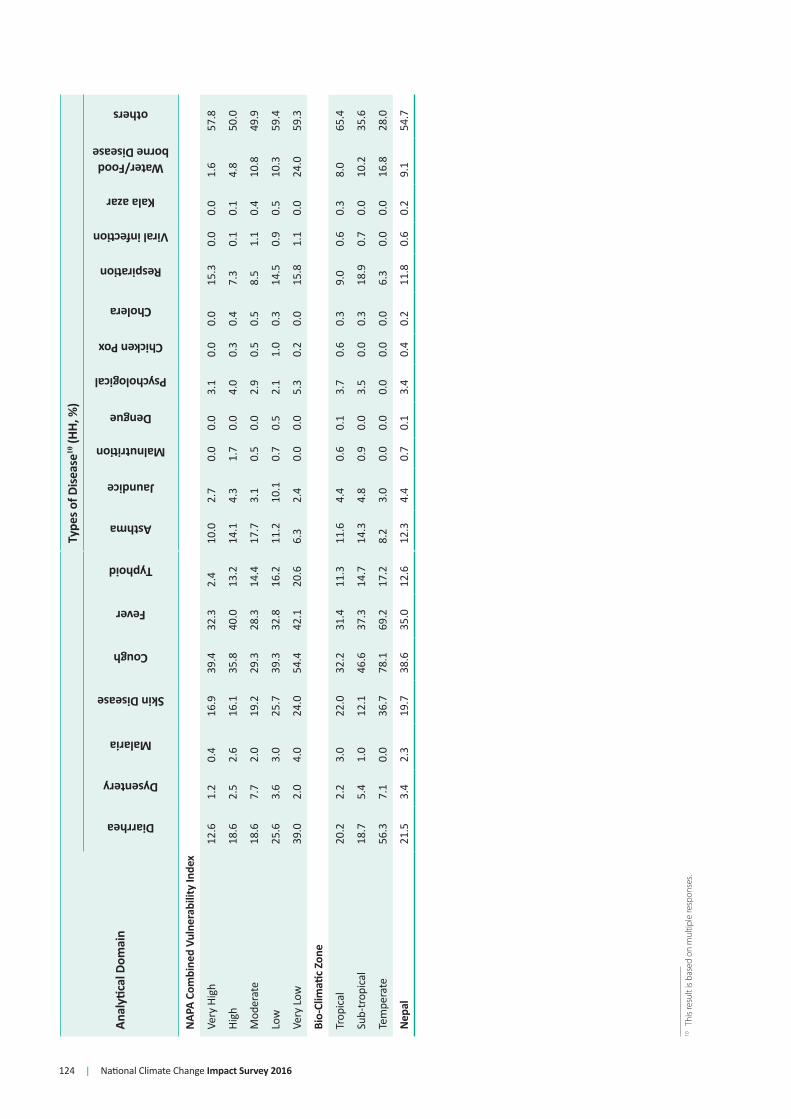
124 | National Climate Change Impact Survey 2016
Anal
ytica
l Dom
ain
Type
s of D
iseas
e10 (H
H, %
)
Diarrhea
Dysentery
Malaria
Skin Disease
Cough
Fever
Typhoid
Asthma
Jaundice
Malnutrition
Dengue
Psychological
Chicken Pox
Cholera
Respiration
Viral infection
Kala azar
Water/Food borne Disease
others
NAP
A Co
mbi
ned
Vuln
erab
ility
Inde
x
Very
Hig
h12
.61.
20.
416
.939
.432
.32.
410
.02.
70.
00.
03.
10.
00.
015
.30.
00.
01.
657
.8
High
18.6
2.5
2.6
16.1
35.8
40.0
13.2
14.1
4.3
1.7
0.0
4.0
0.3
0.4
7.3
0.1
0.1
4.8
50.0
Mod
erat
e18
.67.
72.
019
.229
.328
.314
.417
.73.
10.
50.
02.
90.
50.
58.
51.
10.
410
.849
.9
Low
25.6
3.6
3.0
25.7
39.3
32.8
16.2
11.2
10.1
0.7
0.5
2.1
1.0
0.3
14.5
0.9
0.5
10.3
59.4
Very
Low
39.0
2.0
4.0
24.0
54.4
42.1
20.6
6.3
2.4
0.0
0.0
5.3
0.2
0.0
15.8
1.1
0.0
24.0
59.3
Bio-
Clim
atic Z
one
Trop
ical
20.2
2.2
3.0
22.0
32.2
31.4
11.3
11.6
4.4
0.6
0.1
3.7
0.6
0.3
9.0
0.6
0.3
8.0
65.4
Sub-
trop
ical
18.7
5.4
1.0
12.1
46.6
37.3
14.7
14.3
4.8
0.9
0.0
3.5
0.0
0.3
18.9
0.7
0.0
10.2
35.6
Tem
pera
te56
.37.
10.
036
.778
.169
.217
.28.
23.
00.
00.
00.
00.
00.
06.
30.
00.
016
.828
.0
Nep
al21
.53.
42.
319
.738
.635
.012
.612
.34.
40.
70.
13.
40.
40.
211
.80.
60.
29.
154
.7
10
This
resu
lt is
base
d on
mul
tiple
resp
onse
s.

National Climate Change Impact Survey 2016 | 125
Table 7-8 represents the percentage distribution of households reporting an increase of incidence of Disease in last 25 years. Out of 18 identified Disease, cough (38.6%) and fever (35%) are reported to have increased while only 0.1 per cent and 0.2 per cent respondents reported so for dengue and cholera respectively. Similarly, 17.7 per cent respondents in urban area reported that the incidence of respiratory disease is increasing while 9.4 per cent respondents reported so in rural area. Cough
(100%), fever (100%), diarrhea (68.6%), dysentery (44.3%) and typhoid (60.7%) are reported to have increased in far-western mountain while 46.6 per cent respondents in Kathmandu Valley reported so for respiration related disease. Similarly, cough (32.2%) is reported as most frequently appearing disease in tropical zone in the past 25 years while 46.6 per cent and 78.1 per cent respondents reported so in sub-tropical and temperate zone respectively.
Table 7-9: Increase in Incidence of Vector-Borne Disease in Last 25 Years
Analytical DomainIncreased Incidence of Vector-borne Disease (HH, %)
TotalYes No
Urban/RuralUrban 12.85 87.15 100.00Rural 20.97 79.03 100.00Ecological BeltMountain 36.43 63.57 100.00Hill 15.31 84.69 100.00Terai 18.79 81.21 100.00Eco-Development RegionEastern Mountain 25.29 74.71 100.00Eastern Hill 13.03 86.97 100.00Eastern Terai 15.47 84.53 100.00Central Mountain 13.89 86.11 100.00Central Hill 19.18 80.82 100.00Central Terai 19.52 80.48 100.00Western Mountain 0.0 100.00 100.00Western Hill 3.02 96.98 100.00Western Terai 19.72 80.28 100.00Mid-western Mountain 58.75 41.25 100.00Mid-western Hill 40.49 59.51 100.00Mid-western Terai 18.16 81.84 100.00Far-western Mountain 71.51 28.49 100.00Far-western Hill 15.88 84.12 100.00Far-western Terai 32.01 67.99 100.00Kathmandu Valley 4.32 95.68 100.00NAPA Combined Vulnerability IndexVery High 22.26 77.74 100.00High 30.25 69.75 100.00Moderate 10.17 89.83 100.00Low 12.48 87.52 100.00Very Low 15.16 84.84 100.00Bio-Climatic ZoneTropical 17.27 82.73 100.00Sub-tropical 18.61 81.39 100.00Temperate 36.10 63.90 100.00Sub-alpine 0.0 100.00 100.00Nepal 18.59 81.41 100.00
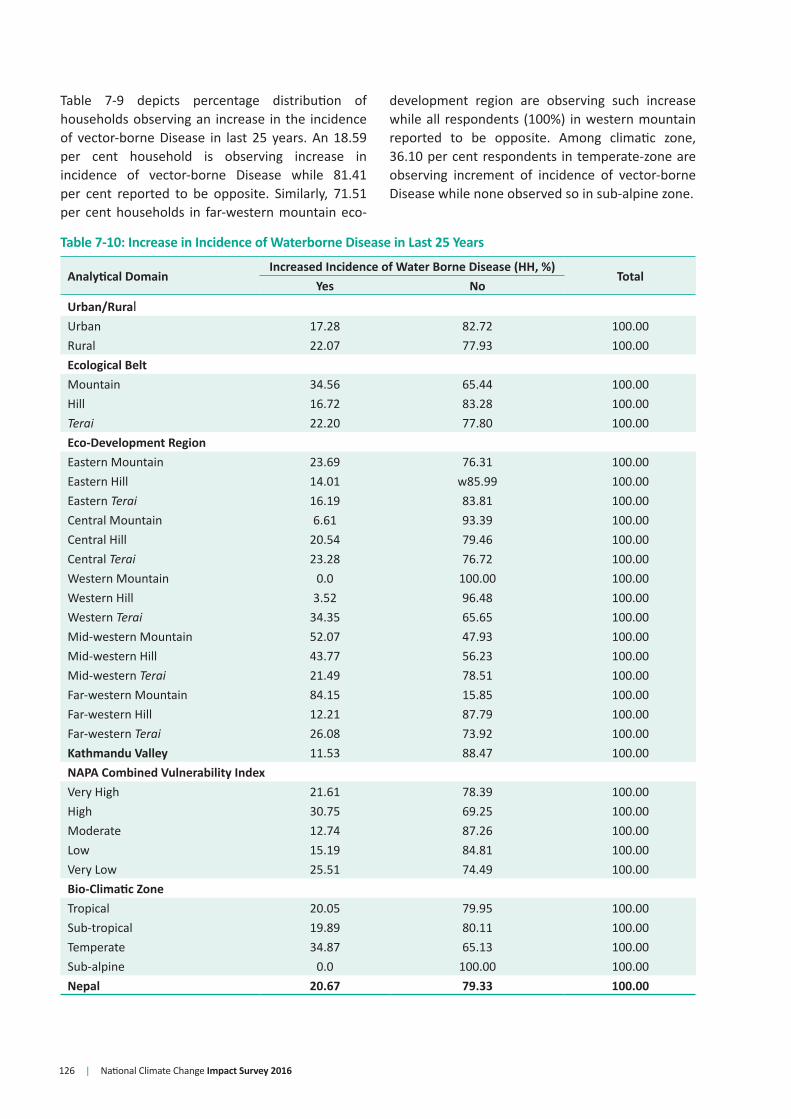
126 | National Climate Change Impact Survey 2016
Table 7-9 depicts percentage distribution of households observing an increase in the incidence of vector-borne Disease in last 25 years. An 18.59 per cent household is observing increase in incidence of vector-borne Disease while 81.41 per cent reported to be opposite. Similarly, 71.51 per cent households in far-western mountain eco-
development region are observing such increase while all respondents (100%) in western mountain reported to be opposite. Among climatic zone, 36.10 per cent respondents in temperate-zone are observing increment of incidence of vector-borne Disease while none observed so in sub-alpine zone.
Table 7-10: Increase in Incidence of Waterborne Disease in Last 25 Years
Analytical DomainIncreased Incidence of Water Borne Disease (HH, %)
TotalYes No
Urban/RuralUrban 17.28 82.72 100.00Rural 22.07 77.93 100.00Ecological BeltMountain 34.56 65.44 100.00Hill 16.72 83.28 100.00Terai 22.20 77.80 100.00Eco-Development RegionEastern Mountain 23.69 76.31 100.00Eastern Hill 14.01 w85.99 100.00Eastern Terai 16.19 83.81 100.00Central Mountain 6.61 93.39 100.00Central Hill 20.54 79.46 100.00Central Terai 23.28 76.72 100.00Western Mountain 0.0 100.00 100.00Western Hill 3.52 96.48 100.00Western Terai 34.35 65.65 100.00Mid-western Mountain 52.07 47.93 100.00Mid-western Hill 43.77 56.23 100.00Mid-western Terai 21.49 78.51 100.00Far-western Mountain 84.15 15.85 100.00Far-western Hill 12.21 87.79 100.00Far-western Terai 26.08 73.92 100.00Kathmandu Valley 11.53 88.47 100.00NAPA Combined Vulnerability IndexVery High 21.61 78.39 100.00High 30.75 69.25 100.00Moderate 12.74 87.26 100.00Low 15.19 84.81 100.00Very Low 25.51 74.49 100.00Bio-Climatic ZoneTropical 20.05 79.95 100.00Sub-tropical 19.89 80.11 100.00Temperate 34.87 65.13 100.00Sub-alpine 0.0 100.00 100.00Nepal 20.67 79.33 100.00
National Climate Change Impact Survey 2016 | 127
Table 7-10 presents the percentage distribution of households observing an increase in incidence of waterborne Disease in last 25 years. It shows that 20.67 per cent respondents have been observing increase of incidence of waterborne Disease in last 25 years while 79.33 per cent reported the opposite. Higher percentage of respondents in far (84.15%) and mid-western mountain (52.07%) regions are
observing such increase while no one reported so in western mountain region. Moreover, no one in sub-alpine climatic zone reported an increase on incidence of waterborne disease in last 25 years while 34.87 per cent respondents in temperate zone, 20.05 per cent in tropical zone, and 19.89 per cent in sub-tropical zone are observing an increase in such incidences in last 25 years.

128 | National Climate Change Impact Survey 2016
8.1. Summary of Findings The survey result reveals that climate change has been significantly impacting natural resources including water and biodiversity in last 25 years across the country. Some of these impacts are more direct or first order such as drying up of streams and ponds, while others are manifested as the consequential effects of the first order impacts on ecosystems, agriculture and different dimensions of livelihoods. The survey divulges that 84.5 per cent households are observing decrease in surface water while 74.4per cent reported so for overall water resources (Figure 8-1).
Similarly, the survey results shows that most households (89%) are observing changes on water resources was mainly due to insufficient rainfall followed by increase in temperature (44.1%), and deforestation (37.9%). Significant respondents are observing such change due to population increase and earthquake, while less than one per cent respondents reported so due to decrease in temperature and sufficient rainfall (Figure 8-2).
The survey has primarily assessed climate change impact on three aspects of forests and biodiversity: changes and shifts in animal and plant species, infestation of invasive species in forest and agricultural land, and changes in flowering and fruiting behavior of the vegetation. Survey result indicates that people have witnessed changes in plant and animal species primarily the birds, trees, wildlife and the insects in last 25 years. About 78 per cent households are observing changes in bird species in their areas followed by tree (70%), other wild animals (61%), insect species (57%), and shrub/bush species (43%) (Figure 8-3).
CLIMATE CHANGE AND NATURAL RESOURCES: WATER AND BIODIVERSITY
CHAPTER 8
Figure 8-1: Observed Changes on Water Resources in Last 25 Years
Figure 8-2: Causes of changes in water resources in last 25 years
Figure 8-3: Changes in the status of animal and plant species in last 25 years
0
10
20
30
40
50
60
70
80
90
Changes onsurface waterChanges onwater sources
Temperature increase
Temperature decrease
Land slide / soil erosion
Heavy use of underground water
Mining
Earthquake
Re
spon
se (%
)M
ajor
cau
ses
Response (%)
Observations
10 20 30 40 50 60 70 80 90 100
@
Tree
Shrub / bush
Herbal/ NTFPs
Grass / Fodder
Wild animal
Birds
Insects

National Climate Change Impact Survey 2016 | 129
Figure 8-4: Appearance of Invasive Species in Last 25 Years
Figure 8-5: Appearance of Invasive Species Based on Land use in Last 25 Years
Figure 8-6: Cause for Appearance of New Invasive Species in Last 25 Years
Similarly, presence of invasive species and their impact is found to be significant in last 25 years. As a whole, 36.5 per cent respondents are observing an appearance of invasive species under shrub/bush category in last 25 years followed by creeper plants in the land (16.7%) and creeper plants as climber (14.4%) respectively (Figure 8-4). However, appearance of such invasive species varies based on the land use. Higher percentage of households is observing appearance of invasive species in the agriculture land followed by forests land. Also, 92 per cent household are observing invasive species under creeper plants (land) category in agriculture land followed by that under shrub/bush (60%) and creeper plants (climber) (57%) respectively in last 25 years (Figure 8-5).
Households are observing different reasons for appearance of invasive species in their area in last 25 years. Higher percentage of households is observing natural causes as the main cause behind appearance of such invasive species. Survey result reveals that invasive
species under above mentioned three categories: creeper plant (land) (97%), creeper plant (climber) (94%), and shrub/bush (81%), are appearing and spreading due to natural cause while less than one per cent households reported human cause for such changes (Figure 8-6).
Climate change impact on water, forest and biodiversity has affected different aspects of household livelihood including decrease in overall income. Different analytical domain wise survey result on different aspects of climate change impact on those resources and livelihood is presented in following sub-sections.
0
10
20
30
40
50
60
70
80
Resp
onse
(%)
Types of invasive species
YesNo
Notapplicable
0
10
20
30
40
50
60
70
80
90
100
Forest Pasture Land Agriculture
Resp
onse
(%)
Landuse type
Shrub / bushCreeper plant(climber)Creeper plant(land)
0
10
20
30
40
50
60
70
80
90
100
Naturally Don’ t' know
Resp
onse
(%)
Cause
Shrub / bushCreeper plant (climber)Creeper plant (land)
Shrub / bush Creeper plant (climber) Creeper plant (land)

130 | National Climate Change Impact Survey 2016
8.2. Impact on Water ResourcesTable 8-1: Observed Changes in Water Sources in Last 25 Years
Analytical DomainObserved Change (HH, %)
Yes NoUrban/ 524Urban 76.41 23.59Rural 73.42 26.58Ecological BeltMountain 84.04 15.96Hill 78.60 21.40Terai 68.34 31.66Eco-Development RegionEastern Mountain 61.54 38.46Eastern Hill 87.97 12.03Eastern Terai 59.85 40.15Central Mountain 84.10 15.90Central Hill 95.07 4.93Central Terai 54.88 45.12Western Mountain 88.39 11.61Western Hill 41.97 58.03Western Terai 98.37 1.63Mid-western Mountain 96.83 3.17Mid-western Hill 91.54 8.46Mid-western Terai 96.67 3.33Far-western Mountain 98.99 1.01Far-western Hill 94.71 5.29Far-western Terai 93.23 6.77
Kathmandu Valley 93.96 6.04NAPA Combined Vulnerability IndexVery High 86.68 13.32High 84.94 15.06Moderate 54.66 45.34Low 70.56 29.44Very Low 76.03 23.97Bio-Climate ZonesTropical 71.58 28.42Sub-tropical 78.73 21.27Temperate 76.76 23.24Sub-alpine 95.00 5.00Nepal 74.29 25.71
Table 8-1 represents the percentage distribution of households observing changes in water sources in last 25 years. Higher percentage of households (74.29%) is observing changes in water sources. Majority of households in mountain region (84.04%) are observing changes on water sources followed by hill (78.60%) and Terai (68.34%) region. Similarly, 93.96 per cent households in Kathmandu Valley are observing such changes in last 25 years. Similarly,
higher percentages of households in very vulnerable area (86.68%) under NAPA combined vulnerability are observing changes in water sources in last 25 years while only 54.66 per cent households reported so in moderate vulnerable area. Moreover, 95 per cent households in sub-alpine region are observing such changes while 78.73 per cent households in sub-tropical, 76.76 per cent in temperate, and 71.58 per cent in tropical region reported so.

National Climate Change Impact Survey 2016 | 131
Table 8-2: Observed Changes in Amount of Surface Water in Last 25 Years
Analytical Domain Observed Change (HH, %)Decreased Increased No change Don't know Not applicable
Urban/RuralUrban 86.43 1.10 2.11 2.89 7.47Rural 83.67 0.83 5.15 1.78 8.58Ecological BeltMountain 82.67 4.62 12.43 0.27 0.0Hill 90.80 0.46 4.58 3.07 1.10Terai 78.51 0.72 2.55 1.45 16.78Eco-Development RegionEastern Mountain 58.07 10.10 30.79 1.04 0.0Eastern Hill 96.12 1.09 2.52 0.26 0.0Eastern Terai 81.57 1.42 3.38 2.38 11.25Central Mountain 84.57 6.00 9.43 0.0 0.0Central Hill 97.95 0.58 1.22 0.25 0.0Central Terai 74.84 0.20 2.97 1.02 20.97Western Mountain 82.80 2.20 12.80 2.20 0.0Western Hill 80.22 0.14 9.10 10.18 0.36Western Terai 60.73 0.0 0.89 0.0 38.38Mid-western Mountain 92.58 0.0 7.42 0.0 0.0Mid-western Hill 91.08 0.24 7.40 0.0 1.29Mid-western Terai 97.67 1.09 1.24 0.0 0.0Far-western Mountain 100.00 0.0 0.0 0.0 0.0Far-western Hill 99.48 0.0 0.52 0.0 0.0Far-western Terai 88.68 0.83 0.71 4.11 5.66Kathmandu Valley 82.10 0.42 3.42 2.24 11.82
NAPA Combined Vulnerability IndexVery High 86.34 1.48 2.46 0.84 8.89High 92.02 1.41 3.27 0.23 3.06Moderate 75.95 0.08 7.26 4.39 12.32Low 89.90 1.07 5.22 1.97 1.84Very Low 70.38 0.0 1.25 4.36 24.01Bio-Climate ZonesTropical 81.25 0.67 3.20 2.07 12.81Sub-tropical 89.80 1.32 5.32 2.23 1.33Temperate 87.13 0.99 10.27 1.60 0.0Sub-alpine 85.00 0.0 15.00 0.0 0.0Nepal 84.47 0.91 4.26 2.10 8.25
Table 8-2 shows the percentage distribution of households observing changes in amount of surface water in last 25 years. The survey result reveals that higher percent of households (84.47%) are observing decrease in amount of surface water while 4.26 per cent households reported to no change on it. Similarly, majority of households in hill (90.8%) are observing decrease in amount of
water in its sources followed by mountain (82.67%) and Terai (78.51%). Likewise, 100 per cent households of far-western mountain and 99.48 per cent of far-western hill have observed a decrease in water amount in sources in last 25 years. Similarly, majority of households in all climatic zones are observing decrease in water amount in sources in last 25 years.
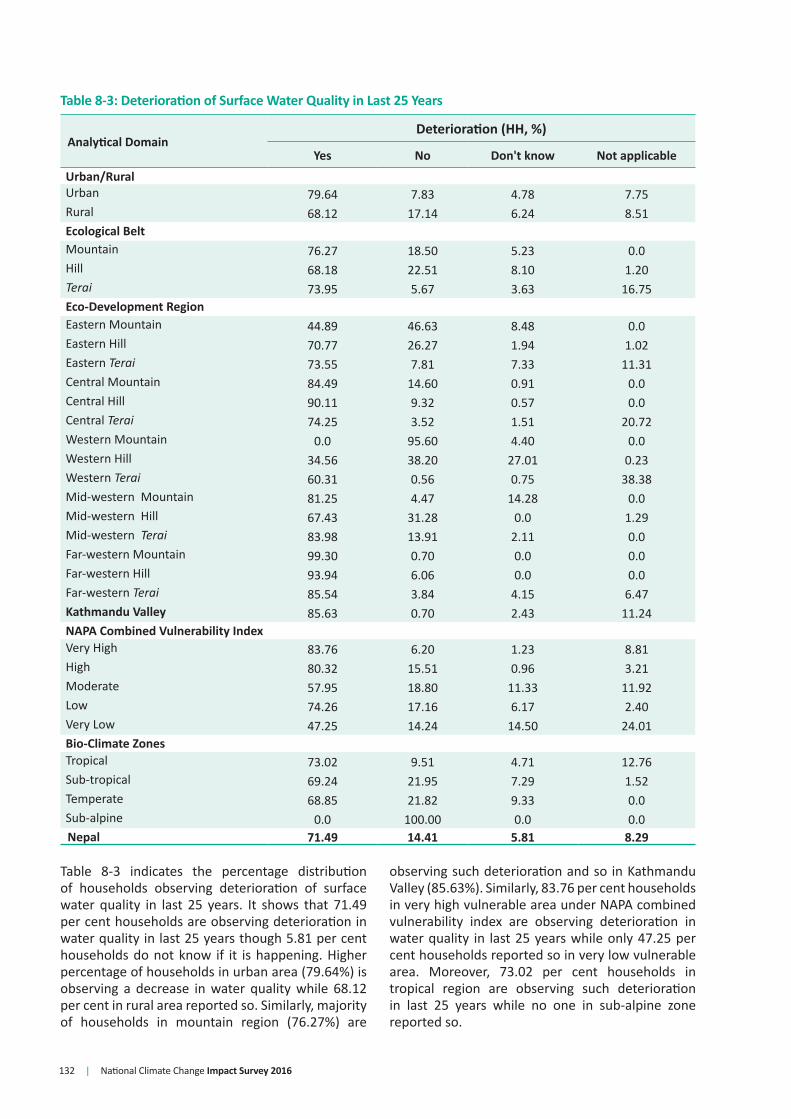
132 | National Climate Change Impact Survey 2016
Table 8-3: Deterioration of Surface Water Quality in Last 25 Years
Analytical DomainDeterioration (HH, %)
Yes No Don't know Not applicableUrban/RuralUrban 79.64 7.83 4.78 7.75Rural 68.12 17.14 6.24 8.51Ecological BeltMountain 76.27 18.50 5.23 0.0Hill 68.18 22.51 8.10 1.20Terai 73.95 5.67 3.63 16.75Eco-Development RegionEastern Mountain 44.89 46.63 8.48 0.0Eastern Hill 70.77 26.27 1.94 1.02Eastern Terai 73.55 7.81 7.33 11.31Central Mountain 84.49 14.60 0.91 0.0Central Hill 90.11 9.32 0.57 0.0Central Terai 74.25 3.52 1.51 20.72Western Mountain 0.0 95.60 4.40 0.0Western Hill 34.56 38.20 27.01 0.23Western Terai 60.31 0.56 0.75 38.38Mid-western Mountain 81.25 4.47 14.28 0.0Mid-western Hill 67.43 31.28 0.0 1.29Mid-western Terai 83.98 13.91 2.11 0.0Far-western Mountain 99.30 0.70 0.0 0.0Far-western Hill 93.94 6.06 0.0 0.0Far-western Terai 85.54 3.84 4.15 6.47Kathmandu Valley 85.63 0.70 2.43 11.24NAPA Combined Vulnerability IndexVery High 83.76 6.20 1.23 8.81High 80.32 15.51 0.96 3.21Moderate 57.95 18.80 11.33 11.92Low 74.26 17.16 6.17 2.40Very Low 47.25 14.24 14.50 24.01Bio-Climate ZonesTropical 73.02 9.51 4.71 12.76Sub-tropical 69.24 21.95 7.29 1.52Temperate 68.85 21.82 9.33 0.0Sub-alpine 0.0 100.00 0.0 0.0Nepal 71.49 14.41 5.81 8.29
Table 8-3 indicates the percentage distribution of households observing deterioration of surface water quality in last 25 years. It shows that 71.49 per cent households are observing deterioration in water quality in last 25 years though 5.81 per cent households do not know if it is happening. Higher percentage of households in urban area (79.64%) is observing a decrease in water quality while 68.12 per cent in rural area reported so. Similarly, majority of households in mountain region (76.27%) are
observing such deterioration and so in Kathmandu Valley (85.63%). Similarly, 83.76 per cent households in very high vulnerable area under NAPA combined vulnerability index are observing deterioration in water quality in last 25 years while only 47.25 per cent households reported so in very low vulnerable area. Moreover, 73.02 per cent households in tropical region are observing such deterioration in last 25 years while no one in sub-alpine zone reported so.
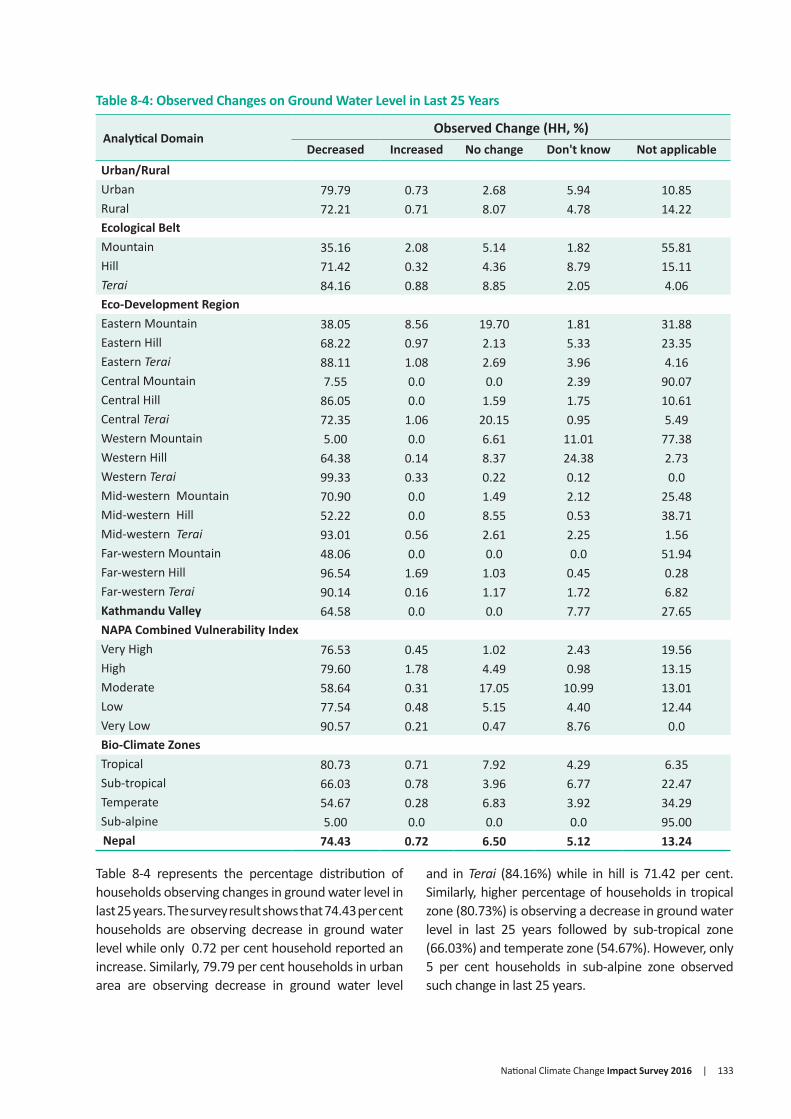
National Climate Change Impact Survey 2016 | 133
Table 8-4: Observed Changes on Ground Water Level in Last 25 Years
Analytical DomainObserved Change (HH, %)
Decreased Increased No change Don't know Not applicableUrban/RuralUrban 79.79 0.73 2.68 5.94 10.85Rural 72.21 0.71 8.07 4.78 14.22Ecological BeltMountain 35.16 2.08 5.14 1.82 55.81Hill 71.42 0.32 4.36 8.79 15.11Terai 84.16 0.88 8.85 2.05 4.06Eco-Development RegionEastern Mountain 38.05 8.56 19.70 1.81 31.88Eastern Hill 68.22 0.97 2.13 5.33 23.35Eastern Terai 88.11 1.08 2.69 3.96 4.16Central Mountain 7.55 0.0 0.0 2.39 90.07Central Hill 86.05 0.0 1.59 1.75 10.61Central Terai 72.35 1.06 20.15 0.95 5.49Western Mountain 5.00 0.0 6.61 11.01 77.38Western Hill 64.38 0.14 8.37 24.38 2.73Western Terai 99.33 0.33 0.22 0.12 0.0Mid-western Mountain 70.90 0.0 1.49 2.12 25.48Mid-western Hill 52.22 0.0 8.55 0.53 38.71Mid-western Terai 93.01 0.56 2.61 2.25 1.56Far-western Mountain 48.06 0.0 0.0 0.0 51.94Far-western Hill 96.54 1.69 1.03 0.45 0.28Far-western Terai 90.14 0.16 1.17 1.72 6.82Kathmandu Valley 64.58 0.0 0.0 7.77 27.65NAPA Combined Vulnerability IndexVery High 76.53 0.45 1.02 2.43 19.56High 79.60 1.78 4.49 0.98 13.15Moderate 58.64 0.31 17.05 10.99 13.01Low 77.54 0.48 5.15 4.40 12.44Very Low 90.57 0.21 0.47 8.76 0.0Bio-Climate ZonesTropical 80.73 0.71 7.92 4.29 6.35Sub-tropical 66.03 0.78 3.96 6.77 22.47Temperate 54.67 0.28 6.83 3.92 34.29Sub-alpine 5.00 0.0 0.0 0.0 95.00Nepal 74.43 0.72 6.50 5.12 13.24
Table 8-4 represents the percentage distribution of households observing changes in ground water level in last 25 years. The survey result shows that 74.43 per cent households are observing decrease in ground water level while only 0.72 per cent household reported an increase. Similarly, 79.79 per cent households in urban area are observing decrease in ground water level
and in Terai (84.16%) while in hill is 71.42 per cent. Similarly, higher percentage of households in tropical zone (80.73%) is observing a decrease in ground water level in last 25 years followed by sub-tropical zone (66.03%) and temperate zone (54.67%). However, only 5 per cent households in sub-alpine zone observed such change in last 25 years.

134 | National Climate Change Impact Survey 2016
Table 8-5: Deterioration of Ground Water Quality in Last 25 Years
Analytical DomainDeterioration (HH, %)
Yes No Don't know Not applicable
Urban/RuralUrban 74.13 6.66 8.00 11.21Rural 65.15 12.76 7.82 14.27Ecological BeltMountain 35.07 4.75 4.30 55.89Hill 54.61 17.44 12.74 15.21Terai 86.48 5.62 3.66 4.23Eco-Development RegionEastern Mountain 39.71 16.54 11.31 32.44Eastern Hill 56.85 9.40 7.75 25.99Eastern Terai 79.71 7.94 7.99 4.36Central Mountain 7.66 1.46 1.93 88.95Central Hill 74.29 11.31 4.47 9.92Central Terai 91.15 2.40 0.82 5.63Western Mountain 0.0 9.40 15.42 75.18Western Hill 29.27 33.88 34.36 2.49Western Terai 99.34 0.12 0.41 0.12Mid-western Mountain 69.64 0.60 3.63 26.12Mid-western Hill 41.27 20.28 0.74 37.71Mid-western Terai 77.82 16.12 4.50 1.56Far-western Mountain 46.84 0.0 0.0 53.16Far-western Hill 93.67 5.32 0.45 0.56Far-western Terai 83.89 6.54 2.10 7.47Kathmandu Valley 61.92 2.81 7.55 27.72
NAPA Combined Vulnerability IndexVery High 70.23 6.63 3.91 19.23High 76.18 8.21 2.11 13.51Moderate 58.15 14.59 14.70 12.56Low 64.72 13.85 8.04 13.40Very Low 72.30 12.93 14.42 0.35Bio-Climate ZonesTropical 79.69 7.93 6.08 6.31Sub-tropical 50.27 15.86 11.07 22.80Temperate 42.28 14.66 7.73 35.32Sub-alpine 0.0 5.00 0.0 95.00Nepal 67.78 10.97 7.87 13.37
Table 8-5 represents the percentage distribution of households observing deterioration of ground water quality in last 25 years. The table shows that 67.78 per cent households are observing a deterioration of ground water quality in last 25 years while 10.97 per cent households are not observing so. Similarly,
higher percentage of households in Terai (86.48%) is observing such deterioration in water quality followed by hill (54.61%) and mountain (35.07%). While 79.69 per cent households in tropical zone are observing deterioration in ground water quality in last 25 years where as none observed so in sub-alpine zone.

National Climate Change Impact Survey 2016 | 135
Table 8-6: Surface Water Sources Dried in Last 25 Years
Analytical DomainResponse (HH, %)
Yes No Don't know Not applicableUrban/RuralUrban 56.42 27.01 7.05 9.51Rural 57.85 29.34 3.92 8.88Ecological BeltMountain 74.56 21.68 3.74 0.02Hill 63.83 27.88 6.11 2.18Terai 48.14 30.63 3.77 17.46Eco-Development RegionEastern Mountain 36.58 56.69 6.73 0.0Eastern Hill 82.34 15.14 1.69 0.83Eastern Terai 31.40 49.40 5.43 13.77Central Mountain 83.76 10.86 5.38 0.0Central Hill 82.05 15.06 2.55 0.34Central Terai 65.38 13.04 1.22 20.35Western Mountain 19.58 73.21 5.00 2.20Western Hill 23.91 59.77 16.22 0.10Western Terai 30.38 23.96 7.74 37.93Mid-western Mountain 90.24 9.13 0.64 0.0Mid-western Hill 79.46 18.97 0.16 1.41Mid-western Terai 67.52 30.02 2.45 0.0Far-western Mountain 92.09 7.91 0.0 0.0Far-western Hill 89.08 10.45 0.47 0.0Far-western Terai 40.38 47.87 4.35 7.39Kathmandu Valley 48.11 18.70 8.44 24.75
NAPA Combined Vulnerability IndexVery High 56.73 27.84 3.44 12.00High 75.73 19.97 1.11 3.19Moderate 52.03 28.99 7.26 11.72Low 54.36 37.40 5.20 3.04Very Low 32.71 32.67 10.89 23.72Bio-Climate ZonesTropical 52.53 29.61 4.50 13.37Sub-tropical 64.88 26.76 5.65 2.70Temperate 66.70 29.98 3.28 0.04Sub-alpine 35.00 60.00 5.00 0.0Nepal 57.43 28.66 4.84 9.07
Table 8-6 shows the percentage distribution of households observing dried surface water sources -in last 25 years. As a whole, 57.43 per cent households are observing the dried up of surface water sources in last 25 years. Similarly, majority of households in far-western mountain (92.09%)
and mid-western mountain (90.24%) region are observing such changes. Moreover, majority of households in temperate zone (66.70%) are observing such changes in last 25 years followed by sub-tropical (64.88%), tropical (52.53%), and sub-alpine (35%) in last 25 years.
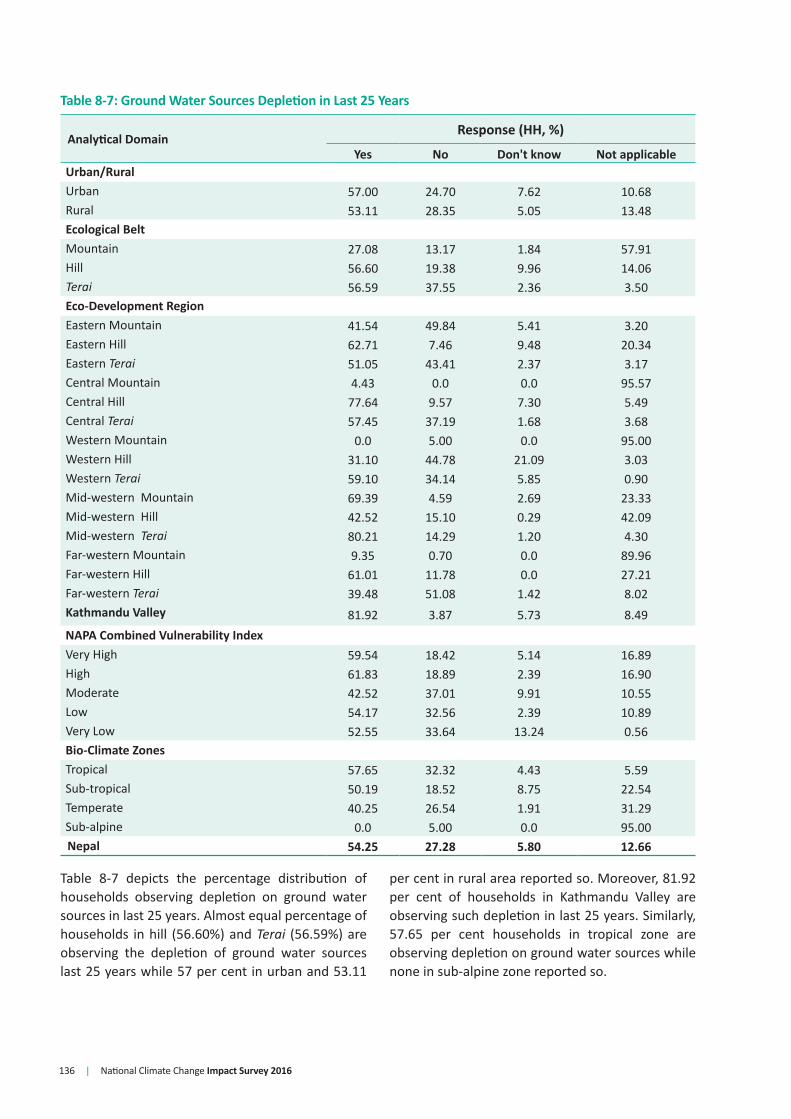
136 | National Climate Change Impact Survey 2016
Table 8-7 depicts the percentage distribution of households observing depletion on ground water sources in last 25 years. Almost equal percentage of households in hill (56.60%) and Terai (56.59%) are observing the depletion of ground water sources last 25 years while 57 per cent in urban and 53.11
per cent in rural area reported so. Moreover, 81.92 per cent of households in Kathmandu Valley are observing such depletion in last 25 years. Similarly, 57.65 per cent households in tropical zone are observing depletion on ground water sources while none in sub-alpine zone reported so.
Table 8-7: Ground Water Sources Depletion in Last 25 Years
Analytical DomainResponse (HH, %)
Yes No Don't know Not applicableUrban/RuralUrban 57.00 24.70 7.62 10.68Rural 53.11 28.35 5.05 13.48Ecological BeltMountain 27.08 13.17 1.84 57.91Hill 56.60 19.38 9.96 14.06Terai 56.59 37.55 2.36 3.50Eco-Development RegionEastern Mountain 41.54 49.84 5.41 3.20Eastern Hill 62.71 7.46 9.48 20.34Eastern Terai 51.05 43.41 2.37 3.17Central Mountain 4.43 0.0 0.0 95.57Central Hill 77.64 9.57 7.30 5.49Central Terai 57.45 37.19 1.68 3.68Western Mountain 0.0 5.00 0.0 95.00Western Hill 31.10 44.78 21.09 3.03Western Terai 59.10 34.14 5.85 0.90Mid-western Mountain 69.39 4.59 2.69 23.33Mid-western Hill 42.52 15.10 0.29 42.09Mid-western Terai 80.21 14.29 1.20 4.30Far-western Mountain 9.35 0.70 0.0 89.96Far-western Hill 61.01 11.78 0.0 27.21Far-western Terai 39.48 51.08 1.42 8.02Kathmandu Valley 81.92 3.87 5.73 8.49NAPA Combined Vulnerability IndexVery High 59.54 18.42 5.14 16.89High 61.83 18.89 2.39 16.90Moderate 42.52 37.01 9.91 10.55Low 54.17 32.56 2.39 10.89Very Low 52.55 33.64 13.24 0.56Bio-Climate ZonesTropical 57.65 32.32 4.43 5.59Sub-tropical 50.19 18.52 8.75 22.54Temperate 40.25 26.54 1.91 31.29Sub-alpine 0.0 5.00 0.0 95.00Nepal 54.25 27.28 5.80 12.66

National Climate Change Impact Survey 2016 | 137
Table 8-8: Completely Dried Ground Water Sources in Last 25 Years
Analytical Domain Response (HH, %)Yes No Don't know Not applicable Total
Urban/RuralUrban 42.47 38.74 7.03 11.76 100.00Rural 36.82 43.15 5.95 14.08 100.00Ecological BeltMountain 23.67 15.32 1.71 59.30 100.00Hill 48.81 24.60 10.86 15.73 100.00Terai 30.76 63.55 2.49 3.21 100.00Eco-Development RegionEastern Mountain 37.03 53.19 4.87 4.91 100.00Eastern Hill 54.77 8.48 12.74 24.00 100.00Eastern Terai 17.47 77.69 1.78 3.06 100.00Central Mountain 2.05 0.0 0.0 97.95 100.00Central Hill 73.06 9.76 10.99 6.18 100.00Central Terai 33.64 60.83 2.58 2.95 100.00Western Mountain 0.0 6.61 0.0 93.39 100.00Western Hill 16.72 59.81 18.12 5.35 100.00Western Terai 53.21 40.94 5.85 0.0 100.00Mid-western Mountain 68.54 4.59 2.69 24.18 100.00Mid-western Hill 39.04 17.09 1.05 42.82 100.00Mid-western Terai 51.40 43.05 1.25 4.30 100.00Far-western Mountain 2.63 7.53 0.0 89.84 100.00Far-western Hill 55.66 15.22 0.47 28.65 100.00Far-western Terai 9.55 78.99 1.13 10.33 100.00Kathmandu Valley 77.07 9.13 5.47 8.33 100.00NAPA Combined Vulnerability IndexVery High 37.69 37.96 7.12 17.23 100.00High 47.82 31.73 3.17 17.28 100.00Moderate 29.91 48.17 9.95 11.97 100.00Low 36.90 48.63 2.23 12.24 100.00Very Low 42.37 45.93 11.59 0.10 100.00Bio-Climate ZonesTropical 35.67 54.02 4.33 5.99 100.00Sub-tropical 43.58 22.59 9.90 23.94 100.00Temperate 37.67 25.98 4.67 31.67 100.00Sub-alpine 0.0 0.0 0.0 100.00 100.00Nepal 38.47 41.86 6.27 13.40 100.00
Table 8-8 depicts the percentage distribution of household observing ground water sources completely dried up in last 25 years. Table shows that 38.47 per cent of total households are observing a complete drying up of ground water sources whereas a higher proportion (41.86%) have reported the opposite. Similarly, 30.76 per cent households in Terai are observing such changes while 63.55 per cent households have not reported so. However, higher percentage
of households in Kathmandu Valley (77.07%) reported complete drying of water resources in last 25 years. Moreover, 47.82 per cent households in high vulnerable area under NAPA combined vulnerability index are observing such instances while only 29.91 per cent households reported so in moderately vulnerable area. Similarly, 43.58 per cent households in sub-tropical zone are observing such instances in last 25 years while no one in sub-alpine zone reported so.
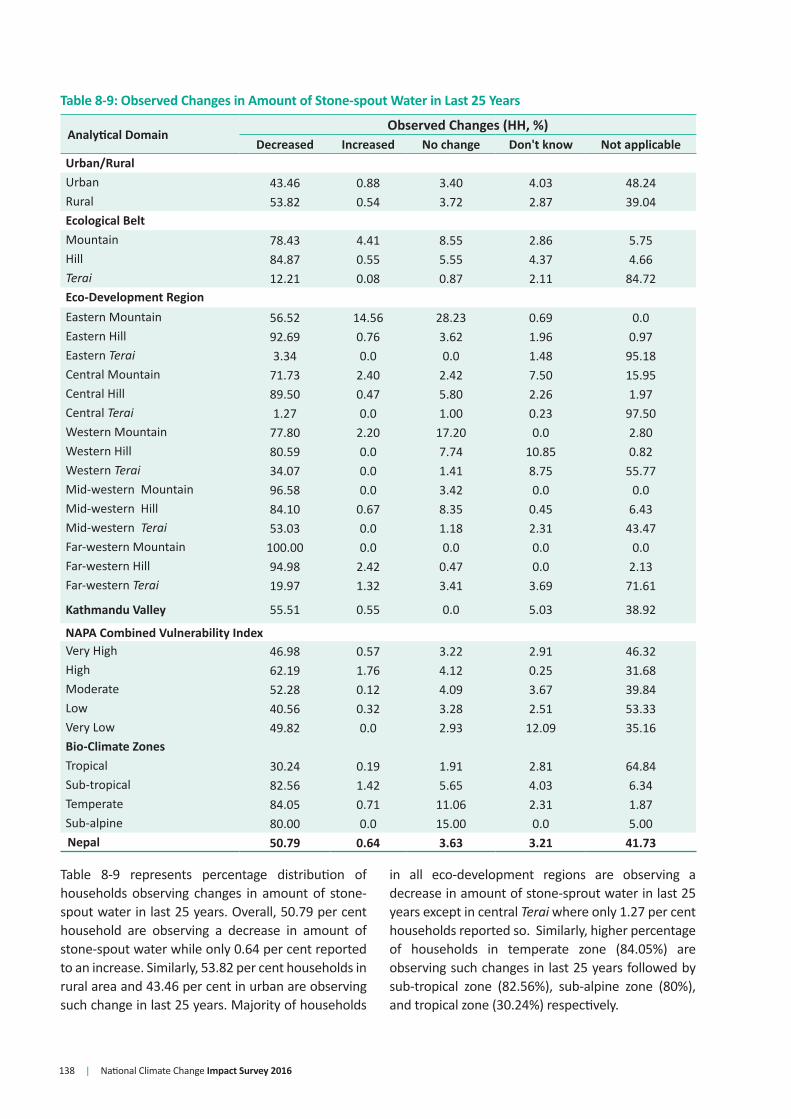
138 | National Climate Change Impact Survey 2016
Table 8-9: Observed Changes in Amount of Stone-spout Water in Last 25 Years
Analytical DomainObserved Changes (HH, %)
Decreased Increased No change Don't know Not applicableUrban/RuralUrban 43.46 0.88 3.40 4.03 48.24Rural 53.82 0.54 3.72 2.87 39.04Ecological BeltMountain 78.43 4.41 8.55 2.86 5.75Hill 84.87 0.55 5.55 4.37 4.66Terai 12.21 0.08 0.87 2.11 84.72Eco-Development RegionEastern Mountain 56.52 14.56 28.23 0.69 0.0Eastern Hill 92.69 0.76 3.62 1.96 0.97Eastern Terai 3.34 0.0 0.0 1.48 95.18Central Mountain 71.73 2.40 2.42 7.50 15.95Central Hill 89.50 0.47 5.80 2.26 1.97Central Terai 1.27 0.0 1.00 0.23 97.50Western Mountain 77.80 2.20 17.20 0.0 2.80Western Hill 80.59 0.0 7.74 10.85 0.82Western Terai 34.07 0.0 1.41 8.75 55.77Mid-western Mountain 96.58 0.0 3.42 0.0 0.0Mid-western Hill 84.10 0.67 8.35 0.45 6.43Mid-western Terai 53.03 0.0 1.18 2.31 43.47Far-western Mountain 100.00 0.0 0.0 0.0 0.0Far-western Hill 94.98 2.42 0.47 0.0 2.13Far-western Terai 19.97 1.32 3.41 3.69 71.61
Kathmandu Valley 55.51 0.55 0.0 5.03 38.92
NAPA Combined Vulnerability IndexVery High 46.98 0.57 3.22 2.91 46.32High 62.19 1.76 4.12 0.25 31.68Moderate 52.28 0.12 4.09 3.67 39.84Low 40.56 0.32 3.28 2.51 53.33Very Low 49.82 0.0 2.93 12.09 35.16Bio-Climate ZonesTropical 30.24 0.19 1.91 2.81 64.84Sub-tropical 82.56 1.42 5.65 4.03 6.34Temperate 84.05 0.71 11.06 2.31 1.87Sub-alpine 80.00 0.0 15.00 0.0 5.00Nepal 50.79 0.64 3.63 3.21 41.73
Table 8-9 represents percentage distribution of households observing changes in amount of stone-spout water in last 25 years. Overall, 50.79 per cent household are observing a decrease in amount of stone-spout water while only 0.64 per cent reported to an increase. Similarly, 53.82 per cent households in rural area and 43.46 per cent in urban are observing such change in last 25 years. Majority of households
in all eco-development regions are observing a decrease in amount of stone-sprout water in last 25 years except in central Terai where only 1.27 per cent households reported so. Similarly, higher percentage of households in temperate zone (84.05%) are observing such changes in last 25 years followed by sub-tropical zone (82.56%), sub-alpine zone (80%), and tropical zone (30.24%) respectively.

National Climate Change Impact Survey 2016 | 139
Table 8-10: Completely Dried Water in Stone-spout in Last 25 Years
Analytical DomainResponse (HH, %)
Yes No Don't know Not applicable TotalUrban/RuralUrban 33.38 12.90 4.56 49.16 100.00Rural 38.47 18.60 3.36 39.56 100.00Ecological-BeltMountain 69.58 20.26 4.45 5.71 100.00Hill 62.22 28.85 4.92 4.01 100.00Terai 6.33 4.53 2.39 86.75 100.00Eco-Development RegionEastern Mountain 35.63 56.62 7.06 0.69 100.00Eastern Hill 81.35 16.05 2.35 0.24 100.00Eastern Terai 1.08 0.0 1.05 97.87 100.00Central Mountain 68.84 8.23 7.55 15.39 100.00Central Hill 78.97 14.78 4.58 1.67 100.00Central Terai 0.15 1.13 0.0 98.72 100.00Western Mountain 13.99 80.42 2.80 2.80 100.00Western Hill 23.35 66.15 10.03 0.47 100.00Western Terai 12.22 19.60 12.28 55.90 100.00Mid-western Mountain 94.02 5.98 0.0 0.0 100.00Mid-western Hill 72.28 21.13 0.57 6.02 100.00Mid-western Terai 38.80 15.75 2.40 43.05 100.00Far-western Mountain 91.62 8.38 0.0 0.0 100.00Far-western Hill 90.99 9.01 0.0 0.0 100.00Far-western Terai 9.87 2.74 4.85 82.54 100.00Kathmandu Valley 54.27 3.26 5.67 36.80 100.00NAPA Combined Vulnerability IndexVery High 41.32 7.99 4.29 46.39 100.00High 53.87 12.91 1.02 32.21 100.00Moderate 26.85 29.16 4.06 39.93 100.00Low 32.31 9.67 2.28 55.73 100.00Very Low 19.44 33.93 11.66 34.97 100.00Bio-Climate ZonesTropical 19.95 10.79 3.07 66.19 100.00Sub-tropical 63.39 26.20 4.55 5.85 100.00Temperate 64.29 28.22 5.96 1.53 100.00Sub-alpine 25.00 65.00 5.00 5.00 100.00Nepal 36.98 16.93 3.72 42.37 100.00
Table 8-10 depicts the percentage distribution of households observing completely dried up stone-sprout last 25 years. Total 36.98 per cent households are observing completely dried stone-sprout while 16.93 per cent households reported opposite. Similarly, 38.47 per cent households in rural area are observing such changes while 33.38 per cent households in urban area reported so. Moreover, higher percentage of households in mountain region
(69.58%) have reported to have observed completely dried water in stone-spout in last 25 years followed by hill (62.22%) and Terai (6.33%). Similarly, 54.27 per cent of the households in Kathmandu Valley reported to observe such changes in last 25 years. Moreover, higher percentages of household in temperate zones (64.29%) are observing a complete drying of water in stone-sprout while only 19.95 per cent households reported so in tropical zone.

140 | National Climate Change Impact Survey 2016
Table 8-11: Observed Changes in Duration of Tap Water Supply in Last 25 Years
Analytical DomainObserved Change (HH, %)
Decreased Increased No change Stopped Not applicable Total
Urban/RuralUrban 46.36 6.36 15.76 0.48 31.05 100.00Rural 41.91 3.53 13.41 0.13 41.02 100.00Ecological BeltMountain 74.77 3.16 20.13 0.0 1.94 100.00Hill 66.52 8.37 19.21 0.40 5.50 100.00Terai 14.65 0.58 7.99 0.11 76.67 100.00Eco-Development RegionEastern Mountain 44.83 9.34 45.82 0.0 0.0 100.00Eastern Hill 85.80 2.93 10.48 0.54 0.26 100.00Eastern Terai 6.20 1.54 4.23 0.0 88.03 100.00Central Mountain 82.23 1.37 15.81 0.0 0.59 100.00Central Hill 72.16 19.92 6.46 0.0 1.45 100.00Central Terai 3.07 0.13 3.72 0.0 93.08 100.00Western Mountain 21.19 41.01 37.80 0.0 0.0 100.00Western Hill 47.17 1.86 48.39 0.0 2.58 100.00Western Terai 50.85 0.0 16.38 0.0 32.76 100.00Mid-western Mountain 96.21 0.0 3.79 0.0 0.0 100.00Mid-western Hill 53.35 1.00 15.72 0.0 29.93 100.00Mid-western Terai 42.53 0.0 4.35 1.11 52.01 100.00Far-western Mountain 79.50 0.0 11.55 0.0 8.94 100.00Far-western Hill 97.68 1.24 1.09 0.0 0.0 100.00Far-western Terai 16.19 0.0 44.27 0.0 39.54 100.00Kathmandu Valley 68.73 23.27 0.18 4.39 3.43 100.00
NAPA Combined Vulnerability IndexVery High 50.24 5.14 5.79 0.61 38.22 100.00High 45.58 10.14 7.37 0.0 36.91 100.00Moderate 36.04 1.11 23.61 0.18 39.06 100.00Low 37.13 2.56 15.48 0.24 44.59 100.00Very Low 52.28 0.0 24.13 0.0 23.59 100.00Bio-Climate ZonesTropical 24.90 3.29 11.60 0.10 60.12 100.00Sub-tropical 71.08 6.45 17.61 0.50 4.35 100.00Temperate 76.58 2.57 20.65 0.0 0.20 100.00Sub-alpine 30.00 30.00 40.00 0.0 0.0 100.00Nepal 43.21 4.36 14.10 0.23 38.10 100.00
Table 8-11 represents the percentage distribution of households observing changes in duration of tap water supply in last 25 years. The result shows that 43.21 per cent households are observing decrease in the duration of tap water supply in last 25 years while only 4.36 per cent reported an increase. Similarly, 46.36 per cent households in urban area are observing a decrease in
duration of tap water supply while 41.91 per cent households reported so in rural area. Among the climatic zones, higher percentage of households in temperate zone (76.58%) are observing a decrease in duration of tap water supply in last 25 years while only 24.90 per cent households in tropical and 30 per cent households in sub-alpine zone have reported so.

National Climate Change Impact Survey 2016 | 141
Table 8-12: Reasons of Changes in Water Sources
Analytical Domain
Reasons of Change (HH, %)11
Insu
ffici
ent r
ainf
all
Suffi
cien
t rai
nfal
l
Tem
pera
ture
incr
ease
Tem
pera
ture
dec
reas
e
Road
con
stru
ction
Land
slid
e /
soil
eros
ion
Urb
anis
ation
Defo
rest
ation
Heav
y us
e of
un
derg
roun
d w
ater
Min
ing
Popu
latio
n in
crea
se
Eart
hqua
ke
Oth
ers
Urban/RuralUrban 81.8 0.7 43.0 0.1 9.9 2.8 24.8 38.9 13.9 1.8 27.1 8.8 3.9Rural 92.1 0.4 44.6 0.5 9.8 4.4 5.3 37.4 5.4 1.2 18.4 16.1 3.1Ecological BeltMountain 76.9 1.7 37.6 0.9 9.9 4.1 3.7 41.3 0.0 0.0 20.5 27.6 4.6Hill 89.5 0.5 45.7 0.4 16.0 7.0 13.6 26.4 4.7 1.2 21.8 20.9 2.3Terai 91.1 0.3 43.5 0.3 2.8 0.3 9.9 50.2 13.4 1.9 20.3 3.0 4.2Eco-Development RegionEastern Mountain 71.7 3.7 37.7 28.9 21.5 9.4 4.8 0.0 0.0 23.6 39.3 10.4Eastern Hill 97.9 0.5 52.3 0.3 24.4 2.3 12.6 23.8 1.9 0.2 20.0 16.5 3.6Eastern Terai 84.1 0.0 16.5 0.0 3.2 0.0 10.3 42.5 17.3 1.0 25.7 4.9 6.7Central Mountain 54.8 1.7 27.0 0.0 5.6 0.0 3.3 13.7 0.0 0.0 22.5 55.6 6.8Central Hill 95.1 0.4 54.9 1.0 20.6 0.6 11.1 17.7 2.8 1.1 13.3 32.2 0.2Central Terai 98.8 0.3 61.8 0.3 0.3 0.0 1.9 41.1 1.8 0.5 6.8 2.8 4.9Western Mountain 91.9 2.5 21.5 5.7 5.0 16.3 0.0 17.4 0.0 0.0 0.0 8.1 24.6Western Hill 77.5 0.4 21.5 0.0 11.4 6.2 5.4 12.1 1.1 2.0 23.3 34.9 6.0Western Terai 87.6 0.1 46.5 0.5 3.5 0.4 16.9 70.8 29.0 5.9 24.1 1.1 1.1Mid-western Mountain 94.6 0.0 2.1 0.0 8.3 0.0 2.8 59.5 0.0 0.0 34.9 2.1 0.0Mid-western Hill 88.3 0.5 39.0 0.0 11.1 19.2 8.3 48.9 0.7 0.0 28.9 6.6 2.1Mid-western Terai 91.6 0.6 34.0 0.0 7.1 1.0 16.7 47.7 10.0 2.1 35.1 3.8 3.3Far-western Mountain 97.5 1.6 90.4 3.8 3.8 0.5 1.1 96.3 0.0 0.0 1.7 0.5 0.0Far-western Hill 95.4 1.7 75.4 0.0 6.8 31.6 0.0 58.1 2.8 5.3 14.6 1.0 1.3Far-western Terai 95.2 1.1 84.3 1.0 1.6 0.7 11.0 72.0 14.2 1.1 16.6 0.0 0.9Kathmandu Valley 64.3 0.0 21.7 0.0 3.4 0.0 63.4 20.6 35.0 0.7 51.4 6.5 2.3
NAPA Combined Vulnerability IndexVery High 82.2 0.4 38.3 0.6 8.5 0.2 19.4 28.9 14.5 0.7 22.1 14.3 2.7High 96.5 0.6 49.7 0.1 12.6 6.2 5.2 36.5 0.7 1.5 16.2 19.7 3.5Moderate 89.8 0.6 51.4 0.5 11.2 3.7 2.2 33.0 1.7 0.8 12.9 18.2 3.8Low 87.1 0.6 39.4 0.3 9.7 7.7 14.6 46.8 7.5 1.0 29.7 5.7 4.7Very Low 89.3 0.1 40.0 0.4 3.6 0.3 14.5 57.8 23.5 4.8 29.8 5.0 0.9Bio-Climate ZonesTropical 90.3 0.3 42.3 0.4 7.6 2.0 9.2 43.9 9.9 1.7 19.7 11.4 4.2Sub-tropical 87.5 0.8 48.0 0.4 13.2 6.7 15.3 28.4 5.9 1.0 23.1 17.8 1.9Temperate 85.2 0.7 35.8 0.5 11.7 6.1 3.0 36.7 0.0 0.0 22.4 14.9 3.0Sub-alpine 94.7 0.0 31.6 5.3 0.0 10.5 0.0 0.0 0.0 0.0 0.0 5.3 36.8Nepal 89.0 0.5 44.1 0.4 9.8 3.9 11.1 37.9 8.0 1.4 21.1 13.9 3.3
11 The result is based on the multiple response
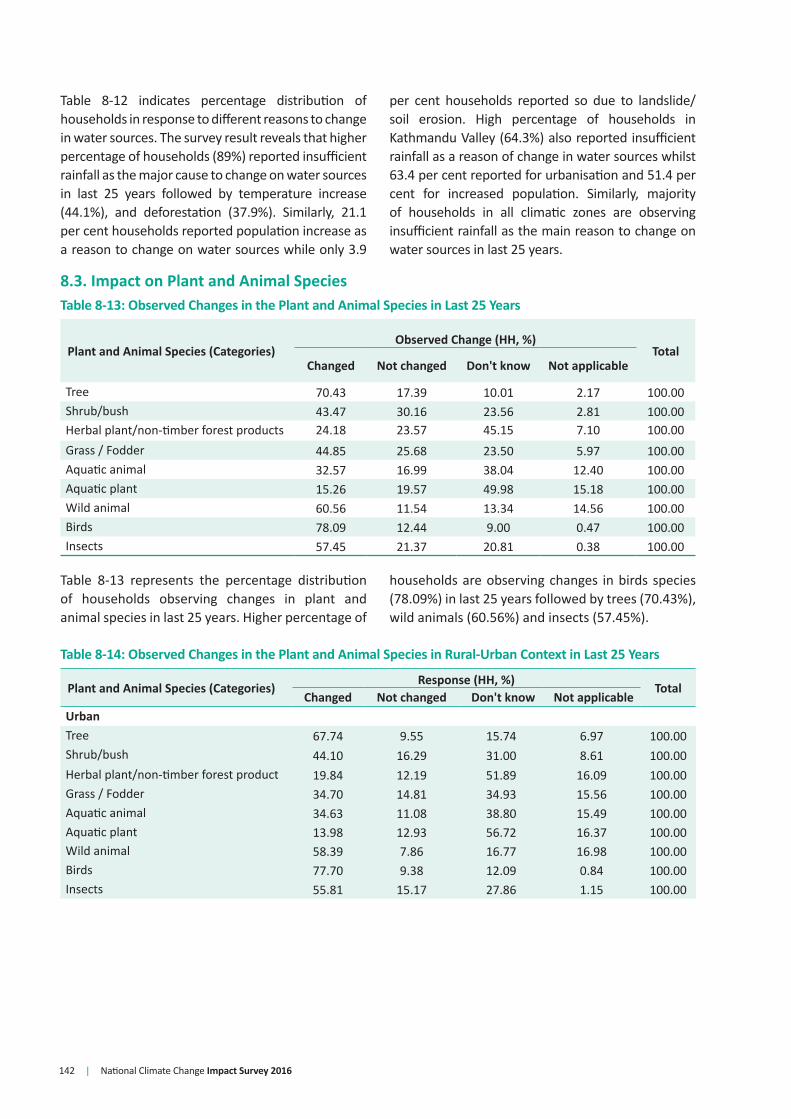
142 | National Climate Change Impact Survey 2016
Table 8-12 indicates percentage distribution of households in response to different reasons to change in water sources. The survey result reveals that higher percentage of households (89%) reported insufficient rainfall as the major cause to change on water sources in last 25 years followed by temperature increase (44.1%), and deforestation (37.9%). Similarly, 21.1 per cent households reported population increase as a reason to change on water sources while only 3.9
per cent households reported so due to landslide/soil erosion. High percentage of households in Kathmandu Valley (64.3%) also reported insufficient rainfall as a reason of change in water sources whilst 63.4 per cent reported for urbanisation and 51.4 per cent for increased population. Similarly, majority of households in all climatic zones are observing insufficient rainfall as the main reason to change on water sources in last 25 years.
8.3. Impact on Plant and Animal SpeciesTable 8-13: Observed Changes in the Plant and Animal Species in Last 25 Years
Plant and Animal Species (Categories)Observed Change (HH, %)
TotalChanged Not changed Don't know Not applicable
Tree 70.43 17.39 10.01 2.17 100.00Shrub/bush 43.47 30.16 23.56 2.81 100.00Herbal plant/non-timber forest products 24.18 23.57 45.15 7.10 100.00Grass / Fodder 44.85 25.68 23.50 5.97 100.00Aquatic animal 32.57 16.99 38.04 12.40 100.00Aquatic plant 15.26 19.57 49.98 15.18 100.00Wild animal 60.56 11.54 13.34 14.56 100.00Birds 78.09 12.44 9.00 0.47 100.00Insects 57.45 21.37 20.81 0.38 100.00
Table 8-13 represents the percentage distribution of households observing changes in plant and animal species in last 25 years. Higher percentage of
households are observing changes in birds species (78.09%) in last 25 years followed by trees (70.43%), wild animals (60.56%) and insects (57.45%).
Table 8-14: Observed Changes in the Plant and Animal Species in Rural-Urban Context in Last 25 Years
Plant and Animal Species (Categories) Response (HH, %) TotalChanged Not changed Don't know Not applicable
UrbanTree 67.74 9.55 15.74 6.97 100.00Shrub/bush 44.10 16.29 31.00 8.61 100.00Herbal plant/non-timber forest product 19.84 12.19 51.89 16.09 100.00Grass / Fodder 34.70 14.81 34.93 15.56 100.00Aquatic animal 34.63 11.08 38.80 15.49 100.00Aquatic plant 13.98 12.93 56.72 16.37 100.00Wild animal 58.39 7.86 16.77 16.98 100.00Birds 77.70 9.38 12.09 0.84 100.00Insects 55.81 15.17 27.86 1.15 100.00

National Climate Change Impact Survey 2016 | 143
Table 8-14 depicts the percentage distribution of households observing changes in the plant and animal species by rural-urban area in last 25 years. Almost equal percentage of households in rural (78.25%) and urban (77.70%) reported to observing change in bird species. Similarly, majority households in rural area
(71.54%) are observing changes in tree species while 67.74 per cent households are observing so in urban area. Moreover, 35.90 per cent households in rural area and 16.29 per cent households in urban area reported that they are not noticing such change in shrub/bush species in last 25 years.
Plant and Animal Species (Categories) Response (HH, %) TotalChanged Not changed Don't know Not applicable
RuralTree 71.54 20.64 7.64 0.18 100.00Shrub/bush 43.22 35.90 20.48 0.40 100.00Herbal plant/non-timber forest product 25.97 28.29 42.36 3.38 100.00Grass/Fodder 49.05 30.18 18.77 2.00 100.00Aquatic animal 31.71 19.44 37.72 11.12 100.00Aquatic plant 15.79 22.33 47.19 14.68 100.00Wild animal 61.46 13.07 11.91 13.56 100.00Birds 78.25 13.71 7.73 0.31 100.00Insects 58.12 23.93 17.89 0.06 100.00
Table 8-15: Observed Changes in the Plant and animal Species by Ecological Belt in Last 25 Years
Plant and Animal Species (Categories)Observed Changes (HH, %)
TotalChanged Not changed Don't know Not applicable
MountainTree 64.90 25.91 9.19 0.0 100.00Shrub/bushShrub/bush 33.27 37.41 29.32 0.0 100.00Herbal plant/non-timber forest product 21.63 31.76 46.32 0.29 100.00Grass / Fodder 41.85 34.48 23.56 0.12 100.00Aquatic animal 10.45 31.38 46.86 11.31 100.00Aquatic plant 1.10 29.31 58.36 11.23 100.00Wild animal 82.86 7.89 9.25 0.0 100.00Birds 77.80 12.07 10.13 0.0 100.00Insects 43.51 24.98 31.34 0.17 100.00HillTree 56.70 26.80 12.57 3.94 100.00Shrub/bush 42.04 30.99 22.86 4.11 100.00Herbal plant/non-timber forest product 22.03 26.88 46.03 5.06 100.00Grass / Fodder 39.57 33.49 22.42 4.53 100.00Aquatic animal 12.04 18.05 49.11 20.80 100.00Aquatic plant 1.42 17.60 55.95 25.03 100.00Wild animal 68.18 13.89 12.93 5.01 100.00Birds 68.50 19.87 11.05 0.58 100.00Insects 45.50 28.56 25.44 0.50 100.00
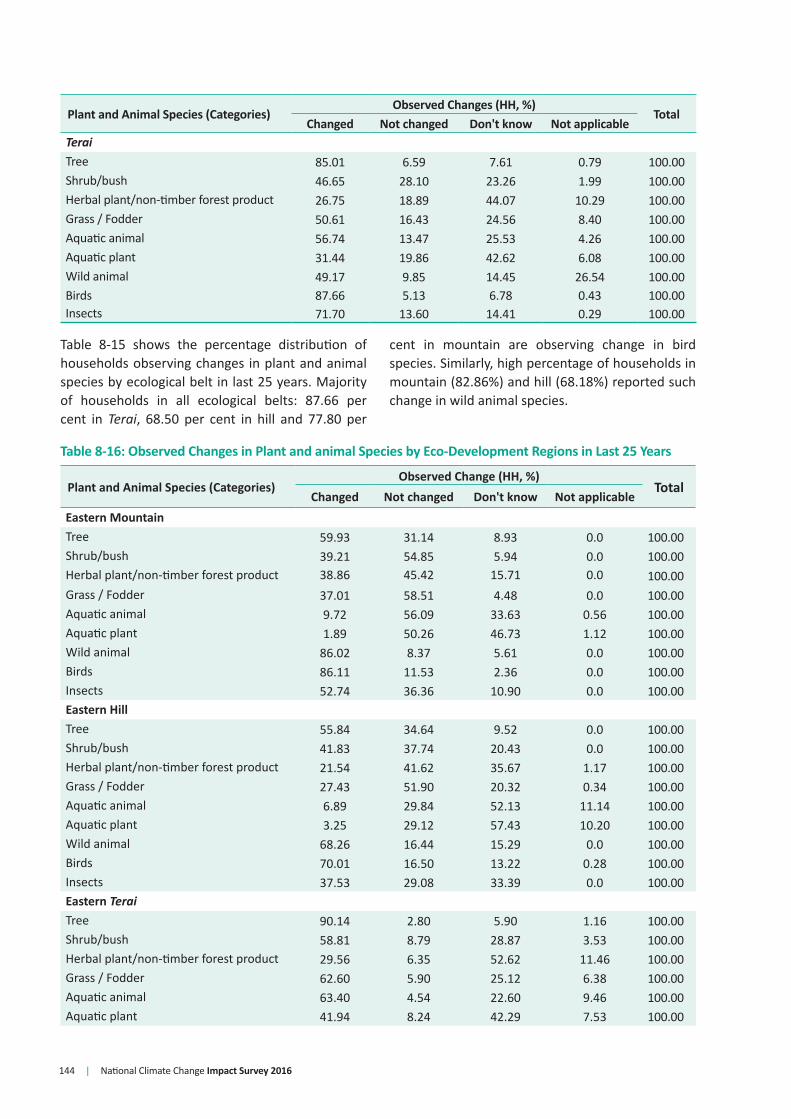
144 | National Climate Change Impact Survey 2016
Plant and Animal Species (Categories)Observed Changes (HH, %)
TotalChanged Not changed Don't know Not applicable
Terai
Tree 85.01 6.59 7.61 0.79 100.00Shrub/bush 46.65 28.10 23.26 1.99 100.00Herbal plant/non-timber forest product 26.75 18.89 44.07 10.29 100.00Grass / Fodder 50.61 16.43 24.56 8.40 100.00Aquatic animal 56.74 13.47 25.53 4.26 100.00Aquatic plant 31.44 19.86 42.62 6.08 100.00Wild animal 49.17 9.85 14.45 26.54 100.00Birds 87.66 5.13 6.78 0.43 100.00Insects 71.70 13.60 14.41 0.29 100.00
Table 8-15 shows the percentage distribution of households observing changes in plant and animal species by ecological belt in last 25 years. Majority of households in all ecological belts: 87.66 per cent in Terai, 68.50 per cent in hill and 77.80 per
cent in mountain are observing change in bird species. Similarly, high percentage of households in mountain (82.86%) and hill (68.18%) reported such change in wild animal species.
Table 8-16: Observed Changes in Plant and animal Species by Eco-Development Regions in Last 25 Years
Plant and Animal Species (Categories)Observed Change (HH, %)
TotalChanged Not changed Don't know Not applicable
Eastern MountainTree 59.93 31.14 8.93 0.0 100.00Shrub/bush 39.21 54.85 5.94 0.0 100.00Herbal plant/non-timber forest product 38.86 45.42 15.71 0.0 100.00Grass / Fodder 37.01 58.51 4.48 0.0 100.00Aquatic animal 9.72 56.09 33.63 0.56 100.00Aquatic plant 1.89 50.26 46.73 1.12 100.00Wild animal 86.02 8.37 5.61 0.0 100.00Birds 86.11 11.53 2.36 0.0 100.00Insects 52.74 36.36 10.90 0.0 100.00Eastern HillTree 55.84 34.64 9.52 0.0 100.00Shrub/bush 41.83 37.74 20.43 0.0 100.00Herbal plant/non-timber forest product 21.54 41.62 35.67 1.17 100.00Grass / Fodder 27.43 51.90 20.32 0.34 100.00Aquatic animal 6.89 29.84 52.13 11.14 100.00Aquatic plant 3.25 29.12 57.43 10.20 100.00Wild animal 68.26 16.44 15.29 0.0 100.00Birds 70.01 16.50 13.22 0.28 100.00Insects 37.53 29.08 33.39 0.0 100.00Eastern Terai
Tree 90.14 2.80 5.90 1.16 100.00Shrub/bush 58.81 8.79 28.87 3.53 100.00Herbal plant/non-timber forest product 29.56 6.35 52.62 11.46 100.00Grass / Fodder 62.60 5.90 25.12 6.38 100.00Aquatic animal 63.40 4.54 22.60 9.46 100.00Aquatic plant 41.94 8.24 42.29 7.53 100.00

National Climate Change Impact Survey 2016 | 145
Plant and Animal Species (Categories)Observed Change (HH, %)
TotalChanged Not changed Don't know Not applicable
Wild animal 53.35 5.01 6.96 34.67 100.00Birds 94.35 1.03 4.38 0.23 100.00Insects 79.92 5.26 14.46 0.36 100.00Central MountainTree 88.94 6.98 4.08 0.0 100.00Shrub/bush 22.45 21.56 55.98 0.0 100.00Herbal plant/non-timber forest product 16.98 13.50 69.53 0.0 100.00Grass / Fodder 50.80 11.23 37.97 0.0 100.00Aquatic animal 0.0 6.83 63.06 30.11 100.00Aquatic plant 0.0 5.23 65.56 29.21 100.00Wild animal 100.00 0.0 0.0 0.0 100.00Birds 99.09 0.0 0.91 0.0 100.00Insects 49.90 4.27 45.83 0.0 100.00Central HillTree 60.97 36.81 2.23 0.0 100.00Shrub/bush 37.50 39.35 23.15 0.0 100.00Herbal plant/non-timber forest product 9.42 29.71 59.04 1.83 100.00Grass / Fodder 31.29 36.46 32.10 0.15 100.00Aquatic animal 8.11 7.70 53.09 31.10 100.00Aquatic plant 7.45 60.04 32.51 100.00Wild animal 63.35 25.56 9.32 1.78 100.00Birds 63.07 31.86 5.06 0.0 100.00Insects 49.17 34.81 16.02 0.0 100.00Central Terai
Tree 88.35 6.55 5.09 0.0 100.00Shrub/bush 36.35 49.93 13.73 0.0 100.00Herbal plant/non-timber forest product 33.99 28.29 34.28 3.44 100.00Grass / Fodder 51.85 21.88 24.29 1.97 100.00Aquatic animal 61.05 14.59 24.36 0.0 100.00Aquatic plant 35.18 23.40 41.41 0.0 100.00Wild animal 34.40 15.18 13.87 36.55 100.00Birds 90.89 5.36 3.36 0.39 100.00Insects 75.94 16.23 7.83 0.0 100.00Western MountainTree 87.80 10.00 2.20 0.0 100.00Shrub/bush 40.18 53.21 6.61 0.0 100.00Herbal plant/non-timber forest product 32.20 42.80 25.00 0.0 100.00Grass / Fodder 51.19 41.61 7.20 0.0 100.00Aquatic animal 4.40 51.01 44.58 0.0 100.00Aquatic plant 0.0 37.02 62.98 0.0 100.00Wild animal 95.00 0.0 5.00 0.0 100.00Birds 73.99 16.61 9.40 0.0 100.00Insects 9.40 42.20 48.39 0.0 100.00Western HillTree 43.37 29.07 27.23 0.33 100.00Shrub/bush 33.06 33.10 33.46 0.38 100.00
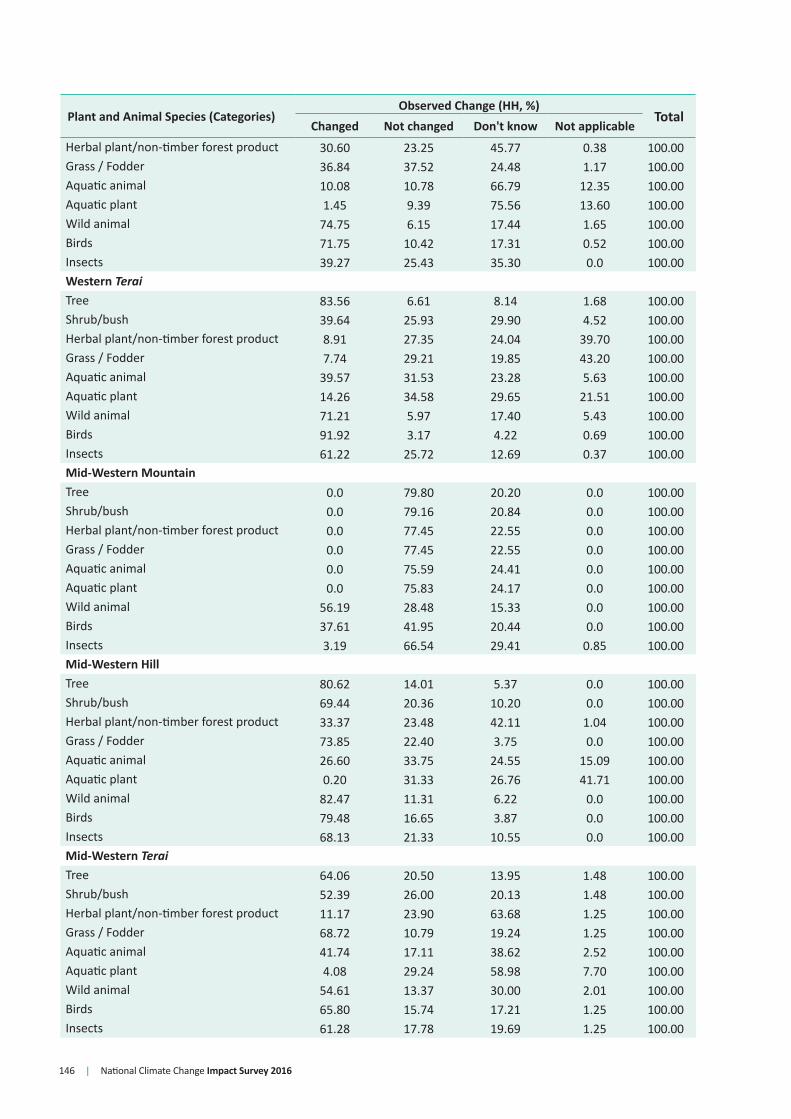
146 | National Climate Change Impact Survey 2016
Plant and Animal Species (Categories)Observed Change (HH, %)
TotalChanged Not changed Don't know Not applicable
Herbal plant/non-timber forest product 30.60 23.25 45.77 0.38 100.00Grass / Fodder 36.84 37.52 24.48 1.17 100.00Aquatic animal 10.08 10.78 66.79 12.35 100.00Aquatic plant 1.45 9.39 75.56 13.60 100.00Wild animal 74.75 6.15 17.44 1.65 100.00Birds 71.75 10.42 17.31 0.52 100.00Insects 39.27 25.43 35.30 0.0 100.00Western Terai
Tree 83.56 6.61 8.14 1.68 100.00Shrub/bush 39.64 25.93 29.90 4.52 100.00Herbal plant/non-timber forest product 8.91 27.35 24.04 39.70 100.00Grass / Fodder 7.74 29.21 19.85 43.20 100.00Aquatic animal 39.57 31.53 23.28 5.63 100.00Aquatic plant 14.26 34.58 29.65 21.51 100.00Wild animal 71.21 5.97 17.40 5.43 100.00Birds 91.92 3.17 4.22 0.69 100.00Insects 61.22 25.72 12.69 0.37 100.00Mid-Western MountainTree 0.0 79.80 20.20 0.0 100.00Shrub/bush 0.0 79.16 20.84 0.0 100.00Herbal plant/non-timber forest product 0.0 77.45 22.55 0.0 100.00Grass / Fodder 0.0 77.45 22.55 0.0 100.00Aquatic animal 0.0 75.59 24.41 0.0 100.00Aquatic plant 0.0 75.83 24.17 0.0 100.00Wild animal 56.19 28.48 15.33 0.0 100.00Birds 37.61 41.95 20.44 0.0 100.00Insects 3.19 66.54 29.41 0.85 100.00Mid-Western HillTree 80.62 14.01 5.37 0.0 100.00Shrub/bush 69.44 20.36 10.20 0.0 100.00Herbal plant/non-timber forest product 33.37 23.48 42.11 1.04 100.00Grass / Fodder 73.85 22.40 3.75 0.0 100.00Aquatic animal 26.60 33.75 24.55 15.09 100.00Aquatic plant 0.20 31.33 26.76 41.71 100.00Wild animal 82.47 11.31 6.22 0.0 100.00Birds 79.48 16.65 3.87 0.0 100.00Insects 68.13 21.33 10.55 0.0 100.00Mid-Western Terai
Tree 64.06 20.50 13.95 1.48 100.00Shrub/bush 52.39 26.00 20.13 1.48 100.00Herbal plant/non-timber forest product 11.17 23.90 63.68 1.25 100.00Grass / Fodder 68.72 10.79 19.24 1.25 100.00Aquatic animal 41.74 17.11 38.62 2.52 100.00Aquatic plant 4.08 29.24 58.98 7.70 100.00Wild animal 54.61 13.37 30.00 2.01 100.00Birds 65.80 15.74 17.21 1.25 100.00Insects 61.28 17.78 19.69 1.25 100.00

National Climate Change Impact Survey 2016 | 147
Plant and Animal Species (Categories)Observed Change (HH, %)
TotalChanged Not changed Don't know Not applicable
Far-Western MountainTree 91.27 0.55 8.18 0.0 100.00Shrub/bush 79.41 1.65 18.94 0.0 100.00Herbal plant/non-timber forest product 30.07 1.51 66.93 1.49 100.00Grass / Fodder 73.40 3.39 22.61 0.60 100.00Aquatic animal 41.75 0.0 56.33 1.92 100.00Aquatic plant 3.31 0.0 94.16 2.52 100.00Wild animal 73.54 1.41 25.04 0.0 100.00Birds 68.83 4.55 26.62 0.0 100.00Insects 62.76 6.04 31.20 0.0 100.00Far-Western HillTree 95.44 4.56 0.0 0.0 100.00Shrub/bush 75.90 20.45 3.65 0.0 100.00Herbal plant/non-timber forest product 33.46 22.64 43.90 0.0 100.00Grass / Fodder 86.57 9.03 4.40 0.0 100.00Aquatic animal 21.16 45.32 20.80 12.72 100.00Aquatic plant 5.76 53.00 28.46 12.79 100.00Wild animal 89.24 8.19 2.57 0.0 100.00Birds 86.04 9.51 4.46 0.0 100.00Insects 60.91 28.59 10.50 0.0 100.00Far-Western Terai
Tree 72.23 5.71 21.38 0.67 100.00Shrub/bush 46.57 9.85 42.16 1.41 100.00Herbal plant/non-timber forest product 27.15 6.39 64.89 1.57 100.00Grass / Fodder 32.50 25.31 41.03 1.17 100.00Aquatic animal 51.37 14.62 32.69 1.32 100.00Aquatic plant 27.80 18.74 51.61 1.85 100.00Wild animal 63.69 6.26 29.09 0.96 100.00Birds 56.89 13.53 29.59 0.0 100.00Insects 37.25 13.28 49.47 0.0 100.00Kathmandu ValleyTree 12.53 2.97 29.11 55.39 100.00Shrub/bush 11.65 2.34 28.26 57.74 100.00Herbal plant/non-timber forest product 6.80 2.39 31.77 59.05 100.00Grass / Fodder 4.60 2.04 34.23 59.14 100.00Aquatic animal 11.86 2.04 29.34 56.76 100.00Aquatic plant 0.67 1.74 40.52 57.07 100.00Wild animal 13.94 1.69 25.85 58.51 100.00Birds 35.77 34.10 24.59 5.53 100.00Insects 17.68 28.98 46.19 7.15 100.00

148 | National Climate Change Impact Survey 2016
Table 8-16 represents the percentage distribution of households observing changes in the plant and animal species by eco-development region in last 25 years. The survey result shows that majority of households in all eco-development regions are observing changes in birds and wild animal species. Similarly, all households in central mountain region (100%) reported to have observed change in wild animals
while 99.09 per cent households reported so for bird species. Similarly, higher percentage of household in far-western hill (95.44%) are observing changes in tree species in last 25 years followed by far-western mountain (91.27%) and eastern Terai (90.14%). Moreover, significant percentage of households in eastern Terai (79.92%) and central Terai (75.94%) are observing changes on insect species.
Table 8-17: Observed Changes in the Plant and Animal Species by NAPA Combined Vulnerability Index in Last 25 Years
Plan and Animal Species (Categories)Observed Change (HH, %)
TotalChanged Not changed Don't know Not applicable
Very HighTree 82.20 3.72 6.21 7.87 100.00Shrub/bush 56.65 9.15 26.11 8.09 100.00Herbal plant/non-timber forest product 26.80 7.82 55.49 9.90 100.00Grass / Fodder 48.00 8.89 34.47 8.65 100.00Aquatic animal 28.83 4.40 48.63 18.14 100.00Aquatic plant 12.68 3.88 66.23 17.21 100.00Wild animal 57.51 2.23 9.43 30.83 100.00Birds 84.95 7.15 6.97 0.94 100.00Insects 71.66 6.86 20.48 1.00 100.00HighTree 61.63 34.10 4.26 0.0 100.00Shrub/bush 38.59 50.37 11.05 0.0 100.00Herbal plant/non-timber forest product 21.99 41.26 34.68 2.07 100.00Grass / Fodder 43.48 40.88 14.19 1.45 100.00Aquatic animal 27.77 31.63 21.72 18.88 100.00Aquatic plant 8.02 34.62 30.96 26.40 100.00Wild animal 48.32 26.97 14.06 10.65 100.00Birds 66.39 27.02 6.50 0.10 100.00Insects 46.74 41.38 11.88 0.0 100.00ModerateTree 69.81 16.05 14.05 0.09 100.00Shrub/bush 40.50 39.34 20.04 0.12 100.00Herbal plant/non-timber forest product 34.20 27.77 36.87 1.16 100.00Grass / Fodder 46.98 30.34 22.19 0.49 100.00Aquatic animal 34.36 14.67 46.86 4.11 100.00Aquatic plant 19.86 17.27 59.16 3.72 100.00Wild animal 61.89 8.57 12.38 17.15 100.00Birds 78.62 8.56 12.41 0.41 100.00Insects 57.99 21.32 20.64 0.06 100.00LowTree 74.66 11.90 12.25 1.19 100.00Shrub/bush 45.33 17.08 34.35 3.24 100.00Herbal plant/non-timber forest product 19.00 12.58 59.57 8.85 100.00Grass / Fodder 52.37 18.37 24.08 5.18 100.00

National Climate Change Impact Survey 2016 | 149
Plan and Animal Species (Categories)Observed Change (HH, %)
TotalChanged Not changed Don't know Not applicable
Aquatic animal 43.56 15.32 33.47 7.65 100.00Aquatic plant 23.86 21.31 45.68 9.16 100.00Wild animal 71.35 10.48 15.93 2.24 100.00Birds 78.25 9.89 11.59 0.28 100.00Insects 52.95 15.65 30.85 0.55 100.00Very LowTree 55.82 24.14 18.77 1.26 100.00Shrub/bush 26.76 35.51 34.69 3.03 100.00Herbal plant/non-timber forest product 8.40 30.80 35.75 25.04 100.00Grass / Fodder 17.73 32.41 22.42 27.44 100.00Aquatic animal 24.75 20.40 40.95 13.90 100.00Aquatic plant 8.92 21.91 44.25 24.92 100.00Wild animal 72.22 4.94 17.92 4.92 100.00Birds 89.68 3.78 5.72 0.82 100.00Insects 58.49 18.63 22.65 0.23 100.00
Table 8-17 shows the percentage distribution of households observing changes in plant and animal species by NAPA combined vulnerability index in last 25 years. Higher percentages of households in all categories are observing changes in bird species.
Similarly, majority of households in very high area (82.20%) are observing changes in tree species (61.63%) while 72.22 per cent households in very low vulnerable area reported to change on wild animals.
Plan and Animal Species (Categories)Observed Changes (%)
TotalChanged Not changed Don't know Not applicable
TropicalTree 77.59 13.14 8.59 0.67 100.00Shrub/bush 45.34 30.52 22.57 1.58 100.00Herbal plant/non-timber forest product 25.19 21.68 45.14 7.99 100.00Grass / Fodder 48.58 21.83 23.00 6.60 100.00Aquatic animal 47.46 14.17 29.64 8.73 100.00Aquatic plant 24.37 19.26 44.70 11.67 100.00Wild animal 53.87 12.20 13.45 20.48 100.00Birds 81.25 10.36 8.01 0.38 100.00Insects 64.10 18.10 17.58 0.22 100.00Sub-TropicalTree 59.91 22.93 12.06 5.10 100.00Shrub/bush 41.80 28.23 24.63 5.35 100.00Herbal plant/non-timber forest product 22.12 25.59 45.80 6.49 100.00Grass / Fodder 40.33 30.39 23.62 5.66 100.00
Table 8-18: Observed Changes in Plant Species by Bio-Climatic Zones in Last 25 Years
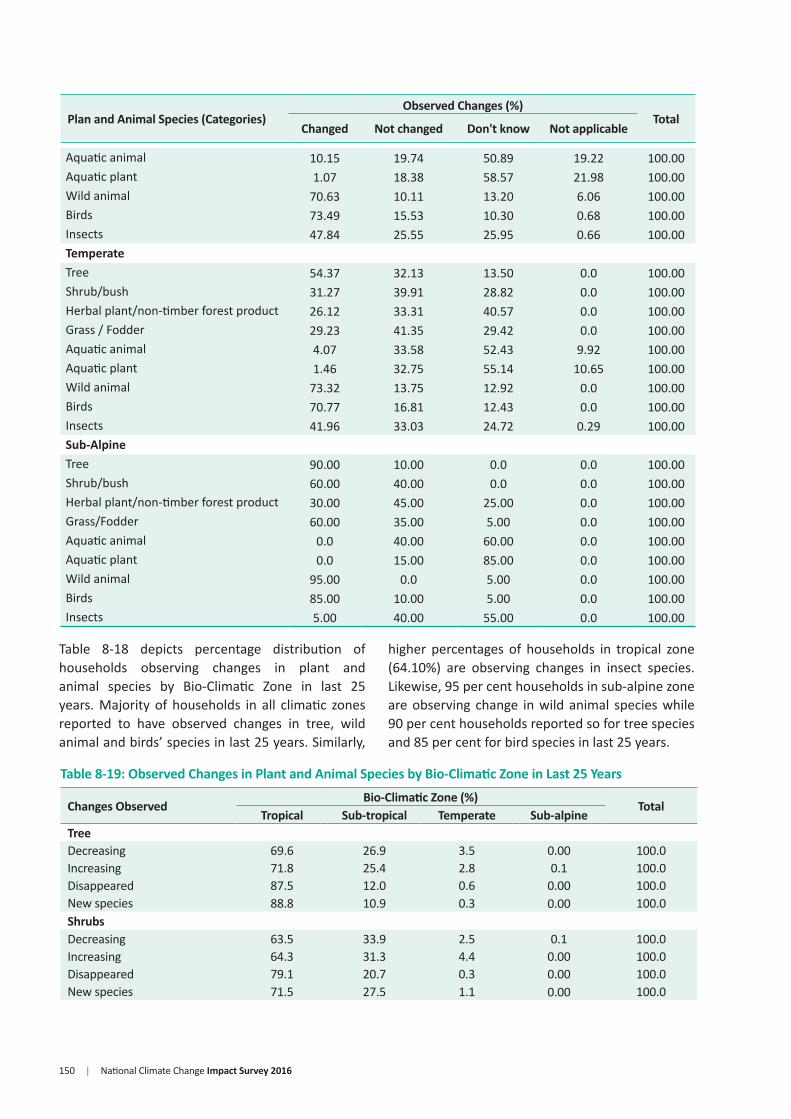
150 | National Climate Change Impact Survey 2016
Plan and Animal Species (Categories)Observed Changes (%)
TotalChanged Not changed Don't know Not applicable
Aquatic animal 10.15 19.74 50.89 19.22 100.00Aquatic plant 1.07 18.38 58.57 21.98 100.00Wild animal 70.63 10.11 13.20 6.06 100.00Birds 73.49 15.53 10.30 0.68 100.00Insects 47.84 25.55 25.95 0.66 100.00TemperateTree 54.37 32.13 13.50 0.0 100.00Shrub/bush 31.27 39.91 28.82 0.0 100.00Herbal plant/non-timber forest product 26.12 33.31 40.57 0.0 100.00Grass / Fodder 29.23 41.35 29.42 0.0 100.00Aquatic animal 4.07 33.58 52.43 9.92 100.00Aquatic plant 1.46 32.75 55.14 10.65 100.00Wild animal 73.32 13.75 12.92 0.0 100.00Birds 70.77 16.81 12.43 0.0 100.00Insects 41.96 33.03 24.72 0.29 100.00Sub-AlpineTree 90.00 10.00 0.0 0.0 100.00Shrub/bush 60.00 40.00 0.0 0.0 100.00Herbal plant/non-timber forest product 30.00 45.00 25.00 0.0 100.00Grass/Fodder 60.00 35.00 5.00 0.0 100.00Aquatic animal 0.0 40.00 60.00 0.0 100.00Aquatic plant 0.0 15.00 85.00 0.0 100.00Wild animal 95.00 0.0 5.00 0.0 100.00Birds 85.00 10.00 5.00 0.0 100.00Insects 5.00 40.00 55.00 0.0 100.00
Table 8-18 depicts percentage distribution of households observing changes in plant and animal species by Bio-Climatic Zone in last 25 years. Majority of households in all climatic zones reported to have observed changes in tree, wild animal and birds’ species in last 25 years. Similarly,
higher percentages of households in tropical zone (64.10%) are observing changes in insect species. Likewise, 95 per cent households in sub-alpine zone are observing change in wild animal species while 90 per cent households reported so for tree species and 85 per cent for bird species in last 25 years.
Table 8-19: Observed Changes in Plant and Animal Species by Bio-Climatic Zone in Last 25 Years
Changes ObservedBio-Climatic Zone (%)
TotalTropical Sub-tropical Temperate Sub-alpine
TreeDecreasing 69.6 26.9 3.5 0.00 100.0Increasing 71.8 25.4 2.8 0.1 100.0Disappeared 87.5 12.0 0.6 0.00 100.0New species 88.8 10.9 0.3 0.00 100.0ShrubsDecreasing 63.5 33.9 2.5 0.1 100.0Increasing 64.3 31.3 4.4 0.00 100.0Disappeared 79.1 20.7 0.3 0.00 100.0New species 71.5 27.5 1.1 0.00 100.0
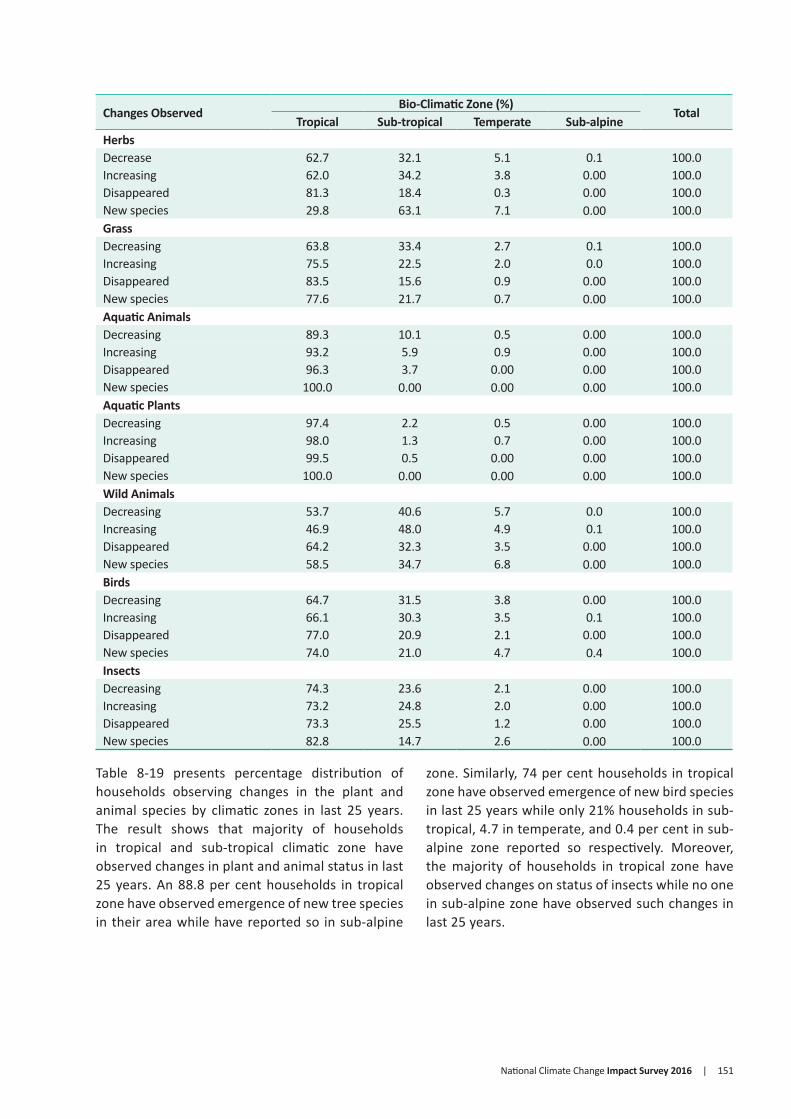
National Climate Change Impact Survey 2016 | 151
Changes ObservedBio-Climatic Zone (%)
TotalTropical Sub-tropical Temperate Sub-alpine
HerbsDecrease 62.7 32.1 5.1 0.1 100.0Increasing 62.0 34.2 3.8 0.00 100.0Disappeared 81.3 18.4 0.3 0.00 100.0New species 29.8 63.1 7.1 0.00 100.0GrassDecreasing 63.8 33.4 2.7 0.1 100.0Increasing 75.5 22.5 2.0 0.0 100.0Disappeared 83.5 15.6 0.9 0.00 100.0New species 77.6 21.7 0.7 0.00 100.0Aquatic AnimalsDecreasing 89.3 10.1 0.5 0.00 100.0Increasing 93.2 5.9 0.9 0.00 100.0Disappeared 96.3 3.7 0.00 0.00 100.0New species 100.0 0.00 0.00 0.00 100.0Aquatic PlantsDecreasing 97.4 2.2 0.5 0.00 100.0Increasing 98.0 1.3 0.7 0.00 100.0Disappeared 99.5 0.5 0.00 0.00 100.0New species 100.0 0.00 0.00 0.00 100.0Wild AnimalsDecreasing 53.7 40.6 5.7 0.0 100.0Increasing 46.9 48.0 4.9 0.1 100.0Disappeared 64.2 32.3 3.5 0.00 100.0New species 58.5 34.7 6.8 0.00 100.0BirdsDecreasing 64.7 31.5 3.8 0.00 100.0Increasing 66.1 30.3 3.5 0.1 100.0Disappeared 77.0 20.9 2.1 0.00 100.0New species 74.0 21.0 4.7 0.4 100.0InsectsDecreasing 74.3 23.6 2.1 0.00 100.0Increasing 73.2 24.8 2.0 0.00 100.0Disappeared 73.3 25.5 1.2 0.00 100.0New species 82.8 14.7 2.6 0.00 100.0
Table 8-19 presents percentage distribution of households observing changes in the plant and animal species by climatic zones in last 25 years. The result shows that majority of households in tropical and sub-tropical climatic zone have observed changes in plant and animal status in last 25 years. An 88.8 per cent households in tropical zone have observed emergence of new tree species in their area while have reported so in sub-alpine
zone. Similarly, 74 per cent households in tropical zone have observed emergence of new bird species in last 25 years while only 21% households in sub-tropical, 4.7 in temperate, and 0.4 per cent in sub-alpine zone reported so respectively. Moreover, the majority of households in tropical zone have observed changes on status of insects while no one in sub-alpine zone have observed such changes in last 25 years.
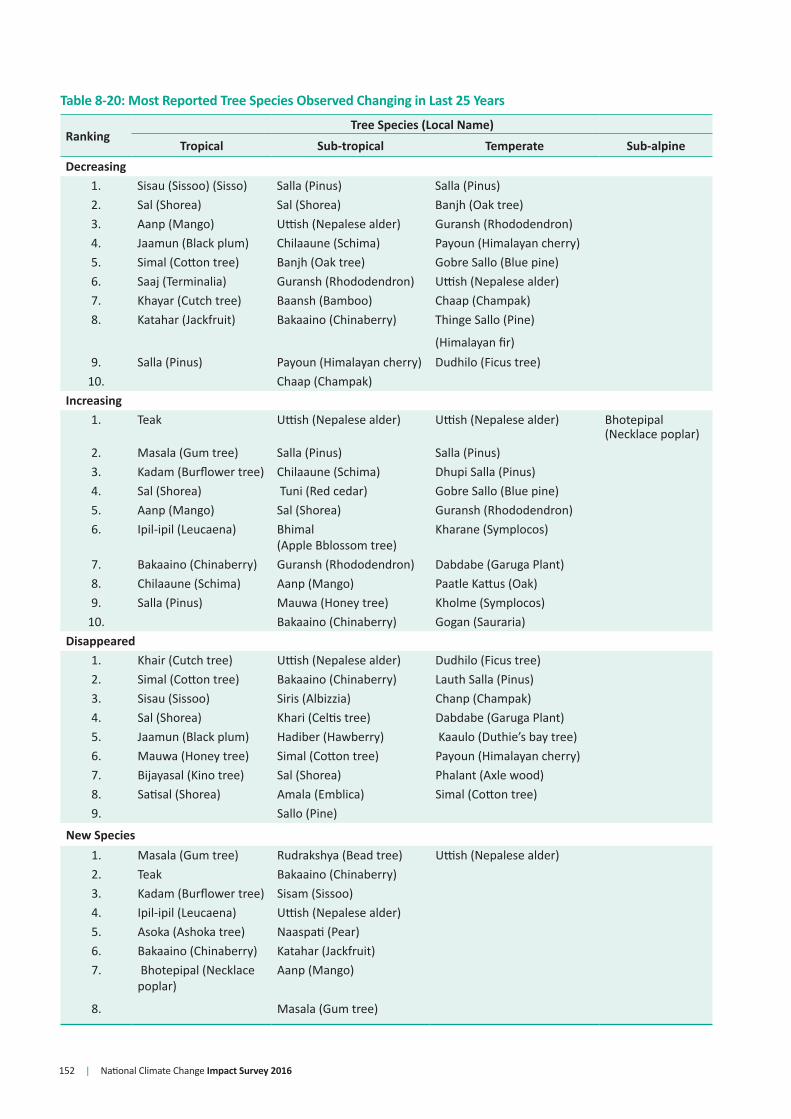
152 | National Climate Change Impact Survey 2016
Table 8-20: Most Reported Tree Species Observed Changing in Last 25 Years
RankingTree Species (Local Name)
Tropical Sub-tropical Temperate Sub-alpineDecreasing
1. Sisau (Sissoo) (Sisso) Salla (Pinus) Salla (Pinus)2. Sal (Shorea) Sal (Shorea) Banjh (Oak tree)3. Aanp (Mango) Uttish (Nepalese alder) Guransh (Rhododendron)4. Jaamun (Black plum) Chilaaune (Schima) Payoun (Himalayan cherry)5. Simal (Cotton tree) Banjh (Oak tree) Gobre Sallo (Blue pine)6. Saaj (Terminalia) Guransh (Rhododendron) Uttish (Nepalese alder)7. Khayar (Cutch tree) Baansh (Bamboo) Chaap (Champak)8. Katahar (Jackfruit) Bakaaino (Chinaberry) Thinge Sallo (Pine)
(Himalayan fir)9. Salla (Pinus) Payoun (Himalayan cherry) Dudhilo (Ficus tree)
10. Chaap (Champak)Increasing
1. Teak Uttish (Nepalese alder) Uttish (Nepalese alder) Bhotepipal (Necklace poplar)
2. Masala (Gum tree) Salla (Pinus) Salla (Pinus)3. Kadam (Burflower tree) Chilaaune (Schima) Dhupi Salla (Pinus)4. Sal (Shorea) Tuni (Red cedar) Gobre Sallo (Blue pine)5. Aanp (Mango) Sal (Shorea) Guransh (Rhododendron)6. Ipil-ipil (Leucaena) Bhimal
(Apple Bblossom tree)Kharane (Symplocos)
7. Bakaaino (Chinaberry) Guransh (Rhododendron) Dabdabe (Garuga Plant)8. Chilaaune (Schima) Aanp (Mango) Paatle Kattus (Oak)9. Salla (Pinus) Mauwa (Honey tree) Kholme (Symplocos)
10. Bakaaino (Chinaberry) Gogan (Sauraria)Disappeared
1. Khair (Cutch tree) Uttish (Nepalese alder) Dudhilo (Ficus tree)2. Simal (Cotton tree) Bakaaino (Chinaberry) Lauth Salla (Pinus)3. Sisau (Sissoo) Siris (Albizzia) Chanp (Champak)4. Sal (Shorea) Khari (Celtis tree) Dabdabe (Garuga Plant)5. Jaamun (Black plum) Hadiber (Hawberry) Kaaulo (Duthie’s bay tree)6. Mauwa (Honey tree) Simal (Cotton tree) Payoun (Himalayan cherry)7. Bijayasal (Kino tree) Sal (Shorea) Phalant (Axle wood)8. Satisal (Shorea) Amala (Emblica) Simal (Cotton tree)9. Sallo (Pine)
New Species1. Masala (Gum tree) Rudrakshya (Bead tree) Uttish (Nepalese alder)2. Teak Bakaaino (Chinaberry)3. Kadam (Burflower tree) Sisam (Sissoo)4. Ipil-ipil (Leucaena) Uttish (Nepalese alder)5. Asoka (Ashoka tree) Naaspati (Pear)6. Bakaaino (Chinaberry) Katahar (Jackfruit)7. Bhotepipal (Necklace
poplar)Aanp (Mango)
8. Masala (Gum tree)

National Climate Change Impact Survey 2016 | 153
Table 8-20 shows the status of most reported tree species observed changing in last 25 years. Majority of households in Tropical region reported a decreasing trend of Sissso followed by Sal and Aanp (Mango). Similarly, both in sub-tropical and temperate climatic zone, households are observing decrease in the status of Sal. Households are observing an increase in Teak, Masala (Gum tree), Sapeta, Uttis, and Bhote Pipal
across climatic zones. Similarly, households are observing emergence of new species including Masala (Gum tree), Teak and Kadam (Burflower tree) in tropical zone, Rudrakshya (Bead tree) and Bakaaino (Chinaberry) in sub-tropical zone, and Sallo (Pine) in temperate zones. However, none of the household in the sub-alpine zone is observing any change in status of tree species in their area in last 25 years.
Table 8-21: Most Reported Shrubs/bush Species Observed Changing in Last 25 Years
RankingShrub/Bush Species (Local Name)
Tropical Sub-tropical Temperate Sub-alpine
Decreasing1. Bayar (Zizyphus) Aiselu (Wild raspberries) Aiselu (Wild raspberries) Kande (Loranthus)2. Ambak (Guava) Chutro (Wild blue berry) Chutro (Wild blue berry)3. Mewa (Papaya) Dhayaro (Woodfordia) Nibaro (Ficus)4. Kera (Banana) Kagati (Lemon) Guransh (Rhododendron)5. Dhayaro (Woodfordia) Suntala (Orange) Argeli (Indian rhododendron)6. Kagati (Lemon) Teti Patti (Mugwort) Banmaaraa (Cat weed)7. Amala (Emblica) Sisnu (Stinging nettle) Ghagaru (Pyracantha)8. Sarifa (Custard Apple) Guransh (Rhododendron) Payoun (Himalayan cherry)9. Baansh (Bamboo) Baansh (Bamboo)
10. Anar (Pomegranate)Increasing
1. Banmaaraa (Cat weed)
Aiselu (Wild raspberries)
Aiselu (Wild raspberries) Kande (Loranthus)
2. Baansh (Bamboo) Chutro (Wild blue berry) Chutro (Wild blue berry)3. Ambak (Guava) Dhayaro (Woodfordia) Guransh (Rhododendron)4. Kera (Banana) Suntala (Orange) Nibaro (Ficus)5. Dhayaro (Woodfordia) Kagati (Lemon) Argeli (Indian rhododendron)6. Thakal Teti Patti (Mugwort) Banmaaraa (Cat weed)7. Mewa (Papaya) Sisnu (Stinging nettle) Ghangaro
(Himalayan firethorn)8. Narkat (Giant cane) Guransh (Rhododendron) Payoun (Himalayan cherry)9. Lychee (Litchi) Baansh (Bamboo)
10. Asuro (Malbarnut)
Disappeared1. Bayar (Zizyphus) Aiselu (Wild raspberries) Aiselu (Wild raspberries)2. Anar (Pomegranate) Chutro (Wild blue berry)3. Sarifa (Custard Apple) Sisnu (Stinging nettle)4. Teti Patti (Mugwort) Narkat (Giant cane)5. Dhayaro (Woodfordia) Kagati (Lemon)6. Amala (Emblica) Bayar (Zizyphus)7. Sanpaati
(Rhododendron)Mayal (Wild pear)
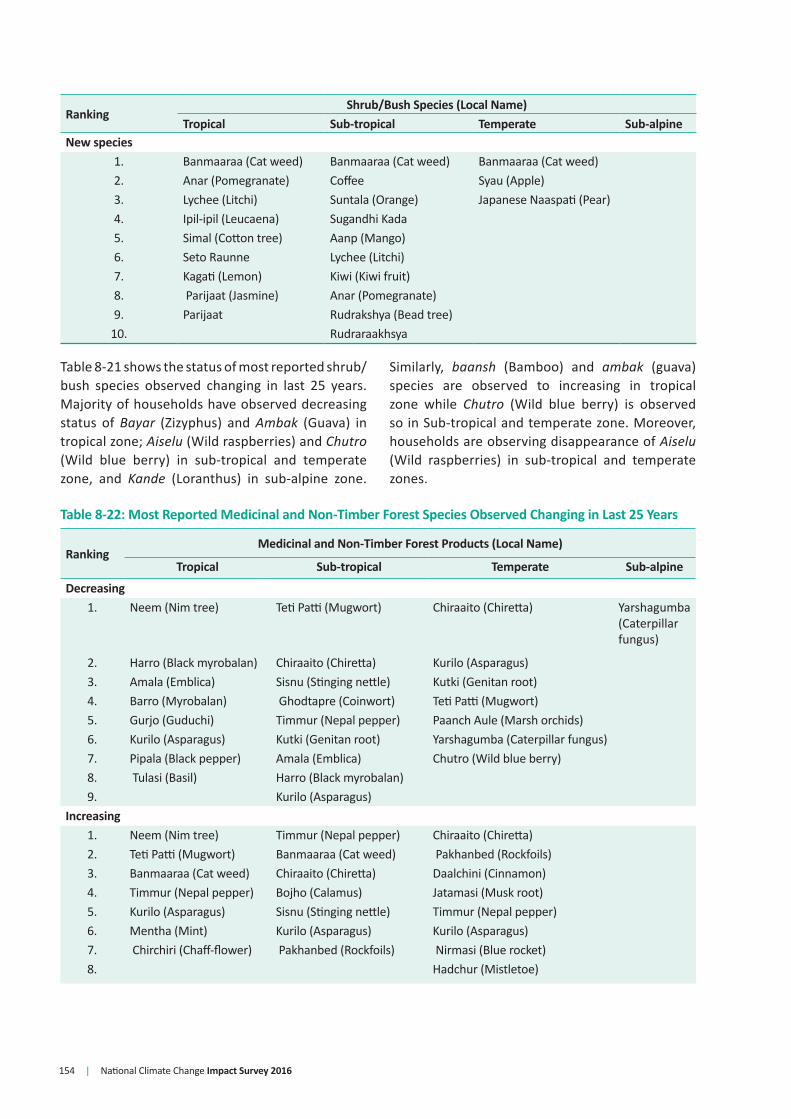
154 | National Climate Change Impact Survey 2016
RankingShrub/Bush Species (Local Name)
Tropical Sub-tropical Temperate Sub-alpineNew species
1. Banmaaraa (Cat weed) Banmaaraa (Cat weed) Banmaaraa (Cat weed)2. Anar (Pomegranate) Coffee Syau (Apple)3. Lychee (Litchi) Suntala (Orange) Japanese Naaspati (Pear)4. Ipil-ipil (Leucaena) Sugandhi Kada5. Simal (Cotton tree) Aanp (Mango)6. Seto Raunne Lychee (Litchi)7. Kagati (Lemon) Kiwi (Kiwi fruit)8. Parijaat (Jasmine) Anar (Pomegranate)9. Parijaat Rudrakshya (Bead tree)
10. Rudraraakhsya
Table 8-21 shows the status of most reported shrub/bush species observed changing in last 25 years. Majority of households have observed decreasing status of Bayar (Zizyphus) and Ambak (Guava) in tropical zone; Aiselu (Wild raspberries) and Chutro (Wild blue berry) in sub-tropical and temperate zone, and Kande (Loranthus) in sub-alpine zone.
Similarly, baansh (Bamboo) and ambak (guava) species are observed to increasing in tropical zone while Chutro (Wild blue berry) is observed so in Sub-tropical and temperate zone. Moreover, households are observing disappearance of Aiselu (Wild raspberries) in sub-tropical and temperate zones.
Table 8-22: Most Reported Medicinal and Non-Timber Forest Species Observed Changing in Last 25 Years
RankingMedicinal and Non-Timber Forest Products (Local Name)
Tropical Sub-tropical Temperate Sub-alpine
Decreasing1. Neem (Nim tree) Teti Patti (Mugwort) Chiraaito (Chiretta) Yarshagumba
(Caterpillar fungus)
2. Harro (Black myrobalan) Chiraaito (Chiretta) Kurilo (Asparagus)3. Amala (Emblica) Sisnu (Stinging nettle) Kutki (Genitan root)4. Barro (Myrobalan) Ghodtapre (Coinwort) Teti Patti (Mugwort)5. Gurjo (Guduchi) Timmur (Nepal pepper) Paanch Aule (Marsh orchids)6. Kurilo (Asparagus) Kutki (Genitan root) Yarshagumba (Caterpillar fungus)7. Pipala (Black pepper) Amala (Emblica) Chutro (Wild blue berry)8. Tulasi (Basil) Harro (Black myrobalan)9. Kurilo (Asparagus)
Increasing1. Neem (Nim tree) Timmur (Nepal pepper) Chiraaito (Chiretta)2. Teti Patti (Mugwort) Banmaaraa (Cat weed) Pakhanbed (Rockfoils)3. Banmaaraa (Cat weed) Chiraaito (Chiretta) Daalchini (Cinnamon)4. Timmur (Nepal pepper) Bojho (Calamus) Jatamasi (Musk root)5. Kurilo (Asparagus) Sisnu (Stinging nettle) Timmur (Nepal pepper)6. Mentha (Mint) Kurilo (Asparagus) Kurilo (Asparagus)7. Chirchiri (Chaff-flower) Pakhanbed (Rockfoils) Nirmasi (Blue rocket)8. Hadchur (Mistletoe)

National Climate Change Impact Survey 2016 | 155
Table 8-22 shows the status of most reported NTFP species in last 25 years. Households are observing decrease in status of Neem (Nim tree), and Harro (Black myrobalan) in tropical zone, Teti Patti (Mugwort) and Chiraito in sub-tropical, Kurilo (Asparagus) in temperate, and Yarsagumba in sub-alpine zones. However, Banmara (Cat weed) and Timmur (Nepal pepper) in tropical, Kurilo (Asparagus)
and Bojho (Calamus) in sub-tropical and Chutro (Wild blue berry) in temperate zone are observed to increasing in last 25 years. Moreover, households have observed disappearance of Harro (Black myrobalan) in tropical, Ghodtapre (Coinwort) in sub-tropical, and Bojho (Calamus) in temperate zones. None of the households in sub-alpine zone have reported changes in status of NTFP species in their area in last 25 years.
Table 8-23: Most Reported Grass species Observed Changing in Last 25 Years
RankingGrass Species (Local Name)
Tropical Sub-tropical Temperate Sub-alpineDecreasing
1. Sama ghans (Japanese millet)
Siru (Star-grass) Babiyo (Dung weed)
Banmara (Cat weed)
2. Dubo (Bermuda grass) Dubo (Bermuda grass) Banso Ghans (Carpet grass)
3. Siru (Star-grass) Banso Ghans (Carpet grass)
4. Banso Ghans (Carpet grass)
Increasing1. Mothhe Jhar (Coco-grass) Amriso (Broom grass) Baansh
(Bamboo)Banso Ghans (Carpet grass)
2. Dubo (Bermuda grass) Malingo (Candy cane)
3. Nepiyer (Napier)
RankingMedicinal and Non-Timber Forest Products (Local Name)
Tropical Sub-tropical Temperate Sub-alpine
Disappeared1. Harro (Black myrobalan) Ghodtapre (Coinwort) Bojho (Calamus)2. Barro (Myrobalan) Asuro (Malbarnut)3. Kurilo (Asparagus) Rudilo (Cockspur patchouli)4. Khayar (Cutch tree) Hadchur (Mistletoe)5. Jaamun (Black plum) Bojho (Calamus)6. Baabari (Mint)7. Kurilo (Asparagus)8. Ketuke (Sentry plant)
New Species1. Neem (Nim tree) Banmaaraa (Cat weed) Banmaaraa (Cat weed)2. Timmur (Nepal pepper) Kaalijhaar (Cat weed)3. Jaamun (Black plum) Timmur (Nepal pepper)4. Jaitun (Olive) Eaichi (Cardamom)5. Bojho (Calamus) Ghiukumari (Aloe vera)6. Barro (Myrobalan) Jaitun (Olive)7. Kurilo (Asparagus) Kurilo (Asparagus)8. Lemongrass Tulasi (Basil)9. Tejpaat (Cinnamon)
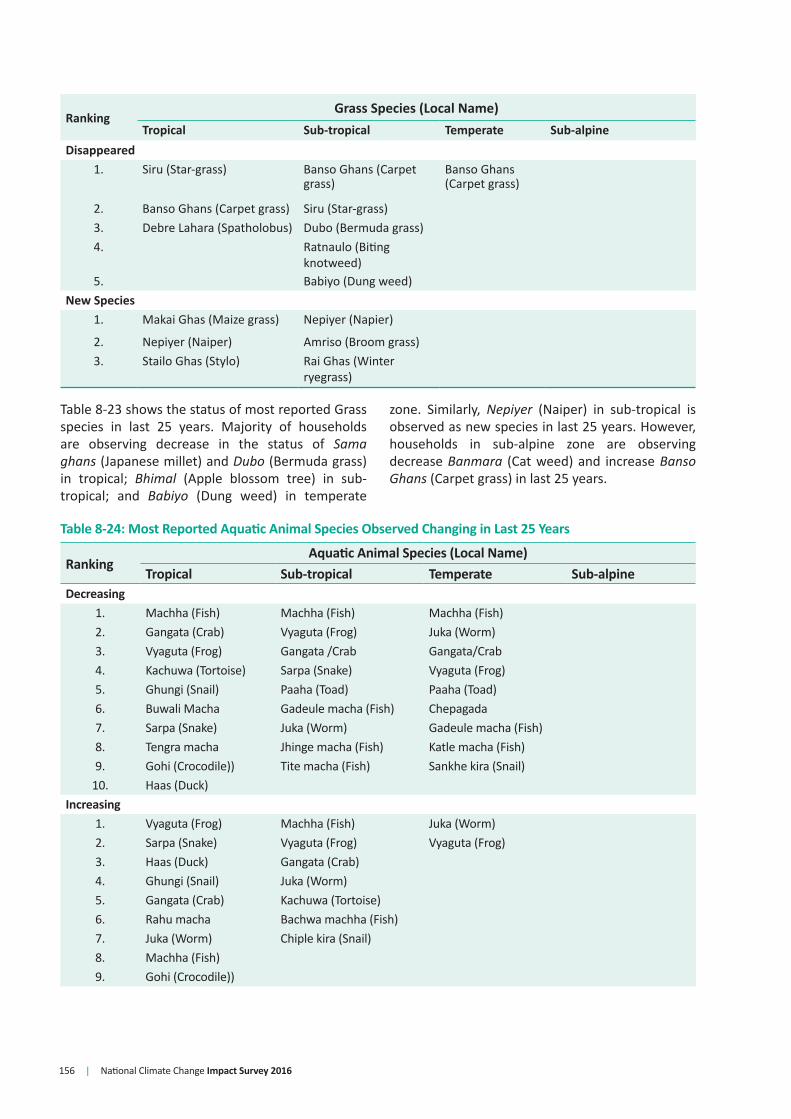
156 | National Climate Change Impact Survey 2016
RankingGrass Species (Local Name)
Tropical Sub-tropical Temperate Sub-alpineDisappeared
1. Siru (Star-grass) Banso Ghans (Carpet grass)
Banso Ghans (Carpet grass)
2. Banso Ghans (Carpet grass) Siru (Star-grass)3. Debre Lahara (Spatholobus) Dubo (Bermuda grass)4. Ratnaulo (Biting
knotweed)5. Babiyo (Dung weed)
New Species1. Makai Ghas (Maize grass) Nepiyer (Napier)
2. Nepiyer (Naiper) Amriso (Broom grass)3. Stailo Ghas (Stylo) Rai Ghas (Winter
ryegrass)
Table 8-23 shows the status of most reported Grass species in last 25 years. Majority of households are observing decrease in the status of Sama ghans (Japanese millet) and Dubo (Bermuda grass) in tropical; Bhimal (Apple blossom tree) in sub-tropical; and Babiyo (Dung weed) in temperate
zone. Similarly, Nepiyer (Naiper) in sub-tropical is observed as new species in last 25 years. However, households in sub-alpine zone are observing decrease Banmara (Cat weed) and increase Banso Ghans (Carpet grass) in last 25 years.
Table 8-24: Most Reported Aquatic Animal Species Observed Changing in Last 25 Years
RankingAquatic Animal Species (Local Name)
Tropical Sub-tropical Temperate Sub-alpineDecreasing
1. Machha (Fish) Machha (Fish) Machha (Fish)2. Gangata (Crab) Vyaguta (Frog) Juka (Worm)3. Vyaguta (Frog) Gangata /Crab Gangata/Crab4. Kachuwa (Tortoise) Sarpa (Snake) Vyaguta (Frog)5. Ghungi (Snail) Paaha (Toad) Paaha (Toad)6. Buwali Macha Gadeule macha (Fish) Chepagada7. Sarpa (Snake) Juka (Worm) Gadeule macha (Fish)8. Tengra macha Jhinge macha (Fish) Katle macha (Fish)9. Gohi (Crocodile)) Tite macha (Fish) Sankhe kira (Snail)
10. Haas (Duck)Increasing
1. Vyaguta (Frog) Machha (Fish) Juka (Worm)2. Sarpa (Snake) Vyaguta (Frog) Vyaguta (Frog)3. Haas (Duck) Gangata (Crab)4. Ghungi (Snail) Juka (Worm)5. Gangata (Crab) Kachuwa (Tortoise)6. Rahu macha Bachwa machha (Fish)7. Juka (Worm) Chiple kira (Snail)8. Machha (Fish)9. Gohi (Crocodile))

National Climate Change Impact Survey 2016 | 157
Table 8-24 shows the status of most reported aquatic animal species last 25 years. The result shows that majority of households are observing decrease in the status of fish, Gangata (Crab) and Vyaguta (Frog) in tropical and sub-tropical zone while Juka (leech) is reported so in temperate zone. Households are
observing increase in the status of Ghungi (Snail) and Sarpa (Snake) in tropical zone while Kachuwa (Tortoise) and bachwa fish are reported so in sub-tropical zone. Households in sub-alpine zone are not observing any changes in the status of aquatic animals in last 25 years.
RankingAquatic Animal Species (Local Name)
Tropical Sub-tropical Temperate Sub-alpineDisappeared
1. Kachuwa (Tortoise) Vyaguta (Frog)2. Gangata (Crab) Gangata (Crab)3. Buwali Macha Chepa gada (Tadpole)4. Gohi (Crocodile)) Sarpa (Snake)5. Chakewa (Shelduck) Hile macha (Fish)6 Chepa gada (Tadpole) Haas (Duck)7. Sankhe kira (Snail) Jhinge macha (Fish)8. Kachuwa (Tortoise)
Table 8-25: Most Reported Aquatic Plant Species Observed Changing in Last 25 Years
RankingAquatic Plant Species (Local Name)
Tropical Sub-tropical Temperate Sub-alpine
Decreasing1. Jal Kumbhi (Water hyacinth) Leu (Crystal wort) Pani sag (Wild Spinach)2. Kamal (Lotus) Pani sag (Wild Spinach) Sim sag (Wild Spinach)3. Amarlatti (Giant dodder) Bojho (Calamus)4. Dhodi sag (Wild Spinach) Amarlatti (Giant dodder)5. Niuro (Fiddlehead Fern)6. Pani tarul (Yam)
Increasing1. Jal Kumbhi (Water hyacinth) Bojho (Calamus) Thotne (Gedilo)2. Dhodi sag (Wild Spinach) Leu (Crystal wort)3. Amarlatti (Giant dodder) Malato (Macaranga)4. Niuro (Fiddlehead Fern)
Disappeared1. Kamal (Lotus) Leu (Crystal wort)2. Amarlatti (Giant dodder) Bojho (Calamus)3. Bet (Rattan)
Table 8-25 shows the status of most reported aquatic plants species in last 25 years. It shows that majority of households in tropical zone are observing decrease in the status of Jal Kumvi (Water hyacinth), and Kamal (Lotus) while households reported so for Leu (Crystal wort) and Pani sag
(Wild Spinach) in sub-tropical. Thotne (Gedilo) is the single species that households in temperate zone are observing to increase. Households in sub-alpine zone are not observing any change in status of aquatic plant species in their area in last 25 years.

158 | National Climate Change Impact Survey 2016
Table 8-26: Most Reported Wild Animal Species Observed Changing in Last 25 Years
RankingWild Animal Species (Local Name)
Tropical Sub-tropical Temperate Sub-alpineDecreasing
1. Syal (Jackal) Syal (Jackal) Bagha (Tiger) Kharayo (Rabbit)2. Bagha (Tiger) Bagha (Tiger) Bhalu (Bear) Phyauro (Fox)3. Huchil (Owl) Bhalu (Bear) Ghoral (Himalayan Ghoral) Habre (Red panda)
4. Kharayo (Rabbit) Ghoral (Himalayan Ghoral) Chituwa (Leopard) Syal (Jackal)
5. Bhalu (Bear) Chituwa (Leopard) Mriga (Deer)6. Bandel (Wild boar) Ratuwa (Barking deer) Syal (Jackal)7. Chital (Spotted deer) Mriga (Deer) Ratuwa (Barking deer)8. Badar (Monkey) Badar (Monkey) Bandel (Wild boar)9. Chituwa (Leopard) Bandel (Wild boar) Thar (Himalayan thar)10 Mriga (Deer) Kharayo (Rabbit) Kasturi (Musk deer)
Increasing1. Syal (Jackal) Mriga (Deer) Dumsi (Porcupine) Nauri2. Bandel (Wild boar) Dumsi (Porcupine) Mriga (Deer) Mriga (Deer)3. Badar (Monkey) Badar (Monkey) Badar (Monkey) Phyau musa (Squirrel)4 Dumsi (Porcupine) Syal (Jackal) Syal (Jackal) Bhalu (Bear)5. Mriga (Deer) Bandel (Wild boar) Phyauro (Fox) Syal (Jackal)6. Kharayo (Rabbit) Kharayo (Rabbit) Malsapro (Stone Marten)7. Nauri Ghoral Ghoral
Nauri (Mole) Ghoral (Himalayan Ghoral) Ghoral (Himalayan Ghoral)
8. Ghodgadhi Lokharke (Squirrel) Bandhade (Wild cat)9. Nilgai (Blue bull) Malsapro (Stone Marten) Kharayo (Rabbit)
10. Lokharke (Squirrel) Bagha (Tiger) Habre (Red panda)
Disappeared1. Bagha (Tiger) Bagha (Tiger) Bagha (Tiger)2. Mriga (Deer) Syal (Jackal) Bhalu (Bear)3. Syal (Jackal) Chituwa (Leopard) Bandel (Wild boar)4. Hatti (Elephant) Ban biralo (Wild cat) Syal (Jackal)5. Nilgai (Blue bull) Bhalu (Bear) Kasturi (Musk deer)6. Chituwa (Leopard) Salak (Pangolin) Chituwa (Leopard)7. Jarayo (Antelope) Dumsi (Porcupine) Langur (Monkey)8 Bhalu (Bear) Phyauro (Fox) Nauri (Mole)9. Bandel (Wild boar) Malsapro (Stone Marten) Dumsi (Porcupine)
10. Mriga (Deer) Salak (Pangolin)New species
1. Mriga (Deer) Ratuwa (Barking deer) Badar (Monkey)2. Hatti (Elephant) Bandel (Wild boar) Dumsi (Porcupine) 3. Bagha (Tiger) Badar (Monkey) Ratuwa (Barking deer)4. Bandel (Wild boar) Habre (Red panda) Habre (Red panda)5. Ratuwa (Barking deer) Mriga (Deer) Syal (Jackal)6. Badar (Monkey) Dumsi (Porcupine) Mriga (Deer)7. Nauri (Mole) Chutuwa (Leopard) Ghodgadhi8. Dumsi (Porcupine) Ghoral (Himalayan Ghoral)9. Kharayo (Rabbit)
10. Bagha (Tiger)

National Climate Change Impact Survey 2016 | 159
Table 8-26 shows the status of most reported wild animal species in last 25 years. Majority of households reported a decreasing trend of jackal, tiger and huchil (Owl) in tropical; bear, ghoral (Himalayan Ghoral) and leopard in sub-tropical; deer and ratuwa (Barking deer) in temperate; and rabbit and fox in sub-alpine zones. Similarly, households are observing
an increase of bandel (Wild boar) and monkey in tropical; dumsi (Porcupine) and rabbit in sub-tropical; dumsi (Porcupine) and malsapro (Stone Marten) in temperate; and nauri (Mole) in sub-alpine zones. Moreover, none in sub-alpine zone are observing either disappearance or emerging new species of wild animals in their area in last 25 years.
Table 8-27: Most Reported Bird Species Observed Changing in Last 25 Years
RankingBird Species (Local Name)
Tropical Sub-tropical Temperate Sub-alpineDecreasing
1. Suga (Parrot) Bhangera (Sparrow) Bhangera (Sparrow)2. Bhangera (Sparrow) Kaag (Crow) Kaliz (Pheasant)3. Kaag (Crow) Kaliz (Pheasant) Chyakura (Chukar)4. Dhukur (Dove) Gidda (Vulture) Danfe (Himalayan Monal)5. Cheel (Eagle) Gauthali (Swallow) Kaag (Crow)6. Gidda (Vulture) Dhukur (Dove) Sarew/Ruppi (Mynah)7. Maina/ Dangre (Mynah) Chyakura (Chukar) Gauthali8. Bakula (Heron) Suga (Parrot) Dhukur (Dove)9. Kaliz (Phesant) Sareu (Mynah) Cheel (Eagle)
10. Jureli (Bulbul)Increasing
1. Kaglero (Crow) Kaglero (Crow) Kaglero (Crow)2. Bhangera (Sparrow) Kaliz (Pheasant) Bhangera (Sparrow)3. Suga (Parrot) Bhangera (Sparrow) Kaliz (Pheasant)4. Parewa (Peigon) Kokale (Tree pie) Dhukur (Dove)5. Pani Hans (Duck) Lampuchre (Magpie)6. Maina (Mynah) Dhukur(Dove)7 Dhukur (Dove) Suga (Parrot)8. Kaliz (Pheasant) Maina (Mynah)9. Sarau (Mynah)
Disappeared1. Gidda (Vulture) Gidda (Vulture) Gidda (Vulture)2. Cheel (Eagle) Cheel (Eagle) Bhangera (Sparrow)3. Nilkantha (Magpie) Huchil (Owl) Danfe (Himalayan Monal)4. Gadur (Shikra) Suga (Parrot) Chakewa (Shelduck)5. Mayur (Peacock) Chakewa (Shelduck) Bhadrai (Babbler)6. Dhanesh (Hornbill) Bakulla (Heron) Kaliz7. Jureli (Bulbul) Bhangera (Sparrow) Latkosero (owl)8. Gauthali (Swallow) Jureli (Bulbul) Ruppi (Mynah)9. Baaj (Hawk) Danfe (Himalayan Monal) Eagle10 Karang kurung (Crane) Gauthali (Swallow) Batai (Quail)

160 | National Climate Change Impact Survey 2016
New Species1. Lampuchre (Magpie) Lampuchre (Magpie) Nyauli (Great Barbet) Dhukur (Dove)2. Saras (Crane) Suga (Parrot)3. Mayur (Peacock) Parewa (Pigeon) Kotero (Munia)4. Mauri khane/Murali Chara
(Bee-eater) Parewa (Pigeon) Bakulla (Heron)
5. Bhyakur (Babbler) Kaliz (Pheasant) Khuthukrke (Barbet)6. Jureli (Bulbul) Suga (Parrot) Lampuchre (Magpie)7. Nyauli (Great Barbet) Munal (Lophophorus) Koili (Cuckoo)8. Kotero (Munia)9. Chirchire (Finch)
10. Jureli (Bulbul)
Table 8-27 shows the status of most reported bird species in last 25 years. Majority of households reported that species such as suga (Parrot), bhangera (Sparrow), kag (Crow), kaliz (Pheasant) in tropical and sub-tropical zone; and chyakhura (Chukar) and danfe (Lophophorus) in temperate are decreasing
in last 25 years. Households in sub-alpine zone have not reported an observation neither increase nor decrease in disappearance of any bird species in their area in last 25 years. However, dhukur (Dove) is the only bird that households in sub-alpine zone reported to have appeared as a new species in their area.
8.4. Emergence of New Invasive Plant SpeciesTable 8-28: Emergence of New Invasive Plants in Last 25 Years
Invasive Species (Category)Response (HH, %)
TotalYes No Not applicable
Shrub/bush 36.47 55.70 7.83 100.00Creeper plant (climber) 14.38 74.79 10.83 100.00Creeper plant (land) 16.73 70.69 12.57 100.00
Table 8-28 presents the percentage distribution of households observing an emergence of new invasive plant species in last 25 years. Overall, majority of households are not observing an emergence of new invasive species in their area in last 25 years.
However, 36.47 per cent households reported that they have observed an emergence of shrub/bush in last 25 years followed by creeper plant (land) (16.73%) and creeper plant (climber) (14.38%).
Table 8-29: Emergence of New Invasive Plant by Ecological Belt in Last 25 Years
Invasive Species (Category)Observed Change (HH, %)
TotalYes No Not applicable
MountainShrub/bush 22.69 76.55 0.76 100.00Creeper plant (climber) 4.18 94.44 1.37 100.00Creeper plant (land) 1.16 98.21 0.63 100.00HillShrub/bush 43.67 48.35 7.98 100.00Creeper plant (climber) 11.68 78.04 10.28 100.00Creeper plant (land) 9.28 78.34 12.37 100.00TeraiShrub/bush 31.70 59.42 8.89 100.00Creeper plant (climber) 18.81 68.18 13.01 100.00Creeper plant (land) 26.81 58.37 14.82 100.00

National Climate Change Impact Survey 2016 | 161
Table 8-29 presents the percentage distribution of households observing an emergence of new invasive plant species by ecological belt in last 25 years. A 43.67 per cent of households in hill are
observing an emergence of shrub/bush species in last 25 years while 22.69 per cent households in hill and 31.70 per cent households in Terai have reported so.
Table 8-30: Emergence of New Invasive Plants by Eco-Development Region in Last 25 Years
Invasive Species (Category)Observed Change (HH, %)
TotalYes No Not applicable
Eastern MountainShrub/bush 29.80 70.20 0.0 100.00
Creeper plant (climber) 2.25 94.29 3.46 100.00
Creeper plant (land) 1.03 98.01 0.95 100.00
Eastern Hill
Shrub/bush 21.89 75.63 2.48 100.00
Creeper plant (climber) 11.04 85.94 3.02 100.00
Creeper plant (land) 4.94 90.88 4.18 100.00
Eastern Terai
Shrub/bush 41.61 44.64 13.75 100.00
Creeper plant (climber) 26.55 60.97 12.48 100.00
Creeper plant (land) 36.50 50.36 13.14 100.00
Central Mountain
Shrub/bush 10.98 89.02 0.0 100.00
Creeper plant (climber) 4.09 95.32 0.59 100.00
Creeper plant (land) 2.52 96.93 0.55 100.00
Central Hill
Shrub/bush 24.28 73.32 2.40 100.00
Creeper plant (climber) 3.50 94.10 2.40 100.00
Creeper plant (land) 2.45 95.08 2.47 100.00
Central Terai
Shrub/bush 14.34 81.22 4.44 100.00
Creeper plant (climber) 17.73 78.12 4.16 100.00
Creeper plant (land) 26.01 66.05 7.93 100.00
Western Mountain
Shrub/bush 2.20 95.60 2.20 100.00
Creeper plant (climber) 0.0 97.80 2.20 100.00
Creeper plant (land) 0.0 97.80 2.20 100.00
Western Hill
Shrub/bush 71.35 24.26 4.40 100.00
Creeper plant (climber) 5.07 86.65 8.28 100.00
Creeper plant (land) 2.01 86.42 11.57 100.00
Western Terai
Shrub/bush 43.35 47.82 8.83 100.00
Creeper plant (climber) 0.30 55.77 43.93 100.00
Creeper plant (land) 0.27 56.14 43.59 100.00

162 | National Climate Change Impact Survey 2016
Invasive Species (Category)Observed Change (HH, %)
TotalYes No Not applicable
Mid-Western Mountain
Shrub/bush 0.0 96.77 3.23 100.00
Creeper plant (climber) 0.0 99.07 0.93 100.00
Creeper plant (land) 0.0 99.07 0.93 100.00
Mid-Western Hill
Shrub/bush 71.34 27.58 1.08 100.00
Creeper plant (climber) 39.00 52.30 8.70 100.00
Creeper plant (land) 49.62 35.04 15.34 100.00
Mid-Western Terai
Shrub/bush 61.63 29.39 8.98 100.00
Creeper plant (climber) 22.80 64.19 13.01 100.00
Creeper plant (land) 41.05 44.01 14.93 100.00
Far-Western Mountain
Shrub/bush 59.68 39.79 0.53 100.00
Creeper plant (climber) 11.28 88.11 0.61 100.00
Creeper plant (land) 0.0 100.00 0.0 100.00
Far-Western Hill
Shrub/bush 57.91 41.25 0.84 100.00
Creeper plant (climber) 31.87 66.72 1.41 100.00
Creeper plant (land) 5.88 91.79 2.33 100.00
Far-Western Terai
Shrub/bush 11.54 79.48 8.99 100.00
Creeper plant (climber) 12.62 78.76 8.61 100.00
Creeper plant (land) 7.63 83.45 8.92 100.00
Kathmandu Valley
Shrub/bush 0.0 21.32 78.68 100.00
Creeper plant (climber) 0.0 20.63 79.37 100.00
Creeper plant (land) 0.0 20.63 79.37 100.00
Table 8-30 shows the percentage distribution of households observing an emergence of new invasive plant species by eco-development region in last 25 years. High percentage of households in western hill (71.35%) and mid-western Hill (71.34%) are
observing an emergence of new bush/shrub plant species in last 25 years. However, high percentage of households in mid-western hill (49.62%) reported such observation for creeper plant (land) and 39 per cent households for creeper plant (climber).
Table 8-31: Emergence of New Invasive Plants by NAPA Combined Vulnerability Index in Last 25 Years
Invasive Species (Category)Observed Changes (HH, %)
TotalYes No Not applicable
Very HighShrub/bush 28.26 58.07 13.67 100.00Creeper plant (climber) 15.38 70.89 13.73 100.00Creeper plant (land) 14.54 71.25 14.21 100.00

National Climate Change Impact Survey 2016 | 163
Table 8-31 depicts the percentage of households observing an emergence of new invasive plant species by NAPA combined vulnerability index areas in last 25 years. Higher percentage of households in very low vulnerability area (53.64%) reported
to have observed the emergence of shrub/bush species while only 0.46 per cent households and 0.56 per cent households in the same area have reported so for creeper plant (climber) and creeper plant (land) respectively.
Table 8-32: Emergence of New Invasive Plants by Bio-climatic Zones in Last 25 Years
Invasive Species (Category)Observed Changes (HH, %)
TotalYes No Not applicable
TropicalShrub/bush 37.56 55.11 7.33 100.00Creeper plant (climber) 19.02 69.91 11.06 100.00Creeper plant (land) 23.86 62.64 13.51 100.00Sub-TropicalShrub/bush 35.55 54.80 9.65 100.00Creeper plant (climber) 7.75 80.95 11.30 100.00Creeper plant (land) 6.33 81.64 12.03 100.00TemperateShrub/bush 29.30 69.88 0.82 100.00Creeper plant (climber) 2.78 92.89 4.33 100.00Creeper plant (land) 0.69 94.91 4.40 100.00Sub-AlpineShrub/bush 0.0 100.00 0.0 100.00Creeper plant (climber) 0.0 100.00 0.0 100.00Creeper plant (land) 0.0 100.00 0.0 100.00
Invasive Species (Category)Observed Changes (HH, %)
TotalYes No Not applicable
HighShrub/bush 40.18 58.13 1.70 100.00Creeper plant (climber) 18.08 80.25 1.67 100.00Creeper plant (land) 13.63 83.11 3.26 100.00ModerateShrub/bush 34.98 61.04 3.98 100.00Creeper plant (climber) 9.71 85.65 4.65 100.00Creeper plant (land) 18.38 74.13 7.49 100.00LowShrub/bush 35.50 51.42 13.08 100.00Creeper plant (climber) 20.59 63.96 15.44 100.00Creeper plant (land) 27.90 53.98 18.12 100.00Very LowShrub/bush 53.64 38.91 7.44 100.00Creeper plant (climber) 0.46 66.01 33.53 100.00Creeper plant (land) 0.56 65.68 33.76 100.00

164 | National Climate Change Impact Survey 2016
Table 8-32 indicates the percentage distribution of households observing an emergence of new invasive plant species by climatic zone in last 25 years. It is reported that higher percentage of households
(37.56%) in tropical region are observing an emergence of new invasive species of shrub/bush followed by 35.55 per cent in sub-tropical and 29.30 per cent in temperate zone in last 25 years.
Table 8-33: Emergence of New Invasive Plants by Land Use Type
Invasive Species (Category)Observed Change (HH, %)
TotalForest Pasture Land Agriculture
Shrub/bush 27.47 12.24 60.29 100.00Creeper plant (climber) 40.76 1.86 57.38 100.00Creeper plant (land) 3.45 4.53 92.03 100.00
Table 8-33 shows the percentage distribution of households observing an emergence of new invasive species by land use type in last 25 years. Overall, higher percentage of households (92.03%)
is observing emergence of creeper plant (land) in agricultural land followed by shrubs/bush (60.29%), and creeper plant (climber) (57.38%).
Table 8-34: Emergence of New Invasive Plants by Land Use Type in Ecological Belt
Invasive Species (Category)Observed Change (HH, %)
TotalForest Pasture Land Agriculture
MountainShrub/bush 56.82 6.68 36.51 100.00Creeper plant (climber) 45.16 0.0 54.84 100.00Creeper plant (land) 13.82 46.88 39.30 100.00HillShrub/bush 36.43 11.12 52.45 100.00Creeper plant (climber) 73.38 3.40 23.22 100.00Creeper plant (land) 7.01 8.69 84.30 100.00Terai
Shrub/bush 11.60 14.46 73.94 100.00Creeper plant (climber) 20.47 0.99 78.54 100.00Creeper plant (land) 2.15 2.78 95.07 100.00
Table 8-34 presents the percentage distribution of households observing an emergence of new invasive species by land use type in ecological belt. Higher percentage of households in Terai (95.07%)
have reported to have observed an emergence of creeper plant (land) in agricultural land followed by 78.54 per cent for creeper plant (climber) and 73.94 per cent for shrub/bush in last 25 years.

National Climate Change Impact Survey 2016 | 165
Table 8-35: Emergence of New Invasive Plants by Land Use Type in Eco-Development Region
Invasive Species (Category)Observed Change (HH, %)
TotalForest Pasture Land Agriculture
Eastern MountainShrub/bush 39.53 8.04 52.43 100.00Creeper plant (climber) 77.84 0.0 22.16 100.00Creeper plant (land) 0.0 0.0 100.00 100.00Eastern HillShrub/bush 52.38 13.14 34.48 100.00Creeper plant (climber) 68.44 16.21 15.35 100.00Creeper plant (land) 26.87 55.72 17.41 100.00Eastern Terai
Shrub/bush 6.31 11.32 82.37 100.00Creeper plant (climber) 24.36 0.73 74.91 100.00Creeper plant (land) 2.50 3.95 93.55 100.00Central MountainShrub/bush 39.30 0.0 60.70 100.00Creeper plant (climber) 100.00 0.0 0.0 100.00Creeper plant (land) 17.65 59.88 22.47 100.00Central HillShrub/bush 21.80 7.98 70.22 100.00Creeper plant (climber) 11.86 0.0 88.14 100.00Creeper plant (land) 12.90 18.25 68.85 100.00Central Terai
Shrub/bush 0.0 0.93 99.07 100.00Creeper plant (climber) 7.06 0.92 92.02 100.00Creeper plant (land) 0.43 0.0 99.57 100.00Western MountainShrub/bush 100.00 0.0 0.0 100.00Creeper plant (climber) 100.00 0.0 0.0 100.00Creeper plant (land) 100.00 0.0 0.0 100.00Western HillShrub/bush 24.84 4.25 70.91 100.00Creeper plant (climber) 92.76 0.0 7.24 100.00Creeper plant (land) 21.28 0.0 78.72 100.00Western Terai
Shrub/bush 2.66 1.00 96.35 100.00Creeper plant (climber) 51.39 48.61 0.0 100.00Creeper plant (land) 100.00 0.0 0.0 100.00Mid-western HillShrub/bush 49.82 22.19 27.99 100.00Creeper plant (climber) 75.44 0.0 24.56 100.00Creeper plant (land) 0.59 0.47 98.94 100.00Mid-western Terai
Shrub/bush 34.71 47.16 18.14 100.00Creeper plant (climber) 45.43 0.0 54.57 100.00Creeper plant (land) 0.0 5.83 94.17 100.00

166 | National Climate Change Impact Survey 2016
Invasive Species (Category)Observed Change (HH, %)
TotalForest Pasture Land Agriculture
Far-Western MountainShrub/bush 73.59 8.11 18.29 100.00Creeper plant (climber) 0.0 0.0 100.00 100.00Far-Western HillShrub/bush 72.78 22.06 5.16 100.00Creeper plant (climber) 89.02 3.81 7.17 100.00Creeper plant (land) 45.26 42.81 11.92 100.00Far-Western Terai
Shrub/bush 76.34 2.54 21.12 100.00Creeper plant (climber) 16.69 5.29 78.03 100.00Creeper plant (land) 40.09 3.77 56.14 100.00
Table 8-35 depicts the percentage distribution of households observing an emergence of new invasive species by land use type in eco-development regions in last 25 years. The table shows that all households in central mountain region (100%) are observing an
emergence of creeper plants (climber) in forests areas while all households in western mountain region (100%) and western Terai (100%) are observing emergence of shrub/bush and creeper plant (land) in forests area.
Table 8-36: Emergence of New Invasive Plants by Land Use Type in NAPA Combined Vulnerability Index
Invasive Species (Category)Observed Changes (HH, %)
TotalForest Pasture Land Agriculture
Very HighShrub/bush 15.05 2.21 82.73 100.00Creeper plant (climber) 25.25 0.0 74.75 100.00Creeper plant (land) 4.76 2.05 93.19 100.00HighShrub/bush 31.44 12.80 55.76 100.00Creeper plant (climber) 40.31 2.01 57.68 100.00Creeper plant (land) 4.92 5.16 89.92 100.00ModerateShrub/bush 31.58 3.51 64.91 100.00Creeper plant (climber) 26.26 0.0 73.74 100.00Creeper plant (land) 1.22 0.0 98.78 100.00LowShrub/bush 38.40 36.00 25.60 100.00Creeper plant (climber) 61.63 4.12 34.26 100.00Creeper plant (land) 3.34 9.13 87.53 100.00Very LowShrub/bush 12.53 3.84 83.64 100.00Creeper plant (climber) 80.47 19.53 0.0 100.00Creeper plant (land) 29.88 0.0 70.12 100.00
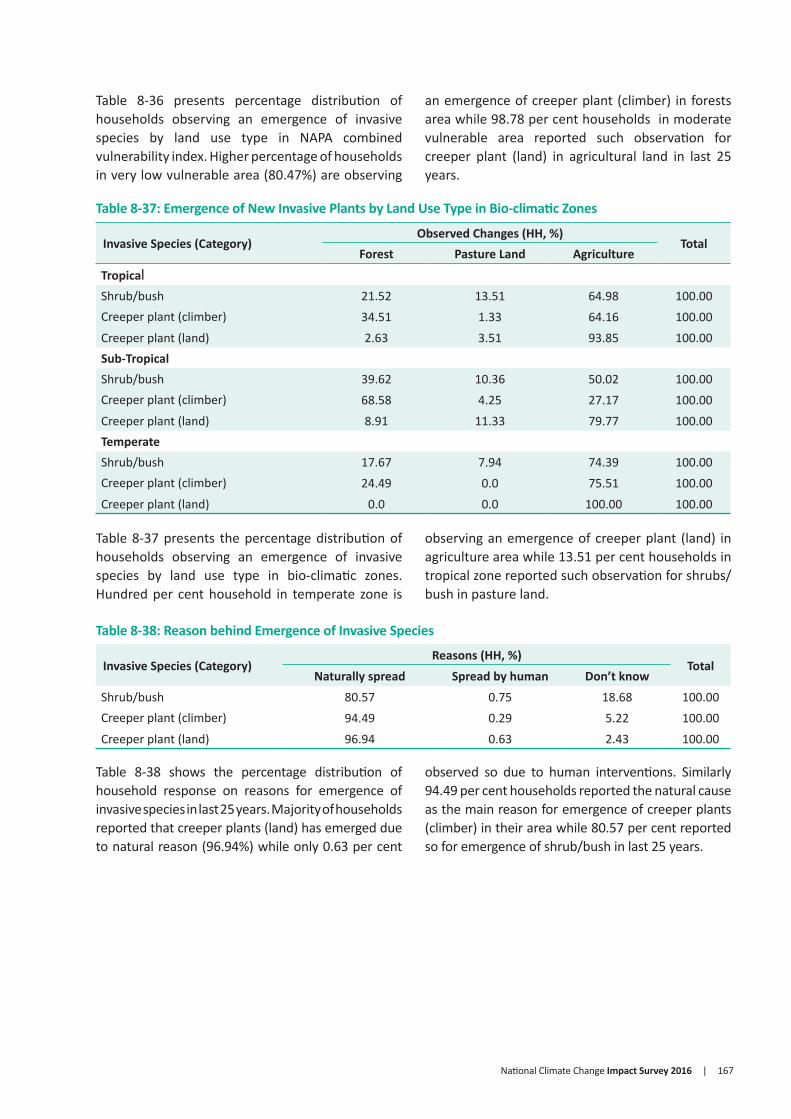
National Climate Change Impact Survey 2016 | 167
Table 8-36 presents percentage distribution of households observing an emergence of invasive species by land use type in NAPA combined vulnerability index. Higher percentage of households in very low vulnerable area (80.47%) are observing
an emergence of creeper plant (climber) in forests area while 98.78 per cent households in moderate vulnerable area reported such observation for creeper plant (land) in agricultural land in last 25 years.
Table 8-37: Emergence of New Invasive Plants by Land Use Type in Bio-climatic Zones
Invasive Species (Category)Observed Changes (HH, %)
TotalForest Pasture Land Agriculture
TropicalShrub/bush 21.52 13.51 64.98 100.00Creeper plant (climber) 34.51 1.33 64.16 100.00Creeper plant (land) 2.63 3.51 93.85 100.00Sub-TropicalShrub/bush 39.62 10.36 50.02 100.00Creeper plant (climber) 68.58 4.25 27.17 100.00Creeper plant (land) 8.91 11.33 79.77 100.00TemperateShrub/bush 17.67 7.94 74.39 100.00Creeper plant (climber) 24.49 0.0 75.51 100.00Creeper plant (land) 0.0 0.0 100.00 100.00
Table 8-37 presents the percentage distribution of households observing an emergence of invasive species by land use type in bio-climatic zones. Hundred per cent household in temperate zone is
observing an emergence of creeper plant (land) in agriculture area while 13.51 per cent households in tropical zone reported such observation for shrubs/bush in pasture land.
Table 8-38: Reason behind Emergence of Invasive Species
Invasive Species (Category)Reasons (HH, %)
TotalNaturally spread Spread by human Don’t know
Shrub/bush 80.57 0.75 18.68 100.00Creeper plant (climber) 94.49 0.29 5.22 100.00Creeper plant (land) 96.94 0.63 2.43 100.00
Table 8-38 shows the percentage distribution of household response on reasons for emergence of invasive species in last 25 years. Majority of households reported that creeper plants (land) has emerged due to natural reason (96.94%) while only 0.63 per cent
observed so due to human interventions. Similarly 94.49 per cent households reported the natural cause as the main reason for emergence of creeper plants (climber) in their area while 80.57 per cent reported so for emergence of shrub/bush in last 25 years.

168 | National Climate Change Impact Survey 2016
Table 8-39: Reason behind Emergence of New Invasive Species by Rural-Urban
Invasive Species (Category)Reasons (HH, %)
TotalNaturally spread Spread by human Don’t know
Urban
Shrub/bush 91.14 1.50 7.36 100.00
Creeper plant (climber) 95.03 0.0 4.97 100.00
Creeper plant (land) 95.39 2.82 1.79 100.00
Rural
Shrub/bush 77.49 0.54 21.97 100.00
Creeper plant (climber) 94.32 0.38 5.30 100.00
Creeper plant (land) 97.38 0.0 2.62 100.00
Table 8-39 shows the percentage distribution of households response on reason for emergence of new invasive species by rural-urban area. Majority of households in both urban and rural area are
observing an emergence of invasive species due to natural reason. However, small proportion of households in urban area (1.50%) reported so due to human activities.
Table 8-40: Reason behind Emergence of New Invasive Species by Ecological Belt
Invasive Species (Category)Reasons (HH, %)
TotalNaturally spread Spread by human Don’t know
MountainShrub/bush 95.48 1.43 3.09 100.00Creeper plant (climber) 91.04 0.0 8.96 100.00Creeper plant (land) 78.29 0.0 21.71 100.00HillShrub/bush 66.27 0.78 32.94 100.00Creeper plant (climber) 89.71 0.22 10.07 100.00Creeper plant (land) 90.50 2.48 7.02 100.00Terai
Shrub/bush 98.28 0.63 1.08 100.00Creeper plant (climber) 97.56 0.35 2.09 100.00Creeper plant (land) 99.29 0.0 0.71 100.00
Table 8-40 presents the percentage distribution of households response on reason of emergence of new invasive species by ecological belt. Majority of households in all ecological regions are observing such changes due to natural reason.
However, 1.43 per cent households in mountain region, 0.78 per cent in hill and 0.63 per cent in Terai reported that human activities are the main reason behind emergence of shrub/bush in last 25 years.
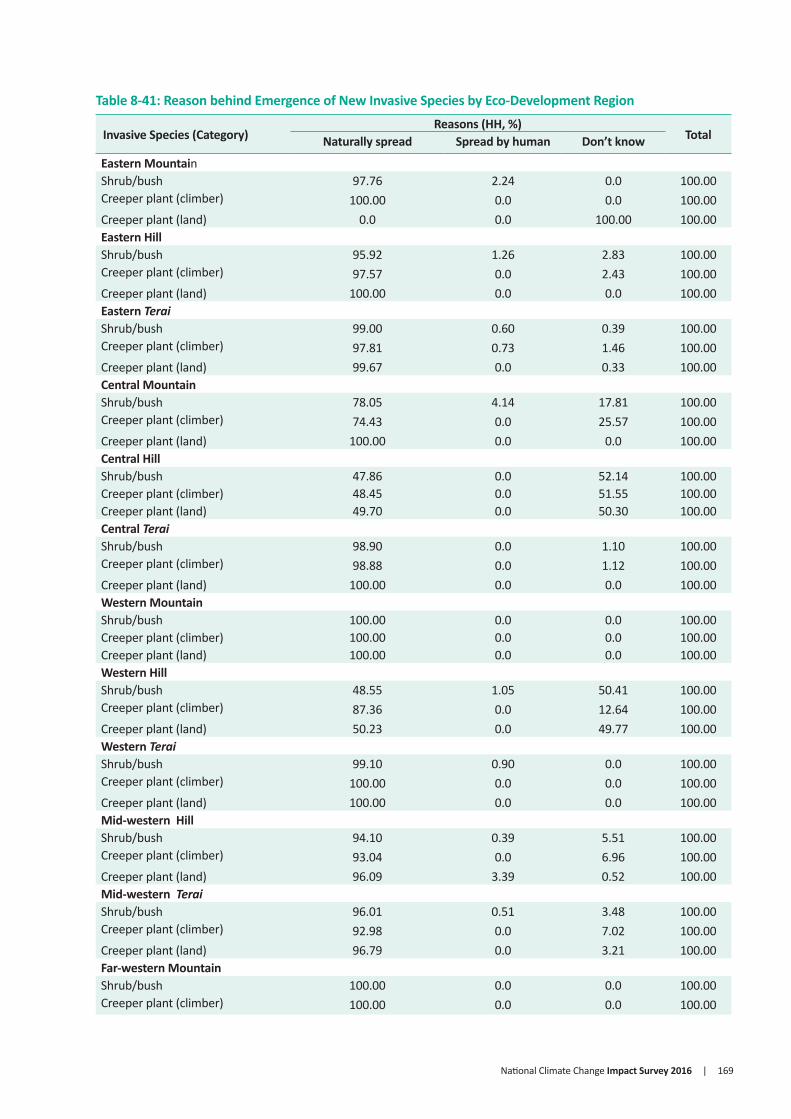
National Climate Change Impact Survey 2016 | 169
Table 8-41: Reason behind Emergence of New Invasive Species by Eco-Development Region
Invasive Species (Category)Reasons (HH, %)
TotalNaturally spread Spread by human Don’t know
Eastern MountainShrub/bush 97.76 2.24 0.0 100.00Creeper plant (climber) 100.00 0.0 0.0 100.00Creeper plant (land) 0.0 0.0 100.00 100.00Eastern HillShrub/bush 95.92 1.26 2.83 100.00Creeper plant (climber) 97.57 0.0 2.43 100.00Creeper plant (land) 100.00 0.0 0.0 100.00Eastern TeraiShrub/bush 99.00 0.60 0.39 100.00Creeper plant (climber) 97.81 0.73 1.46 100.00Creeper plant (land) 99.67 0.0 0.33 100.00Central MountainShrub/bush 78.05 4.14 17.81 100.00Creeper plant (climber) 74.43 0.0 25.57 100.00Creeper plant (land) 100.00 0.0 0.0 100.00Central HillShrub/bush 47.86 0.0 52.14 100.00Creeper plant (climber) 48.45 0.0 51.55 100.00Creeper plant (land) 49.70 0.0 50.30 100.00Central TeraiShrub/bush 98.90 0.0 1.10 100.00Creeper plant (climber) 98.88 0.0 1.12 100.00Creeper plant (land) 100.00 0.0 0.0 100.00Western MountainShrub/bush 100.00 0.0 0.0 100.00Creeper plant (climber) 100.00 0.0 0.0 100.00Creeper plant (land) 100.00 0.0 0.0 100.00Western HillShrub/bush 48.55 1.05 50.41 100.00Creeper plant (climber) 87.36 0.0 12.64 100.00Creeper plant (land) 50.23 0.0 49.77 100.00Western TeraiShrub/bush 99.10 0.90 0.0 100.00Creeper plant (climber) 100.00 0.0 0.0 100.00Creeper plant (land) 100.00 0.0 0.0 100.00Mid-western HillShrub/bush 94.10 0.39 5.51 100.00Creeper plant (climber) 93.04 0.0 6.96 100.00Creeper plant (land) 96.09 3.39 0.52 100.00Mid-western TeraiShrub/bush 96.01 0.51 3.48 100.00Creeper plant (climber) 92.98 0.0 7.02 100.00Creeper plant (land) 96.79 0.0 3.21 100.00Far-western MountainShrub/bush 100.00 0.0 0.0 100.00Creeper plant (climber) 100.00 0.0 0.0 100.00

170 | National Climate Change Impact Survey 2016
Invasive Species (Category)Reasons (HH, %)
TotalNaturally spread Spread by human Don’t know
Far-western HillShrub/bush 89.17 1.37 9.46 100.00Creeper plant (climber) 94.64 1.28 4.08 100.00Creeper plant (land) 100.00 0.0 0.0 100.00Far-western TeraiShrub/bush 92.43 5.03 2.54 100.00Creeper plant (climber) 96.35 0.0 3.65 100.00Creeper plant (land) 95.63 0.0 4.37 100.00
Table 8-41 shows the percentage distribution of households response on reason behind emergence of new invasive species by eco-development region
in last 25 years. It can be seen that majority of households in all eco-development region are observing such changes due to natural causes.
Table 8-42: Reason behind Emergence of New Invasive Species by Bio-Climate Zones
Invasive Species (Category)Reasons (HH, %)
TotalNaturally spread Spread by human Don’t' know
TropicalShrub/bush 90.71 0.78 8.51 100.00Creeper plant (climber) 95.44 0.26 4.30 100.00
Creeper plant (land) 97.33 0.73 1.94 100.00Sub-tropicalShrub/bush 65.59 0.69 33.72 100.00Creeper plant (climber) 90.73 0.44 8.83 100.00
Creeper plant (land) 94.27 0.0 5.73 100.00TemperateShrub/bush 44.79 0.95 54.25 100.00Creeper plant (climber) 86.85 0.0 13.15 100.00
Creeper plant (land) 100.00 0.0 0.0 100.00
Table 8-42 represents the percentage distribution of household response on reason of emergence of new invasive species by climatic zone in last 25 years. Higher percentages of households in all Bio-Climatic Zones have attributed natural cause as main reason
for emergence of new invasive species in their area. However, less than one per cent households in all climatic zones have reported human cause for such changes.
Table 8-43: Observed Impact due to Invasive Species
Invasive species (Category)
Observed Impact12 (HH, %)
Decreased Income
Loss in timber
Loss in grass
Loss in firewood
Leaf litter loss
Food grass loss
Human and livestock's
health problem
No affect
Shrub/bush 56.6 13.3 62.7 4.4 10.1 12.7 4.2 2.5Creeper plant (climber) 44.9 50.1 22.4 5.4 5.0 9.0 3.1 15.7Creeper plant (land) 87.7 2.0 13.8 0.7 1.9 37.8 4.7 2.3
12 The result is based on multiple response

National Climate Change Impact Survey 2016 | 171
Table 8-43 represents percentage distribution of households observing impact due to emergence of invasive species in last 25 years. Higher percentages of households have observed a decrease in income due to emergence of creeper plant (land) (87.7%) followed
by shrub/bush (56.6%) and creeper plant (climber) (44.9%). Similarly, 62.7 per cent households reported loss on grass due to emergence of shrubs/bush while 50.1 per cent reported loss on timber production due to emergence of creeper plant (climber).
Table 8-44: Observed Impact due to Invasive Species by Eco-Development Region
Invasive species (Category)
Observed Impact13 (HH, %)
Decreased Income
Loss in timber
Loss in grass
Loss in firewood
Leaf litter loss
Food grass loss
Human and livestock's
health problem
No affect
Eastern MountainShrub/bush 69.0 6.4 84.4 0.0 6.1 0.0 0.0 0.0Creeper plant (climber) 49.0 53.7 73.2 0.0 0.0 0.0 0.0 0.0Creeper plant (land) 100.0 58.3 41.7 0.0 0.0 0.0 0.0 0.0Eastern HillShrub/bush 75.1 15.2 81.8 11.1 15.5 2.6 1.3 0.0Creeper plant (climber) 49.8 47.9 73.9 9.1 19.8 12.0 0.0 0.0Creeper plant (land) 59.7 15.4 79.2 16.0 50.1 5.9 9.4 0.0Eastern Terai
Shrub/bush 77.4 4.2 53.0 0.9 0.5 4.7 2.0 2.2Creeper plant (climber) 69.5 61.6 17.9 2.8 0.0 3.7 1.5 6.8Creeper plant (land) 87.6 1.2 12.3 0.0 0.0 29.7 9.5 1.1Central MountainShrub/bush 91.8 4.6 21.0 0.0 0.0 5.4 0.0 4.2Creeper plant (climber) 0.0 48.9 51.1 10.9 14.4 0.0 0.0 0.0Creeper plant (land) 22.5 0.0 77.5 0.0 37.8 0.0 0.0 0.0Central HillShrub/bush 63.3 5.0 36.1 0.8 12.7 12.9 0.0 0.0Creeper plant (climber) 74.3 11.9 0.0 5.5 0.0 59.4 0.0 13.8Creeper plant (land) 75.6 0.0 37.3 0.0 0.0 44.1 9.1 6.2Central TeraiShrub/bush 86.3 0.0 26.8 0.0 0.0 0.0 5.0 10.0Creeper plant (climber) 23.1 27.2 1.8 0.0 0.0 14.9 0.0 51.8Creeper plant (land) 91.2 0.0 1.5 0.0 0.0 91.2 0.9 3.6Western MountainShrub/bush 0.0 100.0 100.0 0.0 0.0 0.0 0.0 0.0
Western HillShrub/bush 48.3 16.4 87.0 7.6 2.3 2.5 3.0 2.1Creeper plant (climber) 11.1 67.5 16.1 0.0 0.0 4.7 0.0 16.6Creeper plant (land) 62.5 14.1 25.5 0.0 0.0 0.0 0.0 11.9Western TeraiShrub/bush 95.2 0.5 8.6 0.0 0.0 97.4 17.7 1.4Creeper plant (climber) 0.0 0.0 100.0 51.4 0.0 0.0 0.0 0.0Creeper plant (land) 0.0 100.0 0.0 0.0 0.0 0.0 0.0 0.0Mid-Western HillShrub/bush 29.9 20.4 74.8 6.5 26.3 18.2 8.3 1.5Creeper plant (climber) 33.0 73.5 41.2 16.5 6.9 3.4 0.0 3.1Creeper plant (land) 95.5 1.5 15.6 0.0 0.0 5.2 1.4 1.7
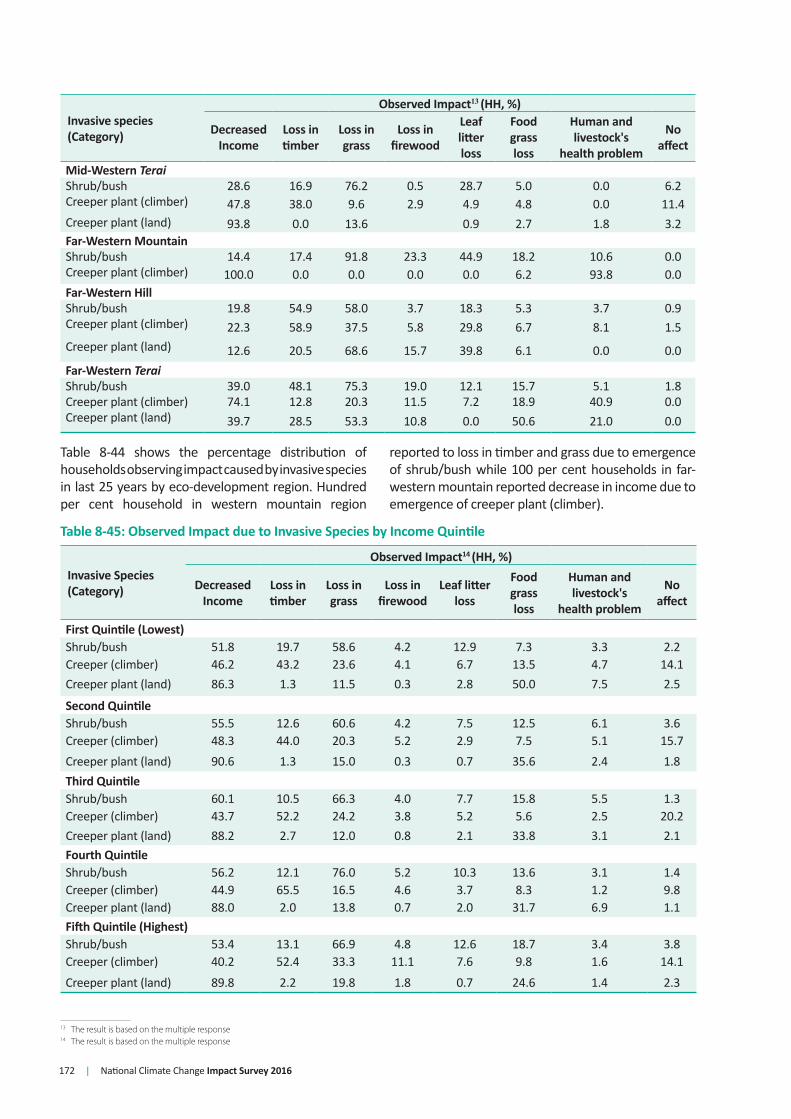
172 | National Climate Change Impact Survey 2016
Invasive species (Category)
Observed Impact13 (HH, %)
Decreased Income
Loss in timber
Loss in grass
Loss in firewood
Leaf litter loss
Food grass loss
Human and livestock's
health problem
No affect
Mid-Western TeraiShrub/bush 28.6 16.9 76.2 0.5 28.7 5.0 0.0 6.2Creeper plant (climber) 47.8 38.0 9.6 2.9 4.9 4.8 0.0 11.4Creeper plant (land) 93.8 0.0 13.6 0.9 2.7 1.8 3.2Far-Western MountainShrub/bush 14.4 17.4 91.8 23.3 44.9 18.2 10.6 0.0Creeper plant (climber) 100.0 0.0 0.0 0.0 0.0 6.2 93.8 0.0Far-Western HillShrub/bush 19.8 54.9 58.0 3.7 18.3 5.3 3.7 0.9Creeper plant (climber) 22.3 58.9 37.5 5.8 29.8 6.7 8.1 1.5Creeper plant (land) 12.6 20.5 68.6 15.7 39.8 6.1 0.0 0.0Far-Western TeraiShrub/bush 39.0 48.1 75.3 19.0 12.1 15.7 5.1 1.8Creeper plant (climber) 74.1 12.8 20.3 11.5 7.2 18.9 40.9 0.0Creeper plant (land) 39.7 28.5 53.3 10.8 0.0 50.6 21.0 0.0
Table 8-44 shows the percentage distribution of households observing impact caused by invasive species in last 25 years by eco-development region. Hundred per cent household in western mountain region
reported to loss in timber and grass due to emergence of shrub/bush while 100 per cent households in far-western mountain reported decrease in income due to emergence of creeper plant (climber).
Table 8-45: Observed Impact due to Invasive Species by Income Quintile
Invasive Species (Category)
Observed Impact14 (HH, %)
Decreased Income
Loss in timber
Loss in grass
Loss in firewood
Leaf litter loss
Food grass loss
Human and livestock's
health problem
No affect
First Quintile (Lowest)Shrub/bush 51.8 19.7 58.6 4.2 12.9 7.3 3.3 2.2Creeper (climber) 46.2 43.2 23.6 4.1 6.7 13.5 4.7 14.1Creeper plant (land) 86.3 1.3 11.5 0.3 2.8 50.0 7.5 2.5
Second QuintileShrub/bush 55.5 12.6 60.6 4.2 7.5 12.5 6.1 3.6Creeper (climber) 48.3 44.0 20.3 5.2 2.9 7.5 5.1 15.7Creeper plant (land) 90.6 1.3 15.0 0.3 0.7 35.6 2.4 1.8Third QuintileShrub/bush 60.1 10.5 66.3 4.0 7.7 15.8 5.5 1.3Creeper (climber) 43.7 52.2 24.2 3.8 5.2 5.6 2.5 20.2Creeper plant (land) 88.2 2.7 12.0 0.8 2.1 33.8 3.1 2.1Fourth QuintileShrub/bush 56.2 12.1 76.0 5.2 10.3 13.6 3.1 1.4Creeper (climber) 44.9 65.5 16.5 4.6 3.7 8.3 1.2 9.8Creeper plant (land) 88.0 2.0 13.8 0.7 2.0 31.7 6.9 1.1Fifth Quintile (Highest)Shrub/bush 53.4 13.1 66.9 4.8 12.6 18.7 3.4 3.8Creeper (climber) 40.2 52.4 33.3 11.1 7.6 9.8 1.6 14.1Creeper plant (land) 89.8 2.2 19.8 1.8 0.7 24.6 1.4 2.3
13 The result is based on the multiple response14 The result is based on the multiple response

National Climate Change Impact Survey 2016 | 173
Table 8-45 shows the percentage distribution of households observing impacts due to invasive species in last 25 years by income quintile. Higher percentage
of households in first quintile (86.3%) and fifth quintile (89.8%) attributed to decrease their income due to emergence of creeper plant (land).
Table 8-46: Observed Impact due to Invasive Species by Bio-climatic Zones
Invasive Species (Category)
Observed Impact15 (HH, %)
Decreased Income
Loss in timber
Loss in grass
Loss in firewood
Leaf litter loss
Food grass loss
Human and livestock's
health problem
No affect
TropicalShrub/bush 63.4 11.9 54.6 2.1 7.9 16.6 4.1 3.0Creeper (climber) 45.4 50.2 18.8 5.0 2.5 8.5 1.8 19.1Creeper plant (land) 88.5 1.9 12.0 0.5 0.9 42.8 4.8 2.3Sub-TropicalShrub/bush 43.3 16.9 75.8 7.2 14.6 5.3 3.9 1.6Creeper (climber) 41.3 51.4 37.7 7.2 15.1 11.4 7.2 1.7Creeper plant (land) 82.3 3.0 26.4 2.3 8.7 5.5 3.8 2.6TemperateShrub/bush 61.4 5.2 81.2 16.9 7.0 15.0 8.8 1.4Creeper (climber) 75.5 13.2 28.4 0.0 13.2 33.4 0.0Creeper plant (land) 100.0 0.0 0.0 0.0 0.0 0.0 0.0 0.0
Table 8-46 depicts the percentage distribution of households observing impact due to invasive species in last 25 years by climatic zone. Hundred per cent households in temperate zone reported decrease in income due to emergence of creeper plant (land) while 88.5 per cent in tropical zone
and 82.3 per cent in sub-tropical zone reported so. Likewise, 81.2 per cent households in temperate zone, 75.8 per cent in sub-tropical zone, and 54.6 per cent in tropical zone have reported loss in grass due to emergence of shrub/bush in last 25 years.
Table 8-47: Early Flowering or Fruiting in the Tree Species
Analytical DomainResponse (HH, %)
TotalYes No Don't know Not applicable
Urban/RuralUrban 41.44 33.92 17.00 7.63 100.00Rural 40.99 43.49 15.34 0.18 100.00Ecological BeltMountain 37.75 46.46 15.76 0.04 100.00Hill 42.19 36.31 17.00 4.49 100.00Terai 40.64 44.04 14.67 0.64 100.00Eco-Development RegionEastern Mountain 24.89 66.06 9.05 0.0 100.00Eastern Hill 62.63 24.99 12.38 0.0 100.00Eastern Terai 66.98 20.75 11.72 0.55 100.00Central Mountain 46.60 44.65 8.74 0.0 100.00Central Hill 42.20 50.86 6.66 0.28 100.00Central Terai 21.23 65.70 12.87 0.20 100.00Western Mountain 2.20 97.80 0.0 0.0 100.00
15 The result is based on the multiple response

174 | National Climate Change Impact Survey 2016
Analytical DomainResponse (HH, %)
TotalYes No Don't know Not applicable
Western Hill 33.40 27.06 38.78 0.76 100.00Western Terai 27.03 38.89 32.11 1.97 100.00Mid-western Mountain 26.52 44.93 28.36 0.19 100.00Mid-western Hill 32.30 64.20 3.50 0.0 100.00Mid-western Terai 35.42 52.72 10.43 1.43 100.00Far-western Mountain 50.68 24.08 25.24 0.0 100.00Far-western Hill 88.14 10.66 1.19 0.0 100.00Far-western Terai 47.98 37.74 14.28 0.0 100.00Kathmandu Valley 2.16 12.54 24.70 60.60 100.00NAPA Combined Vulnerability IndexVery High 59.75 24.41 7.27 8.57 100.00High 42.99 49.69 7.10 0.23 100.00Moderate 24.32 52.10 23.22 0.36 100.00Low 45.09 39.40 14.77 0.74 100.00Very Low 25.09 30.64 42.94 1.33 100.00Bio-Climate ZonesTropical 38.70 46.22 14.44 0.64 100.00Sub-tropical 43.61 32.83 17.94 5.62 100.00Temperate 55.01 25.81 18.39 0.78 100.00Sub-alpine 0.0 100.00 0.0 0.0 100.00Nepal 41.12 40.69 15.83 2.36 100.00
Table 8-48: Delay in Flowering or Fruiting in the Tree Species
Analytical DomainResponse (HH, %)
TotalYes No Don't know Not applicable
Urban/RuralUrban 12.05 62.42 17.94 7.58 100.00Rural 10.84 73.06 15.93 0.16 100.00Ecological BeltMountain 15.39 69.85 14.77 0.0 100.00Hill 11.42 66.20 17.77 4.60 100.00Terai 10.25 73.68 15.58 0.49 100.00Eco-Development RegionEastern Mountain 20.21 73.38 6.41 0.0 100.00Eastern Hill 20.08 66.92 13.01 0.0 100.00Eastern Terai 15.09 71.51 13.25 0.15 100.00Central Mountain 15.86 76.02 8.11 0.0 100.00Central Hill 10.97 83.73 5.01 0.28 100.00
Table 8-47 and 8-48 present the percentage distribution of households observing early or delay in flowering and fruiting in the tree species in last 25 years. Almost equal percentage of households are observing early flowering or fruiting (41.12%)
and delay on flowering and fruiting (40.69%) in tree species in last 25 years. However, significant percentage of households (16.52%) reported that they do not know whether flowering and fruiting time in trees species is delayed.
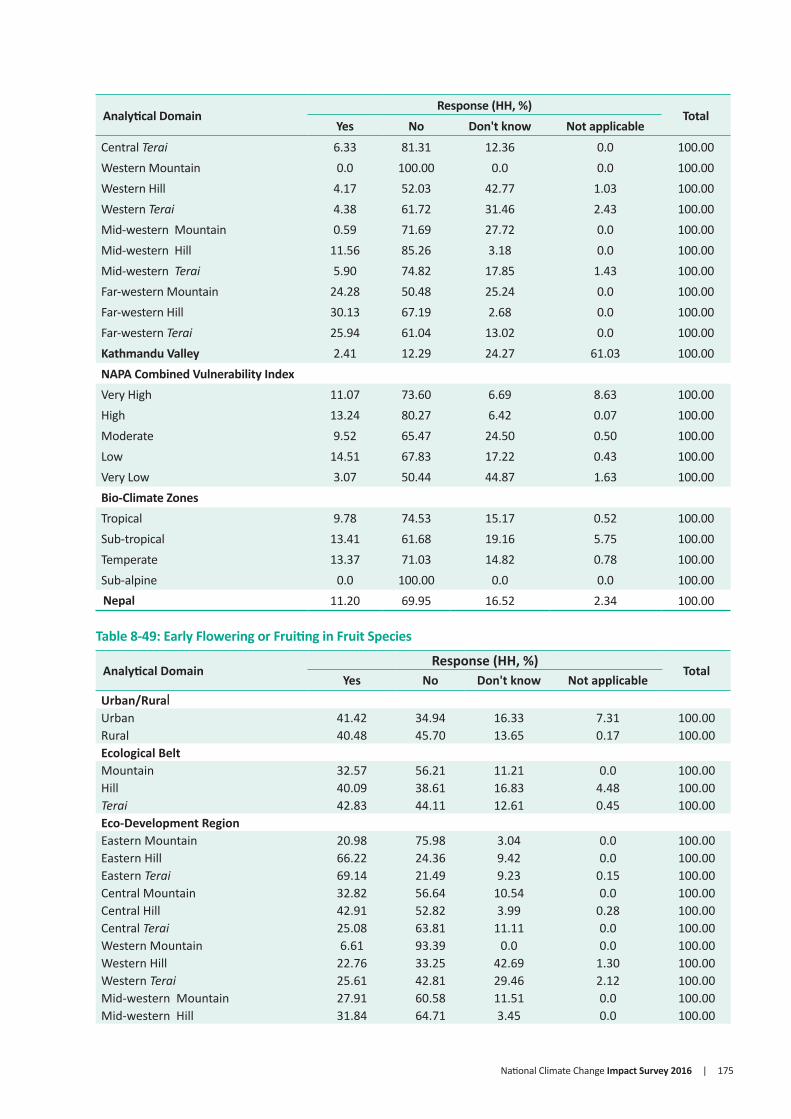
National Climate Change Impact Survey 2016 | 175
Analytical DomainResponse (HH, %)
TotalYes No Don't know Not applicable
Central Terai 6.33 81.31 12.36 0.0 100.00Western Mountain 0.0 100.00 0.0 0.0 100.00Western Hill 4.17 52.03 42.77 1.03 100.00Western Terai 4.38 61.72 31.46 2.43 100.00Mid-western Mountain 0.59 71.69 27.72 0.0 100.00Mid-western Hill 11.56 85.26 3.18 0.0 100.00Mid-western Terai 5.90 74.82 17.85 1.43 100.00Far-western Mountain 24.28 50.48 25.24 0.0 100.00Far-western Hill 30.13 67.19 2.68 0.0 100.00Far-western Terai 25.94 61.04 13.02 0.0 100.00Kathmandu Valley 2.41 12.29 24.27 61.03 100.00NAPA Combined Vulnerability IndexVery High 11.07 73.60 6.69 8.63 100.00High 13.24 80.27 6.42 0.07 100.00Moderate 9.52 65.47 24.50 0.50 100.00Low 14.51 67.83 17.22 0.43 100.00Very Low 3.07 50.44 44.87 1.63 100.00Bio-Climate ZonesTropical 9.78 74.53 15.17 0.52 100.00Sub-tropical 13.41 61.68 19.16 5.75 100.00Temperate 13.37 71.03 14.82 0.78 100.00Sub-alpine 0.0 100.00 0.0 0.0 100.00Nepal 11.20 69.95 16.52 2.34 100.00
Table 8-49: Early Flowering or Fruiting in Fruit Species
Analytical DomainResponse (HH, %)
TotalYes No Don't know Not applicable
Urban/RuralUrban 41.42 34.94 16.33 7.31 100.00Rural 40.48 45.70 13.65 0.17 100.00Ecological BeltMountain 32.57 56.21 11.21 0.0 100.00Hill 40.09 38.61 16.83 4.48 100.00Terai 42.83 44.11 12.61 0.45 100.00Eco-Development RegionEastern Mountain 20.98 75.98 3.04 0.0 100.00Eastern Hill 66.22 24.36 9.42 0.0 100.00Eastern Terai 69.14 21.49 9.23 0.15 100.00Central Mountain 32.82 56.64 10.54 0.0 100.00Central Hill 42.91 52.82 3.99 0.28 100.00Central Terai 25.08 63.81 11.11 0.0 100.00Western Mountain 6.61 93.39 0.0 0.0 100.00Western Hill 22.76 33.25 42.69 1.30 100.00Western Terai 25.61 42.81 29.46 2.12 100.00Mid-western Mountain 27.91 60.58 11.51 0.0 100.00Mid-western Hill 31.84 64.71 3.45 0.0 100.00
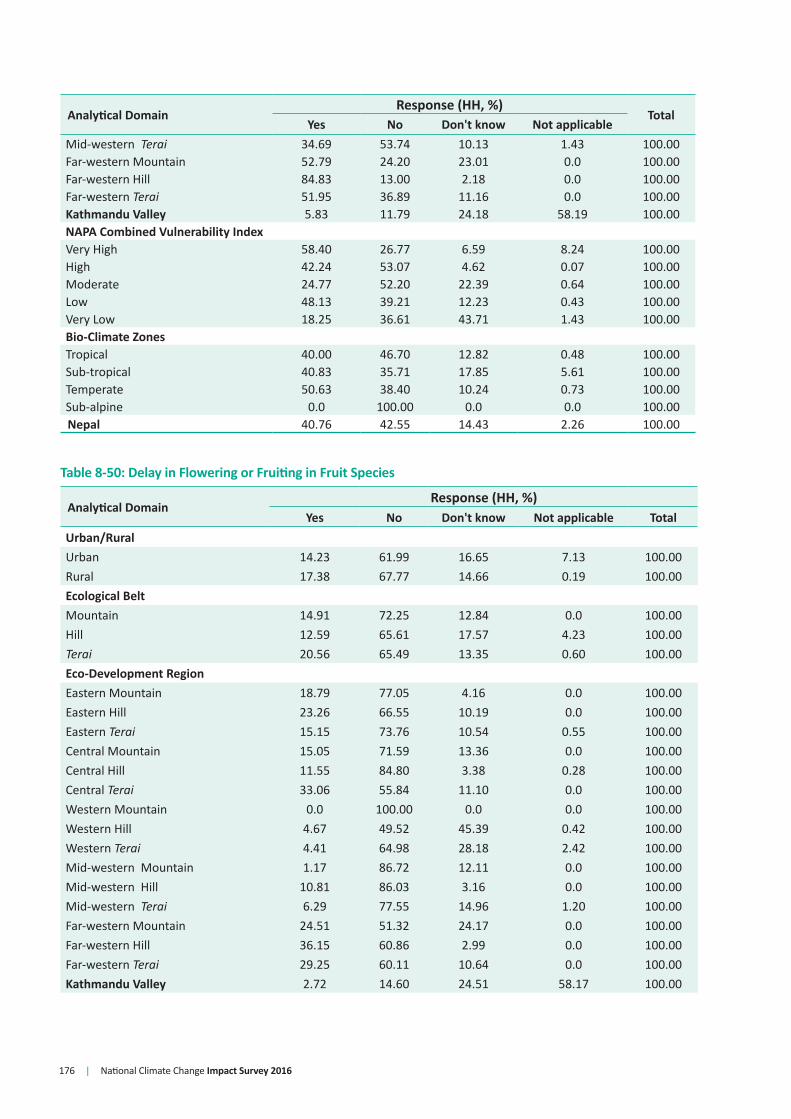
176 | National Climate Change Impact Survey 2016
Analytical DomainResponse (HH, %)
TotalYes No Don't know Not applicable
Mid-western Terai 34.69 53.74 10.13 1.43 100.00Far-western Mountain 52.79 24.20 23.01 0.0 100.00Far-western Hill 84.83 13.00 2.18 0.0 100.00Far-western Terai 51.95 36.89 11.16 0.0 100.00Kathmandu Valley 5.83 11.79 24.18 58.19 100.00NAPA Combined Vulnerability IndexVery High 58.40 26.77 6.59 8.24 100.00High 42.24 53.07 4.62 0.07 100.00Moderate 24.77 52.20 22.39 0.64 100.00Low 48.13 39.21 12.23 0.43 100.00Very Low 18.25 36.61 43.71 1.43 100.00Bio-Climate ZonesTropical 40.00 46.70 12.82 0.48 100.00Sub-tropical 40.83 35.71 17.85 5.61 100.00Temperate 50.63 38.40 10.24 0.73 100.00Sub-alpine 0.0 100.00 0.0 0.0 100.00Nepal 40.76 42.55 14.43 2.26 100.00
Table 8-50: Delay in Flowering or Fruiting in Fruit Species
Analytical DomainResponse (HH, %)
Yes No Don't know Not applicable TotalUrban/RuralUrban 14.23 61.99 16.65 7.13 100.00Rural 17.38 67.77 14.66 0.19 100.00Ecological BeltMountain 14.91 72.25 12.84 0.0 100.00Hill 12.59 65.61 17.57 4.23 100.00Terai 20.56 65.49 13.35 0.60 100.00Eco-Development RegionEastern Mountain 18.79 77.05 4.16 0.0 100.00Eastern Hill 23.26 66.55 10.19 0.0 100.00Eastern Terai 15.15 73.76 10.54 0.55 100.00Central Mountain 15.05 71.59 13.36 0.0 100.00Central Hill 11.55 84.80 3.38 0.28 100.00Central Terai 33.06 55.84 11.10 0.0 100.00Western Mountain 0.0 100.00 0.0 0.0 100.00Western Hill 4.67 49.52 45.39 0.42 100.00Western Terai 4.41 64.98 28.18 2.42 100.00Mid-western Mountain 1.17 86.72 12.11 0.0 100.00Mid-western Hill 10.81 86.03 3.16 0.0 100.00Mid-western Terai 6.29 77.55 14.96 1.20 100.00Far-western Mountain 24.51 51.32 24.17 0.0 100.00Far-western Hill 36.15 60.86 2.99 0.0 100.00Far-western Terai 29.25 60.11 10.64 0.0 100.00Kathmandu Valley 2.72 14.60 24.51 58.17 100.00
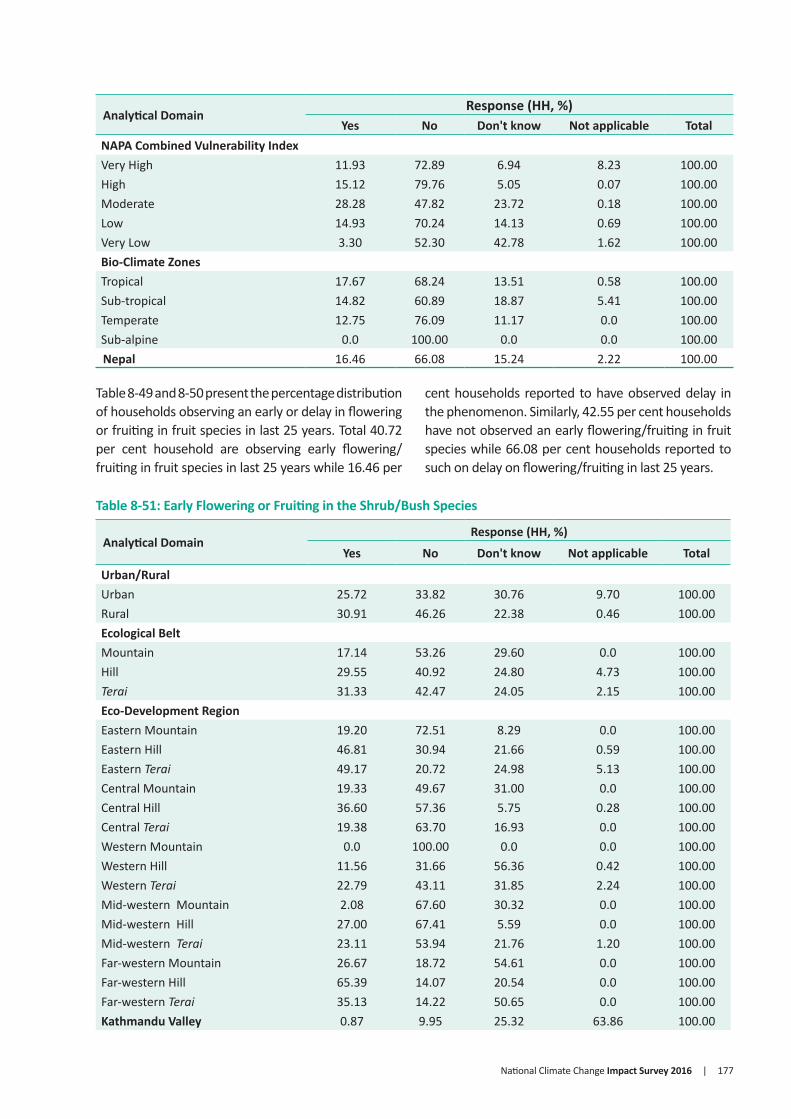
National Climate Change Impact Survey 2016 | 177
Analytical DomainResponse (HH, %)
Yes No Don't know Not applicable TotalNAPA Combined Vulnerability IndexVery High 11.93 72.89 6.94 8.23 100.00High 15.12 79.76 5.05 0.07 100.00Moderate 28.28 47.82 23.72 0.18 100.00Low 14.93 70.24 14.13 0.69 100.00Very Low 3.30 52.30 42.78 1.62 100.00Bio-Climate ZonesTropical 17.67 68.24 13.51 0.58 100.00Sub-tropical 14.82 60.89 18.87 5.41 100.00Temperate 12.75 76.09 11.17 0.0 100.00Sub-alpine 0.0 100.00 0.0 0.0 100.00Nepal 16.46 66.08 15.24 2.22 100.00
Table 8-49 and 8-50 present the percentage distribution of households observing an early or delay in flowering or fruiting in fruit species in last 25 years. Total 40.72 per cent household are observing early flowering/fruiting in fruit species in last 25 years while 16.46 per
cent households reported to have observed delay in the phenomenon. Similarly, 42.55 per cent households have not observed an early flowering/fruiting in fruit species while 66.08 per cent households reported to such on delay on flowering/fruiting in last 25 years.
Table 8-51: Early Flowering or Fruiting in the Shrub/Bush Species
Analytical DomainResponse (HH, %)
Yes No Don't know Not applicable Total
Urban/RuralUrban 25.72 33.82 30.76 9.70 100.00Rural 30.91 46.26 22.38 0.46 100.00Ecological BeltMountain 17.14 53.26 29.60 0.0 100.00Hill 29.55 40.92 24.80 4.73 100.00Terai 31.33 42.47 24.05 2.15 100.00Eco-Development Region Eastern Mountain 19.20 72.51 8.29 0.0 100.00Eastern Hill 46.81 30.94 21.66 0.59 100.00Eastern Terai 49.17 20.72 24.98 5.13 100.00Central Mountain 19.33 49.67 31.00 0.0 100.00Central Hill 36.60 57.36 5.75 0.28 100.00Central Terai 19.38 63.70 16.93 0.0 100.00Western Mountain 0.0 100.00 0.0 0.0 100.00Western Hill 11.56 31.66 56.36 0.42 100.00Western Terai 22.79 43.11 31.85 2.24 100.00Mid-western Mountain 2.08 67.60 30.32 0.0 100.00Mid-western Hill 27.00 67.41 5.59 0.0 100.00Mid-western Terai 23.11 53.94 21.76 1.20 100.00Far-western Mountain 26.67 18.72 54.61 0.0 100.00Far-western Hill 65.39 14.07 20.54 0.0 100.00Far-western Terai 35.13 14.22 50.65 0.0 100.00Kathmandu Valley 0.87 9.95 25.32 63.86 100.00

178 | National Climate Change Impact Survey 2016
Analytical DomainResponse (HH, %)
Yes No Don't know Not applicable Total
NAPA Combined Vulnerability IndexVery High 53.17 27.63 10.18 9.03 100.00High 34.89 56.39 8.65 0.07 100.00Moderate 12.23 52.72 34.86 0.18 100.00Low 23.29 34.43 37.83 4.45 100.00Very Low 14.73 35.98 47.79 1.51 100.00Bio-Climate ZonesTropical 28.51 45.94 23.75 1.80 100.00Sub-tropical 30.11 37.01 26.89 5.99 100.00Temperate 35.94 40.13 23.93 0.0 100.00Sub-alpine 0.0 100.00 0.0 0.0 100.00Nepal 29.39 42.61 24.83 3.16 100.00
Table 8-52: Delay in Flowering or Fruiting in the Shrub/Bush Species
Analytical DomainResponse (HH, %)
Yes No Don't know Not applicable TotalUrban/RuralUrban 7.71 51.17 31.26 9.86 100.00Rural 9.31 67.14 22.83 0.72 100.00Ecological BeltMountain 12.48 57.61 29.92 0.0 100.00Hill 9.79 59.70 25.73 4.77 100.00Terai 7.27 66.04 24.08 2.61 100.00Eco-Development RegionEastern Mountain 18.42 73.98 7.60 0.0 100.00Eastern Hill 20.39 55.36 23.61 0.63 100.00Eastern Terai 8.16 60.70 24.59 6.55 100.00Central Mountain 11.40 56.55 32.05 0.0 100.00Central Hill 8.74 85.08 5.89 0.28 100.00Central Terai 5.71 77.76 16.54 0.0 100.00Western Mountain 0.0 100.00 0.0 0.0 100.00Western Hill 1.32 41.38 56.91 0.39 100.00Western Terai 1.82 64.09 32.13 1.96 100.00Mid-western Mountain 0.0 69.68 30.32 0.0 100.00Mid-western Hill 10.40 83.66 5.93 0.0 100.00Mid-western Terai 7.24 68.83 22.73 1.20 100.00Far-western Mountain 20.33 24.52 55.14 0.0 100.00Far-western Hill 29.64 43.55 26.80 0.0 100.00Far-western Terai 22.79 23.42 53.59 0.20 100.00Kathmandu Valley 1.03 9.79 24.75 64.44 100.00NAPA Combined Vulnerability IndexVery High 11.29 69.21 10.39 9.11 100.00High 12.19 77.98 9.75 0.07 100.00Moderate 7.68 57.03 35.12 0.17 100.00Low 6.97 49.35 38.09 5.59 100.00Very Low 1.24 49.14 48.29 1.33 100.00

National Climate Change Impact Survey 2016 | 179
Analytical DomainResponse (HH, %)
Yes No Don't know Not applicable TotalBio-Climate ZonesTropical 6.51 67.36 23.98 2.15 100.00Sub-tropical 12.61 53.55 27.80 6.05 100.00Temperate 11.47 64.24 24.29 0.0 100.00Sub-alpine 0.0 100.00 0.0 0.0 100.00Nepal 8.84 62.46 25.30 3.40 100.00
Table 8-51 and 8-52 depict the percentage distribution of households observing early or delay in flowering or fruiting of shrubs/bush species in last 25 years. A total 29.39 per cent household reported to have observed an early flowering/fruiting in shrub/bush species while only 8.84 per cent households reported to have observed
delay. Similarly, higher percentage of households in very high vulnerable area (53.17%) under NAPA combined vulnerable index reported of observing early flowering/ fruiting in the shrubs/bush species while only 12.19 per cent households in the area reported of observing delay in such phenomenon in shrubs/bushes in last 25 years.
Table 8-53: Early Flowering or Fruiting in Medicine Plant Species
Analytical DomainResponse (HH, %)
Yes No Don't know Not applicable TotalUrban/RuralUrban 20.42 27.34 37.22 15.03 100.00Rural 23.54 34.33 37.63 4.49 100.00Ecological BeltMountain 12.11 49.04 38.85 0.0 100.00Hill 21.70 37.21 34.57 6.52 100.00Terai 25.35 24.51 40.20 9.93 100.00Eco-Development RegionEastern Mountain 14.74 75.72 9.54 0.0 100.00Eastern Hill 38.63 30.33 29.63 1.41 100.00Eastern Terai 44.83 13.97 28.86 12.34 100.00Central Mountain 19.26 46.75 33.98 0.0 100.00Central Hill 34.37 53.54 11.38 0.72 100.00Central Terai 19.01 30.70 48.40 1.89 100.00Western Mountain 0.0 100.00 0.0 0.0 100.00Western Hill 3.89 31.93 63.30 0.87 100.00Western Terai 0.89 34.69 24.83 39.59 100.00Mid-western Mountain 4.77 54.92 40.31 0.0 100.00Mid-western Hill 10.57 49.09 30.94 9.39 100.00Mid-western Terai 10.41 31.33 57.06 1.20 100.00Far-western Mountain 3.57 11.14 85.30 0.0 100.00Far-western Hill 42.90 12.78 44.33 0.0 100.00Far-western Terai 28.05 14.32 57.02 0.61 100.00Kathmandu Valley 0.87 9.59 24.12 65.42 100.00NAPA Combined Vulnerability IndexVery High 52.41 27.05 11.09 9.45 100.00High 28.40 46.81 22.27 2.53 100.00Moderate 5.57 32.49 61.40 0.54 100.00Low 12.61 21.86 53.74 11.80 100.00Very Low 0.77 30.64 43.37 25.23 100.00
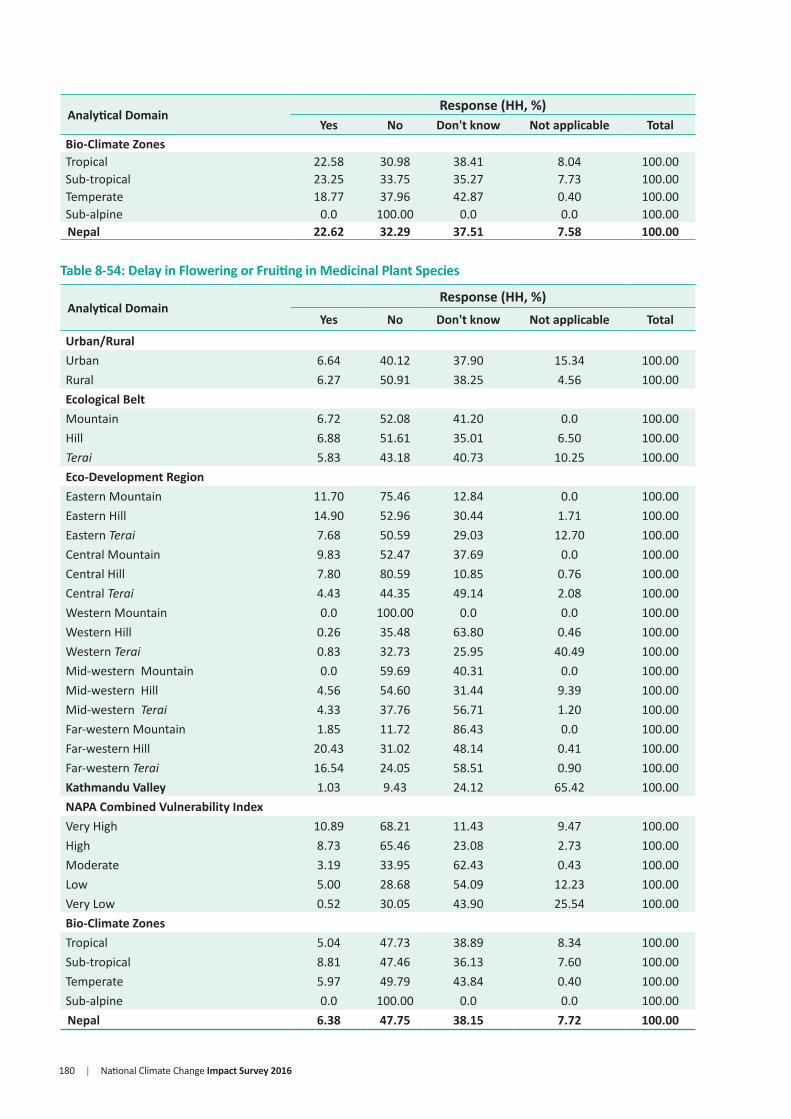
180 | National Climate Change Impact Survey 2016
Analytical DomainResponse (HH, %)
Yes No Don't know Not applicable TotalBio-Climate ZonesTropical 22.58 30.98 38.41 8.04 100.00Sub-tropical 23.25 33.75 35.27 7.73 100.00Temperate 18.77 37.96 42.87 0.40 100.00Sub-alpine 0.0 100.00 0.0 0.0 100.00Nepal 22.62 32.29 37.51 7.58 100.00
Table 8-54: Delay in Flowering or Fruiting in Medicinal Plant Species
Analytical DomainResponse (HH, %)
Yes No Don't know Not applicable Total
Urban/RuralUrban 6.64 40.12 37.90 15.34 100.00Rural 6.27 50.91 38.25 4.56 100.00Ecological BeltMountain 6.72 52.08 41.20 0.0 100.00Hill 6.88 51.61 35.01 6.50 100.00Terai 5.83 43.18 40.73 10.25 100.00Eco-Development RegionEastern Mountain 11.70 75.46 12.84 0.0 100.00Eastern Hill 14.90 52.96 30.44 1.71 100.00Eastern Terai 7.68 50.59 29.03 12.70 100.00Central Mountain 9.83 52.47 37.69 0.0 100.00Central Hill 7.80 80.59 10.85 0.76 100.00Central Terai 4.43 44.35 49.14 2.08 100.00Western Mountain 0.0 100.00 0.0 0.0 100.00Western Hill 0.26 35.48 63.80 0.46 100.00Western Terai 0.83 32.73 25.95 40.49 100.00Mid-western Mountain 0.0 59.69 40.31 0.0 100.00Mid-western Hill 4.56 54.60 31.44 9.39 100.00Mid-western Terai 4.33 37.76 56.71 1.20 100.00Far-western Mountain 1.85 11.72 86.43 0.0 100.00Far-western Hill 20.43 31.02 48.14 0.41 100.00Far-western Terai 16.54 24.05 58.51 0.90 100.00Kathmandu Valley 1.03 9.43 24.12 65.42 100.00NAPA Combined Vulnerability IndexVery High 10.89 68.21 11.43 9.47 100.00High 8.73 65.46 23.08 2.73 100.00Moderate 3.19 33.95 62.43 0.43 100.00Low 5.00 28.68 54.09 12.23 100.00Very Low 0.52 30.05 43.90 25.54 100.00Bio-Climate ZonesTropical 5.04 47.73 38.89 8.34 100.00Sub-tropical 8.81 47.46 36.13 7.60 100.00Temperate 5.97 49.79 43.84 0.40 100.00Sub-alpine 0.0 100.00 0.0 0.0 100.00Nepal 6.38 47.75 38.15 7.72 100.00
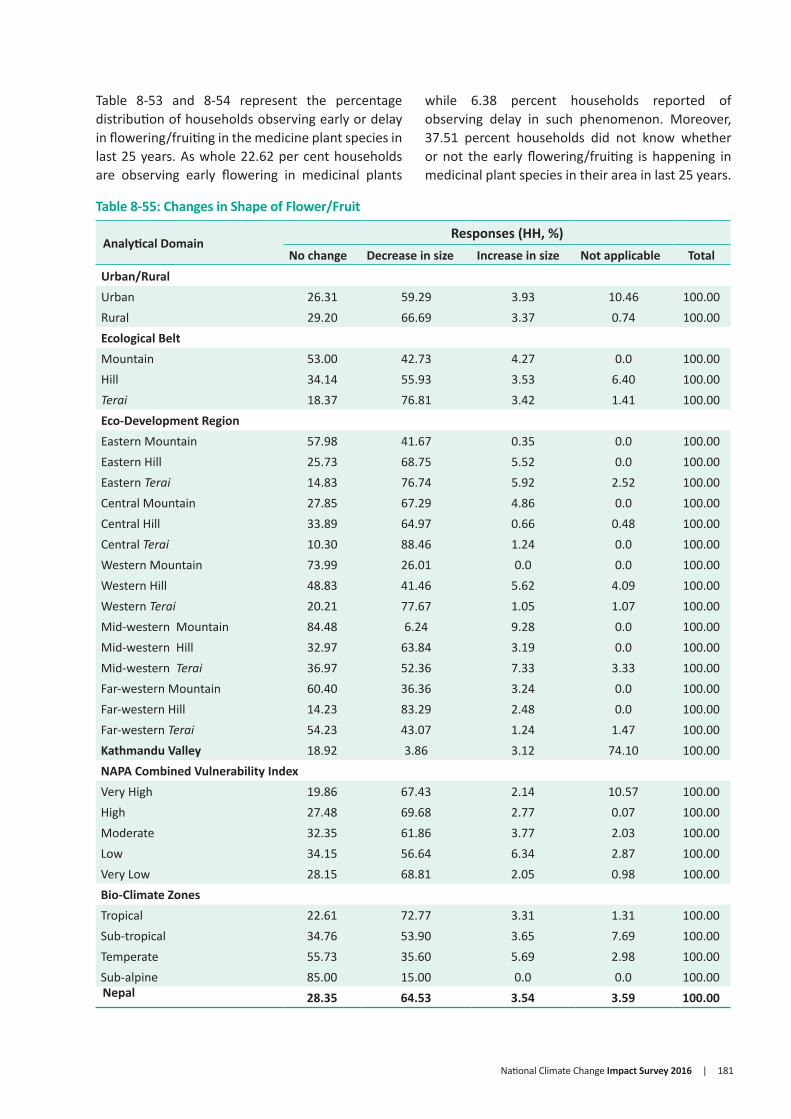
National Climate Change Impact Survey 2016 | 181
Table 8-53 and 8-54 represent the percentage distribution of households observing early or delay in flowering/fruiting in the medicine plant species in last 25 years. As whole 22.62 per cent households are observing early flowering in medicinal plants
while 6.38 percent households reported of observing delay in such phenomenon. Moreover, 37.51 percent households did not know whether or not the early flowering/fruiting is happening in medicinal plant species in their area in last 25 years.
Table 8-55: Changes in Shape of Flower/Fruit
Analytical DomainResponses (HH, %)
No change Decrease in size Increase in size Not applicable TotalUrban/RuralUrban 26.31 59.29 3.93 10.46 100.00Rural 29.20 66.69 3.37 0.74 100.00Ecological BeltMountain 53.00 42.73 4.27 0.0 100.00Hill 34.14 55.93 3.53 6.40 100.00Terai 18.37 76.81 3.42 1.41 100.00Eco-Development RegionEastern Mountain 57.98 41.67 0.35 0.0 100.00Eastern Hill 25.73 68.75 5.52 0.0 100.00Eastern Terai 14.83 76.74 5.92 2.52 100.00Central Mountain 27.85 67.29 4.86 0.0 100.00Central Hill 33.89 64.97 0.66 0.48 100.00Central Terai 10.30 88.46 1.24 0.0 100.00Western Mountain 73.99 26.01 0.0 0.0 100.00Western Hill 48.83 41.46 5.62 4.09 100.00Western Terai 20.21 77.67 1.05 1.07 100.00Mid-western Mountain 84.48 6.24 9.28 0.0 100.00Mid-western Hill 32.97 63.84 3.19 0.0 100.00Mid-western Terai 36.97 52.36 7.33 3.33 100.00Far-western Mountain 60.40 36.36 3.24 0.0 100.00Far-western Hill 14.23 83.29 2.48 0.0 100.00Far-western Terai 54.23 43.07 1.24 1.47 100.00Kathmandu Valley 18.92 3.86 3.12 74.10 100.00NAPA Combined Vulnerability IndexVery High 19.86 67.43 2.14 10.57 100.00High 27.48 69.68 2.77 0.07 100.00Moderate 32.35 61.86 3.77 2.03 100.00Low 34.15 56.64 6.34 2.87 100.00Very Low 28.15 68.81 2.05 0.98 100.00Bio-Climate ZonesTropical 22.61 72.77 3.31 1.31 100.00Sub-tropical 34.76 53.90 3.65 7.69 100.00Temperate 55.73 35.60 5.69 2.98 100.00Sub-alpine 85.00 15.00 0.0 0.0 100.00Nepal 28.35 64.53 3.54 3.59 100.00

182 | National Climate Change Impact Survey 2016
Table 8-55 depicts percentage distribution of households observing changes in shape of flower/fruit of different plant species in last 25 years. Overall data shows that higher percentages of households (64.53%) are observing decrease in size of the flowers/fruit while 28.35 per cent households
reported to no change. Similarly, higher percentage of households in high vulnerable area (69.68%) under NAPA combined vulnerability index are observing a decrease in size of fruit/flower in their area in last 25 years while 56.645 per cent households in low vulnerable area reported so.

National Climate Change Impact Survey 2016 | 183
9.1. Summary of FindingsOne fifth (20.61%) of the total respondents reported that they have touristic places in their vicinity. Ecological zone wise survey data reveals that Sub-alpine zone has maximum touristic places as 95 per cent households in the zone mentioned so.
The survey result reveals that the number of tourists in both urban and rural area is increased in most of the ecological zones and eco-developmental regions in last 25 years as about 95 per cent households reported to be so. Comparatively, eastern
CLIMATE CHANGE AND TOURISM
CHAPTER 9
9.2. Description of ResultsTable 9-1: Availability of Touristic Places
Analytical DomainResponse (HH, %)
Yes No TotalUrban/RuralUrban 36.74 63.26 100.00Rural 13.93 86.07 100.00Ecological BeltMountain 33.05 66.95 100.00Hill 24.60 75.40 100.00Terai 14.50 85.50 100.00Eco-Development RegionEastern Mountain 61.99 38.01 100.00Eastern Hill 17.08 82.92 100.00Eastern Terai 5.68 94.32 100.00Central Mountain 14.64 85.36 100.00Central Hill 13.64 86.36 100.00Central Terai 4.55 95.45 100.00Western Mountain 88.39 11.61 100.00Western Hill 37.99 62.01 100.00Western Terai 22.69 77.31 100.00Mid-western Mountain 39.33 60.67 100.00Mid-western Hill 11.83 88.17 100.00Mid-western Terai 58.89 41.11 100.00Far-western Mountain 21.69 78.31 100.00Far-western Hill 31.14 68.86 100.00Far-western Terai 37.57 62.43 100.00Kathmandu Valley 53.95 46.05 100.00NAPA Combined Vulnerability IndexVery High 17.16 82.84 100.00High 15.95 84.05 100.00Moderate 24.79 75.21 100.00
Terai (87.28%) and Sub-alpine (100%) households have observed gradual increase in number of the tourists in their area. However, some households reported to decreasing number in last 25 years though the underlying causes were not explicitly related to change on climatic variables. Similarly, almost one-third (33.29%) households have reported an increase in the length of stay of tourists in their areas. The analytical domain wise survey findings on change on the number of tourists, their stay, and reasons for such change are presented in following sub-sections.

184 | National Climate Change Impact Survey 2016
Analytical DomainResponse (HH, %)
Yes No TotalLow 24.58 75.42 100.00Very Low 21.31 78.69 100.00Bio-Climatic ZoneTropical 17.01 82.99 100.00Sub-tropical 26.41 73.59 100.00Temperate 23.96 76.04 100.00Sub-alpine 95.00 5.00 100.00Nepal 20.61 79.39 100.00
Table 9-1 presents the percentage distribution of households on availability of touristic places in their vicinity. Only 20.61 per cent of total respondents reported to have touristic places in their locality. Majority of households in mountain ecological belt (33.05%) have reported there is availability
of touristic spots in their area. Western mountain consist relatively more touristic places among eco-development regions as 88.39 per cent respondents reported so. Across climatic zones on the other hand, 95.00 per cent respondent in sub-alpine zone reported to have touristic places.
Table 9-2: Observed Changes in Number of Tourists
Analytical DomainObserved Changes (%)
Increased Decreased No change Don't know TotalUrban/RuralUrban 67.12 7.63 16.34 8.91 100.00Rural 57.84 2.18 32.89 7.09 100.00Ecological BeltMountain 64.38 0.41 32.16 3.05 100.00Hill 61.38 3.81 24.41 10.40 100.00Terai 64.22 8.87 20.89 6.03 100.00Eco-Development RegionEastern Mountain 55.92 0.0 39.09 4.99 100.00Eastern Hill 56.65 0.0 39.61 3.74 100.00Eastern Terai 87.28 0.0 12.72 0.0 100.00Central Mountain 87.23 0.0 12.77 0.0 100.00Central Hill 68.88 5.58 20.24 5.31 100.00Central Terai 8.93 67.10 18.88 5.08 100.00Western Mountain 60.13 2.49 37.37 0.0 100.00Western Hill 71.59 1.37 23.23 3.81 100.00Western Terai 76.14 0.97 20.78 2.11 100.00Mid-western Mountain 58.70 1.49 39.81 0.0 100.00Mid-western Hill 42.52 6.50 29.38 21.60 100.00Mid-western Terai 67.29 0.41 22.75 9.54 100.00Far-western Mountain 77.44 0.0 16.38 6.17 100.00Far-western Hill 28.36 2.21 48.46 20.96 100.00Far-western Terai 63.68 3.84 24.75 7.72 100.00Kathmandu Valley 54.59 11.64 4.79 28.98 100.00NAPA Combined Vulnerability IndexVery High 67.92 6.24 11.65 14.19 100.00High 36.40 17.27 34.55 11.78 100.00

National Climate Change Impact Survey 2016 | 185
Analytical DomainObserved Changes (%)
Increased Decreased No change Don't know TotalModerate 67.72 1.29 27.48 3.51 100.00Low 69.69 1.03 22.62 6.67 100.00Very Low 69.57 0.64 23.91 5.88 100.00Bio-Climatic ZoneTropical 65.92 7.17 21.42 5.49 100.00Sub-tropical 59.59 3.09 25.52 11.80 100.00Temperate 56.52 0.99 41.33 1.17 100.00Sub-alpine 100.00 0.0 0.0 0.0 100.00Nepal 62.68 5.02 24.25 8.04 100.00
Table 9-2 depicts observed changes in number of tourists in last 25 years. Majority of households (62.68 %) have observed an increase in number of tourists whereas 5.02 per cent respondents have observed a decrease in such number. Similarly, 67.12 per cent respondents in urban area have observed an increase in number of tourists in last 25 years while 57.84 per cent have observed so in rural area. Similarly, highest percentage of households in eastern Terai (87.28%) observed an increase in tourist number in last 25 years followed by central mountain (87.23%) and western hill (71.59%) while all respondents (100%) in sub-alpine climatic zone have observed such increase.
Table 9-3 depicts the households’ response on the reasons behind decrease in number of tourists in their area. The respondents have identified and ranked 10 major causes for the decline though all of those are not explicitly linked to climatic variables. inadequate marketing and strikes are the main two reasons behind decrease in number of tourists. Similarly, households have opined that earthquake has played a vital role in decline of tourists in their area. Moreover, respondents have reported some reasons such as increases in natural disasters and rise in temperature have also caused decrease in tourists which are directly related to climatic variables.
Table 9-3: Main Reason Behind Decrease in Number of Tourists
S.N. Reasons to Decrease Tourist Number1. Inadequate promotion/marketing2. Strikes
3. Inadequate sanitation and hygiene4. Earthquake5. Increase in pollution6. Inadequate infrastructure development
7. Inadequate transportation facilities8. Inadequate conservation and protection of tourists area9. Natural disasters
10. Temperature rise

186 | National Climate Change Impact Survey 2016
Table 9-4: Observed Changes in Length of Stay
Analytical DomainResponse (HH, %)
Increased Decreased No Change Don't know TotalUrban/RuralUrban 44.87 4.56 33.91 16.66 100.00Rural 20.64 0.90 65.40 13.06 100.00Ecological BeltMountain 48.54 0.07 43.50 7.90 100.00Hill 29.80 2.10 51.31 16.79 100.00Terai 33.18 5.09 47.16 14.57 100.00Eco-Development RegionEastern Mountain 52.11 0.0 41.82 6.07 100.00Eastern Hill 29.25 6.75 60.25 3.74 100.00Eastern Terai 22.87 0.0 62.96 14.17 100.00Central Mountain 71.67 0.0 3.10 25.23 100.00Central Hill 40.11 0.0 42.34 17.55 100.00Central Terai 7.19 39.45 53.35 0.0 100.00Western Mountain 60.13 2.49 37.37 0.0 100.00Western Hill 22.21 0.92 68.07 8.81 100.00Western Terai 54.71 0.97 37.11 7.21 100.00Mid-western Mountain 10.21 0.0 88.30 1.49 100.00Mid-western Hill 23.42 2.72 50.26 23.59 100.00Mid-western Terai 22.19 0.0 55.16 22.65 100.00Far-western Mountain 74.99 0.0 18.84 6.17 100.00Far-western Hill 24.72 0.0 47.00 28.28 100.00Far-western Terai 62.83 1.62 21.20 14.35 100.00Kathmandu Valley 46.50 4.49 8.94 40.07 100.00NAPA Combined Vulnerability IndexVery High 48.82 1.98 20.67 28.52 100.00High 29.38 8.80 47.57 14.25 100.00Moderate 25.98 0.61 67.23 6.18 100.00Low 29.96 2.22 51.34 16.47 100.00Very Low 40.82 1.13 46.17 11.88 100.00Bio-Climatic ZoneTropical 31.32 3.83 53.22 11.64 100.00Sub-tropical 36.40 1.99 41.60 20.02 100.00Temperate 23.52 0.16 71.84 4.48 100.00Sub-alpine 100.00 0.0 0.0 0.0 100.00Nepal 33.29 2.81 48.96 14.94 100.00
Table 9-4 presents the percentage distribution of households observed changes in the length of stay of tourists in their area. It demonstrates that 33.29 per cent respondent have observed an increase in length of stay of tourists whereas 2.81 per cent reported to have decreased. More respondent from
urban area (44.87%) have observed an increase in the time of tourists’ stay in last 25 years than those in rural areas (20.64%). Total 46.5 per cent respondents in Kathmandu Valley observed an increase whilst 4.49 per cent respondents reported to decrease.
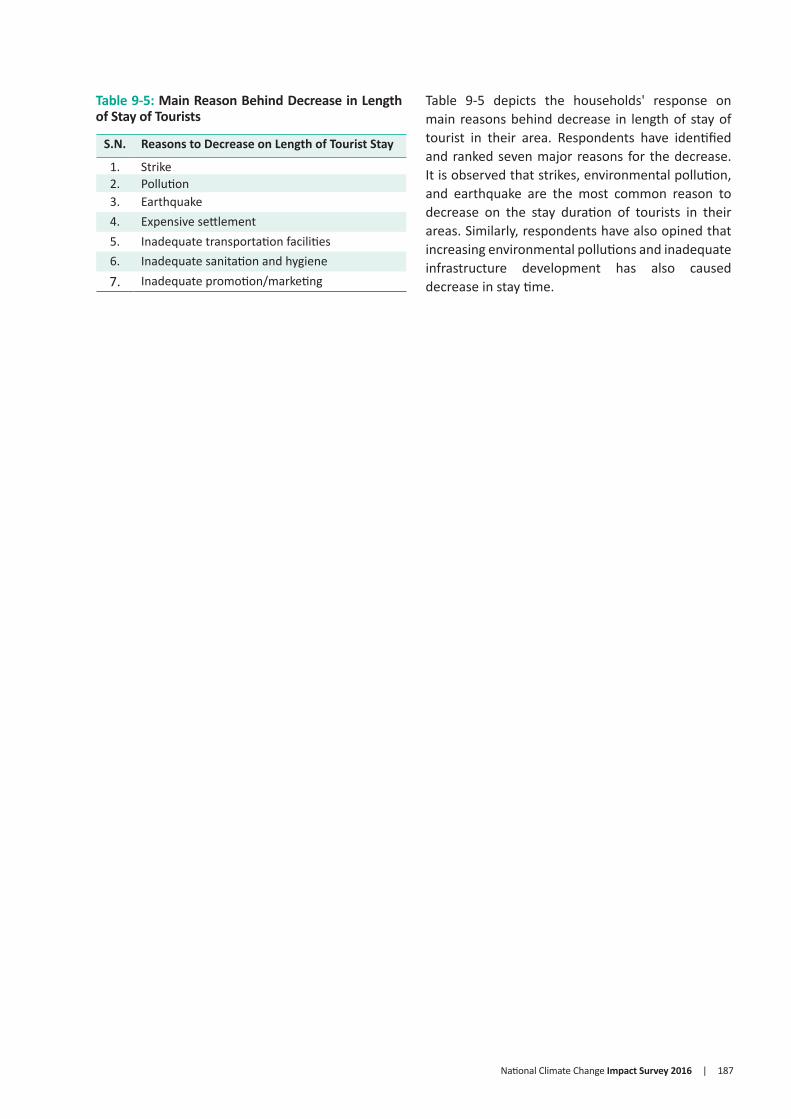
National Climate Change Impact Survey 2016 | 187
Table 9-5: Main Reason Behind Decrease in Length of Stay of Tourists
S.N. Reasons to Decrease on Length of Tourist Stay
1. Strike2. Pollution3. Earthquake 4. Expensive settlement5. Inadequate transportation facilities6. Inadequate sanitation and hygiene7. Inadequate promotion/marketing
Table 9-5 depicts the households' response on main reasons behind decrease in length of stay of tourist in their area. Respondents have identified and ranked seven major reasons for the decrease. It is observed that strikes, environmental pollution, and earthquake are the most common reason to decrease on the stay duration of tourists in their areas. Similarly, respondents have also opined that increasing environmental pollutions and inadequate infrastructure development has also caused decrease in stay time.

188 | National Climate Change Impact Survey 2016
10.1. Summary of FindingsThe survey result reveals that households are adopting different adaptation measures to minimize climate change impacts. The survey
ADAPTATION MEASURES
CHAPTER 10
Figure 10-2: Adaptation Measures (off-farm) Adopted in last 25 years
Flood/landslide/water management
Involve on community based NRM
has identified total 22 farm-based and 7 off-farm based adaptation measures based on expert consultation.
Not - applicableNoYes
Road/infrastructure improvement
Figure 10-1: Adaptation Measures (Farm Based) Adopted in Last 25 Years
Agriculture skills training
Raise improved breed of livestock
Investment on pond
Improved seed
Switch to another livestock
Livestock insurance
Agriculture insurance
Raise livestock only
Both livestock and crop farming
Start agro-forestry
mixed cropping
Use of tunnel for vegetable farming
Use of cold storage
Start seed bank
Start
time
10 20 30 40 50 60 70 80 90 100
10 20 30 40 50 60 70 80 90 100
Adap
tatio
n m
easu
res
Adap
tatio
n m
easu
res
Response (%)
Response (%)
Not applicableNo
Yes
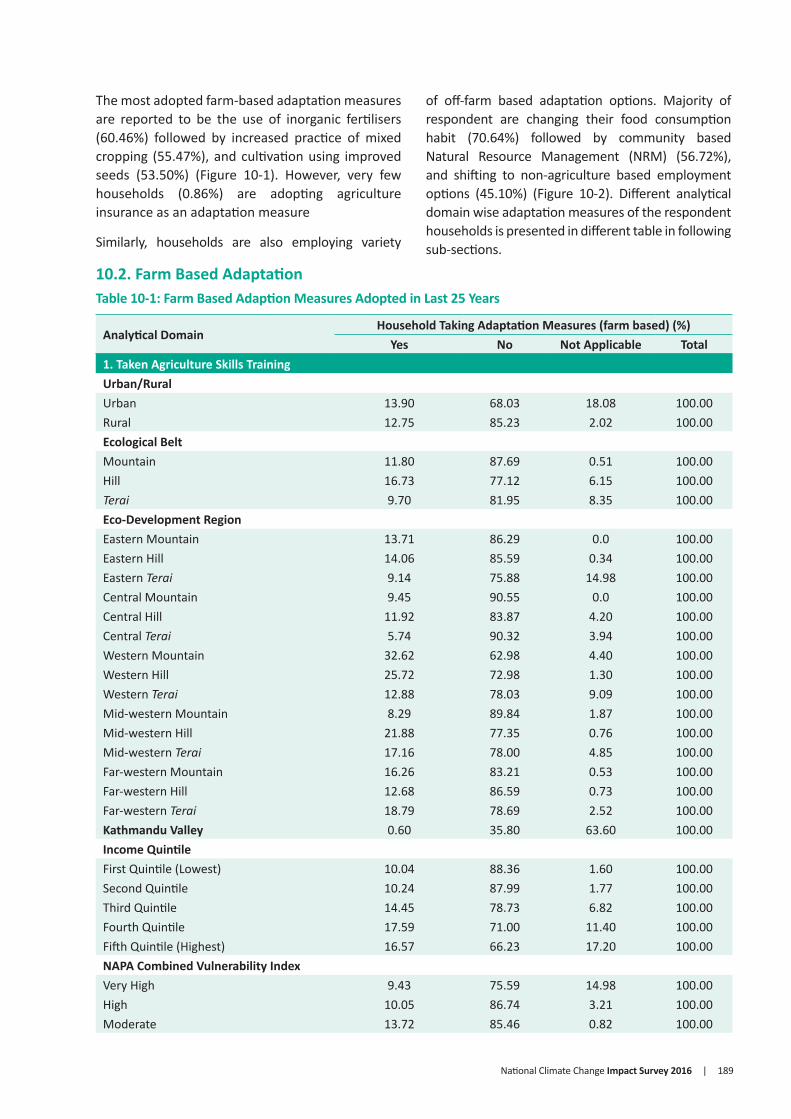
National Climate Change Impact Survey 2016 | 189
The most adopted farm-based adaptation measures are reported to be the use of inorganic fertilisers (60.46%) followed by increased practice of mixed cropping (55.47%), and cultivation using improved seeds (53.50%) (Figure 10-1). However, very few households (0.86%) are adopting agriculture insurance as an adaptation measure
Similarly, households are also employing variety
of off-farm based adaptation options. Majority of respondent are changing their food consumption habit (70.64%) followed by community based Natural Resource Management (NRM) (56.72%), and shifting to non-agriculture based employment options (45.10%) (Figure 10-2). Different analytical domain wise adaptation measures of the respondent households is presented in different table in following sub-sections.
Analytical DomainHousehold Taking Adaptation Measures (farm based) (%)
Yes No Not Applicable Total1. Taken Agriculture Skills TrainingUrban/RuralUrban 13.90 68.03 18.08 100.00Rural 12.75 85.23 2.02 100.00Ecological BeltMountain 11.80 87.69 0.51 100.00Hill 16.73 77.12 6.15 100.00Terai 9.70 81.95 8.35 100.00Eco-Development RegionEastern Mountain 13.71 86.29 0.0 100.00Eastern Hill 14.06 85.59 0.34 100.00Eastern Terai 9.14 75.88 14.98 100.00Central Mountain 9.45 90.55 0.0 100.00Central Hill 11.92 83.87 4.20 100.00Central Terai 5.74 90.32 3.94 100.00Western Mountain 32.62 62.98 4.40 100.00Western Hill 25.72 72.98 1.30 100.00Western Terai 12.88 78.03 9.09 100.00Mid-western Mountain 8.29 89.84 1.87 100.00Mid-western Hill 21.88 77.35 0.76 100.00Mid-western Terai 17.16 78.00 4.85 100.00Far-western Mountain 16.26 83.21 0.53 100.00Far-western Hill 12.68 86.59 0.73 100.00Far-western Terai 18.79 78.69 2.52 100.00Kathmandu Valley 0.60 35.80 63.60 100.00Income QuintileFirst Quintile (Lowest) 10.04 88.36 1.60 100.00Second Quintile 10.24 87.99 1.77 100.00Third Quintile 14.45 78.73 6.82 100.00Fourth Quintile 17.59 71.00 11.40 100.00Fifth Quintile (Highest) 16.57 66.23 17.20 100.00NAPA Combined Vulnerability IndexVery High 9.43 75.59 14.98 100.00High 10.05 86.74 3.21 100.00Moderate 13.72 85.46 0.82 100.00
10.2. Farm Based Adaptation Table 10-1: Farm Based Adaption Measures Adopted in Last 25 Years
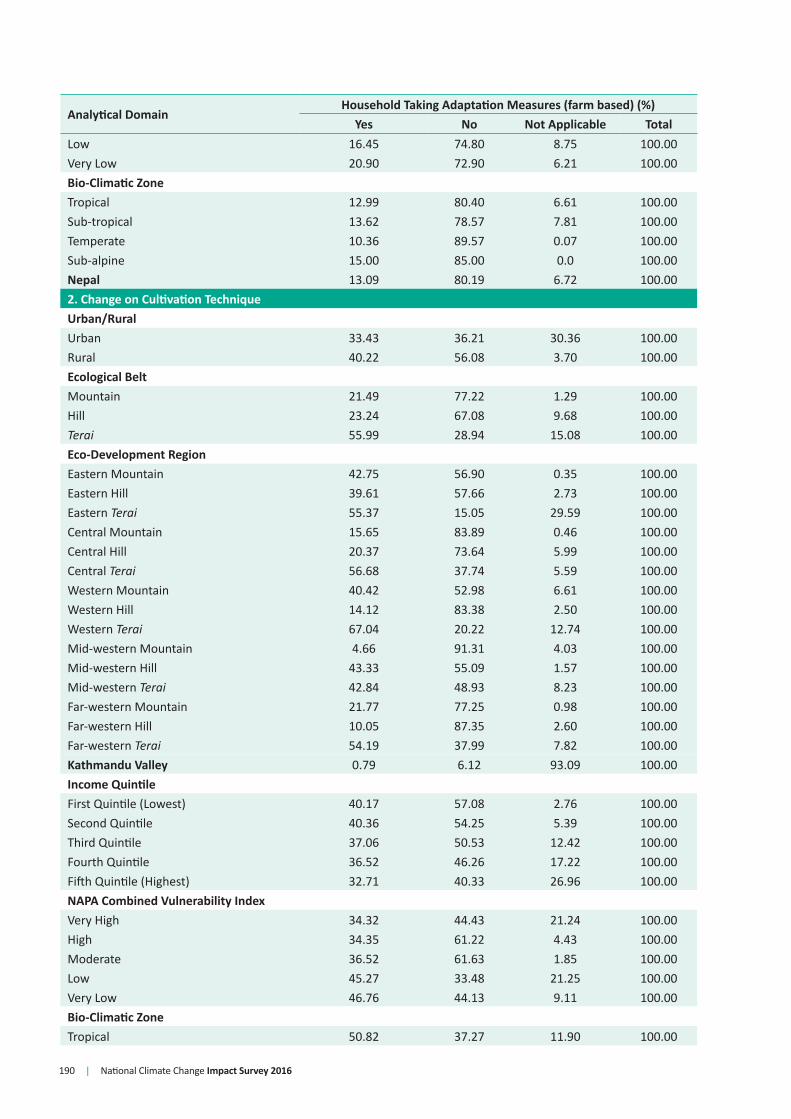
190 | National Climate Change Impact Survey 2016
Analytical DomainHousehold Taking Adaptation Measures (farm based) (%)
Yes No Not Applicable TotalLow 16.45 74.80 8.75 100.00Very Low 20.90 72.90 6.21 100.00Bio-Climatic ZoneTropical 12.99 80.40 6.61 100.00Sub-tropical 13.62 78.57 7.81 100.00Temperate 10.36 89.57 0.07 100.00Sub-alpine 15.00 85.00 0.0 100.00Nepal 13.09 80.19 6.72 100.002. Change on Cultivation TechniqueUrban/RuralUrban 33.43 36.21 30.36 100.00Rural 40.22 56.08 3.70 100.00Ecological BeltMountain 21.49 77.22 1.29 100.00Hill 23.24 67.08 9.68 100.00Terai 55.99 28.94 15.08 100.00Eco-Development RegionEastern Mountain 42.75 56.90 0.35 100.00Eastern Hill 39.61 57.66 2.73 100.00Eastern Terai 55.37 15.05 29.59 100.00Central Mountain 15.65 83.89 0.46 100.00Central Hill 20.37 73.64 5.99 100.00Central Terai 56.68 37.74 5.59 100.00Western Mountain 40.42 52.98 6.61 100.00Western Hill 14.12 83.38 2.50 100.00Western Terai 67.04 20.22 12.74 100.00Mid-western Mountain 4.66 91.31 4.03 100.00Mid-western Hill 43.33 55.09 1.57 100.00Mid-western Terai 42.84 48.93 8.23 100.00Far-western Mountain 21.77 77.25 0.98 100.00Far-western Hill 10.05 87.35 2.60 100.00Far-western Terai 54.19 37.99 7.82 100.00Kathmandu Valley 0.79 6.12 93.09 100.00Income QuintileFirst Quintile (Lowest) 40.17 57.08 2.76 100.00Second Quintile 40.36 54.25 5.39 100.00Third Quintile 37.06 50.53 12.42 100.00Fourth Quintile 36.52 46.26 17.22 100.00Fifth Quintile (Highest) 32.71 40.33 26.96 100.00NAPA Combined Vulnerability IndexVery High 34.32 44.43 21.24 100.00High 34.35 61.22 4.43 100.00Moderate 36.52 61.63 1.85 100.00Low 45.27 33.48 21.25 100.00Very Low 46.76 44.13 9.11 100.00Bio-Climatic ZoneTropical 50.82 37.27 11.90 100.00
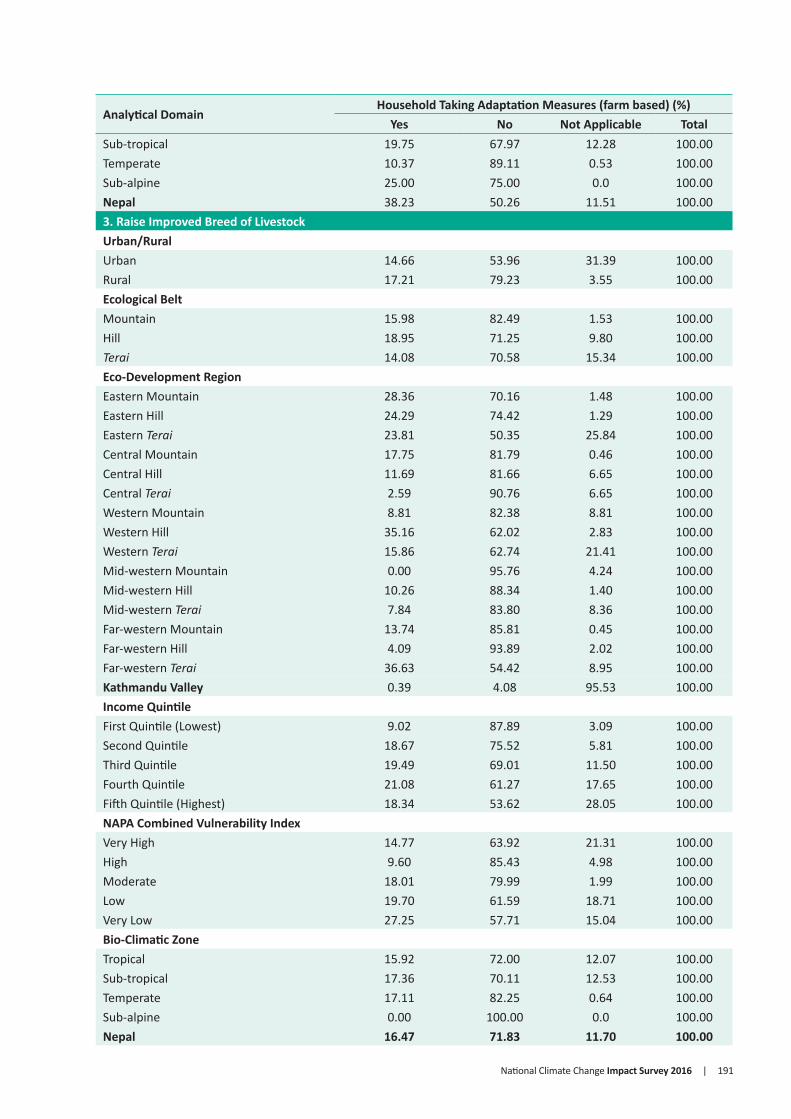
National Climate Change Impact Survey 2016 | 191
Analytical DomainHousehold Taking Adaptation Measures (farm based) (%)
Yes No Not Applicable TotalSub-tropical 19.75 67.97 12.28 100.00Temperate 10.37 89.11 0.53 100.00Sub-alpine 25.00 75.00 0.0 100.00Nepal 38.23 50.26 11.51 100.003. Raise Improved Breed of LivestockUrban/RuralUrban 14.66 53.96 31.39 100.00Rural 17.21 79.23 3.55 100.00Ecological BeltMountain 15.98 82.49 1.53 100.00Hill 18.95 71.25 9.80 100.00Terai 14.08 70.58 15.34 100.00Eco-Development RegionEastern Mountain 28.36 70.16 1.48 100.00Eastern Hill 24.29 74.42 1.29 100.00Eastern Terai 23.81 50.35 25.84 100.00Central Mountain 17.75 81.79 0.46 100.00Central Hill 11.69 81.66 6.65 100.00Central Terai 2.59 90.76 6.65 100.00Western Mountain 8.81 82.38 8.81 100.00Western Hill 35.16 62.02 2.83 100.00Western Terai 15.86 62.74 21.41 100.00Mid-western Mountain 0.00 95.76 4.24 100.00Mid-western Hill 10.26 88.34 1.40 100.00Mid-western Terai 7.84 83.80 8.36 100.00Far-western Mountain 13.74 85.81 0.45 100.00Far-western Hill 4.09 93.89 2.02 100.00Far-western Terai 36.63 54.42 8.95 100.00Kathmandu Valley 0.39 4.08 95.53 100.00Income QuintileFirst Quintile (Lowest) 9.02 87.89 3.09 100.00Second Quintile 18.67 75.52 5.81 100.00Third Quintile 19.49 69.01 11.50 100.00Fourth Quintile 21.08 61.27 17.65 100.00Fifth Quintile (Highest) 18.34 53.62 28.05 100.00NAPA Combined Vulnerability IndexVery High 14.77 63.92 21.31 100.00High 9.60 85.43 4.98 100.00Moderate 18.01 79.99 1.99 100.00Low 19.70 61.59 18.71 100.00Very Low 27.25 57.71 15.04 100.00Bio-Climatic ZoneTropical 15.92 72.00 12.07 100.00Sub-tropical 17.36 70.11 12.53 100.00Temperate 17.11 82.25 0.64 100.00Sub-alpine 0.00 100.00 0.0 100.00Nepal 16.47 71.83 11.70 100.00

192 | National Climate Change Impact Survey 2016
Analytical DomainHousehold Taking Adaptation Measures (farm based) (%)
Yes No Not Applicable Total4. Supplemental Irrigation ManagementUrban/RuralUrban 20.94 47.83 31.24 100.00Rural 30.42 65.15 4.43 100.00Ecological BeltMountain 17.20 77.67 5.13 100.00Hill 10.47 79.83 9.70 100.00Terai 46.49 37.45 16.06 100.00Eco-Development RegionEastern Mountain 28.29 69.73 1.98 100.00Eastern Hill 22.16 76.82 1.02 100.00Eastern Terai 32.04 38.43 29.54 100.00Central Mountain 13.35 86.20 0.46 100.00Central Hill 6.11 87.55 6.35 100.00Central Terai 62.04 30.84 7.12 100.00Western Mountain 11.19 80.00 8.81 100.00Western Hill 11.14 86.08 2.78 100.00Western Terai 56.08 31.78 12.14 100.00Mid-western Mountain 22.28 72.62 5.10 100.00Mid-western Hill 10.86 87.40 1.74 100.00Mid-western Terai 23.76 65.80 10.45 100.00Far-western Mountain 5.55 76.84 17.62 100.00Far-western Hill 4.00 93.98 2.02 100.00Far-western Terai 49.17 38.49 12.34 100.00Kathmandu Valley 0.00 4.44 95.56 100.00Income QuintileFirst Quintile (Lowest) 34.36 61.68 3.96 100.00Second Quintile 27.18 66.78 6.04 100.00Third Quintile 29.03 58.47 12.50 100.00Fourth Quintile 26.12 56.21 17.68 100.00Fifth Quintile (Highest) 22.10 50.39 27.51 100.00NAPA Combined Vulnerability IndexVery High 16.90 60.46 22.64 100.00High 17.05 78.04 4.91 100.00Moderate 43.67 52.72 3.61 100.00Low 29.34 49.68 20.98 100.00Very Low 35.89 55.38 8.74 100.00Climatic ZoneTropical 39.29 48.04 12.67 100.00Sub-tropical 9.58 77.63 12.79 100.00Temperate 9.17 87.52 3.31 100.00Sub-alpine 20.00 80.00 0.0 100.00Nepal 27.64 60.08 12.28 100.005. Investment on PondUrban/RuralUrban 2.14 67.56 30.30 100.00Rural 3.10 91.69 5.21 100.00
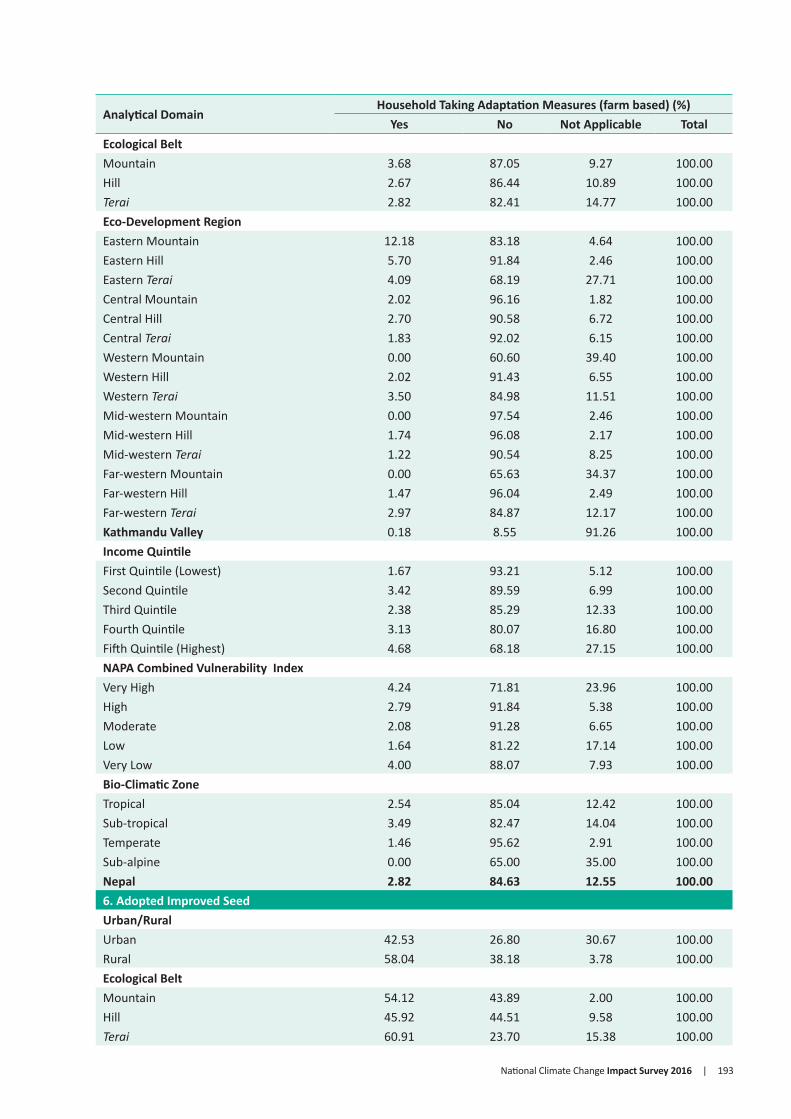
National Climate Change Impact Survey 2016 | 193
Analytical DomainHousehold Taking Adaptation Measures (farm based) (%)
Yes No Not Applicable TotalEcological BeltMountain 3.68 87.05 9.27 100.00Hill 2.67 86.44 10.89 100.00Terai 2.82 82.41 14.77 100.00Eco-Development RegionEastern Mountain 12.18 83.18 4.64 100.00Eastern Hill 5.70 91.84 2.46 100.00Eastern Terai 4.09 68.19 27.71 100.00Central Mountain 2.02 96.16 1.82 100.00Central Hill 2.70 90.58 6.72 100.00Central Terai 1.83 92.02 6.15 100.00Western Mountain 0.00 60.60 39.40 100.00Western Hill 2.02 91.43 6.55 100.00Western Terai 3.50 84.98 11.51 100.00Mid-western Mountain 0.00 97.54 2.46 100.00Mid-western Hill 1.74 96.08 2.17 100.00Mid-western Terai 1.22 90.54 8.25 100.00Far-western Mountain 0.00 65.63 34.37 100.00Far-western Hill 1.47 96.04 2.49 100.00Far-western Terai 2.97 84.87 12.17 100.00Kathmandu Valley 0.18 8.55 91.26 100.00Income QuintileFirst Quintile (Lowest) 1.67 93.21 5.12 100.00Second Quintile 3.42 89.59 6.99 100.00Third Quintile 2.38 85.29 12.33 100.00Fourth Quintile 3.13 80.07 16.80 100.00Fifth Quintile (Highest) 4.68 68.18 27.15 100.00NAPA Combined Vulnerability IndexVery High 4.24 71.81 23.96 100.00High 2.79 91.84 5.38 100.00Moderate 2.08 91.28 6.65 100.00Low 1.64 81.22 17.14 100.00Very Low 4.00 88.07 7.93 100.00Bio-Climatic ZoneTropical 2.54 85.04 12.42 100.00Sub-tropical 3.49 82.47 14.04 100.00Temperate 1.46 95.62 2.91 100.00Sub-alpine 0.00 65.00 35.00 100.00Nepal 2.82 84.63 12.55 100.006. Adopted Improved SeedUrban/RuralUrban 42.53 26.80 30.67 100.00Rural 58.04 38.18 3.78 100.00Ecological BeltMountain 54.12 43.89 2.00 100.00Hill 45.92 44.51 9.58 100.00Terai 60.91 23.70 15.38 100.00
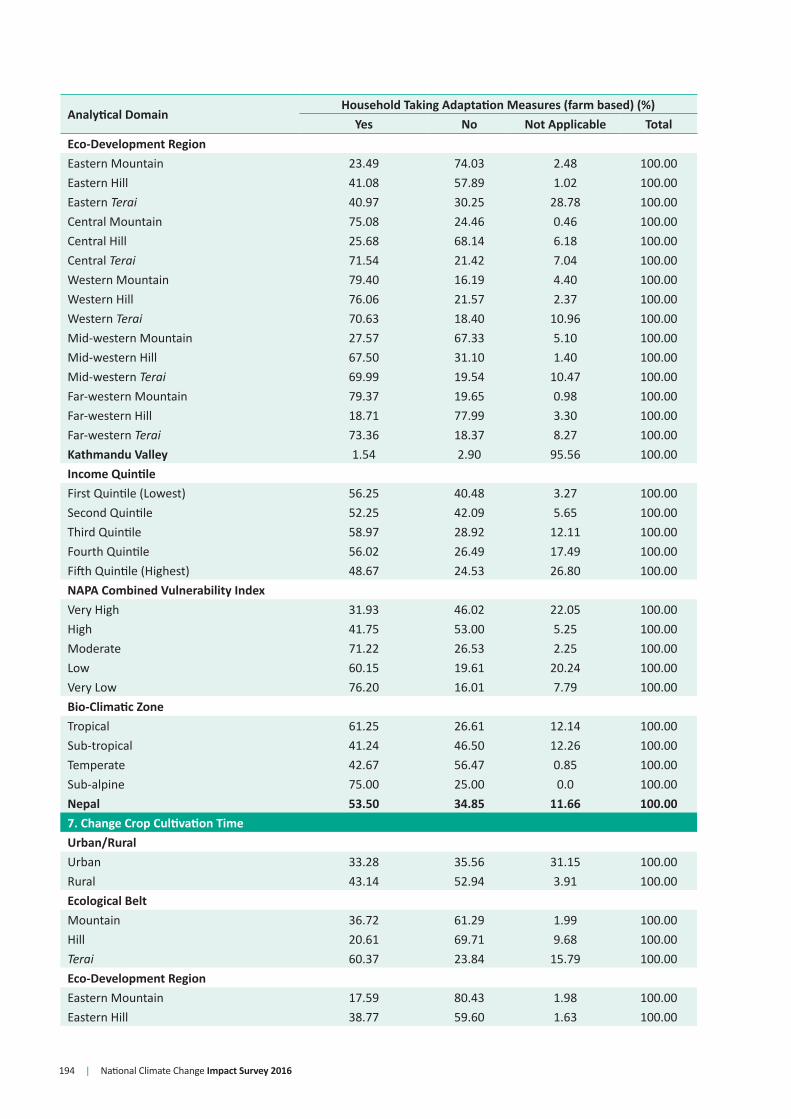
194 | National Climate Change Impact Survey 2016
Analytical DomainHousehold Taking Adaptation Measures (farm based) (%)
Yes No Not Applicable TotalEco-Development RegionEastern Mountain 23.49 74.03 2.48 100.00Eastern Hill 41.08 57.89 1.02 100.00Eastern Terai 40.97 30.25 28.78 100.00Central Mountain 75.08 24.46 0.46 100.00Central Hill 25.68 68.14 6.18 100.00Central Terai 71.54 21.42 7.04 100.00Western Mountain 79.40 16.19 4.40 100.00Western Hill 76.06 21.57 2.37 100.00Western Terai 70.63 18.40 10.96 100.00Mid-western Mountain 27.57 67.33 5.10 100.00Mid-western Hill 67.50 31.10 1.40 100.00Mid-western Terai 69.99 19.54 10.47 100.00Far-western Mountain 79.37 19.65 0.98 100.00Far-western Hill 18.71 77.99 3.30 100.00Far-western Terai 73.36 18.37 8.27 100.00Kathmandu Valley 1.54 2.90 95.56 100.00Income QuintileFirst Quintile (Lowest) 56.25 40.48 3.27 100.00Second Quintile 52.25 42.09 5.65 100.00Third Quintile 58.97 28.92 12.11 100.00Fourth Quintile 56.02 26.49 17.49 100.00Fifth Quintile (Highest) 48.67 24.53 26.80 100.00NAPA Combined Vulnerability IndexVery High 31.93 46.02 22.05 100.00High 41.75 53.00 5.25 100.00Moderate 71.22 26.53 2.25 100.00Low 60.15 19.61 20.24 100.00Very Low 76.20 16.01 7.79 100.00Bio-Climatic ZoneTropical 61.25 26.61 12.14 100.00Sub-tropical 41.24 46.50 12.26 100.00Temperate 42.67 56.47 0.85 100.00Sub-alpine 75.00 25.00 0.0 100.00Nepal 53.50 34.85 11.66 100.007. Change Crop Cultivation TimeUrban/RuralUrban 33.28 35.56 31.15 100.00Rural 43.14 52.94 3.91 100.00Ecological BeltMountain 36.72 61.29 1.99 100.00Hill 20.61 69.71 9.68 100.00Terai 60.37 23.84 15.79 100.00Eco-Development RegionEastern Mountain 17.59 80.43 1.98 100.00Eastern Hill 38.77 59.60 1.63 100.00

National Climate Change Impact Survey 2016 | 195
Analytical DomainHousehold Taking Adaptation Measures (farm based) (%)
Yes No Not Applicable TotalEastern Terai 46.01 23.81 30.18 100.00Central Mountain 41.53 58.01 0.46 100.00Central Hill 16.10 77.73 6.17 100.00Central Terai 80.61 12.35 7.04 100.00Western Mountain 19.40 73.99 6.61 100.00Western Hill 13.39 84.14 2.47 100.00Western Terai 44.20 45.65 10.16 100.00Mid-western Mountain 4.50 90.40 5.10 100.00Mid-western Hill 35.92 62.68 1.40 100.00Mid-western Terai 42.50 47.04 10.47 100.00Far-western Mountain 85.49 13.07 1.44 100.00Far-western Hill 8.04 89.18 2.78 100.00Far-western Terai 77.37 13.95 8.68 100.00Kathmandu Valley 1.36 3.08 95.56 100.00Income QuintileFirst Quintile (Lowest) 51.59 45.34 3.07 100.00Second Quintile 42.54 51.49 5.97 100.00Third Quintile 36.42 50.92 12.66 100.00Fourth Quintile 32.99 49.01 18.00 100.00Fifth Quintile (Highest) 27.74 45.50 26.76 100.00NAPA Combined Vulnerability IndexVery High 28.75 49.15 22.10 100.00High 33.74 61.02 5.24 100.00Moderate 51.53 46.17 2.30 100.00Low 51.13 27.42 21.45 100.00Very Low 31.51 61.10 7.39 100.00Bio-Climatic ZoneTropical 52.60 34.95 12.45 100.00Sub-tropical 21.11 66.51 12.38 100.00Temperate 20.83 78.28 0.89 100.00Sub-alpine 15.00 85.00 0.0 100.00Nepal 40.26 47.85 11.89 100.008. Increase Use of Inorganic FertiliserUrban/RuralUrban 49.74 18.06 32.20 100.00Rural 64.89 31.05 4.06 100.00Ecological BeltMountain 46.54 51.25 2.21 100.00Hill 45.55 44.75 9.70 100.00Terai 77.64 5.75 16.61 100.00Eco-Development RegionEastern Mountain 55.32 42.16 2.52 100.00Eastern Hill 60.71 37.58 1.71 100.00Eastern Terai 64.26 4.05 31.69 100.00Central Mountain 70.00 29.54 0.46 100.00Central Hill 57.38 36.30 6.32 100.00

196 | National Climate Change Impact Survey 2016
Analytical DomainHousehold Taking Adaptation Measures (farm based) (%)
Yes No Not Applicable TotalCentral Terai 90.40 2.41 7.19 100.00Western Mountain 0.00 82.80 17.20 100.00Western Hill 35.50 61.91 2.59 100.00Western Terai 74.81 13.62 11.58 100.00Mid-western Mountain 3.32 92.17 4.51 100.00Mid-western Hill 58.08 40.52 1.40 100.00Mid-western Terai 76.35 12.83 10.82 100.00Far-western Mountain 38.19 59.82 1.99 100.00Far-western Hill 14.94 82.93 2.13 100.00Far-western Terai 81.94 8.69 9.37 100.00Kathmandu Valley 2.10 2.72 95.18 100.00Income QuintileFirst Quintile (Lowest) 69.38 27.59 3.02 100.00Second Quintile 63.42 30.62 5.95 100.00Third Quintile 59.09 27.77 13.14 100.00Fourth Quintile 55.16 26.12 18.73 100.00Fifth Quintile (Highest) 48.06 24.18 27.75 100.00NAPA Combined Vulnerability IndexVery High 58.64 18.95 22.41 100.00High 60.32 34.46 5.22 100.00Moderate 61.66 35.83 2.51 100.00Low 62.08 15.44 22.48 100.00Very Low 58.46 33.25 8.28 100.00Climatic ZoneTropical 74.70 12.22 13.08 100.00Sub-tropical 40.67 46.87 12.45 100.00Temperate 20.99 78.28 0.73 100.00Sub-alpine 0.00 85.00 15.00 100.00Nepal 60.46 27.25 12.30 100.009. Increase Compost FertiliserUrban/RuralUrban 27.35 40.46 32.19 100.00Rural 47.77 48.02 4.21 100.00Ecological BeltMountain 77.97 20.32 1.72 100.00Hill 33.78 56.16 10.06 100.00Terai 43.52 39.92 16.56 100.00Eco-Development RegionEastern Mountain 56.14 42.03 1.83 100.00Eastern Hill 51.73 45.87 2.40 100.00Eastern Terai 25.30 43.03 31.67 100.00Central Mountain 97.10 2.44 0.46 100.00Central Hill 25.20 68.03 6.77 100.00Central Terai 68.90 23.91 7.19 100.00Western Mountain 14.40 73.99 11.61 100.00Western Hill 42.94 54.27 2.79 100.00

National Climate Change Impact Survey 2016 | 197
Analytical DomainHousehold Taking Adaptation Measures (farm based) (%)
Yes No Not Applicable TotalWestern Terai 38.23 50.79 10.97 100.00Mid-western Mountain 54.66 41.68 3.66 100.00Mid-western Hill 37.93 60.67 1.40 100.00Mid-western Terai 10.50 78.49 11.00 100.00Far-western Mountain 96.79 1.76 1.44 100.00Far-western Hill 7.51 89.95 2.54 100.00Far-western Terai 53.10 37.32 9.57 100.00Kathmandu Valley 0.86 3.58 95.56 100.00Income QuintileFirst Quintile (Lowest) 50.63 46.00 3.38 100.00Second Quintile 43.22 50.58 6.20 100.00Third Quintile 42.41 44.42 13.17 100.00Fourth Quintile 38.37 43.13 18.50 100.00Fifth Quintile (Highest) 29.81 42.26 27.93 100.00NAPA Combined Vulnerability IndexVery High 30.35 46.94 22.71 100.00High 36.38 58.17 5.45 100.00Moderate 63.20 34.33 2.47 100.00Low 34.97 42.49 22.54 100.00Very Low 43.25 48.75 8.01 100.00Bio-Climatic ZoneTropical 42.62 44.31 13.07 100.00Sub-tropical 37.71 49.48 12.81 100.00Temperate 61.85 37.71 0.44 100.00Sub-alpine 10.00 85.00 5.00 100.00Nepal 41.79 45.81 12.40 100.0010. Cultivation of New CropUrban/RuralUrban 17.31 51.57 31.12 100.00Rural 25.23 70.99 3.79 100.00Ecological BeltMountain 26.86 71.62 1.52 100.00Hill 17.73 72.57 9.70 100.00Terai 27.37 57.00 15.63 100.00Eco-Development RegionEastern Mountain 58.38 40.14 1.48 100.00Eastern Hill 48.97 49.67 1.37 100.00Eastern Terai 32.62 37.96 29.42 100.00Central Mountain 28.03 71.51 0.46 100.00Central Hill 9.76 83.98 6.25 100.00Central Terai 24.17 68.79 7.04 100.00Western Mountain 36.01 55.18 8.81 100.00Western Hill 13.59 83.76 2.64 100.00Western Terai 17.28 72.17 10.55 100.00Mid-western Mountain 4.80 91.54 3.66 100.00Mid-western Hill 15.64 82.96 1.40 100.00

198 | National Climate Change Impact Survey 2016
Analytical DomainHousehold Taking Adaptation Measures (farm based) (%)
Yes No Not Applicable TotalMid-western Terai 22.84 66.53 10.63 100.00Far-western Mountain 7.02 92.01 0.98 100.00Far-western Hill 5.10 92.10 2.80 100.00Far-western Terai 45.05 45.63 9.32 100.00Kathmandu Valley 0.57 3.87 95.56 100.00Income QuintileFirst Quintile (Lowest) 22.51 74.43 3.05 100.00Second Quintile 23.58 70.66 5.76 100.00Third Quintile 22.66 65.41 11.92 100.00Fourth Quintile 22.34 59.58 18.08 100.00Fifth Quintile (Highest) 18.70 53.80 27.50 100.00NAPA Combined Vulnerability IndexVery High 23.21 54.65 22.14 100.00High 21.51 73.38 5.11 100.00Moderate 21.13 76.51 2.36 100.00Low 30.09 49.06 20.85 100.00Very Low 14.19 78.07 7.74 100.00Bio-Climatic ZoneTropical 25.52 62.13 12.35 100.00Sub-tropical 19.12 68.55 12.33 100.00Temperate 16.72 82.84 0.44 100.00Sub-alpine 25.00 75.00 0.0 100.00Nepal 22.91 65.30 11.79 100.0011. Switch to Another LivestockUrban/RuralUrban 10.26 60.49 29.25 100.00Rural 10.39 86.33 3.28 100.00Ecological BeltMountain 14.24 84.03 1.74 100.00Hill 11.25 79.18 9.57 100.00Terai 8.80 77.45 13.75 100.00Eco-Development RegionEastern Mountain 41.67 56.50 1.83 100.00Eastern Hill 25.37 73.60 1.03 100.00Eastern Terai 14.46 62.38 23.15 100.00Central Mountain 6.99 92.56 0.46 100.00Central Hill 5.97 87.57 6.46 100.00Central Terai 1.61 91.85 6.54 100.00Western Mountain 6.61 84.58 8.81 100.00Western Hill 16.43 81.00 2.57 100.00Western Terai 7.39 76.18 16.43 100.00Mid-western Mountain 0.00 96.34 3.66 100.00Mid-western Hill 3.28 95.56 1.17 100.00Mid-western Terai 5.75 84.67 9.58 100.00Far-western Mountain 8.08 90.24 1.68 100.00Far-western Hill 1.23 96.80 1.97 100.00Far-western Terai 28.89 64.39 6.72 100.00Kathmandu Valley 0.00 4.76 95.24 100.00
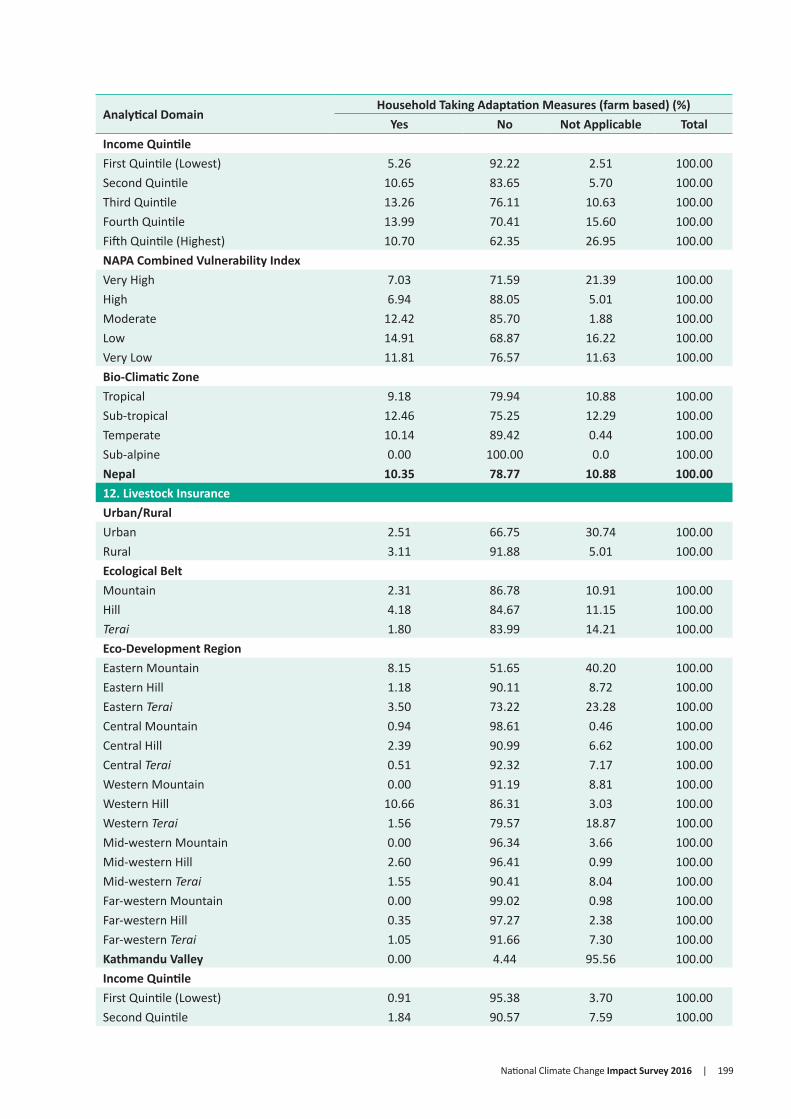
National Climate Change Impact Survey 2016 | 199
Analytical DomainHousehold Taking Adaptation Measures (farm based) (%)
Yes No Not Applicable TotalIncome QuintileFirst Quintile (Lowest) 5.26 92.22 2.51 100.00Second Quintile 10.65 83.65 5.70 100.00Third Quintile 13.26 76.11 10.63 100.00Fourth Quintile 13.99 70.41 15.60 100.00Fifth Quintile (Highest) 10.70 62.35 26.95 100.00NAPA Combined Vulnerability IndexVery High 7.03 71.59 21.39 100.00High 6.94 88.05 5.01 100.00Moderate 12.42 85.70 1.88 100.00Low 14.91 68.87 16.22 100.00Very Low 11.81 76.57 11.63 100.00Bio-Climatic ZoneTropical 9.18 79.94 10.88 100.00Sub-tropical 12.46 75.25 12.29 100.00Temperate 10.14 89.42 0.44 100.00Sub-alpine 0.00 100.00 0.0 100.00Nepal 10.35 78.77 10.88 100.0012. Livestock InsuranceUrban/RuralUrban 2.51 66.75 30.74 100.00Rural 3.11 91.88 5.01 100.00Ecological BeltMountain 2.31 86.78 10.91 100.00Hill 4.18 84.67 11.15 100.00Terai 1.80 83.99 14.21 100.00Eco-Development RegionEastern Mountain 8.15 51.65 40.20 100.00Eastern Hill 1.18 90.11 8.72 100.00Eastern Terai 3.50 73.22 23.28 100.00Central Mountain 0.94 98.61 0.46 100.00Central Hill 2.39 90.99 6.62 100.00Central Terai 0.51 92.32 7.17 100.00Western Mountain 0.00 91.19 8.81 100.00Western Hill 10.66 86.31 3.03 100.00Western Terai 1.56 79.57 18.87 100.00Mid-western Mountain 0.00 96.34 3.66 100.00Mid-western Hill 2.60 96.41 0.99 100.00Mid-western Terai 1.55 90.41 8.04 100.00Far-western Mountain 0.00 99.02 0.98 100.00Far-western Hill 0.35 97.27 2.38 100.00Far-western Terai 1.05 91.66 7.30 100.00Kathmandu Valley 0.00 4.44 95.56 100.00Income QuintileFirst Quintile (Lowest) 0.91 95.38 3.70 100.00Second Quintile 1.84 90.57 7.59 100.00

200 | National Climate Change Impact Survey 2016
Analytical DomainHousehold Taking Adaptation Measures (farm based) (%)
Yes No Not Applicable TotalThird Quintile 4.02 83.59 12.39 100.00Fourth Quintile 4.89 77.03 18.08 100.00Fifth Quintile (Highest) 3.37 68.01 28.62 100.00NAPA Combined Vulnerability IndexVery High 2.36 75.96 21.68 100.00High 1.76 89.90 8.34 100.00Moderate 3.05 91.91 5.04 100.00Low 2.26 82.00 15.74 100.00Very Low 8.66 78.08 13.26 100.00Bio-Climatic ZoneTropical 2.88 85.75 11.38 100.00Sub-tropical 3.33 81.09 15.58 100.00Temperate 0.69 94.01 5.30 100.00Sub-alpine 0.00 100.00 0.0 100.00Nepal 2.93 84.52 12.54 100.0013. Agriculture InsuranceUrban/RuralUrban 1.00 68.32 30.69 100.00Rural 0.81 93.72 5.47 100.00Ecological BeltMountain 2.20 87.19 10.62 100.00Hill 0.69 88.18 11.13 100.00Terai 0.80 84.25 14.95 100.00Eco-Development RegionEastern Mountain 8.40 51.89 39.70 100.00Eastern Hill 1.32 89.42 9.26 100.00Eastern Terai 0.91 70.98 28.11 100.00Central Mountain 0.44 99.11 0.46 100.00Central Hill 1.01 92.73 6.25 100.00Central Terai 1.04 91.67 7.29 100.00Western Mountain 0.00 91.19 8.81 100.00Western Hill 0.46 96.76 2.78 100.00Western Terai 0.33 89.83 9.84 100.00Mid-western Mountain 0.00 97.20 2.80 100.00Mid-western Hill 0.35 98.25 1.40 100.00Mid-western Terai 0.46 90.58 8.96 100.00Far-western Mountain 0.00 99.02 0.98 100.00Far-western Hill 0.00 97.62 2.38 100.00Far-western Terai 0.29 91.66 8.05 100.00Kathmandu Valley 0.00 4.44 95.56 100.00Income QuintileFirst Quintile (Lowest) 0.72 94.98 4.30 100.00Second Quintile 0.48 92.39 7.14 100.00Third Quintile 0.74 85.70 13.56 100.00Fourth Quintile 0.86 80.36 18.78 100.00Fifth Quintile (Highest) 1.35 70.75 27.90 100.00
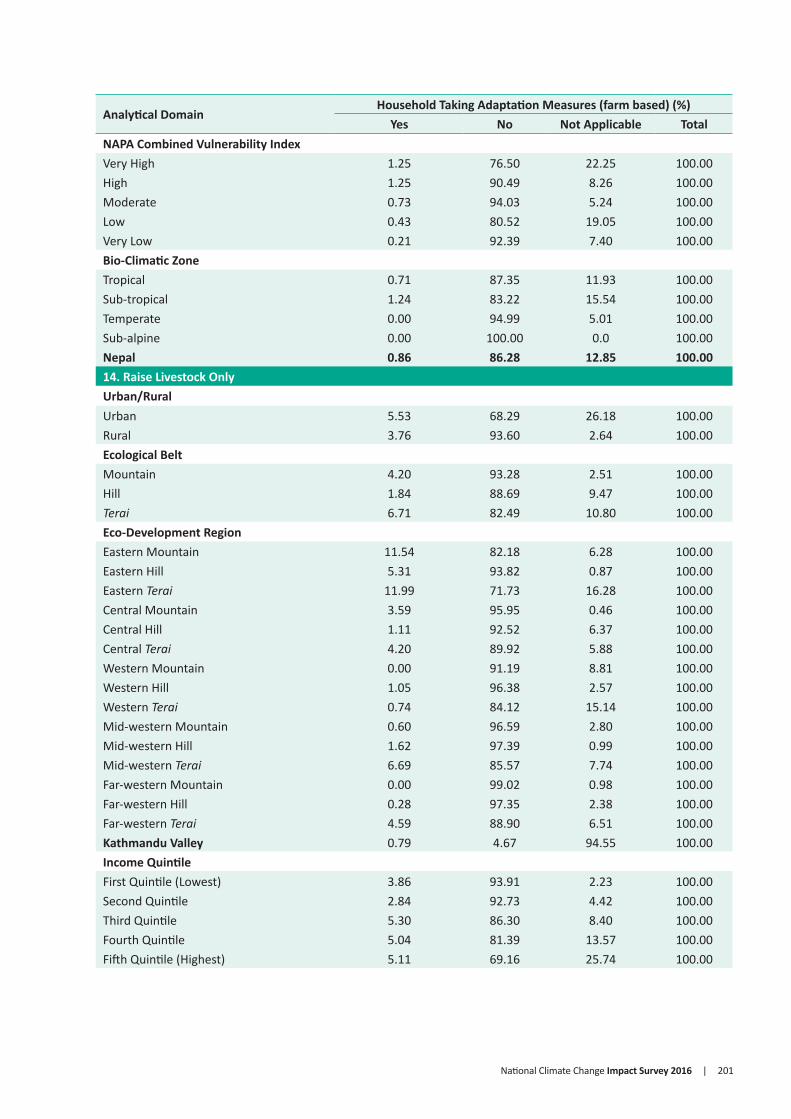
National Climate Change Impact Survey 2016 | 201
Analytical DomainHousehold Taking Adaptation Measures (farm based) (%)
Yes No Not Applicable TotalNAPA Combined Vulnerability IndexVery High 1.25 76.50 22.25 100.00High 1.25 90.49 8.26 100.00Moderate 0.73 94.03 5.24 100.00Low 0.43 80.52 19.05 100.00Very Low 0.21 92.39 7.40 100.00Bio-Climatic ZoneTropical 0.71 87.35 11.93 100.00Sub-tropical 1.24 83.22 15.54 100.00Temperate 0.00 94.99 5.01 100.00Sub-alpine 0.00 100.00 0.0 100.00Nepal 0.86 86.28 12.85 100.0014. Raise Livestock OnlyUrban/RuralUrban 5.53 68.29 26.18 100.00Rural 3.76 93.60 2.64 100.00Ecological BeltMountain 4.20 93.28 2.51 100.00Hill 1.84 88.69 9.47 100.00Terai 6.71 82.49 10.80 100.00Eco-Development RegionEastern Mountain 11.54 82.18 6.28 100.00Eastern Hill 5.31 93.82 0.87 100.00Eastern Terai 11.99 71.73 16.28 100.00Central Mountain 3.59 95.95 0.46 100.00Central Hill 1.11 92.52 6.37 100.00Central Terai 4.20 89.92 5.88 100.00Western Mountain 0.00 91.19 8.81 100.00Western Hill 1.05 96.38 2.57 100.00Western Terai 0.74 84.12 15.14 100.00Mid-western Mountain 0.60 96.59 2.80 100.00Mid-western Hill 1.62 97.39 0.99 100.00Mid-western Terai 6.69 85.57 7.74 100.00Far-western Mountain 0.00 99.02 0.98 100.00Far-western Hill 0.28 97.35 2.38 100.00Far-western Terai 4.59 88.90 6.51 100.00Kathmandu Valley 0.79 4.67 94.55 100.00Income QuintileFirst Quintile (Lowest) 3.86 93.91 2.23 100.00Second Quintile 2.84 92.73 4.42 100.00Third Quintile 5.30 86.30 8.40 100.00Fourth Quintile 5.04 81.39 13.57 100.00Fifth Quintile (Highest) 5.11 69.16 25.74 100.00
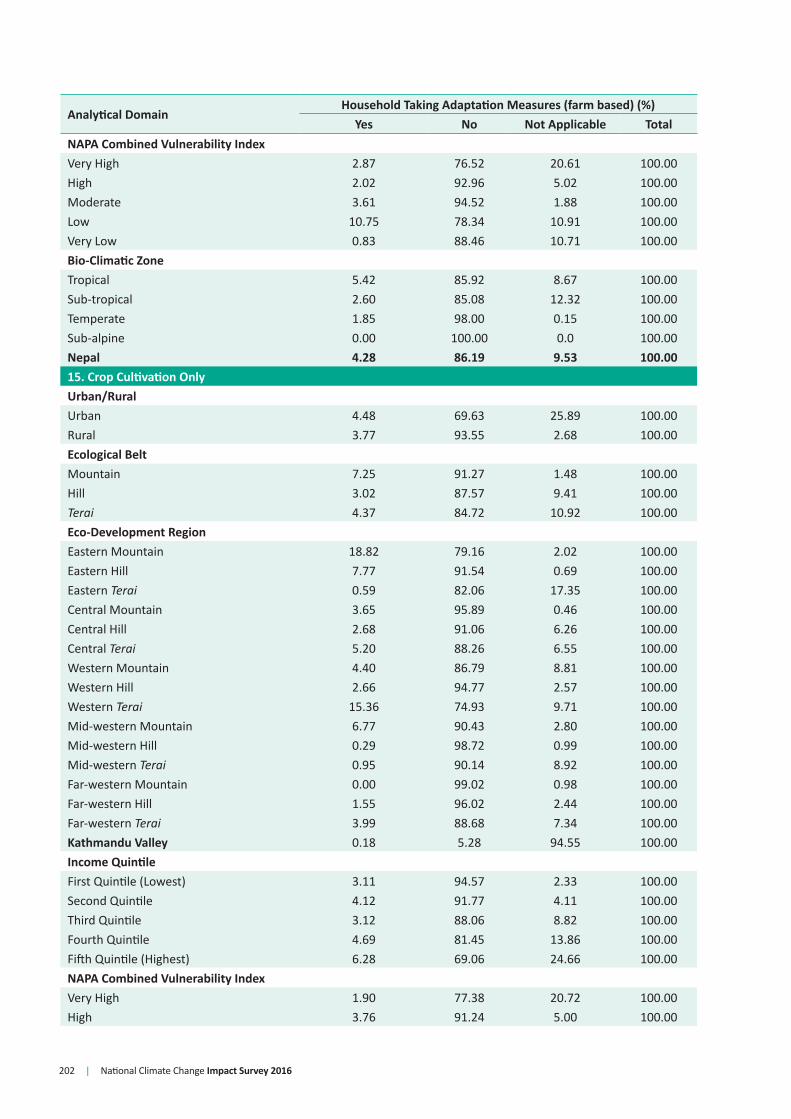
202 | National Climate Change Impact Survey 2016
Analytical DomainHousehold Taking Adaptation Measures (farm based) (%)
Yes No Not Applicable TotalNAPA Combined Vulnerability IndexVery High 2.87 76.52 20.61 100.00High 2.02 92.96 5.02 100.00Moderate 3.61 94.52 1.88 100.00Low 10.75 78.34 10.91 100.00Very Low 0.83 88.46 10.71 100.00Bio-Climatic ZoneTropical 5.42 85.92 8.67 100.00Sub-tropical 2.60 85.08 12.32 100.00Temperate 1.85 98.00 0.15 100.00Sub-alpine 0.00 100.00 0.0 100.00Nepal 4.28 86.19 9.53 100.0015. Crop Cultivation OnlyUrban/RuralUrban 4.48 69.63 25.89 100.00Rural 3.77 93.55 2.68 100.00Ecological BeltMountain 7.25 91.27 1.48 100.00Hill 3.02 87.57 9.41 100.00Terai 4.37 84.72 10.92 100.00Eco-Development RegionEastern Mountain 18.82 79.16 2.02 100.00Eastern Hill 7.77 91.54 0.69 100.00Eastern Terai 0.59 82.06 17.35 100.00Central Mountain 3.65 95.89 0.46 100.00Central Hill 2.68 91.06 6.26 100.00Central Terai 5.20 88.26 6.55 100.00Western Mountain 4.40 86.79 8.81 100.00Western Hill 2.66 94.77 2.57 100.00Western Terai 15.36 74.93 9.71 100.00Mid-western Mountain 6.77 90.43 2.80 100.00Mid-western Hill 0.29 98.72 0.99 100.00Mid-western Terai 0.95 90.14 8.92 100.00Far-western Mountain 0.00 99.02 0.98 100.00Far-western Hill 1.55 96.02 2.44 100.00Far-western Terai 3.99 88.68 7.34 100.00Kathmandu Valley 0.18 5.28 94.55 100.00Income QuintileFirst Quintile (Lowest) 3.11 94.57 2.33 100.00Second Quintile 4.12 91.77 4.11 100.00Third Quintile 3.12 88.06 8.82 100.00Fourth Quintile 4.69 81.45 13.86 100.00Fifth Quintile (Highest) 6.28 69.06 24.66 100.00NAPA Combined Vulnerability IndexVery High 1.90 77.38 20.72 100.00High 3.76 91.24 5.00 100.00
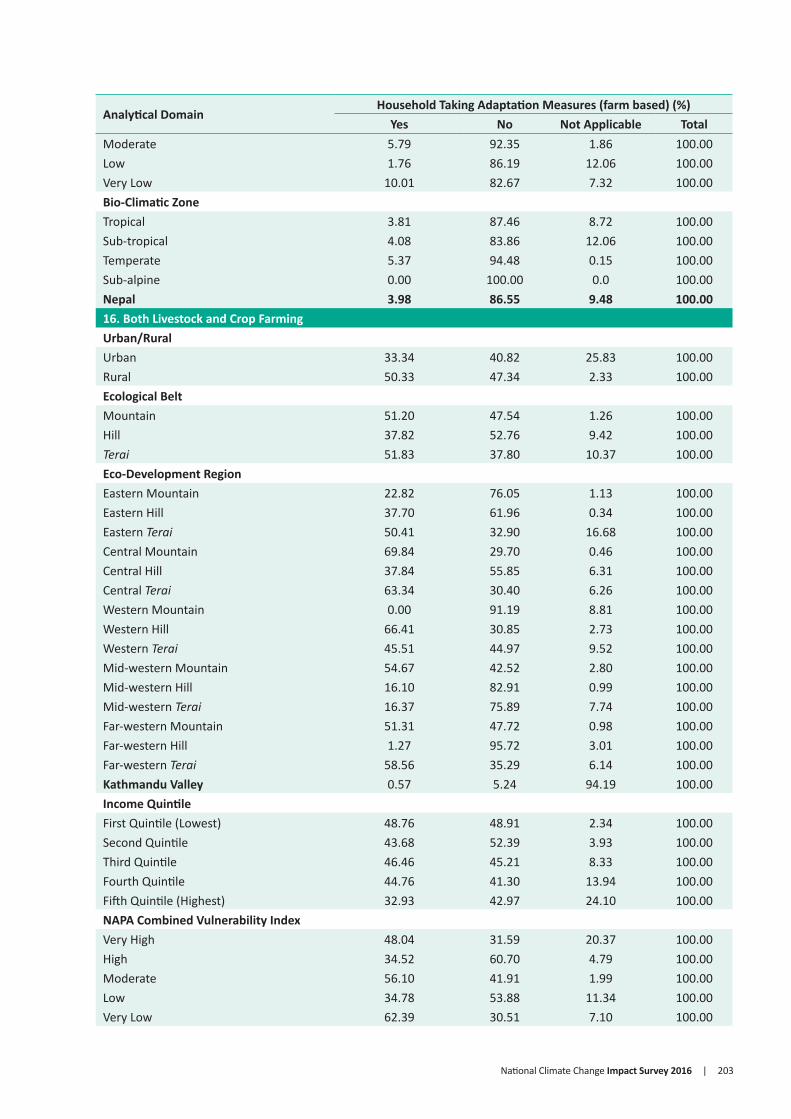
National Climate Change Impact Survey 2016 | 203
Analytical DomainHousehold Taking Adaptation Measures (farm based) (%)
Yes No Not Applicable TotalModerate 5.79 92.35 1.86 100.00Low 1.76 86.19 12.06 100.00Very Low 10.01 82.67 7.32 100.00Bio-Climatic ZoneTropical 3.81 87.46 8.72 100.00Sub-tropical 4.08 83.86 12.06 100.00Temperate 5.37 94.48 0.15 100.00Sub-alpine 0.00 100.00 0.0 100.00Nepal 3.98 86.55 9.48 100.0016. Both Livestock and Crop FarmingUrban/RuralUrban 33.34 40.82 25.83 100.00Rural 50.33 47.34 2.33 100.00Ecological BeltMountain 51.20 47.54 1.26 100.00Hill 37.82 52.76 9.42 100.00Terai 51.83 37.80 10.37 100.00Eco-Development RegionEastern Mountain 22.82 76.05 1.13 100.00Eastern Hill 37.70 61.96 0.34 100.00Eastern Terai 50.41 32.90 16.68 100.00Central Mountain 69.84 29.70 0.46 100.00Central Hill 37.84 55.85 6.31 100.00Central Terai 63.34 30.40 6.26 100.00Western Mountain 0.00 91.19 8.81 100.00Western Hill 66.41 30.85 2.73 100.00Western Terai 45.51 44.97 9.52 100.00Mid-western Mountain 54.67 42.52 2.80 100.00Mid-western Hill 16.10 82.91 0.99 100.00Mid-western Terai 16.37 75.89 7.74 100.00Far-western Mountain 51.31 47.72 0.98 100.00Far-western Hill 1.27 95.72 3.01 100.00Far-western Terai 58.56 35.29 6.14 100.00Kathmandu Valley 0.57 5.24 94.19 100.00Income QuintileFirst Quintile (Lowest) 48.76 48.91 2.34 100.00Second Quintile 43.68 52.39 3.93 100.00Third Quintile 46.46 45.21 8.33 100.00Fourth Quintile 44.76 41.30 13.94 100.00Fifth Quintile (Highest) 32.93 42.97 24.10 100.00NAPA Combined Vulnerability IndexVery High 48.04 31.59 20.37 100.00High 34.52 60.70 4.79 100.00Moderate 56.10 41.91 1.99 100.00Low 34.78 53.88 11.34 100.00Very Low 62.39 30.51 7.10 100.00

204 | National Climate Change Impact Survey 2016
Analytical DomainHousehold Taking Adaptation Measures (farm based) (%)
Yes No Not Applicable TotalBio-Climatic ZoneTropical 48.30 43.41 8.28 100.00Sub-tropical 38.66 49.27 12.07 100.00Temperate 57.05 42.80 0.15 100.00Sub-alpine 0.0 100.00 0.0 100.00Nepal 45.36 45.43 9.21 100.0017. Start Agro-ForestryUrban/RuralUrban 9.38 66.24 24.39 100.00Rural 14.95 82.80 2.25 100.00Ecological BeltMountain 22.20 76.53 1.26 100.00Hill 8.61 82.01 9.38 100.00Terai 16.47 74.16 9.37 100.00Eco-Development RegionEastern Mountain 23.61 75.26 1.13 100.00Eastern Hill 11.33 88.33 0.34 100.00Eastern Terai 30.95 54.82 14.23 100.00Central Mountain 44.25 55.29 0.46 100.00Central Hill 0.99 92.52 6.49 100.00Central Terai 12.16 81.96 5.88 100.00Western Mountain 35.18 56.01 8.81 100.00Western Hill 17.75 79.83 2.42 100.00Western Terai 3.90 87.01 9.09 100.00Mid-western Mountain 0.86 96.34 2.80 100.00Mid-western Hill 9.81 89.20 0.99 100.00Mid-western Terai 6.66 85.60 7.74 100.00Far-western Mountain 0.46 98.56 0.98 100.00Far-western Hill 1.27 96.24 2.49 100.00Far-western Terai 2.72 90.58 6.70 100.00Kathmandu Valley 0.0 5.45 94.55 100.00Income QuintileFirst Quintile (Lowest) 9.01 88.63 2.36 100.00Second Quintile 13.70 82.45 3.85 100.00Third Quintile 16.99 75.45 7.57 100.00Fourth Quintile 17.90 69.04 13.07 100.00Fifth Quintile (Highest) 11.75 65.04 23.21 100.00NAPA Combined Vulnerability IndexVery High 18.21 60.82 20.97 100.00High 10.76 84.63 4.62 100.00Moderate 11.46 86.80 1.73 100.00Low 13.87 77.09 9.03 100.00Very Low 11.42 81.96 6.62 100.00Bio-Climatic ZoneTropical 14.39 78.07 7.54 100.00Sub-tropical 11.27 76.76 11.97 100.00

National Climate Change Impact Survey 2016 | 205
Analytical DomainHousehold Taking Adaptation Measures (farm based) (%)
Yes No Not Applicable TotalTemperate 14.19 85.66 0.15 100.00Sub-alpine 55.00 45.00 0.0 100.00Nepal 13.32 77.95 8.73 100.0018. Started Mixed CroppingUrban/RuralUrban 38.81 31.36 29.83 100.00Rural 62.37 34.04 3.59 100.00Ecological BeltMountain 75.76 23.06 1.18 100.00Hill 48.64 41.97 9.39 100.00Terai 58.77 26.35 14.88 100.00Eco-Development RegionEastern Mountain 59.83 39.39 0.78 100.00Eastern Hill 59.06 40.25 0.69 100.00Eastern Terai 55.69 15.43 28.88 100.00Central Mountain 91.12 8.42 0.46 100.00Central Hill 42.37 51.40 6.23 100.00Central Terai 75.81 17.31 6.89 100.00Western Mountain 33.63 57.56 8.81 100.00Western Hill 64.35 33.42 2.23 100.00Western Terai 36.20 54.71 9.09 100.00Mid-western Mountain 60.79 36.41 2.80 100.00Mid-western Hill 35.54 63.06 1.40 100.00Mid-western Terai 31.47 60.14 8.40 100.00Far-western Mountain 84.63 14.40 0.98 100.00Far-western Hill 58.97 39.01 2.02 100.00Far-western Terai 60.18 32.27 7.54 100.00Kathmandu Valley 0.92 3.84 95.24 100.00Income QuintileFirst Quintile (Lowest) 63.00 34.32 2.68 100.00Second Quintile 60.63 33.78 5.59 100.00Third Quintile 56.22 32.17 11.61 100.00Fourth Quintile 50.34 32.07 17.59 100.00Fifth Quintile (Highest) 39.67 34.30 26.03 100.00NAPA Combined Vulnerability IndexVery High 63.25 14.82 21.93 100.00High 52.42 42.63 4.96 100.00Moderate 66.53 31.39 2.09 100.00Low 37.04 43.36 19.60 100.00Very Low 56.38 37.11 6.52 100.00Bio-Climatic ZoneTropical 53.27 34.98 11.74 100.00Sub-tropical 56.79 31.27 11.94 100.00Temperate 75.21 24.64 0.15 100.00Sub-alpine 5.00 95.00 0.0 100.00Nepal 55.47 33.25 11.27 100.00

206 | National Climate Change Impact Survey 2016
Analytical DomainHousehold Taking Adaptation Measures (farm based) (%)
Yes No Not Applicable Total19. Use of Tunnel for Vegetable FarmingUrban/RuralUrban 4.09 67.81 28.10 100.00Rural 4.38 92.42 3.20 100.00Ecological BeltMountain 6.61 91.81 1.59 100.00Hill 5.30 85.41 9.29 100.00Terai 2.89 83.89 13.22 100.00Eco-Development RegionEastern Mountain 11.33 86.88 1.79 100.00Eastern Hill 5.42 93.94 0.64 100.00Eastern Terai 0.33 75.63 24.04 100.00Central Mountain 8.37 90.72 0.91 100.00Central Hill 5.29 88.48 6.23 100.00Central Terai 4.31 88.88 6.81 100.00Western Mountain 4.40 86.79 8.81 100.00Western Hill 6.18 91.75 2.07 100.00Western Terai 1.84 88.78 9.39 100.00Mid-western Mountain 0.0 97.20 2.80 100.00Mid-western Hill 3.11 95.72 1.17 100.00Mid-western Terai 0.0 91.85 8.15 100.00Far-western Mountain 4.24 94.79 0.98 100.00Far-western Hill 11.19 86.79 2.02 100.00Far-western Terai 15.27 77.02 7.71 100.00Kathmandu Valley 0.57 4.49 94.94 100.00Income QuintileFirst Quintile (Lowest) 4.80 92.26 2.95 100.00Second Quintile 4.83 90.29 4.88 100.00Third Quintile 3.74 85.42 10.84 100.00Fourth Quintile 4.21 80.30 15.50 100.00Fifth Quintile (Highest) 3.93 70.86 25.21 100.00NAPA Combined Vulnerability IndexVery High 3.93 74.63 21.44 100.00High 5.27 89.76 4.98 100.00Moderate 5.19 92.76 2.05 100.00Low 3.05 80.68 16.27 100.00Very Low 3.09 90.21 6.70 100.00Bio-Climatic ZoneTropical 3.77 85.78 10.45 100.00Sub-tropical 5.39 82.66 11.96 100.00Temperate 3.00 96.85 0.15 100.00Sub-alpine 0.0 100.00 0.0 100.00Nepal 4.29 85.22 10.49 100.0020. Use of Cold StorageUrban/RuralUrban 4.22 67.43 28.34 100.00Rural 5.29 89.82 4.88 100.00
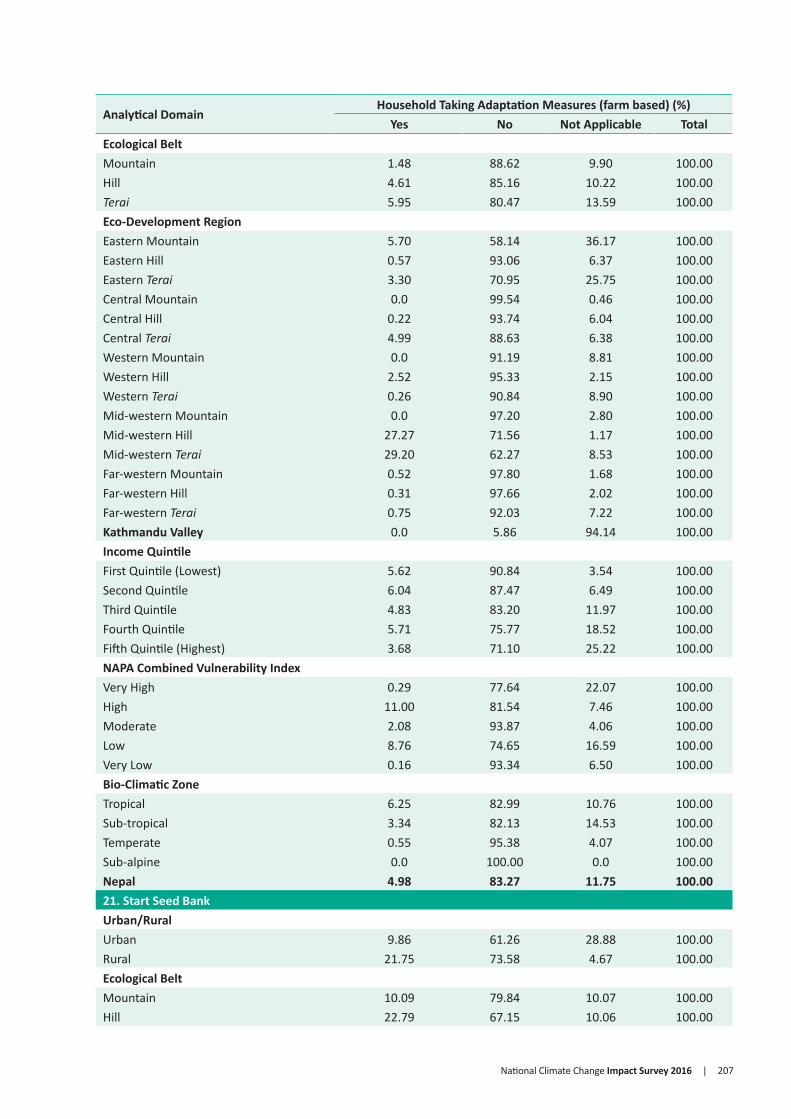
National Climate Change Impact Survey 2016 | 207
Analytical DomainHousehold Taking Adaptation Measures (farm based) (%)
Yes No Not Applicable TotalEcological BeltMountain 1.48 88.62 9.90 100.00Hill 4.61 85.16 10.22 100.00Terai 5.95 80.47 13.59 100.00Eco-Development RegionEastern Mountain 5.70 58.14 36.17 100.00Eastern Hill 0.57 93.06 6.37 100.00Eastern Terai 3.30 70.95 25.75 100.00Central Mountain 0.0 99.54 0.46 100.00Central Hill 0.22 93.74 6.04 100.00Central Terai 4.99 88.63 6.38 100.00Western Mountain 0.0 91.19 8.81 100.00Western Hill 2.52 95.33 2.15 100.00Western Terai 0.26 90.84 8.90 100.00Mid-western Mountain 0.0 97.20 2.80 100.00Mid-western Hill 27.27 71.56 1.17 100.00Mid-western Terai 29.20 62.27 8.53 100.00Far-western Mountain 0.52 97.80 1.68 100.00Far-western Hill 0.31 97.66 2.02 100.00Far-western Terai 0.75 92.03 7.22 100.00Kathmandu Valley 0.0 5.86 94.14 100.00Income QuintileFirst Quintile (Lowest) 5.62 90.84 3.54 100.00Second Quintile 6.04 87.47 6.49 100.00Third Quintile 4.83 83.20 11.97 100.00Fourth Quintile 5.71 75.77 18.52 100.00Fifth Quintile (Highest) 3.68 71.10 25.22 100.00NAPA Combined Vulnerability IndexVery High 0.29 77.64 22.07 100.00High 11.00 81.54 7.46 100.00Moderate 2.08 93.87 4.06 100.00Low 8.76 74.65 16.59 100.00Very Low 0.16 93.34 6.50 100.00Bio-Climatic ZoneTropical 6.25 82.99 10.76 100.00Sub-tropical 3.34 82.13 14.53 100.00Temperate 0.55 95.38 4.07 100.00Sub-alpine 0.0 100.00 0.0 100.00Nepal 4.98 83.27 11.75 100.0021. Start Seed BankUrban/RuralUrban 9.86 61.26 28.88 100.00Rural 21.75 73.58 4.67 100.00Ecological BeltMountain 10.09 79.84 10.07 100.00Hill 22.79 67.15 10.06 100.00

208 | National Climate Change Impact Survey 2016
Analytical DomainHousehold Taking Adaptation Measures (farm based) (%)
Yes No Not Applicable TotalTerai 15.19 71.07 13.74 100.00Eco-Development RegionEastern Mountain 2.14 60.42 37.44 100.00Eastern Hill 13.69 80.47 5.84 100.00Eastern Terai 18.39 55.64 25.97 100.00Central Mountain 1.34 98.21 0.46 100.00Central Hill 2.36 91.66 5.98 100.00Central Terai 10.39 83.10 6.51 100.00Western Mountain 0.0 91.19 8.81 100.00Western Hill 44.98 52.83 2.20 100.00Western Terai 4.66 86.44 8.90 100.00Mid-western Mountain 1.71 95.49 2.80 100.00Mid-western Hill 52.65 46.18 1.17 100.00Mid-western Terai 32.61 58.86 8.53 100.00Far-western Mountain 45.41 53.61 0.98 100.00Far-western Hill 1.60 96.79 1.61 100.00Far-western Terai 19.80 72.49 7.71 100.00Kathmandu Valley 0.0 6.54 93.46 100.00Income QuintileFirst Quintile (Lowest) 20.38 76.15 3.47 100.00Second Quintile 21.71 71.36 6.92 100.00Third Quintile 18.91 68.88 12.21 100.00Fourth Quintile 17.46 64.38 18.16 100.00Fifth Quintile (Highest) 11.33 63.53 25.14 100.00NAPA Combined Vulnerability IndexVery High 2.47 76.71 20.82 100.00High 14.48 77.80 7.72 100.00Moderate 23.80 72.46 3.74 100.00Low 31.06 50.87 18.07 100.00Very Low 24.15 69.34 6.50 100.00Bio-Climatic ZoneTropical 15.87 73.24 10.89 100.00Sub-tropical 21.67 64.01 14.33 100.00Temperate 24.68 71.25 4.07 100.00Sub-alpine 0.0 100.00 0.0 100.00Nepal 18.27 69.97 11.76 100.0022. Work on Water and Land ConservationUrban/RuralUrban 28.83 57.09 14.08 100.00Rural 37.34 60.96 1.70 100.00Ecological BeltMountain 43.07 55.97 0.96 100.00Hill 40.60 52.65 6.75 100.00Terai 27.73 67.61 4.65 100.00Eco-Development RegionEastern Mountain 16.01 83.99 0.0 100.00

National Climate Change Impact Survey 2016 | 209
Analytical DomainHousehold Taking Adaptation Measures (farm based) (%)
Yes No Not Applicable TotalEastern Hill 25.59 72.06 2.36 100.00Eastern Terai 26.88 67.23 5.89 100.00Central Mountain 64.31 34.15 1.54 100.00Central Hill 22.73 73.50 3.77 100.00Central Terai 21.08 75.16 3.76 100.00Western Mountain 89.40 10.60 0.0 100.00Western Hill 69.95 28.98 1.07 100.00Western Terai 36.22 58.57 5.20 100.00Mid-western Mountain 26.33 72.55 1.12 100.00Mid-western Hill 65.84 33.93 0.23 100.00Mid-western Terai 41.43 55.01 3.56 100.00Far-western Mountain 52.24 46.78 0.98 100.00Far-western Hill 20.79 76.88 2.33 100.00Far-western Terai 34.47 61.64 3.90 100.00Kathmandu Valley 2.27 28.39 69.34 100.00Income QuintileFirst Quintile (Lowest) 35.68 62.45 1.87 100.00Second Quintile 36.69 60.56 2.75 100.00Third Quintile 37.02 59.03 3.95 100.00Fourth Quintile 35.32 57.63 7.05 100.00Fifth Quintile (Highest) 34.23 50.62 15.15 100.00NAPA Combined Vulnerability IndexVery High 23.51 62.61 13.88 100.00High 23.94 72.59 3.47 100.00Moderate 45.21 53.62 1.18 100.00Low 39.68 56.70 3.62 100.00Very Low 53.38 43.06 3.57 100.00Bio-Climatic ZoneTropical 32.39 63.81 3.80 100.00Sub-tropical 37.66 53.62 8.72 100.00Temperate 45.87 54.13 0.0 100.00Sub-alpine 85.00 15.00 0.0 100.00
Nepal 34.85 59.83 5.32 100.00
Table 10-1 presents the percentage distribution of households adopting various adaptation measures in last 25 years. A total of 22 farm based adaption measures have been identified with the expert input and the households are surveyed whether those measures are being adopted.
The survey result shows that use of inorganic fertilisers (60.46%), increase or initiate mixed cropping (55.47%), and cultivation of improved seeds (53.5%) are the most practiced adaption measures. Similarly, agriculture insurance (0.86%), investment on pond (2.82%), and crop cultivation only (3.98%) are less adopted adaptation measures. Similarly, it
is observed that majority of households from rural area are adopting different adaptation measures compared to that of urban areas. Furthermore, use of inorganic fertilisers is the most adopted adaptation measures in both rural (64.89%) and urban (49.74%) areas. Similarly, agriculture insurance, despite being less adopted adaptation measure is being practiced slightly more in urban areas (1.00%) in comparison to rural area (0.81%).
Similarly, use of compost fertilisers (77.97%) and mixed cropping (75.76%) are found to be most adopted adaptation measure in mountain region while mixed cropping (48.64%) in hills and use

210 | National Climate Change Impact Survey 2016
of inorganic fertilisers (77.64%) in Terai regions. Moreover, investment on pond, use of cold storage, and initiation of livestock insurance is reported to be adopted as adaptation measures in all ecological belts. Comparing eco-development regions, using compost fertilisers is reported the most adopted adaptation measures in central mountain (97.10%) while use of chemical fertiliser in central Terai is 90.40 per cent. Most of the identified adaptation measures are adopting to all eco-development regions except Kathmandu Valley.
Both livestock and crop farming, use of inorganic
fertilisers and work on water and land conservation are the most reported adaptation measures adopted in very high vulnerable areas based on NAPA combined vulnerability index. Comparatively, higher percentage of households (18.21%) also reported to have initiated agro-forestry as an adaptation measure in the same area. Moreover, about 85 per cent households are involved in water and land conservation in sub-alpine zone as most adopted adaptation measure while mixed cropping is reported in both temperate (75.21%), and sub-tropical (56.79%) zones.
10.3. Off-farm Based AdaptationTable 10-2: Farm Based Adaption Measures Adopted in Last 25 Years
Analytical Domain Response (HH, %)
Yes No Not Applicable Total1. Change on Food Consumption HabitUrban/RuralUrban 76.56 22.05 1.38 100.00Rural 68.19 31.56 0.25 100.00Ecological BeltMountain 50.56 49.23 0.21 100.00Hill 73.61 25.95 0.44 100.00Terai 71.15 28.06 0.79 100.00Eco-Development RegionEastern Mountain 75.28 24.72 0.0 100.00Eastern Hill 64.78 35.22 0.0 100.00Eastern Terai 90.26 9.74 0.0 100.00Central Mountain 18.16 81.84 0.0 100.00Central Hill 62.63 36.64 0.73 100.00Central Terai 50.96 48.23 0.81 100.00Western Mountain 97.80 2.20 0.0 100.00Western Hill 86.50 13.50 0.0 100.00Western Terai 73.55 25.40 1.05 100.00Mid-western Mountain 39.41 60.03 0.56 100.00Mid-western Hill 83.77 16.23 0.00 100.00Mid-western Terai 69.71 27.32 2.97 100.00Far-western Mountain 88.65 10.82 0.53 100.00Far-western Hill 58.95 40.29 0.77 100.00Far-western Terai 85.67 13.23 1.10 100.00Kathmandu Valley 82.23 15.03 2.74 100.00Income QuintileFirst Quintile (Lowest) 65.35 34.12 0.53 100.00Second Quintile 68.46 31.12 0.42 100.00Third Quintile 70.00 29.44 0.56 100.00Fourth Quintile 74.58 24.76 0.66 100.00Fifth Quintile (Highest) 77.34 21.58 1.08 100.00NAPA Combined Vulnerability IndexVery High 68.87 30.34 0.79 100.00High 66.59 33.00 0.42 100.00Moderate 67.70 31.97 0.34 100.00

National Climate Change Impact Survey 2016 | 211
Analytical Domain Response (HH, %)
Yes No Not Applicable TotalLow 79.09 20.10 0.81 100.00Very Low 74.34 25.00 0.66 100.00Bio-Climatic ZoneTropical 72.94 26.46 0.60 100.00Sub-tropical 69.30 30.07 0.63 100.00Temperate 49.98 50.02 0.0 100.00Sub-alpine 100.00 0.0 0.0 100.00Nepal 70.64 28.77 0.58 100.002. Started Off-farm Activities Urban/RuralUrban 38.43 56.57 5.00 100.00Rural 31.77 67.91 0.32 100.00Ecological BeltMountain 25.15 74.10 0.75 100.00Hill 18.90 78.33 2.76 100.00Terai 49.90 49.31 0.79 100.00Eco-Development RegionEastern Mountain 44.69 54.65 0.67 100.00Eastern Hill 21.89 77.84 0.28 100.00Eastern Terai 45.71 54.15 0.14 100.00Central Mountain 11.19 88.81 0.0 100.00Central Hill 9.24 89.69 1.06 100.00Central Terai 67.37 32.63 0.0 100.00Western Mountain 32.20 65.60 2.20 100.00Western Hill 27.90 71.96 0.15 100.00Western Terai 45.89 53.57 0.53 100.00Mid-western Mountain 12.87 85.64 1.50 100.00Mid-western Hill 12.56 87.28 0.16 100.00Mid-western Terai 19.10 75.97 4.94 100.00Far-western Mountain 38.68 59.88 1.44 100.00Far-western Hill 14.55 84.57 0.88 100.00Far-western Terai 23.47 73.39 3.14 100.00Kathmandu Valley 30.46 36.37 33.17 100.00Income QuintileFirst Quintile (Lowest) 36.51 63.22 0.26 100.00Second Quintile 29.60 70.19 0.21 100.00Third Quintile 32.56 67.00 0.45 100.00Fourth Quintile 35.12 62.31 2.58 100.00Fifth Quintile (Highest) 38.25 55.24 6.51 100.00NAPA Combined Vulnerability IndexVery High 26.08 68.69 5.24 100.00High 23.73 75.91 0.36 100.00Moderate 50.60 49.26 0.14 100.00Low 29.24 69.08 1.68 100.00Very Low 44.34 55.23 0.44 100.00Bio-Climatic ZoneTropical 42.13 57.22 0.65 100.00Sub-tropical 21.34 74.91 3.75 100.00Temperate 15.37 84.59 0.04 100.00Sub-alpine 30.00 70.00 0.0 100.00Nepal 33.72 64.59 1.69 100.00
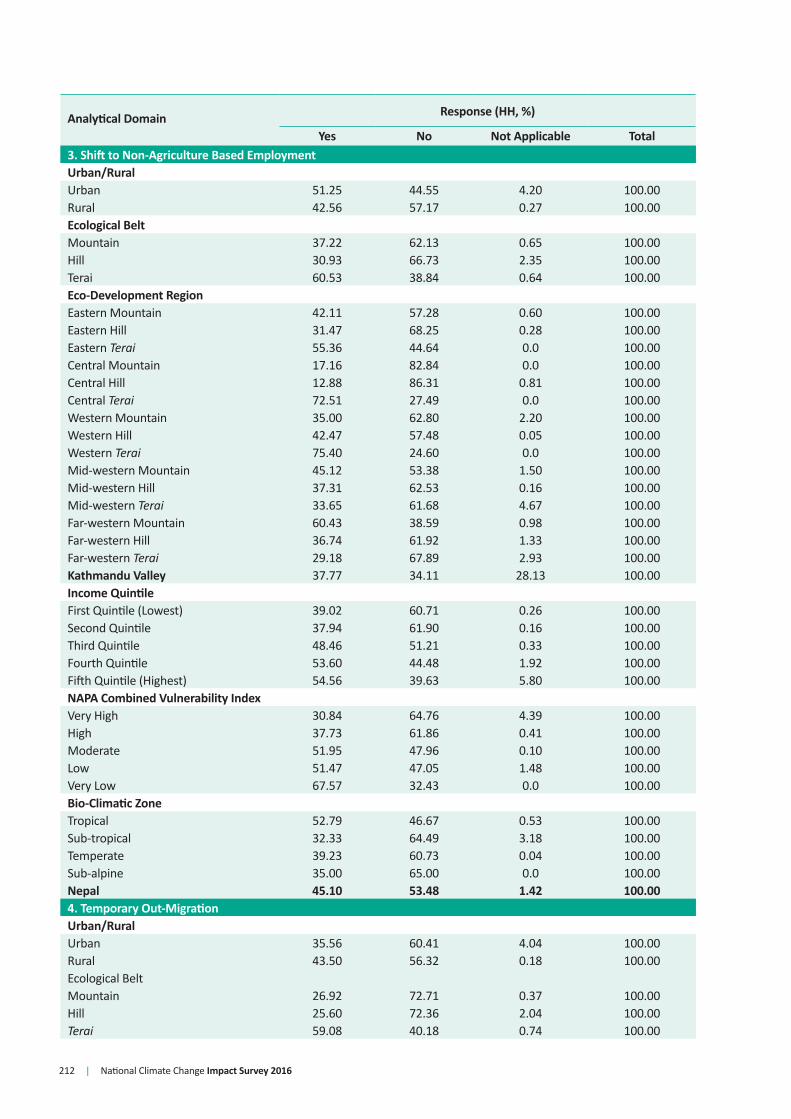
212 | National Climate Change Impact Survey 2016
Analytical Domain Response (HH, %)
Yes No Not Applicable Total3. Shift to Non-Agriculture Based EmploymentUrban/RuralUrban 51.25 44.55 4.20 100.00Rural 42.56 57.17 0.27 100.00Ecological BeltMountain 37.22 62.13 0.65 100.00Hill 30.93 66.73 2.35 100.00Terai 60.53 38.84 0.64 100.00Eco-Development RegionEastern Mountain 42.11 57.28 0.60 100.00Eastern Hill 31.47 68.25 0.28 100.00Eastern Terai 55.36 44.64 0.0 100.00Central Mountain 17.16 82.84 0.0 100.00Central Hill 12.88 86.31 0.81 100.00Central Terai 72.51 27.49 0.0 100.00Western Mountain 35.00 62.80 2.20 100.00Western Hill 42.47 57.48 0.05 100.00Western Terai 75.40 24.60 0.0 100.00Mid-western Mountain 45.12 53.38 1.50 100.00Mid-western Hill 37.31 62.53 0.16 100.00Mid-western Terai 33.65 61.68 4.67 100.00Far-western Mountain 60.43 38.59 0.98 100.00Far-western Hill 36.74 61.92 1.33 100.00Far-western Terai 29.18 67.89 2.93 100.00Kathmandu Valley 37.77 34.11 28.13 100.00Income QuintileFirst Quintile (Lowest) 39.02 60.71 0.26 100.00Second Quintile 37.94 61.90 0.16 100.00Third Quintile 48.46 51.21 0.33 100.00Fourth Quintile 53.60 44.48 1.92 100.00Fifth Quintile (Highest) 54.56 39.63 5.80 100.00NAPA Combined Vulnerability IndexVery High 30.84 64.76 4.39 100.00High 37.73 61.86 0.41 100.00Moderate 51.95 47.96 0.10 100.00Low 51.47 47.05 1.48 100.00Very Low 67.57 32.43 0.0 100.00Bio-Climatic ZoneTropical 52.79 46.67 0.53 100.00Sub-tropical 32.33 64.49 3.18 100.00Temperate 39.23 60.73 0.04 100.00Sub-alpine 35.00 65.00 0.0 100.00Nepal 45.10 53.48 1.42 100.004. Temporary Out-MigrationUrban/RuralUrban 35.56 60.41 4.04 100.00Rural 43.50 56.32 0.18 100.00Ecological BeltMountain 26.92 72.71 0.37 100.00Hill 25.60 72.36 2.04 100.00Terai 59.08 40.18 0.74 100.00

National Climate Change Impact Survey 2016 | 213
Analytical Domain Response (HH, %)
Yes No Not Applicable TotalEco-Development RegionEastern Mountain 39.06 60.94 0.0 100.00Eastern Hill 31.60 68.40 0.0 100.00Eastern Terai 50.81 48.08 1.11 100.00Central Mountain 21.67 78.33 0.0 100.00Central Hill 10.14 89.04 0.82 100.00Central Terai 81.38 18.62 0.0 100.00Western Mountain 65.60 34.40 0.0 100.00Western Hill 29.34 70.66 0.0 100.00Western Terai 50.30 49.70 0.0 100.00Mid-western Mountain 7.38 91.68 0.93 100.00Mid-western Hill 45.39 54.61 0.0 100.00Mid-western Terai 36.55 60.60 2.85 100.00Far-western Mountain 39.31 59.72 0.98 100.00Far-western Hill 26.50 73.50 0.0 100.00Far-western Terai 22.09 76.63 1.28 100.00Kathmandu Valley 16.94 56.90 26.16 100.00Income QuintileFirst Quintile (Lowest) 47.19 52.58 0.23 100.00Second Quintile 40.13 59.34 0.52 100.00Third Quintile 38.17 61.64 0.19 100.00Fourth Quintile 39.70 58.56 1.74 100.00Fifth Quintile (Highest) 39.93 54.89 5.18 100.00NAPA Combined Vulnerability IndexVery High 30.06 65.04 4.89 100.00High 42.00 57.94 0.06 100.00Moderate 53.64 46.30 0.06 100.00Low 39.65 59.54 0.80 100.00Very Low 37.20 62.80 0.0 100.00Bio-Climatic ZoneTropical 52.67 46.75 0.58 100.00Sub-tropical 24.30 72.94 2.76 100.00Temperate 15.40 84.60 0.0 100.00Sub-alpine 70.00 30.00 0.0 100.00Nepal 41.17 57.52 1.31 100.005. Involvement in Flood/Landslide/Water Management Urban/RuralUrban 33.59 61.71 4.69 100.00Rural 45.29 53.64 1.07 100.00Ecological BeltMountain 58.46 41.20 0.34 100.00Hill 43.68 53.61 2.71 100.00Terai 37.21 60.92 1.87 100.00Eco-Development RegionEastern Mountain 45.75 54.25 0.0 100.00Eastern Hill 27.22 72.78 0.0 100.00Eastern Terai 23.01 76.51 0.48 100.00Central Mountain 85.89 14.11 0.0 100.00Central Hill 22.95 76.44 0.61 100.00Central Terai 49.71 46.71 3.57 100.00Western Mountain 95.00 5.00 0.0 100.00
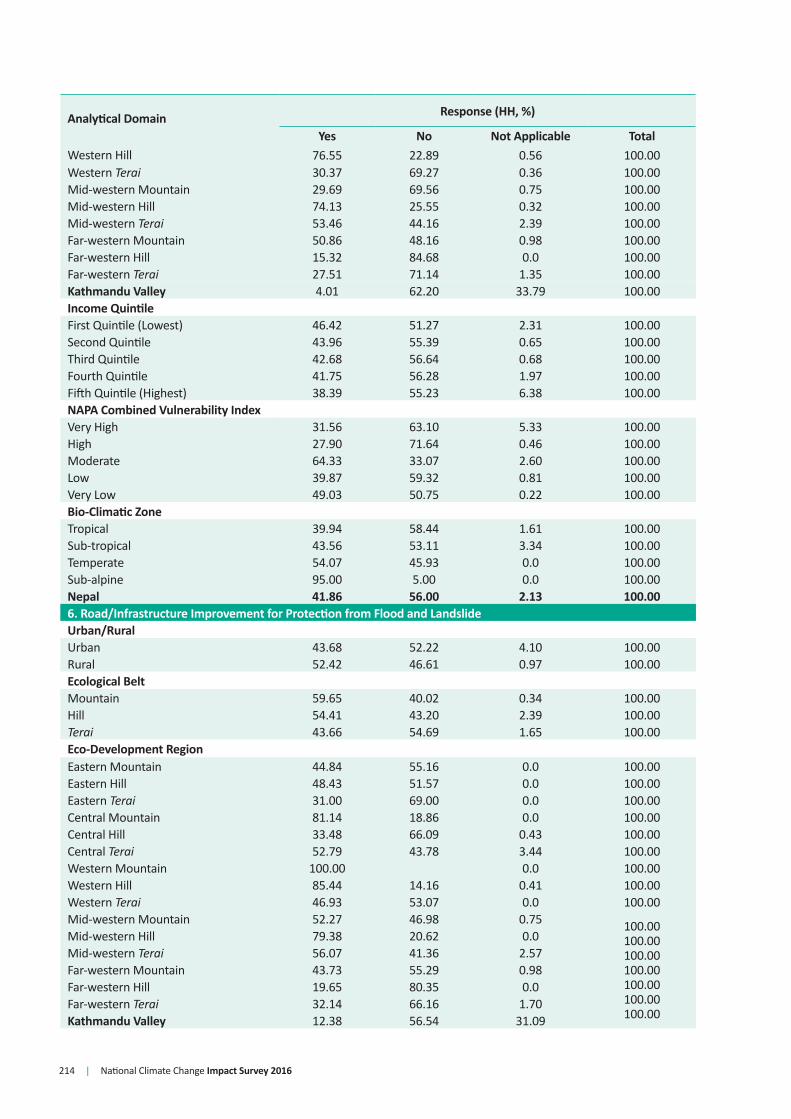
214 | National Climate Change Impact Survey 2016
Analytical Domain Response (HH, %)
Yes No Not Applicable TotalWestern Hill 76.55 22.89 0.56 100.00Western Terai 30.37 69.27 0.36 100.00Mid-western Mountain 29.69 69.56 0.75 100.00Mid-western Hill 74.13 25.55 0.32 100.00Mid-western Terai 53.46 44.16 2.39 100.00Far-western Mountain 50.86 48.16 0.98 100.00Far-western Hill 15.32 84.68 0.0 100.00Far-western Terai 27.51 71.14 1.35 100.00Kathmandu Valley 4.01 62.20 33.79 100.00Income QuintileFirst Quintile (Lowest) 46.42 51.27 2.31 100.00Second Quintile 43.96 55.39 0.65 100.00Third Quintile 42.68 56.64 0.68 100.00Fourth Quintile 41.75 56.28 1.97 100.00Fifth Quintile (Highest) 38.39 55.23 6.38 100.00NAPA Combined Vulnerability IndexVery High 31.56 63.10 5.33 100.00High 27.90 71.64 0.46 100.00Moderate 64.33 33.07 2.60 100.00Low 39.87 59.32 0.81 100.00Very Low 49.03 50.75 0.22 100.00Bio-Climatic ZoneTropical 39.94 58.44 1.61 100.00Sub-tropical 43.56 53.11 3.34 100.00Temperate 54.07 45.93 0.0 100.00Sub-alpine 95.00 5.00 0.0 100.00Nepal 41.86 56.00 2.13 100.006. Road/Infrastructure Improvement for Protection from Flood and LandslideUrban/RuralUrban 43.68 52.22 4.10 100.00Rural 52.42 46.61 0.97 100.00Ecological BeltMountain 59.65 40.02 0.34 100.00Hill 54.41 43.20 2.39 100.00Terai 43.66 54.69 1.65 100.00Eco-Development RegionEastern Mountain 44.84 55.16 0.0 100.00Eastern Hill 48.43 51.57 0.0 100.00Eastern Terai 31.00 69.00 0.0 100.00Central Mountain 81.14 18.86 0.0 100.00Central Hill 33.48 66.09 0.43 100.00Central Terai 52.79 43.78 3.44 100.00Western Mountain 100.00 0.0 100.00Western Hill 85.44 14.16 0.41 100.00Western Terai 46.93 53.07 0.0 100.00Mid-western Mountain 52.27 46.98 0.75 100.00
100.00100.00100.00100.00100.00100.00
Mid-western Hill 79.38 20.62 0.0Mid-western Terai 56.07 41.36 2.57Far-western Mountain 43.73 55.29 0.98Far-western Hill 19.65 80.35 0.0Far-western Terai 32.14 66.16 1.70Kathmandu Valley 12.38 56.54 31.09

National Climate Change Impact Survey 2016 | 215
Analytical Domain Response (HH, %)
Yes No Not Applicable TotalIncome QuintileFirst Quintile (Lowest) 52.27 45.66 2.07 100.00Second Quintile 51.07 48.47 0.46 100.00Third Quintile 50.20 49.22 0.58 100.00Fourth Quintile 48.81 49.40 1.79 100.00Fifth Quintile (Highest) 53.02 41.58 5.40 100.00NAPA Combined Vulnerability IndexVery High 36.41 59.06 4.52 100.00High 33.96 65.81 0.23 100.00Moderate 69.92 27.44 2.64 100.00Low 54.15 45.05 0.80 100.00Very Low 62.16 37.84 0.00 100.00Bio-Climatic ZoneTropical 47.12 51.50 1.38 100.00Sub-tropical 53.07 43.91 3.02 100.00Temperate 61.65 38.35 0.0 100.00Sub-alpine 100.00 0.0 0.0 100.00Nepal 49.86 48.25 1.88 100.007. Involvement in Community-Based NRMUrban/RuralUrban 48.47 48.14 3.39 100.00Rural 60.14 39.49 0.37 100.00Ecological BeltMountain 56.72 42.95 0.34 100.00Hill 60.25 37.79 1.96 100.00Terai 53.23 46.06 0.71 100.00Eco-Development RegionEastern Mountain 57.09 42.91 0.0 100.00Eastern Hill 50.19 49.81 0.0 100.00Eastern Terai 19.51 80.49 0.0 100.00Central Mountain 64.32 35.68 0.0 100.00Central Hill 48.61 50.95 0.43 100.00Central Terai 73.20 25.55 1.25 100.00Western Mountain 97.80 2.20 0.0 100.00Western Hill 81.60 18.11 0.29 100.00Western Terai 73.39 26.61 0.0 100.00Mid-western Mountain 46.54 52.71 0.75 100.00Mid-western Hill 91.46 8.54 0.0 100.00Mid-western Terai 71.64 26.76 1.60 100.00Far-western Mountain 50.35 48.67 0.98 100.00Far-western Hill 32.25 67.75 0.0 100.00Far-western Terai 49.60 49.05 1.35 100.00Kathmandu Valley 11.63 62.98 25.39 100.00Income QuintileFirst Quintile (Lowest) 61.64 37.42 0.94 100.00Second Quintile 55.52 44.41 0.07 100.00Third Quintile 57.20 42.55 0.25 100.00Fourth Quintile 55.66 42.98 1.36 100.00Fifth Quintile (Highest) 59.47 35.68 4.84 100.00
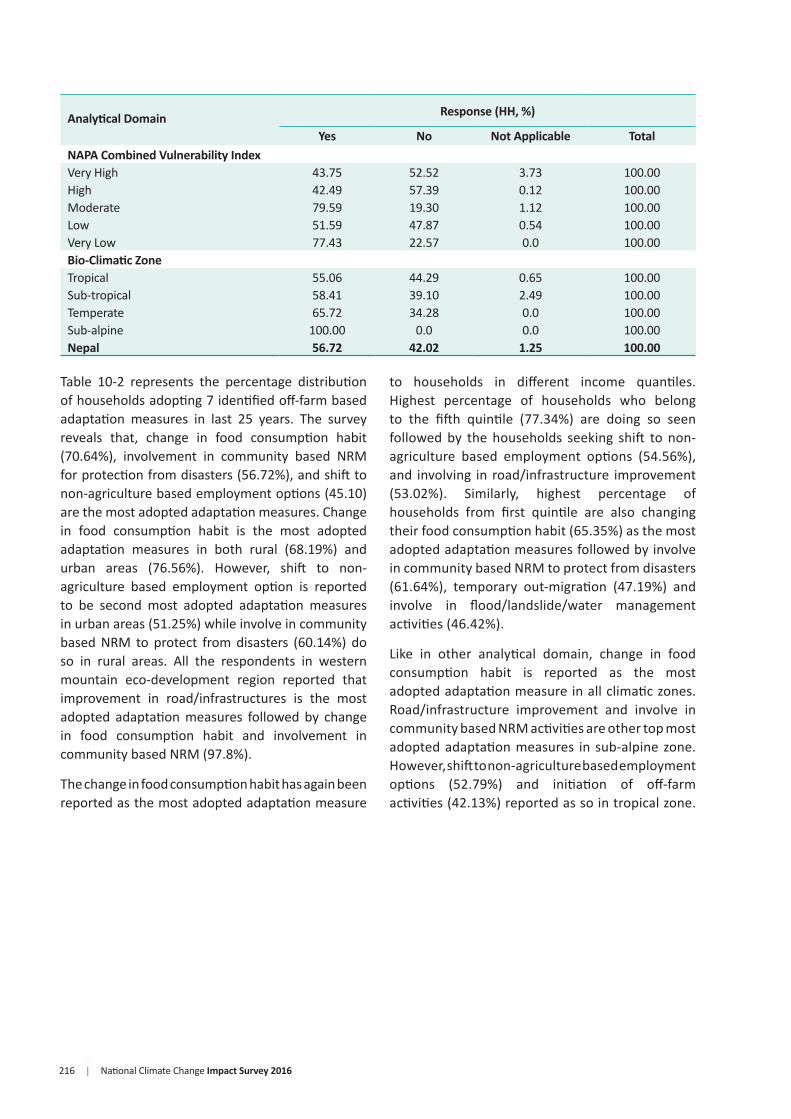
216 | National Climate Change Impact Survey 2016
Table 10-2 represents the percentage distribution of households adopting 7 identified off-farm based adaptation measures in last 25 years. The survey reveals that, change in food consumption habit (70.64%), involvement in community based NRM for protection from disasters (56.72%), and shift to non-agriculture based employment options (45.10) are the most adopted adaptation measures. Change in food consumption habit is the most adopted adaptation measures in both rural (68.19%) and urban areas (76.56%). However, shift to non-agriculture based employment option is reported to be second most adopted adaptation measures in urban areas (51.25%) while involve in community based NRM to protect from disasters (60.14%) do so in rural areas. All the respondents in western mountain eco-development region reported that improvement in road/infrastructures is the most adopted adaptation measures followed by change in food consumption habit and involvement in community based NRM (97.8%).
The change in food consumption habit has again been reported as the most adopted adaptation measure
to households in different income quantiles. Highest percentage of households who belong to the fifth quintile (77.34%) are doing so seen followed by the households seeking shift to non-agriculture based employment options (54.56%), and involving in road/infrastructure improvement (53.02%). Similarly, highest percentage of households from first quintile are also changing their food consumption habit (65.35%) as the most adopted adaptation measures followed by involve in community based NRM to protect from disasters (61.64%), temporary out-migration (47.19%) and involve in flood/landslide/water management activities (46.42%).
Like in other analytical domain, change in food consumption habit is reported as the most adopted adaptation measure in all climatic zones. Road/infrastructure improvement and involve in community based NRM activities are other top most adopted adaptation measures in sub-alpine zone. However, shift to non-agriculture based employment options (52.79%) and initiation of off-farm activities (42.13%) reported as so in tropical zone.
Analytical Domain Response (HH, %)
Yes No Not Applicable TotalNAPA Combined Vulnerability IndexVery High 43.75 52.52 3.73 100.00High 42.49 57.39 0.12 100.00Moderate 79.59 19.30 1.12 100.00Low 51.59 47.87 0.54 100.00Very Low 77.43 22.57 0.0 100.00Bio-Climatic ZoneTropical 55.06 44.29 0.65 100.00Sub-tropical 58.41 39.10 2.49 100.00Temperate 65.72 34.28 0.0 100.00Sub-alpine 100.00 0.0 0.0 100.00Nepal 56.72 42.02 1.25 100.00

National Climate Change Impact Survey 2016 | 217
REFERENCES
Chaulagain, N. P. (2009). Climate Change Impacts on Water Resources of Nepal with Reference to the Glaciers in the Langtang. Journal of Hydrology and Meteorology, Vol. 6, No. 1.
IPCC. (2001). Climate Change 2001: The scientific basis. Contribution of Working Group I to the Third Assessment Report of the Intergovernmental Panel on Climate Change (Houghton, J. T., Ding, Y., Griggs, D. J., Noguer, M., Van der Linden, P. J., Dai, X., Maskell, K. and Johnson, C. A. (Eds.)) Cambridge University Press, Cambridge and New York.
IPCC. (2001). Contribution of Working Groups I, II, and III to the Third Assessment Report of the Intergovernmental Panel on Climate Change . Cambridge: Cambridge University Press.
IPCC. (2007). Contribution of Working Group II to the Fourth Assessment Report of the Intergovernmental Panel on Climate Change. Cambridge University Press.
IPCC. (2014). Climate change and health: on the latest IPCC report. IPCC.
Karki, M., Mool, P., & Shrestha, A. (2009). Climate Change and its Increasing Impacts in Nepal. The Initiation, 30-37.
Malla, G. (2008). Climate Change And Its Impact On Nepalese Agriculture. The Journal of Agriculture and Environment Vol:.9.
MoPE. (2010). National Adaptation Programme of Action to Climate Chage Ministry of Environment, Kathmandu, Nepal.
MoPE. (2012). Mountain Environment and Climate Change in Nepal: National Report prepared for the International Conference of Mountain Countries on Climate Change, 5-6 April 2012, Ministry of Environment, Kathmandu, Nepal.
Neupane, G., & Chhetri, N. (2009). Vulnerability to climate change of nature-based tourism in the Nepalese Himalayas. Tourism Geographies.
Regmi, B. R., Pandit, A., Pradhan, B., Kovats, S., & Lama, P. (2008). Climate Change and Health in Nepal. Capacity Strenghting in the least developed countries(LDCS) for adaptation to climate change (CLACC).
WECS. (2011). Water Resources of Nepal in the Context of Climate Change. Kathmandu: Water and Energy Commission Secretariat (WECS), Government of Nepal.

218 | National Climate Change Impact Survey 2016
AdaptationIn human systems, ‘adaptation’ is understood as the process of adjustment to actual or expected climate and its effects, in order to moderate harm or exploit beneficial opportunities. In natural systems, it is defined as the process of adjustment to actual climate and its effects; human intervention may facilitate adjustment to expected climate.
Global WarmingIn general, the ‘global warming’ is an increase in average temperature of the earth surface and the atmosphere. It is considered as an important aspect for the climate change along with rain fall and sea level change.
Climate Change Impact [on Water, Water Resources, and Livelihood]Climate change has extended impacts not only on drinking water but also on other associated sectors including agriculture, irrigation, hydropower, water-powered small projects, and other dependent enterprises. Similar impact could be associated with water resources such as drying up of existing water holes. Melting glacier on unprecedented rate at the Himalayas does not only accelerate the risk of flooding specially in the monsoon but also decrease water availability during dry season. Climate change impacts on different aspects of water sector have been briefed as follows:
Water QuantityWater sector has already has been pressurised due to its mounting demand mainly for irrigation, and its uses on industrial pollution and sewage management. Climate change would have further accelerated such pressure. Increasing temperature but decreasing rainfall would have diminished the available water quantity for different purposes such as drinking, on other domestic uses, and on agriculture and industrial sectors. It would result in the increased competitive demand of water and hence would need effective good governance mechanism.
ANNEXES
Water QualityThe water quality would be the issue of more interest at the global arena especially in the areas with ascending water scarcity. The change in rainfall pattern and amount has direct link on water flow within the watershed area. Water quality would deteriorate if it encounters different chemicals during its cycle which limits utility options. For example, salt composition in water increases through rapid evaporation due to temperature rise. The increased flood frequency further catalysis water to encounter with different agricultural chemical compounds and industrial waste which reaches water table through infiltration results fading underground water quality. Similarly, increased sea level rise contaminates proximate water distribution system increasing salt compounds, which adds risk to access of people on pure water.
Access to WaterThe competition over existing water resources speeds up rapidly while water quantity and quality decreases as a result of accelerated water cycle. Water demand would be increased especially for agriculture and domestic use in summer and dry season. Similarly, increasing population and temperature rise but decreasing rainfall would further enhance competition for underground water resulting conflicts.
Waterborne DisasterThe risk level would be further amplified especially from increasing frequency of climate induced natural disasters including flooding and drought. IPCC has also projected that the risk and direct impact of climate induced natural disasters to local communities would be more significant.
Different projected changes on water quantity, quality, and access would have direct impact on diverse sectors including agriculture and food security, health, and other economic activities along with human lives through conflict for water resources. Besides, direct negative impact on community livelihood, climate induced flooding has following additional impacts:
ANNEX 1: GLOSSARY OF TERMINOLOGIES
National Climate Change Impact Survey 2016 | 219
s Increases risk of waterborne disease as an outcome of contaminated water and over pressure from sewage system;
sImpact on clean water distribution system due to damage caused on infrastructures;
s Risk of different types of epidemics of malaria, jaundice, and dengue especially at the downstream communities creating enabling environment for mosquitoes;
sIncrease in frequency of different types of Disease and health issues such that of dermatology related issues;
sContribute on malnutrition and under-nutrition mainly by posing threat to income generation and food distribution system.
s Impacts on agriculture and food security due to water imbalance
Slight changes on enduring climatic conditions such as seasonal changes on rainfall pattern can invite adverse results considering interlinked relation between agriculture and the climate. It directly impacts production especially in areas where agriculture system completely depends upon rain and irrigation mechanism is not adapted adjusting to changed rainfall pattern. Such impact would fuel food insecurity in areas those are already vulnerable.
DiseaseIt is the process of suffering whole or parts of the plant/animal body by any microbial.
Farming SystemIt refers to the process of managing the farm interlinking crops, horticulture, agriculture, forestry, and animal husbandry; and utilising its physical environments such as weather, soil, and landscape.
Crop DiversificationCrop diversification is the improvement on crop, species, and crop system to increase total production and income from limited land area. It is mainly based on market demand and quality considering feasibility in the landscape and comparative benefit.
Mixed/IntercroppingMixed/intercropping contributes to increase in per unit productivity with optimum utilisation of solar light, plant nutrition, and water. The plant species having different root system cropped in the mixed/intercropping system uses nutrition at different
times. For example, the mung utilises soil nutrition after 35th day of it plantation while maize does so after 50th day only in the maize-mung intercropping.
Cereal CropsThese are mainly rice, maize, wheat species, barley species, buckwheat, latte, Kaguno, chinu, and Junelo.
LegumesThese are crop species mostly containing dicotyledonous seeds including soybean and gram.
VegetablesThese are crops such as cauliflower, cabbage, and broccoli.
Invasive SpeciesThey are the exotic and unwanted plant species which displace and impact production and expansion of already established both naturally or planted vegetation, and those which are part of livelihood. Mikenia and catweed (banmara) are some example of invasive species. Climate change can create favorable milieu to comparatively less economically important species and ultimately displaces native, already established, and economically important plant species.
Non Timber Forest Products (NTFPs)Forests provide different products and services which are broadly divided into two categories: timber and products other than timber. Forest products other than timber are categorised as NTFPs. Single tree could provide both timber and NTFPs since the stem yields timber while remaining part including branches, leaves, flower, fruits, and bark offer economic benefits. Similarly, other plant species that do not yield timber or hard wood also offer other economic benefits for their medicinal, cultural, edible, and other values.
DeforestationIt is the invasion of forests areas for other land use purposes or decrement of total forest crown cover to less than 10 per cent in long run.
Forest DegradationIt is understood as the degraded state of forest which fails to offer anticipated products and services in its normal state even though there is no universal

220 | National Climate Change Impact Survey 2016
definition. However, in context of REDD+, it is understood in terms of its ability of carbon storage mainly due to anthropogenic pressure. At such state, the total forests area remains same while its productivity is despoiled.
Forest ManagementForest management is the process of conservation, development, management, and utilisation of forests employing both technical and professional principles mainly for ecosystems, biodiversity, economic, and social prosperity. The forest management regimes and technics differ based on the management objectives. These days, the forests management also includes activities carried out to reduce carbon emission and enhance carbon stock in forests area.
TouristsTourists are the visitors visiting other than own residence aiming to spend at least 24 hours. However, visitors who visit other areas and spend less than 24 hours are defined as ‘excursionists’. It could be categorized as domestic/internal and external/international tourists.
Tourist AreaIt is an area including heritage sites and has an object to attract both domestic and international tourists to visit.
Duration of StayIt is understood as the total time spent by any domestic and international tourists while visiting touristic areas. For example, the average duration of stay for international tourists in Nepal is 13 days. However, it differs in countries. Tourists visiting for trekking and mountaineering have comparatively longer duration of stay while it is less for tourists visiting for cultural, entertainment, and business purposes.
WindstormWindstorm, in this report, indicates high speed wind breeze generally happens in dry seasons - April and May. It also refers the same that happen in rainy season generally with rain. Windstorm in both seasons contributes on crop and tree plants damage and hence on reduction of total production.

National Climate Change Impact Survey 2016 | 221
The information asked in this questionnaire are confidential according to the statistical act, 2015. Individual information are not published and only used for statistical purposes.
Government of NepalNational Planning Commission Secretariat
Central Bureau of StatisticsThapathali, kathmandu
Phone No. 4245848, 4252479, 4245946, 4245947, 4245948Fax: 01-4227720
Website: www.cbs.gov.np
Climate Change Impact Survey 2016
Questionnaire
PSU Code Household No.
ANNEX 2: Survey Questionnaire
Unofficial Translation fromQuestionnaire in Nepali

222 | National Climate Change Impact Survey 2016
Cent
ral B
urea
u of
Sta
tistic
s
Clim
ate
Chan
ge Im
pact
Sur
vey,
201
6
Mod
ule
1: In
trod
ucto
ry In
form
ation
Intr
oduc
tion
Info
rmati
on o
f the
resp
onde
nt
Sex
Mal
e …
.. 1
Fem
ale
… 2
Age
(yea
rs)
Iden
tifica
tion
of S
ampl
ing
Area
Desc
riptio
nA0
7. N
ame
of th
e Ho
useh
old
H ea
d
A01.
PSU
No.
A08.
Nam
e of
the
Resp
onde
nt (4
5 ye
ars
or a
bove
)A0
2. D
istric
t ....
......
..(c
ode)
A03.
VDC
/Mun
icip
ality
...
......
......
......
......
..(c
ode)
A09.
Con
tact
Num
ber o
f the
Res
pond
ent
A04.
War
d no
/ Sub
-war
d no
A10.
Eth
nici
ty o
f the
resp
onde
nt (S
ee c
ode)
A05.
Nam
e of
vill
age/
tole
A11.
Qua
lifica
tion
of re
spon
dent
(See
cod
e)A0
6. A
ltitu
de/e
leva
tion
of
the
surv
ey a
rea
(m)
A12.
Dur
ation
of s
tay
in th
is co
mm
unity
(in
year
s)
Enum
erat
or
Nam
e:
Sign
atur
e:
Date
:
Supe
rviso
r
Nam
e:
Sign
atur
e:
Date
:
Data
ent
ry o
pera
tor
Nam
e:
Sign
atur
e:
Date
:
•Th
e ob
jecti
ve o
f thi
s su
rvey
is to
stu
dy th
e im
pact
s of
clim
ate
chan
ge in
the
soci
al, e
cono
mic
and
env
ironm
enta
l asp
ects
. To
fulfi
ll th
is ob
jecti
ve C
entr
al
Bure
au o
f Sta
tistic
s is r
eque
sting
to a
ll st
akeh
olde
rs to
pro
vide
real
info
rmati
on.
•Q
uesti
ons g
iven
bel
ow sh
all b
e as
ked
to a
45
year
s old
per
son
stay
ing
in th
at c
omm
unity
ove
r the
pas
t 25
year
s fro
m e
very
hou
seho
ld.
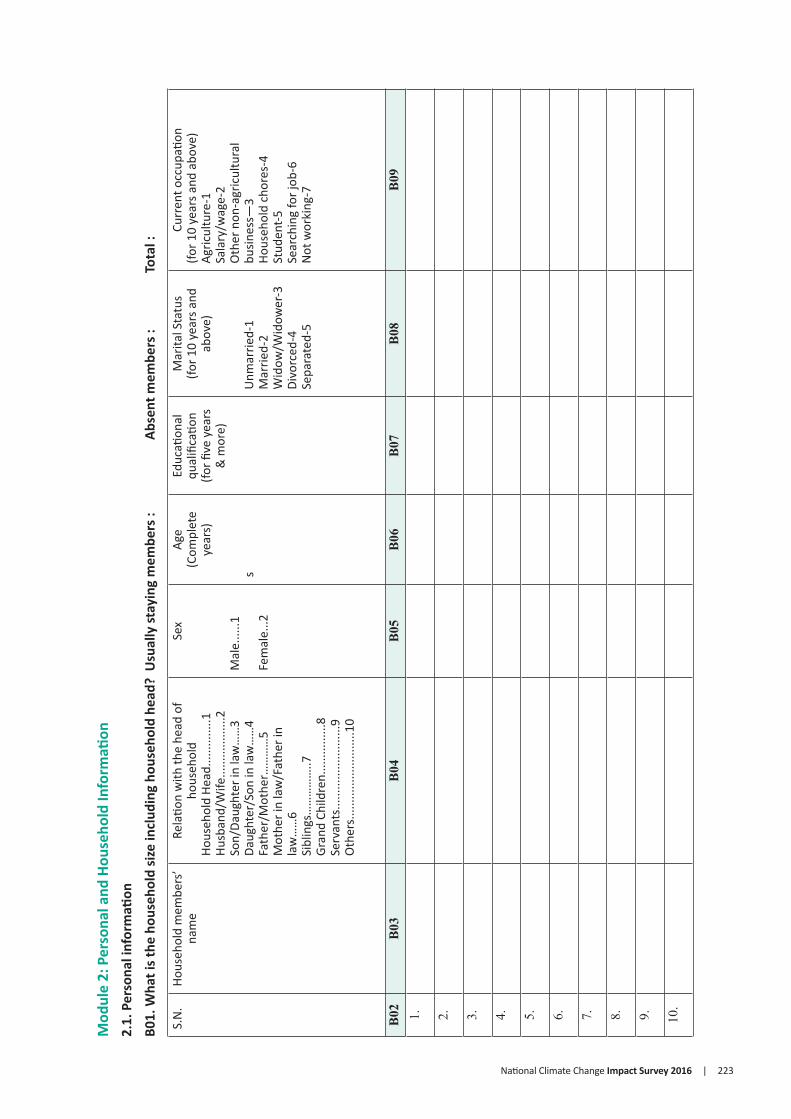
National Climate Change Impact Survey 2016 | 223
Mod
ule
2: P
erso
nal a
nd H
ouse
hold
Info
rmati
on2.
1. P
erso
nal i
nfor
mati
on
B01.
Wha
t is t
he h
ouse
hold
size
incl
udin
g ho
useh
old
head
? U
sual
ly st
ayin
g m
embe
rs :
Ab
sent
mem
bers
:
Tot
al :
S.N
. Ho
useh
old
mem
bers
’ na
me
Rela
tion
with
the
head
of
hous
ehol
dHo
useh
old
Head
......
......
..1Hu
sban
d/W
ife...
......
......
...2
Son/
Daug
hter
in la
w…
…3
Daug
hter
/Son
in la
w…
…4
Fath
er/M
othe
r……
……
5M
othe
r in
law
/Fat
her i
n la
w…
…6
Sibl
ings
……
……
…..7
Gran
d Ch
ildre
n....
......
.....8
Serv
ants
......
......
......
......
.9O
ther
s....
......
......
......
....1
0
Sex
Mal
e....
..1
Fem
ale.
..2
Age
(Com
plet
e ye
ars)
s
Educ
ation
al
qual
ifica
tion
(for fi
ve y
ears
&
mor
e)
Mar
ital S
tatu
s (fo
r 10
year
s and
ab
ove)
Unm
arrie
d-1
Mar
ried-
2W
idow
/Wid
ower
-3Di
vorc
ed-4
Sepa
rate
d-5
Curr
ent o
ccup
ation
(for 1
0 ye
ars a
nd a
bove
)Ag
ricul
ture
-1Sa
lary
/wag
e-2
Oth
er n
on-a
gric
ultu
ral
busin
ess—
3Ho
useh
old
chor
es-4
Stud
ent-5
Sear
chin
g fo
r job
-6N
ot w
orki
ng-7
B02
B03
B04
B05
B06
B07
B08
B09
1. 2. 3. 4. 5. 6. 7. 8. 9. 10.

224 | National Climate Change Impact Survey 2016
2.2.
Hou
seho
ld In
form
ation
Q.N
o.De
scrip
tion
Code
Q.N
o.De
scrip
tion
Code
B10
Ow
ners
hip
of re
siden
ce?
1.
Ow
ned
2.
Rent
ed3.
In
stitu
tiona
l4.
O
ther
s
B11
Type
of i
nfra
stru
ctur
e of
you
r mai
n re
siden
ce.
1.
Perm
anen
t2.
Se
mi (
half)
-Per
man
ent
3.
Kach
chi
4.
Oth
ers
B12
Sour
ces o
f drin
king
wat
er (r
ank
thre
e m
ain
sour
ces i
n pr
iorit
y )
1.
Pipe
line
2.
Shal
low
/Dee
p tu
be w
ell
3.
Wel
l/ sp
ring
4.
Cana
l/Riv
er/s
trea
m w
ater
5.
Rain
wat
er6.
Sp
ring/
ston
e sp
out
7.
Jar/
tank
er8.
O
ther
s
B13
Sour
ces o
f fue
l use
d fo
r coo
king
(t
hree
mai
n so
urce
s in
prio
rity)
1.
Fire
woo
d2.
Ga
s/LP
G3.
Co
w d
ung
4.
Biog
as5.
Ke
rose
ne6.
El
ectr
icity
7.
Briq
uette
/ric
e hu
sk8.
O
ther
s
B14
Mai
n so
urce
of e
nerg
y fo
r lig
ht1.
El
ectr
icity
2.
Sola
r Pow
er3.
Ke
rose
ne4.
Bi
o-ga
s5.
O
ther
s
B15
Mai
n ty
pe o
f toi
let/
latr
ine
faci
lity
1.
Flus
h to
ilet
(con
nect
ed to
sew
age)
2.
Flus
h to
ilet
(con
nect
ed to
septi
c ta
nk)
3.
Gene
ral h
ouse
hold
latr
ine
4.
Pub
lic to
ilet
5.
Ope
n sp
ace/
No
latr
ine
B16
Sour
ces o
f inc
ome
of th
e ho
useh
old
in th
e pa
st
12 m
onth
s (ra
nk th
ree
mai
n so
urce
s in
prio
rity)
1.
Agric
ultu
re2.
Sa
lary
/Wag
es3.
N
on-A
gri.
Busin
ess
4.
Rem
ittan
ce5.
O
ther
s
B17
Whi
ch o
f the
faci
lities
fam
ily a
re u
sing
as li
sted
bel
ow:
(mul
tiple
ans
wer
s are
pos
sible
for t
his q
uesti
on)
1.
Radi
o 2
. Tel
evisi
on
3. C
able
4.
Com
pute
r
5. In
tern
et
6. T
elep
hone
7. M
obile
8. M
otor
cycl
e9.
Car
10. B
icyc
le
1
1. O
ther
veh
icle
12. R
efrig
erati
on 1
3. N
one
of a
bove
B18.
Ha
s thi
s hou
seho
ld re
ceiv
ed re
mitt
ance
in th
e pa
st 1
2 m
onth
s?1.
Ye
s2.
N
o
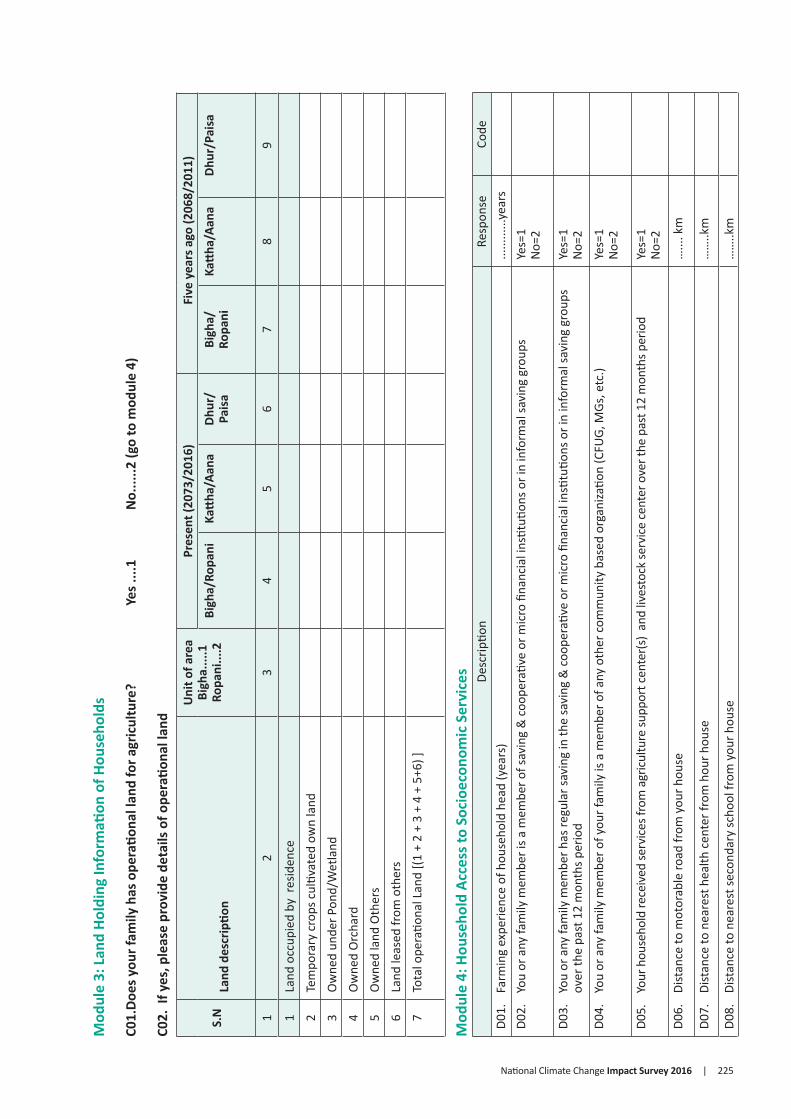
National Climate Change Impact Survey 2016 | 225
Mod
ule
3: L
and
Hold
ing
Info
rmati
on o
f Hou
seho
lds
C01.
Does
you
r fam
ily h
as o
pera
tiona
l lan
d fo
r agr
icul
ture
?
Yes .
...1
N
o....
..2 (g
o to
mod
ule
4)
C02.
If y
es, p
leas
e pr
ovid
e de
tails
of o
pera
tiona
l lan
d
S.N
Land
des
crip
tion
Uni
t of a
rea
Bigh
a....
.1Ro
pani
....2
Pres
ent (
2073
/201
6)
Fiv
e ye
ars a
go (2
068/
2011
)
Bigh
a/Ro
pani
Katt
ha/A
ana
Dhur
/Pa
isa
Bigh
a/Ro
pani
Katt
ha/A
ana
Dhur
/Pai
sa
12
34
56
78
9
1La
nd o
ccup
ied
by r
esid
ence
2Te
mpo
rary
cro
ps c
ultiv
ated
ow
n la
nd
3O
wne
d un
der P
ond/
Wet
land
4O
wne
d O
rcha
rd
5O
wne
d la
nd O
ther
s
6La
nd le
ased
from
oth
ers
7To
tal o
pera
tiona
l Lan
d [(1
+ 2
+ 3
+ 4
+ 5
+6) ]
Mod
ule
4: H
ouse
hold
Acc
ess t
o So
cioe
cono
mic
Ser
vice
s Desc
riptio
nRe
spon
seCo
deD0
1.
Farm
ing
expe
rienc
e of
hou
seho
ld h
ead
(yea
rs)
......
......
year
sD0
2.
You
or a
ny fa
mily
mem
ber i
s a m
embe
r of s
avin
g &
coo
pera
tive
or m
icro
fina
ncia
l ins
tituti
ons o
r in
info
rmal
savi
ng g
roup
s Ye
s=1
No=
2
D03.
Yo
u or
any
fam
ily m
embe
r has
regu
lar s
avin
g in
the
savi
ng &
coo
pera
tive
or m
icro
fina
ncia
l ins
tituti
ons o
r in
info
rmal
savi
ng g
roup
s ov
er th
e pa
st 1
2 m
onth
s per
iod
Yes=
1 N
o=2
D04.
Yo
u or
any
fam
ily m
embe
r of y
our f
amily
is a
mem
ber o
f any
oth
er c
omm
unity
bas
ed o
rgan
izatio
n (C
FUG,
MGs
, etc
.)Ye
s=1
No=
2
D05.
Yo
ur h
ouse
hold
rece
ived
serv
ices f
rom
agr
icultu
re su
ppor
t cen
ter(s
) an
d liv
esto
ck se
rvice
cent
er o
ver t
he p
ast 1
2 m
onth
s per
iod
Yes=
1 N
o=2
D06.
Di
stan
ce to
mot
orab
le ro
ad fr
om y
our h
ouse
…...
. km
D07.
Di
stan
ce to
nea
rest
hea
lth c
ente
r fro
m h
our h
ouse
……
..km
D08.
Di
stan
ce to
nea
rest
seco
ndar
y sc
hool
from
you
r hou
se…
…..k
m
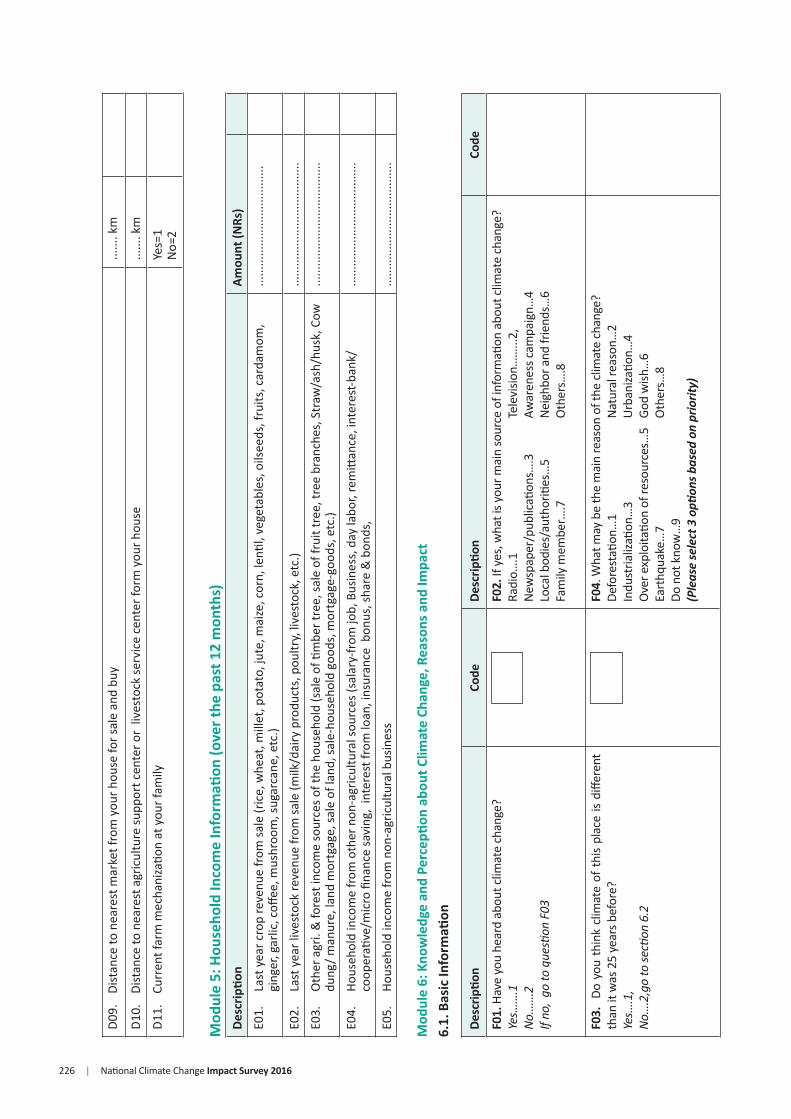
226 | National Climate Change Impact Survey 2016
D09.
Di
stan
ce to
nea
rest
mar
ket f
rom
you
r hou
se fo
r sal
e an
d bu
y ...
.... k
m
D10.
Di
stan
ce to
nea
rest
agr
icul
ture
supp
ort c
ente
r or
lives
tock
serv
ice
cent
er fo
rm y
our h
ouse
......
. km
D11.
Cu
rren
t far
m m
echa
niza
tion
at y
our f
amily
Yes=
1 N
o=2
Mod
ule
5: H
ouse
hold
Inco
me
Info
rmati
on (o
ver t
he p
ast 1
2 m
onth
s)De
scrip
tion
Amou
nt (N
Rs)
E01.
La
st y
ear c
rop
reve
nue
from
sale
(ric
e, w
heat
, mill
et, p
otat
o, ju
te, m
aize
, cor
n, le
ntil,
vege
tabl
es, o
ilsee
ds, f
ruits
, car
dam
om,
ging
er, g
arlic
, coff
ee, m
ushr
oom
, sug
arca
ne, e
tc.)
......
......
......
......
......
......
E02.
La
st y
ear l
ives
tock
reve
nue
from
sale
(milk
/dai
ry p
rodu
cts,
pou
ltry,
lives
tock
, etc
.)...
......
......
......
......
......
....
E03.
O
ther
agr
i. &
fore
st in
com
e so
urce
s of t
he h
ouse
hold
(sal
e of
tim
ber t
ree,
sale
of f
ruit
tree
, tre
e br
anch
es, S
traw
/ash
/hus
k, C
ow
dung
/ man
ure,
land
mor
tgag
e, sa
le o
f lan
d, sa
le-h
ouse
hold
goo
ds, m
ortg
age-
good
s, e
tc.)
......
......
......
......
......
......
.
E04.
Ho
useh
old
inco
me
from
oth
er n
on-a
gric
ultu
ral s
ourc
es (s
alar
y-fr
om jo
b, B
usin
ess,
day
labo
r, re
mitt
ance
, int
eres
t-ban
k/co
oper
ative
/mic
ro fi
nanc
e sa
ving
, in
tere
st fr
om lo
an, i
nsur
ance
bon
us, s
hare
& b
onds
,
...
......
......
......
......
......
....
E05.
Ho
useh
old
inco
me
from
non
-agr
icul
tura
l bus
ines
s ...
......
......
......
......
......
....
Mod
ule
6: K
now
ledg
e an
d Pe
rcep
tion
abou
t Clim
ate
Chan
ge, R
easo
ns a
nd Im
pact
6.1.
Bas
ic In
form
ation
Desc
riptio
nCo
deDe
scrip
tion
Code
F01.
Hav
e yo
u he
ard
abou
t clim
ate
chan
ge?
Yes…
….1
No…
….2
If no
, go
to q
uesti
on F
03
F02.
If y
es, w
hat i
s you
r mai
n so
urce
of i
nfor
mati
on a
bout
clim
ate
chan
ge?
Radi
o….1
Te
levi
sion…
…...
2,N
ewsp
aper
/pub
licati
ons…
.3
Awar
enes
s cam
paig
n…4
Loca
l bod
ies/
auth
oriti
es…
5 N
eigh
bor a
nd fr
iend
s…6
Fam
ily m
embe
r….7
O
ther
s….8
F03.
Do
you
thin
k cl
imat
e of
thi
s pl
ace
is di
ffere
nt
than
it w
as 2
5 ye
ars b
efor
e?Ye
s….1
,N
o….2
,go
to s
ectio
n 6.
2
F04.
Wha
t may
be
the
mai
n re
ason
of t
he cl
imat
e ch
ange
?De
fore
stati
on…
1 N
atur
al re
ason
…2
Indu
stria
lizati
on…
3 Ur
bani
zatio
n…4
Ove
r exp
loita
tion
of re
sour
ces…
5 Go
d w
ish…
6Ea
rthq
uake
…7
Oth
ers…
8Do
not
kno
w…
9(P
leas
e se
lect
3 o
ption
s ba
sed
on p
rior
ity)
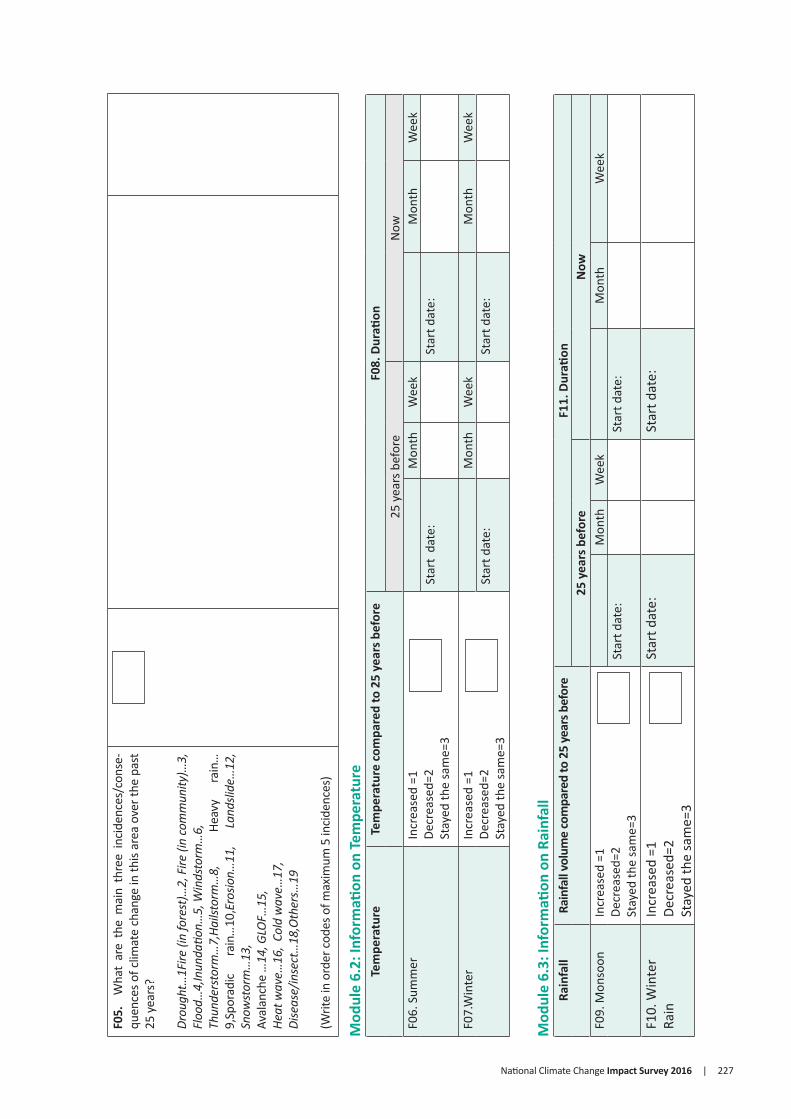
National Climate Change Impact Survey 2016 | 227
F05.
W
hat
are
the
mai
n th
ree
incid
ence
s/co
nse-
quen
ces o
f clim
ate
chan
ge in
this
area
ove
r the
pas
t 25
yea
rs?
Dro
ught
…1F
ire (i
n fo
rest
)…2,
Fire
(in
com
mun
ity)…
3,
Floo
d…4,
Inun
datio
n…5,
Win
dsto
rm…
6,Th
unde
rsto
rm…
7,H
ails
torm
…8,
Heav
y ra
in…
9,Sp
orad
ic ra
in…
10,E
rosi
on…
11,
Land
slid
e…12
, Sn
owst
orm
…13
,
Av
alan
che
…14
, GLO
F…15
,H
eat w
ave…
16,
Cold
wav
e…17
,D
isea
se/i
nsec
t…18
,Oth
ers…
19
(Writ
e in
ord
er co
des o
f max
imum
5 in
ciden
ces)
Mod
ule
6.2:
Info
rmati
on o
n Te
mpe
ratu
reTe
mpe
ratu
reTe
mpe
ratu
re c
ompa
red
to 2
5 ye
ars b
efor
eF0
8. D
urati
on25
yea
rs b
efor
eN
owF0
6. S
umm
erIn
crea
sed
=1De
crea
sed=
2 St
ayed
the
sam
e=3
Mon
thW
eek
Mon
thW
eek
Star
t da
te:
Star
t dat
e:
F07.
Win
ter
Incr
ease
d =1
Decr
ease
d=2
Stay
ed th
e sa
me=
3
Mon
thW
eek
Mon
thW
eek
Star
t dat
e:St
art d
ate:
Mod
ule
6.3:
Info
rmati
on o
n Ra
infa
llRa
infa
llRa
infa
ll vo
lum
e co
mpa
red
to 2
5 ye
ars b
efor
eF1
1. D
urati
on25
yea
rs b
efor
eN
owF0
9. M
onso
onIn
crea
sed
=1De
crea
sed=
2 St
ayed
the
sam
e=3
Mon
thW
eek
Mon
thW
eek
Star
t dat
e:St
art d
ate:
F10.
Win
ter
Rain
Incr
ease
d =1
Decr
ease
d=2
Stay
ed th
e sa
me=
3
Star
t dat
e:St
art d
ate:

228 | National Climate Change Impact Survey 2016
Mod
ule
6.4:
Info
rmati
on a
bout
Impa
ct o
f Clim
ate
Chan
geS.
N.
Nat
ural
disa
ster
s or e
vent
s du
e to
clim
ate
chan
ge(fi
rst i
denti
fy th
e m
ain
disa
ster
eve
nts o
f the
lo
calit
y)
Have
you
eve
r exp
erie
nced
the
chan
ge in
the
follo
win
g ev
ents
in
this
area
ove
r the
pas
t 25
year
s?
Yes…
1N
o…2,
next
col
umn
Not
app
licab
le…
3, n
ext c
olum
n
If ye
s, h
ow h
as it
ch
ange
d ov
er th
e pa
st
25 y
ears
Incr
ease
d …
. 1
Decr
ease
d …
2
To w
hat e
xten
t the
se e
vent
s hav
e im
pact
ed/a
ffect
ed y
ou o
r you
r fa
mily
ove
r the
pas
t 25
year
s?
Very
low
…1,
Low
… 2
, Mod
erat
e …
3,
Hig
h …
.4,
Very
hig
h …
5
Wha
t cou
ld b
e th
e m
ain
reas
ons
for t
he o
ccur
renc
e of
follo
win
g ev
ents
ove
r the
pas
t 25
year
s?
(writ
e th
e co
des o
f mai
n th
ree
reas
ons i
n p
riorit
y)*
F12
F13
F14
F15
F16
F17
1.Dr
ough
t2.
Fire
(in
fore
st)
3.Fi
re (i
n co
mm
unity
)4.
Floo
d5.
Inun
datio
n6.
Win
dsto
rm7.
Thun
ders
torm
8.Ha
ilsto
rm9.
Heav
y ra
in10
.Sp
orad
ic ra
in11
.Er
osio
n12
.La
ndsli
de13
.Sn
owst
orm
14.
Aval
anch
e15
. G
LOF
16.
Heat
wav
e
17.
Cold
wav
e
18.
Dise
ase/
inse
ct
19.
Oth
ers
*Low
rain
fall.
.1, H
eavy
rain
..2, I
ncre
ase
in te
mpe
ratu
re..3
, Dec
reas
e in
tem
pera
ture
..4, R
oad
cons
truc
tion.
.5, U
rban
izatio
n..6
, Def
ores
tatio
n..7
, Ove
r with
draw
al o
f wat
er..8
, Ea
rthq
uake
.. 9,
Pop
ulati
on in
crea
se ..
10, O
ther
s ..1
1
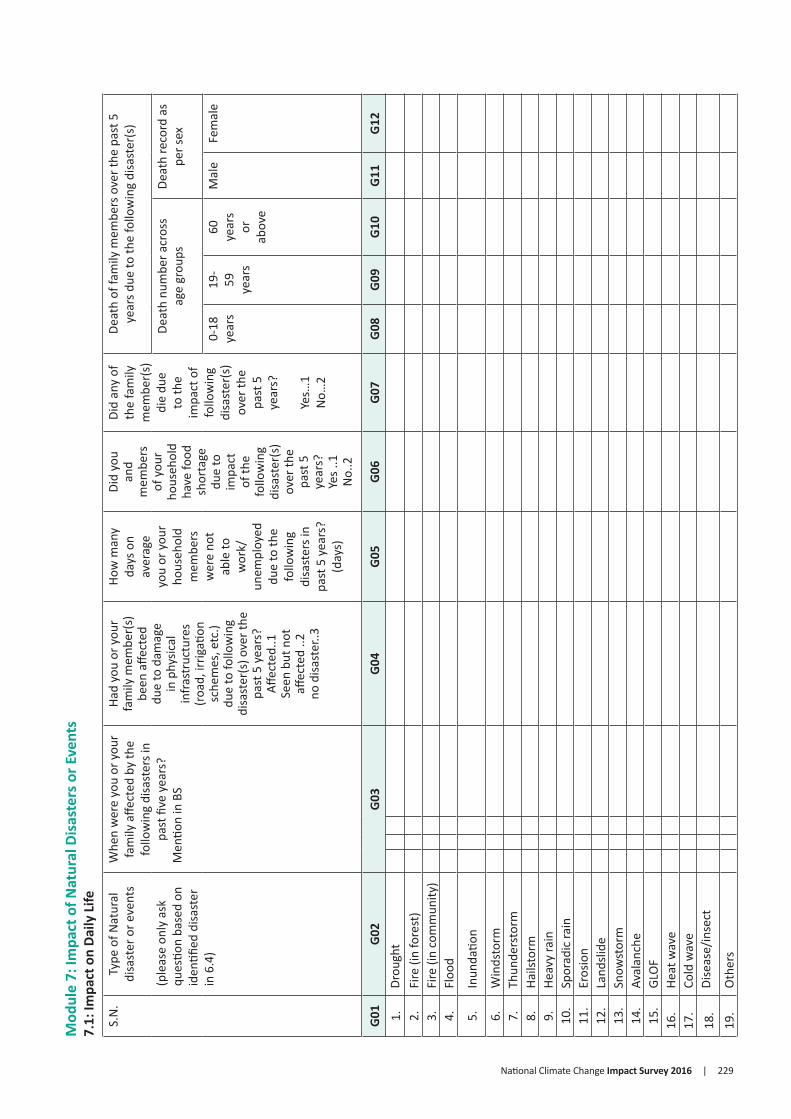
National Climate Change Impact Survey 2016 | 229
Mod
ule
7: Im
pact
of N
atur
al D
isas
ters
or E
vent
s7.
1: Im
pact
on
Daily
Life
S.N
.Ty
pe o
f Nat
ural
di
sast
er o
r eve
nts
(ple
ase
only
ask
qu
estio
n ba
sed
on
iden
tified
disa
ster
in
6.4
)
Whe
n w
ere
you
or y
our
fam
ily a
ffect
ed b
y th
e fo
llow
ing
disa
ster
s in
past
five
yea
rs?
Men
tion
in B
S
Had
you
or y
our
fam
ily m
embe
r(s)
be
en a
ffect
ed
due
to d
amag
e in
phy
sical
in
fras
truc
ture
s (r
oad,
irrig
ation
sc
hem
es, e
tc.)
due
to fo
llow
ing
disa
ster
(s) o
ver t
he
past
5 y
ears
?Aff
ecte
d..1
Seen
but
not
aff
ecte
d ..2
no d
isast
er..3
How
man
y da
ys o
n av
erag
e yo
u or
you
r ho
useh
old
mem
bers
w
ere
not
able
to
wor
k/
unem
ploy
ed
due
to th
e fo
llow
ing
disa
ster
s in
past
5 y
ears
?(d
ays)
Did
you
and
mem
bers
of
you
r ho
useh
old
have
food
sh
orta
ge
due
to
impa
ct
of th
e fo
llow
ing
disa
ster
(s)
over
the
past
5
year
s?Ye
s ..1
No.
.2
Did
any
of
the
fam
ily
mem
ber(
s)
die
due
to th
e im
pact
of
follo
win
g di
sast
er(s
) ov
er th
e pa
st 5
ye
ars?
Yes…
1N
o…2
Deat
h of
fam
ily m
embe
rs o
ver t
he p
ast 5
ye
ars d
ue to
the
follo
win
g di
sast
er(s
)
Deat
h nu
mbe
r acr
oss
age
grou
psDe
ath
reco
rd a
s pe
r sex
0-18
ye
ars
19-
59
year
s
60
year
s or
ab
ove
Mal
eFe
mal
e
G01
G02
G03
G04
G05
G06
G07
G08
G09
G10
G11
G12
1.Dr
ough
t2.
Fire
(in
fore
st)
3.Fi
re (i
n co
mm
unity
)4.
Floo
d
5.In
unda
tion
6.W
inds
torm
7.Th
unde
rsto
rm8.
Hails
torm
9.He
avy
rain
10.
Spor
adic
rain
11.
Eros
ion
12.
Land
slide
13.
Snow
stor
m14
.Av
alan
che
15.
GLO
F16
.He
at w
ave
17.
Cold
wav
e18
.Di
seas
e/in
sect
19.
Oth
ers
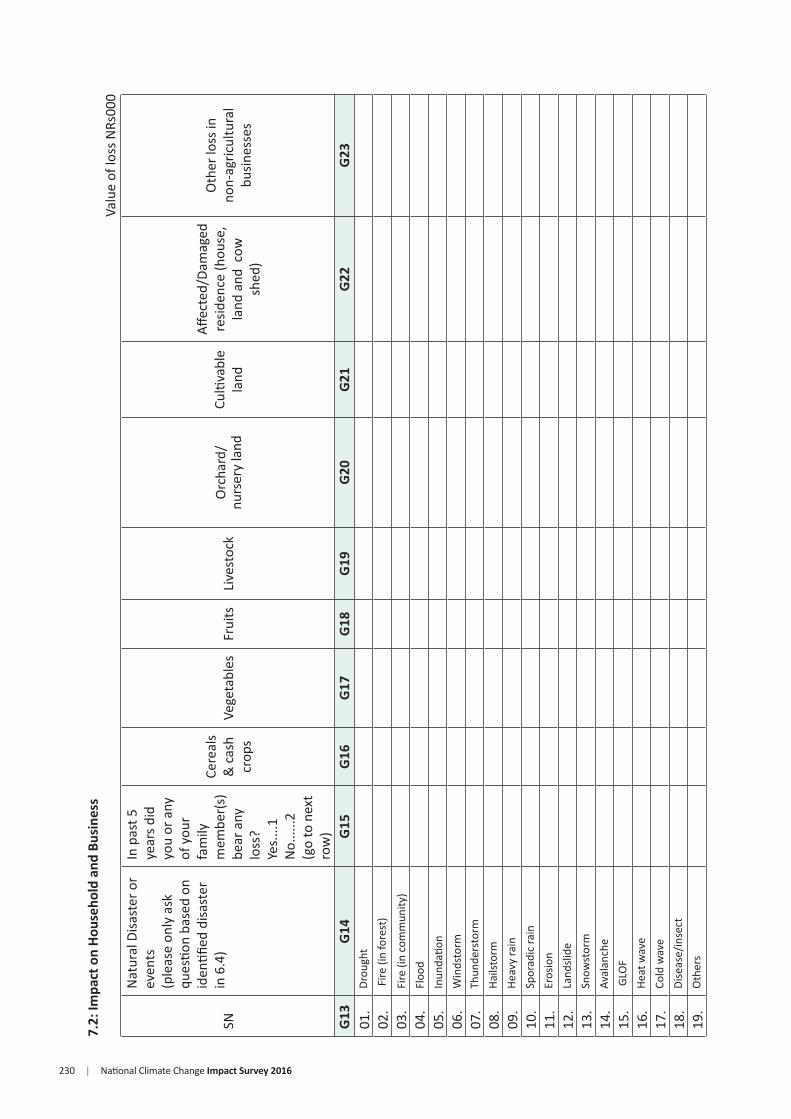
230 | National Climate Change Impact Survey 2016
7.2:
Impa
ct o
n Ho
useh
old
and
Busi
ness
Valu
e of
loss
NRs
000
SN
Nat
ural
Disa
ster
or
even
ts(p
leas
e on
ly a
sk
ques
tion
base
d on
id
entifi
ed d
isast
er
in 6
.4)
In p
ast 5
ye
ars d
id
you
or a
ny
of y
our
fam
ily
mem
ber(
s)
bear
any
lo
ss?
Yes.
...1
No.
.....2
(g
o to
nex
t ro
w)
Cere
als
& c
ash
crop
sVe
geta
bles
Frui
tsLi
vest
ock
Orc
hard
/nu
rser
y la
ndCu
ltiva
ble
land
Affec
ted/
Dam
aged
re
siden
ce (h
ouse
, la
nd a
nd c
ow
shed
)
Oth
er lo
ss in
no
n-ag
ricul
tura
l bu
sines
ses
G13
G14
G15
G16
G17
G18
G19
G20
G21
G22
G23
01.
Drou
ght
02.
Fire
(in
fore
st)
03.
Fire
(in
com
mun
ity)
04.
Floo
d
05.
Inun
datio
n
06.
Win
dsto
rm
07.
Thun
ders
torm
08.
Hails
torm
09.
Heav
y ra
in
10.
Spor
adic
rain
11.
Eros
ion
12.
Land
slide
13.
Snow
stor
m
14.
Aval
anch
e
15.
GLO
F
16.
Heat
wav
e
17.
Cold
wav
e
18.
Dise
ase/
inse
ct
19.
Oth
ers
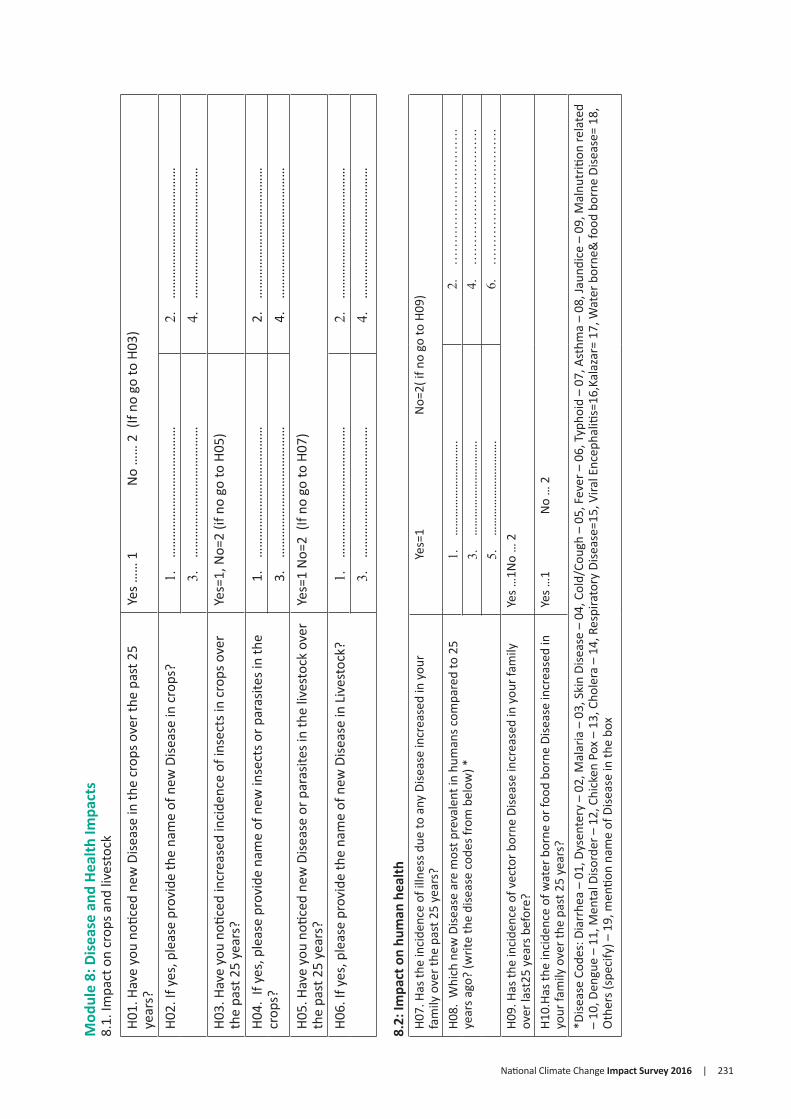
National Climate Change Impact Survey 2016 | 231
Mod
ule
8: D
isea
se a
nd H
ealth
Impa
cts
8.1.
Impa
ct o
n cr
ops a
nd li
vest
ock
H01.
Hav
e yo
u no
ticed
new
Dise
ase
in th
e cr
ops o
ver t
he p
ast 2
5 ye
ars?
Yes …
… 1
No
……
2 (
If no
go
to H
03)
H02.
If y
es, p
leas
e pr
ovid
e th
e na
me
of n
ew D
iseas
e in
cro
ps?
1.
……
……
……
……
……
……
…2.
…
……
……
……
……
……
……
3.
……
……
……
……
……
……
…4.
…
……
……
……
……
……
……
H03.
Hav
e yo
u no
ticed
incr
ease
d in
cide
nce
of in
sect
s in
crop
s ove
r th
e pa
st 2
5 ye
ars?
Yes=
1, N
o=2
(if n
o go
to H
05)
H04.
If y
es, p
leas
e pr
ovid
e na
me
of n
ew in
sect
s or p
aras
ites i
n th
e cr
ops?
1.
……
……
……
……
……
……
…2.
…
……
……
……
……
……
……
3.
……
……
……
……
……
……
…4.
…
……
……
……
……
……
……
H05.
Hav
e yo
u no
ticed
new
Dise
ase
or p
aras
ites i
n th
e liv
esto
ck o
ver
the
past
25
year
s?
Yes=
1 N
o=2
(If n
o go
to H
07)
H06.
If y
es, p
leas
e pr
ovid
e th
e na
me
of n
ew D
iseas
e in
Liv
esto
ck?
1.
……
……
……
……
……
……
…2.
…
……
……
……
……
……
……
3.
……
……
……
……
……
……
…4.
…
……
……
……
……
……
……
8.2:
Impa
ct o
n hu
man
hea
lthH0
7. H
as th
e in
cide
nce
of il
lnes
s due
to a
ny D
iseas
e in
crea
sed
in y
our
fam
ily o
ver t
he p
ast 2
5 ye
ars?
Yes=
1
N
o=2(
if n
o go
to H
09)
H08.
Whi
ch n
ew D
iseas
e ar
e m
ost p
reva
lent
in h
uman
s com
pare
d to
25
year
s ago
? (w
rite
the
dise
ase
code
s fro
m b
elow
) *1.
…
……
……
……
……
….
2.
……
……
……
……
……
.3.
…
……
……
……
……
….
4.
……
……
……
……
……
.5.
…
……
……
……
……
….
6.
……
……
……
……
……
.H0
9. H
as th
e in
cide
nce
of v
ecto
r bor
ne D
iseas
e in
crea
sed
in y
our f
amily
ov
er la
st25
yea
rs b
efor
e?Ye
s …1N
o …
2
H10.
Has t
he in
cide
nce
of w
ater
bor
ne o
r foo
d bo
rne
Dise
ase
incr
ease
d in
yo
ur fa
mily
ove
r the
pas
t 25
year
s?Ye
s …1
No
… 2
*Dise
ase
Code
s: D
iarr
hea
– 01
, Dys
ente
ry –
02,
Mal
aria
– 0
3, S
kin
Dise
ase
– 04
, Col
d/Co
ugh
– 05
, Fev
er –
06,
Typ
hoid
– 0
7, A
sthm
a –
08, J
aund
ice
– 09
, Mal
nutr
ition
rela
ted
– 10
, Den
gue
– 11
, Men
tal D
isord
er –
12,
Chi
cken
Pox
– 1
3, C
hole
ra –
14,
Res
pira
tory
Dise
ase=
15, V
iral E
ncep
haliti
s=16
,Kal
azar
= 17
, Wat
er b
orne
& fo
od b
orne
Dise
ase=
18,
O
ther
s (sp
ecify
) – 1
9, m
entio
n na
me
of D
iseas
e in
the
box
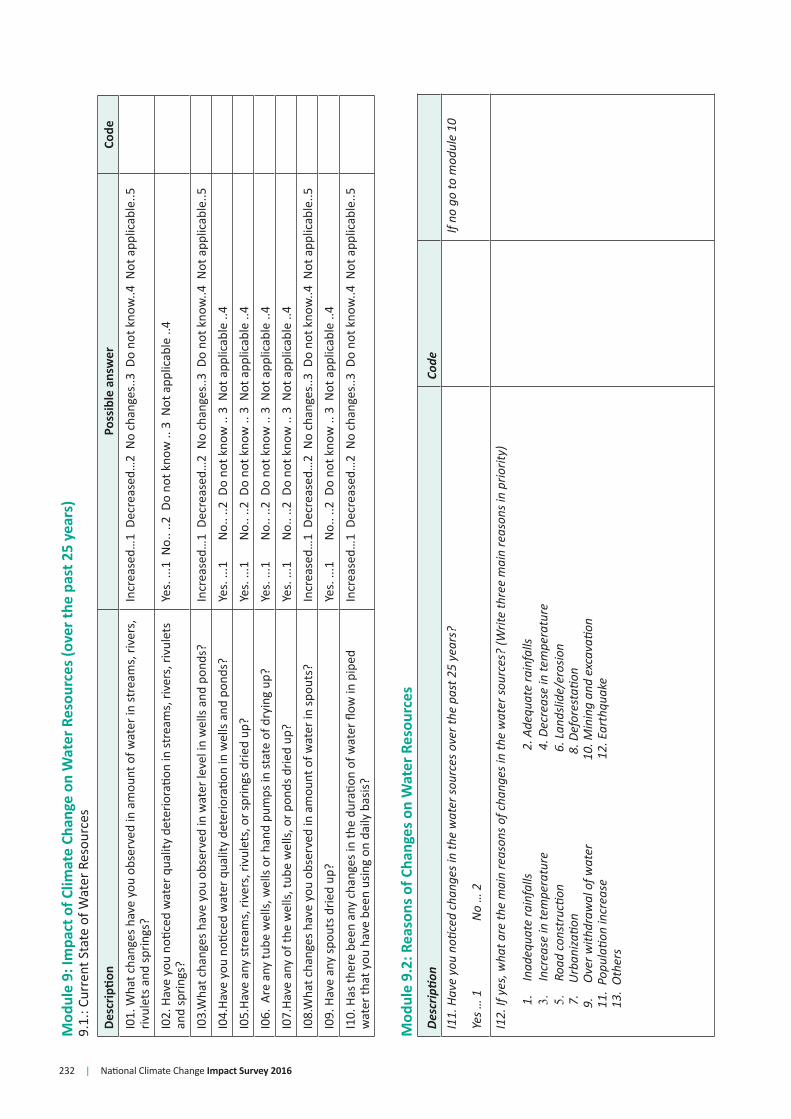
232 | National Climate Change Impact Survey 2016
Mod
ule
9: Im
pact
of C
limat
e Ch
ange
on
Wat
er R
esou
rces
(ove
r the
pas
t 25
year
s)9.
1.: C
urre
nt S
tate
of W
ater
Res
ourc
es
Desc
riptio
nPo
ssib
le a
nsw
erCo
de
I01.
Wha
t cha
nges
hav
e yo
u ob
serv
ed in
am
ount
of w
ater
in st
ream
s, ri
vers
, riv
ulet
s and
sprin
gs?
Incr
ease
d…1
Dec
reas
ed…
2 N
o ch
ange
s..3
Do
not k
now
..4 N
ot a
pplic
able
..5
I02.
Hav
e yo
u no
ticed
wat
er q
ualit
y de
terio
ratio
n in
stre
ams,
rive
rs, r
ivul
ets
and
sprin
gs?
Yes.
...1
No.
. ..2
Do
not k
now
.. 3
Not
app
licab
le ..
4
I03.
Wha
t cha
nges
hav
e yo
u ob
serv
ed in
wat
er le
vel i
n w
ells
and
pond
s?In
crea
sed…
1 D
ecre
ased
…2
No
chan
ges.
.3 D
o no
t kno
w..4
Not
app
licab
le..5
I04.
Have
you
noti
ced
wat
er q
ualit
y de
terio
ratio
n in
wel
ls an
d po
nds?
Yes.
...1
No.
. ..2
Do
not k
now
.. 3
Not
app
licab
le ..
4
I05.
Have
any
stre
ams,
rive
rs, r
ivul
ets,
or s
prin
gs d
ried
up?
Yes.
...1
No.
. ..2
Do
not k
now
.. 3
Not
app
licab
le ..
4
I06.
Are
any
tube
wel
ls, w
ells
or h
and
pum
ps in
stat
e of
dry
ing
up?
Yes.
...1
No.
. ..2
Do
not k
now
.. 3
Not
app
licab
le ..
4
I07.
Have
any
of t
he w
ells,
tube
wel
ls, o
r pon
ds d
ried
up?
Yes.
...1
No.
. ..2
Do
not k
now
.. 3
Not
app
licab
le ..
4
I08.
Wha
t cha
nges
hav
e yo
u ob
serv
ed in
am
ount
of w
ater
in sp
outs
?In
crea
sed…
1 D
ecre
ased
…2
No
chan
ges.
.3 D
o no
t kno
w..4
Not
app
licab
le..5
I09.
Hav
e an
y sp
outs
drie
d up
?Ye
s. ..
.1
N
o.. .
.2 D
o no
t kno
w ..
3 N
ot a
pplic
able
..4
I10.
Has
ther
e be
en a
ny c
hang
es in
the
dura
tion
of w
ater
flow
in p
iped
w
ater
that
you
hav
e be
en u
sing
on d
aily
bas
is?In
crea
sed…
1 D
ecre
ased
…2
No
chan
ges.
.3 D
o no
t kno
w..4
Not
app
licab
le..5
Mod
ule
9.2:
Rea
sons
of C
hang
es o
n W
ater
Res
ourc
esD
escr
ipti
onCo
de
I11.
Hav
e yo
u no
ticed
cha
nges
in th
e w
ater
sou
rces
ove
r the
pas
t 25
year
s?
Yes
… 1
N
o …
2
If no
go
to m
odul
e 10
I12.
If y
es, w
hat a
re th
e m
ain
reas
ons
of c
hang
es in
the
wat
er s
ourc
es?
(Writ
e th
ree
mai
n re
ason
s in
prio
rity)
1.
Inad
equa
te ra
infa
lls
2. A
dequ
ate
rain
falls
3.
Incr
ease
in te
mpe
ratu
re
4. D
ecre
ase
in te
mpe
ratu
re5.
Ro
ad c
onst
ructi
on
6
. Lan
dslid
e/er
osio
n7.
U
rban
izati
on
8. D
efor
esta
tion
9.
O
ver w
ithdr
awal
of w
ater
1
0. M
inin
g an
d ex
cava
tion
11.
Pop
ulati
on in
crea
se
12.
Ear
thqu
ake
13.
Oth
ers
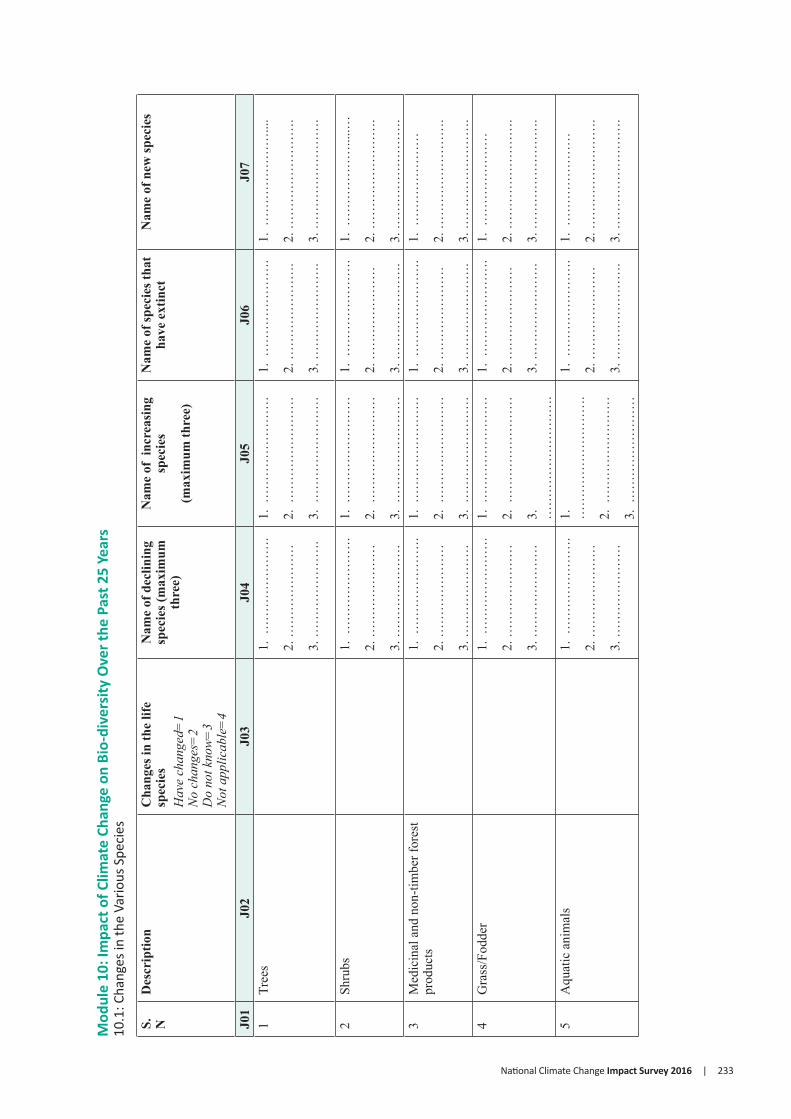
National Climate Change Impact Survey 2016 | 233
Mod
ule
10: I
mpa
ct o
f Clim
ate
Chan
ge o
n Bi
o-di
vers
ity O
ver t
he P
ast 2
5 Ye
ars
10.1
: Cha
nges
in th
e Va
rious
Spe
cies
S.
ND
escr
iptio
nC
hang
es in
the
life
spec
ies
Hav
e ch
ange
d=1
No
chan
ges=
2D
o no
t kno
w=
3 N
ot a
pplic
able
=4
Nam
e of
dec
linin
g sp
ecie
s (m
axim
um
thre
e)
Nam
e of
inc
reas
ing
spec
ies
(max
imum
thre
e)
Nam
e of
spec
ies t
hat
have
ext
inct
Nam
e of
new
spec
ies
J01
J02
J03
J04
J05
J06
J07
1Tr
ees
1. …
……
……
……
.
2. …
……
……
……
3. …
……
……
……
.
1. …
……
……
……
…
2. …
……
……
……
…
3. …
……
……
……
…
1. …
……
……
……
.
2. …
……
……
……
.
3. …
……
……
……
.
1. …
……
……
……
....
2. …
……
……
……
….
3. …
……
……
……
….
2Sh
rubs
1. …
……
……
……
.
2. …
……
……
……
3. …
……
……
……
1. …
……
……
……
…
2. …
……
……
……
…
3. …
……
……
……
…
1. …
……
……
……
.
2. …
……
……
……
3. …
……
……
……
.
1. …
……
……
…...
..…
2. …
……
……
……
….
3. …
……
……
……
….
3M
edic
inal
and
non
-tim
ber f
ores
t pr
oduc
ts1.
……
……
……
….
2. …
……
……
……
3. …
……
……
……
1. …
……
……
……
…
2. …
……
……
……
…
3. …
……
……
……
…
1. …
……
……
……
.
2. …
……
……
……
3. …
……
……
……
.
1. …
……
……
……
2. …
……
……
……
….
3. …
……
……
……
….
4G
rass
/Fod
der
1. …
……
……
……
.
2. …
……
……
……
3. …
……
……
……
1. …
……
……
……
…
2. …
……
……
……
…
3.
……
……
……
……
….
1. …
……
……
……
.
2. …
……
……
……
3. …
……
……
……
.
1. …
……
……
……
2. …
……
……
……
….
3. …
……
……
……
….
5A
quat
ic a
nim
als
1. …
……
……
……
.
2. …
……
……
……
3. …
……
……
……
1.
……
……
……
……
….
2. …
……
……
……
…
3. …
……
……
……
…
1. …
……
……
……
.
2. …
……
……
……
3. …
……
……
……
.
1. …
……
……
……
2. …
……
……
……
….
3. …
……
……
……
….

234 | National Climate Change Impact Survey 2016
6A
quat
ic p
lant
s1.
……
……
……
….
2. …
……
……
……
3. …
……
……
……
1. …
……
……
……
…
2. …
……
……
……
…
3. …
……
……
……
…
1. …
……
……
……
.
2. …
……
……
……
3. …
……
……
……
.
1. …
……
……
……
....
2. …
……
……
……
….
3. …
……
……
……
….
7W
ild li
fe1.
……
……
……
….
2. …
……
……
……
3. …
……
……
……
1. …
……
……
……
…
2. …
……
……
……
…
3. …
……
……
……
…
1. …
……
……
……
.
2. …
……
……
……
3. …
……
……
……
.
1. …
……
……
……
...
2. …
……
……
……
….
3. …
……
……
……
….
8B
irds
1. …
……
……
……
.
2. …
……
……
……
3. …
……
……
……
1. …
……
……
……
…
2. …
……
……
……
…
3. …
……
……
……
…
1. …
……
……
……
.
2.
……
……
……
……
.
3. …
……
……
……
.
1. …
……
……
……
....
2. …
……
……
……
….
3. …
……
……
……
….
9In
sect
s1.
……
……
……
….
2. …
……
……
……
3. …
……
……
……
1. …
……
……
……
…
2. …
……
……
……
…
3. …
……
……
……
…
1. …
……
……
……
.
2. …
……
……
……
3. …
……
……
……
.
1. …
……
……
……
2. …
……
……
……
….
3. …
……
……
……
….
Mod
ule
10.2
: Inf
esta
tion
Ove
r the
Pas
t 25
Year
sS.
NTy
pe o
f Ve
geta
tion
New
in
vasiv
e sp
ecie
s ha
ve
appe
ared
ov
er th
e pa
st 2
0 ye
ars
Yes=
1
No=
2
(if n
o go
to
next
row
)
Nam
e of
new
inva
sive
spec
ies
Loca
tion
of
infe
stati
on
Fore
st=1
Past
ure=
2
Agric
ultu
re=3
Wha
t is t
he m
ain
caus
e of
infe
stati
on
Nat
ural
ly sp
read
=1
Hum
an In
trod
uced
=2
Don’
t kno
w=3
Wha
t are
the
thre
e m
ain
impa
cts
of in
fest
ation
in y
our d
aily
life
?
Inco
me
redu
ction
=1Lo
ss o
f tim
ber=
2
Loss
of f
odde
r=3L
oss o
f fir
ewoo
d=4
Loss
of
bedd
ing
mat
eria
ls (s
ottar
)=5
Loss
of a
nim
al b
ed m
ater
ials=
6
Loss
of e
dibl
e sp
ecie
s of h
uman
or
wild
life=
7
No
impa
ct=8
(Cho
ose
3 op
tions
bas
ed o
n pr
iorit
y)
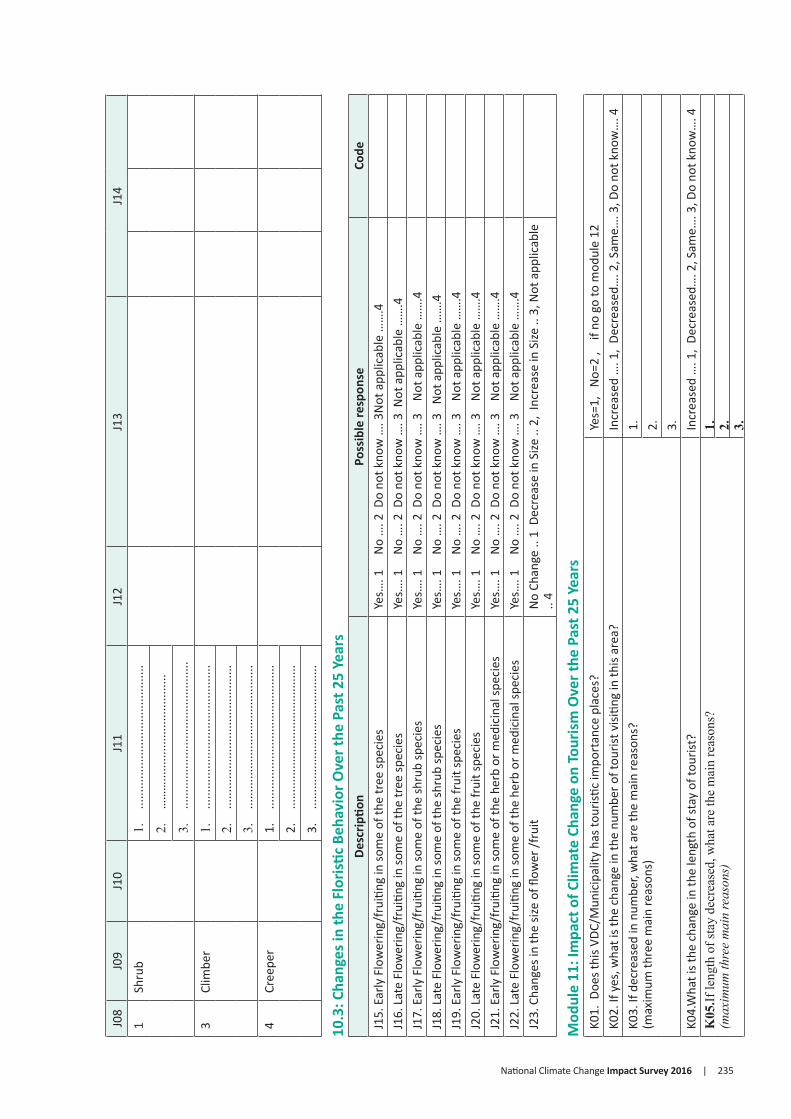
National Climate Change Impact Survey 2016 | 235
J08
J09
J10
J11
J12
J13
J14
1Sh
rub
1.
......
......
......
......
......
......
......
.
2.
……
…...
......
......
......
......
.....
3.
......
......
......
......
......
......
......
..
3Cl
imbe
r1.
...
......
......
......
......
......
......
....
2.
......
......
......
......
......
......
......
.
3.
......
......
......
......
......
......
......
.
4Cr
eepe
r1.
...
......
......
......
......
......
......
....
2.
......
......
......
......
......
......
......
.
3.
......
......
......
......
......
......
......
.
10.3
: Cha
nges
in th
e Fl
oris
tic B
ehav
ior O
ver t
he P
ast 2
5 Ye
ars
Desc
riptio
nPo
ssib
le re
spon
seCo
deJ1
5. E
arly
Flo
wer
ing/
frui
ting
in so
me
of th
e tr
ee sp
ecie
sYe
s…. 1
N
o …
. 2 D
o no
t kno
w …
. 3N
ot a
pplic
able
……
.4J1
6. L
ate
Flow
erin
g/fr
uitin
g in
som
e of
the
tree
spec
ies
Yes…
. 1
No
…. 2
Do
not k
now
…. 3
Not
app
licab
le …
….4
J17.
Ear
ly F
low
erin
g/fr
uitin
g in
som
e of
the
shru
b sp
ecie
sYe
s…. 1
N
o …
. 2 D
o no
t kno
w …
. 3
Not
app
licab
le …
….4
J18.
Lat
e Fl
ower
ing/
frui
ting
in so
me
of th
e sh
rub
spec
ies
Yes…
. 1
No
…. 2
Do
not k
now
…. 3
N
ot a
pplic
able
……
.4J1
9. E
arly
Flo
wer
ing/
frui
ting
in so
me
of th
e fr
uit s
peci
esYe
s…. 1
N
o …
. 2 D
o no
t kno
w …
. 3
Not
app
licab
le …
….4
J20.
Lat
e Fl
ower
ing/
frui
ting
in so
me
of th
e fr
uit s
peci
esYe
s…. 1
N
o …
. 2 D
o no
t kno
w …
. 3
Not
app
licab
le …
….4
J21.
Ear
ly F
low
erin
g/fr
uitin
g in
som
e of
the
herb
or m
edic
inal
spec
ies
Yes…
. 1
No
…. 2
Do
not k
now
…. 3
N
ot a
pplic
able
……
.4J2
2. L
ate
Flow
erin
g/fr
uitin
g in
som
e of
the
herb
or m
edic
inal
spec
ies
Yes…
. 1
No
…. 2
Do
not k
now
…. 3
N
ot a
pplic
able
……
.4J2
3. C
hang
es in
the
size
of fl
ower
/fru
it N
o Ch
ange
.. 1
Dec
reas
e in
Size
.. 2
, In
crea
se in
Size
.. 3
, Not
app
licab
le
.. 4
Mod
ule
11: I
mpa
ct o
f Clim
ate
Chan
ge o
n To
uris
m O
ver t
he P
ast 2
5 Ye
ars
K01.
Doe
s thi
s VDC
/Mun
icip
ality
has
tour
istic
impo
rtan
ce p
lace
s?Ye
s=1,
N
o=2
, i
f no
go to
mod
ule
12K0
2. If
yes
, wha
t is t
he c
hang
e in
the
num
ber o
f tou
rist v
isitin
g in
this
area
?In
crea
sed
…. 1
, De
crea
sed…
. 2, S
ame…
. 3, D
o no
t kno
w…
. 4
K03.
If d
ecre
ased
in n
umbe
r, w
hat a
re th
e m
ain
reas
ons?
(max
imum
thre
e m
ain
reas
ons)
1. 2. 3.K0
4.W
hat i
s the
cha
nge
in th
e le
ngth
of s
tay
of to
urist
?In
crea
sed
…. 1
, De
crea
sed…
. 2, S
ame…
. 3, D
o no
t kno
w…
. 4K
05.If
leng
th o
f sta
y de
crea
sed,
wha
t are
the
mai
n re
ason
s?(m
axim
um th
ree
mai
n re
ason
s)1. 2. 3.

236 | National Climate Change Impact Survey 2016
Mod
ule
12: F
arm
Bas
ed C
opin
g St
rate
gies
/Acti
on A
dopt
ed b
y Ho
useh
olds
Due
to Im
pact
of C
limat
e Ch
ange
Ove
r the
Pas
t 25
Year
s12
.1.:
Farm
Bas
ed
Desc
riptio
nPo
ssib
le re
spon
seCo
de
L01.
Rece
ived
farm
bas
ed sk
ill d
evel
opm
ent t
rain
ing
by y
ou o
r any
mem
ber o
f you
r fam
ily o
ver t
he p
ast 2
5 ye
ars t
o co
pe w
ith
the
impa
ct o
f clim
ate
chan
geYe
s……
…..1
No…
……
..2N
ot a
pplic
able
……
3
L02.
Cha
nged
in c
ropp
ing
patte
rn (c
hang
e in
cro
p ro
tatio
n, in
terc
ropp
ing,
) ov
er th
e pa
st 2
5 ye
ars
Yes…
……
..1N
o……
…..2
Not
app
licab
le…
…3
L03.
Left
land
fallo
wYe
s……
…..1
No…
……
..2N
ot a
pplic
able
……
3
L04.
Rea
red
lives
tock
of t
he d
iffer
ent b
reed
than
the
earli
er o
ne o
ver t
he p
ast 2
5 ye
ars
Yes…
……
..1N
o……
…..2
Not
app
licab
le…
…3
L05.
Pro
vide
d su
pple
men
tal i
rrig
ation
ove
r the
pas
t 25
year
s Ye
s……
…..1
No…
……
..2N
ot a
pplic
able
……
3
L06.
Inv
este
d in
pon
ds fo
r irr
igati
on o
ver t
he p
ast 2
5 ye
ars
Yes…
……
..1N
o……
…..2
Not
app
licab
le…
…3
L07.
Ado
pted
impr
oved
seed
s ove
r the
pas
t 25
year
s (im
prov
ed, d
roug
ht re
silie
nt, w
ater
resil
ient
var
ietie
s, e
tc.)
Yes…
……
..1N
o……
…..2
Not
app
licab
le…
…3
L08.
Cha
nge
in p
lanti
ng d
ate(
Seed
ling,
etc
.) ov
er th
e pa
st 2
5 ye
ars
Yes…
……
..1N
o……
…..2
Not
app
licab
le…
…3
L09.
Use
d in
crea
sed
amou
nt o
f ino
rgan
ic fe
rtiliz
ers i
n th
e fie
ld o
ver t
he p
ast 2
5 ye
ars
Yes…
……
..1N
o……
…..2
Not
app
licab
le…
…3
L10.
Use
d in
crea
sed
amou
nt o
f org
anic
ferti
lizer
ove
r the
pas
t 25
year
sYe
s……
…..1
No…
……
..2N
ot a
pplic
able
……
3
L11.
New
cro
ps g
row
n ov
er th
e pa
st 2
5 ye
ars
Yes…
……
..1N
o……
…..2
Not
app
licab
le…
…3
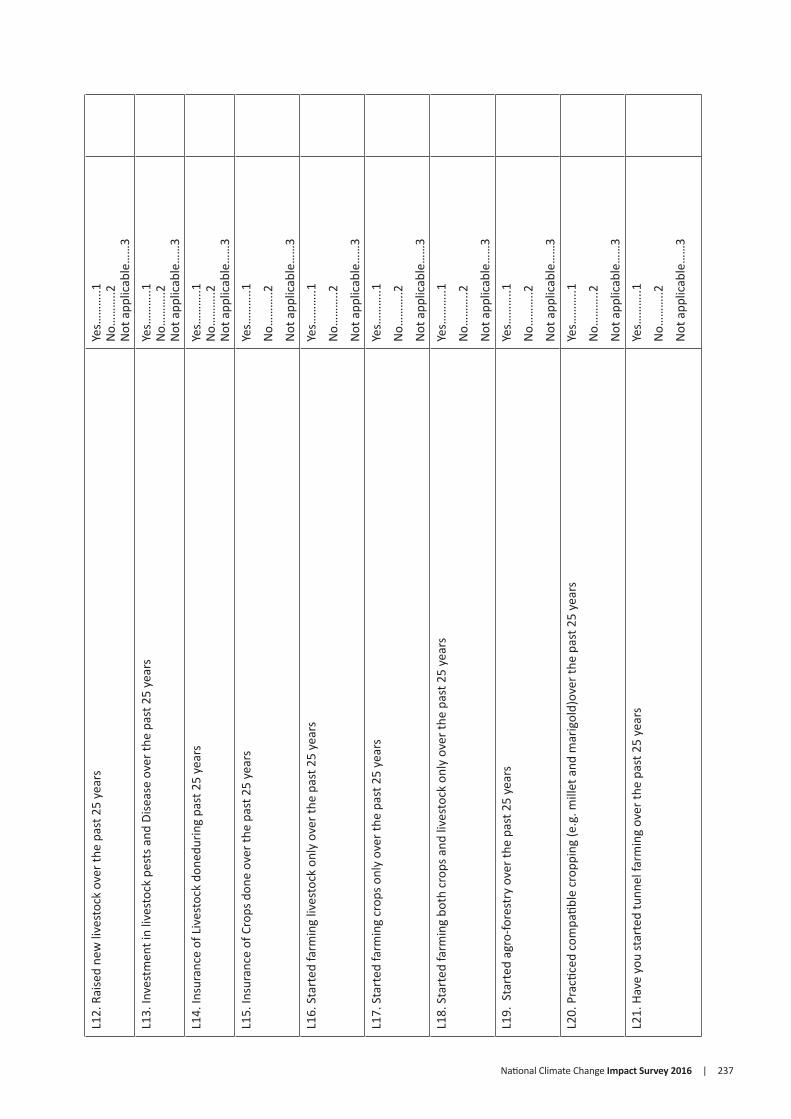
National Climate Change Impact Survey 2016 | 237
L12.
Rai
sed
new
live
stoc
k ov
er th
e pa
st 2
5 ye
ars
Yes…
……
..1N
o……
…..2
Not
app
licab
le…
…3
L13.
Inve
stm
ent i
n liv
esto
ck p
ests
and
Dise
ase
over
the
past
25
year
sYe
s……
…..1
No…
……
..2N
ot a
pplic
able
……
3
L14.
Insu
ranc
e of
Liv
esto
ck d
oned
urin
g pa
st 2
5 ye
ars
Yes…
……
..1N
o……
…..2
Not
app
licab
le…
…3
L15.
Insu
ranc
e of
Cro
ps d
one
over
the
past
25
year
sYe
s……
…..1
No…
……
..2
Not
app
licab
le…
…3
L16.
Sta
rted
farm
ing
lives
tock
onl
y ov
er th
e pa
st 2
5 ye
ars
Yes…
……
..1
No…
……
..2
Not
app
licab
le…
…3
L17.
Sta
rted
farm
ing
crop
s onl
y ov
er th
e pa
st 2
5 ye
ars
Yes…
……
..1
No…
……
..2
Not
app
licab
le…
…3
L18.
Sta
rted
farm
ing
both
cro
ps a
nd li
vest
ock
only
ove
r the
pas
t 25
year
sYe
s……
…..1
No…
……
..2
Not
app
licab
le…
…3
L19.
Sta
rted
agr
o-fo
rest
ry o
ver t
he p
ast 2
5 ye
ars
Yes…
……
..1
No…
……
..2
Not
app
licab
le…
…3
L20.
Pra
ctice
d co
mpa
tible
cro
ppin
g (e
.g. m
illet
and
mar
igol
d)ov
er th
e pa
st 2
5 ye
ars
Yes…
……
..1
No…
……
..2
Not
app
licab
le…
…3
L21.
Hav
e yo
u st
arte
d tu
nnel
farm
ing
over
the
past
25
year
sYe
s……
…..1
No…
……
..2
Not
app
licab
le…
…3
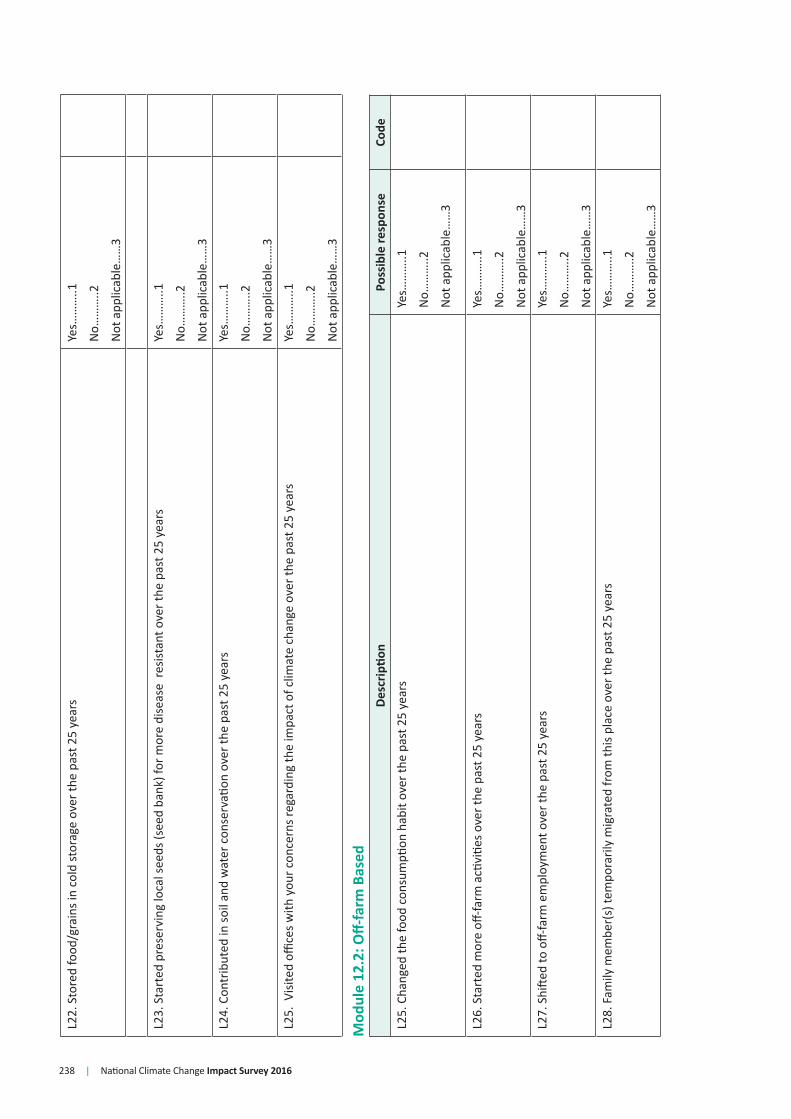
238 | National Climate Change Impact Survey 2016
L22.
Sto
red
food
/gra
ins i
n co
ld st
orag
e ov
er th
e pa
st 2
5 ye
ars
Yes…
……
..1
No…
……
..2
Not
app
licab
le…
…3
L23.
Sta
rted
pre
serv
ing
loca
l see
ds (s
eed
bank
) for
mor
e di
seas
e re
sista
nt o
ver t
he p
ast 2
5 ye
ars
Yes…
……
..1
No…
……
..2
Not
app
licab
le…
…3
L24.
Con
trib
uted
in so
il an
d w
ater
con
serv
ation
ove
r the
pas
t 25
year
sYe
s……
…..1
No…
……
..2
Not
app
licab
le…
…3
L25.
Visi
ted
office
s with
you
r con
cern
s reg
ardi
ng th
e im
pact
of c
limat
e ch
ange
ove
r the
pas
t 25
year
sYe
s……
…..1
No…
……
..2
Not
app
licab
le…
…3
Mod
ule
12.2
: Off-
farm
Bas
edDe
scrip
tion
Poss
ible
resp
onse
Code
L25.
Cha
nged
the
food
con
sum
ption
hab
it ov
er th
e pa
st 2
5 ye
ars
Yes…
……
..1
No…
……
..2
Not
app
licab
le…
…3
L26.
Sta
rted
mor
e off
-farm
acti
vitie
s ove
r the
pas
t 25
year
sYe
s……
…..1
No…
……
..2
Not
app
licab
le…
…3
L27.
Shi
fted
to o
ff-fa
rm e
mpl
oym
ent o
ver t
he p
ast 2
5 ye
ars
Yes…
……
..1
No…
……
..2
Not
app
licab
le…
…3
L28.
Fam
ily m
embe
r(s)
tem
pora
rily
mig
rate
d fr
om th
is pl
ace
over
the
past
25
year
sYe
s……
…..1
No…
……
..2
Not
app
licab
le…
…3
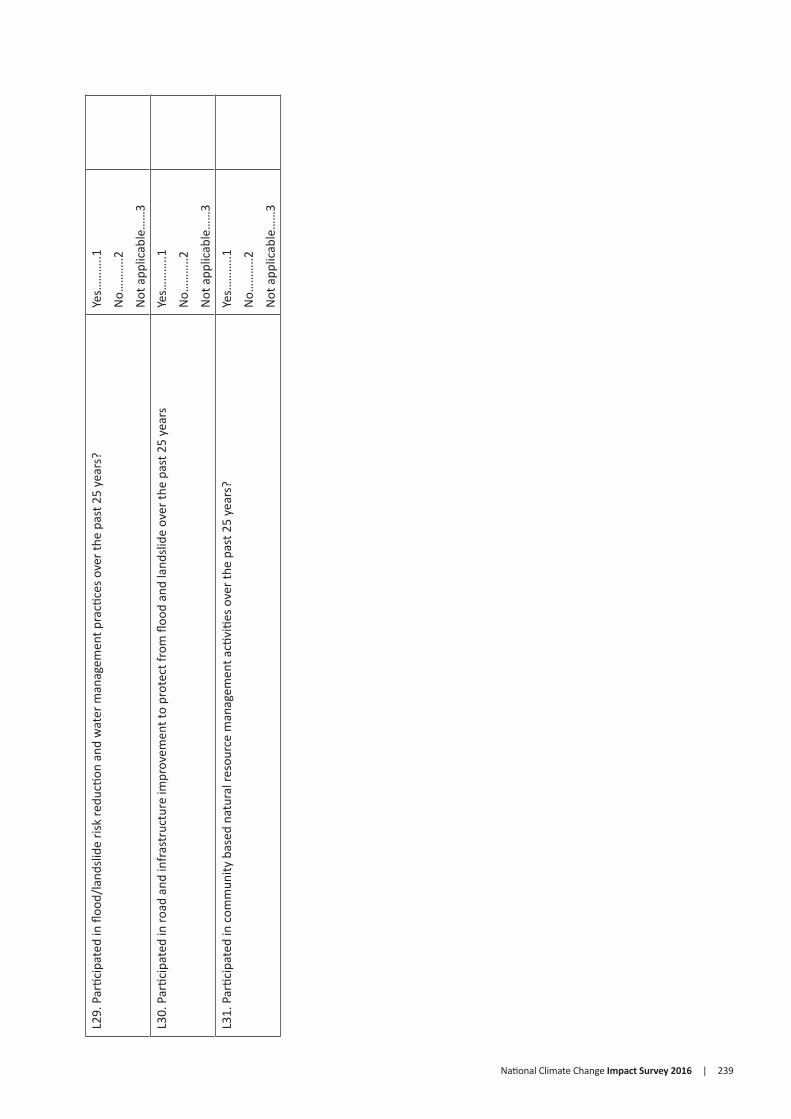
National Climate Change Impact Survey 2016 | 239
L29.
Par
ticip
ated
in fl
ood/
land
slide
risk
redu
ction
and
wat
er m
anag
emen
t pra
ctice
s ove
r the
pas
t 25
year
s?Ye
s……
…..1
No…
……
..2
Not
app
licab
le…
…3
L30.
Par
ticip
ated
in ro
ad a
nd in
fras
truc
ture
impr
ovem
ent t
o pr
otec
t fro
m fl
ood
and
land
slide
ove
r the
pas
t 25
year
sYe
s……
…..1
No…
……
..2
Not
app
licab
le…
…3
L31.
Par
ticip
ated
in c
omm
unity
bas
ed n
atur
al re
sour
ce m
anag
emen
t acti
vitie
s ove
r the
pas
t 25
year
s?Ye
s……
…..1
No…
……
..2
Not
app
licab
le…
…3

240 | National Climate Change Impact Survey 2016

National Climate Change Impact Survey 2016 | 241

Government of NepalNational Planning Commission Secretariat
Central Bureau of Statistics