national contribution · mobile operator, with over 8.4 million1 customers. established in 1988, it...
TRANSCRIPT

47Sustainability & National Contribution Report 2019
NATIONAL CONTRIBUTION
REPORT

48Sustainability & National Contribution Report 2019
Introduction
As one of the leading telecommunications groups in Asia with a presence in 11 countries and a customer base of approximately 153 million, Axiata Group Berhad makes a substantial contribution to the countries in which the Group operates. Through its investments in its portfolio of operating companies across the region, Axiata is recognised as one of the largest Foreign Direct Investors, best employer, significant taxpayer and substantial purchaser of local services where it has a digital telecommunications presence.
Over the past six years, Axiata has published an annual National Contribution Report to continuously measure the economic impact and value creation in the markets and communities served. Our national contributions represent the long-term value we have created through our investments in the local telecommunications industry, network infrastructure, talent development, environmental conservation and in society.
The National Contribution Report should be read in tandem with Axiata’s Integrated Annual Report and the Sustainability Report to understand the context in which we operate and our holistic value creation initiatives.
Report Scope and Information of the National Contribution Report 2019
This report consists of an economic impact assessment at six of Axiata’s digital telco operating companies. The report includes economic and financial analysis of Axiata’s operating companies’ contribution to the national economy, which includes an assessment of the following:
Investment and innovation for the long-term Labour productivity
Economic contribution to the nation
Talent developmentContribution to public finance
RM
Highlights of the National Contribution Report 2019
Contributed USD8.4 billion1 to the national GDPs of six countries where Axiata has a digital telco presence
Every USD1 spent on capex by the Group
translates to between USD5.2 and
USD8.5 contribution to GDP in six key operating markets
Total tax paid to government
USD1.3 billion
Employed 10,1002 employees across ASEAN and South Asia Axiata companies support both directly and indirectly,
approximately 600,000 jobs across the region.
Collective direct operational and capital expenditures
reached USD4.7 billion
Notes: 1 In previous reports, our investments in M1 and Idea were included in the calculations of overall economic contribution in the region. For this year, we have excluded their contribution as we have divested our shareholdings in M1 and Idea 2 Total employee headcount at Axiata (including ADL, ADS and Suvitech) as at 31 Dec 2019 was 12,976. Our six digital telco operations accounts for over 10,100 employees
49Sustainability & National Contribution Report 2019
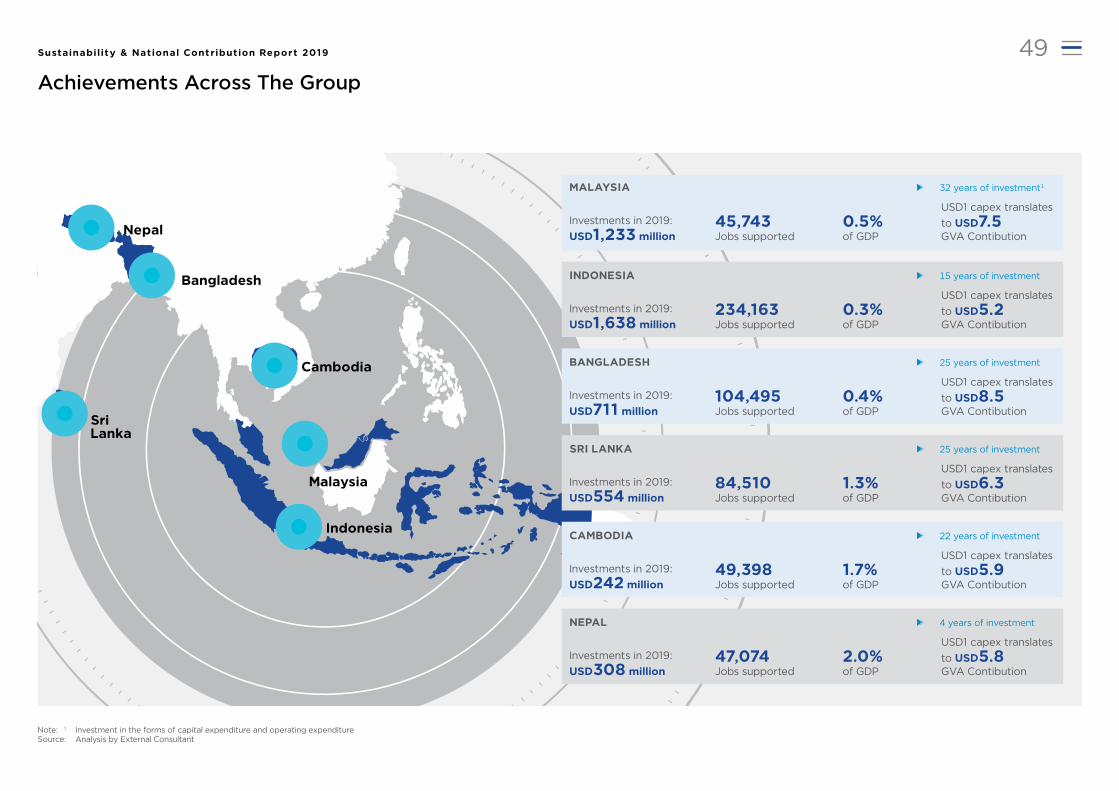
Achievements Across The Group
Malaysia
Cambodia
Nepal
Bangladesh
Indonesia
Sri Lanka
Investments in 2019:
USD1,233 million
USD1 capex translates
to USD7.5GVA Contibution
45,743 Jobs supported
0.5%of GDP
MALAYSIA 32 years of investment1
Investments in 2019:
USD1,638 million
USD1 capex translates
to USD5.2GVA Contibution
234,163 Jobs supported
0.3%of GDP
INDONESIA 15 years of investment
Investments in 2019:
USD711 million
USD1 capex translates
to USD8.5GVA Contibution
104,495 Jobs supported
0.4%of GDP
BANGLADESH 25 years of investment
Investments in 2019:
USD554 million
USD1 capex translates
to USD6.3GVA Contibution
84,510 Jobs supported
1.3%of GDP
SRI LANKA 25 years of investment
Investments in 2019:
USD242 million
USD1 capex translates
to USD5.9GVA Contibution
49,398 Jobs supported
1.7%of GDP
CAMBODIA 22 years of investment
Investments in 2019:
USD308 million
USD1 capex translates
to USD5.8GVA Contibution
47,074 Jobs supported
2.0%of GDP
NEPAL 4 years of investment
Note: 1 Investment in the forms of capital expenditure and operating expenditure Source: Analysis by External Consultant

Sustainability & National Contribution Report 2019
Malaysia
Celcom is Malaysia’s first private mobile operator, with over 8.4 million1 customers. Established in 1988, it boasts the widest national 2G, 3G and 4G LTE networks, covering over 98% of the population. Celcom is now moving towards integrated multi-access and multimedia services and Internet of Things solutions, in line with evolving technologies and consumer behaviour in Malaysia. A culture that places the customer FIRST™ is reflected in our award-winning customer service, products, and other corporate accolades at a regional level.
National Contribution
Contribution to Gross Value Added
USD1,844 MILLION(0.5% OF THE NATION’S GDP)
Direct Employees
TOTAL
2,704 STAFF
Female:
48%
Malaysians:
99.5%
Total Jobs Supported
TOTAL
45,743 JOBS
Capital + Operating Expenditure
USD1,233 MILLION
Capital Expenditure:
USD246 million
Operating Expenditure:
USD987 million
translates to
Every USD1spent on capex
USD7.5GVA Contribution2
50Sustainability & National Contribution Report 2019
Operational Direct GVA:
USD813 million
Capital Investment GVA:
USD198 million
Operational Indirect and Induced GVA:
USD774 million
Productivity GVA:
USD59 million
Notes: 1 Excludes Mobile Virtual Network (MNVO) subcribers on Celcom’s network 2 Including GDP contribution from market penetration related productivity impact 3 Total tax revenue for the federal government in 2019 was estimated at RM26,300 million (USD63,583). (Source: Ministry of Finance, Malaysia)
Directly Employed:
2,704Operational Indirectly Supported:
32,431Supported by Capital Investment:
10,607
Contribution to Public Finance
USD206 million(0.3% of total tax revenue of the Malaysian Federal Government3)
Click to watch more from our Chief Executive Officer, Celcom Axiata

51Sustainability & National Contribution Report 2019
Malaysia
CELCOM’S TOTAL ECONOMIC CONTRIBUTION TO THE MALAYSIAN ECONOMY
CELCOM’S TOTAL ECONOMIC CONTRIBUTION OVER THE LAST FIVE YEARS
INVESTING AND INNOVATING FOR THE LONG-TERM
Figure 1: GVA contribution to the Malaysian economy 2019
Figure 2: GVA contribution to the Malaysian economy 2015-2019
Figure 3: Total capital investment 2015-2019
Celcom’s substantial operations and investments in Malaysia contributed USD1.8 billion to Malaysia’s GDP in 2019. With a total operating expenditure of USD987 million and capital investment of USD246 million, Celcom’s total Gross Value Added (GVA) contribution to Malaysia’s economy was estimated at USD1,844 million in 2019, accounting for 0.5% of national GDP.
Celcom’s operations directly contributed USD813 million, accounting for 44% of total GVA contribution. It also indirectly contributed USD774 million to economic activity in Malaysia through the inputs it purchased from local suppliers. This indicates that for every USD1 Celcom directly added to Malaysia’s economy, it generated just under another USD1 indirectly through purchasing goods and services from Malaysian suppliers, higher than the general industry average of USD0.8.1 USD198 million GVA was generated by Celcom’s capital investment, accounting for 11% of total contribution. Productivity improvement contributed a further USD59 million. (Figure 1)
Celcom’s total GVA contribution fell from USD2,233 million in 2015 to USD1,844 million in 2019 with a decreasing share of the country’s GDP from 0.7 to 0.5%. This was mainly due to a decline in Celcom’s operating profits and mobile penetration rate in Malaysia.
Over the last five years, total operating profits contracted by 20.0% and mobile penetration rate decreased by 13.4 percentage points. Meanwhile, the market share of Celcom’s penetration dropped from 28% to 20%.
However, total GVA contribution grew by 2.6% in 2019 mainly due to the productivity improvement resulting from increased mobile subscribers. (Figure 2)
Total accumulated capital investment by Celcom over the last five years reached USD1,356 million. In 2019, Celcom continued to make significant investments of USD246 million. This continuous investment supports Celcom’s long-term development, and ongoing significant contribution to the Malaysian economy. (Figure 3)
44%
42%
3%
11%
Notes: 1 Based on simple average of general industry 2 Totals may not add up due to roundingSource: Analysis by External Consultant; OECD 2011 Source: Analysis by External Consultant; GSMA Intelligence Source: Axiata
GVA by capital investment
Operational indirect and induced GVA
Productivity
Operational direct GVA
As a % of total GDP
2015
228
2016
321
2017
299
2019
246
2018
262
US
D m
illio
n
USD813 million Operational direct GVA
USD774 million Operational indirect and induced GVA
USD59 million Productivity
USD198 million GVA by capital investment
2,000
2,500
1,500
1,000
500
0
US
D m
illio
n
2015
2,233
2016
0.7%
1,762
2017
0.6%
1,634
2018
0.5%
2019
1,797
0.5% 0.5%
1,844
USD
1,844 million2

52Sustainability & National Contribution Report 2019
Malaysia
CONTRIBUTIONS TO PUBLIC FINANCE TOTAL EMPLOYMENT IMPACT CELCOM’S LABOUR PRODUCTIVITY
Figure 4: Total tax contributions to public finance 2015-2019 Figure 5:
Total employment impact 2019
Figure 6: Celcom’s labour productivity 2015-2019
Total accumulated tax contributions to public finance over the last five years reached USD1,032 million. Annual tax contributions has fallen since 2015 due to falling operating profits, but rebounded in 2018. This is mainly due to a 17.5% increase in Celcom’s operating profits in 2018.
In 2019, Celcom contributed USD206 million in tax, accounting for 0.3% of total tax revenue of the Malaysian Federal Government. (Figure 4)
Celcom directly provided 2,704 jobs in 2019. The firm was predominantly run by Malaysian citizens with 99.5% of total employees being Malaysian. Around 48% of Celcom employees were female, higher than the national level recorded at 39%.
Celcom’s operations indirectly supported an additional 32,431 jobs in Malaysia through its suppliers and a further 10,607 jobs were supported by Celcom’s capital investments. The total number of employees supported slightly decreased from 46,334 in 2018 to 45,743 in 2019. (Figure 5)
Celcom’s productivity, measured as Gross Value Added (GVA) per employee, reached USD300,514 in 2019, representing a CAGR of 5.4% from USD243,099 in 2015.
Celcom’s productivity slightly increased by 0.9% in 2019. The increase of productivity likely result from Celcom’s digital transformation strategy, strong levels of digital diffusion and upskilling of the workforce. (Figure 6)
Source: Axiata and Analysis by External Consultant
Total tax and fees paid to government
As a % of total government revenue
0.2%0.4%0.5%
0.3%0.4%
US
D m
illio
n
124
2017
200
2016
288
2015 2019
206
2018
215
32,431 Operational indirectly supported
10,607 Supported by capital investment
2,704Directly employed
6%
71%
23%
Note: 1 Totals may not add up due to roundingSource: Analysis by External Consultant
Source: Analysis by External Consultant
2015
243,099
2016
208,819
2017
204,964
2019
300,514
2018
297,782
US
D
45,743 Jobs Supported1

Sustainability & National Contribution Report 2019
Indonesia
XL Axiata is the second largest telecommunications company in Indonesia by market capitalisation. XL Axiata offers an array of innovative telecommunications products and services ranging from voice, SMS, Value Added Service (VAS) to mobile data covering more than 90% of population throughout Indonesia. With over 20 years’ experience, XL Axiata is credited with bringing cellular services that allow middle and lower-income groups access to cellular services. XL Axiata continues to innovate and transform itself into a leading mobile data provider to serve the burgeoning demand for data amongst Indonesians.
National Contribution
Direct Employees
TOTAL
1,606 STAFF
Female:
30%
Indonesian:
99%
Capital + Operating Expenditure
USD 1,638 MILLION
Capital Expenditure:
USD566 million
Operating Expenditure:
USD1,072 million
translates to
Every USD1spent on capex
USD5.2GVA Contribution1
Contribution to Public Finance
USD211 million(0.2% of total tax revenue of the Indonesian government2)
Contribution to Gross Value Added
USD2,957 MILLION(0.3% OF THE NATION’S GDP)
Operational Indirect and Induced GVA:
USD729 million
Operational Direct GVA:
USD797 million
Capital Investment GVA:
USD511 million
Productivity GVA:
USD921 million
Total Jobs Supported
TOTAL
234,163 JOBS
Directly Employed:
1,606Operational Indirectly Supported:
84,190Supported by Capital Investment:
148,367
53Sustainability & National Contribution Report 2019
Notes: 1 Including GDP contribution from market penetration related productivity impact 2 Total general government tax revenue in Indonesia was Rp 1,643 trillion (USD116.2 billion) (Source: Statistics Indonesia, Actual government revenue)
Click to watch more from our President Director, XL Axiata

54Sustainability & National Contribution Report 2019
Indonesia
XL’S TOTAL ECONOMIC CONTRIBUTION TO THE INDONESIAN ECONOMY
XL’S TOTAL ECONOMIC CONTRIBUTION OVER THE LAST FIVE YEARS
INVESTING AND INNOVATING FOR THE LONG-TERM
Figure 1: GVA contribution to the Indonesian economy 2019
Figure 2: GVA contribution to the Indonesian economy 2015-2019
Figure 3: Total capital investment 2015-2019
Led by XL’s total operating expenditure of USD1,072 million and capital investment of USD566 million, the company’s total Gross Value Added (GVA) contribution to Indonesia’s economy was USD2,957 million, accounting for 0.3% of national GDP.
XL’s operations directly contributed USD797 million, accounting for 27% of total GVA contribution. Another USD729 million was indirectly generated through the expenditures by XL’s suppliers. For every USD1 XL contributed directly to Indonesia’s economy, another USD0.9 was generated indirectly through local suppliers, higher than a general industry of USD0.61.
A further USD511 million was contributed by XL’s capital investment with a share of 17% of total GVA contribution. GVA contribution from productivity improvement was estimated at USD921 million, accounting for 31% of total GVA contribution. (Figure 1)
XL’s total GVA contribution increased from USD2,563 million in 2015 to USD4,586 million in 2017. However, the contribution decreased to USD2,043 million in 2018, mainly due to a drop in the national mobile subscriptions as a result of the new national SIM card registration decree. For 2018’s contribution, productivity increase from fixed broadband penetration was included. The GVA contribution from productivity improvement was USD318 million1 with fixed broadband subscription grew by 12.8% from 2017 to 2018.
In 2019, total GVA contribution increased to USD2,957 million, as the mobile subscription bounced back to 338.2 million from 323.5 million in 2018 and XL’s operational profit increased from USD603 million to USD706 million. (Figure 2)
Total accumulated capital investment by XL over the last five years reached USD2,429 million. In 2019, capital investment increased by 18.4% from USD478 million to USD566 million. Over 2015 to 2019, capital investment grew from USD362 million to USD566 million. (Figure 3)
USD797 million Operational direct GVA
USD729 million Operational indirect and induced GVA
USD921 million Productivity
USD511 million GVA by capital investment
Notes: 1 Based on simple average of general industry 2 Totals may not add up due to roundingSource: Analysis by External Consultant; Statistics Indonesia 2010
Source: Axiata
6,000
4,000
2,000
0
US
D m
illio
n
2015
2,563
2016
4,006
2017
4,586
2018 2019
2,957
2,043
0.3% 0.4% 0.5%0.3%
0.2%
2015
362
2016
487
2017
537
2019
566
2018
478
US
D m
illio
n
Note: 1 Fixed broadband subscription numbers were revised by EIUSource: Analysis by External Consultant; GSMA Intelligence; EIU
GVA by capital investment
Operational indirect and induced GVA
Productivity
Operational direct GVA
As a % of total GDP
27%
25%
17%
31%
USD
2,957 million2
55Sustainability & National Contribution Report 2019
Indonesia
CONTRIBUTIONS TO PUBLIC FINANCE TOTAL EMPLOYMENT IMPACT XL’S LABOUR PRODUCTIVITY
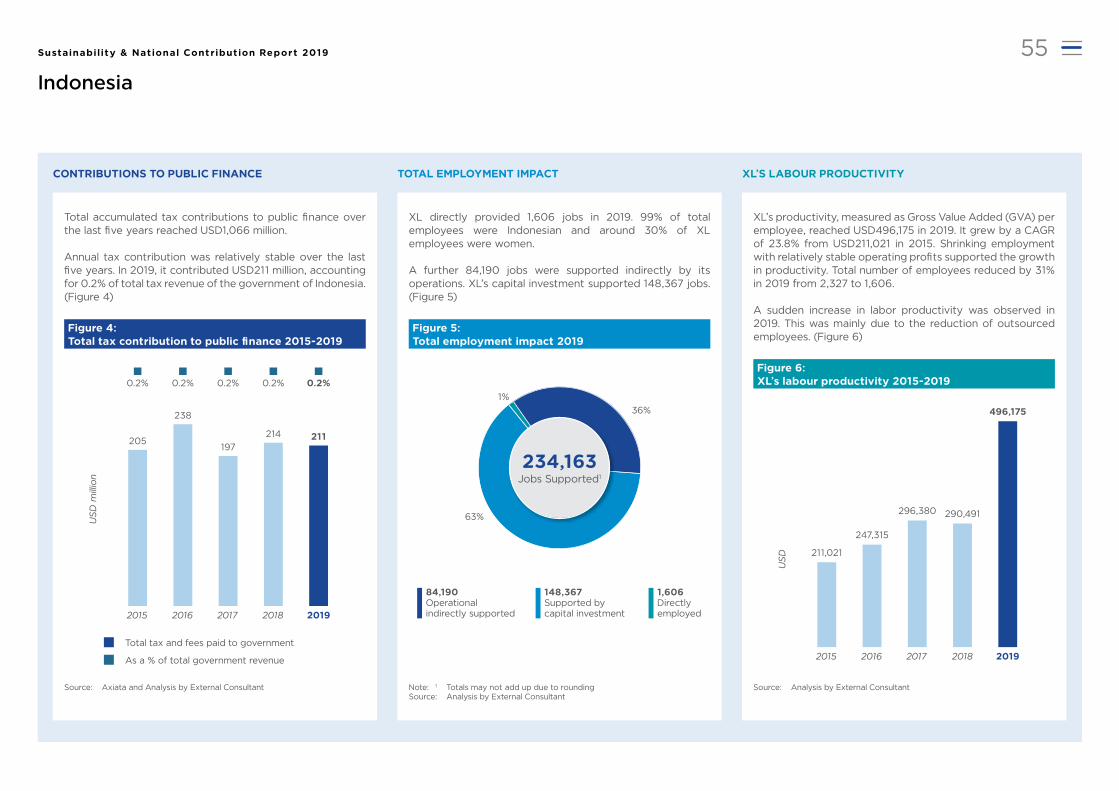
Figure 4: Total tax contribution to public finance 2015-2019
Total accumulated tax contributions to public finance over the last five years reached USD1,066 million.
Annual tax contribution was relatively stable over the last five years. In 2019, it contributed USD211 million, accounting for 0.2% of total tax revenue of the government of Indonesia. (Figure 4)
Total tax and fees paid to government
As a % of total government revenue
Source: Axiata and Analysis by External Consultant
US
D m
illio
n
0.2%
197
2017
0.2%
205
2015
0.2%
238
2016
0.2%
2019
211
0.2%
2018
214
Figure 5: Total employment impact 2019
Figure 6: XL’s labour productivity 2015-2019
XL directly provided 1,606 jobs in 2019. 99% of total employees were Indonesian and around 30% of XL employees were women.
A further 84,190 jobs were supported indirectly by its operations. XL’s capital investment supported 148,367 jobs. (Figure 5)
XL’s productivity, measured as Gross Value Added (GVA) per employee, reached USD496,175 in 2019. It grew by a CAGR of 23.8% from USD211,021 in 2015. Shrinking employment with relatively stable operating profits supported the growth in productivity. Total number of employees reduced by 31% in 2019 from 2,327 to 1,606.
A sudden increase in labor productivity was observed in 2019. This was mainly due to the reduction of outsourced employees. (Figure 6)
Source: Analysis by External Consultant
84,190Operational indirectly supported
148,367 Supported by capital investment
1,606 Directly employed
2015
211,021
2016
247,315
2017
296,380
2019
496,175
2018
290,491
US
D
36%
63%
1%
234,163 Jobs Supported1
Note: 1 Totals may not add up due to roundingSource: Analysis by External Consultant
Sustainability & National Contribution Report 2019
Sri Lanka
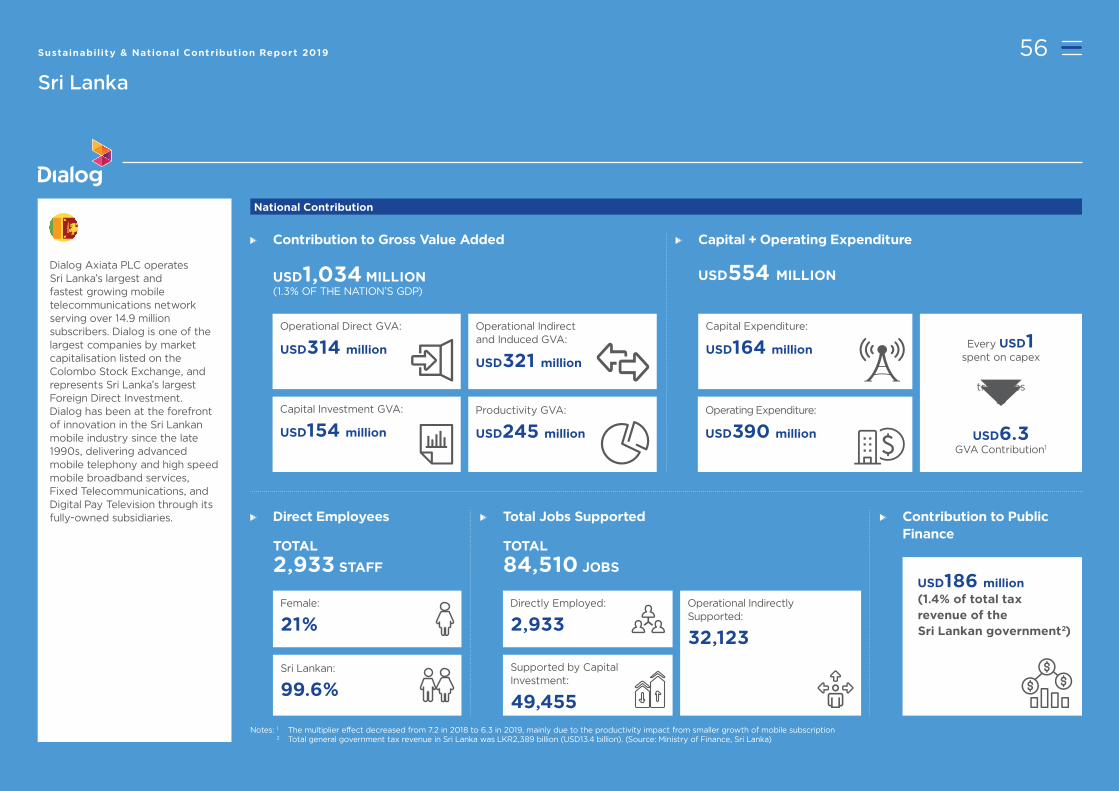
Dialog Axiata PLC operates Sri Lanka’s largest and fastest growing mobile telecommunications network serving over 14.9 million subscribers. Dialog is one of the largest companies by market capitalisation listed on the Colombo Stock Exchange, and represents Sri Lanka’s largest Foreign Direct Investment. Dialog has been at the forefront of innovation in the Sri Lankan mobile industry since the late 1990s, delivering advanced mobile telephony and high speed mobile broadband services, Fixed Telecommunications, and Digital Pay Television through its fully-owned subsidiaries.
National Contribution
Capital + Operating Expenditure
USD554 MILLION
Capital Expenditure:
USD164 million
Operating Expenditure:
USD390 million
translates to
Every USD1spent on capex
USD6.3GVA Contribution1
Contribution to Gross Value Added
USD1,034 MILLION(1.3% OF THE NATION’S GDP)
Operational Indirect and Induced GVA:
USD321 million
Productivity GVA:
USD245 million
Operational Direct GVA:
USD314 million
Capital Investment GVA:
USD154 million
Direct Employees
TOTAL
2,933 STAFF
Female:
21%
Sri Lankan:
99.6%
Contribution to Public Finance
USD186 million(1.4% of total tax revenue of the Sri Lankan government2)
Total Jobs Supported
TOTAL
84,510 JOBS
Operational Indirectly Supported:
32,123
Directly Employed:
2,933
Supported by Capital Investment:
49,455
56Sustainability & National Contribution Report 2019
Notes: 1 The multiplier effect decreased from 7.2 in 2018 to 6.3 in 2019, mainly due to the productivity impact from smaller growth of mobile subscription 2 Total general government tax revenue in Sri Lanka was LKR2,389 billion (USD13.4 billion). (Source: Ministry of Finance, Sri Lanka)
57Sustainability & National Contribution Report 2019
Sri Lanka
DIALOG’S TOTAL ECONOMIC CONTRIBUTION TO THE SRI LANKA ECONOMY
DIALOG’S TOTAL ECONOMIC CONTRIBUTION OVER THE LAST FIVE YEARS
INVESTING AND INNOVATING FOR THE LONG-TERM
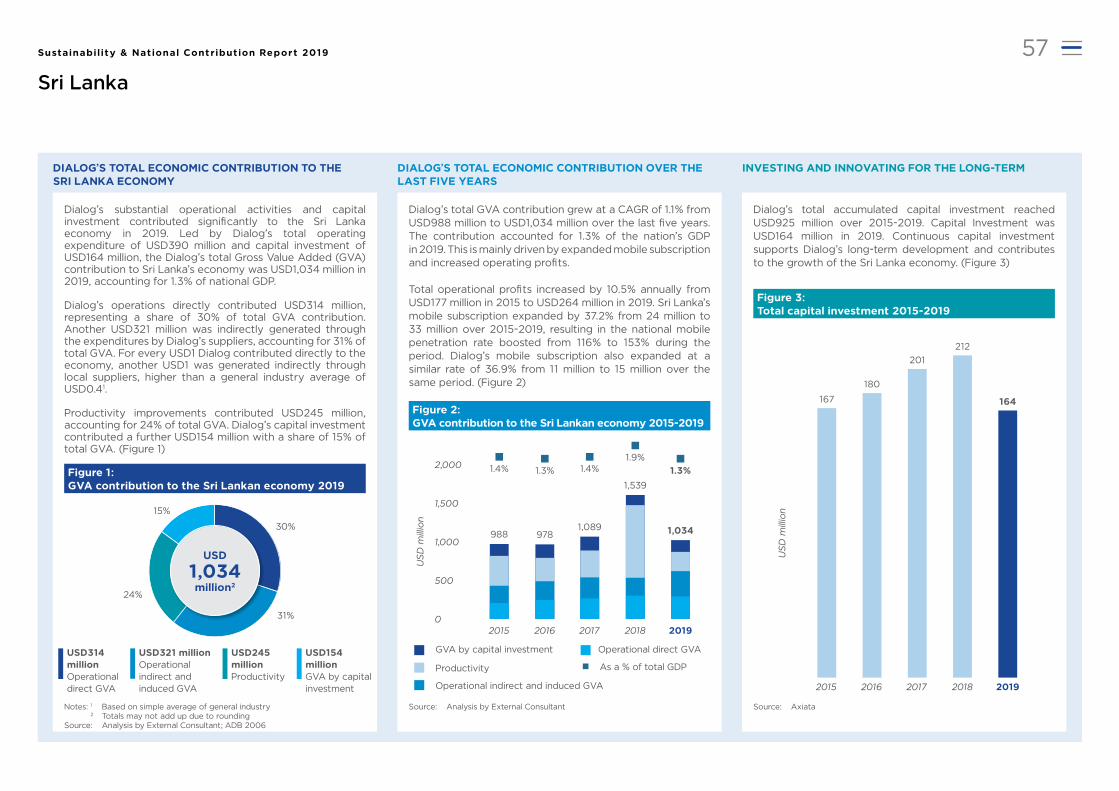
Figure 1: GVA contribution to the Sri Lankan economy 2019
Figure 2: GVA contribution to the Sri Lankan economy 2015-2019
Figure 3: Total capital investment 2015-2019
Dialog’s substantial operational activities and capital investment contributed significantly to the Sri Lanka economy in 2019. Led by Dialog’s total operating expenditure of USD390 million and capital investment of USD164 million, the Dialog’s total Gross Value Added (GVA) contribution to Sri Lanka’s economy was USD1,034 million in 2019, accounting for 1.3% of national GDP.
Dialog’s operations directly contributed USD314 million, representing a share of 30% of total GVA contribution. Another USD321 million was indirectly generated through the expenditures by Dialog’s suppliers, accounting for 31% of total GVA. For every USD1 Dialog contributed directly to the economy, another USD1 was generated indirectly through local suppliers, higher than a general industry average of USD0.41.
Productivity improvements contributed USD245 million, accounting for 24% of total GVA. Dialog’s capital investment contributed a further USD154 million with a share of 15% of total GVA. (Figure 1)
Dialog’s total GVA contribution grew at a CAGR of 1.1% from USD988 million to USD1,034 million over the last five years. The contribution accounted for 1.3% of the nation’s GDP in 2019. This is mainly driven by expanded mobile subscription and increased operating profits.
Total operational profits increased by 10.5% annually from USD177 million in 2015 to USD264 million in 2019. Sri Lanka’s mobile subscription expanded by 37.2% from 24 million to 33 million over 2015-2019, resulting in the national mobile penetration rate boosted from 116% to 153% during the period. Dialog’s mobile subscription also expanded at a similar rate of 36.9% from 11 million to 15 million over the same period. (Figure 2)
Dialog’s total accumulated capital investment reached USD925 million over 2015-2019. Capital Investment was USD164 million in 2019. Continuous capital investment supports Dialog’s long-term development and contributes to the growth of the Sri Lanka economy. (Figure 3)
USD314 million Operational direct GVA
USD321 million Operational indirect and induced GVA
USD245 million Productivity
USD154 million GVA by capital investment
Notes: 1 Based on simple average of general industry 2 Totals may not add up due to roundingSource: Analysis by External Consultant; ADB 2006
2,000
1,000
1,500
500
0
US
D m
illio
n
2017 2018 20192015 2016
1.3% 1.4% 1.3%1.9%
1.4%
9781,089 1,034
1,539
988
2015
167
2016
180
2017
201
2019
164
2018
212
US
D m
illio
n
Source: Analysis by External Consultant Source: Axiata
GVA by capital investment
Operational indirect and induced GVA
Productivity
Operational direct GVA
As a % of total GDP
30%
31%
15%
24%
USD
1,034 million2

58Sustainability & National Contribution Report 2019
Sri Lanka
CONTRIBUTIONS TO PUBLIC FINANCE TOTAL EMPLOYMENT IMPACT DIALOG’S LABOUR PRODUCTIVITY
Figure 4: Total tax contribution to public finance 2015-2019
From 2015 to 2019, Dialog has contributed USD1,046 million of taxes and fees to public finance. Annual tax contributions slightly decreased over the period.
In 2019, Dialog contributed USD186 million in tax, accounting for 1.4% of total tax revenue of Sri Lanka’s government. (Figure 4)
Total tax and fees paid to government
As a % of total government revenue
Source: Axiata and Analysis by External Consultant Note: 1 Totals may not add up due to roundingSource: Analysis by External Consultant
Source: Analysis by External Consultant
2019
US
D m
illio
n
234
2017
1.9%
217
2016
1.9%
198
2015
1.9%
1.4%
186
2018
1.6%
210
Figure 5: Total employment impact 2019
Figure 6: Dialog’s labour productivity 2015-2019
Dialog’s direct operations generated 2,933 jobs in 2019. 21% of the total employees were female. Dialog was dominated by Sri Lankan as 99.6% of total employees were locals.
A further 32,123 jobs were supported indirectly by Dialog’s operations. Its capital investment supported 49,455 jobs. (Figure 5)
Dialog’s productivity, measured as Gross Value Added (GVA) per employee, grew by a CAGR of 15.3% from USD60,445 in 2015 to USD106,897 in 2019.
A significant increase in labor productivity of 37.1% was observed for 2019 due to shrinking employment with relatively stable operating profits. Total number of employees reduced by 28% from 4,095 in 2018 to 2,933 in 2019. (Figure 6)
32,123Operational indirectly supported
49,455 Supported by capital investment
2,933Directly employed
2015
60,445
2016
64,475
2017
69,062
2019
106,897
2018
77,944
US
D
3%
38%
59%
84,510 Jobs Supported1

Sustainability & National Contribution Report 2019
Bangladesh
Robi is the second largest mobile network operator, serving more than 49 million subscribers. Robi has been the leader in Bangladesh in rolling out innovative and new solutions. It was the first operator to introduce GPRS, 3.5G services and the first to launch 4.5G service in all the 64 districts of the country. By the end of 2018, Robi created the largest 4.5G network of the country with nearly 8,910 sites covering 93% of the country. It is the only mobile operator to have successfully conducted the trial run of 5G and Voice over LTE technology on its 4.5G network.
National Contribution
Contribution to Gross Value Added
USD1,439 MILLION(0.4% OF THE NATION’S GDP)
Capital + Operating Expenditure
USD711 MILLION
Capital Expenditure:
USD168 million
Operating Expenditure:
USD542 million
translates to
Every USD1spent on capex
USD8.5GVA Contribution1
Operational Indirect and Induced GVA:
USD370 million
Productivity GVA:
USD483 million
Operational Direct GVA:
USD396 million
Capital Investment GVA:
USD191 million
Direct Employees
TOTAL
1,518 STAFF
Female:
11%
Bangladeshi:
99.7%
Total Jobs Supported
TOTAL
104,495 JOBS
Operational Indirectly Supported:
70,756
Directly Employed:
1,518
Supported by Capital Investment:
32,221
Contribution to Public Finance
USD327 million(0.8% of total tax revenue of the government of Bangladesh2)
59Sustainability & National Contribution Report 2019
Notes: 1 Including GDP contribution from market penetration related productivity impact 2 Total government tax revenue was BDT3,256 billion (USD39 billion). (Source: Budget 2019-2020, Ministry of Finance, Bangladesh)

60Sustainability & National Contribution Report 2019
Bangladesh
ROBI’S TOTAL ECONOMIC CONTRIBUTION TO THE BANGLADESH ECONOMY
ROBI’S TOTAL ECONOMIC CONTRIBUTION OVER THE LAST FIVE YEARS
INVESTING AND INNOVATING FOR THE LONG-TERM
Figure 1: GVA contribution to the Bangladesh economy 2019
Figure 2: GVA contribution to the Bangladesh economy 2015-2019
Robi’s substantial operations and investments in Bangladesh contributed significantly to the country’s economic growth. With a total operating expenditure of USD542 million and capital investment of USD168 million, Robi contributed USD1,439 million to the economy of Bangladesh in 2019, accounting for 0.4% of national GDP.
Robi’s operations directly contributed USD396 million, accounting for 28% of total GVA contribution. Another USD370 million was indirectly generated through the expenditures by Robi’s suppliers. For every USD1 that Robi directly added to Bangladesh economy, it generated just under another USD1 indirectly from local suppliers, higher than an average of USD0.4 for general industry1.
Productivity improvements contributed USD483 million, accounting for 34% of total GVA. Capital investment contributed a further USD191 million, representing a share of 13% of the total GVA. (Figure 1)
Robi’s total GVA contribution grew at a CAGR of 3.5% from USD1,253 million in 2015 to USD1,439 million in 2019, representing a 0.4% of the national GDP in 2019. Total GVA dropped in 2016 to USD721 million, mainly due to the fluctuation of mobile penetration rate in Bangladesh.
Robi’s total GVA grew by 2.2% over 2018-2019 from USD1,408 million. This is mainly due to an increase of operating profits over the period. GVA contribution from productivity impact contracted in 2019, mainly due to the slower growth of mobile penetration rate. (Figure 2)
USD396 million Operational direct GVA
USD370 million Operational indirect and induced GVA
USD483 million Productivity
USD191 million GVA by capital investment
Notes: 1 Based on simple average of general industry 2 Totals may not add up due to roundingSource: Analysis by External Consultant; ADB 2006
28%
26%
13%
34%
2,000
1,000
1,500
500
0
US
D m
illio
n
721
2017
1,707
2018 2019
1,4391,408
2015
1,253
2016
0.3%
0.7%0.4%0.5%0.6%
Figure 3: Total capital investment 2015-2019
Robi’s capital investment was USD168 million in 2019. The total accumulated capital investment reached USD1,225 million over the last five years. Capital investment plays an important role in facilitating long-term sustainable development of Robi’s business and contributing to the growth of the Bangladesh economy. (Figure 3)
2015
256
2016
254
2017
298
2019
168
2018
249
US
D m
illio
n
Source: Analysis by External Consultant
GVA by capital investment
Operational indirect and induced GVA
Productivity
Operational direct GVA
As a % of total GDP
Source: Axiata
USD
1,439 million2

61Sustainability & National Contribution Report 2019
Bangladesh
CONTRIBUTIONS TO PUBLIC FINANCE TOTAL EMPLOYMENT IMPACT ROBI’S LABOUR PRODUCTIVITY
Figure 4: Total tax contribution to public finance 2015-20191
Figure 5: Total employment impact 2019
Figure 6: Robi’s labour productivity 2015-2019
Total accumulated tax contributions to public finance over the last five years reached USD1,533 million.
Annual tax contributions in 2019 was USD327 million, accounting for 0.8% of total tax revenue of the government of Bangladesh. (Figure 4)
1,518 jobs were directly provided by Robi’s operations in 2019. 11% of Robi’s employees were women. The firm is predominated by Bangladesh citizens with 99.7%.
Robi’s operations also indirectly supported 70,756 jobs. A further 32,221 jobs were supported by its capital investment. (Figure 5)
Robi’s productivity, measured as Gross Value Added (GVA) per employee, increased by a CAGR of 23.0% to USD261,151 in 2019 from USD114,164 in 2015, mainly driven by decreasing employment number and increasing operating profits.
Robi’s productivity grew by 66.2% from USD157,108 per worker over 2018-2019, mainly due to a 72.9% increase in operating profits. (Figure 6)
Total tax and fees paid to government
As a % of total government revenue
Note: 1 Totals may not add up due to roundingSource: Analysis by External Consultant
US
D m
illio
n
356
2017
1.5%
263
2016
1.2%
220
2015
1.2%
2019
0.8%
327
2018
1.1%
367
Note: 1 Total government revenue numbers were updated based on the latest information availableSource: Axiata and Analysis by External Consultant
Source: Analysis by External Consultant
70,756Operational indirectly supported
32,221 Supported by capital investment
1,518Directly employed
US
D
2019
261,151
2018
157,108
2017
125,045
2016
114,329
2015
114,16468%
1%
31% 104,495 Jobs Supported1

Sustainability & National Contribution Report 2019
Cambodia
Smart Axiata Co., Ltd. is Cambodia’s leading mobile telecommunications operator, serving approximately 8 million subscribers under the ‘Smart’ brand. Smart is at the forefront of mobile technology advancement in Cambodia with extensive national wide coverage of 99% of the Cambodian population. Smart was the first network to introduce 4G LTE in 2014, 4G+ in 2016, 4G+ with HD Voice (VoLTE) and 4.5G in 2017. In mid-2019, Smart hosted the first 5G live showcase in the Kingdom, manifesting its mobile data leadership position in the country. The company is also rapidly transforming itself into a digital lifestyle brand, having introduced many innovative offerings and lifestyle entertainment value propositions. Smart aspires to be the #1 and most loved communication tech brand in Cambodia by 2022, while having a strong corporate social responsibility and sustainability agenda for national socioeconomic growth.
National Contribution
Capital + Operating Expenditure
USD242 MILLION
Capital Expenditure:
USD78 million
Operating Expenditure:
USD164 million
translates to
Every USD1spent on capex
USD5.9GVA Contribution1
Contribution to Gross Value Added
USD459 MILLION(1.7% OF THE NATION’S GDP)
Operational Indirect and Induced GVA:
USD81 million
Productivity GVA:
USD153 million
Operational Direct GVA:
USD163 million
Capital Investment GVA:
USD62 million
Direct Employees
TOTAL
833 STAFF
Female:
36%
Cambodian:
97%
Total Jobs Supported
TOTAL
49,398 JOBS
Operational Indirectly Supported:
27,539
Directly Employed:
833
Supported by Capital Investment:
21,027
Contribution to Public Finance
USD94 million(2.1% of total tax revenue of the Cambodian government, excluding regulatory related fees, levies and payments2)
62Sustainability & National Contribution Report 2019
Notes: 1 Including GDP contribution from market penetration related productivity impact 2 https://www.khmertimeskh.com/50683321/over-2-8-billion-collected-in-tax-revenue-in-2019/

63Sustainability & National Contribution Report 2019
Cambodia
SMART’S TOTAL ECONOMIC CONTRIBUTION TO THE CAMBODIAN ECONOMY
SMART’S TOTAL ECONOMIC CONTRIBUTION OVER THE LAST FIVE YEARS
INVESTING AND INNOVATING FOR THE LONG-TERM
Figure 1: GVA contribution to the Cambodian economy 2019
Figure 2: GVA contribution to the Cambodian economy 2015-2019
Figure 3: Total capital investment 2015-2019
Smart’s substantial operations and investments in Cambodia had a strong positive impact on the Cambodian economy in 2019. With a total operating expenditure of USD164 million and capital investment of USD78 million, Smart’s total Gross Value Added (GVA) contribution to Cambodia’s economy was estimated at USD459 million in 2019, accounting for 1.7% of national GDP.
Smart’s operations directly contributed USD163 million, accounting for 36% of total GVA contribution. It also indirectly contributed USD81 million to economic activity. For every USD1 Smart contributed directly to Cambodia’s economy, another USD0.5 was generated indirectly through local suppliers, higher than the general industry average of USD0.4.1
Capital investment contributed USD62 million, representing 13% of total GVA. A further USD153 million which was generated from productivity improvement due to the rising mobile penetration rate, accounted for 33% of total GVA. (Figure 1)
Smart’s total GVA contribution increased from USD298 million in 2015 to USD459 million in 2019 with a CAGR of 11.4%, representing a slightly increasing share of the country’s GDP from 1.6% to 1.7%. Expansion in Smart’s operational profits and mobile penetration rate in Cambodia facilitated the growth of GVA contribution.
Over the last five years, total operational profits grew from USD116 million to USD151 million with a CAGR of 6.8%. In 2019, mobile penetration rates increased from 120% to 133% while internet penetration rates increased from 84% to 99%1. (Figure 2)
The total accumulated capital investment by Smart over the last five years reached USD373 million. In 2019, Smart invested another USD78 million primarily for network expansions. Smart’s continuous capital investment over the years is in line with the company’s commitment towards developing Cambodia’s ICT sector. (Figure 3)
USD163 millionOperational direct GVA
USD81 million Operational indirect and induced GVA
USD153 million Productivity
USD62 million GVA by capital investment
36%
18%
13%
33%
Notes: 1 Based on simple average of general industry 2 Totals may not add up due to roundingSource: Analysis by External Consultant; OECD 2011
Source: Axiata
300
400
500
200
100
0
US
D m
illio
n
325
2017
342
2018 2019
459
376
2015
298
2016
1.6% 1.5%1.7%
1.5%1.6%
2015
60
2016
75
2017
80
2019
78
2018
80
US
D m
illio
n
Note: 1 Telecommunications Regulator of CambodiaSource: Analysis by External Consultant; GSMA Intelligence
GVA by capital investment
Operational indirect and induced GVA
Productivity
Operational direct GVA
As a % of total GDP
USD
459 million2

64Sustainability & National Contribution Report 2019
Cambodia
CONTRIBUTIONS TO PUBLIC FINANCE TOTAL EMPLOYMENT IMPACT SMART’S LABOUR PRODUCTIVITY
Figure 4: Total tax contribution 2015-2019 Figure 5:
Total employment impact 2019
Figure 6: Smart’s labour productivity 2015-2019
The total accumulated tax and fee contributions over the last five years reached USD381 million. Annual contributions has expanded from USD59 million in 2015 to USD94 million in 2019 with a CAGR of 12.4%.
In 2019, Smart contributed USD94 million in tax as well regulatory fees and levies. Smart’s tax contribution alone accounted for 2.1% of national tax income. (Figure 4)
Smart directly provided 833 jobs in 2019. Cambodian citizens accounted for 97% of total employees of the firm. Around 36% of Smart employees were women. Smart also engaged 260 interns to provide young people with the specialist skills required in the ICT and digital economy.
Smart’s operations indirectly supported an additional 27,539 jobs and a further 21,027 jobs were supported by Smart’s capital investments in 2019. (Figure 5)
Smart’s productivity, measured as Gross Value Added (GVA) per employee, increased from USD130,135 in 2015 to USD195,678 in 2019 with a CAGR of 10.7%. Significant growth in operational profits supported the increase in productivity. (Figure 6)
Total tax and fees paid to government
As a % of national tax revenue
Note: 1 Totals may not add up due to rounding Source: Analysis by External Consultant
Source: Axiata and Analysis by External Consultant Source: Analysis by External Consultant
US
D m
illio
n
76
2017
2.9%
65
2016
3.6%
59
2015
3.8
2019
94
2.1
2018
86
2.6%
27,539Operational indirectly supported
21,027 Supported by capital investment
833 Directly employed
2015
130,135
2016
133,383
2017
175,668
2018 2019
195,678
174,224
US
D
56%
2%
43%
49,398 Jobs Supported1
Sustainability & National Contribution Report 2019
Nepal
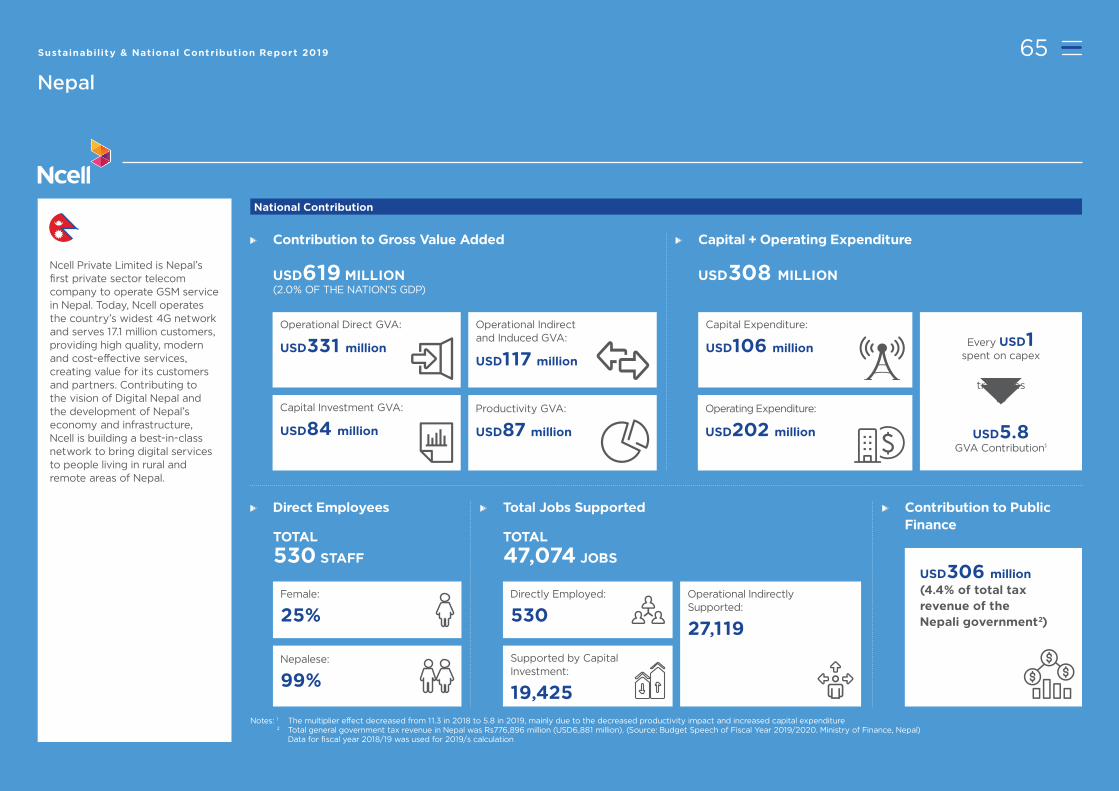
Ncell Private Limited is Nepal’s first private sector telecom company to operate GSM service in Nepal. Today, Ncell operates the country’s widest 4G network and serves 17.1 million customers, providing high quality, modern and cost-effective services, creating value for its customers and partners. Contributing to the vision of Digital Nepal and the development of Nepal’s economy and infrastructure, Ncell is building a best-in-class network to bring digital services to people living in rural and remote areas of Nepal.
National Contribution
Capital + Operating Expenditure
USD308 MILLION
Capital Expenditure:
USD106 million
Operating Expenditure:
USD202 million
translates to
Every USD1spent on capex
USD5.8GVA Contribution1
Contribution to Gross Value Added
USD619 MILLION(2.0% OF THE NATION’S GDP)
Operational Indirect and Induced GVA:
USD117 million
Productivity GVA:
USD87 million
Operational Direct GVA:
USD331 million
Capital Investment GVA:
USD84 million
Direct Employees
TOTAL
530 STAFF
Female:
25%
Nepalese:
99%
Total Jobs Supported
TOTAL
47,074 JOBS
Operational Indirectly Supported:
27,119
Directly Employed:
530
Supported by Capital Investment:
19,425
Contribution to Public Finance
USD306 million(4.4% of total tax revenue of the Nepali government2)
65Sustainability & National Contribution Report 2019
Notes: 1 The multiplier effect decreased from 11.3 in 2018 to 5.8 in 2019, mainly due to the decreased productivity impact and increased capital expenditure 2 Total general government tax revenue in Nepal was Rs776,896 million (USD6,881 million). (Source: Budget Speech of Fiscal Year 2019/2020. Ministry of Finance, Nepal) Data for fiscal year 2018/19 was used for 2019/s calculation

66Sustainability & National Contribution Report 2019
Nepal
NCELL’S TOTAL ECONOMIC CONTRIBUTION TO NEPAL’S ECONOMY
NCELL’S TOTAL ECONOMIC CONTRIBUTION OVER THE LAST THREE YEARS
INVESTING AND INNOVATING FOR THE LONG-TERM
Figure 1: GVA contribution to Nepal’s economy 2019
Figure 2: GVA contribution to Nepal’s economy 2017-2019
Figure 3: Total capital investment 2017-2019
Led by Ncell’s total operating expenditure of USD202 million and capital investment of USD106 million, Ncell’s total Gross Value Added (GVA) contribution to Nepal’s economy was estimated at USD619 million in 2019, accounting for 2.0% of national GDP.
Ncell’s operations directly contributed USD371 million GVA, accounting for 53% of total GVA. A further USD117 million was indirectly generated through the expenditures by Ncell’s suppliers, accounting for 19% of total GVA. For every USD1 Ncell directly added to the economy, it generated another USD0.4 indirectly from local suppliers, similar as the average of general industry1.
Productivity improvements contributed USD87 million, representing 14% of total GVA. A further USD84 million contribution came from capital investment, accounting for 14% of the total GVA. (Figure 1)
Ncell’s total GVA contribution dropped by 16.5% from USD742 million in 2018 to USD619 million in 2019, representing a decreased share of the country’s GDP from 2.7% to 2.0%. This as mainly due to the decrease of operating profits and slower growth of mobile penetration.
Ncell’s operational profits decreased from USD346 million to USD288 million over 2018-2019. The number of mobile subscribers in Nepal reached 41 million in 2019 with a penetration growth of 6%. (Figure 2)
Ncell’s total accumulated capital investment reached USD270 million over the last three years’ of operations. The capital investment was USD106 million in 2019, representing a 61.2% growth from USD66 million in 2018. Capital investment plays a significant role in enhancing the company’s competitiveness and contributing to Nepal’s economy. (Figure 3)
USD331 million Operational direct GVA
USD117 million Operational indirect and induced GVA
USD87 million Productivity
USD84 million GVA by capital investment
53%
19%
14%
14%
Notes: 1 Based on simple average of general industry 2 Totals may not add up due to roundingSource: Analysis by External Consultant; OECD 2011
Source: Axiata
1,000
600
800
400
200
0
US
D m
illio
n
2019
619
2.0%
742
2018
2.7%
788
2017
3.1%
106
20192018
66
2017
98
US
D m
illio
n
Source: Analysis by External Consultant
GVA by capital investment
Operational indirect and induced GVA
Productivity
Operational direct GVA
As a % of total GDP
USD
619 million2
67Sustainability & National Contribution Report 2019
Nepal
CONTRIBUTIONS TO PUBLIC FINANCE TOTAL EMPLOYMENT IMPACT NCELL’S LABOUR PRODUCTIVITY
Figure 4: Total tax contribution to public finance 2017-2019
Figure 5: Total employment impact 2019
Figure 6: Ncell’s labour productivity 2017-20191
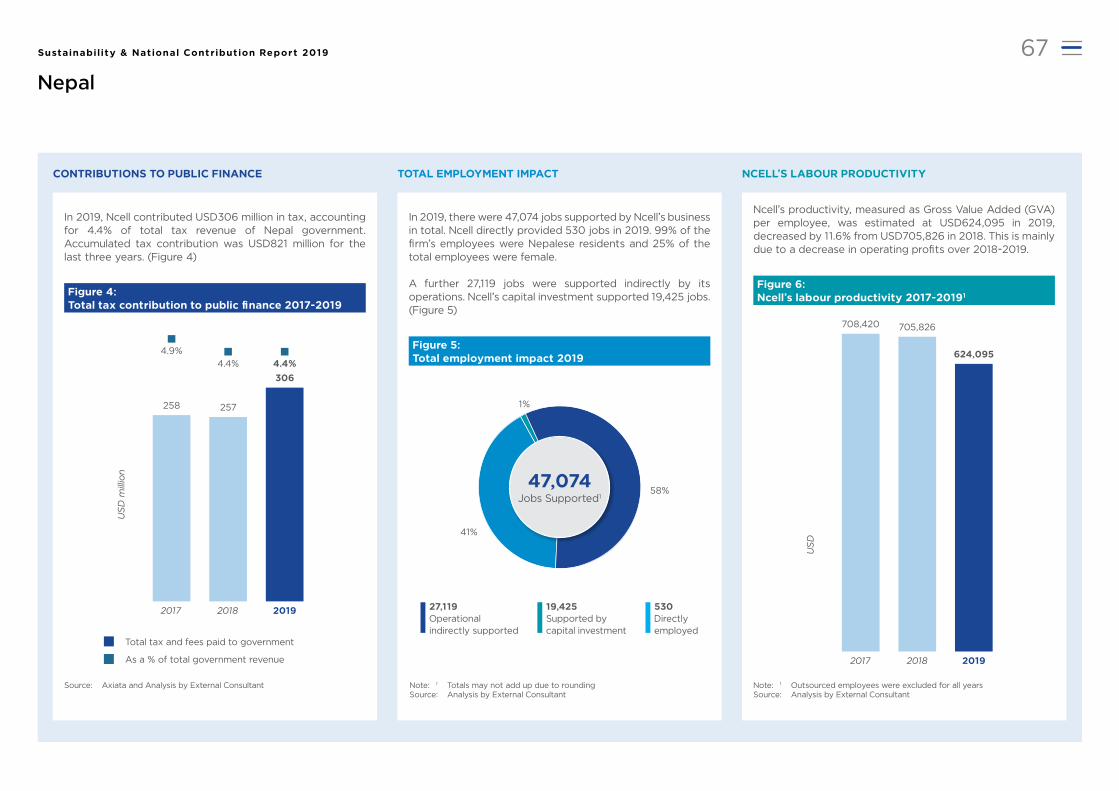
In 2019, Ncell contributed USD306 million in tax, accounting for 4.4% of total tax revenue of Nepal government. Accumulated tax contribution was USD821 million for the last three years. (Figure 4)
In 2019, there were 47,074 jobs supported by Ncell’s business in total. Ncell directly provided 530 jobs in 2019. 99% of the firm’s employees were Nepalese residents and 25% of the total employees were female.
A further 27,119 jobs were supported indirectly by its operations. Ncell’s capital investment supported 19,425 jobs. (Figure 5)
Ncell’s productivity, measured as Gross Value Added (GVA) per employee, was estimated at USD624,095 in 2019, decreased by 11.6% from USD705,826 in 2018. This is mainly due to a decrease in operating profits over 2018-2019.
Total tax and fees paid to government
As a % of total government revenue
Note: 1 Totals may not add up due to roundingSource: Analysis by External Consultant
Note: 1 Outsourced employees were excluded for all years Source: Analysis by External Consultant
Source: Axiata and Analysis by External Consultant
US
D m
illio
n
306
2019
4.4%
2018
4.4%
257
2017
4.9%
258
27,119Operational indirectly supported
19,425 Supported by capital investment
530Directly employed
624,095
20192018
705,826
2017
708,420
US
D
58%
1%
41%
47,074 Jobs Supported1
68Sustainability & National Contribution Report 2019
Methodology
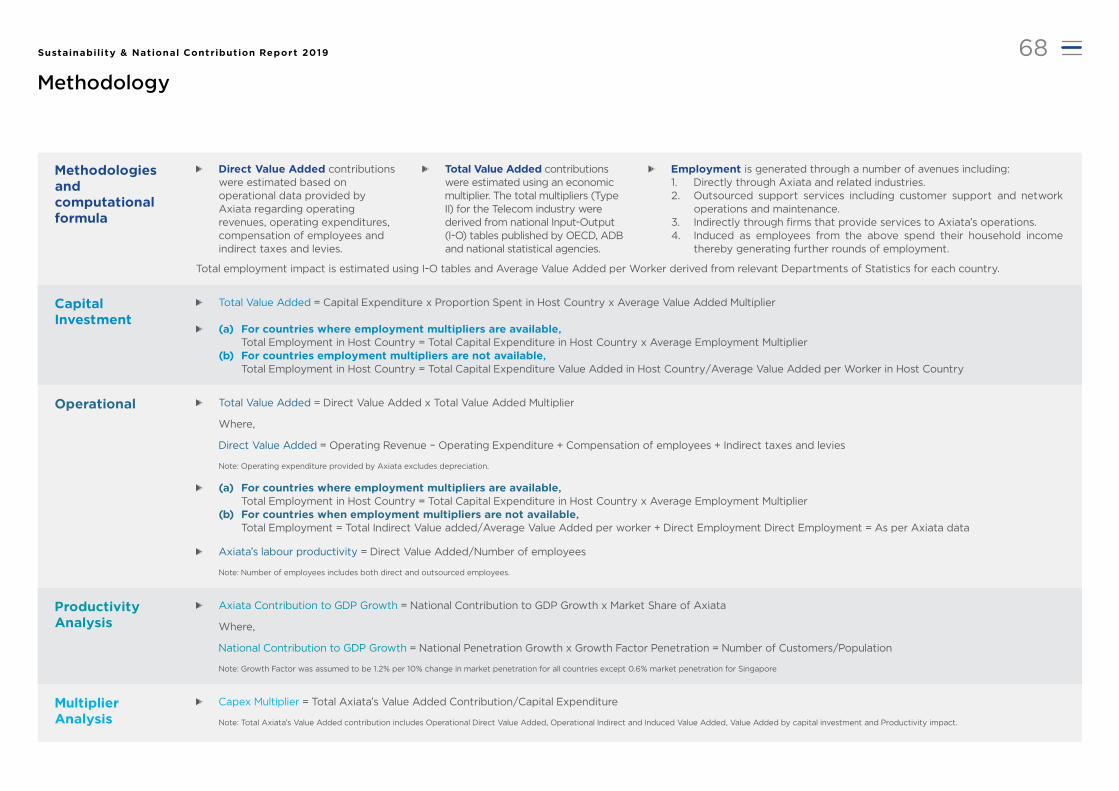
Direct Value Added contributions were estimated based on operational data provided by Axiata regarding operating revenues, operating expenditures, compensation of employees and indirect taxes and levies.
Total Value Added = Capital Expenditure x Proportion Spent in Host Country x Average Value Added Multiplier
(a) For countries where employment multipliers are available, Total Employment in Host Country = Total Capital Expenditure in Host Country x Average Employment Multiplier(b) For countries employment multipliers are not available, Total Employment in Host Country = Total Capital Expenditure Value Added in Host Country/Average Value Added per Worker in Host Country
Total Value Added = Direct Value Added x Total Value Added Multiplier
Where,
Direct Value Added = Operating Revenue – Operating Expenditure + Compensation of employees + Indirect taxes and levies
Note: Operating expenditure provided by Axiata excludes depreciation.
(a) For countries where employment multipliers are available, Total Employment in Host Country = Total Capital Expenditure in Host Country x Average Employment Multiplier(b) For countries when employment multipliers are not available, Total Employment = Total Indirect Value added/Average Value Added per worker + Direct Employment Direct Employment = As per Axiata data
Axiata’s labour productivity = Direct Value Added/Number of employees
Note: Number of employees includes both direct and outsourced employees.
Axiata Contribution to GDP Growth = National Contribution to GDP Growth x Market Share of Axiata
Where,
National Contribution to GDP Growth = National Penetration Growth x Growth Factor Penetration = Number of Customers/Population
Note: Growth Factor was assumed to be 1.2% per 10% change in market penetration for all countries except 0.6% market penetration for Singapore
Capex Multiplier = Total Axiata’s Value Added Contribution/Capital Expenditure
Note: Total Axiata’s Value Added contribution includes Operational Direct Value Added, Operational Indirect and Induced Value Added, Value Added by capital investment and Productivity impact.
Total Value Added contributions were estimated using an economic multiplier. The total multipliers (Type II) for the Telecom industry were derived from national Input-Output (I-O) tables published by OECD, ADB and national statistical agencies.
Employment is generated through a number of avenues including:1. Directly through Axiata and related industries.2. Outsourced support services including customer support and network
operations and maintenance.3. Indirectly through firms that provide services to Axiata’s operations.4. Induced as employees from the above spend their household income
thereby generating further rounds of employment.
Total employment impact is estimated using I-O tables and Average Value Added per Worker derived from relevant Departments of Statistics for each country.
Methodologies and computational formula
Capital Investment
Operational
Productivity Analysis
Multiplier Analysis