national emission standards for hazardous air … · manufacture of semiconductors-- background...
TRANSCRIPT
February 2001
National Emission Standards for
Hazardous Air Pollutants
(NESHAP) for Source Category:
Manufacture of Semiconductors
-- Background Information for
Proposed Standards
United States
Environmental
Office of Air Quality
Planning and Standards
Research Triangle Park, NC 27711

National Emission Standards for
Hazardous Air Pollutants (NESHAP) for
Source Category:
Manufacture of Semiconductors -
Background Information for Proposed
Standards
Emission Standards Division
U.S. Environmental Protection Agency
Office of Air Quality Planning and Standards
Research Triangle Park, North Carolina 27711
February 2001

DISCLAIMER
This report has been reviewed by the U.S. Environmental
Protection Agency, Office of Air Quality Planning and
Standards, Emission Standards Division and approved for
publication. Mention of trade names or commercial products
does not constitute endorsement or recommendation for use.

ENVIRONMENTAL PROTECTION AGENCY
NATIONAL EMISSION STANDARDS FOR HAZARDOUS AIR POLLUTANTS
(NESHAP) FOR SOURCE CATEGORY: MANUFACTURE OF SEMICONDUCTORS -
BACKGROUND INFORMATION FOR PROPOSED STANDARDS
1. The standards regulate organic hazardous air pollutant
(HAP) emissions from the manufacture of semiconductors.
Only those semiconductor manufacturing facilities that
are part of major sources under section 112(d) of the
Clean Air Act (Act) will be regulated.
2. For additional information contact:
Mr. John Schaefer
Organic Chemicals Group
U.S. Environmental Protection Agency (MD-13)
Research Triangle Park, NC 27711
Telephone: (919) 541-0296
E-MAIL: [email protected]
3. Paper copies of this document may be obtained from:
U.S. Environmental Protection Agency Library (MD-36)
Research Triangle Park, NC 27711
Telephone: (919) 541-2777
National Technical Information Service (NTIS)
5285 Port Royal Road
Springfield, VA 22161
Telephone: (703) 487-4650

4. Electronic copies of this document may be obtained from
the EPA Technology Transfer Network (TTN) over the
internet by going to the following address:
http://www.epa.gov/ttn/uatw
5. Electronic copies of this document may be obtained from
the EPA TTN electronic bulletin board system which is
free, except for the normal long distance charges. To
access the Background Information Document:
• Set software communication setting to 8 bits, no
parity, and 1 stop bit
• Set a terminal emulation of either VT100, VT102, or
ANSI
• Baud rates of 1200, 2400, 9600, 14,400 are accepted
• Use access number (919) 541-5742; access problems
should be directed to the system operator at (919)
541-5384
• Register online by providing a personal name and
password
• Specify TTN Bulletin Board: Clean Air Act Amendments
• Select menu item: Recently Signed Rules

i
SEMICONDUCTOR MANUFACTURING NESHAP
BACKGROUND INFORMATION DOCUMENT
Table of Contents
Page1.0 INTRODUCTION . . . . . . . . . . . . . . . . . . . . 1-1
1.1 OVERVIEW . . . . . . . . . . . . . . . . . . . 1-11.2 PROJECT HISTORY . . . . . . . . . . . . . . . . 1-2
1.2.1 Background . . . . . . . . . . . . . . . 1-21.2.2 Data Gathering . . . . . . . . . . . . . 1-21.2.3 Participating Companies . . . . . . . . 1-41.2.4 Emissions and Control Data . . . . . . . 1-4
1.3 DEFINITIONS . . . . . . . . . . . . . . . . . . 1-4
2.0 SEMICONDUCTOR MANUFACTURING INDUSTRY CHARACTERIZATION AND EMISSIONS . . . . . . . . . . . . . . . . . . . 2-12.1 INTRODUCTION . . . . . . . . . . . . . . . . . 2-1
2.1.1 End Products . . . . . . . . . . . . . . 2-22.2 INDUSTRY CHARACTERIZATION . . . . . . . . . . . 2-2
2.2.1 Source Category Description . . . . . . 2-22.2.2 Semiconductor Market Characterization . 2-3
2.3 SEMICONDUCTOR MANUFACTURING PROCESSES . . . . . 2-32.3.1 Crystal Growing . . . . . . . . . . . . 2-102.3.2 Wafer Preparation . . . . . . . . . . . 2-112.3.3 Oxidation . . . . . . . . . . . . . . . 2-122.3.4 Photolithography . . . . . . . . . . . . 2-132.3.5 Etching . . . . . . . . . . . . . . . . 2-142.3.6 Doping . . . . . . . . . . . . . . . . . 2-152.3.7 Layering . . . . . . . . . . . . . . . . 2-16
2.3.7.1 Deposition . . . . . . . . . . 2-17 2.3.7.2 Metalization . . . . . . . . . 2-17
2.3.7.3 Dielectric and Polysilicon Films 2-182.3.8 Cleaning . . . . . . . . . . . . . . . . 2-182.3.9 Assembly and Test . . . . . . . . . . . 2-19
2.3.9.1 Assembly . . . . . . . . . . . 2-19 2.3.9.2 Testing . . . . . . . . . . . . 2-19
2.3.10 Ancillary Processes . . . . . . . . . . 2-192.4 HAP USAGE AND EMISSIONS . . . . . . . . . . . . 2-19
2.4.1 HAP Usage . . . . . . . . . . . . . . . 2-202.4.2 Number of Exhaust Streams . . . . . . . 2-222.4.3 Uncontrolled Emissions . . . . . . . . . 2-22

ii
2.4.4 Process Operation Areas and Emissions . 2-22 2.4.4.1 Solvent Stations . . . . . . . 2-23 2.4.4.2 Wet Chemical Stations . . . . . 2-24 2.4.4.3 Photoresist Application, Developing,
and Stripping Stations . . . . . 2-24 2.4.4.4 Gaseous Operation Stations . . 2-25 2.4.4.5 Miscellaneous Operations . . . 2-26
2.4.5 HAP Materials and Waste Characterization in the Semiconductor Manufacturing Industry 2-26
2.5 NATIONAL BASELINE EMISSIONS . . . . . . . . . . 2-272.6 REFERENCES . . . . . . . . . . . . . . . . . . 2-30
3.0 EMISSION CONTROL TECHNIQUES . . . . . . . . . . . . 3-13.1 CONTROL OF HAP EMISSION SOURCES . . . . . . . . 3-13.2 ADD-ON CONTROL DEVICES . . . . . . . . . . . . 3-1
3.2.1 Adsorbers . . . . . . . . . . . . . . . 3-13.2.2 Oxidizers . . . . . . . . . . . . . . . 3-2
3.2.2.1 Regenerative . . . . . . . . . 3-2 3.2.2.2 Recuperative . . . . . . . . . 3-3
3.2.3 Concentrators . . . . . . . . . . . . . 3-33.2.4 Absorbers . . . . . . . . . . . . . . . 3-33.2.5 Point of Use . . . . . . . . . . . . . . 3-4
3.3 REFERENCES . . . . . . . . . . . . . . . . . . 3-6
4.0 MACT FLOORS AND REGULATORY ALTERNATIVES . . . . . . 4-14.1 CLEAN AIR ACT REQUIREMENTS . . . . . . . . . . 4-2
4.1.1 Definition of “Average” . . . . . . . . 4-24.2.2 Meaning of “Source” . . . . . . . . . . 4-34.1.3 Meaning of “Best Performing” and “Best
Controlled” . . . . . . . . . . . . . . 4-44.2 DETERMINATION OF THE MACT FLOORS FOR EACH SOURCE
TYPE . . . . . . . . . . . . . . . . . . . . . 4-44.3 CONSIDERATION OF REGULATORY ALTERNATIVES ABOVE THE
MACT FLOOR . . . . . . . . . . . . . . . . . . 4-84.3.1 Process Vents . . . . . . . . . . . . . 4-84.3.2 Storage Tanks . . . . . . . . . . . . . 4-94.3.3 Wastewater . . . . . . . . . . . . . . . 4-104.3.4 Equipment Leaks . . . . . . . . . . . . 4-104.3.4 Process Changes . . . . . . . . . . . . 4-11
4.4 REFERENCES . . . . . . . . . . . . . . . . . . 4-12
5.0 ENVIRONMENTAL, ENERGY, AND COST IMPACTS . . . . . . 5-15.1 INTRODUCTION . . . . . . . . . . . . . . . . . 5-15.2 NEW SOURCES . . . . . . . . . . . . . . . . . . 5-15.3 EXISTING SOURCES . . . . . . . . . . . . . . . 5-2
5.3.1 Environmental Impacts . . . . . . . . . 5-2

iii
5.3.2 Energy Impacts . . . . . . . . . . . . . 5-35.3.3 Cost Impacts . . . . . . . . . . . . . . 5-3
5.4 REFERENCES . . . . . . . . . . . . . . . . . . 5-4
APPENDICES
Appendix A Definitions . . . . . . . . . . . . . . . . A-1
Appendix B Cost Per Ton of Emission Reduction Calculation for Above the Floor Level of Control for Process Vents . . . . . . . . . . . . . . . . . . . B-1
LIST OF TABLES
PageTable 2-1 Semiconductor Manufacturing Facilities Reporting
Under the Toxic Release Inventory System . 2-4
Table 2-2 HAP Emissions from Semiconductor Manufacturingas Reported to the Toxic Release Inventory, 1987- 1994 . . . . . . . . . . . . . . . . . . 2-28
Table 3-1 Pollution Prevention (P2) Measures Employedin the Semiconductor Industry . . . . . . 3-6
Table 4-1 Control Device Removal Efficiency forSemiconductor Manufacturing Facilities . . 4-6
LIST OF FIGURES
PageFigure 2-1. TRI Reportable HAP Releases per Area of Silicon
Substrate . . . . . . . . . . . . . . . . 2-29
1-1
1.0 INTRODUCTION
1.1 OVERVIEW
Section 112 of the Clean Air Act as amended in 1990 (CAA)
requires that the United States Environmental Protection
Agency (EPA) establish emission standards for categories of
sources of hazardous air pollutants (HAP). National emission
standards for hazardous air pollutants (NESHAP) for major
sources of HAP are based on maximum achievable control
technology (MACT), with a minimum level of control as defined
in section 112(d). The CAA defines a major source as:
...any stationary source or group of stationary
sources located within a contiguous area and under
common control that emits or has the potential to
emit, in the aggregate, 10 tons per year or more of
any hazardous air pollutant or 25 tons per year of
any combination of hazardous air pollutants.
On July 16, 1992, the initial list of categories of major
sources that will be regulated under section 112 was published
in the Federal Register (57 FR 31576). “Semiconductor
Manufacturing” was included in the list as a category of major
sources. The semiconductor manufacturing NESHAP project will

1-2
establish standards for semiconductor manufacturing facilities
that are major sources.
The purpose of this document is to summarize the
background information gathered during the development of the
semiconductor manufacturing NESHAP.
1.2 PROJECT HISTORY
1.2.1 Background
On March 7, 1996, a meeting was held between the EPA and
the Semiconductor Industry Association (SIA) to obtain
feedback on a draft presumptive MACT (P-MACT) document that
had been prepared by the EPA based on preliminary information
gathered on the semiconductor industry. Subsequent to that
meeting and meetings with State and local officials, the P-
MACT document was revised into a draft Technical Information
Document (TID). The TID, supplemented with additional, more
recent information collected, and analyses of this
information, served as the origin of this Background
Information Document (BID). Several other meetings have been
held in the interim with State and local agencies, Regional
Offices of the EPA, and semiconductor industry representatives
to gather and discuss specific information relevant to the
determination of MACT.
1.2.2 Data Gathering
The Act requires that minimum control levels (MACT
floors) be established for each category or subcategory
regulated under section 112. These floors, discussed in more
detail in Chapter 4.0 of this document, were based on an
analysis of the level of control existing in a category prior
to NESHAP regulation (i.e., at the baseline). In order to

1-3
obtain information to evaluate this baseline level of control,
several approaches were considered, including:
C Use of existing State regulations;
C Use of discussions with State regulators;
C Use of site visit reports of several semiconductor
manufacturing facilities;
C Use of national databases; and
C Use of industry-developed questionnaires sent to
semiconductor manufacturers.
After evaluating the options, it was determined that each
one could provide unique and valuable information relevant to
the regulatory development process, and the decision was made
by the EPA to use them all.
Most of the information and data presented in this
document is a result of input from the various partners
affected by potential MACT development for the semiconductor
manufacturing industry. The EPA collected process and
emissions information on the semiconductor manufacturing
source category from the industry and State regulatory
agencies. The EPA specifically obtained input to identify
major sources, examine concerns regarding area sources,
determine the P-MACT level of control, gather permit
information, and solicit comments on existing and new source
MACT. This input was provided by representatives of the SIA;
EPA Regions I, II, III, and IX; and the states of California,
Oregon, Maryland, Vermont, Arizona, and Texas.
Information about the semiconductor manufacturing
process, industry characteristics, HAP emissions, and emission
controls was gathered from the SIA, Toxic Release Inventory
(TRI) data, State files, existing literature, and site visits

1-4
to semiconductor manufacturing facilities. This information
has been used to characterize the industry and to identify
what data are needed to propose and establish a formal MACT.
The information gathered to date is discussed below.
1.2.3 Participating Companies
The following companies and facilities (excluding those
that have requested anonymity) have elected to participate by
providing information on various activities that are conducted
within a semiconductor facility. Much of the information
pertaining to process and emission control descriptions in
this document has been received from these companies.
AMD, Austin, TX Motorola, Chandler, AZ
Delco, Kokomo, IN Motorola, Mesa, AZ
IBM, East Fishkill, NY Motorola, Phoenix, AZ
Intel, Ocotillo, AZ Raytheon-TI, Dallas, TX
Intel, Rio Rancho, NM Texas Instruments, Dallas, TX
Micron, Boise, ID Triquint Semiconductor, Dallas, TX
Motorola, Austin, TX VLSI, San Antonio, TX
Motorola, Austin-Oak Hill, TX
1.2.4 Emissions and Control Data
The emissions and control information for the
semiconductor manufacturing source category is summarized in
chapter 3.0 of this document. Because of the rapid and
frequent process modifications made by the semiconductor
manufacturing industry, the specific point sources, HAP
species emitted, magnitude of emissions, and methods of
control described in this document are subject to change.

1-5
However, Chapter 3 presents the most recent information
available to the EPA.
1.3 DEFINITIONS
Throughout the regulatory development process, it is
essential that terminology is clearly defined and both the EPA
and industry use these terms consistently. Lack of clarity in
the meaning of crucial regulatory and industry-specific terms
may lead to ambiguity in the final rule and confusion in its
implementation. Appendix A contains definitions of words and
phrases used in this document and are provided in order to
avoid such problems.

2-1
2.0 SEMICONDUCTOR MANUFACTURING INDUSTRYCHARACTERIZATION AND EMISSIONS
2.1 INTRODUCTION
A semiconductor is a material with electrical
conductivity between that of a conductor and an insulator; its
electrical characteristics can be manipulated to behave like
either depending on how the materials and circuitry inlayed in
the wafer are configured and processed. Silicon has
traditionally been the substrate used to manufacture
semiconductors, although other materials are being developed
for the semiconductor substrate, such as gallium arsenide
(GaAs) and other valence III-V compounds. Materials similar
to GaAs have several advantages over silicon, such as
increased electron mobility as well as semi-insulating
properties.
The operation of an integrated circuit depends on the
ability to control the movement of charged carriers through an
electrical pathway (circuit) constructed on or just below the
surface of a semiconducting material. The circuit is
fabricated by introducing impurities (dopants) in stringently
controlled concentrations in precisely defined areas of the
semiconducting material (substrate). The basic manufacturing
process for semiconductors involves three stages: crystal
growing, wafer fabrication, and assembly.

2-2
During the crystal growing stage, crystalline wafers of
silicon or other specific semiconducting materials are
manufactured for use as substrates in integrated circuit
fabrication. In wafer fabrication, a group of chips are
created on the wafer through a series of pattern-forming
processes. Finally, during the assembly stage, the finished
chips are separated, tested, and packaged for later use in
various products.
2.1.1 End Products
The semiconductor manufacturing industry, a subset of the
electronics manufacturing industry, produces integrated
circuits or "chips." Integrated circuits combine the
functions of discrete electronic devices in a miniature device
that can perform complicated electronic functions in a
fraction of a second. The electronics manufacturing industry
produces devices such as computers, appliances, radios, CD
players, and other finished goods that incorporate these
integrated circuits.
Although semiconductors account for only a small portion
of electronics/computer industry sales, semiconductors are
crucial to all electronic products and to the U.S. economy.
Semiconductors are used in computers, consumer electronic
products, telecommunication equipment, industrial machinery,
transportation equipment, and military hardware. Typical
functions of semiconductors in these products include
information processing, display purposes, power handling, data
storage, signal conditioning, and conversion between light and
electrical energy sources. According to the EPA's Design for
the Environment (DfE) initiative, computers are the principal
end use of semiconductors, constituting 40 percent of the
market in 1992.

2-3
2.2 INDUSTRY CHARACTERIZATION
2.2.1 Source Category Description
Semiconductor manufacturing is classified under Standard
Industrial Classification (SIC) code 3674 (North American
Industry Classification System (NAICS) Code 334413). This SIC
code includes any operation performed in the manufacture of
semiconductor or related solid state devices. Examples of
semiconductor or related solid state devices include
semiconductor diodes, semiconductor stacks, rectifiers,
integrated circuits, transistors, solar cells, and light
sensing and emitting devices. SIC code 3674 includes all
processing from crystal growth through circuit separation,
encapsulation, and testing.
According to U.S. Census Bureau information,1 there are
approximately 1,099 facilities classified under the Standard
Industrial Classification (SIC) code 3674 (semiconductors and
related devices). Studies conducted by the SIA in 2000 and
2001 indicate that about 127 of these facilities are actually
engaged in the manufacture of semiconductors. Table 2-1 list
those semiconductor manufacturing facilities that have
reported under the Toxic Release Inventory System.
2.2.2 Semiconductor Market Characterization
The U.S. global market share of semiconductors,
semiconductor processing equipment, and computer systems fell
between 1980 to 1991, but has grown since 1992.2 In 1996
global sales of semiconductors was $144.4 billion.3 The
dynamics of the market also means that these industries are
sensitive to global activities. In late 1998, global economic
markets waned, slowing the demand, growth, and production of
integrated circuits.

2-4
2.3 SEMICONDUCTOR MANUFACTURING PROCESSES
There are many steps within the design, development, and
manufacture of an integrated circuit. Depending on its
complexity, the logic network on which the semiconductor is
based can take many months to design. To manufacture this
design, the logic network must be translated into a series of
electronic

2-5
Table 2-1. Semiconductor Manufacturing Facilities ReportingUnder the Toxic Release Inventory Systema
TRIS FacilityID Number
Company City State SICCode
04084GTPRDROUTE Control Devices Inc. Standish ME 3264
46904DLCLC1800E Delco Electronics Kokomo IN 3469
24019TTLCT7635P ITT Night Vision Roanoke VA 3671
87109GNRLT6816W General Tech. Corp. Albuquerque NM 3672
85281LTTNS1215S Litton Electro-Optic Tempe AZ 3672
94088DVNCD915DE Advanced MicroDevices
Sunnyvale CA 3674
78741DVNCD5204A Advanced MicroDevices Inc.
Austin TX 3674
19090SPRGL3900W Allegro Microsystems Willow Grove PA 3674
01613SPRGL115NO Allegro Microsystems Worcester MA 3674
83201MRCNM2300B AmericanMicrosystems Inc.
Pocatello ID 3674
75041SLCNM2613I American SiliconProds.
Garland TX 3674
02908MRCNS15CLA American SiliconProds. Inc.
Providence RI 3674
94089PRFRM610EW Analog Devices Sunnyvale CA 3674
01887NLGDV804WO Analog Devices Inc. Wilmington MA 3674
01821MBLSL4SUBU ASE Americas Inc. Billerica MA 3674
80906HNYWL1150E Atmel Corp. Colorado Springs CO 3674
85706BRRBR6730S Burr-Brown Corp. Tucson AZ 3674
02818CHRRY2000S Cherry SemiconductorCorp.
East Greenwich RI 3674
03051CHMRC16FLA Chomerks Div. Hudson NH 3674
32819TTMCR9333S Cirent Semiconductor Orlando FL 3674
16130GTCRPRD2RO ComponentIntertechnologies
Hadley PA 3674
83642CMPTR499EC Computrol Inc. Meridian ID 3674

Table 2-1. Semiconductor Manufacturing Facilities ReportingUnder the Toxic Release Inventory Systema (cont.)
TRIS FacilityID Number
Company City State SICCode
2-6
27713CRRSR2810M Cree Research Inc. Durham NC 3674
45177CRYST180EM Crysteco Inc. Wilmington OH 3674
55425CYPRS2401E CypressSemiconductor
Bloomington MN 3674
78664CYPRS17CYP CypressSemiconductor Inc
Round Rock TX 3674
75244DLLSS4350B Dallas SemiconductorCorp.
Dallas TX 3674
01749DGTLQ75REE Digital EquipmentCorp.
Hudson MA 3674
20110DMNNS9600G DominionSemiconductor
Manassas VA 3674
74354GLPCH200BJ Eagle-Picher Tech. Miami OK 3674
14652STMNK1669L Eastman Kodak Rochester NY 3674
10710LCTRN21GRA Electronic DevicesInc.
Yonkers NY 3674
64063TTTCH777NB Fabtech Inc. Lees Summit MO 3674
84088NTNLS3333W FairchildSemiconductor
West Jordan UT 3674
04106NTNLS333WE FairchildSemiconductor Corp.
South Portland ME 3674
85034FLPCH3701E Flip Chip Tech. Phoenix AZ 3674
97030FJTSM21015 FujitsuMicroelectronicsInc.
Gresham OR 3674
11590GNRLN172SP GeneralSemiconductor Inc.
Westbury NY 3674
01810GRMNMHAVER Germanium PowerDevices Corp.
Andover MA 3674
19403CMMDR950RI GMT Microelectronics Norristown PA 3674
32905HRRSCPALMB Harris Semiconductor Palm Bay FL 3674

Table 2-1. Semiconductor Manufacturing Facilities ReportingUnder the Toxic Release Inventory Systema (cont.)
TRIS FacilityID Number
Company City State SICCode
2-7
95131HWLTT350WT Hewlett-Packard Co. San Jose CA 3674
75063HTCHS6431L HitachiSemiconductor
Irving TX 3674
75081HNYWL830EA Honeywell Inc. Richardson TX 3674
92658HGHSR500SU Hughes Aircraft Co. Newport Beach CA 3674
75034HTSNN1000H Hutson Ind. Inc. Frisco TX 3674
05452BM 1000R IBM Essex Junction VT 3674
11716LCDTD105WI ILC Data DeviceCorp.
Bohemia NY 3674
93905NTGRT1566M Integrated DeviceTech.
Salinas CA 3674
95134NTGRT2670S Integrated DeviceTech. Inc.
San Jose CA 3674
85248NTLCR4500S Intel Corp. Chandler AZ 3674
97124NTRGR3131N Intergrated DeviceTech. Inc.
Hillsboro OR 3674
13039NTLCN63336 InternationalControls
Cicero NY 3674
90245NTRNT233KA InternationalRectifier
El Segundo CA 3674
92390HXFTM41915 InternationalRectifier
Temecula CA 3674
92123KYCRM8611B Kyocera America Inc. San Diego CA 3674
95035LNRTC1630M Linear Tech. Corp. Milpitas CA 3674
92641SLCNG11652 LinfinityMicroelectronics
Garden Grove CA 3674
97030LSLGC23400 LSI Logic Corp. Gresham OR 3674
18103TTMCR555UN Lucent Techs. Inc. Allentown PA 3674
19612TTMCR2525N Lucent Techs.Reading
Reading PA 3674

Table 2-1. Semiconductor Manufacturing Facilities ReportingUnder the Toxic Release Inventory Systema (cont.)
TRIS FacilityID Number
Company City State SICCode
2-8
01803MCMNCSOUTH M/A-com Inc. Burlington MA 3674
75238MRLWN10451 Marlow Ind. Inc. Dallas TX 3674
98373NTNLS11113 MatsushitaSemiconductor Corp.
Puyallup WA 3674
97005MXMNT14320 Maxim IntegratedProds.
Beaverton OR 3674
85281MCRRL2434W Medtronic/Micro-Rel Tempe AZ 3674
63376MNSNT501PE MEMC ElectronicMaterials Inc.
O’Fallon MO 3674
75090MMCST6416U MEMC Southwest Sherman TX 3674
02172NTRDC580PL Micro USPD Inc. Watertown MA 3674
85224MCRCH2355W Microchip Tech. Inc. Chandler AZ 3674
83706MCRNT2805E Micron Tech. Inc. Boise ID 3674
92704MCRSM2830S Microsemi Corp. Santa Ana CA 3674
12533MCRS HUDSO Micrus Hopewell Junction NY 3674
27704MTSBSTHREE MitsubishiSemiconductor
Durham NC 3674
97302MTSBS3990F Mitsubishi SiliconAmerica
Salem OR 3674
80027MKQNT1450I MKE - QuantumComponents
Louisville CO 3674
78721MTRLN3501E Motorola Austin TX 3674
78735MTRLN6501W Motorola Inc. Austin TX 3674
85202MTRLN2200W Motorola Inc. Mesa AZ 3674
92718WSTRN1BANT Motorola Mos 10 Irvine CA 3674
27709GMCRL3026C Motorola Mos 15 Durham NC 3674
85008MTRLN5005E Motorola Phoenix AZ 3674
85224MTRLN1300N Motorola-Chandler Chandler AZ 3674

Table 2-1. Semiconductor Manufacturing Facilities ReportingUnder the Toxic Release Inventory Systema (cont.)
TRIS FacilityID Number
Company City State SICCode
2-9
76017NTNLS1111W NationalSemiconductor
Arlington TX 3674
04106NTNLS5FODE NationalSemiconductor Corp.
South Portland ME 3674
95678NCLCT7501F NEC Electronics Inc. Roseville CA 3674
44281HBRSS8711W Ohio Brass Co. Wadsworth OH 3674
75006PTKTC1215W Optek Tech. Inc. Carrollton TX 3674
48167PTCLM47050 Optical Imaging Sys. Northville MI 3674
94089RBTSM1230B Orbit Semiconductor Sunnyvale CA 3674
87113SGNTC9201P Philips ElectronicsCorp.
Albuquerque NM 3674
94086SGNTC811EA PhilipsSemiconductors
Sunnyvale CA 3674
75243RYTHN13510 Raytheon TI Systems Dallas TX 3674
80907NTDTC1575G RockwellSemiconductor Sys.
Colorado Springs CO 3674
94086XRCRP411NP Rohm Corp. Sunnyvale CA 3674
94086XRCRP740KI Rohm Device USA Sunnyvale CA 3674
78754SMSNG12100 Samsung AustinSemiconductor
Austin TX 3674
95050SNMNC2539S Sanmina Corp. Santa Clara CA 3674
98682SHMRC4111N SEH America Inc. Vancouver WA 3674
01803SMCNC1011N Semicon ComponentsInc.
Burlington MA 3674
92127NRTHR16350 SGS ThomsonMicroelectronics
San Diego CA 3674
75006SGSTH1310E SGS-ThomsonMicroelectronics
Carrollton TX 3674
95060SLCNS2300D Silicon Sys. Inc. Santa Cruz CA 3674
95054SLCNX2201L Siliconix Inc. Santa Clara CA 3674

Table 2-1. Semiconductor Manufacturing Facilities ReportingUnder the Toxic Release Inventory Systema (cont.)
TRIS FacilityID Number
Company City State SICCode
2-10
87113SLMXN5031S Silmax Inc. Albuquerque NM 3674
78245DVNCD8611M Sony SemiconductorCo.
San Antonio TX 3674
91341SPCTR12500 Spectrolab Inc. Sylmar CA 3674
11788STNDR35MAR StandardMicrosystems Corp.
Hauppauge NY 3674
85024SMTMS19801 Sumitomo Sitix ofPhoenix Inc
Phoenix AZ 3674
45039CNCNN537GR Sumitomo SitixSilicon Inc.
Maineville OH 3674
94088SPRTX1225B Supertex Inc. Sunnyvale CA 3674
80916NCRMD1635A Symbios Inc. Colorado Springs CO 3674
80525NCRMC2001D Symbios Logic Inc. Fort Collins CO 3674
85283MTRLN7204S Tempe Motorola Tempe AZ 3674
75080TWNST500WE Texas Instruments Richardson TX 3674
75090TXSNS6400H Texas InstrumentsInc.
Sherman TX 3674
95051KWSKW2400W Unisil Corp. Santa Clara CA 3674
95051KWSKW2400W Unitrode Corp. Merrimack NH 3674
93010VTSSS741CA VitesseSemiconductor Corp.
Camarillo CA 3674
78251VLSTC9651W VLSI Tech. Inc. San Antonio TX 3674
95131VLSTC1109M VLSI Technology Inc. San Jose CA 3674
93291VLTGM8711W Voltage MultipliersInc.
Visalia CA 3674
55425VTCNC2800E VTC Inc. Bloomington MN 3674
97210WCKRS7200N Wacker SiltronicCorp.
Portland OR 3674
95035XCRNC851BU Xicor Inc. Milpitas CA 3674

Table 2-1. Semiconductor Manufacturing Facilities ReportingUnder the Toxic Release Inventory Systema (cont.)
TRIS FacilityID Number
Company City State SICCode
2-11
83651ZLGNC26011 Zilog Inc. Nampa ID 3674
94303VRNSS611HA Varian Associates Palo Alto CA 3844a Source: SIA.

2-12
circuits which will become the individual layers of circuitry
that comprises the finished semiconductor.
The integrated circuits are formed by passing wafers
through many iterations of the specific manufacturing process
steps. Beginning with a thin silicon wafer cut from an ingot
10 to 20 centimeters (4 to 8 inches) in diameter (larger
diameter ingots and thinner wafers are currently under
development), consecutive layers of complex circuitry are
built up, one on top of the another, to produce the completed
chip. These layers of circuitry are created using a complex
series of manufacturing processes that are repeated many
times.
The manufacturing process for semiconductors involves
three basic stages: crystal growing, wafer fabrication, and
assembly. During the crystal growing stage, crystalline
wafers of silicon or other specific semiconducting materials
are manufactured for use as the substrate. In wafer
fabrication, a group of integrated circuits are created on the
wafer through a series of pattern-forming processes. Most of
the chemicals used in the semiconductor manufacturing process
are used in this step. Finally, during the assembly stage,
the finished chips are separated, tested, and packaged.
The individual processes involved in semiconductor
manufacturing are described below.
2.3.1 Crystal Growing
Most silicon for use in semiconductor manufacturing is
made from a pure polycrystalline metal. A common source is
the extraction and refinement of trichlorosilane from ordinary
sand. From this material a monocrystalline silicon is
produced. A number of processes for crystal growth are
available. The most common is the Teal and Little adaptation

2-13
of the Czochralski method. In this method, a polycrystalline
silicon, surrounded by an inert gas, is melted in a fused
silica container (or crucible). A single-monocrystalline
silicon seed is then provided to initiate ingot growth by
lowering this seed until it contacts the surface. The cooler
temperature of the seed causes the formation of the silicon
structure and is then slowly retracted, producing a single-
crystal ingot of silicon.4
From an electrical standpoint this pure silicon is
worthless. The resultant form is an insulator because of the
tightly bound electrons restricting electrical charge flow.
The nature of this material is changed through the
introduction of specific impurities which change the
properties of the crystal in a known manner, preferentially
creating P-Type or N-Type semiconductor material. The growth
of crystals may also be referred to "epitaxial growth" (grown
from a vapor). In either method of crystal growing, the
crystalline material is "doped" to produce N-Type or P-Type
semiconductor substrate ingots. These ingots may be layered
in this manner such that a cross sectional view of the ingot
would display alternating layers of "N" and "P" type
properties.
The type ingot is then sawed into thin wafer discs. Each
disc is ground flat and polished to mirror smoothness. Where
a single N-Type crystal is prepared, the slice is heated in a
chamber, silicon chloride gas is pumped in, and the gas
decomposes to a monocrystalline silicon deposited on the
surface. The gas generally carries a small amount of the P-
Type impurity.
2.3.2 Wafer Preparation

2-14
Ingots are shaped into wafer form through a series of
cutting and grinding steps, usually performed using diamond-
tipped tools. The ends of the silicon ingots are removed and
individual wafers are cut. The wafers may then be polished
using an aluminum oxide/glycerine solution to produce uniform
flatness across the surface of the wafer in a process called
lapping. This initial shaping of the wafer leaves
imperfections in the surface and edge of the wafers that are
subsequently removed in an etching step. Chemical etching
involves the use of hydrofluoric, nitric, or acetic acids as
well as alkaline solutions of potassium or sodium hydroxide.
Other contaminants such as organics are removed in solvent
cleaning steps.
A final polishing step is performed to provide a smooth
surface for subsequent processing. In this step, wafers are
mounted on a fixture, pressed against a polishing pad under
high pressure, and rotated relative to the pad. A polishing
slurry, typically containing silicon dioxide particles in
sodium hydroxide, is used. This step is both a chemical and
mechanical process; the slurry reacts chemically with the
wafer surface to form silicon dioxide, and the silica
particles in the slurry abrade the oxidized silicon away. In
some cases, bare silicon wafers are cleaned using ultrasound
techniques that involve the use of potassium chromate or other
mild alkaline solutions. In the final wafer preparation step,
the wafers are usually rinsed in deionized water and dried
with compressed air or nitrogen.
2.3.3 Oxidation
Oxidation is an initial and sometimes second or third
step in the fabrication of the semiconductor wafer. A film of
silicon dioxide is formed on the exterior surface of the wafer
2-15
in this step. The process takes place in a temperature- and
pressure-controlled vessel to control the reaction between the
surface of the silicon wafer and an oxidant gas such as oxygen
or water vapor. A thin layer of silicon dioxide is formed,
which insulates and protects the wafer during subsequent
processing. Dry oxidation may use chlorine (in the form of
chlorine gas), anhydrous hydrochloric acid, or
trichloroethylene. At this point, the wafer is thoroughly
cleaned and is ready for the initial application materials.
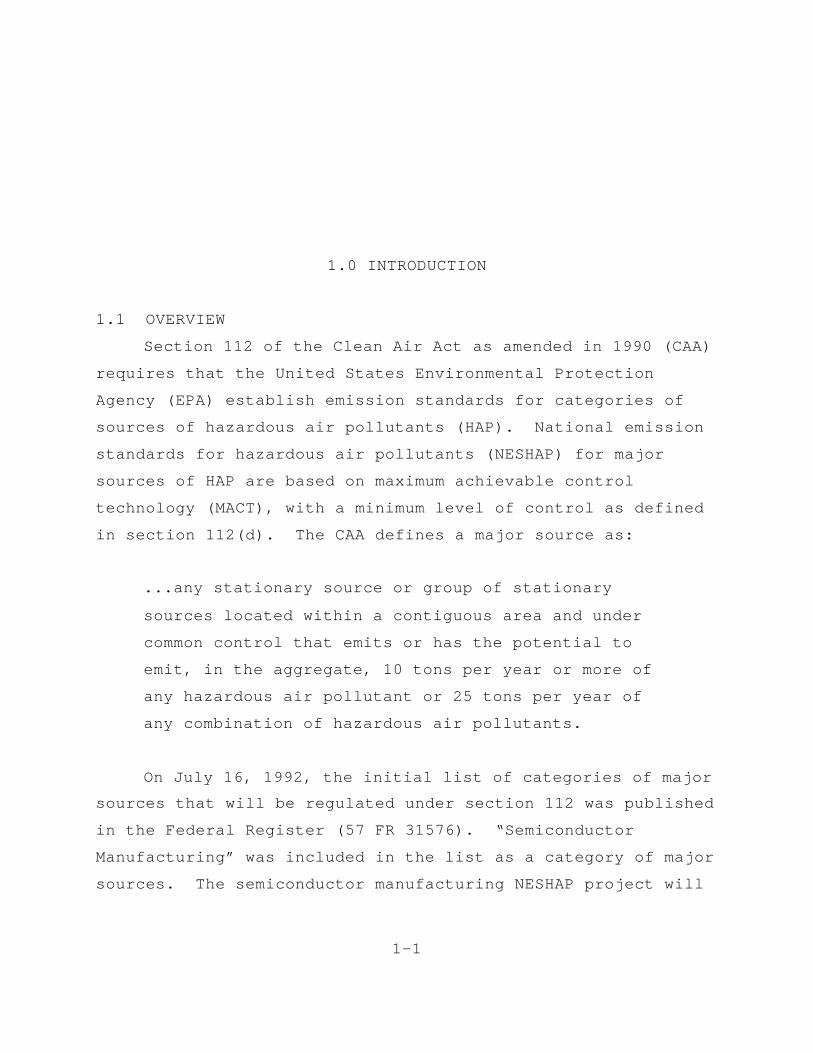
2.3.4 Photolithography
Photolithography transfers multiple patterns to a
semiconductor wafer by exposure and development of a photo-
sensitive material (photoresist) placed on the wafer.
Patterns with widths less than a micrometer (3.9 x 10⁻⁵ inch)
can be transferred using a photomask over the thin layer of
photoresist material on the wafer. The resist is typically
spun onto the wafer and baked to remove any solvent remaining
in the resist material. Next, the photomask, which is
generally a glass emulsion plate with a circuit design made
from a hard-surface material such as chromium or iron printed
on it, is placed over the wafer. Light is projected through
the voids in the photomask causing the exposed surfaces of the
wafer to be “developed.” The unexposed areas of the
photoresist are then removed through a development process
(alternatively, depending on the process and photoresist used,
the exposed photoresist may be removed) leaving the circuit
pattern traced on the wafer.
The following lithography techniques are commonly used;
however, the demand for better techniques and the ever-
expanding capabilities of ICs pose increasing challenges for

2-16
lithographic technology. Though steps such as spin on glass
and resist etchback techniques have been developed to allow
smaller (0.35 micron) designs, additional development of new
techniques such as chemical-mechanical polishing have also
emerged.
There are two types of photoresists:
1. Positive photoresists are chemicals made more soluble
through exposure to radiation. During the development
step, the developer (like in film processing) removes the
resist that was exposed.
2. Negative resist are chemicals that polymerize and
stabilize upon exposure to radiation. During the
subsequent development the developer removes the resist
that was not exposed.
Three types of radiation are used in photolithography:
optical, electron beam, and X-ray. Each type has relative
advantages and costs, but optical ultraviolet (UV)
applications predominate. Electron-beam systems result in
greater resolution than optical systems and can apply a
circuit pattern directly on the photoresist without the use of
a photomask. Electron-beam systems are typically used to
create the photomasks used in optical systems.
In an optical system, the photoresist is exposed to UV
light through the photomask. The photoresist either
polymerizes (hardens) when exposed to light (if a negative
resist is used) or unpolymerizes (if a positive resist is
used). After exposure, the wafer is developed in a solution
(e.g., trichloroethane, chlorobenzene, etc.) that dissolves
the unwanted resist and is then rinsed to remove excess
developer solution. The majority of development processes are
2-17
liquid immersion or spray methods, but dry plasma methods are
also used.
After photolithography, the resulting wafer has a silicon
dioxide layer exposed for the circuit pattern, with the rest
of the wafer being covered with the remaining photoresist
coating. Since the prepared photoresist surface resists
etchants, the wafer can now be washed with etching chemicals
to cut windows in the exposed oxide layer.
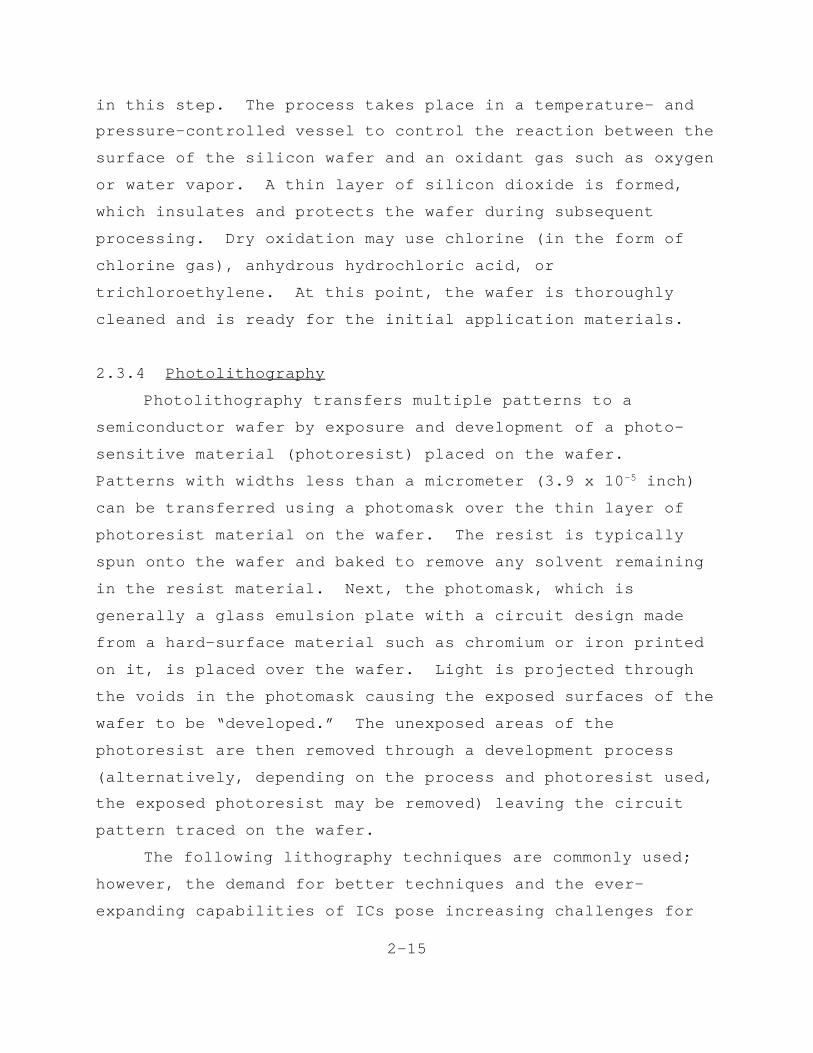
2.3.5 Etching
Etching involves liquid acids or reactive gases which
etch away exposed oxide areas to create dimensional patterns
(windows) on the wafer surface. After the photoresist is
developed, the wafer is placed in a solution that etches the
exposed silicon dioxide layer but does not remove the resist,
creating the circuit pattern in the silicon dioxide layer.
This pattern forms areas in which dopants will be applied to
provide the required electrical properties. Several etching
processes are available. Wet (i.e., liquid) chemical etching
uses acid solutions to etch the exposed layer of silicon
dioxide at ambient or elevated temperatures. Hydrofluoric,
sulfuric, and nitric acids and hydrogen peroxide are typically
used. However, wet etching is less effective for etching
multiple plasma-deposited layers, and dry etching techniques
have been developed that overcome the limitations of wet
etching techniques.
In the most commonly used dry etching technique, plasma
etching, a plasma gas is formed by ionizing process gases
under a vacuum. Although dry etching usually involves
reactive halogenated gases, nonhalogenated gases may also be
used. Chemicals used during the dry etching process include
chlorine, hydrogen bromide, carbon tetrafluoride, sulfur

2-18
hexafluoride, trifluoromethane, fluorine, fluorocarbons,
carbon tetrachloride, boron bichloride, hydrogen, oxygen,
helium, and argon. Other dry etching techniques include
sputter etching, ion milling, reactive etching, and reactive
ion beam etching.
After etching, the remaining photoresist is removed using
dry or liquid stripping compounds. The etched and stripped
wafer is ready for the diffusion furnace where under high
temperatures a dopant is introduced to the exposed windows.
2.3.6 Doping
Doping occurs when ions of dopant materials are
electrically or thermally driven into exposed areas of a
patterned wafer to create electrically positive or negative
conductive regions (PN junctions). To create the desired
electronic components (transistors, resistors, etc.),
impurities (called dopants) are introduced into the silicon
dioxide pattern on the wafer. Dopants are introduced into the
silicon dioxide pattern on the wafer either by diffusion or by
ion implantation processes.
In the diffusion process, vaporized metals diffuse into
exposed regions of the wafer. Dopant atoms are introduced
using either a dopant-containing vapor in high-temperature
furnaces (400 - 1000EC) (750 - 1,800EF) or a dopant-oxide
layer coated on the wafer. The most commonly used dopants
include arsenic, boron, and phosphorus, while aluminum,
antimony, beryllium, gallium, germanium, gold, magnesium,
silicon, tellurium, and tin are also used.5 In the diffusion
process, dopant atoms take the place of a small portion of the
silicon atoms in the crystal structure. Boron, for example,
is a P-type dopant. Where boron is implanted, the silicon

2-19
becomes a P-type junction. When the diffusion depth is
achieved the wafer is removed and the process stops.
The ion implantation process is a physical deposition
process that provides greater control of the number and depth
of dopant atoms than does the diffusion process (a chemical
process). In the ion implantation process, dopant sources are
ionized in a vacuum chamber at ambient temperature. The
ionized particles are then accelerated to high velocities and
imbedded into the wafer by an ion implanter. The strength of
the ion implanter voltage determines the depth of dopant
implantation and the dopant gas usage. Typical gases used in
the ion implantation process include arsine, phosphine, and
boron trifluoride.
2.3.7 Layering
Layering covers the wafer with material that acts as a
conductor (such as aluminum), semiconductor (such as silicon),
or insulator (such as silicon dioxide). Prior to layering,
the wafer is cleaned using the same techniques as those used
in oxidation and doping. The primary layering methods
available include deposition, metalization, and dielectric and
polysilicon film deposition.
2.3.7.1 Deposition. Deposition processes may be used to
apply additional layers of silicon, silicon dioxide, or other
materials to the wafer. Deposition processes typically employ
epitaxial growth, in which the substrate wafer acts as a seed
crystal for the new layer. Dopants may be added to provide
special electrical properties. Two techniques used for
epitaxial growth are chemical vapor deposition (CVD) and
molecular beam epitaxy (MBE), with CVD being more common.
During CVD, materials are vaporized in a high-temperature
reactant chamber furnace to produce a thin layer on the wafer.

2-20
Materials that may be used during CVD include silane, silicon
tetrachloride, ammonia, nitrous oxide, tungsten hexafluoride,
arsine, phosphine, and diborane.6 Another gaseous deposition
technique is low-pressure CVD, which uses elevated-temperature
vacuum chambers that may use nitrogen and/or silane, arsine,
tetraethylorthosilicate, dichlorosilane, ammonia, hydrogen
fluoride, and nitrous oxide.
In MBE, silicon and one or more dopants are evaporated
and transported to the substrate at high velocity in a vacuum.
This process is typically performed at lower temperatures than
CVD. After a layer is applied, the wafer may undergo the steps
previously described to impart additional electrical
properties and circuits to the wafer.
2.3.7.2 Metalization. Metalization deposits metal
layers at the atomic level for contacts and interconnections
through condensation on the wafer surface. Metalization
techniques include evaporation and sputtering and employ
similar photolithography techniques as discussed above.
The evaporation method uses high temperatures to vaporize
a metal that condenses on the wafer surface. Metals used in
metalization include aluminum, platinum, titanium, nickel,
chromium, silver, copper, tungsten, gold, and germanium.
Evaporation methods include electron-beam evaporation of pure
metal, resistance heating evaporation, and inductive heating
evaporation. Argon gas is also used in some operations.
In the sputtering process, ionized gas atoms (e.g.,
argon) remove atoms from a target metal. These metal atoms
deposit on the wafer to form a layer. Metals used in
sputtering include titanium, platinum, gold, molybdenum,
tungsten, nickel, and cobalt. Any unnecessary metals from
this process may be removed by solvents or acid solutions.

2-21
2.3.7.3 Dielectric and Polysilicon Films. Dielectric
and polysilicon films are deposited onto the wafer to provide
conducting regions within the device, electrical insulation
between metals, and protection from the environment. The most
widely deposited films are polycrystalline silicon, silicon
dioxide, and silicon nitride. Doping elements such as
arsenic, phosphorus, and boron also may be added using this
process. Oxygen may be added to polysilicon films to act as a
semi-insulating material used for passivating the surface.
After the final layering, the wafer is rinsed in
deionized water, a glass like material is applied to protect
the wafer from contamination, the bottom of the wafer is
mechanically ground, and a thin layer of gold is then plated
to the bottom of the wafer.
2.3.8 Cleaning
Cleaning of wafers, tools and equipment, and other
general items occurs throughout wafer fabrication. HAP
materials are used for cleaning, including hydrochloric acid
and methanol. Alcohol compounds may be used for cleaning
chips in the final assembly process.
2.3.9 Assembly and Test
2.3.9.1 Assembly. Assembly involves a series of steps
from cutting the individual chips from the wafer to the final
packaging. The steps include: die cutting, die attach, post-
solder cleaning, wire bonding, and encapsulation. In die
cutting, the individual chips (or die) are separated from the
wafer through laser or diamond impregnated saw. The chip is
then mounted onto a metal frame (e.g., lead) through a
soldering process or through use of an epoxy. Solvent blends
or terpenes are used to conduct the post soldering cleaning or
2-22
defluxing. The next step is installing wire bonding (pins),
which provides the connections from the metalized parts of the
chip to the leads of the package or frame. In the
encapsulation step, an airtight package made of plastic or
epoxy resin seals the package. Ceramic caps are used for some
applications.
2.3.9.2 Testing. The individual devices are tested on
automatic electromechanical handling equipment by computers
that apply static electrical tests and some dynamic electrical
tests. Units that pass are marked and packaged.
2.3.10 Ancillary Processes
Ancillary processes in the semiconductor manufacturing
industry include process cooling water, de-ionized water, room
air conditioning, waste treatment, chemical storage and
transport, process piping, and in some cases standby
electrical generation equipment. De-ionized water production,
either onsite or provided through a vendor, is the largest
consumption of water and energy usage of all the ancillary
activities at a fabrication facility.
2.4 HAP USAGE AND EMISSIONS
The physical and chemical processing steps discussed in
Section 2.3 occur at four process operation areas: solvent
stations, wet chemical stations, coating application stations,
and gaseous operation stations. These process operation areas
are discussed in Section 2.4.4. A variety of pollutants may
be emitted at these stations. These include acid fumes and
organic solvent emissions from cleaning, rinsing, resist
drying, developing, and resist stripping; hydrogen chloride
emissions from etching; and other various emissions from spent
etching solutions, spent acid baths, and spent solvents.7 In

2-23
addition to process related emissions, air emissions may also
result from onsite treatment of industrial wastewater.
2.4.1 HAP Usage.
According to information provided by the SIA,8 29
different HAP materials were reported as being used by the 20
facilities participating in the study. Ion bed regeneration
for deionized water production exhibited the highest HAP
usage. Lithography operations represent the largest use of
HAP in wafer production, with wet etch representing the second
largest HAP usage. These HAP materials are predominantly
organic. The other processes with significant HAP usage,
consisting primarily of acids and organic solvents, are
diffusion, epitaxy, and some cleaning operations. Inorganics
other than acids comprise only a small percentage of the HAP
usage. As reported by the SIA, five chemicals comprised 95
percent of the total HAP usage: hydrochloric acid (HCl),
hydrofluoric acid (HF), glycol ethers, methanol, and xylene.9
Of this 95 percent, 76 percent were acids (87 percent HCl), 23
percent were organics (32 percent xylene, 29 percent methanol,
22 percent glycol ethers), and 1 percent were inorganics
(metals, hydrides, chlorine). The SIA study showed that
eleven chemicals represented over 90 percent of reported HAP
emissions.10
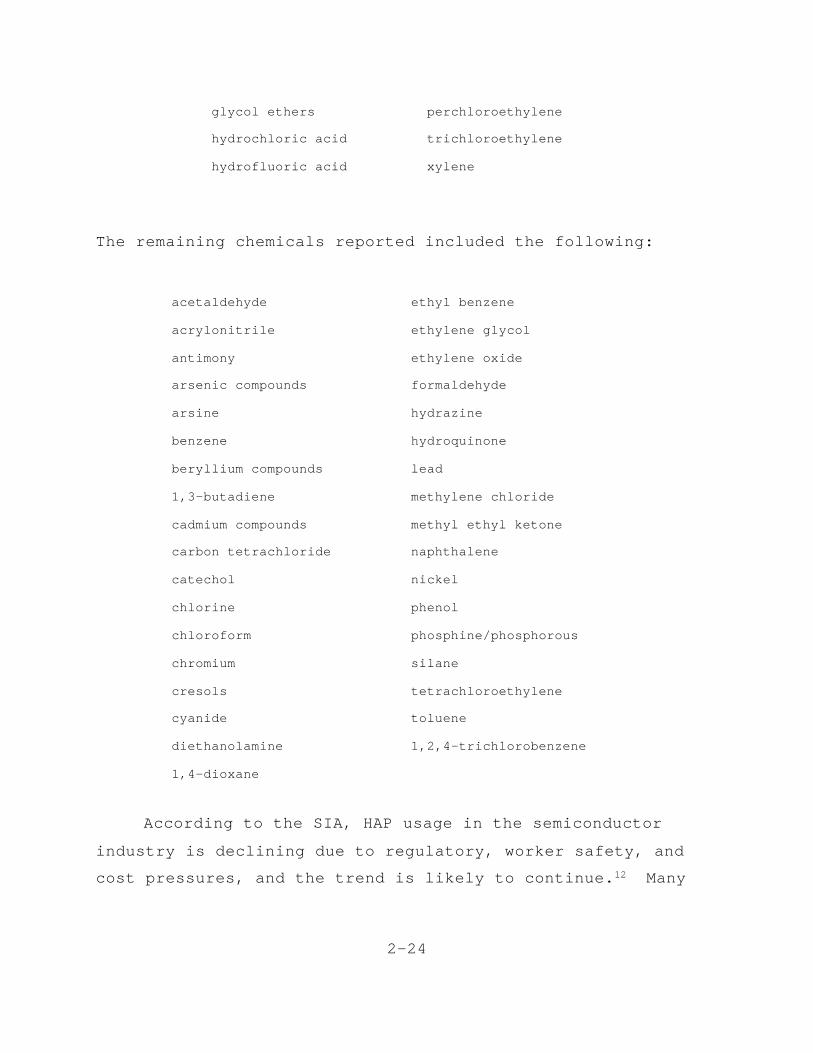
A subsequent SIA study11 showed that the following 10
chemicals comprised approximately 93.8 percent of all
controlled HAPs emitted, with methanol being the most
predominant:
ethylbenzene methanol
ethylene glycol methylene chloride
2-24
glycol ethers perchloroethylene
hydrochloric acid trichloroethylene
hydrofluoric acid xylene
The remaining chemicals reported included the following:
acetaldehyde ethyl benzene
acrylonitrile ethylene glycol
antimony ethylene oxide
arsenic compounds formaldehyde
arsine hydrazine
benzene hydroquinone
beryllium compounds lead
1,3-butadiene methylene chloride
cadmium compounds methyl ethyl ketone
carbon tetrachloride naphthalene
catechol nickel
chlorine phenol
chloroform phosphine/phosphorous
chromium silane
cresols tetrachloroethylene
cyanide toluene
diethanolamine 1,2,4-trichlorobenzene
1,4-dioxane
According to the SIA, HAP usage in the semiconductor
industry is declining due to regulatory, worker safety, and
cost pressures, and the trend is likely to continue.12 Many

2-25
HAP materials used in semiconductor manufacture have been
replaced by HAP-free materials.
2.4.2 Number of Exhaust Streams
As a result of the sterility required of clean rooms for
most semiconductor manufacturing processes, facilities
typically have few air exhaust streams. These air exhaust
streams are characteristically high-volume, low-velocity
streams resulting in dilute pollutant concentrations. In
general, the entire fabrication plant consists of two
different classes of HAP emissions, acids and organics. These
two classes of emissions are separated for treatment by the
appropriate control device. Each tool or station within a
semiconductor fabrication facility must meet certain OSHA
standards for worker protection. In general, each tool has an
exhaust system which may include point of use (POU) devices
tied to a series of plenums that are then directed to control
equipment.
2.4.3 Uncontrolled Emissions
According to a facility by facility HAP emission
accounting conducted by the SIA, the industry also has
uncontrolled emission points within the semiconductor
manufacturing process. Approximately 65.1 megagrams per year
(Mg/yr) (71.6 tons per year (tpy)) of uncontrolled emissions
were identified by the 11 facilities that participated in the
study. Of this amount, 54.0 Mg/yr (59.3 tpy) (or about 83
percent of the uncontrolled emissions) are associated with
cleaning, photoresist formulation (mixing), ceramic layering
activities, and other activities.
2.4.4 Process Operation Areas and Emissions
The physical and chemical processing areas associated
with semiconductor manufacturing can be classified into four

2-26
general types: solvent stations, wet chemical stations,
coating application stations, and gaseous operation stations.
2.4.4.1 Solvent Stations. Solvent station emissions are
subject to control under the Halogenated Solvent Cleaning
NESHAP. Cleaning materials (primarily organic solvents) are
used to prepare and clean wafers for subsequent processing or
for parts cleaning.
Solvent stations are batch and in-line machines. The
solvent removes water-insoluble soils such as waxes and may be
used to dry material by the displacement of moisture with the
solvent, which is subsequently evaporated. Both batch and in-
line machines are designed to use solvent either at room
temperature (i.e., cold cleaners) or solvent vapor (i.e.,
vapor cleaners). Solvent stations may be operated at elevated
temperatures with manual or ultrasonic agitation.
Typical solvents and cleaning agents include acetone,
deionized water, xylene, glycol ethers, isopropyl alcohol,
hydrogen peroxide and sulfuric acid.13 Organic solvent
cleaners use halogenated and nonhalogenated solvents or
solvent blends. The vast majority of halogenated solvent use
is in vapor cleaning, both batch and in-line. Cold cleaners
typically use mineral spirits, Stoddard solvent, and alcohols.
Very little halogenated solvent use has been identified in
batch cold cleaning.14 Traditional semiconductor cleaning
processes often use chlorofluorocarbons (CFC) and chlorinated
hydrocarbons (e.g., trichloroethylene), and
trichlorotrifluoroethane (CFC-113 or Freon™) may be used to
dry the components after rinsing.15 CFC have been used in
vapor degreasing of vacuum system components by using a
mixture of CFC-113 and methyl alcohol. General solvent types
used for wafer wax removal include hydrocarbon-based or

2-27
terpene-based solvents, amines, acids, and mixtures of these
and other agents. The most commonly used cleaning solution in
semiconductor manufacturing includes a combination of hydrogen
peroxide and sulphuric acid.
2.4.4.2 Wet Chemical Stations. Wet chemical stations
are used to clean wafers, remove photoresist, and etch
patterns into the wafer’s silicon or metal surfaces.
Materials used during the wet etching process may include
acids (sulfuric, phosphoric, nitric, hydrofluoric, and
hydrochloric), ethylene glycol, hydrogen peroxide, hydroxide
solutions, and solutions of ammonium, ferric, or potassium
compounds.16 Hydrofluoric acid is used to wet etch silicon.
Phosphoric acid is used to wet etch aluminum, which may be
deposited on the wafer during the evaporation or sputtering
step. Etching stations that use acids are vented through
hoods that are typically connected to a wet scrubber for
control.
2.4.4.3 Photoresist Application, Developing, and
Stripping Stations. This general step in the semiconductor
process may be classified as a coating operation. Processes
in this industry that can be classified as coating operations
include the photoresist application, spin-on glass, and
application of adhesives and resins. Developer stations and
rinses may also be included here. Emissions occur through
evaporation or atomization. Typically, once the photoresist
material has been spun onto the wafer, solvents in the
photoresist are evaporated by baking the wafer at low
temperature.
During the lithography step, developers are used that may
also result in emission losses. Negative photoresist
developers may include xylene or Stoddard solvent, and

2-28
positive photoresist developers include potassium hydroxide,
sodium hydroxide, and tetramethyl ammonium hydroxide (TMAH).
Although mentioned in this section, some photolithography
steps may be associated with the general group of solvent
stations or wet chemical stations. Organic solvents are
commonly used as liquid strippers to remove the photoresist
from wafers containing metals. Liquid photoresist strippers
for non-metalized surfaces commonly include hydrogen peroxide,
sulfuric acid and ammonium persulfate, and sulfuric and nitric
acid blends. Strippers for metallic surfaces most commonly
contain an organic acid and chlorinated hydrocarbons. Other
solutions include chromic and sulfuric acid mixtures, aqueous
amines, and solvents.
2.4.4.4 Gaseous Operation Stations. Many of the
processes at semiconductor manufacturing facilities occur in
gaseous environments. Gaseous environments may be used for
photoresist stripping, cleaning, doping, etching, or layering
operations. Specific processes include CVD, plasma-enhanced
CVD, diffusion furnace chambers, ion implantation chambers,
plasma etching chambers, plasma/ion etching chambers, and
siliconizing reactors. Dry stripping photoresist may
utilize oxygen plasma, which requires no chemical processing,
and thus results in no HAP emissions.
Emission sources from the doping process include excess
dopant gases and contaminated carrier gases.
Oxidation and deposition processes may use HAP gases,
such as chlorine or phosphine, at elevated temperatures. Such
processes are commonly controlled by wet scrubbers due to the
formation of acids from the thermal breakdown of chlorine-
containing compounds.

2-29
In dry chemical stations, perfluorocarbon (PFC) gases
such as hexafluoroethane are used for etching wafers and
cleaning reactors in plasma processes. The PFC gases in the
reactor chamber form fluorine species, including hydrofluoric
acid and hydrogen fluoride. However, the conversion of PFC
gases to hydrofluoric acid is incomplete, and a complete
accounting of each fluorine species is difficult to obtain.
2.4.4.5 Miscellaneous Operations. Including the
reference to ancillary operations such as process cooling
water, laboratory operations, and deionized water chemical
supply and storage, semiconductor production generates
emissions from assembly and test wipe cleaning, equipment
maintenance and assembly, and final mark and pack operations
associated with packaging for distribution. Typically, these
process contribute a small amount of air emissions as compared
to the entire facility.
2.4.5 HAP Materials and Waste Characterization in the
Semiconductor Manufacturing Industry
The following waste characterization is typical of the
waste streams generated during the manufacture of
semiconductors:
• Epitaxy - Acidic gaseous emissions are produced during
the epitaxy process containing silane (SiH4) and hydrogen
chloride.
• Oxidation - Pyrolitic oxidation using TEOS produces
gaseous emissions containing Si(C2H5O)4 and oxygen. Chemical
vapor deposition oxidation emits gaseous vapors containing
silane, oxygen, and hydrogen.
• Photolithography - The photoresist coating stage
involves resins and results in a solvent waste stream that

2-30
typically contains xylene. Developing and rinsing uses
alkalis and acids resulting in liquid waste streams containing
these materials.
• Etching - Oxide etching using hydrofluoric acid
produces an acidic effluent containing metals. Nitric etching
using sulfuric acid, ozone depleting substances, carbon
tetrachloride and carbon tetraflouride produces a low pH
effluent. Polysilicon etch produces a high pH rinse. Plasma
etch produces a waste stream of metals, acids, and fluorides.
Metal etch produces an effluent with a high metal content.
• Diffusion and Implant - The diffusion and implant
stages produces a variety of waste depending on the type of
dopants used. Gaseous emissions may include hydrogen
fluoride, arsine, phosphine, and arsenic. Liquid wastes
contain residual dopant and phosphorus oxychloride. Solid
arsenic waste is associated with diffusion.
• Metalization - Sputtering and evaporation techniques
produce solid waste mainly comprised of heavy metals.
• Passivation by Low Pressure Chemical Vapor
Deposition - The process produces a gaseous waste stream
containing silane and hydrogen chloride.
2.5 NATIONAL BASELINE EMISSIONS
The semiconductor manufacturing industry has a record of
reducing HAP emissions. Table 2-2 presents the reduction in
HAP emissions from all reporting semiconductor manufacturers
from 1987 through 1994. Emission reductions are based on TRI
data reported for SIC code 3674. Based on this data,
aggregate HAP emissions fell from 2,426 Mg (2,668 tons) in
1987 to 579 Mg (636 tons) in 1994. Figure 2-1 shows the same

2-31
data normalized for the surface area of silicon used in the
integrated circuit substrate.
The baseline emissions for this MACT category have been
reduced over several years. The industry efforts directed at
substitution, elimination, and end-of-pipe control
applications have resulted in greatly reducing the number of
major affected sources since the initial category listing.
Based on information provided by the SIA, the baseline
emission of major and co-located area sources is approximately
68 Mg/yr (75 tpy). The three primary HAP pollutants in the
bseline are methanol at 25 Mg/yr (28 tpy), xylene at 15 Mg/yr
(16 tpy), and perchlorethlylene at 19 Mg/yr (21 tpy).

2-32
Table 2-2. HAP Emissions from Semiconductor Manufacturing as Reported to theToxic Release Inventory (TRI), 1987-1994
HAP 1987 1988 1989 1990 1991 1992 1993 1994
1,1,1-Trichloroethane 2,027,269 2,724,521 2,541,609 2,401,186 1,596,634 1,135,257 339,952 92,487
1,2,4-Trichlorobenzene 49,550 62,973 73,918 19,323 4,762 4,522 6,519 10,100
Methylene Chloride 586,482 556,062 518,206 303,824 181,669 104,430 51,683 34,656
Ethylbenzene 25,000 21,980 34,570 11,600 10,640 8,810 1,475 1,815
Ethylene Glycol 1,500 5,360 10,459 3,967 2,316 3,326 12,004 33,849
Glycol Ethers 171,746 165,417 193,357 224,793 198,741 229,642 257,472 205,519
Hydrochloric Acid 188,445 174,420 208,153 206,142 113,969 112,995 95,625 101,792
Hydrofluoric Acid 65,411 93,954 60,193 80,420 81,126 56,683 63,692 48,963
Lead 295 186 1,026 184,631 1,569 760 750 770
Methanol 267,395 555,026 510,794 419,465 414,195 256,462 204,225 210,946
Methyl Ethyl Ketone 39,717 92,610 184,043 181,038 208,220 223,296 138,132 73,319
Phenol 42,506 205,245 71,205 35,069 5,924 1,511 2,795 1,850
Tetrachloroethylene 423,666 495,626 410,296 202,667 135,518 43,996 55,548 71,400
Toluene 37,072 32,369 78,176 48,900 56,550 89,728 84,292 86,726
Trichloroethylene 1,007,021 1,147,956 665,955 562,719 361,692 197,046 177,671 112,047
Xylene (Mixed Isomers) 403,352 481,519 646,437 482,843 456,100 350,680 312,898 186,607
Total 5,336,427 6,815,224 6,208,397 5,007,587 3,829,625 2,819,144 1,804,733 1,272,986

2-33
0
0.01
0.02
0.03
0.04
0.05
0.06
0.07
0.08
0.09
1986 1987 1988 1989 1990 1991 1992 1993 1994 1995
TRI Report Year
HA
P (
lbs)
per
Sq
uar
e In
ch o
f S
ilico
n
Figure 2-1. TRI Reportable HAP Releases per Area of Silicon Substrate

2-34
2.6 REFERENCES
1. U.S. Department of Commerce, Bureau of the Census. 1997Economic Census, Comparative Statistics for UnitedStates, Manufacturing by Industry (4-digit SIC). Available at: http://www.census.gov.
2. SIA. Chip Facts: World Market Sales and Shares for1982-1995. http://www.semichips.org
3. SIA press release #32, October 29, 1997. Global ChipMarket to Grow nearly 17% in 1998; Total Sales ShouldExceed $232 Billion in 2000. http://www.semichips.org
4. Kirk-Othmer Encyclopedia of Chemical Technology, FourthEdition. John Wiley and Sons, New York, 1997. Volume21, page 1092.
5. Profile of the Electronics and Computer Industry. U.S.Environmental Protection Agency, Washington, D.C. Publication No. EPA/310-R-95-002. 1995.
6. Reference 5.
7. Reference 5.
8. SIA Report to EPA. November 1994.
9. Reference 8.
10. Reference 8.
11. SIA Major Source Survey Summary of results. Presented toEPA on November 26, 1996
12. Reference 11.
13. Reference 5.
14. National Emission Standards for Hazardous Air Pollutants: Halogenated Solvent Cleaning - Background InformationDocument. U.S. Environmental Protection Agency, ResearchTriangle Park, NC. Publication No. EPA 453/R-93-054. 1993.
2-35
15. Meier, G. Cleaning Solvent Substitution in ElectronicAssemblies. Second International Congress onEnvironmentally Conscious Manufacturing, August 29 -September 1, 1993. KCP-613-5279, prepared under ContractNo. DE-76-DP00613. U.S. Department of Energy, Arlington,VA.
16. Reference 5.

3-1
3.0 EMISSION CONTROL TECHNIQUES
3.1 CONTROL OF HAP EMISSION SOURCES
Hazardous air pollutant control measures in the
semiconductor manufacturing industry include add-on control
devices and preventive measures. Add-on control devices
include adsorbers, oxidizers, concentrators, and absorbers
(wet scrubbers). In addition, point-of-use control devices
can be used on individual process equipment. Preventive
measures include product substitution and reformulation, work
practice procedures, and equipment modifications.
3.2 ADD-ON CONTROL DEVICES
3.2.1 Adsorbers.
Adsorption is a process in which organics are selectively
collected on the surface of a porous solid. Activated carbon
is the adsorbent most often used for low organic gas
concentrations because of its low cost and relative
insensitivity to water vapor at relative humidities below
about 50 percent. Other common adsorption media include
silica- and alumina-based adsorbates. Because adsorption
processes simply
separate the contaminant from the gas stream, adsorption
processes must be used in conjunction with other unit
operations to recover or destroy the pollutants. There are

3-2
two types of adsorption systems that can be used for removal
of organic vapors from gas streams. These are nonregenerable
and regenerable (fixed-bed systems). The use of
nonregenerable adsorption systems on low concentration, high
flow pollutant streams in the semiconductor manufacturing
industry has not been reported.
3.2.2 Oxidizers
Oxidation is a thermal process that converts organic
compounds to CO2 and H2O. Incineration is widely used for the
destruction of a variety of organic vapors and is best suited
to applications where the gas stream has a consistent flow
rate and concentration.
In thermal oxidation, the organic process exhaust is
heated to very high temperatures to oxidize the organic
compounds in the gas phase. To save fuel, a heat exchanger
(either regenerative or recuperative) is often used to recover
the heat generated during incineration by preheating the inlet
gas. Thermal oxidizers without heat recovery are not known to
be used to control high flow, low concentration gas streams.
This is due to the high rate of fuel consumption when compared
to systems using heat recovery or catalysis.
Because silicon dioxide (SiO2) is a product of the
oxidation of some exhaust streams emitted by semiconductor
manufacturing, and because SiO2 causes catalyst plugging,
catalytic oxidizers are rarely used to control organic
emissions in semiconductor manufacturing.
Depending on the type of heat recovery unit, oxidizers
are further classified as regenerative or recuperative.
Regenerative oxidizers are discussed in Section 3.2.2.1, and
recuperative oxidizers are discussed in Section 3.2.2.2.

3-3
3.2.2.1 Regenerative. Regenerative thermal oxidizers
consist of a flame-based combustion chamber that connects two
or three fixed beds containing inert (e.g., ceramic) packing.
Incoming gas enters one of the beds where it is preheated.
The heated gas flows into the combustion chamber, burns, and
the hot flue gases flow through the packed beds which capture,
store, and allow recovery of the heat generated during
oxidation. The packed beds store the heat energy during one
cycle and then release it as the beds preheat the incoming
organic vapor-laden gas during the second cycle. Up to 95
percent of the energy in the flue gas can be recovered in this
manner.1
3.2.2.2 Recuperative. Recuperative oxidizers use shell
and tube heat exchangers to transfer the heat generated by
incineration to preheat the feed stream. Recuperative thermal
oxidation has a much lower thermal efficiency and as a result,
it is far less economical for low concentration streams, such
as those found in the semiconductor manufacturing industry.
Recuperative oxidizers are not known to be used in the
semiconductor manufacturing industry.
3.2.3 Concentrators
Some semiconductor manufacturing facilities are
installing rotary concentrator systems for control of organic
HAP emissions.2 Zeolite rotary concentrators followed by
thermal oxidation are a typical example.
Rotary concentrators use a rotating wheel containing
adsorbent material which is partially exposed to the influent
waste gas stream. The wheel adsorbs the volatile pollutants
in the influent stream and subsequently desorbs them using
steam or heat. The desorbed stream is relatively rich in
volatiles, and this lower-volume higher-concentration stream

3-4
is typically oxidized. One shortcoming of rotary
concentrators in the semiconductor manufacturing industry is
their lack of affinity for methanol, which is controlled at
only 40-60 percent.3
3.2.4 Absorbers
Wet scrubbing is a process used by the semiconductor
manufacturing industry to remove inorganic pollutants from air
streams. In absorption-based scrubbing, one or more soluble
components of the air stream are dissolved in a liquid.
Typically, water is the liquid of choice reported by the SIA.5
The absorption equipment most commonly used for pollution
control is the packed tower, in which a column filled with
packing material provides a large surface area for thorough
contact between the gaseous and liquid streams. Removal
efficiencies depend on the specific pollutant-solvent
combination, the type of absorber used, and the physical
configuration of the scrubber and media interface. In
general, absorbers have removal efficiencies of 90 percent or
higher.
A wet scrubber may be used to control acetone and other
water miscible VOC. The scrubber effluent containing water
soluble chemicals is typically routed to a local wastewater
treatment plant.
3.2.5 Point of Use
Non-acid inorganic HAP emissions produced at
semiconductor manufacturing facilities include reactive gases
and minute quantities of metals. The pyrophoric nature of
reactive gases imposes certain safety requirements on gas
handling. Because these gases tend to react with oxygen, the
formation of oxygen particulates that collect in piping and
pumps also create substantial maintenance problems. The

3-5
devices used to control non-acid inorganic reactive gases
include thermal reaction chambers (burn boxes), non-thermal
reaction chambers, or electrically-charged reaction chambers
(dry scrubbers). Some facilities regularly vent reactive
gases to central wet scrubbers and use control devices
described above for emergency release of inorganic exhaust
streams containing reactive gases such as phosphine.
In general, point-of-use (POU) control systems are
designed for treating air emissions from the outlet of the
manufacturing process to remove the compounds of interest and
prevent them
from entering the main exhaust ductwork. Historically, POU
control systems have been installed for reducing production
downtime and for health and safety reasons. Recently, air
emissions reductions have been another reason for using POU
control systems; however, their use for this purpose does not
allow for their recognition as part of the tool in
establishing potential to emit. Typically, POU control
systems are interlocked with the process equipment (i.e., when
a POU control system fails, the process equipment is shut
down). The later system type is the main criteria for
inclusion of the POU as an integral part of the tool when
determining PTE.

3-6
3.3 REFERENCES
1. Zerbinia, R.A., J. Spivey, S. Agarwal, W. Sanford. Survey of Control Technologies for Low ConcentrationOrganic Vapor Streams. U.S. Environmental ProtectionAgency, Research Triangle Park, NC. Publication No. EPA456/R-95-003. May 1995. Pages 2-15.
2. SIA Major Source Survey Summary of Results. Presented tothe EPA on November 26, 1996.
3. EPA/SIA/EIA Briefing. Durham, NC. December 11, 1996.
4. Reference 3.
5. Reference 3.

4-1
4.0 MACT FLOORS AND REGULATORY ALTERNATIVES
This chapter presents the maximum achievable control
technology (MACT) floors for existing and new sources of
hazardous air pollutant (HAP) emissions in the semiconductor
manufacturing source category and describes the methodology
used to determine the recommended floors. Regulatory
alternatives more stringent than the floor are also discussed,
but none is recommended.
The recommended MACT floor is based on the selection of
oxidation as the reference control technology representative
of the average emission limitation achieved by the best
performing five existing sources for which data were
available. In previous rulemakings, the EPA has recognized
that an oxidizer can generally achieve 98 percent control when
the concentration of pollutants in the exhaust stream is
sufficiently high. When the pollutant concentration is low,
performance efficiency of an oxidizer decreases and the EPA
has established a maximum emission rate of 20 parts per
million by volume (ppmv) as being equivalent to 98 percent
control. Thus, for the semiconductor manufacturing source
category, an emission reduction of 98 percent or a maximum
emission rate of 20 ppmv was determined to be equivalent to
the MACT floor reference control technology. Similarly, the

4-2
recommended reference technology for new sources (the “best of
the best”) is also oxidation.
The MACT floor analysis was based on data from facilities
that were either major sources or would be major sources if
not for the use of add-on control devices. The floor data
includes stack test data for 17 process vent emission points
from six “synthetic minor” sources. A synthetic minor source
is a source that would be major but for the use of add-on
control devices. In addition, engineering estimates were
collected for 9 process vents at the only known major
semiconductor manufacturing facility bringing the total
number of vents considered to 26.
The 1990 Clean Air Act (CAA) requirements for the
determination of MACT floors are discussed in Section 4.1.
The general approach used to determine the MACT floors for the
semiconductor manufacturing source category is discussed in
Section 4.2. Section 4.3 presents the analysis of
alternatives more stringent than the floor.
4.1 CLEAN AIR ACT REQUIREMENTS
For standards established under section 112(d) of the
CAA, the minimum level of required control is defined as the
“MACT floor.” For new sources, emission standards “shall not
be less stringent than the emission control that is achieved
in practice by the best controlled similar source.” For
existing sources, the emissions standards must be at least as
stringent as either “the average emission limitation achieved
by the best performing 12 percent of the existing sources,” or
“the average emission limitation achieved by the best

4-3
performing five sources” for categories or subcategories with
less than 30 sources.
4.1.1 Definition of “Average”
The minimum level of control defined under section 112(d)
of the CAA (“. . . the average emission limitation achieved by
the best performing 12 percent of the existing sources. . .”
and for a source category with fewer than 30 sources “. . .
the average emission limitation achieved by the best
performing five sources . . .”) is commonly referred to as the
MACT floor. The term “average” is not defined in the CAA. In
a Federal Register notice published on June 6, 1994 (59 FR
29196), the EPA announced its conclusion that Congress
intended “average,” as used in section 112(d)(3), to mean a
measure of mean, median, mode, or some other measure of
central tendency. The EPA concluded that it retains
substantial discretion, within the statutory framework, to set
MACT floors at appropriate levels, and that it construes the
word “average” (as used in section 112(d)(3)) to authorize the
EPA to use any reasonable method, in a particular factual
context, of determining the central tendency of a data set.
In addition, the EPA stated it has discretion to use
“best engineering judgement” in collecting and analyzing data
relevant to a MACT floor determination and in assessing the
data’s comprehensiveness, accuracy, and variability, in order
to determine which sources achieve the best emission
reductions. The EPA also has discretion in determining the
appropriate “average” in each source category (see 59 FR
29199). In this MACT floor analysis, the EPA chose a modal
analysis to determine the most frequently used control
technology reported by the best performing sources. An
average of the level of control (removal efficiency) achieved

4-4
by these sources was not used in this analysis for the reasons
discussed in Section C, below.
4.1.2 Meaning of “Source”
The CAA does not define “source.” A source may be a
facility, a kind of emission point, or a collection of
emission points. For the process vent MACT floor analysis, a
source was defined as an individual process vent. This
approach was selected as being the most appropriate because it
makes the best use of the available data. For example data
were not available for all process vents at a facility, so the
control level achieved by an entire facility could not be
adequately described. However, data were available on a
number of specific emission points for which emission testing
was performed.
4.1.3 Meaning of “Best Performing” and "Best Controlled"
For the MACT floor analysis, performance was measured in
terms of control device removal efficiency as determined
through the use of recognized test methods. The "best
performing" semiconductor manufacturing facilities were those
with the highest removal efficiencies.
Section 112(d)(3) of the CAA requires that the basis of
the MACT floor for new sources be "the emission control
achieved in practice by the best controlled similar source."
The facility with the highest removal efficiency was
considered to be the best controlled source for this analysis.
4.2 DETERMINATION OF THE MACT FLOORS FOR EACH SOURCE TYPE
Based on data gathering efforts that included site
visits, industry survey responses, and literature searches,
four potential emission sources of HAP emissions were
identified for the semiconductor manufacturing industry.
4-5
These sources were process vents, storage tanks, wastewater
treatment, and equipment leaks. No controls were identified
in use to control HAP emissions from storage tanks, wastewater
treatment, or equipment leaks based on the information
obtained from the data gathering efforts. Therefore, the MACT
floor for these sources is no control.
The individual semiconductor manufacturing operations
typically produce process vent emission streams that consist
primarily of organic or inorganic compounds. At some
facilities, the organic and inorganic process vent emission
streams are segregated to facilitate control, while others
combine them into one or more common exhaust streams. For
purposes of the MACT floor analysis, all the data obtained for
the 26 process vents were considered together. No distinction
was made between organic, inorganic, or combined emission
streams for the test data because the same level of control
can be achieved whether the streams are segregated or
combined.
Using the test report summaries for the 26 process vents,
the removal efficiency was calculated from the inlet and
outlet concentration values for each process vent emission
stream. The process vents were then ranked from highest to
lowest removal efficiency, as presented in Table 4-1. This
ranking was performed to determine the most prevalent control
technology, not to determine the average removal efficiency.
This decision was made because the performance of control
devices in the semiconductor manufacturing industry is
affected by highly variable inlet conditions. The performance
of those control devices varies in response to inlet
conditions and is more erratic at lower inlet conditions. Any
single control device will perform at peak efficiency on an

4-6
episodic basis under optimum conditions, but the removal
efficiencies represented by these test results cannot
necessarily be maintained under all operating conditions that
are typical in the semiconductor manufacturing industry.
The MACT floor for process vents for existing sources was
determined from the best performing five process vents from
Table 1 rather than the average of the top 12 percent because
less than 30 process vents are represented. Four of the top
five best performing process vents used some form of thermal
oxidation, and this control technology was considered to be
representative of the MACT floor. Consistent with other
previously promulgated NESHAP for process vents,1 the level of
Table 4-1. Control Device Removal Efficiency forSemiconductor Manufacturing Facilitiesa
Company Location Emission Point ControlDeviceb
RemovalEfficiency(percent)
Motorola Austin, TX EPN E-AE-1 TO 98.8
Motorola Phoenix, AZ No. 4 at PBuilding
RC/TO 98.4
Intel Ocotillo, AZ Fab 12, SC-F-3 Scrubber 97.7
Motorola Phoenix, AZ not listed RTO 97.1
Motorola Phoenix, AZ No. 3 atBuilding D
RC/TO 97.1
Motorola Phoenix, AZ P Building RC/TO 96.7
Motorola Mesa, AZ MOS 21, SC-19-1 Scrubber 96.4
Motorola Chandler, AZ not listed RTO 95.8
Motorola Phoenix, AZ C-36-P Scrubber 95.7
Motorola Mesa, AZ MOS 21, SC-19-3 Scrubber 93.5

Table 4-1. Control Device Removal Efficiency forSemiconductor Manufacturing Facilitiesa (cont.)
Company Location Emission Point ControlDeviceb
RemovalEfficiency(percent)
4-7
Intel Rio Rancho,NM
Fab 10.1.1f Scrubber 93.3
Motorola Phoenix, AZ C-28-P Scrubber 92.7
Motorola Mesa, AZ MOS 6, MOS 21,BP3
CarbonAdsorber
92.0
Motorola Phoenix, AZ COM-1 RC/TO 91.7
Intel Rio Rancho,NM
Fab 9.1.3a Scrubber 91.4
Intel Rio Rancho,NM
Fab 10.1.1d Scrubber 88.4
Intel Rio Rancho,NM
Fab 10.1.1e Scrubber 84.0
Kodak Rochester, NY Building 81-81001
None 0.0b
Kodak Rochester, NY Building 81-81002
None 0.0b
Kodak Rochester, NY Building 81-81003
None 0.0b
Kodak Rochester, NY Building 81-81004
None 0.0b
Kodak Rochester, NY Building 81-81005
None 0.0b
Kodak Rochester, NY Building 81-81006
None 0.0b
Kodak Rochester, NY Building 81-81009
None 0.0b
Kodak Rochester, NY Building 81-81010
None 0.0b
Kodak Rochester, NY Building 81-81011
None 0.0b

4-8
a Source: Stack test results provided by the facilities.b RC/TO = rotary concentrator/thermal oxidizer RTO = regenerative thermal oxidizerc Source: Engineering estimates provided by the facility.
control deemed to be generally achievable by a combustion
control device is 98 percent removal efficiency. This value
was selected as the MACT floor for process vents at existing
semiconductor manufacturing facilities. Because the same
considerations for low concentration, high flow exhaust
streams apply equally to new sources and the best controlled
source used a thermal oxidizer, this level of control was also
selected as the new source MACT floor.
In order to account for the variability in the
performance of control devices used in the semiconductor
manufacturing industry, as well as the increased variability
inherent in the test methods when analyzing the high flow, low
concentration process vent emission streams typically
controlled by these devices, the MACT floor includes an
alternate format based on outlet concentration of HAP. This
alternate format is intended to provide facilities with added
flexibility to comply with the standard when the inlet
concentration of the add-on control device drops below the
point where optimum control efficiency can be achieved, and it
would not be feasible to require optimum performance levels
(expressed in terms of removal efficiency) to be met. To
again be consistent with previous NESHAP that have specified a
control level of 98 percent through the use of a combustion
control device, the alternate format for the process vent MACT
floor was selected to be a HAP concentration limit of 20 ppmv
corrected to 3% oxygen.2

4-9
4.3 CONSIDERATION OF REGULATORY ALTERNATIVES ABOVE THE MACT
FLOOR
4.3.1 Process Vents
For process vents, the MACT floor of 98 percent control
was found to be the highest level of control achievable on a
consistent basis. While control devices such as thermal
oxidizers can be operated under certain conditions to achieve
greater than 98 percent removal efficiency, this was not
deemed achievable on a consistent basis for the varying
emission streams present throughout the semiconductor
manufacturing industry. Thus, no regulatory alternatives
above the floor value of 98 percent control were identified
that were expected to be technically feasible.
However, it is possible that a facility can achieve the
20 ppmv alternative emission limit without the use of add-on
control devices. Such a facility could install add-on control
devices to achieve an emission rate lower than the 20 ppmv
alternative emission limit. Thus, this would represent a
regulatory option more stringent than the MACT floor.
For control above the floor we examined what it would
cost to further control the one major source in this source
category. The Kodak facility currently contains nine emission
streams from the semiconductor manufacturing process. Kodak
has conducted an engineering study to determine the
feasibility of upgrading their vent system to standards
currently in place in the semiconductor industry and
installing the appropriate control technology. The recent
engineering study3 conducted by Kodak determined that their
emission streams could be segregated into two inorganic
streams for control with wet scrubbers, and two organic

4-10
streams for control with regenerative thermal oxidizers. The
estimated cost of this project was $2,734,100.
For the purposes of estimating the cost per ton of
emission reduction of this above the floor option, it was
assumed that the Kodak facility emitted the maximum amount (20
ppmv) under the alternate emission limit, and that this
emission rate would be reduced to 5 ppmv after installation of
the add-on controls. As detailed in Appendix B, this would
lead to an emission reduction in excess of that achieved by
the MACT floor alone of 27.7 tons/yr.
The emission rate used in this analysis is in excess of
Kodak’s actual HAP emissions of approximately 1 ton/yr, and is
used only for the purpose of this analysis to determine the
lowest cost per ton of emission reduction. We chose a higher
emission rate in order to better analyze the benefits of
control more stringent than the selected floor value. Under
this scenario the resulting cost would then be $98,700/ton of
emission reduction. This value was considered to be
unreasonable; therefore, requiring existing sources to install
add-on control devices to achieve an emission limit less than
the 20 ppmv alternative emission limit was rejected as an
above the floor option for process vents.
4.3.2 Storage Tanks
The vast majority of storage tanks in the semiconductor
manufacturing industry are the containers in which the
chemicals are shipped. As these containers are small (less
than 200 gallons) and portable, they do not lend themselves to
venting to a control device. Because these containers are not

4-11
refilled on site, there are no filling losses and emissions
are minimal. For these reasons, we identified no alternatives
above the MACT floor of no control that would be technically
or economically feasible.
4.3.3 Wastewater
We identified no wastewater HAP emission controls in use
by the industry. Wastewater streams from the semiconductor
manufacturing industry consist predominately of HCl. HCl does
not readily volatilize, and is not readily emitted to the
atmosphere. In addition, the amount of HAP contained in
wastewater from the manufacture of semiconductors is very
small, typically on the order of 3 to 4 ppmv. Due to these
factors the potential for emissions is very small. We have
required control of wastewater streams in past rules such as
the HON. The HON, however, does not require control of HCl
due to its low emission potential. Additionally, the HON
determined that control of wastewater streams below 1,000 ppmv
was not cost effective. As previously stated, semiconductor
streams are well below this level. Therefore, we determined
that control above the floor is not feasible.
4.3.4 Equipment Leaks
Nearly all semiconductor manufacturing operations are
conducted in highly controlled clean room environments. As
such, equipment leaks that could contaminate this environment
cannot be tolerated and are immediately repaired. While the
industry has no formal leak detection and repair (LDAR)
programs in place, the procedures inherent in the industry
control equipment leaks to the maximum extent possible.
Consequently, no regulatory options, such as requiring a
formal LDAR program, would result in any additional emission
reduction.

4-12
4.3.5 Process Changes
Finally, we examined process changes that would reduce the
amount of HAP used, and thus have the potential to reduce
emissions from all four emission points. Specifically, we
looked at requiring industry to increase the size of wafers
used in the manufacture of integrated circuits. Industry
studies indicate that going to the next larger size of wafer
decreases a facility’s HAP usage by about 20 to 30 percent.
Typically, sizes used are 4, 6, and 8 inch wafers.
However, we determined that these process changes are not
cost effective because an increase in wafer size requires
replacing most of the equipment in a wafer fabrication
facility. The one major source covered by these NESHAP would
need to replace approximately $150 million worth of equipment
in order to reduce emissions by several hundred pounds.
Additionally, the major source we examined is a small
facility, and would not be able to accommodate the larger
equipment necessary to handle a larger wafer size. Therefore,
we determined that process changes would not be a cost
effective or practical method for reducing HAP emissions.

4-13
4.4 References
6. See, e.g., 40 CFR 63, subpart G, §63.113(a)(2).
7. See, e.g., 40 CFR 63, subpart G, §63.114(a)(2); subpartU, §63.485(a); subpart CC, §63.(a)(2); subpart DD, and§63.693(f)(1)(i)(B).
8. Kodak Building 81 South - Upgrade Exhaust Systems FinalTechnical Report. Erdman Anthony Consulting Engineers,Rochester, New York. August 1999.

5-1
5.0 ENVIRONMENTAL, ENERGY, AND COST IMPACTS
5.1 INTRODUCTION
The purpose of this chapter is to present the estimated
environmental, energy, and cost impacts related to
implementing the MACT floor level of control for new and
existing semiconductor manufacturing facilities. The MACT
floor level of control was determined to be 98 percent control
of HAP emissions from semiconductor manufacturing facilities.
A maximum HAP emission rate of 20 ppmv was determined to be
equivalent to 98 percent control.1 The impacts presented here
are based on achieving this equivalent emission rate.
5.2 NEW SOURCES
Based on studies performed by the SIA, which represents
over 90 percent of the semiconductor manufacturing companies
in the U.S., no new sources that would be classified as major
sources2 are expected to be built in the next five years.
While growth is expected in the industry, including the
construction of new semiconductor manufacturing facilities,
these facilities are expected to follow the prevailing
industry trend of reducing emissions below major source
levels. Emissions will be reduced through pollution-
prevention measures, as well as installing add-on control
devices. The new facilities are also expected to incorporate

5-2
these control requirements into their title V permits, making
the control requirements federally enforceable. Thus, no
environmental, energy, or cost impacts are expected for new
semiconductor manufacturing facilities.
5.3 EXISTING SOURCES
As presented in Chapter 2.0, there are approximately 127
facilities that are actually engaged in the manufacture of
semiconductors. Of the potentially affected facilities, only
one facility (Eastman Kodak located in Rochester, NY) is
expected to be a major source at the time of promulgation of
the NESHAP. The existing source impacts were based on the
Kodak facility.
5.3.1 Environmental Impacts
The Kodak facility currently meets the MACT floor level
of control by maintaining HAP emissions below the 20 ppmv
limit. As such, the facility will not have to implement
pollution prevention measures or install add-on control
devices as a result of the promulgation of the rule, and no
further emission reductions are anticipated. However, the
rule will have the effect of limiting future emissions
increases at the Kodak facility to the 20 ppmv limit. While
the effect on reducing future emissions increases cannot be
quantified, the rule will effectively limit HAP emissions to
at or near their current levels.
Secondary environmental impacts are typically associated
with increased energy usage related to either fuel consumption
by an add-on control device (such as natural gas burned by an
oxidizer) or increased electricity demand on power plants.
Since no additional controls will be required at the Kodak
facility, no secondary environmental impacts are expected.

5-3
5.3.2 Energy Impacts
Similar to secondary impacts, energy impacts are
typically associated with fuel consumption by an add-on
control device or increased electricity demand on power
plants. Since no additional controls will be required at the
Kodak facility, and monitoring provisions are not expected to
increase energy consumption, no energy impacts are expected.
5.3.3 Cost Impacts
No control costs will be incurred by the Kodak facility
for meeting the MACT floor level of control because the
facility is currently achieving that level of control.
However, the proposed rule will impose certain monitoring,
recordkeeping, and reporting (MR&R) requirements that will
consume labor hours of facility personnel. These labor
requirements primarily result from monitoring parameters to
assure compliance to the emission limit and generating the
required reports.
We estimate the Kodak facility will incur a $68,200 cost
during the first three years to conduct all monitoring,
inspection, reporting, and recordkeeping (MIRR) activities
during the first three years after promulgation of the NESHAP.
Other sources will not incur any costs from these proposed
NESHAP. Because no capital costs will be incurred by the one
major source the total cost of the proposed NESHAP will be
$68,200 in MIRR costs.
5-4
5.4 REFERENCES
1. For a complete discussion of the MACT floordetermination, see the following: Memorandum fromHendricks, D., EC/R Inc., to Schaefer, J., EPA:ESD. November 6, 2000. MACT Floor Recommendation for theSemiconductor Manufacturing Source Category.
2. Section 112(a)(1) of the Clean Air Act defines a majorsource as a source that emits or has the potential toemit 10 tons/yr of any HAP or 25 tons/yr of ancombination of HAP.
3. OMB 83-I Supporting Statement, “ICR for theSemiconductor Manufacturing Source Category.” ICR Number1952-01. U.S. Environmental Protection Agency, ResearchTriangle Park, North Carolina. February 2001.

APPENDIX A
DEFINITIONS

DEFINITION OF TERMS
Abatement or recovery device (add-on control device) means anyequipment that reduces the quantity of pollutant that isemitted to the atmosphere. The device may destroy or securethe pollutant for subsequent recovery. Examples areoxidizers, carbon adsorbers, condensers, and scrubbers.
Assembly means the final step in the integrated circuitmanufacturing process where the chip is mounted onto a metalframe, connected to the leads, and enclosed in a protectivehousing. Testing of the completed assembly is also includedin this step.
Capture efficiency means the fraction (usually expressed as apercentage) of the pollutants generated by a process that isdirected to an abatement or recovery device.
Chip (see integrated circuit)
Control device (see abatement or recovery device)
Control efficiency means one minus the fraction (usuallyexpressed as a percentage) of the pollutants that are emittedfrom the control device compared to the pollutants enteringthe control device.
Destruction removal efficiency (DRE) (see control efficiency)
Die (see integrated circuit)
Doping means the introduction through electrical or chemicalmeans of impurities into the silicon during crystal growing. Typical doping materials include arsenic, boron, andphosphorus. Doping provides extra electrons or places forelectrons to go. The type of doping material determines the"N" or "P" type nature of the crystalline lattice.
Epitaxy means growing a layer of monocrystalline silicon fromsilicon vapor. The layer usually contains dopant gas toproduce PN junctions, or to produce a more lightly doped layerof the same type as the substrate.
Etching means the use of liquid acids or reactive gases toremove exposed areas of the wafer silicon oxide layer andsilicon substrate surface to produce dimensional windows.

Film thickness means the thickness of the dry, cured coatingon the substrate.
Hazardous air pollutant (HAP) means any of the compoundsidentified in Section 112(b) of the Clean Air Act.
Industrial Grade Integrated Circuit (IC) means an IC with aperformance typically guaranteed over the temperature range of0 to 70EC.
Integrated circuit means an electronic circuit containingtransistors and perhaps diodes, resistors, and capacitors,along with the interconnecting electrical conductors processedand contained entirely within a single chip of silicon.
Layering means the application of successive layers ofconductive or insulating material over the wafer surface.
Metalization means the deposition by means of evaporation orsputtering of metal layers on the circuit image to formcontacts and interconnects. Metal applications includeconductors such as gold, aluminum, copper, and tin.
Military Grade IC means an IC whose performance is typicallyguaranteed over the range of -55 to +125EC.
Oxidation means the process of chemically reacting oxygen orwater vapor with the surface of a silicon wafer to form a thinlayer of silicon dioxide.
Photolithography means the process by which a circuit image istransferred to a photoresist covered wafer. Photolithographyincludes the application and curing of the photoresist, theimaging process, and developing of the exposed photoresist.
Photomask means a transparent plate containing opaque areasused in photolithographic processes. The photomask containsthe circuit image that is transferred to the photoresist layerduring the imaging step.
Photoresist means a liquid plastic which hardens into a tough,acid resistant solid when exposed to ultraviolet light. Through the use of a photomask, the circuit image istransferred to the wafer.

Semiconductor means a material with electrical propertiesbetween that of a conductor and an insulator. Also used torefer to integrated circuits in general.
Semiconductor manufacturing means the collection ofsemiconductor manufacturing process units used to manufacturep-type and n-type semiconductors or active solid state devicesfrom a water substrate, including processing from crystalgrowth through circuit separation, encapsulation, and testing. Examples of semiconductor or related solid state devicesinclude semiconductor diodes, semiconductor stacks,rectifiers, integrated circuits, and transistors.
Semiconductor manufacturing process unit means the collectionof equipment used to carry out a discrete operation in thesemiconductor manufacturing process. These operationsinclude, but are not limited to, crystal growing; solventstations used to prepare and clean materials for subsequentprocessing or for parts cleaning; wet chemical stations usedfor cleaning (other than solvent cleaning); photoresistapplication, developing, and stripping; etching; gaseousoperation stations used for stripping, cleaning, doping,etching, and layering; separation; encapsulation; and testing. Research and development operations conducted at asemiconductor manufacturing facility are considered to besemiconductor manufacturing process units.
Tool means the equipment that is used individually or inconcert in a wafer manipulation step (e.g., etching,photolithography) necessary to the manufacture of theintegrated circuit.
Wafer means a thin piece of silicon material cut from asilicon ingot. The wafer provides the initial substrate fromwhich the semiconductor chips are manufactured.


APPENDIX B
COST PER TON OF EMISSION REDUCTION CALCULATION FOR ABOVE THEFLOOR LEVEL OF CONTROL FOR PROCESS VENTS

B-1
Cost Per Ton of Emission Reduction Calculation for Installing Add-onControls to Semiconductor Manufacturing Process Vents
Assumptions1. Before control emission stream contains 20 ppmv HAP.2. After control emission stream contains 5 ppmv HAP.3. The HAP in the emission stream is xylene.4. The total flow rate to be controlled is 50,160 cfm (see
Footnote 3 in the text of the memorandum).5. The facility operates continually for 16 hours per day, 5 days
per week, 52 weeks per year.6. Cost of controls is $2,734,100 (see Footnote 3).
Emission Reduction Calculation
Emission reduction = 20 ppmv - 5 ppmv = 15 ppmv
Converting to mass:
(50,160 ft3/min)(15 ft3 xylene/106 ft3)(60 min/hr)(16 hr/day)(5 days/wk)(52 wk/yr) =187,799 ft3 xylene/yr
Assuming ideal gas behavior and standard conditions, then 359 ft3 = 1 lb-mole
(187,799 ft3 xylene/yr)/(359 ft3 xylene/lb-mole xylene) = 523.1 lb-mole xylene/yr
Since 1 lb-mole xylene = 106 lbs xylene,
(523.1 lb-mole xylene/yr)(106 lbs xylene/lb-mole xylene) = 55,449 lb xylene/yr =27.7 tons xylene/yr
Cost Per Ton of Emission Reduction Calculation
Cost per ton of emission reduction equals the cost of implementing the controlmeasure divided by the annual emission reduction resulting from the control measure:
Cost = $2,734,100/27.7 tons = $98,700/ton of emission reduction

TECHNICAL REPORT DATA(Please read Instructions on reverse before completing)
1. REPORT NO. 2. 3. RECIPIENT'S ACCESSION NO.
4. TITLE AND SUBTITLE
National Emission Standards for Hazardous Air Pollutants (NESHAP)for Source Category: Semiconductor Manufacturing–BackgroundInformation for Proposed Standards
5. REPORT DATE
February 2001
6. PERFORMING ORGANIZATION CODE
7. AUTHOR(S)
8. PERFORMING ORGANIZATION REPORT NO.
9. PERFORMING ORGANIZATION NAME AND ADDRESS
U.S. Environmental Protection Agency Office of Air Quality Planning and Standards Organic Chemicals Group Research Triangle Park, NC 27711
10. PROGRAM ELEMENT NO.
11. CONTRACT/GRANT NO.
12. SPONSORING AGENCY NAME AND ADDRESS
U.S. Environmental Protection Agency Office of Air Quality Planning and Standards Organic Chemicals Group Research Triangle Park, NC 27711
13. TYPE OF REPORT AND PERIOD COVERED
14. SPONSORING AGENCY CODE
15. SUPPLEMENTARY NOTES
16. ABSTRACT
A draft rule for the regulation of hazardous air pollutants (HAP) from semiconductor manufacturing operationsis being proposed under the authority of Section 112(d) of the Clean Air Act. This document containscomments the background information used to develop the draft rule.
17. KEY WORDS AND DOCUMENT ANALYSIS
a. DESCRIPTORS b. IDENTIFIERS/OPEN ENDED TERMS c. Field/Group
Air Pollution Hazardous Air Pollutants Semiconductors
18. DISTRIBUTION STATEMENT
Release Unlimited
19. SECURITY CLASS (Report)
Unclassified21. NO. OF PAGES
20. SECURITY CLASS (Page)
Unclassified22. PRICE
EPA Form 2220-1 (Rev. 4-77) PREVIOUS EDITION IS OBSOLETE