national forestry accounting lan of belgium · 1 national forestry accounting plan of belgium...
TRANSCRIPT

1
NATIONAL FORESTRY ACCOUNTING PLAN OF
BELGIUM
Submitted under Regulation EU/2018/841 of the European Parliament and the Council of 30 May 2018 on the inclusion of greenhouse gas emissions and removals from land use, land use change and forestry in the 2030 climate
and energy framework, and amending Regulation (EU) No 525/2013 and Decision No 529/2013/EU
DECEMBER 2019

2
Content
Chapter 1: General introduction ............................................................................................................. 4
1.1: General description of the forest reference level for Belgium .................................................... 4
1.2: Consideration to the criteria as set in Annex IV of the LULUCF Regulation ................................. 4
1.2.1. Annex IV A ............................................................................................................................. 4
1.2.2. Annex IV B ............................................................................................................................. 6
Chapter 2: Preamble for the forest reference level ................................................................................ 8
2.1: Carbon pools and greenhouse gases included in the forest reference level ............................... 8
2.2: Treatment of Natural Disturbances in the forest reference level ................................................ 8
2.3: Demonstration of consistency between the carbon pools included in the forest reference level
............................................................................................................................................................. 8
2.4: Description of the long-term forest strategy ............................................................................... 8
2.4.1: Overall description of the regional and national forest policies ........................................... 8
2.4.2: Overall description of the forests and forest management in Belgium .............................. 11
2.4.3: Description of future harvesting rates under different policy scenarios ............................ 14
Chapter 3: Description of the modelling approach ............................................................................... 16
3.1: Description of the general approach as applied for estimating the forest reference level ....... 16
3.2: Documentation of data sources as applied for estimating the forest reference level .............. 16
3.2.1: Documentation of stratification of the managed forest land ............................................. 16
3.2.2. Area under forest management .......................................................................................... 17
3.2.3: Documentation of the forest management practices during the reference period ........... 19
3.2.4: Documentation of data sources used for the modeling and simulation of the forest
reference level ............................................................................................................................... 30
3.3: Detailed description of the modeling framework as applied in the estimation of the forest
reference level ................................................................................................................................... 33
3.3.1 Above and below ground biomass (SIMREG) ....................................................................... 33
3.3.2 Soil organic carbon ............................................................................................................... 38
3.3.3. Dead organic matter – Litter and deadwood ...................................................................... 39
3.3.4. Harvested Wood Products .................................................................................................. 39
4. Forest reference level ........................................................................................................................ 42

3
4.1: Forest reference level and detailed description of the development of the carbon pools ....... 42
4.1.1 Living Biomass ...................................................................................................................... 42
4.1.2 Soil carbon ............................................................................................................................ 44
4.1.3. Dead organic matter – Litter and deadwood ...................................................................... 44
4.1.4. Harvested wood products ................................................................................................... 44
4.2: Consistency between the forest reference level and the latest national inventory report ...... 44
4.2.1. Forest management ............................................................................................................ 44
4.2.2. Harvested Wood Products .................................................................................................. 47
4.3: Calculated carbon pools and greenhouse gases for the forest reference Level ........................ 48
4.3.1 Living Biomass ...................................................................................................................... 48
4.3.2. Harvested wood products ................................................................................................... 52
References ............................................................................................................................................. 53
Appendixes ............................................................................................................................................ 55
Appendix 1: Relief and climate in Belgium ........................................................................................ 55
Appendix 2: National FRL data .......................................................................................................... 56

4
Chapter 1: General introduction
1.1: General description of the forest reference level for Belgium
The Belgian Forest Reference Level is the result of simulation work by Gembloux Agro-Biotech (University of Liège) based upon data from the regional administrations. Specific data were used for each of the Belgian regions, but the modeling approach and methodology are identical for the entire country.
1.2: Consideration to the criteria as set in Annex IV of the LULUCF
Regulation
1.2.1. Annex IV A
Each of the criteria of annex IV.A is commented hereunder.
(a) the reference level shall be consistent with the goal of achieving a balance between anthropogenic emissions by sources and removals by sinks of greenhouse gases in the second half of this century, including enhancing the potential removals by ageing forest
stocks that may otherwise show progressively declining sinks;
The current forest management in Belgium is designed to maintain and enhance the equilibrium between forest growth and removals in the long term. The forest codes adopted in the 3 regions reflect this guiding principle. Further information on the forest long term strategy is presented in section 2.3. According to the current FRL projections, the continuation of the forest management practices applied during the reference period would lead to a slight increase of the forest sink in 2050. The average annual sink in 2000-2009 is -1009 kt CO2/yr and would increase to -1180 kt CO2/yr in 2040-2050. The ”Species change” projections are based on the same data, but assume that the current trend regarding the change in species is continued. This scenario would lead to a further increase of the sink, reaching on average -1466 kt CO2/yr in 2040-2050. Those projections do not take into account the possible impacts of natural disturbances. The impact of natural disturbances is very limited for the time being, but the uncertainty regarding potential future impacts is large on this time scale. Nevertheless, the current FRL shows an enhancement of the sink towards 2050 and is hence fully consistent with the goal of achieving a balance between anthropogenic
emissions by sources and removals by sinks of greenhouse gases in the second half of this century.
(b) the reference level shall ensure that the mere presence of carbon stocks is excluded from accounting;
This principle is embedded in the FRL approach, as the accounting will reflect net changes in forest carbon stocks, rather than accounting for total existing carbon stocks in forests.
(c) the reference level should ensure a robust and credible accounting system that ensures
that emissions and removals resulting from biomass use are properly accounted for; All carbon pools are considered in a consistent manner between the inventory and the FRL and the construction of the FRL excludes any policy assumption, with a view to that all emission and removals resulting from biomass use are properly accounted for.
5
(d) the reference level shall include the carbon pool of harvested wood products, thereby
providing a comparison between assuming instantaneous oxidation and applying the first-order decay function and half-life values;
For the period 2021-2025, the forest reference level for Belgium is -1.369.009 tons CO2 eq, in which the HWP pool constitutes of -133.368 tons CO2 eq. If instantaneous oxidation of HWP was assumed, the FRL would be -1.235.641 tons CO2 eq.
(e) a constant ratio between solid and energy use of forest biomass as documented in the period from 2000 to 2009 shall be assumed;
A constant ratio between solid and energy use of forest biomass as documented in the period from 2000 to 2009 has been applied for the projection of the HWP pool (section 3.3.4).
(f) the reference level should be consistent with the objective of contributing to the
conservation of biodiversity and the sustainable use of natural resources, as set out in the EU forest strategy, Member States’ national forest policies, and the EU biodiversity strategy;
Current forest management as reflected in the FRL includes measures adopted to preserve the
ecological stability of the forests, such as the implementation of systems of forest certification.
On 18 November 2005, the Federal Government concluded an agreement relating to a circular on
sustainable wood (also see OB-A01). This circular required that as of March 2006 under their
procurement policy, the federal authorities may only buy certified wood coming from forests under
sustainable management. For this purpose, the circular sets criteria which must be satisfied under the
wood certification systems. A number of actions have been taken by the Federal Government to
prevent importing and marketing of wood felled illegally and to strengthen the controls and penalties
imposed on this trade.
The Walloon Region is committed to PEFC certification of sustainable forest management. Certification
is a tool to permanently improve management at the regional level and the practices on the ground.
It makes it possible for the diverse interested actors to meet and form a consensus on forest
management: owners, industrialists, scientists, environmentalists and users. Certification also makes
it possible to provide a guarantee to the consumer that use of the wood goes hand in hand with good
management of the forest. In January 2014, about 54% of the Walloon forest area were PEFC certified
(more than 90% of the publicly-owned forests managed by the Department of Nature and Forests are
PEFC certified).
In the Brussels Capital Region, the Sonian Forest (Forêt de Soignes/Zoniënwoud) is FSC certified. Its
management aims to ensure ecological stability. In addition to ensuring the ability to regenerate,
biodiversity and ecological and social aspects are taken into account.
The Flemish authorities have developed various instruments to ensure biodiversity and sustainable use
of natural resources (protection of vegetation and landscapes). FSC certification started in mid 1990s
in a few large public forests as a case-by-case exercise (Zoniënwoud; Meerdaalwoud & Heverleebos).
Since 2008 this has been turned into a group certificate managed by the Agency Nature & Forests
(Agentschap Natuur & Bos - ANB) with a certified surface of 22.177 ha at the end of 2017.
(g) the reference level shall be consistent with the national projections of anthropogenic
greenhouse gas emissions by sources and removals by sinks reported under Regulation (EU) No 525/2013;

6
Regarding forest management, the last projections submitted under Regulation 525/2013 in March
2019 were not based on the model used for the FRL, as the NFAP had not been subject to the technical assessment at that time and was still subject to technical adaptations
The projections for the LULUCF sector were based upon the 2016 version of the EU Reference scenario prepared for the Directorate-General for Energy, the Directorate-General for Climate Action and the Directorate-General for Mobility and Transport (EU Reference Scenario 2016) for CO2-emissions and sinks,, where the projections for forest management were based on the G4M model. So far, the projections were not consistent with the current LULUCF GHG inventory either. Many corrections were brought on the LULUCF GHG inventory in the 15/3/19 submission, but were impossible to include in the national projections, as both reporting were due on the same deadline. For future reporting of projections under Regulation 525/2013, it is planned to use the model used for the preparation of the FRL. However, it will be adapted in order to reflect the actual forest
management practices, in a “Species change” scenario. The FRL scenario is constrained by the forest management practices in the reference period and is thus a benchmark rather than the most likely
evolution of the forest.
(h) the reference level shall be consistent with greenhouse gas inventories and relevant historical data and shall be based on transparent, complete, consistent, comparable and accurate
information. In particular, the model used to construct the reference level shall be able to reproduce historical data from the National Greenhouse Gas Inventory.
The consistency of the FRL with GHG inventories is presented and discussed in section 4.2 of this report.
1.2.2. Annex IV B
The equivalence table (Table 1) indicates where the different elements of Annex IV B. of the Regulation EC/2018/841 are found in the present report
Table 1 : equivalence table with Annex IV B.
(a) A general description of the determination of the forest reference level.
Section 3.1
(a) Description of how the criteria in LULUCF Regulation were taken into account.
Present equivalent table
(b) Identification of the carbon pools and greenhouse gases which have been included in the forest reference level.
Section 2.1
(b) Reasons for omitting a carbon pool from the forest reference level determination.
Section 2.1
(b) Demonstration of the consistency between the carbon pools included in the forest reference level.
Section 2.2
(c) A description of approaches, methods and models, including quantitative information, used in the determination of the forest reference level, consistent with the most recently submitted national inventory report.
Section 4.2
7
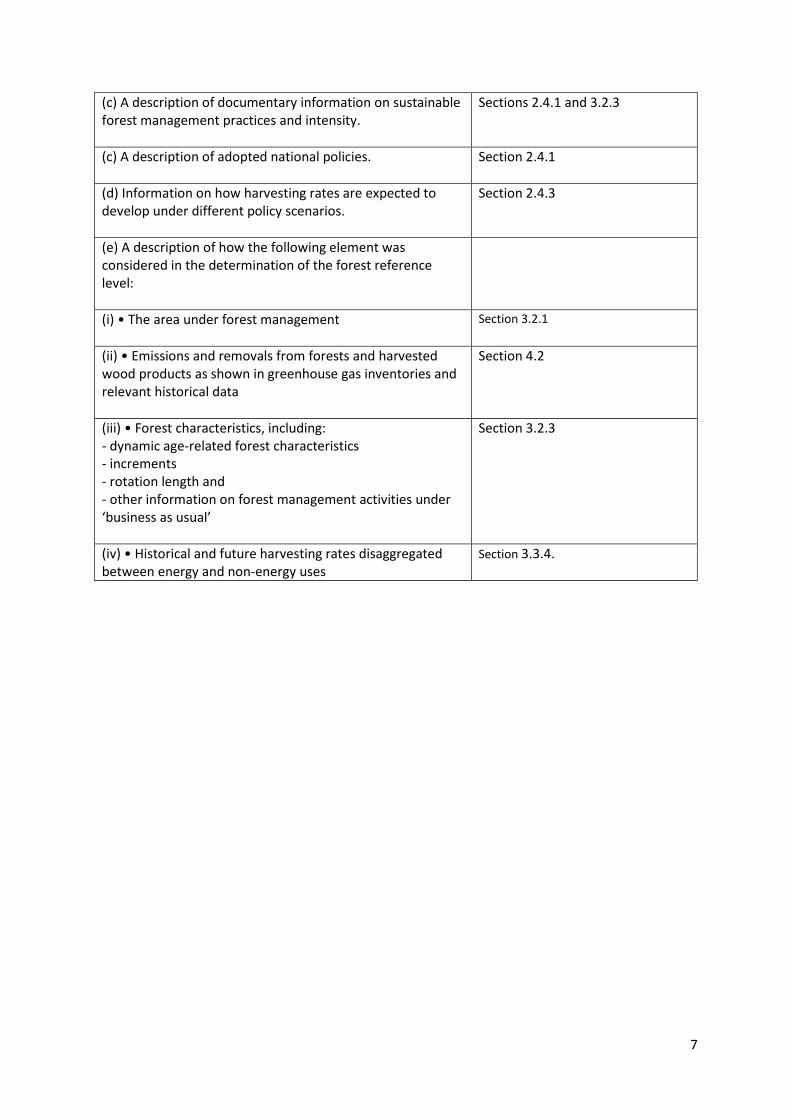
(c) A description of documentary information on sustainable forest management practices and intensity.
Sections 2.4.1 and 3.2.3
(c) A description of adopted national policies.
Section 2.4.1
(d) Information on how harvesting rates are expected to develop under different policy scenarios.
Section 2.4.3
(e) A description of how the following element was considered in the determination of the forest reference level:
(i) • The area under forest management
Section 3.2.1
(ii) • Emissions and removals from forests and harvested wood products as shown in greenhouse gas inventories and relevant historical data
Section 4.2
(iii) • Forest characteristics, including: - dynamic age-related forest characteristics - increments - rotation length and - other information on forest management activities under ‘business as usual’
Section 3.2.3
(iv) • Historical and future harvesting rates disaggregated between energy and non-energy uses
Section 3.3.4.
8
Chapter 2: Preamble for the forest reference level
2.1: Carbon pools and greenhouse gases included in the forest reference level
The following three pools are included within the forest reference level, in accordance with article 5(4) of regulation EC/841/2018 :
• Above-ground biomass
• Below-ground biomass
• Harvested wood products The three other pools (Litter, Deadwood and Soil organic carbon) are considered, but assumed stable, according to the Tier1 approach of the IPCC guidelines, which is applied both in the annual LULUCF inventory and the FRL.
2.2: Treatment of Natural Disturbances in the forest reference level Natural disturbances are not considered in the FRL for the time being. Belgium may decide to apply the provision later, depending on potential future evolution of disturbances. If this is the case a technical correction will be applied to the FRL to include the natural disturbances background level. No climate change driver is considered in the FRL (e.g. no temperature or rain trends), considering the relatively short term of the projections.
2.3: Demonstration of consistency between the carbon pools included in the
forest reference level
The carbon pools included in the FRL are the same as those considered in the annual LULUCF inventories.
2.4: Description of the long-term forest strategy
2.4.1: Overall description of the regional and national forest policies
The first Belgian Forest Code was published in 1854
(https://wallex.wallonie.be/PdfLoader.php?type=doc&linkpdf=7357-6626-1763).
It was progressively amended and replaced by regional laws.
In Wallonia, the Forest Code (Decree of 15 July 2008) has introduced a certain number of constraints
in favor of forest conservation and the maintenance of ligneous materials and carbon, including:
- the abolition of inheritance duties on the stumpage value, which encourages more ecological forestry choices (maintaining the material, greater possibility to choose species with a long life cycle and to apply continuous cover, etc.);
- the restriction of clear-cutting;
9
- the obligation to plant species suited to the site, which contributes to limiting the risks of blowdown and dieback and improves resistance to climate change;
- the creation of integral reserves;
- the limitation on drainage (which encourages preservation of organic matter);
- incentives for production of high quality wood and therefore use of wood in long-term applications with gains in CO2 linked to substitution by other materials.
The designation of 1.500 km2 of forests in Natura 2000 under special fixed rules of management also
contributes to these various objectives.
Three recent measures adopted for the management of public forest also contribute to the long-term
strategy:
• Thinning standard in even-aged spruce stands of 2009: This new standard is part of more dynamic forestry than that practiced in many places. The aim behind the desire for renewed dynamism in forestry regarding the main coniferous species existing in Wallonia is mainly to produce timber in stable, healthy stands, with higher biodiversity and a shorter life-cycle. In the context of global warming, these advantages linked to the dynamism of the clearings can only be beneficial to production, by limiting the disadvantages suffered from pronounced droughts or more numerous beetle populations, for example. 1 In addition, increasing the dynamism of forestry of both coniferous and deciduous trees contributes to increasing the proportion of wood in long-term uses and therefore storage in wood products.
• Higher mix of species to increase biodiversity and resilience (biodiversity standard2)
• Permanent Forest Cover management : the aim is to increase biodiversity and resilience, and reduce windstorm disturbances (Pro silva standard3)
On the long term, the Walloon Forest Code foresees a balance between increment and removals and
between coniferous and deciduous species. A working group on the preparation of a regional forest
program has been set up in 2017, with the aim to start a brainstorming with the stakeholders on the
future challenges and objectives of the forest management. Updated recommendations to the forest
owners regarding adaptation to climate change have also been published in 20174.
Finally, a lot of research programs and many elements of the Framework Agreement on Forest
Research5 are directly related to the preservation and long-term improvement of forest resources, in
a context of climate change :
1 de Potter B., 2011. Prise en compte des changements globaux pour la gestion des pessières en Wallonie [Taking into
account global changes in the management of spruce in Wallonia]. Forêt Wallonne 114: 17-25 2 http://environnement.wallonie.be/publi/dnf/normes.pdf 3 https://www.foretwallonne.be/images/stories/librairie/infoPS-NEW.pdf 4 Le changement climatique et ses impacts sur les forêts wallonnes. Recommandations aux décideurs et aux propriétaires et
gestionnaires. Himpens et al, 2017. http://biodiversite.wallonie.be/servlet/Repository/changements-climatiques-brochure-
recommandations-2017.pdf?ID=38830&saveFile=true 5 https://www.foretnature.be/images/stories/AteliersForestiers/ProgrammeAC2019.pdf

10
- The suitability of species at stations is essential, in order to improve productivity but also the
resilience of forests. In 2017, a new version of the Ecological Tree Species File has been published
and is a decision support tool for planting, serving forest and natural area managers.
- Intensity of biomass removal (e.g. for energy use) must be compatible with the long-term
preservation of soil fertility. This will be determined in particular by a quantification of the mineral
exports accompanying the farms.
- The response of trees to repeated stress (insect attacks, frosts, droughts, soil quality, etc.) is being
studied to better manage forests, for example by reducing the density of trees for better access to
resources (water and nutrients) or by planting them in suitable stations, along with other species
(mixing).
- Research is underway on the search for species that should better withstand a drier and warmer
climate, in particular by examining the responses of species planted in the arboretums to the
various climatic stresses (drought, frosts, etc.), with a view to identify more drought-resistant
species that produce quality timber in order to maintain species diversity and good timber
production in the future.
- Modeling of forest growth is continuing, to identify the most appropriate management modes that
will enhance forest resilience in the face of future environmental uncertainties. This concerns, for
example, forest management of mixed stands, aimed in particular at increasing the resilience of
beech or oak forests, with more diversified forests that are better adapted to climate change. The
Permanent Regional Forest Inventory is a key element to deliver data for the modeling.
- Bark beetle (Ips typographe and Chalcographe) epidemics have been particularly important in
recent years, following the storm-related damage caused by the storms Eleanor and David in 2017
and the climatic conditions of 2018 and 2019, which are particularly favorable for the proliferation
of the insect. In this context, the Walloon Forest Health Observatory was created in 2011 and aims
to centralize data and knowledge on forest health relative to the levels of the Walloon and Brussels
territories. Its main missions are the production of a periodic report on the health of forest stands,
the detection and identification of pathogenic insects and pathogenic fungi responsible for
diseases, and the participation in the development of biotic and abiotic health risk maps, based on
the state of vulnerability of the forest species and the stations.
In the Brussels Capital Region, the Sonian Forest is protected (no deforestation allowed) and FSC
certified. Its management aims to ensure ecological stability and a long-term balance in the
distribution of forest age. In addition to ensuring the ability to regenerate, biodiversity and ecological
and social aspects are taken into account.
In Flanders, the objective of the Forest Decree introduced on 13 June 1990 was to regulate the
preservation, protection, management, restoration of forests and their natural environment and
afforestation. It applies to both public forests and private forests. Central to the strategy is the
objective for forest management in Flanders to safeguard the forest area and maintain the different
societal functions of the forest ecosystem: the economic, the social and educational, the
environmental protective, and the ecological functions.
Since its conception other policies have intervened and work synergistically or complementary: e.g.
Decree concerning nature conservation and the natural environment (21/10/1997), Decree on the
organization of spatial planning (18/05/1999),… At the moment the forest and nature conservation

11
legislation is being integrated to promote synergy and increase efficiency of policy measures updating
the objective to integrated management taking into account the ecological, economic and social
functions (since 28/10/2017).
To support and steer this objective a range of policy measures is being used:
− A system of management planning with financial support tailored to specific social (e.g.
recreation) and ecological (e.g. Natura 2000) goals;
− The prohibition of deforestation and compensation rules;
− The protection of (general or regional) protected vegetations and species,…
− Nature reserves (including forest ecosystems);
− Principles for sustainable management (linked to independent certification);
− Stand-still principle (e.g. no exotic tree species after indigenous deciduous species);
− Rules for sustainable harvesting (e.g. without management plan an extensive system of
licensing is in operation) and (for public forests) the sale of wood;
− Public access to forests.
As a general rule, deforestation is prohibited. There are a number of exceptions, but an exemption is
required in each case and this exemption will be granted only in exchange for compensation. The
obligation for compensation consists of the planting of a forest of equal size or larger (depending on
the forest type) at another location within the Flemish Region. The compensation can also be financial
in the form of a forest maintenance contribution to the Forests Compensation Fund.
2.4.2: Overall description of the forests and forest management in Belgium
In Belgium, forest covers about 21% of the territory (Table 2). The distribution of the forest over the
regions is respectively 77,0%, 22,8% and 0,2% for Wallonia, Flanders and Brussels (Table 1). The
proportion of the two categories of owners differs between regions with respectively 51%, 59% and
0% of private owners for Wallonia, Flanders and Brussels. At the national scale, the proportion of
private owners is 53% versus 47% for the public owners.
Table 2: Forest cover in Belgium (Belgian FRA 2015). The proportion of the forest cover according to ownership type is mentioned between brackets (public/private).The ownership ratio has been updated
for Flanders according to the last inventory data.
Total area
(km²) Forest cover
(%) % of the Belgian forest
area
Wallonia 16.844 31,2
(49/51) 77,0
Flanders 13.522 11,5
(41/59) 22,8
Brussels 162 10,5
(100/0) 0,2
Belgium 30.528 22,4
(47,3/52,7)

12
Five main tree species represents 76% of the total growing stock of 157,4 million cubic meters in
2000 (i.e. 120 Mm³). These main species are, by decreasing order: Norway spruce, native oaks (Q.
petraea and Q. robur), common beech, Scots pine and hybrid poplar (Table 3). The forest
composition is very different between the regions. The two main tree species are Norway spruce and
native oaks in Wallonia, Scots pine and hybrid poplar in Flanders, and common beech in Brussels.

13
Figure 1: Forest cover in the three regions of Belgium. Table 3: Main species encountered in the forest growing stock of Belgium in 2000 (Belgian FRA 2015).
Species Wallonia Flanders Total
Mm³ % Mm³ % Mm³ %
Picea abies 52,5 41,8 0,5 1,6 53 33,7
Q. robur & Q. petraea 25,2 20,0 3,6 11,4 28,8 18,3
Fagus sylvatica 16,3 13,0 2,4 7,6 18,7 11,9
Pinus sylvestris 2,9 2,3 8,6 27,1 11,5 7,3
Hybrid poplar 2,8 2,2 5,1 16,1 7,9 5,0
Others 26 20,7 11,5 36,3 37,5 23,8
Total 125,7 100 31,7 100 157,4 100
Most of the Belgian forest belongs to private owners: 55%. With an average surface area of ~2,5 ha per owner and more than 100.000 owners, the private forest is characterized by a relatively large fragmentation and a large diversity of owners. These private forests are either managed directly by their owners or by a manager or a cooperative chosen by them. Management is governed by specific legislation:
• the Forest Code in the Walloon Region
• Bosdecreet in the Flemish Region
• the Forest Code in the Brussels Region.

14
Public owners are managing 45% of the forest: they are the State-owned forests belonging to the Regions (11%), its communes (28%) and its provinces, public welfare centers, churches factories (3%). These forests are subject to the forest regime and managed by the forest administration:
• the Department of Nature and Forests (DNF) in the Walloon Region
• Agentschap voor Natuur en Bos (ANB) in the Flemish Region
• the Environment and Energy Administration (Brussels Environment) in the Brussels Region. In the field, forest administrations are divided into:
• Regional directorates, each covering +/- 30.000 ha
• Cantonments (+/- 9.000 ha) and yards (+/- 750 ha)
In Flanders, the administration is organized through “Terrain management” entities (Terreinbeheer
West/Terreinbeheer Oost/Terreinbeheer Koepel), which are subdivided in 15 “management regions”
(beheerregio’s).
Given the diversity of soils (sand, silt, clay) and climates (from 0 to 700 m altitude, 700 to 1.400 mm
precipitation), a large number of species are adapted to the Belgian territory. The figures in appendix
1 provide details on elevation, average precipitation and average annual temperatures respectively.
2.4.3: Description of future harvesting rates under different policy scenarios
Considering that management plans are prepared at the local (stand/property) level and that the current forest policies do not foresee any decision on the future harvest rate, only one alternative policy scenario has been built. The policy scenario tested is the ”Species change” scenario, which is based on the forest management
practices between the two last Regional Forest Inventories which were used on the first RFIs data and
projected up to 2030 (Figure 2 and Table 4). The SIMREG forest simulator detailed in section 3.3.1 was
used for the projection. In contrast to the Forest Reference Level scenario, the trend of the forest
composition change between the RFIs was taken into account. The other assumptions for the
simulation are the same as for the FRL scenario: a constant forest management practice, a constant
forest land area, absence of major disturbances (e.g.: windstorms) and no climate change drivers
(considering the relatively short term of the projections).

15
Figure 2 : Stem wood harvested (volume from the bottom of the stem up to 7 cm of the diameter) in a
“Species change scenario”. The forest management practices applied on the simulation are the practices observed in-between two RFIs. Due to the scale of the graph, the data for Brussels are
difficult to read. These can be found in Table 4.
Table 4: Stem wood removed (volume from the bottom of the stem up to 7 cm of the diameter). in a
“Species change scenario”. The forest management practices applied on the simulation are the practices observed in-between two RFIs. Stem wood removed is the sum of the volume harvested and
the new volume of dead trees (mortality). Based on the Walloon RFI, 5% of the volume removed is dead trees
Date Stem wood removed (x 1.000 m³)
Belgium Wallonia Flanders Brussels
2012 5454 4596 858 0
2013 5265 4369 889 7
2014 5357 4469 877 11
2015 5350 4463 875 11
2016 5483 4623 849 11
2017 5486 4684 795 6
2018 5211 4418 786 7
2019 5416 4544 861 11
2020 5323 4515 797 10
2021 5316 4506 798 11
2022 5328 4548 773 7
2023 5114 4392 715 7
2024 5283 4499 774 10
2025 5288 4469 808 11
2026 5370 4571 788 11
2027 5326 4528 792 7
2028 5202 4416 779 7
2029 5431 4693 729 10
2030 5420 4658 751 11

16
Chapter 3: Description of the modelling approach
3.1: Description of the general approach as applied for estimating the forest
reference level
The simulation of the forest evolution in Belgium has to be able to deal with the small-scale intensive
forest management and the wide range of compositions and structures occurring in the country. The
living biomass and the carbon in soils are the two most important forest carbon pools in Belgium (Latte
et al., 2013). Unlike the carbon soil pool, living biomass stock might quickly change in the forest.
Therefore, the evolution of the living biomass has to be simulated on an annual basis and including
some periodical forest management practices as thinnings and clearcuts. In order to meet the
peculiarities of the Belgian forest and the living biomass pool, the forest reference level of living
biomass will be simulated with the forest simulation software SIMREG (Perin et al., in progress; Perin
et al., 2017). A so called ‘carbon pool variation module’ is then applied on the living biomass results in
order to obtain the variation of the other carbon forest pools (see section 2.3.4.3 in Forsell et al., 2018).
The FRL scenario includes the following good practices:
• Projection of the age-related effects (or diameter structure effect) within the stands,
• Constant stand composition (no species changes),
• Constant forest management practices (same forest management practices as in the
Reference Period),
• Constant forest area (Afforestation and deforestation are not modeled)
• No climate change drivers for a short term simulation
A ”Species change” scenario , has also been built, which is based on the forest management practices observed between the two last Regional Forest Inventories. The same SIMREG forest simulator detailed in section 3.3.1 for the FRL was used for this projection. In contrast to the Forest Reference Level scenario, the trend of the forest composition change between the RFIs was taken into account in the ”Species change” scenario. The other assumptions for the simulation are the same as for the FRL scenario: a constant forest management practice, a constant forest land area, absence of major disturbances and no climate change drivers.
3.2: Documentation of data sources as applied for estimating the forest
reference level
3.2.1: Documentation of stratification of the managed forest land
The Belgian stratification is based on criteria which are stable throughout the time (administrative
regions and ownership). Forest characteristics that might change through time (such as tree species
composition) are not used for stratification and will be represented by continuous (e.g. no change in
the reference period nor in the projected period) variables in the simulation of the living biomass pool.
17
Administrative regions
In Belgium, forest policies are conducted at the regional level (Flanders, Brussels-Capital Region,
Wallonia). Political decisions on forest matters therefore have an impact at the regional scale.
The monitoring of the forest resources is mostly executed at the regional level by Regional Forest
Inventories (RFI). The RFI sampling protocols applied in Flanders and Wallonia, the two largest regions,
are derived from traditional national forest inventory methods while the Brussels RFI is closer to a
Forest Management Inventory.
The administrative strata are also correlated with some topographic and climate parameters that
follow a North-South gradient such as rainfall, temperature and topography (appendix 1).
Ownership
The ownership has a significant influence on forest management practices as described in the section
3.2.2. Moreover, the forest area managed by a public or private forest owner is considerably different.
For example in Wallonia, 7% of the public forest properties have more than 500 ha of forest, which
together represent 90% of the public forest area (Colson et al., 2015). These forest properties are
equally distributed to public managers of the Walloon forestry department. On the other hand, the
average area of a private forest property is 3 hectares. Properties of less than 5 ha represent 91% of
the properties and 25% of the private forest area. Whereas properties larger than 100 ha represent
less than 1% of the properties and 27% of the private forest area (Colson et al., 2015). The private
forest area managed by one forest manager is therefore very variable.
3.2.2. Area under forest management
As stated in the NIR (section 10.5.1) and further detailed in section 2.3 of the present report, all forests in Belgium are managed. In the FRL, it is assumed that the area of managed forest land does not change from 2009 onwards. A technical correction will be applied by 2026 to correct for the difference between assumed area development and actual MFL area development during the compliance period.
Wallonia
The total managed forest land in Wallonia as reported in the GHG inventory (2019 submission),
according to the current Land-Use change matrix and excluding lands under conversion (afforestation
and deforestation), is respectively 548.662 ha in 2001 and 542.025 ha in 2012, the latter being subject
to possible adjustments in the future according to updates in the matrix (forest land remaining forest
land).
The total area of forest land according to table 4.1 of the CRF table is respectively 551.516 ha in 2001
and 551.566 ha in 2012.
The area reported in the regional forest inventory in 2001 is 554.000 ha. The difference between the
inventory and the matrix remains within the 95% confidence interval on the total area which is 545.136
ha – 562.864 ha (error is 1,6%) for the forest inventory. This difference could be attributed to the fact

18
that the forest inventory data represents the estimated area within one inventory cycle (1994-2008),
while the land use matrix is constructed by interpolation between two land-use covers (1990 and 2009
for this period).
This total area includes non-productive areas included in the forest such as :
• roads and firebreaks (38.500 ha);
• heathland, uncultivated and fens (13.400 ha);
• old non-replanted clearings (13.000 ha);
• ponds and rivers (2.450 ha);
• various (embankments, quarries ...) (7.150 ha).
The total area of unproductive forest is estimated at 74.500 in 2001 and 74.700 ha in 2012. Given the
type of areas described above, no carbon stock change is considered for these areas, in both GHG
inventory and FRL. According to recent NIR, at least 13 member States include in the total forest areas
some non-productive areas, that are part of the forest management. This is also clearly stated in the
EU NIR, which states “For forest administrative purposes, lands without tree cover, may be included
or not within forest land, thus, additional qualitative criteria complement the forest definitions
provided (i.e. treatment of forest roads, nurseries, willow crops, etc.).” The Belgian definition is also in
line with the FAO definition6 which mentions : “3.Includes forest roads, firebreaks and other small open
areas; forest in national parks, nature reserves and other protected areas such as those of specific
environmental, scientific, historical, cultural or spiritual interest. 4. Includes windbreaks, shelterbelts
and corridors of trees with an area of more than 0,5 hectares and width of more than 20 meters.”
The carbon stock change approach in the GHG inventory is calculated according to wood volumes measured in the inventory. The resulting total stock change is then reported on the total area in the CRF table (including non-productive forest), which means that the implied emission factor relates to the whole forest area. The same approach is applied in the FRL, as the SIMREG model is only applied to the productive forest (479.500ha), while no carbon stock change is considered in the non-productive forest.
Flanders
The total managed forest land in Flanders as reported in the GHG inventory in 2018, according to the
current Land-Use change matrix and excluding lands under conversion (afforestation and
deforestation), is respectively 148.250 ha in 1998 and 142.104 ha in 2012.
The total area of forest land according to table 4.1 of the CRF table is respectively 156.304 ha in 1998
and 157.915 ha in 2012.
Similarly to the approach used for Wallonia, the projected FRL reported in Appendix 2 gives an area of
131.950 ha (1998– based on NFI1 (1997-1999), area calculated by plot sampling) which represents the
area of productive forest only, thereby excluding some areas in the forest (roads and firebreaks,
6 http://www.fao.org/3/ap862e/ap862e00.pdf

19
heathland, uncultivated areas and fens, old non-replanted clearings, ponds and rivers, embankments,
quarries,…).
The total area in 1997-1999 for the forest inventory is 140.302 ha (135.398 ha – 145.205 ha). Since
there is no confidence interval available on the area estimated by the Land-Use change matrix, a
significant difference between both estimates is uncertain.
A difference could be due to the fact that the forest inventory data represent the estimated area within
one inventory cycle (1997-1999), while the land use matrix is constructed by interpolation between
two land-use covers (1990 and 2009 for this period). Either way, the methodology for estimating forest
area is different.
In analogy to the approach used for Wallonia, no carbon stock change is considered for unproductive
areas, in both GHG inventory and FRL. It must be underlined that the carbon stock change approach in
the GHG inventory is calculated according to wood volumes measured in the inventory. The resulting
total stock change is then reported with the total area in the CRF table, which means that the implied
emission factor relates to the whole forest area.
3.2.3: Documentation of the forest management practices during the reference period
Wallonia
Introduction
The description of the forest management practices in Wallonia is mainly based on information from
the Regional Forest Inventory (RFI) of Wallonia. All the RFI information of this section is based on
updated data (not yet published) from the first part of the second cycle of the permanent RFI (the
reference year of RFI2 is 2012) and the results of the first cycle of the permanent RFI (the reference
year of RFI1 is 2001). The period between the two RFIs (2001-2012) is close to the Reference Period
(2000-2009) and was used to detail the forest management practices during the Reference Period. The
description of the RFI of Wallonia and the main results from RFI1 are documented in English in the
book chapter of Alderweireld et al. (2016) and more details are available in the RFI1 result report in
French (Alderweireld et al., 2015) and the RFI methodological guide in French (Rondeux and Lecomte,
2010).
Forest composition
The ratio between broadleaves and conifers forest is 58:42 in 2011 and the main forest stand type in
Wallonia are Norway spruce even-aged pure stand (26% of the ‘productive’ forest area) followed by
Oaks pure stand (17%).
Based on the two successive RFI, the distribution of the some of the main forest stand types has quickly
changed during the Reference Period 2000-2009. Spruce stand area has decreased by 20% in eleven
years (2001-2012), Douglas stands increased by 53 % and the total area of the broadleaves stands
increased by 4,5 % (Figure 3).

20
The forest composition of some stands might change throughout the time. For example, most of the
mixed stands of Norway spruce and Douglas shift to pure Douglas stand, or some mixed stands of oaks
and beech can slowly be transformed to a “pure” beech stand because of natural competition.
Figure 3 : Main forest types in Wallonia during the first and second permanent RFI with respectively the central year of the inventory 2001 and 2012.
The forest type distribution used in the FRL modeling of the Walloon forest is the probable distribution encountered in 2009. This probable distribution is based on a scenario which simulates the forest evolution from RFI1 up to 2009 and resulting to a forest distribution which is in between the results of the RFI1 (reference year of 2001) and RFI2 (reference year of 2012) (Figure 3).
Additional guarantee of sustainable forest management
Around 60% of the Walloon forest is ecocertified with a PEFC certification of 299.324 ha in public forest
and 27.984 ha in private forest (PEFC, 2017). Natura 2000 sites cover 30% of the forest area.
Harvesting
Between the two RFIs, the total amount of solid wood volume harvested in conifer trees is 3,136
Mm³/year and 0,876 Mm³/year in broadleaves trees (coppice stands and coppice layers are not
taken into account).
Forest operation schedule
Even-aged system
The even-aged system is applied in most of the coniferous stands in Wallonia. This system is also
encountered in poplar stands, and less often in other broadleaves stands. Most coniferous stands
originate from artificial regeneration (planting) but methods of natural regeneration are increasingly
applied (Latte et al., 2016).
In Wallonia, most productive coniferous stands are regularly thinned. The results of RFI1 show that the
thinning applied are mostly based on selective thinning methods (vs. systematic thinning, Alderweireld
et al. 2015). Forest good practices in Wallonia suggest forest operation every 6 years in fast growth
2012

21
coniferous stands (standards 2707 from the year 2007; Perin et al. 2016) to keep the total stand basal
area between 30-35 m²/ha (Hebert et al., 2002). The 6 years thinning rotation is mostly respected in
public managed forests which represent 45% of the coniferous forest area of Wallonia. Based on the
results of RFI1 in spruce stands, the first thinning is generally operated after the stands reach the age
of 20 years (Figure 4). During the Reference Period (between the RF1 and RFI2), slight changes in
sylvicultural practices were noticed in the public forest. In particular, the mean total basal area in
younger coniferous stands has decreased from 38,7 m²/ha at the age of 30 years to about 35 m²/ha.
In private forest, the interpretation of the thinning practices are more difficult as many factors affect
the practices (economic opportunities, the ownership, the property size which change with the time:
inheritance, …).
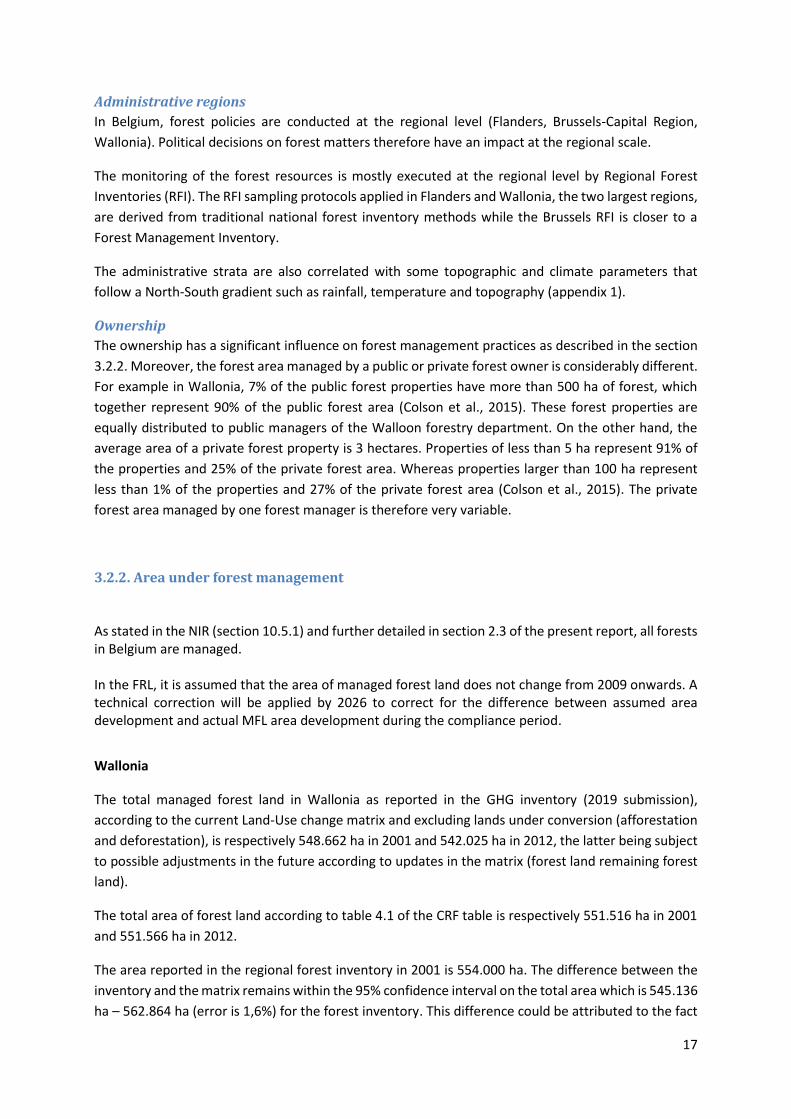
The last operation in even-aged system is clearcutting. Forest good practices suggest harvesting the
whole spruce stands when the top height reaches 30 m. Following the site index of the stand, this top
height is reached for an age between 55 years and 70 years (Perin et al., 2016). The image
interpretation of the forest RFI plots between 2006 and 2009 shows that about half of the spruce
stands are clearcut before the age of 50 years in private forest and 70 years in public forest; and 90%
of the spruces stands are respectively clearcut before the age of 70 years and 90 years in private and
public forests (Figure 5; Lejeune et al., 2013). The Walloon forest code forbids clearcut areas superior
to 3 ha in broadleaves stands and 5 ha in conifers stands.
Figure 4 : Frequency of thinned stands by age class according to the spruce stand owner (Alderweireld et al., 2015).
22
Figure 5 : Cumulative frequency of spruce stand clearcuts between 2006 and 2009 as a function of
stand age and type of owner (Lejeune et al., 2013).
Other Forest structure and system
A wide gradient of forest structure are encountered in broadleaves forest in Wallonia including
coppice, stands on coppice, two layers stands, one layer stands, even-aged stands and uneven-aged
stands. Coppices and stand on coppices are part of an old forestry system which is slowly abandoned
to a forestry based on uneven-aged stands structure, but forests with coppices still represent an
important part of the broadleaves forest (32% of the Walloon forest).
In public broadleaves forest (54% of the broadleaves forest of Wallonia), the cutting cycle is 8 to 12
years following site fertility, with sometimes thinnings in mid-cycle (4 to 6 years following the stand
development stage). The main criteria leading the forest operations are: i) the tree maturity (tree
diameter to reach before logging) and ii) the forest density expressed in basal area per hectare.
Thinning is operated in order to promote crop trees and regeneration. Unlike in the even-aged system,
most of the natural regeneration develops under a continuous cover forestry system.
Good forest practices in Wallonia suggest keeping the stand basal area between 11 m² ha-1 and 18 m²
ha-1 for native oaks and light demanding species (e.g. ash, cherry, alder) stands and between 17 m² ha-
1 and 21 m² ha-1 for the other broadleaves stands (Alderweireld et al., 2015; Rondeux and Lecomte,
1988; Sanchez, 2016). Based on the plots with tree measured on the RFI data, the mean basal area of
broadleaves stand has increased from 22,5 m² ha-1 to 23,9 m² ha-1 between the RFI1 and RFI2
(respectively 19,9 m² ha-1 and 21,1 and m² ha-1 without the coppice layer and coppice stands). The
basal area and its evolution might be different following the forest type and the ownership (Table 5).

23
Table 5: The mean basal area of the different broadleaves forest types (in bracket, the basal area without the coppice layer and coppice stands). The estimates are computed with the plots containing
at least one tree measured in the Regional Forest Inventory.
Forest type RFI1
(m².ha-1) RFI2
(m².ha-1) Difference
(%)
Beech 22 (21,7) 22,2 (21,9) 1,0 (0,7)
Public 20,9 (20,8) 20,9 (20,9) 0,0 (0,1)
Private 26,3 (25,2) 27,1 (25,7) 3,1 (2)
Oaks 21,9 (18,5) 23,6 (20,2) 8,0 (9,2)
Public 21,2 (17,9) 23,1 (19,7) 9 (9,8)
Private 22,8 (19,4) 24,4 (21,1) 6,9 (8,8)
Poplar 22,6 (19,2) 25,4 (22) 12,2 (14,4)
Public 26,6 (22) 29,6 (23,1) 11,2 (5,2)
Private 22,0 (18,8) 24,8 (21,8) 12,6 (16,2)
Precious species 22,6 (20,4) 24,6 (21,7) 9 (6,3)
Public 22,3 (20,8) 23,6 (21,7) 6,2 (4,1)
Private 22,9 (20,1) 25,7 (21,8) 12,2 (8,8) Other broadleaves
23,6 (20,2) 24,5 (20,7) 3,8 (2,8)
Public 22,6 (19,7) 23,7 (20,4) 4,8 (3,6)
Private 24,3 (20,5) 25,1 (21,0) 3,0 (2,2)
All 22,5 (19,9) 23,9 (21,1) 6,2 (6,0)
Public 21,6 (19,0) 22,9 (20,1) 5,8 (5,9)
Private 23,5 (18,7) 25,2 (20,0) 7,3 (7,1)
Flanders
Introduction
The description of the forest characteristics and management practices in the Region of Flanders is
based on sample measurements in the framework of the first Flemish forest inventory (RFI1,
measurements 1997-1999) and interim results of the 2nd Flemish forest inventory (RFI2, 85% of the
measurements processed, measurement campaign 2009-2016). The period between the two RFIs is
close to the Reference Period (2000-2009) and is considered to be the best available approximation of
the forest management practices during the Reference Period.
The description and results of the first RFI are documented in Waterinckx et al. (2001). The
methodology of the second RFI is documented in Wouters et al. (2008). Full results of the second RFI
were published in 2019 and will be used for future modeling and reporting exercises.
Forest composition
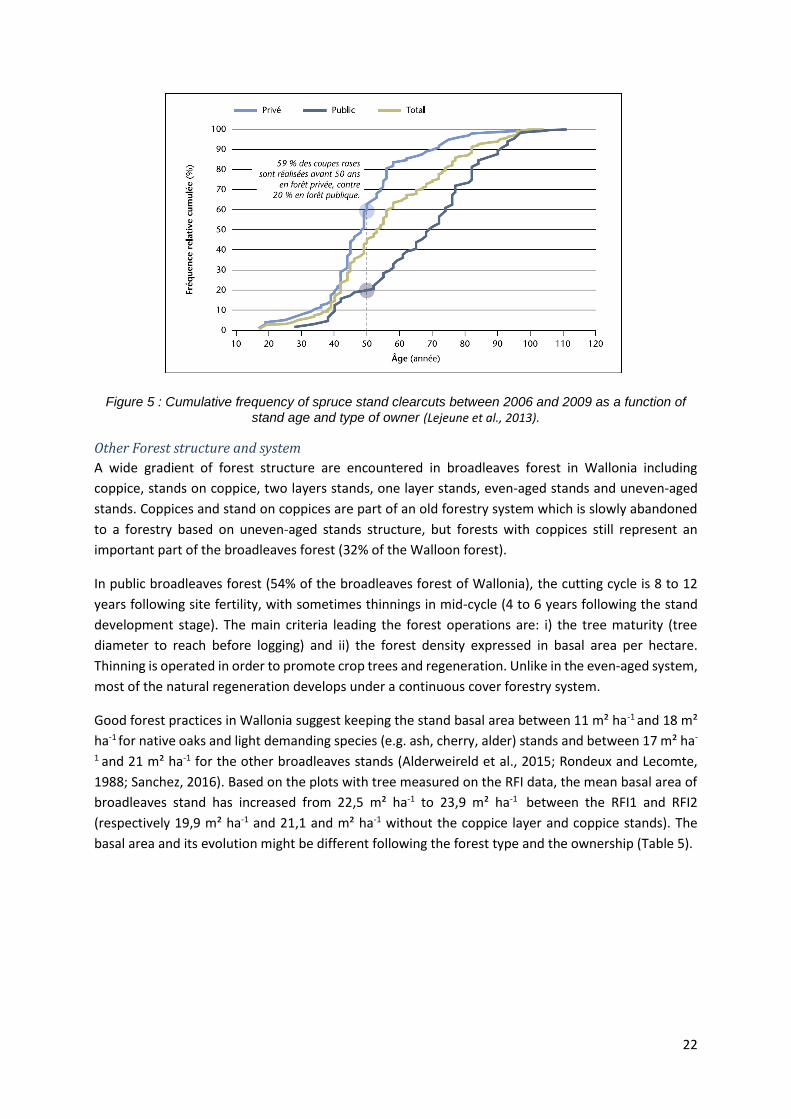
Over half of the forest in Flanders is deciduous forest. The pure, homogenous pine forests now cover
about a quarter of the Flemish forests. In the past, that was almost 40%. All other mixed types of forest
increased between RFI1 and RFI2. Data of the RFI show a significant increase of mixed stands, at the
expense of stands dominated by coniferous species.
24
Figure 6 : Evolution of the stand types in Flanders between RFI1 and RFI2.
The share of homogeneous stands (pine, poplar and other species) has also significantly decreased in
favor of the mixed forests, which now represent more than half of the Flemish forests, compared to
39% twenty years ago.
Figure 7 : Evolution of the proportion of homogeneous and mixed stands in Flanders between RFI1 and RFI2.
25
Scots pine is still the most common tree species in Flanders, both in volume as in number of stems,
although a slight decrease from 27% to 23% (in volume) is observed. Coniferous trees as a whole
account for 40% of the living wood stock, while that was still 46% at the first forest inventory.
Native oak (Quercus robur and Quercus petraea) has overtaken poplar as the most common deciduous
tree species. Poplar has dropped significantly from 17% to 11% of the total volume, while the share of
native oak has increased from 11% to 13%. Beech remains the number three of deciduous tree species
with 8%.
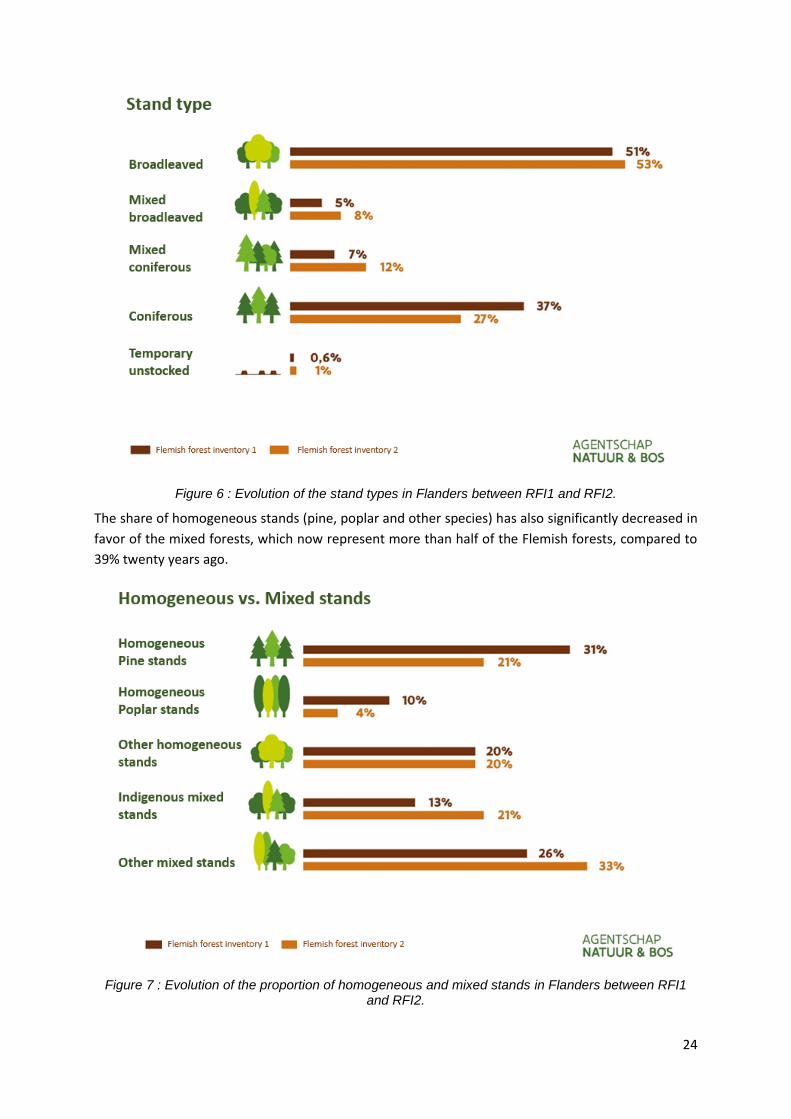
Over the past twenty years, the share of indigenous tree species in Flanders has risen from 61% to
68%. The mixed native stocks have also clearly increased: from 13% to 21%.
Figure 8 : Evolution of the basal area share of indigenous species in Flanders between RFI1 and RFI2.
The forest type distribution used in the FRL modeling of the Flemish forest is the probable
distribution encountered in 2009. This probable distribution is based on a scenario which simulates
the forest evolution from RFI1 up to 2009 and resulting to a forest distribution which is in between
the results of the RFI1 (1997-1999) and RFI2 (2009-2019).
Harvesting
Table 6 gives an overview of the total volume of wood harvested in public forests managed by the
Agency Nature & Forests (ANB). The non-ANB part of the timber sale is currently being mapped out.

26
Table 6: overview of the total volume of wood harvested in public forest managed by ANB.
2013 2014 2015 2016 2017
Total harvested wood volume (m³) 113.902 100.469 106.933 103.210 98.892
Coniferous (m³) 42.413 35.057 32.110 35.878 44.002
Deciduous (m³) 71.490 65.411 74.824 67.332 54.890
Forest operation schedule
Forest ownership is very fragmented in Flanders with about 60% privately owned and rather diverse
in composition and structure. It is therefore difficult to determine a single forest operation schedule.
Comparison of RFI1 and RFI2 shows the results of the forest policy. Flemish forests change in the
desired direction. They are becoming more diverse in composition, structure,…. Trees grow older and
larger, although the detected changes are not always meaningful (yet). The impact of the extended
forest management plans cannot be determined yet. Since the RFI2 can’t spot real differences between
private and public forest anymore, forest policy seems successful and the management principles and
approaches as described in the Flemish criteria for sustainable forest management can be used as an
approximation of general or common forest practice. More so, this document was also the guiding
principle for the operations of the forest groups, cooperative associations that support mainly private
forest owners in the management of their forests through advice, information, administrative support,
training and coordination of management activities. In October 2017 the criteria for sustainable forest
management were replaced by the criteria for integrated nature management, but basic principles are
still valid.
This approach combines management based on natural processes, nature conservation measures and
forest use (e.g. harvesting) that does not exceed the carrying capacity of the ecosystem. It is therefore
a management vision for forests that can be sustainably used in various ways by society. This approach
is summarized as the mosaic cycle concept:
− All development phases of a forest are important;
− Aiming for forests with a sufficiently large surface area (at least 50 ha and preferably larger).
− Forest management uses management units (= unit of treatment, surface with the same
ecological properties);
− In large forests, a structure is strived for where all development phases (including open phase)
are present;
− Time dimension: accept waiting and responding to evolution, including natural rejuvenation.
The main forestry strategy is selective high thinning before the final harvest.
Selective high thinning is variable in time: the cycle is depending on the age of the stand (Table 7).

27
Table 7: Typical thinning regimes
Stand type Age Thinning regimes
Coniferous < 40 years 3 years
> 40 years 6 years
From 70 – 90 years 9 – 12 years
Deciduous < 70 – 80 years 4 years
> 70 – 80 years 8 years
Selective high thinning is variable in space: the thinning intensity varies per management unit or group
of trees to better adapt to differences in site specific conditions, species present, accidents (e.g. wind
fall) etc.
The younger coniferous stands (Scots or Corsican pine) are treated specifically. The first thinning starts
at 30 – 35 years. Scots pine stands with a basal area below 14 m²/ha and Corsican pine stands below
25 m²/ha are not yet thinned.
The rotation period is not determined at the level of a management unit as a whole, but at the level of
a group of trees or an individual tree. The rotation period is determined based on wood quality, value
accruement and expected influence on surrounding trees (e.g. natural rejuvenation). The general
average harvesting quantum is set at 5m³/ha/year, but always within the average annual growth. The
real production goal will be set in the forest management plans based on the local situation.
Poplar plantations clear cutting is limited to 3 ha.
Brussels-Capital Region
Introduction
The description of the forest management practices in the Brussels-Capital Region is partially based on
a GIS-based forest stand description updated in 2006 and 2010 (Timal, 2006). It mainly provides data
as forest-stands composition, ages, structures and surfaces for year 2010. A first Regional Forest
Inventory (RFI1) with permanent sample plots (GxABT, 2007) was launched in Brussels in 2008 and
lasted till 2016. The second inventory is ongoing (2017-2024). RFI1 and 2 will provide in the future
valuable data as growth rates and structure/composition/surface updates.
Forest composition
The main forest stand types in the Brussels-Capital Region in 2010 were pure beech stands (59% of the
forest area) followed by pure Oaks stands (12%). Broadleaves stands cover more than 92% of the forest
area. Mixed stands can gather broadleaves and conifer trees.

28
Figure 9 : Main forest types in Brussels-Capital Region based on GIS-based forest stand description (2010)
Forest eco certification
The only eco certification encountered in the Brussels Region is FSC with 1.659 ha of (public) forest
certified (95,5% of Brussels forest cover). First certificate was issued in 2003 and is nowadays still on-
going.
Harvesting
The total amount of solid wood volume harvested in the Brussels Region between 2004 and 2011 is
described in the figure below. It has to be compared to the average annual growth rate estimated to
8,5 m³ BFT/ha by Galoux (1959). It would provide annually 13.000 m³ of wood. That old global
estimated growth rate value will be confirmed and developed during the second regional forest
inventory actually on its way.
Forest types in 2010
Beech Mixed beech stands Oaks
Mixed oak stands Maple Mixed maple stands
Pine Larch Mixed larch stands
Ash Mixed ash stands Miscelaneous
Other surfaces

29
Figure 10: Total amount of solid wood volume harvested between 2004 and 2011 in Brussels.
Forest operation schedule
The Sonian Forest (95,5% of Brussels-Capital forest cover) was in 2010 mainly covered by pure beech stands (59% of the forest cover). Sylviculture was oriented there to produce “beech cathedrals”, traditional forest stands characterized by 45-50 meters high beeches, with 15-20 meters branch-free trunks and vegetation-free soils.
Such a sylviculture is based on high-density plantations, conservative thinnings, 8-years rotation and a
200 years-old revolution with clearcutting. Timal (2005) developed a Forestry standard in order to help
forest guards to produce traditional “beech cathedrals”.
Since 2016, in response to climate change, surfaces dedicated to traditional beech cathedral
production are reduced to 20% of the forest cover. Sessile oak becomes the main forest species to
promote in a multi-aged, multi-layer and multi-species system.
In those broadleaves stands, the cutting cycle remains 8 years with possible forest operation in mid-
cycle. The main criteria leading the forest operations are : i) the tree maturity (tree diameter to reach
before logging), ii) the forest density expressed in basal area per hectare. Thinning is operated in order
to promote crop trees and regeneration.
Good forest practices in Wallonia suggest keeping the stand basal area between 11 m² ha-1 and 18 m² ha-1 for native oaks stands and between 17 m² ha-1 and 21 m² ha-1 for the other broadleaves stands.
0
1000
2000
3000
4000
5000
6000
7000
8000
9000
10000
2004 2005 2006 2007 2008 2009 2010 2011
Total amount of solid wood volume harvested (m³ BFT) -Years 2004 to 2011
broadleaves trees conifer trees Total BFT
30
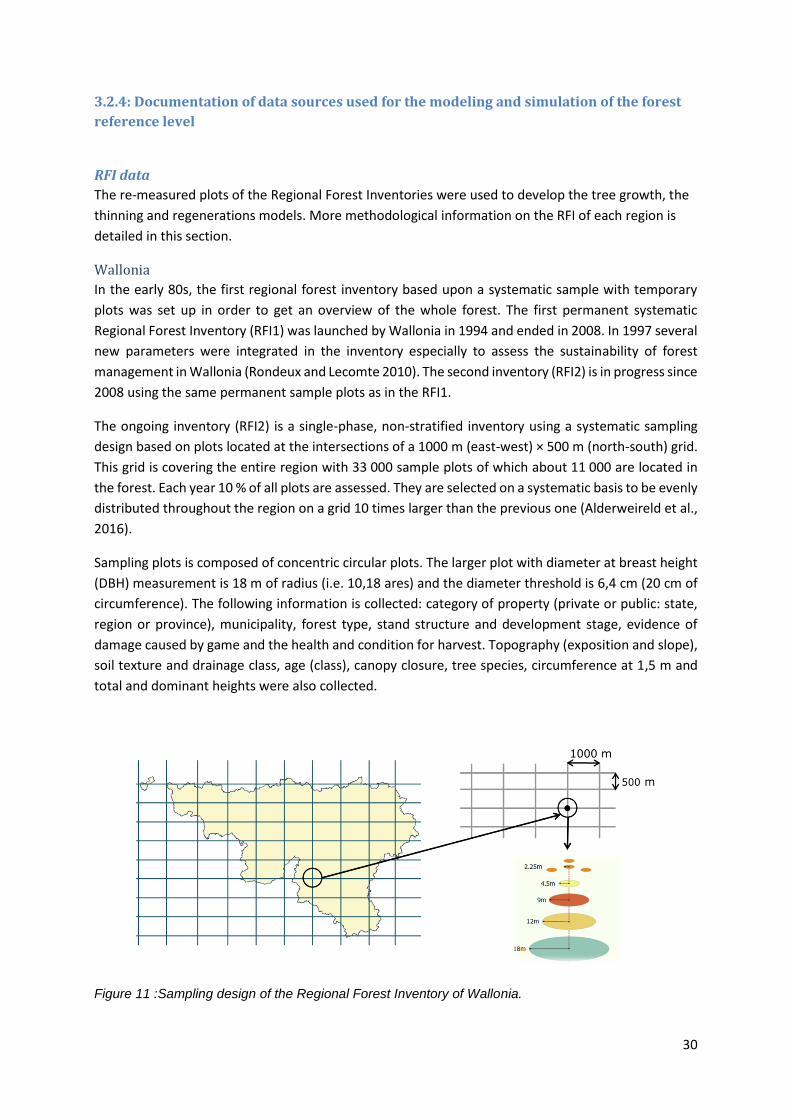
3.2.4: Documentation of data sources used for the modeling and simulation of the forest
reference level
RFI data
The re-measured plots of the Regional Forest Inventories were used to develop the tree growth, the
thinning and regenerations models. More methodological information on the RFI of each region is
detailed in this section.
Wallonia
In the early 80s, the first regional forest inventory based upon a systematic sample with temporary
plots was set up in order to get an overview of the whole forest. The first permanent systematic
Regional Forest Inventory (RFI1) was launched by Wallonia in 1994 and ended in 2008. In 1997 several
new parameters were integrated in the inventory especially to assess the sustainability of forest
management in Wallonia (Rondeux and Lecomte 2010). The second inventory (RFI2) is in progress since
2008 using the same permanent sample plots as in the RFI1.
The ongoing inventory (RFI2) is a single-phase, non-stratified inventory using a systematic sampling
design based on plots located at the intersections of a 1000 m (east-west) × 500 m (north-south) grid.
This grid is covering the entire region with 33 000 sample plots of which about 11 000 are located in
the forest. Each year 10 % of all plots are assessed. They are selected on a systematic basis to be evenly
distributed throughout the region on a grid 10 times larger than the previous one (Alderweireld et al.,
2016).
Sampling plots is composed of concentric circular plots. The larger plot with diameter at breast height
(DBH) measurement is 18 m of radius (i.e. 10,18 ares) and the diameter threshold is 6,4 cm (20 cm of
circumference). The following information is collected: category of property (private or public: state,
region or province), municipality, forest type, stand structure and development stage, evidence of
damage caused by game and the health and condition for harvest. Topography (exposition and slope),
soil texture and drainage class, age (class), canopy closure, tree species, circumference at 1,5 m and
total and dominant heights were also collected.
Figure 11 :Sampling design of the Regional Forest Inventory of Wallonia.

31
The description of the RFI of Wallonia and the main results from RFI1 are documented in English in the
book chapter of Alderweireld et al. (2016) and more details information are available in the RFI1 result
report in French (Alderweireld et al., 2015) and the RFI methodological guide in French (Rondeux and
Lecomte, 2010).
Flanders
The first Regional Forest Inventory (RFI1) with permanent sample plots was launched in Flanders
between 1997 and 1999. The second Regional Forest Inventory started in 2009 and ended in 2018. As
in Wallonia, the design of the forest inventory is a single-phase, non-stratified inventory using a
systematic sampling design based on plots located at the intersections of a 1000 m (east-west) × 500
m (north-south) grid with about 3.000 plots located in the forest. The larger plot with DBH
measurement is 18 m of radius (i.e. 10,18 ares) and the DBH threshold is 7 cm (20 cm of
circumference).
Brussels
The first Regional Forest Inventory (RFI1) with permanent sample plots was launched in Brussels
between 2008 and 2015. The second inventory is ongoing. The forest inventory is a single-phase, non-
stratified inventory using a systematic sampling design based on plots located at the intersections of a
200 (east-west) × 200 m (north-south) grid with 431 plots located in the forest. The larger plot with
DBH measurement is 18 m of radius (i.e. 10,18 ares) and the DBH threshold is higher compare to the
other regions: 12,7 cm (40 cm of circumference) instead of the 6,4 cm of the other regions.
In the Brussels Capital Region, the Sonian forest is protected (no deforestation allowed) and FSC
certified from 2003 on. The management principles are defined and implemented in order to ensure
ecological stability and a long-term balance in the distribution of forest ages. These principles are on
the basis of the modelling exercise realized by Gembloux ABT, which was calibrated on the
observations from RFI1.
Image interpretation in the Reference Period
The objectives of the image interpretation of the forest plots from the RFI’s first cycles were 1) to
collect data in the reference period to develop the clearcut model and 2) to update plot status
(presence or absence of growing stock).
The final database of the image interpretation is composed of plot ID with the information on presence
or absence of growing stock (Boolean variable).
Figure 12: Image interpretation of a time series of aerial images (within the Reference Period) for a forest plot measured in the RFI 1 of Wallonia. The forest plot was measured in 1998 and was a 41
years Norway spruce stand.

32

33
3.3: Detailed description of the modeling framework as applied in the
estimation of the forest reference level
3.3.1 Above and below ground biomass (SIMREG)
The total living biomass (above and below ground biomass) is simulated for the Belgian forest
reference level using the forest simulation software SIMREG (Perin et al., in progress; Perin et al.,
2017). SIMREG is species-specific or species group specific for the minor species, the software uses
tree and stand level models and requires trees and plot data coming from forest inventory as the
National/Regional Forest Inventory data. SIMREG starts by computing each virtual stand on the basis
of forest inventory data measured on the corresponding sample plot and then run calibrated forest
sub-models of removal (thinning and clearcut), growth and regeneration (recruitment and
reforestation) to predict the forest evolution (Figure 13).
The simulation of the living biomass starts by updating each plot of the RFI data up to 2009 (the last
year of the Reference Period) by applying a ‘Business as Usual’ scenario. Then, the Forest Reference
Level scenario is simulated up to 2030. The FRL scenario includes the following good practices: the
projection of the age-related effects (or diameter structure effect) within the stands, the regeneration
of clearcut with the same stand composition (no species changes), a constant forest management
practice (same forest management practices as in the Reference Period) and a constant forest land
area. Simulations will be executed up to the last year of the commitment period (2030). This short-
term projection does not require any projection of climate change conditions.
Figure 13 : Overview of the operating of the forest simulation software SIMREG.

34
Initialization of the simulation
The raw RFI data are processed in order to get summarized RFI data which are stored in two files: one
file (stands.inv) with stand plot information (plot ID, bioclimatic region, altitude, strata, represented
area, status, age, beginning and ending date of the simulation and forestry parameter such as the
rotation, …) and the second file (trees.inv) with the measured trees data (plot ID, tree ID, species,
extension factor per hectare, DBH, height, …).
Those files are then used to generate virtual stands representatives of each plot ID that are introduced
in the simulation from the date at which the corresponding permanent sample plot was measured.
The simulation is thus only full scale from the date corresponding to the end of the first inventory cycle
for each Region. Before those date, we apply at each year a simple extrapolation to estimate the [Total
Volume per Region] = [Total Area per Region] * [Total Simulated Volume per Region] / [Total Simulated
Area per Region]. Hence, there is no extrapolation from 1997 in Flanders, 2008 in Wallonia and 2015
in Brussels.
To take into account the high fragmentation of Belgian forests, each virtual stand has a maximum area
of 5 ha. This means, for example, that 10 virtual stands of 5 ha will be generated from a plot that
represents 50 ha. A total of 122.696 virtual stands were generated to represent the Belgian forest.
Virtual stands consist of a list of virtual trees generated from the data stored in the trees.inv
initialization file. Every virtual forest stands is generated by simple extrapolation from the tree data
measured in a single permanent sample plot so that each measured tree is represented by a number
of simulated trees strictly equal to the number it represents at the national level. Virtual forest stands
are thus perfectly representative of the RFIs data. A total of 552.159.170 virtual trees were initially
generated to represent the Belgian forest. Empty virtual stands are either considered as clearcut
waiting for regeneration or as unproductive forest stands depending on the status data provided in
the stands.inv initialization files.
Tree species identified in the simulator
Most models integrated in the simulator are species specific. These models were calibrated for 22
different species groups: 20 for the most common tree species of Belgium and 2 default groups for the
other less abundant broadleaves and conifer species. There are 14 individualized broadleaved species:
Indigenous oak, Beech, Birch, Ash, Black poplar, Maple, Red oak, Alder, Hornbeam, Cherry, Chestnut,
Rowan, Black cherry, Black Locust and 6 individualized conifers : Norway spruce, Scots pine, Black pine,
Douglas-fir, Larch, Sitka spruce. These 20 tree species represent about 97,5% of the total forest
resource of Belgium.
Tree growth model
Tree growth is estimated using non-linear tree-level distance-independent species-specific models that
predict the annual girth increment as a function of individual tree girth, stand basal area, stand
dominant girth and elevation as an abiotic predictor (Perin et al., in progress). The dataset used to
calibrate the growth model consist of 35.124 growth segments collected between 1994 and 2016 in
3.844 permanent sample plots from the RFI databases. The methodology applied to fit those models
is derived from previously published work (Perin et al., 2017).
The error distributions of each model were analyzed for each species and each predictor and no
evidence of bias was found. These models explain, for each species, between 18 and 52% of the girth
annual growth variance and between 28 and 72% of the basal area annual growth variance (Table 8).

35
Together, they account for about 48% of the girth annual growth variance and 60% of the basal area
annual growth variance.

36
Table 8 : Summary of the growth model dataset and fitting statistics for each species group: number of growth segments (N), mean annual girth growth measured (dC, in cm/year), mean error for the annual
tree girth increment estimation (cm/year), adjusted R² for the annual tree girth increment estimation (cm/year) and adjusted R² for the annual tree basal area increment estimation (cm²/year).
Thinning model
Tree thinning is estimated using binary logistic tree-level distance-independent species-specific
regressions that predict the annual probability of removal as a function of the tree relative diameter,
the stand density, structure and composition and the regional owner type. Currently, these models are
also used to simulate tree mortality and self-thinning in addition to thinning. The dataset used to
calibrate the thinning models (Table 9) consist of 49.719 trees measured between 1994 and 2016 in
3.844 permanent sample plots from the RFI databases.
Species N Mean dC (cm/yr)
Mean error (cm/yr) R² dC R² dG
Indigenous oak 8391 1.0 0.01 20.1 40.1
Beech 4475 1.3 0.01 25.6 48.0
Birch 1953 0.8 -0.01 29.3 41.6
Ash 1094 1.3 0.01 28.6 53.7
Black poplar 1063 2.6 0.02 51.6 43.7
Maple 740 1.2 0.01 29.6 45.5
Red oak 677 1.9 0.01 44.8 69.0
Alder 435 0.9 -0.01 34.7 49.1
Hornbeam 303 0.9 0.00 25.5 42.9
Cherry 197 1.1 0.01 18.6 28.5
Chestnut 178 1.8 0.02 24.9 41.4
Rowan 138 0.5 0.00 29.0 54.4
Black cherry 127 1.2 0.03 50.0 47.4
Black Locust 93 1.1 0.02 39.5 55.4
Other broadleaves 368 1.3 0.01 38.2 45.8
Total broadleaves 20232 1.2 0.01 46.3 57.3
Norway spruce 8657 1.4 0.01 40.1 59.2
Scots pine 3130 1.0 0.01 27.9 28.5
Black pine 1116 1.2 0.02 46.0 51.4
Douglas-fir 980 2.3 0.03 52.4 72.4
Larch 798 1.4 0.00 36.8 46.4
Sitka spruce 82 2.1 -0.01 32.6 45.4
Other conifers 129 2.1 0.02 51.7 69.9
Total Conifers 14892 1.4 0.01 50.2 65.3
TOTAL 35124 1.3 0.01 48.2 59.7

37
Table 9: The mean percentage of tree removing per year in Belgium (total) and at the strata scale.
Stand clearcut probability model
Stand clearcut is estimated using a binary logistic regression that predicts the annual probability of
clearcut (Figure 14) as a function of the stand composition, the dominant girth (Cdom) and the regional
owner type. The dataset used to calibrate the clearcut model is based on the results of the image
interpretation (see section 3.2.3) of 9.276 sample plots measured before 2007 by the RFIs.
Species N
Mean %cut/an
Total Wallonia
Public Wallonia Private
Flanders Public
Flanders Private
Indigenous oak 9873 2.0 2.0 1.4 3.2 3.1
Beech 5758 2.4 2.6 1.3 2.5 2.1
Birch 3089 3.4 2.7 2.9 4.5 4.4
Ash 1446 2.8 1.8 2.3 4.9 7.4
Black poplar 1513 3.4 2.5 2.4 6.8 3.6
Maple 1079 3.2 1.2 2.6 5.8 7.5
Red oak 1114 4.2 2.1 2.4 6.1 3.7
Alder 993 5.9 2.5 3.7 9.2 7.5
Hornbeam 390 2.5 2.6 2.0 6.4 3.2
Cherry 275 3.0 2.7 2.1 5.2 6.4
Chestnut 294 4.8 1.0 1.4 6.7 6.7
Rowan 287 4.8 2.9 5.5 8.2 5.9
Black cherry 629 9.6 - - 11.2 9.0
Black Locust 121 2.3 0.0 2.0 5.0 3.5
Other broadleaves 922 6.1 3.5 3.7 9.5 10.3
Total broadleaves 27783 3.1 2.4 2.2 5.4 5.3
Norway spruce 12150 1.4 5.0 4.3 4.4 5.0
Scots pine 4923 1.0 3.4 2.6 4.1 3.6
Black pine 2107 1.2 4.3 5.7 5.3 4.6
Douglas-fir 1424 2.3 6.4 4.4 5.6 4.1
Larch 1037 1.4 4.5 2.3 3.0 2.9
Sitka spruce 121 2.1 5.5 4.5 - -
Other conifers 174 2.1 3.2 0.8 2.6 6.3
Total Conifers 21936 2.1 4.9 4.2 4.4 3.9
TOTAL 49719 2.1 3.5 3.3 4.9 4.7
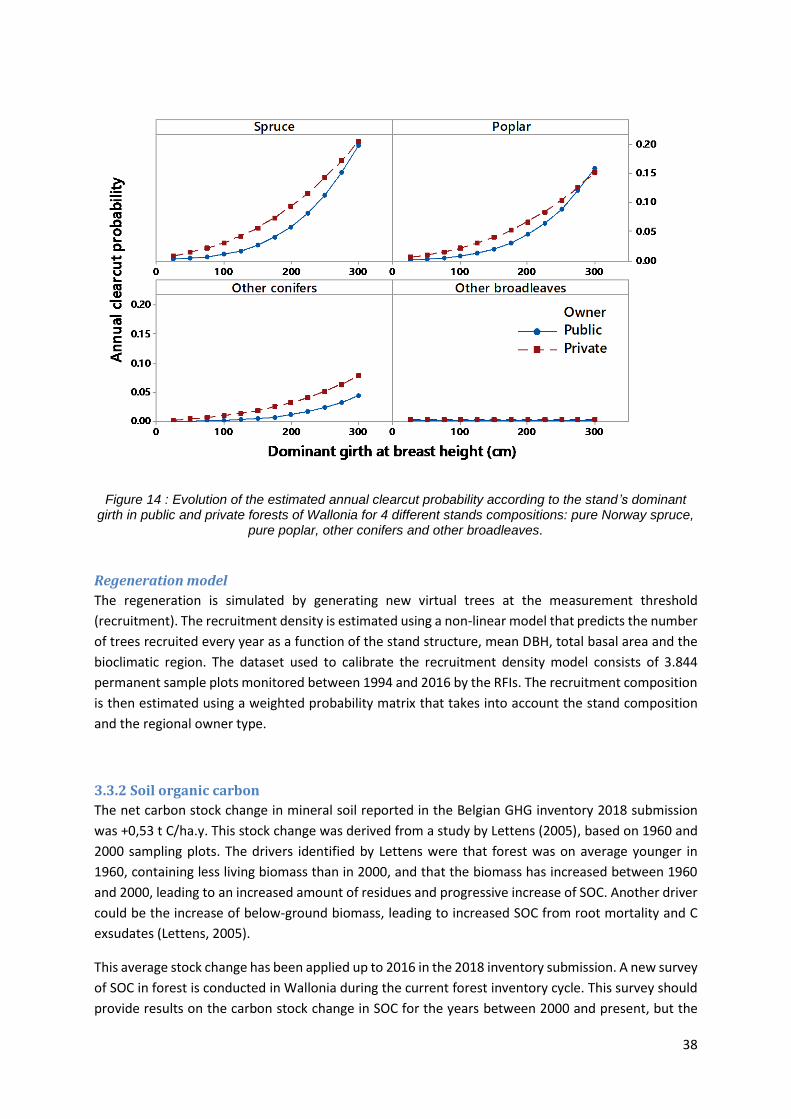
38
Figure 14 : Evolution of the estimated annual clearcut probability according to the stand’s dominant girth in public and private forests of Wallonia for 4 different stands compositions: pure Norway spruce,
pure poplar, other conifers and other broadleaves.
Regeneration model
The regeneration is simulated by generating new virtual trees at the measurement threshold
(recruitment). The recruitment density is estimated using a non-linear model that predicts the number
of trees recruited every year as a function of the stand structure, mean DBH, total basal area and the
bioclimatic region. The dataset used to calibrate the recruitment density model consists of 3.844
permanent sample plots monitored between 1994 and 2016 by the RFIs. The recruitment composition
is then estimated using a weighted probability matrix that takes into account the stand composition
and the regional owner type.
3.3.2 Soil organic carbon
The net carbon stock change in mineral soil reported in the Belgian GHG inventory 2018 submission
was +0,53 t C/ha.y. This stock change was derived from a study by Lettens (2005), based on 1960 and
2000 sampling plots. The drivers identified by Lettens were that forest was on average younger in
1960, containing less living biomass than in 2000, and that the biomass has increased between 1960
and 2000, leading to an increased amount of residues and progressive increase of SOC. Another driver
could be the increase of below-ground biomass, leading to increased SOC from root mortality and C
exsudates (Lettens, 2005).
This average stock change has been applied up to 2016 in the 2018 inventory submission. A new survey
of SOC in forest is conducted in Wallonia during the current forest inventory cycle. This survey should
provide results on the carbon stock change in SOC for the years between 2000 and present, but the

39
results are not available yet. In Flanders, the current forest inventory cycle does not include soil carbon
measurements. In the Brussels-Capital Region, a personal communication by the University of Ghent
underlines indications of an increase in soil carbon stocks, but no quantified data are available. In
Flanders, a study from 2009 (De Vos) also suggests an increase in soil carbon stocks. However, the
number of samples is currently too limited and the uncertainty margin (95% confidence interval) too
large to deliver significant results.
In this context, the UNFCCC review in 2018 drew the attention to the fact that the current carbon stock
change applied for SOC appears to be an outlier compared to other Parties. The consultation of the EU
NIR (table 6.15) confirms this assessment, as the SOC stock change is the highest of all member states:
18 member States report no change in carbon stocks and the other present a very limited sink (or
source for 2 MS). Only one Member State currently reports an annual change (which is still smaller
but) of the same order of magnitude (0,41 tC/ha.y). In the absence of updated values from the regional
forest inventories, the currently available data and studies do not allow to extend the use of the
average carbon stock change factor for the years after 2000.
As a consequence and considering that no recent information confirms that the drivers of the SOC
change between 1960 and 2000 are applicable to the present forest, Belgium has revised its estimates
for Soil Carbon in its 2019 submission, for the entire time series.
The available data showed an increase in carbon stocks in mineral soils between 1960 and 2000, so
this pool does not appear to be a source, which means that the assumption of no stock change in SOC
is conservative and in line with the Tier 1 approach of the IPCC 2006 Guidelines.
Consequently, in the absence of updated values that would allow the calculation of updated estimates,
the assumption of no stock change in SOC, following IPCC 2006 Guidelines Tier1 approach is applied
for the FRL and is also applied since the 2019 GHG inventory submission, to ensure consistency and
avoid any expectation of undue net credits. This Tier 1 approach does not require a model.
3.3.3. Dead organic matter – Litter and deadwood
In the GHG inventory submission, Belgium applies the Tier 1 approach of the IPCC 2006 Guidelines,
assuming no change in carbon stock in managed forest land, for both litter and deadwood (notation
key “NO” is used in the CRF tables).
The same approach is applied for the FRL, assuming no change in carbon stock in managed forest land,
for both litter and deadwood. This Tier 1 approach does not require a model.
3.3.4. Harvested Wood Products
The projected HWP pool has been estimated according to the stepwise approach described in the
Technical guidance.

40
The projected harvest has been compared to the average historic harvest as documented in the FAO database, which is the activity data used in the annual HWP reporting. The average total harvest in 2000-2009 according to the FAO database is 4.697*10³ m³ per year (total for roundwood : industrial roundwood+wood fuel). The average share of wood fuel according to FAO data is 13%. The total annual harvest according to the model during the reference period is on average 5.552*10³ m³ per year, which is significantly higher than the FAO data.
Consultation with relevant experts revealed that the FAO data are based on regional forest inventory data where some removals are neither recorded nor considered. In particular, harvest estimates for coppice, linear stands, unmeasured and impenetrable stands are not included in the FAO data but they are simulated by our model. It should also be noted that our model does not differentiate between harvesting and mortality.
We estimated that coppice should represents 7 to 8% of the total harvest and that, based on the Walloon RFI, about 5% of the volume removed corresponds to dead trees. The rest of the difference between FAO data and simulated harvest is attributed to impenetrable and unmeasured stands. According to expert judgment, this additional harvest does not fit the typical requirements for solid wood product and we thus assume that it is used as woodfuel. As a result, the total share of woodfuel is actually significantly larger than the 13% reported in the FAO data and represents in fact 27% of the total harvest.
In order to avoid any overestimation of the industrial roundwood (IRW) entering the HWP pool, the industrial round wood has been projected from 2010 by applying the modeled trend of the total harvest (as projected by the model) on the average IRW from FAO data for the period 2000-2009. In
practice, we applied the same approach as the one applied by the Netherlands7, by scaling each years’ production values in each category (sawnwood, paper, wood based panels) compared to the average over the period 2000-2009 (total harvest in year divided by total harvest in the reference period 2000-2009.
Imports and exports were projected by calculating “intensity indicators” for wood imports and wood exports in the period 2000-2009 (share of import and export compared to the domestic production) and applying them to the wood production from 2010 on, for all categories.
This approach excludes the woodfuel from the HWP accounting and maintains a constant ratio between solid and energy use of forest biomass as documented in the period from 2000 to 2009, in line with Annex IV, A (e) of the LULUCF regulation.
According to the model, the total harvest in 2021-2025 varies from 5.260 to 5.418*10³ m³, representing a slight decrease compared to the 5.552*10³ m³ simulated in the reference period, with an annual harvest in 2021-2025 representing yearly 95% to 98% of the average harvest in the reference period.
We also calculated the average fD and fFM in 2000-2009 and used it to estimate the ratio of wood issued from managed forest. Figure 15 shows the consistency during the reference period (2000-2009) between the estimates for Industrial roundwood in the FAO data and the FRL model.
7 http://cdr.eionet.europa.eu/nl/eu/mmr/lulucf/envxdyfqg/NFAP-NL.pdf, equation 3.9 page 44

41
Figure 15 : Comparison of Industrial roundwood estimates : FAO data and FRL model.
The HWP have then been calculated from 2010 onwards, using the same methodology as in the current
inventory. The situation at the end of the Reference Period, i.e. 2009, is considered as a starting point
for the projection. This correction was applied according to the technical recommendation published
in the Commission Staff Working Document SWD 2019/212. In the NFAP as submitted in January 2019,
the actual available data up to 2016 were used so that the projection started in 2017, which was not
in line with the Regulation and Technical Guidance.
Production of Sawn wood, Wood panels and Paper and Paperboard projected from 2010 to 2025, are
multiplied by their fraction of domestic harvest (fIRW, fPULP) and by the share of forest management (fFM)
to determine the fluxes entering the HWP carbon pool. This is added to the historical HWP carbon
stock, while the overall carbon stock decays, according to the specific half-lives of IRW, WP and PP
(resp. 35, 25, 2 years).
Since April 2019, a slight correction had also been applied in the HWP calculation : carbon stocks of the HWP pools at initial time (period 1900-1961) are now estimated applying equation 2.8.6 of the 2013 Revised Supplementary Methods and Good Practice Guidance Arising from the Kyoto Protocol, instead of equation 12.6 of the 2006 IPCC Guidelines applied in the 2019 submission (see NIR 2019 page 244). This correction will be applied in the forthcoming inventory submissions, from January 2020 on.
Table 10 : Harvest data and solid use of harvest for the average of the Reference Period and for the period 2021-2025 (FRL)
Total harvest (10³ m³)
Solid use of harvest – simulated (Industrial
Roundwood, 10³ m³)
Woodfuel – simulated (10³ m³)
Average 2000-2009 5552
4072 (GHGI 2000-2009 : 4069)
1483
2021 5418 3975 1443
2022 5260 3859 1401
2023 5280 3873 1406

42
2024 5282 3875 1407
2025 5275 3870 1405
4. Forest reference level
4.1: Forest reference level and detailed description of the development of
the carbon pools
4.1.1 Living Biomass
The main raw outputs of the simulator SIMREG are the species, the DBH (and the height) of each tree
in each RFIs plot for each year simulated.
The stem volume (solid wood volume, Vstem) are estimated using the 13 species volume equations of
Dagnelie et al. (2013). For each species without a species volume equation, a morphological
correspondence between one of the 13 species equations and the focused species has been done.
The stem volume is converted into total above ground volume (AGV) by using the DBH and height
dependent volume expansion factor (VEF) of Longuetaud et al. (2013) on which we add the volume of
the stump (equations 1,2,3 and 4). In Table 11, an average ratio AGV/Vstem per species has been
computed (BEF1) with the second Walloon RFI to summarize the conversion of Vstem to AGV.
The stump volume is estimated as a cylinder with a diameter equal to the diameter of the beginning
of the bole and a height of 10 cm (the mean stump height in the dataset of Dagnelie et al., 2013,
equation 4). The diameter of the beginning of the bole, D0, is estimated by using the taper curves of
Dagnelie et al. (2013, equation 5).
𝐴𝐺𝑉 = 𝑣𝑠𝑡𝑒𝑚 ∙ 𝑉𝐸𝐹 + 𝑣𝑠𝑡𝑢𝑚𝑝 Equation 1
𝑉𝑠𝑡𝑒𝑚 = 𝑓(𝑑𝑏ℎ) Equation 2
𝑉𝐸𝐹 = 𝑓(𝑑𝑏ℎ, ℎ) Equation 3
𝑉𝑠𝑡𝑢𝑚𝑝 = 𝐷0 ∙ 0.1 Equation 4
𝐷0 = 𝑓(𝑑𝑏ℎ, ℎ) Equation 5
The below ground volume is estimated by using the below biomass expansion factors (BEF2) of Vande
Walle et al. (2005, equation 6).
The total volume of the tree is then converted into biomass by using the species mean basal wood
density of 40 species in Belgium (equation 6 and 7). The mean basal wood density was computed from
the worldwide dryad database (Chave et al., 2009; Zanne et al., 2009) and the wood density (WD) data
of Wagenführ and Schreiber (1985) which were converted into basic wood density (Latte et al., 2013).
The biomass is converted in carbon by using the default IPCC conversion factor CC: 0.5 (Eggleston et
al., 2006, equation 8).

43
𝐵𝐺𝑉 = 𝐴𝐺𝑉 ∙ 𝐵𝐸𝐹2 Equation 6
𝑇𝑉 = 𝐴𝐺𝑉 + 𝐵𝐺𝑉 Equation 7
𝑇𝐶 = 𝑇𝑉 ∙ 𝑊𝐷 ∙ 𝐶𝐶 Equation 8
The yearly carbon stock change of the Belgian forest is converted in equivalent CO2 using the
molecular weight ratio 44/12.
Table 11: Species or genus having a species/genus Dagnelie et al. (2013) stem volume equation
and/or a Longuetaud et al. (2013) VEF. BEF1 is the mean ratio AGV/Vstem, AGV is the above ground volume which includes the volume of the stump, the stem and the branches (only non italic BEF1 are based on Longuetaud et al. (2013) genus specific equations). BEF2 are the constant below ground biomass expansion factor of Vande Walle et al. (2005). The basic wood density is computed as the average of the species basic wood density from Chave et al. (2009) and Wagenführ and Schreiber (1985).
Species/genusStem volume
equation
Mean BEF1
in the RFIW2BEF2
Mean basic
wood density
(g/m³)
Quercus petraea & robur x 1.35 0.21 0.562
Quercus rubra x 1.3 0.21 0.516
Fagus sylvatica x 1.38 0.21 0.586
Betula pendula & pubescens x 1.33 0.21 0.528
Acer pseudoplatanus x 1.37 0.21 0.514
Fraxinus excelsior x 1.25 0.21 0.563
Prunus avium x 1.4 0.21 0.496
Ulmus campestris & glabra x 1.43 0.21 0.518
Carpinus sp. 1.53 0.21 0.685
Larix decidua & kaempferi x 1.11 0.2 0.458
Picea abies x 1.14 0.2 0.380
Pinus sylvestris x 1.12 0.16 0.422
Pseudotsuga menziesii x 1.16 0.17 0.427
Abies sp. 1.23 0.2 0.410

44
4.1.2 Soil carbon
As explained in section 3.3.2, the soil carbon is deemed stable , so the FRL does not include any
emission or removals in this pool.
4.1.3. Dead organic matter – Litter and deadwood
As explained in section 3.3.3, Belgium assumes no change in carbon stocks in this pool. Hence no
emissions or removals are considered in the FRL.
4.1.4. Harvested wood products
The projected total HWP calculated as explained in section 3.3.4 are presented in Table 12.
Table 12 : Projected total Harvested Wood Products volumes.
HWP (kt CO2)
2021 -169.1
2022 -124.9
2023 -127.2
2024 -125.1
2025 -120.7
4.2: Consistency between the forest reference level and the latest national
inventory report
4.2.1. Forest management
Regional inventories were significantly revised between the 2018 and 2019 GHG inventory submission.
These revisions are reflected and described in the 15th April 2019 GHG inventory submission.
Figure 15 compares the FRL to the 15th April 2019 GHGI submission.

45
Figure 15 : CO2 equivalent emission and removals the Belgian forest simulated with the FRL scenario
and GHGI data (April 2019 submission) using the stock change approach.
Historical data used for the consistency analysis
The consistency is here analyzed with regard to the 15th April 2019 submission data.
According to the technical Guidance, section 2.4.1, “Historical data here refers to the period 2000-
20XX; where 20XX is the latest inventory year available in the national GHGI at time the FRL is
constructed. (As publicly available by the time of submission of the FRL.)” In this regard, Belgium
underlines that the 15th April submission, is the latest submission and is publicly available on the
EIONET Central Data Repository
(https://cdr.eionet.europa.eu/be/eu/mmr/art07_inventory/ghg_inventory/ ).
Consistency with GHG inventory
Phase 1 / consistency of management practices
As described in section 3.2.2, the management practices applied in the model are based on the actual
management observed in the reference period, inferred from the direct interpretation of the forest
inventory sampling plots, as measured in 2001 and 2012 in Wallonia, 1998-2012 in Flanders and 2006-
2010 in Brussels Capital Region.
The GHG inventory is based on the same results of the regional forest inventories for these central
years, using a carbon stock change approach which includes all actual increments and removals in
managed forest.

46
In this regard, the management practices used in the FRL are fully consistent with the practices
measured in the reference period.
The thinning model developed for Flanders and described in Table 9 has been revised since January
2019 because it led to an overestimation of the total volume removed in the FRL. We assume that the
methodological differences (eg protocol and equipment) between the first and the second RFI resulted
in some technical mismatches that were wrongly identified as removals during our modelling process.
It seems reasonable to expect that the thinning applied in forest stands of identical composition,
structure and owner type is comparable in all regions. The thinning values presented for Wallonia in
Table 9 have therefore been applied to all regions as was suggested during the review process by the
LULUCFEG. The FRL generated using the adapted thinning figures is presented in Figure 15 and clearly
shows that this approach brings the FRL and GHG inventory closer to each other.
Phase 2/ Consistency of emissions and removals estimates
The total stock change and average annual values of the FRL and the GHG inventory are compared in
the table and figure below. The years 2000 and 2001 are not considered here : 2001 is the central year
of the Walloon forest inventory and the GHG inventory data, prepared using a stock change approach,
show a clear jump in the estimate and consequently these years are not relevant for this comparison.
Taking into account these elements, the period 2002-2009 is deemed the most relevant for the
comparison.
Table 13 : Belgium - Comparison between FRL and GHG inventory (April 2019)
Average annual removal in the period 2002-2009 (kt CO2)
FRL -1022
GHG Inventory April 2019 (95% confidence interval)
-1116 (-875/ -1357)
The average values of FRL and GHG inventory are very close and the FRL values lies within the GHG
inventory 95% confidence interval 8 , which suggest a good consistency. This is in line with the
Commission recommendation, as recorded in the minutes of the WG5 meeting on 2-3 October 2019
“However, the most important part is the third step – consistency of output data for the entire time
series and total of all pools – which is where the 95% confidence interval is to be applied to check for
consistency and whether ex-post adjustment is necessary”9
Phase 3 / Consistency of time series
8 The 95 confidence interval is calculated on the basis of an uncertainty of 21,6% for the category Forest land remaining forest land, as reported in the NIR 2019 (page 352). 9 https://ec.europa.eu/transparency/regexpert/index.cfm?do=groupDetail.groupMeetingDoc&docid=36319

47
The consistency analysis described in section 2.4.4. of the Technical Guidance is not applicable,
considering the use of a stock change approach, which does not allow to analyse a short term trend.
4.2.2. Harvested Wood Products
Figure 16 compares the projected HWP from the FRL (see section 3.3.4) and the HWP as reported April
2019 GHGI submission. The correction applied since April 2019 is also represented (carbon stocks of
the HWP pools for the period 1900-1961 are now estimated applying equation 2.8.6 of the 2013
Revised Supplementary Methods and Good Practice Guidance Arising from the Kyoto Protocol, instead
of equation 12.6 of the 2006 IPCC Guidelines applied in the 2019 submission).
Figure 17 : HWP emissions and removals : April 2019 submission, corrected April 2019 submission and
FRL
Figure 17 shows that the HWP pool is calculated using the same methodology for the reference period.
The projected level differs from the current GHG inventory for the years 2010-2017, due to various
rationales:
- the recent evolution of sawnwood and wood panels production, as observed in 2010-2017 according to the FAO database, with an increase of sawnwood and a decrease of wood panels, is not reflected in the FRL projections which are purely based on projected harvests. - Industrial Roundwood production according to the FAO database for 2010-2017 is slightly higher than the projected FRL value.

48
4.3: Calculated carbon pools and greenhouse gases for the forest reference
Level
4.3.1 Living Biomass
Following the FRL scenario, the living biomass stock increases during the commitment period from a
mean carbon stock of 60,560Tg in the 5 first years of the commitment period (2021-2025) to an
average of 62,298Tg of carbon in the second half of the commitment period (2026-2030, Table 14 and
Figure 16 and Figure 17 and 21)10. The sink of the Belgian forest is slightly increasing during the
commitment period with an absorption of around 1.236 ktons of CO2-eq. The stem volume removed
from the living biomass of the forest is slightly decreasing and close to 5,3 Mm³.
After clearcut, between 15 and 25 years (depending on the species) are generally required for the next
forest stand to leave the juvenile stage and reach its production phase. The Walloon forest inventory
data shows that the annual clearcutting rate is currently decreasing (and has done so for the last 20
years) while the rate at which juvenile stands reach their production phase is increasing. This is
obviously linked to the current renewal of our softwood resources that has been observed since the
1990s. This essentially leads to an actual increase of the share of the total productive forest area that
is in its production phase. In addition, we observed between 1995 and 2009 that the total area
occupied by pure douglas-fir stands and mixed douglas-fir - Norway spruce stands increased from 16
500 ha to 31 000 ha. Thus, a significant proportion of these new plantations are composed of species
that are more productive than the one they replaced. We believe these elements are the key driver
for the overall simulated trends in growth and harvest.
Table 14: The mean value of the living biomass in the forest reference level scenario before and during the commitment period.
Period
Annual carbon stock
Average annual balance
Average annual stem
volume harvested (10³ m³)
(kt C)
(negative values stand for removals)
(kt CO2eq)
2011-2015 57336 -960.0 5442
2016-2020 58873 -1293.8 5289
2021-2025 60560 -1235.6 5303
2026-2030 62298 -1327.6 5269
Table 15: Increment of the main species in Belgium
Species Increment (m³ ha-1 year-1)
Wallonia Flanders Brussels
Oaks 5,4 5,5 5,7
Beech 8,9 8,3 8,3
Birch 6,3 5,7 6,5
Ash 8,4 8,4 8,4
10 Data for 2026-2030 are included in this section for information only and do not represent any official submission of the FRL for 2026-2030.

49
Poplar 7,6 6,9 -
Other broadleaves 12,2 9,7 10,1
Norway spruce 17,0 15,0 10,4
Douglas 21,8 16,3 13,8
Scot pine 5,7 6,7 5,7
Black pine 8,9 10,7 9,2
Larches 9,4 9,7 7,9
Other conifers 21,8 20,8 16,0
Table 17 : Regional FRL
Annual balance (kt CO2) Belgium Wallonia Flanders Brussels
2021-2025 1235.6 968.8 260.8 6.0
Figure 16 : Forest structure evolution in Brussels

50
Figure 17: Forest structure evolution in Flanders and Wallonia by periods of 5 years.
Figure 18: Forest structure evolution in Flanders and Wallonia by forest type group.

51
Figure 19 : The forest reference level of the living biomass before and during the commitment period.
Due to the scale of the graphs, the data for Brussels are difficult to read.

52
4.3.2. Harvested wood products
The projected total HWP calculated for the FRL are presented in Table 16.
Table 16 : Projected total Harvested Wood Products volumes.
HWP (kt CO2)
2021 -169.1
2022 -124.9
2023 -127.2
2024 -125.1
2025 -120.7
Average 2021-2025 -133.4
53
References Alderweireld, M., Burnay, F., Pitchugin, M., Lecomte, H., 2015. Inventaire forestier wallon-Résultats
1994-2012. SPW. Alderweireld, M., Rondeux, J., Latte, N., Hébert, J., Lecomte, H., 2016. Belgium (Wallonia), in:
National Forest Inventories. Springer, pp. 159–179. Chave, J., Coomes, D., Jansen, S., Lewis, S.L., Swenson, N.G., Zanne, A.E., 2009. Towards a worldwide
wood economics spectrum. Ecology letters 12, 351–366. Colson, V., Delfosse, B., Lecomte, H., Marchal, D., 2015. Structure de la propriété forestière en
Wallonie et cartographie du morcellement foncier. Forêt.Nature Juillet-Septembre, 59–67. Dagnelie, P., Palm, R., Rondeux, J., 2013. Cubage des arbres et des peuplements forestiers. Tables et
équations. Presses agronomiques de Gembloux. Eggleston, S., Buendia, L., Miwa, K., Ngara, T., Tanabe, K., 2006. 2006 IPCC guidelines for national
greenhouse gas inventories. Institute for Global Environmental Strategies Hayama, Japan. Forsell, N., Korosuo, A., Fedirici, S., Gusti, M., Rincón-Cristóbal, J.J., Ruter, S., Sánchez-Jiménez, B.,
Dore, C., Brajterman, O., Gardiner, J., 2018. Guidance on developing and reporting the Forest Reference Levels in accordance with Regulation (EU) 2018/841.
Galoux, A., 1959. Sylviculture en Forêt de Soignes. Natur. Belges 40, 26–35. GxABT, 2007. Etude portant sur la mise en place d’inventaires permanents du patrimoine forestier de
la Région Bruxelles Capitale – Guide méthodologique pour la collecte, l’encodage et le traitement des données d’inventaire.
Hebert, J., Herman, M., Jourez, B., 2002. Sylviculture et qualité du bois de l’épicéa en Région wallonne. Forêt wallonne.
Latte, N., Colinet, G., Fayolle, A., Lejeune, P., Hébert, J., Claessens, H., Bauwens, S., 2013. Description of a new procedure to estimate the carbon stocks of all forest pools and impact assessment of methodological choices on the estimates. European journal of forest research 132, 565–577.
Latte, N., Perin, J., Lejeune, P., 2016. Evolution récente des surfaces forestières et de la régénération des coupes rases en Wallonie. Forêt. Nature 141, 46–51.
Lejeune, P., Alderweireld, M., Lecomte, H., Hebert, J., 2013. Analyse de l’évolution de la surface de la forêt wallonne par interprétation d’images aériennes: un outil complémentaire à l’inventaire forestier régional. Forêt Wallonne 27–35.
Longuetaud, F., Santenoise, P., Mothe, F., Kiessé, T.S., Rivoire, M., Saint-André, L., Ognouabi, N., Deleuze, C., 2013. Modeling volume expansion factors for temperate tree species in France. Forest ecology and management 292, 111–121.
PEFC, 2017. Rapport annuel 2017. Perin, J., Hebert, J., Lejeune, P., Claessens, H., 2016. Nouvelles normes sylvicoles pour les
peuplements purs équiennes d’épicéa et de douglas. Perin, J., Lejeune, P., Hebert, J., 2017. Regional scale simulation of the forest resources evolution in
Southern Belgium (Wallonia). Rondeux, J., Lecomte, H., 2010. Inventaire Permanent des Ressources Forestières de Wallonie-Guide
méthodologique. Rondeux, J., Lecomte, H., 1988. Considérations sur la structure actuelle des hêtraies en Ardenne et
en région jurassique: Implications en matière de traitement sylvicole. Bulletin de la Société Royale Forestière de Belgique= Tijdschrift van de Koninklijke Belgische Bosbouwmaatschappij 95, 279–293.
Sanchez, C., 2016. La sylviculture pro sylva en Wallonie. Mesures et recommandations du DNF. Timal, G., 2006. Mise à jour de la carte des peuplements. Timal, G., 2005. Etude des critères dendrométriques qui doivent permettre d’assurer le suivi des
peuplements de hêtres orientés vers l’objectif de « Maintien de la hêtraie cathédrale ».

54
Vande Walle, I., Van Camp, N., Perrin, D., Lemeur, R., Verheyen, K., Van Wesemael, B., Laitat, E., 2005. Growing stock-based assessment of the carbon stock in the Belgian forest biomass. Annals of Forest Science 62, 853–864.
Wagenführ, R., Schreiber, C., 1985. Wood atlas. Wood atlas. Zanne, A.E., Lopez-Gonzalez, G., Coomes, D.A., Ilic, J., Jansen, S., Lewis, S.L., Miller, R.B., Swenson,
N.G., Wiemann, M.C., Chave, J., 2009. Data from: Towards a worldwide wood economics spectrum. https://doi.org/10.5061/dryad.234

55
Appendixes
Appendix 1: Relief and climate in Belgium

56
Appendix 2: National FRL data
Date Region Area Carbons stock Emissions /removals
Growing stock
Stem volume removed
Above-ground biomass removed
Carbon density
(ha) (Mg) (kt eCO2) (m³) (10³ m³) (Mg dry matter)
(Mg C/ha)
2000 Belgium 612978 53831690 -1504 149663893 5439 2892197 88
2001 Belgium 612978 54237499 -747 151474824 5638 2973012 88
2002 Belgium 612978 54436882 -1892 152365193 5761 3034583 89
2003 Belgium 612978 54948551 -1188 153409545 5520 2919888 90
2004 Belgium 612978 55268300 -1067 154003370 5552 2949184 90
2005 Belgium 612978 55555044 -1031 154918324 5309 2824210 91
2006 Belgium 612978 55831887 -992 155392687 5577 2968723 91
2007 Belgium 612978 56098151 -871 155639030 5559 2966078 92
2008 Belgium 612978 56330238 -588 155798974 5576 2989993 92
2009 Belgium 612978 56481118 -547 156101389 5584 2992159 92
2010 Belgium 612978 56630385 -722 156423390 5419 2913222 92
2011 Belgium 612978 56827174 -870 156928288 5393 2879580 93
2012 Belgium 612978 57064412 -927 157461413 5396 2896287 93
2013 Belgium 612978 57317160 -1069 158000154 5381 2898623 94
2014 Belgium 612978 57608651 -928 158573816 5537 2978015 94
2015 Belgium 612978 57861728 -1006 158979307 5504 2955639 94
2016 Belgium 612978 58136207 -1294 159444786 5247 2848680 95
2017 Belgium 612978 58489154 -1507 160184516 5119 2775293 95
2018 Belgium 612978 58900019 -1320 161071792 5290 2871106 96
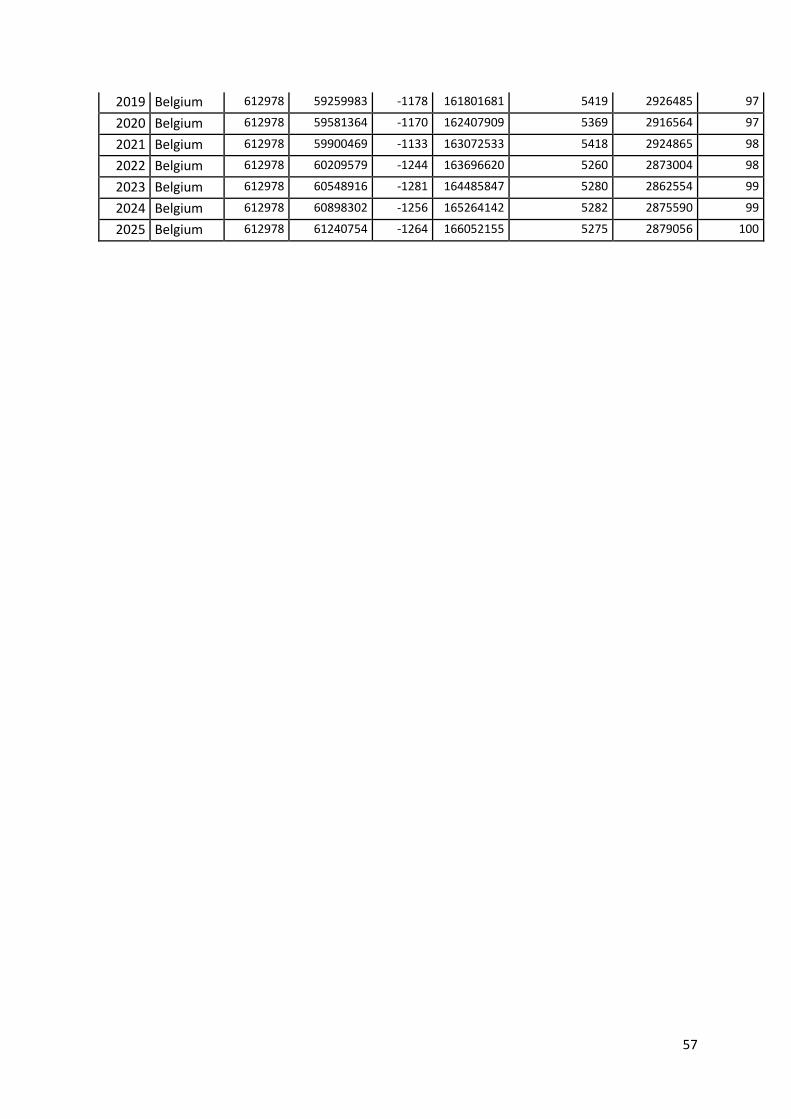
57
2019 Belgium 612978 59259983 -1178 161801681 5419 2926485 97
2020 Belgium 612978 59581364 -1170 162407909 5369 2916564 97
2021 Belgium 612978 59900469 -1133 163072533 5418 2924865 98
2022 Belgium 612978 60209579 -1244 163696620 5260 2873004 98
2023 Belgium 612978 60548916 -1281 164485847 5280 2862554 99
2024 Belgium 612978 60898302 -1256 165264142 5282 2875590 99
2025 Belgium 612978 61240754 -1264 166052155 5275 2879056 100

58
This report has been prepared by :
• Perin Jérôme, Bauwens Sébastien, Pitchugin Mikhail, Lejeune Philippe, Hébert Jacques. University of Liège - Gembloux Agro-Bio Tech - TERRA Research Unit - Forest is life. Passage des Déportés 2, 5030 Gembloux
• Walloon Air and Climate Agency (AWAC) Avenue Prince de Liège 7 5100 Jambes Contact : André Guns
• Service Public de Wallonie – DGO3 - Département de la Nature et des Forêts -Direction des
Ressources Forestières - Cellule Inventaire Permanent des Ressources Forestières de
Wallonie. Avenue Prince de Liège 7 5100 Jambes
• Department of Environment and Spatial Development – Departement Omgeving (dOMG)
Koning Albert II-laan 20 box 8 1000 Brussels
• Flanders Environment Agency - Vlaamse Milieumaatschappij (VMM) Dokter De Moorstraat 24-26 9300 Aalst
• Agency for Nature and Forests – Agentschap voor Natuur & Bos (ANB) Havenlaan 88 box 75 1000 Brussels
• Brussels Environment (IBGE-BIM) Site de Tour & Taxis, Avenue du Port 86C/3000, 1000 Brussels