national functional guidelines for inorganic superfund ...tune analysis ... epa clp national...
TRANSCRIPT
&EPA Office of Superfund Remediation and Technology Innovation (OSRTI) United States Environmental Protection Agency (EPA) Washington, DC 20460
NATIONALFUNCTIONALGUIDELINES for Inorganic Superfund Methods Data Review
OLEM 9355.0-135 EPA-540-R-201 7-001 January 2017
January 2017 ii
This page is intentionally left blank.
January 2017 iii
NOTICE The policies and procedures set forth here are intended as guidance to the United States Environmental Protection Agency (EPA) and other governmental employees. They do not constitute rule making by the EPA, and may not be relied upon to create a substantive or procedural right enforceable by any other person. The Government may take action that is at variance with the policies and procedures in this manual. This document can be obtained from the EPA’s Superfund Analytical Services and Contract Laboratory Program website at:
https://www.epa.gov/clp/contract-laboratory-program-national-functional-guidelines-data-review

January 2017 iv
This page is intentionally left blank.

January 2017 v
TABLE OF CONTENTS
LIST OF TABLES .................................................................................................................................... vii
ACRONYMS AND ABBREVIATIONS .................................................................................................. ix
I. Terminology ....................................................................................................................................... ix II. Target Analyte List ............................................................................................................................ xi
INTRODUCTION ....................................................................................................................................... 1
I. Purpose of Document .......................................................................................................................... 1 II. Limitations of Use ............................................................................................................................... 1 III. Document Organization ...................................................................................................................... 1 IV. For Additional Information ................................................................................................................. 1
PART A: GENERAL DATA REVIEW .................................................................................................... 3
I. Preliminary Review ............................................................................................................................. 5 II. Data Qualifier Definitions ................................................................................................................... 6 III. Data Review Narrative ........................................................................................................................ 7
PART B: METHOD-SPECIFIC DATA REVIEW .................................................................................. 9
ICP-AES DATA REVIEW ....................................................................................................................... 11
Example Analytical Sequence .................................................................................................................... 13 I. Preservation and Holding Times ....................................................................................................... 15 II. Calibration ......................................................................................................................................... 17 III. Blanks ................................................................................................................................................ 20 IV. Interference Check Sample ............................................................................................................... 24 V. Laboratory Control Sample ............................................................................................................... 27 VI. Duplicate Sample Analysis ............................................................................................................... 30 VII. Spike Sample Analysis ...................................................................................................................... 33 VIII. Serial Dilution ................................................................................................................................... 36 IX. Performance Evaluation Sample ....................................................................................................... 38 X. Regional Quality Assurance and Quality Control ............................................................................. 40 XI. Overall Assessment of Data .............................................................................................................. 41 XII. Calculations ....................................................................................................................................... 43
ICP-MS DATA REVIEW ........................................................................................................................ 45
Example Analytical Sequence .................................................................................................................... 47 I. Preservation and Holding Times ....................................................................................................... 49 II. Tune Analysis.................................................................................................................................... 51 III. Calibration ......................................................................................................................................... 53 IV. Blanks ................................................................................................................................................ 56 V. Interference Check Sample ............................................................................................................... 60 VI. Laboratory Control Sample ............................................................................................................... 63 VII. Duplicate Sample Analysis ............................................................................................................... 65 VIII. Spike Sample Analysis ...................................................................................................................... 68 IX. Serial Dilution ................................................................................................................................... 71 X. Internal Standards.............................................................................................................................. 73 XI. Performance Evaluation Sample ....................................................................................................... 75 XII. Regional Quality Assurance and Quality Control ............................................................................. 77 XIII. Overall Assessment of Data .............................................................................................................. 78 XIV. Calculations ....................................................................................................................................... 80

January 2017 vi
MERCURY DATA REVIEW .................................................................................................................. 81
Example Analytical Sequence .................................................................................................................... 83 I. Preservation and Holding Times ....................................................................................................... 85 II. Calibration ......................................................................................................................................... 87 III. Blanks ................................................................................................................................................ 90 IV. Duplicate Sample Analysis ............................................................................................................... 95 V. Spike Sample Analysis ...................................................................................................................... 98 VI. Performance Evaluation Sample ..................................................................................................... 100 VII. Regional Quality Assurance and Quality Control ........................................................................... 102 VIII. Overall Assessment of Data ............................................................................................................ 103 IX. Calculations ..................................................................................................................................... 105
CYANIDE DATA REVIEW .................................................................................................................. 107
Example Analytical Sequence .................................................................................................................. 109 I. Preservation and Holding Times ..................................................................................................... 111 II. Calibration ....................................................................................................................................... 113 III. Blanks .............................................................................................................................................. 116 IV. Duplicate Sample Analysis ............................................................................................................. 120 V. Spike Sample Analysis .................................................................................................................... 123 VI. Performance Evaluation Sample ..................................................................................................... 126 VII. Regional Quality Assurance and Quality Control ........................................................................... 128 VIII. Overall Assessment of Data ............................................................................................................ 129 IX. Calculations ..................................................................................................................................... 131
APPENDIX A: GLOSSARY .................................................................................................................. A-1
APPENDIX B: INORGANIC DATA REVIEW SUMMARY ............................................................ B-1
Inorganic Data Review
January 2017 vii
LIST OF TABLES
Table 1. Data Qualifiers and Definitions .................................................................................................. 6 Table 2. Preservation and Holding Time Actions for ICP-AES Analysis .............................................. 16 Table 3. Acceptance Criteria for ICV and CCV Standards for ICP-AES Analysis ................................ 17 Table 4. Calibration Actions for ICP-AES Analysis............................................................................... 19 Table 5. Blank Actions for ICP-AES Analysis ....................................................................................... 22 Table 6. Interference Check Actions for ICP-AES Analysis .................................................................. 26 Table 7. LCS Actions for ICP-AES Analysis ......................................................................................... 29 Table 8. Duplicate Sample Actions for ICP-AES Analysis .................................................................... 32 Table 9. Spike Sample Actions for ICP-AES Analysis .......................................................................... 35 Table 10. Serial Dilution Actions for ICP-AES Analysis ......................................................................... 37 Table 11. PE Sample Actions for ICP-AES Analysis ............................................................................... 39 Table 12. Preservation and Holding Time Actions for ICP-MS Analysis ................................................ 50 Table 13. ICP-MS Tune Actions for ICP-MS Analysis ............................................................................ 52 Table 14. Acceptance Criteria for ICV and CCV Standards for ICP-MS Analysis .................................. 53 Table 15. Calibration Actions for ICP-MS Analysis ................................................................................ 55 Table 16. Blank Actions for ICP-MS Analysis ......................................................................................... 58 Table 17. Interference Check Actions for ICP-MS Analysis .................................................................... 62 Table 18. LCS Actions for ICP-MS Analysis ........................................................................................... 64 Table 19. Duplicate Sample Actions for ICP-MS Analysis ...................................................................... 67 Table 20. Spike Sample Actions for ICP-MS Analysis ............................................................................ 70 Table 21. Serial Dilution Actions for ICP-MS Analysis ........................................................................... 72 Table 22. Internal Standard Actions for ICP-MS Analysis ....................................................................... 74 Table 23. PE Sample Actions for ICP-MS Analysis ................................................................................. 76 Table 24. Preservation and Holding Time Actions for Mercury Analysis ................................................ 86 Table 25. Acceptance Criteria for ICV and CCV Standards for Mercury Analysis ................................. 87 Table 26. Calibration Actions for Mercury Analysis ................................................................................ 89 Table 27. Blank Actions for Mercury Analysis ........................................................................................ 93 Table 28. Duplicate Sample Actions for Mercury Analysis ..................................................................... 97 Table 29. Spike Sample Actions for Mercury Analysis ............................................................................ 99 Table 30. PE Sample Actions for Mercury Analysis .............................................................................. 101 Table 31. Preservation and Holding Time Actions for Cyanide Analysis .............................................. 112 Table 32. Acceptance Criteria for ICV and CCV Standards for Cyanide Analysis ................................ 113 Table 33. Calibration Actions for Cyanide Analysis .............................................................................. 115 Table 34. Blank Actions for Cyanide Analysis ....................................................................................... 118 Table 35. Duplicate Sample Actions for Cyanide Analysis .................................................................... 122 Table 36. Spike Sample Actions for Cyanide Analysis .......................................................................... 125 Table 37. PE Sample Actions for Cyanide Analysis ............................................................................... 127

Inorganic Data Review
January 2017 viii
This page is intentionally left blank.
Inorganic Data Review
January 2017 ix
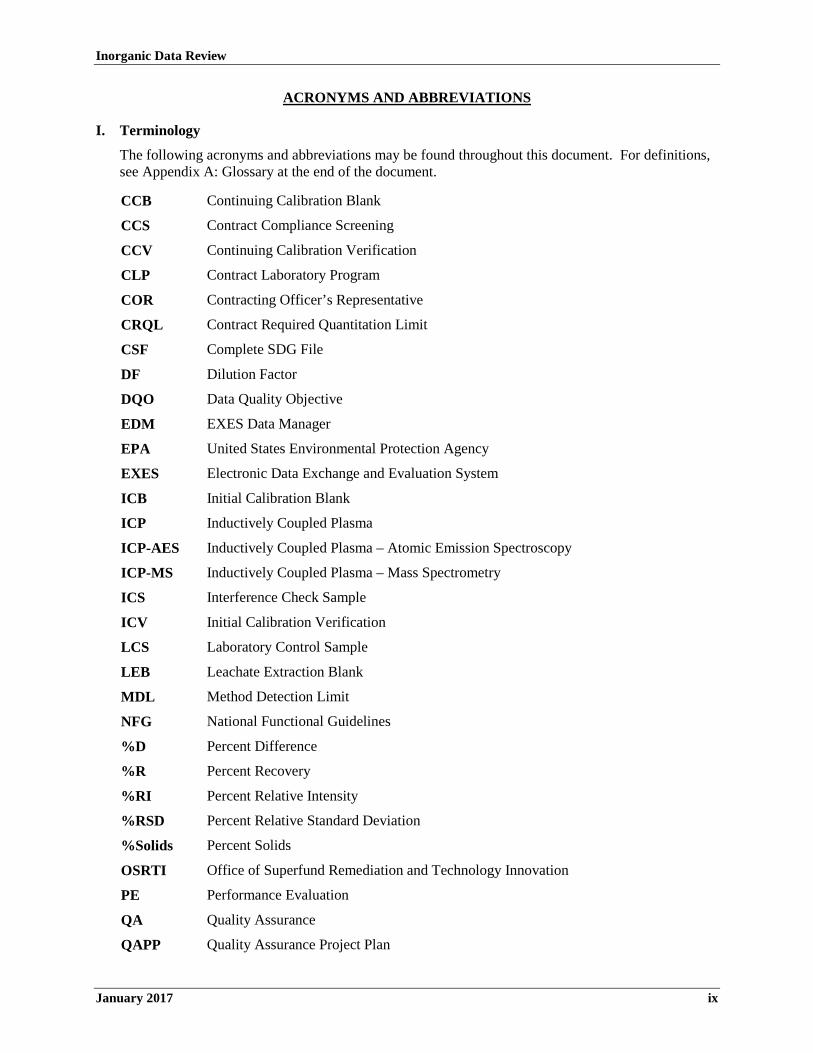
ACRONYMS AND ABBREVIATIONS
I. Terminology
The following acronyms and abbreviations may be found throughout this document. For definitions, see Appendix A: Glossary at the end of the document.
CCB Continuing Calibration Blank
CCS Contract Compliance Screening
CCV Continuing Calibration Verification
CLP Contract Laboratory Program
COR Contracting Officer’s Representative
CRQL Contract Required Quantitation Limit
CSF Complete SDG File
DF Dilution Factor
DQO Data Quality Objective
EDM EXES Data Manager
EPA United States Environmental Protection Agency
EXES Electronic Data Exchange and Evaluation System
ICB Initial Calibration Blank
ICP Inductively Coupled Plasma
ICP-AES Inductively Coupled Plasma – Atomic Emission Spectroscopy
ICP-MS Inductively Coupled Plasma – Mass Spectrometry
ICS Interference Check Sample
ICV Initial Calibration Verification
LCS Laboratory Control Sample
LEB Leachate Extraction Blank
MDL Method Detection Limit
NFG National Functional Guidelines
%D Percent Difference
%R Percent Recovery
%RI Percent Relative Intensity
%RSD Percent Relative Standard Deviation
%Solids Percent Solids
OSRTI Office of Superfund Remediation and Technology Innovation
PE Performance Evaluation
QA Quality Assurance
QAPP Quality Assurance Project Plan

Inorganic Data Review
January 2017 x
QC Quality Control
RPD Relative Percent Difference
SDG Sample Delivery Group
SEDD Staged Electronic Data Deliverable
SMO Sample Management Office
SOP Standard Operating Procedure
SOW Statement of Work
SPLP Synthetic Precipitation Leaching Procedure
TAL Target Analyte List
TCLP Toxicity Characteristic Leaching Procedure
TDS Total Dissolved Solids
TOC Total Organic Carbon
TR/COC Traffic Report/Chain of Custody
TSS Total Suspended Solids
Inorganic Data Review
January 2017 xi
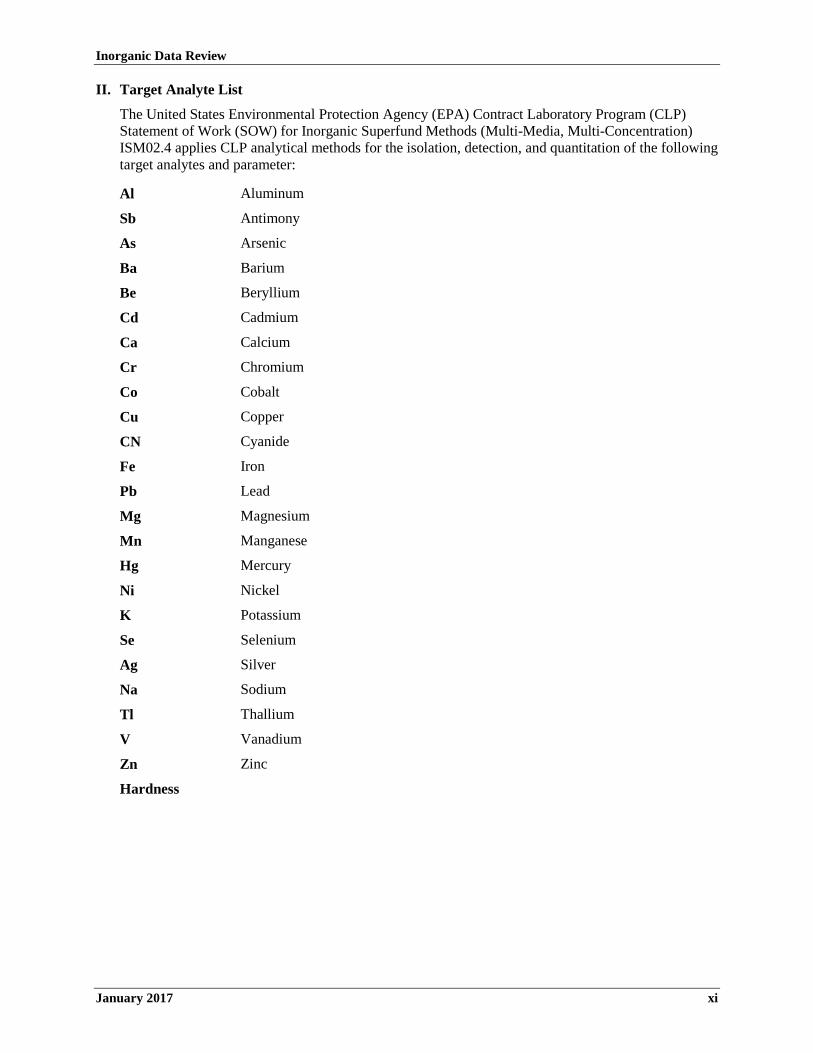
II. Target Analyte List
The United States Environmental Protection Agency (EPA) Contract Laboratory Program (CLP) Statement of Work (SOW) for Inorganic Superfund Methods (Multi-Media, Multi-Concentration) ISM02.4 applies CLP analytical methods for the isolation, detection, and quantitation of the following target analytes and parameter:
Al Aluminum
Sb Antimony
As Arsenic
Ba Barium
Be Beryllium
Cd Cadmium
Ca Calcium
Cr Chromium
Co Cobalt
Cu Copper
CN Cyanide
Fe Iron
Pb Lead
Mg Magnesium
Mn Manganese
Hg Mercury
Ni Nickel
K Potassium
Se Selenium
Ag Silver
Na Sodium
Tl Thallium
V Vanadium
Zn Zinc
Hardness

Inorganic Data Review
January 2017 xii
This page is intentionally left blank.

Inorganic Data Review Introduction
January 2017 1
INTRODUCTION
I. Purpose of Document
This document contains guidance to aid the data reviewer in determining the usability of analytical data generated using the United States Environmental Protection Agency (EPA) Contract Laboratory Program (CLP) Statement of Work (SOW) for Inorganic Superfund Methods (Multi-Media, Multi-Concentration) ISM02.4. The SOW includes analytical methods for metals by Inductively Coupled Plasma – Atomic Emission Spectroscopy (ICP-AES), metals by Inductively Coupled Plasma – Mass Spectrometry (ICP-MS), mercury, and cyanide.
The guidelines presented in this document are designed to assist the data reviewer in evaluating: (a) whether the analytical data meet the technical and Quality Control (QC) criteria specified in the SOW, and (b) the usability and extent of bias of any data not meeting these criteria. This document contains definitive guidance in areas such as blanks, calibration verification standards, Interference Check Samples (ICSs), QC audit samples, and instrument performance checks (e.g., tuning), in which performance is fully under a laboratory’s control. General guidance is provided to aid the reviewer in making subjective judgments regarding the use of data that are affected by site conditions (e.g., sample matrix effects) and do not meet SOW-specified requirements.
II. Limitations of Use
This guidance is specific to the review of analytical data generated using CLP SOW ISM02.4. It applies to the current version of the SOW, as well as future versions that contain editorial changes. To use this document effectively, the reviewer should have an understanding of the analytical methods and a general overview of the Sample Delivery Group (SDG) or Case at hand. This guidance is not appropriate for use in conducting contract compliance reviews and should be used with caution in reviewing data generated using methods other than CLP SOW ISM02.4, although the general types of QC checks, the evaluation procedures, and the decisions made after consideration of the evaluation criteria may be applicable to data from any similar method.
While this document is a valuable aid in the data review process, other sources of guidance and information, along with professional judgment, are useful in determining the ultimate usability of the data. This is particularly critical in those cases where data do not meet SOW-specified technical and QC criteria. To make the appropriate judgments, the reviewer needs to gain a complete understanding of the intended use of the data, and is strongly encouraged to establish a dialogue with the data user prior to and following data review, to discuss usability issues and resolve questions regarding the review.
III. Document Organization
Following this introduction, the document is presented in two major parts: Part A – General Data Review, which applies to all methods; and Part B – Method-Specific Data Review. In Part B, each method is addressed individually in a stand-alone format. A complete list of acronyms used in this document appears preceding this Introduction, and a Glossary is appended as Appendix A.
IV. For Additional Information
For additional information regarding the CLP and the services it provides, refer to EPA’s Superfund Analytical Services and Contract Laboratory Program website at https://www.epa.gov/clp.

Inorganic Data Review
January 2017 2
This page is intentionally left blank.
Inorganic Data Review General
January 2017 3
PART A: GENERAL DATA REVIEW

Inorganic Data Review General
January 2017 4
This page is intentionally left blank.

Inorganic Data Review General
January 2017 5
I. Preliminary Review
A preliminary review should be performed on the data, prior to embarking on the method-specific review (see Part B). During this process, the reviewer should compile the necessary data package elements to ensure that all of the information needed to determine data usability is available. The preliminary review also allows the reviewer to obtain an overview of the Case or Sample Delivery Group (SDG) under review.
The initial review should include, but is not limited to, verification of the exact number of samples, their assigned number and matrices, and the Contractor laboratory name. It should take into consideration all the documentation specific to the sample data package, which may include Modified Analysis requests, the Traffic Report/Chain of Custody (TR/COC) Record, the SDG Narrative, and other applicable documents.
The reviewer should be aware that minor modifications to the Statement of Work (SOW) that have been made through a Modified Analysis request, to meet site-specific requirements, could affect certain validation criteria such as Contract Required Quantitation Limits (CRQLs) and Target Analyte Lists (TALs). Therefore, these modifications should be applied during the method-specific review (Part B) process.
The Cases or SDGs routinely have unique field quality control (QC) samples that may affect the outcome of the review. These include field blanks, field duplicates, and Performance Evaluation (PE) samples which must be identified in the sampling records. The reviewer should verify that the following information is identified in the sampling records (e.g., TR/COC Records, field logs, and/or Contractor tables):
1. The United States Environmental Protection Agency (EPA) Region where the samples were collected; and
2. The complete list of samples with information on:
a. Sample matrix
b. Field blanks (if applicable)
c. Field duplicates (if applicable)
d. Field spikes (if applicable)
e. PE samples (if applicable)
f. Sampling dates
g. Sampling times
h. Shipping dates
i. Preservatives
j. Types of analysis
k. Contractor laboratory
The laboratory’s SDG Narrative is another source of general information, which includes notable problems with matrices; insufficient sample volume for analysis or reanalysis; samples received in broken containers; preservation information; and unusual events. The reviewer should also inspect any email or telephone/communication logs in the data package detailing any discussion of sample logistics, preparation, and/or analysis issues between the laboratory, the Contract Laboratory Program (CLP) Sample Management Office (SMO), and the EPA Region.
Inorganic Data Review General
January 2017 6
The reviewer should also have a copy of the Quality Assurance Project Plan (QAPP), or similar document, for the project for which the samples were analyzed, to assist in the determination of final usability of the analytical data. The reviewer should contact the appropriate EPA Regional CLP Contracting Officer’s Representative (EPA Regional CLP COR) to obtain copies of the QAPP and relevant site information.
For data obtained through the CLP, the Staged Electronic Data Deliverable (SEDD) generated by the CLP laboratories is subjected to the following reviews via the Electronic Data Exchange and Evaluation System (EXES): 1) automated data assessment for Contract Compliance Screening (CCS) based on the technical and QC criteria in CLP SOW ISM02.4, and 2) automated data validation based on the criteria in the EPA CLP National Functional Guidelines for Inorganic Superfund Methods Data Review. In addition, completeness checks are manually performed on the hardcopy data. The automated CCS results and hardcopy data issues are subsequently included in a CCS defect report that is provided to the laboratory. The laboratory may then submit a reconciliation package for any missing items or to correct noncompliant data identified in the report. The automated data validation results are summarized in criteria-based National Functional Guidelines (NFG) reports that are provided to the EPA Regions. The data reviewer can access the CCS and NFG reports through the EXES Data Manager (EDM) via the Superfund Analytical Services SMO Portal and may use them in determining data usability.
For access to the Superfund Analytical Services SMO Portal, refer to the following EPA Superfund Analytical Services and Contract Laboratory Program web page to contact the EPA Regional CLP COR from the EPA Region where the data review is being performed and to obtain the necessary username and password information:
https://www.epa.gov/clp/forms/contact-us-about-superfund-analytical-services-or-contract-laboratory-program#tab-3
For concerns or questions regarding the data package, contact the EPA Regional CLP COR from the EPA Region where the samples were collected.
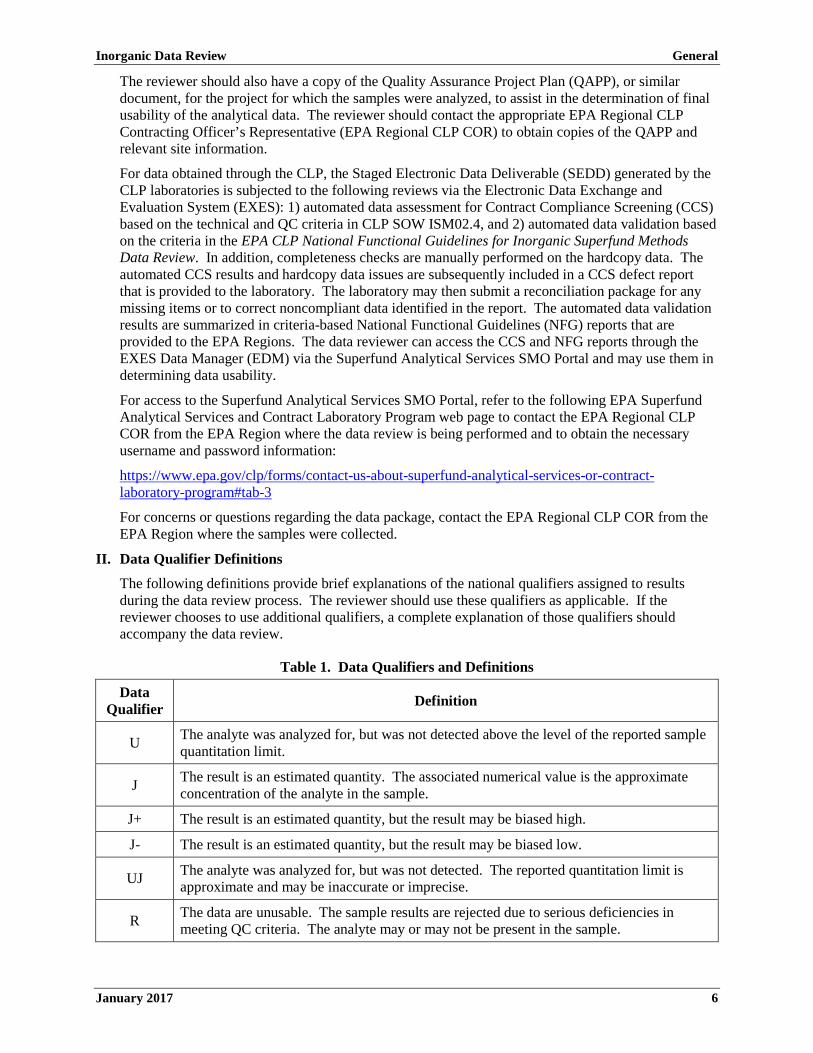
II. Data Qualifier Definitions
The following definitions provide brief explanations of the national qualifiers assigned to results during the data review process. The reviewer should use these qualifiers as applicable. If the reviewer chooses to use additional qualifiers, a complete explanation of those qualifiers should accompany the data review.
Table 1. Data Qualifiers and Definitions
Data Qualifier Definition
U The analyte was analyzed for, but was not detected above the level of the reported sample quantitation limit.
J The result is an estimated quantity. The associated numerical value is the approximate concentration of the analyte in the sample.
J+ The result is an estimated quantity, but the result may be biased high.
J- The result is an estimated quantity, but the result may be biased low.
UJ The analyte was analyzed for, but was not detected. The reported quantitation limit is approximate and may be inaccurate or imprecise.
R The data are unusable. The sample results are rejected due to serious deficiencies in meeting QC criteria. The analyte may or may not be present in the sample.
Inorganic Data Review General
January 2017 7
III. Data Review Narrative
The reviewer should complete a Data Review Narrative that includes comments that address the problems identified during the review process and state the limitations of the data associated with a Case or SDG. The EPA CLP sample numbers, analytical methods, extent of the problem(s), and assigned qualifiers should also be listed in the document.
The Data Review Narrative, including the Inorganic Data Review Summary form (see Appendix B), should be provided together with the laboratory data to the appropriate recipient(s). A copy of the Data Review Narrative should also be submitted to the EPA Regional CLP COR assigned oversight responsibility for the Contractor laboratory.

Inorganic Data Review
January 2017 8
This page is intentionally left blank.

Inorganic Data Review
January 2017 9
PART B: METHOD-SPECIFIC DATA REVIEW
Inorganic Data Review
January 2017 10
This page is intentionally left blank.

Inorganic Data Review ICP-AES
January 2017 11
ICP-AES DATA REVIEW
The inorganic data requirements for Inductively Coupled Plasma – Atomic Emission Spectroscopy (ICP-AES) to be reviewed during validation are listed below: Example Analytical Sequence .................................................................................................................... 13
I. Preservation and Holding Times ....................................................................................................... 15
II. Calibration ......................................................................................................................................... 17
III. Blanks ................................................................................................................................................ 20
IV. Interference Check Sample ............................................................................................................... 24
V. Laboratory Control Sample ............................................................................................................... 27
VI. Duplicate Sample Analysis ............................................................................................................... 30
VII. Spike Sample Analysis ...................................................................................................................... 33
VIII. Serial Dilution ................................................................................................................................... 36
IX. Performance Evaluation Sample ....................................................................................................... 38
X. Regional Quality Assurance and Quality Control ............................................................................. 40
XI. Overall Assessment of Data .............................................................................................................. 41
XII. Calculations ....................................................................................................................................... 43

Inorganic Data Review ICP-AES
January 2017 12
This page is intentionally left blank.

Inorganic Data Review ICP-AES
January 2017 13
Example Analytical Sequence This is an example of an analytical sequence: S## S## S## S## S## S## ICV ICB ICSA ICSAB CCV### CCB### samples CCV### CCB### samples CCV### CCB###, etc. * Suffix ## and ### are as specified in Exhibit B of the Statement of Work (SOW).
Inorganic Data Review ICP-AES
January 2017 14
This page is intentionally left blank.
Inorganic Data Review ICP-AES
January 2017 15
I. Preservation and Holding Times
A. Review Items
Form 1-IN, Form 12-IN, Traffic Report/Chain of Custody (TR/COC) Record documentation, Form DC-1, raw data, and the Sample Delivery Group (SDG) Narrative checking for: pH, shipping container temperature, holding time, and other sample conditions. (SOW ISM02.4 – Exhibit B, Section 3.4; Exhibit D/Introduction, Section 5.0; Exhibit D/General, Sections 8.0, 10.1.2.1, and 10.2.2.4.4; and Exhibit D/ICP-AES, Sections 8.0 and 10.1.1)
B. Objective
The objective is to determine the validity of the analytical results based on the sample conditions and the holding time of the sample.
C. Criteria
1. The technical holding time is determined from the date of collection, or the date that Toxicity Characteristic Leaching Procedure (TCLP) or Synthetic Precipitation Leaching Procedure (SPLP) extraction is complete, to the date of analysis.
2. The technical holding time criteria for aqueous/water samples and leachate samples from TCLP or SPLP is 180 days, preserved (with nitric acid) to pH ≤ 2.
3. The technical holding time criteria for soil/sediment samples is 180 days, based on the technical holding time criteria for aqueous/water samples.
4. The technical holding time criteria for wipe samples is 180 days, based on the technical holding time criteria for aqueous/water samples.
D. Evaluation
1. Establish technical holding times by comparing the sampling date(s) on the TR/COC Record documentation with the dates of analysis on Form 12-IN and the raw data; also consider using information in the Complete SDG File (CSF), as it may be helpful in the assessment.
2. Verify that the analysis dates on Form 12-IN and the raw data are identical.
3. Review the SDG Narrative and raw data preparation logs to determine if samples were properly preserved and arrived at the laboratory in proper condition (e.g., received intact, appropriate sample temperature at receipt, pH). If there is an indication of problems with the samples, the sample integrity may be compromised. Use professional judgment to evaluate the effect of the problem on the sample results.
E. Action
NOTE: Apply the action to each field sample for which the preservation or holding time criteria was not met.
1. If the pH of aqueous/water samples is > 2 at the time of sample receipt, determine if the laboratory adjusted the pH of the sample to ≤ 2 at the time of sample receipt. Also determine if the laboratory adjusted the pH to ≤ 2 for the TCLP and SPLP leachates after completion of the leaching procedure. If not, use professional judgment to qualify the samples based on the pH of the sample and the chemistry of the metal(s) of interest. Detects should be qualified as estimated low (J-) and non-detects as unusable (R).
2. If technical holding times are exceeded, use professional judgment to determine the reliability of the data, based on the magnitude of the additional time compared to the technical requirement and whether the samples were properly preserved. The expected bias would be low. Detects should be qualified as estimated low (J-) and non-detects as unusable (R).

Inorganic Data Review ICP-AES
January 2017 16
3. Due to limited information concerning holding times for soil/sediment and wipe samples, use professional judgment when deciding whether to apply the aqueous/water holding time criteria to soil/sediment and wipe samples. If they are applied, annotate this in the Data Review Narrative.
4. When the holding times are exceeded, annotate any possible consequences for the analytical results in the Data Review Narrative, and note it for United States Environmental Protection Agency Regional Contract Laboratory Program Contracting Officer’s Representative (EPA Regional CLP COR) action.
Table 2. Preservation and Holding Time Actions for ICP-AES Analysis
Criteria Action
Detect Non-detect
Aqueous/Water samples received with pH > 2 and pH not adjusted
Use professional judgment
J-
Use professional judgment
R
TCLP/SPLP leachate samples with pH > 2 and pH not adjusted Use professional
judgment J-
Use professional judgment
R
Technical Holding Time: Aqueous/Water and TCLP/SPLP leachate samples > 180 days
J- R
Technical Holding Time: Soil/Sediment and Wipe samples > 180 days
J- R
Inorganic Data Review ICP-AES
January 2017 17
II. Calibration
A. Review Items
Form 2-IN, Form 12-IN, Form 15-IN, Form 16-IN, preparation logs, calibration standard logs, instrument logs, instrument printouts, and raw data. (SOW ISM02.4 – Exhibit B, Section 3.4 and Exhibit D/ICP-AES, Sections 7.2.4.3, 9.1, 9.2, 9.3, 9.4, and 9.5)
B. Objective
The objective is to determine the validity of the analytical results based on initial calibration and calibration verification.
C. Criteria
1. Initial Calibration
The instruments shall be successfully calibrated each time the instrument is set up and after Continuing Calibration Verification (CCV) failure. The calibration date and time shall be included in the raw data.
a. A blank and at least five calibration standards shall be used to establish each calibration curve. At least one of these standards shall be at or below the Contract Required Quantitation Limit (CRQL) but above the Method Detection Limit (MDL). All measurements shall be within the instrument working range where the interelement correction factors are valid. A minimum of three replicate exposures are required for standardization, for all Quality Control (QC) samples, and for sample analyses. The average result of all the multiple exposures for the standardization, QC, and sample analyses shall be used. The calibration curve shall be fitted using linear regression or weighted linear regression. The curve may be forced through zero. The curve must have a correlation coefficient ≥ 0.995. The calculated percent differences (%Ds) for all of the non-zero standards must be within ±30% of the true value of the standard.
2. Initial and Continuing Calibration Verification
The acceptance criteria for the Initial Calibration Verification (ICV) and CCV standards are presented in Table 3:
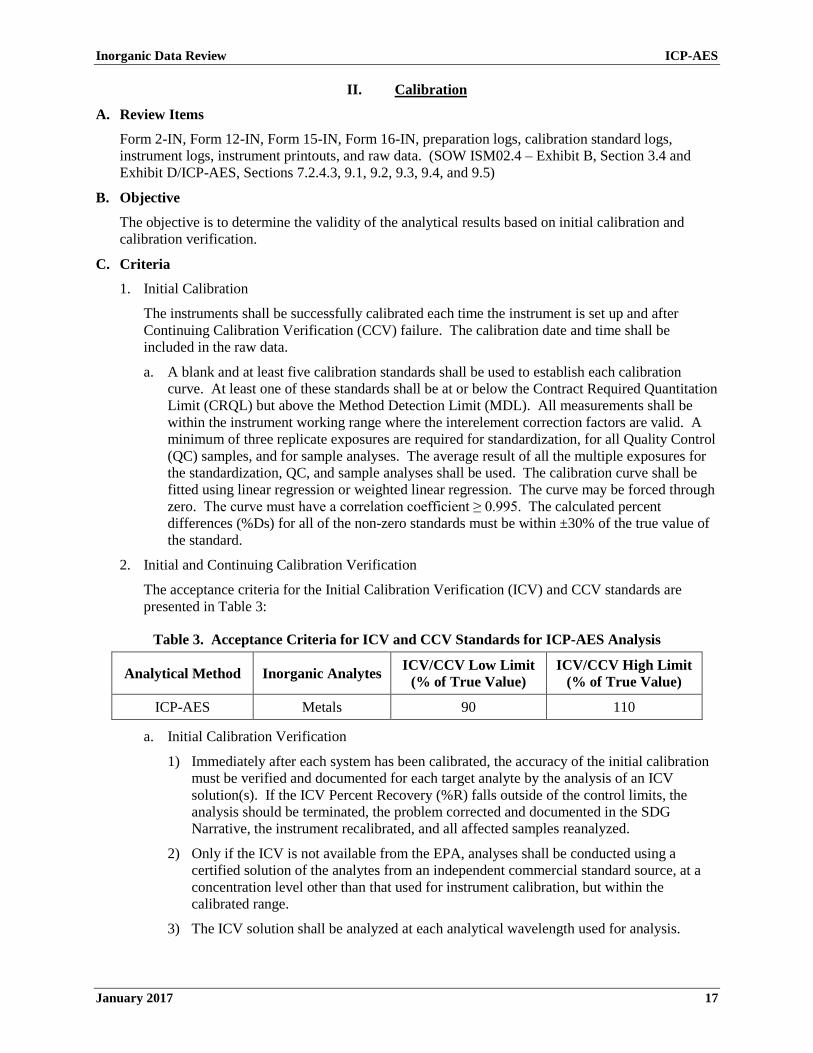
Table 3. Acceptance Criteria for ICV and CCV Standards for ICP-AES Analysis
Analytical Method Inorganic Analytes ICV/CCV Low Limit (% of True Value)
ICV/CCV High Limit (% of True Value)
ICP-AES Metals 90 110
a. Initial Calibration Verification
1) Immediately after each system has been calibrated, the accuracy of the initial calibration must be verified and documented for each target analyte by the analysis of an ICV solution(s). If the ICV Percent Recovery (%R) falls outside of the control limits, the analysis should be terminated, the problem corrected and documented in the SDG Narrative, the instrument recalibrated, and all affected samples reanalyzed.
2) Only if the ICV is not available from the EPA, analyses shall be conducted using a certified solution of the analytes from an independent commercial standard source, at a concentration level other than that used for instrument calibration, but within the calibrated range.
3) The ICV solution shall be analyzed at each analytical wavelength used for analysis.
Inorganic Data Review ICP-AES
January 2017 18
b. Continuing Calibration Verification
1) To ensure accuracy during the course of each analytical sequence, the CCV shall be analyzed and reported for each wavelength used for the analysis of each analyte.
2) The CCV standard shall be analyzed at a frequency of every two hours during an analytical sequence. The CCV standard shall also be analyzed at the beginning of the analytical sequence, and again after the last analytical sample.
3) The analyte concentration(s) in the CCV standard(s) shall be different than the concentration used for the ICV, and at a concentration equivalent to the mid-level of their respective calibration curves.
4) The same CCV standard solution shall be used throughout the analysis for an SDG.
5) The CCV shall be analyzed in the same fashion as an actual sample. If the %R of the CCV was outside of the control limits, the analysis should be terminated, the problem corrected and documented in the SDG Narrative, the instrument recalibrated, and all analytical samples analyzed since the last compliant CCV reanalyzed.
D. Evaluation
1. Verify that the instrument was calibrated each time the instrument was set up, utilizing a blank and at least five calibration standards, one of which was at or below the CRQL but above the MDL.
2. Confirm that the measurements were within the working calibration range, and were the average result of at least three replicate exposures.
3. Verify that the ICV and CCV standards were analyzed for each analyte at the specified frequency and at the appropriate concentration. Verify that acceptable %R results were obtained.
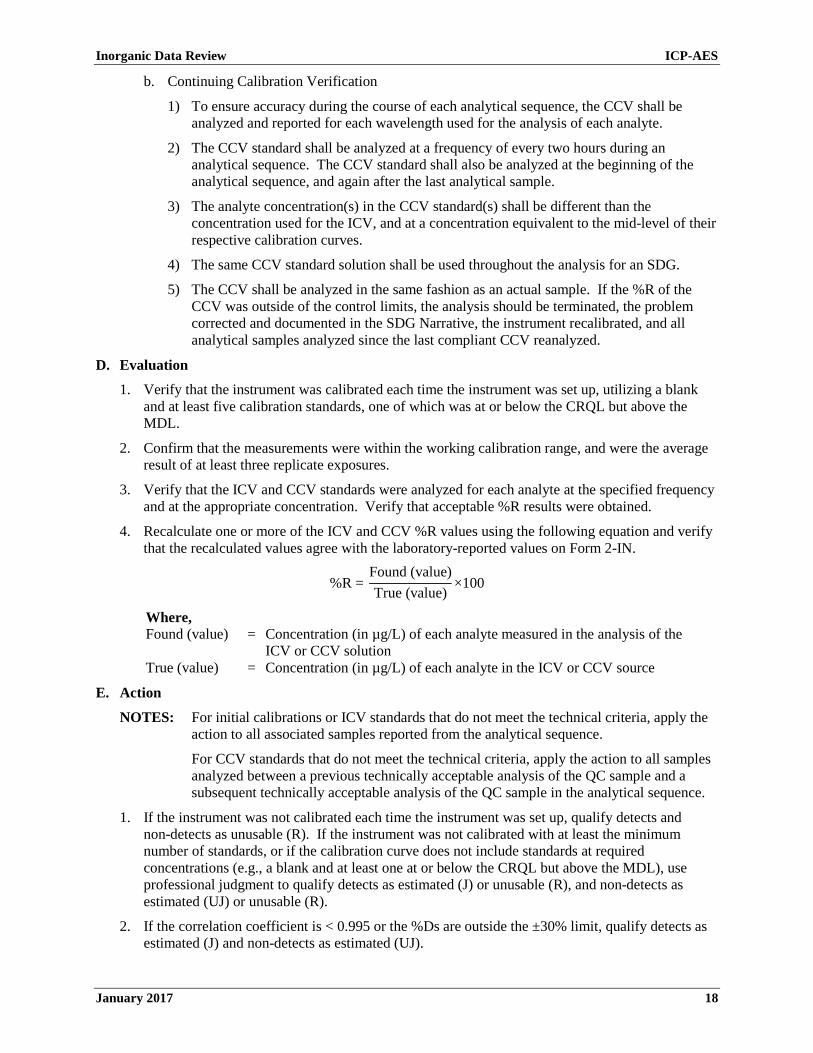
4. Recalculate one or more of the ICV and CCV %R values using the following equation and verify that the recalculated values agree with the laboratory-reported values on Form 2-IN.
%R = Found (value)True (value)
×100
Where, Found (value) = Concentration (in µg/L) of each analyte measured in the analysis of the
ICV or CCV solution True (value) = Concentration (in µg/L) of each analyte in the ICV or CCV source
E. Action
NOTES: For initial calibrations or ICV standards that do not meet the technical criteria, apply the action to all associated samples reported from the analytical sequence.
For CCV standards that do not meet the technical criteria, apply the action to all samples analyzed between a previous technically acceptable analysis of the QC sample and a subsequent technically acceptable analysis of the QC sample in the analytical sequence.
1. If the instrument was not calibrated each time the instrument was set up, qualify detects and non-detects as unusable (R). If the instrument was not calibrated with at least the minimum number of standards, or if the calibration curve does not include standards at required concentrations (e.g., a blank and at least one at or below the CRQL but above the MDL), use professional judgment to qualify detects as estimated (J) or unusable (R), and non-detects as estimated (UJ) or unusable (R).
2. If the correlation coefficient is < 0.995 or the %Ds are outside the ±30% limit, qualify detects as estimated (J) and non-detects as estimated (UJ).

Inorganic Data Review ICP-AES
January 2017 19
3. If the ICV or CCV %R falls outside the acceptance windows, use professional judgment to qualify all associated data. If possible, indicate the bias in the Data Review Narrative. The following guidelines are recommended:
a. If the ICV or CCV %R is < 75%, use professional judgment to qualify detects as estimated low (J-) or unusable (R), and non-detects as unusable (R).
b. If the ICV or CCV %R falls within the range of 75-89%, qualify detects as estimated low (J-) and non-detects as estimated (UJ).
c. If the ICV or CCV %R falls within the range of 90-110%, detects and non-detects should not be qualified.
d. If the ICV or CCV %R falls within the range of 111-125%, qualify detects as estimated high (J+). Non-detects should not be qualified.
e. If the ICV or CCV %R is > 125%, use professional judgment to qualify detects as estimated high (J+) or unusable (R). Non-detects should not be qualified.
4. If the laboratory failed to provide adequate calibration information, notify the EPA Regional CLP COR. The EPA Regional CLP COR may contact the laboratory to request the necessary information. If the information is unavailable, use professional judgment to assess the data.
5. Annotate the potential effects on the reported data due to exceeding the calibration criteria in the Data Review Narrative.
6. If calibration criteria are grossly exceeded, note this for EPA Regional CLP COR action.
NOTE: For truly critical samples, a further in-depth evaluation of the calibration curve may be warranted to determine if additional qualification is necessary.
Table 4. Calibration Actions for ICP-AES Analysis
Criteria Action
Detect Non-detect
Calibration not performed R R
Calibration incomplete Use professional
judgment J or R
Use professional judgment UJ or R
Correlation coefficient < 0.995 or %D outside ±30% J UJ
ICV/CCV %R < 75% Use professional
judgment J- or R
Use professional judgment
R
ICV/CCV %R 75-89% J- UJ
ICV/CCV %R 90-110% No qualification No qualification
ICV/CCV %R 111-125% J+ No qualification
ICV/CCV %R > 125% Use professional
judgment J+ or R
No qualification

Inorganic Data Review ICP-AES
January 2017 20
III. Blanks
A. Review Items
Form 1-IN, Form 3-IN, Form 12-IN, preparation logs, calibration standard logs, instrument logs, and raw data. (SOW ISM02.4 – Exhibit B, Section 3.4 and Exhibit D/ICP-AES, Sections 7.3, 9.6, and 12.1)
B. Objective
The objective is to determine the validity of the analytical results based on the blank responses by determining the existence and magnitude of contamination resulting from laboratory (or field) activities or baseline drift during analysis.
C. Criteria
1. No contaminants should be found in the blank(s).
2. The Initial Calibration Blank (ICB) shall be analyzed at each mass used for analysis after the analytical standards, but not before analysis of the ICV during the initial calibration of the instrument (see Section II.C.1).
3. A Continuing Calibration Blank (CCB) shall be analyzed at each wavelength used for the analysis, immediately after every CCV. The CCB shall be analyzed at a frequency of every two hours during the analytical sequence. The CCB shall be analyzed at the beginning of the analytical sequence, and again after the last CCV that was analyzed after the last analytical sample of the analytical sequence. The CCB result (absolute value) shall not exceed the CRQL of each analyte for which analysis is performed.
4. At least one Preparation Blank shall be prepared and analyzed for each matrix, with every SDG, or with each batch of samples digested, whichever is more frequent. The Preparation Blank consists of reagent water or a clean wipe processed through the appropriate sample preparation and analysis procedure.
5. If the concentration of any analyte in the Preparation Blank is > CRQL, the lowest concentration of that analyte in the associated samples must be ≥ 10x the Preparation Blank concentration. Otherwise, all associated samples with the analyte’s concentration < 10x the Preparation Blank concentration, and > CRQL, should be redigested and reanalyzed for that analyte. The laboratory is not to correct the sample concentration for the blank value.
6. If the concentration of any analyte in the Preparation Blank is < (-CRQL), all associated samples with the analyte’s concentration < 10x the CRQL should be redigested and reanalyzed.
7. At least one Leachate Extraction Blank (LEB) shall be prepared and analyzed for each batch of samples extracted by TCLP or SPLP. The LEB consists of reagent water processed through the extraction procedure. Post-extraction, the LEB shall be processed through the appropriate sample preparation and analysis procedure.
D. Evaluation
1. Verify that an ICB was analyzed after the calibration; the CCB was analyzed at the specified frequency and sequence during the analysis; and Preparation Blanks and LEBs were prepared and analyzed as appropriate for the SDG (e.g., total number of samples, various types of matrices present, number of digestion batches, etc.).
2. Review the results reported on Form 3-IN, as well as the raw data for all blanks, and verify that the results were accurately reported.
3. Evaluate all of the associated blanks for the presence of target analytes. Verify that if the concentration of any target analyte was > CRQL in a Preparation Blank, all associated samples with the analyte’s concentration > CRQL but < 10x the Preparation Blank concentration were redigested and reanalyzed for that analyte. Verify that if a concentration was < (-CRQL) in a

Inorganic Data Review ICP-AES
January 2017 21
Preparation Blank, all associated samples with the analyte’s concentration < 10x CRQL were redigested and reanalyzed. Verify that if the absolute value of any target analytes was > CRQL in an ICB or a CCB, the analysis was terminated, the problem corrected and documented in the SDG Narrative, the instrument recalibrated, and the preceding 10 analytical samples or all analytical samples analyzed since the last compliant calibration blank reanalyzed.
E. Action
NOTES: For ICBs that do not meet the technical criteria, apply the action to all associated samples reported from the analytical sequence.
For CCBs that do not meet the technical criteria, apply the action to all associated samples analyzed between a previous technically acceptable analysis of the CCB and a subsequent technically acceptable analysis of the CCB in the analytical sequence.
For Preparation Blanks that do not meet the technical criteria, apply the action to all associated samples prepared in the same preparation batch. For LEBs that do not meet the technical criteria, apply the action to all associated samples extracted in the same extraction batch.
1. If the appropriate blanks were not analyzed with the specified frequency, use professional judgment to determine if the associated sample data should be qualified. Obtain additional information from the laboratory, if necessary. Record the situation in the Data Review Narrative, and note it for EPA Regional CLP COR action.
2. Action regarding unsuitable blank results depends on the circumstances and origin of the blank. In instances where more than one blank is associated with a given sample, qualification should be based upon a comparison with the associated blank having the highest concentration of contaminant.
3. Some general “technical” review actions include:
a. For any blank (including Preparation Blanks and LEBs) reported with detects ≤ CRQLs, report sample detects ≤ CRQLs at the CRQLs and qualify as non-detect (U). For any blank (including Preparation Blanks and LEBs) reported with detects ≤ CRQLs, use professional judgment to qualify the sample results > CRQLs. Non-detects should not be qualified.
b. For any blank (including Preparation Blanks and LEBs) reported with a negative result ≤ (-MDL) but ≥ (-CRQL), carefully evaluate and determine its effect on the sample data. Use professional judgment to assess the data.
c. The blank analyses may not involve the same weights, volumes, or dilution factors as the associated samples. In particular, soil/sediment sample results reported on Form 1-IN will not be on the same basis (units, dilution) as the calibration blank data reported on Form 3-IN. It may be easier to work with the raw data and/or convert the ICB or CCB results to the same units as the soil/sediment samples for comparison purposes.
4. Specific “method” actions include:
a. If an ICB or a CCB result is > CRQL, the analysis should be terminated. If the analysis was not terminated and the associated samples were not reanalyzed, non-detects should not be qualified. Report detects ≤ CRQLs at the CRQLs and qualify as non-detect (U). Report sample results that are > CRQLs but < ICB/CCB results at ICB/CCB results and use professional judgment to qualify as non-detect (U) or unusable (R). Use professional judgment to qualify sample results ≥ ICB/CCB results. Record the situation in the Data Review Narrative, and note it for EPA Regional CLP COR action.
Inorganic Data Review ICP-AES
January 2017 22
b. If an ICB or a CCB result is < (-CRQL), the analysis should be terminated. If the analysis was not terminated and the associated samples were not reanalyzed, use professional judgment to qualify non-detects as estimated (UJ) or unusable (R). Use professional judgment to qualify detects ≤ CRQL, or qualify as estimated low (J-). Use professional judgment to qualify sample results that are > CRQLs as estimated low (J-).
c. If the concentration of any analyte in the Preparation Blank/LEB is > CRQL, the lowest concentration of that analyte in the associated samples must be ≥ 10x the Preparation Blank/LEB concentration. All samples associated with the Preparation Blank with concentrations < 10x the Preparation Blank concentration and > CRQL should have been redigested and reanalyzed. If the associated samples were not redigested and reanalyzed, report the sample results at Preparation Blank results; use professional judgment to qualify the results as estimated high (J+) or unusable (R). Report results < 10x the LEB concentration and > CRQL in the samples associated with the LEB at LEB results; use professional judgment to qualify the results as estimated high (J+) or unusable (R). Report detects ≤ CRQLs in the samples associated with the Preparation Blank/LEB at CRQLs and qualify as non-detect (U). Non-detects and sample results that are ≥ 10x the Preparation Blank/LEB results should not be qualified. If the laboratory failed to redigest and reanalyze the samples associated with the Preparation Blank, record it in the Data Review Narrative, and note it for EPA Regional CLP COR action.
d. For any Preparation Blank or LEB reported with a negative result < (-CRQL), use professional judgment to qualify detects ≤ CRQL, or qualify as estimated low (J-). Qualify sample results that are ≥ CRQLs but < 10x CRQLs as estimated low (J-), and qualify non-detects as estimated (UJ). Sample results that are ≥ 10x CRQLs should not be qualified.
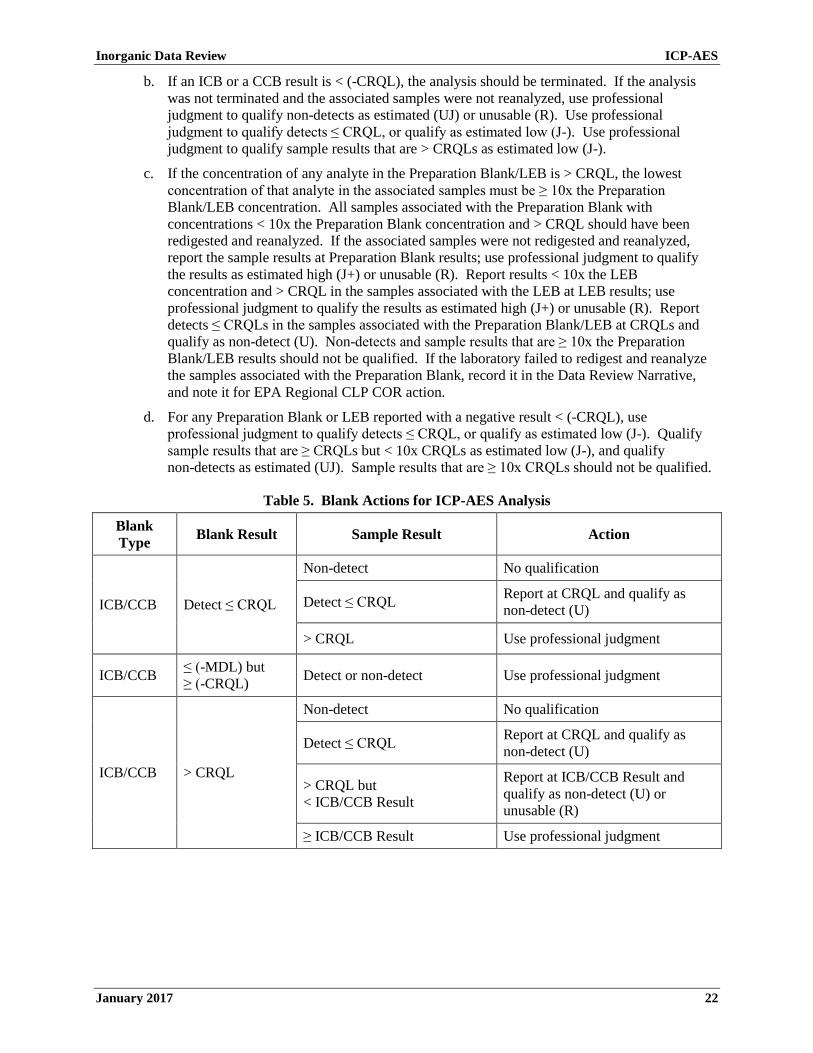
Table 5. Blank Actions for ICP-AES Analysis
Blank Type Blank Result Sample Result Action
ICB/CCB Detect ≤ CRQL
Non-detect No qualification
Detect ≤ CRQL Report at CRQL and qualify as non-detect (U)
> CRQL Use professional judgment
ICB/CCB ≤ (-MDL) but ≥ (-CRQL) Detect or non-detect Use professional judgment
ICB/CCB > CRQL
Non-detect No qualification
Detect ≤ CRQL Report at CRQL and qualify as non-detect (U)
> CRQL but < ICB/CCB Result
Report at ICB/CCB Result and qualify as non-detect (U) or unusable (R)
≥ ICB/CCB Result Use professional judgment
Inorganic Data Review ICP-AES
January 2017 23
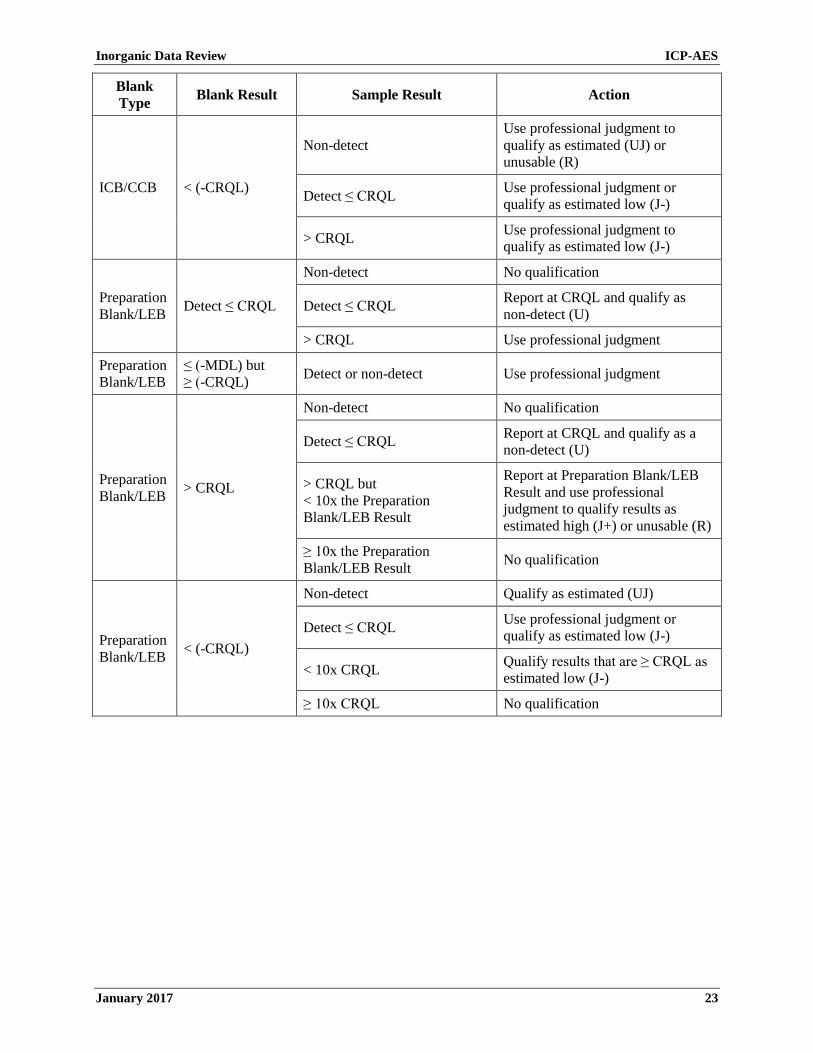
Blank Type Blank Result Sample Result Action
ICB/CCB < (-CRQL)
Non-detect Use professional judgment to qualify as estimated (UJ) or unusable (R)
Detect ≤ CRQL Use professional judgment or qualify as estimated low (J-)
> CRQL Use professional judgment to qualify as estimated low (J-)
Preparation Blank/LEB Detect ≤ CRQL
Non-detect No qualification
Detect ≤ CRQL Report at CRQL and qualify as non-detect (U)
> CRQL Use professional judgment
Preparation Blank/LEB
≤ (-MDL) but ≥ (-CRQL) Detect or non-detect Use professional judgment
Preparation Blank/LEB > CRQL
Non-detect No qualification
Detect ≤ CRQL Report at CRQL and qualify as a non-detect (U)
> CRQL but < 10x the Preparation Blank/LEB Result
Report at Preparation Blank/LEB Result and use professional judgment to qualify results as estimated high (J+) or unusable (R)
≥ 10x the Preparation Blank/LEB Result No qualification
Preparation Blank/LEB < (-CRQL)
Non-detect Qualify as estimated (UJ)
Detect ≤ CRQL Use professional judgment or qualify as estimated low (J-)
< 10x CRQL Qualify results that are ≥ CRQL as estimated low (J-)
≥ 10x CRQL No qualification
Inorganic Data Review ICP-AES
January 2017 24
IV. Interference Check Sample
A. Review Items
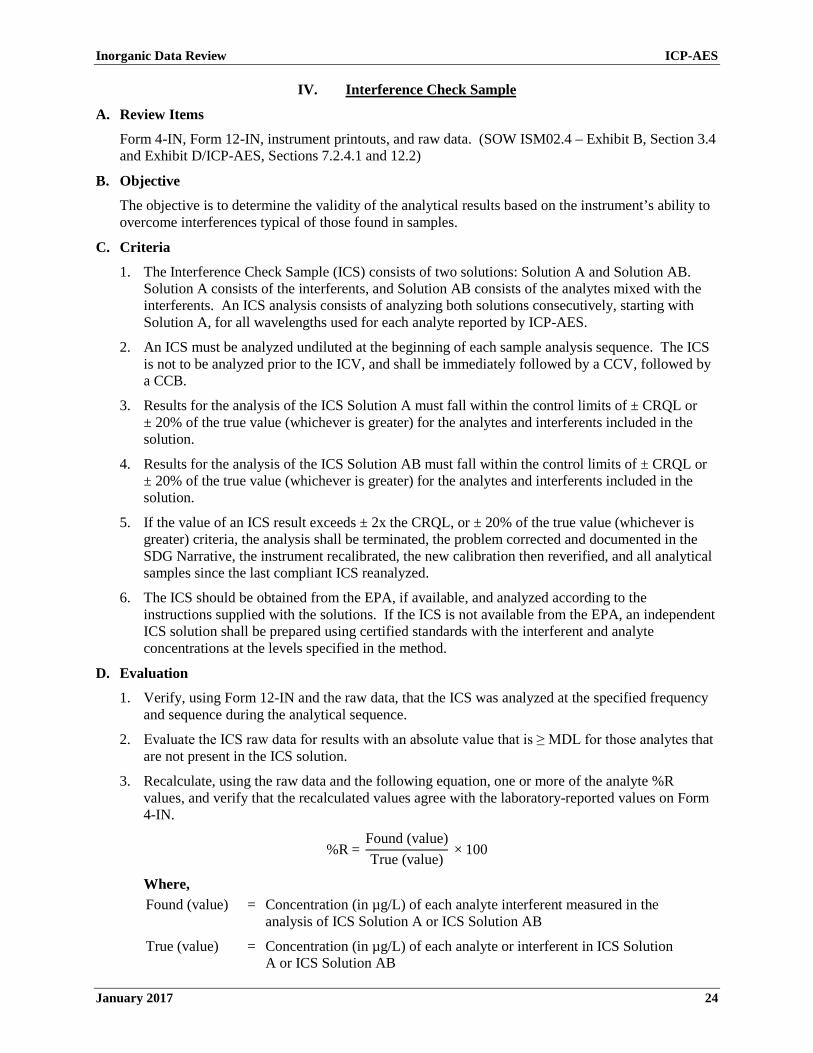
Form 4-IN, Form 12-IN, instrument printouts, and raw data. (SOW ISM02.4 – Exhibit B, Section 3.4 and Exhibit D/ICP-AES, Sections 7.2.4.1 and 12.2)
B. Objective
The objective is to determine the validity of the analytical results based on the instrument’s ability to overcome interferences typical of those found in samples.
C. Criteria
1. The Interference Check Sample (ICS) consists of two solutions: Solution A and Solution AB. Solution A consists of the interferents, and Solution AB consists of the analytes mixed with the interferents. An ICS analysis consists of analyzing both solutions consecutively, starting with Solution A, for all wavelengths used for each analyte reported by ICP-AES.
2. An ICS must be analyzed undiluted at the beginning of each sample analysis sequence. The ICS is not to be analyzed prior to the ICV, and shall be immediately followed by a CCV, followed by a CCB.
3. Results for the analysis of the ICS Solution A must fall within the control limits of ± CRQL or ± 20% of the true value (whichever is greater) for the analytes and interferents included in the solution.
4. Results for the analysis of the ICS Solution AB must fall within the control limits of ± CRQL or ± 20% of the true value (whichever is greater) for the analytes and interferents included in the solution.
5. If the value of an ICS result exceeds ± 2x the CRQL, or ± 20% of the true value (whichever is greater) criteria, the analysis shall be terminated, the problem corrected and documented in the SDG Narrative, the instrument recalibrated, the new calibration then reverified, and all analytical samples since the last compliant ICS reanalyzed.
6. The ICS should be obtained from the EPA, if available, and analyzed according to the instructions supplied with the solutions. If the ICS is not available from the EPA, an independent ICS solution shall be prepared using certified standards with the interferent and analyte concentrations at the levels specified in the method.
D. Evaluation
1. Verify, using Form 12-IN and the raw data, that the ICS was analyzed at the specified frequency and sequence during the analytical sequence.
2. Evaluate the ICS raw data for results with an absolute value that is ≥ MDL for those analytes that are not present in the ICS solution.
3. Recalculate, using the raw data and the following equation, one or more of the analyte %R values, and verify that the recalculated values agree with the laboratory-reported values on Form 4-IN.
%R = Found (value)True (value)
× 100
Where, Found (value) = Concentration (in µg/L) of each analyte interferent measured in the
analysis of ICS Solution A or ICS Solution AB
True (value) = Concentration (in µg/L) of each analyte or interferent in ICS Solution A or ICS Solution AB
Inorganic Data Review ICP-AES
January 2017 25
4. If the value of an ICS result exceeds the ± CRQL or ± 20% of the true value (whichever is greater) criteria, and the laboratory failed to terminate the analysis and take the appropriate corrective action, note this for EPA Regional CLP COR action and record the situation in the Data Review Narrative. Use professional judgment to assess the data.
E. Action
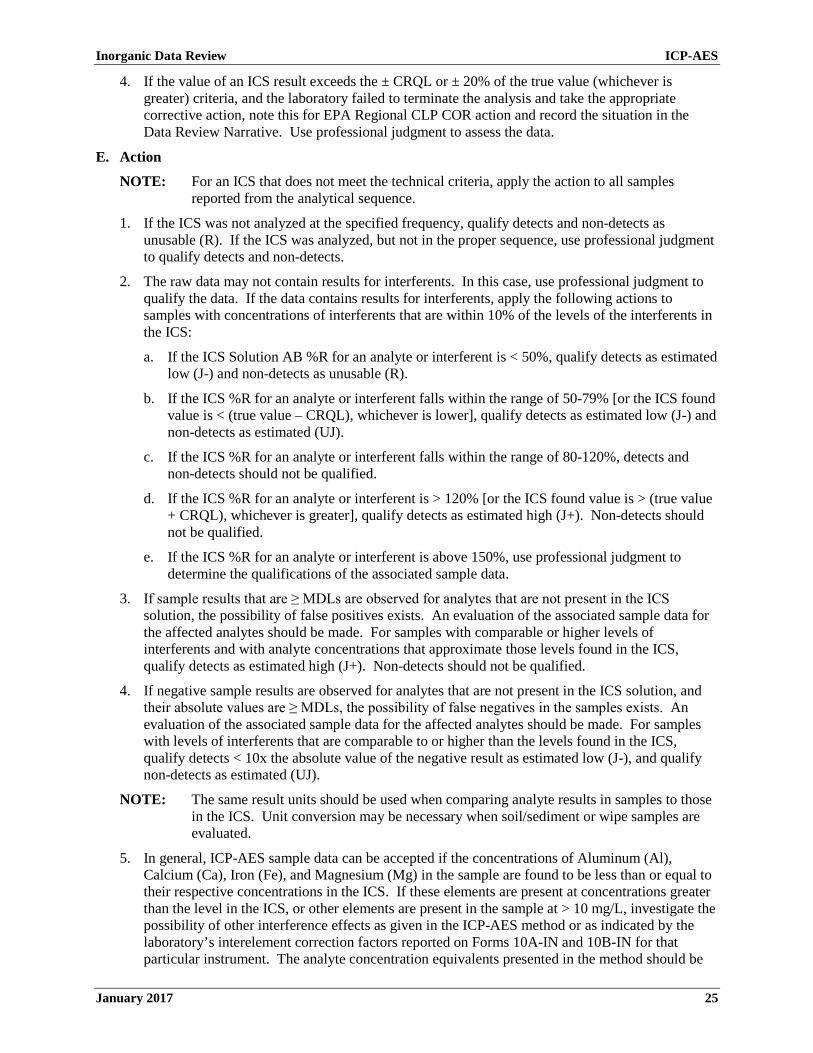
NOTE: For an ICS that does not meet the technical criteria, apply the action to all samples reported from the analytical sequence.
1. If the ICS was not analyzed at the specified frequency, qualify detects and non-detects as unusable (R). If the ICS was analyzed, but not in the proper sequence, use professional judgment to qualify detects and non-detects.
2. The raw data may not contain results for interferents. In this case, use professional judgment to qualify the data. If the data contains results for interferents, apply the following actions to samples with concentrations of interferents that are within 10% of the levels of the interferents in the ICS:
a. If the ICS Solution AB %R for an analyte or interferent is < 50%, qualify detects as estimated low (J-) and non-detects as unusable (R).
b. If the ICS %R for an analyte or interferent falls within the range of 50-79% [or the ICS found value is < (true value – CRQL), whichever is lower], qualify detects as estimated low (J-) and non-detects as estimated (UJ).
c. If the ICS %R for an analyte or interferent falls within the range of 80-120%, detects and non-detects should not be qualified.
d. If the ICS %R for an analyte or interferent is > 120% [or the ICS found value is > (true value + CRQL), whichever is greater], qualify detects as estimated high (J+). Non-detects should not be qualified.
e. If the ICS %R for an analyte or interferent is above 150%, use professional judgment to determine the qualifications of the associated sample data.
3. If sample results that are ≥ MDLs are observed for analytes that are not present in the ICS solution, the possibility of false positives exists. An evaluation of the associated sample data for the affected analytes should be made. For samples with comparable or higher levels of interferents and with analyte concentrations that approximate those levels found in the ICS, qualify detects as estimated high (J+). Non-detects should not be qualified.
4. If negative sample results are observed for analytes that are not present in the ICS solution, and their absolute values are ≥ MDLs, the possibility of false negatives in the samples exists. An evaluation of the associated sample data for the affected analytes should be made. For samples with levels of interferents that are comparable to or higher than the levels found in the ICS, qualify detects < 10x the absolute value of the negative result as estimated low (J-), and qualify non-detects as estimated (UJ).
NOTE: The same result units should be used when comparing analyte results in samples to those in the ICS. Unit conversion may be necessary when soil/sediment or wipe samples are evaluated.
5. In general, ICP-AES sample data can be accepted if the concentrations of Aluminum (Al), Calcium (Ca), Iron (Fe), and Magnesium (Mg) in the sample are found to be less than or equal to their respective concentrations in the ICS. If these elements are present at concentrations greater than the level in the ICS, or other elements are present in the sample at > 10 mg/L, investigate the possibility of other interference effects as given in the ICP-AES method or as indicated by the laboratory’s interelement correction factors reported on Forms 10A-IN and 10B-IN for that particular instrument. The analyte concentration equivalents presented in the method should be

Inorganic Data Review ICP-AES
January 2017 26
considered only as estimated values since the exact value of any analytical system is instrument-specific. Therefore, estimate the concentration produced by an interfering element. If the estimate is > 2x the CRQL, and also > 10% of the reported concentration of the affected element, qualify the affected results as estimated (J).
6. If the raw data does not contain results for the interferents, annotate this in the Data Review Narrative.
7. Actions regarding the interpretation and/or the subsequent qualification of ICP data due to the ICS analytical results can be extremely complex. Use professional judgment to determine the need for the associated sample data to be qualified. Obtain additional information from the laboratory, if necessary. Record all interpretive situations in the Data Review Narrative.
8. If the ICS acceptance criteria are grossly exceeded, note the specifics for EPA Regional CLP COR action.
Table 6. Interference Check Actions for ICP-AES Analysis
Criteria Action
Detect Non-detect
ICS not analyzed R R
ICS not analyzed in the proper sequence Use professional judgment
Use professional judgment
ICSAB %R < 50% J- R
ICS %R 50-79% [or ICS found value value – CRQL), whichever is lower]
is < (true J- UJ
ICS %R 80-120% No qualification No qualification
ICS %R > 120% [or ICS found value is > value + CRQL), whichever is greater]
(true J+ No qualification
ICS %R > 150% Use professional judgment
Use professional judgment
Sample results ≥ MDLs, but not present in ICS J+ No qualification
Negative sample results, but not present in ICS
J- for results < 10x (|negative sample
result|)
UJ
Inorganic Data Review ICP-AES
January 2017 27
V. Laboratory Control Sample
A. Review Items
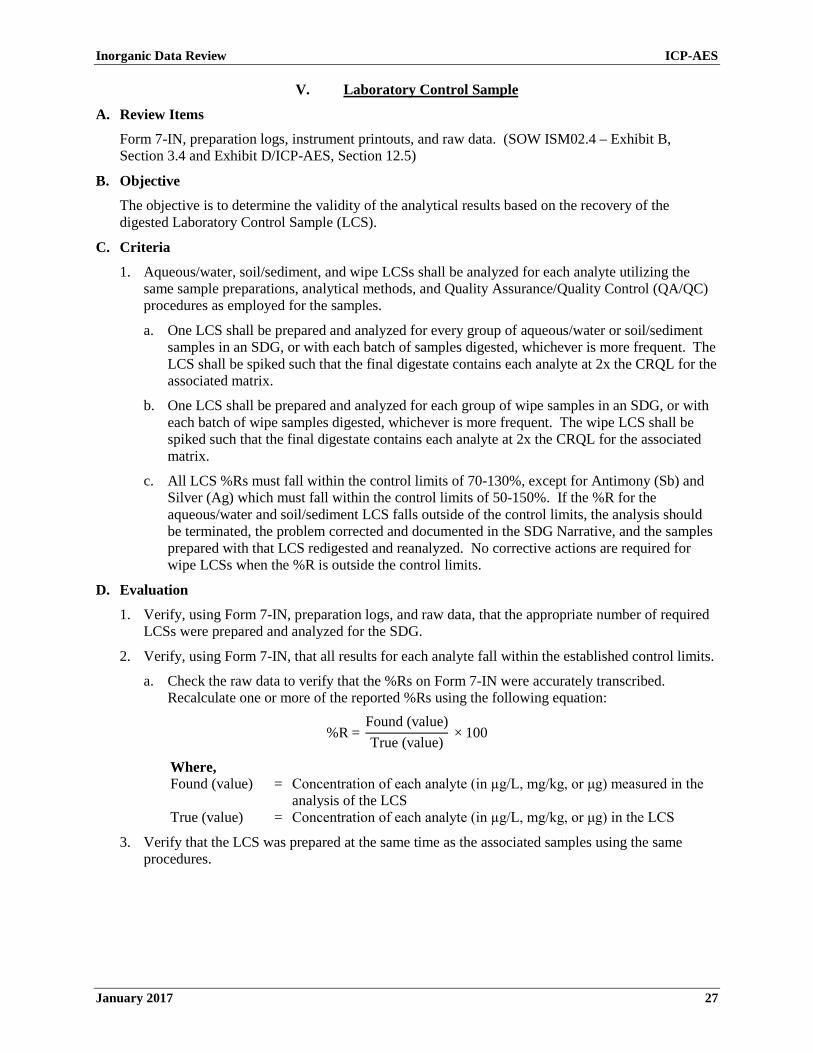
Form 7-IN, preparation logs, instrument printouts, and raw data. (SOW ISM02.4 – Exhibit B, Section 3.4 and Exhibit D/ICP-AES, Section 12.5)
B. Objective
The objective is to determine the validity of the analytical results based on the recovery of the digested Laboratory Control Sample (LCS).
C. Criteria
1. Aqueous/water, soil/sediment, and wipe LCSs shall be analyzed for each analyte utilizing the same sample preparations, analytical methods, and Quality Assurance/Quality Control (QA/QC) procedures as employed for the samples.
a. One LCS shall be prepared and analyzed for every group of aqueous/water or soil/sediment samples in an SDG, or with each batch of samples digested, whichever is more frequent. The LCS shall be spiked such that the final digestate contains each analyte at 2x the CRQL for the associated matrix.
b. One LCS shall be prepared and analyzed for each group of wipe samples in an SDG, or with each batch of wipe samples digested, whichever is more frequent. The wipe LCS shall be spiked such that the final digestate contains each analyte at 2x the CRQL for the associated matrix.
c. All LCS %Rs must fall within the control limits of 70-130%, except for Antimony (Sb) and Silver (Ag) which must fall within the control limits of 50-150%. If the %R for the aqueous/water and soil/sediment LCS falls outside of the control limits, the analysis should be terminated, the problem corrected and documented in the SDG Narrative, and the samples prepared with that LCS redigested and reanalyzed. No corrective actions are required for wipe LCSs when the %R is outside the control limits.
D. Evaluation
1. Verify, using Form 7-IN, preparation logs, and raw data, that the appropriate number of required LCSs were prepared and analyzed for the SDG.
2. Verify, using Form 7-IN, that all results for each analyte fall within the established control limits.
a. Check the raw data to verify that the %Rs on Form 7-IN were accurately transcribed. Recalculate one or more of the reported %Rs using the following equation:
%R = Found (value)True (value)
× 100
Where, Found (value) = Concentration of each analyte (in µg/L, mg/kg, or μg) measured in the
analysis of the LCS True (value) = Concentration of each analyte (in µg/L, mg/kg, or μg) in the LCS
3. Verify that the LCS was prepared at the same time as the associated samples using the same procedures.

Inorganic Data Review ICP-AES
January 2017 28
E. Action
NOTE: If the LCS criteria are not met, the laboratory performance and method accuracy are in question. Use professional judgment to determine if the data should be qualified or rejected. The following guidance is suggested for qualifying sample data associated with an LCS that does not meet the required criteria.
For an LCS that does not meet the technical criteria, apply the action to all samples in the same preparation batch.
1. If the required LCS was not analyzed at the specified frequency, use professional judgment to determine if the associated sample results should be qualified. Obtain additional information from the laboratory, if necessary. If a laboratory fails to analyze an LCS with each SDG, or if a laboratory consistently fails to generate acceptable LCS recoveries, record the situation in the Data Review Narrative, and note it for EPA Regional CLP COR action. Detects should be qualified as estimated (J) and non-detects as estimated (UJ).
2. Aqueous/Water and Soil/Sediment LCS:
a. If the LCS %R is < 40% (< 20% for Ag and Sb), qualify detects as estimated low (J-) and non-detects as unusable (R).
b. If the LCS %R falls within the range of 40-69% (20-49% for Ag and Sb), qualify detects as estimated low (J-) and non-detects as estimated (UJ).
c. If the LCS %R falls within the range of 70-130%, detects and non-detects should not be qualified.
d. If the LCS %R is > 130% (150% for Ag and Sb), qualify detects as estimated high (J+). Non-detects should not be qualified.
e. If the LCS %R is > 150% (170% for Ag and Sb), qualify detects as unusable (R). Non-detects should not be qualified.
3. Wipe LCS:
a. If the LCS %R is < 40%, qualify detects as estimated low (J-) and non-detects as unusable (R).
b. If the LCS %R falls within the range of 40-69%, qualify detects as estimated low (J-) and non-detects as estimated (UJ).
c. If the LCS %R falls within the range of 70-130%, detects and non-detects should not be qualified.
d. If the LCS %R is > 130%, qualify detects as estimated high (J+). Non-detects should not be qualified.
4. Annotate the potential effects on the data due to out-of-control LCS results in the Data Review Narrative.
Inorganic Data Review ICP-AES
January 2017 29
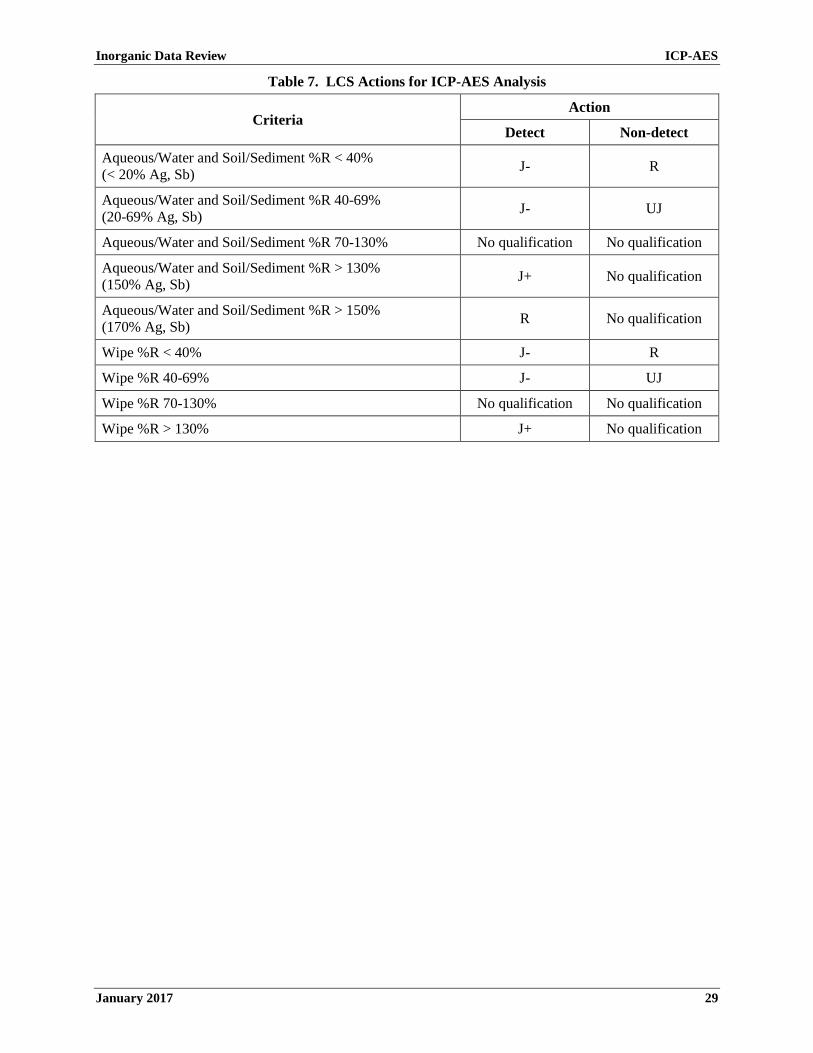
Table 7. LCS Actions for ICP-AES Analysis
Criteria Action
Detect Non-detect
Aqueous/Water and Soil/Sediment %R < (< 20% Ag, Sb)
40% J- R
Aqueous/Water and Soil/Sediment %R 40-69% (20-69% Ag, Sb) J- UJ
Aqueous/Water and Soil/Sediment %R 70-130% No qualification No qualification
Aqueous/Water and Soil/Sediment %R > (150% Ag, Sb)
130% J+ No qualification
Aqueous/Water and Soil/Sediment %R > (170% Ag, Sb)
150% R No qualification
Wipe %R < 40% J- R
Wipe %R 40-69% J- UJ
Wipe %R 70-130% No qualification No qualification
Wipe %R > 130% J+ No qualification
Inorganic Data Review ICP-AES
January 2017 30
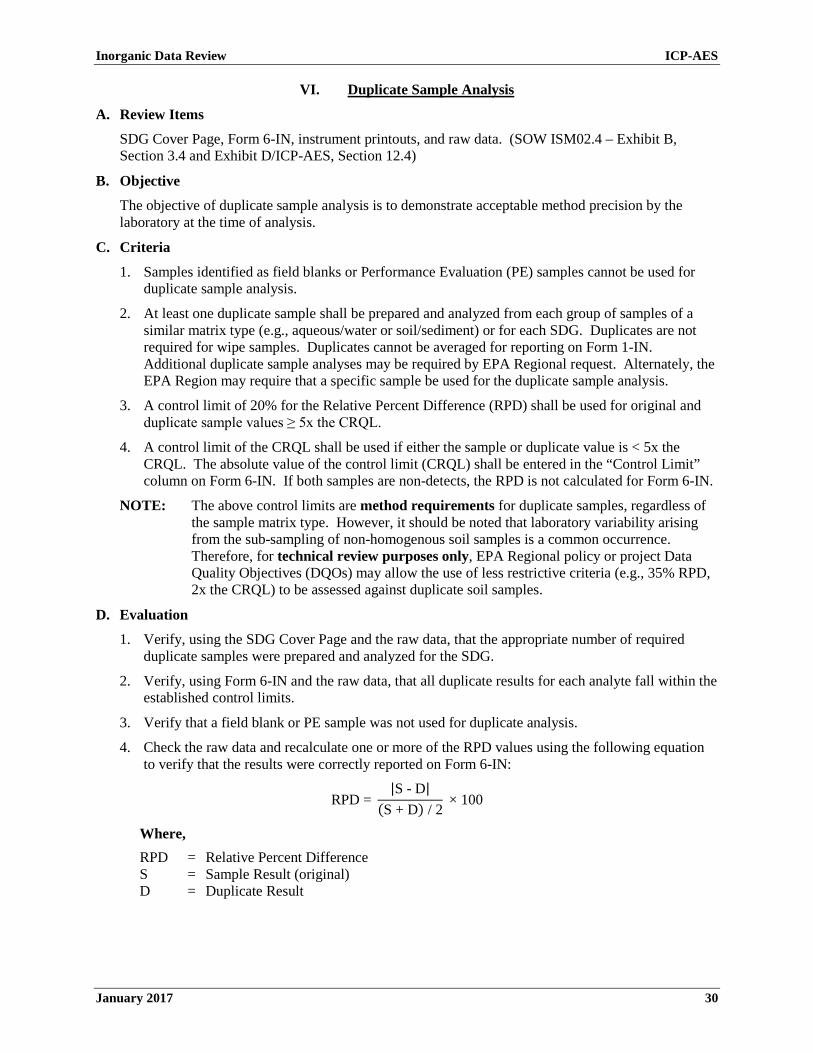
VI. Duplicate Sample Analysis
A. Review Items
SDG Cover Page, Form 6-IN, instrument printouts, and raw data. (SOW ISM02.4 – Exhibit B, Section 3.4 and Exhibit D/ICP-AES, Section 12.4)
B. Objective
The objective of duplicate sample analysis is to demonstrate acceptable method precision by the laboratory at the time of analysis.
C. Criteria
1. Samples identified as field blanks or Performance Evaluation (PE) samples cannot be used for duplicate sample analysis.
2. At least one duplicate sample shall be prepared and analyzed from each group of samples of a similar matrix type (e.g., aqueous/water or soil/sediment) or for each SDG. Duplicates are not required for wipe samples. Duplicates cannot be averaged for reporting on Form 1-IN. Additional duplicate sample analyses may be required by EPA Regional request. Alternately, the EPA Region may require that a specific sample be used for the duplicate sample analysis.
3. A control limit of 20% for the Relative Percent Difference (RPD) shall be used for original and duplicate sample values ≥ 5x the CRQL.
4. A control limit of the CRQL shall be used if either the sample or duplicate value is < 5x the CRQL. The absolute value of the control limit (CRQL) shall be entered in the “Control Limit” column on Form 6-IN. If both samples are non-detects, the RPD is not calculated for Form 6-IN.
NOTE: The above control limits are method requirements for duplicate samples, regardless of the sample matrix type. However, it should be noted that laboratory variability arising from the sub-sampling of non-homogenous soil samples is a common occurrence. Therefore, for technical review purposes only, EPA Regional policy or project Data Quality Objectives (DQOs) may allow the use of less restrictive criteria (e.g., 35% RPD, 2x the CRQL) to be assessed against duplicate soil samples.
D. Evaluation
1. Verify, using the SDG Cover Page and the raw data, that the appropriate number of required duplicate samples were prepared and analyzed for the SDG.
2. Verify, using Form 6-IN and the raw data, that all duplicate results for each analyte fall within the established control limits.
3. Verify that a field blank or PE sample was not used for duplicate analysis.
4. Check the raw data and recalculate one or more of the RPD values using the following equation to verify that the results were correctly reported on Form 6-IN:
RPD = |S - D|
(S + D) / 2 × 100
Where, RPD = Relative Percent Difference S = Sample Result (original) D = Duplicate Result

Inorganic Data Review ICP-AES
January 2017 31
E. Action
NOTE: For a duplicate sample analysis that does not meet the technical criteria, apply the action to all samples of the same matrix if the samples are considered sufficiently similar. Exercise professional judgment in determining sample similarity when making use of all available data, including: site and sampling documentation (e.g., location and type of sample, descriptive data, soil classification); field test data (e.g., pH, Eh, conductivity, chlorine); and laboratory data for other parameters [e.g., Total Suspended Solids (TSS), Total Dissolved Solids (TDS), Total Organic Carbon (TOC), alkalinity or buffering capacity, reactive sulfide, anions]. Additionally, use the sample data (e.g., similar concentrations of analytes) in determining similarity between samples in the SDG. Two possible determinations are: 1) only some of the samples in the SDG are similar to the duplicate sample, and that only these samples should be qualified; or 2) no samples are sufficiently similar to the sample used for the duplicate, and thus only the field sample used to prepare the duplicate sample should be qualified.
1. If the appropriate number of duplicate samples were not analyzed for each matrix using the correct frequency, use professional judgment to determine if the associated sample data should be qualified. Obtain additional information from the laboratory, if necessary. Record the situation in the Data Review Narrative, and note it for EPA Regional CLP COR action. Detects should be qualified as estimated (J) and non-detects as estimated (UJ) if any of the frequency criteria is not met.
2. If both original sample and duplicate sample results are ≥ 5x the CRQL and the RPD is > 20%, qualify detects as estimated (J) and non-detects as estimated (UJ).
3. If the RPD is > 100%, use professional judgment to determine if the associated sample data should be qualified.
4. If both original sample and duplicate sample results are ≥ 5x the CRQL and the RPD is ≤ 20%, detects and non-detects should not be qualified.
5. If the original sample or duplicate sample result is < 5x the CRQL (including non-detects) and the absolute difference between sample and duplicate is > CRQL, qualify detects as estimated (J) and non-detects as estimated (UJ).
6. If the original sample or duplicate sample result is < 5x the CRQL (including non-detects) and the absolute difference between sample and duplicate is ≤ CRQL, detects and non-detects should not be qualified.
7. If a field blank or PE sample was used for the duplicate sample analysis, note this for EPA Regional CLP COR action. All of the other QC data must then be carefully checked. Use professional judgment when evaluating the data.
8. Annotate the potential effects on the data due to out-of-control duplicate sample results in the Data Review Narrative.
Inorganic Data Review ICP-AES
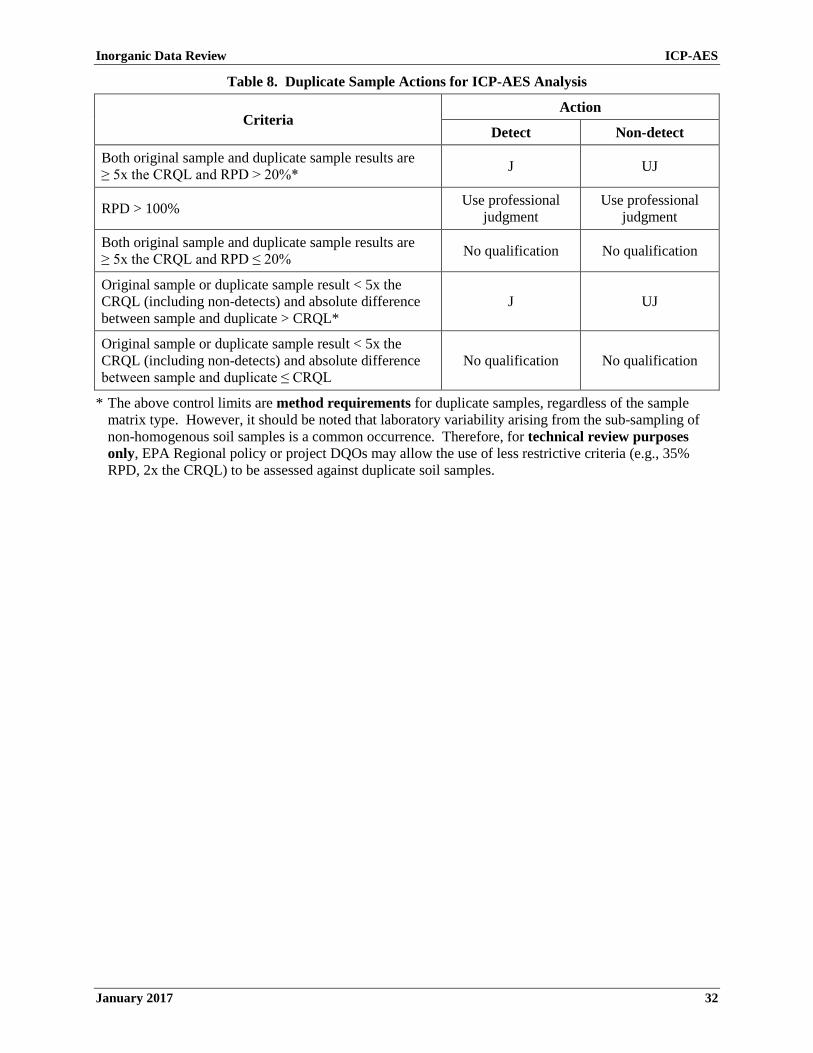
January 2017 32
Table 8. Duplicate Sample Actions for ICP-AES Analysis
Criteria Action
Detect Non-detect
Both original sample and duplicate sample results are ≥ 5x the CRQL and RPD > 20%* J UJ
RPD > 100% Use professional judgment
Use professional judgment
Both original sample and duplicate sample results are ≥ 5x the CRQL and RPD ≤ 20% No qualification No qualification
Original sample or duplicate sample result < 5x the CRQL (including non-detects) and absolute difference between sample and duplicate > CRQL*
J UJ
Original sample or duplicate sample result < 5x the CRQL (including non-detects) and absolute difference between sample and duplicate ≤ CRQL
No qualification No qualification
* The above control limits are method requirements for duplicate samples, regardless of the sample matrix type. However, it should be noted that laboratory variability arising from the sub-sampling of non-homogenous soil samples is a common occurrence. Therefore, for technical review purposes only, EPA Regional policy or project DQOs may allow the use of less restrictive criteria (e.g., 35% RPD, 2x the CRQL) to be assessed against duplicate soil samples.

Inorganic Data Review ICP-AES
January 2017 33
VII. Spike Sample Analysis
A. Review Items
SDG Cover Page, Form 5A-IN, Form 5B-IN, instrument printouts, and raw data. (SOW ISM02.4 – Exhibit B, Section 3.4 and Exhibit D/ICP-AES, Section 12.3)
B. Objective
The objective of the spiked sample analysis is to evaluate the effect of each sample matrix on the sample preparation procedures and the measurement methodology.
C. Criteria
1. Samples identified as field blanks or PE samples cannot be used for spiked sample analysis.
2. At least one spiked sample (pre-digestion) shall be prepared and analyzed from each group of samples with a similar matrix type (e.g., aqueous/water or soil/sediment), or for each SDG. Matrix Spikes are not required for wipe samples.
3. When the Matrix Spike recovery falls outside of the control limits and the sample result is < 4x the spike added, a post-digestion spike shall be performed for those analytes that do not meet the specified criteria. An aliquot of the remaining unspiked sample shall be spiked at 2x the indigenous level or 2x the CRQL, whichever is greater.
NOTE: Post-digestion spikes are not required for Ag.
4. The spike %R shall be within the established acceptance limits. However, spike recovery limits do not apply when the sample concentration is ≥ 4x the spike added. In such an event, the data shall be reported unflagged, even if the %R does not meet the acceptance criteria.
5. If the spiked sample analysis was performed on the same sample that was chosen for the duplicate sample analysis, spike calculations shall be performed using the results of the sample designated as the “original sample”. The average of the duplicate results cannot be used for the purpose of determining the %R.
NOTE: The final spike concentrations required for the various target analytes are presented in the methods described in the SOW.
D. Evaluation
1. Verify, using the SDG Cover Page, Form 5A-IN, and raw data, that the appropriate number of required spiked samples was prepared and analyzed for the SDG.
2. Verify that a field blank or PE sample was not used for the spiked sample analysis.
3. Verify, using Form 5A-IN and the raw data, that all pre-digestion spiked sample results for each required analyte fall within the established control limits. If not, verify that a post-digestion spike was prepared and analyzed.
4. Recalculate, using the raw data, one or more of the %R values using the following equation, and verify that the recalculated values agree with the laboratory-reported values on Forms 5A-IN and 5B-IN:
%Recovery = SSR-SR
SA × 100
Where, SSR = Spiked Sample Result SR = Sample Result SA = Spike Added

Inorganic Data Review ICP-AES
January 2017 34
NOTE: When the sample result is < MDL or reported as a non-detect, use SR = 0 only for the purpose of calculating the %R. The actual spiked sample results, sample results, and %R (positive or negative) shall still be reported on Forms 5A-IN and 5B-IN.
E. Action
NOTE: For a Matrix Spike that does not meet the technical criteria, apply the action to all samples of the same matrix if the samples are considered sufficiently similar. Exercise professional judgment in determining sample similarity when making use of all available data, including: site and sampling documentation (e.g., location and type of sample, descriptive data, soil classification); field test data (e.g., pH, Eh, conductivity, chlorine); and laboratory data for other parameters (e.g., TSS, TDS, TOC, alkalinity or buffering capacity, reactive sulfide, anions). Additionally, use the sample data (e.g., similar concentrations of analytes) in determining similarity between samples in the SDG. Two possible determinations are: 1) only some of the samples in the SDG are similar to the Matrix Spike sample, and that only these samples should be qualified; or 2) no samples are sufficiently similar to the sample used for the Matrix Spike, and thus only the field sample used to prepare the Matrix Spike sample should be qualified.
1. If the appropriate number of Matrix Spike samples were not analyzed for each matrix using the correct frequency, use professional judgment to determine if the associated sample data should be qualified. Obtain additional information from the laboratory, if necessary. Record the situation in the Data Review Narrative, and note it for EPA Regional CLP COR action. Detects should be qualified as estimated (J) and non-detects as estimated (UJ) if any of the frequency criteria is not met.
2. If a field blank or PE sample was used for the spiked sample analysis, note this for EPA Regional CLP COR action. All of the other QC data must then be carefully checked. Use professional judgment when evaluating the data. Detects should be qualified as estimated (J) and non-detects as estimated (UJ).
3. If the Matrix Spike recovery does not meet the evaluation criteria and a required post-digestion spike was not performed, note this for EPA Regional CLP COR action.
4. If the Matrix Spike %R is < 30%, verify that a post-digestion spike was analyzed. If the post-digestion spike %R is < 75% or the analysis was not performed, qualify detects as estimated low (J-) and non-detects as unusable (R). If the post-digestion spike %R is ≥ 75%, qualify detects as estimated (J) and non-detects as estimated (UJ).
5. If the Matrix Spike %R falls within the range of 30-74%, verify that a post-digestion spike was analyzed (if required when sample concentration is < 4x spike added). If the post-digestion spike %R is < 75% or the analysis was not performed, qualify detects as estimated low (J-) and non-detects as estimated (UJ). If the post-digestion spike %R is ≥ 75%, qualify detects as estimated (J) and non-detects as estimated (UJ).
6. If the Matrix Spike %R falls within the range of 75-125%, no post-digestion spike is required. Detects and non-detects should not be qualified.
7. If the Matrix Spike %R is > 125%, verify that a post-digestion spike was analyzed (if required when sample concentration is < 4x spike added). If the post-digestion spike %R is > 125% or the analysis was not performed, qualify detects as estimated high (J+); non-detects should not be qualified. If the post-digestion spike %R is ≤ 125%, qualify detects as estimated (J); non-detects should not be qualified.
8. Annotate the potential effects on the data due to out-of-control spiked sample results in the Data Review Narrative.
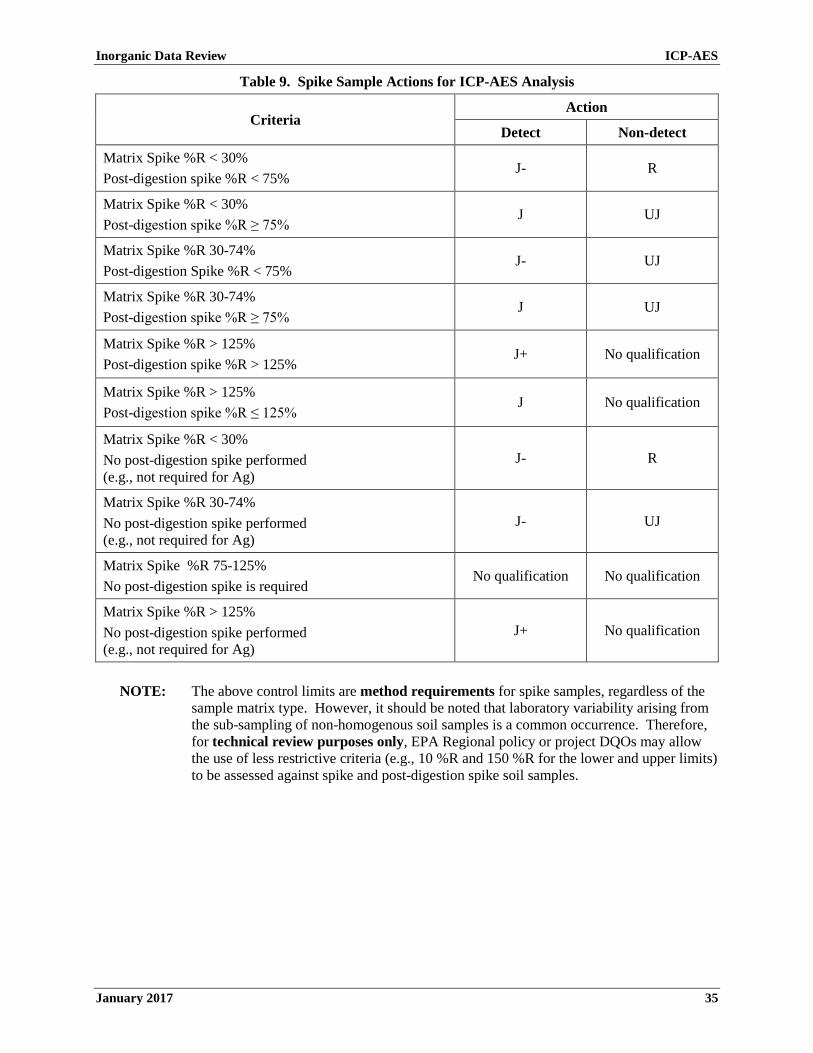
Inorganic Data Review ICP-AES
January 2017 35
Table 9. Spike Sample Actions for ICP-AES Analysis
Criteria Action
Detect Non-detect
Matrix Spike %R < 30% Post-digestion spike %R < 75%
J- R
Matrix Spike %R < 30% Post-digestion spike %R ≥ 75%
J UJ
Matrix Spike %R 30-74% Post-digestion Spike %R < 75%
J- UJ
Matrix Spike %R 30-74% Post-digestion spike %R ≥ 75%
J UJ
Matrix Spike %R > 125% Post-digestion spike %R > 125%
J+ No qualification
Matrix Spike %R > 125% Post-digestion spike %R ≤ 125%
J No qualification
Matrix Spike %R < 30% No post-digestion spike performed (e.g., not required for Ag)
J- R
Matrix Spike %R 30-74% No post-digestion spike performed (e.g., not required for Ag)
J- UJ
Matrix Spike %R 75-125% No post-digestion spike is required
No qualification No qualification
Matrix Spike %R > 125% No post-digestion spike performed (e.g., not required for Ag)
J+ No qualification
NOTE: The above control limits are method requirements for spike samples, regardless of the sample matrix type. However, it should be noted that laboratory variability arising from the sub-sampling of non-homogenous soil samples is a common occurrence. Therefore, for technical review purposes only, EPA Regional policy or project DQOs may allow the use of less restrictive criteria (e.g., 10 %R and 150 %R for the lower and upper limits) to be assessed against spike and post-digestion spike soil samples.

Inorganic Data Review ICP-AES
January 2017 36
VIII. Serial Dilution
A. Review Items
Form 1-IN, Form 8-IN, instrument printouts, and raw data. (SOW ISM02.4 – Exhibit B, Section 3.4 and Exhibit D/ICP-AES, Section 12.6)
B. Objective
The objective of the serial dilution analysis is to determine whether or not significant physical or chemical interferences exist due to sample matrix.
C. Criteria
1. An ICP Serial Dilution analysis shall be performed on a sample from each group of samples with a similar matrix type (e.g., aqueous/water or soil/sediment) or for each SDG, whichever is more frequent.
2. An ICP Serial Dilution analysis is not required for wipe samples.
3. Samples identified as field blanks or PE samples cannot be used for the ICP Serial Dilution analysis.
4. If the analyte concentration is sufficiently high (concentration in the original sample is > 50x the MDL that is calculated for the sample), the %D between the original determination and the serial dilution analysis (a five-fold dilution) after correction for dilution (concentration in the serial dilution sample is ≥ CRQL) shall be ≤ 10%.
NOTE: The above criteria are method requirements for serial dilution samples, regardless of the sample matrix type. However, for technical review purposes only, EPA Regional policy or project DQOs may allow the use of less restrictive criteria (e.g., %D > 15%) to be assessed against serial dilution soil samples.
D. Evaluation
1. Verify that a field blank or PE sample was not used for the serial dilution analysis.
2. Check the raw data and recalculate the %D using the following equation. Verify that the serial dilution analysis results and the calculated %D results agree with the values reported by the laboratory on Form 8-IN:
%Difference = |I - S|
I × 100
Where, I = Initial Sample Result S = Serial Dilution Result
3. Check the raw data for any evidence of positive or negative interference (results from the diluted sample which are significantly different than the original sample), possibly due to high levels of dissolved solids in the sample, ionization effects, etc.
E. Action
NOTE: For a serial dilution that does not meet the technical criteria, apply the action to all samples of the same matrix if the samples are considered sufficiently similar. Exercise professional judgment in determining sample similarity when making use of all available data, including: site and sampling documentation (e.g., location and type of sample, descriptive data, soil classification); field test data (e.g., pH, Eh, conductivity, chlorine); and laboratory data for other parameters (e.g., TSS, TDS, TOC, alkalinity or buffering capacity, reactive sulfide, anions). Additionally, use the sample data (e.g., similar concentrations of analytes) in determining similarity between samples in the SDG. Two

Inorganic Data Review ICP-AES
January 2017 37
possible determinations are: 1) only some of the samples in the SDG are similar to the serial dilution sample, and that only these samples should be qualified; or 2) no samples are sufficiently similar to the sample used for serial dilution, and thus only the field sample used to prepare the serial dilution sample should be qualified.
1. If the appropriate number of serial dilution samples were not analyzed for each matrix, use professional judgment to determine if the associated sample data should be qualified. Obtain additional information from the laboratory, if necessary. If a field blank or PE sample was used for the serial dilution analysis, record the situation in the Data Review Narrative, and note it for EPA Regional CLP COR action. Detects should be qualified as estimated (J) and non-detects as estimated (UJ).
2. If the analyte concentration in the original sample is > 50x the MDL, its concentration in the serial dilution sample is ≥ CRQL, and the %D is > 10%, qualify detects as estimated (J) and non-detects as estimated (UJ).
3. If the analyte concentration in the original sample is > 50x the MDL, its concentration in the serial dilution sample is ≥ CRQL, and the %D is ≤ 10%, detects and non-detects should not be qualified.
4. If the analyte concentration in the original sample is > 50x the MDL, its concentration in the serial dilution sample is ≥ CRQL, and the %D is ≥ 100%, use professional judgment to determine if the associated sample data should be qualified.
5. If the analyte concentration in the original sample is > 5x the CRQL and its concentration in the serial dilution sample is < CRQL, detects and non-detects should not be qualified.
6. If evidence of positive or negative interference is found, use professional judgment to qualify the associated sample data. Annotate the potential effects on the reported data in the Data Review Narrative.
Table 10. Serial Dilution Actions for ICP-AES Analysis
Criteria Action
Detect Non-detect
Sample concentration > 50x MDL, serial dilution sample concentration ≥ CRQL, and %D > 10%* J UJ
Sample concentration >50x MDL, serial dilution sample concentration ≥ CRQL, and %D ≤ 10% No qualification No qualification
Sample concentration > 50x MDL, serial dilution sample concentration ≥ CRQL, and %D ≥ 100%
Use professional judgment
Use professional judgment
Sample concentration > 5x CRQL and serial dilution sample concentration < CRQL No qualification No qualification
Interferences present Use professional judgment
Use professional judgment
* The above criteria are method requirements for serial dilution samples, regardless of the sample matrix type. However, for technical review purposes only, EPA Regional policy or project DQOs may allow the use of less restrictive criteria (e.g., %D > 15%) to be assessed against serial dilution soil samples.
Inorganic Data Review ICP-AES
January 2017 38
IX. Performance Evaluation Sample
A. Review Items
Form 1-IN, TR/COC Record documentation, preparation logs, instrument printouts, and raw data. (SOW ISM02.4 – Exhibit B, Section 3.4 and Exhibit F, Section 4.1)
B. Objective
The objective is to determine the validity of the analytical results based on the recovery of the PE sample(s).
C. Criteria
1. Matrix-specific PE samples shall be analyzed utilizing the same analytical methods and QA/QC procedures as employed for the samples, at a frequency to be determined by each EPA Region for each site. PE samples must be analyzed in an SDG containing field samples for the Case, using the same procedures, reagents, and instrumentation.
D. Evaluation
1. Verify, using Form 1-IN, preparation logs, and raw data, that the PE samples were analyzed with the field samples and field blanks in the SDG.
2. Verify, using Form 1-IN, that the PE sample results are within the warning limits (95% confidence interval) and action limits (99% confidence interval).
3. If a significant number (i.e., half or more) of the analytes in the PE samples fall outside of the 95% warning or 99% action criteria, or a number of false positive results are reported, evaluate the overall impact on the data.
E. Action
NOTE: If the PE sample criteria are not met, the laboratory performance and method accuracy are in question. Use professional judgment to determine if the data should be qualified or rejected. The following guidance is suggested for qualifying sample data associated with a PE sample that does not meet the required criteria.
For a PE sample that does not meet the technical criteria, apply the action to all samples in the same preparation batch. If the concentration of any analyte in a PE sample is not comparable to the analyte’s concentration in the field samples or field blanks (i.e., it is much higher or much lower than the concentration in these samples), the action may be applied to only those samples in which the analyte’s concentration is comparable to the PE sample concentration.
1. If the PE sample was not analyzed with the field samples and field blanks, use professional judgment to determine if the associated sample results should be qualified. Obtain additional information from the laboratory, if necessary. If a laboratory fails to analyze the PE sample(s) provided with field samples and field blanks, or if a laboratory consistently fails to generate acceptable PE sample results, record the situation in the Data Review Narrative, and note it for EPA Regional CLP COR action.
2. If the PE sample results are outside the lower warning limits but inside the lower action limits, qualify detects as estimated low (J-) and non-detects as estimated (UJ).
3. If the PE sample results are outside the lower action limits, qualify detects as estimated low (J-) and non-detects as unusable (R).
4. If the PE sample results are within the limits, detects and non-detects should not be qualified.
5. If the PE sample results are outside the upper warning limits but inside the upper action limits, qualify detects as estimated high (J+). Non-detects should not be qualified.
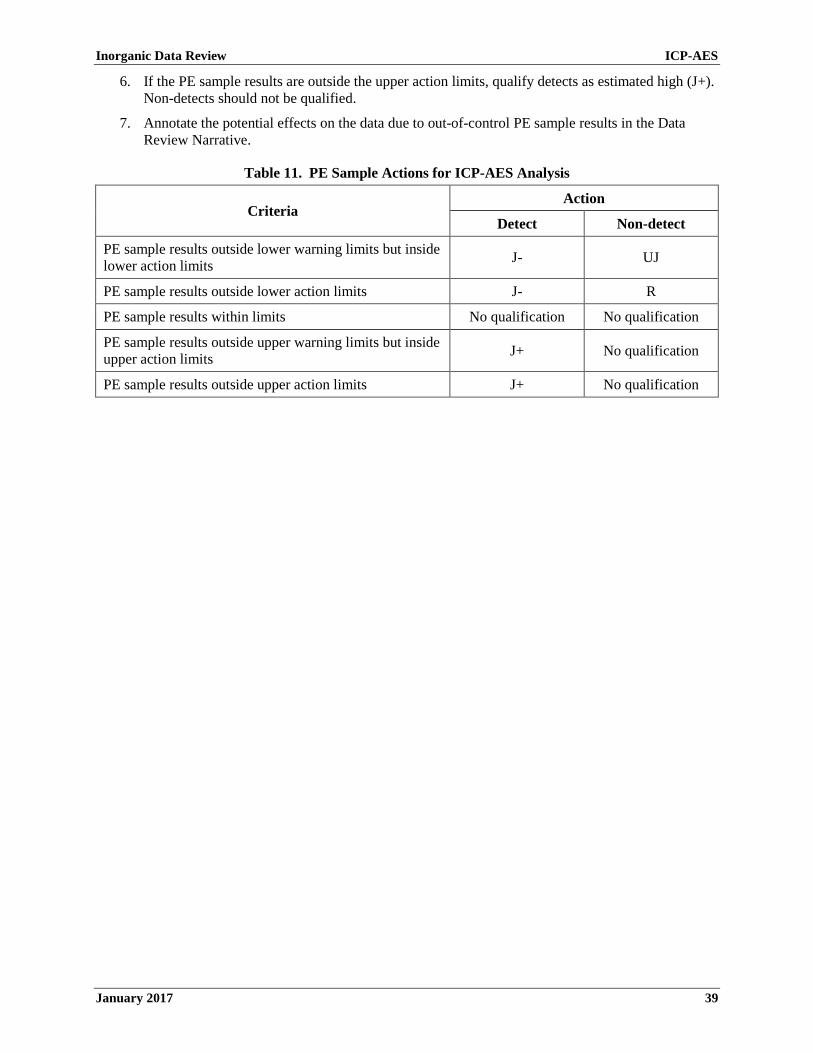
Inorganic Data Review ICP-AES
January 2017 39
6. If the PE sample results are outside the upper action limits, qualify detects as estimated high (J+). Non-detects should not be qualified.
7. Annotate the potential effects on the data due to out-of-control PE sample results in the Data Review Narrative.
Table 11. PE Sample Actions for ICP-AES Analysis
Criteria Action
Detect Non-detect
PE sample results outside lower warning limits but inside lower action limits J- UJ
PE sample results outside lower action limits J- R
PE sample results within limits No qualification No qualification
PE sample results outside upper warning limits but inside upper action limits J+ No qualification
PE sample results outside upper action limits J+ No qualification

Inorganic Data Review ICP-AES
January 2017 40
X. Regional Quality Assurance and Quality Control
A. Review Items
Form 1-IN, instrument printouts, and raw data. (SOW ISM02.4 – Exhibit B, Sections 2.4 and 3.4)
B. Objective
The objective is to use results from the analysis of EPA Regional QA/QC samples such as field blanks, blind spikes, and blind blanks to determine the validity of the analytical results.
C. Criteria
Criteria are determined by each EPA Region.
1. The frequency of EPA Regional QA/QC samples should be defined in the project QAPP.
2. Performance criteria for EPA Regional QA/QC samples should also be defined in the project QAPP.
3. The EPA Region may provide the laboratory with PE samples to be analyzed with each SDG. These samples may include blind spikes and/or blind blanks. The laboratory must analyze a PE sample when provided by the EPA Region. Refer to Section III, above, for blanks criteria. Refer to Section IX, above, for PE samples criteria.
4. The RPD between field duplicates shall fall within the specific limits in the EPA Region’s Standard Operating Procedure (SOP) or project QAPP.
D. Evaluation
1. Evaluation procedures must follow the EPA Region’s SOP for data review.
2. Determine whether the results of EPA Regional QA/QC samples impact all samples in the project or only those directly associated (i.e., in the same SDG, collected on the same day, prepared together, or contained in the same analytical sequence).
3. Calculate the RPD between field duplicates and provide this information in the Data Review Narrative. Also verify that the value falls within the specific limits in the EPA Region’s SOP or project QAPP.
4. Determine whether poor precision is the fault of the laboratory, or a result of sample non-homogeneity in the field. Laboratory observations of sample appearance may become important in these situations.
E. Action
1. Any action must be in accordance with EPA Regional specifications and the criteria for acceptable field duplicate sample results.
2. Note unacceptable results for field duplicate samples for EPA Regional CLP COR action.
3. In general, for EPA Regional QA/QC performance not within QAPP specification, qualify detects as estimated (J) and non-detects as estimated (UJ). The impact on overall data quality should be assessed after consultation with the data user and/or field personnel. Contact the EPA Regional CLP COR if reanalysis of samples is required.
Inorganic Data Review ICP-AES
January 2017 41
XI. Overall Assessment of Data
A. Review Items
Entire sample data package, data review results, preparation logs, calibration standard logs, instrument logs, instrument printouts, and raw data (including any confirmation data).
B. Objective
The objective is to provide the overall assessment on data quality and usability.
C. Criteria
1. Review all available materials to assess the overall quality of the data, keeping in mind the additive nature of analytical problems.
2. Reported analyte concentrations must be quantitated according to the appropriate equations, as listed in the method. All sample results must be within the linear calibration ranges per the methods. Percent Solids (%Solids) must be properly used for all applicable matrix result calculations.
D. Evaluation
Examine the raw data to verify that correct calculations of the sample results were reported by the laboratory. Digestion logs, instrument printouts, etc., should be compared to the reported sample results recorded on the appropriate Inorganic Data Reporting Forms (Form 1-IN through Form 16-IN).
1. Evaluate any technical problems not previously addressed.
2. Examine the raw data for any anomalies (e.g., baseline shifts, negative absorbance, omissions, illegibility, etc.).
3. Verify that appropriate methods and amounts were used to prepare the samples for analysis. If reduced volumes were used, verify that the laboratory had received EPA Regional CLP COR approval for the use of the reduced volume.
4. Verify that there are no transcription or reduction errors (e.g., dilutions, %Solids, sample weights, etc.) on one or more samples. Recalculate %Solids for at least 10% of the samples and verify that the calculated %Solids agree with that reported by the laboratory.
5. Verify that MDLs are properly reported and that they are not greater than the respective CRQLs.
6. Verify that results fall within the calibrated range(s) of the ICP instrument(s) (Form 15-IN).
7. If appropriate information is available, assess the usability of the data to assist the data user in avoiding inappropriate use of the data. Review all available information, including the Quality Assurance Project Plan (QAPP), focusing specifically on the acceptance or performance criteria, the SOPs, and communication with the user concerning the intended use and desired quality of these data.
E. Action
1. Use professional judgment to determine if there is any need to qualify data which were not qualified based on the QC criteria previously discussed.
2. Use professional judgment to qualify detects and non-detects if the MDL exceeds the CRQL.
3. If a sample is not diluted properly when sample results exceed the upper limit of the calibration range, qualify detects as estimated (J).
Inorganic Data Review ICP-AES
January 2017 42
4. Write a brief Data Review Narrative to give the user an indication of the limitations of the analytical data. Annotate any discrepancies between the data and the SDG Narrative for EPA Regional CLP COR action. If sufficient information on the intended use and required quality of the data is available, include an assessment of the data usability within the given context.
5. If any discrepancies are found, notify the EPA Regional CLP COR. The EPA Regional CLP COR may contact the laboratory to obtain additional information for resolution. If a discrepancy remains unresolved, use professional judgment to determine if qualification of the data is warranted.

Inorganic Data Review ICP-AES
January 2017 43
XII. Calculations
Aqueous/Water and TCLP/SPLP Sample Concentration:
The concentrations determined in the digestate are to be reported in units of µg/L:
Concentration (μg/L) = C ×Vf
V × DF
Where, C = Instrument value in µg/L (the average of all replicate exposures) Vf = Final digestion volume (mL) V = Initial aliquot amount (mL) DF = Dilution Factor
Convert units to mg/L for TCLP leachates by dividing the final calculated concentration by 1000.
Soil/Sediment Sample Concentration:
The concentrations determined in the digestate are to be reported on the basis of the dry weight of the sample, in units of mg/kg:
Concentration (mg kg⁄ dry weight) = C ×Vf
W × S× DF 1000⁄
Where, C = Instrument value in µg/L (the average of all replicate exposures) Vf = Final digestion volume (mL) W = Initial aliquot amount (g) S = %Solids/100 (see Exhibit D – General Inorganic Analysis, Section 10.1.1) DF = Dilution Factor
Wipe Mass:
Mass (μg) = C × Vf × DF 1000⁄
Where, C = Instrument value in µg/L (The average of all replicate exposures) Vf = Final digestion volume (mL) DF = Dilution Factor
Adjusted MDL/Adjusted CRQL:
To calculate the adjusted MDL or adjusted CRQL for aqueous/water or TCLP/SPLP leachate samples, substitute the value of the MDL or CRQL, in the appropriate units, into the “C” term in the equation above.
Calculate the adjusted MDL or adjusted CRQL for soil/sediment samples as follows:
Adjusted MDL or CRQL ( mg kg) = C ×WM
W × S ×
Vf
VM × DF�
Where, C = MDL or CRQL (mg/kg) WM = Minimum method required aliquot amount (g) (1.00 g) W = Initial aliquot amount (g) VM = Method required final sample digestion volume (mL) (100 mL or 50 mL) Vf = Final digestion volume (mL) S = % Solids/100 (see Exhibit D – General Inorganic Analysis, Section 10.1.1) DF = Dilution Factor
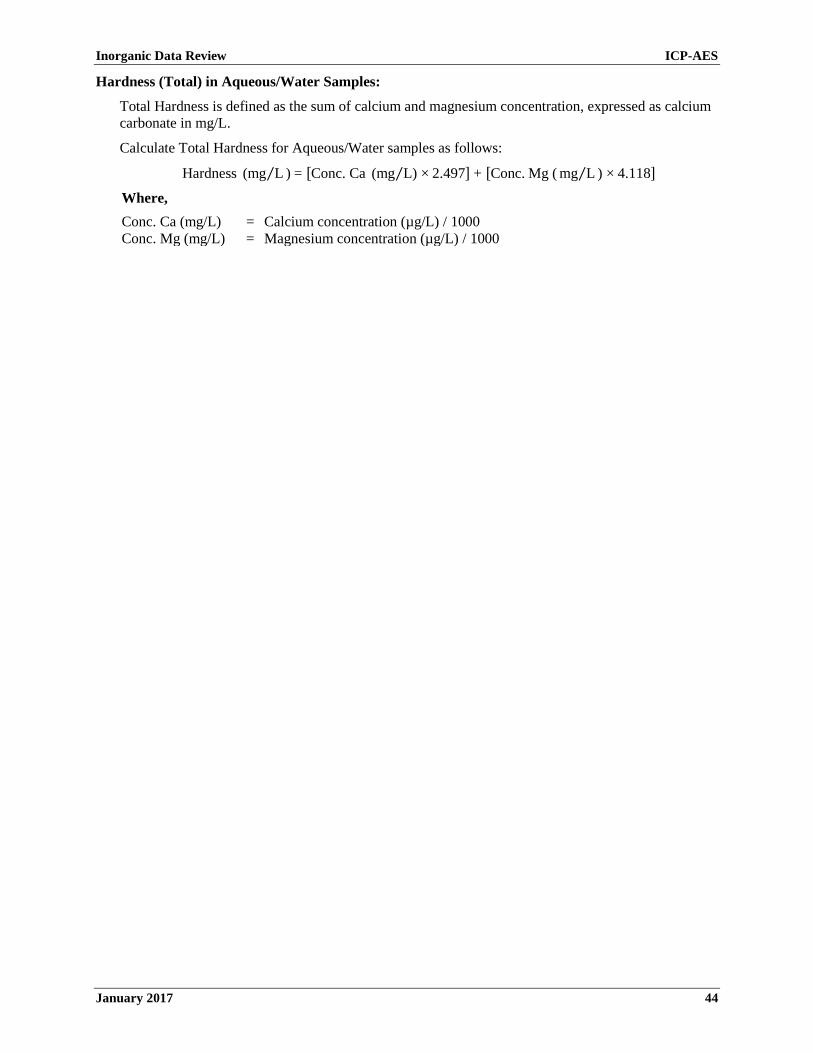
Inorganic Data Review ICP-AES
January 2017 44
Hardness (Total) in Aqueous/Water Samples:
Total Hardness is defined as the sum of calcium and magnesium concentration, expressed as calcium carbonate in mg/L.
Calculate Total Hardness for Aqueous/Water samples as follows:
Hardness (mg L⁄ ) = [Conc. Ca (mg L) × 2.497⁄ ] + [Conc. Mg ( mg L⁄ ) × 4.118]
Where, Conc. Ca (mg/L) = Calcium concentration (µg/L) / 1000 Conc. Mg (mg/L) = Magnesium concentration (µg/L) / 1000
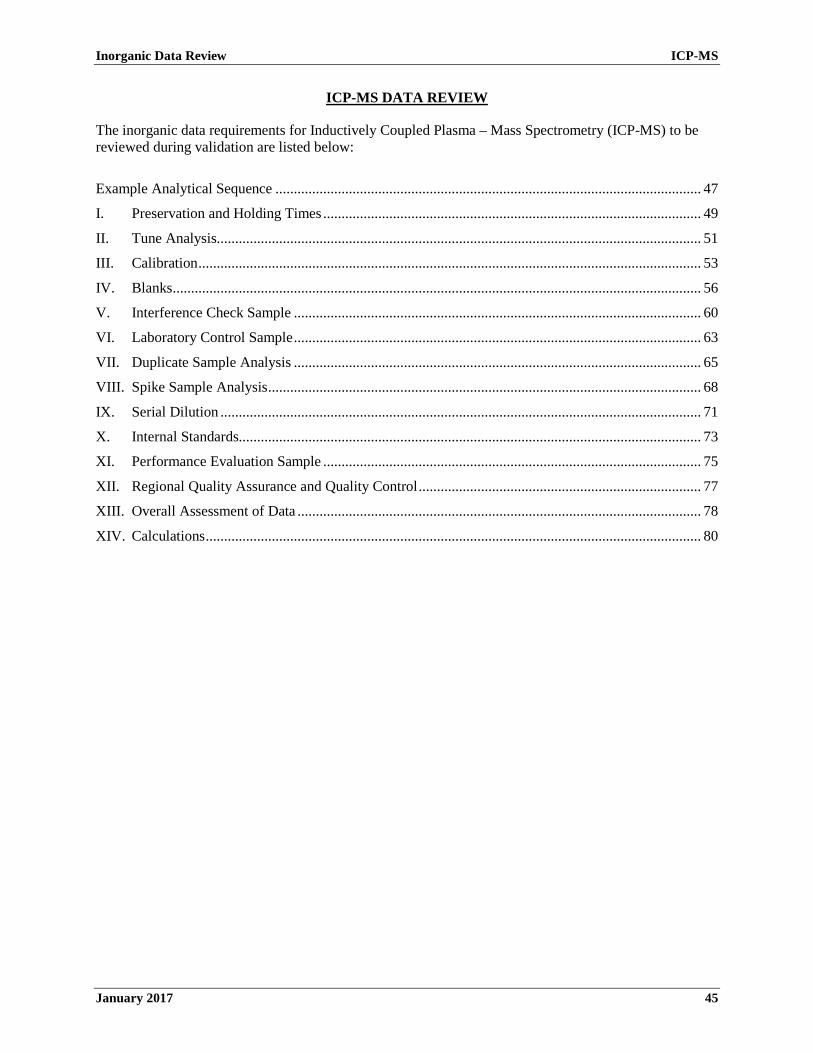
Inorganic Data Review ICP-MS
January 2017 45
ICP-MS DATA REVIEW
The inorganic data requirements for Inductively Coupled Plasma – Mass Spectrometry (ICP-MS) to be reviewed during validation are listed below:
Example Analytical Sequence .................................................................................................................... 47
I. Preservation and Holding Times ....................................................................................................... 49
II. Tune Analysis.................................................................................................................................... 51
III. Calibration ......................................................................................................................................... 53
IV. Blanks ................................................................................................................................................ 56
V. Interference Check Sample ............................................................................................................... 60
VI. Laboratory Control Sample ............................................................................................................... 63
VII. Duplicate Sample Analysis ............................................................................................................... 65
VIII. Spike Sample Analysis ...................................................................................................................... 68
IX. Serial Dilution ................................................................................................................................... 71
X. Internal Standards.............................................................................................................................. 73
XI. Performance Evaluation Sample ....................................................................................................... 75
XII. Regional Quality Assurance and Quality Control ............................................................................. 77
XIII. Overall Assessment of Data .............................................................................................................. 78
XIV. Calculations ....................................................................................................................................... 80

Inorganic Data Review ICP-MS
January 2017 46
This page is intentionally left blank.
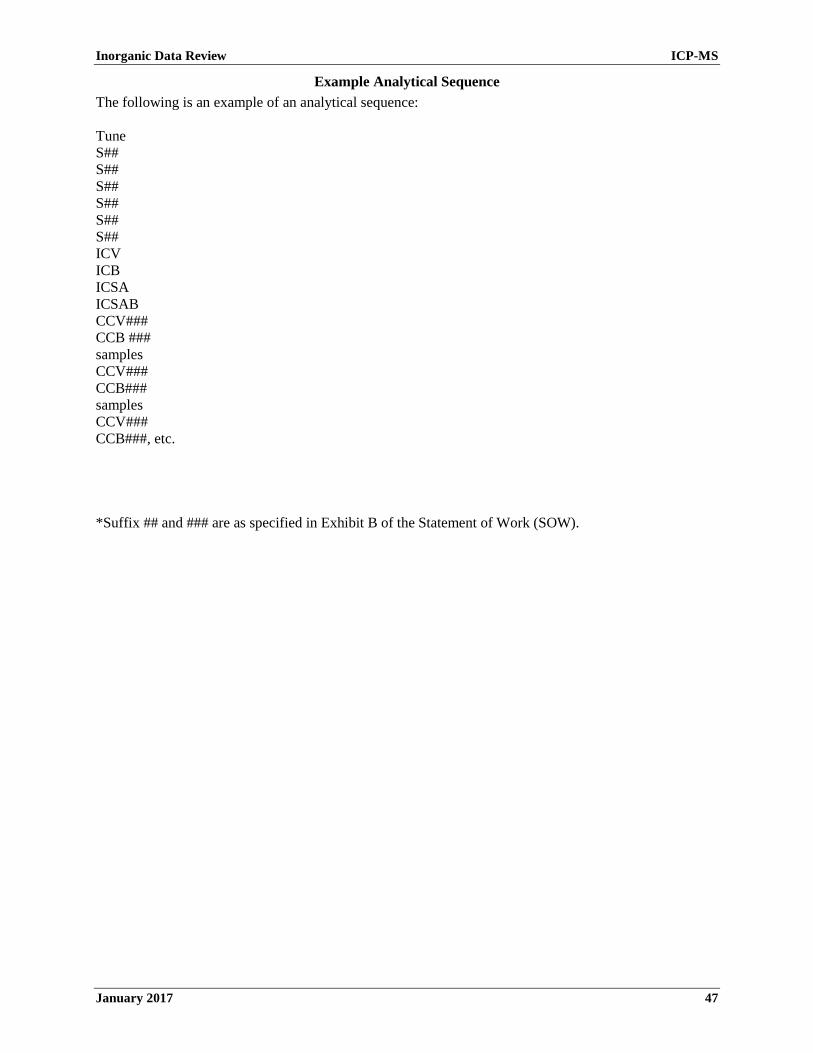
Inorganic Data Review ICP-MS
January 2017 47
Example Analytical Sequence The following is an example of an analytical sequence: Tune S## S## S## S## S## S## ICV ICB ICSA ICSAB CCV### CCB ### samples CCV### CCB### samples CCV### CCB###, etc. *Suffix ## and ### are as specified in Exhibit B of the Statement of Work (SOW).

Inorganic Data Review ICP-MS
January 2017 48
This page is intentionally left blank.

Inorganic Data Review ICP-MS
January 2017 49
I. Preservation and Holding Times
A. Review Items
Form 1-IN, Form 12-IN, Traffic Report/Chain of Custody (TR/COC) Record documentation, Form DC-1, raw data, and the Sample Delivery Group (SDG) Narrative checking for: pH, shipping container temperature, holding time, and other sample conditions. (SOW ISM02.4 – Exhibit B, Section 3.4; Exhibit D/Introduction, Section 5.0; Exhibit D/General, Sections 8.0 and 10.1.2.1; and Exhibit D/ICP-MS, Sections 8.0 and 10.1.1)
B. Objective
The objective is to determine the validity of the analytical results based on the sample conditions and the holding time of the sample.
C. Criteria
1. The technical holding time is determined from the date of collection to the date of analysis.
2. The technical holding time criteria for aqueous/water samples is 180 days, preserved (with nitric acid) to pH ≤ 2. The addition of nitric acid to adjust the pH is only required for aqueous/water samples.
3. The technical holding time criteria for soil/sediment samples is 180 days, based on the technical holding time criteria for aqueous/water samples.
D. Evaluation
1. Establish technical holding times by comparing the sampling date(s) on the TR/COC Record documentation with the dates of analysis on Form 12-IN and the raw data; also consider using information in the Complete SDG File (CSF), as it may be helpful in the assessment.
2. Verify that the analysis dates on Form 12-IN and the raw data are identical.
3. Review the SDG Narrative and raw data preparation logs to determine if samples were properly preserved and arrived at the laboratory in proper condition (e.g., received intact, appropriate sample temperature at receipt, pH). If there is an indication of problems with the samples, the sample integrity may be compromised. Use professional judgment to evaluate the effect of the problem on the sample results.
E. Action
NOTE: Apply the action to each field sample for which the preservation or holding time criteria was not met.
1. If the pH of aqueous/water metals samples is > 2 at the time of sample receipt, determine if the laboratory adjusted the pH of the sample to ≤ 2 at the time of sample receipt. If not, use professional judgment to qualify the samples based on the pH of the sample and the chemistry of the metal(s) of interest. Detects should be qualified as estimated low (J-) and non-detects as unusable (R).
2. If technical holding times are exceeded, use professional judgment to determine the reliability of the data, based on the magnitude of the additional time compared to the technical requirement and whether the samples were properly preserved. The expected bias would be low. Detects should be qualified as estimated low (J-) and non-detects as unusable (R).
3. Due to limited information concerning holding times for soil/sediment samples, use professional judgment when deciding whether to apply the aqueous/water holding time criteria to soil/sediment samples. If they are applied, annotate this in the Data Review Narrative.

Inorganic Data Review ICP-MS
January 2017 50
4. When the holding times are exceeded, annotate any possible consequences for the analytical results in the Data Review Narrative, and note it for United States Environmental Protection Agency Regional Contract Laboratory Program Contracting Officer’s Representative (EPA Regional CLP COR) action.
Table 12. Preservation and Holding Time Actions for ICP-MS Analysis
Criteria Action
Detect Non-detect
Aqueous/Water samples received with pH > 2 and pH not adjusted
Use professional judgment
J-
Use professional judgment
R
Technical Holding Time: Aqueous/Water samples > 180 days
J- R
Technical Holding Time: Soil/Sediment samples > 180 days
J- R
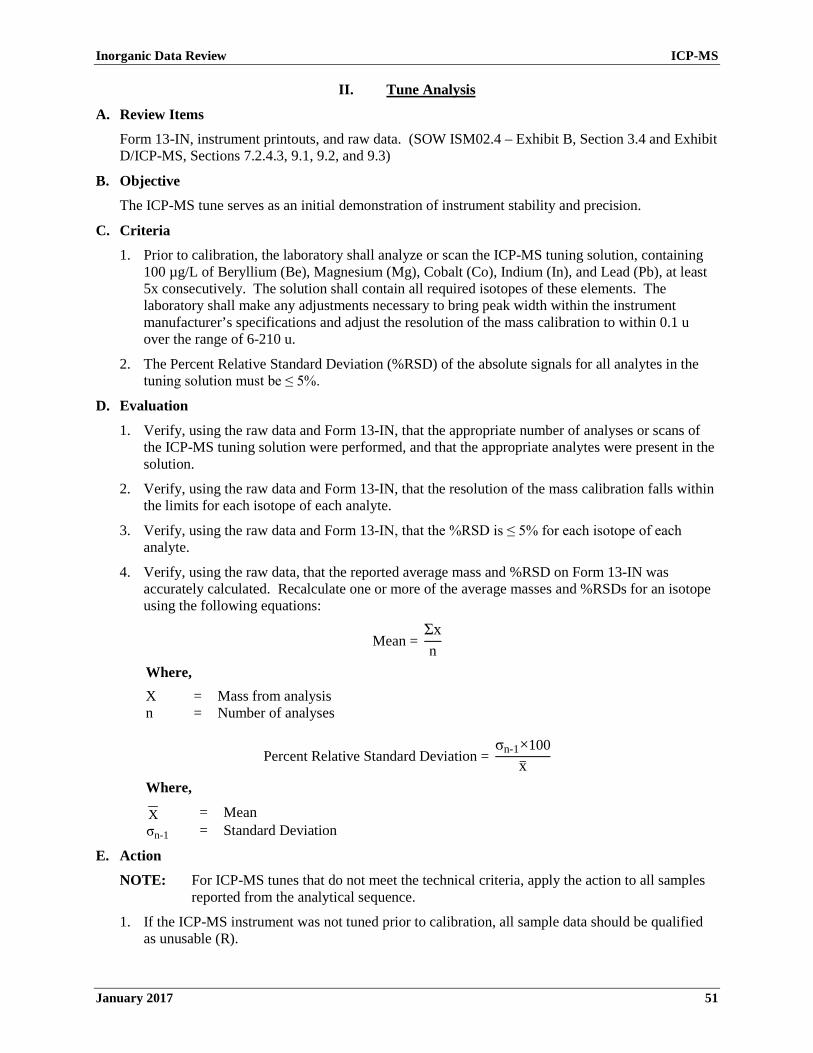
Inorganic Data Review ICP-MS
January 2017 51
II. Tune Analysis
A. Review Items
Form 13-IN, instrument printouts, and raw data. (SOW ISM02.4 – Exhibit B, Section 3.4 and Exhibit D/ICP-MS, Sections 7.2.4.3, 9.1, 9.2, and 9.3)
B. Objective
The ICP-MS tune serves as an initial demonstration of instrument stability and precision.
C. Criteria
1. Prior to calibration, the laboratory shall analyze or scan the ICP-MS tuning solution, containing 100 µg/L of Beryllium (Be), Magnesium (Mg), Cobalt (Co), Indium (In), and Lead (Pb), at least 5x consecutively. The solution shall contain all required isotopes of these elements. The laboratory shall make any adjustments necessary to bring peak width within the instrument manufacturer’s specifications and adjust the resolution of the mass calibration to within 0.1 u over the range of 6-210 u.
2. The Percent Relative Standard Deviation (%RSD) of the absolute signals for all analytes in the tuning solution must be ≤ 5%.
D. Evaluation
1. Verify, using the raw data and Form 13-IN, that the appropriate number of analyses or scans of the ICP-MS tuning solution were performed, and that the appropriate analytes were present in the solution.
2. Verify, using the raw data and Form 13-IN, that the resolution of the mass calibration falls within the limits for each isotope of each analyte.
3. Verify, using the raw data and Form 13-IN, that the %RSD is ≤ 5% for each isotope of each analyte.
4. Verify, using the raw data, that the reported average mass and %RSD on Form 13-IN was accurately calculated. Recalculate one or more of the average masses and %RSDs for an isotope using the following equations:
Mean = Σxn
Where, X = Mass from analysis n = Number of analyses
Percent Relative Standard Deviation = σn-1×100
x�
Where,
X = Mean σn-1 = Standard Deviation
E. Action
NOTE: For ICP-MS tunes that do not meet the technical criteria, apply the action to all samples reported from the analytical sequence.
1. If the ICP-MS instrument was not tuned prior to calibration, all sample data should be qualified as unusable (R).

Inorganic Data Review ICP-MS
January 2017 52
2. If the tuning solution was not analyzed or scanned at least 5x consecutively, or the tuning solution does not contain the required analytes spanning the analytical range, use professional judgment to determine if the associated sample data should be qualified. Obtain additional information from the laboratory, if necessary. Record the situation in the Data Review Narrative, and note it for EPA Regional CLP COR action.
3. If the resolution of the mass calibration is not within 0.1 u for any isotope in the tuning solution, qualify the associated analytes that are detects as estimated (J) and non-detects as estimated (UJ). Record the situation in the Data Review Narrative, and note it for EPA Regional CLP COR action.
4. If the %RSD is > 5% for any isotope in the tuning solution, qualify detects as estimated (J) and non-detects as estimated (UJ). Record the situation in the Data Review Narrative, and note it for EPA Regional CLP COR action.
Table 13. ICP-MS Tune Actions for ICP-MS Analysis
Criteria Action
Detect Non-detect
Tune not performed R R
Tune not performed properly (Section II.E.2) Use professional judgment
Use professional judgment
Resolution of mass calibration not within 0.1 u J UJ
%RSD > 5% J UJ
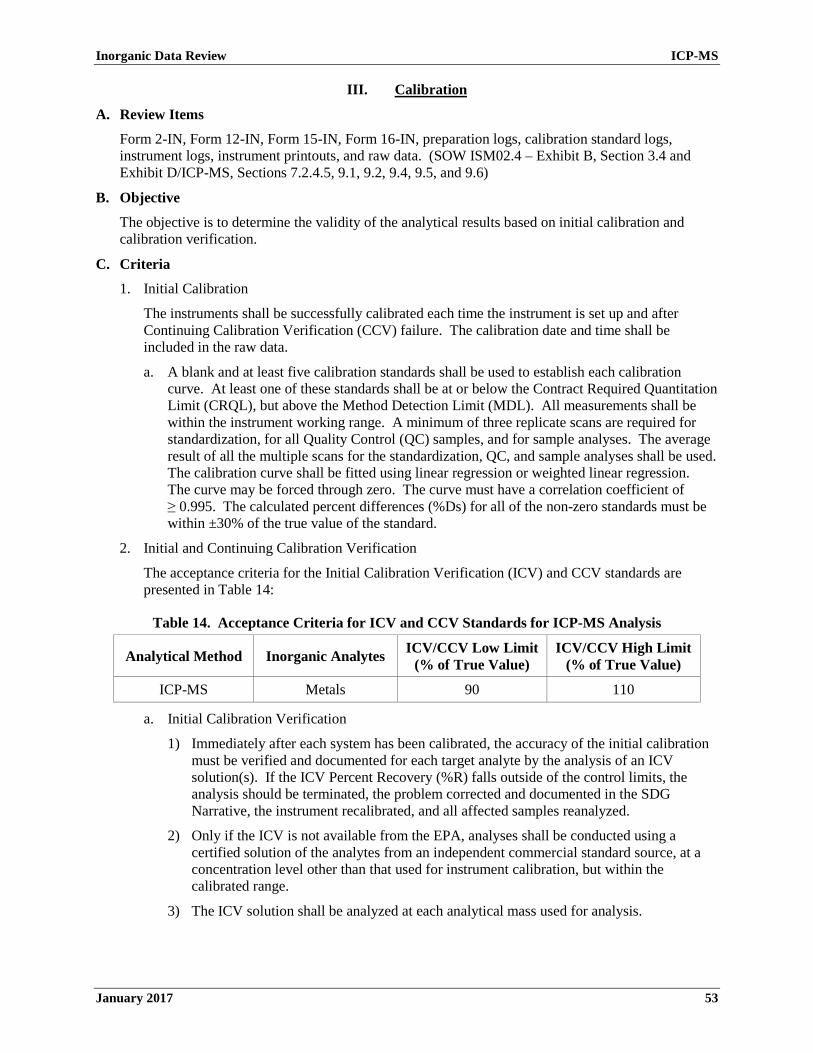
Inorganic Data Review ICP-MS
January 2017 53
III. Calibration
A. Review Items
Form 2-IN, Form 12-IN, Form 15-IN, Form 16-IN, preparation logs, calibration standard logs, instrument logs, instrument printouts, and raw data. (SOW ISM02.4 – Exhibit B, Section 3.4 and Exhibit D/ICP-MS, Sections 7.2.4.5, 9.1, 9.2, 9.4, 9.5, and 9.6)
B. Objective
The objective is to determine the validity of the analytical results based on initial calibration and calibration verification.
C. Criteria
1. Initial Calibration
The instruments shall be successfully calibrated each time the instrument is set up and after Continuing Calibration Verification (CCV) failure. The calibration date and time shall be included in the raw data.
a. A blank and at least five calibration standards shall be used to establish each calibration curve. At least one of these standards shall be at or below the Contract Required Quantitation Limit (CRQL), but above the Method Detection Limit (MDL). All measurements shall be within the instrument working range. A minimum of three replicate scans are required for standardization, for all Quality Control (QC) samples, and for sample analyses. The average result of all the multiple scans for the standardization, QC, and sample analyses shall be used. The calibration curve shall be fitted using linear regression or weighted linear regression. The curve may be forced through zero. The curve must have a correlation coefficient of ≥ 0.995. The calculated percent differences (%Ds) for all of the non-zero standards must be within ±30% of the true value of the standard.
2. Initial and Continuing Calibration Verification
The acceptance criteria for the Initial Calibration Verification (ICV) and CCV standards are presented in Table 14:
Table 14. Acceptance Criteria for ICV and CCV Standards for ICP-MS Analysis
Analytical Method Inorganic Analytes ICV/CCV Low Limit (% of True Value)
ICV/CCV High Limit (% of True Value)
ICP-MS Metals 90 110
a. Initial Calibration Verification
1) Immediately after each system has been calibrated, the accuracy of the initial calibration must be verified and documented for each target analyte by the analysis of an ICV solution(s). If the ICV Percent Recovery (%R) falls outside of the control limits, the analysis should be terminated, the problem corrected and documented in the SDG Narrative, the instrument recalibrated, and all affected samples reanalyzed.
2) Only if the ICV is not available from the EPA, analyses shall be conducted using a certified solution of the analytes from an independent commercial standard source, at a concentration level other than that used for instrument calibration, but within the calibrated range.
3) The ICV solution shall be analyzed at each analytical mass used for analysis.

Inorganic Data Review ICP-MS
January 2017 54
b. Continuing Calibration Verification
1) To ensure accuracy during the course of each analytical sequence, the CCV shall be analyzed and reported for each mass used for the analysis of each analyte.
2) The CCV standard shall be analyzed at a frequency of every two hours during an analytical sequence. The CCV standard shall also be analyzed at the beginning of the analytical sequence, and again after the last analytical sample.
3) The analyte concentration(s) in the CCV standard(s) shall be different than the concentration used for the ICV, and at a concentration equivalent to the mid-level of their respective calibration curves.
4) The same CCV standard solution shall be used throughout the analysis for an SDG.
5) The CCV shall be analyzed in the same fashion as an actual sample. If the %R of the CCV was outside of the control limits, the analysis should be terminated, the problem corrected and documented in the SDG Narrative, the instrument recalibrated, and all analytical samples analyzed since the last compliant CCV reanalyzed.
D. Evaluation
1. Verify that the instrument was calibrated each time the instrument was set up, utilizing a blank and at least five calibration standards, one of which was at or below the CRQL but above the MDL.
2. Confirm that the measurements were within the working calibration range, and were the average result of at least three replicate exposures.
3. Verify that the ICV and CCV standards were analyzed for each analyte at the specified frequency and at the appropriate concentration. Verify that acceptable %R results were obtained.
4. Recalculate one or more of the ICV and CCV %R values using the following equation and verify that the recalculated values agree with the laboratory-reported values on Form 2-IN.
%R = Found (value)True (value)
× 100
Where, Found (value) = Concentration (in µg/L) of each analyte measured in the analysis of the
ICV or CCV solution True (value) = Concentration (in µg/L) of each analyte in the ICV or CCV source
E. Action
NOTES: For initial calibrations or ICV standards that do not meet the technical criteria, apply the action to all associated samples reported from the analytical sequence.
For CCV standards that do not meet the technical criteria, apply the action to all samples analyzed between a previous technically acceptable analysis of the QC sample and a subsequent technically acceptable analysis of the QC sample in the analytical sequence.
1. If the instrument was not calibrated each time the instrument was set up, qualify detects and non-detects as unusable (R). If the instrument was not calibrated with at least the minimum number of standards, or if the calibration curve does not include standards at required concentrations (e.g., a blank and at least one at or below the CRQL but above the MDL), use professional judgment to qualify detects as estimated (J) or unusable (R), and non-detects as estimated (UJ) or unusable (R).
2. If the correlation coefficient is < 0.995 or the %Ds are outside the ±30% limit, qualify detects as estimated (J) and non-detects as estimated (UJ).

Inorganic Data Review ICP-MS
January 2017 55
3. If the ICV or CCV %R falls outside the acceptance windows, use professional judgment to qualify all associated data. If possible, indicate the bias in the Data Review Narrative. The following guidelines are recommended:
a. If the ICV or CCV %R is < 75%, use professional judgment to qualify detects as estimated low (J-) or unusable (R), and non-detects as unusable (R).
b. If the ICV or CCV %R falls within the range of 75-89%, qualify detects as estimated low (J-) and non-detects as estimated (UJ).
c. If the ICV or CCV %R falls within the range of 90-110%, detects and non-detects should not be qualified.
d. If the ICV or CCV %R falls within the range of 111-125%, qualify detects as estimated high (J+). Non-detects should not be qualified.
e. If the ICV or CCV %R is > 125%, use professional judgment to qualify detects as estimated high (J+) or unusable (R). Non-detects should not be qualified.
4. If the laboratory failed to provide adequate calibration information, notify the EPA Regional CLP COR. The EPA Regional CLP COR may contact the laboratory and request the necessary information. If the information is unavailable, use professional judgment to assess the data.
5. Annotate the potential effects on the reported data due to exceeding the calibration criteria in the Data Review Narrative.
6. If calibration criteria are grossly exceeded, note this for EPA Regional CLP COR action.
NOTE: For truly critical samples, a further in-depth evaluation of the calibration curve may be warranted to determine if additional qualification is necessary.
Table 15. Calibration Actions for ICP-MS Analysis
Criteria Action
Detect Non-detect
Calibration not performed R R
Calibration incomplete Use professional
judgment J or R
Use professional judgment UJ or R
Correlation coefficient < 0.995 or %D outside ±30% J UJ
ICV/CCV %R < 75% Use professional
judgment J- or R
R
ICV/CCV %R 75-89% J UJ
ICV/CCV %R 90-110% No qualification No qualification
ICV/CCV %R 111-125% J+ No qualification
ICV/CCV %R > 125% Use professional
judgment J+ or R
No qualification

Inorganic Data Review ICP-MS
January 2017 56
IV. Blanks
A. Review Items
Form 1-IN, Form 3-IN, Form 12-IN, preparation logs, calibration standard logs, instrument logs, and raw data. (SOW ISM02.4 – Exhibit B, Section 3.4 and Exhibit D/ICP-MS, Sections 7.3, 9.7, and 12.1)
B. Objective
The objective is to determine the validity of the analytical results based on the blank responses by determining the existence and magnitude of contamination resulting from laboratory (or field) activities or baseline drift during analysis.
C. Criteria
1. No contaminants should be found in the blank(s).
2. The Initial Calibration Blank (ICB) shall be analyzed at each mass used for analysis after the analytical standards, but not before analysis of the ICV during the initial calibration of the instrument (see Section III.C.1).
3. A Continuing Calibration Blank (CCB) shall be analyzed at each mass used for the analysis, immediately after every CCV. The CCB shall be analyzed at a frequency of every two hours during the analytical sequence. The CCB shall be analyzed at the beginning of the analytical sequence, and again after the last CCV that was analyzed after the last analytical sample of the analytical sequence. The CCB result (absolute value) shall not exceed the CRQL of each analyte for which analysis is performed.
4. At least one Preparation Blank shall be prepared and analyzed for each matrix, with every SDG, or with each batch of samples digested, whichever is more frequent. The Preparation Blank consists of reagent water processed through the appropriate sample preparation and analysis procedure.
5. If the concentration of any analyte in the Preparation Blank is > CRQL, the lowest concentration of that analyte in the associated samples must be ≥ 10x the Preparation Blank concentration. Otherwise, all associated samples with the analyte’s concentration < 10x the Preparation Blank concentration, and > CRQL, should be redigested and reanalyzed for that analyte. The laboratory is not to correct the sample concentration for the blank value.
6. If the concentration of any analyte in the Preparation Blank is < (-CRQL), all associated samples with the analyte’s concentration < 10x the CRQL should be redigested and reanalyzed.
D. Evaluation
1. Verify that an ICB was analyzed after the calibration; the CCB was analyzed at the specified frequency and sequence during the analysis; and Preparation Blanks were prepared and analyzed as appropriate for the SDG (e.g., total number of samples, various types of matrices present, number of digestion batches, etc.).
2. Review the results reported on Form 3-IN, as well as the raw data for all blanks, and verify that the results were accurately reported.
3. Evaluate all of the associated blanks for the presence of target analytes. Verify that if the concentration of any target analyte was > CRQL in a Preparation Blank, all associated samples with the analyte’s concentration > CRQL but < 10x the Preparation Blank concentration were redigested and reanalyzed for that analyte. Verify that if a concentration was < (-CRQL) in a Preparation Blank, all associated samples with the analyte’s concentration < 10x CRQL were redigested and reanalyzed. Verify that if the absolute value of any target analytes was > CRQL in an ICB or a CCB, the analysis was terminated, the problem corrected and documented in the SDG

Inorganic Data Review ICP-MS
January 2017 57
Narrative, the instrument recalibrated, and the preceding 10 analytical samples or all analytical samples analyzed since the last compliant calibration blank reanalyzed.
E. Action
NOTES: For ICBs that do not meet the technical criteria, apply the action to all associated samples reported from the analytical sequence.
For CCBs that do not meet the technical criteria, apply the action to all associated samples analyzed between a previous technically acceptable analysis of the CCB and a subsequent technically acceptable analysis of the CCB in the analytical sequence.
For Preparation Blanks that do not meet the technical criteria, apply the action to all associated samples prepared in the same preparation batch.
1. If the appropriate blanks were not analyzed with the specified frequency, use professional judgment to determine if the associated sample data should be qualified. Obtain additional information from the laboratory, if necessary. Record the situation in the Data Review Narrative, and note it for EPA Regional CLP COR action.
2. Action regarding unsuitable blank results depends on the circumstances and origin of the blank. In instances where more than one blank is associated with a given sample, qualification should be based upon a comparison with the associated blank having the highest concentration of contaminant.
3. Some general “technical” review actions include:
a. For any blank (including Preparation Blanks) reported with detects ≤ CRQLs, report sample detects ≤ CRQLs at the CRQLs and qualify as non-detect (U). For any blank (including Preparation Blanks) reported with detects ≤ CRQLs, use professional judgment to qualify the sample results > CRQLs. Non-detects should not be qualified.
b. For any blank (including Preparation Blanks) reported with a negative result ≤ (-MDL) but ≥ (-CRQL), carefully evaluate and determine its effect on the sample data. Use professional judgment to assess the data.
c. The blank analyses may not involve the same weights, volumes, or dilution factors as the associated samples. In particular, soil/sediment sample results reported on Form 1-IN will not be on the same basis (units, dilution) as the calibration blank data reported on Form 3-IN. It may be easier to work with the raw data and/or convert the ICB or CCB results to the same units as the soil/sediment samples for comparison purposes.
4. Specific “method” actions include:
a. If an ICB or a CCB result is > CRQL, the analysis should be terminated. If the analysis was not terminated and the associated samples were not reanalyzed, non-detects should not be qualified. Report detects ≤ CRQLs at the CRQLs and qualify as non-detect (U). Report sample results that are > CRQLs but < ICB/CCB results at ICB/CCB results and use professional judgment to qualify as non-detect (U) or unusable (R). Use professional judgment to qualify sample results ≥ ICB/CCB results. Record the situation in the Data Review Narrative, and note it for EPA Regional CLP COR action.
b. If an ICB or a CCB result is < (-CRQL), the analysis should be terminated. If the analysis was not terminated and the associated samples were not reanalyzed, use professional judgment to qualify non-detects as estimated (UJ) or unusable (R). Use professional judgment to qualify detects ≤ CRQL, or qualify as estimated low (J-). Use professional judgment to qualify sample results that are > CRQLs as estimated low (J-).
c. If the concentration of any analyte in the Preparation Blank is > CRQL, the lowest concentration of that analyte in the associated samples must be ≥ 10x the Preparation Blank concentration. All samples associated with the Preparation Blank with concentrations < 10x
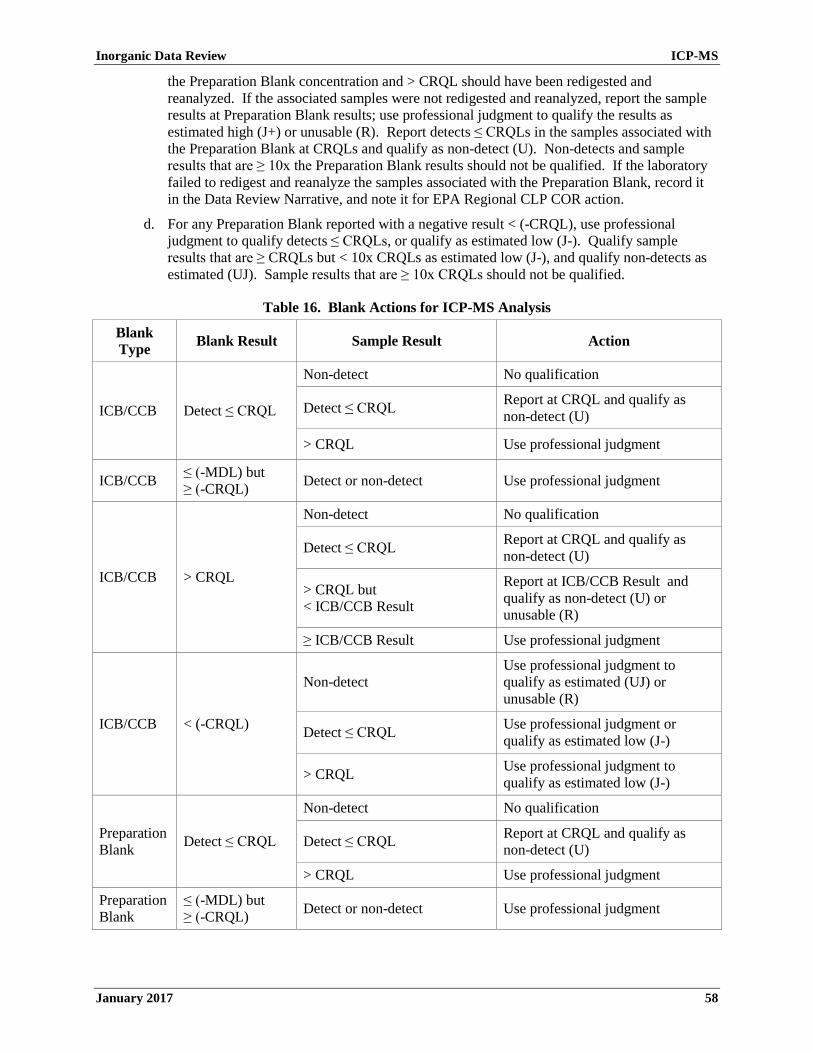
Inorganic Data Review ICP-MS
January 2017 58
the Preparation Blank concentration and > CRQL should have been redigested and reanalyzed. If the associated samples were not redigested and reanalyzed, report the sample results at Preparation Blank results; use professional judgment to qualify the results as estimated high (J+) or unusable (R). Report detects ≤ CRQLs in the samples associated with the Preparation Blank at CRQLs and qualify as non-detect (U). Non-detects and sample results that are ≥ 10x the Preparation Blank results should not be qualified. If the laboratory failed to redigest and reanalyze the samples associated with the Preparation Blank, record it in the Data Review Narrative, and note it for EPA Regional CLP COR action.
d. For any Preparation Blank reported with a negative result < (-CRQL), use professional judgment to qualify detects ≤ CRQLs, or qualify as estimated low (J-). Qualify sample results that are ≥ CRQLs but < 10x CRQLs as estimated low (J-), and qualify non-detects as estimated (UJ). Sample results that are ≥ 10x CRQLs should not be qualified.
Table 16. Blank Actions for ICP-MS Analysis
Blank Type Blank Result Sample Result Action
ICB/CCB Detect ≤ CRQL
Non-detect No qualification
Detect ≤ CRQL Report at CRQL and qualify as non-detect (U)
> CRQL Use professional judgment
ICB/CCB ≤ (-MDL) but ≥ (-CRQL) Detect or non-detect Use professional judgment
ICB/CCB > CRQL
Non-detect No qualification
Detect ≤ CRQL Report at CRQL and qualify as non-detect (U)
> CRQL but < ICB/CCB Result
Report at ICB/CCB Result and qualify as non-detect (U) or unusable (R)
≥ ICB/CCB Result Use professional judgment
ICB/CCB < (-CRQL)
Non-detect Use professional judgment to qualify as estimated (UJ) or unusable (R)
Detect ≤ CRQL Use professional judgment or qualify as estimated low (J-)
> CRQL Use professional judgment to qualify as estimated low (J-)
Preparation Blank Detect ≤ CRQL
Non-detect No qualification
Detect ≤ CRQL Report at CRQL and qualify as non-detect (U)
> CRQL Use professional judgment
Preparation Blank
≤ (-MDL) but ≥ (-CRQL) Detect or non-detect Use professional judgment

Inorganic Data Review ICP-MS
January 2017 59
Blank Type Blank Result Sample Result Action
Preparation Blank > CRQL
Non-detect No qualification
Detect ≤ CRQL Report at CRQL and qualify as non-detect (U)
> CRQL but < 10x the Preparation Blank Result
Report at Preparation Blank Result and use professional judgment to qualify results as estimated high (J+) or unusable (R)
≥ 10x the Preparation Blank Result No qualification
Preparation Blank < (-CRQL)
Non-detect Qualify as estimated (UJ)
Detect ≤ CRQL Use professional judgment or qualify as estimated low (J-)
< 10x CRQL Qualify results that are ≥ CRQL as estimated low (J-)
≥ 10x CRQL No qualification
Inorganic Data Review ICP-MS
January 2017 60
V. Interference Check Sample
A. Review Items
Form 4-IN, Form 12-IN, instrument printouts, and raw data. (SOW ISM02.4 – Exhibit B, Section 3.4 and Exhibit D/ICP-MS, Sections 7.2.4.4 and 12.2)
B. Objective
The objective is to determine the validity of the analytical results based on the instrument’s ability to overcome interferences typical of those found in samples.
C. Criteria
1. The Interference Check Sample (ICS) consists of two solutions: Solution A and Solution AB. Solution A consists of the interferents, and Solution AB consists of the analytes mixed with the interferents. An ICS analysis consists of analyzing both solutions consecutively, starting with Solution A, for all masses used for each analyte or interferent reported by ICP-MS.
2. An ICS must be analyzed undiluted at the beginning of each sample analysis sequence. The ICS is not to be analyzed prior to the ICV, and shall be immediately followed by a CCV, followed by a CCB.
3. Results for the analysis of the ICS Solution A must fall within the control limits of ± 2x the CRQL or ± 20% of the true value (whichever is greater) for the analytes and interferents included in the solution.
4. Results for the analysis of the ICS Solution AB must fall within the control limits of ± 2x the CRQL or ± 20% of the true value (whichever is greater) for the analytes and interferents included in the solution.
5. If the value of an ICS result exceeds ± 2x the CRQL, or ± 20% of the true value (whichever is greater) criteria, the analysis shall be terminated, the problem corrected and documented in the SDG Narrative, the instrument recalibrated, the new calibration then reverified, and all analytical samples analyzed since the last compliant ICS reanalyzed.
6. The ICS should be obtained from the EPA, if available, and analyzed according to the instructions supplied with the solutions. If the ICS is not available from the EPA, an independent ICS solution shall be prepared using certified standards with the interferent and analyte concentrations at the levels specified in the method.
D. Evaluation
1. Verify, using Form 12-IN and the raw data, that the ICS was analyzed at the specified frequency and sequence during the analytical sequence.
2. Evaluate the ICS raw data for results with an absolute value that is ≥ MDL for those analytes that are not present in the ICS solution.
3. Recalculate, using the raw data and the following equation, one or more of the analyte %R values, and verify that the recalculated values agree with the laboratory-reported values on Form 4-IN.
%R = Found (value)True (value)
× 100
Where, Found (value) = Concentration (in µg/L) of each analyte interferent measured in the analysis
of ICS Solution A or ICS Solution AB True (value) = Concentration (in µg/L) of each analyte or interferent in ICS Solution A or
ICS Solution AB

Inorganic Data Review ICP-MS
January 2017 61
4. If the value of an ICS result exceeds ± 2x the CRQL, or ± 20% of the true value (whichever is greater) criteria, and the laboratory failed to terminate the analysis and take the appropriate corrective action, note this for EPA Regional CLP COR action and record the situation in the Data Review Narrative. Use professional judgment to assess the data.
E. Action
NOTE: For an ICS that does not meet the technical criteria, apply the action to all samples reported from the analytical sequence.
1. If the ICS was not analyzed at the specified frequency, qualify detects and non-detects as unusable (R). If the ICS was analyzed, but not in the proper sequence, use professional judgment to qualify detects and non-detects.
2. The raw data may not contain results for interferents. In this case, use professional judgment to qualify the data. If the data contains results for interferents, apply the following actions to samples with concentrations of interferents that are within 10% of the levels of the interferents in the ICS:
a. If the ICS Solution AB %R for an analyte or interferent is < 50%, qualify detects as estimated low (J-) and non-detects as unusable (R).
b. If the ICS %R for an analyte or interferent falls within the range of 50-79% [or the ICS found value is < (true value – 2x the CRQL), whichever is lower], qualify detects as estimated low (J-) and non-detects as estimated (UJ).
c. If the ICS %R for an analyte or interferent falls within the range of 80-120%, detects and non-detects should not be qualified.
d. If the ICS %R for an analyte or interferent is > 120% [or the ICS found value is > (true value + 2x the CRQL), whichever is greater], qualify detects as estimated high (J+). Non-detects should not be qualified.
e. If the ICS %R for an analyte or interferent is above 150%, use professional judgment to determine the qualifications of the associated sample data.
3. If sample results that are ≥ MDLs are observed for analytes which are not present in the ICS solution, the possibility of false positives exists. An evaluation of the associated sample data for the affected analytes should be made. For samples with comparable or higher levels of interferents and with analyte concentrations that approximate those levels found in the ICS, qualify detects as estimated high (J+). Non-detects should not be qualified.
4. If negative sample results are observed for analytes that are not present in the ICS solution, and their absolute values are ≥ MDLs, the possibility of false negatives in the samples exists. An evaluation of the associated sample data for the affected analytes should be made. For samples with levels of interferents that are comparable to or higher than the levels found in the ICS, qualify detects < 10x the absolute value of the negative result as estimated low (J-), and qualify non-detects as estimated (UJ).
NOTE: The same result units should be used when comparing analyte results in samples to those in the ICS. Unit conversion may be necessary when soil/sediment samples are evaluated.
5. If the raw data does not contain results for the interferents, annotate this in the Data Review Narrative.
6. Actions regarding the interpretation and/or the subsequent qualification of ICP data due to the ICS analytical results can be extremely complex. Use professional judgment to determine the need for the associated sample data to be qualified. Obtain additional information from the laboratory, if necessary. Record all interpretive situations in the Data Review Narrative.

Inorganic Data Review ICP-MS
January 2017 62
7. If the ICS acceptance criteria are grossly exceeded, note the specifics for EPA Regional CLP COR action.
Table 17. Interference Check Actions for ICP-MS Analysis
Criteria Action
Detect Non-detect
ICS not analyzed R R
ICS not analyzed in proper sequence Use professional judgment
Use professional judgment
ICSAB %R < 50% J- R
ICS %R 50-79% [or ICS found value is < (true value – 2x CRQL), whichever is lower] J- UJ
ICS %R 80-120% No qualification No qualification
ICS %R > 120% [or ICS true value is > (true value + 2x CRQL), whichever is greater] J+ No qualification
ICS %R > 150% Use professional judgment
Use professional judgment
Sample results ≥ MDLs, but not present in ICS J+ No qualification
Negative sample results, but not present in ICS
J- for results < 10x (|negative sample
result|)
UJ

Inorganic Data Review ICP-MS
January 2017 63
VI. Laboratory Control Sample
A. Review Items
Form 7-IN, preparation logs, instrument printouts, and raw data. (SOW ISM02.4 – Exhibit B, Section 3.4 and Exhibit D/ICP-MS, Section 12.5)
B. Objective
The objective is to determine the validity of the analytical results based on the recovery of the digested Laboratory Control Sample (LCS).
C. Criteria
1. Aqueous/water and soil/sediment LCSs shall be analyzed for each analyte utilizing the same sample preparations, analytical methods, and Quality Assurance/Quality Control (QA/QC) procedures as employed for the samples.
a. One LCS shall be prepared and analyzed for every group of aqueous/water or soil/sediment samples in an SDG, or with each batch of samples digested, whichever is more frequent. The LCS shall be spiked such that the final digestate contains each analyte at 2x the CRQL for the associated matrix.
b. All LCS %Rs must fall within the control limits of 70-130%. If the %R for the LCS falls outside of the control limits, the analysis should be terminated, the problem corrected and documented in the SDG Narrative, and the samples prepared with that LCS redigested and reanalyzed.
D. Evaluation
1. Verify, using Form 7-IN, preparation logs, and raw data, that the appropriate number of required LCSs were prepared and analyzed for the SDG.
2. Verify, using Form 7-IN, that all results for each analyte fall within the established control limits.
a. Check the raw data to verify that the %Rs on Form 7-IN were accurately transcribed. Recalculate one or more of the reported %Rs using the following equation:
%R = Found (value)True (value)
× 100
Where, Found (value) = Concentration of each analyte (in µg/L or mg/kg) measured in the
analysis of the LCS True (value) = Concentration of each analyte (in µg/L or mg/kg) in the LCS
3. Verify that the LCS was prepared at the same time as the associated samples using the same procedures.
E. Action
NOTE: If the LCS criteria are not met, the laboratory performance and method accuracy are in question. Use professional judgment to determine if the data should be qualified or rejected. The following guidance is suggested for qualifying sample data associated with an LCS that does not meet the required criteria.
For an LCS that does not meet the technical criteria, apply the action to all samples in the same preparation batch.

Inorganic Data Review ICP-MS
January 2017 64
1. If the required LCS was not analyzed at the specified frequency, use professional judgment to determine if the associated sample data should be qualified. Obtain additional information from the laboratory, if necessary. If a laboratory fails to analyze an LCS with each SDG, or if a laboratory consistently fails to generate acceptable LCS recoveries, record the situation in the Data Review Narrative, and note it for EPA Regional CLP COR action. Detects should be qualified as estimated (J) and non-detects as estimated (UJ).
2. LCS for all matrices:
a. If the LCS %R is < 40%, qualify detects as estimated low (J-) and non-detects as unusable (R).
b. If the LCS %R falls within the range of 40-69%, qualify detects as estimated low (J-) and non-detects as estimated (UJ).
c. If the LCS %R falls within the range of 70-130%, detects and non-detects should not be qualified.
d. If the LCS %R is > 130%, qualify detects as estimated high (J+). Non-detects should not be qualified.
e. If the LCS %R is > 150%, qualify detects as unusable (R). Non-detects should not be qualified.
3. Annotate the potential effects on the data due to out-of-control LCS results in the Data Review Narrative.
Table 18. LCS Actions for ICP-MS Analysis
Criteria Action
Detect Non-detect
Aqueous/Water and Soil/Sediment %R < 40% J- R
Aqueous/Water and Soil/Sediment %R 40-69% J- UJ
Aqueous/Water and Soil/Sediment %R 70-130% No qualification No qualification
Aqueous/Water and Soil/Sediment %R > 130% J+ No qualification
Aqueous/Water and Soil/Sediment %R > 150% R No qualification

Inorganic Data Review ICP-MS
January 2017 65
VII. Duplicate Sample Analysis
A. Review Items
SDG Cover Page, Form 6-IN, instrument printouts, and raw data. (SOW ISM02.4 – Exhibit B, Section 3.4 and Exhibit D/ICP-MS, Section 12.4)
B. Objective
The objective of duplicate sample analysis is to demonstrate acceptable method precision by the laboratory at the time of analysis.
C. Criteria
1. Samples identified as field blanks or Performance Evaluation (PE) samples cannot be used for duplicate sample analysis.
2. At least one duplicate sample shall be prepared and analyzed from each group of samples of a similar matrix type (e.g., aqueous/water or soil/sediment) or for each SDG. Duplicates cannot be averaged for reporting on Form 1-IN. Additional duplicate sample analyses may be required by EPA Regional request. Alternately, the EPA Region may require that a specific sample be used for the duplicate sample analysis.
3. A control limit of 20% for the Relative Percent Difference (RPD) shall be used for original and duplicate sample values ≥ 5x the CRQL.
4. A control limit of the CRQL shall be used if either the sample or duplicate value is < 5x the CRQL. The absolute value of the control limit (CRQL) shall be entered in the “Control Limit” column on Form 6-IN. If both samples are non-detects, the RPD is not calculated for Form 6-IN.
NOTE: The above control limits are method requirements for duplicate samples, regardless of the sample matrix type. However, it should be noted that laboratory variability arising from the sub-sampling of non-homogenous soil samples is a common occurrence. Therefore, for technical review purposes only, EPA Regional policy or project Data Quality Objectives (DQOs) may allow the use of less restrictive criteria (e.g., 35% RPD, 2x the CRQL) to be assessed against duplicate soil samples.
D. Evaluation
1. Verify, from the SDG Cover Page and the raw data, that the appropriate number of required duplicate samples were prepared and analyzed for the SDG.
2. Verify, using Form 6-IN and the raw data, that all duplicate results for each analyte fall within the established control limits.
3. Verify that a field blank or PE sample was not used for duplicate analysis.
4. Check the raw data and recalculate one or more of the RPD values using the following equation to verify that the results were correctly reported on Form 6-IN:
RPD = |S - D|
(S + D) / 2 × 100
Where, RPD = Relative Percent Difference S = Sample Result (original) D = Duplicate Result

Inorganic Data Review ICP-MS
January 2017 66
E. Action
NOTE: For a duplicate sample analysis that does not meet the technical criteria, apply the action to all samples of the same matrix if the samples are considered sufficiently similar. Exercise professional judgment in determining sample similarity when making use of all available data, including: site and sampling documentation (e.g., location and type of sample, descriptive data, soil classification); field test data (e.g., pH, Eh, conductivity, chlorine); and laboratory data for other parameters [e.g., Total Suspended Solids (TSS), Total Dissolved Solids (TDS), Total Organic Carbon (TOC), alkalinity or buffering capacity, reactive sulfide, anions]. Additionally, use the sample data (e.g., similar concentrations of analytes) in determining similarity between samples in the SDG. Two possible determinations are: 1) only some of the samples in the SDG are similar to the duplicate sample, and that only these samples should be qualified; or 2) no samples are sufficiently similar to the sample used for the duplicate, and thus only the field sample used to prepare the duplicate sample should be qualified.
1. If the appropriate number of duplicate samples were not analyzed for each matrix using the correct frequency, use professional judgment to determine if the associated sample data should be qualified. Obtain additional information from the laboratory, if necessary. Record the situation in the Data Review Narrative, and note it for EPA Regional CLP COR action. Detects should be qualified as estimated (J) and non-detects as estimated (UJ) if any of the frequency criteria is not met.
2. If both original sample and duplicate sample results are ≥ 5x the CRQL and the RPD is > 20%, qualify detects as estimated (J) and non-detects as estimated (UJ).
3. If the RPD is > 100%, use professional judgment to determine if the associated sample data should be qualified.
4. If both original sample and duplicate sample results are ≥ 5x the CRQL and the RPD is ≤ 20%, detects and non-detects should not be qualified.
5. If the original sample or duplicate sample result is < 5x the CRQL (including non-detects) and the absolute difference between sample and duplicate is > CRQL, qualify detects as estimated (J) and non-detects as estimated (UJ).
6. If the original sample or duplicate sample result is < 5x the CRQL (including non-detects) and the absolute difference between sample and duplicate is ≤ CRQL, detects and non-detects should not be qualified.
7. If a field blank or PE sample was used for the duplicate sample analysis, note this for EPA Regional CLP COR action. All of the other QC data must then be carefully checked. Use professional judgment when evaluating the data.
8. Annotate the potential effects on the data due to out-of-control duplicate sample results in the Data Review Narrative.

Inorganic Data Review ICP-MS
January 2017 67
Table 19. Duplicate Sample Actions for ICP-MS Analysis
Criteria Action
Detect Non-detect
Both original sample and duplicate sample results are ≥ 5x the CRQL and RPD > 20%* J UJ
Both original sample and duplicate sample results are ≥ 5x the CRQL and RPD ≤ 20% No qualification No qualification
RPD > 100% Use professional judgment
Use professional judgment
Original sample or duplicate sample result < 5x the CRQL (including non-detects) and absolute difference between sample and duplicate > CRQL*
J UJ
Original sample or duplicate sample result < 5x the CRQL (including non-detects) and absolute difference between sample and duplicate ≤ CRQL
No qualification No qualification
* The above control limits are method requirements for duplicate samples, regardless of the sample matrix type. However, it should be noted that laboratory variability arising from the sub-sampling of non-homogenous soil samples is a common occurrence. Therefore, for technical review purposes only, EPA Regional policy or project DQOs may allow the use of less restrictive criteria (e.g., 35% RPD, 2x the CRQL) to be assessed against duplicate soil samples.
Inorganic Data Review ICP-MS
January 2017 68
VIII. Spike Sample Analysis
A. Review Items
SDG Cover Page, Form 5A-IN, Form 5B-IN, instrument printouts, and raw data. (SOW ISM02.4 – Exhibit B, Section 3.4 and Exhibit D/ICP-MS, Section 12.3)
B. Objective
The objective of the spiked sample analysis is to evaluate the effect of each sample matrix on the sample preparation procedures and the measurement methodology.
C. Criteria
1. Samples identified as field blanks or PE samples cannot be used for spiked sample analysis.
2. At least one spiked sample (pre-digestion) shall be prepared and analyzed from each group of samples with a similar matrix type (e.g., aqueous/water or soil/sediment), or for each SDG.
3. When the Matrix Spike recovery falls outside of the control limits and the sample result is < 4x the spike added, a post-digestion spike shall be performed for those analytes that do not meet the specified criteria. An aliquot of the remaining unspiked sample shall be spiked at 2x the indigenous level or 2x the CRQL, whichever is greater.
4. The spike %R shall be within the established acceptance limits. However, spike recovery limits do not apply when the sample concentration is ≥ 4x the spike added. In such an event, the data shall be reported unflagged, even if the %R does not meet the acceptance criteria.
5. If the spiked sample analysis was performed on the same sample that was chosen for the duplicate sample analysis, spike calculations shall be performed using the results of the sample designated as the “original sample”. The average of the duplicate results cannot be used for the purpose of determining the %R.
NOTE: The final spike concentrations required for the various target analytes are presented in the methods described in the SOW.
D. Evaluation
1. Verify, using the SDG Cover Page, Form 5A-IN, and raw data, that the appropriate number of required spiked samples was prepared and analyzed for the SDG.
2. Verify that a field blank or PE sample was not used for the spiked sample analysis.
3. Verify, using Form 5A-IN and the raw data, that all pre-digestion spiked sample results for each required analyte fall within the established control limits If not, verify that a post-digestion spike was prepared and analyzed.
4. Recalculate, using the raw data, one or more of the %R values using the following equation, and verify that the recalculated values agree with the laboratory-reported values on Forms 5A-IN and 5B-IN:
%Recovery = SSR-SR
SA × 100
Where, SSR = Spiked Sample Result SR = Sample Result SA = Spike Added
NOTE: When the sample result is < MDL or reported as a non-detect, use SR = 0 only for the purpose of calculating the %R. The actual spiked sample results, sample results, and %R (positive or negative) shall still be reported on Forms 5A-IN and 5B-IN.

Inorganic Data Review ICP-MS
January 2017 69
E. Action
NOTE: For a Matrix Spike that does not meet the technical criteria, apply the action to all samples of the same matrix, if the samples are considered sufficiently similar. Exercise professional judgment in determining sample similarity when making use of all available data, including: site and sampling documentation (e.g., location and type of sample, descriptive data, soil classification); field test data (e.g., pH, Eh, conductivity, chlorine); and laboratory data for other parameters (e.g., TSS, TDS, TOC, alkalinity or buffering capacity, reactive sulfide, anions). Additionally, use the sample data (e.g., similar concentrations of analytes) in determining similarity between samples in the SDG. Two possible determinations are: 1) only some of the samples in the SDG are similar to the Matrix Spike sample, and that only these samples should be qualified; or 2) no samples are sufficiently similar to the sample used for the Matrix Spike, and thus only the field sample used to prepare the Matrix Spike sample should be qualified.
1. If the appropriate number of Matrix Spike samples were not analyzed for each matrix using the correct frequency, use professional judgment to determine if the associated sample data should be qualified. Obtain additional information from the laboratory, if necessary. Record the situation in the Data Review Narrative, and note it for EPA Regional CLP COR action. Detects should be qualified as estimated (J) and non-detects as estimated (UJ) if any of the frequency criteria is not met.
2. If a field blank or PE sample was used for the spiked sample analysis, note this for EPA Regional CLP COR action. All of the other QC data must then be carefully checked. Use professional judgment when evaluating the data. Detects should be qualified as estimated (J) and non-detects as estimated (UJ).
3. If the Matrix Spike recovery does not meet the evaluation criteria and a required post-digestion spike was not performed, note this for EPA Regional CLP COR action.
4. If the Matrix Spike %R is < 30%, verify that a post-digestion spike was analyzed. If the post-digestion spike %R is < 75% or the analysis was not performed, qualify detects as estimated low (J-) and non-detects as unusable (R). If the post-digestion spike %R is ≥ 75%, qualify detects as estimated (J) and non-detects as estimated (UJ).
5. If the Matrix Spike %R falls within the range of 30-74%, verify that a post-digestion spike was analyzed (if required when sample concentration is < 4x spike added). If the post-digestion spike %R is < 75% or the analysis was not performed, qualify detects as estimated low (J-) and non-detects as estimated (UJ). If the post-digestion spike %R is ≥ 75%, qualify detects as estimated (J) and non-detects as estimated (UJ).
6. If the Matrix Spike %R falls within the range of 75-125%, no post-digestion spike is required. Detects and non-detects should not be qualified.
7. If the Matrix Spike %R is > 125%, verify that a post-digestion spike was analyzed (if required when sample concentration is < 4x spike added). If the post-digestion spike %R is > 125% or the analysis was not performed, qualify detects as estimated high (J+); non-detects should not be qualified. If the post-digestion spike %R is ≤ 125%, qualify detects as estimated (J); non-detects should not be qualified.
8. Annotate the potential effects on the data due to out-of-control spiked sample results in the Data Review Narrative.
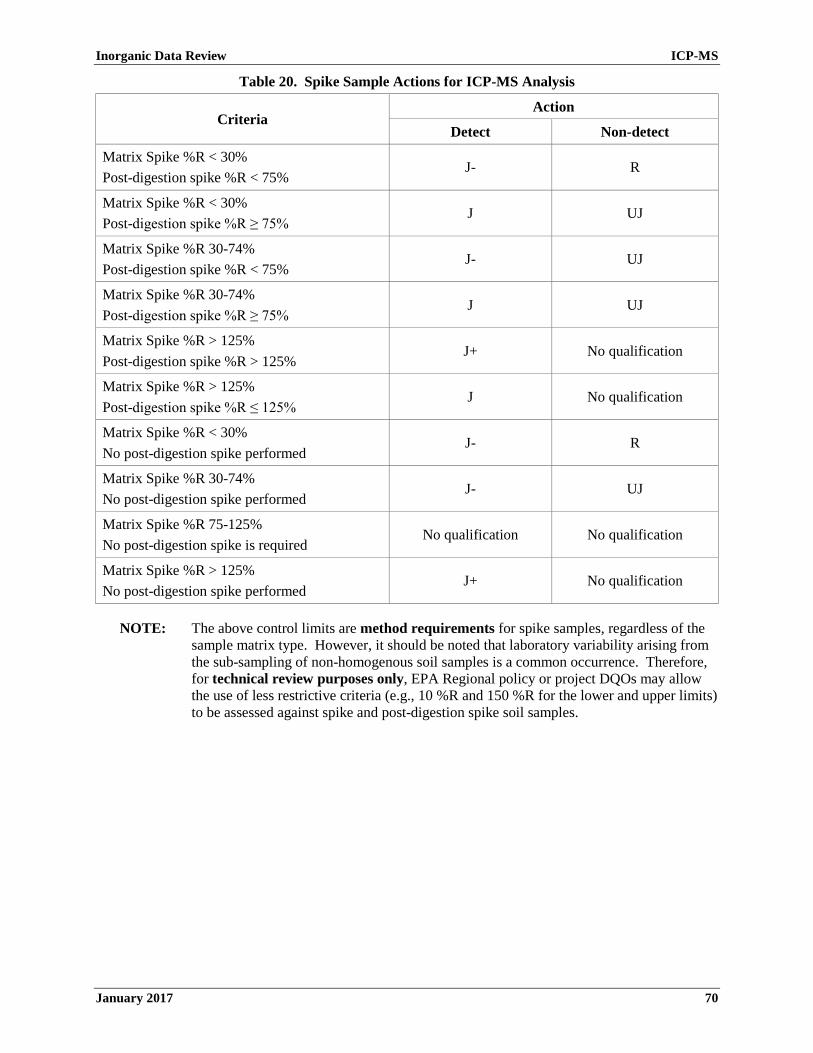
Inorganic Data Review ICP-MS
January 2017 70
Table 20. Spike Sample Actions for ICP-MS Analysis
Criteria Action
Detect Non-detect
Matrix Spike %R < 30% Post-digestion spike %R < 75%
J- R
Matrix Spike %R < 30% Post-digestion spike %R ≥ 75%
J UJ
Matrix Spike %R 30-74% Post-digestion spike %R < 75%
J- UJ
Matrix Spike %R 30-74% Post-digestion spike %R ≥ 75%
J UJ
Matrix Spike %R > 125% Post-digestion spike %R > 125%
J+ No qualification
Matrix Spike %R > 125% Post-digestion spike %R ≤ 125%
J No qualification
Matrix Spike %R < 30% No post-digestion spike performed
J- R
Matrix Spike %R 30-74% No post-digestion spike performed
J- UJ
Matrix Spike %R 75-125% No post-digestion spike is required
No qualification No qualification
Matrix Spike %R > 125% No post-digestion spike performed
J+ No qualification
NOTE: The above control limits are method requirements for spike samples, regardless of the sample matrix type. However, it should be noted that laboratory variability arising from the sub-sampling of non-homogenous soil samples is a common occurrence. Therefore, for technical review purposes only, EPA Regional policy or project DQOs may allow the use of less restrictive criteria (e.g., 10 %R and 150 %R for the lower and upper limits) to be assessed against spike and post-digestion spike soil samples.
Inorganic Data Review ICP-MS
January 2017 71
IX. Serial Dilution
A. Review Items
Form 1-IN, Form 8-IN, instrument printouts, and raw data. (SOW ISM02.4 – Exhibit B, Section 3.4 and Exhibit D/ICP-MS, Section 12.6)
B. Objective
The objective of the serial dilution analysis is to determine whether or not significant physical or chemical interferences exist due to sample matrix.
C. Criteria
1. An ICP Serial Dilution analysis shall be performed on a sample from each group of samples with a similar matrix type (e.g., aqueous/water or soil/sediment) or for each SDG, whichever is more frequent.
2. Samples identified as field blanks or PE samples cannot be used for the ICP Serial Dilution analysis.
3. If the analyte concentration is sufficiently high (concentration in the original sample is > 50x the MDL that is calculated for the sample), the %D between the original determination and the serial dilution analysis (a five-fold dilution) after correction for dilution (concentration in the serial dilution sample is ≥ CRQL) shall be ≤ 10%.
NOTE: The above criteria are method requirements for serial dilution samples, regardless of the sample matrix type. However, for technical review purposes only, EPA Regional policy or project DQOs may allow the use of less restrictive criteria (e.g., %D > 15%) to be assessed against serial dilution soil samples.
D. Evaluation
1. Verify that a field blank or PE sample was not used for the serial dilution analysis.
2. Check the raw data and recalculate the %D using the following equation. Verify that the serial dilution analysis results and the calculated %D results agree with the values reported by the laboratory on Form 8-IN:
%Difference = |I-S|
I × 100
Where, I = Initial Sample Result S = Serial Dilution Result
3. Check the raw data for any evidence of positive or negative interference (results from the diluted sample which are significantly different than the original sample), possibly due to high levels of dissolved solids in the sample, ionization effects, etc.
E. Action
NOTE: For a serial dilution that does not meet the technical criteria, apply the action to all samples of the same matrix if the samples are considered sufficiently similar. Exercise professional judgment in determining sample similarity when making use of all available data, including: site and sampling documentation (e.g., location and type of sample, descriptive data, soil classification); field test data (e.g., pH, Eh, conductivity, chlorine); and laboratory data for other parameters (e.g., TSS, TDS, TOC, alkalinity or buffering capacity, reactive sulfide, anions). Additionally, use the sample data (e.g., similar concentrations of analytes) in determining similarity between samples in the SDG. Two possible determinations are: 1) only some of the samples in the SDG are similar to the serial dilution sample, and that only these samples should be qualified; or 2) no samples
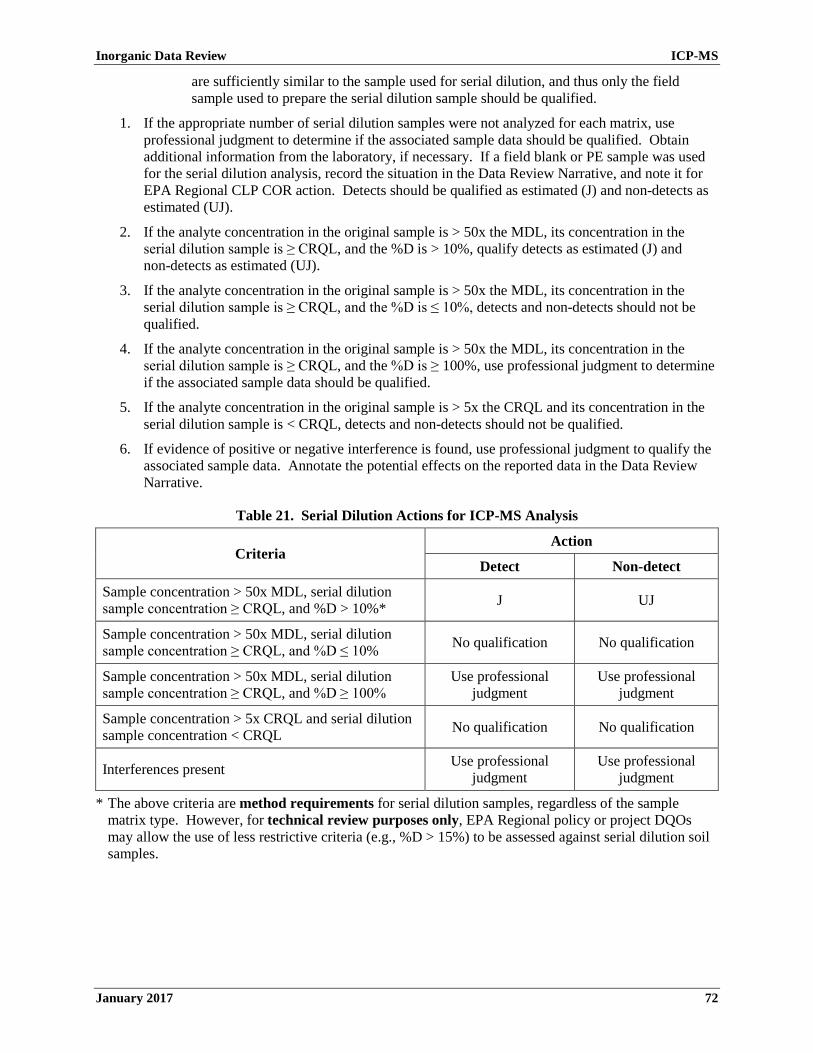
Inorganic Data Review ICP-MS
January 2017 72
are sufficiently similar to the sample used for serial dilution, and thus only the field sample used to prepare the serial dilution sample should be qualified.
1. If the appropriate number of serial dilution samples were not analyzed for each matrix, use professional judgment to determine if the associated sample data should be qualified. Obtain additional information from the laboratory, if necessary. If a field blank or PE sample was used for the serial dilution analysis, record the situation in the Data Review Narrative, and note it for EPA Regional CLP COR action. Detects should be qualified as estimated (J) and non-detects as estimated (UJ).
2. If the analyte concentration in the original sample is > 50x the MDL, its concentration in the serial dilution sample is ≥ CRQL, and the %D is > 10%, qualify detects as estimated (J) and non-detects as estimated (UJ).
3. If the analyte concentration in the original sample is > 50x the MDL, its concentration in the serial dilution sample is ≥ CRQL, and the %D is ≤ 10%, detects and non-detects should not be qualified.
4. If the analyte concentration in the original sample is > 50x the MDL, its concentration in the serial dilution sample is ≥ CRQL, and the %D is ≥ 100%, use professional judgment to determine if the associated sample data should be qualified.
5. If the analyte concentration in the original sample is > 5x the CRQL and its concentration in the serial dilution sample is < CRQL, detects and non-detects should not be qualified.
6. If evidence of positive or negative interference is found, use professional judgment to qualify the associated sample data. Annotate the potential effects on the reported data in the Data Review Narrative.
Table 21. Serial Dilution Actions for ICP-MS Analysis
Criteria Action
Detect Non-detect
Sample concentration > 50x MDL, serial dilution sample concentration ≥ CRQL, and %D > 10%* J UJ
Sample concentration > 50x MDL, serial dilution sample concentration ≥ CRQL, and %D ≤ 10% No qualification No qualification
Sample concentration > 50x MDL, serial dilution sample concentration ≥ CRQL, and %D ≥ 100%
Use professional judgment
Use professional judgment
Sample concentration > 5x CRQL and serial dilution sample concentration < CRQL No qualification No qualification
Interferences present Use professional judgment
Use professional judgment
* The above criteria are method requirements for serial dilution samples, regardless of the sample matrix type. However, for technical review purposes only, EPA Regional policy or project DQOs may allow the use of less restrictive criteria (e.g., %D > 15%) to be assessed against serial dilution soil samples.
Inorganic Data Review ICP-MS
January 2017 73
X. Internal Standards
A. Review Items
Form 11-IN, Form 14-IN, instrument printouts, and raw data. (SOW ISM02.4 – Exhibit B, Section 3.4 and Exhibit D/ICP-MS, Sections 7.2.4.2 and 12.7)
B. Objective
The objective of internal standard analysis is to determine the existence and magnitude of instrument drift and physical interferences.
C. Criteria
1. All samples analyzed during an analytical sequence, with the exception of the tune, shall contain internal standards. A minimum of five internal standards from the following list shall be added to each sample: Li (the Li6 isotope); Sc; Y; Rh; In; Tb; Ho; Lu; and Bi. If the laboratory uses lithium as an internal standard, the laboratory shall use an Li6-enriched standard. The laboratory shall monitor the same internal standards throughout the entire analytical sequence and shall assign each analyte to at least one internal standard.
2. The intensity of the internal standard response in a sample is monitored and compared to the intensity of the response for that internal standard in the calibration blank. The Percent Relative Intensity (%RI) in the sample shall fall within 60-125% of the response in the calibration blank. When collision or reaction cells are used, both the target analyte and associated internal standard responses shall be monitored in the same mode.
3. If the %RI of the response in the sample falls outside of these limits, the laboratory shall reanalyze the original sample at a two-fold dilution with internal standard added.
D. Evaluation
1. Verify, using Form 14-IN and the raw data, that a minimum of five internal standards from the specified list were used for the analysis; that the same internal standards were monitored for the entire analytical sequence; and that each analyte was associated to at least one internal standard.
2. Verify, using Form 14-IN and the raw data, that these internal standards were added to each sample in the analytical sequence, including calibrations, samples, and QC samples (except tune).
3. Verify, using Form 14-IN, that the %RI between an internal standard in a sample and the internal standard in the calibration blank was reported for each sample.
4. Verify, using Form 11-IN, Form 14-IN, and the raw data, that if the %RI for a sample was outside the limits (60-125%), the sample was reanalyzed at a two-fold dilution with internal standard added.
E. Action
NOTE: Apply the action to the affected analytes for each sample that does not meet the internal standard criteria.
1. If no internal standards were analyzed with the analytical sequence, detects and non-detects should be qualified as unusable (R). Record this issue in the Data Review Narrative, and note it for EPA Regional CLP COR action.
2. If less than five of the required internal standards were analyzed with the analytical sequence, or (a) target analyte(s) is (are) not associated to an internal standard, the sample results for the analyte(s) not associated to an internal standard should be qualified as unusable (R). Record this issue in the Data Review Narrative, and note it for EPA Regional CLP COR action.
3. If the %RI for the internal standards in a sample falls within the range of 60-125%, the sample results should not be qualified.
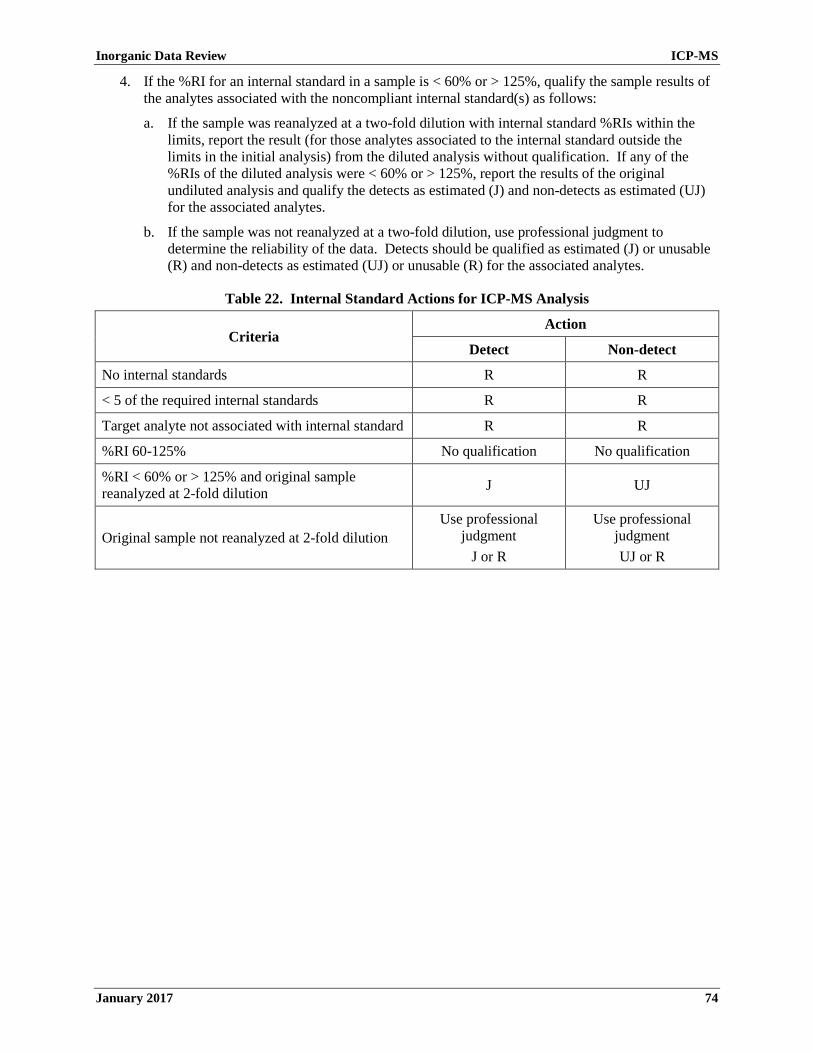
Inorganic Data Review ICP-MS
January 2017 74
4. If the %RI for an internal standard in a sample is < 60% or > 125%, qualify the sample results of the analytes associated with the noncompliant internal standard(s) as follows:
a. If the sample was reanalyzed at a two-fold dilution with internal standard %RIs within the limits, report the result (for those analytes associated to the internal standard outside the limits in the initial analysis) from the diluted analysis without qualification. If any of the %RIs of the diluted analysis were < 60% or > 125%, report the results of the original undiluted analysis and qualify the detects as estimated (J) and non-detects as estimated (UJ) for the associated analytes.
b. If the sample was not reanalyzed at a two-fold dilution, use professional judgment to determine the reliability of the data. Detects should be qualified as estimated (J) or unusable (R) and non-detects as estimated (UJ) or unusable (R) for the associated analytes.
Table 22. Internal Standard Actions for ICP-MS Analysis
Criteria Action
Detect Non-detect
No internal standards R R
< 5 of the required internal standards R R
Target analyte not associated with internal standard R R
%RI 60-125% No qualification No qualification
%RI < 60% or > 125% and original sample reanalyzed at 2-fold dilution J UJ
Original sample not reanalyzed at 2-fold dilution Use professional
judgment J or R
Use professional judgment UJ or R

Inorganic Data Review ICP-MS
January 2017 75
XI. Performance Evaluation Sample
A. Review Items
Form 1-IN, TR/COC Record documentation, preparation logs, instrument printouts, and raw data. (SOW ISM02.4 – Exhibit B, Section 3.4 and Exhibit F, Section 4.1)
B. Objective
The objective is to determine the validity of the analytical results based on the recovery of the PE sample(s).
C. Criteria
1. Matrix-specific PE samples shall be analyzed utilizing the same analytical methods and QA/QC procedures as employed for the samples, at a frequency to be determined by each EPA Region for each site. PE samples must be analyzed in an SDG containing field samples for the Case, using the same procedures, reagents, and instrumentation.
D. Evaluation
1. Verify, using Form 1-IN, preparation logs, and raw data, that the PE samples were analyzed with the field samples and field blanks in the SDG.
2. Verify, using Form 1-IN, that the PE sample results are within the warning limits (95% confidence interval) and action limits (99% confidence interval).
3. If a significant number (i.e., half or more) of the analytes in the PE samples fall outside of the 95% warning or 99% action criteria, or a number of false positive results are reported, evaluate the overall impact on the data.
E. Action
NOTE: If the PE sample criteria are not met, the laboratory performance and method accuracy are in question. Use professional judgment to determine if the data should be qualified or rejected. The following guidance is suggested for qualifying sample data associated with a PE sample that does not meet the required criteria.
For a PE sample that does not meet the technical criteria, apply the action to all samples in the same preparation batch. If the concentration of any analyte in a PE sample is not comparable to the analyte’s concentration in the field samples or field blanks (i.e., it is much higher or much lower than the concentration in these samples), the action may be applied to only those samples in which the analyte’s concentration is comparable to the PE sample concentration.
1. If the PE sample was not analyzed with the field samples and field blanks, use professional judgment to determine if the associated sample results should be qualified. Obtain additional information from the laboratory, if necessary. If a laboratory fails to analyze the PE sample(s) provided with field samples and field blanks, or if a laboratory consistently fails to generate acceptable PE sample results, record the situation in the Data Review Narrative, and note it for EPA Regional CLP COR action.
2. If the PE sample results are outside the lower warning limits but inside the lower action limits, qualify detects as estimated low (J-) and non-detects as estimated (UJ).
3. If the PE sample results are outside the lower action limits, qualify detects as estimated low (J-) and non-detects as unusable (R).
4. If the PE sample results are within the limits, detects and non-detects should not be qualified.
5. If the PE sample results are outside the upper warning limits but inside the upper action limits, qualify detects as estimated high (J+). Non-detects should not be qualified.
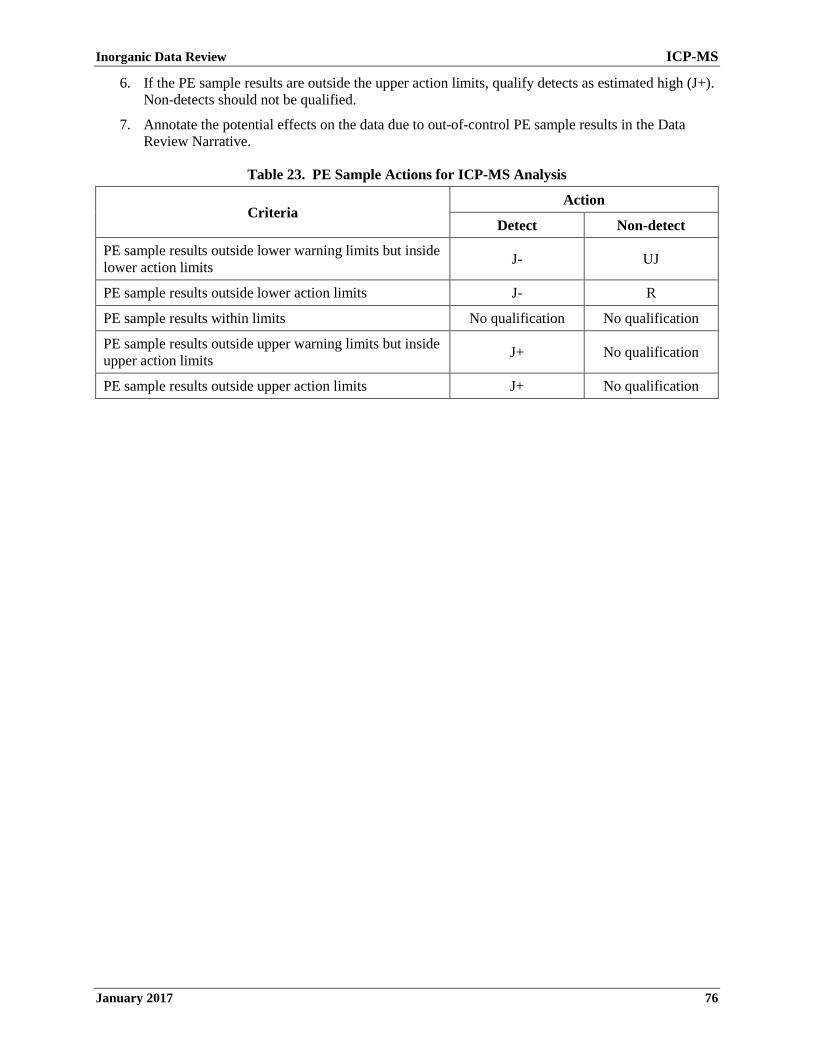
Inorganic Data Review ICP-MS
January 2017 76
6. If the PE sample results are outside the upper action limits, qualify detects as estimated high (J+). Non-detects should not be qualified.
7. Annotate the potential effects on the data due to out-of-control PE sample results in the Data Review Narrative.
Table 23. PE Sample Actions for ICP-MS Analysis
Criteria Action
Detect Non-detect
PE sample results outside lower warning limits but inside lower action limits J- UJ
PE sample results outside lower action limits J- R
PE sample results within limits No qualification No qualification
PE sample results outside upper warning limits but inside upper action limits J+ No qualification
PE sample results outside upper action limits J+ No qualification
Inorganic Data Review ICP-MS
January 2017 77
XII. Regional Quality Assurance and Quality Control
A. Review Items
Form 1-IN, instrument printouts, and raw data. (SOW ISM02.4 – Exhibit B, Sections 2.4 and 3.4)
B. Objective
The objective is to use results from the analysis of EPA Regional QA/QC samples such as field blanks, blind spikes, and blind blanks to determine the validity of the analytical results.
C. Criteria
Criteria are determined by each EPA Region.
1. The frequency of EPA Regional QA/QC samples should be defined in the project QAPP.
2. Performance criteria for EPA Regional QA/QC samples should also be defined in the project QAPP.
3. The EPA Region may provide the laboratory with PE samples to be analyzed with each SDG. These samples may include blind spikes and/or blind blanks. The laboratory must analyze a PE sample when provided by the EPA Region. Refer to Section IV, above, for blanks criteria. Refer to Section XI, above, for PE samples criteria.
4. The RPD between field duplicates shall fall within the specific limits in the EPA Region’s Standard Operating Procedure (SOP) or project QAPP.
D. Evaluation
1. Evaluation procedures must follow the EPA Region’s SOP for data review.
2. Determine whether the results of EPA Regional QA/QC samples impact all samples in the project or only those directly associated (i.e., in the same SDG, collected on the same day, prepared together, or contained in the same analytical sequence).
3. Calculate the RPD between field duplicates and provide this information in the Data Review Narrative. Also verify that the value falls within the specific limits in the EPA Region’s SOP or project QAPP.
4. Determine whether poor precision is the fault of the laboratory, or a result of sample non-homogeneity in the field. Laboratory observations of sample appearance may become important in these situations.
E. Action
1. Any action must be in accordance with EPA Regional specifications and the criteria for acceptable field duplicate sample results.
2. Note unacceptable results for field duplicate samples for EPA Regional CLP COR action.
3. In general, for EPA Regional QA/QC performance not within QAPP specification, qualify detects as estimated (J) and non-detects as estimated (UJ). The impact on overall data quality should be assessed after consultation with the data user and/or field personnel. Contact the EPA Regional CLP COR if reanalysis of samples is required.

Inorganic Data Review ICP-MS
January 2017 78
XIII. Overall Assessment of Data
A. Review Items
Entire sample data package, data review results, preparation logs, calibration standard logs, instrument logs, instrument printouts, and raw data (including any confirmation data).
B. Objective
The objective is to provide the overall assessment on data quality and usability.
C. Criteria
1. Review all available materials to assess the overall quality of the data, keeping in mind the additive nature of analytical problems.
2. Reported analyte concentrations must be quantitated according to the appropriate equations, as listed in the method. All sample results must be within the linear calibration ranges per the methods. Percent Solids (%Solids) must be properly used for all applicable matrix result calculations.
D. Evaluation
Examine the raw data to verify that the correct calculation of the sample results was reported by the laboratory. Digestion logs, instrument printouts, etc., should be compared to the reported sample results recorded on the appropriate Inorganic Data Reporting Forms (Form 1-IN through Form 16-IN).
1. Evaluate any technical problems not previously addressed.
2. Examine the raw data for any anomalies (e.g., baseline shifts, negative response, mass dependent drift, omissions, illegibility, etc.).
3. Verify that appropriate methods and volumes were used to prepare the samples for analysis. If reduced volumes were used, verify that the laboratory had received EPA Regional CLP COR approval for the use of the reduced volume.
4. Verify that there are no transcription or reduction errors (e.g., dilutions, %Solids, sample weights, etc.) on one or more samples. Recalculate %Solids for at least 10% of the samples and verify that the calculated %Solids agree with that reported by the library.
5. Verify that MDLs are properly reported and that they are not greater than the respective CRQLs.
6. Verify that results fall within the calibrated range(s) of the ICP instrument(s) (Form 15-IN).
7. If appropriate information is available, assess the usability of the data to assist the data user in avoiding inappropriate use of the data. Review all available information, including the Quality Assurance Project Plan (QAPP), focusing specifically on the acceptance or performance criteria, the SOPs, and communication with the user concerning the intended use and desired quality of these data.
E. Action
1. Use professional judgment to determine if there is any need to qualify data which were not qualified based on the QC criteria previously discussed.
2. Use professional judgment to qualify detects and non-detects if the MDL exceeds the CRQL.
3. If a sample is not diluted properly when sample results exceed the upper limit of the calibration range, qualify detects as estimated (J).

Inorganic Data Review ICP-MS
January 2017 79
4. Write a brief Data Review Narrative to give the user an indication of the limitations of the analytical data. Annotate any discrepancies between the data and the SDG Narrative for EPA Regional CLP COR action. If sufficient information on the intended use and required quality of the data is available, include an assessment of the data usability within the given context.
5. If any discrepancies are found, notify the EPA Regional CLP COR. The EPA Regional CLP COR may contact the laboratory to obtain additional information for resolution. If a discrepancy remains unresolved, use professional judgment to determine if qualification of the data is warranted.
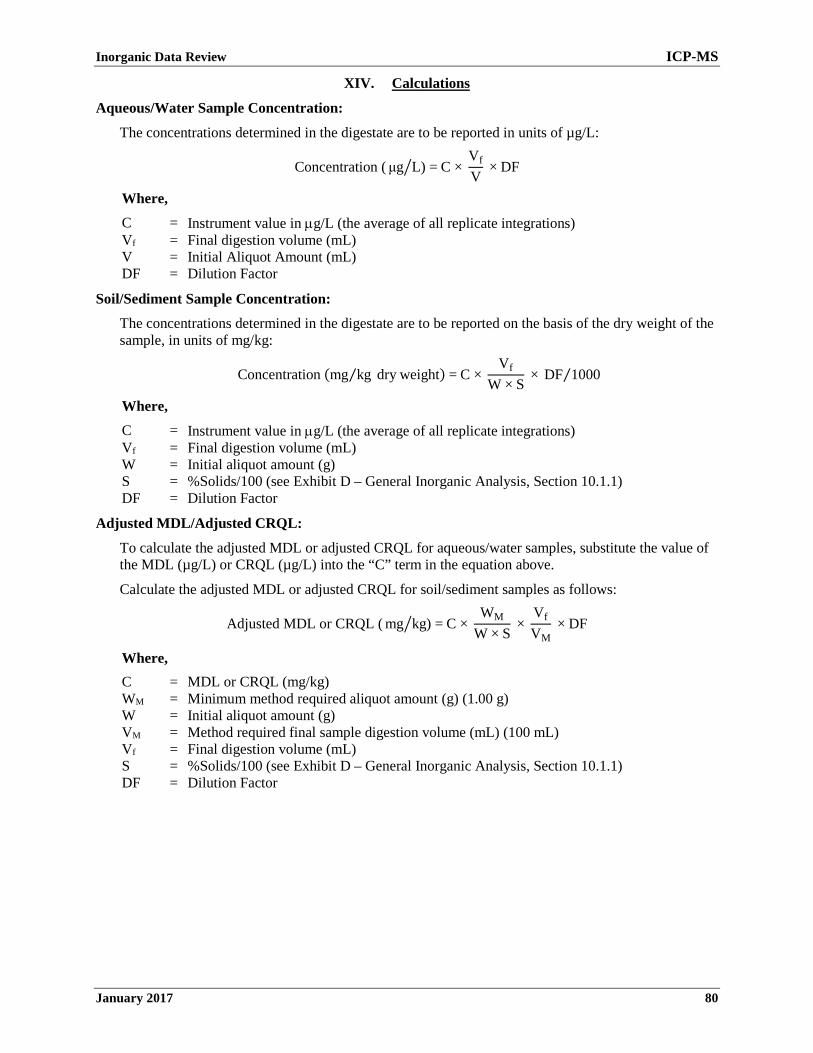
Inorganic Data Review ICP-MS
January 2017 80
XIV. Calculations
Aqueous/Water Sample Concentration:
The concentrations determined in the digestate are to be reported in units of µg/L:
Concentration ( μg L) = C × Vf
V × DF�
Where, C = Instrument value in µg/L (the average of all replicate integrations) Vf = Final digestion volume (mL) V = Initial Aliquot Amount (mL) DF = Dilution Factor
Soil/Sediment Sample Concentration:
The concentrations determined in the digestate are to be reported on the basis of the dry weight of the sample, in units of mg/kg:
Concentration (mg kg⁄ dry weight) = C × Vf
W × S × DF 1000⁄
Where, C = Instrument value in µg/L (the average of all replicate integrations) Vf = Final digestion volume (mL) W = Initial aliquot amount (g) S = %Solids/100 (see Exhibit D – General Inorganic Analysis, Section 10.1.1) DF = Dilution Factor
Adjusted MDL/Adjusted CRQL:
To calculate the adjusted MDL or adjusted CRQL for aqueous/water samples, substitute the value of the MDL (µg/L) or CRQL (µg/L) into the “C” term in the equation above.
Calculate the adjusted MDL or adjusted CRQL for soil/sediment samples as follows:
Adjusted MDL or CRQL ( mg kg) = C × WM
W × S ×
Vf
VM × DF�
Where, C = MDL or CRQL (mg/kg) WM = Minimum method required aliquot amount (g) (1.00 g) W = Initial aliquot amount (g) VM = Method required final sample digestion volume (mL) (100 mL) Vf = Final digestion volume (mL) S = %Solids/100 (see Exhibit D – General Inorganic Analysis, Section 10.1.1) DF = Dilution Factor
Inorganic Data Review Mercury
January 2017 81
MERCURY DATA REVIEW
The inorganic data requirements for mercury to be reviewed during validation are listed below: Example Analytical Sequence .................................................................................................................... 83
I. Preservation and Holding Times ....................................................................................................... 85
II. Calibration ......................................................................................................................................... 87
III. Blanks ................................................................................................................................................ 90
IV. Duplicate Sample Analysis ............................................................................................................... 95
V. Spike Sample Analysis ...................................................................................................................... 98
VI. Performance Evaluation Sample ..................................................................................................... 100
VII. Regional Quality Assurance and Quality Control ........................................................................... 102
VIII. Overall Assessment of Data ............................................................................................................ 103
IX. Calculations ..................................................................................................................................... 105
Inorganic Data Review Mercury
January 2017 82
This page is intentionally left blank.
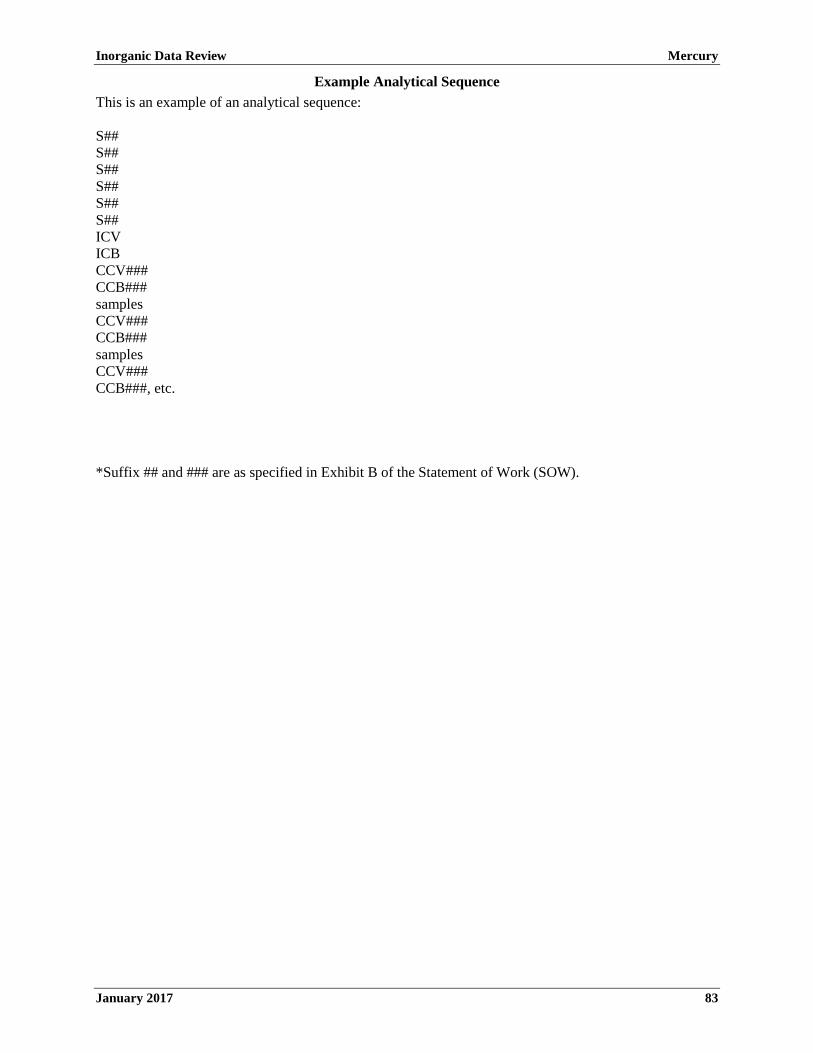
Inorganic Data Review Mercury
January 2017 83
Example Analytical Sequence This is an example of an analytical sequence: S## S## S## S## S## S## ICV ICB CCV### CCB### samples CCV### CCB### samples CCV### CCB###, etc. *Suffix ## and ### are as specified in Exhibit B of the Statement of Work (SOW).

Inorganic Data Review Mercury
January 2017 84
This page is intentionally left blank.
Inorganic Data Review Mercury
January 2017 85
I. Preservation and Holding Times
A. Review Items
Form 1-IN, Form 12-IN, Traffic Report/Chain of Custody (TR/COC) Record documentation, Form DC-1, raw data, and the Sample Delivery Group (SDG) Narrative checking for: pH, shipping container temperature, holding time, and other sample conditions. (SOW ISM02.4 – Exhibit B, Section 3.4; Exhibit D/Introduction, Section 5.0; Exhibit D/General, Sections 8.0, 10.1.2.1, and 10.2.2.4.4; and Exhibit D/Mercury, Sections 8.0 and 10.1.1)
B. Objective
The objective is to determine the validity of the analytical results based on the sample conditions and the holding time of the sample.
C. Criteria
1. The technical holding time is determined from the date of collection, or the date that Toxicity Characteristic Leaching Procedure (TCLP) or Synthetic Precipitation Leaching Procedure (SPLP) extraction is complete, to the date of analysis.
2. The technical holding time criteria for aqueous/water samples and leachate samples from TCLP or SPLP is 28 days, preserved (with nitric acid) to pH ≤ 2.
3. The technical holding time criteria for soil/sediment samples is 28 days, based on the technical holding time criteria for aqueous/water samples.
4. Soil/sediment samples shall be maintained at ≤ 6ºC (but not frozen) from the time of collection until receipt at the laboratory and all aqueous/water and soil/sediment samples shall be stored at ≤ 6ºC (but not frozen) from the time of sample receipt until digestion.
5. Samples and standards shall be analyzed with 48 hours of preparation.
D. Evaluation
1. Establish technical holding times by comparing the sampling date(s) on the TR/COC Record documentation with the dates of analysis on Form 12-IN and the raw data; also consider using information in the Complete SDG File (CSF), as it may be helpful in the assessment.
2. Verify that the analysis dates on Form 12-IN and the raw data are identical.
3. Review the SDG Narrative and raw data preparation logs to determine if samples were properly preserved and arrived at the laboratory in proper condition (e.g., received intact, appropriate sample temperature at receipt, pH). If there is an indication of problems with the samples, the sample integrity may be compromised. Use professional judgment to evaluate the effect of the problem on the sample results.
E. Action
NOTE: Apply the action to each field sample for which the preservation or holding time criteria was not met.
1. If the pH of aqueous/water samples is > 2 at the time of sample receipt, determine if the laboratory adjusted the pH of the sample to ≤ 2 at the time of sample receipt. Also determine if the laboratory adjusted the pH to ≤ 2 for the TCLP and SPLP leachates after completion of the leaching procedure. If not, use professional judgment to qualify the samples based on the pH of the sample and the chemistry of Mercury (possible Methylation). Detects should be qualified as estimated low (J-) and non-detects as unusable (R).
2. If soil/sediment samples were received at a temperature > 6°C but ≤ 10°C, use professional judgment to determine the reliability of the data, or qualify detects as estimated (J) and non-detects as estimated (UJ).
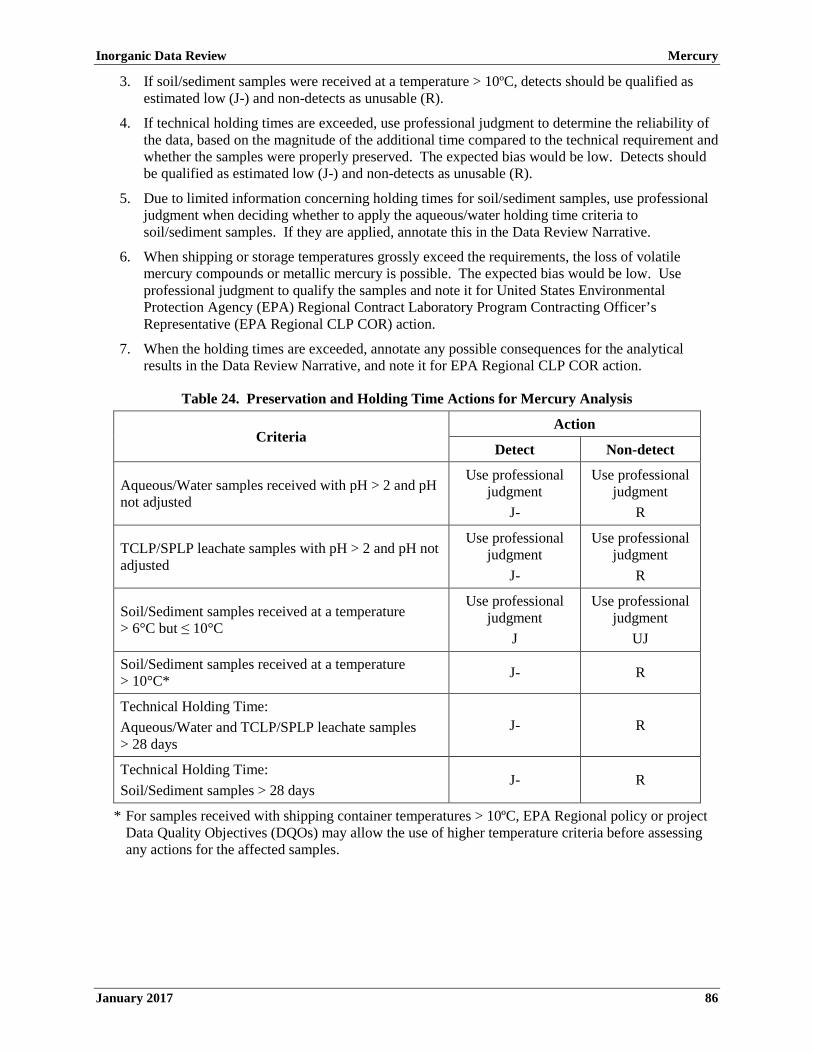
Inorganic Data Review Mercury
January 2017 86
3. If soil/sediment samples were received at a temperature > 10ºC, detects should be qualified as estimated low (J-) and non-detects as unusable (R).
4. If technical holding times are exceeded, use professional judgment to determine the reliability of the data, based on the magnitude of the additional time compared to the technical requirement and whether the samples were properly preserved. The expected bias would be low. Detects should be qualified as estimated low (J-) and non-detects as unusable (R).
5. Due to limited information concerning holding times for soil/sediment samples, use professional judgment when deciding whether to apply the aqueous/water holding time criteria to soil/sediment samples. If they are applied, annotate this in the Data Review Narrative.
6. When shipping or storage temperatures grossly exceed the requirements, the loss of volatile mercury compounds or metallic mercury is possible. The expected bias would be low. Use professional judgment to qualify the samples and note it for United States Environmental Protection Agency (EPA) Regional Contract Laboratory Program Contracting Officer’s Representative (EPA Regional CLP COR) action.
7. When the holding times are exceeded, annotate any possible consequences for the analytical results in the Data Review Narrative, and note it for EPA Regional CLP COR action.
Table 24. Preservation and Holding Time Actions for Mercury Analysis
Criteria Action
Detect Non-detect
Aqueous/Water samples received with pH > 2 and pH not adjusted
Use professional judgment
J-
Use professional judgment
R
TCLP/SPLP leachate samples with pH > 2 and pH not adjusted
Use professional judgment
J-
Use professional judgment
R
Soil/Sediment samples received at a temperature > 6°C but ≤ 10°C
Use professional judgment
J
Use professional judgment
UJ
Soil/Sediment samples received at a temperature > 10°C* J- R
Technical Holding Time: Aqueous/Water and TCLP/SPLP leachate samples > 28 days
J- R
Technical Holding Time: Soil/Sediment samples > 28 days
J- R
* For samples received with shipping container temperatures > 10ºC, EPA Regional policy or project Data Quality Objectives (DQOs) may allow the use of higher temperature criteria before assessing any actions for the affected samples.
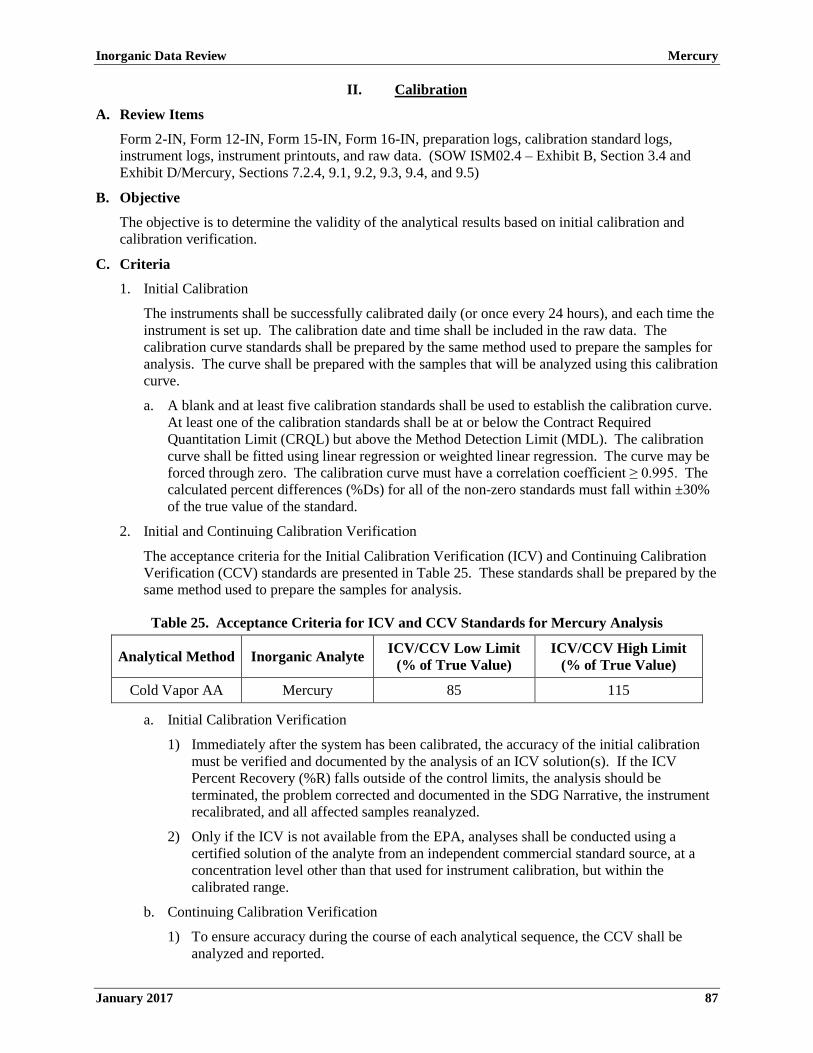
Inorganic Data Review Mercury
January 2017 87
II. Calibration
A. Review Items
Form 2-IN, Form 12-IN, Form 15-IN, Form 16-IN, preparation logs, calibration standard logs, instrument logs, instrument printouts, and raw data. (SOW ISM02.4 – Exhibit B, Section 3.4 and Exhibit D/Mercury, Sections 7.2.4, 9.1, 9.2, 9.3, 9.4, and 9.5)
B. Objective
The objective is to determine the validity of the analytical results based on initial calibration and calibration verification.
C. Criteria
1. Initial Calibration
The instruments shall be successfully calibrated daily (or once every 24 hours), and each time the instrument is set up. The calibration date and time shall be included in the raw data. The calibration curve standards shall be prepared by the same method used to prepare the samples for analysis. The curve shall be prepared with the samples that will be analyzed using this calibration curve.
a. A blank and at least five calibration standards shall be used to establish the calibration curve. At least one of the calibration standards shall be at or below the Contract Required Quantitation Limit (CRQL) but above the Method Detection Limit (MDL). The calibration curve shall be fitted using linear regression or weighted linear regression. The curve may be forced through zero. The calibration curve must have a correlation coefficient ≥ 0.995. The calculated percent differences (%Ds) for all of the non-zero standards must fall within ±30% of the true value of the standard.
2. Initial and Continuing Calibration Verification
The acceptance criteria for the Initial Calibration Verification (ICV) and Continuing Calibration Verification (CCV) standards are presented in Table 25. These standards shall be prepared by the same method used to prepare the samples for analysis.
Table 25. Acceptance Criteria for ICV and CCV Standards for Mercury Analysis
Analytical Method Inorganic Analyte ICV/CCV Low Limit (% of True Value)
ICV/CCV High Limit (% of True Value)
Cold Vapor AA Mercury 85 115
a. Initial Calibration Verification
1) Immediately after the system has been calibrated, the accuracy of the initial calibration must be verified and documented by the analysis of an ICV solution(s). If the ICV Percent Recovery (%R) falls outside of the control limits, the analysis should be terminated, the problem corrected and documented in the SDG Narrative, the instrument recalibrated, and all affected samples reanalyzed.
2) Only if the ICV is not available from the EPA, analyses shall be conducted using a certified solution of the analyte from an independent commercial standard source, at a concentration level other than that used for instrument calibration, but within the calibrated range.
b. Continuing Calibration Verification
1) To ensure accuracy during the course of each analytical sequence, the CCV shall be analyzed and reported.
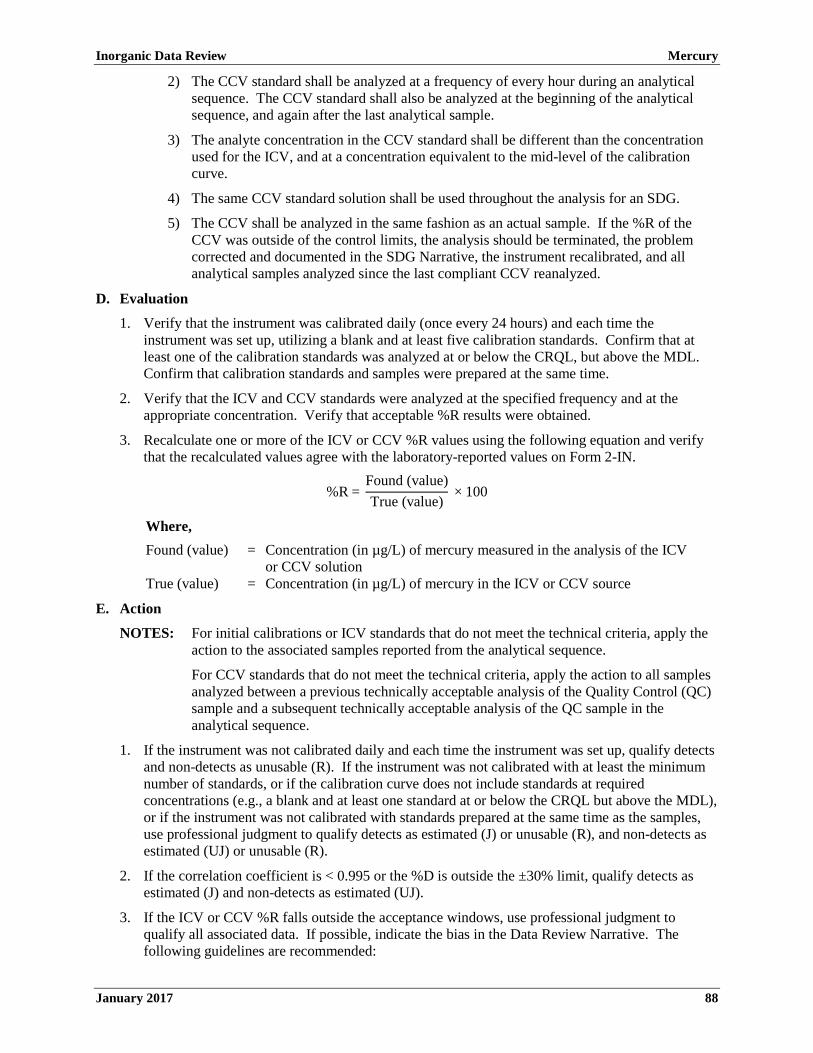
Inorganic Data Review Mercury
January 2017 88
2) The CCV standard shall be analyzed at a frequency of every hour during an analytical sequence. The CCV standard shall also be analyzed at the beginning of the analytical sequence, and again after the last analytical sample.
3) The analyte concentration in the CCV standard shall be different than the concentration used for the ICV, and at a concentration equivalent to the mid-level of the calibration curve.
4) The same CCV standard solution shall be used throughout the analysis for an SDG.
5) The CCV shall be analyzed in the same fashion as an actual sample. If the %R of the CCV was outside of the control limits, the analysis should be terminated, the problem corrected and documented in the SDG Narrative, the instrument recalibrated, and all analytical samples analyzed since the last compliant CCV reanalyzed.
D. Evaluation
1. Verify that the instrument was calibrated daily (once every 24 hours) and each time the instrument was set up, utilizing a blank and at least five calibration standards. Confirm that at least one of the calibration standards was analyzed at or below the CRQL, but above the MDL. Confirm that calibration standards and samples were prepared at the same time.
2. Verify that the ICV and CCV standards were analyzed at the specified frequency and at the appropriate concentration. Verify that acceptable %R results were obtained.
3. Recalculate one or more of the ICV or CCV %R values using the following equation and verify that the recalculated values agree with the laboratory-reported values on Form 2-IN.
%R = Found (value)True (value)
× 100
Where, Found (value) = Concentration (in µg/L) of mercury measured in the analysis of the ICV
or CCV solution True (value) = Concentration (in µg/L) of mercury in the ICV or CCV source
E. Action
NOTES: For initial calibrations or ICV standards that do not meet the technical criteria, apply the action to the associated samples reported from the analytical sequence.
For CCV standards that do not meet the technical criteria, apply the action to all samples analyzed between a previous technically acceptable analysis of the Quality Control (QC) sample and a subsequent technically acceptable analysis of the QC sample in the analytical sequence.
1. If the instrument was not calibrated daily and each time the instrument was set up, qualify detects and non-detects as unusable (R). If the instrument was not calibrated with at least the minimum number of standards, or if the calibration curve does not include standards at required concentrations (e.g., a blank and at least one standard at or below the CRQL but above the MDL), or if the instrument was not calibrated with standards prepared at the same time as the samples, use professional judgment to qualify detects as estimated (J) or unusable (R), and non-detects as estimated (UJ) or unusable (R).
2. If the correlation coefficient is < 0.995 or the %D is outside the ±30% limit, qualify detects as estimated (J) and non-detects as estimated (UJ).
3. If the ICV or CCV %R falls outside the acceptance windows, use professional judgment to qualify all associated data. If possible, indicate the bias in the Data Review Narrative. The following guidelines are recommended:

Inorganic Data Review Mercury
January 2017 89
a. If the ICV or CCV %R is < 70%, use professional judgment to qualify detects as estimated low (J-) or unusable (R) and non-detects as unusable (R).
b. If the ICV or CCV %R falls within the range of 70-84%, qualify detects as estimated low (J-) and non-detects as estimated (UJ).
c. If the ICV or CCV %R falls within the range of 85-115%, detects and non-detects should not be qualified.
d. If the ICV or CCV %R falls within the range of 116-130%, qualify detects as estimated high (J+). Non-detects should not be qualified.
e. If the ICV or CCV %R is > 130%, use professional judgment to qualify detects as estimated high (J+) or unusable (R). Non-detects should not be qualified.
f. If the ICV or CCV %R is > 165%, qualify detects as unusable (R). Non-detects should not be qualified.
4. If the laboratory failed to provide adequate calibration information, notify the EPA Regional CLP COR. The EPA Regional CLP COR may contact the laboratory and request the necessary information. If the information is unavailable, use professional judgment to assess the data.
5. Annotate the potential effects on the reported data due to exceeding the calibration criteria in the Data Review Narrative.
6. If calibration criteria are grossly exceeded, note this for EPA Regional CLP COR action.
NOTE: For truly critical samples, a further in-depth evaluation of the calibration curve may be warranted to determine if additional qualification is necessary.
Table 26. Calibration Actions for Mercury Analysis
Criteria Action
Detect Non-detect
Calibration not performed R R
Calibration incomplete Use professional
judgment J or R
Use professional judgment UJ or R
Correlation coefficient < 0.995 or %D outside ±30% J UJ
ICV/CCV %R < 70% Use professional
judgment J- or R
Use professional judgment
R
ICV/CCV %R 70-84% J- UJ
ICV/CCV %R 85-115% No qualification No qualification
ICV/CCV %R 116-130% J+ No qualification
ICV/CCV %R > 130% Use professional
judgment J+ or R
No qualification
ICV/CCV %R > 165% R No qualification

Inorganic Data Review Mercury
January 2017 90
III. Blanks
A. Review Items
Form 1-IN, Form 3-IN, Form 12-IN, preparation logs, calibration standard logs, instrument logs, and raw data. (SOW ISM02.4 – Exhibit B, Section 3.4 and Exhibit D/Mercury, Sections 7.3, 9.6, and 12.1)
B. Objective
The objective is to determine the validity of the analytical results based on the blank responses by determining the existence and magnitude of contamination resulting from laboratory (or field) activities or baseline drift during analysis.
C. Criteria
1. No contaminants should be found in the blank(s).
2. The Initial Calibration Blank (ICB) shall be analyzed at the wavelength used for analysis after the analytical standards, but not before analysis of the ICV during the initial calibration of the instrument (see Section II.C.1). The ICB shall be prepared by the same method used to prepare the samples for analysis.
3. A Continuing Calibration Blank (CCB) shall be analyzed immediately after every CCV. The CCB shall be prepared by the same method used to prepare the samples for analysis. The CCB shall be analyzed at a frequency of every hour during the analytical sequence. The CCB shall be analyzed at the beginning of the analytical sequence, and again after the last CCV that was analyzed after the last analytical sample of the analytical sequence. The CCB result (absolute value) shall not exceed the CRQL.
4. At least one Preparation Blank shall be prepared and analyzed for each matrix, with every SDG, or with each batch of samples digested, whichever is more frequent. The Preparation Blank consists of reagent water processed through the appropriate sample preparation and analysis procedure.
5. If the analyte concentration in the Preparation Blank is > CRQL, the lowest concentration of the analyte in the associated samples must be ≥ 10x the Preparation Blank concentration. Otherwise, all associated samples with the analyte’s concentration < 10x the Preparation Blank concentration, and > CRQL, should be redigested and reanalyzed. The laboratory is not to correct the sample concentration for the blank value.
6. If the analyte concentration in the Preparation Blank is < (-CRQL), all associated samples with the analyte’s concentration < 10x the CRQL should be redigested and reanalyzed.
7. At least one Leachate Extraction Blank (LEB) shall be prepared and analyzed for each batch of samples extracted by TCLP or SPLP. The LEB consists of reagent water processed through the extraction procedure. Post-extraction, the LEB shall be processed through the appropriate sample preparation and analysis procedure.
D. Evaluation
1. Verify that an ICB was analyzed after the calibration; the CCB was analyzed at the specified frequency and sequence during the analysis; and Preparation Blanks and LEBs are prepared and analyzed as appropriate for the SDG (e.g., total number of samples, various types of matrices present, number of digestion batches, etc.).
2. Review the results reported on Form 3-IN, as well as the raw data for all blanks, and verify that the results are accurately reported.

Inorganic Data Review Mercury
January 2017 91
3. Evaluate all of the associated blanks for the presence of the target analyte. Verify that if the concentration of the target analyte was > CRQL in a Preparation Blank, all associated samples with the analyte’s concentration > CRQL but < 10x the Preparation Blank concentration were redigested and reanalyzed for that analyte. Verify that if the concentration was < (-CRQL) in a Preparation Blank, all associated samples with the analyte’s concentration < 10x CRQL were redigested and reanalyzed. Verify that if the absolute value of the target analyte was > CRQL in an ICB or a CCB, the analysis was terminated, the problem corrected and documented in the SDG Narrative, the instrument recalibrated, and the preceding 10 analytical samples or all analytical samples analyzed since the last compliant calibration blank reanalyzed.
E. Action
NOTES: For ICBs that do not meet the technical criteria, apply the action to all associated samples reported from the analytical sequence.
For CCBs that do not meet the technical criteria, apply the action to all associated samples analyzed between a previous technically acceptable analysis of the CCB and a subsequent technically acceptable analysis of the CCB in the analytical sequence.
For Preparation Blanks that do not meet the technical criteria, apply the action to all associated samples prepared in the same preparation batch. For LEBs that do not meet the technical criteria, apply the action to all associated samples extracted in the same extraction batch.
1. If the appropriate blanks were not analyzed with the specified frequency, use professional judgment to determine if the associated sample data should be qualified. Obtain additional information from the laboratory, if necessary. Record the situation in the Data Review Narrative, and note it for EPA Regional CLP COR action.
2. Action regarding unsuitable blank results depends on the circumstances and origin of the blank. In instances where more than one blank is associated with a given sample, qualification should be based upon a comparison with the associated blank having the highest concentration of contaminant.
3. Some general “technical” review actions include:
a. For any blank (including Preparation Blanks and LEBs) reported with detects ≤ CRQL, report sample detects ≤ CRQL at the CRQL and qualify as non-detect (U). For any blank (including Preparation Blanks and LEBs) reported with a detect ≤ CRQL, use professional judgment to qualify the sample results > CRQL. Non-detects should not be qualified.
b. For any blank (including Preparation Blanks and LEBs) reported with a negative result ≤ (-MDL) but ≥ (- CRQL), carefully evaluate it to determine its effect on the sample data. Use professional judgment to assess the data.
c. The blank analyses may not involve the same weights, volumes, or dilution factors as the associated samples. In particular, soil/sediment sample results reported on Form 1-IN will not be on the same basis (units, dilution) as the calibration blank data reported on Form 3-IN. It may be easier to work with the raw data and/or convert the ICB or CCB results to the same units as the soil/sediment samples for comparison purposes.
4. Specific “method” actions include:
a. If an ICB or a CCB result is > CRQL, the analysis should be terminated. If the analysis was not terminated and the associated samples were not reanalyzed, non-detects should not be qualified. Report detects ≤ CRQL at the CRQL and qualify as non-detect (U). Report sample results that are > CRQL but < ICB/CCB results at ICB/CCB results and use professional judgment to qualify as non-detect (U) or unusable (R). Use professional judgment to qualify sample results ≥ ICB/CCB results. Record the situation in the Data Review Narrative, and note it for EPA Regional CLP COR action.

Inorganic Data Review Mercury
January 2017 92
b. If an ICB or a CCB result is < (-CRQL), the analysis should be terminated. If the analysis was not terminated and the associated samples were not reanalyzed, use professional judgment to qualify non-detects as estimated (UJ) or unusable (R). Use professional judgment to qualify detects ≤ CRQL or qualify as estimated low (J-). Use professional judgment to qualify sample results that are > CRQL as estimated low (J-).
c. If the concentration of the analyte in the Preparation Blank/LEB is > CRQL, the lowest concentration of that analyte in the associated samples must be ≥ 10x the Preparation Blank/LEB concentration. All samples associated with the Preparation Blank with concentrations < 10x the Preparation Blank concentration and > CRQL should have been redigested and reanalyzed. If the associated samples were not redigested and reanalyzed, report the sample results at Preparation Blank results; use professional judgment to qualify the results as estimated high (J+) or unusable (R). Report results < 10x the LEB concentration and > CRQL in the samples associated with the LEB at LEB results; use professional judgment to qualify the results as estimated high (J+) or unusable (R). Report detects ≤ CRQL in the samples associated with the Preparation Blank/LEB at the CRQL and qualify as non-detect (U). Non-detects and sample results that are ≥ 10x the Preparation Blank/LEB results should not be qualified. If the laboratory failed to redigest and reanalyze the samples associated with the Preparation Blank, record it in the Data Review Narrative, and note it for EPA Regional CLP COR action.
d. For any Preparation Blank or LEB reported with a negative result < (-CRQL), use professional judgment to qualify detects ≤ CRQL, or qualify as estimated low (J-). Qualify sample results that are ≥ CRQL but < 10x CRQL as estimated low (J-), and qualify non-detects as estimated (UJ). Sample results that are ≥ 10x CRQL should not be qualified.
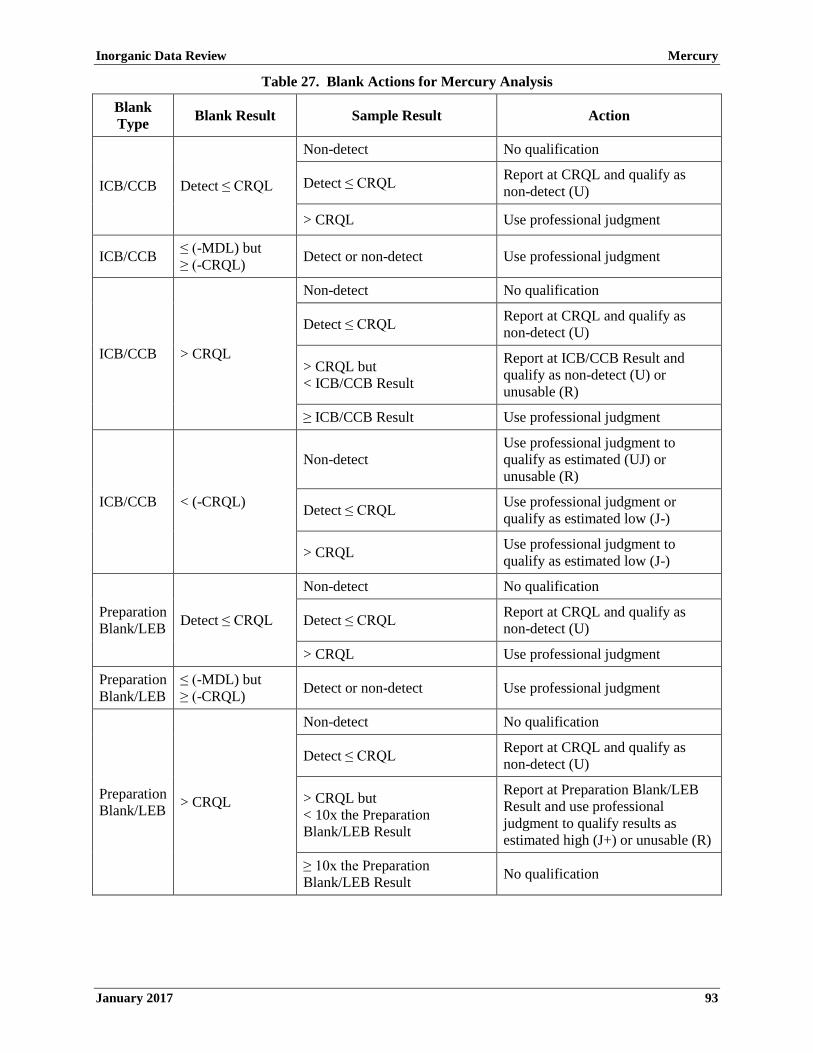
Inorganic Data Review Mercury
January 2017 93
Table 27. Blank Actions for Mercury Analysis
Blank Type Blank Result Sample Result Action
ICB/CCB Detect ≤ CRQL
Non-detect No qualification
Detect ≤ CRQL Report at CRQL and qualify as non-detect (U)
> CRQL Use professional judgment
ICB/CCB ≤ (-MDL) but ≥ (-CRQL) Detect or non-detect Use professional judgment
ICB/CCB > CRQL
Non-detect No qualification
Detect ≤ CRQL Report at CRQL and qualify as non-detect (U)
> CRQL but < ICB/CCB Result
Report at ICB/CCB Result and qualify as non-detect (U) or unusable (R)
≥ ICB/CCB Result Use professional judgment
ICB/CCB < (-CRQL)
Non-detect Use professional judgment to qualify as estimated (UJ) or unusable (R)
Detect ≤ CRQL Use professional judgment or qualify as estimated low (J-)
> CRQL Use professional judgment to qualify as estimated low (J-)
Preparation Blank/LEB Detect ≤ CRQL
Non-detect No qualification
Detect ≤ CRQL Report at CRQL and qualify as non-detect (U)
> CRQL Use professional judgment
Preparation Blank/LEB
≤ (-MDL) but ≥ (-CRQL) Detect or non-detect Use professional judgment
Preparation Blank/LEB > CRQL
Non-detect No qualification
Detect ≤ CRQL Report at CRQL and qualify as non-detect (U)
> CRQL but < 10x the Preparation Blank/LEB Result
Report at Preparation Blank/LEB Result and use professional judgment to qualify results as estimated high (J+) or unusable (R)
≥ 10x the Preparation Blank/LEB Result No qualification

Inorganic Data Review Mercury
January 2017 94
Blank Type Blank Result Sample Result Action
Preparation Blank/LEB < (-CRQL)
Non-detect Qualify as estimated (UJ)
Detect ≤ CRQL Use professional judgment or qualify as estimated low (J-)
< 10x CRQL Qualify results that are ≥ CRQL as estimated low (J-)
≥ 10x CRQL No qualification

Inorganic Data Review Mercury
January 2017 95
IV. Duplicate Sample Analysis
A. Review Items
SDG Cover Page, Form 6-IN, instrument printouts, and raw data. (SOW ISM02.4 – Exhibit B, Section 3.4 and Exhibit D/Mercury, Section 12.3)
B. Objective
The objective of duplicate sample analysis is to demonstrate acceptable method precision by the laboratory at the time of analysis.
C. Criteria
1. Samples identified as field blanks or Performance Evaluation (PE) samples cannot be used for duplicate sample analysis.
2. At least one duplicate sample shall be prepared and analyzed from each group of samples of a similar matrix type (e.g., aqueous/water or soil/sediment) or for each SDG. Duplicates cannot be averaged for reporting on Form 1-IN. Additional duplicate sample analyses may be required by EPA Regional request. Alternately, the EPA Region may require that a specific sample be used for the duplicate sample analysis.
3. A control limit of 20% for the Relative Percent Difference (RPD) shall be used for original and duplicate sample values ≥ 5x the CRQL.
4. A control limit of the CRQL shall be used if either the sample or duplicate value is < 5x the CRQL. The absolute value of the control limit (CRQL) shall be entered in the “Control Limit” column on Form 6-IN. If both samples are non-detects, the RPD is not calculated for Form 6-IN.
NOTE: The above control limits are method requirements for duplicate samples, regardless of the sample matrix type. However, it should be noted that laboratory variability arising from the sub-sampling of non-homogenous soil samples is a common occurrence. Therefore, for technical review purposes only, EPA Regional policy or project DQOs may allow the use of less restrictive criteria (e.g., 35% RPD, 2x the CRQL) to be assessed against duplicate soil samples.
D. Evaluation
1. Verify, from the SDG Cover Page and the raw data, that the appropriate number of required duplicate samples were prepared and analyzed for the SDG.
2. Verify, using Form 6-IN and the raw data, that the duplicate results fall within the established control limits.
3. Verify that a field blank or PE sample was not used for duplicate analysis.
4. Check the raw data and recalculate one or more of the RPD values using the following equation to verify that the results were correctly reported on Form 6-IN:
RPD = |S - D|
(S + D) / 2 × 100
Where, RPD = Relative Percent Difference S = Sample Result (original) D = Duplicate Result
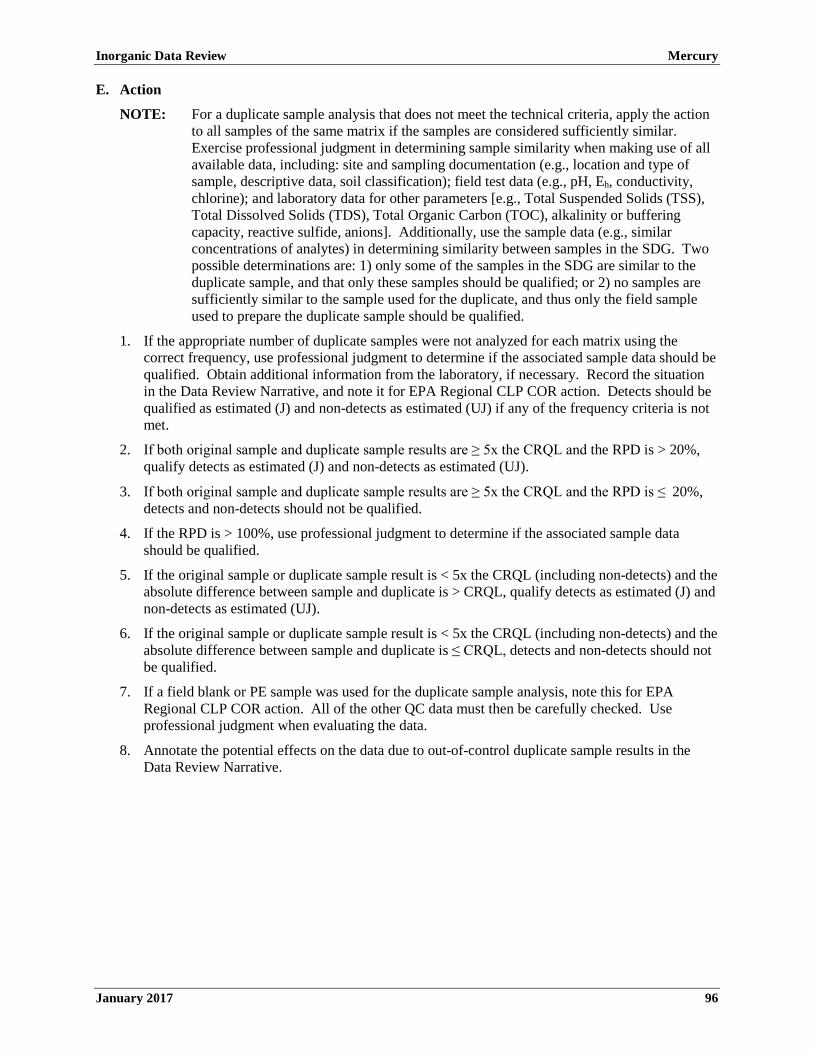
Inorganic Data Review Mercury
January 2017 96
E. Action
NOTE: For a duplicate sample analysis that does not meet the technical criteria, apply the action to all samples of the same matrix if the samples are considered sufficiently similar. Exercise professional judgment in determining sample similarity when making use of all available data, including: site and sampling documentation (e.g., location and type of sample, descriptive data, soil classification); field test data (e.g., pH, Eh, conductivity, chlorine); and laboratory data for other parameters [e.g., Total Suspended Solids (TSS), Total Dissolved Solids (TDS), Total Organic Carbon (TOC), alkalinity or buffering capacity, reactive sulfide, anions]. Additionally, use the sample data (e.g., similar concentrations of analytes) in determining similarity between samples in the SDG. Two possible determinations are: 1) only some of the samples in the SDG are similar to the duplicate sample, and that only these samples should be qualified; or 2) no samples are sufficiently similar to the sample used for the duplicate, and thus only the field sample used to prepare the duplicate sample should be qualified.
1. If the appropriate number of duplicate samples were not analyzed for each matrix using the correct frequency, use professional judgment to determine if the associated sample data should be qualified. Obtain additional information from the laboratory, if necessary. Record the situation in the Data Review Narrative, and note it for EPA Regional CLP COR action. Detects should be qualified as estimated (J) and non-detects as estimated (UJ) if any of the frequency criteria is not met.
2. If both original sample and duplicate sample results are ≥ 5x the CRQL and the RPD is > 20%, qualify detects as estimated (J) and non-detects as estimated (UJ).
3. If both original sample and duplicate sample results are ≥ 5x the CRQL and the RPD is ≤ 20%, detects and non-detects should not be qualified.
4. If the RPD is > 100%, use professional judgment to determine if the associated sample data should be qualified.
5. If the original sample or duplicate sample result is < 5x the CRQL (including non-detects) and the absolute difference between sample and duplicate is > CRQL, qualify detects as estimated (J) and non-detects as estimated (UJ).
6. If the original sample or duplicate sample result is < 5x the CRQL (including non-detects) and the absolute difference between sample and duplicate is ≤ CRQL, detects and non-detects should not be qualified.
7. If a field blank or PE sample was used for the duplicate sample analysis, note this for EPA Regional CLP COR action. All of the other QC data must then be carefully checked. Use professional judgment when evaluating the data.
8. Annotate the potential effects on the data due to out-of-control duplicate sample results in the Data Review Narrative.
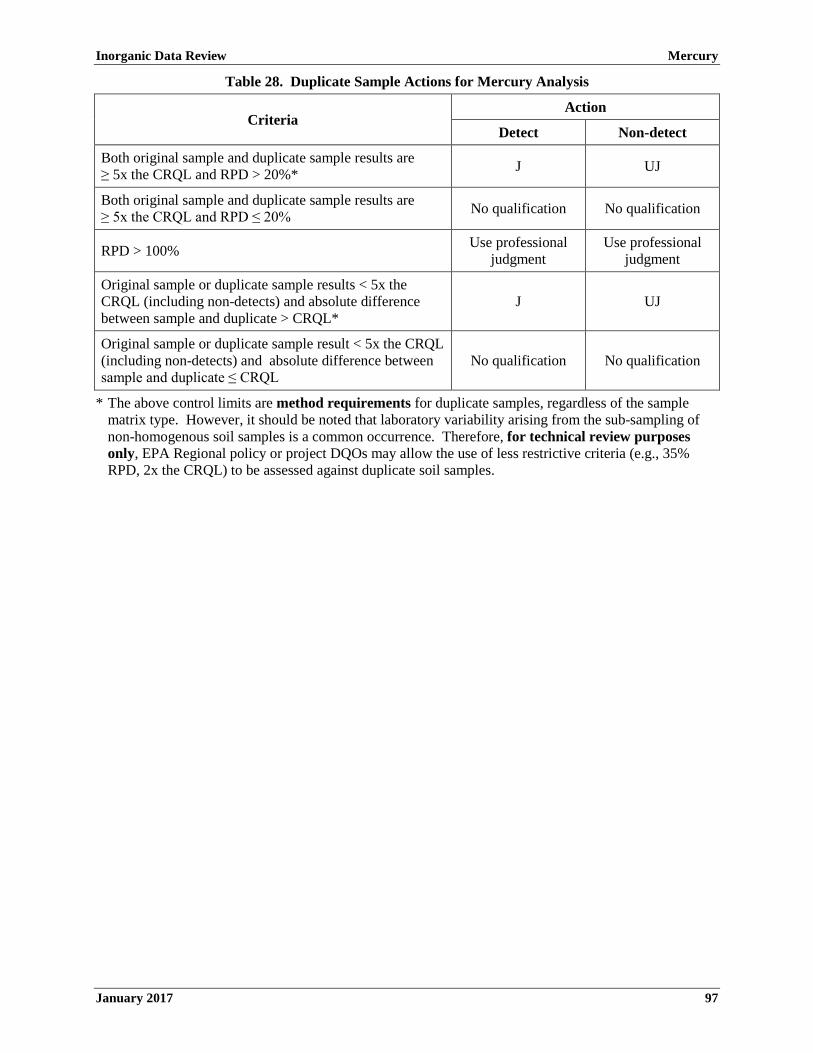
Inorganic Data Review Mercury
January 2017 97
Table 28. Duplicate Sample Actions for Mercury Analysis
Criteria Action
Detect Non-detect
Both original sample and duplicate sample results are ≥ 5x the CRQL and RPD > 20%* J UJ
Both original sample and duplicate sample results are ≥ 5x the CRQL and RPD ≤ 20% No qualification No qualification
RPD > 100% Use professional judgment
Use professional judgment
Original sample or duplicate sample results < 5x the CRQL (including non-detects) and absolute difference between sample and duplicate > CRQL*
J UJ
Original sample or duplicate sample result < 5x the CRQL (including non-detects) and absolute difference between sample and duplicate ≤ CRQL
No qualification No qualification
* The above control limits are method requirements for duplicate samples, regardless of the sample matrix type. However, it should be noted that laboratory variability arising from the sub-sampling of non-homogenous soil samples is a common occurrence. Therefore, for technical review purposes only, EPA Regional policy or project DQOs may allow the use of less restrictive criteria (e.g., 35% RPD, 2x the CRQL) to be assessed against duplicate soil samples.

Inorganic Data Review Mercury
January 2017 98
V. Spike Sample Analysis
A. Review Items
SDG Cover Page, Form 5A-IN, instrument printouts, and raw data. (SOW ISM02.4 – Exhibit B, Section 3.4 and Exhibit D/Mercury, Section 12.2)
B. Objective
The objective of the spiked sample analysis is to evaluate the effect of each sample matrix on the sample preparation procedures and the measurement methodology.
C. Criteria
1. Samples identified as field blanks or PE samples cannot be used for spiked sample analysis.
2. At least one spiked sample shall be prepared and analyzed from each group of samples with a similar matrix type (e.g., aqueous/water or soil/sediment), or for each SDG.
3. The spike %R shall be within the established acceptance limits. However, spike recovery limits do not apply when the sample concentration is ≥ 4x the spike added. In such an event, the data shall be reported unflagged, even if the %R does not meet the acceptance criteria.
4. If the spiked sample analysis was performed on the same sample that was chosen for the duplicate sample analysis, spike calculations shall be performed using the results of the sample designated as the “original sample”. The average of the duplicate results cannot be used for the purpose of determining the %R.
NOTE: The final spike concentration required is presented in the method described in the SOW.
D. Evaluation
1. Verify, using the SDG Cover Page, Form 5A-IN, and raw data, that the appropriate number of required spiked samples was prepared and analyzed for the SDG.
2. Verify that a field blank or PE sample was not used for the spiked sample analysis.
3. Verify, using Form 5A-IN and the raw data, that all Matrix Spike sample results fall within the established control limits.
4. Recalculate, using the raw data, one or more of the %R values using the following equation, and verify that the recalculated values agree with the laboratory-reported values on Form 5A-IN:
%Recovery = SSR-SR
SA × 100
Where, SSR = Spiked Sample Result SR = Sample Result SA = Spike Added
NOTE: When the sample result is < MDL or reported as a non-detect, use SR = 0 only for the purpose of calculating the %R. The actual spiked sample result, sample result, and %R (positive or negative) shall still be reported on Form 5A-IN.
E. Action
NOTE: For a Matrix Spike that does not meet the technical criteria, apply the action to all samples of the same matrix if the samples are considered sufficiently similar. Exercise professional judgment in determining sample similarity when making use of all available data, including: site and sampling documentation (e.g., location and type of sample, descriptive data, soil classification); field test data (e.g., pH, Eh, conductivity, chlorine); and laboratory data for other parameters (e.g., TSS, TDS, TOC, alkalinity or buffering
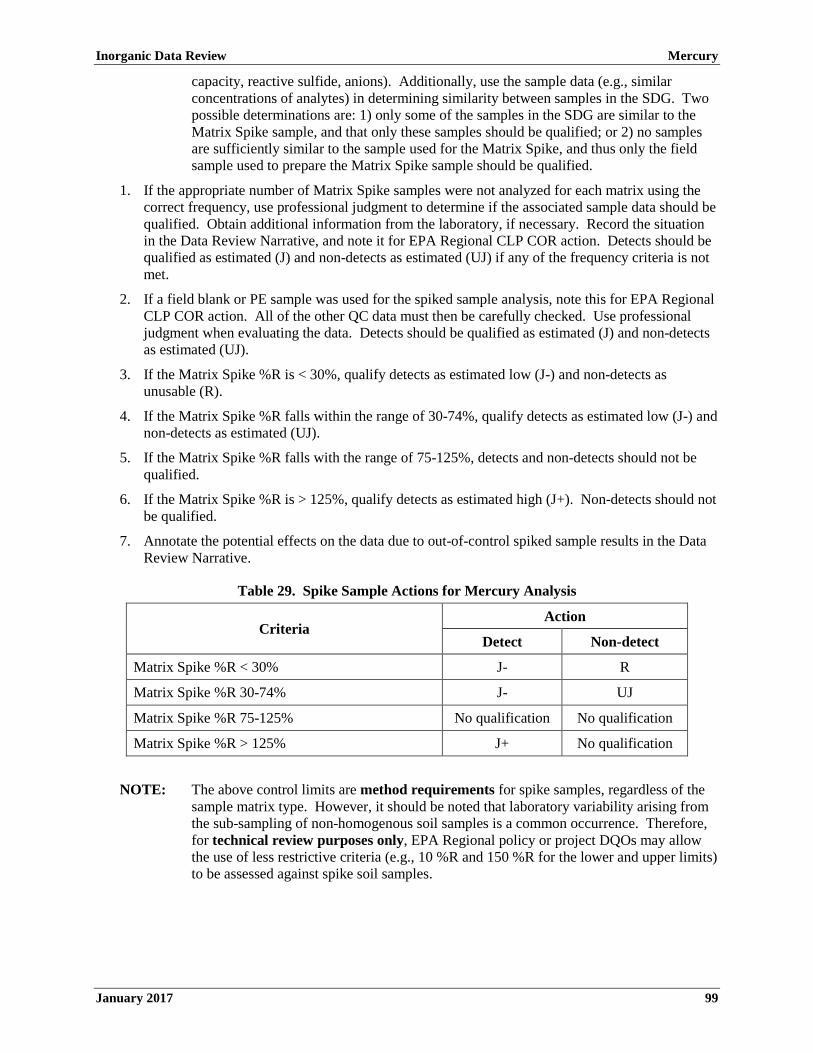
Inorganic Data Review Mercury
January 2017 99
capacity, reactive sulfide, anions). Additionally, use the sample data (e.g., similar concentrations of analytes) in determining similarity between samples in the SDG. Two possible determinations are: 1) only some of the samples in the SDG are similar to the Matrix Spike sample, and that only these samples should be qualified; or 2) no samples are sufficiently similar to the sample used for the Matrix Spike, and thus only the field sample used to prepare the Matrix Spike sample should be qualified.
1. If the appropriate number of Matrix Spike samples were not analyzed for each matrix using the correct frequency, use professional judgment to determine if the associated sample data should be qualified. Obtain additional information from the laboratory, if necessary. Record the situation in the Data Review Narrative, and note it for EPA Regional CLP COR action. Detects should be qualified as estimated (J) and non-detects as estimated (UJ) if any of the frequency criteria is not met.
2. If a field blank or PE sample was used for the spiked sample analysis, note this for EPA Regional CLP COR action. All of the other QC data must then be carefully checked. Use professional judgment when evaluating the data. Detects should be qualified as estimated (J) and non-detects as estimated (UJ).
3. If the Matrix Spike %R is < 30%, qualify detects as estimated low (J-) and non-detects as unusable (R).
4. If the Matrix Spike %R falls within the range of 30-74%, qualify detects as estimated low (J-) and non-detects as estimated (UJ).
5. If the Matrix Spike %R falls with the range of 75-125%, detects and non-detects should not be qualified.
6. If the Matrix Spike %R is > 125%, qualify detects as estimated high (J+). Non-detects should not be qualified.
7. Annotate the potential effects on the data due to out-of-control spiked sample results in the Data Review Narrative.
Table 29. Spike Sample Actions for Mercury Analysis
Criteria Action
Detect Non-detect
Matrix Spike %R < 30% J- R
Matrix Spike %R 30-74% J- UJ
Matrix Spike %R 75-125% No qualification No qualification
Matrix Spike %R > 125% J+ No qualification
NOTE: The above control limits are method requirements for spike samples, regardless of the sample matrix type. However, it should be noted that laboratory variability arising from the sub-sampling of non-homogenous soil samples is a common occurrence. Therefore, for technical review purposes only, EPA Regional policy or project DQOs may allow the use of less restrictive criteria (e.g., 10 %R and 150 %R for the lower and upper limits) to be assessed against spike soil samples.

Inorganic Data Review Mercury
January 2017 100
VI. Performance Evaluation Sample
A. Review Items
Form 1-IN, TR/COC Record documentation, preparation logs, instrument printouts, and raw data. (SOW ISM02.4 – Exhibit B, Section 3.4 and Exhibit F, Section 4.1)
B. Objective
The objective is to determine the validity of the analytical results based on the recovery of the PE sample(s).
C. Criteria
1. Matrix-specific PE samples shall be analyzed utilizing the same analytical methods and Quality Assurance/Quality Control (QA/QC) procedures as employed for the samples, at a frequency to be determined by each EPA Region for each site. PE samples must be analyzed in an SDG containing field samples for the Case, using the same procedures, reagents, and instrumentation.
D. Evaluation
1. Verify, using Form 1-IN, preparation logs, and raw data, that the PE samples were analyzed with the field samples and field blanks in the SDG.
2. Verify, using Form 1-IN, that the PE sample results are within the warning limits (95% confidence interval) and action limits (99% confidence interval).
3. If a significant number (i.e., half or more) of the analytes in the PE samples fall outside of the 95% warning or 99% action criteria, or a number of false positive results are reported, evaluate the overall impact on the data.
E. Action
NOTE: If the PE sample criteria are not met, the laboratory performance and method accuracy are in question. Use professional judgment to determine if the data should be qualified or rejected. The following guidance is suggested for qualifying sample data associated with a PE sample that does not meet the required criteria.
For a PE sample that does not meet the technical criteria, apply the action to all samples in the same preparation batch. If the concentration of any analyte in a PE sample is not comparable to the analyte’s concentration in the field samples or field blanks (i.e., it is much higher or much lower than the concentration in these samples), the action may be applied to only those samples in which the analyte’s concentration is comparable to the PE sample concentration.
1. If the PE sample was not analyzed with the field samples and field blanks, use professional judgment to determine if the associated sample results should be qualified. Obtain additional information from the laboratory, if necessary. If a laboratory fails to analyze the PE sample(s) provided with field samples and field blanks, or if a laboratory consistently fails to generate acceptable PE sample results, record the situation in the Data Review Narrative, and note it for EPA Regional CLP COR action.
2. If the PE sample results are outside the lower warning limits but inside the lower action limits, qualify detects as estimated low (J-) and non-detects as estimated (UJ).
3. If the PE sample results are outside the lower action limits, qualify detects as estimated low (J-) and non-detects as unusable (R).
4. If the PE sample results are within the limits, detects and non-detects should not be qualified.
5. If the PE sample results are outside the upper warning limits but inside the upper action limits, qualify detects as estimated high (J+). Non-detects should not be qualified.

Inorganic Data Review Mercury
January 2017 101
6. If the PE sample results are outside the upper action limits, qualify detects as estimated high (J+). Non-detects should not be qualified.
7. Annotate the potential effects on the data due to out-of-control PE sample results in the Data Review Narrative.
Table 30. PE Sample Actions for Mercury Analysis
Criteria Action
Detect Non-detect
PE sample results outside lower warning limits but inside lower action limits J- UJ
PE sample results outside lower action limits J- R
PE sample results within limits No qualification No qualification
PE sample results outside upper warning limits but inside upper action limits J+ No qualification
PE sample results outside upper action limits J+ No qualification
Inorganic Data Review Mercury
January 2017 102
VII. Regional Quality Assurance and Quality Control
A. Review Items
Form 1-IN, instrument printouts, and raw data. (SOW ISM02.4 – Exhibit B, Sections 2.4 and 3.4)
B. Objective
The objective is to use results from the analysis of EPA Regional QA/QC samples such as field blanks, blind spikes, and blind blanks to determine the validity of the analytical results.
C. Criteria
Criteria are determined by each EPA Region.
1. The frequency of EPA Regional QA/QC samples should be defined in the project QAPP.
2. Performance criteria for EPA Regional QA/QC samples should also be defined in the project QAPP.
3. The EPA Region may provide the laboratory with PE samples to be analyzed with each SDG. These samples may include blind spikes and/or blind blanks. The laboratory must analyze a PE sample when provided by the EPA Region. Refer to Section III, above, for blanks criteria. Refer to Section VI, above, for PE samples criteria.
4. The RPD between field duplicates shall fall within the specific limits in the EPA Region’s Standard Operating Procedure (SOP) or project QAPP.
D. Evaluation
1. Evaluation procedures must follow the EPA Region’s SOP for data review.
2. Determine whether the results of EPA Regional QA/QC samples impact all samples in the project or only those directly associated (i.e., in the same SDG, collected on the same day, prepared together, or contained in the same analytical sequence).
3. Calculate the RPD between field duplicates and provide this information in the Data Review Narrative. Also verify that the value falls within the specific limits in the EPA Region’s SOP or project QAPP.
4. Determine whether poor precision is the fault of the laboratory, or a result of sample non-homogeneity in the field. Laboratory observations of sample appearance may become important in these situations.
E. Action
1. Any action must be in accordance with EPA Regional specifications and the criteria for acceptable field duplicate sample results.
2. Note unacceptable results for field duplicate samples for EPA Regional CLP COR action.
3. In general, for EPA Regional QA/QC performance not within QAPP specification, qualify detects as estimated (J) and non-detects as estimated (UJ). The impact on overall data quality should be assessed after consultation with the data user and/or field personnel. Contact the EPA Regional CLP COR if reanalysis of samples is required.
Inorganic Data Review Mercury
January 2017 103
VIII. Overall Assessment of Data
A. Review Items
Entire sample data package, data review results, preparation logs, calibration standard logs, instrument logs, instrument printouts, and raw data (including any confirmation data).
B. Objective
The objective is to provide the overall assessment on data quality and usability.
C. Criteria
1. Review all available materials to assess the overall quality of the data, keeping in mind the additive nature of analytical problems.
2. Reported analyte concentrations must be quantitated according to the appropriate equations, as listed in the method. All sample results must be within the linear calibration ranges per the methods. Percent Solids (%Solids) must be properly used for all applicable matrix result calculations.
D. Evaluation
Examine the raw data to verify that the correct calculation of the sample results was reported by the laboratory. Digestion logs, instrument printouts, etc., should be compared to the reported sample results recorded on the appropriate Inorganic Data Reporting Forms (Form 1-IN through Form 16-IN).
1. Evaluate any technical problems not previously addressed.
2. Examine the raw data for any anomalies (e.g., baseline shifts, negative absorbance, omissions, illegibility, etc.).
3. Verify that the appropriate methods and amounts were used to prepare samples and standards for analysis. If reduced volumes are used, verify that the laboratory received EPA Regional CLP COR approval for the use of the reduced volume.
4. Verify that there are no transcription or reduction errors (e.g., dilutions, %Solids, sample weights, etc.) on one or more samples. Recalculate %Solids for at least 10% of the samples and verify that the calculated %Solids agree with that reported by the laboratory.
5. Verify that the MDL is properly reported and that it is not greater than the CRQL.
6. Verify that results fall within the calibrated range (Form 15-IN).
7. If appropriate information is available, assess the usability of the data to assist the data user in avoiding inappropriate use of the data. Review all available information, including the Quality Assurance Project Plan (QAPP), focusing specifically on the acceptance or performance criteria, the SOPs, and communication with the user concerning the intended use and desired quality of these data.
E. Action
1. Use professional judgment to determine if there is any need to qualify data which are not qualified based on the QC criteria previously discussed.
2. Use professional judgment to qualify detects and non-detects if the MDL exceeds the CRQL.
3. If a sample is not diluted properly when sample results exceed the upper limit of the calibration range, qualify detect as estimated (J).

Inorganic Data Review Mercury
January 2017 104
4. Write a brief Data Review Narrative to give the user an indication of the limitations of the analytical data. Annotate any discrepancies between the data and the SDG Narrative for EPA Regional CLP COR action. If sufficient information on the intended use and required quality of the data is available, include an assessment of the data usability within the given context.
5. If any discrepancies are found, notify the EPA Regional CLP COR. The EPA Regional CLP COR may contact the laboratory to obtain additional information for resolution. If a discrepancy remains unresolved, use professional judgment to determine if qualification of the data is warranted.
Inorganic Data Review Mercury
January 2017 105
IX. Calculations
Aqueous/Water and TCLP/SPLP Leachate Sample Concentration:
Hg Concentration (μg L⁄ ) = C × DF
Where, C = Instrument value in µg/L from the calibration curve DF = Dilution Factor
Convert units to mg/L for TCLP leachates by dividing the final calculated concentration by 1000.
Soil/Sediment Sample Concentration:
Hg Concentration (mg kg⁄ dry weight) = C × 1
W × S × DF × 0.1
Where, C = Instrument value in µg/L from the calibration curve W = Initial aliquot amount (g) S = %Solids/100 (see Exhibit D – General Inorganic Analysis, Section 10.1.1) DF = Dilution Factor
Adjusted MDL/Adjusted CRQL:
To calculate the adjusted MDL or adjusted CRQL for aqueous/water or TCLP/SPLP leachate samples, substitute the value of the MDL or CRQL, in the appropriate units, into the “C” term in the equation above.
Calculate the adjusted MDL or adjusted CRQL for soil/sediment samples as follows:
Adjusted MDL or CRQL (mg kg⁄ ) = C × Wm
W × S × DF
Where, C = MDL or CRQL (mg/kg) Wm = Method required minimum sample weight (g) (0.50 g) W = Initial aliquot amount (g) S = %Solids/100 (see Exhibit D – General Inorganic Analysis, Section 10.1.1) DF = Dilution Factor
Inorganic Data Review Mercury
January 2017 106
This page is intentionally left blank.
Inorganic Data Review Cyanide
January 2017 107
CYANIDE DATA REVIEW
The inorganic data requirements for cyanide to be reviewed during validation are listed below: Example Analytical Sequence .................................................................................................................. 109
I. Preservation and Holding Times ..................................................................................................... 111
II. Calibration ....................................................................................................................................... 113
III. Blanks .............................................................................................................................................. 116
IV. Duplicate Sample Analysis ............................................................................................................. 120
V. Spike Sample Analysis .................................................................................................................... 123
VI. Performance Evaluation Sample ..................................................................................................... 126
VII. Regional Quality Assurance and Quality Control ........................................................................... 128
VIII. Overall Assessment of Data ............................................................................................................ 129
IX. Calculations ..................................................................................................................................... 131
Inorganic Data Review Cyanide
January 2017 108
This page is intentionally left blank.

Inorganic Data Review Cyanide
January 2017 109
Example Analytical Sequence The following is an example of an analytical sequence: S## S## S## S## S## S## ICV ICB CCV### CCB### samples CCV### CCB### samples CCV### CCB###, etc. *Suffix ## and ### are as specified in Exhibit B of the Statement of Work (SOW).

Inorganic Data Review Cyanide
January 2017 110
This page is intentionally left blank.

Inorganic Data Review Cyanide
January 2017 111
I. Preservation and Holding Times
A. Review Items
Form 1-IN, Form 12-IN, Traffic Report/Chain of Custody (TR/COC) Record documentation, Form DC-1, raw data, and the Sample Delivery Group (SDG) Narrative checking for: pH, shipping container temperature, holding time, and other sample conditions. (SOW ISM02.4, Exhibit B, Section 3.4; Exhibit D/Introduction, Section 5.0; Exhibit D/General, Sections 8.0, 10.1.2.1, and 10.2.2.4.4; and Exhibit D/Cyanide, Sections 8.0 and 10.1.1)
B. Objective
The objective is to determine the validity of the analytical results based on the sample conditions and the holding time of the sample.
C. Criteria
1. The technical holding time is determined from the date of collection, or the date that Synthetic Precipitation Leaching Procedure (SPLP) extraction is complete, to the date of analysis.
2. The technical holding time criteria for aqueous/water samples and leachate samples from SPLP is 14 days, preserved (with sodium hydroxide) to pH ≥ 10.
3. The technical holding time criteria for soil/sediment samples is 14 days, based on the technical holding time criteria for aqueous/water samples.
4. Aqueous/water and soil/sediment samples shall be maintained at ≤ 6ºC (but not frozen) from the time of collection until receipt at the laboratory and be stored at ≤ 6ºC (but not frozen) from the time of sample receipt until preparation. The SPLP leachates must be stored at ≤ 6ºC (but not frozen) from the time of the leaching procedure completion until preparation.
D. Evaluation
1. Establish technical holding times by comparing the sampling date(s) on the TR/COC Record documentation with the dates of analysis on Form 12-IN and the raw data; also consider using information in the Complete SDG File (CSF), as it may be helpful in the assessment.
2. Verify that the analysis dates on Form 12-IN and the raw data are identical.
3. Review the SDG Narrative and raw data preparation logs to determine if samples were properly preserved and arrived at the laboratory in proper condition (e.g., received intact, appropriate sample temperature at receipt, pH). If there is an indication of problems with the samples, the sample integrity may be compromised. Use professional judgment to evaluate the effect of the problem on the sample results. For aqueous/water samples, look for evidence that the samples were tested for the presence of sulfides, oxidizing agents, or nitrate/nitrite, and whether the appropriate preservation steps were taken.
E. Action
NOTE: Apply the action to each field sample for which the preservation or holding time criteria was not met.
1. If oxidizing agents were detected in aqueous/water samples at the time of sample preparation, qualify detects as estimated (J) and non-detects as unusable (R). If sulfides were detected in aqueous/water samples at the time of sample preparation, qualify detects as estimated (J) and non-detects as unusable (R). If there is evidence that samples were not treated with sulfamic acid prior to distillation for nitrate/nitrite interferences, qualify detects as estimated (J) and non-detects as unusable (R). If the pH of aqueous/water samples was < 10 at the time of sample receipt, use professional judgment to qualify the samples based on the pH of the sample. Detects should be qualified as estimated (J) and non-detects as unusable (R).
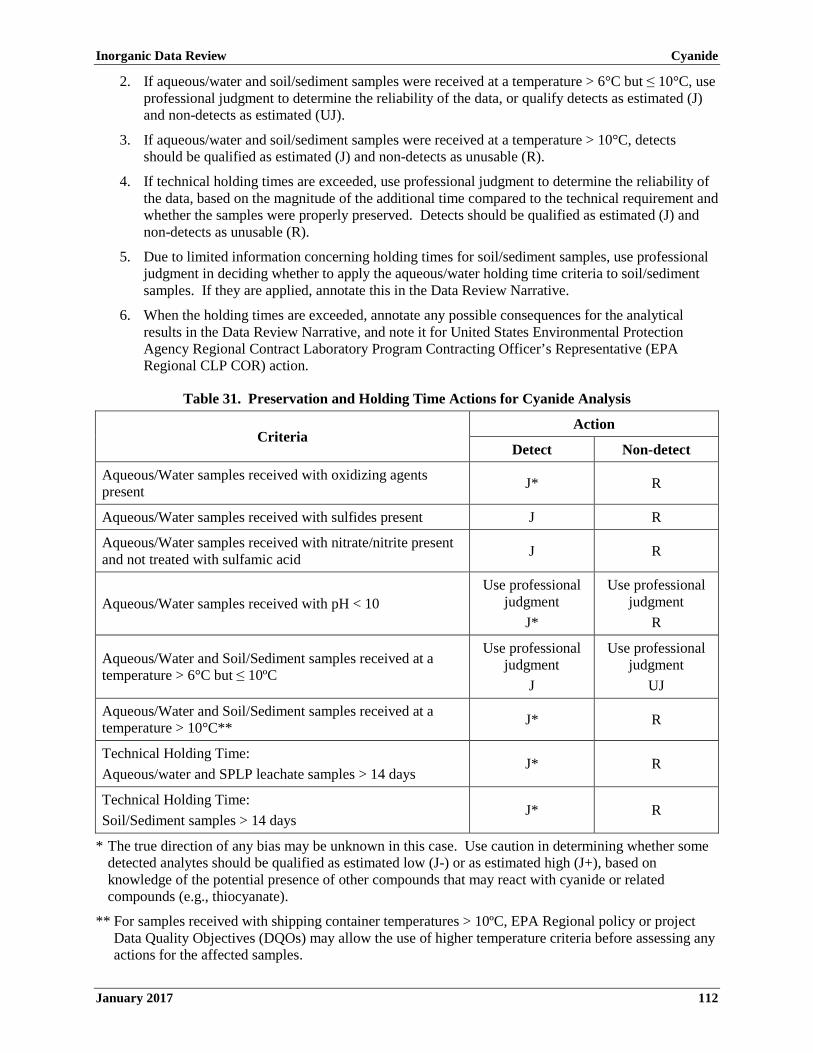
Inorganic Data Review Cyanide
January 2017 112
2. If aqueous/water and soil/sediment samples were received at a temperature > 6°C but ≤ 10°C, use professional judgment to determine the reliability of the data, or qualify detects as estimated (J) and non-detects as estimated (UJ).
3. If aqueous/water and soil/sediment samples were received at a temperature > 10°C, detects should be qualified as estimated (J) and non-detects as unusable (R).
4. If technical holding times are exceeded, use professional judgment to determine the reliability of the data, based on the magnitude of the additional time compared to the technical requirement and whether the samples were properly preserved. Detects should be qualified as estimated (J) and non-detects as unusable (R).
5. Due to limited information concerning holding times for soil/sediment samples, use professional judgment in deciding whether to apply the aqueous/water holding time criteria to soil/sediment samples. If they are applied, annotate this in the Data Review Narrative.
6. When the holding times are exceeded, annotate any possible consequences for the analytical results in the Data Review Narrative, and note it for United States Environmental Protection Agency Regional Contract Laboratory Program Contracting Officer’s Representative (EPA Regional CLP COR) action.
Table 31. Preservation and Holding Time Actions for Cyanide Analysis
Criteria Action
Detect Non-detect
Aqueous/Water samples received with oxidizing agents present J* R
Aqueous/Water samples received with sulfides present J R
Aqueous/Water samples received with nitrate/nitrite present and not treated with sulfamic acid J R
Aqueous/Water samples received with pH < 10 Use professional
judgment J*
Use professional judgment
R
Aqueous/Water and Soil/Sediment samples received at a temperature > 6°C but ≤ 10ºC
Use professional judgment
J
Use professional judgment
UJ
Aqueous/Water and Soil/Sediment samples received at a temperature > 10°C** J* R
Technical Holding Time: Aqueous/water and SPLP leachate samples > 14 days
J* R
Technical Holding Time: Soil/Sediment samples > 14 days
J* R
* The true direction of any bias may be unknown in this case. Use caution in determining whether some detected analytes should be qualified as estimated low (J-) or as estimated high (J+), based on knowledge of the potential presence of other compounds that may react with cyanide or related compounds (e.g., thiocyanate).
** For samples received with shipping container temperatures > 10ºC, EPA Regional policy or project Data Quality Objectives (DQOs) may allow the use of higher temperature criteria before assessing any actions for the affected samples.

Inorganic Data Review Cyanide
January 2017 113
II. Calibration
A. Review Items
Form 2-IN, Form 12-IN, Form 15-IN, Form 16-IN, preparation logs, calibration standard logs, instrument logs, instrument printouts, and raw data. (SOW ISM02.4 – Exhibit B, Section 3.4 and Exhibit D/Cyanide, Sections 7.2.4, 9.1, 9.2, 9.3, 9.4, and 9.5)
B. Objective
The objective is to determine the validity of the analytical results based on initial calibration and calibration verification.
C. Criteria
1. Initial Calibration
The instruments shall be successfully calibrated daily (or once every 24 hours), and each time the instrument is set up. The calibration date and time shall be included in the raw data. The calibration curve standards shall be distilled by the same method used to prepare the samples for analysis.
a. A blank and at least five calibration standards shall be used to establish the calibration curve. At least one of the calibration standards shall be at or below the Contract Required Quantitation Limit (CRQL) but above the Method Detection Limit (MDL). The calibration curve shall be fitted using linear regression or weighted linear regression. The curve may be forced through zero. The calibration curve must have a correlation coefficient ≥ 0.995. The calculated percent differences (%Ds) for all of the non-zero standards must be within ±30% of the true value of the standard.
2. Initial and Continuing Calibration Verification
The acceptance criteria for the Initial Calibration Verification (ICV) and Continuing Calibration Verification (CCV) standards are presented in Table 32. These standards shall be prepared by the same method used to prepare the samples for analysis.
Table 32. Acceptance Criteria for ICV and CCV Standards for Cyanide Analysis
Analytical Method Inorganic Analyte ICV/CCV Low Limit (% of True Value)
ICV/CCV High Limit (% of True Value)
Colorimetric Cyanide 85 115
a. Initial Calibration Verification
1) Immediately after each colorimetric system has been calibrated, the accuracy of the initial calibration must be verified and documented by the analysis of an ICV solution(s). If the ICV Percent Recovery (%R) falls outside of the control limits, the analysis should be terminated, the problem corrected and documented in the SDG Narrative, the instrument recalibrated, and all affected samples reanalyzed.
2) Only if the ICV is not available from the EPA, analyses shall be conducted using a certified solution of the analyte from an independent commercial standard source, at a concentration level other than that used for instrument calibration, but within the calibrated range.
b. Continuing Calibration Verification
1) To ensure accuracy during the course of each analytical sequence, the CCV shall be analyzed and reported.
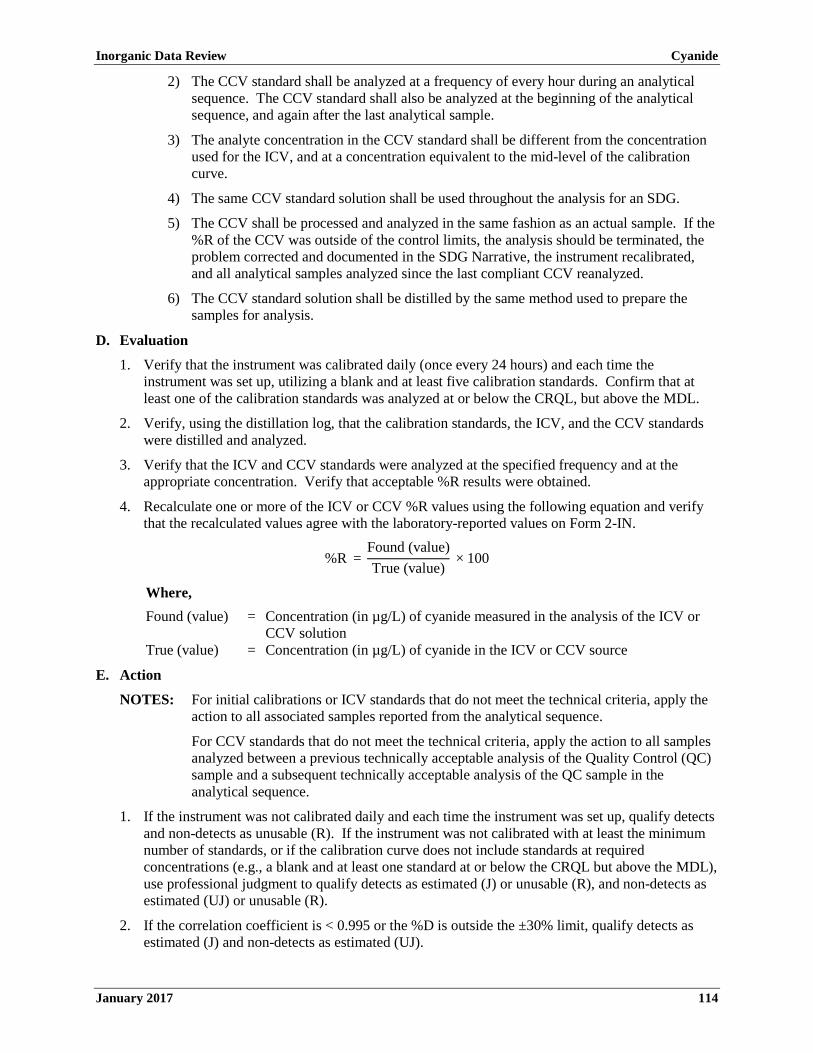
Inorganic Data Review Cyanide
January 2017 114
2) The CCV standard shall be analyzed at a frequency of every hour during an analytical sequence. The CCV standard shall also be analyzed at the beginning of the analytical sequence, and again after the last analytical sample.
3) The analyte concentration in the CCV standard shall be different from the concentration used for the ICV, and at a concentration equivalent to the mid-level of the calibration curve.
4) The same CCV standard solution shall be used throughout the analysis for an SDG.
5) The CCV shall be processed and analyzed in the same fashion as an actual sample. If the %R of the CCV was outside of the control limits, the analysis should be terminated, the problem corrected and documented in the SDG Narrative, the instrument recalibrated, and all analytical samples analyzed since the last compliant CCV reanalyzed.
6) The CCV standard solution shall be distilled by the same method used to prepare the samples for analysis.
D. Evaluation
1. Verify that the instrument was calibrated daily (once every 24 hours) and each time the instrument was set up, utilizing a blank and at least five calibration standards. Confirm that at least one of the calibration standards was analyzed at or below the CRQL, but above the MDL.
2. Verify, using the distillation log, that the calibration standards, the ICV, and the CCV standards were distilled and analyzed.
3. Verify that the ICV and CCV standards were analyzed at the specified frequency and at the appropriate concentration. Verify that acceptable %R results were obtained.
4. Recalculate one or more of the ICV or CCV %R values using the following equation and verify that the recalculated values agree with the laboratory-reported values on Form 2-IN.
%R = Found (value)True (value)
× 100
Where, Found (value) = Concentration (in µg/L) of cyanide measured in the analysis of the ICV or
CCV solution True (value) = Concentration (in µg/L) of cyanide in the ICV or CCV source
E. Action
NOTES: For initial calibrations or ICV standards that do not meet the technical criteria, apply the action to all associated samples reported from the analytical sequence.
For CCV standards that do not meet the technical criteria, apply the action to all samples analyzed between a previous technically acceptable analysis of the Quality Control (QC) sample and a subsequent technically acceptable analysis of the QC sample in the analytical sequence.
1. If the instrument was not calibrated daily and each time the instrument was set up, qualify detects and non-detects as unusable (R). If the instrument was not calibrated with at least the minimum number of standards, or if the calibration curve does not include standards at required concentrations (e.g., a blank and at least one standard at or below the CRQL but above the MDL), use professional judgment to qualify detects as estimated (J) or unusable (R), and non-detects as estimated (UJ) or unusable (R).
2. If the correlation coefficient is < 0.995 or the %D is outside the ±30% limit, qualify detects as estimated (J) and non-detects as estimated (UJ).

Inorganic Data Review Cyanide
January 2017 115
3. If the ICV or the CCV standards are not distilled, qualify detects as estimated (J) and non-detects as estimated (UJ).
4. If the ICV or CCV %R falls outside the acceptance windows, use professional judgment to qualify all associated data. If possible, indicate the bias in the Data Review Narrative. The following guidelines are recommended:
a. If the ICV or CCV %R is < 70%, use professional judgment to qualify detects as estimated low (J-) or unusable (R) and non-detects as unusable (R).
b. If the ICV or CCV %R falls within the range of 70-84%, qualify detects as estimated low (J-) and non-detects as estimated (UJ).
c. If the ICV or CCV %R falls within the range of 85-115%, detects and non-detects should not be qualified.
d. If the ICV or CCV %R falls within the range of 116-130%, qualify detects as estimated high (J+). Non-detects should not be qualified.
e. If the ICV or CCV %R is > 130%, use professional judgment to qualify detects as estimated high (J+) or unusable (R). Non-detects should not be qualified.
5. If the laboratory failed to provide adequate calibration information, notify the EPA Regional CLP COR. The EPA Regional CLP COR may contact the laboratory and request the necessary information. If the information is not available, use professional judgment to assess the data.
6. Annotate the potential effects on the reported data due to exceeding the calibration criteria in the Data Review Narrative.
7. If calibration criteria are grossly exceeded, note this for EPA Regional CLP COR action.
NOTE: For truly critical samples, a further in-depth evaluation of the calibration curve may be warranted to determine if additional qualification is necessary.
Table 33. Calibration Actions for Cyanide Analysis
Criteria Action
Detect Non-detect
Calibration not performed R R
Calibration incomplete Use professional
judgment J or R
Use professional judgment UJ or R
Correlation coefficient < 0.995 or %D outside ±30% J UJ
Standards and QC not distilled J UJ
ICV/CCV %R < 70% Use professional
judgment J- or R
Use professional judgment
R
ICV/CCV %R 70-84% J- UJ
ICV/CCV %R 85-115% No qualification No qualification
ICV/CCV %R 116-130% J+ No qualification
ICV/CCV %R > 130% Use professional
judgment J+ or R
No qualification
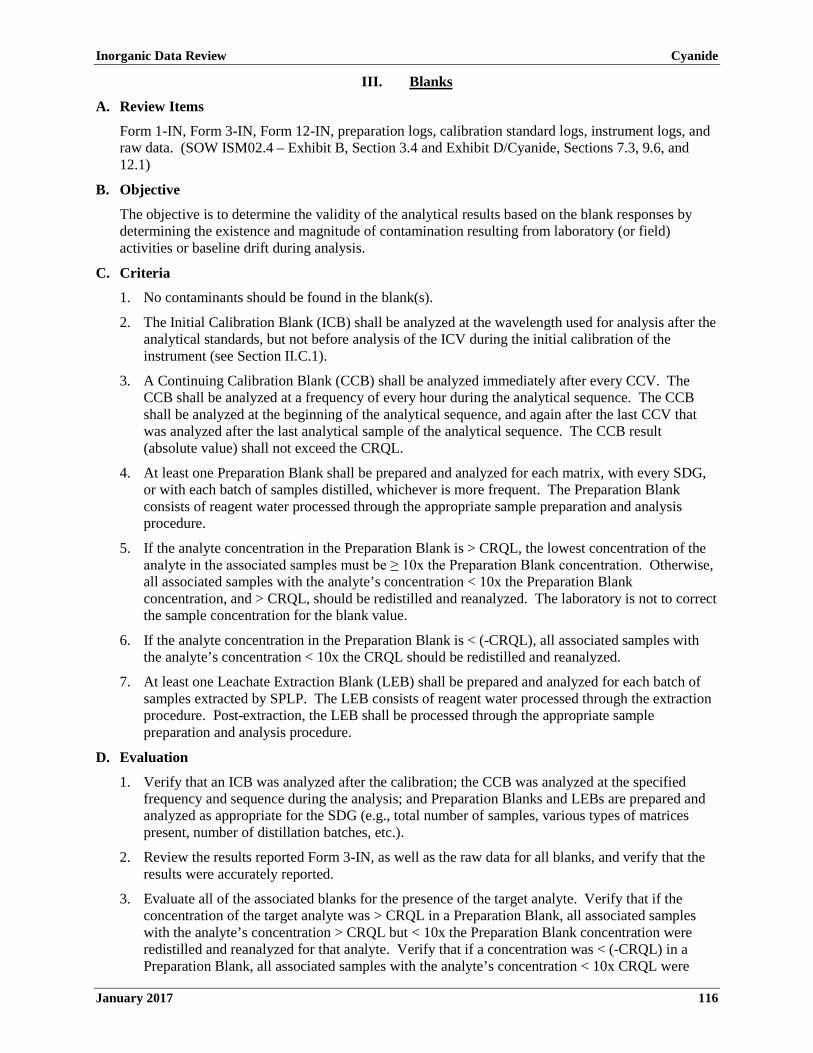
Inorganic Data Review Cyanide
January 2017 116
III. Blanks
A. Review Items
Form 1-IN, Form 3-IN, Form 12-IN, preparation logs, calibration standard logs, instrument logs, and raw data. (SOW ISM02.4 – Exhibit B, Section 3.4 and Exhibit D/Cyanide, Sections 7.3, 9.6, and 12.1)
B. Objective
The objective is to determine the validity of the analytical results based on the blank responses by determining the existence and magnitude of contamination resulting from laboratory (or field) activities or baseline drift during analysis.
C. Criteria
1. No contaminants should be found in the blank(s).
2. The Initial Calibration Blank (ICB) shall be analyzed at the wavelength used for analysis after the analytical standards, but not before analysis of the ICV during the initial calibration of the instrument (see Section II.C.1).
3. A Continuing Calibration Blank (CCB) shall be analyzed immediately after every CCV. The CCB shall be analyzed at a frequency of every hour during the analytical sequence. The CCB shall be analyzed at the beginning of the analytical sequence, and again after the last CCV that was analyzed after the last analytical sample of the analytical sequence. The CCB result (absolute value) shall not exceed the CRQL.
4. At least one Preparation Blank shall be prepared and analyzed for each matrix, with every SDG, or with each batch of samples distilled, whichever is more frequent. The Preparation Blank consists of reagent water processed through the appropriate sample preparation and analysis procedure.
5. If the analyte concentration in the Preparation Blank is > CRQL, the lowest concentration of the analyte in the associated samples must be ≥ 10x the Preparation Blank concentration. Otherwise, all associated samples with the analyte’s concentration < 10x the Preparation Blank concentration, and > CRQL, should be redistilled and reanalyzed. The laboratory is not to correct the sample concentration for the blank value.
6. If the analyte concentration in the Preparation Blank is < (-CRQL), all associated samples with the analyte’s concentration < 10x the CRQL should be redistilled and reanalyzed.
7. At least one Leachate Extraction Blank (LEB) shall be prepared and analyzed for each batch of samples extracted by SPLP. The LEB consists of reagent water processed through the extraction procedure. Post-extraction, the LEB shall be processed through the appropriate sample preparation and analysis procedure.
D. Evaluation
1. Verify that an ICB was analyzed after the calibration; the CCB was analyzed at the specified frequency and sequence during the analysis; and Preparation Blanks and LEBs are prepared and analyzed as appropriate for the SDG (e.g., total number of samples, various types of matrices present, number of distillation batches, etc.).
2. Review the results reported Form 3-IN, as well as the raw data for all blanks, and verify that the results were accurately reported.
3. Evaluate all of the associated blanks for the presence of the target analyte. Verify that if the concentration of the target analyte was > CRQL in a Preparation Blank, all associated samples with the analyte’s concentration > CRQL but < 10x the Preparation Blank concentration were redistilled and reanalyzed for that analyte. Verify that if a concentration was < (-CRQL) in a Preparation Blank, all associated samples with the analyte’s concentration < 10x CRQL were
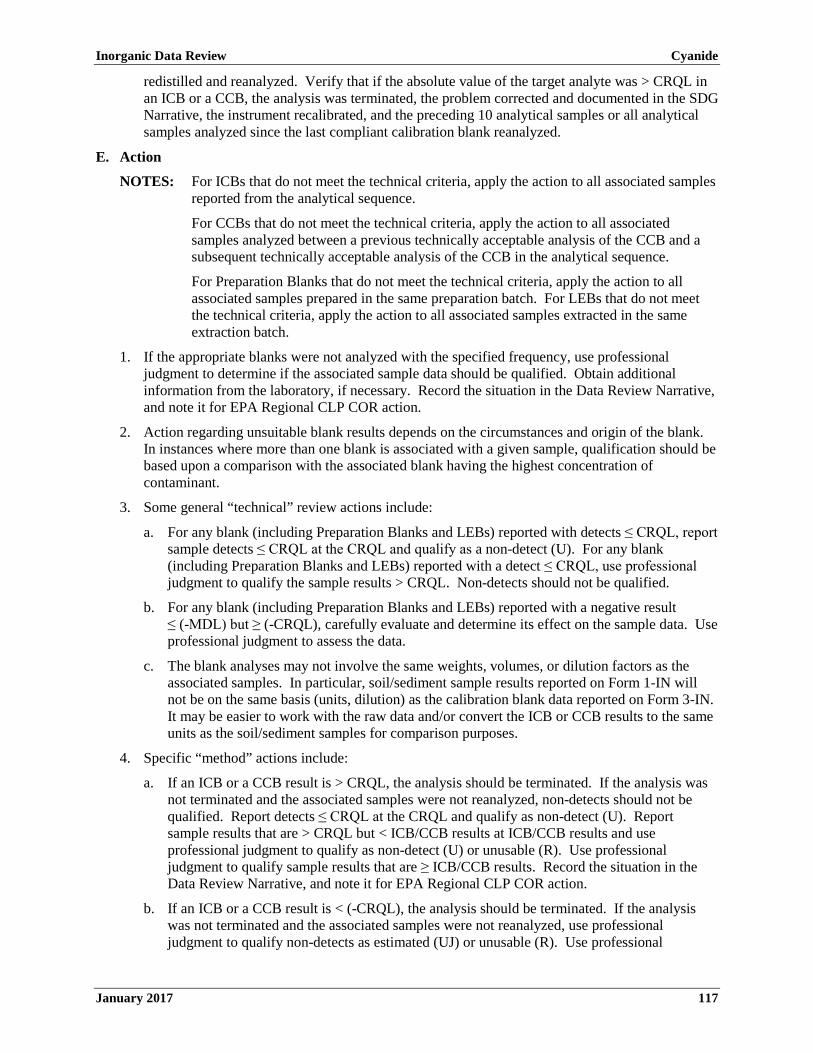
Inorganic Data Review Cyanide
January 2017 117
redistilled and reanalyzed. Verify that if the absolute value of the target analyte was > CRQL in an ICB or a CCB, the analysis was terminated, the problem corrected and documented in the SDG Narrative, the instrument recalibrated, and the preceding 10 analytical samples or all analytical samples analyzed since the last compliant calibration blank reanalyzed.
E. Action
NOTES: For ICBs that do not meet the technical criteria, apply the action to all associated samples reported from the analytical sequence.
For CCBs that do not meet the technical criteria, apply the action to all associated samples analyzed between a previous technically acceptable analysis of the CCB and a subsequent technically acceptable analysis of the CCB in the analytical sequence.
For Preparation Blanks that do not meet the technical criteria, apply the action to all associated samples prepared in the same preparation batch. For LEBs that do not meet the technical criteria, apply the action to all associated samples extracted in the same extraction batch.
1. If the appropriate blanks were not analyzed with the specified frequency, use professional judgment to determine if the associated sample data should be qualified. Obtain additional information from the laboratory, if necessary. Record the situation in the Data Review Narrative, and note it for EPA Regional CLP COR action.
2. Action regarding unsuitable blank results depends on the circumstances and origin of the blank. In instances where more than one blank is associated with a given sample, qualification should be based upon a comparison with the associated blank having the highest concentration of contaminant.
3. Some general “technical” review actions include:
a. For any blank (including Preparation Blanks and LEBs) reported with detects ≤ CRQL, report sample detects ≤ CRQL at the CRQL and qualify as a non-detect (U). For any blank (including Preparation Blanks and LEBs) reported with a detect ≤ CRQL, use professional judgment to qualify the sample results > CRQL. Non-detects should not be qualified.
b. For any blank (including Preparation Blanks and LEBs) reported with a negative result ≤ (-MDL) but ≥ (-CRQL), carefully evaluate and determine its effect on the sample data. Use professional judgment to assess the data.
c. The blank analyses may not involve the same weights, volumes, or dilution factors as the associated samples. In particular, soil/sediment sample results reported on Form 1-IN will not be on the same basis (units, dilution) as the calibration blank data reported on Form 3-IN. It may be easier to work with the raw data and/or convert the ICB or CCB results to the same units as the soil/sediment samples for comparison purposes.
4. Specific “method” actions include:
a. If an ICB or a CCB result is > CRQL, the analysis should be terminated. If the analysis was not terminated and the associated samples were not reanalyzed, non-detects should not be qualified. Report detects ≤ CRQL at the CRQL and qualify as non-detect (U). Report sample results that are > CRQL but < ICB/CCB results at ICB/CCB results and use professional judgment to qualify as non-detect (U) or unusable (R). Use professional judgment to qualify sample results that are ≥ ICB/CCB results. Record the situation in the Data Review Narrative, and note it for EPA Regional CLP COR action.
b. If an ICB or a CCB result is < (-CRQL), the analysis should be terminated. If the analysis was not terminated and the associated samples were not reanalyzed, use professional judgment to qualify non-detects as estimated (UJ) or unusable (R). Use professional
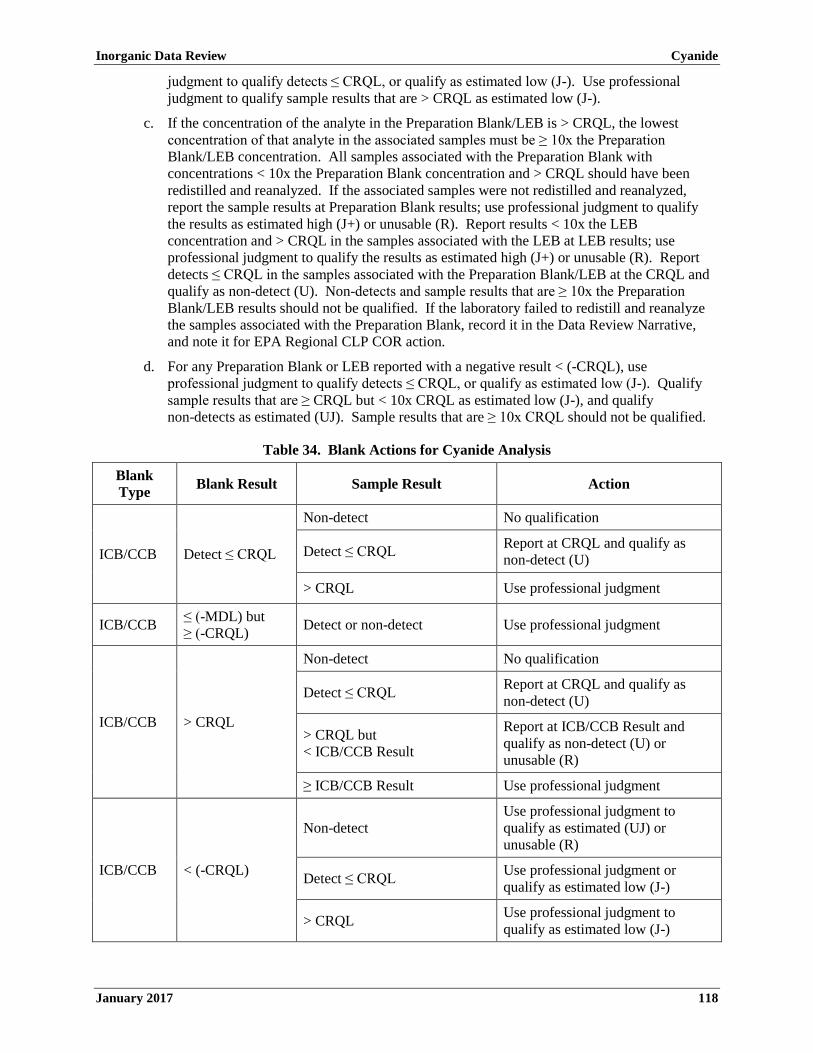
Inorganic Data Review Cyanide
January 2017 118
judgment to qualify detects ≤ CRQL, or qualify as estimated low (J-). Use professional judgment to qualify sample results that are > CRQL as estimated low (J-).
c. If the concentration of the analyte in the Preparation Blank/LEB is > CRQL, the lowest concentration of that analyte in the associated samples must be ≥ 10x the Preparation Blank/LEB concentration. All samples associated with the Preparation Blank with concentrations < 10x the Preparation Blank concentration and > CRQL should have been redistilled and reanalyzed. If the associated samples were not redistilled and reanalyzed, report the sample results at Preparation Blank results; use professional judgment to qualify the results as estimated high (J+) or unusable (R). Report results < 10x the LEB concentration and > CRQL in the samples associated with the LEB at LEB results; use professional judgment to qualify the results as estimated high (J+) or unusable (R). Report detects ≤ CRQL in the samples associated with the Preparation Blank/LEB at the CRQL and qualify as non-detect (U). Non-detects and sample results that are ≥ 10x the Preparation Blank/LEB results should not be qualified. If the laboratory failed to redistill and reanalyze the samples associated with the Preparation Blank, record it in the Data Review Narrative, and note it for EPA Regional CLP COR action.
d. For any Preparation Blank or LEB reported with a negative result < (-CRQL), use professional judgment to qualify detects ≤ CRQL, or qualify as estimated low (J-). Qualify sample results that are ≥ CRQL but < 10x CRQL as estimated low (J-), and qualify non-detects as estimated (UJ). Sample results that are ≥ 10x CRQL should not be qualified.
Table 34. Blank Actions for Cyanide Analysis
Blank Type Blank Result Sample Result Action
ICB/CCB Detect ≤ CRQL
Non-detect No qualification
Detect ≤ CRQL Report at CRQL and qualify as non-detect (U)
> CRQL Use professional judgment
ICB/CCB ≤ (-MDL) but ≥ (-CRQL) Detect or non-detect Use professional judgment
ICB/CCB > CRQL
Non-detect No qualification
Detect ≤ CRQL Report at CRQL and qualify as non-detect (U)
> CRQL but < ICB/CCB Result
Report at ICB/CCB Result and qualify as non-detect (U) or unusable (R)
≥ ICB/CCB Result Use professional judgment
ICB/CCB < (-CRQL)
Non-detect Use professional judgment to qualify as estimated (UJ) or unusable (R)
Detect ≤ CRQL Use professional judgment or qualify as estimated low (J-)
> CRQL Use professional judgment to qualify as estimated low (J-)

Inorganic Data Review Cyanide
January 2017 119
Blank Type Blank Result Sample Result Action
Preparation Blank/LEB Detect ≤ CRQL
Non-detect No qualification
Detect ≤ CRQL Report at CRQL and qualify as non-detect (U)
> CRQL Use professional judgment
Preparation Blank/LEB
≤ (-MDL) but ≥ (-CRQL) Detect or non-detect Use professional judgment
Preparation Blank/LEB > CRQL
Non-detect No qualification
Detect ≤ CRQL Report at CRQL and qualify as non-detect (U)
> CRQL but < 10x the Preparation Blank/LEB Result
Report at Preparation Blank/LEB Result and use professional judgment to qualify results as estimated high (J+) or unusable (R)
≥ 10x the Preparation Blank/LEB Result No qualification
Preparation Blank/LEB < (-CRQL)
Non-detect Qualify as estimated (UJ)
Detect ≤ CRQL Use professional judgment or qualify as estimated low (J-)
< 10x CRQL Qualify results that are ≥ CRQL as estimated low (J-)
≥ 10x CRQL No qualification
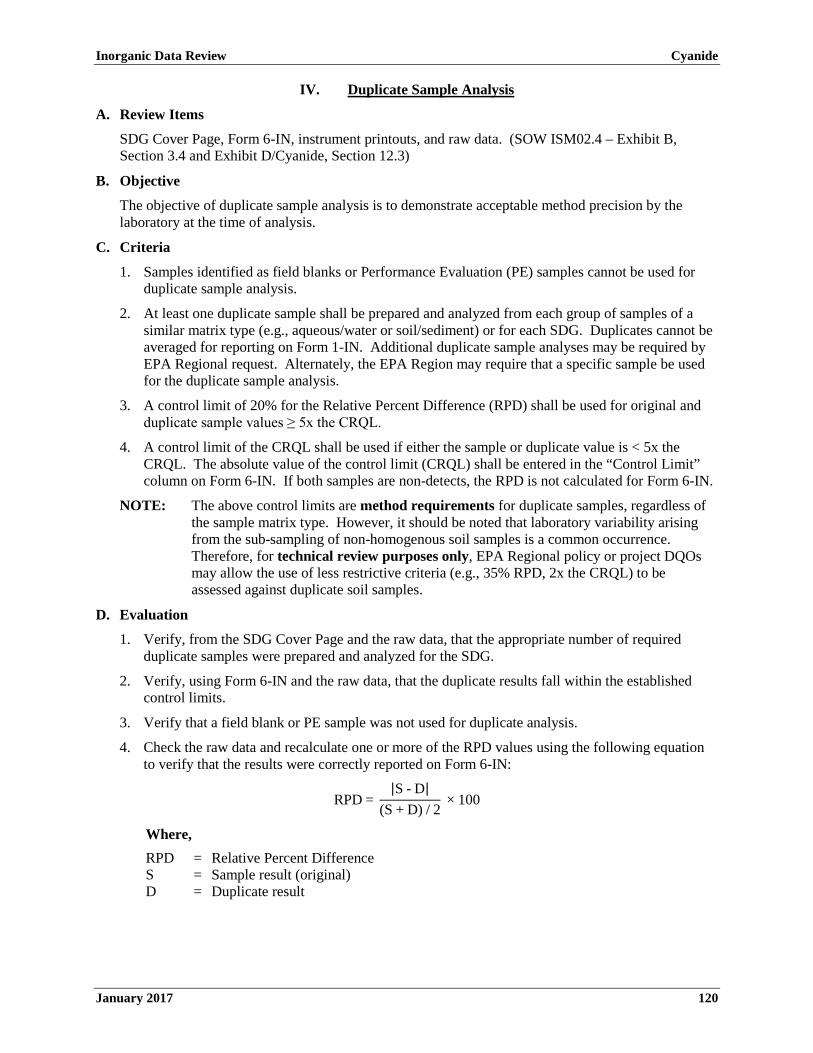
Inorganic Data Review Cyanide
January 2017 120
IV. Duplicate Sample Analysis
A. Review Items
SDG Cover Page, Form 6-IN, instrument printouts, and raw data. (SOW ISM02.4 – Exhibit B, Section 3.4 and Exhibit D/Cyanide, Section 12.3)
B. Objective
The objective of duplicate sample analysis is to demonstrate acceptable method precision by the laboratory at the time of analysis.
C. Criteria
1. Samples identified as field blanks or Performance Evaluation (PE) samples cannot be used for duplicate sample analysis.
2. At least one duplicate sample shall be prepared and analyzed from each group of samples of a similar matrix type (e.g., aqueous/water or soil/sediment) or for each SDG. Duplicates cannot be averaged for reporting on Form 1-IN. Additional duplicate sample analyses may be required by EPA Regional request. Alternately, the EPA Region may require that a specific sample be used for the duplicate sample analysis.
3. A control limit of 20% for the Relative Percent Difference (RPD) shall be used for original and duplicate sample values ≥ 5x the CRQL.
4. A control limit of the CRQL shall be used if either the sample or duplicate value is < 5x the CRQL. The absolute value of the control limit (CRQL) shall be entered in the “Control Limit” column on Form 6-IN. If both samples are non-detects, the RPD is not calculated for Form 6-IN.
NOTE: The above control limits are method requirements for duplicate samples, regardless of the sample matrix type. However, it should be noted that laboratory variability arising from the sub-sampling of non-homogenous soil samples is a common occurrence. Therefore, for technical review purposes only, EPA Regional policy or project DQOs may allow the use of less restrictive criteria (e.g., 35% RPD, 2x the CRQL) to be assessed against duplicate soil samples.
D. Evaluation
1. Verify, from the SDG Cover Page and the raw data, that the appropriate number of required duplicate samples were prepared and analyzed for the SDG.
2. Verify, using Form 6-IN and the raw data, that the duplicate results fall within the established control limits.
3. Verify that a field blank or PE sample was not used for duplicate analysis.
4. Check the raw data and recalculate one or more of the RPD values using the following equation to verify that the results were correctly reported on Form 6-IN:
RPD = |S - D|
(S + D) / 2 × 100
Where, RPD = Relative Percent Difference S = Sample result (original) D = Duplicate result

Inorganic Data Review Cyanide
January 2017 121
E. Action
NOTE: For a duplicate sample analysis that does not meet the technical criteria, apply the action to all samples of the same matrix if the samples are considered sufficiently similar. Exercise professional judgment in determining sample similarity when making use of all available data, including: site and sampling documentation (e.g., location and type of sample, descriptive data, soil classification); field test data (e.g., pH, Eh, conductivity, chlorine); and laboratory data for other parameters [e.g., Total Suspended Solids (TSS), Total Dissolved Solids (TDS), Total Organic Carbon (TOC), alkalinity or buffering capacity, reactive sulfide, anions]. Additionally, use the sample data (e.g., similar concentrations of analytes) in determining similarity between samples in the SDG. Two possible determinations are: 1) only some of the samples in the SDG are similar to the duplicate sample, and that only these samples should be qualified; or 2) no samples are sufficiently similar to the sample used for the duplicate, and thus only the field sample used to prepare the duplicate sample should be qualified.
1. If the appropriate number of duplicate samples were not analyzed for each matrix using the correct frequency, use professional judgment to determine if the associated sample data should be qualified. Obtain additional information from the laboratory, if necessary. Record the situation in the Data Review Narrative, and note it for EPA Regional CLP COR action. Detects should be qualified as estimated (J) and non-detects as estimated (UJ) if any of the frequency criteria is not met.
2. If both original sample and duplicate sample results are ≥ 5x the CRQL and the RPD is > 20%, qualify detects as estimated (J) and non-detects as estimated (UJ).
3. If the RPD is > 100%, use professional judgment to determine if the associated sample data should be qualified.
4. If both original sample and duplicate sample results are ≥ 5x the CRQL and the RPD is ≤ 20%, detects and non-detects should not be qualified.
5. If the original sample or duplicate sample result is < 5x the CRQL (including non-detects) and the absolute difference between sample and duplicate is > CRQL, qualify detects as estimated (J) and non-detects as estimated (UJ).
6. If the original sample or duplicate sample result is < 5x the CRQL (including non-detects) and the absolute difference between sample and duplicate is ≤ CRQL, detects and non-detects should not be qualified.
7. If a field blank or PE sample was used for the duplicate sample analysis, note this for EPA Regional CLP COR action. All of the other QC data must then be carefully checked. Exercise professional judgment when evaluating the data.
8. Annotate the potential effects on the data due to out-of-control duplicate sample results in the Data Review Narrative.
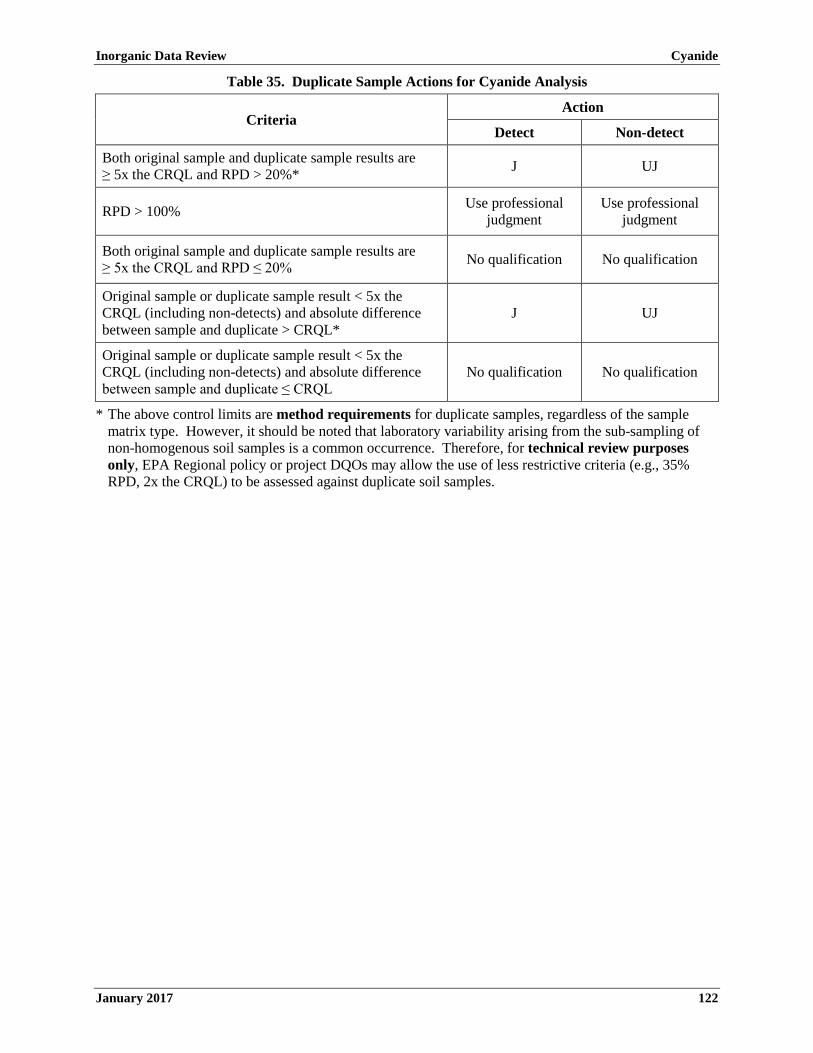
Inorganic Data Review Cyanide
January 2017 122
Table 35. Duplicate Sample Actions for Cyanide Analysis
Criteria Action
Detect Non-detect
Both original sample and duplicate sample results are ≥ 5x the CRQL and RPD > 20%* J UJ
RPD > 100% Use professional judgment
Use professional judgment
Both original sample and duplicate sample results are ≥ 5x the CRQL and RPD ≤ 20% No qualification No qualification
Original sample or duplicate sample result < 5x the CRQL (including non-detects) and absolute difference between sample and duplicate > CRQL*
J UJ
Original sample or duplicate sample result < 5x the CRQL (including non-detects) and absolute difference between sample and duplicate ≤ CRQL
No qualification No qualification
* The above control limits are method requirements for duplicate samples, regardless of the sample matrix type. However, it should be noted that laboratory variability arising from the sub-sampling of non-homogenous soil samples is a common occurrence. Therefore, for technical review purposes only, EPA Regional policy or project DQOs may allow the use of less restrictive criteria (e.g., 35% RPD, 2x the CRQL) to be assessed against duplicate soil samples.
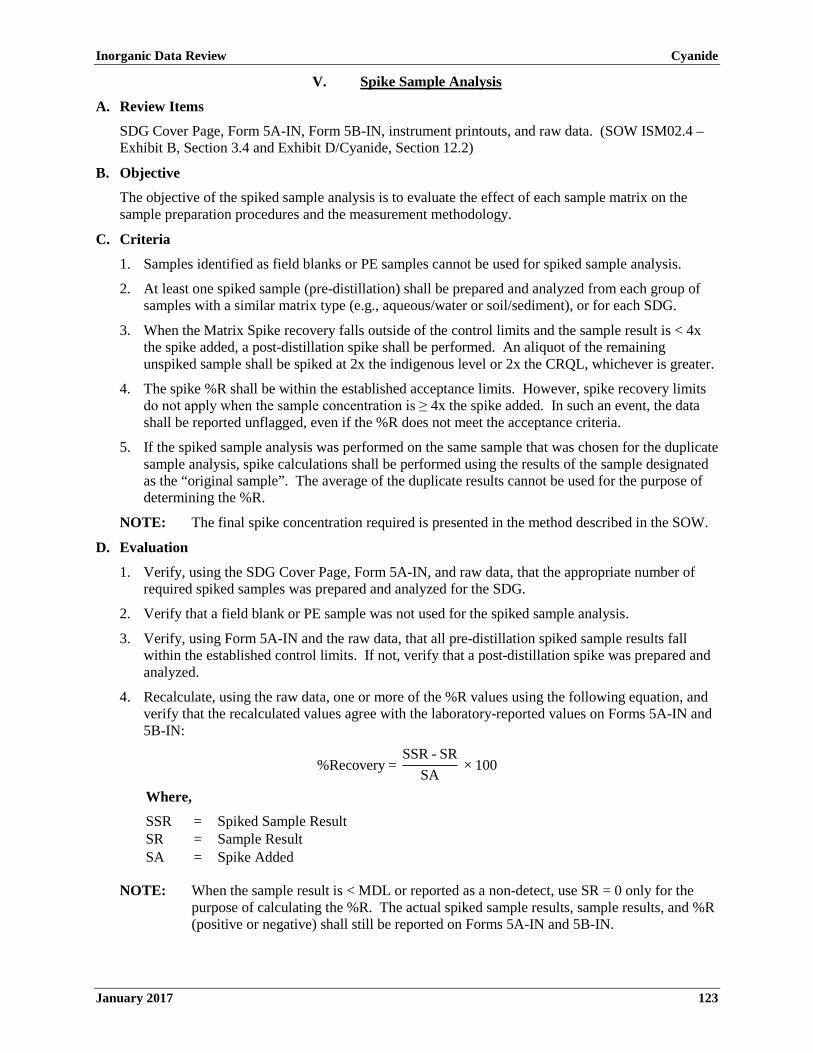
Inorganic Data Review Cyanide
January 2017 123
V. Spike Sample Analysis
A. Review Items
SDG Cover Page, Form 5A-IN, Form 5B-IN, instrument printouts, and raw data. (SOW ISM02.4 – Exhibit B, Section 3.4 and Exhibit D/Cyanide, Section 12.2)
B. Objective
The objective of the spiked sample analysis is to evaluate the effect of each sample matrix on the sample preparation procedures and the measurement methodology.
C. Criteria
1. Samples identified as field blanks or PE samples cannot be used for spiked sample analysis.
2. At least one spiked sample (pre-distillation) shall be prepared and analyzed from each group of samples with a similar matrix type (e.g., aqueous/water or soil/sediment), or for each SDG.
3. When the Matrix Spike recovery falls outside of the control limits and the sample result is < 4x the spike added, a post-distillation spike shall be performed. An aliquot of the remaining unspiked sample shall be spiked at 2x the indigenous level or 2x the CRQL, whichever is greater.
4. The spike %R shall be within the established acceptance limits. However, spike recovery limits do not apply when the sample concentration is ≥ 4x the spike added. In such an event, the data shall be reported unflagged, even if the %R does not meet the acceptance criteria.
5. If the spiked sample analysis was performed on the same sample that was chosen for the duplicate sample analysis, spike calculations shall be performed using the results of the sample designated as the “original sample”. The average of the duplicate results cannot be used for the purpose of determining the %R.
NOTE: The final spike concentration required is presented in the method described in the SOW.
D. Evaluation
1. Verify, using the SDG Cover Page, Form 5A-IN, and raw data, that the appropriate number of required spiked samples was prepared and analyzed for the SDG.
2. Verify that a field blank or PE sample was not used for the spiked sample analysis.
3. Verify, using Form 5A-IN and the raw data, that all pre-distillation spiked sample results fall within the established control limits. If not, verify that a post-distillation spike was prepared and analyzed.
4. Recalculate, using the raw data, one or more of the %R values using the following equation, and verify that the recalculated values agree with the laboratory-reported values on Forms 5A-IN and 5B-IN:
%Recovery = SSR - SR
SA × 100
Where,
SSR = Spiked Sample Result SR = Sample Result SA = Spike Added
NOTE: When the sample result is < MDL or reported as a non-detect, use SR = 0 only for the purpose of calculating the %R. The actual spiked sample results, sample results, and %R (positive or negative) shall still be reported on Forms 5A-IN and 5B-IN.
Inorganic Data Review Cyanide
January 2017 124
E. Action
NOTE: For a Matrix Spike that does not meet the technical criteria, apply the action to all samples of the same matrix if the samples are considered sufficiently similar. Exercise professional judgment in determining sample similarity when making use of all available data, including: site and sampling documentation (e.g., location and type of sample, descriptive data, soil classification); field test data (e.g., pH, Eh, conductivity, chlorine); and laboratory data for other parameters (e.g., TSS, TDS, TOC, alkalinity or buffering capacity, reactive sulfide, anions). Additionally, use the sample data (e.g., similar concentrations of analytes) in determining similarity between samples in the SDG. Two possible determinations are: 1) only some of the samples in the SDG are similar to the Matrix Spike sample, and that only these samples should be qualified; or 2) no samples are sufficiently similar to the sample used for the Matrix Spike, and thus only the field sample used to prepare the Matrix Spike sample should be qualified.
1. If the appropriate number of Matrix Spike samples were not analyzed for each matrix using the correct frequency, use professional judgment to determine if the associated sample data should be qualified. Obtain additional information from the laboratory, if necessary. Record the situation in the Data Review Narrative, and note it for EPA Regional CLP COR action. Detects should be qualified as estimated (J) and non-detects as estimated (UJ) if any of the frequency criteria is not met.
2. If a field blank or PE sample was used for the spiked sample analysis, note this for EPA Regional CLP COR action. All of the other QC data must then be carefully checked. Use professional judgment when evaluating the data. Detects should be qualified as estimated (J) and non-detects as estimated (UJ).
3. If the Matrix Spike recovery does not meet the evaluation criteria and a required post-distillation spike was not performed, note this for EPA Regional CLP COR action.
4. If the Matrix Spike %R is < 30%, verify that a post-distillation spike was analyzed (if required when sample concentration is < 4x spike added). If the post-distillation spike %R is < 75% or the analysis was not performed, qualify detects as estimated low (J-) and non-detects as unusable (R). If the post-distillation spike %R is ≥ 75%, qualify detects as estimated (J) and non-detects as estimated (UJ).
5. If the Matrix Spike %R falls within the range of 30-74%, verify that a post-distillation spike was analyzed (if required when sample concentration is < 4x spike added). If the post-distillation spike %R is < 75% or the analysis was not performed, qualify detects as estimated low (J-) and non-detects as estimated (UJ). If the post-distillation spike %R is ≥ 75%, qualify detects as estimated (J) and non-detects as estimated (UJ).
6. If the Matrix Spike %R falls within the range of 75-125%, no post-distillation spike is required. Detects and non-detects should not be qualified.
7. If the Matrix Spike %R is > 125%, verify that a post-distillation spike was analyzed (if required when sample concentration is < 4x spike added). If the post-distillation spike %R is > 125% or the analysis was not performed, qualify detects as estimated high (J+); non-detects should not be qualified. If the post-distillation spike %R is ≤ 125%, qualify detects as estimated (J); non-detects should not be qualified.
8. Annotate the potential effects on the data due to out-of-control spiked sample results in the Data Review Narrative.
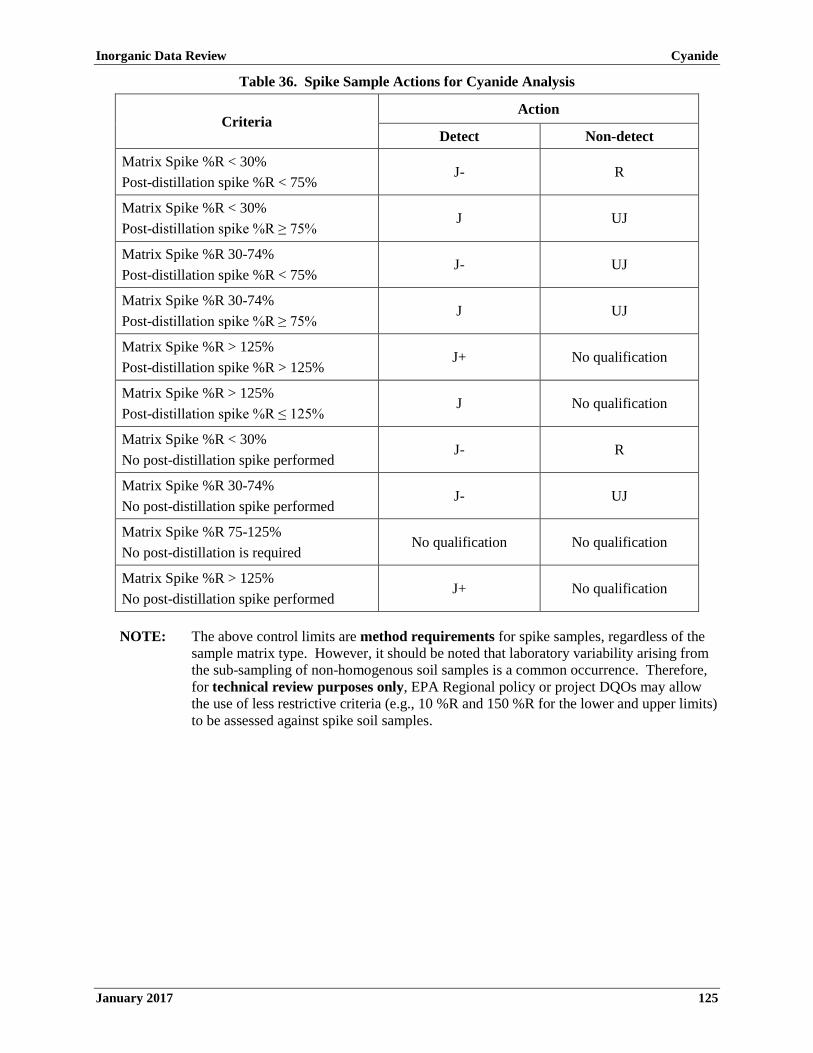
Inorganic Data Review Cyanide
January 2017 125
Table 36. Spike Sample Actions for Cyanide Analysis
Criteria Action
Detect Non-detect
Matrix Spike %R < 30% Post-distillation spike %R < 75%
J- R
Matrix Spike %R < 30% Post-distillation spike %R ≥ 75%
J UJ
Matrix Spike %R 30-74% Post-distillation spike %R < 75%
J- UJ
Matrix Spike %R 30-74% Post-distillation spike %R ≥ 75%
J UJ
Matrix Spike %R > 125% Post-distillation spike %R > 125%
J+ No qualification
Matrix Spike %R > 125% Post-distillation spike %R ≤ 125%
J No qualification
Matrix Spike %R < 30% No post-distillation spike performed
J- R
Matrix Spike %R 30-74% No post-distillation spike performed
J- UJ
Matrix Spike %R 75-125% No post-distillation is required
No qualification No qualification
Matrix Spike %R > 125% No post-distillation spike performed
J+ No qualification
NOTE: The above control limits are method requirements for spike samples, regardless of the sample matrix type. However, it should be noted that laboratory variability arising from the sub-sampling of non-homogenous soil samples is a common occurrence. Therefore, for technical review purposes only, EPA Regional policy or project DQOs may allow the use of less restrictive criteria (e.g., 10 %R and 150 %R for the lower and upper limits) to be assessed against spike soil samples.
Inorganic Data Review Cyanide
January 2017 126
VI. Performance Evaluation Sample
A. Review Items
Form 1-IN, TR/COC Record documentation, preparation logs, instrument printouts, and raw data. (SOW ISM02.4 – Exhibit B, Section 3.4 and Exhibit F, Section 4.1)
B. Objective
The objective is to determine the validity of the analytical results based on the recovery of the PE sample(s).
C. Criteria
1. Matrix-specific PE samples shall be analyzed utilizing the same analytical methods and Quality Assurance/Quality Control (QA/QC) procedures as employed for the samples, at a frequency to be determined by each EPA Region for each site. PE samples must be analyzed in an SDG containing field samples for the Case, using the same procedures, reagents, and instrumentation.
D. Evaluation
1. Verify, using Form 1-IN, preparation logs, and raw data, that the PE samples were analyzed with the field samples and field blanks in the SDG.
2. Verify, using Form 1-IN, that the PE sample results are within the warning limits (95% confidence interval) and action limits (99% confidence interval).
3. If a significant number (i.e., half or more) of the analytes in the PE samples fall outside of the 95% warning or 99% action criteria, or a number of false positive results are reported, evaluate the overall impact on the data.
E. Action
NOTE: If the PE sample criteria are not met, the laboratory performance and method accuracy are in question. Use professional judgment to determine if the data should be qualified or rejected. The following guidance is suggested for qualifying sample data associated with a PE sample that does not meet the required criteria.
For a PE sample that does not meet the technical criteria, apply the action to all samples in the same preparation batch. If the concentration of any analyte in a PE sample is not comparable to the analyte’s concentration in the field samples or field blanks (i.e., it is much higher or much lower than the concentration in these samples), the action may be applied to only those samples in which the analyte’s concentration is comparable to the PE sample concentration.
1. If the PE sample was not analyzed with the field samples and field blanks, use professional judgment to determine if the associated sample results should be qualified. Obtain additional information from the laboratory, if necessary. If a laboratory fails to analyze the PE sample(s) provided with field samples and field blanks, or if a laboratory consistently fails to generate acceptable PE sample results, record the situation in the Data Review Narrative, and note it for EPA Regional CLP COR action.
2. If the PE sample results are outside the lower warning limits but inside the lower action limits, qualify detects as estimated low (J-) and non-detects as estimated (UJ).
3. If the PE sample results are outside the lower action limits, qualify detects as estimated low (J-) and non-detects as unusable (R).
4. If the PE sample results are within the limits, detects and non-detects should not be qualified.
5. If the PE sample results are outside the upper warning limits but inside the upper action limits, qualify detects as estimated high (J+). Non-detects should not be qualified.

Inorganic Data Review Cyanide
January 2017 127
6. If the PE sample results are outside the upper action limits, qualify detects as estimated high (J+). Non-detects should not be qualified.
7. Annotate the potential effects on the data due to out-of-control PE sample results in the Data Review Narrative.
Table 37. PE Sample Actions for Cyanide Analysis
Criteria Action
Detect Non-detect
PE sample results outside lower warning limits but inside lower action limits J- UJ
PE sample results outside lower action limits J- R
PE sample results within limits No qualification No qualification
PE sample results outside upper warning limits but inside upper action limits J+ No qualification
PE sample results outside upper action limits J+ No qualification

Inorganic Data Review Cyanide
January 2017 128
VII. Regional Quality Assurance and Quality Control
A. Review Items
Form 1-IN, instrument printouts, and raw data. (SOW ISM02.4 – Exhibit B, Sections 2.4 and 3.4)
B. Objective
The objective is to use results from the analysis of EPA Regional QA/QC samples such as field blanks, blind spikes, and blind blanks to determine the validity of the analytical results.
C. Criteria
Criteria are determined by each EPA Region.
1. The frequency of EPA Regional QA/QC samples should be defined in the project QAPP.
2. Performance criteria for EPA Regional QA/QC samples should also be defined in the project QAPP.
3. The EPA Region may provide the laboratory with PE samples to be analyzed with each SDG. These samples may include blind spikes and/or blind blanks. The laboratory must analyze a PE sample when provided by the EPA Region. Refer to Section III, above, for blanks criteria. Refer to Section VI, above, for PE samples criteria.
4. The RPD between field duplicates shall fall within the specific limits in the EPA Region’s Standard Operating Procedure (SOP) or project QAPP.
D. Evaluation
1. Evaluation procedures must follow the EPA Region’s SOP for data review.
2. Determine whether the results of EPA Regional QA/QC samples impact all samples in the project or only those directly associated (i.e., in the same SDG, collected on the same day, prepared together, or contained in the same analytical sequence).
3. Calculate the RPD between field duplicates and provide this information in the Data Review Narrative. Also verify that the value falls within the specific limits in the EPA Region’s SOP or project QAPP.
4. Determine whether poor precision is the fault of the laboratory, or a result of sample non-homogeneity in the field. Laboratory observations of sample appearance may become important in these situations.
E. Action
1. Any action must be in accordance with EPA Regional specifications and the criteria for acceptable field duplicate sample results.
2. Note unacceptable results for field duplicate samples for EPA Regional CLP COR action.
3. In general, for EPA Regional QA/QC performance not within QAPP specification, qualify detects as estimated (J) and non-detects as estimated (UJ). The impact on overall data quality should be assessed after consultation with the data user and/or field personnel. Contact the EPA Regional CLP COR if reanalysis of samples is required.
Inorganic Data Review Cyanide
January 2017 129
VIII. Overall Assessment of Data
A. Review Items
Entire data package, data review results, preparation logs, calibration standard logs, instrument logs, instrument printouts, and raw data (including any confirmation data).
B. Objective
The objective is to provide the overall assessment on data quality and usability.
C. Criteria
1. Review all available materials to assess the overall quality of the data, keeping in mind the additive nature of analytical problems.
2. Reported analyte concentrations must be quantitated according to the appropriate equations, as listed in the method. All sample results must be within the linear calibration ranges per the methods. Percent Solids (%Solids) must be properly used for all applicable matrix result calculations.
D. Evaluation
Examine the raw data to verify that the correct calculation of the sample results was reported by the laboratory. Distillation logs, instrument printouts, etc., should be compared to the reported sample results recorded on the appropriate Inorganic Data Reporting Forms (Form 1-IN through Form 16-IN).
1. Evaluate any technical problems not previously addressed.
2. Examine the raw data for any anomalies (e.g., baseline shifts, negative absorbance, omissions, illegibility, etc.).
3. Verify that the appropriate methods and amounts were used to prepare samples and standards for analysis. If reduced volumes were used, verify that the laboratory had received EPA Regional CLP COR approval for the use of the reduced volume.
4. Verify that there are no transcription or reduction errors (e.g., dilutions, %Solids, sample weights, etc.) on one or more samples. Recalculate %Solids for at least 10% of the samples and verify that the calculated %Solids agree with that reported by the laboratory.
5. Verify that the MDL is properly reported and it is not greater than the CRQL.
6. Verify that results fall within the calibrated range (Form 15-IN).
7. If appropriate information is available, assess the usability of the data to assist the data user in avoiding inappropriate use of the data. Review all available information, including the Quality Assurance Project Plan (QAPP), focusing specifically on the acceptance or performance criteria, the SOPs, and communication with the user concerning the intended use and desired quality of these data.
E. Action
1. Use professional judgment to determine if there is any need to qualify data which were not qualified based on the QC criteria previously discussed.
2. Use professional judgment to qualify detects and non-detects if the MDL exceeds the CRQL.
3. If a sample is not diluted properly when sample results exceed the upper limit of the calibration range, qualify detect as estimated (J).

Inorganic Data Review Cyanide
January 2017 130
4. Write a brief Data Review Narrative to give the user an indication of the limitations of the analytical data. Annotate any discrepancies between the data and the SDG Narrative for EPA Regional CLP COR action. If sufficient information on the intended use and required quality of the data is available, include an assessment of the data usability within the given context.
5. If any discrepancies are found, notify the EPA Regional CLP COR. The EPA Regional CLP COR may contact the laboratory to obtain additional information for resolution. If a discrepancy remains unresolved, use professional judgment to determine if qualification of the data is warranted.
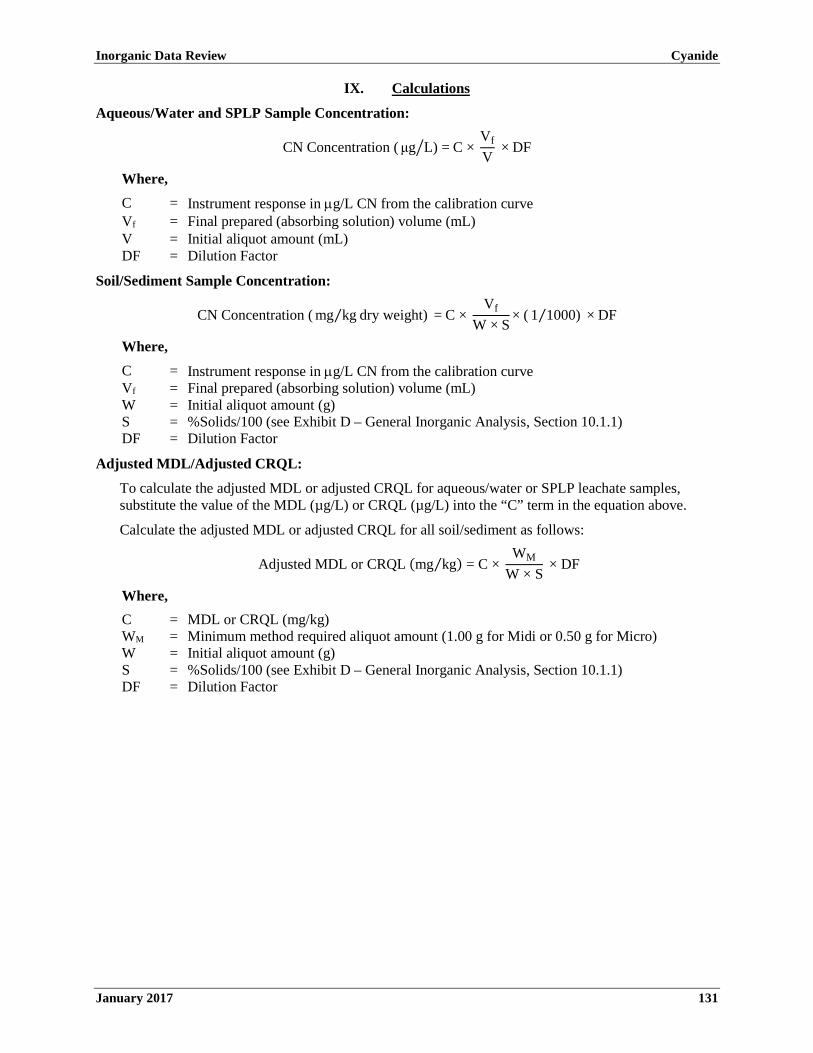
Inorganic Data Review Cyanide
January 2017 131
IX. Calculations
Aqueous/Water and SPLP Sample Concentration:
CN Concentration ( μg L) = C × Vf
V� × DF
Where, C = Instrument response in µg/L CN from the calibration curve Vf = Final prepared (absorbing solution) volume (mL) V = Initial aliquot amount (mL) DF = Dilution Factor
Soil/Sediment Sample Concentration:
CN Concentration ( mg kg dry weight)⁄ = C × Vf
W × S× ( 1 1000)⁄ × DF
Where, C = Instrument response in µg/L CN from the calibration curve Vf = Final prepared (absorbing solution) volume (mL) W = Initial aliquot amount (g) S = %Solids/100 (see Exhibit D – General Inorganic Analysis, Section 10.1.1) DF = Dilution Factor
Adjusted MDL/Adjusted CRQL:
To calculate the adjusted MDL or adjusted CRQL for aqueous/water or SPLP leachate samples, substitute the value of the MDL (µg/L) or CRQL (µg/L) into the “C” term in the equation above.
Calculate the adjusted MDL or adjusted CRQL for all soil/sediment as follows:
Adjusted MDL or CRQL (mg kg⁄ ) = C × WM
W × S × DF
Where, C = MDL or CRQL (mg/kg) WM = Minimum method required aliquot amount (1.00 g for Midi or 0.50 g for Micro) W = Initial aliquot amount (g) S = %Solids/100 (see Exhibit D – General Inorganic Analysis, Section 10.1.1) DF = Dilution Factor
Inorganic Data Review Cyanide
January 2017 132
This page is intentionally left blank.
Inorganic Data Review Appendix A
January 2017 A-1
APPENDIX A: GLOSSARY
Analyte – The element or ion an analysis seeks to determine; the element of interest.
Analytical Sample – Any solution or media introduced into an instrument on which an analysis is performed, excluding instrument calibration, Initial Calibration Verification (ICV), Initial Calibration Blank (ICB), Continuing Calibration Verification (CCV), Continuing Calibration Blank (CCB), and tunes. Note that the following are all defined as analytical samples: undiluted and diluted samples (EPA and non-EPA); matrix spike samples; duplicate samples; serial dilution samples, post-digestion/post-distillation spike samples; Interference Check Samples (ICSs); Laboratory Control Samples (LCSs); Performance Evaluation (PE) samples; and Preparation Blanks.
Analytical Services Branch (ASB) – The division of the United States Environmental Protection Agency’s (EPA’s) Office of Superfund Remediation and Technology Innovation (OSRTI) responsible for the overall management of the Contract Laboratory Program (CLP). Associated Samples – Any sample related to a particular Quality Control (QC) analysis. For example, for Initial Calibration Verification (ICV), all samples analyzed under the same calibration curve. For duplicates, all Sample Delivery Group (SDG) samples digested/distilled of the same matrix.
Blank – An analytical sample that has negligible or unmeasurable amounts of a substance of interest. The blank is designed to assess specific sources of contamination. Types of blanks may include calibration blanks, preparation blanks, and field blanks. See the individual definitions for types of blanks.
Calibration – A set of operations that establish under specific conditions, the relationship between values indicated by a measuring instrument and the corresponding known values. The calibration standards must be prepared using the same type of reagents or concentration of acids as used in the sample preparation.
Calibration Blank – A blank solution containing all of the reagents and in the same concentration as those used in the analytical sample preparation. This blank is not subjected to the preparation method for Inductively Coupled Plasma – Atomic Emission Spectroscopy (ICP-AES) and Inductively Coupled Plasma – Mass Spectrometry (ICP-MS), but is digested for mercury and cyanide. Calibration blanks are used to verify that the instrument baseline is stable and the instrument is free of contamination.
Calibration Curve – A plot of instrument response versus concentration of standards.
Calibration Standards – A series of known standard solutions used by the analyst for calibration of the instrument (i.e., preparation of the calibration curve). The solutions may or may not be subjected to the preparation method, but contain the same matrix (i.e., the same amount of reagents and/or preservatives) as the sample preparations to be analyzed.
Case – A finite, usually predetermined number of samples collected over a given time period from a particular site. Case Numbers are assigned by the Sample Management Office (SMO). A Case consists of one or more Sample Delivery Groups (SDGs).
Continuing Calibration Blank (CCB) – A reagent water sample that is run 2 hours (ICP-AES, ICP-MS) or every hour (Hg, CN) and designed to detect any carryover contamination.
Continuing Calibration Verification (CCV) – A single parameter or multi-parameter standard solution prepared by the analyst and used to verify the stability of the instrument calibration with time, and the instrument performance during the analysis of samples. The CCV can be one of the calibration standards. However, all parameters being measured by the particular system must be represented in this standard and the standard must have the same matrix (i.e., the same amount of reagents and/or preservatives) as the samples. The CCV should have a concentration in the middle of the calibration range and shall be analyzed at the beginning of the day prior to the analysis of samples, and every 2 hours (1 hour for Hg and CN).

Inorganic Data Review Appendix A
January 2017 A-2
Contract Compliance Screening (CCS) – A screening of electronic and hardcopy data deliverables for completeness and compliance with the contract. This screening is performed under EPA direction by the Contract Laboratory Program (CLP) Sample Management Office (SMO) Contractor.
Contract Laboratory Program (CLP) – Supports the EPA’s Superfund effort by providing a range of state-of-the-art chemical analytical services of known and documented quality. This program is directed by the Analytical Services Branch (ASB) of the Office of Superfund Remediation and Technical Innovation (OSRTI) of the EPA.
Contract Required Quantitation Limit (CRQL) – Minimum level of quantitation acceptable under the contract Statement of Work (SOW), and supported by the analysis of standards.
Contractual Holding Time – The maximum amount of time that the Contract Laboratory Program (CLP) laboratory may hold the samples from the sample receipt date until analysis and still be in compliance with the terms of the contract, as specified in the United States Environmental Protection Agency (EPA) Contract Laboratory Program (CLP) Statement of Work (SOW) for Inorganic Superfund Methods (Multi-Media, Multi-Concentration) ISM02.4. These times are the same or less than technical holding times to allow for sample packaging and shipping.
Duplicate – A second aliquot of a sample that is treated the same as the original sample in order to evaluate the precision.
EPA Regional CLP Contracting Officer’s Representative (EPA Regional CLP COR) – The EPA official who monitors assigned CLP laboratories (either inside or outside of the Regional CLP COR’s respective Region), responds to and identifies problems in laboratory operations, and participants in on-site laboratory audits.
Field Blank – Any sample that is submitted from the field and identified as a blank. A field blank is used to check for cross-contamination during sample collection, sample shipment, and in the laboratory. A field blank includes trip blanks, rinsate blanks, bottle blanks, equipment blanks, preservative blanks, decontamination blanks, etc.
Field Duplicate – A duplicate sample generated in the field, not in the laboratory.
Initial Calibration – Analysis of analytical standards for a series of different specified concentrations; used to define the quantitative response, linearity, and dynamic range of the instrument to target analytes.
Initial Calibration Blank (ICB) – The first blank standard analysis to confirm the calibration curve.
Initial Calibration Verification (ICV) – Solution(s) prepared from stock standard solutions, metals, or salts obtained from a source separate from that utilized to prepare the calibration standards. The ICV is used to verify the concentration of the calibration standards and the adequacy of the instrument calibration. The ICV should be traceable to National Institute of Standards and Technology (NIST) or other certified standard sources when EPA ICV solutions are not available.
Interference Check Sample (ICS) – A solution containing both interfering and analyte elements of known concentration that can be used to verify background and interelement correction factors.
Internal Standard – A non-target element added to a sample at a known concentration after preparation but prior to analysis. Instrument responses to internal standards are monitored as a means of assessing overall instrument performance.
Laboratory Control Sample (LCS) – A reference matrix spiked with target analytes at a known concentration. LCSs are analyzed using the same sample preparation, reagents, and analytical methods employed for the EPA samples received.
Matrix – The predominant material of which the sample to be analyzed is composed. For the purposes of this document, the matrices are aqueous/water, soil/sediment, and wipe. Matrix is not synonymous with phase (liquid or solid).
Inorganic Data Review Appendix A
January 2017 A-3
Matrix Spike – Aliquot of a sample (aqueous/water or soil/sediment) fortified (spiked) with known quantities of specific compounds and subjected to the entire analytical procedure to indicate the appropriateness of the method for the matrix by measuring recovery.
Method Detection Limit (MDL) – The concentration of a target parameter that, when a sample is processed through the complete method, produces a signal with 99 percent probability that it is different from the blank. For 7 replicates of the sample, the mean value must be 3.14s above the blank, where “s” is the standard deviation of the 7 replicates.
Percent Difference (%D) – As used in this document and the Statement of Work (SOW), is used to compare two values. It is the difference between the two values divided by one of the values multiplied by 100.
Performance Evaluation (PE) Sample – A sample of known composition to the EPA; however, unknown to the Contractor that is provided to evaluate Contractor performance.
Post-Digestion Spike/Post-Distillation Spike – The addition of a known amount of standard after digestion or distillation (also identified as an analytical spike).
Preparation Blank – An analytical control that contains reagent water and reagents, which is carried through the entire preparation and analytical procedure.
Relative Percent Difference (RPD) – As used in this document and the Statement of Work (SOW) to compare two values, the RPD is based on the mean of the two values, and is reported as an absolute value (i.e., always expressed as a positive number or zero).
Relative Standard Deviation (RSD) – As used in this document and the Statement of Work (SOW), the mean divided by the standard deviation, expressed as a percentage.
Sample – A portion of material to be analyzed that is contained in single or multiple containers and identified by a unique sample number.
Sample Delivery Group (SDG) – A unit within a sample Case that is used to identify a group of samples for delivery. An SDG is defined by the following, whichever is most frequent:
• Each 20 field samples [excluding Performance Evaluation (PE) samples] within a Case; or
• Each 7 calendar day period (3 calendar day period for 7-day turnaround) during which field samples in a Case are received (said period beginning with the receipt of the first sample in the SDG).
• All samples scheduled with the same level of deliverables.
• In addition, all samples and/or sample fractions assigned to an SDG must be scheduled under the same contractual turnaround time. Preliminary Results have no impact on defining the SDG.
Samples may be assigned to SDGs by matrix (i.e., all soil/sediment samples in one SDG, all aqueous/water samples in another) at the discretion of the laboratory. Laboratories shall take all precautions to meet the 20 sample per SDG criteria.
Sample Management Office (SMO) – A Contractor-operated facility operated under the SMO contract, awarded and administered by the EPA.
SDG Narrative – Portion of the data package which includes laboratory, contract, Case, Sample Number identification, and descriptive documentation of any problems encountered in processing the samples, along with corrective action taken and problem resolution.
Serial Dilution – The dilution of a sample by a factor of five. When corrected by the Dilution Factor (DF), the diluted sample must agree with the original undiluted sample within specified limits. Serial dilution may reflect the influence of interferents [Inductively Coupled Plasma (ICP) only].
Statement of Work (SOW) – A document which specifies how laboratories analyze samples under a particular Contract Laboratory Program (CLP) analytical program.

Inorganic Data Review Appendix A
January 2017 A-4
Technical Holding Time – The maximum amount of time that samples may be held from the collection date until analysis.
Tune – A solution containing a range of isotope masses to establish Inductively Coupled Plasma – Mass Spectrometry (ICP-MS) accuracy, resolution, and precision prior to calibration. May also be called Instrument Performance Check sample (IPC).

Inorganic Data Review Appendix B
January 2017 B-1
APPENDIX B: INORGANIC DATA REVIEW SUMMARY
CASE NO. SITE
LABORATORY NO. OF SAMPLES/MATRIX
MA NO. SDG NO.
SOW NO. REGION
REVIEWER NAME COMPLETION DATE
REGIONAL CLP COR ACTION FYI
REVIEW CRITERIA METHOD/ANALYTE
ICP-AES ICP-MS Mercury Cyanide
1. Preservation and Holding Time
2. Tune Analysis
3. Calibration
4. Blanks
5. Interference Check Sample
6. Laboratory Control Sample
7. Duplicate Sample Analysis
8. Spike Sample Analysis
9. Serial Dilution
10. Internal Standards
11. Performance Evaluation Sample
12. Regional Quality Assurance and Quality Control
13. Overall Assessment of Data

Inorganic Data Review Appendix B
January 2017 B-2
This page is intentionally left blank.