national income and product accounts tables · national income and product accounts tables ......
TRANSCRIPT
August
National Income and Product Accounts Tables
This section presents revised estimates for through the first quarter of and advance estimates forthe second quarter of for most of the national income and product accounts () tables that are usuallypublished as part of an annual revision of the ’s. (The article that precedes this section describes the annualrevision.) “Summary National Income and Product Series, –,” which shows revised annual and quarterlyestimates for major aggregates and components, begins on page .
Most of the tables in section , “Quantity and Price Indexes,” have been reorganized; in addition, severalnew tables, .–., have been introduced. For more information, see “Presentational Changes” in the articledescribing the revision.
Tables .–. and .–. are not yet available on the revised basis; these tables are scheduled to bepublished in the October S. In addition, tables .–. are scheduled to be published in the SeptemberS.
The estimates presented here, along with unrevised estimates for earlier periods (for most tables, back to) and tables .–., are available in electronic form from - and on diskettes from (see thebox “Data Availability” on page ).
The tables contain annual, quarterly, and monthly estimates, indicated as follows:
A Only annual estimatesQ Only quarterly estimatesQA Quarterly and annual estimatesMA Monthly and annual estimates
Table number and title Page
A Summary National Income and Product Accounts, 1996 ........................ 38
1. National Product and Income1.1 Gross Domestic Product: QA .................................................................... 401.2 Real Gross Domestic Product: QA ........................................................... 411.3 Gross Domestic Product by Major Type of Product: QA ........................ 421.4 Real Gross Domestic Product by Major Type of Product: QA ................ 431.5 Relation of Gross Domestic Product, Gross Domestic Purchases, and
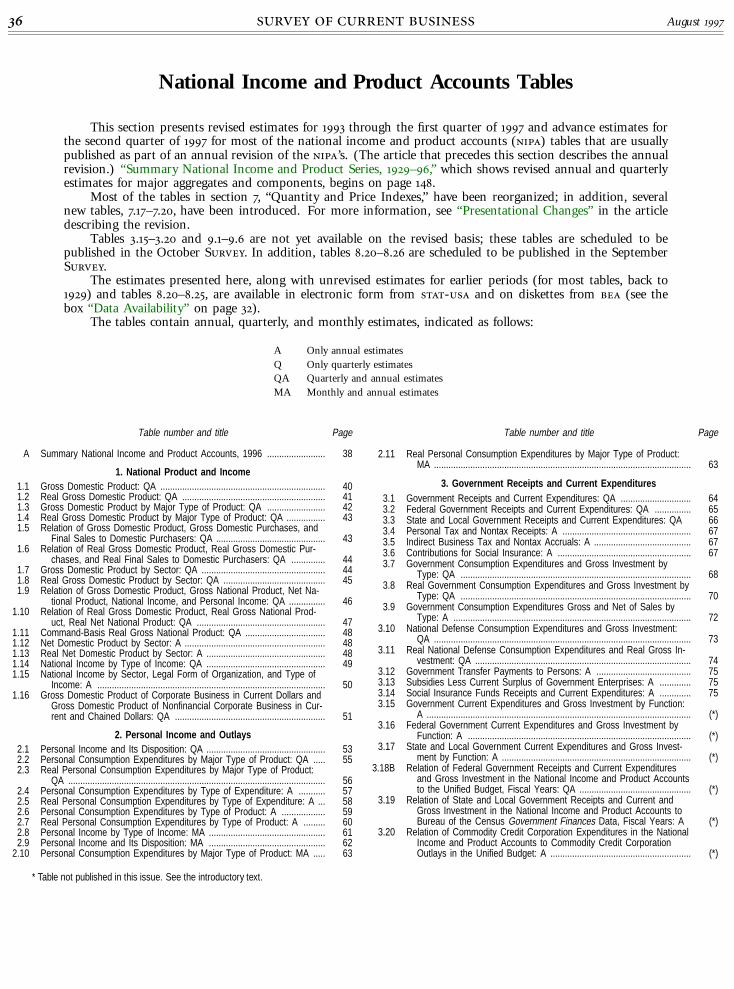
Final Sales to Domestic Purchasers: QA ............................................. 431.6 Relation of Real Gross Domestic Product, Real Gross Domestic Pur-
chases, and Real Final Sales to Domestic Purchasers: QA .............. 441.7 Gross Domestic Product by Sector: QA ................................................... 441.8 Real Gross Domestic Product by Sector: QA .......................................... 451.9 Relation of Gross Domestic Product, Gross National Product, Net Na-
tional Product, National Income, and Personal Income: QA ............... 461.10 Relation of Real Gross Domestic Product, Real Gross National Prod-
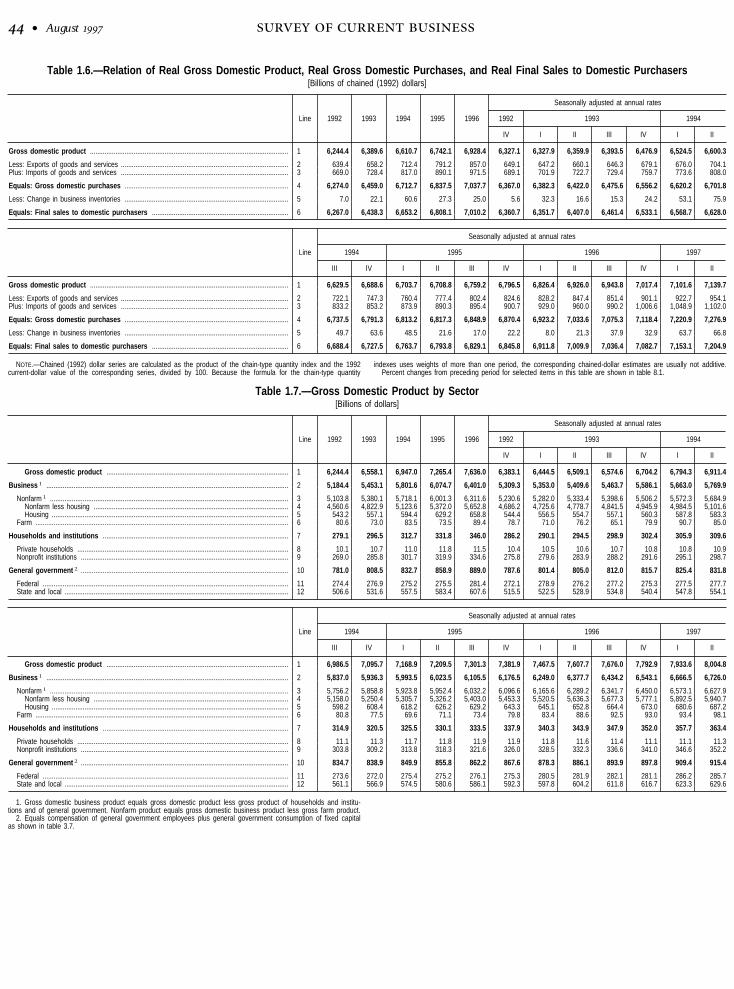
uct, Real Net National Product: QA ..................................................... 471.11 Command-Basis Real Gross National Product: QA ................................. 481.12 Net Domestic Product by Sector: A .......................................................... 481.13 Real Net Domestic Product by Sector: A ................................................. 481.14 National Income by Type of Income: QA ................................................. 491.15 National Income by Sector, Legal Form of Organization, and Type of
Income: A .............................................................................................. 501.16 Gross Domestic Product of Corporate Business in Current Dollars and
Gross Domestic Product of Nonfinancial Corporate Business in Cur-rent and Chained Dollars: QA .............................................................. 51
2. Personal Income and Outlays2.1 Personal Income and Its Disposition: QA ................................................. 532.2 Personal Consumption Expenditures by Major Type of Product: QA ..... 552.3 Real Personal Consumption Expenditures by Major Type of Product:
QA .......................................................................................................... 562.4 Personal Consumption Expenditures by Type of Expenditure: A ........... 572.5 Real Personal Consumption Expenditures by Type of Expenditure: A ... 582.6 Personal Consumption Expenditures by Type of Product: A .................. 592.7 Real Personal Consumption Expenditures by Type of Product: A ......... 602.8 Personal Income by Type of Income: MA ................................................ 612.9 Personal Income and Its Disposition: MA ................................................ 62
2.10 Personal Consumption Expenditures by Major Type of Product: MA ..... 63
Table number and title Page
2.11 Real Personal Consumption Expenditures by Major Type of Product:MA .......................................................................................................... 63
3. Government Receipts and Current Expenditures3.1 Government Receipts and Current Expenditures: QA ............................. 643.2 Federal Government Receipts and Current Expenditures: QA ............... 653.3 State and Local Government Receipts and Current Expenditures: QA 663.4 Personal Tax and Nontax Receipts: A ..................................................... 673.5 Indirect Business Tax and Nontax Accruals: A ........................................ 673.6 Contributions for Social Insurance: A ....................................................... 673.7 Government Consumption Expenditures and Gross Investment by
Type: QA ............................................................................................... 683.8 Real Government Consumption Expenditures and Gross Investment by
Type: QA ............................................................................................... 703.9 Government Consumption Expenditures Gross and Net of Sales by
Type: A .................................................................................................. 723.10 National Defense Consumption Expenditures and Gross Investment:
QA .......................................................................................................... 733.11 Real National Defense Consumption Expenditures and Real Gross In-
vestment: QA ......................................................................................... 743.12 Government Transfer Payments to Persons: A ....................................... 753.13 Subsidies Less Current Surplus of Government Enterprises: A ............. 753.14 Social Insurance Funds Receipts and Current Expenditures: A ............. 753.15 Government Current Expenditures and Gross Investment by Function:
A ............................................................................................................. (*)3.16 Federal Government Current Expenditures and Gross Investment by
Function: A ............................................................................................ (*)3.17 State and Local Government Current Expenditures and Gross Invest-
ment by Function: A .............................................................................. (*)3.18B Relation of Federal Government Receipts and Current Expenditures
and Gross Investment in the National Income and Product Accountsto the Unified Budget, Fiscal Years: QA .............................................. (*)
3.19 Relation of State and Local Government Receipts and Current andGross Investment in the National Income and Product Accounts toBureau of the Census Government Finances Data, Fiscal Years: A (*)
3.20 Relation of Commodity Credit Corporation Expenditures in the NationalIncome and Product Accounts to Commodity Credit CorporationOutlays in the Unified Budget: A .......................................................... (*)
* Table not published in this issue. See the introductory text.

August •
Table number and title Page
4. Foreign Transactions4.1 Foreign Transactions in the National Income and Product Accounts:
QA .......................................................................................................... 764.2 Real Exports and Imports of Goods and Services and Receipts and
Payments of Factor Income: QA .......................................................... 774.3 Exports and Imports of Goods and Services by Type of Product: QA 784.4 Real Exports and Imports of Goods and Services by Type of Product:
QA .......................................................................................................... 804.5 Relation of Foreign Transactions in the National Income and Product
Accounts (NIPA’s) to the Corresponding Items in the Balance ofPayments Accounts (BPA’s): A ............................................................ 82
5. Saving and Investment5.1 Gross Saving and Investment: QA ........................................................... 835.2 Gross and Net Investment by Major Type: A .......................................... 845.3 Real Gross and Net Investment by Major Type: A ................................. 845.4 Private Fixed Investment by Type: QA ..................................................... 855.5 Real Private Fixed Investment by Type: QA ............................................ 865.6 Private Purchases of Structures by Type: A ............................................ 875.7 Real Private Purchases of Structures by Type: A ................................... 875.8 Private Purchases of Producers’ Durable Equipment: A ......................... 885.9 Real Private Purchases of Producers’ Durable Equipment: A ................ 88
5.10 Change in Business Inventories by Industry: QA .................................... 895.11 Real Change in Business Inventories by Industry: QA ........................... 905.12 Inventories and Domestic Final Sales of Business by Industry: Q ......... 915.13 Real Inventories and Real Domestic Final Sales of Business by Indus-
try: Q ...................................................................................................... 925.14 Gross Government Fixed Investment by Type: A .................................... 935.15 Real Gross Government Fixed Investment by Type: A ........................... 93
6. Income, Employment, and Product by Industry6.1C National Income Without Capital Consumption Adjustment by Industry:
QA .......................................................................................................... 946.2C Compensation of Employees by Industry: A ............................................ 956.3C Wage and Salary Accruals by Industry: A ............................................... 956.4C Full-time and Part-time Employees by Industry: A .................................. 966.5C Full-time Equivalent Employees by Industry: A ........................................ 966.6C Wage and Salary Accruals Per Full-time Equivalent Employee by In-
dustry: A ................................................................................................ 976.7C Self-employed Persons by Industry: A ..................................................... 976.8C Persons Engaged in Production by Industry: A ....................................... 986.9C Hours Worked by Full-time and Part-time Employees by Industry: A .... 98
6.10C Employer Contributions for Social Insurance by Industry: A ................... 996.11C Other Labor Income by Industry and by Type: A .................................... 996.12C Nonfarm Proprietors’ Income by Industry: A ............................................ 1006.13C Noncorporate Capital Consumption Allowances by Industry: A .............. 1006.14C Inventory Valuation Adjustment to Nonfarm Income by Legal Form of
Organization and Industry: A ................................................................ 1006.15C Net Interest by Industry: A ........................................................................ 1006.16C Corporate Profits by Industry: QA ............................................................. 1016.17C Corporate Profits Before Tax by Industry: A ............................................ 1026.18C Federal, State, and Local Corporate Profits Tax Liability by Industry: A 1026.19C Corporate Profits After Tax by Industry: A ............................................... 1036.20C Net Corporate Dividend Payments by Industry: A ................................... 1036.21C Undistributed Corporate Profits by Industry: A ......................................... 1046.22C Corporate Capital Consumption Allowances by Industry: A .................... 104
7. Quantity and Price Indexes7.1 Quantity and Price Indexes for Gross Domestic Product: QA ................ 1057.2 Quantity and Price Indexes for Gross Domestic Product, Final Sales,
and Purchases: QA ............................................................................... 1097.3 Quantity and Price Indexes for Gross National Product and Command-
basis Gross National Product: QA ....................................................... 1107.4 Chain-type Quantity and Price Indexes for Personal Consumption Ex-
penditures by Major Type of Product: QA ........................................... 1117.5 Chain-type Quantity and Price Indexes for Personal Consumption Ex-
penditures by Type of Product: A ........................................................ 1137.6 Chain-type Quantity and Price Indexes for Private Fixed Investment by
Type: QA ............................................................................................... 1157.7 Chain-type Quantity and Price Indexes for Private Purchases of Struc-
tures by Type: A ................................................................................... 1177.8 Chain-type Quantity and Price Indexes for Private Purchases of Pro-
ducers’ Durable Equipment by Type: A ............................................... 1177.9 Chain-type Quantity and Price Indexes for Exports and Imports of
Goods and Services and for Receipts of Payments of Factor In-come: QA ............................................................................................... 118
Table number and title Page
7.10 Chain-type Quantity and Price Indexes for Exports and Imports ofGoods and Services by Major Type of Product: QA ........................... 119
7.11 Chain-type Quantity and Price Indexes for Government ConsumptionExpenditures and Gross Investment by Type: QA .............................. 123
7.12 Chain-type Quantity and Price Indexes for National Defense Consump-tion Expenditures and Gross Investment by Type: A .......................... 125
7.13 Chain-type Quantity and Price Indexes for Gross Government Fixed In-vestment by Type: A ............................................................................. 126
7.14 Chain-type Quantity and Price Indexes for Gross Domestic Product bySector: QA ............................................................................................. 127
7.15 Current-dollar Cost and Profit Per Unit of Real Gross Domestic Prod-uct of Nonfinancial Corporate Business: QA ....................................... 128
7.16 Implicit Price Deflators for Inventories: Q ................................................. 1297.17 Chain-type Quantity Indexes for Gross Domestic Product by Major
Type of Product: QA ............................................................................. 1307.18 Chain-type Quantity Indexes for Auto Output: QA ................................... 1317.19 Chain-type Quantity Indexes for Truck Output: QA ................................. 1327.20 Chain-type Quantity Indexes for Gross and Net Investment by Major
Type: A .................................................................................................. 132
8. Supplemental Tables8.1 Percent Change from Preceding Period in Selected Series: QA ............ 1338.2 Contributions to Percent Change in Real Gross Domestic Product: QA 1378.3 Selected Per Capita Product and Income Series in Current and
Chained Dollars: QA ............................................................................. 1388.4 Auto Output: QA ........................................................................................ 1398.5 Real Auto Output: QA ............................................................................... 1408.6 Truck Output: QA ...................................................................................... 1418.7 Real Truck Output: QA .............................................................................. 1418.8 Farm Sector Output, Gross Product, and National Income: A ................ 1428.9 Real Farm Sector Output, Real Gross Product, and Real Net Product:
A ............................................................................................................. 1428.10 Housing Sector Output, Gross Product, and National Income: A ........... 1428.11 Real Housing Sector Output, Real Gross Product, and Real Net Prod-
uct: A ..................................................................................................... 1428.12 Consumption of Fixed Capital by Legal Form of Organization: A .......... 1438.13 Capital Consumption Adjustment by Legal Form of Organization and
Type of Adjustment: A .......................................................................... 1438.14 Business Transfer Payments by Type: A ................................................. 1438.15 Supplements to Wages and Salaries by Type: A .................................... 1438.16 Rental Income of Persons by Type: A ..................................................... 1448.17 Dividends Paid and Received by Sector: A ............................................. 1448.18 Interest Paid and Received by Sector and Legal Form of Organization:
A ............................................................................................................. 1448.19 Imputations in the National Income and Product Accounts: A ................ 1458.20 Relation of Consumption of Fixed Capital in the National Income and
Product Accounts (NIPA’s) to Depreciation and Amortization as Pub-lished by the Internal Revenue Service (IRS): A ................................ (*)
8.21 Relation of Nonfarm Proprietors’ Income in the National Income andProduct Accounts (NIPA’s) to Corresponding Measures as Publishedby the Internal Revenue Service (IRS): A ........................................... (*)
8.22 Relation of Net Farm Income in the National Income and Product Ac-counts (NIPA’s) to Net Farm Income as Published by the U.S. De-partment of Agriculture (USDA): A ....................................................... (*)
8.23 Relation of Corporate Profits, Taxes, and Dividends in the National In-come and Product Accounts (NIPA’s) to Corresponding Measuresas Published by the Internal Revenue Service (IRS): A ..................... (*)
8.24 Relation of Monetary Interest Paid and Received in the National In-come and Product Accounts (NIPA’s) to Corresponding Measuresas Published by the Internal Revenue Service (IRS): A ..................... (*)
8.25 Relation of Wages and Salaries in the National Income and ProductAccounts (NIPA’s) to Wages and Salaries as Published by the Bu-reau of Labor Statistics (BLS): A ......................................................... (*)
8.26 Comparison of Personal Income in the National Income and ProductAccounts (NIPA’s) With Adjusted Gross Income as Published by theInternal Revenue Service (IRS): A ....................................................... (*)
8.27 Quantity Indexes and Percent Change from Preceding Period in Se-lected Series, Fixed 1992 Weights: QA ............................................... 146
9. Seasonally Unadjusted Estimates9.1 Gross Domestic Product: Q ...................................................................... (*)9.2 Personal Consumption Expenditures by Major Type of Product: Q ....... (*)9.3 Federal Government Receipts and Current Expenditures: Q .................. (*)9.4 State and Local Government Receipts and Current Expenditures: Q .... (*)9.5 Foreign Transactions in the National Income and Product Accounts: Q (*)9.6 Corporate Profits With Inventory Valuation Adjustment: Q ...................... (*)
* Table not published in this issue. See the introductory text.

• August
Table A.—Summary National Income and Product Accounts, 1996[Billions of dollars]
Line Line
Account 1.—National Income and Product Account
1 Compensation of employees .................................................................. 4,426.9 36 Personal consumption expenditures (2–3) ............................................ 5,207.62 Wage and salary accruals ................................................................. 3,633.6 37 Durable goods .................................................................................... 634.53 Disbursements (2–7) ...................................................................... 3,632.5 38 Nondurable goods .............................................................................. 1,534.74 Wage accruals less disbursements (3–8 and 5–5) ...................... 1.1 39 Services .............................................................................................. 3,038.45 Supplements to wages and salaries ................................................. 793.36 Employer contributions for social insurance (3–16) ..................... 385.7 40 Gross private domestic investment (5–1) .............................................. 1,116.57 Other labor income (2–8) .............................................................. 407.6 41 Fixed investment ................................................................................ 1,090.7
42 Nonresidential ................................................................................ 781.48 Proprietors’ income with inventory valuation and capital consumption 520.3 43 Structures ................................................................................... 215.2
adjustments (2–9). 44 Producers’ durable equipment .................................................. 566.245 Residential ...................................................................................... 309.2
9 Rental income of persons with capital consumption adjustment 146.3 46 Change in business inventories ........................................................ 25.9(2–10).
47 Net exports of goods and services ....................................................... –94.810 Corporate profits with inventory valuation and capital consumption 735.9 48 Exports (4–1) ...................................................................................... 870.9
adjustments. 49 Imports (4–4) ...................................................................................... 965.711 Corporate profits with inventory valuation adjustment ...................... 674.112 Profits before tax ........................................................................... 676.6 50 Government consumption expenditures and gross investment (3–1 1,406.713 Profits tax liability (3–13) ........................................................... 229.0 and 5–2).14 Profits after tax .......................................................................... 447.6 51 Federal ................................................................................................ 520.015 Dividends (2–12) ................................................................... 304.8 52 National defense ............................................................................ 352.816 Undistributed profits .............................................................. 142.8 53 Nondefense .................................................................................... 167.317 Inventory valuation adjustment ...................................................... –2.5 54 State and local ................................................................................... 886.718 Capital consumption adjustment ........................................................ 61.8
19 Net interest (2–15) .................................................................................. 425.1
20 National income .................................................................................... 6,254.5
21 Business transfer payments ................................................................... 33.622 To persons (2–19) .............................................................................. 26.023 To the rest of the world (4–9) ........................................................... 7.624 Indirect business tax and nontax liability (3–14) ................................... 604.825 Less: Subsidies less current surplus of government enterprises (3–7) 25.4
26 Consumption of fixed capital (5–7) ........................................................ 830.127 Private (5–8) ....................................................................................... 682.728 Government (5–9) .............................................................................. 147.429 General government (5–10) .......................................................... 125.130 Government enterprises (5–11) ..................................................... 22.3
31 Gross national income ............................................................................ 7,697.6
32 Statistical discrepancy (5–14) ................................................................ –59.9
33 Gross national product ........................................................................ 7,637.7
34 Less: Receipts of factor income from the rest of the world (4–2) ....... 234.3
35 Plus: Payments of factor income to the rest of the world (4–5) .......... 232.6
GROSS DOMESTIC PRODUCT ............................................................ 7,636.0 GROSS DOMESTIC PRODUCT ........................................................... 7,636.0
Account 2.—Personal Income and Outlay Account
1 Personal tax and nontax payments (3–12) ........................................... 886.9 7 Wage and salary disbursements (1–3) .................................................. 3,632.5
2 Personal outlays ..................................................................................... 5,368.8 8 Other labor income (1–7) ....................................................................... 407.63 Personal consumption expenditures (1–36) ...................................... 5,207.64 Interest paid by persons (2–17) ........................................................ 145.2 9 Proprietors’ income with inventory valuation and capital consumption 520.35 Personal transfer payments to the rest of the world (net) (4–7) ..... 15.9 adjustments (1–8).
6 Personal saving (5–4) ............................................................................ 239.6 10 Rental income of persons with capital consumption adjustment (1–9) 146.311 Personal dividend income ...................................................................... 291.212 Dividends (1–15) ................................................................................ 304.813 Less: Dividends received by government (3–6) ............................... 13.6
14 Personal interest income ........................................................................ 735.715 Net interest (1–19) ............................................................................. 425.116 Net interest paid by government (3–5) ............................................. 165.417 Interest paid by persons (2–4) .......................................................... 145.2
18 Transfer payments to persons ............................................................... 1,068.019 From business (1–22) ........................................................................ 26.020 From government (3–3) ..................................................................... 1,042.0
21 Less: Personal contributions for social insurance (3–17) ..................... 306.3
7 PERSONAL TAXES, OUTLAYS, AND SAVING .................................. 6,495.2 22 PERSONAL INCOME ............................................................................ 6,495.2
See note at end of table.

August •
Table A.—Summary National Income and Product Accounts, 1996—Continued[Billions of dollars]
Line Line
Account 3.—Government Receipts and Expenditures Account
1 Consumption expenditures (1–50) ......................................................... 1,182.4 12 Personal tax and nontax payments (2–1) ............................................. 886.9
2 Transfer payments .................................................................................. 1,058.3 13 Corporate profits tax liability (1–13) ....................................................... 229.03 To persons (2–20) .............................................................................. 1,042.04 To the rest of the world (net) (4–8) .................................................. 16.3 14 Indirect business tax and nontax liability (1–24) ................................... 604.8
5 Net interest paid (2–16) ......................................................................... 165.4 15 Contributions for social insurance .......................................................... 692.016 Employer (1–6) ................................................................................... 385.7
6 Less: Dividends received by government (2–13) .................................. 13.6 17 Personal (2–21) .................................................................................. 306.3
7 Subsidies less current surplus of government enterprises (1–25) ....... 25.4
8 Less: Wage accruals less disbursements (1–4) ................................... 0
9 Current surplus or deficit (–), national income and product accounts(5–12).
–5.1
10 Federal ................................................................................................ –110.511 State and local ................................................................................... 105.3
GOVERNMENT CURRENT EXPENDITURES AND SURPLUS .......... 2,412.7 GOVERNMENT RECEIPTS ................................................................... 2,412.7
Account 4.—Foreign Transactions Account
1 Exports of goods and services (1–48) .................................................. 870.9 4 Imports of goods and services (1–49) .................................................. 965.7
2 Receipts of factor income (1–34) ........................................................... 234.3 5 Payments of factor income (1–35) ........................................................ 232.6
3 Capital grants received by the United States (net) (5–13) ................... 0 6 Transfer payments to the rest of the world (net) ................................. 39.87 From persons (net) (2–5) .................................................................. 15.98 From government (net) (3–4) ............................................................ 16.39 From business (1–23) ........................................................................ 7.6
10 Net foreign investment (5–3) ................................................................. –132.9
RECEIPTS FROM THE REST OF THE WORLD ................................ 1,105.1 PAYMENTS TO THE REST OF THE WORLD .................................... 1,105.1
Account 5.—Gross Saving and Investment Account
1 Gross private domestic investment (1–40) ............................................ 1,116.5 4 Personal saving (2–6) ............................................................................ 239.6
2 Gross government investment (1–50) .................................................... 224.3 5 Wage accruals less disbursements (private) (1–4) ............................... 1.1
3 Net foreign investment (4–10) ................................................................ –132.9 6 Undistributed corporate profits with inventory valuation and capitalconsumption adjustments.
202.1
7 Consumption of fixed capital (1–26) ...................................................... 830.18 Private (1–27) ..................................................................................... 682.79 Government (1–28) ............................................................................ 147.410 General government (1–29) .......................................................... 125.111 Government enterprises (1–30) .................................................... 22.3
12 Government current surplus or deficit (–), national income and prod-uct accounts (3–9).
–5.1
13 Capital grants received by the United States (net) (4–3) .................... 0
14 Statistical discrepancy (1–32) ................................................................ –59.9
GROSS INVESTMENT ........................................................................... 1,207.9 GROSS SAVING AND STATISTICAL DISCREPANCY ...................... 1,207.9
NOTE.—Numbers in parentheses indicate accounts and items of counterentry in the accounts. Forexample, line 3 of account 1 is shown as ‘‘wage and salary disbursements, (2-7)’’; the counterentryis shown in account 2, line 7.

• August
. National Product and Income
Table 1.1.—Gross Domestic Product[Billions of dollars]
Line 1992 1993 1994 1995 1996
Seasonally adjusted at annual rates
1992 1993 1994
IV I II III IV I II
Gross domestic product .................................................................................................... 1 6,244.4 6,558.1 6,947.0 7,265.4 7,636.0 6,383.1 6,444.5 6,509.1 6,574.6 6,704.2 6,794.3 6,911.4
Personal consumption expenditures ......................................................................................... 2 4,219.8 4,459.2 4,717.0 4,957.7 5,207.6 4,329.6 4,365.4 4,428.1 4,488.6 4,554.9 4,616.6 4,680.5
Durable goods ............................................................................................................................ 3 488.5 530.2 579.5 608.5 634.5 506.2 506.4 524.2 537.2 553.1 563.2 572.4Nondurable goods ...................................................................................................................... 4 1,321.8 1,370.7 1,428.4 1,475.8 1,534.7 1,349.5 1,354.4 1,366.3 1,373.9 1,388.0 1,404.4 1,416.0Services ...................................................................................................................................... 5 2,409.4 2,558.4 2,709.1 2,873.4 3,038.4 2,473.9 2,504.6 2,537.6 2,577.4 2,613.8 2,649.0 2,692.2
Gross private domestic investment .......................................................................................... 6 790.4 876.2 1,007.9 1,038.2 1,116.5 816.1 854.3 857.4 872.8 920.3 963.4 1,017.9
Fixed investment ........................................................................................................................ 7 783.4 855.7 946.6 1,008.1 1,090.7 809.7 823.5 842.9 858.8 897.5 911.0 941.7Nonresidential ........................................................................................................................ 8 557.9 604.1 660.6 723.0 781.4 569.6 580.5 598.8 606.4 630.6 634.6 652.9
Structures .......................................................................................................................... 9 169.2 176.4 184.5 200.6 215.2 167.1 171.7 175.2 177.8 180.7 175.4 185.2Producers’ durable equipment .......................................................................................... 10 388.7 427.7 476.1 522.4 566.2 402.5 408.9 423.6 428.6 449.9 459.3 467.7
Residential ............................................................................................................................. 11 225.6 251.6 286.0 285.1 309.2 240.1 243.0 244.1 252.4 266.8 276.4 288.7Change in business inventories ................................................................................................ 12 7.0 20.5 61.2 30.1 25.9 6.5 30.7 14.5 14.0 22.9 52.4 76.3
Net exports of goods and services ........................................................................................... 13 –29.5 –60.7 –90.9 –86.0 –94.8 –42.7 –46.6 –57.5 –72.1 –66.6 –76.6 –87.9
Exports ....................................................................................................................................... 14 639.4 658.6 721.2 818.4 870.9 649.1 647.1 661.2 646.8 679.4 678.5 710.1Goods .................................................................................................................................... 15 448.7 459.7 509.6 583.9 617.5 459.0 451.2 462.2 447.9 477.7 475.7 499.2Services ................................................................................................................................. 16 190.7 198.9 211.6 234.6 253.3 190.1 195.8 199.0 198.9 201.7 202.8 210.9
Imports ....................................................................................................................................... 17 669.0 719.3 812.1 904.5 965.7 691.8 693.7 718.7 718.9 746.0 755.1 797.9Goods .................................................................................................................................... 18 544.9 592.8 676.8 757.5 809.0 564.4 570.8 593.2 592.8 614.4 622.4 663.8Services ................................................................................................................................. 19 124.1 126.5 135.3 146.9 156.7 127.4 122.9 125.4 126.1 131.6 132.8 134.1
Government consumption expenditures and gross investment ........................................... 20 1,263.8 1,283.4 1,313.0 1,355.5 1,406.7 1,280.0 1,271.5 1,281.2 1,285.3 1,295.5 1,291.0 1,300.8
Federal ....................................................................................................................................... 21 528.0 518.3 510.2 509.6 520.0 535.0 521.3 517.8 515.7 518.5 506.9 505.3National defense .................................................................................................................... 22 375.8 360.7 349.2 344.6 352.8 375.3 363.6 361.7 358.0 359.4 344.9 348.5Nondefense ............................................................................................................................ 23 152.2 157.7 161.0 165.0 167.3 159.7 157.7 156.1 157.7 159.1 162.0 156.8
State and local ........................................................................................................................... 24 735.8 765.0 802.8 846.0 886.7 745.1 750.1 763.4 769.6 777.0 784.1 795.5
Line
Seasonally adjusted at annual rates
1994 1995 1996 1997
III IV I II III IV I II III IV I II
Gross domestic product .................................................................................................... 1 6,986.5 7,095.7 7,168.9 7,209.5 7,301.3 7,381.9 7,467.5 7,607.7 7,676.0 7,792.9 7,933.6 8,004.8
Personal consumption expenditures ......................................................................................... 2 4,750.6 4,820.2 4,871.7 4,934.8 4,990.6 5,033.8 5,105.8 5,189.1 5,227.4 5,308.1 5,405.7 5,429.8
Durable goods ............................................................................................................................ 3 583.3 599.3 596.9 602.8 616.0 618.4 626.7 638.6 634.5 638.2 658.4 644.0Nondurable goods ...................................................................................................................... 4 1,439.5 1,453.7 1,462.7 1,472.4 1,480.4 1,487.8 1,508.1 1,532.3 1,538.3 1,560.1 1,587.4 1,578.9Services ...................................................................................................................................... 5 2,727.8 2,767.2 2,812.2 2,859.6 2,894.2 2,927.5 2,970.9 3,018.2 3,054.6 3,109.8 3,159.9 3,206.9
Gross private domestic investment .......................................................................................... 6 1,007.1 1,043.1 1,050.8 1,024.0 1,028.8 1,049.1 1,060.5 1,105.4 1,149.2 1,151.1 1,193.6 1,227.2
Fixed investment ........................................................................................................................ 7 956.9 977.0 998.7 999.6 1,009.4 1,024.6 1,049.4 1,082.0 1,112.0 1,119.2 1,127.5 1,157.8Nonresidential ........................................................................................................................ 8 667.4 687.5 710.9 722.5 725.4 733.1 750.7 769.3 798.6 807.2 811.3 836.4
Structures .......................................................................................................................... 9 186.8 190.7 197.7 201.1 202.8 200.7 205.7 210.6 217.7 227.0 227.4 230.4Producers’ durable equipment .......................................................................................... 10 480.6 496.8 513.2 521.4 522.6 532.4 545.0 558.7 580.9 580.2 583.9 606.0
Residential ............................................................................................................................. 11 289.5 289.5 287.8 277.1 284.0 291.4 298.8 312.7 313.5 312.0 316.2 321.4Change in business inventories ................................................................................................ 12 50.2 66.2 52.1 24.5 19.4 24.5 11.1 23.4 37.1 31.9 66.1 69.4
Net exports of goods and services ........................................................................................... 13 –103.4 –95.6 –98.3 –105.4 –80.4 –60.1 –83.0 –93.8 –114.0 –88.6 –98.8 –103.3
Exports ....................................................................................................................................... 14 732.6 763.7 784.5 807.7 831.6 849.9 850.2 865.0 863.7 904.6 922.2 948.4Goods .................................................................................................................................... 15 518.9 544.6 560.7 578.6 591.1 605.1 606.1 613.9 609.7 640.5 656.2 679.1Services ................................................................................................................................. 16 213.7 219.0 223.9 229.2 240.5 244.7 244.1 251.1 254.0 264.2 266.0 269.3
Imports ....................................................................................................................................... 17 836.0 859.2 882.8 913.1 912.0 909.9 933.2 958.7 977.6 993.2 1,021.0 1,051.8Goods .................................................................................................................................... 18 699.2 721.7 739.3 767.0 762.9 761.0 778.4 802.9 820.2 834.6 855.8 883.5Services ................................................................................................................................. 19 136.9 137.5 143.5 146.1 149.1 149.0 154.8 155.8 157.5 158.6 165.2 168.3
Government consumption expenditures and gross investment ........................................... 20 1,332.3 1,328.0 1,344.7 1,356.0 1,362.2 1,359.2 1,384.2 1,407.0 1,413.5 1,422.3 1,433.1 1,451.1
Federal ....................................................................................................................................... 21 520.4 508.3 513.6 511.2 512.9 500.6 516.4 524.6 521.6 517.6 516.1 528.0National defense .................................................................................................................... 22 359.7 343.6 346.3 348.1 347.3 336.5 348.4 357.3 354.8 350.6 343.3 352.6Nondefense ............................................................................................................................ 23 160.7 164.7 167.3 163.0 165.5 164.1 168.0 167.3 166.8 167.0 172.8 175.3
State and local ........................................................................................................................... 24 811.9 819.6 831.1 844.8 849.3 858.6 867.8 882.4 891.9 904.7 917.0 923.2
NOTE.—Percent changes from preceding period for selected items in this table are shown in table 8.1.

August •
Table 1.2.—Real Gross Domestic Product[Billions of chained (1992) dollars]
Line 1992 1993 1994 1995 1996
Seasonally adjusted at annual rates
1992 1993 1994
IV I II III IV I II
Gross domestic product .................................................................................................... 1 6,244.4 6,389.6 6,610.7 6,742.1 6,928.4 6,327.1 6,327.9 6,359.9 6,393.5 6,476.9 6,524.5 6,600.3
Personal consumption expenditures ......................................................................................... 2 4,219.8 4,343.6 4,486.0 4,595.3 4,714.1 4,282.3 4,286.8 4,322.8 4,366.6 4,398.0 4,439.4 4,472.2
Durable goods ............................................................................................................................ 3 488.5 523.8 561.2 583.6 611.1 505.0 504.0 519.3 529.9 542.1 550.7 555.8Nondurable goods ...................................................................................................................... 4 1,321.8 1,351.0 1,389.9 1,412.6 1,432.3 1,339.8 1,337.5 1,347.8 1,356.8 1,361.8 1,378.4 1,385.5Services ...................................................................................................................................... 5 2,409.4 2,468.9 2,535.5 2,599.6 2,671.0 2,437.6 2,445.3 2,455.9 2,480.0 2,494.4 2,510.9 2,531.4
Gross private domestic investment .......................................................................................... 6 790.4 863.6 975.7 991.5 1,069.1 812.2 845.5 846.1 858.6 904.0 939.9 987.8
Fixed investment ........................................................................................................................ 7 783.4 842.8 915.5 962.1 1,041.7 805.8 814.8 831.1 844.5 880.8 887.8 913.2Nonresidential ........................................................................................................................ 8 557.9 600.2 648.4 706.5 771.7 569.1 577.8 595.1 602.3 625.6 626.2 641.2
Structures .......................................................................................................................... 9 169.2 170.8 172.5 179.9 188.7 165.6 168.0 170.3 171.7 173.1 166.3 174.5Producers’ durable equipment .......................................................................................... 10 388.7 429.6 476.8 528.3 586.0 403.5 409.8 424.9 430.7 452.9 460.6 467.3
Residential ............................................................................................................................. 11 225.6 242.6 267.0 257.0 272.1 236.7 237.0 236.1 242.2 255.1 261.3 271.5Change in business inventories ................................................................................................ 12 7.0 22.1 60.6 27.3 25.0 5.6 32.3 16.6 15.3 24.2 53.1 75.9
Net exports of goods and services ........................................................................................... 13 –29.5 –70.2 –104.6 –98.8 –114.4 –40.0 –54.7 –62.6 –83.1 –80.5 –97.6 –103.9
Exports ....................................................................................................................................... 14 639.4 658.2 712.4 791.2 857.0 649.1 647.2 660.1 646.3 679.1 676.0 704.1Goods .................................................................................................................................... 15 448.7 463.7 509.8 573.9 628.4 461.0 454.1 465.3 452.0 483.5 479.1 501.2Services ................................................................................................................................. 16 190.7 194.5 202.9 218.0 229.9 188.2 193.1 194.8 194.2 195.9 197.0 203.1
Imports ....................................................................................................................................... 17 669.0 728.4 817.0 890.1 971.5 689.1 701.9 722.7 729.4 759.7 773.6 808.0Goods .................................................................................................................................... 18 544.9 602.0 684.1 749.2 823.1 561.8 578.7 597.8 603.1 628.3 641.4 674.6Services ................................................................................................................................. 19 124.1 126.5 133.2 141.2 149.0 127.4 123.3 124.9 126.3 131.4 132.3 133.6
Government consumption expenditures and gross investment ........................................... 20 1,263.8 1,252.1 1,252.3 1,251.9 1,257.9 1,272.5 1,250.1 1,253.1 1,250.5 1,254.7 1,241.9 1,243.3
Federal ....................................................................................................................................... 21 528.0 505.7 486.6 470.3 464.2 534.0 512.1 507.8 501.5 501.3 487.2 481.2National defense .................................................................................................................... 22 375.8 354.4 336.9 322.6 317.8 376.8 359.2 356.7 351.1 350.8 335.1 335.9Nondefense ............................................................................................................................ 23 152.2 151.2 149.5 147.5 146.1 157.1 152.9 151.1 150.3 150.4 151.9 145.1
State and local ........................................................................................................................... 24 735.8 746.4 765.7 781.6 793.7 738.5 738.0 745.3 749.1 753.4 754.7 762.2
Residual .......................................................................................................................................... 25 0 –.9 –.3 .6 –1.6 .9 –1.3 –1.5 –.4 –1.0 –.9 –.9
Line
Seasonally adjusted at annual rates
1994 1995 1996 1997
III IV I II III IV I II III IV I II
Gross domestic product .................................................................................................... 1 6,629.5 6,688.6 6,703.7 6,708.8 6,759.2 6,796.5 6,826.4 6,926.0 6,943.8 7,017.4 7,101.6 7,139.7
Personal consumption expenditures ......................................................................................... 2 4,498.2 4,534.1 4,551.3 4,583.5 4,612.9 4,633.5 4,669.4 4,712.2 4,718.2 4,756.4 4,818.1 4,827.9
Durable goods ............................................................................................................................ 3 561.7 576.6 572.2 577.7 590.8 593.7 600.7 614.8 611.9 617.1 637.8 628.5Nondurable goods ...................................................................................................................... 4 1,393.2 1,402.5 1,408.4 1,411.6 1,413.9 1,416.3 1,422.5 1,431.6 1,433.9 1,441.2 1,457.8 1,450.1Services ...................................................................................................................................... 5 2,543.8 2,555.9 2,571.2 2,594.5 2,608.7 2,623.8 2,646.5 2,666.5 2,672.8 2,698.2 2,723.9 2,748.8
Gross private domestic investment .......................................................................................... 6 972.2 1,003.0 1,005.8 977.5 982.0 1,000.8 1,012.2 1,059.2 1,100.3 1,104.8 1,149.2 1,185.7
Fixed investment ........................................................................................................................ 7 922.7 938.5 955.8 954.0 962.3 976.3 1,001.5 1,035.7 1,060.9 1,068.7 1,079.0 1,110.9Nonresidential ........................................................................................................................ 8 653.2 672.9 695.7 705.4 708.2 716.8 736.9 759.7 789.3 800.8 808.9 837.8
Structures .......................................................................................................................... 9 174.0 175.0 179.0 180.9 181.2 178.6 182.1 185.6 190.0 196.9 195.9 197.0Producers’ durable equipment .......................................................................................... 10 480.0 499.1 518.1 525.9 528.5 540.5 557.4 577.1 602.9 606.7 616.6 645.9
Residential ............................................................................................................................. 11 269.4 265.9 261.2 250.4 255.5 260.8 266.1 277.2 274.1 271.1 273.3 277.1Change in business inventories ................................................................................................ 12 49.7 63.6 48.5 21.6 17.0 22.2 8.0 21.3 37.9 32.9 63.7 66.8
Net exports of goods and services ........................................................................................... 13 –111.1 –105.9 –113.5 –112.8 –92.9 –76.1 –100.8 –112.6 –138.9 –105.6 –126.3 –147.9
Exports ....................................................................................................................................... 14 722.1 747.3 760.4 777.4 802.4 824.6 828.2 847.4 851.4 901.1 922.7 954.1Goods .................................................................................................................................... 15 518.4 540.4 550.4 565.7 580.4 599.1 605.2 619.2 623.0 666.2 686.2 718.0Services ................................................................................................................................. 16 204.1 207.5 210.6 212.5 222.6 226.2 224.0 229.3 229.4 236.8 238.9 239.9
Imports ....................................................................................................................................... 17 833.2 853.2 873.9 890.3 895.4 900.7 929.0 960.0 990.2 1,006.6 1,048.9 1,102.0Goods .................................................................................................................................... 18 700.0 720.4 733.5 751.4 753.6 758.2 781.4 811.7 841.7 857.5 891.3 942.1Services ................................................................................................................................. 19 133.5 133.2 140.7 139.3 142.1 142.9 147.8 148.8 149.3 150.0 158.4 161.2
Government consumption expenditures and gross investment ........................................... 20 1,268.1 1,255.8 1,257.7 1,257.3 1,255.0 1,237.7 1,243.2 1,265.1 1,261.5 1,261.8 1,260.5 1,272.3
Federal ....................................................................................................................................... 21 496.4 481.7 480.4 474.9 473.4 452.6 460.9 470.7 465.7 459.6 452.8 462.0National defense .................................................................................................................... 22 347.0 329.6 328.7 327.4 324.0 310.3 314.9 323.2 319.4 313.6 303.9 311.4Nondefense ............................................................................................................................ 23 149.4 151.7 151.4 147.3 149.1 142.1 145.7 147.2 146.0 145.7 148.5 150.1
State and local ........................................................................................................................... 24 771.7 774.1 777.3 782.3 781.5 785.1 782.4 794.4 795.9 802.3 807.7 810.4
Residual .......................................................................................................................................... 25 .6 .3 .9 1.7 1.7 –1.1 .1 –.9 –2.4 –3.8 –2.9 –1.0
NOTE.—Chained (1992) dollar series are calculated as the product of the chain-type quantity index and the 1992current-dollar value of the corresponding series, divided by 100. Because the formula for the chain-type quantityindexes uses weights of more than one period, the corresponding chained-dollar estimates are usually not additive.
The residual line is the difference between the first line and the sum of the most detailed lines.Percent changes from preceding period for selected items in this table are shown in table 8.1; contributions to
the percent change in real gross domestic product are shown in table 8.2.

• August
Table 1.3.—Gross Domestic Product by Major Type of Product[Billions of dollars]
Line 1992 1993 1994 1995 1996
Seasonally adjusted at annual rates
1992 1993 1994
IV I II III IV I II
Gross domestic product .................................................................................................... 1 6,244.4 6,558.1 6,947.0 7,265.4 7,636.0 6,383.1 6,444.5 6,509.1 6,574.6 6,704.2 6,794.3 6,911.4
Final sales of domestic product ................................................................................................ 2 6,237.4 6,537.6 6,885.7 7,235.3 7,610.2 6,376.6 6,413.8 6,494.7 6,560.6 6,681.3 6,741.9 6,835.1Change in business inventories ................................................................................................ 3 7.0 20.5 61.2 30.1 25.9 6.5 30.7 14.5 14.0 22.9 52.4 76.3
Goods ............................................................................................................................................ 4 2,321.0 2,422.1 2,581.4 2,667.9 2,785.2 2,372.3 2,388.3 2,408.7 2,412.0 2,479.6 2,531.2 2,568.6
Final sales ............................................................................................................................. 5 2,314.0 2,401.6 2,520.2 2,637.8 2,759.3 2,365.8 2,357.5 2,394.2 2,398.0 2,456.7 2,478.8 2,492.4Change in business inventories ............................................................................................ 6 7.0 20.5 61.2 30.1 25.9 6.5 30.7 14.5 14.0 22.9 52.4 76.3
Durable goods ............................................................................................................................ 7 955.0 1,028.8 1,106.1 1,163.0 1,228.9 979.3 1,001.5 1,021.9 1,023.6 1,068.4 1,081.3 1,102.6Final sales ............................................................................................................................. 8 965.9 1,012.7 1,072.5 1,133.9 1,212.0 994.2 980.8 1,014.9 1,009.4 1,045.9 1,052.3 1,062.1Change in business inventories ............................................................................................ 9 –10.9 16.1 33.6 29.1 16.9 –14.9 20.6 7.0 14.2 22.5 29.0 40.5
Nondurable goods ...................................................................................................................... 10 1,366.0 1,393.3 1,475.3 1,504.9 1,556.3 1,392.9 1,386.8 1,386.8 1,388.4 1,411.2 1,449.9 1,466.0Final sales ............................................................................................................................. 11 1,348.1 1,388.9 1,447.6 1,503.9 1,547.3 1,371.6 1,376.7 1,379.3 1,388.6 1,410.8 1,426.5 1,430.2Change in business inventories ............................................................................................ 12 17.9 4.4 27.7 1.0 9.0 21.4 10.1 7.4 –.2 .4 23.4 35.8
Services ......................................................................................................................................... 13 3,411.1 3,589.5 3,772.3 3,980.7 4,187.3 3,486.4 3,527.4 3,561.8 3,612.4 3,656.1 3,695.1 3,749.6
Structures ...................................................................................................................................... 14 512.3 546.5 593.2 616.8 663.6 524.4 528.8 538.6 550.2 568.5 568.0 593.1
Addenda:Motor vehicle output .................................................................................................................. 15 205.3 229.1 265.9 273.5 271.4 221.3 223.0 226.2 221.5 245.7 265.6 259.9Gross domestic product less motor vehicle output .................................................................. 16 6,039.2 6,329.0 6,681.1 6,991.9 7,364.7 6,161.8 6,221.5 6,282.9 6,353.1 6,458.4 6,528.7 6,651.5
Line
Seasonally adjusted at annual rates
1994 1995 1996 1997
III IV I II III IV I II III IV I II
Gross domestic product .................................................................................................... 1 6,986.5 7,095.7 7,168.9 7,209.5 7,301.3 7,381.9 7,467.5 7,607.7 7,676.0 7,792.9 7,933.6 8,004.8
Final sales of domestic product ................................................................................................ 2 6,936.3 7,029.6 7,116.8 7,185.0 7,281.8 7,357.4 7,456.4 7,584.3 7,638.9 7,761.0 7,867.4 7,935.4Change in business inventories ................................................................................................ 3 50.2 66.2 52.1 24.5 19.4 24.5 11.1 23.4 37.1 31.9 66.1 69.4
Goods ............................................................................................................................................ 4 2,582.8 2,643.0 2,650.5 2,637.8 2,673.3 2,710.2 2,733.2 2,782.7 2,797.8 2,826.9 2,904.6 2,904.9
Final sales ............................................................................................................................. 5 2,532.6 2,576.9 2,598.4 2,613.4 2,653.9 2,685.7 2,722.1 2,759.3 2,760.7 2,795.0 2,838.4 2,835.4Change in business inventories ............................................................................................ 6 50.2 66.2 52.1 24.5 19.4 24.5 11.1 23.4 37.1 31.9 66.1 69.4
Durable goods ............................................................................................................................ 7 1,111.5 1,128.9 1,150.5 1,147.7 1,165.5 1,188.3 1,200.6 1,232.9 1,249.5 1,232.4 1,279.8 1,296.9Final sales ............................................................................................................................. 8 1,082.3 1,093.4 1,108.9 1,120.8 1,143.9 1,162.1 1,183.4 1,214.8 1,216.3 1,233.5 1,248.0 1,258.3Change in business inventories ............................................................................................ 9 29.3 35.6 41.6 26.9 21.6 26.2 17.2 18.1 33.3 –1.1 31.8 38.6
Nondurable goods ...................................................................................................................... 10 1,471.3 1,514.1 1,499.9 1,490.1 1,507.8 1,521.9 1,532.6 1,549.9 1,548.3 1,594.5 1,624.7 1,608.0Final sales ............................................................................................................................. 11 1,450.3 1,483.5 1,489.4 1,492.6 1,510.0 1,523.6 1,538.7 1,544.5 1,544.4 1,561.5 1,590.4 1,577.2Change in business inventories ............................................................................................ 12 20.9 30.6 10.5 –2.5 –2.1 –1.7 –6.2 5.3 3.9 33.0 34.3 30.8
Services ......................................................................................................................................... 13 3,800.8 3,843.9 3,903.0 3,961.4 4,011.0 4,047.3 4,096.2 4,162.2 4,208.1 4,282.7 4,338.2 4,400.9
Structures ...................................................................................................................................... 14 602.9 608.8 615.5 610.2 617.0 624.4 638.1 662.8 670.1 683.3 690.8 699.0
Addenda:Motor vehicle output .................................................................................................................. 15 267.1 271.1 278.4 269.6 266.3 279.9 256.1 283.5 278.7 267.2 281.4 270.3Gross domestic product less motor vehicle output .................................................................. 16 6,719.5 6,824.7 6,890.6 6,939.9 7,034.9 7,102.0 7,211.5 7,324.2 7,397.3 7,525.8 7,652.2 7,734.5
NOTE.—Percent changes from preceding period for selected items in this table are shown in table 8.1.

August •
Table 1.4.—Real Gross Domestic Product by Major Type of Product[Billions of chained (1992) dollars]
Line 1992 1993 1994 1995 1996
Seasonally adjusted at annual rates
1992 1993 1994
IV I II III IV I II
Gross domestic product .................................................................................................... 1 6,244.4 6,389.6 6,610.7 6,742.1 6,928.4 6,327.1 6,327.9 6,359.9 6,393.5 6,476.9 6,524.5 6,600.3
Final sales of domestic product ................................................................................................ 2 6,237.4 6,368.9 6,551.2 6,712.7 6,901.0 6,320.7 6,297.3 6,344.9 6,379.3 6,453.8 6,473.0 6,526.7Change in business inventories ................................................................................................ 3 7.0 22.1 60.6 27.3 25.0 5.6 32.3 16.6 15.3 24.2 53.1 75.9
Residual ..................................................................................................................................... 4 0 –1.4 –1.1 2.1 2.4 .8 –1.7 –1.6 –1.1 –1.1 –1.6 –2.3
Goods ............................................................................................................................................ 5 2,321.0 2,391.5 2,514.2 2,574.2 2,662.6 2,366.4 2,363.6 2,383.2 2,382.7 2,436.5 2,476.7 2,508.6
Final sales ............................................................................................................................. 6 2,314.0 2,370.7 2,453.9 2,545.0 2,635.5 2,360.1 2,332.9 2,368.1 2,368.6 2,413.2 2,424.5 2,433.8Change in business inventories ............................................................................................ 7 7.0 22.1 60.6 27.3 25.0 5.6 32.3 16.6 15.3 24.2 53.1 75.9
Durable goods ............................................................................................................................ 8 955.0 1,023.1 1,089.7 1,152.3 1,222.1 980.0 998.0 1,016.4 1,017.6 1,060.6 1,069.2 1,084.7Final sales ............................................................................................................................. 9 965.9 1,007.0 1,056.7 1,124.3 1,205.8 994.8 977.3 1,009.0 1,003.4 1,038.2 1,040.4 1,044.7Change in business inventories ............................................................................................ 10 –10.9 15.8 32.3 27.3 15.9 –14.8 20.7 7.0 13.8 21.9 28.0 39.1
Nondurable goods ...................................................................................................................... 11 1,366.0 1,368.5 1,424.9 1,423.4 1,443.7 1,386.5 1,365.6 1,367.0 1,365.3 1,376.3 1,407.9 1,424.3Final sales ............................................................................................................................. 12 1,348.1 1,363.8 1,397.5 1,421.9 1,433.2 1,365.3 1,355.6 1,359.2 1,365.2 1,375.3 1,384.3 1,389.3Change in business inventories ............................................................................................ 13 17.9 6.2 28.2 –.2 9.1 20.5 11.6 9.7 1.4 2.1 25.0 36.8
Services ......................................................................................................................................... 14 3,411.1 3,469.5 3,542.9 3,614.7 3,686.6 3,442.3 3,447.0 3,454.1 3,480.4 3,496.4 3,510.4 3,533.9
Structures ...................................................................................................................................... 15 512.3 528.7 554.9 555.0 582.2 518.5 517.5 522.8 530.3 544.5 538.6 559.0
Residual .......................................................................................................................................... 16 0 –1.4 –1.8 –.9 –4.4 .5 –1.8 –1.9 –1.0 –1.5 –2.2 –2.5
Addenda:Motor vehicle output .................................................................................................................. 17 205.3 219.7 246.0 247.5 241.3 219.2 216.7 217.6 212.0 232.4 250.3 240.5Gross domestic product less motor vehicle output .................................................................. 18 6,039.1 6,169.7 6,364.4 6,494.3 6,687.1 6,107.8 6,111.1 6,142.2 6,181.5 6,244.2 6,273.7 6,359.6
Line
Seasonally adjusted at annual rates
1994 1995 1996 1997
III IV I II III IV I II III IV I II
Gross domestic product .................................................................................................... 1 6,629.5 6,688.6 6,703.7 6,708.8 6,759.2 6,796.5 6,826.4 6,926.0 6,943.8 7,017.4 7,101.6 7,139.7
Final sales of domestic product ................................................................................................ 2 6,580.4 6,624.8 6,654.3 6,685.3 6,739.3 6,771.9 6,815.0 6,902.3 6,905.0 6,981.7 7,034.1 7,068.0Change in business inventories ................................................................................................ 3 49.7 63.6 48.5 21.6 17.0 22.2 8.0 21.3 37.9 32.9 63.7 66.8
Residual ..................................................................................................................................... 4 –.6 .2 .9 1.9 2.9 2.4 3.4 2.4 .9 2.8 3.8 4.9
Goods ............................................................................................................................................ 5 2,508.4 2,563.1 2,563.4 2,548.5 2,576.8 2,608.1 2,614.6 2,658.8 2,673.1 2,704.1 2,769.3 2,770.6
Final sales ............................................................................................................................. 6 2,458.9 2,498.4 2,513.5 2,525.3 2,557.4 2,583.8 2,604.1 2,635.5 2,634.0 2,668.4 2,699.6 2,696.6Change in business inventories ............................................................................................ 7 49.7 63.6 48.5 21.6 17.0 22.2 8.0 21.3 37.9 32.9 63.7 66.8
Durable goods ............................................................................................................................ 8 1,090.8 1,114.1 1,135.3 1,136.5 1,157.7 1,179.7 1,188.7 1,227.3 1,244.0 1,228.5 1,277.0 1,301.7Final sales ............................................................................................................................. 9 1,062.1 1,079.4 1,094.9 1,110.6 1,137.2 1,154.3 1,171.9 1,210.0 1,211.4 1,230.1 1,245.8 1,263.8Change in business inventories ............................................................................................ 10 28.2 33.8 39.1 25.2 20.2 24.7 16.3 17.0 31.3 –.9 29.9 36.2
Nondurable goods ...................................................................................................................... 11 1,418.1 1,449.4 1,429.1 1,413.2 1,420.8 1,430.6 1,428.4 1,435.1 1,433.5 1,477.9 1,496.1 1,474.7Final sales ............................................................................................................................. 12 1,397.2 1,419.3 1,419.1 1,415.5 1,421.8 1,431.3 1,434.5 1,429.3 1,426.5 1,442.6 1,458.3 1,438.9Change in business inventories ............................................................................................ 13 21.4 29.7 9.1 –3.9 –3.4 –2.8 –8.3 4.3 6.6 33.8 33.8 30.6
Services ......................................................................................................................................... 14 3,559.7 3,567.7 3,583.1 3,610.5 3,630.6 3,634.5 3,648.4 3,684.9 3,689.0 3,723.9 3,743.9 3,776.0
Structures ...................................................................................................................................... 15 562.1 560.1 559.0 550.9 553.4 556.7 565.7 584.9 585.0 592.9 595.1 598.4
Residual .......................................................................................................................................... 16 –1.2 –1.4 –.6 0 –.6 –2.2 –2.1 –4.4 –6.0 –5.0 –5.2 –4.2
Addenda:Motor vehicle output .................................................................................................................. 17 245.0 248.1 253.0 245.3 240.7 250.8 229.0 252.8 246.8 236.5 247.5 239.9Gross domestic product less motor vehicle output .................................................................. 18 6,384.1 6,440.1 6,450.3 6,463.2 6,518.4 6,545.4 6,597.5 6,672.9 6,696.8 6,781.0 6,854.1 6,899.9
NOTE.—Chained (1992) dollar series are calculated as the product of the chain-type quantity index and the 1992current-dollar value of the corresponding series, divided by 100. Because the formula for the chain-type quantityindexes uses weights of more than one period, the corresponding chained-dollar estimates are usually not additive.The residual line following change in business inventories is the difference between gross domestic product and
the sum of final sales of domestic product and of change in business inventories; the residual line following struc-tures is the difference between gross domestic product and the sum of the detailed lines of goods, of services,and of structures.
Percent changes from preceding period for selected items in this table are shown in table 8.1
Table 1.5.—Relation of Gross Domestic Product, Gross Domestic Purchases, and Final Sales to Domestic Purchasers[Billions of dollars]
Line 1992 1993 1994 1995 1996
Seasonally adjusted at annual rates
1992 1993 1994
IV I II III IV I II
Gross domestic product ............................................................................................................. 1 6,244.4 6,558.1 6,947.0 7,265.4 7,636.0 6,383.1 6,444.5 6,509.1 6,574.6 6,704.2 6,794.3 6,911.4
Less: Exports of goods and services ............................................................................................ 2 639.4 658.6 721.2 818.4 870.9 649.1 647.1 661.2 646.8 679.4 678.5 710.1Plus: Imports of goods and services ............................................................................................ 3 669.0 719.3 812.1 904.5 965.7 691.8 693.7 718.7 718.9 746.0 755.1 797.9
Equals: Gross domestic purchases .......................................................................................... 4 6,274.0 6,618.8 7,037.9 7,351.4 7,730.9 6,425.8 6,491.1 6,566.7 6,646.7 6,770.8 6,870.9 6,999.2
Less: Change in business inventories .......................................................................................... 5 7.0 20.5 61.2 30.1 25.9 6.5 30.7 14.5 14.0 22.9 52.4 76.3
Equals: Final sales to domestic purchasers ........................................................................... 6 6,267.0 6,598.3 6,976.6 7,321.3 7,705.0 6,419.3 6,460.4 6,552.2 6,632.7 6,747.9 6,818.5 6,923.0
Line
Seasonally adjusted at annual rates
1994 1995 1996 1997
III IV I II III IV I II III IV I II
Gross domestic product ............................................................................................................. 1 6,986.5 7,095.7 7,168.9 7,209.5 7,301.3 7,381.9 7,467.5 7,607.7 7,676.0 7,792.9 7,933.6 8,004.8
Less: Exports of goods and services ............................................................................................ 2 732.6 763.7 784.5 807.7 831.6 849.9 850.2 865.0 863.7 904.6 922.2 948.4Plus: Imports of goods and services ............................................................................................ 3 836.0 859.2 882.8 913.1 912.0 909.9 933.2 958.7 977.6 993.2 1,021.0 1,051.8
Equals: Gross domestic purchases .......................................................................................... 4 7,090.0 7,191.3 7,267.2 7,314.8 7,381.7 7,442.0 7,550.5 7,701.5 7,790.0 7,881.5 8,032.4 8,108.1
Less: Change in business inventories .......................................................................................... 5 50.2 66.2 52.1 24.5 19.4 24.5 11.1 23.4 37.1 31.9 66.1 69.4
Equals: Final sales to domestic purchasers ........................................................................... 6 7,039.8 7,125.1 7,215.1 7,290.4 7,362.2 7,417.5 7,539.5 7,678.1 7,752.8 7,849.6 7,966.3 8,038.7
NOTE.—Percent changes from preceding period for selected items in this table are shown in table 8.1.
• August
Table 1.6.—Relation of Real Gross Domestic Product, Real Gross Domestic Purchases, and Real Final Sales to Domestic Purchasers[Billions of chained (1992) dollars]
Line 1992 1993 1994 1995 1996
Seasonally adjusted at annual rates
1992 1993 1994
IV I II III IV I II
Gross domestic product ............................................................................................................. 1 6,244.4 6,389.6 6,610.7 6,742.1 6,928.4 6,327.1 6,327.9 6,359.9 6,393.5 6,476.9 6,524.5 6,600.3
Less: Exports of goods and services ............................................................................................ 2 639.4 658.2 712.4 791.2 857.0 649.1 647.2 660.1 646.3 679.1 676.0 704.1Plus: Imports of goods and services ............................................................................................ 3 669.0 728.4 817.0 890.1 971.5 689.1 701.9 722.7 729.4 759.7 773.6 808.0
Equals: Gross domestic purchases .......................................................................................... 4 6,274.0 6,459.0 6,712.7 6,837.5 7,037.7 6,367.0 6,382.3 6,422.0 6,475.6 6,556.2 6,620.2 6,701.8
Less: Change in business inventories .......................................................................................... 5 7.0 22.1 60.6 27.3 25.0 5.6 32.3 16.6 15.3 24.2 53.1 75.9
Equals: Final sales to domestic purchasers ........................................................................... 6 6,267.0 6,438.3 6,653.2 6,808.1 7,010.2 6,360.7 6,351.7 6,407.0 6,461.4 6,533.1 6,568.7 6,628.0
Line
Seasonally adjusted at annual rates
1994 1995 1996 1997
III IV I II III IV I II III IV I II
Gross domestic product ............................................................................................................. 1 6,629.5 6,688.6 6,703.7 6,708.8 6,759.2 6,796.5 6,826.4 6,926.0 6,943.8 7,017.4 7,101.6 7,139.7
Less: Exports of goods and services ............................................................................................ 2 722.1 747.3 760.4 777.4 802.4 824.6 828.2 847.4 851.4 901.1 922.7 954.1Plus: Imports of goods and services ............................................................................................ 3 833.2 853.2 873.9 890.3 895.4 900.7 929.0 960.0 990.2 1,006.6 1,048.9 1,102.0
Equals: Gross domestic purchases .......................................................................................... 4 6,737.5 6,791.3 6,813.2 6,817.3 6,848.9 6,870.4 6,923.2 7,033.6 7,075.3 7,118.4 7,220.9 7,276.9
Less: Change in business inventories .......................................................................................... 5 49.7 63.6 48.5 21.6 17.0 22.2 8.0 21.3 37.9 32.9 63.7 66.8
Equals: Final sales to domestic purchasers ........................................................................... 6 6,688.4 6,727.5 6,763.7 6,793.8 6,829.1 6,845.8 6,911.8 7,009.9 7,036.4 7,082.7 7,153.1 7,204.9
NOTE.—Chained (1992) dollar series are calculated as the product of the chain-type quantity index and the 1992current-dollar value of the corresponding series, divided by 100. Because the formula for the chain-type quantity
indexes uses weights of more than one period, the corresponding chained-dollar estimates are usually not additive.Percent changes from preceding period for selected items in this table are shown in table 8.1.
Table 1.7.—Gross Domestic Product by Sector[Billions of dollars]
Line 1992 1993 1994 1995 1996
Seasonally adjusted at annual rates
1992 1993 1994
IV I II III IV I II
Gross domestic product .................................................................................................... 1 6,244.4 6,558.1 6,947.0 7,265.4 7,636.0 6,383.1 6,444.5 6,509.1 6,574.6 6,704.2 6,794.3 6,911.4
Business 1 ..................................................................................................................................... 2 5,184.4 5,453.1 5,801.6 6,074.7 6,401.0 5,309.3 5,353.0 5,409.6 5,463.7 5,586.1 5,663.0 5,769.9
Nonfarm 1 ................................................................................................................................... 3 5,103.8 5,380.1 5,718.1 6,001.3 6,311.6 5,230.6 5,282.0 5,333.4 5,398.6 5,506.2 5,572.3 5,684.9Nonfarm less housing ........................................................................................................... 4 4,560.6 4,822.9 5,123.6 5,372.0 5,652.8 4,686.2 4,725.6 4,778.7 4,841.5 4,945.9 4,984.5 5,101.6Housing .................................................................................................................................. 5 543.2 557.1 594.4 629.2 658.8 544.4 556.5 554.7 557.1 560.3 587.8 583.3
Farm ........................................................................................................................................... 6 80.6 73.0 83.5 73.5 89.4 78.7 71.0 76.2 65.1 79.9 90.7 85.0
Households and institutions ...................................................................................................... 7 279.1 296.5 312.7 331.8 346.0 286.2 290.1 294.5 298.9 302.4 305.9 309.6
Private households .................................................................................................................... 8 10.1 10.7 11.0 11.8 11.5 10.4 10.5 10.6 10.7 10.8 10.8 10.9Nonprofit institutions .................................................................................................................. 9 269.0 285.8 301.7 319.9 334.6 275.8 279.6 283.9 288.2 291.6 295.1 298.7
General government 2 .................................................................................................................. 10 781.0 808.5 832.7 858.9 889.0 787.6 801.4 805.0 812.0 815.7 825.4 831.8
Federal ....................................................................................................................................... 11 274.4 276.9 275.2 275.5 281.4 272.1 278.9 276.2 277.2 275.3 277.5 277.7State and local ........................................................................................................................... 12 506.6 531.6 557.5 583.4 607.6 515.5 522.5 528.9 534.8 540.4 547.8 554.1
Line
Seasonally adjusted at annual rates
1994 1995 1996 1997
III IV I II III IV I II III IV I II
Gross domestic product .................................................................................................... 1 6,986.5 7,095.7 7,168.9 7,209.5 7,301.3 7,381.9 7,467.5 7,607.7 7,676.0 7,792.9 7,933.6 8,004.8
Business 1 ..................................................................................................................................... 2 5,837.0 5,936.3 5,993.5 6,023.5 6,105.5 6,176.5 6,249.0 6,377.7 6,434.2 6,543.1 6,666.5 6,726.0
Nonfarm 1 ................................................................................................................................... 3 5,756.2 5,858.8 5,923.8 5,952.4 6,032.2 6,096.6 6,165.6 6,289.2 6,341.7 6,450.0 6,573.1 6,627.9Nonfarm less housing ........................................................................................................... 4 5,158.0 5,250.4 5,305.7 5,326.2 5,403.0 5,453.3 5,520.5 5,636.3 5,677.3 5,777.1 5,892.5 5,940.7Housing .................................................................................................................................. 5 598.2 608.4 618.2 626.2 629.2 643.3 645.1 652.8 664.4 673.0 680.6 687.2
Farm ........................................................................................................................................... 6 80.8 77.5 69.6 71.1 73.4 79.8 83.4 88.6 92.5 93.0 93.4 98.1
Households and institutions ...................................................................................................... 7 314.9 320.5 325.5 330.1 333.5 337.9 340.3 343.9 347.9 352.0 357.7 363.4
Private households .................................................................................................................... 8 11.1 11.3 11.7 11.8 11.9 11.9 11.8 11.6 11.4 11.1 11.1 11.3Nonprofit institutions .................................................................................................................. 9 303.8 309.2 313.8 318.3 321.6 326.0 328.5 332.3 336.6 341.0 346.6 352.2
General government 2 .................................................................................................................. 10 834.7 838.9 849.9 855.8 862.2 867.6 878.3 886.1 893.9 897.8 909.4 915.4
Federal ....................................................................................................................................... 11 273.6 272.0 275.4 275.2 276.1 275.3 280.5 281.9 282.1 281.1 286.2 285.7State and local ........................................................................................................................... 12 561.1 566.9 574.5 580.6 586.1 592.3 597.8 604.2 611.8 616.7 623.3 629.6
1. Gross domestic business product equals gross domestic product less gross product of households and institu-tions and of general government. Nonfarm product equals gross domestic business product less gross farm product.
2. Equals compensation of general government employees plus general government consumption of fixed capitalas shown in table 3.7.

August •
Table 1.8.—Real Gross Domestic Product by Sector[Billions of chained (1992) dollars]
Line 1992 1993 1994 1995 1996
Seasonally adjusted at annual rates
1992 1993 1994
IV I II III IV I II
Gross domestic product .................................................................................................... 1 6,244.4 6,389.6 6,610.7 6,742.1 6,928.4 6,327.1 6,327.9 6,359.9 6,393.5 6,476.9 6,524.5 6,600.3
Business 1 ..................................................................................................................................... 2 5,184.4 5,317.2 5,530.6 5,657.4 5,842.9 5,263.1 5,260.6 5,287.9 5,318.5 5,401.9 5,447.5 5,520.7
Nonfarm 1 ................................................................................................................................... 3 5,103.8 5,246.2 5,446.0 5,582.7 5,766.8 5,184.4 5,186.7 5,213.4 5,257.1 5,327.6 5,361.7 5,435.8Nonfarm less housing ........................................................................................................... 4 4,560.6 4,704.1 4,883.3 5,005.7 5,181.4 4,645.9 4,640.5 4,672.5 4,716.5 4,787.1 4,799.8 4,881.5Housing .................................................................................................................................. 5 543.2 542.1 562.7 577.0 585.7 538.5 546.2 541.0 540.6 540.6 561.9 554.4
Farm ........................................................................................................................................... 6 80.6 71.0 85.0 74.2 75.5 78.7 74.0 74.7 61.0 74.4 86.3 85.4
Households and institutions ...................................................................................................... 7 279.1 290.1 297.9 305.1 311.2 282.0 284.6 289.4 292.5 293.9 294.9 296.9
Private households .................................................................................................................... 8 10.1 10.3 10.4 10.8 10.1 10.3 10.3 10.4 10.3 10.3 10.3 10.3Nonprofit institutions .................................................................................................................. 9 269.0 279.8 287.5 294.3 301.1 271.7 274.2 279.0 282.2 283.6 284.6 286.6
General government 2 .................................................................................................................. 10 781.0 782.3 782.6 780.3 775.9 782.0 782.7 782.6 782.5 781.3 782.4 783.0
Federal ....................................................................................................................................... 11 274.4 267.7 258.4 248.1 240.9 272.7 271.3 269.2 267.0 263.5 262.5 259.8State and local ........................................................................................................................... 12 506.6 514.5 524.2 532.2 535.2 509.3 511.4 513.4 515.5 517.8 519.9 523.2
Residual .......................................................................................................................................... 13 –.1 .1 –.8 –.2 –1.5 0 0 –.3 .4 –.4 –.8 –.9
Line
Seasonally adjusted at annual rates
1994 1995 1996 1997
III IV I II III IV I II III IV I II
Gross domestic product .................................................................................................... 1 6,629.5 6,688.6 6,703.7 6,708.8 6,759.2 6,796.5 6,826.4 6,926.0 6,943.8 7,017.4 7,101.6 7,139.7
Business 1 ..................................................................................................................................... 2 5,547.5 5,606.6 5,618.6 5,622.1 5,672.2 5,716.7 5,750.2 5,838.1 5,854.9 5,928.5 6,009.6 6,045.0
Nonfarm 1 ................................................................................................................................... 3 5,461.6 5,524.8 5,542.0 5,545.6 5,600.2 5,643.0 5,673.0 5,761.3 5,779.8 5,853.3 5,929.7 5,962.6Nonfarm less housing ........................................................................................................... 4 4,897.1 4,954.9 4,968.1 4,968.8 5,025.4 5,060.6 5,093.9 5,179.0 5,191.3 5,261.3 5,335.3 5,367.3Housing .................................................................................................................................. 5 564.5 569.8 573.9 576.7 574.9 582.4 579.3 582.6 588.7 592.3 594.9 595.9
Farm ........................................................................................................................................... 6 86.4 81.9 76.2 76.1 71.5 73.1 76.6 76.2 74.6 74.7 79.0 81.4
Households and institutions ...................................................................................................... 7 298.8 301.0 302.8 304.3 305.9 307.4 307.6 310.4 312.5 314.4 316.9 319.0
Private households .................................................................................................................... 8 10.4 10.5 10.8 10.8 10.8 10.7 10.5 10.3 10.0 9.6 9.6 9.6Nonprofit institutions .................................................................................................................. 9 288.4 290.5 292.0 293.4 295.1 296.7 297.1 300.1 302.5 304.8 307.4 309.4
General government 2 .................................................................................................................. 10 783.6 781.5 782.9 782.9 781.8 773.6 769.9 778.9 778.1 776.6 777.7 778.6
Federal ....................................................................................................................................... 11 257.6 253.8 252.0 251.0 249.3 240.3 240.5 242.8 241.3 238.9 238.2 236.7State and local ........................................................................................................................... 12 526.0 527.8 530.9 531.9 532.6 533.5 529.6 536.3 537.0 537.9 539.9 542.2
Residual .......................................................................................................................................... 13 –.9 –.6 –.2 .1 –.4 –.8 –1.1 –1.3 –1.6 –2.1 –2.7 –2.8
1. Gross domestic business product equals gross domestic product less gross product of households and institu-tions and of general government. Nonfarm product equals gross domestic business product less gross farm product.
2. Equals compensation of general government employees plus general government consumption of fixed capitalas shown in table 3.8.
NOTE.—Chained (1992) dollar series are calculated as the product of the chain-type quantity index and the 1992current-dollar value of the corresponding series, divided by 100. Because the formula for the chain-type quantityindexes uses weights of more than one period, the corresponding chained-dollar estimates are usually not additive.The residual line is the difference between the first line and the sum of the most detailed lines.

• August
Table 1.9.—Relation of Gross Domestic Product, Gross National Product, Net National Product, National Income, and Personal Income[Billions of dollars]
Line 1992 1993 1994 1995 1996
Seasonally adjusted at annual rates
1992 1993 1994
IV I II III IV I II
Gross domestic product ............................................................................................................. 1 6,244.4 6,558.1 6,947.0 7,265.4 7,636.0 6,383.1 6,444.5 6,509.1 6,574.6 6,704.2 6,794.3 6,911.4
Plus: Receipts of factor income from the rest of the world ......................................................... 2 137.9 150.8 176.5 222.8 234.3 133.9 145.6 148.9 153.2 155.6 161.1 168.3Less: Payments of factor income to the rest of the world .......................................................... 3 126.8 132.1 168.3 217.5 232.6 126.4 122.1 132.7 130.9 142.7 144.2 159.3
Equals: Gross national product ................................................................................................. 4 6,255.5 6,576.8 6,955.2 7,270.6 7,637.7 6,390.5 6,468.1 6,525.3 6,596.9 6,717.1 6,811.2 6,920.3
Less: Consumption of fixed capital ............................................................................................... 5 713.5 727.9 777.5 796.8 830.1 704.3 721.8 720.7 735.3 733.6 823.3 753.1Private ........................................................................................................................... 6 585.4 594.5 638.6 653.0 682.7 574.3 590.5 588.1 601.1 598.1 685.2 614.9
Capital consumption allowances .............................................................................. 7 575.4 599.1 647.3 669.1 709.9 578.5 598.0 592.1 601.7 604.5 663.8 631.6Less: Capital consumption adjustment .................................................................... 8 –10.0 4.6 8.7 16.1 27.1 4.2 7.5 4.1 .5 6.4 –21.3 16.7
Government .................................................................................................................. 9 128.2 133.4 138.8 143.8 147.4 130.0 131.3 132.7 134.2 135.5 138.1 138.1General government ................................................................................................. 10 110.2 114.3 118.2 122.4 125.1 111.6 112.6 113.6 115.0 116.0 116.9 118.0Government enterprises ........................................................................................... 11 18.0 19.1 20.6 21.4 22.3 18.4 18.7 19.0 19.2 19.5 21.2 20.2
Equals: Net national product ..................................................................................................... 12 5,542.0 5,848.9 6,177.7 6,473.9 6,807.6 5,686.2 5,746.2 5,804.6 5,861.5 5,983.5 5,987.9 6,167.3
Less: Indirect business tax and nontax liability ............................................................................ 13 505.6 532.5 568.5 582.8 604.8 521.7 520.6 525.9 534.4 549.4 556.9 564.4Business transfer payments ............................................................................................. 14 28.4 28.2 30.5 32.2 33.6 28.8 27.8 27.7 28.2 29.0 29.7 30.1Statistical discrepancy ....................................................................................................... 15 44.8 52.6 14.6 –28.2 –59.9 64.6 71.0 46.9 47.5 45.0 6.3 42.4
Plus: Subsidies less current surplus of government enterprises ................................................. 16 27.1 31.1 26.6 25.2 25.4 31.5 33.0 32.8 30.2 28.5 28.1 25.9
Equals: National income ............................................................................................................. 17 4,990.4 5,266.8 5,590.7 5,912.3 6,254.5 5,102.6 5,159.8 5,236.9 5,281.7 5,388.7 5,423.2 5,556.3
Less: Corporate profits with inventory valuation and capital consumption adjustments ............. 18 428.0 492.8 570.5 650.0 735.9 454.6 459.2 478.2 492.8 541.2 512.0 562.0Net interest ........................................................................................................................ 19 414.3 402.5 412.3 425.1 425.1 412.4 411.2 404.6 398.9 395.4 397.2 405.6Contributions for social insurance .................................................................................... 20 571.4 596.0 630.5 659.1 692.0 575.7 585.3 594.0 598.7 606.1 619.2 628.2Wage accruals less disbursements .................................................................................. 21 –15.8 4.4 13.3 13.1 1.1 –63.0 70.1 –.1 –.1 –52.2 52.4 .3
Plus: Personal interest income ...................................................................................................... 22 667.2 651.0 668.1 718.9 735.7 660.4 660.3 653.7 647.8 642.1 641.4 656.4Personal dividend income ................................................................................................ 23 159.4 185.3 204.8 251.9 291.2 170.1 177.8 182.1 187.8 193.5 192.1 200.3Government transfer payments to persons ..................................................................... 24 835.7 889.8 930.9 990.0 1,042.0 853.0 874.9 886.0 895.3 903.1 917.3 926.2Business transfer payments to persons ........................................................................... 25 22.5 22.1 23.7 25.0 26.0 22.9 22.3 22.0 22.0 22.2 23.1 23.6
Equals: Personal income ............................................................................................................ 26 5,277.2 5,519.2 5,791.8 6,150.8 6,495.2 5,429.3 5,369.4 5,504.1 5,544.2 5,659.1 5,616.3 5,766.6
Addenda:Gross domestic income ............................................................................................................. 27 6,199.7 6,505.5 6,932.4 7,293.6 7,695.9 6,318.4 6,373.5 6,462.2 6,527.1 6,659.2 6,788.0 6,869.0Gross national income ............................................................................................................... 28 6,210.7 6,524.2 6,940.6 7,298.9 7,697.6 6,325.9 6,397.0 6,478.4 6,549.4 6,672.0 6,804.9 6,878.0Net domestic product ................................................................................................................ 29 5,530.9 5,830.2 6,169.5 6,468.6 6,805.9 5,678.8 5,722.7 5,788.4 5,839.2 5,970.6 5,971.0 6,158.3
Line
Seasonally adjusted at annual rates
1994 1995 1996 1997
III IV I II III IV I II III IV I II
Gross domestic product ............................................................................................................. 1 6,986.5 7,095.7 7,168.9 7,209.5 7,301.3 7,381.9 7,467.5 7,607.7 7,676.0 7,792.9 7,933.6 8,004.8
Plus: Receipts of factor income from the rest of the world ......................................................... 2 181.9 194.6 213.6 226.4 222.6 228.5 226.0 227.1 235.4 248.8 248.2 ...............Less: Payments of factor income to the rest of the world .......................................................... 3 176.1 193.5 207.4 215.3 225.6 221.9 218.2 224.3 242.3 245.6 262.5 ...............
Equals: Gross national product ................................................................................................. 4 6,992.3 7,096.8 7,175.1 7,220.6 7,298.3 7,388.5 7,475.3 7,610.5 7,669.1 7,796.1 7,919.2 ...............
Less: Consumption of fixed capital ............................................................................................... 5 762.2 771.4 780.1 790.6 799.0 817.3 815.5 824.1 835.4 845.6 855.0 862.5Private ........................................................................................................................... 6 623.3 631.2 638.3 647.4 654.7 671.7 669.2 676.8 687.7 697.2 705.4 712.0
Capital consumption allowances .............................................................................. 7 642.2 651.5 655.6 663.7 672.5 684.8 693.8 704.9 715.4 725.3 736.6 745.9Less: Capital consumption adjustment .................................................................... 8 18.9 20.3 17.3 16.3 17.7 13.1 24.6 28.0 27.8 28.1 31.2 34.0
Government .................................................................................................................. 9 138.9 140.2 141.9 143.2 144.3 145.6 146.2 147.2 147.8 148.4 149.6 150.5General government ................................................................................................. 10 118.5 119.5 120.9 122.0 122.8 123.9 124.3 125.1 125.4 125.8 126.8 127.3Government enterprises ........................................................................................... 11 20.5 20.7 21.0 21.2 21.5 21.7 22.0 22.1 22.4 22.6 22.9 23.2
Equals: Net national product ..................................................................................................... 12 6,230.1 6,325.4 6,395.0 6,429.9 6,499.2 6,571.2 6,659.8 6,786.4 6,833.6 6,950.4 7,064.2 ...............
Less: Indirect business tax and nontax liability ............................................................................ 13 573.2 579.4 578.9 580.9 584.0 587.3 594.0 599.0 600.9 625.3 610.2 616.4Business transfer payments ............................................................................................. 14 30.7 31.5 31.8 32.0 32.5 32.7 32.7 33.5 33.8 34.2 34.4 35.0Statistical discrepancy ....................................................................................................... 15 15.2 –5.4 1.2 –20.2 –45.0 –48.9 –50.3 –50.2 –79.5 –59.5 –64.3 ...............
Plus: Subsidies less current surplus of government enterprises ................................................. 16 25.1 27.4 24.8 25.1 25.7 25.5 25.3 25.2 24.9 26.0 26.1 25.9
Equals: National income ............................................................................................................. 17 5,636.1 5,747.3 5,807.9 5,862.4 5,953.4 6,025.5 6,108.8 6,229.4 6,303.3 6,376.5 6,510.0 ...............
Less: Corporate profits with inventory valuation and capital consumption adjustments ............. 18 590.1 617.7 613.2 628.0 672.8 685.7 717.7 738.5 739.6 747.8 779.6 ...............Net interest ........................................................................................................................ 19 415.6 430.7 432.7 429.7 419.5 418.6 416.2 422.5 430.9 430.6 440.5 ...............Contributions for social insurance .................................................................................... 20 633.4 641.2 650.1 655.1 662.4 668.6 677.3 688.7 696.8 705.1 719.5 726.8Wage accruals less disbursements .................................................................................. 21 .3 .3 13.1 13.1 13.1 13.1 1.1 1.1 1.1 1.1 1.2 1.2
Plus: Personal interest income ...................................................................................................... 22 674.1 700.4 713.9 719.4 717.9 724.2 722.3 727.8 742.7 749.8 757.2 766.8Personal dividend income ................................................................................................ 23 208.5 218.5 243.4 248.6 254.2 261.5 287.4 290.0 292.0 295.2 312.5 318.3Government transfer payments to persons ..................................................................... 24 934.8 945.4 972.4 985.6 996.4 1,005.7 1,027.6 1,039.0 1,046.3 1,055.1 1,080.5 1,090.5Business transfer payments to persons ........................................................................... 25 24.0 24.4 24.6 24.8 25.1 25.4 25.6 25.9 26.1 26.4 26.7 26.9
Equals: Personal income ............................................................................................................ 26 5,838.1 5,946.1 6,053.1 6,114.8 6,179.1 6,256.2 6,359.4 6,461.3 6,541.9 6,618.4 6,746.2 6,830.0
Addenda:Gross domestic income ............................................................................................................. 27 6,971.3 7,101.1 7,167.8 7,229.7 7,346.3 7,430.8 7,517.8 7,657.9 7,755.5 7,852.4 7,997.9 ...............Gross national income ............................................................................................................... 28 6,977.1 7,102.2 7,173.9 7,240.8 7,343.3 7,437.4 7,525.6 7,660.7 7,748.5 7,855.5 7,983.6 ...............Net domestic product ................................................................................................................ 29 6,224.4 6,324.3 6,388.8 6,418.8 6,502.2 6,564.6 6,652.0 6,783.6 6,840.6 6,947.3 7,078.5 7,142.3
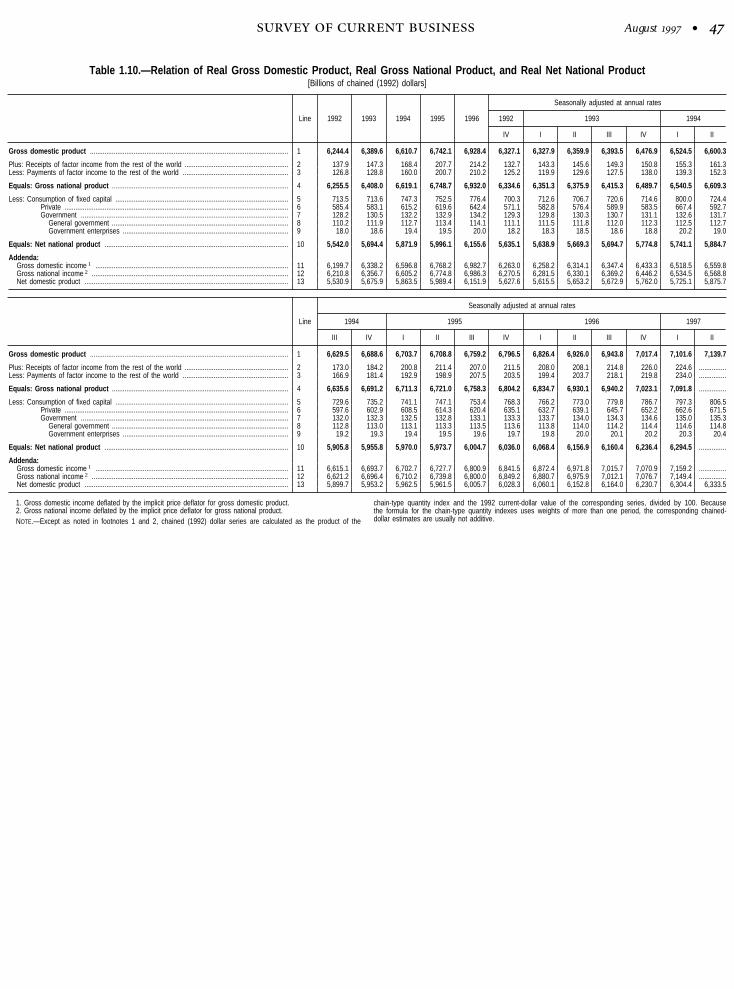
August •
Table 1.10.—Relation of Real Gross Domestic Product, Real Gross National Product, and Real Net National Product[Billions of chained (1992) dollars]
Line 1992 1993 1994 1995 1996
Seasonally adjusted at annual rates
1992 1993 1994
IV I II III IV I II
Gross domestic product ............................................................................................................. 1 6,244.4 6,389.6 6,610.7 6,742.1 6,928.4 6,327.1 6,327.9 6,359.9 6,393.5 6,476.9 6,524.5 6,600.3
Plus: Receipts of factor income from the rest of the world ......................................................... 2 137.9 147.3 168.4 207.7 214.2 132.7 143.3 145.6 149.3 150.8 155.3 161.3Less: Payments of factor income to the rest of the world .......................................................... 3 126.8 128.8 160.0 200.7 210.2 125.2 119.9 129.6 127.5 138.0 139.3 152.3
Equals: Gross national product ................................................................................................. 4 6,255.5 6,408.0 6,619.1 6,748.7 6,932.0 6,334.6 6,351.3 6,375.9 6,415.3 6,489.7 6,540.5 6,609.3
Less: Consumption of fixed capital ............................................................................................... 5 713.5 713.6 747.3 752.5 776.4 700.3 712.6 706.7 720.6 714.6 800.0 724.4Private ........................................................................................................................... 6 585.4 583.1 615.2 619.6 642.4 571.1 582.8 576.4 589.9 583.5 667.4 592.7Government .................................................................................................................. 7 128.2 130.5 132.2 132.9 134.2 129.3 129.8 130.3 130.7 131.1 132.6 131.7
General government ................................................................................................. 8 110.2 111.9 112.7 113.4 114.1 111.1 111.5 111.8 112.0 112.3 112.5 112.7Government enterprises ........................................................................................... 9 18.0 18.6 19.4 19.5 20.0 18.2 18.3 18.5 18.6 18.8 20.2 19.0
Equals: Net national product ..................................................................................................... 10 5,542.0 5,694.4 5,871.9 5,996.1 6,155.6 5,635.1 5,638.9 5,669.3 5,694.7 5,774.8 5,741.1 5,884.7
Addenda:Gross domestic income 1 .......................................................................................................... 11 6,199.7 6,338.2 6,596.8 6,768.2 6,982.7 6,263.0 6,258.2 6,314.1 6,347.4 6,433.3 6,518.5 6,559.8Gross national income 2 ............................................................................................................ 12 6,210.8 6,356.7 6,605.2 6,774.8 6,986.3 6,270.5 6,281.5 6,330.1 6,369.2 6,446.2 6,534.5 6,568.8Net domestic product ................................................................................................................ 13 5,530.9 5,675.9 5,863.5 5,989.4 6,151.9 5,627.6 5,615.5 5,653.2 5,672.9 5,762.0 5,725.1 5,875.7
Line
Seasonally adjusted at annual rates
1994 1995 1996 1997
III IV I II III IV I II III IV I II
Gross domestic product ............................................................................................................. 1 6,629.5 6,688.6 6,703.7 6,708.8 6,759.2 6,796.5 6,826.4 6,926.0 6,943.8 7,017.4 7,101.6 7,139.7
Plus: Receipts of factor income from the rest of the world ......................................................... 2 173.0 184.2 200.8 211.4 207.0 211.5 208.0 208.1 214.8 226.0 224.6 ...............Less: Payments of factor income to the rest of the world .......................................................... 3 166.9 181.4 192.9 198.9 207.5 203.5 199.4 203.7 218.1 219.8 234.0 ...............
Equals: Gross national product ................................................................................................. 4 6,635.6 6,691.2 6,711.3 6,721.0 6,758.3 6,804.2 6,834.7 6,930.1 6,940.2 7,023.1 7,091.8 ...............
Less: Consumption of fixed capital ............................................................................................... 5 729.6 735.2 741.1 747.1 753.4 768.3 766.2 773.0 779.8 786.7 797.3 806.5Private ........................................................................................................................... 6 597.6 602.9 608.5 614.3 620.4 635.1 632.7 639.1 645.7 652.2 662.6 671.5Government .................................................................................................................. 7 132.0 132.3 132.5 132.8 133.1 133.3 133.7 134.0 134.3 134.6 135.0 135.3
General government ................................................................................................. 8 112.8 113.0 113.1 113.3 113.5 113.6 113.8 114.0 114.2 114.4 114.6 114.8Government enterprises ........................................................................................... 9 19.2 19.3 19.4 19.5 19.6 19.7 19.8 20.0 20.1 20.2 20.3 20.4
Equals: Net national product ..................................................................................................... 10 5,905.8 5,955.8 5,970.0 5,973.7 6,004.7 6,036.0 6,068.4 6,156.9 6,160.4 6,236.4 6,294.5 ...............
Addenda:Gross domestic income 1 .......................................................................................................... 11 6,615.1 6,693.7 6,702.7 6,727.7 6,800.9 6,841.5 6,872.4 6,971.8 7,015.7 7,070.9 7,159.2 ...............Gross national income 2 ............................................................................................................ 12 6,621.2 6,696.4 6,710.2 6,739.8 6,800.0 6,849.2 6,880.7 6,975.9 7,012.1 7,076.7 7,149.4 ...............Net domestic product ................................................................................................................ 13 5,899.7 5,953.2 5,962.5 5,961.5 6,005.7 6,028.3 6,060.1 6,152.8 6,164.0 6,230.7 6,304.4 6,333.5
1. Gross domestic income deflated by the implicit price deflator for gross domestic product.2. Gross national income deflated by the implicit price deflator for gross national product.NOTE.—Except as noted in footnotes 1 and 2, chained (1992) dollar series are calculated as the product of the
chain-type quantity index and the 1992 current-dollar value of the corresponding series, divided by 100. Becausethe formula for the chain-type quantity indexes uses weights of more than one period, the corresponding chained-dollar estimates are usually not additive.

• August
Table 1.11.—Command-Basis Real Gross National Product[Billions of chained (1992) dollars]
Line 1992 1993 1994 1995 1996
Seasonally adjusted at annual rates
1992 1993 1994
IV I II III IV I II
Gross national product ............................................................................................................... 1 6,255.5 6,408.0 6,619.1 6,748.7 6,932.0 6,334.6 6,351.3 6,375.9 6,415.3 6,489.7 6,540.5 6,609.3
Less: Exports of goods and services and receipts of factor income from the rest of the world 2 777.3 805.5 881.1 999.7 1,071.7 781.8 790.5 805.7 795.8 829.9 831.4 865.5Plus: Command-basis exports of goods and services and receipts of factor income 1 ............. 3 777.4 814.7 895.1 1,014.0 1,091.1 779.2 798.4 810.8 806.5 843.4 852.2 881.3
Equals: Command-basis gross national product .................................................................... 4 6,255.6 6,417.3 6,633.2 6,763.0 6,951.4 6,332.0 6,359.1 6,381.0 6,426.0 6,503.1 6,561.2 6,625.1
Addendum:Terms of trade 2 ......................................................................................................................... 5 100.0 101.1 101.6 101.4 101.8 99.7 101.0 100.6 101.3 101.6 102.5 101.8
Line
Seasonally adjusted at annual rates
1994 1995 1996 1997
III IV I II III IV I II III IV I II
Gross national product ............................................................................................................... 1 6,635.6 6,691.2 6,711.3 6,721.0 6,758.3 6,804.2 6,834.7 6,930.1 6,940.2 7,023.1 7,091.8 ...............
Less: Exports of goods and services and receipts of factor income from the rest of the world 2 895.5 932.0 962.0 989.9 1,010.1 1,036.8 1,036.7 1,055.8 1,066.8 1,127.6 1,147.3 ...............Plus: Command-basis exports of goods and services and receipts of factor income 1 ............. 3 904.2 942.8 978.1 999.8 1,024.2 1,053.8 1,055.7 1,075.2 1,090.2 1,143.4 1,171.9 ...............
Equals: Command-basis gross national product .................................................................... 4 6,644.3 6,702.1 6,727.3 6,730.8 6,772.3 6,821.3 6,853.7 6,949.5 6,963.6 7,038.9 7,116.4 ...............
Addendum:Terms of trade 2 ......................................................................................................................... 5 101.0 101.2 101.7 101.0 101.4 101.6 101.8 101.8 102.2 101.4 102.1 103.3
1. Exports of goods and services and receipts of factor income deflated by the implicit price deflator for importsof goods and services and payments of factor income.
2. Ratio of the implicit price deflator for exports of goods and services and receipts of factor income to thecorresponding implicit price deflator for imports with the decimal point shifted two places to the right.
NOTE.—Chained (1992) dollar series are calculated as the product of the chain-type quantity index and the 1992current-dollar value of the corresponding series, divided by 100. Because the formula for the chain-type quantityindexes uses weights of more than one period, the corresponding chained-dollar estimates are usually not additive.
Percent changes from preceding period for selected items in this table are shown in table 8.1.
Table 1.12.—Net Domestic Product by Sector[Billions of dollars]
Line 1992 1993 1994 1995 1996
Net domestic product ..................................................... 1 5,530.9 5,830.2 6,169.5 6,468.6 6,805.9
Business 1 ................................................................................. 2 4,581.0 4,839.5 5,142.3 5,400.4 5,696.0
Nonfarm 1 ............................................................................... 3 4,523.7 4,789.9 5,082.5 5,351.6 5,632.2Nonfarm less housing ....................................................... 4 4,086.3 4,333.3 4,605.5 4,833.9 5,088.2Housing .............................................................................. 5 437.4 456.6 477.0 517.7 544.0
Farm ....................................................................................... 6 57.3 49.7 59.8 48.8 63.8
Households and institutions .................................................. 7 279.1 296.5 312.7 331.8 346.0
Private households ................................................................ 8 10.1 10.7 11.0 11.8 11.5Nonprofit institutions .............................................................. 9 269.0 285.8 301.7 319.9 334.6
General government 2 .............................................................. 10 670.8 694.2 714.5 736.5 763.9
Federal ................................................................................... 11 210.9 211.4 208.3 207.3 212.8State and local ...................................................................... 12 460.0 482.8 506.2 529.2 551.0
1. Net domestic business product equals net domestic product less net product of households and institutionsand of general government. Nonfarm product equals net domestic business product less net farm product.
2. Equals compensation of general government employees as shown in table 3.7.
Table 1.13.—Real Net Domestic Product by Sector[Billions of chained (1992) dollars]
Line 1992 1993 1994 1995 1996
Net domestic product ..................................................... 1 5,530.9 5,675.9 5,863.5 5,989.4 6,151.9
Business 1 ................................................................................. 2 4,581.0 4,715.5 4,896.0 5,018.2 5,180.5
Nonfarm 1 ............................................................................... 3 4,523.7 4,667.2 4,833.8 4,966.2 5,127.5Nonfarm less housing ....................................................... 4 4,086.3 4,221.5 4,380.6 4,489.8 4,643.3Housing .............................................................................. 5 437.4 445.7 453.2 476.3 484.2
Farm ....................................................................................... 6 57.3 48.3 62.9 51.3 52.2
Households and institutions .................................................. 7 279.1 290.1 297.9 305.1 311.2
Private households ................................................................ 8 10.1 10.3 10.4 10.8 10.1Nonprofit institutions .............................................................. 9 269.0 279.8 287.5 294.3 301.1
General government 2 .............................................................. 10 670.8 670.4 669.9 667.0 661.9
Federal ................................................................................... 11 210.9 204.0 195.1 185.5 178.9State and local ...................................................................... 12 460.0 466.4 474.8 481.6 483.2
Residual ...................................................................................... 13 –.1 –.1 –1.0 –.2 –1.1
1. Net domestic business product equals net domestic product less net product of households and institutionsand of general government. Nonfarm product equals net domestic business product less net farm product.
2. Equals compensation of general government employees as shown in table 3.8.NOTE.—Chained (1992) dollar series are calculated as the product of the chain-type quantity index and the 1992
current-dollar value of the corresponding series, divided by 100. Because the formula for the chain-type quantityindexes uses weights of more than one period, the corresponding chained-dollar estimates are usually not additive.The residual line is the difference between the first line and the sum of the most detailed lines.
.

August •
Table 1.14.—National Income by Type of Income[Billions of dollars]
Line 1992 1993 1994 1995 1996
Seasonally adjusted at annual rates
1992 1993 1994
IV I II III IV I II
National income ................................................................................................................... 1 4,990.4 5,266.8 5,590.7 5,912.3 6,254.5 5,102.6 5,159.8 5,236.9 5,281.7 5,388.7 5,423.2 5,556.3
Compensation of employees ...................................................................................................... 2 3,644.9 3,814.9 4,012.0 4,215.4 4,426.9 3,707.0 3,749.3 3,796.3 3,837.6 3,876.2 3,937.4 3,988.0Wage and salary accruals ......................................................................................................... 3 2,970.6 3,094.0 3,254.0 3,442.6 3,633.6 3,021.7 3,045.5 3,079.3 3,111.0 3,140.4 3,190.7 3,232.3
Government ........................................................................................................................... 4 567.8 584.3 602.2 623.0 642.6 572.5 581.1 581.5 586.3 588.4 596.0 601.3Other ...................................................................................................................................... 5 2,402.9 2,509.7 2,651.8 2,819.6 2,991.0 2,449.2 2,464.5 2,497.7 2,524.7 2,552.0 2,594.8 2,631.0
Supplements to wages and salaries ......................................................................................... 6 674.3 720.8 758.0 772.9 793.3 685.3 703.8 717.0 726.6 735.8 746.7 755.6Employer contributions for social insurance ......................................................................... 7 323.0 335.7 353.0 366.0 385.7 324.2 330.0 334.7 337.1 340.9 347.1 352.0Other labor income ............................................................................................................... 8 351.3 385.1 405.0 406.8 407.6 361.1 373.8 382.3 389.5 394.9 399.5 403.7
Proprietors’ income with inventory valuation and capital consumption adjustments ...... 9 423.8 450.8 471.6 489.0 520.3 437.4 440.3 452.2 446.2 464.4 463.9 474.7Farm ........................................................................................................................................... 10 37.1 32.4 36.9 23.4 37.2 36.5 29.7 36.3 25.6 38.0 46.4 38.8
Proprietors’ income with inventory valuation adjustment ..................................................... 11 45.2 40.4 44.8 31.4 45.0 44.4 37.7 44.2 33.8 46.0 54.3 46.7Capital consumption adjustment ........................................................................................... 12 –8.1 –8.0 –7.9 –7.9 –7.8 –7.9 –8.0 –8.0 –8.2 –8.0 –7.9 –7.9
Nonfarm ...................................................................................................................................... 13 386.7 418.4 434.7 465.5 483.1 401.0 410.6 416.0 420.6 426.5 417.5 435.9Proprietors’ income ................................................................................................................ 14 363.1 392.7 415.0 438.8 455.3 376.3 383.5 389.0 394.8 403.4 408.1 410.9Inventory valuation adjustment ............................................................................................. 15 –.7 –1.1 –.6 –.5 –.2 –.4 –1.2 –.4 –.5 –2.4 –1.8 1.8Capital consumption adjustment ........................................................................................... 16 24.3 26.8 20.4 27.2 28.0 25.1 28.4 27.4 26.3 25.4 11.2 23.3
Rental income of persons with capital consumption adjustment ........................................ 17 79.4 105.7 124.4 132.8 146.3 91.2 99.7 105.6 106.1 111.5 112.7 126.0Rental income of persons ......................................................................................................... 18 127.5 148.5 172.0 179.8 193.3 131.1 144.8 146.6 149.4 153.3 171.2 169.0Capital consumption adjustment ............................................................................................... 19 –48.1 –42.8 –47.6 –47.0 –47.0 –39.8 –45.1 –41.0 –43.3 –41.9 –58.4 –43.0
Corporate profits with inventory valuation and capital consumption adjustments ........... 20 428.0 492.8 570.5 650.0 735.9 454.6 459.2 478.2 492.8 541.2 512.0 562.0Corporate profits with inventory valuation adjustment ............................................................. 21 398.9 456.9 519.1 598.4 674.1 420.5 419.2 444.4 459.8 504.1 470.8 510.2
Profits before tax ................................................................................................................... 22 406.4 465.4 535.1 622.6 676.6 420.3 431.7 461.5 459.6 508.9 475.1 525.3Profits tax liability .............................................................................................................. 23 143.0 165.2 186.6 213.2 229.0 149.7 149.2 165.4 161.2 184.9 163.0 182.8Profits after tax ................................................................................................................. 24 263.4 300.2 348.5 409.4 447.6 270.6 282.5 296.1 298.4 324.0 312.1 342.5
Dividends ...................................................................................................................... 25 169.5 195.8 216.2 264.4 304.8 180.4 188.0 192.5 198.3 204.2 203.2 211.6Undistributed profits ...................................................................................................... 26 93.9 104.5 132.3 145.0 142.8 90.3 94.5 103.6 100.1 119.7 108.9 131.0
Inventory valuation adjustment ............................................................................................. 27 –7.5 –8.5 –16.1 –24.3 –2.5 .2 –12.5 –17.1 .2 –4.8 –4.3 –15.1Capital consumption adjustment ............................................................................................... 28 29.1 36.0 51.4 51.6 61.8 34.1 40.0 33.8 33.0 37.1 41.2 51.8
Net interest ................................................................................................................................... 29 414.3 402.5 412.3 425.1 425.1 412.4 411.2 404.6 398.9 395.4 397.2 405.6
Addenda:Corporate profits after tax with inventory valuation and capital consumption adjustments ... 30 285.0 327.6 383.8 436.7 506.9 304.9 309.9 312.8 331.5 356.3 348.9 379.3Net cash flow with inventory valuation and capital consumption adjustments ....................... 31 491.9 520.3 579.9 601.3 654.3 500.8 504.9 505.3 526.2 544.7 571.0 570.5
Undistributed profits with inventory valuation and capital consumption adjustments ......... 32 115.5 131.9 167.6 172.4 202.1 124.5 121.9 120.3 133.2 152.1 145.8 167.7Consumption of fixed capital ................................................................................................ 33 376.4 388.4 412.3 428.9 452.3 376.3 383.0 385.0 393.0 392.6 425.3 402.8
Less: Inventory valuation adjustment ........................................................................................ 34 –7.5 –8.5 –16.1 –24.3 –2.5 .2 –12.5 –17.1 .2 –4.8 –4.3 –15.1Equals: Net cash flow ............................................................................................................... 35 499.4 528.8 596.0 625.5 656.8 500.6 517.5 522.4 526.0 549.4 575.4 585.6
Line
Seasonally adjusted at annual rates
1994 1995 1996 1997
III IV I II III IV I II III IV I II
National income ................................................................................................................... 1 5,636.1 5,747.3 5,807.9 5,862.4 5,953.4 6,025.5 6,108.8 6,229.4 6,303.3 6,376.5 6,510.0 ...............
Compensation of employees ...................................................................................................... 2 4,028.7 4,093.9 4,153.2 4,187.9 4,238.0 4,282.6 4,322.2 4,403.9 4,461.0 4,520.7 4,606.3 4,663.3Wage and salary accruals ......................................................................................................... 3 3,267.2 3,325.9 3,384.3 3,417.7 3,463.3 3,504.9 3,540.3 3,612.3 3,664.0 3,718.0 3,792.7 3,842.6
Government ........................................................................................................................... 4 603.5 608.0 617.2 621.1 625.1 628.5 635.6 640.3 645.5 648.9 657.8 661.7Other ...................................................................................................................................... 5 2,663.7 2,717.8 2,767.1 2,796.7 2,838.2 2,876.4 2,904.7 2,972.0 3,018.4 3,069.0 3,134.9 3,180.9
Supplements to wages and salaries ......................................................................................... 6 761.5 768.1 768.9 770.2 774.6 777.7 781.9 791.5 797.0 802.7 813.6 820.7Employer contributions for social insurance ......................................................................... 7 354.6 358.3 361.0 363.6 368.0 371.4 376.8 383.6 388.6 393.6 401.3 405.5Other labor income ............................................................................................................... 8 406.9 409.8 407.9 406.6 406.7 406.2 405.0 407.9 408.4 409.1 412.3 415.1
Proprietors’ income with inventory valuation and capital consumption adjustments ...... 9 471.6 476.1 478.2 484.4 491.7 501.5 509.3 520.0 523.8 528.3 534.6 543.6Farm ........................................................................................................................................... 10 33.2 29.1 20.6 21.3 22.9 28.9 31.9 36.5 40.1 40.4 40.2 44.5
Proprietors’ income with inventory valuation adjustment ..................................................... 11 41.1 37.0 28.6 29.3 30.8 36.8 39.8 44.3 47.9 48.1 47.9 52.1Capital consumption adjustment ........................................................................................... 12 –7.9 –7.9 –7.9 –7.9 –7.9 –7.9 –7.9 –7.8 –7.8 –7.8 –7.7 –7.6
Nonfarm ...................................................................................................................................... 13 438.4 447.0 457.6 463.1 468.7 472.6 477.4 483.5 483.7 487.9 494.4 499.1Proprietors’ income ................................................................................................................ 14 416.6 424.3 431.3 436.6 442.4 444.7 448.8 456.4 456.1 460.0 466.3 469.7Inventory valuation adjustment ............................................................................................. 15 –1.4 –1.0 .4 –.4 –1.6 –.3 .2 –1.2 –.1 .3 –.1 .6Capital consumption adjustment ........................................................................................... 16 23.2 23.7 25.8 27.0 27.9 28.3 28.3 28.3 27.8 27.5 28.1 28.8
Rental income of persons with capital consumption adjustment ........................................ 17 130.1 128.9 130.5 132.3 131.5 137.1 143.4 144.6 148.0 149.2 149.0 148.6Rental income of persons ......................................................................................................... 18 174.0 173.9 176.2 178.0 177.3 187.7 189.5 191.0 195.5 197.3 197.9 197.7Capital consumption adjustment ............................................................................................... 19 –43.9 –45.0 –45.7 –45.7 –45.9 –50.6 –46.1 –46.4 –47.5 –48.1 –48.9 –49.1
Corporate profits with inventory valuation and capital consumption adjustments ........... 20 590.1 617.7 613.2 628.0 672.8 685.7 717.7 738.5 739.6 747.8 779.6 ...............Corporate profits with inventory valuation adjustment ............................................................. 21 535.0 560.3 560.4 577.2 621.4 634.5 659.8 676.8 676.4 683.4 711.9 ...............
Profits before tax ................................................................................................................... 22 556.2 583.9 610.7 615.0 630.6 634.1 664.9 682.2 679.1 680.0 708.4 ...............Profits tax liability .............................................................................................................. 23 194.6 206.2 209.6 209.1 218.8 215.3 226.2 232.2 231.6 226.0 241.2 ...............Profits after tax ................................................................................................................. 24 361.6 377.7 401.0 405.9 411.8 418.8 438.7 450.0 447.5 454.0 467.2 ...............
Dividends ...................................................................................................................... 25 220.0 230.2 255.5 260.8 266.8 274.4 300.7 303.7 305.7 309.1 326.8 333.0Undistributed profits ...................................................................................................... 26 141.6 147.5 145.6 145.1 145.0 144.5 138.0 146.4 141.8 144.9 140.3 ...............
Inventory valuation adjustment ............................................................................................. 27 –21.2 –23.6 –50.3 –37.8 –9.3 .4 –5.1 –5.4 –2.7 3.3 3.5 18.1Capital consumption adjustment ............................................................................................... 28 55.1 57.4 52.9 50.8 51.5 51.1 57.9 61.6 63.2 64.4 67.7 69.9
Net interest ................................................................................................................................... 29 415.6 430.7 432.7 429.7 419.5 418.6 416.2 422.5 430.9 430.6 440.5 ...............
Addenda:Corporate profits after tax with inventory valuation and capital consumption adjustments ... 30 395.5 411.5 403.6 418.9 454.0 470.4 491.5 506.3 508.0 521.8 538.4 ...............Net cash flow with inventory valuation and capital consumption adjustments ....................... 31 583.7 594.5 566.6 583.9 618.6 635.9 633.8 651.1 657.8 674.6 678.9 ...............
Undistributed profits with inventory valuation and capital consumption adjustments ......... 32 175.5 181.3 148.1 158.1 187.2 196.0 190.8 202.6 202.3 212.6 211.5 ...............Consumption of fixed capital ................................................................................................ 33 408.2 413.1 418.4 425.8 431.4 439.9 443.0 448.5 455.5 462.0 467.4 472.1
Less: Inventory valuation adjustment ........................................................................................ 34 –21.2 –23.6 –50.3 –37.8 –9.3 .4 –5.1 –5.4 –2.7 3.3 3.5 18.1Equals: Net cash flow ............................................................................................................... 35 604.9 618.1 616.9 621.7 627.9 635.5 638.9 656.5 660.5 671.3 675.5 ...............

• August
Table 1.15.—National Income by Sector, Legal Form of Organization, and Type of Income[Billions of dollars]
Line 1992 1993 1994 1995 1996
National income ............................................................................................................................. 1 4,990.4 5,266.8 5,590.7 5,912.3 6,254.5
Domestic business ..................................................................................................................................... 2 4,029.4 4,257.3 4,555.3 4,838.8 5,142.9
Corporate business .................................................................................................................................. 3 2,865.9 3,035.0 3,266.0 3,480.0 3,708.7Compensation of employees ............................................................................................................... 4 2,387.7 2,500.7 2,642.0 2,781.1 2,926.7
Wage and salary accruals .............................................................................................................. 5 1,969.0 2,049.3 2,164.8 2,296.4 2,433.5Supplements to wages and salaries .............................................................................................. 6 418.7 451.4 477.2 484.7 493.2
Corporate profits with inventory valuation and capital consumption adjustments ............................ 7 363.1 419.0 497.1 563.2 640.0Profits before tax ............................................................................................................................. 8 341.5 391.6 461.8 535.9 580.7Inventory valuation adjustment ....................................................................................................... 9 –7.5 –8.5 –16.1 –24.3 –2.5Capital consumption adjustment ..................................................................................................... 10 29.1 36.0 51.4 51.6 61.8
Net interest ........................................................................................................................................... 11 115.1 115.3 126.9 135.6 142.1
Sole proprietorships and partnerships ..................................................................................................... 12 708.8 748.9 790.4 827.4 874.9Compensation of employees ............................................................................................................... 13 212.6 229.7 244.5 264.9 286.1
Wage and salary accruals .............................................................................................................. 14 184.2 199.5 213.1 231.6 251.3Supplements to wages and salaries .............................................................................................. 15 28.4 30.2 31.5 33.3 34.8
Proprietors’ income with inventory valuation and capital consumption adjustments ........................ 16 421.1 448.0 468.6 486.1 517.3Farm ................................................................................................................................................. 17 37.1 32.4 36.9 23.4 37.2
Proprietors’ income with inventory valuation adjustment .......................................................... 18 45.2 40.4 44.8 31.4 45.0Capital consumption adjustment ................................................................................................. 19 –8.1 –8.0 –7.9 –7.9 –7.8
Nonfarm ........................................................................................................................................... 20 384.0 415.6 431.7 462.7 480.1Proprietors’ income ..................................................................................................................... 21 359.8 389.2 411.3 435.3 451.6Inventory valuation adjustment ................................................................................................... 22 –.7 –1.1 –.6 –.5 –.2Capital consumption adjustment ................................................................................................. 23 25.0 27.5 21.0 27.9 28.7
Net interest ........................................................................................................................................... 24 75.1 71.2 77.2 76.4 71.5
Other private business ............................................................................................................................. 25 373.7 391.8 412.8 442.5 467.9Compensation of employees ............................................................................................................... 26 13.7 14.2 14.6 14.8 15.4
Wage and salary accruals .............................................................................................................. 27 12.0 12.4 12.7 13.0 13.5Supplements to wages and salaries .............................................................................................. 28 1.8 1.9 1.9 1.9 1.9
Proprietors’ income with inventory valuation and capital consumption adjustments ........................ 29 2.6 2.8 3.0 2.8 3.0Proprietors’ income with inventory valuation adjustment ............................................................... 30 3.3 3.5 3.6 3.5 3.7Capital consumption adjustment ..................................................................................................... 31 –.7 –.7 –.7 –.7 –.7
Rental income of persons with capital consumption adjustment ....................................................... 32 79.4 105.7 124.4 132.8 146.3Rental income of persons ............................................................................................................... 33 127.5 148.5 172.0 179.8 193.3Capital consumption adjustment ..................................................................................................... 34 –48.1 –42.8 –47.6 –47.0 –47.0
Net interest ........................................................................................................................................... 35 277.9 269.0 270.8 292.1 303.2
Government enterprises ........................................................................................................................... 36 81.0 81.6 86.2 88.9 91.4Compensation of employees ............................................................................................................... 37 81.0 81.6 86.2 88.9 91.4
Wage and salary accruals .............................................................................................................. 38 59.8 59.8 63.0 64.9 66.7Supplements to wages and salaries .............................................................................................. 39 21.3 21.8 23.2 24.0 24.7
Households and institutions ..................................................................................................................... 40 279.1 296.5 312.7 331.8 346.0
Compensation of employees ................................................................................................................... 41 279.1 296.5 312.7 331.8 346.0Wage and salary accruals ................................................................................................................... 42 237.7 250.6 263.8 281.1 295.3Supplements to wages and salaries ................................................................................................... 43 41.3 45.8 49.0 50.6 50.8
General government ................................................................................................................................... 44 670.8 694.2 714.5 736.5 763.9
Compensation of employees ................................................................................................................... 45 670.8 694.2 714.5 736.5 763.9Wage and salary accruals ................................................................................................................... 46 508.0 524.5 539.2 558.1 575.9Supplements to wages and salaries ................................................................................................... 47 162.8 169.7 175.2 178.4 188.0
Rest of the world ........................................................................................................................................ 48 11.1 18.7 8.2 5.2 1.7
Compensation of employees ................................................................................................................... 49 –.1 –2.1 –2.5 –2.5 –2.6Corporate profits ....................................................................................................................................... 50 64.9 73.9 73.4 86.7 95.9Net interest ............................................................................................................................................... 51 –53.8 –53.0 –62.7 –78.9 –91.7
Addenda:Domestic income (1-48) ........................................................................................................................... 52 4,979.3 5,248.0 5,582.5 5,907.1 6,252.8
Compensation of employees (4+13+26+37+41+45) ........................................................................... 53 3,645.0 3,817.0 4,014.5 4,218.0 4,429.5Proprietors’ income with inventory valuation and capital consumption adjustments (16+29) .......... 54 423.8 450.8 471.6 489.0 520.3Rental income of persons with capital consumption adjustment (32) ............................................... 55 79.4 105.7 124.4 132.8 146.3Corporate profits with inventory valuation and capital consumption adjustments (7) ....................... 56 363.1 419.0 497.1 563.2 640.0Net interest (11+24+35) ....................................................................................................................... 57 468.1 455.5 475.0 504.1 516.7
.

August •
Table 1.16.—Gross Domestic Product of Corporate Business in Current Dollars and Gross Domestic Product of Nonfinancial Corporate Business inCurrent and Chained Dollars
[Billions of dollars]
Line 1992 1993 1994 1995 1996
Seasonally adjusted at annual rates
1992 1993 1994
IV I II III IV I II
Billions of dollars
Gross domestic product of corporate business ............................................................. 1 3,616.2 3,820.8 4,107.6 4,348.5 4,624.9 3,705.7 3,720.3 3,789.1 3,837.2 3,936.5 3,993.2 4,068.3
Consumption of fixed capital ......................................................................................................... 2 376.4 388.4 412.3 428.9 452.3 376.3 383.0 385.0 393.0 392.6 425.3 402.8
Net domestic product ..................................................................................................................... 3 3,239.8 3,432.4 3,695.2 3,919.6 4,172.6 3,329.4 3,337.3 3,404.1 3,444.2 3,543.9 3,568.0 3,665.5Indirect business tax and nontax liability plus business transfer payments less subsidies ... 4 373.9 397.4 429.2 439.6 463.9 385.5 386.3 392.4 398.7 412.1 420.6 426.4Domestic income ....................................................................................................................... 5 2,865.9 3,035.0 3,266.0 3,480.0 3,708.7 2,943.9 2,951.0 3,011.7 3,045.5 3,131.8 3,147.4 3,239.1
Compensation of employees ................................................................................................ 6 2,387.7 2,500.7 2,642.0 2,781.1 2,926.7 2,435.7 2,456.5 2,488.9 2,514.5 2,543.1 2,588.9 2,625.1Wage and salary accruals ................................................................................................ 7 1,969.0 2,049.3 2,164.8 2,296.4 2,433.5 2,005.2 2,015.3 2,040.4 2,060.0 2,081.7 2,119.0 2,148.9Supplements to wages and salaries ................................................................................ 8 418.7 451.4 477.2 484.7 493.2 430.5 441.2 448.5 454.5 461.4 469.9 476.2
Corporate profits with inventory valuation and capital consumption adjustments .............. 9 363.1 419.0 497.1 563.2 640.0 395.3 379.6 408.3 415.7 472.3 440.0 489.7Profits before tax .............................................................................................................. 10 341.5 391.6 461.8 535.9 580.7 361.0 352.2 391.6 382.5 439.9 403.2 453.0
Profits tax liability ......................................................................................................... 11 143.0 165.2 186.6 213.2 229.0 149.7 149.2 165.4 161.2 184.9 163.0 182.8Profits after tax ............................................................................................................. 12 198.5 226.4 275.1 322.7 351.6 211.4 203.0 226.2 221.3 255.0 240.2 270.2
Dividends .................................................................................................................. 13 146.0 174.9 184.4 236.9 270.8 163.0 170.9 171.4 174.6 182.9 175.4 184.8Undistributed profits ................................................................................................. 14 52.4 51.4 90.7 85.8 80.8 48.3 32.1 54.8 46.7 72.2 64.8 85.4
Inventory valuation adjustment ......................................................................................... 15 –7.5 –8.5 –16.1 –24.3 –2.5 .2 –12.5 –17.1 .2 –4.8 –4.3 –15.1Capital consumption adjustment ...................................................................................... 16 29.1 36.0 51.4 51.6 61.8 34.1 40.0 33.8 33.0 37.1 41.2 51.8
Net interest ............................................................................................................................ 17 115.1 115.3 126.9 135.6 142.1 112.9 114.9 114.6 115.3 116.5 118.5 124.3
Gross domestic product of financial corporate business ............................................ 18 353.5 390.4 397.8 443.2 492.5 363.9 368.6 388.8 392.9 411.3 368.8 399.4
Gross domestic product of nonfinancial corporate business ...................................... 19 3,262.6 3,430.4 3,709.7 3,905.3 4,132.4 3,341.7 3,351.8 3,400.3 3,444.3 3,525.2 3,624.5 3,668.9
Consumption of fixed capital ......................................................................................................... 20 330.5 340.3 360.7 373.4 393.4 329.7 335.8 337.3 344.5 343.4 375.1 351.6
Net domestic product ..................................................................................................................... 21 2,932.2 3,090.1 3,349.0 3,531.9 3,739.0 3,012.0 3,015.9 3,063.0 3,099.8 3,181.9 3,249.3 3,317.3Indirect business tax and nontax liability plus business transfer payments less subsidies ... 22 337.0 358.5 389.0 399.8 421.8 348.0 348.2 353.8 359.7 372.3 380.4 386.1Domestic income ....................................................................................................................... 23 2,595.1 2,731.6 2,960.1 3,132.1 3,317.2 2,664.0 2,667.7 2,709.2 2,740.1 2,809.6 2,868.9 2,931.1
Compensation of employees ................................................................................................ 24 2,195.3 2,290.7 2,426.7 2,555.5 2,682.9 2,236.1 2,253.5 2,279.9 2,301.5 2,327.8 2,372.5 2,409.8Wage and salary accruals ................................................................................................ 25 1,808.9 1,874.0 1,985.4 2,107.9 2,228.6 1,839.3 1,846.1 1,865.9 1,882.0 1,901.9 1,938.6 1,969.6Supplements to wages and salaries ................................................................................ 26 386.5 416.7 441.2 447.5 454.4 396.8 407.3 413.9 419.4 426.0 433.9 440.2
Corporate profits with inventory valuation and capital consumption adjustments .............. 27 295.6 346.4 437.1 474.6 545.8 328.2 316.0 334.4 345.5 389.9 405.4 427.0Profits before tax .............................................................................................................. 28 257.8 308.6 392.3 438.3 477.2 277.9 275.6 306.9 303.1 349.0 359.1 380.7
Profits tax liability ......................................................................................................... 29 91.1 105.0 128.8 139.4 154.8 98.4 92.5 104.7 102.9 120.0 119.5 124.6Profits after tax ............................................................................................................. 30 166.7 203.6 263.5 298.9 322.4 179.5 183.1 202.2 200.2 228.9 239.6 256.1
Dividends .................................................................................................................. 31 133.6 147.7 158.6 188.3 196.4 146.3 143.5 144.2 147.6 155.6 150.4 158.7Undistributed profits ................................................................................................. 32 33.1 55.9 104.9 110.6 126.0 33.2 39.6 58.0 52.5 73.4 89.2 97.4
Inventory valuation adjustment ......................................................................................... 33 –7.5 –8.5 –16.1 –24.3 –2.5 .2 –12.5 –17.1 .2 –4.8 –4.3 –15.1Capital consumption adjustment ...................................................................................... 34 45.3 46.3 60.8 60.5 71.1 50.1 52.9 44.5 42.2 45.7 50.6 61.4
Net interest ............................................................................................................................ 35 104.2 94.5 96.3 102.0 88.5 99.7 98.2 95.0 93.1 91.9 91.1 94.3
Billions of chained (1992) dollars
Gross domestic product of nonfinancial corporate business 1 ................................... 36 3,262.6 3,374.4 3,586.3 3,719.7 3,887.8 3,328.2 3,310.2 3,352.5 3,387.2 3,447.7 3,526.1 3,559.8
Consumption of fixed capital 2 ....................................................................................................... 37 330.5 335.1 349.8 357.8 374.4 328.6 332.7 331.9 339.8 336.1 366.0 341.3Net domestic product 3 .................................................................................................................. 38 2,932.2 3,039.3 3,236.5 3,361.9 3,513.5 2,999.6 2,977.5 3,020.6 3,047.3 3,111.6 3,160.0 3,218.5
See footnotes at end of table.

• August
Table 1.16.—Gross Domestic Product of Corporate Business in Current Dollars and Gross Domestic Product of Nonfinancial Corporate Business inCurrent and Chained Dollars—Continued
[Billions of dollars]
Line
Seasonally adjusted at annual rates
1994 1995 1996 1997
III IV I II III IV I II III IV I II
Billions of dollars
Gross domestic product of corporate business ............................................................. 1 4,138.5 4,230.2 4,260.2 4,297.8 4,395.9 4,440.0 4,503.3 4,601.8 4,661.0 4,733.2 4,824.8 ...............
Consumption of fixed capital ......................................................................................................... 2 408.2 413.1 418.4 425.8 431.4 439.9 443.0 448.5 455.5 462.0 467.4 472.1
Net domestic product ..................................................................................................................... 3 3,730.3 3,817.1 3,841.7 3,872.1 3,964.5 4,000.1 4,060.3 4,153.3 4,205.5 4,271.2 4,357.4 ...............Indirect business tax and nontax liability plus business transfer payments less subsidies ... 4 432.6 437.4 435.9 437.3 441.0 444.2 451.6 458.0 460.9 485.0 465.9 474.6Domestic income ....................................................................................................................... 5 3,297.7 3,379.7 3,405.8 3,434.8 3,523.5 3,555.9 3,608.7 3,695.3 3,744.6 3,786.2 3,891.5 ...............
Compensation of employees ................................................................................................ 6 2,652.5 2,701.4 2,740.1 2,761.1 2,796.2 2,826.9 2,846.9 2,910.4 2,951.4 2,997.9 3,056.5 3,098.3Wage and salary accruals ................................................................................................ 7 2,173.7 2,217.6 2,256.6 2,277.9 2,310.9 2,340.1 2,359.8 2,417.2 2,456.3 2,500.7 2,550.7 2,588.1Supplements to wages and salaries ................................................................................ 8 478.7 483.9 483.5 483.2 485.3 486.8 487.2 493.2 495.1 497.3 505.8 510.2
Corporate profits with inventory valuation and capital consumption adjustments .............. 9 515.9 542.6 529.7 537.6 592.4 593.2 626.6 645.2 647.8 640.3 682.2 ...............Profits before tax .............................................................................................................. 10 482.0 508.8 527.2 524.6 550.2 541.7 573.8 589.0 587.4 572.5 611.0 ...............
Profits tax liability ......................................................................................................... 11 194.6 206.2 209.6 209.1 218.8 215.3 226.2 232.2 231.6 226.0 241.2 ...............Profits after tax ............................................................................................................. 12 287.3 302.7 317.5 315.5 331.4 326.4 347.6 356.8 355.7 346.5 369.8 ...............
Dividends .................................................................................................................. 13 181.8 195.6 223.5 232.9 243.8 247.5 270.4 265.8 265.6 281.6 292.7 ...............Undistributed profits ................................................................................................. 14 105.5 107.1 94.0 82.6 87.5 78.9 77.2 91.0 90.1 64.9 77.1 ...............
Inventory valuation adjustment ......................................................................................... 15 –21.2 –23.6 –50.3 –37.8 –9.3 .4 –5.1 –5.4 –2.7 3.3 3.5 18.1Capital consumption adjustment ...................................................................................... 16 55.1 57.4 52.9 50.8 51.5 51.1 57.9 61.6 63.2 64.4 67.7 69.9
Net interest ............................................................................................................................ 17 129.4 135.6 136.0 136.0 134.8 135.7 135.2 139.7 145.4 148.0 152.8 ...............
Gross domestic product of financial corporate business ............................................ 18 409.3 413.8 426.6 437.5 455.5 453.1 472.6 488.9 495.2 513.2 525.1 ...............
Gross domestic product of nonfinancial corporate business ...................................... 19 3,729.1 3,816.4 3,833.6 3,860.4 3,940.4 3,986.8 4,030.7 4,112.9 4,165.8 4,220.1 4,299.7 ...............
Consumption of fixed capital ......................................................................................................... 20 355.9 360.0 364.4 370.6 375.4 383.1 385.5 390.2 396.2 401.8 406.3 410.3
Net domestic product ..................................................................................................................... 21 3,373.2 3,456.4 3,469.2 3,489.8 3,564.9 3,603.7 3,645.2 3,722.7 3,769.7 3,818.3 3,893.4 ...............Indirect business tax and nontax liability plus business transfer payments less subsidies ... 22 392.3 397.1 395.7 397.1 401.3 405.2 413.2 420.2 423.7 430.0 432.2 437.2Domestic income ....................................................................................................................... 23 2,980.9 3,059.2 3,073.5 3,092.7 3,163.7 3,198.5 3,232.0 3,302.5 3,345.9 3,388.3 3,461.2 ...............
Compensation of employees ................................................................................................ 24 2,439.2 2,485.2 2,519.3 2,538.4 2,568.6 2,595.5 2,613.1 2,668.6 2,704.7 2,745.3 2,801.9 2,840.2Wage and salary accruals ................................................................................................ 25 1,996.1 2,037.4 2,072.5 2,092.0 2,120.7 2,146.5 2,163.8 2,214.2 2,248.7 2,287.5 2,335.8 2,370.1Supplements to wages and salaries ................................................................................ 26 443.1 447.8 446.8 446.4 447.9 449.0 449.3 454.4 456.0 457.8 466.0 470.1
Corporate profits with inventory valuation and capital consumption adjustments .............. 27 444.1 472.0 449.0 450.3 494.3 504.8 525.4 542.8 553.3 561.7 575.4 ...............Profits before tax .............................................................................................................. 28 400.7 428.9 437.6 428.3 443.1 444.3 463.4 477.4 483.4 484.4 494.5 ...............
Profits tax liability ......................................................................................................... 29 130.1 141.1 140.8 135.3 140.1 141.5 149.2 154.1 156.8 159.0 159.4 ...............Profits after tax ............................................................................................................. 30 270.6 287.8 296.9 293.0 303.0 302.9 314.2 323.3 326.6 325.5 335.1 ...............
Dividends .................................................................................................................. 31 158.5 166.8 183.4 189.1 191.4 189.3 200.3 194.3 191.8 199.4 207.0 ...............Undistributed profits ................................................................................................. 32 112.1 121.0 113.5 103.9 111.6 113.6 113.9 129.1 134.8 126.1 128.2 ...............
Inventory valuation adjustment ......................................................................................... 33 –21.2 –23.6 –50.3 –37.8 –9.3 .4 –5.1 –5.4 –2.7 3.3 3.5 18.1Capital consumption adjustment ...................................................................................... 34 64.6 66.7 61.7 59.8 60.4 60.1 67.1 70.8 72.6 74.0 77.4 79.7
Net interest ............................................................................................................................ 35 97.6 102.1 105.2 104.0 100.8 98.2 93.5 91.2 88.0 81.3 83.9 ...............
Billions of chained (1992) dollars
Gross domestic product of nonfinancial corporate business 1 ................................... 36 3,594.6 3,664.9 3,664.9 3,683.2 3,747.7 3,782.9 3,801.8 3,872.4 3,913.7 3,963.5 4,022.2 ...............
Consumption of fixed capital 2 ....................................................................................................... 37 344.3 347.6 351.2 355.0 359.0 365.8 367.3 371.8 376.6 381.7 396.0 402.2Net domestic product 3 .................................................................................................................. 38 3,250.3 3,317.3 3,313.7 3,328.1 3,388.8 3,417.2 3,434.5 3,500.6 3,537.1 3,581.8 3,626.2 ...............
1. Chained-dollar gross domestic product of nonfinancial corporate business equals the current-dollar product de-flated by the implicit price deflator for goods and structures in gross domestic product.
2. Chained-dollar consumption of fixed capital of nonfinancial corporate business is calculated as the product of
the chain-type quantity index and the 1992 current-dollar value of the corresponding series, divided by 100.3. Chained-dollar net domestic product of nonfinancial corporate business is the difference between the gross
product and the consumption of fixed capital.

August •
. Personal Income and Outlays
Table 2.1.—Personal Income and Its Disposition[Billions of dollars]
Line 1992 1993 1994 1995 1996
Seasonally adjusted at annual rates
1992 1993 1994
IV I II III IV I II
Personal income .......................................................................................................................... 1 5,277.2 5,519.2 5,791.8 6,150.8 6,495.2 5,429.3 5,369.4 5,504.1 5,544.2 5,659.1 5,616.3 5,766.6
Wage and salary disbursements ........................................................................................... 2 2,986.4 3,089.6 3,240.7 3,429.5 3,632.5 3,084.7 2,975.4 3,079.3 3,111.1 3,192.6 3,138.3 3,232.0Private industries ................................................................................................................... 3 2,418.6 2,505.3 2,638.5 2,806.5 2,989.9 2,512.2 2,394.4 2,497.8 2,524.8 2,604.2 2,542.3 2,630.7
Goods-producing industries .............................................................................................. 4 765.7 781.2 824.4 864.4 909.1 783.6 749.7 779.9 786.5 808.6 797.1 820.5Manufacturing ............................................................................................................... 5 583.5 592.9 620.8 648.4 674.7 599.7 566.7 592.8 597.2 614.9 600.7 618.4
Distributive industries ........................................................................................................ 6 680.3 699.4 741.4 783.1 823.3 699.9 677.5 697.7 704.3 718.2 715.8 737.9Service industries .............................................................................................................. 7 972.6 1,024.7 1,072.7 1,159.0 1,257.5 1,028.6 967.2 1,020.2 1,034.0 1,077.4 1,029.4 1,072.3
Government ........................................................................................................................... 8 567.8 584.3 602.2 623.0 642.6 572.5 581.1 581.5 586.3 588.4 596.0 601.3
Other labor income ................................................................................................................. 9 351.3 385.1 405.0 406.8 407.6 361.1 373.8 382.3 389.5 394.9 399.5 403.7
Proprietors’ income with inventory valuation and capital consumption adjustments 10 423.8 450.8 471.6 489.0 520.3 437.4 440.3 452.2 446.2 464.4 463.9 474.7Farm ....................................................................................................................................... 11 37.1 32.4 36.9 23.4 37.2 36.5 29.7 36.3 25.6 38.0 46.4 38.8Nonfarm ................................................................................................................................. 12 386.7 418.4 434.7 465.5 483.1 401.0 410.6 416.0 420.6 426.5 417.5 435.9
Rental income of persons with capital consumption adjustment .................................... 13 79.4 105.7 124.4 132.8 146.3 91.2 99.7 105.6 106.1 111.5 112.7 126.0
Personal dividend income ...................................................................................................... 14 159.4 185.3 204.8 251.9 291.2 170.1 177.8 182.1 187.8 193.5 192.1 200.3
Personal interest income ........................................................................................................ 15 667.2 651.0 668.1 718.9 735.7 660.4 660.3 653.7 647.8 642.1 641.4 656.4
Transfer payments to persons .............................................................................................. 16 858.2 912.0 954.7 1,015.0 1,068.0 875.8 897.2 908.0 917.3 925.3 940.4 949.8Old-age, survivors, disability, and health insurance benefits .............................................. 17 414.0 444.4 473.0 507.8 537.6 421.5 437.6 441.9 446.4 451.8 463.3 470.4Government unemployment insurance benefits ................................................................... 18 38.9 34.0 23.6 21.4 22.0 37.1 34.5 34.4 34.7 32.6 27.7 23.9Veterans benefits ................................................................................................................... 19 19.3 20.2 20.2 20.8 21.6 19.1 20.0 20.5 20.3 19.8 20.0 20.1Government employees retirement benefits ......................................................................... 20 109.0 116.6 124.5 133.6 142.5 110.5 114.2 115.9 117.4 119.0 120.5 123.8Other transfer payments ....................................................................................................... 21 277.1 296.8 313.5 331.4 344.2 287.7 291.0 295.4 298.6 302.1 308.9 311.6
Family assistance 1 ........................................................................................................... 22 23.3 24.0 24.3 23.3 21.7 23.5 23.7 24.0 24.0 24.2 24.3 24.3Other .................................................................................................................................. 23 253.8 272.8 289.3 308.0 322.5 264.2 267.3 271.4 274.6 277.9 284.6 287.3
Less: Personal contributions for social insurance ............................................................ 24 248.4 260.3 277.5 293.1 306.3 251.4 255.2 259.2 261.6 265.2 272.0 276.2
Less: Personal tax and nontax payments ................................................................................ 25 650.5 690.0 739.1 795.1 886.9 674.8 662.5 685.6 695.5 716.4 712.9 750.5
Equals: Disposable personal income ........................................................................................ 26 4,626.7 4,829.2 5,052.7 5,355.7 5,608.3 4,754.5 4,707.0 4,818.5 4,848.7 4,942.8 4,903.4 5,016.1
Less: Personal outlays ................................................................................................................ 27 4,341.0 4,580.7 4,842.1 5,101.1 5,368.8 4,450.0 4,488.4 4,549.5 4,609.8 4,675.2 4,738.2 4,803.3
Personal consumption expenditures ......................................................................................... 28 4,219.8 4,459.2 4,717.0 4,957.7 5,207.6 4,329.6 4,365.4 4,428.1 4,488.6 4,554.9 4,616.6 4,680.5Interest paid by persons ............................................................................................................ 29 111.7 108.2 110.9 128.5 145.2 110.4 110.0 108.3 107.9 106.6 107.6 108.7Personal transfer payments to the rest of the world (net) ...................................................... 30 9.6 13.3 14.2 14.8 15.9 9.9 13.1 13.1 13.4 13.7 14.0 14.1
Equals: Personal saving ............................................................................................................. 31 285.6 248.5 210.6 254.6 239.6 304.5 218.6 269.0 239.0 267.6 165.2 212.8
Addenda:Disposable personal income:
Total, billions of chained (1992) dollars 2 ............................................................................. 32 4,626.7 4,703.9 4,805.1 4,964.2 5,076.9 4,702.5 4,622.3 4,703.9 4,716.9 4,772.5 4,715.3 4,792.8Per capita:
Current dollars ................................................................................................................... 33 18,113 18,706 19,381 20,349 21,117 18,533 18,304 18,692 18,756 19,070 18,878 19,267Chained (1992) dollars ..................................................................................................... 34 18,113 18,221 18,431 18,861 19,116 18,330 17,975 18,247 18,246 18,413 18,154 18,409
Population (mid-period, millions) ........................................................................................... 35 255.4 258.2 260.7 263.2 265.6 256.5 257.2 257.8 258.5 259.2 259.7 260.4
Personal saving as a percentage of disposable personal income .................................. 36 6.2 5.1 4.2 4.8 4.3 6.4 4.6 5.6 4.9 5.4 3.4 4.2
See footnotes at end of table.

• August
Table 2.1.—Personal Income and Its Disposition—Continued[Billions of dollars]
Line
Seasonally adjusted at annual rates
1994 1995 1996 1997
III IV I II III IV I II III IV I II
Personal income .......................................................................................................................... 1 5,838.1 5,946.1 6,053.1 6,114.8 6,179.1 6,256.2 6,359.4 6,461.3 6,541.9 6,618.4 6,746.2 6,830.0
Wage and salary disbursements ........................................................................................... 2 3,266.9 3,325.6 3,371.2 3,404.6 3,450.2 3,491.8 3,539.2 3,611.2 3,662.8 3,716.9 3,791.5 3,841.5Private industries ................................................................................................................... 3 2,663.4 2,717.5 2,754.0 2,783.5 2,825.1 2,863.3 2,903.6 2,970.9 3,017.3 3,067.9 3,133.7 3,179.8
Goods-producing industries .............................................................................................. 4 832.9 847.2 854.8 858.5 867.7 876.4 884.9 906.3 917.2 927.8 942.9 953.3Manufacturing ............................................................................................................... 5 626.9 637.1 643.4 644.5 650.2 655.3 659.1 674.1 680.1 685.6 694.1 700.7
Distributive industries ........................................................................................................ 6 748.0 763.6 769.9 778.7 788.4 795.5 804.4 819.2 829.0 840.6 856.8 866.8Service industries .............................................................................................................. 7 1,082.5 1,106.7 1,129.3 1,146.3 1,169.0 1,191.4 1,214.3 1,245.3 1,271.1 1,299.5 1,334.1 1,359.6
Government ........................................................................................................................... 8 603.5 608.0 617.2 621.1 625.1 628.5 635.6 640.3 645.5 648.9 657.8 661.7
Other labor income ................................................................................................................. 9 406.9 409.8 407.9 406.6 406.7 406.2 405.0 407.9 408.4 409.1 412.3 415.1
Proprietors’ income with inventory valuation and capital consumption adjustments 10 471.6 476.1 478.2 484.4 491.7 501.5 509.3 520.0 523.8 528.3 534.6 543.6Farm ....................................................................................................................................... 11 33.2 29.1 20.6 21.3 22.9 28.9 31.9 36.5 40.1 40.4 40.2 44.5Nonfarm ................................................................................................................................. 12 438.4 447.0 457.6 463.1 468.7 472.6 477.4 483.5 483.7 487.9 494.4 499.1
Rental income of persons with capital consumption adjustment .................................... 13 130.1 128.9 130.5 132.3 131.5 137.1 143.4 144.6 148.0 149.2 149.0 148.6
Personal dividend income ...................................................................................................... 14 208.5 218.5 243.4 248.6 254.2 261.5 287.4 290.0 292.0 295.2 312.5 318.3
Personal interest income ........................................................................................................ 15 674.1 700.4 713.9 719.4 717.9 724.2 722.3 727.8 742.7 749.8 757.2 766.8
Transfer payments to persons .............................................................................................. 16 958.8 969.8 997.0 1,010.4 1,021.5 1,031.0 1,053.2 1,064.8 1,072.4 1,081.5 1,107.2 1,117.5Old-age, survivors, disability, and health insurance benefits .............................................. 17 475.8 482.4 498.4 505.8 511.1 516.0 529.5 535.4 540.0 545.6 558.9 564.4Government unemployment insurance benefits ................................................................... 18 21.6 20.9 21.0 21.0 21.8 22.0 23.0 22.1 21.3 21.6 22.1 21.9Veterans benefits ................................................................................................................... 19 20.5 20.1 20.7 20.8 21.1 20.5 21.4 21.9 21.7 21.4 22.4 22.3Government employees retirement benefits ......................................................................... 20 125.9 127.6 130.0 132.9 134.8 136.6 138.3 142.2 143.7 145.9 150.4 152.7Other transfer payments ....................................................................................................... 21 315.0 318.7 326.9 329.8 332.8 335.9 340.9 343.3 345.7 347.0 353.5 356.1
Family assistance 1 ........................................................................................................... 22 24.4 24.2 23.9 23.5 23.2 22.8 22.5 22.0 21.6 20.7 19.7 19.4Other .................................................................................................................................. 23 290.7 294.5 303.1 306.3 309.6 313.2 318.5 321.3 324.2 326.2 333.8 336.8
Less: Personal contributions for social insurance ............................................................ 24 278.8 282.9 289.1 291.5 294.5 297.2 300.5 305.0 308.2 311.5 318.2 321.3
Less: Personal tax and nontax payments ................................................................................ 25 739.9 753.0 766.5 795.1 798.9 820.0 840.0 887.8 897.3 922.6 955.7 982.0
Equals: Disposable personal income ........................................................................................ 26 5,098.2 5,193.1 5,286.6 5,319.6 5,380.2 5,436.2 5,519.4 5,573.5 5,644.6 5,695.8 5,790.5 5,848.0
Less: Personal outlays ................................................................................................................ 27 4,876.1 4,950.7 5,007.3 5,074.3 5,136.4 5,186.3 5,261.3 5,347.8 5,390.6 5,475.4 5,574.6 5,600.1
Personal consumption expenditures ......................................................................................... 28 4,750.6 4,820.2 4,871.7 4,934.8 4,990.6 5,033.8 5,105.8 5,189.1 5,227.4 5,308.1 5,405.7 5,429.8Interest paid by persons ............................................................................................................ 29 111.4 116.1 121.1 125.2 130.9 137.1 140.1 143.0 147.4 150.5 151.9 152.9Personal transfer payments to the rest of the world (net) ...................................................... 30 14.2 14.4 14.5 14.3 14.9 15.4 15.4 15.8 15.9 16.7 17.0 17.4
Equals: Personal saving ............................................................................................................. 31 222.1 242.4 279.2 245.4 243.8 249.9 258.1 225.7 254.0 220.4 215.9 247.9
Addenda:Disposable personal income:
Total, billions of chained (1992) dollars 2 ............................................................................. 32 4,827.3 4,884.9 4,938.9 4,940.9 4,973.0 5,003.9 5,047.6 5,061.3 5,094.8 5,103.8 5,161.1 5,199.7Per capita:
Current dollars ................................................................................................................... 33 19,530 19,844 20,160 20,239 20,416 20,579 20,853 21,012 21,229 21,373 21,689 21,858Chained (1992) dollars ..................................................................................................... 34 18,493 18,667 18,834 18,798 18,871 18,942 19,071 19,081 19,161 19,152 19,331 19,435
Population (mid-period, millions) ........................................................................................... 35 261.0 261.7 262.2 262.8 263.5 264.2 264.7 265.3 265.9 266.5 267.0 267.5
Personal saving as a percentage of disposable personal income .................................. 36 4.4 4.7 5.3 4.6 4.5 4.6 4.7 4.1 4.5 3.9 3.7 4.2
1. Consists of aid to families with dependent children and, beginning with 1996, assistance programs operatingunder the Personal Responsibility and Work Opportunity Reconciliation Act of 1996.
2. Equals disposable personal income deflated by the implicit price deflator for personal consumption expenditures.NOTE.—Percent changes from preceding period for selected items in this table are shown in table 8.1.
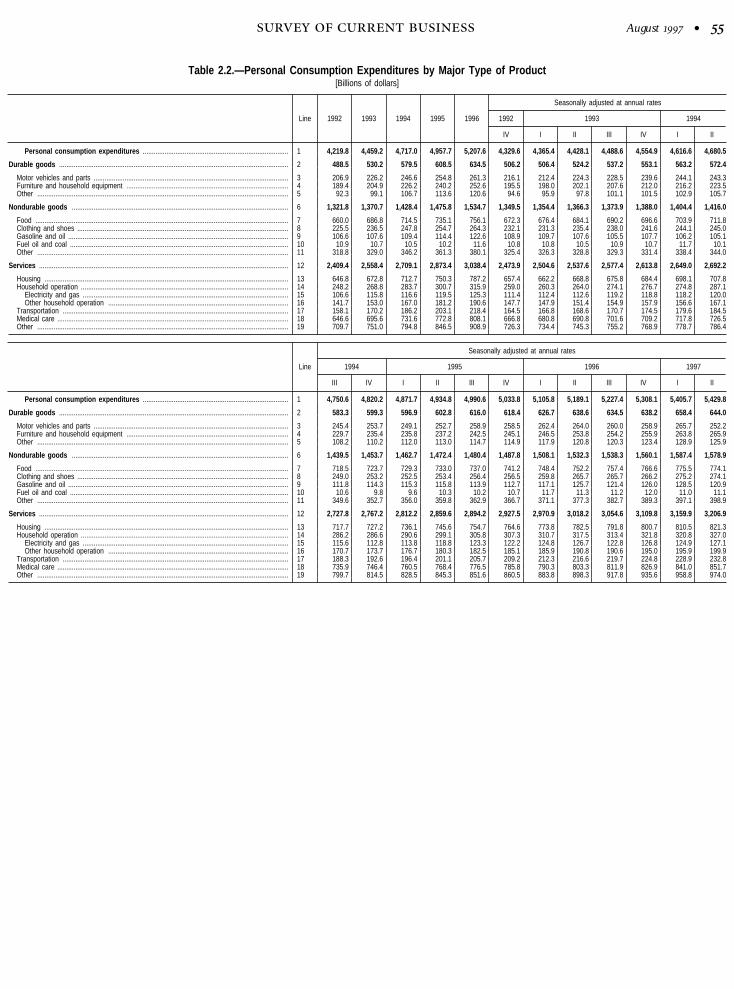
August •
Table 2.2.—Personal Consumption Expenditures by Major Type of Product[Billions of dollars]
Line 1992 1993 1994 1995 1996
Seasonally adjusted at annual rates
1992 1993 1994
IV I II III IV I II
Personal consumption expenditures ................................................................................ 1 4,219.8 4,459.2 4,717.0 4,957.7 5,207.6 4,329.6 4,365.4 4,428.1 4,488.6 4,554.9 4,616.6 4,680.5
Durable goods .............................................................................................................................. 2 488.5 530.2 579.5 608.5 634.5 506.2 506.4 524.2 537.2 553.1 563.2 572.4
Motor vehicles and parts ........................................................................................................... 3 206.9 226.2 246.6 254.8 261.3 216.1 212.4 224.3 228.5 239.6 244.1 243.3Furniture and household equipment ......................................................................................... 4 189.4 204.9 226.2 240.2 252.6 195.5 198.0 202.1 207.6 212.0 216.2 223.5Other .......................................................................................................................................... 5 92.3 99.1 106.7 113.6 120.6 94.6 95.9 97.8 101.1 101.5 102.9 105.7
Nondurable goods ....................................................................................................................... 6 1,321.8 1,370.7 1,428.4 1,475.8 1,534.7 1,349.5 1,354.4 1,366.3 1,373.9 1,388.0 1,404.4 1,416.0
Food ........................................................................................................................................... 7 660.0 686.8 714.5 735.1 756.1 672.3 676.4 684.1 690.2 696.6 703.9 711.8Clothing and shoes .................................................................................................................... 8 225.5 236.5 247.8 254.7 264.3 232.1 231.3 235.4 238.0 241.6 244.1 245.0Gasoline and oil ......................................................................................................................... 9 106.6 107.6 109.4 114.4 122.6 108.9 109.7 107.6 105.5 107.7 106.2 105.1Fuel oil and coal ........................................................................................................................ 10 10.9 10.7 10.5 10.2 11.6 10.8 10.8 10.5 10.9 10.7 11.7 10.1Other .......................................................................................................................................... 11 318.8 329.0 346.2 361.3 380.1 325.4 326.3 328.8 329.3 331.4 338.4 344.0
Services ......................................................................................................................................... 12 2,409.4 2,558.4 2,709.1 2,873.4 3,038.4 2,473.9 2,504.6 2,537.6 2,577.4 2,613.8 2,649.0 2,692.2
Housing ...................................................................................................................................... 13 646.8 672.8 712.7 750.3 787.2 657.4 662.2 668.8 675.8 684.4 698.1 707.8Household operation .................................................................................................................. 14 248.2 268.8 283.7 300.7 315.9 259.0 260.3 264.0 274.1 276.7 274.8 287.1
Electricity and gas ................................................................................................................. 15 106.6 115.8 116.6 119.5 125.3 111.4 112.4 112.6 119.2 118.8 118.2 120.0Other household operation ................................................................................................... 16 141.7 153.0 167.0 181.2 190.6 147.7 147.9 151.4 154.9 157.9 156.6 167.1
Transportation ............................................................................................................................ 17 158.1 170.2 186.2 203.1 218.4 164.5 166.8 168.6 170.7 174.5 179.6 184.5Medical care ............................................................................................................................... 18 646.6 695.6 731.6 772.8 808.1 666.8 680.8 690.8 701.6 709.2 717.8 726.5Other .......................................................................................................................................... 19 709.7 751.0 794.8 846.5 908.9 726.3 734.4 745.3 755.2 768.9 778.7 786.4
Line
Seasonally adjusted at annual rates
1994 1995 1996 1997
III IV I II III IV I II III IV I II
Personal consumption expenditures ................................................................................ 1 4,750.6 4,820.2 4,871.7 4,934.8 4,990.6 5,033.8 5,105.8 5,189.1 5,227.4 5,308.1 5,405.7 5,429.8
Durable goods .............................................................................................................................. 2 583.3 599.3 596.9 602.8 616.0 618.4 626.7 638.6 634.5 638.2 658.4 644.0
Motor vehicles and parts ........................................................................................................... 3 245.4 253.7 249.1 252.7 258.9 258.5 262.4 264.0 260.0 258.9 265.7 252.2Furniture and household equipment ......................................................................................... 4 229.7 235.4 235.8 237.2 242.5 245.1 246.5 253.8 254.2 255.9 263.8 265.9Other .......................................................................................................................................... 5 108.2 110.2 112.0 113.0 114.7 114.9 117.9 120.8 120.3 123.4 128.9 125.9
Nondurable goods ....................................................................................................................... 6 1,439.5 1,453.7 1,462.7 1,472.4 1,480.4 1,487.8 1,508.1 1,532.3 1,538.3 1,560.1 1,587.4 1,578.9
Food ........................................................................................................................................... 7 718.5 723.7 729.3 733.0 737.0 741.2 748.4 752.2 757.4 766.6 775.5 774.1Clothing and shoes .................................................................................................................... 8 249.0 253.2 252.5 253.4 256.4 256.5 259.8 265.7 265.7 266.2 275.2 274.1Gasoline and oil ......................................................................................................................... 9 111.8 114.3 115.3 115.8 113.9 112.7 117.1 125.7 121.4 126.0 128.5 120.9Fuel oil and coal ........................................................................................................................ 10 10.6 9.8 9.6 10.3 10.2 10.7 11.7 11.3 11.2 12.0 11.0 11.1Other .......................................................................................................................................... 11 349.6 352.7 356.0 359.8 362.9 366.7 371.1 377.3 382.7 389.3 397.1 398.9
Services ......................................................................................................................................... 12 2,727.8 2,767.2 2,812.2 2,859.6 2,894.2 2,927.5 2,970.9 3,018.2 3,054.6 3,109.8 3,159.9 3,206.9
Housing ...................................................................................................................................... 13 717.7 727.2 736.1 745.6 754.7 764.6 773.8 782.5 791.8 800.7 810.5 821.3Household operation .................................................................................................................. 14 286.2 286.6 290.6 299.1 305.8 307.3 310.7 317.5 313.4 321.8 320.8 327.0
Electricity and gas ................................................................................................................. 15 115.6 112.8 113.8 118.8 123.3 122.2 124.8 126.7 122.8 126.8 124.9 127.1Other household operation ................................................................................................... 16 170.7 173.7 176.7 180.3 182.5 185.1 185.9 190.8 190.6 195.0 195.9 199.9
Transportation ............................................................................................................................ 17 188.3 192.6 196.4 201.1 205.7 209.2 212.3 216.6 219.7 224.8 228.9 232.8Medical care ............................................................................................................................... 18 735.9 746.4 760.5 768.4 776.5 785.8 790.3 803.3 811.9 826.9 841.0 851.7Other .......................................................................................................................................... 19 799.7 814.5 828.5 845.3 851.6 860.5 883.8 898.3 917.8 935.6 958.8 974.0

• August
Table 2.3.—Real Personal Consumption Expenditures by Major Type of Product[Billions of chained (1992) dollars]
Line 1992 1993 1994 1995 1996
Seasonally adjusted at annual rates
1992 1993 1994
IV I II III IV I II
Personal consumption expenditures ................................................................................ 1 4,219.8 4,343.6 4,486.0 4,595.3 4,714.1 4,282.3 4,286.8 4,322.8 4,366.6 4,398.0 4,439.4 4,472.2
Durable goods .............................................................................................................................. 2 488.5 523.8 561.2 583.6 611.1 505.0 504.0 519.3 529.9 542.1 550.7 555.8
Motor vehicles and parts ........................................................................................................... 3 206.9 218.9 230.0 229.5 231.3 213.9 209.1 218.4 219.8 228.4 231.6 228.4Furniture and household equipment ......................................................................................... 4 189.4 207.8 229.4 248.4 269.5 196.4 200.4 205.0 210.9 214.8 219.1 226.1Other .......................................................................................................................................... 5 92.3 97.2 102.3 107.2 113.3 94.6 94.6 95.9 99.3 99.0 100.0 101.6
Nondurable goods ....................................................................................................................... 6 1,321.8 1,351.0 1,389.9 1,412.6 1,432.3 1,339.8 1,337.5 1,347.8 1,356.8 1,361.8 1,378.4 1,385.5
Food ........................................................................................................................................... 7 660.0 675.3 687.9 690.5 689.7 668.6 670.1 674.1 677.9 679.2 684.3 689.8Clothing and shoes .................................................................................................................... 8 225.5 234.2 247.1 257.5 267.7 230.9 228.8 233.4 235.9 238.6 243.1 242.7Gasoline and oil ......................................................................................................................... 9 106.6 108.7 109.8 113.1 114.1 107.3 107.2 108.6 109.8 109.0 109.2 109.6Fuel oil and coal ........................................................................................................................ 10 10.9 10.7 10.7 10.5 10.6 10.7 10.8 10.3 10.9 10.9 11.9 10.2Other .......................................................................................................................................... 11 318.8 322.1 334.3 341.3 351.2 322.3 320.6 321.4 322.3 324.0 329.9 333.0
Services ......................................................................................................................................... 12 2,409.4 2,468.9 2,535.5 2,599.6 2,671.0 2,437.6 2,445.3 2,455.9 2,480.0 2,494.4 2,510.9 2,531.4
Housing ...................................................................................................................................... 13 646.8 654.7 674.3 688.2 700.2 650.6 650.6 652.4 655.8 660.0 666.8 672.2Household operation .................................................................................................................. 14 248.2 261.5 270.5 282.9 289.6 256.1 256.6 257.7 265.2 266.3 263.1 274.1
Electricity and gas ................................................................................................................. 15 106.6 112.3 112.5 115.0 117.8 109.7 111.0 109.2 114.7 114.1 113.8 115.8Other household operation ................................................................................................... 16 141.7 149.2 158.0 167.8 171.7 146.5 145.7 148.5 150.5 152.2 149.3 158.4
Transportation ............................................................................................................................ 17 158.1 163.1 175.2 185.2 194.6 159.6 160.3 161.9 163.8 166.6 170.3 173.6Medical care ............................................................................................................................... 18 646.6 655.3 662.1 674.9 688.1 652.2 653.7 654.3 656.4 656.7 658.1 661.1Other .......................................................................................................................................... 19 709.7 734.5 754.0 769.1 799.4 719.1 724.1 729.7 739.0 745.2 753.0 750.9
Residual .......................................................................................................................................... 20 –.1 –.4 –1.6 –2.9 –5.1 –.1 –.2 –.3 –.4 –.7 –1.0 –1.2
Line
Seasonally adjusted at annual rates
1994 1995 1996 1997
III IV I II III IV I II III IV I II
Personal consumption expenditures ................................................................................ 1 4,498.2 4,534.1 4,551.3 4,583.5 4,612.9 4,633.5 4,669.4 4,712.2 4,718.2 4,756.4 4,818.1 4,827.9
Durable goods .............................................................................................................................. 2 561.7 576.6 572.2 577.7 590.8 593.7 600.7 614.8 611.9 617.1 637.8 628.5
Motor vehicles and parts ........................................................................................................... 3 227.3 232.6 226.2 227.5 232.9 231.6 233.4 234.2 229.7 228.0 233.4 222.7Furniture and household equipment ......................................................................................... 4 232.2 240.3 241.4 244.6 251.5 256.2 259.2 269.9 272.3 276.8 287.4 292.9Other .......................................................................................................................................... 5 102.9 104.5 105.9 107.0 107.9 107.9 110.2 113.4 113.2 116.3 121.4 119.2
Nondurable goods ....................................................................................................................... 6 1,393.2 1,402.5 1,408.4 1,411.6 1,413.9 1,416.3 1,422.5 1,431.6 1,433.9 1,441.2 1,457.8 1,450.1
Food ........................................................................................................................................... 7 687.9 689.5 690.8 690.2 690.6 690.6 692.4 690.3 687.3 689.0 694.6 690.5Clothing and shoes .................................................................................................................... 8 248.1 254.7 255.3 257.0 259.1 258.7 261.6 268.4 270.8 270.0 277.1 273.0Gasoline and oil ......................................................................................................................... 9 109.9 110.7 112.7 113.2 113.0 113.6 112.9 114.5 114.1 114.8 114.7 115.4Fuel oil and coal ........................................................................................................................ 10 10.7 10.2 10.0 10.6 10.4 11.1 11.1 10.4 10.6 10.3 9.4 10.2Other .......................................................................................................................................... 11 336.7 337.8 339.9 341.0 341.5 342.9 345.1 349.1 352.5 358.3 363.7 362.4
Services ......................................................................................................................................... 12 2,543.8 2,555.9 2,571.2 2,594.5 2,608.7 2,623.8 2,646.5 2,666.5 2,672.8 2,698.2 2,723.9 2,748.8
Housing ...................................................................................................................................... 13 677.0 681.1 683.7 686.7 689.7 692.8 695.6 698.7 701.7 704.8 708.3 712.1Household operation .................................................................................................................. 14 272.3 272.4 274.3 282.4 287.5 287.5 288.7 292.0 285.8 291.7 288.0 294.5
Electricity and gas ................................................................................................................. 15 111.4 108.9 109.7 114.8 118.7 116.9 119.0 119.7 114.8 117.7 113.8 117.8Other household operation ................................................................................................... 16 160.9 163.4 164.5 167.5 168.7 170.4 169.6 172.3 170.9 173.9 174.0 176.6
Transportation ............................................................................................................................ 17 176.7 180.1 182.5 183.8 185.4 189.0 192.1 193.8 195.4 197.0 199.3 200.0Medical care ............................................................................................................................... 18 663.2 666.0 669.5 672.9 677.0 680.4 679.4 686.2 689.8 697.1 704.4 710.8Other .......................................................................................................................................... 19 755.1 756.9 761.8 769.5 770.1 775.0 791.7 796.8 800.8 808.4 824.3 832.0
Residual .......................................................................................................................................... 20 –1.8 –2.6 –2.6 –2.8 –3.6 –3.6 –3.9 –5.5 –5.7 –6.0 –7.7 –7.7
NOTE.—Chained (1992) dollar series are calculated as the product of the chain-type quantity index and the 1992current-dollar value of the corresponding series, divided by 100. Because the formula for the chain-type quantityindexes uses weights of more than one period, the corresponding chained-dollar estimates are usually not additive.The residual line is the difference between the first line and the sum of the most detailed lines.

August •
Table 2.4.—Personal Consumption Expenditures by Type of Expenditure[Billions of dollars]
Line 1992 1993 1994 1995 1996
Personal consumption expenditures ........................ 1 4,219.8 4,459.2 4,717.0 4,957.7 5,207.6
Food and tobacco .................................................................... 2 709.5 733.4 761.7 783.8 805.7
Food purchased for off-premise consumption (n.d.) ............. 3 423.3 435.6 451.6 462.2 478.4Purchased meals and beverages 1 (n.d.) .............................. 4 228.6 243.0 254.3 264.1 268.7Food furnished to employees (including military) (n.d.) ....... 5 7.5 7.8 8.1 8.4 8.7Food produced and consumed on farms (n.d.) .................... 6 .6 .5 .5 .4 .4Tobacco products (n.d.) ......................................................... 7 49.6 46.6 47.3 48.7 49.6
Addenda: Food excluding alcoholic beverages (n.d.) ........... 8 583.9 608.7 633.6 652.0 669.9Alcoholic beverages purchased for off-
premise consumption (n.d.).9 50.5 51.8 53.9 54.9 57.3
Other alcoholic beverages (n.d.) ..................... 10 25.5 26.3 27.0 28.2 28.9
Clothing, accessories, and jewelry ........................................ 11 283.5 298.1 312.7 323.4 336.3
Shoes (n.d.) ............................................................................ 12 33.6 34.4 36.0 36.8 38.1Clothing and accessories except shoes 2 ............................. 13 191.7 201.8 211.6 217.7 226.0
Women’s and children’s (n.d.) ........................................... 14 125.3 131.9 137.5 141.3 145.8Men’s and boys’ (n.d.) ....................................................... 15 66.4 69.9 74.1 76.4 80.2
Standard clothing issued to military personnel (n.d) ............ 16 .2 .3 .3 .3 .3Cleaning, storage, and repair of clothing and shoes (s.) ..... 17 11.4 11.4 11.6 12.3 12.3Jewelry and watches (d.) ....................................................... 18 33.2 35.6 37.7 39.3 41.6Other 3 (s.) .............................................................................. 19 13.4 14.6 15.6 17.1 18.1
Personal care ............................................................................ 20 63.1 65.1 68.4 71.9 75.7
Toilet articles and preparations (n.d.) ................................... 21 41.4 43.1 45.3 47.2 49.9Barbershops, beauty parlors, and health clubs (s.) .............. 22 21.8 22.0 23.0 24.7 25.7
Housing ...................................................................................... 23 646.8 672.8 712.7 750.3 787.2
Owner-occupied nonfarm dwellings—space rent 4 (s.) ......... 24 457.8 480.9 507.0 532.2 558.3Tenant-occupied nonfarm dwellings—rent 5 (s.) ................... 25 160.5 162.1 174.0 184.6 193.6Rental value of farm dwellings (s.) ....................................... 26 5.3 5.5 5.8 5.9 6.1Other 6 (s.) .............................................................................. 27 23.1 24.3 26.0 27.5 29.1
Household operation ................................................................ 28 470.6 504.1 535.0 562.8 591.9
Furniture, including mattresses and bedsprings (d.) ............ 29 39.8 42.7 45.9 48.0 49.6Kitchen and other household appliances 7 (d.) ..................... 30 22.2 24.0 25.6 27.2 27.8China, glassware, tableware, and utensils (d.) ..................... 31 20.7 22.0 24.0 25.3 27.4Other durable house furnishings 8 (d.) .................................. 32 45.5 48.2 52.3 54.5 58.2Semidurable house furnishings 9 (n.d.) ................................. 33 23.2 25.0 27.2 28.9 30.1Cleaning and polishing preparations, and miscellaneous
household supplies and paper products (n.d).34 46.5 48.5 50.8 52.3 54.5
Stationery and writing supplies (n.d.) .................................... 35 13.5 14.2 15.1 15.8 17.0Household utilities .................................................................. 36 148.6 160.3 163.8 168.5 177.9
Electricity (s.) ..................................................................... 37 77.0 83.0 84.2 88.0 90.3Gas (s.) .............................................................................. 38 29.5 32.7 32.4 31.5 34.9Water and other sanitary services (s.) ............................. 39 31.1 33.8 36.6 38.8 41.1Fuel oil and coal (n.d.) ...................................................... 40 10.9 10.7 10.5 10.2 11.6
Telephone and telegraph (s.) ................................................ 41 70.3 74.5 82.6 90.2 96.9Domestic service (s.) ............................................................. 42 10.9 11.5 11.9 12.8 12.5Other 10 (s.) ............................................................................ 43 29.4 33.3 35.8 39.4 40.1
Medical care .............................................................................. 44 733.2 785.5 826.1 871.6 912.8
Drug preparations and sundries 11 (n.d.) .............................. 45 75.0 78.1 81.6 85.7 90.9Ophthalmic products and orthopedic appliances (d.) ........... 46 11.6 11.8 12.9 13.1 13.9Physicians (s.) ........................................................................ 47 167.2 172.5 180.0 191.4 196.5Dentists (s.) ............................................................................ 48 38.5 40.8 43.9 47.6 50.9Other professional services 12 (s.) ......................................... 49 78.2 87.6 95.7 104.4 110.2Hospitals and nursing homes 13 ............................................ 50 320.0 341.1 357.0 375.9 394.2
Hospitals ............................................................................. 51 268.8 285.8 298.1 310.6 325.1Nonprofit (s.) .................................................................. 52 183.6 193.9 200.2 207.9 217.3Proprietary (s.) ............................................................... 53 30.1 30.7 32.1 34.5 37.1Government (s.) ............................................................. 54 55.1 61.1 65.8 68.2 70.7
Nursing homes (s.) ............................................................ 55 51.2 55.3 58.9 65.2 69.1Health insurance .................................................................... 56 42.7 53.6 55.0 53.6 56.3
Medical care and hospitalization 14 (s.) ............................ 57 36.8 43.9 42.9 40.7 41.8Income loss 15 (s.) ............................................................. 58 2.3 2.5 2.7 2.9 3.2
Line 1992 1993 1994 1995 1996
Workers’ compensation 16 (s.) ........................................... 59 3.5 7.1 9.4 10.0 11.3
Personal business .................................................................... 60 341.7 357.4 370.4 389.1 421.1
Brokerage charges and investment counseling (s.) ............. 61 30.4 35.7 36.2 38.8 47.2Bank service charges, trust services, and safe deposit box
rental (s.).62 28.0 30.7 31.6 33.9 37.3
Services furnished without payment by financialintermediaries except life insurance carriers and privatenoninsured pension plans (s.).
63 142.9 144.2 151.5 159.8 169.9
Expense of handling life insurance 17 (s.) ............................ 64 67.5 70.9 72.6 75.4 79.9Legal services (s.) .................................................................. 65 46.5 47.9 48.8 49.1 52.2Funeral and burial expenses (s.) .......................................... 66 10.1 10.8 11.1 12.2 12.8Other 18 (s.) ............................................................................ 67 16.4 17.3 18.5 19.9 21.8
Transportation ........................................................................... 68 471.5 504.0 542.2 572.3 602.2
User-operated transportation ................................................. 69 435.7 465.5 502.6 530.1 557.7New autos (d.) ................................................................... 70 82.1 86.4 91.2 87.1 86.1Net purchases of used autos (d.) ..................................... 71 35.5 40.2 44.1 52.4 55.3Other motor vehicles (d.) ................................................... 72 59.5 67.9 76.8 79.4 82.1Tires, tubes, accessories, and other parts (d.) ................ 73 29.8 31.7 34.5 35.8 37.9Repair, greasing, washing, parking, storage, rental, and
leasing (s.).74 94.4 102.4 116.4 128.7 140.1
Gasoline and oil (n.d.) ....................................................... 75 106.6 107.6 109.4 114.4 122.6Bridge, tunnel, ferry, and road tolls (s.) ............................ 76 2.3 2.5 2.6 2.8 2.9Insurance 19 (s.) ................................................................. 77 25.5 26.8 27.5 29.4 30.9
Purchased local transportation .............................................. 78 8.0 8.4 8.9 9.2 10.1Mass transit systems (s.) .................................................. 79 5.4 5.6 5.9 6.0 6.6Taxicab (s.) ........................................................................ 80 2.6 2.8 3.0 3.2 3.5
Purchased intercity transportation ......................................... 81 27.9 30.1 30.7 33.0 34.4Railway (s.) ........................................................................ 82 .8 .8 .7 .8 .8Bus (s.) ............................................................................... 83 1.1 1.0 1.1 1.3 1.3Airline (s.) ........................................................................... 84 23.3 25.4 25.8 27.7 28.2Other 20 (s.) ........................................................................ 85 2.8 2.9 3.2 3.3 4.0
Recreation .................................................................................. 86 310.8 340.2 370.2 402.5 431.1
Books and maps (d.) ............................................................. 87 17.7 19.0 20.6 22.1 23.2Magazines, newspapers, and sheet music (n.d.) ................. 88 21.6 22.7 24.5 25.5 26.5Nondurable toys and sport supplies (n.d.) ............................ 89 34.2 36.6 39.7 42.2 45.4Wheel goods, sports and photographic equipment, boats,
and pleasure aircraft (d.).90 29.9 32.6 35.6 39.1 42.0
Video and audio products, computing equipment, andmusical instruments (d.).
91 61.2 68.1 78.5 85.2 89.7
Radio and television repair (s.) ............................................. 92 4.2 4.5 4.5 4.9 5.1Flowers, seeds, and potted plants (n.d.) .............................. 93 12.3 12.7 13.4 13.9 14.9Admissions to specified spectator amusements ................... 94 16.6 18.1 19.0 20.2 22.1
Motion picture theaters (s.) ............................................... 95 5.0 5.2 5.6 6.0 6.3Legitimate theaters and opera, and entertainments of
nonprofit institutions (except athletics) (s.).96 6.8 7.8 8.2 8.7 9.3
Spectator sports 21 (s.) ...................................................... 97 4.8 5.1 5.2 5.5 6.4Clubs and fraternal organizations 22 (s.) ............................... 98 10.3 11.2 11.8 12.7 13.0Commercial participant amusements 23 (s.) .......................... 99 27.2 31.5 36.2 41.5 46.2Pari-mutuel net receipts (s.) .................................................. 100 3.3 3.3 3.3 3.3 3.5Other 24 (s.) ............................................................................ 101 72.4 80.0 83.1 91.9 99.6
Education and research ........................................................... 102 93.1 98.5 104.7 112.2 119.6
Higher education 25 (s.) ......................................................... 103 52.0 55.5 59.0 62.2 65.2Nursery, elementary, and secondary schools 26 (s.) ............ 104 19.3 20.1 21.4 22.8 24.0Other 27 (s.) ............................................................................ 105 21.7 23.0 24.4 27.2 30.3
Religious and welfare activities 28 (s.) ................................... 106 115.6 121.3 131.2 139.8 150.5
Foreign travel and other, net .................................................. 107 –19.7 –21.2 –18.3 –22.1 –26.5
Foreign travel by U.S. residents (s.) ..................................... 108 43.4 46.0 50.1 51.9 54.9Expenditures abroad by U.S. residents (n.d.) ....................... 109 2.9 2.8 2.7 2.6 2.6Less: Expenditures in the United States by nonresidents
(s.).110 64.7 68.6 69.7 75.2 82.7
Less: Personal remittances in kind to nonresidents (n.d.) ... 111 1.3 1.4 1.4 1.4 1.2
1. Consists of purchases (including tips) of meals and beverages from retail, service, and amusement establish-ments, hotels, dining and buffet cars, schools, school fraternities, institutions, clubs, and industrial lunchrooms. In-cludes meals and beverages consumed both on- and off-premise.
2. Includes luggage.3. Consists of watch, clock, and jewelry repairs, costume and dress suit rental, and miscellaneous personal serv-
ices.4. Consists of rent for space and for heating and plumbing facilities, water heaters, lighting fixtures, kitchen cabi-
nets, linoleum, storm windows and doors, window screens, and screen doors, but excludes rent for appliances andfurniture and purchases of fuel and electricity.
5. Consists of space rent (see footnote 4) and rent for appliances, furnishings, and furniture.6. Consists of transient hotels, motels, clubs, schools, and other group housing.7. Consists of refrigerators and freezers, cooking ranges, dishwashers, laundry equipment, stoves, room air condi-
tioners, sewing machines, vacuum cleaners, and other appliances.8. Includes such house furnishings as floor coverings, comforters, quilts, blankets, pillows, picture frames, mirrors,
art products, portable lamps, and clocks. Also includes writing equipment and hand, power, and garden tools.9. Consists largely of textile house furnishings, including piece goods allocated to house furnishing use. Also
includes lamp shades, brooms, and brushes.10. Consists of maintenance services for appliances and house furnishings, moving and warehouse expenses,
postage and express charges, premiums for fire and theft insurance on personal property less benefits and divi-dends, and miscellaneous household operation services.
11. Excludes drug preparations and related products dispensed by physicians, hospitals, and other medical serv-ices.
12. Consists of osteopathic physicians, chiropractors, private duty nurses, chiropodists, podiatrists, and others pro-viding health and allied services, not elsewhere classified.
13. Consists of (1) current expenditures (including consumption of fixed capital) of nonprofit hospitals and nursinghomes, and (2) payments by patients to proprietary and government hospitals and nursing homes.
14. Consists of (1) premiums, less benefits and dividends, for health, hospitalization, and accidental death anddismemberment insurance provided by commercial insurance carriers, and (2) administrative expenses (including con-sumption of fixed capital) of Blue Cross and Blue Shield plans and of other independent prepaid and self-insuredhealth plans.
15. Consists of premiums, less benefits and dividends, for income loss insurance.16. Consists of premiums, less benefits and dividends, for privately administered workers’ compensation.17. Consists of (1) operating expenses of life insurance carriers and private noninsured pension plans, and (2)
premiums, less benefits and dividends, of fraternal benefit societies. Excludes expenses allocated by commercialcarriers to accident and health insurance.
18. Consists of current expenditures (including consumption of fixed capital) of trade unions and professional asso-ciations, employment agency fees, money order fees, spending for classified advertisements, tax return preparationservices, and other personal business services.
19. Consists of premiums, less benefits and dividends, for motor vehicle insurance.
20. Consists of baggage charges, coastal and inland waterway fares, travel agents’ fees, and airport bus fares.21. Consists of admissions to professional and amateur athletic events and to racetracks.22. Consists of dues and fees excluding insurance premiums.23. Consists of billiard parlors; bowling alleys; dancing, riding, shooting, skating, and swimming places; amusement
devices and parks; golf courses; sightseeing buses and guides; private flying operations; casino gambling; and othercommercial participant amusements.
24. Consists of net receipts of lotteries and expenditures for purchases of pets and pet care services, cableTV, film processing, photographic studios, sporting and recreation camps, video cassette rentals, and recreationalservices, not elsewhere classified.
25. For private institutions, equals current expenditures (including consumption of fixed capital) less receipts—such as those from meals, rooms, and entertainments—accounted for separately in consumer expenditures, andless expenditures for research and development financed under contracts or grants. For government institutions,equals student payments of tuition.
26. For private institutions, equals current expenditures (including consumption of fixed capital) less receipts—such as those from meals, rooms, and entertainments—accounted for separately in consumer expenditures. For gov-ernment institutions, equals student payments of tuition. Excludes child day care services, which are included inreligious and welfare activities.
27. Consists of (1) fees paid to commercial, business, trade, and correspondence schools and for educationalservices, not elsewhere classified, and (2) current expenditures (including consumption of fixed capital) by researchorganizations and foundations for education and research.
28. For nonprofit institutions, equals current expenditures (including consumption of fixed capital) of religious, so-cial welfare, foreign relief, and political organizations, museums, libraries, and foundations. The expenditures arenet of receipts—such as those from meals, rooms, and entertainments—accounted for separately in consumer ex-penditures, and excludes relief payments within the United States and expenditures by foundations for educationand research. For proprietary and government institutions, equals receipts from users.
NOTES.—Consumer durable goods are designated (d.), nondurable goods (n.d.), and services (s.).Estimates of foreign travel by U.S. residents (line 108) expenditures were $0.3 billion in 1981. Beginning with
1984, estimates of foreign travel by U.S. residents include substantially improved estimates of U.S. residents’ foreigntravel and passenger fare expenditures. Estimates of expenditures in the United States by nonresidents (line 110)include, beginning with 1981, nonresidents’ student and medical care expenditures in the United States. Studentexpenditures were $2.2 billion, and medical expenditures were $0.4 billion in 1981. Beginning with 1984, estimatesof expenditures in the United States by nonresidents include substantially improved estimates of nonresidents’ travelexpenditures. Expenditures in the United States by nonresidents are subtracted from total personal consumption ex-penditures (line 110) because they are included in detailed type of expenditure estimates elsewhere in personalconsumption expenditures.

• August
Table 2.5.—Real Personal Consumption Expenditures by Type of Expenditure[Billions of chained (1992) dollars]
Line 1992 1993 1994 1995 1996
Personal consumption expenditures ........................ 1 4,219.8 4,343.6 4,486.0 4,595.3 4,714.1
Food and tobacco .................................................................... 2 709.5 720.1 735.0 737.9 736.5
Food purchased for off-premise consumption (n.d.) ............. 3 423.3 428.8 434.5 433.4 434.7Purchased meals and beverages 1 (n.d.) .............................. 4 228.6 238.4 245.1 248.7 246.6Food furnished to employees (including military) (n.d.) ....... 5 7.5 7.6 7.8 7.9 8.0Food produced and consumed on farms (n.d.) .................... 6 .6 .5 .5 .5 .4Tobacco products (n.d.) ......................................................... 7 49.6 44.8 47.2 47.4 46.8
Addenda: Food excluding alcoholic beverages (n.d.) ........... 8 583.9 598.1 608.7 610.2 608.7Alcoholic beverages purchased for off-
premise consumption (n.d.).9 50.5 51.7 53.7 54.5 55.5
Other alcoholic beverages (n.d.) ..................... 10 25.5 25.6 25.6 25.9 25.7
Clothing, accessories, and jewelry ........................................ 11 283.5 294.1 308.5 321.8 335.3
Shoes (n.d.) ............................................................................ 12 33.6 34.2 35.7 36.6 37.6Clothing and accessories except shoes 2 ............................. 13 191.7 199.7 211.2 220.6 229.9
Women’s and children’s (n.d.) ........................................... 14 125.3 130.3 137.0 144.2 150.7Men’s and boys’ (n.d.) ....................................................... 15 66.4 69.3 74.1 76.4 79.2
Standard clothing issued to military personnel (n.d) ............ 16 .2 .3 .3 .3 .3Cleaning, storage, and repair of clothing and shoes (s.) ..... 17 11.4 11.0 11.0 11.5 11.3Jewelry and watches (d.) ....................................................... 18 33.2 34.8 35.6 36.8 39.7Other 3 (s.) .............................................................................. 19 13.4 14.2 14.7 16.0 16.6
Personal care ............................................................................ 20 63.1 63.7 65.5 67.9 70.1
Toilet articles and preparations (n.d.) ................................... 21 41.4 42.4 43.7 45.0 47.0Barbershops, beauty parlors, and health clubs (s.) .............. 22 21.8 21.4 21.8 22.9 23.0
Housing ...................................................................................... 23 646.8 654.7 674.3 688.2 700.2
Owner-occupied nonfarm dwellings—space rent 4 (s.) ......... 24 457.8 467.9 479.6 487.2 495.3Tenant-occupied nonfarm dwellings—rent 5 (s.) ................... 25 160.5 158.0 165.2 171.1 174.9Rental value of farm dwellings (s.) ....................................... 26 5.3 5.2 5.2 5.2 5.1Other 6 (s.) .............................................................................. 27 23.1 23.5 24.3 24.8 25.0
Household operation ................................................................ 28 470.6 494.6 514.5 533.6 548.4
Furniture, including mattresses and bedsprings (d.) ............ 29 39.8 41.6 43.2 44.2 44.6Kitchen and other household appliances 7 (d.) ..................... 30 22.2 23.8 25.0 26.6 27.1China, glassware, tableware, and utensils (d.) ..................... 31 20.7 22.1 23.5 25.0 26.9Other durable house furnishings 8 (d.) .................................. 32 45.5 47.8 51.4 53.1 56.1Semidurable house furnishings 9 (n.d.) ................................. 33 23.2 24.7 25.7 26.9 28.2Cleaning and polishing preparations, and miscellaneous
household supplies and paper products (n.d).34 46.5 48.3 50.2 50.0 50.6
Stationery and writing supplies (n.d.) .................................... 35 13.5 14.0 14.4 14.4 14.8Household utilities .................................................................. 36 148.6 155.0 156.3 159.4 163.1
Electricity (s.) ..................................................................... 37 77.0 81.4 82.6 84.3 85.2Gas (s.) .............................................................................. 38 29.5 30.8 30.0 30.7 32.7Water and other sanitary services (s.) ............................. 39 31.1 32.0 33.0 33.8 34.6Fuel oil and coal (n.d.) ...................................................... 40 10.9 10.7 10.7 10.5 10.6
Telephone and telegraph (s.) ................................................ 41 70.3 73.7 79.6 86.6 91.1Domestic service (s.) ............................................................. 42 10.9 11.1 11.2 11.7 11.0Other 10 (s.) ............................................................................ 43 29.4 32.4 34.2 35.9 35.3
Medical care .............................................................................. 44 733.2 742.1 751.0 766.2 782.4
Drug preparations and sundries 11 (n.d.) .............................. 45 75.0 75.4 76.7 79.1 81.7Ophthalmic products and orthopedic appliances (d.) ........... 46 11.6 11.5 12.3 12.2 12.6Physicians (s.) ........................................................................ 47 167.2 163.4 162.4 166.1 169.3Dentists (s.) ............................................................................ 48 38.5 38.8 39.8 41.1 42.0Other professional services 12 (s.) ......................................... 49 78.2 84.9 89.2 95.6 99.1Hospitals and nursing homes 13 ............................................ 50 320.0 327.0 331.5 336.6 343.1
Hospitals ............................................................................. 51 268.8 273.8 276.9 278.5 284.4Nonprofit (s.) .................................................................. 52 183.6 187.2 187.8 188.2 191.8Proprietary (s.) ............................................................... 53 30.1 29.0 29.2 30.3 31.9Government (s.) ............................................................. 54 55.1 57.7 59.9 60.0 60.7
Nursing homes (s.) ............................................................ 55 51.2 53.2 54.6 58.1 58.7Health insurance .................................................................... 56 42.7 41.5 40.0 37.5 36.9
Medical care and hospitalization 14 (s.) ............................ 57 36.8 36.6 36.6 35.2 34.7Income loss 15 (s.) ............................................................. 58 2.3 2.4 2.4 2.5 2.6Workers’ compensation 16 (s.) ........................................... 59 3.5 2.9 2.3 1.8 1.8
Line 1992 1993 1994 1995 1996
Personal business .................................................................... 60 341.7 351.7 352.1 350.7 363.6
Brokerage charges and investment counseling (s.) ............. 61 30.4 37.3 37.8 41.8 50.0Bank service charges, trust services, and safe deposit box
rental (s.).62 28.0 29.0 27.5 27.8 28.9
Services furnished without payment by financialintermediaries except life insurance carriers and privatenoninsured pension plans (s.).
63 142.9 144.5 146.5 141.9 143.9
Expense of handling life insurance 17 (s.) ............................ 64 67.5 68.3 68.1 67.9 68.5Legal services (s.) .................................................................. 65 46.5 45.9 45.3 44.0 45.2Funeral and burial expenses (s.) .......................................... 66 10.1 10.3 10.1 10.5 10.4Other 18 (s.) ............................................................................ 67 16.4 16.8 17.1 17.6 18.7
Transportation ........................................................................... 68 471.5 490.8 515.3 528.0 540.3
User-operated transportation ................................................. 69 435.7 454.2 476.6 487.8 497.7New autos (d.) ................................................................... 70 82.1 84.4 86.2 80.6 78.2Net purchases of used autos (d.) ..................................... 71 35.5 36.7 37.5 40.8 42.1Other motor vehicles (d.) ................................................... 72 59.5 65.7 71.4 71.7 72.5Tires, tubes, accessories, and other parts (d.) ................ 73 29.8 32.1 35.1 36.2 38.3Repair, greasing, washing, parking, storage, rental, and
leasing (s.).74 94.4 98.7 108.5 116.5 123.3
Gasoline and oil (n.d.) ....................................................... 75 106.6 108.7 109.8 113.1 114.1Bridge, tunnel, ferry, and road tolls (s.) ............................ 76 2.3 2.4 2.4 2.4 2.5Insurance 19 (s.) ................................................................. 77 25.5 25.6 25.6 26.0 26.2
Purchased local transportation .............................................. 78 8.0 8.2 8.6 8.5 8.5Mass transit systems (s.) .................................................. 79 5.4 5.4 5.7 5.5 5.6Taxicab (s.) ........................................................................ 80 2.6 2.7 2.9 3.0 3.0
Purchased intercity transportation ......................................... 81 27.9 28.3 30.1 31.7 34.2Railway (s.) ........................................................................ 82 .8 .8 .7 .7 .7Bus (s.) ............................................................................... 83 1.1 1.1 1.1 1.4 1.4Airline (s.) ........................................................................... 84 23.3 23.9 25.5 26.8 28.8Other 20 (s.) ........................................................................ 85 2.8 2.6 2.8 2.8 3.3
Recreation .................................................................................. 86 310.8 338.1 365.2 395.7 424.4
Books and maps (d.) ............................................................. 87 17.7 18.5 19.6 20.6 20.8Magazines, newspapers, and sheet music (n.d.) ................. 88 21.6 21.9 22.9 22.9 22.7Nondurable toys and sport supplies (n.d.) ............................ 89 34.2 36.3 38.9 41.4 43.9Wheel goods, sports and photographic equipment, boats,
and pleasure aircraft (d.).90 29.9 32.5 34.8 37.7 40.3
Video and audio products, computing equipment, andmusical instruments (d.).
91 61.2 72.6 87.4 101.8 119.5
Radio and television repair (s.) ............................................. 92 4.2 4.3 4.2 4.5 4.5Flowers, seeds, and potted plants (n.d.) .............................. 93 12.3 12.9 13.4 13.2 14.4Admissions to specified spectator amusements ................... 94 16.6 17.8 17.8 18.2 18.9
Motion picture theaters (s.) ............................................... 95 5.0 5.1 5.2 5.4 5.4Legitimate theaters and opera, and entertainments of
nonprofit institutions (except athletics) (s.).96 6.8 7.7 7.7 7.9 8.0
Spectator sports 21 (s.) ...................................................... 97 4.8 5.0 4.9 5.0 5.5Clubs and fraternal organizations 22 (s.) ............................... 98 10.3 10.8 11.2 11.5 11.8Commercial participant amusements 23 (s.) .......................... 99 27.2 30.5 34.1 38.0 41.1Pari-mutuel net receipts (s.) .................................................. 100 3.3 3.2 3.1 3.1 3.1Other 24 (s.) ............................................................................ 101 72.4 77.2 79.1 85.5 89.3
Education and research ........................................................... 102 93.1 94.7 96.8 99.4 102.7
Higher education 25 (s.) ......................................................... 103 52.0 52.4 53.1 53.7 54.0Nursery, elementary, and secondary schools 26 (s.) ............ 104 19.3 19.6 20.4 20.8 21.7Other 27 (s.) ............................................................................ 105 21.7 22.6 23.4 25.0 27.2
Religious and welfare activities 28 (s.) ................................... 106 115.6 118.6 125.6 128.6 136.6
Foreign travel and other, net .................................................. 107 –19.7 –19.3 –16.2 –19.5 –21.5
Foreign travel by U.S. residents (s.) ..................................... 108 43.4 46.0 48.8 48.9 50.8Expenditures abroad by U.S. residents (n.d.) ....................... 109 2.9 2.9 2.8 2.4 2.4Less: Expenditures in the United States by nonresidents
(s.).110 64.7 66.8 66.4 69.5 73.5
Less: Personal remittances in kind to nonresidents (n.d.) ... 111 1.3 1.4 1.3 1.3 1.1
Residual ...................................................................................... 112 –.1 –1.7 –5.7 –10.6 –17.8
NOTES.—Chained (1992) dollar series are calculated as the product of the chain-type quantity index and the 1992current-dollar value of the corresponding series, divided by 100. Because the formula for the chain-type quantityindexes uses weights of more than one period, the corresponding chained-dollar estimates are usually not additive.
The residual line is the difference between the first line and the sum of the most detailed lines.See notes and footnotes to table 2.4.

August •
Table 2.6.—Personal Consumption Expenditures by Type of Product[Billions of dollars]
Line 1992 1993 1994 1995 1996
Personal consumption expenditures ........................ 1 4,219.8 4,459.2 4,717.0 4,957.7 5,207.6
Durable goods ........................................................................... 2 488.5 530.2 579.5 608.5 634.5
Motor vehicles and parts ....................................................... 3 206.9 226.2 246.6 254.8 261.3New autos (70) .................................................................. 4 82.1 86.4 91.2 87.1 86.1Net purchases of used autos (71) .................................... 5 35.5 40.2 44.1 52.4 55.3Other motor vehicles (72) .................................................. 6 59.5 67.9 76.8 79.4 82.1Tires, tubes, accessories, and other parts (73) ............... 7 29.8 31.7 34.5 35.8 37.9
Furniture and household equipment ...................................... 8 189.4 204.9 226.2 240.2 252.6Furniture, including mattresses and bedsprings (29) ....... 9 39.8 42.7 45.9 48.0 49.6Kitchen and other household appliances (30) .................. 10 22.2 24.0 25.6 27.2 27.8China, glassware, tableware, and utensils (31) ............... 11 20.7 22.0 24.0 25.3 27.4Video and audio products, computing equipment, and
musical instruments (91).12 61.2 68.1 78.5 85.2 89.7
Other durable house furnishings (32) ............................... 13 45.5 48.2 52.3 54.5 58.2
Other ....................................................................................... 14 92.3 99.1 106.7 113.6 120.6Ophthalmic products and orthopedic appliances (46) ...... 15 11.6 11.8 12.9 13.1 13.9Wheel goods, sports and photographic equipment,
boats, and pleasure aircraft (90).16 29.9 32.6 35.6 39.1 42.0
Jewelry and watches (18) ................................................. 17 33.2 35.6 37.7 39.3 41.6Books and maps (87) ........................................................ 18 17.7 19.0 20.6 22.1 23.2
Nondurable goods .................................................................... 19 1,321.8 1,370.7 1,428.4 1,475.8 1,534.7
Food ........................................................................................ 20 660.0 686.8 714.5 735.1 756.1Food purchased for off-premise consumption (3) ............ 21 423.3 435.6 451.6 462.2 478.4Purchased meals and beverages (4) ................................ 22 228.6 243.0 254.3 264.1 268.7Food furnished to employees (including military) and
food produced and consumed on farms (5+6).23 8.0 8.3 8.5 8.9 9.1
Addenda: Food excluding alcoholic beverages (8) .......... 24 583.9 608.7 633.6 652.0 669.9Alcoholic beverages purchased for off-
premise consumption (9).25 50.5 51.8 53.9 54.9 57.3
Other alcoholic beverages (10) ................... 26 25.5 26.3 27.0 28.2 28.9
Clothing and shoes ................................................................ 27 225.5 236.5 247.8 254.7 264.3Shoes (12) ......................................................................... 28 33.6 34.4 36.0 36.8 38.1Women’s and children’s clothing and accessories except
shoes (14).29 125.3 131.9 137.5 141.3 145.8
Men’s and boys’ clothing and accessories except shoes(15+16).
30 66.7 70.2 74.4 76.7 80.5
Gasoline and oil (75) ............................................................. 31 106.6 107.6 109.4 114.4 122.6
Fuel oil and coal (40) ............................................................ 32 10.9 10.7 10.5 10.2 11.6
Other ....................................................................................... 33 318.8 329.0 346.2 361.3 380.1
Tobacco products (7) ......................................................... 34 49.6 46.6 47.3 48.7 49.6Toilet articles and preparations (21) ................................. 35 41.4 43.1 45.3 47.2 49.9Semidurable house furnishings (33) ................................. 36 23.2 25.0 27.2 28.9 30.1Cleaning and polishing preparations, and miscellaneous
household supplies and paper products (34).37 46.5 48.5 50.8 52.3 54.5
Drug preparations and sundries (45) ................................ 38 75.0 78.1 81.6 85.7 90.9Nondurable toys and sport supplies (89) ......................... 39 34.2 36.6 39.7 42.2 45.4Stationery and writing supplies (35) ................................. 40 13.5 14.2 15.1 15.8 17.0Net foreign remittances (109 less 111) ............................ 41 1.6 1.4 1.4 1.3 1.3Magazines, newspapers, and sheet music (88) ............... 42 21.6 22.7 24.5 25.5 26.5Flowers, seeds, and potted plants (93) ............................ 43 12.3 12.7 13.4 13.9 14.9
Services ..................................................................................... 44 2,409.4 2,558.4 2,709.1 2,873.4 3,038.4
Housing ................................................................................... 45 646.8 672.8 712.7 750.3 787.2Owner-occupied nonfarm dwellings—space rent (24) ...... 46 457.8 480.9 507.0 532.2 558.3
Line 1992 1993 1994 1995 1996
Tenant-occupied nonfarm dwellings—rent (25) ................ 47 160.5 162.1 174.0 184.6 193.6Rental value of farm dwellings (26) .................................. 48 5.3 5.5 5.8 5.9 6.1Other (27) ........................................................................... 49 23.1 24.3 26.0 27.5 29.1
Household operation .............................................................. 50 248.2 268.8 283.7 300.7 315.9Electricity (37) .................................................................... 51 77.0 83.0 84.2 88.0 90.3Gas (38) ............................................................................. 52 29.5 32.7 32.4 31.5 34.9Water and other sanitary services (39) ............................ 53 31.1 33.8 36.6 38.8 41.1Telephone and telegraph (41) ........................................... 54 70.3 74.5 82.6 90.2 96.9Domestic service (42) ........................................................ 55 10.9 11.5 11.9 12.8 12.5Other (43) ........................................................................... 56 29.4 33.3 35.8 39.4 40.1
Transportation ......................................................................... 57 158.1 170.2 186.2 203.1 218.4User-operated transportation ............................................. 58 122.2 131.7 146.6 160.9 173.9
Repair, greasing, washing, parking, storage, rental,and leasing (74).
59 94.4 102.4 116.4 128.7 140.1
Other user-operated transportation (76+77) ................. 60 27.8 29.2 30.2 32.2 33.8Purchased local transportation .......................................... 61 8.0 8.4 8.9 9.2 10.1
Mass transit systems (79) ............................................. 62 5.4 5.6 5.9 6.0 6.6Taxicab (80) ................................................................... 63 2.6 2.8 3.0 3.2 3.5
Purchased intercity transportation ..................................... 64 27.9 30.1 30.7 33.0 34.4Railway (82) ................................................................... 65 .8 .8 .7 .8 .8Bus (83) ......................................................................... 66 1.1 1.0 1.1 1.3 1.3Airline (84) ..................................................................... 67 23.3 25.4 25.8 27.7 28.2Other (85) ...................................................................... 68 2.8 2.9 3.2 3.3 4.0
Medical care ........................................................................... 69 646.6 695.6 731.6 772.8 808.1Physicians (47) .................................................................. 70 167.2 172.5 180.0 191.4 196.5Dentists (48) ....................................................................... 71 38.5 40.8 43.9 47.6 50.9Other professional services (49) ....................................... 72 78.2 87.6 95.7 104.4 110.2Hospitals and nursing homes (50) .................................... 73 320.0 341.1 357.0 375.9 394.2Health insurance (56) ........................................................ 74 42.7 53.6 55.0 53.6 56.3
Other ....................................................................................... 75 709.7 751.0 794.8 846.5 908.9Personal care ..................................................................... 76 46.6 47.9 50.2 54.1 56.1
Cleaning, storage, and repair of clothing and shoes(17).
77 11.4 11.4 11.6 12.3 12.3
Barbershops, beauty parlors, and health clubs (22) .... 78 21.8 22.0 23.0 24.7 25.7Other (19) ...................................................................... 79 13.4 14.6 15.6 17.1 18.1
Personal business .............................................................. 80 341.7 357.4 370.4 389.1 421.1Brokerage charges and investment counseling (61) ... 81 30.4 35.7 36.2 38.8 47.2Bank service charges, trust services, and safe
deposit box rental (62).82 28.0 30.7 31.6 33.9 37.3
Services furnished without payment by financialintermediaries except life insurance carriers andprivate noninsured pension plans (63).
83 142.9 144.2 151.5 159.8 169.9
Expense of handling life insurance (64) ....................... 84 67.5 70.9 72.6 75.4 79.9Legal services (65) ........................................................ 85 46.5 47.9 48.8 49.1 52.2Funeral and burial expenses (66) ................................ 86 10.1 10.8 11.1 12.2 12.8Other (67) ...................................................................... 87 16.4 17.3 18.5 19.9 21.8
Recreation .......................................................................... 88 134.0 148.5 157.9 174.6 189.4Admissions to specified spectator amusements (94) 89 16.6 18.1 19.0 20.2 22.1Other (92+98+99+100+101) .......................................... 90 117.5 130.4 138.9 154.4 167.4
Education and research ..................................................... 91 93.1 98.5 104.7 112.2 119.6Higher education (103) .................................................. 92 52.0 55.5 59.0 62.2 65.2Nursery, elementary, and secondary schools (104) .... 93 19.3 20.1 21.4 22.8 24.0Other (105) .................................................................... 94 21.7 23.0 24.4 27.2 30.3
Religious and welfare activities (106) ............................... 95 115.6 121.3 131.2 139.8 150.5Net foreign travel ............................................................... 96 –21.3 –22.6 –19.6 –23.4 –27.8
Foreign travel by U.S. residents (108) ......................... 97 43.4 46.0 50.1 51.9 54.9Less: Expenditures in the United States by
nonresidents (110).98 64.7 68.6 69.7 75.2 82.7
NOTES.—See note to table 2.4 for information on discontinuities in estimates of foreign travel by U.S. residents(line 97) and expenditures in the United States by nonresidents (line 98).
The figures in parentheses are the line numbers of the corresponding items in table 2.4.

• August
Table 2.7.—Real Personal Consumption Expenditures by Type of Product[Billions of chained (1992) dollars]
Line 1992 1993 1994 1995 1996
Personal consumption expenditures ........................ 1 4,219.8 4,343.6 4,486.0 4,595.3 4,714.1
Durable goods ........................................................................... 2 488.5 523.8 561.2 583.6 611.1
Motor vehicles and parts ....................................................... 3 206.9 218.9 230.0 229.5 231.3New autos (70) .................................................................. 4 82.1 84.4 86.2 80.6 78.2Net purchases of used autos (71) .................................... 5 35.5 36.7 37.5 40.8 42.1Other motor vehicles (72) .................................................. 6 59.5 65.7 71.4 71.7 72.5Tires, tubes, accessories, and other parts (73) ............... 7 29.8 32.1 35.1 36.2 38.3
Furniture and household equipment ...................................... 8 189.4 207.8 229.4 248.4 269.5Furniture, including mattresses and bedsprings (29) ....... 9 39.8 41.6 43.2 44.2 44.6Kitchen and other household appliances (30) .................. 10 22.2 23.8 25.0 26.6 27.1China, glassware, tableware, and utensils (31) ............... 11 20.7 22.1 23.5 25.0 26.9Video and audio products, computing equipment, and
musical instruments (91).12 61.2 72.6 87.4 101.8 119.5
Other durable house furnishings (32) ............................... 13 45.5 47.8 51.4 53.1 56.1
Other ....................................................................................... 14 92.3 97.2 102.3 107.2 113.3Ophthalmic products and orthopedic appliances (46) ...... 15 11.6 11.5 12.3 12.2 12.6Wheel goods, sports and photographic equipment,
boats, and pleasure aircraft (90).16 29.9 32.5 34.8 37.7 40.3
Jewelry and watches (18) ................................................. 17 33.2 34.8 35.6 36.8 39.7Books and maps (87) ........................................................ 18 17.7 18.5 19.6 20.6 20.8
Nondurable goods .................................................................... 19 1,321.8 1,351.0 1,389.9 1,412.6 1,432.3
Food ........................................................................................ 20 660.0 675.3 687.9 690.5 689.7Food purchased for off-premise consumption (3) ............ 21 423.3 428.8 434.5 433.4 434.7Purchased meals and beverages (4) ................................ 22 228.6 238.4 245.1 248.7 246.6Food furnished to employees (including military) and
food produced and consumed on farms (5+6).23 8.0 8.1 8.3 8.4 8.4
Addenda: Food excluding alcoholic beverages (8) .......... 24 583.9 598.1 608.7 610.2 608.7Alcoholic beverages purchased for off-
premise consumption (9).25 50.5 51.7 53.7 54.5 55.5
Other alcoholic beverages (10) ................... 26 25.5 25.6 25.6 25.9 25.7
Clothing and shoes ................................................................ 27 225.5 234.2 247.1 257.5 267.7Shoes (12) ......................................................................... 28 33.6 34.2 35.7 36.6 37.6Women’s and children’s clothing and accessories except
shoes (14).29 125.3 130.3 137.0 144.2 150.7
Men’s and boys’ clothing and accessories except shoes(15+16).
30 66.7 69.6 74.4 76.7 79.5
Gasoline and oil (75) ............................................................. 31 106.6 108.7 109.8 113.1 114.1
Fuel oil and coal (40) ............................................................ 32 10.9 10.7 10.7 10.5 10.6
Other ....................................................................................... 33 318.8 322.1 334.3 341.3 351.2Tobacco products (7) ......................................................... 34 49.6 44.8 47.2 47.4 46.8Toilet articles and preparations (21) ................................. 35 41.4 42.4 43.7 45.0 47.0Semidurable house furnishings (33) ................................. 36 23.2 24.7 25.7 26.9 28.2Cleaning and polishing preparations, and miscellaneous
household supplies and paper products (34).37 46.5 48.3 50.2 50.0 50.6
Drug preparations and sundries (45) ................................ 38 75.0 75.4 76.7 79.1 81.7Nondurable toys and sport supplies (89) ......................... 39 34.2 36.3 38.9 41.4 43.9Stationery and writing supplies (35) ................................. 40 13.5 14.0 14.4 14.4 14.8Net foreign remittances (109 less 111) ............................ 41 1.6 1.5 1.4 1.1 1.2Magazines, newspapers, and sheet music (88) ............... 42 21.6 21.9 22.9 22.9 22.7Flowers, seeds, and potted plants (93) ............................ 43 12.3 12.9 13.4 13.2 14.4
Services ..................................................................................... 44 2,409.4 2,468.9 2,535.5 2,599.6 2,671.0
Housing ................................................................................... 45 646.8 654.7 674.3 688.2 700.2Owner-occupied nonfarm dwellings—space rent (24) ...... 46 457.8 467.9 479.6 487.2 495.3Tenant-occupied nonfarm dwellings—rent (25) ................ 47 160.5 158.0 165.2 171.1 174.9
Line 1992 1993 1994 1995 1996
Rental value of farm dwellings (26) .................................. 48 5.3 5.2 5.2 5.2 5.1Other (27) ........................................................................... 49 23.1 23.5 24.3 24.8 25.0
Household operation .............................................................. 50 248.2 261.5 270.5 282.9 289.6Electricity (37) .................................................................... 51 77.0 81.4 82.6 84.3 85.2Gas (38) ............................................................................. 52 29.5 30.8 30.0 30.7 32.7Water and other sanitary services (39) ............................ 53 31.1 32.0 33.0 33.8 34.6Telephone and telegraph (41) ........................................... 54 70.3 73.7 79.6 86.6 91.1Domestic service (42) ........................................................ 55 10.9 11.1 11.2 11.7 11.0Other (43) ........................................................................... 56 29.4 32.4 34.2 35.9 35.3
Transportation ......................................................................... 57 158.1 163.1 175.2 185.2 194.6User-operated transportation ............................................. 58 122.2 126.6 136.5 144.9 151.9
Repair, greasing, washing, parking, storage, rental,and leasing (74).
59 94.4 98.7 108.5 116.5 123.3
Other user-operated transportation (76+77) ................. 60 27.8 27.9 28.0 28.4 28.6Purchased local transportation .......................................... 61 8.0 8.2 8.6 8.5 8.5
Mass transit systems (79) ............................................. 62 5.4 5.4 5.7 5.5 5.6Taxicab (80) ................................................................... 63 2.6 2.7 2.9 3.0 3.0
Purchased intercity transportation ..................................... 64 27.9 28.3 30.1 31.7 34.2Railway (82) ................................................................... 65 .8 .8 .7 .7 .7Bus (83) ......................................................................... 66 1.1 1.1 1.1 1.4 1.4Airline (84) ..................................................................... 67 23.3 23.9 25.5 26.8 28.8Other (85) ...................................................................... 68 2.8 2.6 2.8 2.8 3.3
Medical care ........................................................................... 69 646.6 655.3 662.1 674.9 688.1Physicians (47) .................................................................. 70 167.2 163.4 162.4 166.1 169.3Dentists (48) ....................................................................... 71 38.5 38.8 39.8 41.1 42.0Other professional services (49) ....................................... 72 78.2 84.9 89.2 95.6 99.1Hospitals and nursing homes (50) .................................... 73 320.0 327.0 331.5 336.6 343.1Health insurance (56) ........................................................ 74 42.7 41.5 40.0 37.5 36.9
Other ....................................................................................... 75 709.7 734.5 754.0 769.1 799.4Personal care ..................................................................... 76 46.6 46.6 47.5 50.4 50.9
Cleaning, storage, and repair of clothing and shoes(17).
77 11.4 11.0 11.0 11.5 11.3
Barbershops, beauty parlors, and health clubs (22) .... 78 21.8 21.4 21.8 22.9 23.0Other (19) ...................................................................... 79 13.4 14.2 14.7 16.0 16.6
Personal business .............................................................. 80 341.7 351.7 352.1 350.7 363.6Brokerage charges and investment counseling (61) ... 81 30.4 37.3 37.8 41.8 50.0Bank service charges, trust services, and safe
deposit box rental (62).82 28.0 29.0 27.5 27.8 28.9
Services furnished without payment by financialintermediaries except life insurance carriers andprivate noninsured pension plans (63).
83 142.9 144.5 146.5 141.9 143.9
Expense of handling life insurance (64) ....................... 84 67.5 68.3 68.1 67.9 68.5Legal services (65) ........................................................ 85 46.5 45.9 45.3 44.0 45.2Funeral and burial expenses (66) ................................ 86 10.1 10.3 10.1 10.5 10.4Other (67) ...................................................................... 87 16.4 16.8 17.1 17.6 18.7
Recreation .......................................................................... 88 134.0 143.7 149.5 160.8 168.5Admissions to specified spectator amusements (94) 89 16.6 17.8 17.8 18.2 18.9Other (92+98+99+100+101) .......................................... 90 117.5 125.9 131.7 142.5 149.6
Education and research ..................................................... 91 93.1 94.7 96.8 99.4 102.7Higher education (103) .................................................. 92 52.0 52.4 53.1 53.7 54.0Nursery, elementary, and secondary schools (104) .... 93 19.3 19.6 20.4 20.8 21.7Other (105) .................................................................... 94 21.7 22.6 23.4 25.0 27.2
Religious and welfare activities (106) ............................... 95 115.6 118.6 125.6 128.6 136.6Net foreign travel ............................................................... 96 –21.3 –20.8 –17.6 –20.6 –22.7
Foreign travel by U.S. residents (108) ......................... 97 43.4 46.0 48.8 48.9 50.8Less: Expenditures in the United States by
nonresidents (110).98 64.7 66.8 66.4 69.5 73.5
Residual ...................................................................................... 99 –.3 –1.0 –4.3 –8.4 –15.2
NOTE.—Chained (1992) dollar series are calculated as the product of the chain-type quantity index and the 1992current-dollar value of the corresponding series, divided by 100. Because the formula for the chain-type quantityindexes weights of more than one period, the corresponding chained-dollar estimates are usually not additive. Theresidual line is the difference between the first line and the sum of the most detailed lines.
See note to table 2.4 for information on discontinuities in estimates of foreign travel by U.S. residents (line 97)and expenditures in the United States by nonresidents (line 98).
The figures in parentheses are the line numbers of the corresponding items in table 2.4.

August •
Table 2.8.—Personal Income by Type of Income[Billions of dollars; months seasonally adjusted at annual rates]
Year and month Personal in-come
Wage and salary disbursements
Other laborincome
Proprietors’ income withinventory valuation andcapital consumption ad-
justments
Rental in-come ofpersons
with capitalconsump-
tion adjust-ment
Personaldividend in-
come
Personal in-terest in-
come
Transferpayments
Less: Per-sonal con-tributionsfor socialinsurance
All indus-tries
Private in-dustries
Goods-producing
Distributive Service Govern-ment
Farm NonfarmTotal Manufactur-ing
1992 ................. 5,277.2 2,986.4 2,418.6 765.7 583.5 680.3 972.6 567.8 351.3 37.1 386.7 79.4 159.4 667.2 858.2 248.41993 ................. 5,519.2 3,089.6 2,505.3 781.2 592.9 699.4 1,024.7 584.3 385.1 32.4 418.4 105.7 185.3 651.0 912.0 260.31994 ................. 5,791.8 3,240.7 2,638.5 824.4 620.8 741.4 1,072.7 602.2 405.0 36.9 434.7 124.4 204.8 668.1 954.7 277.5
1995 ................. 6,150.8 3,429.5 2,806.5 864.4 648.4 783.1 1,159.0 623.0 406.8 23.4 465.5 132.8 251.9 718.9 1,015.0 293.11996 ................. 6,495.2 3,632.5 2,989.9 909.1 674.7 823.3 1,257.5 642.6 407.6 37.2 483.1 146.3 291.2 735.7 1,068.0 306.3
1992January ............ 5,129.1 2,889.3 2,330.2 749.1 567.7 658.5 922.7 559.0 338.2 34.6 372.8 76.4 152.7 677.7 830.9 243.4February .......... 5,175.1 2,925.3 2,363.5 752.4 572.3 669.8 941.3 561.8 340.8 37.5 374.3 77.2 152.1 673.5 840.1 245.8March ............... 5,188.4 2,934.9 2,371.5 756.7 574.5 670.3 944.5 563.5 343.3 35.4 375.9 78.0 152.0 671.2 844.0 246.4April ................. 5,214.3 2,942.2 2,376.6 759.3 577.2 670.6 946.8 565.5 345.1 34.6 382.4 78.3 153.0 674.9 850.3 246.5May .................. 5,239.2 2,959.0 2,391.8 762.7 580.4 675.7 953.3 567.2 347.5 36.0 383.6 79.4 154.3 673.4 853.6 247.6June ................. 5,259.5 2,967.5 2,398.6 763.7 581.2 674.7 960.2 568.9 350.1 40.6 385.4 80.7 156.2 670.6 856.5 248.1July .................. 5,271.2 2,974.3 2,404.5 764.4 583.1 676.3 963.8 569.8 353.6 40.0 387.3 82.3 158.2 663.5 860.8 248.8August ............. 5,258.8 2,996.5 2,426.4 765.4 582.8 683.4 977.6 570.1 356.0 39.1 387.0 45.2 160.9 660.8 863.6 250.2September ....... 5,303.2 2,993.7 2,424.1 764.1 583.1 684.9 975.1 569.6 358.0 37.8 388.5 81.1 163.2 659.3 871.6 250.0October ............ 5,348.4 3,010.5 2,437.6 766.5 583.2 685.5 985.6 572.9 358.4 37.8 399.9 88.6 166.3 660.7 877.5 251.4November ........ 5,373.0 3,032.7 2,461.0 769.2 585.8 691.7 1,000.1 571.7 360.8 36.6 403.5 91.0 169.7 660.4 870.8 252.5December ........ 5,566.5 3,210.9 2,637.9 815.2 630.2 722.7 1,100.0 573.0 363.9 35.0 399.6 94.1 174.2 660.0 879.2 250.4
1993January ............ 5,366.1 2,975.2 2,390.9 748.2 566.5 679.1 963.6 584.3 371.3 30.0 409.5 99.5 176.5 661.3 897.6 254.9February .......... 5,375.0 2,979.4 2,399.9 752.4 568.2 678.7 968.8 579.4 374.4 29.2 412.3 102.3 177.9 660.4 894.7 255.6March ............... 5,367.2 2,971.7 2,392.3 748.4 565.3 674.8 969.1 579.4 375.7 29.9 410.0 97.4 179.1 659.3 899.4 255.2April ................. 5,483.3 3,064.6 2,484.4 780.1 594.5 693.4 1,010.9 580.2 379.2 36.1 413.9 104.6 180.4 656.3 906.3 258.1May .................. 5,518.3 3,091.9 2,510.3 780.5 592.2 702.0 1,027.9 581.6 383.9 37.5 417.9 105.6 182.0 653.3 906.2 260.1June ................. 5,510.6 3,081.5 2,498.7 779.2 591.9 697.7 1,021.9 582.8 383.8 35.2 416.1 106.6 183.9 651.3 911.7 259.5July .................. 5,517.7 3,097.5 2,513.1 783.2 594.2 702.6 1,027.2 584.4 386.9 26.8 417.7 100.6 185.8 649.8 913.2 260.6August ............. 5,556.9 3,119.4 2,533.2 785.3 595.7 706.3 1,041.7 586.1 390.6 23.4 422.9 108.3 187.7 647.7 918.9 262.1September ....... 5,558.1 3,116.3 2,528.1 791.0 601.5 704.0 1,033.1 588.3 390.9 26.6 421.3 109.5 189.8 645.9 919.8 262.0October ............ 5,580.3 3,130.0 2,542.4 793.2 601.1 708.5 1,040.7 587.6 393.3 32.2 422.3 107.6 191.9 644.2 921.9 263.1November ........ 5,603.7 3,137.7 2,549.6 797.5 604.7 707.2 1,044.9 588.1 394.6 39.0 426.8 111.8 193.7 641.0 922.9 263.8December ........ 5,793.4 3,310.1 2,720.5 835.0 639.0 738.8 1,146.7 589.6 396.7 42.7 430.3 115.0 194.8 641.1 931.2 268.7
1994January ............ 5,562.0 3,138.4 2,543.8 793.5 598.6 715.7 1,034.6 594.6 399.8 46.5 389.8 93.6 190.1 639.5 936.3 272.0February .......... 5,628.0 3,128.5 2,532.1 794.9 598.4 711.9 1,025.3 596.4 398.3 47.9 430.5 120.7 191.8 640.8 941.0 271.4March ............... 5,658.9 3,148.0 2,551.1 802.9 605.2 719.9 1,028.3 596.9 400.4 44.8 432.4 124.0 194.3 643.9 943.9 272.7April ................. 5,740.4 3,214.5 2,615.4 816.1 615.2 732.8 1,066.5 599.1 402.2 41.1 434.9 124.5 197.6 651.0 949.6 275.0May .................. 5,776.6 3,241.8 2,638.1 821.2 618.9 738.9 1,078.1 603.7 405.0 38.8 436.5 126.0 200.3 656.3 948.8 276.8June ................. 5,782.8 3,239.7 2,638.6 824.1 621.2 742.1 1,072.4 601.1 403.9 36.7 436.3 127.5 202.8 661.9 951.0 276.9July .................. 5,811.5 3,256.6 2,654.5 829.0 624.1 745.7 1,079.8 602.1 406.8 34.9 435.6 127.9 205.5 666.9 955.3 278.1August ............. 5,834.2 3,262.2 2,658.7 832.0 626.8 746.4 1,080.3 603.4 406.4 33.2 438.8 130.2 208.4 673.8 959.9 278.5September ....... 5,868.5 3,281.9 2,677.0 837.6 629.8 752.0 1,087.4 604.9 407.5 31.6 440.8 132.1 211.7 681.6 961.1 279.8October ............ 5,928.8 3,319.6 2,713.1 842.9 633.7 764.1 1,106.1 606.5 411.0 31.2 444.3 129.8 215.3 693.5 966.6 282.4November ........ 5,937.6 3,318.6 2,710.8 847.5 637.1 761.3 1,101.9 607.8 409.1 29.3 446.5 128.9 218.9 700.9 967.9 282.4December ........ 5,972.0 3,338.5 2,728.7 851.3 640.6 765.4 1,112.0 609.8 409.3 27.0 450.2 128.0 221.4 706.8 974.7 283.8
1995January ............ 6,039.3 3,366.7 2,751.9 852.5 642.9 770.5 1,128.9 614.8 409.6 22.1 455.8 130.0 241.8 710.6 991.4 288.7February .......... 6,050.3 3,369.6 2,752.0 855.3 643.3 769.2 1,127.5 617.6 407.6 20.3 457.4 130.5 243.3 714.2 996.5 289.0March ............... 6,069.6 3,377.4 2,758.2 856.6 644.0 770.1 1,131.5 619.2 406.4 19.5 459.5 131.1 245.2 717.0 1,003.1 289.5April ................. 6,112.6 3,412.4 2,792.9 859.0 644.9 784.5 1,149.5 619.5 409.3 21.0 459.2 132.1 247.1 718.5 1,005.1 291.9May .................. 6,099.5 3,388.5 2,767.7 856.2 643.4 772.5 1,139.1 620.8 404.7 21.3 462.9 132.4 248.5 719.6 1,012.1 290.4June ................. 6,132.2 3,412.9 2,790.0 860.4 645.4 779.2 1,150.4 623.0 405.8 21.8 467.2 132.4 250.1 720.1 1,014.0 292.1July .................. 6,164.9 3,445.9 2,821.7 864.2 648.0 788.9 1,168.5 624.2 407.9 21.8 465.2 130.5 252.1 717.3 1,018.4 294.2August ............. 6,171.2 3,442.8 2,817.6 867.6 650.3 785.8 1,164.2 625.2 405.8 22.8 469.7 131.2 254.1 717.7 1,021.3 294.0September ....... 6,201.1 3,462.0 2,836.1 871.4 652.3 790.4 1,174.2 626.0 406.3 24.3 471.3 132.7 256.4 718.6 1,024.8 295.3October ............ 6,239.8 3,487.2 2,860.2 875.0 654.1 795.5 1,189.7 627.0 407.5 27.3 471.9 132.3 259.0 722.6 1,028.9 296.9November ........ 6,254.9 3,489.5 2,861.1 877.1 656.0 796.1 1,187.9 628.4 406.0 29.0 473.1 138.6 261.7 724.9 1,029.3 297.0December ........ 6,274.0 3,498.8 2,868.7 877.3 655.7 794.8 1,196.6 630.2 405.3 30.3 472.9 140.4 263.7 725.2 1,035.0 297.6
1996January ............ 6,311.0 3,504.2 2,869.8 874.9 652.9 793.9 1,201.0 634.3 402.8 30.7 473.6 142.1 286.2 721.7 1,048.1 298.2February .......... 6,371.1 3,550.6 2,915.0 891.4 664.4 806.9 1,216.6 635.6 406.3 31.9 478.1 143.5 287.4 722.1 1,052.5 301.2March ............... 6,396.0 3,562.8 2,926.0 888.5 660.0 812.3 1,225.2 636.8 406.0 33.2 480.4 144.7 288.7 723.2 1,058.9 302.0April ................. 6,424.7 3,581.6 2,943.0 901.5 671.5 810.4 1,231.1 638.7 406.4 35.1 483.0 144.2 289.5 724.6 1,063.5 303.2May .................. 6,446.8 3,598.3 2,957.8 905.6 673.5 814.6 1,237.5 640.6 406.5 36.5 484.0 144.5 290.1 727.4 1,063.7 304.2June ................. 6,512.4 3,653.6 3,011.8 911.9 677.3 832.6 1,267.4 641.7 410.9 37.8 483.5 145.1 290.6 731.4 1,067.3 307.7July .................. 6,504.9 3,633.3 2,989.6 912.5 677.3 821.0 1,256.1 643.7 406.9 39.4 484.2 146.7 291.3 738.9 1,070.6 306.3August ............. 6,538.9 3,660.6 3,015.3 918.6 681.4 829.1 1,267.6 645.4 408.2 40.2 482.6 148.0 291.9 743.0 1,072.4 308.1September ....... 6,582.0 3,694.6 3,047.1 920.6 681.8 836.9 1,289.6 647.5 410.2 40.7 484.4 149.2 292.7 746.2 1,074.3 310.2October ............ 6,575.6 3,683.5 3,035.4 921.7 681.8 832.1 1,281.6 648.1 407.2 40.8 485.8 149.2 293.7 747.8 1,077.0 309.4November ........ 6,615.2 3,713.4 3,064.4 926.5 684.7 840.8 1,297.1 649.1 408.7 40.5 487.9 149.2 295.0 749.8 1,081.8 311.3December ........ 6,664.4 3,753.7 3,104.0 935.2 690.4 848.9 1,319.9 649.7 411.4 39.9 490.0 149.1 296.9 751.8 1,085.5 313.8
1997January ............ 6,700.1 3,754.1 3,098.7 936.3 690.5 847.7 1,314.6 655.5 410.5 39.4 492.8 148.5 310.7 754.3 1,105.5 315.8February .......... 6,750.3 3,799.1 3,140.9 943.4 693.4 857.9 1,339.6 658.2 412.5 39.9 494.6 149.3 312.5 757.0 1,104.1 318.7March ............... 6,788.2 3,821.3 3,161.7 948.8 698.4 864.8 1,348.1 659.7 413.9 41.4 495.8 149.2 314.4 760.4 1,111.9 320.1April ................. 6,800.2 3,822.1 3,161.2 950.3 699.5 863.1 1,347.7 660.9 413.4 43.6 497.4 149.0 316.3 763.7 1,114.6 320.1May .................. 6,823.5 3,834.9 3,173.2 953.7 700.4 865.8 1,353.8 661.7 415.1 44.7 498.6 149.0 318.3 766.8 1,117.0 320.9June ................. 6,866.4 3,867.4 3,205.0 955.9 702.3 871.6 1,377.5 662.5 417.0 45.2 501.1 147.7 320.3 769.8 1,120.8 322.9

• August
Table 2.9.—Personal Income and Its Disposition[Months seasonally adjusted at annual rates]
Year and month
Billions of dollars Disposable personal income
Population(mid-period,thousands)
Personal sav-ing as a per-
centage of dis-posable per-sonal income
Personal in-come
Less: Personaltax and nontax
payments
Equals: Dis-posable per-sonal income
Less: Personal outlays
Equals: Per-sonal saving
Total, billionsof chained
(1992) dollars 1
Per capita
TotalPersonal con-sumption ex-
penditures
Interest paidby persons
Personal trans-fer paymentsto rest of theworld (net)
Current dollars Chained(1992) dollars 1
1992 ................. 5,277.2 650.5 4,626.7 4,341.0 4,219.8 111.7 9.6 285.6 4,626.7 18,113 18,113 255,432 6.21993 ................. 5,519.2 690.0 4,829.2 4,580.7 4,459.2 108.2 13.3 248.5 4,703.9 18,706 18,221 258,161 5.11994 ................. 5,791.8 739.1 5,052.7 4,842.1 4,717.0 110.9 14.2 210.6 4,805.1 19,381 18,431 260,705 4.2
1995 ................. 6,150.8 795.1 5,355.7 5,101.1 4,957.7 128.5 14.8 254.6 4,964.2 20,349 18,861 263,194 4.81996 ................. 6,495.2 886.9 5,608.3 5,368.8 5,207.6 145.2 15.9 239.6 5,076.9 21,117 19,116 265,579 4.3
1992January ............ 5,129.1 634.7 4,494.4 4,234.2 4,112.1 112.7 9.4 260.2 4,558.1 17,685 17,936 254,137 5.8February .......... 5,175.1 642.1 4,533.0 4,247.8 4,125.2 113.1 9.4 285.2 4,584.2 17,823 18,025 254,329 6.3March ............... 5,188.4 633.3 4,555.2 4,267.8 4,145.6 112.8 9.4 287.3 4,592.0 17,895 18,040 254,548 6.3April ................. 5,214.3 637.5 4,576.7 4,279.3 4,157.3 112.3 9.7 297.5 4,601.3 17,963 18,060 254,785 6.5May .................. 5,239.2 640.2 4,599.1 4,308.0 4,186.3 112.0 9.7 291.1 4,614.1 18,033 18,092 255,030 6.3June ................. 5,259.5 642.3 4,617.2 4,327.1 4,205.6 111.8 9.7 290.1 4,621.7 18,087 18,105 255,281 6.3July .................. 5,271.2 646.5 4,624.8 4,352.8 4,232.1 111.5 9.2 272.0 4,611.9 18,097 18,047 255,548 5.9August ............. 5,258.8 652.2 4,606.6 4,329.2 4,208.6 111.4 9.2 277.4 4,605.2 18,007 18,002 255,819 6.0September ....... 5,303.2 653.3 4,649.9 4,396.4 4,276.0 111.2 9.2 253.5 4,624.1 18,158 18,057 256,079 5.5October ............ 5,348.4 658.9 4,689.4 4,428.4 4,307.5 111.0 9.9 261.0 4,645.1 18,295 18,122 256,324 5.6November ........ 5,373.0 663.7 4,709.3 4,444.6 4,324.3 110.4 9.9 264.7 4,657.6 18,357 18,155 256,547 5.6December ........ 5,566.5 701.9 4,864.6 4,476.9 4,357.0 109.9 9.9 387.8 4,804.8 18,946 18,713 256,760 8.0
1993January ............ 5,366.1 661.0 4,705.1 4,488.5 4,365.2 110.2 13.1 216.6 4,632.8 18,311 18,029 256,961 4.6February .......... 5,375.0 663.1 4,711.9 4,500.6 4,377.3 110.2 13.1 211.3 4,624.8 18,324 17,985 257,148 4.5March ............... 5,367.2 663.2 4,704.0 4,476.2 4,353.7 109.4 13.1 227.8 4,609.3 18,279 17,911 257,346 4.8April ................. 5,483.3 682.2 4,801.1 4,535.7 4,413.4 109.2 13.1 265.4 4,691.1 18,641 18,214 257,558 5.5May .................. 5,518.3 687.8 4,830.5 4,543.6 4,422.7 107.9 13.1 286.9 4,714.4 18,739 18,288 257,781 5.9June ................. 5,510.6 686.7 4,823.9 4,569.2 4,448.2 108.0 13.1 254.7 4,706.2 18,696 18,240 258,017 5.3July .................. 5,517.7 691.2 4,826.5 4,594.3 4,473.2 107.7 13.4 232.2 4,703.7 18,688 18,213 258,266 4.8August ............. 5,556.9 697.0 4,859.9 4,607.9 4,486.6 108.0 13.4 252.0 4,727.1 18,799 18,286 258,518 5.2September ....... 5,558.1 698.3 4,859.9 4,627.1 4,505.9 107.9 13.4 232.7 4,720.0 18,781 18,241 258,764 4.8October ............ 5,580.3 702.8 4,877.5 4,657.5 4,536.8 107.1 13.7 220.0 4,715.9 18,833 18,209 258,991 4.5November ........ 5,603.7 705.9 4,897.9 4,674.2 4,554.2 106.3 13.7 223.7 4,727.7 18,897 18,240 259,194 4.6December ........ 5,793.4 740.5 5,052.9 4,693.9 4,573.8 106.4 13.7 359.0 4,873.8 19,480 18,790 259,388 7.1
1994January ............ 5,562.0 711.8 4,850.2 4,681.6 4,559.6 107.9 14.0 168.7 4,677.1 18,686 18,019 259,560 3.5February .......... 5,628.0 711.0 4,917.0 4,757.2 4,635.8 107.3 14.0 159.9 4,728.3 18,932 18,205 259,726 3.3March ............... 5,658.9 715.8 4,943.0 4,775.8 4,654.4 107.4 14.0 167.2 4,740.4 19,017 18,238 259,928 3.4April ................. 5,740.4 780.6 4,959.7 4,784.7 4,662.8 107.8 14.1 175.0 4,748.3 19,066 18,253 260,138 3.5May .................. 5,776.6 735.7 5,040.9 4,797.8 4,675.3 108.5 14.1 243.1 4,818.9 19,362 18,510 260,345 4.8June ................. 5,782.8 735.2 5,047.6 4,827.3 4,703.5 109.8 14.1 220.3 4,811.2 19,371 18,464 260,571 4.4July .................. 5,811.5 737.5 5,074.0 4,841.7 4,718.0 109.6 14.2 232.3 4,818.9 19,455 18,477 260,804 4.6August ............. 5,834.2 738.8 5,095.3 4,886.3 4,760.9 111.3 14.2 209.0 4,822.8 19,519 18,475 261,040 4.1September ....... 5,868.5 743.2 5,125.3 4,900.4 4,772.9 113.3 14.2 224.9 4,840.3 19,616 18,526 261,275 4.4October ............ 5,928.8 751.6 5,177.2 4,935.0 4,806.4 114.2 14.4 242.2 4,877.5 19,799 18,653 261,494 4.7November ........ 5,937.6 751.8 5,185.8 4,953.7 4,823.2 116.1 14.4 232.1 4,877.1 19,816 18,637 261,695 4.5December ........ 5,972.0 755.7 5,216.3 4,963.4 4,830.9 118.1 14.4 252.9 4,900.0 19,918 18,710 261,888 4.8
1995January ............ 6,039.3 765.3 5,273.9 5,006.0 4,871.3 120.2 14.5 267.9 4,936.8 20,125 18,839 262,057 5.1February .......... 6,050.3 766.1 5,284.3 4,995.6 4,860.3 120.8 14.5 288.7 4,936.3 20,152 18,825 262,223 5.5March ............... 6,069.6 768.1 5,301.5 5,020.4 4,883.6 122.2 14.5 281.1 4,943.4 20,202 18,837 262,427 5.3April ................. 6,112.6 826.3 5,286.3 5,032.8 4,895.4 123.0 14.3 253.5 4,916.5 20,128 18,720 262,639 4.8May .................. 6,099.5 775.2 5,324.3 5,073.0 4,933.8 124.9 14.3 251.3 4,945.1 20,257 18,814 262,842 4.7June ................. 6,132.2 783.9 5,348.3 5,117.1 4,975.1 127.6 14.3 231.3 4,961.3 20,331 18,860 263,060 4.3July .................. 6,164.9 794.1 5,370.7 5,108.9 4,965.5 128.5 14.9 261.8 4,973.1 20,399 18,888 263,289 4.9August ............. 6,171.2 797.4 5,373.8 5,155.2 5,010.0 130.3 14.9 218.6 4,963.6 20,392 18,835 263,525 4.1September ....... 6,201.1 805.0 5,396.1 5,145.1 4,996.4 133.9 14.9 250.9 4,982.2 20,458 18,889 263,767 4.7October ............ 6,239.8 814.4 5,425.4 5,146.4 4,996.0 134.9 15.4 279.0 4,998.5 20,552 18,935 263,984 5.1November ........ 6,254.9 819.4 5,435.5 5,187.2 5,034.6 137.1 15.4 248.3 5,005.7 20,576 18,949 264,172 4.6December ........ 6,274.0 826.3 5,447.7 5,225.2 5,070.6 139.2 15.4 222.6 5,007.7 20,608 18,943 264,351 4.1
1996January ............ 6,311.0 827.6 5,483.4 5,223.8 5,068.9 139.5 15.4 259.7 5,027.2 20,731 19,006 264,505 4.7February .......... 6,371.1 842.2 5,528.9 5,278.2 5,122.8 140.0 15.4 250.7 5,056.3 20,890 19,105 264,667 4.5March ............... 6,396.0 850.1 5,545.8 5,281.8 5,125.8 140.7 15.4 264.0 5,059.2 20,938 19,101 264,870 4.8April ................. 6,424.7 909.4 5,515.3 5,333.4 5,176.1 141.5 15.8 181.9 5,015.7 20,807 18,923 265,066 3.3May .................. 6,446.8 868.8 5,578.0 5,359.2 5,200.5 142.9 15.8 218.8 5,065.0 21,029 19,095 265,253 3.9June ................. 6,512.4 885.1 5,627.3 5,350.8 5,190.6 144.4 15.8 276.5 5,103.2 21,199 19,224 265,456 4.9July .................. 6,504.9 885.9 5,619.0 5,379.5 5,216.8 146.8 15.9 239.5 5,079.7 21,150 19,120 265,669 4.3August ............. 6,538.9 897.0 5,641.9 5,389.2 5,226.4 146.9 15.9 252.6 5,094.4 21,219 19,160 265,886 4.5September ....... 6,582.0 909.1 5,673.0 5,403.2 5,238.8 148.5 15.9 269.8 5,110.3 21,318 19,204 266,106 4.8October ............ 6,575.6 909.4 5,666.2 5,450.0 5,285.4 147.9 16.7 216.3 5,087.2 21,277 19,103 266,308 3.8November ........ 6,615.2 921.7 5,693.5 5,470.2 5,302.7 150.8 16.7 223.3 5,101.1 21,364 19,142 266,492 3.9December ........ 6,664.4 936.8 5,727.6 5,505.9 5,336.4 152.8 16.7 221.7 5,123.0 21,478 19,211 266,672 3.9
1997January ............ 6,700.1 942.3 5,757.8 5,565.9 5,396.7 152.2 17.0 191.9 5,142.3 21,579 19,272 266,826 3.3February .......... 6,750.3 957.7 5,792.7 5,578.5 5,409.7 151.7 17.0 214.2 5,159.4 21,697 19,326 266,975 3.7March ............... 6,788.2 967.0 5,821.2 5,579.5 5,410.8 151.6 17.0 241.7 5,181.4 21,789 19,394 267,161 4.2April ................. 6,800.2 972.6 5,827.5 5,584.0 5,413.9 152.7 17.4 243.5 5,182.6 21,797 19,385 267,354 4.2May .................. 6,823.5 981.1 5,842.4 5,600.6 5,430.4 152.8 17.4 241.8 5,197.6 21,838 19,427 267,541 4.1June ................. 6,866.4 992.3 5,874.1 5,615.6 5,445.1 153.2 17.4 258.5 5,219.1 21,940 19,493 267,740 4.4
1. Equals disposable personal income deflated by the implicit price deflator for personal consumption expenditures.

August •
Table 2.10.—Personal Consumption Expenditures by Major Type ofProduct
[Billions of dollars; months seasonally adjusted at annual rates]
Year and month Personal consump-tion expenditures Durable goods Nondurable goods Services
1992 ................ 4,219.8 488.5 1,321.8 2,409.41993 ................ 4,459.2 530.2 1,370.7 2,558.41994 ................ 4,717.0 579.5 1,428.4 2,709.1
1995 ................ 4,957.7 608.5 1,475.8 2,873.41996 ................ 5,207.6 634.5 1,534.7 3,038.4
1992January ............ 4,112.1 473.3 1,303.7 2,335.0February .......... 4,125.2 478.7 1,303.7 2,342.9March .............. 4,145.6 470.2 1,302.0 2,373.3April ................. 4,157.3 469.3 1,304.2 2,383.8May .................. 4,186.3 483.3 1,311.6 2,391.4June ................. 4,205.6 491.4 1,309.4 2,404.7July .................. 4,232.1 487.8 1,318.4 2,425.9August ............. 4,208.6 492.8 1,329.5 2,386.3September ....... 4,276.0 496.9 1,331.0 2,448.1October ............ 4,307.5 505.4 1,344.8 2,457.3November ........ 4,324.3 496.8 1,349.3 2,478.3December ........ 4,357.0 516.4 1,354.3 2,486.2
1993January ............ 4,365.2 519.8 1,359.1 2,486.3February .......... 4,377.3 501.9 1,361.3 2,514.0March .............. 4,353.7 497.4 1,342.9 2,513.4April ................. 4,413.4 520.0 1,365.6 2,527.8May .................. 4,422.7 525.0 1,366.6 2,531.1June ................. 4,448.2 527.6 1,366.7 2,554.0July .................. 4,473.2 539.0 1,372.1 2,562.2August ............. 4,486.6 535.8 1,372.4 2,578.3September ....... 4,505.9 536.8 1,377.3 2,591.8October ............ 4,536.8 548.1 1,385.6 2,603.0November ........ 4,554.2 553.6 1,387.9 2,612.8December ........ 4,573.8 557.6 1,390.6 2,625.6
1994January ............ 4,559.6 550.4 1,385.1 2,624.0February .......... 4,635.8 567.2 1,407.7 2,660.9March .............. 4,654.4 572.0 1,420.2 2,662.1April ................. 4,662.8 578.1 1,408.4 2,676.4May .................. 4,675.3 567.5 1,414.3 2,693.5June ................. 4,703.5 571.6 1,425.2 2,706.6July .................. 4,718.0 576.8 1,431.3 2,709.9August ............. 4,760.9 587.0 1,442.5 2,731.4September ....... 4,772.9 586.1 1,444.6 2,742.2October ............ 4,806.4 595.3 1,451.3 2,759.8November ........ 4,823.2 603.1 1,454.1 2,766.1December ........ 4,830.9 599.4 1,455.7 2,775.9
1995January ............ 4,871.3 604.0 1,474.1 2,793.2February .......... 4,860.3 587.3 1,454.6 2,818.4March .............. 4,883.6 599.5 1,459.2 2,824.8April ................. 4,895.4 588.6 1,464.7 2,842.1May .................. 4,933.8 603.4 1,474.5 2,855.9June ................. 4,975.1 616.4 1,478.0 2,880.7July .................. 4,965.5 608.6 1,476.6 2,880.3August ............. 5,010.0 626.4 1,479.7 2,903.9September ....... 4,996.4 613.1 1,484.9 2,898.4October ............ 4,996.0 608.2 1,478.8 2,909.1November ........ 5,034.6 616.8 1,487.6 2,930.3December ........ 5,070.6 630.4 1,497.1 2,943.1
1996January ............ 5,068.9 615.3 1,498.4 2,955.2February .......... 5,122.8 638.6 1,511.4 2,972.8March .............. 5,125.8 626.3 1,514.6 2,984.9April ................. 5,176.1 641.0 1,531.2 3,003.9May .................. 5,200.5 644.7 1,534.7 3,021.1June ................. 5,190.6 630.1 1,530.9 3,029.6July .................. 5,216.8 631.5 1,536.4 3,048.9August ............. 5,226.4 641.1 1,533.5 3,051.9September ....... 5,238.8 630.8 1,545.0 3,063.0October ............ 5,285.4 638.8 1,557.8 3,088.8November ........ 5,302.7 638.4 1,558.1 3,106.2December ........ 5,336.4 637.4 1,564.6 3,134.5
1997January ............ 5,396.7 661.0 1,584.5 3,151.1February .......... 5,409.7 659.8 1,589.0 3,160.9March .............. 5,410.8 654.4 1,588.6 3,167.8April ................. 5,413.9 642.9 1,577.0 3,194.0May .................. 5,430.4 646.4 1,577.7 3,206.3June ................. 5,445.1 642.7 1,582.1 3,220.3
Table 2.11.—Real Personal Consumption Expenditures by Major Type ofProduct
[Billions of chained (1992) dollars; months seasonally adjusted at annual rates]
Year and month Personal consump-tion expenditures Durable goods Nondurable goods Services
1992 ................ 4,219.8 488.5 1,321.8 2,409.41993 ................ 4,343.6 523.8 1,351.0 2,468.91994 ................ 4,486.0 561.2 1,389.9 2,535.5
1995 ................ 4,595.3 583.6 1,412.6 2,599.61996 ................ 4,714.1 611.1 1,432.3 2,671.0
1992January ............ 4,170.3 477.3 1,317.5 2,375.5February .......... 4,171.9 480.3 1,315.5 2,375.8March .............. 4,179.1 470.6 1,310.1 2,398.5April ................. 4,179.6 469.6 1,310.8 2,399.3May .................. 4,199.9 482.5 1,316.0 2,401.3June ................. 4,209.7 491.3 1,309.2 2,409.1July .................. 4,220.4 487.4 1,314.7 2,418.2August ............. 4,207.3 492.1 1,324.4 2,390.9September ....... 4,252.3 496.3 1,324.3 2,431.7October ............ 4,266.8 503.5 1,336.1 2,427.2November ........ 4,276.8 494.7 1,340.2 2,441.9December ........ 4,303.4 516.7 1,343.1 2,443.7
1993January ............ 4,298.1 517.2 1,346.1 2,435.0February .......... 4,296.4 499.5 1,342.6 2,454.3March .............. 4,266.0 495.4 1,323.8 2,446.7April ................. 4,312.3 515.1 1,345.5 2,451.8May .................. 4,316.4 520.4 1,347.0 2,449.2June ................. 4,339.7 522.3 1,350.9 2,466.6July .................. 4,359.4 533.0 1,355.6 2,471.1August ............. 4,364.0 528.4 1,354.0 2,481.7September ....... 4,376.2 528.2 1,360.8 2,487.3October ............ 4,386.4 537.3 1,360.7 2,488.6November ........ 4,396.0 542.2 1,361.0 2,493.0December ........ 4,411.7 546.8 1,363.6 2,501.5
1994January ............ 4,396.8 539.4 1,360.4 2,497.2February .......... 4,457.8 554.9 1,381.8 2,521.5March .............. 4,463.6 557.7 1,392.8 2,513.9April ................. 4,464.1 563.9 1,379.9 2,520.8May .................. 4,469.4 550.5 1,385.6 2,533.5June ................. 4,483.2 552.9 1,390.9 2,539.7July .................. 4,480.8 556.0 1,389.5 2,535.7August ............. 4,506.2 565.3 1,395.1 2,546.4September ....... 4,507.6 563.9 1,394.9 2,549.3October ............ 4,528.2 573.4 1,401.3 2,554.2November ........ 4,536.1 580.0 1,403.5 2,553.6December ........ 4,538.0 576.3 1,402.6 2,559.9
1995January ............ 4,560.0 579.7 1,420.5 2,561.0February .......... 4,540.2 563.0 1,400.5 2,576.7March .............. 4,553.7 574.0 1,404.0 2,576.1April ................. 4,553.0 562.9 1,406.1 2,583.9May .................. 4,582.4 578.6 1,412.9 2,591.3June ................. 4,615.1 591.6 1,415.7 2,608.3July .................. 4,597.9 584.2 1,411.8 2,602.2August ............. 4,627.6 600.5 1,413.1 2,614.8September ....... 4,613.2 587.6 1,416.9 2,609.2October ............ 4,602.9 583.5 1,407.8 2,611.6November ........ 4,636.5 592.8 1,417.6 2,626.4December ........ 4,661.0 604.8 1,423.7 2,633.4
1996January ............ 4,647.1 589.6 1,416.7 2,640.5February .......... 4,684.9 612.5 1,427.4 2,646.0March .............. 4,676.0 599.8 1,423.4 2,652.8April ................. 4,707.3 615.4 1,431.4 2,661.2May .................. 4,722.2 621.2 1,432.9 2,669.0June ................. 4,707.1 607.6 1,430.5 2,669.2July .................. 4,716.1 609.0 1,432.7 2,674.5August ............. 4,719.3 618.5 1,431.6 2,670.0September ....... 4,719.2 608.0 1,437.5 2,673.9October ............ 4,745.2 616.0 1,443.7 2,686.1November ........ 4,751.0 617.2 1,439.3 2,694.7December ........ 4,773.1 618.2 1,440.7 2,714.0
1997January ............ 4,819.8 641.2 1,456.0 2,724.2February .......... 4,818.3 638.4 1,458.1 2,723.2March .............. 4,816.1 633.8 1,459.2 2,724.2April ................. 4,814.7 626.0 1,446.3 2,741.8May .................. 4,831.0 631.1 1,449.6 2,749.9June ................. 4,837.9 628.4 1,454.2 2,754.6
NOTE.—Chained (1992) dollar series are calculated as the product of the chain-type quantity index and the 1992current-dollar value of the corresponding series, divided by 100. Because the formula for the chain-type quantityindexes uses weights of more than one period, the corresponding chained-dollar estimates are usually not additive.

• August
. Government Receipts and Expenditures
Table 3.1.—Government Receipts and Current Expenditures[Billions of dollars]
Line 1992 1993 1994 1995 1996
Seasonally adjusted at annual rates
1992 1993 1994
IV I II III IV I II
Receipts ................................................................................................................................ 1 1,870.6 1,983.7 2,124.7 2,250.2 2,412.7 1,921.8 1,917.5 1,970.8 1,989.8 2,056.7 2,051.9 2,125.9
Personal tax and nontax receipts .................................................................................................. 2 650.5 690.0 739.1 795.1 886.9 674.8 662.5 685.6 695.5 716.4 712.9 750.5Corporate profits tax accruals ....................................................................................................... 3 143.0 165.2 186.6 213.2 229.0 149.7 149.2 165.4 161.2 184.9 163.0 182.8Indirect business tax and nontax accruals ................................................................................... 4 505.6 532.5 568.5 582.8 604.8 521.7 520.6 525.9 534.4 549.4 556.9 564.4Contributions for social insurance ................................................................................................. 5 571.4 596.0 630.5 659.1 692.0 575.7 585.3 594.0 598.7 606.1 619.2 628.2
Current expenditures .......................................................................................................... 6 2,065.2 2,146.9 2,214.5 2,321.6 2,417.8 2,109.1 2,118.0 2,138.7 2,153.4 2,177.6 2,176.2 2,194.3
Consumption expenditures ............................................................................................................ 7 1,054.7 1,078.9 1,107.0 1,142.1 1,182.4 1,071.3 1,068.6 1,074.7 1,082.0 1,090.4 1,094.0 1,098.4
Transfer payments (net) ................................................................................................................ 8 852.3 907.1 947.3 1,001.5 1,058.3 879.1 887.5 900.9 910.8 929.3 928.5 939.2To persons ................................................................................................................................. 9 835.7 889.8 930.9 990.0 1,042.0 853.0 874.9 886.0 895.3 903.1 917.3 926.2To the rest of the world (net) ................................................................................................... 10 16.6 17.3 16.4 11.5 16.3 26.1 12.6 14.8 15.5 26.2 11.2 12.9
Net interest paid ............................................................................................................................. 11 141.2 140.3 144.9 165.2 165.4 137.6 139.1 140.8 141.0 140.2 136.7 142.1Interest paid ............................................................................................................................... 12 282.7 279.0 286.4 314.1 317.7 279.4 278.4 279.6 279.6 278.4 275.5 282.4
To persons and business ..................................................................................................... 13 242.2 237.4 239.4 252.8 246.4 238.8 237.6 238.7 237.4 235.9 232.3 237.5To the rest of the world ........................................................................................................ 14 40.5 41.6 47.0 61.3 71.3 40.6 40.8 40.8 42.2 42.4 43.2 44.9
Less: Interest received by government ..................................................................................... 15 141.5 138.7 141.5 148.9 152.3 141.9 139.3 138.8 138.6 138.2 138.8 140.3
Less: Dividends received by government ..................................................................................... 16 10.1 10.5 11.4 12.5 13.6 10.3 10.2 10.4 10.5 10.8 11.1 11.3
Subsidies less current surplus of government enterprises .......................................................... 17 27.1 31.1 26.6 25.2 25.4 31.5 33.0 32.8 30.2 28.5 28.1 25.9Subsidies .................................................................................................................................... 18 32.3 37.0 33.7 34.0 33.5 34.7 36.2 37.3 37.6 37.0 35.3 33.9Less: Current surplus of government enterprises .................................................................... 19 5.1 5.9 7.1 8.8 8.1 3.2 3.2 4.5 7.4 8.5 7.1 8.0
Less: Wage accruals less disbursements ..................................................................................... 20 0 0 0 0 0 0 0 0 0 0 0 0
Current surplus or deficit (–), national income and product accounts ...................... 21 –194.6 –163.2 –89.8 –71.4 –5.1 –187.3 –200.4 –167.9 –163.6 –120.9 –124.3 –68.4
Social insurance funds ................................................................................................................... 22 116.4 112.3 128.1 124.7 126.6 116.0 108.7 112.4 112.0 116.2 123.0 127.6Other ............................................................................................................................................... 23 –311.0 –275.5 –217.9 –196.0 –131.7 –303.3 –309.2 –280.3 –275.6 –237.1 –247.2 –196.0
Line
Seasonally adjusted at annual rates
1994 1995 1996 1997
III IV I II III IV I II III IV I II
Receipts ................................................................................................................................ 1 2,141.1 2,179.8 2,205.2 2,240.3 2,264.2 2,291.3 2,337.5 2,407.6 2,426.7 2,479.0 2,526.6 ...............
Personal tax and nontax receipts .................................................................................................. 2 739.9 753.0 766.5 795.1 798.9 820.0 840.0 887.8 897.3 922.6 955.7 982.0Corporate profits tax accruals ....................................................................................................... 3 194.6 206.2 209.6 209.1 218.8 215.3 226.2 232.2 231.6 226.0 241.2 ...............Indirect business tax and nontax accruals ................................................................................... 4 573.2 579.4 578.9 580.9 584.0 587.3 594.0 599.0 600.9 625.3 610.2 616.4Contributions for social insurance ................................................................................................. 5 633.4 641.2 650.1 655.1 662.4 668.6 677.3 688.7 696.8 705.1 719.5 726.8
Current expenditures .......................................................................................................... 6 2,230.3 2,257.3 2,289.0 2,314.1 2,339.5 2,343.6 2,387.0 2,404.8 2,423.6 2,455.8 2,477.4 2,501.7
Consumption expenditures ............................................................................................................ 7 1,119.0 1,116.8 1,131.7 1,140.2 1,151.4 1,145.1 1,162.2 1,180.7 1,189.8 1,197.0 1,209.7 1,224.4
Transfer payments (net) ................................................................................................................ 8 950.5 971.2 984.4 996.5 1,007.7 1,017.4 1,046.7 1,050.2 1,058.2 1,078.0 1,091.0 1,100.5To persons ................................................................................................................................. 9 934.8 945.4 972.4 985.6 996.4 1,005.7 1,027.6 1,039.0 1,046.3 1,055.1 1,080.5 1,090.5To the rest of the world (net) ................................................................................................... 10 15.7 25.8 12.0 11.0 11.3 11.8 19.2 11.2 11.9 22.9 10.5 9.9
Net interest paid ............................................................................................................................. 11 147.2 153.6 160.2 164.5 167.5 168.6 166.0 162.3 164.4 168.8 164.9 165.6Interest paid ............................................................................................................................... 12 289.1 298.6 307.4 313.9 316.6 318.5 317.4 314.6 318.1 320.7 317.9 319.0
To persons and business ..................................................................................................... 13 241.8 245.9 250.5 253.7 253.4 253.8 252.7 247.3 244.1 241.3 233.3 228.6To the rest of the world ........................................................................................................ 14 47.3 52.6 57.0 60.2 63.2 64.7 64.7 67.3 74.0 79.4 84.6 90.4
Less: Interest received by government ..................................................................................... 15 142.0 145.0 147.3 149.4 149.1 149.9 151.4 152.3 153.7 152.0 153.0 153.5
Less: Dividends received by government ..................................................................................... 16 11.4 11.7 12.1 12.3 12.6 12.9 13.3 13.6 13.7 14.0 14.3 14.7
Subsidies less current surplus of government enterprises .......................................................... 17 25.1 27.4 24.8 25.1 25.7 25.5 25.3 25.2 24.9 26.0 26.1 25.9Subsidies .................................................................................................................................... 18 33.0 32.7 33.8 34.0 34.1 34.1 33.4 33.3 33.5 33.7 34.1 34.6Less: Current surplus of government enterprises .................................................................... 19 7.9 5.3 9.1 8.9 8.5 8.6 8.0 8.1 8.5 7.7 8.0 8.7
Less: Wage accruals less disbursements ..................................................................................... 20 0 0 0 0 0 0 0 0 0 0 0 0
Current surplus or deficit (–), national income and product accounts ...................... 21 –89.2 –77.5 –83.8 –73.8 –75.4 –52.4 –49.6 2.8 3.1 23.2 49.2 ...............
Social insurance funds ................................................................................................................... 22 129.7 132.1 125.5 122.5 124.5 126.1 119.9 124.7 129.7 132.0 129.9 131.8Other ............................................................................................................................................... 23 –218.8 –209.6 –209.3 –196.4 –199.9 –178.5 –169.5 –121.9 –126.6 –108.8 –80.7 ...............

August •
Table 3.2.—Federal Government Receipts and Current Expenditures[Billions of dollars]
Line 1992 1993 1994 1995 1996
Seasonally adjusted at annual rates
1992 1993 1994
IV I II III IV I II
Receipts ................................................................................................................................ 1 1,198.5 1,275.1 1,374.8 1,463.2 1,587.6 1,230.5 1,227.1 1,268.8 1,277.2 1,327.2 1,324.5 1,381.1
Personal tax and nontax receipts .................................................................................................. 2 490.8 522.6 562.3 605.8 686.7 510.0 500.8 519.1 527.1 543.4 542.0 574.3Income taxes ............................................................................................................................. 3 478.1 508.1 545.3 588.7 666.8 496.6 487.2 505.0 512.8 527.5 524.8 556.3Estate and gift taxes ................................................................................................................. 4 11.3 12.9 15.1 14.9 17.5 12.0 12.1 12.5 12.7 14.2 15.5 16.1Nontaxes .................................................................................................................................... 5 1.4 1.6 1.9 2.2 2.5 1.5 1.5 1.5 1.6 1.7 1.8 1.9
Corporate profits tax accruals ....................................................................................................... 6 118.6 138.3 156.7 182.1 194.5 123.7 125.2 138.5 135.0 154.5 136.9 153.4Federal Reserve banks ............................................................................................................. 7 16.8 16.0 20.5 23.4 20.1 15.7 16.4 16.0 15.7 15.8 18.6 19.5Other .......................................................................................................................................... 8 101.9 122.3 136.3 158.7 174.4 108.0 108.8 122.5 119.2 138.7 118.3 133.9
Indirect business tax and nontax accruals ................................................................................... 9 81.9 86.9 98.7 93.5 95.8 86.5 82.6 85.5 85.9 93.8 98.2 98.1Excise taxes ............................................................................................................................... 10 45.9 48.8 59.3 58.1 56.4 46.9 45.5 46.8 47.4 55.5 58.4 59.4Customs duties .......................................................................................................................... 11 18.3 19.9 21.1 19.4 19.2 18.9 18.6 20.5 20.5 19.8 20.5 21.0Nontaxes .................................................................................................................................... 12 17.7 18.3 18.2 16.1 20.2 20.7 18.5 18.2 18.0 18.5 19.3 17.8
Contributions for social insurance ................................................................................................. 13 507.1 527.3 557.1 581.8 610.5 510.3 518.5 525.8 529.3 535.5 547.4 555.3
Current expenditures .......................................................................................................... 14 1,479.4 1,525.7 1,561.4 1,637.6 1,698.1 1,509.5 1,505.3 1,518.0 1,527.8 1,551.9 1,533.5 1,544.3
Consumption expenditures ............................................................................................................ 15 451.0 447.3 443.2 443.5 451.5 457.7 447.1 445.8 447.0 449.2 442.4 439.2
Transfer payments (net) ................................................................................................................ 16 625.1 659.9 683.0 720.9 763.5 643.3 647.1 655.7 661.3 675.5 670.6 676.9To persons ................................................................................................................................. 17 608.5 642.6 666.6 709.4 747.2 617.2 634.5 640.9 645.8 649.3 659.5 663.9To the rest of the world (net) ................................................................................................... 18 16.6 17.3 16.4 11.5 16.3 26.1 12.6 14.8 15.5 26.2 11.2 12.9
Grants-in-aid to State and local governments .............................................................................. 19 172.2 185.8 199.2 211.9 218.3 176.3 177.2 181.9 187.3 196.9 194.5 196.2
Net interest paid ............................................................................................................................. 20 195.8 192.7 200.0 224.8 227.1 191.8 192.2 193.1 192.9 192.5 189.9 196.6Interest paid ............................................................................................................................... 21 217.9 214.5 222.7 250.0 253.1 214.6 213.7 215.0 215.2 214.2 211.7 218.7
To persons and business ..................................................................................................... 22 177.4 173.0 175.7 188.7 181.8 174.0 172.9 174.1 173.0 171.7 168.4 173.8To the rest of the world ........................................................................................................ 23 40.5 41.6 47.0 61.3 71.3 40.6 40.8 40.8 42.2 42.4 43.2 44.9
Less: Interest received by government ..................................................................................... 24 22.0 21.8 22.7 25.2 26.0 22.8 21.5 21.9 22.3 21.7 21.8 22.1
Subsidies less current surplus of government enterprises .......................................................... 25 35.1 40.1 35.9 36.4 37.7 40.3 41.7 41.6 39.2 37.8 36.0 35.4Subsidies .................................................................................................................................... 26 31.9 36.7 33.4 33.7 33.1 34.3 35.8 36.9 37.2 36.7 34.9 33.6Less: Current surplus of government enterprises .................................................................... 27 –3.3 –3.4 –2.6 –2.7 –4.6 –6.1 –5.9 –4.6 –2.1 –1.1 –1.1 –1.8
Less: Wage accruals less disbursements ..................................................................................... 28 0 0 0 0 0 0 0 0 0 0 0 0
Current surplus or deficit (–), national income and product accounts ...................... 29 –280.9 –250.7 –186.7 –174.4 –110.5 –279.0 –278.2 –249.2 –250.6 –224.6 –209.0 –163.2
Social insurance funds ................................................................................................................... 30 48.4 44.6 59.2 54.1 55.3 47.6 41.0 44.6 44.3 48.3 54.6 58.7Other ............................................................................................................................................... 31 –329.3 –295.2 –245.8 –228.6 –165.8 –326.6 –319.2 –293.8 –294.9 –273.0 –263.6 –221.9
Line
Seasonally adjusted at annual rates
1994 1995 1996 1997
III IV I II III IV I II III IV I II
Receipts ................................................................................................................................ 1 1,383.8 1,409.5 1,429.0 1,459.0 1,472.8 1,491.9 1,526.3 1,583.8 1,598.6 1,641.6 1,675.3 ...............
Personal tax and nontax receipts .................................................................................................. 2 561.6 571.1 581.4 608.2 607.5 626.0 644.9 688.8 695.7 717.5 746.9 770.7Income taxes ............................................................................................................................. 3 545.3 554.8 565.2 592.0 590.0 607.7 626.5 668.6 674.8 697.2 725.0 747.0Estate and gift taxes ................................................................................................................. 4 14.4 14.3 14.2 14.0 15.3 15.9 16.1 17.8 18.4 17.7 19.3 21.1Nontaxes .................................................................................................................................... 5 1.9 2.0 2.1 2.2 2.2 2.3 2.4 2.4 2.5 2.6 2.6 2.6
Corporate profits tax accruals ....................................................................................................... 6 163.4 173.2 179.0 178.7 186.9 183.8 192.1 197.2 196.7 192.0 204.9 ...............Federal Reserve banks ............................................................................................................. 7 20.9 22.9 22.8 23.8 23.6 23.3 19.9 20.0 20.1 20.4 20.9 ...............Other .......................................................................................................................................... 8 142.5 150.3 156.2 154.9 163.2 160.5 172.2 177.2 176.6 171.7 184.0 ...............
Indirect business tax and nontax accruals ................................................................................... 9 99.3 99.0 94.3 93.8 93.7 92.2 91.7 90.0 91.5 110.2 88.2 92.2Excise taxes ............................................................................................................................... 10 59.6 60.1 58.6 58.2 57.9 57.5 55.5 54.9 55.7 59.6 56.5 59.0Customs duties .......................................................................................................................... 11 21.3 21.7 18.8 19.4 19.9 19.4 20.3 19.5 20.2 16.8 18.6 20.5Nontaxes .................................................................................................................................... 12 18.4 17.3 16.9 16.2 15.9 15.3 15.9 15.6 15.5 33.7 13.2 12.7
Contributions for social insurance ................................................................................................. 13 559.5 566.2 574.3 578.3 584.7 589.9 597.6 607.8 614.8 622.0 635.3 641.4
Current expenditures .......................................................................................................... 14 1,571.4 1,596.4 1,620.6 1,638.5 1,649.3 1,642.0 1,679.9 1,695.4 1,698.2 1,718.8 1,730.8 1,742.1
Consumption expenditures ............................................................................................................ 15 450.5 440.8 444.8 444.0 449.0 436.3 444.6 453.7 454.0 453.6 458.0 466.8
Transfer payments (net) ................................................................................................................ 16 683.8 700.7 709.5 718.0 725.1 731.1 757.6 757.5 761.5 777.3 785.9 790.6To persons ................................................................................................................................. 17 668.1 674.9 697.5 707.0 713.8 719.4 738.4 746.3 749.7 754.4 775.5 780.7To the rest of the world (net) ................................................................................................... 18 15.7 25.8 12.0 11.0 11.3 11.8 19.2 11.2 11.9 22.9 10.5 9.9
Grants-in-aid to State and local governments .............................................................................. 19 199.6 206.6 212.2 216.5 210.6 208.5 213.7 223.2 218.7 217.5 219.6 216.3
Net interest paid ............................................................................................................................. 20 202.8 210.8 218.8 223.9 227.5 229.0 226.6 223.5 226.6 231.8 228.9 230.3Interest paid ............................................................................................................................... 21 225.5 234.9 243.6 249.9 252.4 254.1 252.9 250.1 253.4 256.1 253.2 254.4
To persons and business ..................................................................................................... 22 178.2 182.3 186.6 189.7 189.2 189.4 188.3 182.7 179.5 176.7 168.7 164.0To the rest of the world ........................................................................................................ 23 47.3 52.6 57.0 60.2 63.2 64.7 64.7 67.3 74.0 79.4 84.6 90.4
Less: Interest received by government ..................................................................................... 24 22.7 24.2 24.8 26.0 24.9 25.1 26.4 26.6 26.9 24.3 24.4 24.1
Subsidies less current surplus of government enterprises .......................................................... 25 34.8 37.5 35.3 36.1 37.0 37.2 37.4 37.5 37.4 38.5 38.4 38.1Subsidies .................................................................................................................................... 26 32.6 32.4 33.5 33.7 33.8 33.8 33.0 33.0 33.1 33.4 33.8 34.3Less: Current surplus of government enterprises .................................................................... 27 –2.1 –5.2 –1.8 –2.5 –3.3 –3.4 –4.4 –4.5 –4.2 –5.1 –4.7 –3.8
Less: Wage accruals less disbursements ..................................................................................... 28 0 0 0 0 0 0 0 0 0 0 0 0
Current surplus or deficit (–), national income and product accounts ...................... 29 –187.6 –186.8 –191.5 –179.5 –176.5 –150.2 –153.6 –111.6 –99.5 –77.1 –55.5 ...............
Social insurance funds ................................................................................................................... 30 60.7 62.7 55.5 52.2 53.7 55.1 49.1 53.3 58.2 60.6 58.7 60.2Other ............................................................................................................................................... 31 –248.3 –249.6 –247.0 –231.7 –230.3 –205.3 –202.7 –165.0 –157.8 –137.7 –114.2 ...............
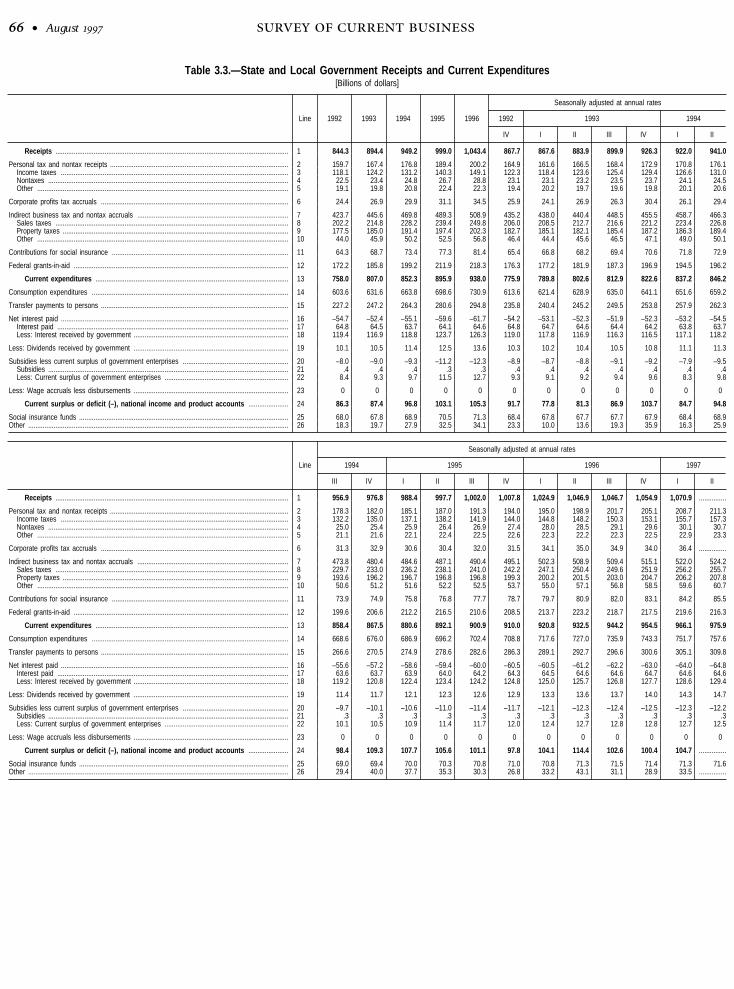
• August
Table 3.3.—State and Local Government Receipts and Current Expenditures[Billions of dollars]
Line 1992 1993 1994 1995 1996
Seasonally adjusted at annual rates
1992 1993 1994
IV I II III IV I II
Receipts ................................................................................................................................ 1 844.3 894.4 949.2 999.0 1,043.4 867.7 867.6 883.9 899.9 926.3 922.0 941.0
Personal tax and nontax receipts .................................................................................................. 2 159.7 167.4 176.8 189.4 200.2 164.9 161.6 166.5 168.4 172.9 170.8 176.1Income taxes ............................................................................................................................. 3 118.1 124.2 131.2 140.3 149.1 122.3 118.4 123.6 125.4 129.4 126.6 131.0Nontaxes .................................................................................................................................... 4 22.5 23.4 24.8 26.7 28.8 23.1 23.1 23.2 23.5 23.7 24.1 24.5Other .......................................................................................................................................... 5 19.1 19.8 20.8 22.4 22.3 19.4 20.2 19.7 19.6 19.8 20.1 20.6
Corporate profits tax accruals ....................................................................................................... 6 24.4 26.9 29.9 31.1 34.5 25.9 24.1 26.9 26.3 30.4 26.1 29.4
Indirect business tax and nontax accruals ................................................................................... 7 423.7 445.6 469.8 489.3 508.9 435.2 438.0 440.4 448.5 455.5 458.7 466.3Sales taxes ................................................................................................................................ 8 202.2 214.8 228.2 239.4 249.8 206.0 208.5 212.7 216.6 221.2 223.4 226.8Property taxes ............................................................................................................................ 9 177.5 185.0 191.4 197.4 202.3 182.7 185.1 182.1 185.4 187.2 186.3 189.4Other .......................................................................................................................................... 10 44.0 45.9 50.2 52.5 56.8 46.4 44.4 45.6 46.5 47.1 49.0 50.1
Contributions for social insurance ................................................................................................. 11 64.3 68.7 73.4 77.3 81.4 65.4 66.8 68.2 69.4 70.6 71.8 72.9
Federal grants-in-aid ...................................................................................................................... 12 172.2 185.8 199.2 211.9 218.3 176.3 177.2 181.9 187.3 196.9 194.5 196.2
Current expenditures .......................................................................................................... 13 758.0 807.0 852.3 895.9 938.0 775.9 789.8 802.6 812.9 822.6 837.2 846.2
Consumption expenditures ............................................................................................................ 14 603.6 631.6 663.8 698.6 730.9 613.6 621.4 628.9 635.0 641.1 651.6 659.2
Transfer payments to persons ....................................................................................................... 15 227.2 247.2 264.3 280.6 294.8 235.8 240.4 245.2 249.5 253.8 257.9 262.3
Net interest paid ............................................................................................................................. 16 –54.7 –52.4 –55.1 –59.6 –61.7 –54.2 –53.1 –52.3 –51.9 –52.3 –53.2 –54.5Interest paid ............................................................................................................................... 17 64.8 64.5 63.7 64.1 64.6 64.8 64.7 64.6 64.4 64.2 63.8 63.7Less: Interest received by government ..................................................................................... 18 119.4 116.9 118.8 123.7 126.3 119.0 117.8 116.9 116.3 116.5 117.1 118.2
Less: Dividends received by government ..................................................................................... 19 10.1 10.5 11.4 12.5 13.6 10.3 10.2 10.4 10.5 10.8 11.1 11.3
Subsidies less current surplus of government enterprises .......................................................... 20 –8.0 –9.0 –9.3 –11.2 –12.3 –8.9 –8.7 –8.8 –9.1 –9.2 –7.9 –9.5Subsidies .................................................................................................................................... 21 .4 .4 .4 .3 .3 .4 .4 .4 .4 .4 .4 .4Less: Current surplus of government enterprises .................................................................... 22 8.4 9.3 9.7 11.5 12.7 9.3 9.1 9.2 9.4 9.6 8.3 9.8
Less: Wage accruals less disbursements ..................................................................................... 23 0 0 0 0 0 0 0 0 0 0 0 0
Current surplus or deficit (–), national income and product accounts ...................... 24 86.3 87.4 96.8 103.1 105.3 91.7 77.8 81.3 86.9 103.7 84.7 94.8
Social insurance funds ................................................................................................................... 25 68.0 67.8 68.9 70.5 71.3 68.4 67.8 67.7 67.7 67.9 68.4 68.9Other ............................................................................................................................................... 26 18.3 19.7 27.9 32.5 34.1 23.3 10.0 13.6 19.3 35.9 16.3 25.9
Line
Seasonally adjusted at annual rates
1994 1995 1996 1997
III IV I II III IV I II III IV I II
Receipts ................................................................................................................................ 1 956.9 976.8 988.4 997.7 1,002.0 1,007.8 1,024.9 1,046.9 1,046.7 1,054.9 1,070.9 ...............
Personal tax and nontax receipts .................................................................................................. 2 178.3 182.0 185.1 187.0 191.3 194.0 195.0 198.9 201.7 205.1 208.7 211.3Income taxes ............................................................................................................................. 3 132.2 135.0 137.1 138.2 141.9 144.0 144.8 148.2 150.3 153.1 155.7 157.3Nontaxes .................................................................................................................................... 4 25.0 25.4 25.9 26.4 26.9 27.4 28.0 28.5 29.1 29.6 30.1 30.7Other .......................................................................................................................................... 5 21.1 21.6 22.1 22.4 22.5 22.6 22.3 22.2 22.3 22.5 22.9 23.3
Corporate profits tax accruals ....................................................................................................... 6 31.3 32.9 30.6 30.4 32.0 31.5 34.1 35.0 34.9 34.0 36.4 ...............
Indirect business tax and nontax accruals ................................................................................... 7 473.8 480.4 484.6 487.1 490.4 495.1 502.3 508.9 509.4 515.1 522.0 524.2Sales taxes ................................................................................................................................ 8 229.7 233.0 236.2 238.1 241.0 242.2 247.1 250.4 249.6 251.9 256.2 255.7Property taxes ............................................................................................................................ 9 193.6 196.2 196.7 196.8 196.8 199.3 200.2 201.5 203.0 204.7 206.2 207.8Other .......................................................................................................................................... 10 50.6 51.2 51.6 52.2 52.5 53.7 55.0 57.1 56.8 58.5 59.6 60.7
Contributions for social insurance ................................................................................................. 11 73.9 74.9 75.8 76.8 77.7 78.7 79.7 80.9 82.0 83.1 84.2 85.5
Federal grants-in-aid ...................................................................................................................... 12 199.6 206.6 212.2 216.5 210.6 208.5 213.7 223.2 218.7 217.5 219.6 216.3
Current expenditures .......................................................................................................... 13 858.4 867.5 880.6 892.1 900.9 910.0 920.8 932.5 944.2 954.5 966.1 975.9
Consumption expenditures ............................................................................................................ 14 668.6 676.0 686.9 696.2 702.4 708.8 717.6 727.0 735.9 743.3 751.7 757.6
Transfer payments to persons ....................................................................................................... 15 266.6 270.5 274.9 278.6 282.6 286.3 289.1 292.7 296.6 300.6 305.1 309.8
Net interest paid ............................................................................................................................. 16 –55.6 –57.2 –58.6 –59.4 –60.0 –60.5 –60.5 –61.2 –62.2 –63.0 –64.0 –64.8Interest paid ............................................................................................................................... 17 63.6 63.7 63.9 64.0 64.2 64.3 64.5 64.6 64.6 64.7 64.6 64.6Less: Interest received by government ..................................................................................... 18 119.2 120.8 122.4 123.4 124.2 124.8 125.0 125.7 126.8 127.7 128.6 129.4
Less: Dividends received by government ..................................................................................... 19 11.4 11.7 12.1 12.3 12.6 12.9 13.3 13.6 13.7 14.0 14.3 14.7
Subsidies less current surplus of government enterprises .......................................................... 20 –9.7 –10.1 –10.6 –11.0 –11.4 –11.7 –12.1 –12.3 –12.4 –12.5 –12.3 –12.2Subsidies .................................................................................................................................... 21 .3 .3 .3 .3 .3 .3 .3 .3 .3 .3 .3 .3Less: Current surplus of government enterprises .................................................................... 22 10.1 10.5 10.9 11.4 11.7 12.0 12.4 12.7 12.8 12.8 12.7 12.5
Less: Wage accruals less disbursements ..................................................................................... 23 0 0 0 0 0 0 0 0 0 0 0 0
Current surplus or deficit (–), national income and product accounts ...................... 24 98.4 109.3 107.7 105.6 101.1 97.8 104.1 114.4 102.6 100.4 104.7 ...............
Social insurance funds ................................................................................................................... 25 69.0 69.4 70.0 70.3 70.8 71.0 70.8 71.3 71.5 71.4 71.3 71.6Other ............................................................................................................................................... 26 29.4 40.0 37.7 35.3 30.3 26.8 33.2 43.1 31.1 28.9 33.5 ...............

August •
Table 3.4.—Personal Tax and Nontax Receipts[Billions of dollars]
Line 1992 1993 1994 1995 1996
Personal tax and nontax receipts ................................. 1 650.5 690.0 739.1 795.1 886.9
Federal ....................................................................................... 2 490.8 522.6 562.3 605.8 686.7
Income taxes ......................................................................... 3 478.1 508.1 545.3 588.7 666.8Withheld ............................................................................. 4 409.4 434.8 466.4 501.6 548.9Declarations and settlements ........................................... 5 149.3 149.4 157.2 174.6 209.0Less: Refunds ................................................................... 6 80.6 76.1 78.3 87.5 91.1
Estate and gift taxes ............................................................. 7 11.3 12.9 15.1 14.9 17.5Nontaxes 1 .............................................................................. 8 1.4 1.6 1.9 2.2 2.5
State and local ......................................................................... 9 159.7 167.4 176.8 189.4 200.2
Income taxes ......................................................................... 10 118.1 124.2 131.2 140.3 149.1Estate and gift taxes ............................................................. 11 4.7 4.9 5.0 5.3 5.6Motor vehicle licenses ........................................................... 12 8.8 8.9 9.5 10.5 10.4Property taxes ........................................................................ 13 3.3 3.4 3.6 3.7 3.7Other taxes 2 .......................................................................... 14 2.3 2.6 2.7 2.8 2.6
Nontaxes ................................................................................ 15 22.5 23.4 24.8 26.7 28.8Fines .................................................................................. 16 8.4 8.8 9.7 10.6 11.6Other 3 ............................................................................... 17 14.2 14.6 15.1 16.0 17.2
1. Consists largely of fines and immigration fees.2. Consists largely of hunting, fishing, and other personal licenses.3. Consists largely of donations and unclaimed bank deposits.
Table 3.5.—Indirect Business Tax and Nontax Accruals[Billions of dollars]
Line 1992 1993 1994 1995 1996
Indirect business tax and nontax accruals ................. 1 505.6 532.5 568.5 582.8 604.8
Federal ....................................................................................... 2 81.9 86.9 98.7 93.5 95.8
Excise taxes ........................................................................... 3 45.9 48.8 59.3 58.1 56.4Gasoline ............................................................................. 4 15.5 16.0 21.3 21.2 22.3Alcoholic beverages .......................................................... 5 7.5 7.5 7.0 7.3 7.3Tobacco ............................................................................. 6 5.3 5.7 5.8 5.9 5.8Diesel fuel .......................................................................... 7 4.2 4.4 7.1 6.6 7.6Air transport ....................................................................... 8 4.8 5.0 5.5 5.7 2.2Crude oil windfall profits tax ............................................. 9 ............ ............ ............ ............ ............Other 1 ............................................................................... 10 8.5 10.1 12.6 11.4 11.2
Customs duties ...................................................................... 11 18.3 19.9 21.1 19.4 19.2
Nontaxes ................................................................................ 12 17.7 18.3 18.2 16.1 20.2Outer Continental Shelf royalties ...................................... 13 2.5 2.7 2.7 2.7 4.2Deposit insurance premiums ............................................ 14 7.9 8.6 8.0 5.8 8.1Other 2 ............................................................................... 15 7.2 6.9 7.4 7.6 7.9
State and local ......................................................................... 16 423.7 445.6 469.8 489.3 508.9
Sales taxes ............................................................................ 17 202.2 214.8 228.2 239.4 249.8State .................................................................................. 18 167.6 177.8 189.0 198.2 206.6
General .......................................................................... 19 111.6 118.7 127.6 135.5 141.3Gasoline ........................................................................ 20 23.0 24.5 24.9 25.6 26.2Alcoholic beverages ...................................................... 21 3.5 3.6 3.6 3.6 3.6Tobacco ......................................................................... 22 6.0 6.3 6.6 6.8 6.9Public utilities ................................................................ 23 7.9 7.8 8.6 8.0 9.0Insurance receipts ......................................................... 24 7.8 8.0 8.1 8.7 8.9Other ............................................................................. 25 7.7 9.0 9.6 9.9 10.6
Local .................................................................................. 26 34.6 36.9 39.2 41.2 43.1General .......................................................................... 27 24.0 25.5 27.0 28.1 29.3Public utilities ................................................................ 28 6.0 6.4 6.8 7.2 7.7Other ............................................................................. 29 4.6 5.0 5.4 5.8 6.2
Property taxes ........................................................................ 30 177.5 185.0 191.4 197.4 202.3Motor vehicle licenses ........................................................... 31 3.8 3.9 4.1 4.6 4.5Severance taxes .................................................................... 32 4.9 4.5 4.3 3.8 4.4Other taxes 3 .......................................................................... 33 18.7 19.9 22.3 23.9 26.4
Nontaxes ................................................................................ 34 16.7 17.5 19.5 20.2 21.6Rents and royalties ........................................................... 35 4.8 4.8 5.7 5.3 5.6Special assessments ......................................................... 36 2.8 3.0 3.2 3.3 3.5Fines .................................................................................. 37 3.0 3.0 3.3 3.5 3.9Other 4 ............................................................................... 38 6.1 6.7 7.4 8.0 8.6
1. Consists largely of taxes on telephone, tires, coal, nuclear fuel, trucks, as well as refunds other than for alco-holic beverages and tobacco.
2. Consists largely of fines, fees, and royalties other than Outer Continental Shelf.3. Consists largely of business licenses and documentary and stamp taxes.4. Consists largely of donations.
Table 3.6.—Contributions for Social Insurance[Billions of dollars]
Line 1992 1993 1994 1995 1996
Contributions for social insurance ............................... 1 571.4 596.0 630.5 659.1 692.0
Employer contributions ........................................................... 2 323.0 335.7 353.0 366.0 385.7
Federal social insurance funds ............................................. 3 278.0 287.2 301.0 310.5 326.6
Old-age, survivors, disability, and hospital insurance ..... 4 185.7 193.6 206.6 217.6 229.6Old-age, survivors, and disability insurance ................ 5 149.2 154.4 162.8 170.9 179.7Hospital insurance ........................................................ 6 36.6 39.2 43.7 46.7 49.9
Unemployment insurance .................................................. 7 24.9 28.1 29.5 29.3 28.6State tax ........................................................................ 8 18.3 21.4 23.2 22.9 22.1Federal tax .................................................................... 9 5.4 5.6 5.5 5.8 5.8Railroad employees ...................................................... 10 .1 0 0 0 0Federal employees ....................................................... 11 1.1 1.2 .7 .7 .6
Federal employee retirement ............................................ 12 60.2 58.5 58.2 56.9 61.5Civilian ........................................................................... 13 31.9 33.0 33.5 33.7 34.6Military ........................................................................... 14 28.3 25.5 24.7 23.2 26.9
Railroad retirement ............................................................ 15 2.7 2.6 2.6 2.5 2.6Pension benefit guaranty .................................................. 16 .9 .9 1.0 .9 1.3Veterans life insurance ..................................................... 17 0 0 0 0 0Workers’ compensation ..................................................... 18 1.8 1.8 1.9 1.9 1.9Military medical insurance ................................................ 19 1.7 1.6 1.4 1.3 1.2
State and local social insurance funds ................................ 20 45.0 48.5 52.0 55.5 59.0
State and local employee retirement ............................... 21 35.1 37.6 40.8 44.5 48.0Temporary disability insurance ......................................... 22 0 0 0 0 0Workers’ compensation ..................................................... 23 9.9 10.8 11.2 11.0 11.0
Personal contributions ............................................................ 24 248.4 260.3 277.5 293.1 306.3
Federal social insurance funds ............................................. 25 229.2 240.0 256.1 271.3 283.9Old-age, survivors, disability, and hospital insurance ..... 26 208.8 217.8 232.0 244.9 258.6
Employees ..................................................................... 27 186.3 194.3 207.5 218.6 230.8Old-age, survivors, and disability insurance ............ 28 149.2 154.4 162.8 170.9 179.7Hospital insurance .................................................... 29 37.1 39.9 44.6 47.7 51.1
Self-employed ............................................................... 30 22.5 23.6 24.5 26.4 27.9Supplementary medical insurance .................................... 31 12.9 15.2 17.3 19.6 18.6State unemployment insurance ........................................ 32 .3 .2 .2 .2 .1Federal civilian employee retirement ................................ 33 4.8 4.7 4.6 4.6 4.5Railroad retirement ............................................................ 34 1.3 1.2 1.2 1.3 1.3Veterans life insurance ..................................................... 35 1.1 .8 .8 .8 .8
State and local social insurance funds ................................ 36 19.3 20.3 21.4 21.8 22.4State and local employee retirement ............................... 37 16.4 17.2 18.3 19.2 20.1Temporary disability insurance ......................................... 38 2.9 3.0 3.1 2.6 2.3

• August
Table 3.7.—Government Consumption Expenditures and Gross Investment by Type[Billions of dollars]
Line 1992 1993 1994 1995 1996
Seasonally adjusted at annual rates
1992 1993 1994
IV I II III IV I II
Government consumption expenditures and gross investment 1 ................................ 1 1,263.8 1,283.4 1,313.0 1,355.5 1,406.7 1,280.0 1,271.5 1,281.2 1,285.3 1,295.5 1,291.0 1,300.8
Federal ........................................................................................................................................... 2 528.0 518.3 510.2 509.6 520.0 535.0 521.3 517.8 515.7 518.5 506.9 505.3
National defense ...................................................................................................................... 3 375.8 360.7 349.2 344.6 352.8 375.3 363.6 361.7 358.0 359.4 344.9 348.5Consumption expenditures .................................................................................................... 4 319.7 311.1 301.6 298.6 305.7 320.7 312.4 311.5 310.6 309.8 299.8 300.7
Durable goods 2 ................................................................................................................ 5 30.1 26.9 23.0 21.1 22.3 29.8 26.9 30.1 26.3 24.4 23.2 22.2Nondurable goods ............................................................................................................. 6 9.4 8.4 7.5 6.3 7.9 8.8 8.1 8.8 9.1 7.6 6.8 7.1Services ............................................................................................................................. 7 280.1 275.7 271.1 271.2 275.6 282.2 277.4 272.5 275.2 277.8 269.8 271.5
Compensation of general government employees, except force-accountconstruction 3.
8 143.1 138.8 133.8 131.5 135.2 138.4 142.4 139.4 138.1 135.4 135.6 135.2
Consumption of general government fixed capital 4 ................................................... 9 54.2 55.7 56.7 57.5 57.3 54.7 55.1 55.3 56.1 56.4 56.6 56.9Other services ............................................................................................................... 10 82.8 81.2 80.5 82.3 83.0 89.1 79.9 77.8 81.0 86.0 77.7 79.5
Gross investment ................................................................................................................... 11 56.1 49.6 47.6 46.0 47.0 54.6 51.2 50.3 47.4 49.6 45.1 47.7Structures .......................................................................................................................... 12 5.2 5.1 5.8 6.4 6.8 5.5 4.8 4.9 5.4 5.3 5.4 5.5Equipment ......................................................................................................................... 13 50.9 44.5 41.8 39.6 40.2 49.1 46.4 45.4 42.0 44.3 39.7 42.2
Nondefense ............................................................................................................................... 14 152.2 157.7 161.0 165.0 167.3 159.7 157.7 156.1 157.7 159.1 162.0 156.8Consumption expenditures .................................................................................................... 15 131.4 136.2 141.6 144.9 145.7 137.0 134.7 134.3 136.4 139.4 142.6 138.5
Durable goods 2 ................................................................................................................ 16 .3 .5 1.0 .8 .9 .6 .3 .6 .5 .7 1.0 .8Nondurable goods ............................................................................................................. 17 6.5 6.9 6.8 6.5 5.7 7.6 6.9 6.6 6.4 7.5 7.2 7.0
Commodity Credit Corporation inventory change ....................................................... 18 –.6 –.3 –.5 –.2 –.4 0 –.4 –.5 –.8 .3 –.3 –.3Other nondurables ........................................................................................................ 19 7.2 7.2 7.3 6.7 6.1 7.6 7.3 7.1 7.2 7.2 7.6 7.3
Services ............................................................................................................................. 20 124.6 128.8 133.8 137.6 139.2 128.9 127.5 127.1 129.5 131.3 134.4 130.7Compensation of general government employees, except force-account
construction 3.21 67.7 72.5 74.4 75.8 77.5 69.5 71.8 71.7 73.1 73.5 75.3 75.4
Consumption of general government fixed capital 4 ................................................... 22 9.3 9.7 10.2 10.7 11.2 9.4 9.6 9.7 9.8 9.9 10.0 10.2Other services ............................................................................................................... 23 47.6 46.6 49.3 51.1 50.4 50.0 46.1 45.7 46.6 47.9 49.1 45.2
Gross investment ................................................................................................................... 24 20.8 21.5 19.5 20.1 21.5 22.6 23.0 21.7 21.4 19.7 19.4 18.3Structures .......................................................................................................................... 25 10.3 11.2 10.4 11.0 11.3 11.0 11.5 10.9 11.3 11.1 10.3 9.7Equipment ......................................................................................................................... 26 10.5 10.2 9.0 9.1 10.2 11.6 11.5 10.8 10.1 8.6 9.1 8.6
State and local ............................................................................................................................. 27 735.8 765.0 802.8 846.0 886.7 745.1 750.1 763.4 769.6 777.0 784.1 795.5Consumption expenditures ........................................................................................................ 28 603.6 631.6 663.8 698.6 730.9 613.6 621.4 628.9 635.0 641.1 651.6 659.2
Durable goods 2 ..................................................................................................................... 29 12.4 13.2 13.9 14.7 15.3 12.7 12.9 13.1 13.3 13.4 13.7 13.8Nondurable goods ................................................................................................................. 30 60.9 64.3 67.8 73.0 78.2 62.2 63.5 64.7 64.2 64.6 66.1 66.9Services ................................................................................................................................. 31 530.3 554.2 582.1 610.9 637.5 538.7 545.0 551.0 557.5 563.1 571.8 578.5
Compensation of general government employees, except force-account construction 3 32 456.7 479.5 502.6 525.5 547.2 464.9 471.3 476.9 482.3 487.4 494.2 499.8Consumption of general government fixed capital 4 ........................................................ 33 46.6 48.8 51.3 54.2 56.6 47.4 48.0 48.6 49.1 49.6 50.3 50.9Other services ................................................................................................................... 34 27.0 25.9 28.1 31.2 33.7 26.3 25.7 25.5 26.1 26.1 27.3 27.8
Gross investment ....................................................................................................................... 35 132.2 133.4 138.9 147.4 155.7 131.5 128.7 134.5 134.6 135.9 132.5 136.3Structures ............................................................................................................................... 36 108.1 108.7 113.4 121.0 128.5 106.9 104.1 109.9 109.8 111.1 107.2 110.8Equipment .............................................................................................................................. 37 24.0 24.7 25.6 26.4 27.3 24.6 24.6 24.6 24.8 24.8 25.3 25.5
Addenda:Compensation of general government employees 3 ................................................................ 38 670.8 694.2 714.5 736.5 763.9 676.0 688.8 691.4 696.9 699.7 708.5 713.8
Federal ................................................................................................................................... 39 210.9 211.4 208.3 207.3 212.8 207.9 214.3 211.1 211.2 209.0 210.9 210.6State and local ...................................................................................................................... 40 460.0 482.8 506.2 529.2 551.0 468.0 474.5 480.3 485.7 490.7 497.5 503.2
See footnotes at end of table.

August •
Table 3.7.—Government Consumption Expenditures and Gross Investment by Type—Continued[Billions of dollars]
Line
Seasonally adjusted at annual rates
1994 1995 1996 1997
III IV I II III IV I II III IV I II
Government consumption expenditures and gross investment 1 ................................ 1 1,332.3 1,328.0 1,344.7 1,356.0 1,362.2 1,359.2 1,384.2 1,407.0 1,413.5 1,422.3 1,433.1 1,451.1
Federal ........................................................................................................................................... 2 520.4 508.3 513.6 511.2 512.9 500.6 516.4 524.6 521.6 517.6 516.1 528.0
National defense ...................................................................................................................... 3 359.7 343.6 346.3 348.1 347.3 336.5 348.4 357.3 354.8 350.6 343.3 352.6Consumption expenditures .................................................................................................... 4 308.7 297.3 299.9 299.8 303.2 291.6 298.2 307.8 309.3 307.6 306.4 314.1
Durable goods 2 ................................................................................................................ 5 24.9 21.9 21.4 19.8 23.6 19.5 20.1 23.7 24.7 20.6 20.6 21.6Nondurable goods ............................................................................................................. 6 8.1 8.2 6.0 6.6 6.8 5.7 7.6 8.3 8.5 7.2 7.6 6.7Services ............................................................................................................................. 7 275.7 267.2 272.4 273.3 272.8 266.3 270.5 275.9 276.1 279.8 278.2 285.8
Compensation of general government employees, except force-accountconstruction 3.
8 133.2 131.5 132.1 131.2 131.7 130.8 134.9 135.4 135.9 134.7 136.8 135.8
Consumption of general government fixed capital 4 ................................................... 9 56.5 56.8 57.2 57.6 57.5 57.7 57.2 57.6 57.2 57.1 57.1 57.0Other services ............................................................................................................... 10 86.1 78.9 83.0 84.6 83.6 77.8 78.3 82.8 83.0 87.9 84.3 93.0
Gross investment ................................................................................................................... 11 51.1 46.3 46.5 48.4 44.1 45.0 50.2 49.5 45.5 42.9 37.0 38.5Structures .......................................................................................................................... 12 6.1 6.1 7.0 6.2 6.0 6.5 6.7 7.3 6.6 6.6 6.3 6.4Equipment ......................................................................................................................... 13 45.0 40.2 39.5 42.2 38.1 38.5 43.5 42.2 38.8 36.3 30.7 32.1
Nondefense ............................................................................................................................... 14 160.7 164.7 167.3 163.0 165.5 164.1 168.0 167.3 166.8 167.0 172.8 175.3Consumption expenditures .................................................................................................... 15 141.8 143.5 144.9 144.2 145.8 144.7 146.4 145.9 144.6 146.0 151.7 152.7
Durable goods 2 ................................................................................................................ 16 1.0 1.0 1.1 .9 .8 .6 1.2 1.0 .7 .5 .9 .6Nondurable goods ............................................................................................................. 17 5.8 7.1 7.0 5.9 6.5 6.5 6.3 5.7 5.2 5.6 6.6 6.7
Commodity Credit Corporation inventory change ....................................................... 18 –1.2 –.2 0 –.8 –.2 –.1 –.1 –.5 –.5 –.3 0 –.1Other nondurables ........................................................................................................ 19 7.0 7.3 6.9 6.7 6.6 6.6 6.4 6.2 5.8 5.9 6.6 6.8
Services ............................................................................................................................. 20 135.0 135.3 136.8 137.4 138.5 137.6 139.0 139.2 138.7 139.9 144.2 145.3Compensation of general government employees, except force-account
construction 3.21 73.6 73.3 75.5 75.7 76.1 75.8 77.1 77.6 77.6 77.8 80.6 81.2
Consumption of general government fixed capital 4 ................................................... 22 10.3 10.4 10.5 10.7 10.8 11.0 11.1 11.2 11.3 11.4 11.5 11.7Other services ............................................................................................................... 23 51.1 51.7 50.8 51.0 51.7 50.9 50.8 50.5 49.8 50.7 52.0 52.5
Gross investment ................................................................................................................... 24 18.9 21.2 22.4 18.8 19.8 19.3 21.5 21.4 22.1 21.0 21.1 22.7Structures .......................................................................................................................... 25 9.9 11.8 12.1 10.7 10.9 10.1 11.1 11.6 11.3 11.4 11.2 10.8Equipment ......................................................................................................................... 26 8.9 9.4 10.3 8.2 8.8 9.2 10.4 9.9 10.9 9.6 9.9 11.9
State and local ............................................................................................................................. 27 811.9 819.6 831.1 844.8 849.3 858.6 867.8 882.4 891.9 904.7 917.0 923.2Consumption expenditures ........................................................................................................ 28 668.6 676.0 686.9 696.2 702.4 708.8 717.6 727.0 735.9 743.3 751.7 757.6
Durable goods 2 ..................................................................................................................... 29 14.0 14.2 14.4 14.5 14.8 15.1 15.2 15.2 15.4 15.5 15.6 15.7Nondurable goods ................................................................................................................. 30 69.0 69.3 71.3 73.6 73.6 73.6 75.9 78.2 78.3 80.3 81.0 80.0Services ................................................................................................................................. 31 585.6 592.6 601.2 608.1 614.0 620.1 626.5 633.6 642.2 647.6 655.1 662.0
Compensation of general government employees, except force-account construction 3 32 505.7 510.9 517.7 523.1 527.9 533.3 538.2 544.0 551.1 555.4 561.1 566.9Consumption of general government fixed capital 4 ........................................................ 33 51.7 52.3 53.1 53.8 54.5 55.3 56.0 56.3 56.8 57.3 58.1 58.7Other services ................................................................................................................... 34 28.1 29.4 30.4 31.2 31.6 31.6 32.3 33.3 34.3 34.9 36.0 36.4
Gross investment ....................................................................................................................... 35 143.3 143.6 144.2 148.6 147.0 149.8 150.3 155.3 156.0 161.4 165.2 165.5Structures ............................................................................................................................... 36 117.6 117.9 118.1 122.3 120.5 123.0 123.2 128.1 128.6 133.9 137.7 138.0Equipment .............................................................................................................................. 37 25.8 25.8 26.1 26.3 26.5 26.8 27.0 27.2 27.4 27.4 27.5 27.5
Addenda:Compensation of general government employees 3 ................................................................ 38 716.2 719.4 729.0 733.8 739.4 743.7 754.0 761.0 768.5 772.0 782.7 788.1
Federal ................................................................................................................................... 39 206.9 204.8 207.7 206.9 207.8 206.7 212.1 213.1 213.5 212.6 217.5 217.1State and local ...................................................................................................................... 40 509.3 514.5 521.3 526.8 531.6 537.0 541.9 547.9 555.0 559.4 565.2 571.0
1. Gross government investment consists of general government and government enterprise expenditures for fixedassets; inventory investment is included in government consumption expenditures.
2. Consumption expenditures for durable goods excludes expenditures classified as investment, except for goodstransferred to foreign countries by the Federal Government.
3. Compensation of government employees engaged in new force-account construction and related expenditures
for goods and services are classified as investment in structures. The compensation of all general government em-ployees is shown in the addenda.
4. Consumption of fixed capital, or depreciation, is included in government consumption expenditures as a partialmeasure of the value of the services of general government fixed assets; use of depreciation assumes a zero netreturn on these assets.

• August
Table 3.8.—Real Government Consumption Expenditures and Real Gross Investment by Type[Billions of chained (1992) dollars]
Line 1992 1993 1994 1995 1996
Seasonally adjusted at annual rates
1992 1993 1994
IV I II III IV I II
Government consumption expenditures and gross investment 1 ................................ 1 1,263.8 1,252.1 1,252.3 1,251.9 1,257.9 1,272.5 1,250.1 1,253.1 1,250.5 1,254.7 1,241.9 1,243.3
Federal ........................................................................................................................................... 2 528.0 505.7 486.6 470.3 464.2 534.0 512.1 507.8 501.5 501.3 487.2 481.2
National defense ...................................................................................................................... 3 375.8 354.4 336.9 322.6 317.8 376.8 359.2 356.7 351.1 350.8 335.1 335.9Consumption expenditures .................................................................................................... 4 319.7 306.0 292.2 280.6 275.5 322.6 308.5 307.1 305.0 303.2 292.4 291.5
Durable goods 2 ................................................................................................................ 5 30.1 26.7 22.8 20.8 21.8 29.7 26.8 29.8 26.1 24.2 22.8 22.0Nondurable goods ............................................................................................................. 6 9.4 8.5 7.8 6.3 7.2 8.7 8.2 8.8 9.3 7.8 7.3 7.4Services ............................................................................................................................. 7 280.1 270.7 261.5 253.2 246.5 284.3 273.5 268.5 269.6 271.2 262.2 262.0
Compensation of general government employees, except force-accountconstruction 3.
8 143.1 136.5 129.4 122.3 117.2 141.5 139.4 137.3 135.9 133.2 131.7 130.4
Consumption of general government fixed capital 4 ................................................... 9 54.2 54.2 53.5 52.5 51.4 54.4 54.4 54.3 54.1 54.0 53.8 53.6Other services ............................................................................................................... 10 82.8 80.1 78.6 78.4 78.0 88.4 79.7 77.0 79.6 84.0 76.6 77.9
Gross investment ................................................................................................................... 11 56.1 48.5 44.8 42.1 42.3 54.2 50.6 49.5 46.1 47.6 42.9 44.5Structures .......................................................................................................................... 12 5.2 4.7 5.0 5.4 5.6 5.4 4.6 4.6 4.8 4.7 4.7 4.8Equipment ......................................................................................................................... 13 50.9 43.8 39.7 36.5 36.5 48.9 46.1 44.9 41.3 42.9 38.1 39.6
Nondefense ............................................................................................................................... 14 152.2 151.2 149.5 147.5 146.1 157.1 152.9 151.1 150.3 150.4 151.9 145.1Consumption expenditures .................................................................................................... 15 131.4 129.9 130.4 128.0 125.3 134.5 130.0 129.5 129.1 130.8 132.7 127.1
Durable goods 2 ................................................................................................................ 16 .3 .6 1.1 1.0 1.1 .6 .4 .7 .6 .8 1.1 .9Nondurable goods ............................................................................................................. 17 6.5 6.4 6.1 5.8 5.1 7.5 6.4 6.2 5.8 7.0 6.7 6.5
Commodity Credit Corporation inventory change ....................................................... 18 –.6 –.4 –.6 –.2 –.2 0 –.5 –.6 –1.0 .3 –.3 –.3Other nondurables ........................................................................................................ 19 7.2 6.8 6.7 6.0 5.4 7.6 7.0 6.8 6.8 6.7 7.0 6.8
Services ............................................................................................................................. 20 124.6 122.9 123.2 121.3 119.1 126.3 123.1 122.6 122.7 123.1 124.9 119.7Compensation of general government employees, except force-account
construction 3.21 67.7 67.4 65.5 62.9 61.3 67.3 68.0 67.9 67.2 66.5 67.0 65.7
Consumption of general government fixed capital 4 ................................................... 22 9.3 9.6 9.9 10.3 10.8 9.4 9.5 9.6 9.6 9.7 9.8 9.9Other services ............................................................................................................... 23 47.6 45.9 47.9 48.5 47.4 49.6 45.6 45.1 45.8 46.9 48.1 44.0
Gross investment ................................................................................................................... 24 20.8 21.3 19.0 19.4 21.0 22.6 23.0 21.6 21.2 19.5 19.1 18.0Structures .......................................................................................................................... 25 10.3 11.0 9.9 10.0 10.0 10.9 11.4 10.7 11.0 10.8 9.9 9.3Equipment ......................................................................................................................... 26 10.5 10.3 9.1 9.4 11.1 11.7 11.5 10.9 10.2 8.7 9.2 8.7
State and local ............................................................................................................................. 27 735.8 746.4 765.7 781.6 793.7 738.5 738.0 745.3 749.1 753.4 754.7 762.2Consumption expenditures ........................................................................................................ 28 603.6 615.8 633.4 646.0 653.6 607.9 610.8 613.5 617.5 621.5 627.2 631.6
Durable goods 2 ..................................................................................................................... 29 12.4 13.0 13.6 13.9 14.4 12.7 12.8 13.0 13.1 13.2 13.5 13.6Nondurable goods ................................................................................................................. 30 60.9 64.0 67.4 69.2 71.5 62.1 62.7 63.5 64.4 65.3 66.5 67.1Services ................................................................................................................................. 31 530.3 538.9 552.5 563.0 567.9 533.2 535.3 537.1 540.1 543.1 547.2 551.0
Compensation of general government employees, except force-account construction 3 32 456.7 463.2 471.6 478.2 479.9 459.0 460.7 462.3 464.0 466.0 467.9 470.8Consumption of general government fixed capital 4 ........................................................ 33 46.6 48.1 49.4 50.7 52.0 47.3 47.6 47.9 48.3 48.6 48.9 49.2Other services ................................................................................................................... 34 27.0 27.5 32.1 35.1 37.4 26.9 26.9 26.8 27.8 28.6 30.8 31.4
Gross investment ....................................................................................................................... 35 132.2 130.6 132.2 135.6 140.1 130.6 127.1 131.8 131.5 131.9 127.6 130.6Structures ............................................................................................................................... 36 108.1 106.1 107.1 109.5 112.8 106.1 102.7 107.4 107.0 107.2 102.7 105.5Equipment .............................................................................................................................. 37 24.0 24.5 25.2 26.1 27.4 24.6 24.5 24.4 24.5 24.7 24.9 25.0
Residual .......................................................................................................................................... 38 .1 0 –.4 –.9 –2.1 –.3 .1 0 .1 –.1 –.1 0
Addenda:Compensation of general government employees 3 ................................................................ 39 670.8 670.4 669.9 667.0 661.9 670.9 671.2 670.8 670.5 669.0 670.0 670.3
Federal ................................................................................................................................... 40 210.9 204.0 195.1 185.5 178.9 208.9 207.4 205.3 203.3 199.8 199.0 196.4State and local ...................................................................................................................... 41 460.0 466.4 474.8 481.6 483.2 462.0 463.8 465.5 467.3 469.2 471.0 474.0
See note at end of table.

August •
Table 3.8.—Real Government Consumption Expenditures and Real Gross Investment by Type—Continued[Billions of chained (1992) dollars]
Line
Seasonally adjusted at annual rates
1994 1995 1996 1997
III IV I II III IV I II III IV I II
Government consumption expenditures and gross investment 1 ................................ 1 1,268.1 1,255.8 1,257.7 1,257.3 1,255.0 1,237.7 1,243.2 1,265.1 1,261.5 1,261.8 1,260.5 1,272.3
Federal ........................................................................................................................................... 2 496.4 481.7 480.4 474.9 473.4 452.6 460.9 470.7 465.7 459.6 452.8 462.0
National defense ...................................................................................................................... 3 347.0 329.6 328.7 327.4 324.0 310.3 314.9 323.2 319.4 313.6 303.9 311.4Consumption expenditures .................................................................................................... 4 298.7 286.2 285.6 283.1 283.8 269.7 271.3 278.4 278.1 274.4 270.3 276.6
Durable goods 2 ................................................................................................................ 5 24.6 21.9 21.3 19.5 23.2 19.3 19.7 23.0 24.1 20.2 20.0 21.0Nondurable goods ............................................................................................................. 6 8.2 8.2 6.2 6.6 6.8 5.5 7.1 7.6 7.8 6.2 6.6 6.3Services ............................................................................................................................. 7 265.9 256.0 257.8 256.7 253.7 244.6 244.3 247.8 246.3 247.8 243.5 249.2
Compensation of general government employees, except force-accountconstruction 3.
8 129.0 126.5 124.9 123.5 122.0 119.0 118.1 118.0 117.2 115.4 114.5 113.0
Consumption of general government fixed capital 4 ................................................... 9 53.4 53.1 52.9 52.6 52.4 52.1 51.8 51.6 51.3 51.0 50.8 50.5Other services ............................................................................................................... 10 83.6 76.4 80.0 80.7 79.4 73.5 74.3 78.3 77.9 81.6 78.4 86.3
Gross investment ................................................................................................................... 11 48.3 43.4 43.2 44.3 40.3 40.6 43.6 44.9 41.4 39.2 33.5 34.8Structures .......................................................................................................................... 12 5.3 5.2 5.9 5.3 5.1 5.4 5.6 6.0 5.4 5.4 5.0 5.1Equipment ......................................................................................................................... 13 42.9 38.1 37.1 38.9 35.1 35.1 37.9 38.7 35.8 33.7 28.2 29.5
Nondefense ............................................................................................................................... 14 149.4 151.7 151.4 147.3 149.1 142.1 145.7 147.2 146.0 145.7 148.5 150.1Consumption expenditures .................................................................................................... 15 130.8 131.1 129.8 129.0 130.0 123.4 125.0 126.5 124.6 125.1 127.7 128.0
Durable goods 2 ................................................................................................................ 16 1.1 1.2 1.2 1.0 .9 .7 1.3 1.2 1.1 .9 1.2 1.0Nondurable goods ............................................................................................................. 17 5.1 6.3 6.3 5.2 5.8 5.8 5.6 5.2 4.7 5.1 6.0 6.0
Commodity Credit Corporation inventory change ....................................................... 18 –1.3 –.4 0 –.8 –.1 0 –.1 –.3 –.4 –.2 0 –.1Other nondurables ........................................................................................................ 19 6.4 6.6 6.3 6.0 5.9 5.9 5.7 5.4 5.1 5.3 6.0 6.2
Services ............................................................................................................................. 20 124.4 123.6 122.4 122.8 123.2 116.9 118.1 120.2 118.9 119.1 120.6 121.1Compensation of general government employees, except force-account
construction 3.21 65.2 64.0 63.9 64.4 64.3 58.9 60.0 62.3 61.7 61.4 61.6 61.7
Consumption of general government fixed capital 4 ................................................... 22 9.9 10.0 10.1 10.2 10.3 10.4 10.6 10.7 10.8 11.0 11.1 11.2Other services ............................................................................................................... 23 49.6 49.9 48.6 48.4 48.9 48.2 48.1 47.5 46.7 47.2 48.3 48.6
Gross investment ................................................................................................................... 24 18.4 20.7 21.7 18.2 19.0 18.6 20.8 20.8 21.6 20.6 20.8 22.3Structures .......................................................................................................................... 25 9.4 11.1 11.2 9.8 9.9 9.0 9.9 10.2 10.0 10.0 9.8 9.3Equipment ......................................................................................................................... 26 9.0 9.6 10.5 8.4 9.1 9.6 11.0 10.6 11.9 10.7 11.3 13.7
State and local ............................................................................................................................. 27 771.7 774.1 777.3 782.3 781.5 785.1 782.4 794.4 795.9 802.3 807.7 810.4Consumption expenditures ........................................................................................................ 28 635.9 639.0 643.2 645.0 646.8 648.9 646.6 654.2 655.7 657.8 661.1 664.5
Durable goods 2 ..................................................................................................................... 29 13.6 13.7 13.8 13.8 13.9 14.1 14.2 14.3 14.5 14.6 14.7 14.8Nondurable goods ................................................................................................................. 30 67.7 68.2 68.5 69.0 69.4 69.9 70.5 71.1 71.8 72.5 73.2 73.8Services ................................................................................................................................. 31 554.6 557.2 561.0 562.4 563.6 565.0 562.1 568.9 569.6 570.9 573.5 576.1
Compensation of general government employees, except force-account construction 3 32 473.1 474.6 477.4 478.0 478.5 479.0 474.9 481.1 481.5 482.0 483.5 485.6Consumption of general government fixed capital 4 ........................................................ 33 49.5 49.9 50.2 50.5 50.9 51.2 51.5 51.9 52.2 52.6 52.9 53.2Other services ................................................................................................................... 34 32.6 33.5 34.2 34.8 35.3 35.9 37.2 37.3 37.3 37.9 38.8 39.0
Gross investment ....................................................................................................................... 35 135.8 135.0 134.1 137.3 134.7 136.2 135.7 140.2 140.1 144.5 146.6 145.9Structures ............................................................................................................................... 36 110.6 109.6 108.4 111.3 108.6 109.8 108.9 112.9 112.6 116.6 118.4 117.4Equipment .............................................................................................................................. 37 25.2 25.4 25.7 26.0 26.2 26.5 26.9 27.3 27.6 28.0 28.3 28.6
Residual .......................................................................................................................................... 38 –.5 –.5 –.6 –.6 –1.0 –1.3 –1.9 –1.6 –2.4 –2.2 –2.1 –3.4
Addenda:Compensation of general government employees 3 ................................................................ 39 670.8 668.6 669.8 669.6 668.4 660.1 656.2 665.0 664.0 662.3 663.2 663.9
Federal ................................................................................................................................... 40 194.4 190.7 189.1 188.3 186.7 178.0 178.3 180.7 179.4 177.2 176.5 175.2State and local ...................................................................................................................... 41 476.4 477.9 480.7 481.4 481.8 482.3 478.1 484.5 484.9 485.4 487.1 489.1
NOTE.—Chained (1992) dollar series are calculated as the product of the chain-type quantity index and the 1992current-dollar value of the corresponding series, divided by 100. Because the formula for the chain-type quantityindexes uses weights of more than one period, the corresponding chained-dollar estimates are usually not additive.
The residual line is the difference between the first line and the sum of the most detailed lines, excluding the linesin the addenda.
See footnotes to table 3.7.

• August
Table 3.9.—Government Consumption Expenditures Gross and Net of Sales by Type[Billions of dollars]
Line 1992 1993 1994 1995 1996
Government consumption expenditures .......................................................................... 1 1,054.7 1,078.9 1,107.0 1,142.1 1,182.4
Federal ........................................................................................................................................... 2 451.0 447.3 443.2 443.5 451.5
National defense ........................................................................................................................ 3 319.7 311.1 301.6 298.6 305.7Durable goods 1 ..................................................................................................................... 4 30.1 26.9 23.0 21.1 22.3
Gross consumption expenditures ..................................................................................... 5 30.1 27.0 23.1 21.1 22.4Less: Sales ....................................................................................................................... 6 0 0 0 0 .1
Nondurable goods ................................................................................................................. 7 9.4 8.4 7.5 6.3 7.9Gross consumption expenditures ..................................................................................... 8 9.4 8.4 7.5 6.3 7.9Less: Sales ....................................................................................................................... 9 0 0 0 0 0
Services ................................................................................................................................. 10 280.1 275.7 271.1 271.2 275.6Gross consumption expenditures ..................................................................................... 11 280.7 276.4 271.8 272.2 277.1Less: Sales ....................................................................................................................... 12 .6 .6 .7 1.0 1.5
Nondefense ................................................................................................................................ 13 131.4 136.2 141.6 144.9 145.7Durable goods 1 ..................................................................................................................... 14 .3 .5 1.0 .8 .9
Gross consumption expenditures ..................................................................................... 15 1.7 1.7 1.7 1.6 1.7Less: Sales ....................................................................................................................... 16 1.5 1.1 .8 .8 .9
Nondurable goods ................................................................................................................. 17 6.5 6.9 6.8 6.5 5.7Commodity Credit Corporation inventory change ............................................................ 18 –.6 –.3 –.5 –.2 –.4
Gross consumption expenditures ................................................................................. 19 1.7 1.6 1.7 .3 .2Less: Sales ................................................................................................................... 20 2.3 2.0 2.3 .6 .5
Other ................................................................................................................................. 21 7.2 7.2 7.3 6.7 6.1Gross consumption expenditures ................................................................................. 22 7.9 7.9 8.0 7.4 7.4Less: Sales ................................................................................................................... 23 .8 .7 .7 .7 1.3
Services ................................................................................................................................. 24 124.6 128.8 133.8 137.6 139.2Gross consumption expenditures ..................................................................................... 25 127.7 131.8 137.7 140.7 143.4Less: Sales ....................................................................................................................... 26 3.1 2.9 3.9 3.1 4.2
State and local ............................................................................................................................. 27 603.6 631.6 663.8 698.6 730.9
Durable goods 1 ......................................................................................................................... 28 12.4 13.2 13.9 14.7 15.3Gross consumption expenditures ......................................................................................... 29 13.3 14.1 14.9 15.8 16.4Less: Sales ............................................................................................................................ 30 .9 1.0 1.0 1.1 1.1
Nondurable goods ..................................................................................................................... 31 60.9 64.3 67.8 73.0 78.2Gross consumption expenditures ......................................................................................... 32 70.6 74.4 78.4 83.9 89.4Less: Sales ............................................................................................................................ 33 9.7 10.1 10.6 10.9 11.2
Services ..................................................................................................................................... 34 530.3 554.2 582.1 610.9 637.5Gross consumption expenditures ......................................................................................... 35 646.3 682.4 719.6 756.1 790.0Less: Sales ............................................................................................................................ 36 116.0 128.2 137.5 145.2 152.5
Tuition and related educational charges ............................................................ 37 25.9 28.0 30.1 32.4 34.5Health and hospital charges ............................................................................... 38 65.4 73.4 79.1 82.9 86.0Other sales .......................................................................................................... 39 24.7 26.8 28.3 30.0 32.0
1. Consumption expenditures for durable goods excludes expenditures classified as investment,except for goods transferred to foreign countries by the Federal Government.
.

August •
Table 3.10.—National Defense Consumption Expenditures and Gross Investment[Billions of dollars]
Line 1992 1993 1994 1995 1996
Seasonally adjusted at annual rates
1992 1993 1994
IV I II III IV I II
National defense consumption expenditures and gross investment 1 ........................ 1 375.8 360.7 349.2 344.6 352.8 375.3 363.6 361.7 358.0 359.4 344.9 348.5
Consumption expenditures ......................................................................................................... 2 319.7 311.1 301.6 298.6 305.7 320.7 312.4 311.5 310.6 309.8 299.8 300.7
Durable goods 2 ....................................................................................................................... 3 30.1 26.9 23.0 21.1 22.3 29.8 26.9 30.1 26.3 24.4 23.2 22.2Aircraft .................................................................................................................................... 4 14.0 11.4 9.4 8.7 9.7 13.2 11.4 12.3 11.6 10.3 9.1 8.5Missiles .................................................................................................................................. 5 4.8 4.1 3.5 3.1 3.2 4.6 4.3 4.2 4.1 4.0 3.9 3.3Ships ...................................................................................................................................... 6 2.1 2.3 1.6 1.2 .9 2.4 1.9 3.6 1.7 1.8 1.7 1.6Vehicles ................................................................................................................................. 7 1.3 1.3 .8 1.1 1.0 1.4 1.3 1.5 1.2 1.0 .8 .8Electronics ............................................................................................................................. 8 3.3 3.5 3.1 2.5 2.6 3.3 3.6 3.9 3.4 3.0 3.3 3.2Other durable goods ............................................................................................................. 9 4.6 4.4 4.6 4.5 5.0 4.8 4.4 4.6 4.3 4.3 4.4 4.7
Nondurable goods ................................................................................................................... 10 9.4 8.4 7.5 6.3 7.9 8.8 8.1 8.8 9.1 7.6 6.8 7.1
Petroleum products ............................................................................................................... 11 3.5 3.2 3.0 2.8 3.4 3.1 3.0 3.5 3.4 2.9 2.5 3.4Ammunition ............................................................................................................................ 12 2.6 2.4 1.7 1.2 1.1 2.4 2.4 2.6 2.6 2.1 1.8 1.5Other nondurable goods ....................................................................................................... 13 3.4 2.8 2.8 2.4 3.4 3.3 2.7 2.7 3.1 2.6 2.5 2.2
Services ..................................................................................................................................... 14 280.1 275.7 271.1 271.2 275.6 282.2 277.4 272.5 275.2 277.8 269.8 271.5
Compensation of general government employees, except force-account construction 3 ... 15 143.1 138.8 133.8 131.5 135.2 138.4 142.4 139.4 138.1 135.4 135.6 135.2Military ............................................................................................................................... 16 93.2 88.6 83.9 82.1 85.8 88.5 91.8 89.7 87.5 85.4 85.5 84.4Civilian ............................................................................................................................... 17 49.9 50.2 49.9 49.4 49.4 49.9 50.6 49.7 50.6 50.0 50.1 50.8
Consumption of general government fixed capital 4 ............................................................ 18 54.2 55.7 56.7 57.5 57.3 54.7 55.1 55.3 56.1 56.4 56.6 56.9Other services ....................................................................................................................... 19 82.8 81.2 80.5 82.3 83.0 89.1 79.9 77.8 81.0 86.0 77.7 79.5
Research and development .............................................................................................. 20 26.1 26.0 25.0 20.9 23.5 28.8 26.0 25.1 25.2 27.7 24.4 26.0Installation support ............................................................................................................ 21 23.3 25.3 26.1 27.7 27.4 26.6 24.6 24.9 25.2 26.3 26.5 26.0Weapons support .............................................................................................................. 22 8.8 7.4 8.4 8.3 6.3 9.4 8.2 6.4 6.6 8.4 7.9 8.2Personnel support ............................................................................................................. 23 15.7 15.5 16.9 18.3 19.0 18.0 16.2 14.8 15.5 15.6 15.5 16.1Transportation of material ................................................................................................. 24 5.9 4.6 3.8 4.3 4.7 3.5 3.3 4.3 6.2 4.8 3.9 4.0Travel of persons .............................................................................................................. 25 5.4 4.9 4.4 4.5 4.3 4.2 4.2 5.0 5.8 4.8 3.6 4.4Other .................................................................................................................................. 26 –2.3 –2.6 –4.0 –1.7 –2.1 –1.4 –2.5 –2.6 –3.6 –1.7 –4.1 –5.2
Gross investment ......................................................................................................................... 27 56.1 49.6 47.6 46.0 47.0 54.6 51.2 50.3 47.4 49.6 45.1 47.7
Structures ................................................................................................................................. 28 5.2 5.1 5.8 6.4 6.8 5.5 4.8 4.9 5.4 5.3 5.4 5.5
Equipment ................................................................................................................................. 29 50.9 44.5 41.8 39.6 40.2 49.1 46.4 45.4 42.0 44.3 39.7 42.2Aircraft .................................................................................................................................... 30 8.7 9.3 10.4 9.0 9.3 7.7 8.2 7.9 9.6 11.8 7.9 9.9Missiles .................................................................................................................................. 31 10.5 7.9 5.7 4.6 4.1 10.2 8.7 8.4 6.5 8.0 6.6 5.6Ships ...................................................................................................................................... 32 10.1 8.7 8.1 8.0 6.8 9.3 9.2 9.0 8.2 8.2 7.6 8.7Vehicles ................................................................................................................................. 33 2.8 1.9 1.0 .9 .9 3.1 3.0 1.8 1.4 1.3 1.1 1.2Electronics ............................................................................................................................. 34 4.2 4.4 4.0 3.5 3.6 4.1 4.7 5.0 4.3 3.8 4.3 4.0Other equipment .................................................................................................................... 35 14.7 12.3 12.6 13.5 15.5 14.6 12.7 13.4 12.0 11.3 12.3 12.8
Addendum:Compensation of general government employees 3 ................................................................ 36 143.1 138.8 133.9 131.5 135.2 138.4 142.4 139.4 138.1 135.4 135.6 135.2
Line
Seasonally adjusted at annual rates
1994 1995 1996 1997
III IV I II III IV I II III IV I II
National defense consumption expenditures and gross investment 1 ........................ 1 359.7 343.6 346.3 348.1 347.3 336.5 348.4 357.3 354.8 350.6 343.3 352.6
Consumption expenditures ......................................................................................................... 2 308.7 297.3 299.9 299.8 303.2 291.6 298.2 307.8 309.3 307.6 306.4 314.1
Durable goods 2 ....................................................................................................................... 3 24.9 21.9 21.4 19.8 23.6 19.5 20.1 23.7 24.7 20.6 20.6 21.6Aircraft .................................................................................................................................... 4 10.7 9.1 9.6 6.8 10.0 8.4 8.7 10.2 10.6 9.2 9.2 10.1Missiles .................................................................................................................................. 5 3.8 2.9 2.9 3.3 3.6 2.7 2.9 3.2 3.8 2.8 2.8 3.1Ships ...................................................................................................................................... 6 1.6 1.5 1.1 1.3 1.6 .8 .7 .9 1.3 .6 .7 .7Vehicles ................................................................................................................................. 7 .8 .9 1.0 1.2 1.3 .9 .9 1.0 1.1 .9 1.2 1.0Electronics ............................................................................................................................. 8 3.1 2.9 2.6 2.4 2.7 2.2 2.3 2.9 2.9 2.3 2.5 2.4Other durable goods ............................................................................................................. 9 4.9 4.6 4.2 4.9 4.4 4.6 4.7 5.5 5.0 4.8 4.1 4.3
Nondurable goods ................................................................................................................... 10 8.1 8.2 6.0 6.6 6.8 5.7 7.6 8.3 8.5 7.2 7.6 6.7
Petroleum products ............................................................................................................... 11 3.5 2.8 2.6 2.8 3.3 2.4 3.1 3.4 4.1 3.0 3.1 3.0Ammunition ............................................................................................................................ 12 1.4 2.3 1.1 1.3 1.3 .9 1.2 1.5 1.1 .7 1.5 1.0Other nondurable goods ....................................................................................................... 13 3.2 3.1 2.3 2.5 2.2 2.4 3.3 3.4 3.3 3.6 3.0 2.7
Services ..................................................................................................................................... 14 275.7 267.2 272.4 273.3 272.8 266.3 270.5 275.9 276.1 279.8 278.2 285.8
Compensation of general government employees, except force-account construction 3 ... 15 133.2 131.5 132.1 131.2 131.7 130.8 134.9 135.4 135.9 134.7 136.8 135.8Military ............................................................................................................................... 16 83.5 82.2 82.0 82.0 82.4 81.8 85.1 85.7 86.3 86.2 87.1 86.6Civilian ............................................................................................................................... 17 49.6 49.3 50.1 49.2 49.2 49.0 49.8 49.7 49.5 48.5 49.7 49.2
Consumption of general government fixed capital 4 ............................................................ 18 56.5 56.8 57.2 57.6 57.5 57.7 57.2 57.6 57.2 57.1 57.1 57.0Other services ....................................................................................................................... 19 86.1 78.9 83.0 84.6 83.6 77.8 78.3 82.8 83.0 87.9 84.3 93.0
Research and development .............................................................................................. 20 26.1 23.6 22.5 20.8 20.9 19.3 20.9 22.9 24.2 26.2 25.8 28.7Installation support ............................................................................................................ 21 25.7 26.2 27.1 28.4 28.5 26.8 26.5 28.2 28.3 26.4 25.9 28.2Weapons support .............................................................................................................. 22 9.5 7.9 8.6 9.3 8.5 7.0 6.1 5.9 5.4 8.0 5.9 6.9Personnel support ............................................................................................................. 23 18.1 17.8 18.0 19.0 18.2 17.9 18.0 18.5 18.8 20.5 20.2 23.0Transportation of material ................................................................................................. 24 3.7 3.6 4.0 4.1 4.2 4.7 4.5 5.0 4.7 4.7 4.5 4.2Travel of persons .............................................................................................................. 25 5.8 3.8 4.6 4.7 4.4 4.2 4.5 4.3 4.2 4.1 3.9 3.8Other .................................................................................................................................. 26 –2.8 –4.0 –1.8 –1.8 –1.2 –2.0 –2.1 –2.0 –2.6 –1.9 –1.8 –1.8
Gross investment ......................................................................................................................... 27 51.1 46.3 46.5 48.4 44.1 45.0 50.2 49.5 45.5 42.9 37.0 38.5
Structures ................................................................................................................................. 28 6.1 6.1 7.0 6.2 6.0 6.5 6.7 7.3 6.6 6.6 6.3 6.4
Equipment ................................................................................................................................. 29 45.0 40.2 39.5 42.2 38.1 38.5 43.5 42.2 38.8 36.3 30.7 32.1Aircraft .................................................................................................................................... 30 12.5 11.5 9.3 9.0 8.0 9.5 13.7 10.0 7.6 5.9 4.7 4.0Missiles .................................................................................................................................. 31 5.7 4.8 4.1 5.8 5.1 3.6 4.2 4.3 4.3 3.7 2.9 3.4Ships ...................................................................................................................................... 32 8.8 7.1 8.7 8.5 7.6 7.2 7.0 7.2 6.6 6.3 5.6 6.7Vehicles ................................................................................................................................. 33 .8 1.0 1.0 .9 1.0 .8 1.0 .9 .9 .8 1.0 1.5Electronics ............................................................................................................................. 34 4.1 3.7 4.0 3.3 3.7 3.2 3.3 3.7 4.0 3.2 3.3 3.1Other equipment .................................................................................................................... 35 13.0 12.2 12.4 14.7 12.8 14.2 14.3 16.0 15.5 16.3 13.2 13.4
Addendum:Compensation of general government employees 3 ................................................................ 36 133.2 131.5 132.1 131.2 131.7 130.8 134.9 135.4 135.9 134.7 136.8 135.8
1. Gross government investment consists of general government and government enterprise expenditures for fixedassets; inventory investment is included in government consumption expenditures.
2. Consumption expenditures for durable goods excludes expenditures classified as investment, except for goodstransferred to foreign countries.
3. Compensation of government employees engaged in new force-account construction and related expendituresfor goods and services are classified as investment in structures. The compensation of all general government em-
ployees is shown in the addendum.4. Consumption of fixed capital, or depreciation, is included in government consumption expenditures as a partial
measure of the value of the services of general government fixed assets; use of depreciation assumes a zero netreturn on these assets.

• August
Table 3.11.—Real National Defense Consumption Expenditures and Real Gross Investment[Billions of chained (1992) dollars]
Line 1992 1993 1994 1995 1996
Seasonally adjusted at annual rates
1992 1993 1994
IV I II III IV I II
National defense consumption expenditures and gross investment 1 ........................ 1 375.8 354.4 336.9 322.6 317.8 376.8 359.2 356.7 351.1 350.8 335.1 335.9
Consumption expenditures ......................................................................................................... 2 319.7 306.0 292.2 280.6 275.5 322.6 308.5 307.1 305.0 303.2 292.4 291.5
Durable goods 2 ....................................................................................................................... 3 30.1 26.7 22.8 20.8 21.8 29.7 26.8 29.8 26.1 24.2 22.8 22.0Aircraft .................................................................................................................................... 4 14.0 11.3 9.2 8.5 9.3 13.2 11.4 12.2 11.5 10.2 9.0 8.6Missiles .................................................................................................................................. 5 4.8 4.1 3.6 3.4 3.4 4.6 4.2 4.1 4.1 4.0 3.9 3.4Ships ...................................................................................................................................... 6 2.1 2.3 1.6 1.2 .8 2.4 1.9 3.6 1.7 1.8 1.6 1.6Vehicles ................................................................................................................................. 7 1.3 1.2 .8 1.0 .9 1.4 1.3 1.5 1.2 1.0 .8 .8Electronics ............................................................................................................................. 8 3.3 3.5 3.1 2.5 2.7 3.3 3.6 3.9 3.5 3.0 3.2 3.1Other durable goods ............................................................................................................. 9 4.6 4.3 4.5 4.3 4.6 4.7 4.4 4.6 4.2 4.2 4.4 4.6
Nondurable goods ................................................................................................................... 10 9.4 8.5 7.8 6.3 7.2 8.7 8.2 8.8 9.3 7.8 7.3 7.4
Petroleum products ............................................................................................................... 11 3.5 3.3 3.4 3.1 3.1 3.0 3.2 3.5 3.6 3.0 3.0 3.8Ammunition ............................................................................................................................ 12 2.6 2.4 1.7 1.1 1.0 2.5 2.4 2.5 2.6 2.1 1.8 1.4Other nondurable goods ....................................................................................................... 13 3.4 2.8 2.8 2.2 3.2 3.2 2.7 2.7 3.1 2.7 2.5 2.3
Services ..................................................................................................................................... 14 280.1 270.7 261.5 253.2 246.5 284.3 273.5 268.5 269.6 271.2 262.2 262.0
Compensation of general government employees, except force-account construction 3 ... 15 143.1 136.5 129.4 122.3 117.2 141.5 139.4 137.3 135.9 133.2 131.7 130.4Military ............................................................................................................................... 16 93.2 88.4 84.2 79.8 76.9 91.8 90.1 88.9 88.1 86.7 85.8 84.9Civilian ............................................................................................................................... 17 49.9 48.0 45.2 42.6 40.4 49.8 49.3 48.4 47.8 46.5 45.9 45.6
Consumption of general government fixed capital 4 ............................................................ 18 54.2 54.2 53.5 52.5 51.4 54.4 54.4 54.3 54.1 54.0 53.8 53.6Other services ....................................................................................................................... 19 82.8 80.1 78.6 78.4 78.0 88.4 79.7 77.0 79.6 84.0 76.6 77.9
Research and development .............................................................................................. 20 26.1 25.8 24.9 20.8 23.5 28.7 25.9 24.9 25.0 27.4 24.2 25.9Installation support ............................................................................................................ 21 23.3 24.9 25.0 25.5 24.9 26.5 24.6 24.6 24.7 25.8 26.0 25.0Weapons support .............................................................................................................. 22 8.8 7.2 8.0 7.8 5.7 9.3 8.0 6.3 6.5 8.0 7.6 7.8Personnel support ............................................................................................................. 23 15.7 15.3 16.8 17.4 17.2 17.8 16.1 14.5 15.2 15.3 15.6 16.1Transportation of material ................................................................................................. 24 5.9 4.7 3.8 4.1 4.7 3.5 3.3 4.4 6.2 4.8 3.9 3.9Travel of persons .............................................................................................................. 25 5.4 4.8 4.2 4.2 4.1 4.1 4.2 4.9 5.5 4.4 3.4 4.2Other .................................................................................................................................. 26 –2.3 –2.5 –4.0 –1.6 –1.9 –1.4 –2.4 –2.5 –3.5 –1.6 –4.0 –5.1
Gross investment ......................................................................................................................... 27 56.1 48.5 44.8 42.1 42.3 54.2 50.6 49.5 46.1 47.6 42.9 44.5
Structures ................................................................................................................................. 28 5.2 4.7 5.0 5.4 5.6 5.4 4.6 4.6 4.8 4.7 4.7 4.8
Equipment ................................................................................................................................. 29 50.9 43.8 39.7 36.5 36.5 48.9 46.1 44.9 41.3 42.9 38.1 39.6Aircraft .................................................................................................................................... 30 8.7 9.0 8.9 7.2 7.1 7.7 8.3 7.8 9.1 10.9 7.1 8.2Missiles .................................................................................................................................. 31 10.5 7.8 5.6 4.7 4.4 10.2 8.7 8.4 6.4 7.7 6.3 5.5Ships ...................................................................................................................................... 32 10.1 8.5 7.7 7.2 6.1 9.3 9.1 8.8 8.1 8.0 7.4 8.3Vehicles ................................................................................................................................. 33 2.8 1.8 .9 .8 .8 3.0 2.9 1.7 1.3 1.2 1.0 1.1Electronics ............................................................................................................................. 34 4.2 4.6 4.2 3.9 4.4 4.2 4.8 5.1 4.5 4.0 4.4 4.2Other equipment .................................................................................................................... 35 14.7 12.1 12.2 12.8 14.1 14.5 12.5 13.2 11.8 11.0 12.0 12.5
Residual .......................................................................................................................................... 36 –.2 –.1 .1 .2 –.6 –.3 –.3 –.2 0 0 –.2 –.2
Addendum:Compensation of general government employees 3 ................................................................ 37 143.1 136.5 129.4 122.3 117.2 141.5 139.4 137.3 135.9 133.2 131.7 130.4
Line
Seasonally adjusted at annual rates
1994 1995 1996 1997
III IV I II III IV I II III IV I II
National defense consumption expenditures and gross investment 1 ........................ 1 347.0 329.6 328.7 327.4 324.0 310.3 314.9 323.2 319.4 313.6 303.9 311.4
Consumption expenditures ......................................................................................................... 2 298.7 286.2 285.6 283.1 283.8 269.7 271.3 278.4 278.1 274.4 270.3 276.6
Durable goods 2 ....................................................................................................................... 3 24.6 21.9 21.3 19.5 23.2 19.3 19.7 23.0 24.1 20.2 20.0 21.0Aircraft .................................................................................................................................... 4 10.4 8.9 9.4 6.6 9.7 8.1 8.4 9.8 10.2 8.9 8.9 9.8Missiles .................................................................................................................................. 5 4.0 3.2 3.1 3.5 3.9 3.0 3.1 3.5 4.0 3.1 2.9 3.1Ships ...................................................................................................................................... 6 1.6 1.5 1.1 1.2 1.5 .8 .6 .8 1.2 .5 .7 .7Vehicles ................................................................................................................................. 7 .8 .9 1.0 1.1 1.3 .8 .9 1.0 1.1 .9 1.2 .9Electronics ............................................................................................................................. 8 3.1 2.9 2.7 2.5 2.7 2.2 2.4 3.0 3.0 2.4 2.6 2.6Other durable goods ............................................................................................................. 9 4.8 4.5 4.1 4.7 4.2 4.3 4.4 5.0 4.6 4.4 3.8 3.9
Nondurable goods ................................................................................................................... 10 8.2 8.2 6.2 6.6 6.8 5.5 7.1 7.6 7.8 6.2 6.6 6.3
Petroleum products ............................................................................................................... 11 3.8 3.0 3.1 3.1 3.6 2.5 3.1 3.2 3.7 2.4 2.6 2.9Ammunition ............................................................................................................................ 12 1.3 2.1 1.0 1.2 1.2 .8 1.1 1.2 1.0 .6 1.3 .9Other nondurable goods ....................................................................................................... 13 3.2 3.1 2.2 2.4 2.1 2.2 3.1 3.2 3.1 3.4 2.8 2.5
Services ..................................................................................................................................... 14 265.9 256.0 257.8 256.7 253.7 244.6 244.3 247.8 246.3 247.8 243.5 249.2
Compensation of general government employees, except force-account construction 3 ... 15 129.0 126.5 124.9 123.5 122.0 119.0 118.1 118.0 117.2 115.4 114.5 113.0Military ............................................................................................................................... 16 83.8 82.2 81.3 80.5 79.2 78.3 77.7 77.0 76.7 76.1 75.5 74.7Civilian ............................................................................................................................... 17 45.2 44.3 43.6 43.1 42.8 40.8 40.5 41.1 40.6 39.4 39.0 38.4
Consumption of general government fixed capital 4 ............................................................ 18 53.4 53.1 52.9 52.6 52.4 52.1 51.8 51.6 51.3 51.0 50.8 50.5Other services ....................................................................................................................... 19 83.6 76.4 80.0 80.7 79.4 73.5 74.3 78.3 77.9 81.6 78.4 86.3
Research and development .............................................................................................. 20 25.9 23.5 22.4 20.8 20.8 19.2 20.7 23.1 24.3 26.0 25.7 28.6Installation support ............................................................................................................ 21 24.3 24.7 25.4 26.2 26.1 24.5 24.4 25.8 25.6 23.8 23.5 25.6Weapons support .............................................................................................................. 22 9.0 7.5 8.1 8.7 8.0 6.5 5.6 5.3 4.9 7.1 5.2 6.1Personnel support ............................................................................................................. 23 17.9 17.4 17.4 18.1 17.4 16.7 16.7 16.9 17.0 18.1 17.7 20.2Transportation of material ................................................................................................. 24 3.7 3.6 4.0 4.0 4.1 4.5 4.5 4.9 4.6 4.6 4.4 4.1Travel of persons .............................................................................................................. 25 5.5 3.7 4.5 4.4 4.1 4.0 4.3 4.2 4.0 3.8 3.6 3.5Other .................................................................................................................................. 26 –2.7 –3.9 –1.7 –1.7 –1.1 –1.9 –1.9 –1.8 –2.3 –1.6 –1.6 –1.6
Gross investment ......................................................................................................................... 27 48.3 43.4 43.2 44.3 40.3 40.6 43.6 44.9 41.4 39.2 33.5 34.8
Structures ................................................................................................................................. 28 5.3 5.2 5.9 5.3 5.1 5.4 5.6 6.0 5.4 5.4 5.0 5.1
Equipment ................................................................................................................................. 29 42.9 38.1 37.1 38.9 35.1 35.1 37.9 38.7 35.8 33.7 28.2 29.5Aircraft .................................................................................................................................... 30 10.7 9.7 7.8 7.2 6.5 7.4 9.0 8.1 6.4 5.0 4.0 3.3Missiles .................................................................................................................................. 31 5.8 4.9 4.1 5.8 5.1 3.6 4.5 4.5 4.5 4.0 2.9 3.4Ships ...................................................................................................................................... 32 8.4 6.7 7.9 7.6 6.7 6.4 6.2 6.5 5.9 5.6 4.9 5.9Vehicles ................................................................................................................................. 33 .7 .9 .9 .8 .8 .7 .9 .8 .7 .7 .9 1.3Electronics ............................................................................................................................. 34 4.4 4.0 4.4 3.6 4.1 3.6 3.9 4.6 5.0 4.2 4.3 4.2Other equipment .................................................................................................................... 35 12.7 11.8 11.9 14.0 12.1 13.3 13.2 14.5 13.9 14.7 11.8 12.0
Residual .......................................................................................................................................... 36 0 .2 .2 .1 –.4 .5 .2 –.6 –1.0 –.9 –.5 –1.2
Addendum:Compensation of general government employees 3 ................................................................ 37 129.0 126.5 124.9 123.5 122.0 119.0 118.1 118.0 117.2 115.4 114.5 113.0
NOTE.—Chained (1992) dollar series are calculated as the product of the chain-type quantity index and the 1992current-dollar value of the corresponding series, divided by 100. Because the formula for the chain-type quantityindexes uses weights of more than one period, the corresponding chained-dollar estimates are usually not additive.
The residual line is the difference between the first line and the sum of the most detailed lines, excluding the linein the addendum.
See footnotes to table 3.10.

August •
Table 3.12.—Government Transfer Payments to Persons[Billions of dollars]
Line 1992 1993 1994 1995 1996
Government transfer payments to persons ............ 1 835.7 889.8 930.9 990.0 1,042.0
Federal ....................................................................................... 2 608.5 642.6 666.6 709.4 747.2
Benefits from social insurance funds .................................... 3 526.4 554.6 574.7 610.5 643.3Old-age, survivors, and disability insurance .................... 4 281.8 297.9 312.1 327.6 342.1Hospital and supplementary medical insurance .............. 5 132.2 146.5 160.9 180.2 195.6Unemployment insurance .................................................. 6 39.6 34.8 23.9 21.7 22.2
State .............................................................................. 7 24.9 21.6 21.5 21.0 21.6Railroad employees ...................................................... 8 .1 .1 .1 .1 .1Federal employees ....................................................... 9 1.1 1.2 .7 .7 .6Special unemployment benefits ................................... 10 13.5 11.9 1.7 ............ ............
Federal employee retirement ............................................ 11 59.3 61.8 64.1 67.3 69.6Civilian 1 ........................................................................ 12 34.2 35.7 37.2 39.2 40.5Military 2 ......................................................................... 13 25.1 26.1 27.0 28.1 29.2
Railroad retirement ............................................................ 14 7.7 7.8 8.0 8.0 8.1Pension benefit guaranty .................................................. 15 .4 .4 .4 .5 .6Veterans life insurance ..................................................... 16 1.9 1.9 1.9 1.9 2.0Workers’ compensation ..................................................... 17 1.8 1.8 1.9 1.9 1.9Military medical insurance 3 .............................................. 18 1.7 1.6 1.4 1.3 1.2
Veterans benefits ................................................................... 19 16.7 17.5 17.9 18.6 19.3Pension and disability ....................................................... 20 16.2 16.8 17.0 17.6 18.2Readjustment ..................................................................... 21 .5 .7 .9 1.0 1.1Other 4 ............................................................................... 22 ............ ............ ............ ............ ............
Food stamp benefits .............................................................. 23 21.2 22.2 22.8 22.4 21.9Black lung benefits ................................................................ 24 1.4 1.4 1.3 1.2 1.2Supplemental security income .............................................. 25 18.2 20.7 22.2 23.9 25.5Direct relief ............................................................................. 26 ............ ............ ............ ............ ............Earned income credit ............................................................ 27 8.3 9.4 11.7 15.3 18.2Other 5 .................................................................................... 28 16.3 16.8 16.1 17.5 17.8
State and local ......................................................................... 29 227.2 247.2 264.3 280.6 294.8
Benefits from social insurance funds .................................... 30 61.0 66.0 71.1 76.8 83.5State and local employee retirement ............................... 31 49.6 54.8 60.3 66.3 72.9Temporary disability insurance ......................................... 32 3.0 2.3 2.2 2.1 2.1Workers’ compensation ..................................................... 33 8.4 8.9 8.6 8.4 8.6
Public assistance ................................................................... 34 156.0 170.0 180.9 190.3 197.0Medical care ...................................................................... 35 119.7 132.5 141.7 151.3 159.9Family assistance 6 ........................................................... 36 23.3 24.0 24.3 23.3 21.7Supplemental security income 7 ....................................... 37 4.1 3.9 3.8 3.8 3.6General assistance ............................................................ 38 3.3 3.3 3.4 3.4 3.5Energy assistance ............................................................. 39 1.6 1.5 2.0 1.5 1.4Other 8 ............................................................................... 40 4.0 4.8 5.7 7.0 6.8
Education ............................................................................... 41 6.0 6.6 7.6 8.5 9.1Employment and training ...................................................... 42 1.1 1.1 1.1 1.2 1.1Other 9 .................................................................................... 43 3.1 3.4 3.7 3.9 4.1
1. Consists of civil service, foreign service, Public Health Service officers, Tennessee Valley Authority, and severalsmall retirement programs.
2. Includes the Coast Guard.3. Consists of payments for medical services for dependents of active duty military personnel at nonmilitary facili-
ties.4. Consists of mustering out pay, terminal leave pay, and adjusted compensation benefits.5. Consists largely of payments to nonprofit institutions, aid to students, and payments for medical services for
retired military personnel and their dependents at nonmilitary facilities.6. Consists of aid to families with dependent children and, beginning with 1996, assistance programs operating
under the Personal Responsibility and Work Opportunity Reconciliation Act of 1996.7. Prior to 1974, consists of old-age assistance, aid to the blind, and aid to the permanently and totally disabled,
which were partly federally funded.8. Consists of emergency assistance, medical insurance premium payments paid on behalf of indigents, and pay-
ments to nonprofit welfare institutions.9. Consists largely of foster care, veterans benefits, Alaska dividends, and crime victim payments.
Table 3.13.—Subsidies Less Current Surplus of Government Enterprises[Billions of dollars]
Line 1992 1993 1994 1995 1996
Subsidies less current surplus of governmententerprises.
1 27.1 31.1 26.6 25.2 25.4
Federal ....................................................................................... 2 35.1 40.1 35.9 36.4 37.7
Subsidies ................................................................................ 3 31.9 36.7 33.4 33.7 33.1Agricultural ......................................................................... 4 10.1 13.4 7.9 7.3 7.3Housing .............................................................................. 5 20.0 20.9 23.1 24.6 24.5Maritime ............................................................................. 6 .3 .3 .2 .3 .2Air carriers ......................................................................... 7 0 0 0 0 0Other 1 ............................................................................... 8 1.5 2.0 2.2 1.5 1.1
Less: Current surplus of government enterprises ................ 9 –3.3 –3.4 –2.6 –2.7 –4.6Postal Service ...................................................... 10 –6.4 –6.4 –7.6 –7.9 –9.1Federal Housing Administration ........................... 11 2.3 2.6 2.5 2.5 3.1Tennessee Valley Authority ................................. 12 1.0 –.3 1.9 2.1 2.1Other 2 .................................................................. 13 –.1 .6 .7 .6 –.7
State and local ......................................................................... 14 –8.0 –9.0 –9.3 –11.2 –12.3
Subsidies ................................................................................ 15 .4 .4 .4 .3 .3Less: Current surplus of government enterprises ................ 16 8.4 9.3 9.7 11.5 12.7
Water and sewerage ............................................ 17 2.5 2.9 3.6 4.2 4.7Gas and electricity ............................................... 18 6.2 6.5 6.7 7.0 7.1Toll facilities .......................................................... 19 1.8 1.8 1.8 1.9 2.0Liquor stores ........................................................ 20 .5 .5 .5 .8 1.1Air and water terminals ....................................... 21 1.4 1.5 1.5 1.6 1.7Housing and urban renewal ................................ 22 –1.1 –1.7 –2.3 –2.3 –2.4Public transit ......................................................... 23 –11.3 –11.7 –12.7 –13.4 –14.4Other 3 .................................................................. 24 8.5 9.5 10.5 11.7 12.8
1. Consists largely of subsidies to railroads and mass transit systems.2. Consists largely of the Bonneville Power Administration, other electric power agencies, and insurance agencies
other than those insuring deposits in financial institutions.3. Consists of lotteries, off-track betting, local parking, and miscellaneous activities.
Table 3.14.—Social Insurance Funds Receipts and Current Expenditures[Billions of dollars]
Line 1992 1993 1994 1995 1996
Federal
Receipts ............................................................................ 1 584.8 609.4 643.7 674.9 709.2
Contributions for social insurance ............................................. 2 507.1 527.3 557.1 581.8 610.5
Personal contributions ........................................................... 3 229.2 240.0 256.1 271.3 283.9Employer contributions .......................................................... 4 278.0 287.2 301.0 310.5 326.6
Government ....................................................................... 5 95.6 95.4 95.9 95.7 101.1Other .................................................................................. 6 182.3 191.8 205.1 214.8 225.5
Interest received ......................................................................... 7 77.6 82.2 86.5 93.1 98.7
Current expenditures ...................................................... 8 536.4 564.9 584.5 620.8 653.9
Administrative expenses (consumption expenditures) .............. 9 9.9 10.3 9.8 10.3 10.6Transfer payments to persons .................................................. 10 526.4 554.6 574.7 610.5 643.3
Current surplus or deficit (–) ........................................ 11 48.4 44.6 59.2 54.1 55.3
State and local
Receipts ............................................................................ 12 133.4 138.9 146.0 153.9 162.0
Contributions for social insurance ............................................. 13 64.3 68.7 73.4 77.3 81.4
Personal contributions ........................................................... 14 19.3 20.3 21.4 21.8 22.4Employer contributions .......................................................... 15 45.0 48.5 52.0 55.5 59.0
Government ....................................................................... 16 37.2 40.1 43.7 47.8 51.5Other .................................................................................. 17 7.8 8.4 8.3 7.7 7.5
Interest and dividends received ................................................ 18 69.1 70.1 72.6 76.6 80.6
Current expenditures ...................................................... 19 65.4 71.1 77.1 83.3 90.7
Administrative expenses (consumption expenditures) .............. 20 4.4 5.1 5.9 6.6 7.2Transfer payments to persons .................................................. 21 61.0 66.0 71.1 76.8 83.5
Current surplus or deficit (–) ........................................ 22 68.0 67.8 68.9 70.5 71.3
NOTE.—In this table, interest and dividends received is included in receipts; in tables 3.1, 3.3, 3.15, 3.17, 3.19,and 9.4, interest received and dividends received are netted against current expenditures.

• August
. Foreign Transactions
Table 4.1.—Foreign Transactions in the National Income and Product Accounts[Billions of dollars]
Line 1992 1993 1994 1995 1996
Seasonally adjusted at annual rates
1992 1993 1994
IV I II III IV I II
Receipts from the rest of the world ................................................................................. 1 777.3 809.4 897.7 1,041.2 1,105.1 783.0 792.7 810.0 800.0 835.0 839.6 878.3
Exports of goods and services ...................................................................................................... 2 639.4 658.6 721.2 818.4 870.9 649.1 647.1 661.2 646.8 679.4 678.5 710.1Goods 1 ...................................................................................................................................... 3 448.7 459.7 509.6 583.9 617.5 459.0 451.2 462.2 447.9 477.7 475.7 499.2
Durable .................................................................................................................................. 4 300.9 314.2 349.3 394.3 421.2 309.7 306.0 316.1 306.1 328.3 329.3 346.3Nondurable ............................................................................................................................ 5 147.8 145.6 160.3 189.6 196.3 149.3 145.2 146.0 141.8 149.3 146.4 152.9
Services 1 ................................................................................................................................... 6 190.7 198.9 211.6 234.6 253.3 190.1 195.8 199.0 198.9 201.7 202.8 210.9
Receipts of factor income .............................................................................................................. 7 137.9 150.8 176.5 222.8 234.3 133.9 145.6 148.9 153.2 155.6 161.1 168.3
Capital grants received by the United States (net) ...................................................................... 8 0 0 0 0 0 0 0 0 0 0 0 0
Payments to the rest of the world ................................................................................... 9 777.3 809.4 897.7 1,041.2 1,105.1 783.0 792.7 810.0 800.0 835.0 839.6 878.3
Imports of goods and services ...................................................................................................... 10 669.0 719.3 812.1 904.5 965.7 691.8 693.7 718.7 718.9 746.0 755.1 797.9Goods 1 ...................................................................................................................................... 11 544.9 592.8 676.8 757.5 809.0 564.4 570.8 593.2 592.8 614.4 622.4 663.8
Durable .................................................................................................................................. 12 346.4 385.9 453.6 510.3 533.6 358.7 369.4 380.0 386.0 408.3 418.0 444.2Nondurable ............................................................................................................................ 13 198.4 206.9 223.1 247.3 275.5 205.7 201.4 213.2 206.8 206.2 204.4 219.6
Services 1 ................................................................................................................................... 14 124.1 126.5 135.3 146.9 156.7 127.4 122.9 125.4 126.1 131.6 132.8 134.1
Payments of factor income ............................................................................................................ 15 126.8 132.1 168.3 217.5 232.6 126.4 122.1 132.7 130.9 142.7 144.2 159.3
Transfer payments (net) ................................................................................................................ 16 32.0 36.6 37.3 33.6 39.8 42.0 31.1 33.6 35.0 46.6 31.9 33.6From persons (net) .................................................................................................................... 17 9.6 13.3 14.2 14.8 15.9 9.9 13.1 13.1 13.4 13.7 14.0 14.1From government (net) .............................................................................................................. 18 16.6 17.3 16.4 11.5 16.3 26.1 12.6 14.8 15.5 26.2 11.2 12.9From business ........................................................................................................................... 19 5.8 6.0 6.8 7.3 7.6 5.9 5.5 5.7 6.2 6.7 6.7 6.6
Net foreign investment ................................................................................................................... 20 –50.5 –78.6 –120.0 –114.4 –132.9 –77.2 –54.2 –74.9 –84.9 –100.4 –91.6 –112.5
Line
Seasonally adjusted at annual rates
1994 1995 1996 1997
III IV I II III IV I II III IV I II
Receipts from the rest of the world ................................................................................. 1 914.4 958.2 998.1 1,034.1 1,054.2 1,078.4 1,076.1 1,092.0 1,099.0 1,153.4 1,170.4 ...............
Exports of goods and services ...................................................................................................... 2 732.6 763.7 784.5 807.7 831.6 849.9 850.2 865.0 863.7 904.6 922.2 948.4Goods 1 ...................................................................................................................................... 3 518.9 544.6 560.7 578.6 591.1 605.1 606.1 613.9 609.7 640.5 656.2 679.1
Durable .................................................................................................................................. 4 354.4 367.4 377.9 391.6 397.8 409.9 410.0 420.4 415.8 438.8 455.9 478.4Nondurable ............................................................................................................................ 5 164.5 177.2 182.8 187.0 193.3 195.2 196.1 193.5 193.9 201.6 200.3 200.7
Services 1 ................................................................................................................................... 6 213.7 219.0 223.9 229.2 240.5 244.7 244.1 251.1 254.0 264.2 266.0 269.3
Receipts of factor income .............................................................................................................. 7 181.9 194.6 213.6 226.4 222.6 228.5 226.0 227.1 235.4 248.8 248.2 ...............
Capital grants received by the United States (net) ...................................................................... 8 0 0 0 0 0 0 0 0 0 0 0 0
Payments to the rest of the world ................................................................................... 9 914.4 958.2 998.1 1,034.1 1,054.2 1,078.4 1,076.1 1,092.0 1,099.0 1,153.4 1,170.4 ...............
Imports of goods and services ...................................................................................................... 10 836.0 859.2 882.8 913.1 912.0 909.9 933.2 958.7 977.6 993.2 1,021.0 1,051.8Goods 1 ...................................................................................................................................... 11 699.2 721.7 739.3 767.0 762.9 761.0 778.4 802.9 820.2 834.6 855.8 883.5
Durable .................................................................................................................................. 12 462.6 489.8 499.0 514.1 512.3 515.7 523.1 529.6 540.3 541.3 563.4 587.6Nondurable ............................................................................................................................ 13 236.6 231.9 240.3 252.9 250.6 245.3 255.3 273.4 279.8 293.3 292.5 295.9
Services 1 ................................................................................................................................... 14 136.9 137.5 143.5 146.1 149.1 149.0 154.8 155.8 157.5 158.6 165.2 168.3
Payments of factor income ............................................................................................................ 15 176.1 193.5 207.4 215.3 225.6 221.9 218.2 224.3 242.3 245.6 262.5 ...............
Transfer payments (net) ................................................................................................................ 16 36.5 47.3 33.8 32.4 33.5 34.6 41.6 34.7 35.4 47.4 35.2 35.3From persons (net) .................................................................................................................... 17 14.2 14.4 14.5 14.3 14.9 15.4 15.4 15.8 15.9 16.7 17.0 17.4From government (net) .............................................................................................................. 18 15.7 25.8 12.0 11.0 11.3 11.8 19.2 11.2 11.9 22.9 10.5 9.9From business ........................................................................................................................... 19 6.7 7.1 7.2 7.1 7.4 7.4 7.1 7.6 7.7 7.8 7.7 8.0
Net foreign investment ................................................................................................................... 20 –134.2 –141.8 –125.8 –126.7 –116.9 –88.0 –116.9 –125.6 –156.4 –132.9 –148.4 ...............
1. Exports and imports of certain goods, primarily military equipment purchased and sold by the Federal Govern-ment, are included in services. Beginning with 1986, repairs and alterations of equipment were reclassified fromgoods to services.

August •
Table 4.2.—Real Exports and Imports of Goods and Services and Receipts and Payments of Factor Income[Billions of chained (1992) dollars]
Line 1992 1993 1994 1995 1996
Seasonally adjusted at annual rates
1992 1993 1994
IV I II III IV I II
Exports of goods and services .................................................................................................. 1 639.4 658.2 712.4 791.2 857.0 649.1 647.2 660.1 646.3 679.1 676.0 704.1Goods 1 ...................................................................................................................................... 2 448.7 463.7 509.8 573.9 628.4 461.0 454.1 465.3 452.0 483.5 479.1 501.2
Durable .................................................................................................................................. 3 300.9 317.5 356.5 411.2 463.3 311.1 308.0 318.3 309.8 334.0 334.8 352.6Nondurable ............................................................................................................................ 4 147.8 146.2 153.5 164.1 169.1 149.9 146.1 147.0 142.1 149.6 144.6 149.1
Services 1 ................................................................................................................................... 5 190.7 194.5 202.9 218.0 229.9 188.2 193.1 194.8 194.2 195.9 197.0 203.1
Receipts of factor income .......................................................................................................... 6 137.9 147.3 168.4 207.7 214.2 132.7 143.3 145.6 149.3 150.8 155.3 161.3
Imports of goods and services .................................................................................................. 7 669.0 728.4 817.0 890.1 971.5 689.1 701.9 722.7 729.4 759.7 773.6 808.0Goods 1 ...................................................................................................................................... 8 544.9 602.0 684.1 749.2 823.1 561.8 578.7 597.8 603.1 628.3 641.4 674.6
Durable .................................................................................................................................. 9 346.4 389.4 456.0 511.7 569.9 359.0 372.9 383.5 389.5 411.8 421.8 447.6Nondurable ............................................................................................................................ 10 198.4 212.5 227.8 237.2 253.5 202.8 205.7 214.3 213.5 216.4 219.4 226.6
Services 1 ................................................................................................................................... 11 124.1 126.5 133.2 141.2 149.0 127.4 123.3 124.9 126.3 131.4 132.3 133.6
Payments of factor income ........................................................................................................ 12 126.8 128.8 160.0 200.7 210.2 125.2 119.9 129.6 127.5 138.0 139.3 152.3
Line
Seasonally adjusted at annual rates
1994 1995 1996 1997
III IV I II III IV I II III IV I II
Exports of goods and services .................................................................................................. 1 722.1 747.3 760.4 777.4 802.4 824.6 828.2 847.4 851.4 901.1 922.7 954.1Goods 1 ...................................................................................................................................... 2 518.4 540.4 550.4 565.7 580.4 599.1 605.2 619.2 623.0 666.2 686.2 718.0
Durable .................................................................................................................................. 3 361.8 376.9 388.7 406.4 416.2 433.5 439.1 459.1 460.8 494.0 517.0 546.9Nondurable ............................................................................................................................ 4 156.8 163.6 162.3 160.8 165.5 167.8 168.4 164.5 166.4 177.0 176.0 179.5
Services 1 ................................................................................................................................... 5 204.1 207.5 210.6 212.5 222.6 226.2 224.0 229.3 229.4 236.8 238.9 239.9
Receipts of factor income .......................................................................................................... 6 173.0 184.2 200.8 211.4 207.0 211.5 208.0 208.1 214.8 226.0 224.6 ...............
Imports of goods and services .................................................................................................. 7 833.2 853.2 873.9 890.3 895.4 900.7 929.0 960.0 990.2 1,006.6 1,048.9 1,102.0Goods 1 ...................................................................................................................................... 8 700.0 720.4 733.5 751.4 753.6 758.2 781.4 811.7 841.7 857.5 891.3 942.1
Durable .................................................................................................................................. 9 464.8 489.7 499.7 512.7 511.9 522.6 540.4 559.8 582.6 596.6 630.8 666.0Nondurable ............................................................................................................................ 10 234.8 230.4 233.5 238.5 241.2 235.7 241.3 251.9 259.4 261.6 263.3 279.0
Services 1 ................................................................................................................................... 11 133.5 133.2 140.7 139.3 142.1 142.9 147.8 148.8 149.3 150.0 158.4 161.2
Payments of factor income ........................................................................................................ 12 166.9 181.4 192.9 198.9 207.5 203.5 199.4 203.7 218.1 219.8 234.0 ...............
1. Exports and imports of certain goods, primarily military equipment purchased and sold by the Federal Govern-ment, are included in services. Beginning with 1986, repairs and alterations of equipment are reclassified from goodsto services.
NOTE.—Chained (1992) dollar series are calculated as the product of the chain-type quantity index and the 1992current-dollar value of the corresponding series, divided by 100. Because the formula for the chain-type quantityindexes uses weights of more than one period, the corresponding chained-dollar estimates are usually not additive.

• August
Table 4.3.—Exports and Imports of Goods and Services by Type of Product[Billions of dollars]
Line 1992 1993 1994 1995 1996
Seasonally adjusted at annual rates
1992 1993 1994
IV I II III IV I II
Exports of goods and services ......................................................................................... 1 639.4 658.6 721.2 818.4 870.9 649.1 647.1 661.2 646.8 679.4 678.5 710.1
Exports of goods 1 ....................................................................................................................... 2 448.7 459.7 509.6 583.9 617.5 459.0 451.2 462.2 447.9 477.7 475.7 499.2
Foods, feeds, and beverages ................................................................................................... 3 40.3 40.7 42.0 50.5 55.5 41.7 41.1 40.7 38.7 42.2 40.1 38.1Industrial supplies and materials ............................................................................................... 4 105.1 102.7 115.7 141.3 141.0 104.5 103.1 103.3 100.9 103.6 103.7 111.7
Durable goods ....................................................................................................................... 5 36.8 37.6 41.3 49.8 51.0 37.3 37.3 37.7 37.6 37.7 37.9 39.8Nondurable goods ................................................................................................................. 6 68.2 65.1 74.5 91.4 90.1 67.3 65.7 65.6 63.3 65.9 65.8 71.9
Capital goods, except automotive ............................................................................................. 7 176.1 182.1 205.2 233.8 253.1 180.5 177.3 183.4 176.1 191.5 195.3 204.4Civilian aircraft, engines, and parts ...................................................................................... 8 37.7 32.7 31.5 26.1 30.8 37.1 33.2 36.3 26.7 34.5 34.1 33.9Computers, peripherals, and parts ....................................................................................... 9 28.8 29.3 33.3 39.7 43.7 29.5 28.9 28.5 29.6 30.3 31.2 32.5Other ...................................................................................................................................... 10 109.6 120.1 140.5 168.0 178.6 113.9 115.3 118.5 119.8 126.7 130.1 138.1
Automotive vehicles, engines, and parts .................................................................................. 11 47.0 52.5 57.8 61.8 65.0 50.2 51.1 52.7 50.7 55.7 54.2 57.0Consumer goods, except automotive ....................................................................................... 12 51.4 54.7 60.0 64.4 70.1 53.2 53.5 54.6 54.6 55.9 56.2 59.5
Durable goods ....................................................................................................................... 13 26.6 28.4 30.6 32.8 35.8 27.3 27.7 28.6 28.3 29.1 28.8 30.8Nondurable goods ................................................................................................................. 14 24.9 26.2 29.4 31.6 34.3 25.9 25.8 26.0 26.3 26.9 27.4 28.7
Other .......................................................................................................................................... 15 28.8 27.0 28.9 32.1 32.7 28.9 25.2 27.5 26.8 28.7 26.2 28.5Durable goods ....................................................................................................................... 16 14.4 13.5 14.5 16.1 16.3 14.4 12.6 13.7 13.4 14.3 13.1 14.2Nondurable goods ................................................................................................................. 17 14.4 13.5 14.5 16.1 16.3 14.4 12.6 13.7 13.4 14.3 13.1 14.2
Exports of services 1 ................................................................................................................... 18 190.7 198.9 211.6 234.6 253.3 190.1 195.8 199.0 198.9 201.7 202.8 210.9
Transfers under U.S. military agency sales contracts ............................................................. 19 10.9 11.6 10.9 12.8 13.5 9.0 12.4 12.3 11.9 9.9 9.8 11.6Travel ......................................................................................................................................... 20 54.7 57.9 58.4 63.4 69.9 55.4 56.8 57.9 57.9 58.9 57.6 58.9Passenger fares ......................................................................................................................... 21 16.6 16.6 17.1 19.1 20.6 16.7 16.5 16.5 16.8 16.6 16.9 17.0Other transportation ................................................................................................................... 22 23.7 23.1 24.9 27.4 27.2 23.5 23.1 23.2 22.6 23.3 23.2 24.7Royalties and license fees ........................................................................................................ 23 20.0 20.3 22.7 27.4 30.0 19.7 19.8 20.7 20.1 20.7 21.3 22.2Other private services ............................................................................................................... 24 49.9 53.3 59.9 65.5 72.2 50.8 51.7 52.3 53.5 55.9 57.3 59.3Other .......................................................................................................................................... 25 14.9 16.1 17.7 18.9 19.9 15.1 15.6 16.2 16.1 16.4 16.7 17.2
Imports of goods and services ......................................................................................... 26 669.0 719.3 812.1 904.5 965.7 691.8 693.7 718.7 718.9 746.0 755.1 797.9
Imports of goods 1 ....................................................................................................................... 27 544.9 592.8 676.8 757.5 809.0 564.4 570.8 593.2 592.8 614.4 622.4 663.8
Foods, feeds, and beverages ................................................................................................... 28 27.6 27.9 31.0 33.2 35.7 27.4 27.3 27.6 27.9 28.8 29.5 30.6Industrial supplies and materials, except petroleum and products ......................................... 29 82.3 88.9 105.0 119.9 125.2 84.1 86.0 87.6 89.4 92.7 96.4 101.9
Durable goods ....................................................................................................................... 30 39.2 43.1 53.5 59.8 63.1 39.7 40.9 41.1 43.2 46.9 48.2 52.5Nondurable goods ................................................................................................................. 31 43.2 45.9 51.4 60.1 62.1 44.4 45.1 46.4 46.2 45.7 48.2 49.4
Petroleum and products ............................................................................................................ 32 51.6 51.5 51.3 56.2 72.7 54.9 51.0 57.2 50.1 47.6 41.9 51.5Capital goods, except automotive ............................................................................................. 33 134.3 152.3 184.4 221.4 229.0 141.3 143.6 151.1 152.6 161.8 170.0 179.4
Civilian aircraft, engines, and parts ...................................................................................... 34 12.6 11.3 11.3 10.7 12.7 13.0 10.6 11.7 10.4 12.4 11.3 12.2Computers, peripherals, and parts ....................................................................................... 35 31.7 38.0 46.2 56.3 61.5 34.2 36.1 37.5 38.9 39.5 41.6 44.8Other ...................................................................................................................................... 36 90.0 103.0 126.9 154.4 154.9 94.1 96.9 101.9 103.3 109.9 117.1 122.4
Automotive vehicles, engines, and parts .................................................................................. 37 91.8 102.4 118.3 123.8 128.9 95.0 100.1 101.7 100.8 107.1 107.9 115.3Consumer goods, except automotive ....................................................................................... 38 122.7 134.1 146.3 159.9 171.0 126.8 129.1 132.5 136.5 138.2 137.9 144.3
Durable goods ....................................................................................................................... 39 63.9 70.3 77.2 83.7 89.3 65.3 68.0 68.2 71.6 73.2 72.5 76.6Nondurable goods ................................................................................................................. 40 58.7 63.8 69.1 76.2 81.7 61.5 61.2 64.2 64.9 65.0 65.4 67.8
Other .......................................................................................................................................... 41 34.6 35.7 40.6 43.2 46.4 34.9 33.6 35.6 35.4 38.3 38.8 40.7Durable goods ....................................................................................................................... 42 17.3 17.9 20.3 21.6 23.2 17.5 16.8 17.8 17.7 19.1 19.4 20.4Nondurable goods ................................................................................................................. 43 17.3 17.9 20.3 21.6 23.2 17.5 16.8 17.8 17.7 19.1 19.4 20.4
Imports of services 1 ................................................................................................................... 44 124.1 126.5 135.3 146.9 156.7 127.4 122.9 125.4 126.1 131.6 132.8 134.1
Direct defense expenditures ...................................................................................................... 45 13.8 12.2 10.3 9.9 10.9 13.5 12.7 12.8 11.7 11.6 10.9 10.8Travel ......................................................................................................................................... 46 38.6 40.7 43.8 46.1 48.7 39.4 39.3 39.3 40.2 44.0 43.5 43.5Passenger fares ......................................................................................................................... 47 10.6 11.3 12.9 14.4 15.8 11.0 11.0 11.0 11.4 11.9 12.6 12.8Other transportation ................................................................................................................... 48 25.5 25.7 27.3 28.3 28.5 25.9 25.3 26.1 25.5 26.1 25.9 27.0Royalties and license fees ........................................................................................................ 49 5.1 4.8 5.6 6.5 7.3 4.4 4.4 4.8 5.0 5.1 6.2 5.0Other private services ............................................................................................................... 50 25.0 26.0 29.4 35.4 38.9 27.6 24.5 25.8 26.5 27.4 27.9 28.9Other .......................................................................................................................................... 51 5.6 5.7 6.1 6.3 6.6 5.6 5.8 5.7 5.9 5.4 5.9 6.0
Addenda:Exports of agricultural goods 2 .................................................................................................. 52 44.0 43.7 47.1 57.2 61.5 45.6 43.7 43.6 42.1 45.3 43.5 43.7Exports of nonagricultural goods .............................................................................................. 53 404.6 416.0 462.5 526.6 556.0 413.4 407.5 418.5 405.8 432.4 432.2 455.5Imports of nonpetroleum goods ................................................................................................ 54 493.3 541.3 625.5 701.4 736.3 509.5 519.8 536.0 542.7 566.9 580.5 612.3
See footnotes at end of table.

August •
Table 4.3.—Exports and Imports of Goods and Services by Type of Product—Continued[Billions of dollars]
Line
Seasonally adjusted at annual rates
1994 1995 1996 1997
III IV I II III IV I II III IV I II
Exports of goods and services ......................................................................................... 1 732.6 763.7 784.5 807.7 831.6 849.9 850.2 865.0 863.7 904.6 922.2 948.4
Exports of goods 1 ....................................................................................................................... 2 518.9 544.6 560.7 578.6 591.1 605.1 606.1 613.9 609.7 640.5 656.2 679.1
Foods, feeds, and beverages ................................................................................................... 3 41.3 48.4 47.6 47.6 53.4 53.3 56.1 55.0 55.1 55.8 51.1 48.2Industrial supplies and materials ............................................................................................... 4 120.6 126.9 137.2 142.3 143.7 141.9 140.2 138.5 139.5 145.9 147.4 151.0
Durable goods ....................................................................................................................... 5 42.8 44.6 48.2 49.9 51.7 49.5 49.7 51.2 51.0 51.9 53.2 54.1Nondurable goods ................................................................................................................. 6 77.9 82.3 89.0 92.3 92.0 92.4 90.5 87.3 88.5 94.0 94.3 96.9
Capital goods, except automotive ............................................................................................. 7 208.0 213.2 217.7 232.4 237.3 247.6 247.9 252.6 246.8 265.3 275.9 294.8Civilian aircraft, engines, and parts ...................................................................................... 8 28.5 29.5 24.9 31.0 23.6 25.0 26.4 33.3 26.8 36.7 39.6 46.4Computers, peripherals, and parts ....................................................................................... 9 34.1 35.6 36.1 37.6 41.3 43.6 44.6 43.4 43.5 43.3 46.3 49.4Other ...................................................................................................................................... 10 145.5 148.1 156.7 163.8 172.4 179.0 176.9 175.9 176.5 185.2 190.0 199.0
Automotive vehicles, engines, and parts .................................................................................. 11 58.0 62.0 63.7 60.2 60.9 62.4 62.7 64.2 66.2 67.0 70.9 71.8Consumer goods, except automotive ....................................................................................... 12 61.0 63.3 62.9 64.6 64.8 65.5 68.3 69.9 69.4 72.9 75.3 77.9
Durable goods ....................................................................................................................... 13 30.6 32.2 32.5 33.3 32.3 33.1 34.3 35.7 35.5 37.8 38.1 40.0Nondurable goods ................................................................................................................. 14 30.4 31.1 30.4 31.3 32.4 32.3 34.0 34.3 33.9 35.1 37.2 37.9
Other .......................................................................................................................................... 15 30.0 30.9 31.5 31.5 30.9 34.5 30.9 33.6 32.7 33.5 35.6 35.4Durable goods ....................................................................................................................... 16 15.0 15.5 15.8 15.7 15.5 17.3 15.4 16.8 16.3 16.8 17.8 17.7Nondurable goods ................................................................................................................. 17 15.0 15.5 15.8 15.7 15.5 17.3 15.4 16.8 16.3 16.8 17.8 17.7
Exports of services 1 ................................................................................................................... 18 213.7 219.0 223.9 229.2 240.5 244.7 244.1 251.1 254.0 264.2 266.0 269.3
Transfers under U.S. military agency sales contracts ............................................................. 19 12.2 10.1 12.1 12.9 13.8 12.4 11.6 14.9 12.8 14.9 12.3 13.6Travel ......................................................................................................................................... 20 58.0 59.2 59.5 60.2 65.4 68.5 66.8 69.4 70.6 72.7 74.5 73.8Passenger fares ......................................................................................................................... 21 17.1 17.3 18.3 18.3 19.6 20.4 20.3 19.8 20.9 21.1 21.3 21.4Other transportation ................................................................................................................... 22 25.4 26.5 26.4 27.6 27.5 28.1 26.2 27.2 26.9 28.6 28.2 29.0Royalties and license fees ........................................................................................................ 23 23.2 24.0 25.9 26.9 28.3 28.3 29.7 29.4 30.0 30.8 30.9 31.2Other private services ............................................................................................................... 24 60.0 62.8 62.7 64.4 66.8 68.2 70.2 71.2 72.4 75.2 77.7 79.0Other .......................................................................................................................................... 25 17.9 19.0 18.9 18.8 19.1 18.7 19.1 19.2 20.4 20.8 21.0 21.3
Imports of goods and services ......................................................................................... 26 836.0 859.2 882.8 913.1 912.0 909.9 933.2 958.7 977.6 993.2 1,021.0 1,051.8
Imports of goods 1 ....................................................................................................................... 27 699.2 721.7 739.3 767.0 762.9 761.0 778.4 802.9 820.2 834.6 855.8 883.5
Foods, feeds, and beverages ................................................................................................... 28 31.9 31.9 34.2 32.8 33.0 32.8 34.4 35.9 35.8 36.7 38.0 40.9Industrial supplies and materials, except petroleum and products ......................................... 29 107.3 114.4 118.6 123.2 119.4 118.4 121.5 123.5 127.1 128.7 130.7 135.0
Durable goods ....................................................................................................................... 30 54.7 58.8 61.1 61.9 58.3 57.8 59.8 63.0 64.7 64.9 65.7 70.6Nondurable goods ................................................................................................................. 31 52.6 55.6 57.4 61.3 61.2 60.7 61.7 60.4 62.4 63.8 65.0 64.4
Petroleum and products ............................................................................................................ 32 60.6 51.1 52.8 59.6 57.5 54.7 58.5 74.1 76.2 82.2 76.7 71.3Capital goods, except automotive ............................................................................................. 33 188.2 199.9 205.3 219.3 227.9 233.3 231.1 226.3 227.4 231.4 237.3 251.6
Civilian aircraft, engines, and parts ...................................................................................... 34 9.8 11.8 10.6 11.2 10.4 10.6 10.9 12.8 13.0 14.0 13.6 15.8Computers, peripherals, and parts ....................................................................................... 35 47.2 51.0 50.0 53.6 58.6 62.9 60.8 60.8 61.7 62.8 65.5 70.6Other ...................................................................................................................................... 36 131.1 137.1 144.7 154.4 158.9 159.8 159.4 152.8 152.7 154.6 158.2 165.2
Automotive vehicles, engines, and parts .................................................................................. 37 121.3 128.5 129.4 126.2 120.7 119.0 124.0 129.1 133.7 128.9 142.2 140.0Consumer goods, except automotive ....................................................................................... 38 148.4 154.5 158.4 162.0 161.2 158.0 163.8 167.6 173.2 179.4 181.2 193.6
Durable goods ....................................................................................................................... 39 77.7 81.8 82.9 84.7 83.8 83.2 85.6 87.9 91.2 92.4 93.2 99.8Nondurable goods ................................................................................................................. 40 70.7 72.6 75.5 77.3 77.4 74.7 78.2 79.7 82.0 87.0 88.0 93.8
Other .......................................................................................................................................... 41 41.5 41.5 40.7 44.0 43.2 44.8 45.1 46.5 46.7 47.2 49.6 51.1Durable goods ....................................................................................................................... 42 20.8 20.7 20.3 22.0 21.6 22.4 22.6 23.2 23.4 23.6 24.8 25.5Nondurable goods ................................................................................................................. 43 20.8 20.7 20.3 22.0 21.6 22.4 22.6 23.2 23.4 23.6 24.8 25.5
Imports of services 1 ................................................................................................................... 44 136.9 137.5 143.5 146.1 149.1 149.0 154.8 155.8 157.5 158.6 165.2 168.3
Direct defense expenditures ...................................................................................................... 45 10.0 9.5 10.1 9.9 9.9 9.7 10.4 11.0 11.1 10.9 11.2 11.4Travel ......................................................................................................................................... 46 44.2 43.9 45.1 46.0 46.0 47.1 49.9 48.4 47.7 49.0 52.3 53.2Passenger fares ......................................................................................................................... 47 13.2 12.9 13.4 14.4 14.8 15.1 15.4 15.8 15.7 16.2 17.1 17.2Other transportation ................................................................................................................... 48 28.3 27.8 28.4 28.4 28.6 27.7 27.3 29.0 28.9 28.7 29.3 30.1Royalties and license fees ........................................................................................................ 49 5.4 5.7 6.0 6.3 6.8 7.0 6.9 6.7 8.6 7.1 7.6 7.6Other private services ............................................................................................................... 50 29.5 31.4 34.0 35.0 36.7 36.2 38.4 38.4 38.9 40.0 40.9 41.9Other .......................................................................................................................................... 51 6.3 6.3 6.5 6.2 6.4 6.3 6.4 6.5 6.7 6.8 6.8 6.9
Addenda:Exports of agricultural goods 2 .................................................................................................. 52 47.2 53.9 55.2 53.9 59.3 60.5 63.5 60.3 60.4 61.8 57.3 56.3Exports of nonagricultural goods .............................................................................................. 53 471.7 490.7 505.4 524.7 531.9 544.6 542.6 553.5 549.3 578.7 598.9 622.8Imports of nonpetroleum goods ................................................................................................ 54 638.6 670.6 686.5 707.4 705.4 706.3 720.0 728.9 743.9 752.4 779.1 812.1
1. Exports and imports of certain goods, primarily military equipment purchased and sold by the Federal Govern-ment, are included in services. Beginning with 1986, repairs and alterations of equipment are reclassified from goodsto services.
2. Includes parts of foods, feeds, and beverages; of nondurable industrial supplies and materials; and of nondura-ble nonautomotive consumer goods.

• August
Table 4.4.—Real Exports and Imports of Goods and Services by Type of Product[Billions of chained (1992) dollars]
Line 1992 1993 1994 1995 1996
Seasonally adjusted at annual rates
1992 1993 1994
IV I II III IV I II
Exports of goods and services ......................................................................................... 1 639.4 658.2 712.4 791.2 857.0 649.1 647.2 660.1 646.3 679.1 676.0 704.1
Exports of goods 1 ....................................................................................................................... 2 448.7 463.7 509.8 573.9 628.4 461.0 454.1 465.3 452.0 483.5 479.1 501.2
Foods, feeds, and beverages ................................................................................................... 3 40.3 40.2 40.2 44.5 44.0 42.5 41.5 41.0 37.8 40.6 37.4 36.0Industrial supplies and materials ............................................................................................... 4 105.1 102.2 108.1 116.4 121.9 103.7 102.5 101.9 100.6 104.1 102.6 107.6
Durable goods ....................................................................................................................... 5 36.8 35.4 37.5 42.3 44.8 36.4 35.7 35.1 35.3 35.6 35.2 36.7Nondurable goods ................................................................................................................. 6 68.2 66.8 70.6 74.2 77.1 67.2 66.7 66.8 65.3 68.5 67.4 70.9
Capital goods, except automotive ............................................................................................. 7 176.1 188.4 218.4 263.5 310.4 183.2 181.6 188.9 182.6 200.3 205.3 216.1Civilian aircraft, engines, and parts ...................................................................................... 8 37.7 31.7 29.7 23.8 27.0 36.7 32.5 35.3 25.9 33.2 32.4 32.0Computers, peripherals, and parts ....................................................................................... 9 28.8 35.1 45.4 66.5 97.2 31.4 32.2 33.3 36.1 38.8 40.8 43.1Other ...................................................................................................................................... 10 109.6 122.0 145.4 180.7 203.3 115.0 117.0 120.2 121.9 129.0 133.2 142.2
Automotive vehicles, engines, and parts .................................................................................. 11 47.0 52.1 56.7 60.0 62.4 49.9 50.6 52.2 50.3 55.2 53.4 56.1Consumer goods, except automotive ....................................................................................... 12 51.4 54.0 59.1 62.6 67.3 52.8 52.8 54.0 54.0 55.2 55.4 58.6
Durable goods ....................................................................................................................... 13 26.6 28.4 30.4 32.3 34.9 27.2 27.5 28.6 28.3 29.0 28.6 30.6Nondurable goods ................................................................................................................. 14 24.9 25.7 28.7 30.3 32.4 25.7 25.3 25.5 25.7 26.2 26.8 28.0
Other .......................................................................................................................................... 15 28.8 26.9 28.2 30.4 31.5 28.9 25.1 27.3 26.7 28.5 25.9 27.9Durable goods ....................................................................................................................... 16 14.4 13.4 14.1 15.2 15.8 14.4 12.5 13.6 13.3 14.2 12.9 14.0Nondurable goods ................................................................................................................. 17 14.4 13.4 14.1 15.2 15.8 14.4 12.5 13.6 13.3 14.2 12.9 14.0
Exports of services 1 ................................................................................................................... 18 190.7 194.5 202.9 218.0 229.9 188.2 193.1 194.8 194.2 195.9 197.0 203.1
Transfers under U.S. military agency sales contracts ............................................................. 19 10.9 11.3 10.2 11.6 12.2 9.0 12.2 12.1 11.5 9.4 9.3 10.8Travel ......................................................................................................................................... 20 54.7 56.6 56.1 59.1 62.6 54.8 56.1 56.7 56.6 57.1 55.6 56.5Passenger fares ......................................................................................................................... 21 16.6 16.4 16.4 17.4 18.7 16.8 16.6 16.2 16.3 16.3 16.5 16.5Other transportation ................................................................................................................... 22 23.7 22.7 24.6 26.6 25.8 23.0 22.8 22.7 22.3 23.0 23.1 24.6Royalties and license fees ........................................................................................................ 23 20.0 19.8 21.6 25.5 27.4 19.5 19.5 20.2 19.5 20.1 20.5 21.2Other private services ............................................................................................................... 24 49.9 52.2 57.6 61.8 67.0 50.3 50.7 51.2 52.3 54.4 55.5 57.2Other .......................................................................................................................................... 25 14.9 15.5 16.4 16.1 16.3 14.8 15.2 15.7 15.6 15.7 16.4 16.2
Residual .......................................................................................................................................... 26 0 –.5 –3.3 –11.9 –27.7 .1 .1 .1 –1.0 –1.4 –1.9 –2.5
Imports of goods and services ......................................................................................... 27 669.0 728.4 817.0 890.1 971.5 689.1 701.9 722.7 729.4 759.7 773.6 808.0
Imports of goods 1 ....................................................................................................................... 28 544.9 602.0 684.1 749.2 823.1 561.8 578.7 597.8 603.1 628.3 641.4 674.6
Foods, feeds, and beverages ................................................................................................... 29 27.6 28.0 28.7 29.3 32.3 27.7 28.1 28.1 27.7 28.2 28.9 29.1Industrial supplies and materials, except petroleum and products ......................................... 30 82.3 89.6 102.8 107.9 114.2 83.9 86.2 87.8 90.7 93.8 96.9 101.5
Durable goods ....................................................................................................................... 31 39.2 43.0 51.7 53.5 57.3 39.9 40.5 40.9 43.7 47.0 47.8 51.5Nondurable goods ................................................................................................................. 32 43.2 46.6 51.0 54.3 56.8 44.0 45.7 46.9 47.0 46.8 49.1 50.0
Petroleum and products ............................................................................................................ 33 51.6 56.7 60.2 59.3 63.8 53.0 53.7 57.9 56.9 58.3 57.0 60.6Capital goods, except automotive ............................................................................................. 34 134.3 158.5 196.9 246.5 294.5 142.6 147.8 156.9 158.7 170.4 180.4 191.1
Civilian aircraft, engines, and parts ...................................................................................... 35 12.6 10.9 10.6 9.8 11.2 12.8 10.4 11.4 10.1 11.9 10.7 11.5Computers, peripherals, and parts ....................................................................................... 36 31.7 44.6 62.2 88.7 118.3 35.7 39.1 42.9 46.5 49.8 53.4 59.0Other ...................................................................................................................................... 37 90.0 103.5 126.3 154.4 177.6 94.1 98.5 102.9 103.1 109.6 117.3 122.1
Automotive vehicles, engines, and parts .................................................................................. 38 91.8 100.9 112.9 114.8 118.8 94.2 100.1 100.5 99.2 103.8 104.2 110.7Consumer goods, except automotive ....................................................................................... 39 122.7 132.9 144.0 155.1 165.3 125.4 129.0 131.3 135.0 136.4 136.3 142.4
Durable goods ....................................................................................................................... 40 63.9 69.4 75.8 81.2 86.6 64.8 67.6 67.6 70.5 72.1 71.3 75.3Nondurable goods ................................................................................................................. 41 58.7 63.5 68.2 73.9 78.7 60.6 61.4 63.8 64.5 64.4 65.1 67.1
Other .......................................................................................................................................... 42 34.6 35.5 39.4 40.2 43.2 34.7 33.7 35.4 35.2 37.8 38.2 39.8Durable goods ....................................................................................................................... 43 17.3 17.8 19.7 20.1 21.6 17.4 16.9 17.7 17.6 18.9 19.1 19.9Nondurable goods ................................................................................................................. 44 17.3 17.8 19.7 20.1 21.6 17.4 16.9 17.7 17.6 18.9 19.1 19.9
Imports of services 1 ................................................................................................................... 45 124.1 126.5 133.2 141.2 149.0 127.4 123.3 124.9 126.3 131.4 132.3 133.6
Direct defense expenditures ...................................................................................................... 46 13.8 12.7 10.5 9.1 10.1 13.6 13.5 13.2 11.9 12.2 11.8 11.2Travel ......................................................................................................................................... 47 38.6 40.4 41.9 43.0 44.6 39.5 39.2 38.8 40.3 43.5 42.2 42.7Passenger fares ......................................................................................................................... 48 10.6 11.5 13.0 13.9 14.9 11.2 11.2 11.1 11.5 12.2 12.9 13.1Other transportation ................................................................................................................... 49 25.5 25.6 27.2 28.0 27.6 25.6 25.2 25.9 25.4 26.0 26.0 27.1Royalties and license fees ........................................................................................................ 50 5.1 4.7 5.3 6.1 6.7 4.4 4.3 4.7 4.9 4.9 5.9 4.8Other private services ............................................................................................................... 51 25.0 25.9 29.3 35.4 39.2 27.5 24.2 25.7 26.6 27.3 27.8 28.9Other .......................................................................................................................................... 52 5.6 5.6 5.8 5.9 6.0 5.6 5.7 5.6 5.8 5.3 5.7 5.8
Residual .......................................................................................................................................... 53 –.1 –.7 –3.0 –10.7 –22.2 .1 –.3 –.6 –1.4 –1.4 –1.7 –2.3
Addenda:Exports of agricultural goods 2 .................................................................................................. 54 44.0 43.0 44.4 49.5 48.6 46.0 43.8 43.9 41.0 43.4 40.4 41.2Exports of nonagricultural goods .............................................................................................. 55 404.6 420.7 465.6 524.6 581.3 415.0 410.3 421.4 411.1 440.1 439.0 460.4Imports of nonpetroleum goods ................................................................................................ 56 493.3 545.3 623.4 688.6 757.8 508.6 524.9 540.0 546.2 569.9 584.0 613.6
See note at end of table.

August •
Table 4.4.—Real Exports and Imports of Goods and Services by Type of Product—Continued[Billions of chained (1992) dollars]
Line
Seasonally adjusted at annual rates
1994 1995 1996 1997
III IV I II III IV I II III IV I II
Exports of goods and services ......................................................................................... 1 722.1 747.3 760.4 777.4 802.4 824.6 828.2 847.4 851.4 901.1 922.7 954.1
Exports of goods 1 ....................................................................................................................... 2 518.4 540.4 550.4 565.7 580.4 599.1 605.2 619.2 623.0 666.2 686.2 718.0
Foods, feeds, and beverages ................................................................................................... 3 40.3 46.8 45.2 43.5 45.8 43.4 44.6 41.2 42.8 47.2 43.2 43.3Industrial supplies and materials ............................................................................................... 4 111.0 111.1 113.7 114.5 117.8 119.7 119.8 119.9 121.3 126.6 127.6 130.9
Durable goods ....................................................................................................................... 5 38.9 39.4 41.0 42.0 43.8 42.4 42.8 44.7 45.4 46.3 46.9 47.7Nondurable goods ................................................................................................................. 6 72.1 71.7 72.8 72.6 74.1 77.3 76.9 75.3 76.0 80.4 80.8 83.2
Capital goods, except automotive ............................................................................................. 7 221.5 230.9 239.3 259.9 269.0 285.8 292.0 306.6 305.8 337.2 356.1 386.0Civilian aircraft, engines, and parts ...................................................................................... 8 26.8 27.6 22.9 28.4 21.5 22.6 23.5 29.4 23.3 31.8 33.7 39.5Computers, peripherals, and parts ....................................................................................... 9 46.5 51.3 55.3 60.2 70.6 79.8 87.8 94.0 100.3 106.8 122.3 140.5Other ...................................................................................................................................... 10 150.8 155.3 165.5 175.5 186.4 195.5 195.4 198.4 202.4 217.2 224.7 236.0
Automotive vehicles, engines, and parts .................................................................................. 11 56.9 60.5 62.0 58.6 59.2 59.9 60.2 61.6 63.5 64.1 67.6 68.3Consumer goods, except automotive ....................................................................................... 12 60.1 62.2 61.5 62.8 62.8 63.4 65.7 67.1 66.5 69.8 71.8 74.4
Durable goods ....................................................................................................................... 13 30.4 31.9 32.1 32.8 31.7 32.5 33.5 34.7 34.5 36.8 36.8 38.5Nondurable goods ................................................................................................................. 14 29.7 30.3 29.4 30.0 31.0 30.8 32.2 32.4 32.0 33.0 35.0 35.8
Other .......................................................................................................................................... 15 29.2 29.8 29.9 29.6 29.2 32.8 29.4 32.1 31.6 33.0 35.1 35.1Durable goods ....................................................................................................................... 16 14.6 14.9 14.9 14.8 14.6 16.4 14.7 16.0 15.8 16.5 17.6 17.6Nondurable goods ................................................................................................................. 17 14.6 14.9 14.9 14.8 14.6 16.4 14.7 16.0 15.8 16.5 17.6 17.6
Exports of services 1 ................................................................................................................... 18 204.1 207.5 210.6 212.5 222.6 226.2 224.0 229.3 229.4 236.8 238.9 239.9
Transfers under U.S. military agency sales contracts ............................................................. 19 11.3 9.3 11.2 11.7 12.4 11.0 10.2 13.4 11.6 13.5 11.1 12.2Travel ......................................................................................................................................... 20 55.5 56.7 56.6 56.2 60.7 63.1 60.8 62.5 62.9 64.4 65.3 64.3Passenger fares ......................................................................................................................... 21 16.4 16.3 16.9 16.2 17.8 18.7 18.6 18.3 19.1 18.8 20.7 19.5Other transportation ................................................................................................................... 22 24.8 26.1 25.8 26.6 26.6 27.5 25.1 25.9 25.4 26.7 26.5 27.5Royalties and license fees ........................................................................................................ 23 22.1 22.7 24.4 25.1 26.3 26.2 27.4 26.9 27.3 28.0 28.0 28.1Other private services ............................................................................................................... 24 57.5 60.0 59.6 60.9 62.6 63.9 65.5 66.1 67.0 69.3 71.4 72.2Other .......................................................................................................................................... 25 16.5 16.6 16.2 15.9 16.2 16.0 16.5 16.2 16.2 16.2 16.3 16.4
Residual .......................................................................................................................................... 26 –3.6 –5.0 –6.3 –8.4 –13.5 –18.8 –22.2 –25.6 –29.9 –32.4 –42.8 –54.1
Imports of goods and services ......................................................................................... 27 833.2 853.2 873.9 890.3 895.4 900.7 929.0 960.0 990.2 1,006.6 1,048.9 1,102.0
Imports of goods 1 ....................................................................................................................... 28 700.0 720.4 733.5 751.4 753.6 758.2 781.4 811.7 841.7 857.5 891.3 942.1
Foods, feeds, and beverages ................................................................................................... 29 28.7 28.1 29.8 29.1 29.0 29.4 31.5 31.8 32.5 33.2 34.2 36.1Industrial supplies and materials, except petroleum and products ......................................... 30 104.7 108.0 108.8 111.0 106.3 105.4 109.5 112.7 116.9 117.7 118.3 123.9
Durable goods ....................................................................................................................... 31 52.7 54.8 55.5 55.7 51.6 51.5 54.3 57.1 58.8 59.1 59.1 62.7Nondurable goods ................................................................................................................. 32 51.9 53.1 53.3 55.2 54.7 53.9 55.2 55.6 58.1 58.5 59.2 61.1
Petroleum and products ............................................................................................................ 33 65.1 58.2 57.0 58.7 62.4 59.1 57.9 65.9 67.5 64.0 62.2 67.9Capital goods, except automotive ............................................................................................. 34 201.0 215.3 224.2 240.3 253.6 267.9 275.6 284.2 298.6 319.6 340.3 370.6
Civilian aircraft, engines, and parts ...................................................................................... 35 9.2 11.1 9.8 10.4 9.5 9.7 9.8 11.3 11.4 12.2 11.7 13.4Computers, peripherals, and parts ....................................................................................... 36 64.4 72.1 73.5 82.3 93.4 105.4 107.0 114.4 121.5 130.2 144.4 168.0Other ...................................................................................................................................... 37 130.0 135.7 144.1 152.1 158.1 163.4 169.1 170.5 179.1 191.8 202.8 213.7
Automotive vehicles, engines, and parts .................................................................................. 38 115.8 120.8 121.4 116.9 111.3 109.4 114.2 119.0 123.1 118.7 131.0 129.1Consumer goods, except automotive ....................................................................................... 39 145.8 151.4 154.8 156.9 155.8 152.8 157.9 161.9 167.6 173.9 176.5 189.0
Durable goods ....................................................................................................................... 40 76.3 80.3 80.9 82.1 81.0 80.6 82.7 85.2 88.6 90.0 91.5 98.8Nondurable goods ................................................................................................................. 41 69.6 71.1 73.9 74.8 74.8 72.2 75.2 76.7 78.9 83.9 84.9 90.1
Other .......................................................................................................................................... 42 40.1 39.5 38.4 40.9 40.0 41.5 41.9 43.2 43.6 44.0 46.4 48.0Durable goods ....................................................................................................................... 43 20.0 19.7 19.2 20.4 20.0 20.8 20.9 21.6 21.8 22.0 23.2 24.0Nondurable goods ................................................................................................................. 44 20.0 19.7 19.2 20.4 20.0 20.8 20.9 21.6 21.8 22.0 23.2 24.0
Imports of services 1 ................................................................................................................... 45 133.5 133.2 140.7 139.3 142.1 142.9 147.8 148.8 149.3 150.0 158.4 161.2
Direct defense expenditures ...................................................................................................... 46 9.8 9.2 9.7 8.8 9.0 8.7 9.7 10.3 10.3 10.0 11.0 11.3Travel ......................................................................................................................................... 47 41.8 40.8 43.6 42.2 42.4 44.0 46.1 44.7 43.0 44.7 49.1 50.4Passenger fares ......................................................................................................................... 48 13.2 12.9 13.1 13.8 14.2 14.3 14.6 15.0 15.0 15.1 15.7 15.3Other transportation ................................................................................................................... 49 28.1 27.7 28.2 27.9 28.3 27.4 26.7 28.2 28.0 27.4 28.1 28.9Royalties and license fees ........................................................................................................ 50 5.2 5.4 5.7 5.8 6.3 6.4 6.3 6.2 7.8 6.4 6.9 6.9Other private services ............................................................................................................... 51 29.3 31.4 34.1 35.0 36.2 36.3 38.6 38.6 39.3 40.3 41.4 42.3Other .......................................................................................................................................... 52 6.0 5.9 6.2 5.8 5.9 5.8 5.9 6.0 6.1 6.2 6.3 6.3
Residual .......................................................................................................................................... 53 –3.9 –4.8 –4.3 –7.1 –12.7 –18.4 –17.6 –19.7 –22.4 –29.1 –37.0 –48.3
Addenda:Exports of agricultural goods 2 .................................................................................................. 54 45.2 50.7 50.5 48.1 50.3 48.9 50.4 45.4 46.8 51.7 47.7 49.9Exports of nonagricultural goods .............................................................................................. 55 473.3 489.5 499.8 517.8 530.0 551.0 555.4 576.0 578.1 616.0 641.6 671.4Imports of nonpetroleum goods ................................................................................................ 56 634.8 661.1 675.3 691.5 689.7 697.7 722.2 744.1 772.3 792.7 829.7 874.3
NOTE.—Chained (1992) dollar series are calculated as the product of the chain-type quantity index and the 1992current-dollar value of the corresponding series, divided by 100. Because the formula for the chain-type quantityindexes uses weights of more than one period, the corresponding chained-dollar estimates are usually not additive.The residual line following the detail for exports is the difference between the aggregate ‘‘exports of goods and
services’’ and the sum of the detailed lines for exports of goods and export of services. The residual line followingthe detail for imports is the difference between the aggregate ‘‘imports of goods and services’’ and the detailedlines for imports of goods and imports of services.
See footnotes to table 4.3.

• August
Table 4.5.—Relation of Foreign Transactions in the National Income and Product Accounts (NIPA’s) to the CorrespondingItems in the Balance of Payments Accounts (BPA’s)
[Billions of dollars]
Line 1992 1993 1994 1995 1996
Exports of goods, services, and income, BPA’s .................................................................... 1 743.4 773.4 854.2 991.5 1,055.2Less: Gold, BPA’s 1 ....................................................................................................................... 2 4.5 9.1 5.8 5.1 6.9
Capital gains, net of losses, in direct investment income receipts, BPA’s 2 ................. 3 ............................ ............................ ............................ ............................ ............................Transfers of goods and services under military grant programs, net 3 .......................... 4 1.0 1.1 .7 .3 .4Statistical differences 4 ...................................................................................................... 5 5.4 0 0 0 0Other items 5 ..................................................................................................................... 6 .5 .8 .6 .7 .7
Plus: Adjustment for U.S. territories and Puerto Rico 6 ............................................................... 7 29.2 29.6 31.9 33.3 34.0Services furnished without payment by financial intermediaries except life insurance
carriers and private noninsured pension plans.8 10.9 11.9 13.3 14.5 15.3
Adjustment for grossing of parent/affiliate transactions 7 ................................................ 9 5.3 5.5 5.3 8.0 8.7Other items ....................................................................................................................... 10 0 0 0 0 0
Equals: Exports of goods and services and receipts of factor income, NIPA’s ............... 11 777.3 809.4 897.7 1,041.2 1,105.1
Imports of goods, services, and income, BPA’s .................................................................... 12 764.5 826.0 948.8 1,086.5 1,163.5Less: Gold, BPA’s 1 ....................................................................................................................... 13 3.8 8.8 4.7 5.3 7.7
Capital gains, net of losses, in direct investment income payments, BPA’s 2 .............. 14 ............................ ............................ ............................ ............................ ............................Statistical differences 4 ...................................................................................................... 15 –2.1 0 0 0 0
Plus: Gold, NIPA’s 1 ....................................................................................................................... 16 –2.9 –3.2 –3.9 –3.6 –3.8Adjustment for U.S. territories and Puerto Rico 6 ........................................................... 17 19.6 20.0 21.5 21.9 22.4Imputed interest paid to the rest of the world ................................................................. 18 10.9 11.9 13.3 14.5 15.3Adjustment for grossing of parent/affiliate transactions 7 ................................................ 19 5.3 5.5 5.3 8.0 8.7Other items 8 ..................................................................................................................... 20 0 0 0 0 0
Equals: Imports of goods and services and payments of factor income, NIPA’s ............. 21 795.8 851.4 980.4 1,122.0 1,198.3
Balance on goods, services, and income, BPA’s (1-12) ........................................................ 22 –21.2 –52.6 –94.7 –95.0 –108.2Less: Gold (2-13+16) ..................................................................................................................... 23 –2.1 –2.9 –2.9 –3.8 –4.6
Capital gains, net of losses, in direct investment income, BPA’s (3-14) ....................... 24 ............................ ............................ ............................ ............................ ............................Statistical differences (5-15) ............................................................................................. 25 7.5 0 0 0 0
Plus: Adjustment for U.S. territories and Puerto Rico (7-17) ...................................................... 26 9.6 9.6 10.4 11.4 11.5Other items (-4-6+10-20) .................................................................................................. 27 –1.5 –1.9 –1.2 –.9 –1.1
Equals: Net exports of goods and services and net receipts of factor income, NIPA’s(11-21).
28 –18.5 –42.0 –82.7 –80.8 –93.1
Allocations of special drawing rights, BPA’s .......................................................................... 29 0 0 0 0 0Plus: Other items ........................................................................................................................... 30 0 0 0 0 0Equals: Capital grants received by the United States, net, NIPA’s ..................................... 31 0 0 0 0 0
Unilateral transfers, net, BPA’s ................................................................................................. 32 35.2 38.1 38.8 34.0 40.0Less: Transfers of goods and services under military grant programs, net 3 ............................. 33 1.0 1.1 .7 .3 .4
Statistical differences 4 ...................................................................................................... 34 2.4 0 0 0 0Plus: Adjustment for U.S. territories and Puerto Rico 6 ............................................................... 35 .2 .2 .2 .2 .2
Other items 9 ..................................................................................................................... 36 –.1 –.7 –1.1 –.4 0Equals: Transfer payments to the rest of the world, net, NIPA’s ........................................ 37 32.0 36.6 37.3 33.6 39.8
Balance on current account, BPA’s (22-32) ............................................................................. 38 –56.4 –90.8 –133.5 –129.1 –148.2Less: Gold (23) .............................................................................................................................. 39 –2.1 –2.9 –2.9 –3.8 –4.6
Capital gains, net of losses, in direct investment income, BPA’s (24) .......................... 40 ............................ ............................ ............................ ............................ ............................Statistical differences (25-34) ........................................................................................... 41 5.2 0 0 0 0Other items (-27-33+36) ................................................................................................... 42 .5 .1 –.5 .3 .7
Plus: Capital grants received by the United States, net, NIPA’s (31) ........................................ 43 0 0 0 0 0Adjustment for U.S. territories and Puerto Rico (26-35) ................................................. 44 9.4 9.4 10.1 11.2 11.3
Equals: Net foreign investment, NIPA’s (28+31-37) ................................................................ 45 –50.5 –78.6 –120.0 –114.4 –132.9
1. Beginning with 1967, the treatment of net exports of gold in the NIPA’s differs from thatin the BPA’s. BPA gold exports (line 2) and imports (line 13) are excluded from the NIPA’s. Im-ports of gold in the NIPA’s (line 16) is the excess of the value of gold in final sales of domesticproduct plus the change in business inventories over the value of U.S. production of gold. Priorto 1967, the treatment of net exports of gold in the NIPA’s and in the BPA’s is identical andis the same as the present NIPA treatment.
2. BPA capital gains and losses included in U.S. direct investment income abroad (line 3) andin foreign direct investment income in the United States (line 14) are removed from the NIPA’sbeginning with 1974 for imports and with 1977 for exports. Beginning with 1982, U.S. direct invest-ment income abroad in the BPA’s excludes capital gains and losses associated with currencytranslation adjustments.
3. Transfers of goods and services under military grant programs, net, are classified as exportsin the BPA’s. In the NIPA’s, these transactions are excluded from exports and included in FederalGovernment consumption expenditures. Beginning in 1988, the BPA’s classify certain items asmilitary grants that the NIPA’s do not.
4. Consists of statistical revisions in the BPA’s that have not yet been incorporated in theNIPA’s.
5. Consists of arms shipments to Israel financed under the Emergency Security Act of 1973.In the NIPA’s, these arms shipments are classified as military grants, which are included in thedefense consumption expenditure component of GDP at the time they are acquired by the U.S.Government. Their transfer abroad is not reflected in the NIPA’s. Beginning in 1988, the BPA’sclassify certain items as military grants that the NIPA’s do not.
6. Consists of transactions between the United States and its territories, Puerto Rico, and theNorthern Mariana Islands. The treatment of U.S. territories, Puerto Rico, and the Northern MarianaIslands in the NIPA’s differs from that in the BPA’s. In the NIPA’s, they are included in the restof the world; in the BPA’s, they are treated as part of the United States. The adjustments toexports and imports of goods and services and to receipts and payments of factor income areshown in lines 7 and 17, respectively. The adjustment to unilateral transfers, net (line 35) consists
only of transfer payments from persons because transfer payments, subsidies, and grants-in-aidfrom the Federal Government to residents of U.S. territories, Puerto Rico, and the Northern Mari-ana Islands are excluded from NIPA transfer payments to the rest of the world.
7. In the BPA’s, income transactions between parents and affiliates are recorded on a netbasis. In BPA exports, U.S. parents’ receipts from foreign affiliates for interest are net of suchpayments by U.S. parents to foreign affiliates. In BPA imports, U.S. affiliates’ payments to foreignparents for interest are net of such receipts by U.S. affiliates from foreign parents. In the NIPA’s,these transactions are recorded on a gross basis beginning with 1974. The amount of adjustmentis identical in payments and in receipts of factor income and, thus, does not affect NIPA netreceipts of factor income or net foreign investment. In addition, for 1974 through 1981, royaltiesand license fees and other private services are recorded on a net basis in the BPA’s but ona gross basis in the NIPA’s. Starting with 1982, these transactions are recorded on a gross basisin both the BPA’s and the NIPA’s. The amount of adjustment is identical in exports and in importsof services and, thus, doe not affect NIPA net exports of goods and services or net foreign invest-ment.
8. For 1946 through 1959, includes shipments to the United States from Alaska and Hawaii.These are added to imports for 1946 to adjust to geographic coverage of imports to the 48-Statecoverage used in the NIPA’s prior to 1960. From 1947 through 1959, such shipments are neg-ligible. Beginning with 1960, the adjustment is not required because Alaska and Hawaii gainedstatehood in 1959. For 1959 through 1981, includes withheld nonresident taxes associated withroyalties and license fees, other private services, and income transactions. In the NIPA’s, thesetransactions are recorded before the deduction of nonresident taxes withheld beginning with 1959.In the BPA’s, the corresponding flows are recorded before the deduction of nonresident taxeswithheld beginning with 1982.
9. Consists of financing provided to Israel in accordance with the Emergency Security Act of1973; a U.S. Government payment to India under the Agricultural Trade Development and Assist-ance Act; less write-offs of loan principal owed to the U.S. Government, which are a type offinancial transaction that is excluded from the NIPA’s.
.

August •
. Saving and Investment
Table 5.1.—Gross Saving and Investment[Billions of dollars]
Line 1992 1993 1994 1995 1996
Seasonally adjusted at annual rates
1992 1993 1994
IV I II III IV I II
Gross saving ........................................................................................................................ 1 904.3 949.5 1,079.2 1,165.5 1,267.8 883.0 932.0 942.1 943.8 980.1 1,062.4 1,065.5
Gross private saving ................................................................................................................... 2 970.7 979.3 1,030.2 1,093.1 1,125.5 940.3 1,001.1 977.3 973.3 965.6 1,048.6 995.7Personal saving ......................................................................................................................... 3 285.6 248.5 210.6 254.6 239.6 304.5 218.6 269.0 239.0 267.6 165.2 212.8Undistributed corporate profits with inventory valuation and capital consumption
adjustments.4 115.5 131.9 167.6 172.4 202.1 124.5 121.9 120.3 133.2 152.1 145.8 167.7
Undistributed profits ............................................................................................................... 5 93.9 104.5 132.3 145.0 142.8 90.3 94.5 103.6 100.1 119.7 108.9 131.0Inventory valuation adjustment ............................................................................................. 6 –7.5 –8.5 –16.1 –24.3 –2.5 .2 –12.5 –17.1 .2 –4.8 –4.3 –15.1Capital consumption adjustment ........................................................................................... 7 29.1 36.0 51.4 51.6 61.8 34.1 40.0 33.8 33.0 37.1 41.2 51.8
Corporate consumption of fixed capital .................................................................................... 8 376.4 388.4 412.3 428.9 452.3 376.3 383.0 385.0 393.0 392.6 425.3 402.8Noncorporate consumption of fixed capital .............................................................................. 9 209.0 206.1 226.3 224.1 230.5 198.0 207.5 203.0 208.1 205.5 259.9 212.1Wage accruals less disbursements .......................................................................................... 10 –15.8 4.4 13.3 13.1 1.1 –63.0 70.1 –.1 –.1 –52.2 52.4 .3
Gross government saving .......................................................................................................... 11 –66.5 –29.8 49.0 72.4 142.3 –57.3 –69.1 –35.2 –29.4 14.5 13.8 69.7Federal ....................................................................................................................................... 12 –215.0 –182.7 –117.2 –103.6 –39.2 –212.5 –211.2 –181.7 –182.2 –155.8 –139.9 –93.6
Consumption of fixed capital ................................................................................................ 13 65.9 67.9 69.5 70.9 71.2 66.5 67.0 67.5 68.4 68.8 69.1 69.6Current surplus or deficit (–), national income and product accounts ................................ 14 –280.9 –250.7 –186.7 –174.4 –110.5 –279.0 –278.2 –249.2 –250.6 –224.6 –209.0 –163.2
State and local ........................................................................................................................... 15 148.6 152.9 166.2 176.0 181.5 155.2 142.1 146.5 152.7 170.4 153.7 163.3Consumption of fixed capital ................................................................................................ 16 62.3 65.5 69.4 72.9 76.2 63.5 64.3 65.2 65.8 66.6 69.0 68.5Current surplus or deficit (–), national income and product accounts ................................ 17 86.3 87.4 96.8 103.1 105.3 91.7 77.8 81.3 86.9 103.7 84.7 94.8
Capital grants received by the United States (net) ................................................................. 18 0 0 0 0 0 0 0 0 0 0 0 0
Gross investment ................................................................................................................ 19 949.1 1,002.1 1,093.8 1,137.2 1,207.9 947.7 1,003.0 989.0 991.3 1,025.1 1,068.7 1,107.8
Gross private domestic investment ............................................................................................... 20 790.4 876.2 1,007.9 1,038.2 1,116.5 816.1 854.3 857.4 872.8 920.3 963.4 1,017.9Gross government investment ....................................................................................................... 21 209.1 204.5 205.9 213.4 224.3 208.8 202.9 206.5 203.4 205.2 197.0 202.4Net foreign investment ................................................................................................................... 22 –50.5 –78.6 –120.0 –114.4 –132.9 –77.2 –54.2 –74.9 –84.9 –100.4 –91.6 –112.5
Statistical discrepancy ........................................................................................................ 23 44.8 52.6 14.6 –28.2 –59.9 64.6 71.0 46.9 47.5 45.0 6.3 42.4
Addendum:Gross saving as a percentage of gross national product ....................................................... 24 14.5 14.4 15.5 16.0 16.6 13.8 14.4 14.4 14.3 14.6 15.6 15.4
Line
Seasonally adjusted at annual rates
1994 1995 1996 1997
III IV I II III IV I II III IV I II
Gross saving ........................................................................................................................ 1 1,071.0 1,118.0 1,136.8 1,133.4 1,167.7 1,224.0 1,215.9 1,256.3 1,295.9 1,303.0 1,332.9 ...............
Gross private saving ................................................................................................................... 2 1,021.2 1,055.3 1,078.7 1,064.0 1,098.8 1,130.7 1,119.3 1,106.3 1,145.1 1,131.4 1,134.0 ...............Personal saving ......................................................................................................................... 3 222.1 242.4 279.2 245.4 243.8 249.9 258.1 225.7 254.0 220.4 215.9 247.9Undistributed corporate profits with inventory valuation and capital consumption
adjustments.4 175.5 181.3 148.1 158.1 187.2 196.0 190.8 202.6 202.3 212.6 211.5 ...............
Undistributed profits ............................................................................................................... 5 141.6 147.5 145.6 145.1 145.0 144.5 138.0 146.4 141.8 144.9 140.3 ...............Inventory valuation adjustment ............................................................................................. 6 –21.2 –23.6 –50.3 –37.8 –9.3 .4 –5.1 –5.4 –2.7 3.3 3.5 18.1Capital consumption adjustment ........................................................................................... 7 55.1 57.4 52.9 50.8 51.5 51.1 57.9 61.6 63.2 64.4 67.7 69.9
Corporate consumption of fixed capital .................................................................................... 8 408.2 413.1 418.4 425.8 431.4 439.9 443.0 448.5 455.5 462.0 467.4 472.1Noncorporate consumption of fixed capital .............................................................................. 9 215.1 218.1 219.8 221.6 223.3 231.8 226.2 228.3 232.2 235.2 238.0 239.8Wage accruals less disbursements .......................................................................................... 10 .3 .3 13.1 13.1 13.1 13.1 1.1 1.1 1.1 1.1 1.2 1.2
Gross government saving .......................................................................................................... 11 49.7 62.7 58.0 69.4 68.9 93.3 96.7 150.0 150.8 171.6 198.9 ...............Federal ....................................................................................................................................... 12 –118.3 –117.0 –121.2 –108.6 –105.5 –78.9 –82.6 –40.2 –28.3 –5.9 15.9 ...............
Consumption of fixed capital ................................................................................................ 13 69.3 69.8 70.3 70.9 71.0 71.3 71.0 71.4 71.2 71.3 71.4 71.5Current surplus or deficit (–), national income and product accounts ................................ 14 –187.6 –186.8 –191.5 –179.5 –176.5 –150.2 –153.6 –111.6 –99.5 –77.1 –55.5 ...............
State and local ........................................................................................................................... 15 168.0 179.7 179.2 178.0 174.5 172.1 179.3 190.2 179.1 177.5 182.9 ...............Consumption of fixed capital ................................................................................................ 16 69.6 70.4 71.5 72.4 73.3 74.3 75.2 75.8 76.5 77.2 78.2 79.1Current surplus or deficit (–), national income and product accounts ................................ 17 98.4 109.3 107.7 105.6 101.1 97.8 104.1 114.4 102.6 100.4 104.7 ...............
Capital grants received by the United States (net) ................................................................. 18 0 0 0 0 0 0 0 0 0 0 0 0
Gross investment ................................................................................................................ 19 1,086.2 1,112.6 1,138.0 1,113.2 1,122.7 1,175.1 1,165.6 1,206.0 1,216.4 1,243.5 1,268.6 ...............
Gross private domestic investment ............................................................................................... 20 1,007.1 1,043.1 1,050.8 1,024.0 1,028.8 1,049.1 1,060.5 1,105.4 1,149.2 1,151.1 1,193.6 1,227.2Gross government investment ....................................................................................................... 21 213.2 211.2 213.0 215.8 210.8 214.1 222.0 226.3 223.6 225.3 223.3 226.7Net foreign investment ................................................................................................................... 22 –134.2 –141.8 –125.8 –126.7 –116.9 –88.0 –116.9 –125.6 –156.4 –132.9 –148.4 ...............
Statistical discrepancy ........................................................................................................ 23 15.2 –5.4 1.2 –20.2 –45.0 –48.9 –50.3 –50.2 –79.5 –59.5 –64.3 ...............
Addendum:Gross saving as a percentage of gross national product ....................................................... 24 15.3 15.8 15.8 15.7 16.0 16.6 16.3 16.5 16.9 16.7 16.8 ...............

• August
Table 5.2.—Gross and Net Investment by Major Type[Billions of dollars]
Line 1992 1993 1994 1995 1996
Gross private domestic investment ...................................... 1 790.4 876.2 1,007.9 1,038.2 1,116.5Less: Consumption of fixed capital ........................................... 2 585.4 594.5 638.6 653.0 682.7Equals: Net private domestic investment .................................. 3 205.1 281.7 369.2 385.2 433.8
Fixed investment ................................................................. 4 783.4 855.7 946.6 1,008.1 1,090.7Less: Consumption of fixed capital ....................................... 5 585.4 594.5 638.6 653.0 682.7Equals: Net fixed investment ................................................ 6 198.1 261.2 308.0 355.0 407.9
Nonresidential .................................................................. 7 557.9 604.1 660.6 723.0 781.4Less: Consumption of fixed capital .................................. 8 471.7 485.7 512.6 532.4 558.5Equals: Net nonresidential ................................................ 9 86.2 118.4 148.0 190.5 222.9
Structures .................................................................... 10 169.2 176.4 184.5 200.6 215.2Less: Consumption of fixed capital .............................. 11 119.8 123.7 133.2 133.7 138.3Equals: Net structures .................................................. 12 49.3 52.7 51.3 66.9 76.9
Producers’ durable equipment ................................. 13 388.7 427.7 476.1 522.4 566.2Less: Consumption of fixed capital .............................. 14 351.9 362.0 379.4 398.7 420.2Equals: Net producers’ durable equipment ................. 15 36.8 65.7 96.7 123.7 146.0
Residential ........................................................................ 16 225.6 251.6 286.0 285.1 309.2Less: Consumption of fixed capital .................................. 17 113.7 108.7 126.0 120.6 124.2Equals: Net residential ...................................................... 18 111.9 142.9 160.0 164.5 185.0
Change in business inventories ........................................ 19 7.0 20.5 61.2 30.1 25.9
Gross government investment 1 ............................................ 20 209.1 204.5 205.9 213.4 224.3Less: Consumption of fixed capital ........................................... 21 128.2 133.4 138.8 143.8 147.4Equals: Net government investment ......................................... 22 81.0 71.1 67.1 69.7 76.9
Federal ................................................................. 23 11.1 3.1 –2.5 –4.8 –2.7National defense .............................................. 24 1.9 –6.1 –9.1 –11.5 –10.3Nondefense ...................................................... 25 9.2 9.3 6.7 6.7 7.6
State and local ..................................................... 26 69.9 67.9 69.6 74.5 79.6
Structures ............................................................................. 27 123.6 125.0 129.6 138.3 146.6Less: Consumption of fixed capital ....................................... 28 55.1 58.0 61.6 64.9 68.0Equals: Net structures ........................................................... 29 68.5 67.0 68.0 73.5 78.6
Federal ............................................................. 30 3.2 3.2 2.5 3.2 3.5National defense ......................................... 31 –1.8 –2.6 –2.2 –1.7 –1.5Nondefense ................................................. 32 5.0 5.8 4.8 5.0 5.0
State and local ................................................. 33 65.3 63.8 65.5 70.3 75.1
Equipment ............................................................................. 34 85.5 79.5 76.4 75.1 77.7Less: Consumption of fixed capital ....................................... 35 73.0 75.4 77.3 78.9 79.4Equals: Net equipment .......................................................... 36 12.5 4.1 –.9 –3.8 –1.7
Federal ............................................................. 37 7.9 –.1 –5.0 –8.0 –6.2National defense ......................................... 38 3.7 –3.6 –6.9 –9.8 –8.7Nondefense ................................................. 39 4.2 3.5 1.9 1.8 2.6
State and local ................................................. 40 4.5 4.2 4.1 4.2 4.5
1. Gross government investment consists of general government and government enterprise expenditures for fixedassets; change in inventories is included in government consumption expenditures.
Table 5.3.—Real Gross and Net Investment by Major Type[Billions of chained (1992) dollars]
Line 1992 1993 1994 1995 1996
Gross private domestic investment ...................................... 1 790.4 863.6 975.7 991.5 1,069.1Less: Consumption of fixed capital ........................................... 2 585.4 583.1 615.2 619.6 642.4Equals: Net private domestic investment .................................. 3 205.1 280.4 360.5 371.9 426.7
Fixed investment ................................................................. 4 783.4 842.8 915.5 962.1 1,041.7Less: Consumption of fixed capital ....................................... 5 585.4 583.1 615.2 619.6 642.4Equals: Net fixed investment ................................................ 6 198.1 259.6 300.4 342.5 399.3
Nonresidential .................................................................. 7 557.9 600.2 648.4 706.5 771.7Less: Consumption of fixed capital .................................. 8 471.7 478.7 497.5 510.7 532.7Equals: Net nonresidential ................................................ 9 86.2 121.5 150.9 195.8 239.0
Structures .................................................................... 10 169.2 170.8 172.5 179.9 188.7Less: Consumption of fixed capital .............................. 11 119.8 119.3 124.5 121.4 122.6Equals: Net structures .................................................. 12 49.3 51.5 47.9 58.6 66.1
Producers’ durable equipment ................................. 13 388.7 429.6 476.8 528.3 586.0Less: Consumption of fixed capital .............................. 14 351.9 359.4 373.0 389.8 410.9Equals: Net producers’ durable equipment ................. 15 36.8 70.1 103.8 138.5 175.1
Residential ........................................................................ 16 225.6 242.6 267.0 257.0 272.1Less: Consumption of fixed capital .................................. 17 113.7 104.5 117.6 109.2 110.3Equals: Net residential ...................................................... 18 111.9 138.1 149.5 147.8 161.9
Change in business inventories ........................................ 19 7.0 22.1 60.6 27.3 25.0
Gross government investment 1 ............................................ 20 209.1 200.4 196.0 197.0 203.3Less: Consumption of fixed capital ........................................... 21 128.2 130.5 132.2 132.9 134.2Equals: Net government investment ......................................... 22 81.0 69.9 63.9 64.1 69.1
Federal ................................................................. 23 11.1 3.5 –2.1 –3.9 –1.6National defense .............................................. 24 1.9 –5.7 –8.7 –10.4 –9.2Nondefense ...................................................... 25 9.2 9.3 6.6 6.6 7.6
State and local ..................................................... 26 69.9 66.4 66.0 67.9 70.7
Structures ............................................................................. 27 123.6 121.7 122.0 124.9 128.4Less: Consumption of fixed capital ....................................... 28 55.1 56.2 57.5 58.2 59.3Equals: Net structures ........................................................... 29 68.5 65.5 64.5 66.7 69.1
Federal ............................................................. 30 3.2 3.2 2.6 3.0 3.2National defense ......................................... 31 –1.8 –2.4 –2.0 –1.5 –1.3Nondefense ................................................. 32 5.0 5.6 4.5 4.5 4.4
State and local ................................................. 33 65.3 62.3 62.0 63.7 65.9
Equipment ............................................................................. 34 85.5 78.6 73.9 71.9 74.7Less: Consumption of fixed capital ....................................... 35 73.0 74.3 74.6 74.7 74.8Equals: Net equipment .......................................................... 36 12.5 4.4 –.7 –2.8 –.1
Federal ............................................................. 37 7.9 .3 –4.7 –7.0 –4.9National defense ......................................... 38 3.7 –3.4 –6.8 –9.0 –8.0Nondefense ................................................. 39 4.2 3.6 2.1 2.1 3.3
State and local ................................................. 40 4.5 4.1 4.0 4.2 4.8
1. Gross government investment consists of general government and government enterprise expenditures for fixedassets; change in inventories is included in government consumption expenditures.
NOTE.—Chained (1992) dollar series are calculated as the product of the chain-type quantity index and the 1992current-dollar value of the corresponding series, divided by 100. Because the formula for the chain-type quantityindexes uses weights of more than one period, the corresponding chained-dollar estimates are usually not additive.

August •
Table 5.4.—Private Fixed Investment by Type[Billions of dollars]
Line 1992 1993 1994 1995 1996
Seasonally adjusted at annual rates
1992 1993 1994
IV I II III IV I II
Private fixed investment ..................................................................................................... 1 783.4 855.7 946.6 1,008.1 1,090.7 809.7 823.5 842.9 858.8 897.5 911.0 941.7
Nonresidential ............................................................................................................................... 2 557.9 604.1 660.6 723.0 781.4 569.6 580.5 598.8 606.4 630.6 634.6 652.9
Structures ................................................................................................................................. 3 169.2 176.4 184.5 200.6 215.2 167.1 171.7 175.2 177.8 180.7 175.4 185.2Nonresidential buildings, including farm ............................................................................... 4 113.2 119.2 128.7 143.8 159.8 111.0 113.6 117.6 121.5 124.2 120.7 130.9Utilities ................................................................................................................................... 5 34.5 32.8 32.0 33.2 33.3 34.2 33.8 32.7 32.2 32.5 32.1 31.6Mining exploration, shafts, and wells ................................................................................... 6 13.3 16.6 16.7 16.3 16.1 13.8 16.0 16.8 16.8 16.6 15.7 15.8Other structures ..................................................................................................................... 7 8.2 7.8 7.1 7.3 6.2 8.1 8.3 8.1 7.3 7.5 6.8 6.9
Producers’ durable equipment .............................................................................................. 8 388.7 427.7 476.1 522.4 566.2 402.5 408.9 423.6 428.6 449.9 459.3 467.7Information processing and related equipment .................................................................... 9 134.2 141.6 152.1 172.8 195.1 136.8 137.2 138.1 145.0 146.0 147.6 149.4
Computers and peripheral equipment 1 ........................................................................... 10 43.9 48.6 51.8 65.6 78.7 44.9 47.1 47.1 49.8 50.5 49.9 50.6Other .................................................................................................................................. 11 90.2 93.0 100.3 107.2 116.3 91.9 90.1 91.0 95.2 95.5 97.7 98.8
Industrial equipment .............................................................................................................. 12 89.3 97.9 109.3 121.5 127.5 92.8 94.0 95.4 98.1 104.1 105.4 107.0Transportation and related equipment .................................................................................. 13 86.2 99.9 118.6 125.7 134.5 91.9 92.9 102.9 96.4 107.5 113.1 115.5Other ...................................................................................................................................... 14 79.0 88.3 96.2 102.4 109.1 81.1 84.7 87.3 89.0 92.2 93.3 95.8
Residential ..................................................................................................................................... 15 225.6 251.6 286.0 285.1 309.2 240.1 243.0 244.1 252.4 266.8 276.4 288.7
Structures ................................................................................................................................. 16 219.5 245.2 279.1 277.8 301.7 233.9 236.7 237.7 245.9 260.3 269.7 281.9Single family .......................................................................................................................... 17 116.5 133.3 153.8 145.2 159.1 123.6 127.5 128.5 133.7 143.4 150.4 156.9Multifamily .............................................................................................................................. 18 13.1 10.8 14.1 17.9 20.3 11.6 10.6 10.3 11.2 11.0 11.7 13.3Other structures ..................................................................................................................... 19 89.9 101.1 111.2 114.8 122.3 98.6 98.7 98.9 101.0 105.8 107.6 111.6
Producers’ durable equipment .............................................................................................. 20 6.0 6.4 6.9 7.2 7.5 6.2 6.3 6.4 6.6 6.6 6.6 6.9
Line
Seasonally adjusted at annual rates
1994 1995 1996 1997
III IV I II III IV I II III IV I II
Private fixed investment ..................................................................................................... 1 956.9 977.0 998.7 999.6 1,009.4 1,024.6 1,049.4 1,082.0 1,112.0 1,119.2 1,127.5 1,157.8
Nonresidential ............................................................................................................................... 2 667.4 687.5 710.9 722.5 725.4 733.1 750.7 769.3 798.6 807.2 811.3 836.4
Structures ................................................................................................................................. 3 186.8 190.7 197.7 201.1 202.8 200.7 205.7 210.6 217.7 227.0 227.4 230.4Nonresidential buildings, including farm ............................................................................... 4 130.0 133.2 138.9 144.1 145.6 146.4 149.8 155.5 162.5 171.2 174.0 174.5Utilities ................................................................................................................................... 5 32.0 32.4 33.2 33.5 33.5 32.7 33.4 32.9 32.7 34.1 32.0 34.3Mining exploration, shafts, and wells ................................................................................... 6 17.0 18.1 18.3 16.1 15.8 15.0 15.7 16.0 16.5 16.0 16.1 16.1Other structures ..................................................................................................................... 7 7.7 7.0 7.2 7.4 7.9 6.5 6.7 6.1 6.0 5.8 5.3 5.5
Producers’ durable equipment .............................................................................................. 8 480.6 496.8 513.2 521.4 522.6 532.4 545.0 558.7 580.9 580.2 583.9 606.0Information processing and related equipment .................................................................... 9 152.8 158.5 162.9 173.0 174.3 181.1 188.0 190.9 201.1 200.3 202.8 205.2
Computers and peripheral equipment 1 ........................................................................... 10 51.5 55.1 57.3 64.7 67.0 73.5 76.4 76.8 80.9 81.0 81.8 82.1Other .................................................................................................................................. 11 101.2 103.4 105.6 108.3 107.3 107.6 111.6 114.1 120.3 119.3 121.0 123.1
Industrial equipment .............................................................................................................. 12 110.8 114.0 118.1 123.0 123.0 121.8 124.7 129.2 128.2 127.9 127.7 135.0Transportation and related equipment .................................................................................. 13 119.8 126.1 129.9 123.6 122.9 126.4 127.1 130.8 140.0 140.1 137.7 146.3Other ...................................................................................................................................... 14 97.3 98.3 102.3 101.8 102.5 103.1 105.3 107.9 111.5 111.9 115.7 119.5
Residential ..................................................................................................................................... 15 289.5 289.5 287.8 277.1 284.0 291.4 298.8 312.7 313.5 312.0 316.2 321.4
Structures ................................................................................................................................. 16 282.5 282.3 280.6 269.9 276.7 284.1 291.5 305.2 305.9 304.4 308.3 313.5Single family .......................................................................................................................... 17 155.0 153.0 149.5 140.5 142.5 148.3 153.4 160.2 162.2 160.6 161.0 160.8Multifamily .............................................................................................................................. 18 15.1 16.2 17.3 17.2 18.2 18.8 20.2 21.7 19.2 20.1 21.9 22.8Other structures ..................................................................................................................... 19 112.4 113.1 113.8 112.3 115.9 117.1 117.9 123.2 124.5 123.7 125.3 129.9
Producers’ durable equipment .............................................................................................. 20 7.0 7.2 7.2 7.1 7.3 7.3 7.3 7.5 7.5 7.6 7.9 7.9
1. Includes new computers and peripheral equipment only.

• August
Table 5.5.—Real Private Fixed Investment by Type[Billions of chained (1992) dollars]
Line 1992 1993 1994 1995 1996
Seasonally adjusted at annual rates
1992 1993 1994
IV I II III IV I II
Private fixed investment ..................................................................................................... 1 783.4 842.8 915.5 962.1 1,041.7 805.8 814.8 831.1 844.5 880.8 887.8 913.2
Nonresidential ............................................................................................................................... 2 557.9 600.2 648.4 706.5 771.7 569.1 577.8 595.1 602.3 625.6 626.2 641.2
Structures ................................................................................................................................. 3 169.2 170.8 172.5 179.9 188.7 165.6 168.0 170.3 171.7 173.1 166.3 174.5Nonresidential buildings, including farm ............................................................................... 4 113.2 115.3 119.9 128.8 140.0 109.8 111.3 114.4 117.1 118.5 114.3 123.1Utilities ................................................................................................................................... 5 34.5 31.8 29.9 30.0 29.3 33.9 33.4 31.7 31.0 31.0 30.3 29.6Mining exploration, shafts, and wells ................................................................................... 6 13.3 16.0 15.8 14.3 13.9 13.7 15.2 16.2 16.4 16.2 15.1 15.1Other structures ..................................................................................................................... 7 8.2 7.7 6.9 6.7 5.5 8.1 8.2 8.0 7.2 7.4 6.7 6.7
Producers’ durable equipment .............................................................................................. 8 388.7 429.6 476.8 528.3 586.0 403.5 409.8 424.9 430.7 452.9 460.6 467.3Information processing and related equipment .................................................................... 9 134.2 147.9 165.1 201.8 253.1 138.9 140.5 143.2 152.5 155.5 158.1 160.8
Computers and peripheral equipment 1 ........................................................................... 10 43.9 56.1 67.2 102.8 160.8 47.5 51.0 53.2 58.4 61.7 62.2 64.1Other .................................................................................................................................. 11 90.2 92.3 99.4 107.0 116.3 91.5 89.6 90.3 94.6 94.8 96.8 97.8
Industrial equipment .............................................................................................................. 12 89.3 96.5 105.5 113.4 117.0 92.6 93.4 94.2 96.5 102.0 102.8 103.8Transportation and related equipment .................................................................................. 13 86.2 98.3 113.2 118.9 125.0 91.5 91.9 101.5 94.8 105.2 108.8 110.0Other ...................................................................................................................................... 14 79.0 86.8 92.9 97.0 100.8 80.5 83.9 85.8 87.3 90.1 90.9 92.6
Residential ..................................................................................................................................... 15 225.6 242.6 267.0 257.0 272.1 236.7 237.0 236.1 242.2 255.1 261.3 271.5
Structures ................................................................................................................................. 16 219.5 236.2 260.3 250.0 265.0 230.5 230.7 229.8 235.7 248.6 254.8 264.8Single family .......................................................................................................................... 17 116.5 127.1 140.1 126.9 136.6 121.6 123.5 123.6 126.8 134.3 139.4 144.5Multifamily .............................................................................................................................. 18 13.1 10.6 13.6 16.9 18.6 11.5 10.4 10.1 11.0 10.7 11.4 13.0Other structures ..................................................................................................................... 19 89.9 98.6 106.5 106.7 110.2 97.4 96.9 96.1 97.9 103.5 103.8 107.2
Producers’ durable equipment .............................................................................................. 20 6.0 6.4 6.7 7.0 7.1 6.2 6.3 6.3 6.5 6.5 6.5 6.7
Residual .......................................................................................................................................... 21 .1 –.7 –2.1 –14.3 –39.4 0 –.2 –.3 –1.0 –1.1 –1.2 –1.0
Line
Seasonally adjusted at annual rates
1994 1995 1996 1997
III IV I II III IV I II III IV I II
Private fixed investment ..................................................................................................... 1 922.7 938.5 955.8 954.0 962.3 976.3 1,001.5 1,035.7 1,060.9 1,068.7 1,079.0 1,110.9
Nonresidential ............................................................................................................................... 2 653.2 672.9 695.7 705.4 708.2 716.8 736.9 759.7 789.3 800.8 808.9 837.8
Structures ................................................................................................................................. 3 174.0 175.0 179.0 180.9 181.2 178.6 182.1 185.6 190.0 196.9 195.9 197.0Nonresidential buildings, including farm ............................................................................... 4 120.6 121.8 125.5 129.4 130.1 130.3 132.7 137.0 141.7 148.4 150.1 149.5Utilities ................................................................................................................................... 5 29.8 29.8 30.4 30.4 30.1 29.2 29.7 29.1 28.7 29.5 27.5 29.2Mining exploration, shafts, and wells ................................................................................... 6 16.2 16.7 16.3 14.2 13.8 13.1 13.6 13.9 14.1 13.8 13.6 13.4Other structures ..................................................................................................................... 7 7.4 6.7 6.8 6.8 7.3 5.9 6.0 5.4 5.4 5.1 4.6 4.8
Producers’ durable equipment .............................................................................................. 8 480.0 499.1 518.1 525.9 528.5 540.5 557.4 577.1 602.9 606.7 616.6 645.9Information processing and related equipment .................................................................... 9 166.1 175.6 184.5 199.3 205.2 218.2 232.8 244.8 264.3 270.4 281.4 292.4
Computers and peripheral equipment 1 ........................................................................... 10 67.1 75.3 82.7 97.2 106.8 124.4 138.7 152.0 170.0 182.4 195.8 210.2Other .................................................................................................................................. 11 100.2 102.8 105.1 107.9 107.2 107.8 111.7 114.0 120.3 119.3 121.5 123.6
Industrial equipment .............................................................................................................. 12 106.7 108.9 112.1 114.9 114.1 112.5 114.8 118.8 117.6 116.9 116.8 123.6Transportation and related equipment .................................................................................. 13 113.5 120.5 124.0 117.3 115.7 118.6 119.2 121.8 129.5 129.7 127.5 135.4Other ...................................................................................................................................... 14 93.7 94.5 98.0 96.6 96.7 96.5 97.9 100.1 102.8 102.5 106.1 109.6
Residential ..................................................................................................................................... 15 269.4 265.9 261.2 250.4 255.5 260.8 266.1 277.2 274.1 271.1 273.3 277.1
Structures ................................................................................................................................. 16 262.7 259.0 254.3 243.6 248.5 253.8 259.1 270.0 266.9 263.9 265.9 269.6Single family .......................................................................................................................... 17 140.5 136.1 131.4 123.1 124.3 128.9 133.1 138.6 138.3 136.2 136.2 135.7Multifamily .............................................................................................................................. 18 14.7 15.5 16.4 16.3 17.2 17.7 18.9 20.2 17.5 18.0 19.6 20.3Other structures ..................................................................................................................... 19 107.6 107.6 106.8 104.7 107.6 107.7 107.5 111.7 111.5 110.0 110.5 114.1
Producers’ durable equipment .............................................................................................. 20 6.7 6.9 6.9 6.9 7.0 7.0 7.0 7.2 7.2 7.2 7.4 7.5
Residual .......................................................................................................................................... 21 –2.0 –4.6 –6.6 –11.7 –15.6 –23.3 –29.3 –34.1 –43.7 –50.3 –58.2 –66.0
1. Includes new computers and peripheral equipment only.NOTE.—Chained (1992) dollar series are calculated as the product of the chain-type quantity index and the 1992
current-dollar value of the corresponding series, divided by 100. Because the formula for the chain-type quantity
indexes uses weights of more than one period, the corresponding chained-dollar estimates are usually not additive.The residual line is the difference between the first line and the sum of the most detailed lines.

August •
Table 5.6.—Private Purchases of Structures by Type[Billions of dollars]
Line 1992 1993 1994 1995 1996
Private purchases of structures ............................... 1 388.7 421.5 463.6 478.4 517.0
Nonresidential ...................................................................... 2 169.2 176.4 184.5 200.6 215.2
New .................................................................................... 3 169.5 176.4 184.3 200.2 214.7
Nonresidential buildings, excluding farm ..................... 4 110.8 115.8 125.5 140.8 156.1Industrial ................................................................... 5 29.0 26.5 28.9 32.5 32.1Commercial ............................................................... 6 51.7 55.6 61.9 70.8 77.6
Office buildings 1 .................................................. 7 23.6 24.3 25.8 29.8 32.1Other 2 .................................................................. 8 28.1 31.2 36.1 41.0 45.5
Religious ................................................................... 9 3.4 3.8 3.8 4.2 4.4Educational ............................................................... 10 5.1 5.1 5.6 6.2 7.5Hospital and institutional .......................................... 11 12.8 13.9 13.7 12.5 13.4Other 3 ....................................................................... 12 8.7 10.9 11.6 14.5 21.1
Utilities ........................................................................... 13 34.5 32.8 32.0 33.2 33.3Railroads ................................................................... 14 2.9 3.1 3.3 3.5 4.6Telecommunications ................................................. 15 8.9 9.6 10.1 11.0 11.9Electric light and power ........................................... 16 15.0 13.6 13.0 12.3 11.0Gas ........................................................................... 17 6.8 5.6 4.6 5.5 4.7Petroleum pipelines .................................................. 18 .8 1.0 1.0 .9 1.0
Farm .............................................................................. 19 2.4 3.4 3.2 3.0 3.7Mining exploration, shafts, and wells ........................... 20 13.3 16.6 16.7 16.3 16.1
Petroleum and natural gas ...................................... 21 11.9 15.0 14.7 14.8 14.8Other ......................................................................... 22 1.4 1.5 1.9 1.5 1.3
Other 4 ........................................................................... 23 8.5 7.8 6.9 6.9 5.7
Brokers’ commissions on sale of structures .................... 24 1.3 1.4 1.5 1.6 1.8Net purchases of used structures .................................... 25 –1.6 –1.4 –1.2 –1.3 –1.3
Residential ............................................................................ 26 219.5 245.2 279.1 277.8 301.7
New .................................................................................... 27 193.7 218.0 248.5 246.9 267.0
New housing units ........................................................ 28 135.1 151.1 177.2 174.4 192.1Permanent site ......................................................... 29 129.6 144.1 167.9 163.1 179.4
Single-family structures ........................................ 30 116.5 133.3 153.8 145.2 159.1Multifamily structures ........................................... 31 13.1 10.8 14.1 17.9 20.3
Mobile homes ........................................................... 32 5.5 7.0 9.3 11.3 12.6Improvements ................................................................ 33 58.3 66.4 71.0 72.0 74.4Other 5 ........................................................................... 34 .3 .5 .3 .5 .6
Brokers’ commissions on sale of structures .................... 35 27.1 29.0 31.6 32.1 36.3Net purchases of used structures .................................... 36 –1.3 –1.9 –1.0 –1.1 –1.6
1. Consists of office buildings, except those constructed at industrial sites and those constructed by utilities fortheir own use.
2. Consists of stores, restaurants, garages, service stations, warehouses, mobile structures, and other buildingsused for commercial purposes.
3. Consists of hotels and motels, buildings used primarily for social and recreational activities, and buildings notelsewhere classified, such as passenger terminals, greenhouses, and animal hospitals.
4. Consists primarily of streets, dams and reservoirs, sewer and water facilities, parks, and airfields.5. Consists primarily of dormitories, fraternity and sorority houses, and nurses’ homes.
Table 5.7.—Real Private Purchases of Structures by Type[Billions of chained (1992) dollars]
Line 1992 1993 1994 1995 1996
Private purchases of structures ............................... 1 388.7 407.0 432.8 430.0 453.7
Nonresidential ...................................................................... 2 169.2 170.8 172.5 179.9 188.7
New .................................................................................... 3 169.5 170.8 172.2 179.5 188.2
Nonresidential buildings, excluding farm ..................... 4 110.8 112.0 116.9 126.1 136.7Industrial ................................................................... 5 29.0 25.6 27.0 29.1 28.1Commercial ............................................................... 6 51.7 53.8 57.7 63.4 68.0
Office buildings 1 .................................................. 7 23.6 23.6 24.1 26.7 28.2Other 2 .................................................................. 8 28.1 30.2 33.6 36.7 39.8
Religious ................................................................... 9 3.4 3.7 3.5 3.8 3.9Educational ............................................................... 10 5.1 4.9 5.2 5.6 6.6Hospital and institutional .......................................... 11 12.8 13.5 12.7 11.2 11.7Other 3 ....................................................................... 12 8.7 10.6 10.8 13.0 18.5
Utilities ........................................................................... 13 34.5 31.8 29.9 30.0 29.3Railroads ................................................................... 14 2.9 2.9 3.0 3.1 3.9Telecommunications ................................................. 15 8.9 9.4 9.6 10.1 10.4Electric light and power ........................................... 16 15.0 13.2 12.1 11.0 9.8Gas ........................................................................... 17 6.8 5.4 4.2 5.0 4.2Petroleum pipelines .................................................. 18 .8 1.0 .9 .8 .9
Farm .............................................................................. 19 2.4 3.3 3.0 2.7 3.2Mining exploration, shafts, and wells ........................... 20 13.3 16.0 15.8 14.3 13.9
Petroleum and natural gas ...................................... 21 11.9 14.5 14.0 13.0 12.7Other ......................................................................... 22 1.4 1.5 1.8 1.3 1.1
Other 4 ........................................................................... 23 8.5 7.7 6.6 6.3 5.0
Brokers’ commissions on sale of structures .................... 24 1.3 1.3 1.4 1.5 1.6Net purchases of used structures .................................... 25 –1.6 –1.3 –1.2 –1.1 –1.2
Residential ............................................................................ 26 219.5 236.2 260.3 250.0 265.0
New .................................................................................... 27 193.7 209.4 230.8 220.8 233.6
New housing units ........................................................ 28 135.1 144.3 162.0 153.1 165.2Permanent site ......................................................... 29 129.6 137.7 153.7 143.5 154.8
Single-family structures ........................................ 30 116.5 127.1 140.1 126.9 136.6Multifamily structures ........................................... 31 13.1 10.6 13.6 16.9 18.6
Mobile homes ........................................................... 32 5.5 6.7 8.3 9.5 10.3Improvements ................................................................ 33 58.3 64.5 68.4 67.3 67.7Other 5 ........................................................................... 34 .3 .5 .3 .4 .5
Brokers’ commissions on sale of structures .................... 35 27.1 28.6 30.4 30.3 32.7Net purchases of used structures .................................... 36 –1.3 –1.8 –.9 –1.0 –1.4
Residual ................................................................................. 37 .2 –.2 .3 –.1 .3
1. Consists of office buildings, except those constructed at industrial sites and those constructed by utilities fortheir own use.
2. Consists of stores, restaurants, garages, service stations, warehouses, mobile structures, and other buildingsused for commercial purposes.
3. Consists of hotels and motels, buildings used primarily for social and recreational activities, and buildings notelsewhere classified, such as passenger terminals, greenhouses, and animal hospitals.
4. Consists primarily of streets, dams and reservoirs, sewer and water facilities, parks, and airfields.5. Consists primarily of dormitories, fraternity and sorority houses, and nurses’ homes.NOTE.—Chained (1992) dollar series are calculated as the product of the chain-type quantity index and the 1992
current-dollar value of the corresponding series, divided by 100. Because the formula for the chain-type quantityindexes uses weights of more than one period, the corresponding chained-dollar estimates are usually not additive.The residual line is the difference between the first line and the sum of the most detailed lines.

• August
Table 5.8.—Private Purchases of Producers’ Durable Equipment by Type[Billions of dollars]
Line 1992 1993 1994 1995 1996
Private purchases of producers’ durableequipment.
1 394.7 434.2 483.0 529.6 573.7
Nonresidential equipment ....................................................... 2 388.7 427.7 476.1 522.4 566.2
Information processing and related equipment .................... 3 134.2 141.6 152.1 172.8 195.1Office, computing, and accounting machinery ................. 4 51.3 56.3 59.3 73.5 88.1
Computers and peripheral equipment 1 ....................... 5 43.9 48.6 51.8 65.6 78.7Other ............................................................................. 6 7.4 7.7 7.5 7.9 9.3
Communication equipment ................................................ 7 47.4 46.2 52.8 59.4 65.9Instruments ........................................................................ 8 20.7 22.5 22.1 22.4 23.4Photocopy and related equipment .................................... 9 14.8 16.7 17.9 17.6 17.7
Industrial equipment .............................................................. 10 89.3 97.9 109.3 121.5 127.5Fabricated metal products ................................................ 11 9.2 9.5 10.5 11.1 11.7Engines and turbines ........................................................ 12 4.4 4.4 4.8 4.2 4.0Metalworking machinery .................................................... 13 18.5 20.4 24.4 28.2 29.6Special industry machinery, n.e.c ..................................... 14 22.5 25.2 26.9 31.2 32.8General industrial, including materials handling,
equipment.15 18.4 21.2 23.6 25.8 28.5
Electrical transmission, distribution, and industrialapparatus.
16 16.3 17.2 19.0 20.9 20.9
Transportation and related equipment .................................. 17 86.2 99.9 118.6 125.7 134.5Trucks, buses, and truck trailers ...................................... 18 33.1 42.5 55.0 63.3 68.9Autos .................................................................................. 19 35.3 38.2 48.0 42.3 45.3Aircraft ............................................................................... 20 13.2 13.1 8.9 12.8 13.4Ships and boats ................................................................ 21 1.3 2.2 1.5 1.5 1.6Railroad equipment ........................................................... 22 3.4 3.9 5.1 5.7 5.3
Other equipment .................................................................... 23 81.8 91.9 99.9 106.9 113.7Furniture and fixtures ........................................................ 24 22.9 23.5 25.6 28.1 30.2Tractors .............................................................................. 25 7.2 8.6 9.9 10.4 10.9Agricultural machinery, except tractors ............................ 26 6.7 8.6 9.7 10.4 10.9Construction machinery, except tractors .......................... 27 7.8 10.1 12.0 13.5 14.4Mining and oilfield machinery ........................................... 28 1.2 1.6 1.5 1.8 2.3Service industry machinery ............................................... 29 11.0 11.9 13.4 14.4 15.2Electrical equipment, n.e.c ................................................ 30 11.1 11.4 10.7 10.8 11.1Other .................................................................................. 31 14.0 16.2 16.9 17.5 18.6
Less: Sale of equipment scrap, excluding autos ................. 32 2.8 3.6 3.7 4.5 4.6
Residential equipment ............................................................. 33 6.0 6.4 6.9 7.2 7.5
Addenda:Private purchases of producers’ durable equipment ........... 34 394.7 434.2 483.0 529.6 573.7Less: Dealers’ margin on used equipment .......................... 35 4.4 4.9 4.9 5.3 5.8
Net purchases of used equipment fromgovernment.
36 1.0 .8 1.0 1.1 1.2
Plus: Net sales of used equipment ...................................... 37 26.2 29.1 31.3 37.6 39.7Net exports of used equipment ............................... 38 1.5 1.0 1.5 .6 .7Sale of equipment scrap .......................................... 39 2.8 3.7 3.8 4.6 4.6
Equals: Private purchases of new equipment ...................... 40 419.7 462.2 513.7 566.0 611.8
1. Includes new computers and peripheral equipment only.n.e.c. Not elsewhere classified.
Table 5.9.—Real Private Purchases of Producers’ Durable Equipment byType
[Billions of chained (1992) dollars]
Line 1992 1993 1994 1995 1996
Private purchases of producers’ durableequipment.
1 394.7 436.0 483.5 535.2 593.1
Nonresidential equipment ....................................................... 2 388.7 429.6 476.8 528.3 586.0
Information processing and related equipment .................... 3 134.2 147.9 165.1 201.8 253.1Office, computing, and accounting machinery ................. 4 51.3 63.5 73.9 108.1 164.2
Computers and peripheral equipment 1 ....................... 5 43.9 56.1 67.2 102.8 160.8Other ............................................................................. 6 7.4 7.6 7.3 7.5 9.0
Communication equipment ................................................ 7 47.4 46.4 53.7 62.0 69.9Instruments ........................................................................ 8 20.7 21.9 21.2 21.2 21.8Photocopy and related equipment .................................... 9 14.8 16.4 17.3 16.6 16.4
Industrial equipment .............................................................. 10 89.3 96.5 105.5 113.4 117.0Fabricated metal products ................................................ 11 9.2 9.5 10.4 10.6 11.0Engines and turbines ........................................................ 12 4.4 4.4 4.6 4.0 3.7Metalworking machinery .................................................... 13 18.5 20.0 23.3 26.0 26.6Special industry machinery, n.e.c ..................................... 14 22.5 24.8 25.9 29.0 29.9General industrial, including materials handling,
equipment.15 18.4 20.7 22.6 24.0 26.0
Electrical transmission, distribution, and industrialapparatus.
16 16.3 17.1 18.6 19.8 19.7
Transportation and related equipment .................................. 17 86.2 98.3 113.2 118.9 125.0Trucks, buses, and truck trailers ...................................... 18 33.1 40.7 50.6 56.7 61.3Autos .................................................................................. 19 35.3 38.8 47.8 43.4 45.1Aircraft ............................................................................... 20 13.2 12.8 8.4 11.6 11.8Ships and boats ................................................................ 21 1.3 2.1 1.5 1.4 1.4Railroad equipment ........................................................... 22 3.4 3.9 4.9 5.2 4.6
Other equipment .................................................................... 23 81.8 90.3 96.0 100.3 104.6Furniture and fixtures ........................................................ 24 22.9 23.2 24.5 26.2 27.4Tractors .............................................................................. 25 7.2 8.4 9.5 9.8 10.2Agricultural machinery, except tractors ............................ 26 6.7 8.4 9.2 9.6 9.9Construction machinery, except tractors .......................... 27 7.8 9.8 11.4 12.4 13.0Mining and oilfield machinery ........................................... 28 1.2 1.6 1.5 1.7 2.1Service industry machinery ............................................... 29 11.0 11.7 13.0 13.5 14.0Electrical equipment, n.e.c ................................................ 30 11.1 11.3 10.6 10.4 10.8Other .................................................................................. 31 14.0 15.9 16.3 16.5 17.2
Less: Sale of equipment scrap, excluding autos ................. 32 2.8 3.5 3.1 3.4 3.8
Residential equipment ............................................................. 33 6.0 6.4 6.7 7.0 7.1
Residual ...................................................................................... 34 –.2 –.4 –1.4 –10.3 –33.8
1. Includes new computers and peripheral equipment only.NOTE.—Chained (1992) dollar series are calculated as the product of the chain-type quantity index and the 1992
current-dollar value of the corresponding series, divided by 100. Because the formula for the chain-type quantityindexes uses weights of more than one period, the corresponding chained-dollar estimates are usually not additive.The residual line is the difference between the first line and the sum of the most detailed lines.
n.e.c. Not elsewhere classified.

August •
Table 5.10.—Change in Business Inventories by Industry[Billions of dollars]
Line 1992 1993 1994 1995 1996
Seasonally adjusted at annual rates
1992 1993 1994
IV I II III IV I II
Change in business inventories ....................................................................................... 1 7.0 20.5 61.2 30.1 25.9 6.5 30.7 14.5 14.0 22.9 52.4 76.3
Farm ............................................................................................................................................... 2 5.0 –6.2 10.8 –7.9 2.9 –1.3 –6.3 –5.3 –11.2 –2.0 13.4 15.3
Nonfarm .......................................................................................................................................... 3 2.0 26.7 50.5 38.1 23.0 7.8 37.1 19.8 25.2 24.8 38.9 60.9Change in book value 1 ........................................................................................................ 4 9.5 35.7 69.4 67.2 28.2 7.4 50.0 40.4 22.4 29.9 46.4 76.2Inventory valuation adjustment 2 ........................................................................................... 5 –7.5 –9.0 –18.9 –29.2 –5.1 .4 –13.0 –20.6 2.7 –5.1 –7.5 –15.2
Manufacturing ............................................................................................................................. 6 –9.2 6.0 11.3 8.4 10.6 –15.0 5.2 9.0 8.3 1.8 15.3 10.4Durable goods ....................................................................................................................... 7 –12.7 5.1 8.5 5.8 10.2 –17.8 3.0 6.4 7.8 3.2 9.4 12.2Nondurable goods ................................................................................................................. 8 3.5 .9 2.8 2.6 .4 2.8 2.2 2.5 .4 –1.4 5.9 –1.8
Wholesale trade ......................................................................................................................... 9 7.8 5.5 15.9 13.4 3.3 12.4 5.0 4.2 10.5 2.3 4.0 17.8Durable goods ....................................................................................................................... 10 3.1 3.2 11.4 11.7 2.5 2.3 2.0 .7 6.4 3.7 2.0 17.8Nondurable goods ................................................................................................................. 11 4.7 2.3 4.6 1.7 .8 10.0 3.1 3.5 4.1 –1.4 2.0 0
Merchant wholesalers ....................................................................................................... 12 7.9 5.3 14.3 11.3 2.4 14.0 5.4 5.2 10.4 .4 1.3 19.1Durable goods .............................................................................................................. 13 3.9 3.0 10.1 10.1 1.9 5.0 2.4 1.3 6.4 2.0 .2 17.6Nondurable goods ........................................................................................................ 14 4.0 2.3 4.2 1.2 .5 9.0 3.0 3.9 4.0 –1.6 1.2 1.6
Nonmerchant wholesalers ................................................................................................. 15 –.1 .2 1.6 2.1 .9 –1.6 –.3 –1.0 .1 1.9 2.7 –1.4Durable goods .............................................................................................................. 16 –.8 .2 1.2 1.7 .6 –2.6 –.4 –.6 0 1.7 1.9 .2Nondurable goods ........................................................................................................ 17 .6 0 .4 .5 .3 1.0 .1 –.4 .1 .2 .9 –1.6
Retail trade ................................................................................................................................. 18 3.9 13.1 17.5 9.3 4.1 8.3 35.0 2.8 3.2 11.5 11.8 26.8Durable goods ....................................................................................................................... 19 .8 7.7 11.6 6.9 1.9 1.9 23.0 1.7 –2.6 8.7 12.4 9.7
Motor vehicle dealers 3 ..................................................................................................... 20 1.2 2.9 6.4 4.6 –1.6 .8 19.3 .1 –7.7 –.1 9.8 .4Other 3 ............................................................................................................................... 21 –.4 4.8 5.3 2.3 3.5 1.1 3.8 1.5 5.1 8.7 2.5 9.4
Nondurable goods ................................................................................................................. 22 3.1 5.5 5.9 2.4 2.3 6.5 12.0 1.2 5.8 2.9 –.5 17.1
Other .......................................................................................................................................... 23 –.4 2.0 5.7 7.0 5.0 2.0 –8.1 3.8 3.2 9.3 7.7 6.0Durable goods ....................................................................................................................... 24 –2.1 .1 2.0 4.6 2.3 –1.3 –7.3 –1.7 2.5 7.0 5.2 .8Nondurable goods ................................................................................................................. 25 1.7 1.9 3.6 2.3 2.6 3.4 –.8 5.5 .7 2.3 2.5 5.2
Line
Seasonally adjusted at annual rates
1994 1995 1996 1997
III IV I II III IV I II III IV I II
Change in business inventories ....................................................................................... 1 50.2 66.2 52.1 24.5 19.4 24.5 11.1 23.4 37.1 31.9 66.1 69.4
Farm ............................................................................................................................................... 2 10.1 4.2 –6.3 –12.0 –12.4 –1.1 –3.8 6.2 5.8 3.2 3.9 4.7
Nonfarm .......................................................................................................................................... 3 40.1 62.0 58.4 36.4 31.8 25.6 14.8 17.2 31.3 28.7 62.2 64.8Change in book value 1 ........................................................................................................ 4 65.8 89.0 115.6 81.4 42.4 29.5 24.2 22.0 33.8 32.6 44.5 44.6Inventory valuation adjustment 2 ........................................................................................... 5 –25.8 –27.1 –57.1 –45.0 –10.6 –4.0 –9.4 –4.8 –2.4 –3.9 17.7 20.2
Manufacturing ............................................................................................................................. 6 9.3 10.4 4.9 8.6 11.7 8.3 13.4 .5 15.3 13.3 22.3 29.5Durable goods ....................................................................................................................... 7 5.6 7.0 1.8 4.8 8.5 8.1 14.8 4.7 14.4 6.8 12.9 16.8Nondurable goods ................................................................................................................. 8 3.7 3.5 3.1 3.8 3.2 .2 –1.4 –4.2 .9 6.4 9.3 12.7
Wholesale trade ......................................................................................................................... 9 15.8 26.1 22.3 12.3 12.6 6.5 6.0 4.8 –7.7 10.1 24.3 12.3Durable goods ....................................................................................................................... 10 10.2 15.5 18.1 10.7 6.9 11.2 6.7 4.1 4.7 –5.5 15.4 11.8Nondurable goods ................................................................................................................. 11 5.7 10.6 4.2 1.6 5.6 –4.7 –.7 .7 –12.4 15.6 8.9 .5
Merchant wholesalers ....................................................................................................... 12 14.1 22.7 21.0 8.7 10.6 4.8 2.4 3.6 –8.0 11.7 18.9 4.3Durable goods .............................................................................................................. 13 9.1 13.7 16.5 8.2 5.9 9.6 3.6 3.1 4.2 –3.2 12.3 6.7Nondurable goods ........................................................................................................ 14 5.0 9.0 4.5 .5 4.7 –4.8 –1.2 .5 –12.1 14.8 6.6 –2.4
Nonmerchant wholesalers ................................................................................................. 15 1.8 3.4 1.3 3.6 2.0 1.7 3.6 1.2 .3 –1.6 5.4 8.0Durable goods .............................................................................................................. 16 1.1 1.8 1.6 2.5 1.0 1.6 3.1 1.0 .6 –2.3 3.1 5.2Nondurable goods ........................................................................................................ 17 .7 1.6 –.3 1.1 .9 .1 .5 .2 –.3 .8 2.3 2.8
Retail trade ................................................................................................................................. 18 13.6 17.9 19.8 15.8 2.3 –.7 –13.8 8.1 21.2 1.1 .6 16.2Durable goods ....................................................................................................................... 19 10.9 13.5 14.3 11.0 1.1 1.1 –13.1 9.1 14.6 –3.3 1.4 8.2
Motor vehicle dealers 3 ..................................................................................................... 20 6.1 9.3 12.3 6.7 –5.8 5.3 –18.5 5.3 11.9 –5.3 –2.9 .8Other 3 ............................................................................................................................... 21 4.8 4.3 2.0 4.3 7.0 –4.1 5.5 3.9 2.7 2.0 4.2 7.4
Nondurable goods ................................................................................................................. 22 2.6 4.4 5.5 4.8 1.2 –1.8 –.8 –1.1 6.6 4.4 –.8 8.0
Other .......................................................................................................................................... 23 1.4 7.5 11.5 –.3 5.3 11.4 9.2 3.8 2.5 4.3 15.2 6.8Durable goods ....................................................................................................................... 24 2.6 –.5 7.5 .4 5.0 5.7 8.8 .1 –.5 .8 2.1 1.8Nondurable goods ................................................................................................................. 25 –1.2 8.0 4.1 –.8 .3 5.7 .4 3.7 2.9 3.4 13.0 5.0
1. Beginning with 1982, this series is derived from the Census Bureau series ‘‘current cost inventories.’’ For earlierperiods, it is derived from the Census Bureau ‘‘book value inventories’’ series. The series differ in the treatmentof inventories reported on a last-in, first-out (LIFO) basis: The series prior to 1982 is a mix of LIFO and non-LIFOinventories; the series beginning with 1982 is entirely on a non-LIFO basis.
2. Beginning with 1973, the inventory valuation adjustment (IVA) shown in this table differs from the IVA thatadjusts business incomes. The IVA in this table reflects the mix of methods (first-in, first-out; last-in, first-out; etc.)underlying inventories derived primarily from Census Bureau statistics (see footnote 1). This mix differs from thatunderlying business income derived primarily from Internal Revenue Service statistics. Prior to 1973, the two IVA’s
are the same because information required for separate estimates is not available.3. Prior to 1981, inventories of auto and home supply stores are included in motor vehicle dealers. Beginning
with 1981, these inventories are included in ‘‘other durable goods.’’NOTE.—Estimates for nonfarm industries other than manufacturing and trade for 1986 and earlier periods are
based on the 1972 Standard Industrial Classification (SIC). Manufacturing estimates for 1981 and earlier periodsand trade estimates for 1966 and earlier periods are based on the 1972 SIC; later estimates for these industriesare based on the 1987 SIC. The resulting discontinuities are small.
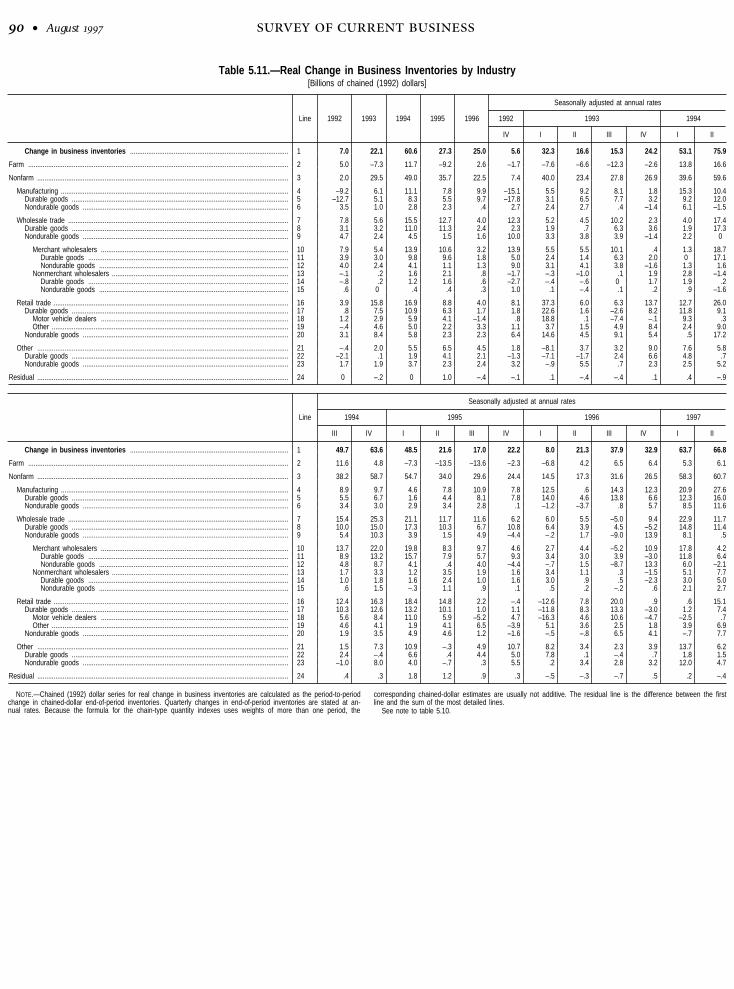
• August
Table 5.11.—Real Change in Business Inventories by Industry[Billions of chained (1992) dollars]
Line 1992 1993 1994 1995 1996
Seasonally adjusted at annual rates
1992 1993 1994
IV I II III IV I II
Change in business inventories ....................................................................................... 1 7.0 22.1 60.6 27.3 25.0 5.6 32.3 16.6 15.3 24.2 53.1 75.9
Farm ............................................................................................................................................... 2 5.0 –7.3 11.7 –9.2 2.6 –1.7 –7.6 –6.6 –12.3 –2.6 13.8 16.6
Nonfarm .......................................................................................................................................... 3 2.0 29.5 49.0 35.7 22.5 7.4 40.0 23.4 27.8 26.9 39.6 59.6
Manufacturing ............................................................................................................................. 4 –9.2 6.1 11.1 7.8 9.9 –15.1 5.5 9.2 8.1 1.8 15.3 10.4Durable goods ....................................................................................................................... 5 –12.7 5.1 8.3 5.5 9.7 –17.8 3.1 6.5 7.7 3.2 9.2 12.0Nondurable goods ................................................................................................................. 6 3.5 1.0 2.8 2.3 .4 2.7 2.4 2.7 .4 –1.4 6.1 –1.5
Wholesale trade ......................................................................................................................... 7 7.8 5.6 15.5 12.7 4.0 12.3 5.2 4.5 10.2 2.3 4.0 17.4Durable goods ....................................................................................................................... 8 3.1 3.2 11.0 11.3 2.4 2.3 1.9 .7 6.3 3.6 1.9 17.3Nondurable goods ................................................................................................................. 9 4.7 2.4 4.5 1.5 1.6 10.0 3.3 3.8 3.9 –1.4 2.2 0
Merchant wholesalers ....................................................................................................... 10 7.9 5.4 13.9 10.6 3.2 13.9 5.5 5.5 10.1 .4 1.3 18.7Durable goods .............................................................................................................. 11 3.9 3.0 9.8 9.6 1.8 5.0 2.4 1.4 6.3 2.0 0 17.1Nondurable goods ........................................................................................................ 12 4.0 2.4 4.1 1.1 1.3 9.0 3.1 4.1 3.8 –1.6 1.3 1.6
Nonmerchant wholesalers ................................................................................................. 13 –.1 .2 1.6 2.1 .8 –1.7 –.3 –1.0 .1 1.9 2.8 –1.4Durable goods .............................................................................................................. 14 –.8 .2 1.2 1.6 .6 –2.7 –.4 –.6 0 1.7 1.9 .2Nondurable goods ........................................................................................................ 15 .6 0 .4 .4 .3 1.0 .1 –.4 .1 .2 .9 –1.6
Retail trade ................................................................................................................................. 16 3.9 15.8 16.9 8.8 4.0 8.1 37.3 6.0 6.3 13.7 12.7 26.0Durable goods ....................................................................................................................... 17 .8 7.5 10.9 6.3 1.7 1.8 22.6 1.6 –2.6 8.2 11.8 9.1
Motor vehicle dealers ....................................................................................................... 18 1.2 2.9 5.9 4.1 –1.4 .8 18.8 .1 –7.4 –.1 9.3 .3Other .................................................................................................................................. 19 –.4 4.6 5.0 2.2 3.3 1.1 3.7 1.5 4.9 8.4 2.4 9.0
Nondurable goods ................................................................................................................. 20 3.1 8.4 5.8 2.3 2.3 6.4 14.6 4.5 9.1 5.4 .5 17.2
Other .......................................................................................................................................... 21 –.4 2.0 5.5 6.5 4.5 1.8 –8.1 3.7 3.2 9.0 7.6 5.8Durable goods ....................................................................................................................... 22 –2.1 .1 1.9 4.1 2.1 –1.3 –7.1 –1.7 2.4 6.6 4.8 .7Nondurable goods ................................................................................................................. 23 1.7 1.9 3.7 2.3 2.4 3.2 –.9 5.5 .7 2.3 2.5 5.2
Residual .......................................................................................................................................... 24 0 –.2 0 1.0 –.4 –.1 .1 –.4 –.4 .1 .4 –.9
Line
Seasonally adjusted at annual rates
1994 1995 1996 1997
III IV I II III IV I II III IV I II
Change in business inventories ....................................................................................... 1 49.7 63.6 48.5 21.6 17.0 22.2 8.0 21.3 37.9 32.9 63.7 66.8
Farm ............................................................................................................................................... 2 11.6 4.8 –7.3 –13.5 –13.6 –2.3 –6.8 4.2 6.5 6.4 5.3 6.1
Nonfarm .......................................................................................................................................... 3 38.2 58.7 54.7 34.0 29.6 24.4 14.5 17.3 31.6 26.5 58.3 60.7
Manufacturing ............................................................................................................................. 4 8.9 9.7 4.6 7.8 10.9 7.8 12.5 .6 14.3 12.3 20.9 27.6Durable goods ....................................................................................................................... 5 5.5 6.7 1.6 4.4 8.1 7.8 14.0 4.6 13.8 6.6 12.3 16.0Nondurable goods ................................................................................................................. 6 3.4 3.0 2.9 3.4 2.8 .1 –1.2 –3.7 .8 5.7 8.5 11.6
Wholesale trade ......................................................................................................................... 7 15.4 25.3 21.1 11.7 11.6 6.2 6.0 5.5 –5.0 9.4 22.9 11.7Durable goods ....................................................................................................................... 8 10.0 15.0 17.3 10.3 6.7 10.8 6.4 3.9 4.5 –5.2 14.8 11.4Nondurable goods ................................................................................................................. 9 5.4 10.3 3.9 1.5 4.9 –4.4 –.2 1.7 –9.0 13.9 8.1 .5
Merchant wholesalers ....................................................................................................... 10 13.7 22.0 19.8 8.3 9.7 4.6 2.7 4.4 –5.2 10.9 17.8 4.2Durable goods .............................................................................................................. 11 8.9 13.2 15.7 7.9 5.7 9.3 3.4 3.0 3.9 –3.0 11.8 6.4Nondurable goods ........................................................................................................ 12 4.8 8.7 4.1 .4 4.0 –4.4 –.7 1.5 –8.7 13.3 6.0 –2.1
Nonmerchant wholesalers ................................................................................................. 13 1.7 3.3 1.2 3.5 1.9 1.6 3.4 1.1 .3 –1.5 5.1 7.7Durable goods .............................................................................................................. 14 1.0 1.8 1.6 2.4 1.0 1.6 3.0 .9 .5 –2.3 3.0 5.0Nondurable goods ........................................................................................................ 15 .6 1.5 –.3 1.1 .9 .1 .5 .2 –.2 .6 2.1 2.7
Retail trade ................................................................................................................................. 16 12.4 16.3 18.4 14.8 2.2 –.4 –12.6 7.8 20.0 .9 .6 15.1Durable goods ....................................................................................................................... 17 10.3 12.6 13.2 10.1 1.0 1.1 –11.8 8.3 13.3 –3.0 1.2 7.4
Motor vehicle dealers ....................................................................................................... 18 5.6 8.4 11.0 5.9 –5.2 4.7 –16.3 4.6 10.6 –4.7 –2.5 .7Other .................................................................................................................................. 19 4.6 4.1 1.9 4.1 6.5 –3.9 5.1 3.6 2.5 1.8 3.9 6.9
Nondurable goods ................................................................................................................. 20 1.9 3.5 4.9 4.6 1.2 –1.6 –.5 –.8 6.5 4.1 –.7 7.7
Other .......................................................................................................................................... 21 1.5 7.3 10.9 –.3 4.9 10.7 8.2 3.4 2.3 3.9 13.7 6.2Durable goods ....................................................................................................................... 22 2.4 –.4 6.6 .4 4.4 5.0 7.8 .1 –.4 .7 1.8 1.5Nondurable goods ................................................................................................................. 23 –1.0 8.0 4.0 –.7 .3 5.5 .2 3.4 2.8 3.2 12.0 4.7
Residual .......................................................................................................................................... 24 .4 .3 1.8 1.2 .9 .3 –.5 –.3 –.7 .5 .2 –.4
NOTE.—Chained (1992) dollar series for real change in business inventories are calculated as the period-to-periodchange in chained-dollar end-of-period inventories. Quarterly changes in end-of-period inventories are stated at an-nual rates. Because the formula for the chain-type quantity indexes uses weights of more than one period, the
corresponding chained-dollar estimates are usually not additive. The residual line is the difference between the firstline and the sum of the most detailed lines.
See note to table 5.10.

August •
Table 5.12.—Inventories and Domestic Final Sales of Business by Industry[Billions of dollars]
Line
Seasonally adjusted quarterly totals
1992 1993 1994
IV I II III IV I II
Inventories 1 ......................................................................................................................... 1 1,077.9 1,099.5 1,102.1 1,104.9 1,114.8 1,132.2 1,150.0
Farm ............................................................................................................................................... 2 104.9 110.1 105.6 101.3 101.5 106.6 100.3
Nonfarm .......................................................................................................................................... 3 973.1 989.3 996.5 1,003.7 1,013.4 1,025.6 1,049.7Durable goods ....................................................................................................................... 4 545.8 555.7 559.9 565.2 573.7 582.9 597.7Nondurable goods ................................................................................................................. 5 427.3 433.6 436.6 438.5 439.7 442.7 452.0
Manufacturing ............................................................................................................................ 6 375.5 378.4 381.9 383.5 384.0 388.9 396.4Durable goods ....................................................................................................................... 7 233.0 234.3 237.5 239.4 240.3 243.7 248.5Nondurable goods ................................................................................................................. 8 142.5 144.0 144.5 144.1 143.7 145.2 147.8
Wholesale trade ......................................................................................................................... 9 245.3 247.8 248.4 251.9 254.5 255.9 262.5Durable goods ....................................................................................................................... 10 150.4 151.9 152.4 154.4 156.1 157.1 162.7Nondurable goods ................................................................................................................. 11 94.9 95.9 96.0 97.5 98.3 98.8 99.7
Merchant wholesalers ....................................................................................................... 12 210.3 212.7 213.8 217.3 219.7 220.2 226.7Durable goods .............................................................................................................. 13 130.3 131.9 132.5 134.5 135.7 136.2 141.6Nondurable goods ........................................................................................................ 14 80.0 80.8 81.2 82.9 84.0 84.1 85.1
Nonmerchant wholesalers ................................................................................................ 15 34.9 35.1 34.6 34.6 34.8 35.7 35.8Durable goods .............................................................................................................. 16 20.0 20.0 19.9 19.9 20.4 20.9 21.1Nondurable goods ........................................................................................................ 17 14.9 15.1 14.7 14.7 14.3 14.7 14.7
Retail trade ................................................................................................................................ 18 249.4 260.4 262.2 263.3 267.3 270.9 279.3Durable goods ....................................................................................................................... 19 127.5 135.0 136.5 136.8 140.1 143.5 147.4
Motor vehicle dealers ....................................................................................................... 20 64.2 69.7 70.8 69.3 69.9 72.7 74.0Other ................................................................................................................................. 21 63.4 65.3 65.7 67.5 70.2 70.8 73.4
Nondurable goods ................................................................................................................. 22 121.8 125.4 125.7 126.5 127.2 127.3 131.9
Other .......................................................................................................................................... 23 103.0 102.8 103.9 105.0 107.6 110.0 111.6Durable goods ....................................................................................................................... 24 34.9 34.4 33.5 34.6 37.1 38.5 39.0Nondurable goods ................................................................................................................. 25 68.0 68.3 70.4 70.4 70.4 71.4 72.6
Final sales of domestic business 2 .................................................................................. 26 441.9 443.5 449.6 454.1 463.6 467.6 474.5Final sales of goods and structures of domestic business 2 ...................................... 27 240.9 240.5 244.4 245.7 252.1 253.9 257.1
Ratio of inventories to final sales of domestic business
Inventories to final sales ................................................................................................................ 28 2.44 2.48 2.45 2.43 2.40 2.42 2.42Nonfarm inventories to final sales ................................................................................................. 29 2.20 2.23 2.22 2.21 2.19 2.19 2.21Nonfarm inventories to final sales of goods and structures ........................................................ 30 4.04 4.11 4.08 4.09 4.02 4.04 4.08
Line
Seasonally adjusted quarterly totals
1994 1995 1996 1997
III IV I II III IV I II III IV I II
Inventories 1 ......................................................................................................................... 1 1,168.9 1,200.6 1,234.8 1,246.5 1,250.8 1,261.5 1,264.9 1,276.9 1,287.1 1,294.5 1,306.1 1,315.3
Farm ............................................................................................................................................... 2 99.9 104.1 105.2 100.5 97.6 100.5 97.7 104.3 106.0 102.6 107.2 107.1
Nonfarm .......................................................................................................................................... 3 1,069.0 1,096.5 1,129.6 1,146.0 1,153.2 1,161.0 1,167.2 1,172.6 1,181.2 1,191.9 1,198.9 1,208.2Durable goods ....................................................................................................................... 4 610.0 625.1 643.2 651.7 655.2 660.0 662.5 667.1 675.6 675.2 684.4 693.0Nondurable goods ................................................................................................................. 5 459.0 471.4 486.4 494.4 497.9 501.1 504.7 505.5 505.5 516.7 514.5 515.2
Manufacturing ............................................................................................................................. 6 403.9 413.3 423.7 428.6 430.8 431.1 433.2 432.5 436.3 440.3 443.3 448.1Durable goods ....................................................................................................................... 7 252.5 257.3 261.7 263.6 264.6 265.3 267.6 268.4 271.4 273.7 277.0 281.5Nondurable goods ................................................................................................................. 8 151.5 156.0 162.1 164.9 166.3 165.7 165.6 164.0 164.9 166.6 166.3 166.6
Wholesale trade ......................................................................................................................... 9 268.2 277.5 287.6 292.9 296.2 298.0 300.7 303.2 300.3 300.8 306.2 306.9Durable goods ....................................................................................................................... 10 166.2 171.2 177.3 180.5 181.4 183.4 184.5 185.3 186.6 184.9 188.7 191.6Nondurable goods ................................................................................................................. 11 102.1 106.2 110.3 112.4 114.8 114.6 116.3 117.9 113.6 116.0 117.5 115.3
Merchant wholesalers ....................................................................................................... 12 231.7 239.8 249.1 253.5 256.4 257.5 259.1 261.5 257.9 258.6 263.4 262.6Durable goods .............................................................................................................. 13 144.7 149.2 154.7 157.3 158.0 159.7 160.1 160.7 161.9 160.7 163.9 165.5Nondurable goods ........................................................................................................ 14 87.0 90.6 94.4 96.2 98.4 97.9 99.0 100.8 96.0 97.9 99.5 97.1
Nonmerchant wholesalers ................................................................................................. 15 36.5 37.6 38.4 39.4 39.8 40.5 41.7 41.7 42.4 42.3 42.8 44.3Durable goods .............................................................................................................. 16 21.4 22.0 22.6 23.2 23.4 23.7 24.4 24.6 24.8 24.1 24.9 26.1Nondurable goods ........................................................................................................ 17 15.0 15.6 15.9 16.2 16.4 16.7 17.3 17.1 17.6 18.1 17.9 18.2
Retail trade ................................................................................................................................. 18 284.2 290.7 298.5 303.4 304.8 306.2 303.5 306.0 312.5 313.0 313.3 315.4Durable goods ....................................................................................................................... 19 151.2 155.9 161.1 164.2 164.6 165.7 162.7 164.9 168.8 167.7 168.7 169.3
Motor vehicle dealers ....................................................................................................... 20 76.2 79.6 83.9 85.4 83.9 86.0 81.7 82.6 85.5 83.9 83.6 82.4Other .................................................................................................................................. 21 74.9 76.3 77.2 78.8 80.7 79.7 81.0 82.4 83.3 83.9 85.1 87.0
Nondurable goods ................................................................................................................. 22 133.1 134.8 137.4 139.3 140.2 140.6 140.9 141.1 143.6 145.3 144.6 146.1
Other .......................................................................................................................................... 23 112.6 115.0 119.8 121.1 121.4 125.7 129.8 130.9 132.1 137.7 136.1 137.8Durable goods ....................................................................................................................... 24 40.2 40.6 43.1 43.3 44.6 45.6 47.8 48.5 48.7 48.9 50.0 50.5Nondurable goods ................................................................................................................. 25 72.4 74.4 76.7 77.8 76.7 80.1 82.0 82.4 83.4 88.8 86.2 87.3
Final sales of domestic business 2 .................................................................................. 26 482.2 489.2 495.1 499.9 507.2 512.7 519.8 529.5 533.1 542.6 550.0 554.7Final sales of goods and structures of domestic business 2 ...................................... 27 261.3 265.5 267.8 268.6 272.6 275.8 280.0 285.2 285.9 289.9 294.1 294.5
Ratio of inventories to final sales of domestic business
Inventories to final sales ................................................................................................................ 28 2.42 2.45 2.49 2.49 2.47 2.46 2.43 2.41 2.41 2.39 2.37 2.37Nonfarm inventories to final sales ................................................................................................. 29 2.22 2.24 2.28 2.29 2.27 2.26 2.25 2.21 2.22 2.20 2.18 2.18Nonfarm inventories to final sales of goods and structures ........................................................ 30 4.09 4.13 4.22 4.27 4.23 4.21 4.17 4.11 4.13 4.11 4.08 4.10
1. Inventories are as of the end of the quarter. The quarter-to-quarter change in inventories calculated from cur-rent-dollar inventories in this table is not the current-dollar change in business inventories (CBI) component of GDP.The former is the difference between two inventory stocks, each valued at their respective end-of-quarter prices.The latter is the change in the physical volume of inventories valued at average prices of the quarter. In addition,
changes calculated from this table are at quarterly rates, whereas CBI is stated at annual rates.2. Quarterly totals at monthly rates. Final sales of domestic business equals final sales of domestic product less
gross product of households and institutions and of general government and includes a small amount of final salesby farms.

• August
Table 5.13.—Real Inventories and Real Domestic Final Sales of Business by Industry[Billions of chained (1992) dollars]
Line
Seasonally adjusted quarterly totals
1992 1993 1994
IV I II III IV I II
Inventories 1 ......................................................................................................................... 1 1,073.9 1,082.0 1,086.1 1,090.0 1,096.0 1,109.3 1,128.2
Farm ............................................................................................................................................... 2 104.7 102.7 101.1 98.0 97.4 100.8 105.0
Nonfarm .......................................................................................................................................... 3 969.2 979.2 985.1 992.0 998.7 1,008.6 1,023.5Durable goods ....................................................................................................................... 4 542.7 547.8 549.6 553.1 558.5 565.5 575.3Nondurable goods ................................................................................................................. 5 426.5 431.4 435.5 439.0 440.2 443.1 448.1
Manufacturing ............................................................................................................................ 6 374.8 376.1 378.4 380.4 380.9 384.7 387.3Durable goods ....................................................................................................................... 7 232.3 233.1 234.7 236.6 237.4 239.7 242.7Nondurable goods ................................................................................................................. 8 142.5 143.1 143.7 143.8 143.5 145.0 144.6
Wholesale trade ......................................................................................................................... 9 244.7 246.0 247.1 249.7 250.2 251.2 255.6Durable goods ....................................................................................................................... 10 150.0 150.5 150.7 152.3 153.2 153.7 158.0Nondurable goods ................................................................................................................. 11 94.6 95.5 96.4 97.4 97.0 97.6 97.6
Merchant wholesalers ....................................................................................................... 12 209.8 211.2 212.5 215.0 215.1 215.5 220.1Durable goods .............................................................................................................. 13 130.0 130.6 131.0 132.5 133.0 133.0 137.3Nondurable goods ........................................................................................................ 14 79.8 80.5 81.6 82.5 82.1 82.4 82.8
Nonmerchant wholesalers ................................................................................................ 15 34.9 34.8 34.6 34.6 35.1 35.8 35.4Durable goods .............................................................................................................. 16 20.0 19.9 19.7 19.7 20.2 20.6 20.7Nondurable goods ........................................................................................................ 17 14.9 14.9 14.8 14.9 14.9 15.1 14.7
Retail trade ................................................................................................................................ 18 247.2 256.5 258.0 259.6 263.0 266.2 272.7Durable goods ....................................................................................................................... 19 126.0 131.6 132.0 131.4 133.4 136.4 138.7
Motor vehicle dealers ....................................................................................................... 20 63.1 67.8 67.8 66.0 66.0 68.3 68.3Other ................................................................................................................................. 21 63.0 63.8 64.2 65.4 67.5 68.1 70.4
Nondurable goods ................................................................................................................. 22 121.2 124.8 126.0 128.2 129.6 129.7 134.0
Other .......................................................................................................................................... 23 102.6 100.6 101.5 102.3 104.6 106.5 107.9Durable goods ....................................................................................................................... 24 34.4 32.6 32.2 32.8 34.5 35.7 35.8Nondurable goods ................................................................................................................. 25 68.2 68.0 69.4 69.6 70.1 70.8 72.1
Residual .......................................................................................................................................... 26 –.2 .2 –.1 0 –.2 .1 –.2
Final sales of domestic business 2 .................................................................................. 27 438.1 435.8 439.4 442.0 448.2 449.7 453.9Final sales of goods and structures of domestic business 2 ...................................... 28 239.9 237.5 240.9 241.6 246.5 246.9 249.4
Ratio of inventories to final sales of domestic business
Inventories to final sales ................................................................................................................ 29 2.45 2.48 2.47 2.47 2.45 2.47 2.49Nonfarm inventories to final sales ................................................................................................. 30 2.21 2.25 2.24 2.24 2.23 2.24 2.25Nonfarm inventories to final sales of goods and structures ........................................................ 31 4.04 4.12 4.09 4.11 4.05 4.08 4.10
Line
Seasonally adjusted quarterly totals
1994 1995 1996 1997
III IV I II III IV I II III IV I II
Inventories 1 ......................................................................................................................... 1 1,140.7 1,156.6 1,168.7 1,174.1 1,178.3 1,183.9 1,185.9 1,191.2 1,200.7 1,208.9 1,224.8 1,241.6
Farm ............................................................................................................................................... 2 107.9 109.1 107.3 103.9 100.5 99.9 98.2 99.3 100.9 102.5 103.8 105.3
Nonfarm .......................................................................................................................................... 3 1,033.1 1,047.7 1,061.4 1,069.9 1,077.3 1,083.4 1,087.0 1,091.4 1,099.3 1,105.9 1,120.5 1,135.7Durable goods ....................................................................................................................... 4 582.4 590.8 600.6 606.9 611.9 618.1 622.2 626.5 634.3 634.0 641.5 650.6Nondurable goods ................................................................................................................. 5 450.6 456.8 460.7 462.9 465.2 465.1 464.7 464.8 464.9 471.7 478.8 485.0
Manufacturing ............................................................................................................................. 6 389.6 392.0 393.1 395.1 397.8 399.8 402.9 403.0 406.6 409.7 414.9 421.8Durable goods ....................................................................................................................... 7 244.1 245.7 246.1 247.2 249.3 251.2 254.7 255.9 259.3 260.9 264.0 268.0Nondurable goods ................................................................................................................. 8 145.5 146.2 147.0 147.8 148.5 148.6 148.3 147.3 147.5 148.9 151.1 154.0
Wholesale trade ......................................................................................................................... 9 259.4 265.7 271.0 273.9 276.8 278.4 279.9 281.3 280.1 282.4 288.1 291.1Durable goods ....................................................................................................................... 10 160.5 164.2 168.6 171.1 172.8 175.5 177.1 178.1 179.2 177.9 181.6 184.5Nondurable goods ................................................................................................................. 11 98.9 101.5 102.5 102.8 104.1 103.0 102.9 103.3 101.1 104.6 106.6 106.8
Merchant wholesalers ....................................................................................................... 12 223.6 229.1 234.0 236.1 238.5 239.7 240.3 241.4 240.1 242.8 247.3 248.3Durable goods .............................................................................................................. 13 139.5 142.9 146.8 148.8 150.2 152.5 153.4 154.1 155.1 154.3 157.3 158.9Nondurable goods ........................................................................................................ 14 84.0 86.2 87.3 87.4 88.4 87.3 87.1 87.5 85.3 88.6 90.1 89.6
Nonmerchant wholesalers ................................................................................................. 15 35.8 36.7 37.0 37.8 38.3 38.7 39.6 39.9 39.9 39.5 40.8 42.7Durable goods .............................................................................................................. 16 20.9 21.4 21.8 22.4 22.6 23.0 23.8 24.0 24.2 23.6 24.3 25.6Nondurable goods ........................................................................................................ 17 14.9 15.3 15.2 15.5 15.7 15.7 15.8 15.9 15.8 16.0 16.5 17.2
Retail trade ................................................................................................................................. 18 275.8 279.9 284.5 288.2 288.7 288.6 285.5 287.4 292.4 292.7 292.8 296.6Durable goods ....................................................................................................................... 19 141.2 144.4 147.7 150.2 150.4 150.7 147.8 149.8 153.2 152.4 152.7 154.6
Motor vehicle dealers ....................................................................................................... 20 69.7 71.8 74.6 76.1 74.8 76.0 71.9 73.0 75.7 74.5 73.9 74.1Other .................................................................................................................................. 21 71.5 72.6 73.0 74.1 75.7 74.7 76.0 76.9 77.5 78.0 79.0 80.7
Nondurable goods ................................................................................................................. 22 134.5 135.3 136.6 137.7 138.0 137.6 137.5 137.3 138.9 140.0 139.8 141.7
Other .......................................................................................................................................... 23 108.3 110.1 112.8 112.8 114.0 116.6 118.7 119.5 120.1 121.1 124.5 126.1Durable goods ....................................................................................................................... 24 36.4 36.3 38.0 38.1 39.2 40.4 42.4 42.4 42.3 42.5 42.9 43.3Nondurable goods ................................................................................................................. 25 71.8 73.8 74.8 74.6 74.7 76.1 76.1 77.0 77.7 78.4 81.4 82.6
Residual .......................................................................................................................................... 26 0 0 .2 .5 .7 .9 .7 .6 .5 .7 .7 .6
Final sales of domestic business 2 .................................................................................. 27 458.2 461.9 464.1 466.6 471.0 474.3 478.2 484.5 484.7 491.1 495.1 497.7Final sales of goods and structures of domestic business 2 ...................................... 28 251.8 254.9 256.0 256.3 259.2 261.6 264.1 268.4 268.2 271.8 274.5 274.6
Ratio of inventories to final sales of domestic business
Inventories to final sales ................................................................................................................ 29 2.49 2.50 2.52 2.52 2.50 2.50 2.48 2.46 2.48 2.46 2.47 2.49Nonfarm inventories to final sales ................................................................................................. 30 2.25 2.27 2.29 2.29 2.29 2.28 2.27 2.25 2.27 2.25 2.26 2.28Nonfarm inventories to final sales of goods and structures ........................................................ 31 4.10 4.11 4.15 4.17 4.16 4.14 4.12 4.07 4.10 4.07 4.08 4.14
1. Inventories are as of the end of the quarter. Quarter-to-quarter changes calculated from this table are at quar-terly rates, whereas, the change in the business inventories component of GDP is stated at annual rates.
2. Quarterly totals at monthly rates. Final sales of domestic business equals final sales of domestic product lessgross product of households and institutions and of general government and includes a small amount of final salesby farms.
NOTE.—Chained (1992) dollar inventory series are calculated as the product of the chain-type quantity index andthe average of the end-of-year fixed-weighted inventories for 1991 and 1992, divided by 100. Chained (1992) dollarfinal sales series are calculated as the product of the chain-type index and the 1992 current-dollar value of thecorresponding series, divided by 100. Because the formula for the chain-type quantity indexes uses weights of morethan one period, the corresponding chained-dollar estimates are usually not additive. The residual line is the dif-ference between the first line and the sum of the most detailed lines for inventories.

August •
Table 5.14.—Gross Government Fixed Investment by Type[Billions of dollars]
Line 1992 1993 1994 1995 1996
Gross government fixed investment 1 ..................... 1 209.1 204.5 205.9 213.4 224.3
Federal .................................................................................. 2 76.9 71.1 67.0 66.1 68.6National defense ............................................................... 3 56.1 49.6 47.6 46.0 47.0Nondefense ....................................................................... 4 20.8 21.5 19.5 20.1 21.5
State and local ..................................................................... 5 132.2 133.4 138.9 147.4 155.7
Structures 2 ............................................................................... 6 123.6 125.0 129.6 138.3 146.6
Federal ................................................................................... 7 15.5 16.3 16.2 17.4 18.1National defense ............................................................... 8 5.2 5.1 5.8 6.4 6.8
New ............................................................................... 9 5.2 5.1 5.8 6.4 6.8Buildings ................................................................... 10 2.1 1.9 2.0 2.1 2.0
Residential ............................................................ 11 1.1 1.2 1.4 1.4 1.4Industrial ............................................................... 12 .9 .7 .7 .7 .7
Military facilities 3 ...................................................... 13 3.2 3.2 3.8 4.3 4.8Net purchases of used structures ................................ 14 0 0 0 0 0
Nondefense ....................................................................... 15 10.3 11.2 10.4 11.0 11.3New ............................................................................... 16 10.6 10.9 10.9 11.3 11.5
Buildings ................................................................... 17 4.6 4.5 3.8 4.4 4.6Residential ............................................................ 18 ............ ............ ............ ............ ............Industrial ............................................................... 19 .9 .9 .7 .7 .6Educational ........................................................... 20 0 0 0 0 0Hospital ................................................................. 21 .6 .7 .7 .8 .9Other 4 .................................................................. 22 3.2 2.8 2.4 2.9 3.0
Highways and streets ............................................... 23 .2 .3 .4 .4 .4Conservation and development ............................... 24 4.5 4.2 4.4 4.2 3.8Other 5 ....................................................................... 25 1.2 1.8 2.3 2.3 2.6
Net purchases of used structures ................................ 26 –.3 .3 –.4 –.4 –.2
State and local ...................................................................... 27 108.1 108.7 113.4 121.0 128.5New .................................................................................... 28 105.0 105.8 110.6 118.0 125.4
Buildings ........................................................................ 29 44.1 44.0 44.9 47.4 50.1Residential ................................................................ 30 3.7 3.5 3.0 3.6 3.8Industrial ................................................................... 31 ............ ............ ............ ............ ............Educational ............................................................... 32 20.7 19.6 19.5 20.5 21.4Hospital ..................................................................... 33 2.8 3.3 3.4 3.5 3.8Other 4 ....................................................................... 34 16.9 17.5 19.0 19.8 21.1
Highways and streets ................................................... 35 34.7 36.5 39.7 41.8 44.1Conservation and development .................................... 36 1.9 1.8 2.0 2.4 2.6Sewer systems .............................................................. 37 9.5 9.1 8.5 9.6 10.6Water systems .............................................................. 38 5.9 5.0 5.7 6.5 7.0Other 5 ........................................................................... 39 8.9 9.4 9.8 10.3 10.9
Net purchases of used structures .................................... 40 3.2 2.9 2.7 3.0 3.1
Equipment ................................................................................. 41 85.5 79.5 76.4 75.1 77.7
Federal ................................................................................... 42 61.4 54.8 50.8 48.7 50.4National defense ............................................................... 43 50.9 44.5 41.8 39.6 40.2
Aircraft ........................................................................... 44 8.7 9.3 10.4 9.0 9.3Missiles .......................................................................... 45 10.5 7.9 5.7 4.6 4.1Ships ............................................................................. 46 10.1 8.7 8.1 8.0 6.8Vehicles ......................................................................... 47 2.8 1.9 1.0 .9 .9Electronics ..................................................................... 48 4.2 4.4 4.0 3.5 3.6Other equipment ........................................................... 49 14.7 12.3 12.6 13.5 15.5
Nondefense ....................................................................... 50 10.5 10.2 9.0 9.1 10.2
State and local ...................................................................... 51 24.0 24.7 25.6 26.4 27.3
Addenda:Government enterprise gross fixed investment .................... 52 44.6 43.9 43.1 46.5 49.3
Federal ............................................................................... 53 6.2 5.6 4.3 4.5 4.0Structures ...................................................................... 54 3.1 2.5 2.7 2.9 2.2Equipment ..................................................................... 55 3.1 3.1 1.6 1.6 1.8
State and local .................................................................. 56 38.4 38.3 38.8 42.0 45.3Structures ...................................................................... 57 33.6 33.0 33.4 36.9 40.2Equipment ..................................................................... 58 4.8 5.3 5.4 5.1 5.1
1. Consists of general government and government enterprise expenditures for fixed assets.2. Structures includes compensation of government employees engaged in new force-account construction and
related expenditures for goods and services.3. Consists of Department of Defense new structures, except family housing.4. Consists primarily of general office buildings, police and fire stations, courthouses, auditoriums, garages, and
passenger terminals.5. Consists primarily of electric and gas facilities, transit systems, and airfields.
Table 5.15.—Real Gross Government Fixed Investment by Type[Billions of chained (1992) dollars]
Line 1992 1993 1994 1995 1996
Gross government fixed investment 1 ..................... 1 209.1 200.4 196.0 197.0 203.3
Federal .................................................................................. 2 76.9 69.8 63.8 61.4 63.1National defense ............................................................... 3 56.1 48.5 44.8 42.1 42.3Nondefense ....................................................................... 4 20.8 21.3 19.0 19.4 21.0
State and local ..................................................................... 5 132.2 130.6 132.2 135.6 140.1
Structures 2 ............................................................................... 6 123.6 121.7 122.0 124.9 128.4
Federal ................................................................................... 7 15.5 15.6 14.9 15.4 15.7National defense ............................................................... 8 5.2 4.7 5.0 5.4 5.6
New ............................................................................... 9 5.2 4.7 5.0 5.4 5.6Buildings ................................................................... 10 2.1 1.8 1.9 1.8 1.8
Residential ............................................................ 11 1.1 1.1 1.2 1.2 1.2Industrial ............................................................... 12 .9 .7 .6 .7 .6
Military facilities 3 ...................................................... 13 3.2 2.8 3.1 3.6 3.8Net purchases of used structures ................................ 14 0 0 0 0 0
Nondefense ....................................................................... 15 10.3 11.0 9.9 10.0 10.0New ............................................................................... 16 10.6 10.7 10.3 10.3 10.2
Buildings ................................................................... 17 4.6 4.4 3.6 4.0 4.1Residential ............................................................ 18 ............ ............ ............ ............ ............Industrial ............................................................... 19 .9 .9 .7 .7 .6Educational ........................................................... 20 0 0 0 0 0Hospital ................................................................. 21 .6 .7 .6 .7 .8Other 4 .................................................................. 22 3.2 2.7 2.2 2.6 2.6
Highways and streets ............................................... 23 .2 .3 .4 .4 .4Conservation and development ............................... 24 4.5 4.1 4.1 3.8 3.4Other 5 ....................................................................... 25 1.2 1.8 2.2 2.1 2.3
Net purchases of used structures ................................ 26 –.3 .3 –.4 –.4 –.1
State and local ...................................................................... 27 108.1 106.1 107.1 109.5 112.8New .................................................................................... 28 105.0 103.3 104.6 106.9 110.1
Buildings ........................................................................ 29 44.1 42.6 42.1 42.7 44.0Residential ................................................................ 30 3.7 3.4 2.7 3.1 3.3Industrial ................................................................... 31 ............ ............ ............ ............ ............Educational ............................................................... 32 20.7 19.0 18.2 18.4 18.8Hospital ..................................................................... 33 2.8 3.2 3.3 3.3 3.4Other 4 ....................................................................... 34 16.9 17.1 17.9 17.9 18.6
Highways and streets ................................................... 35 34.7 36.2 38.3 38.2 38.6Conservation and development .................................... 36 1.9 1.7 2.0 2.3 2.4Sewer systems .............................................................. 37 9.5 8.7 7.7 8.5 9.2Water systems .............................................................. 38 5.9 4.8 5.1 5.7 6.1Other 5 ........................................................................... 39 8.9 9.3 9.5 9.5 9.8
Net purchases of used structures .................................... 40 3.2 2.8 2.5 2.6 2.7
Equipment ................................................................................. 41 85.5 78.6 73.9 71.9 74.7
Federal ................................................................................... 42 61.4 54.1 48.8 45.9 47.4National defense ............................................................... 43 50.9 43.8 39.7 36.5 36.5
Aircraft ........................................................................... 44 8.7 9.0 8.9 7.2 7.1Missiles .......................................................................... 45 10.5 7.8 5.6 4.7 4.4Ships ............................................................................. 46 10.1 8.5 7.7 7.2 6.1Vehicles ......................................................................... 47 2.8 1.8 .9 .8 .8Electronics ..................................................................... 48 4.2 4.6 4.2 3.9 4.4Other equipment ........................................................... 49 14.7 12.1 12.2 12.8 14.1
Nondefense ....................................................................... 50 10.5 10.3 9.1 9.4 11.1
State and local ...................................................................... 51 24.0 24.5 25.2 26.1 27.4
Residual ...................................................................................... 52 –.1 .2 .3 0 –.6
Addenda:Government enterprise gross fixed investment .................... 53 44.6 42.8 40.8 42.6 44.1
Federal ............................................................................... 54 6.2 5.6 4.2 4.4 3.9Structures ...................................................................... 55 3.1 2.4 2.6 2.6 2.0Equipment ..................................................................... 56 3.1 3.2 1.6 1.7 1.9
State and local .................................................................. 57 38.4 37.1 36.5 38.2 40.2Structures ...................................................................... 58 33.6 32.0 31.4 33.4 35.3Equipment ..................................................................... 59 4.8 5.2 5.1 4.9 4.8
1. Consists of general government and government enterprise expenditures for fixed assets.2. Structures includes compensation of government employees engaged in new force-account construction and
related expenditures for goods and services.3. Consists of Department of Defense new structures, except family housing.4. Consists primarily of general office buildings, police and fire stations, courthouses, auditoriums, garages, and
passenger terminals.5. Consists primarily of electric and gas facilities, transit systems, and airfields.NOTE.—Chained (1992) dollar series are calculated as the product of the chain-type quantity index and the 1992
current-dollar value of the corresponding series, divided by 100. Because the formula for the chain-type quantityindexes uses weights of more than one period, the corresponding chained-dollar estimates are usually not additive.The residual line is the difference between the first line and the sum of the most detailed lines, excluding thelines in the addenda.

• August
. Income, Employment, and Product by Industry
Table 6.1C.—National Income Without Capital Consumption Adjustment by Industry[Billions of dollars]
Line 1992 1993 1994 1995 1996
Seasonally adjusted at annual rates
1992 1993 1994
IV I II III IV I II
National income without capital consumption adjustment ........................................... 1 4,993.2 5,254.8 5,574.5 5,888.4 6,219.6 5,091.2 5,144.5 5,224.7 5,273.9 5,376.0 5,437.2 5,532.2
Domestic industries ..................................................................................................................... 2 4,982.1 5,236.1 5,566.3 5,883.2 6,217.9 5,083.8 5,121.0 5,208.5 5,251.6 5,363.1 5,420.3 5,523.2
Private industries ..................................................................................................................... 3 4,230.3 4,460.2 4,765.6 5,057.8 5,362.6 4,325.2 4,351.1 4,436.3 4,472.7 4,580.9 4,627.4 4,723.4
Agriculture, forestry, and fishing ........................................................................................... 4 95.2 91.9 98.9 88.2 105.6 94.8 88.4 96.1 84.6 98.5 107.6 100.4Mining .................................................................................................................................... 5 40.4 40.7 42.1 45.0 46.9 41.2 41.0 39.5 40.8 41.4 42.1 40.8Construction ........................................................................................................................... 6 212.1 224.2 249.0 266.7 285.2 216.0 216.1 219.5 228.1 233.1 238.2 248.0
Manufacturing ........................................................................................................................ 7 877.1 925.0 1,007.1 1,069.2 1,110.1 894.1 892.0 918.4 924.4 965.1 985.4 987.1Durable goods ................................................................................................................... 8 488.8 526.0 577.8 608.2 634.5 498.0 501.2 520.2 529.2 553.3 567.4 570.4Nondurable goods ............................................................................................................. 9 388.3 399.0 429.2 461.0 475.6 396.2 390.8 398.1 395.2 411.7 418.1 416.7
Transportation and public utilities ......................................................................................... 10 365.1 393.2 421.5 440.7 456.7 373.1 385.1 391.2 396.0 400.5 406.8 418.7Transportation ................................................................................................................... 11 153.1 164.0 176.3 184.4 191.0 156.8 161.3 163.1 164.9 166.8 169.6 174.5Communications ................................................................................................................ 12 105.3 115.7 124.2 128.5 135.0 108.3 110.2 116.3 117.5 118.8 121.0 123.9Electric, gas, and sanitary services ................................................................................. 13 106.8 113.5 120.9 127.8 130.8 108.0 113.6 111.8 113.6 114.9 116.2 120.3
Wholesale trade ..................................................................................................................... 14 281.7 286.1 309.1 325.4 349.1 287.3 278.2 287.8 287.7 290.9 298.8 310.9Retail trade ............................................................................................................................ 15 410.7 431.1 461.8 480.1 503.7 423.0 420.1 427.0 435.8 441.4 445.9 459.8Finance, insurance, and real estate ..................................................................................... 16 849.5 907.7 946.2 1,024.4 1,095.3 868.5 889.3 904.0 909.1 928.5 901.1 940.8Services ................................................................................................................................. 17 1,098.5 1,160.3 1,230.0 1,318.1 1,410.1 1,127.3 1,140.8 1,152.7 1,166.2 1,181.5 1,201.5 1,216.9
Government .............................................................................................................................. 18 751.9 775.8 800.7 825.3 855.3 758.5 769.9 772.2 778.9 782.2 792.9 799.8
Rest of the world ......................................................................................................................... 19 11.1 18.7 8.2 5.2 1.7 7.4 23.6 16.2 22.3 12.9 16.9 9.0
Line
Seasonally adjusted at annual rates
1994 1995 1996 1997
III IV I II III IV I II III IV I II
National income without capital consumption adjustment ........................................... 1 5,609.5 5,719.0 5,782.9 5,838.3 5,927.8 6,004.7 6,076.5 6,193.7 6,267.7 6,340.4 6,470.8 ...............
Domestic industries ..................................................................................................................... 2 5,603.8 5,718.0 5,776.7 5,827.1 5,930.8 5,998.1 6,068.8 6,190.9 6,274.7 6,337.3 6,485.1 ...............
Private industries ..................................................................................................................... 3 4,801.1 4,910.6 4,959.1 5,004.7 5,102.4 5,165.1 5,224.4 5,339.1 5,415.0 5,472.0 5,608.9 ...............
Agriculture, forestry, and fishing ........................................................................................... 4 95.4 92.1 84.2 85.6 88.1 94.8 98.8 104.8 109.0 109.6 110.8 ...............Mining .................................................................................................................................... 5 42.3 43.3 43.8 44.5 45.8 45.9 47.7 47.8 46.9 45.0 48.2 ...............Construction ........................................................................................................................... 6 252.4 257.4 260.3 263.3 270.0 273.1 279.1 283.3 286.9 291.4 298.2 ...............
Manufacturing ........................................................................................................................ 7 1,013.1 1,042.6 1,047.3 1,055.0 1,083.5 1,091.1 1,086.8 1,110.7 1,120.8 1,122.1 1,134.6 ...............Durable goods ................................................................................................................... 8 577.1 596.4 601.9 598.5 612.4 620.1 619.8 636.2 642.7 639.4 651.0 ...............Nondurable goods ............................................................................................................. 9 436.0 446.2 445.4 456.5 471.2 471.0 467.0 474.5 478.1 482.8 483.6 ...............
Transportation and public utilities ......................................................................................... 10 424.7 435.6 435.3 437.2 444.7 445.7 449.6 460.8 459.3 457.3 467.1 ...............Transportation ................................................................................................................... 11 178.1 182.9 183.2 184.1 184.7 185.7 185.8 191.3 194.6 192.3 199.6 ...............Communications ................................................................................................................ 12 123.7 128.4 126.6 126.3 131.0 129.9 132.8 137.0 137.0 133.1 135.5 ...............Electric, gas, and sanitary services ................................................................................. 13 122.9 124.3 125.5 126.8 129.0 130.1 131.1 132.6 127.7 131.9 132.0 ...............
Wholesale trade ..................................................................................................................... 14 308.7 317.9 319.8 317.6 328.8 335.5 341.1 340.0 350.6 364.8 372.4 ...............Retail trade ............................................................................................................................ 15 465.6 476.1 473.1 480.0 482.8 484.3 491.6 503.9 506.8 512.3 527.7 ...............Finance, insurance, and real estate ..................................................................................... 16 962.5 980.4 1,003.3 1,018.3 1,033.3 1,042.8 1,061.9 1,091.2 1,111.5 1,116.5 1,168.9 ...............Services ................................................................................................................................. 17 1,236.4 1,265.2 1,291.9 1,303.1 1,325.4 1,351.8 1,367.8 1,396.6 1,423.2 1,452.9 1,481.1 ...............
Government .............................................................................................................................. 18 802.6 807.4 817.6 822.4 828.4 832.9 844.4 851.8 859.7 865.2 876.2 ...............
Rest of the world ......................................................................................................................... 19 5.8 1.1 6.2 11.1 –3.0 6.6 7.8 2.8 –7.0 3.1 –14.3 ...............

August •
Table 6.2C.—Compensation of Employees by Industry[Millions of dollars]
Line 1992 1993 1994 1995 1996
Compensation of employees ................ 1 3,644,938 3,814,865 4,012,002 4,215,434 4,426,912Domestic industries ............................................. 2 3,645,042 3,817,004 4,014,482 4,217,968 4,429,472
Private industries ............................................ 3 2,893,172 3,041,195 3,213,814 3,392,629 3,574,191Agriculture, forestry, and fishing .............. 4 30,732 32,856 34,780 37,011 39,619
Farms ........................................................ 5 13,155 14,238 14,477 15,588 16,385Agricultural services, forestry, and fishing 6 17,577 18,618 20,303 21,423 23,234
Mining ........................................................... 7 32,529 32,317 32,656 32,892 33,678Metal mining .............................................. 8 2,816 2,770 2,791 3,145 3,358Coal mining ............................................... 9 6,810 6,211 6,375 6,174 5,974Oil and gas extraction .............................. 10 18,847 19,126 19,069 18,929 19,539Nonmetallic minerals, except fuels .......... 11 4,056 4,210 4,421 4,644 4,807
Construction ................................................ 12 158,652 165,230 182,016 193,746 209,279Manufacturing .............................................. 13 723,407 753,275 792,034 816,853 839,754
Durable goods ........................................... 14 439,083 459,475 486,844 505,167 521,750Lumber and wood products ................. 15 19,717 21,174 23,018 23,802 24,832Furniture and fixtures ........................... 16 13,261 14,123 14,927 15,443 15,754Stone, clay, and glass products .......... 17 19,262 20,142 21,564 22,129 22,920Primary metal industries ...................... 18 31,627 33,757 36,102 37,261 37,888Fabricated metal products ................... 19 50,648 52,235 56,398 58,594 60,161Industrial machinery and equipment .... 20 87,098 89,655 95,407 100,891 105,182Electronic and other electric
equipment.21 64,570 68,352 72,726 77,181 80,895
Motor vehicles and equipment ............. 22 44,806 54,575 61,771 65,047 65,911Other transportation equipment ........... 23 52,148 48,948 47,367 46,243 47,105Instruments and related products ........ 24 44,265 44,401 44,806 45,579 47,745Miscellaneous manufacturing industries 25 11,681 12,113 12,758 12,997 13,357
Nondurable goods ..................................... 26 284,324 293,800 305,190 311,686 318,004Food and kindred products .................. 27 55,650 57,521 59,381 61,042 62,422Tobacco products ................................. 28 2,812 2,661 2,768 2,949 3,014Textile mill products ............................. 29 17,967 18,636 19,274 18,956 18,744Apparel and other textile products ...... 30 20,789 20,875 21,352 20,996 20,379Paper and allied products .................... 31 30,041 31,001 32,236 32,936 33,661Printing and publishing ......................... 32 53,976 55,696 58,652 60,387 62,308Chemicals and allied products ............. 33 60,015 62,099 63,653 65,393 67,538Petroleum and coal products ............... 34 10,373 10,580 10,769 10,834 10,738Rubber and miscellaneous plastics
products.35 29,803 31,771 34,133 35,322 36,478
Leather and leather products ............... 36 2,898 2,960 2,972 2,871 2,722Transportation and public utilities ........... 37 239,963 251,291 265,575 276,517 287,023
Transportation ........................................... 38 130,775 136,386 144,649 150,664 156,924Railroad transportation ......................... 39 15,873 15,459 15,346 15,313 15,525Local and interurban passenger transit 40 7,731 8,239 8,911 9,374 10,101Trucking and warehousing ................... 41 55,013 58,544 63,763 66,914 60,838Water transportation ............................. 42 7,266 7,455 7,757 7,843 7,895Transportation by air ............................ 43 32,470 33,458 34,424 35,714 46,492Pipelines, except natural gas ............... 44 1,161 1,154 1,126 1,051 1,007Transportation services ........................ 45 11,261 12,077 13,322 14,455 15,066
Communications ........................................ 46 58,976 62,031 67,070 71,112 75,153Telephone and telegraph ..................... 47 45,662 47,782 51,679 53,701 56,202Radio and television ............................. 48 13,314 14,249 15,391 17,411 18,951
Electric, gas, and sanitary services ......... 49 50,212 52,874 53,856 54,741 54,946Wholesale trade ........................................... 50 239,096 244,743 259,828 276,202 289,438Retail trade ................................................... 51 331,771 344,704 365,722 383,120 399,951Finance, insurance, and real estate ......... 52 277,239 300,490 310,211 324,894 350,180
Depository institutions ............................... 53 71,843 74,693 77,101 80,243 83,793Nondepository institutions ......................... 54 17,583 21,506 21,474 21,677 25,089Security and commodity brokers .............. 55 45,275 53,870 53,798 59,450 68,973Insurance carriers ..................................... 56 63,951 67,462 70,378 72,737 75,871Insurance agents, brokers, and service ... 57 26,404 27,530 29,514 31,008 32,828Real estate ................................................ 58 37,212 38,915 41,284 42,182 44,906Holding and other investment offices ...... 59 14,971 16,514 16,662 17,597 18,720
Services ........................................................ 60 859,783 916,289 970,992 1,051,394 1,125,269Hotels and other lodging places .............. 61 31,364 32,665 34,231 35,886 37,676Personal services ...................................... 62 21,017 21,785 22,439 23,495 24,609Business services ..................................... 63 136,911 152,544 168,265 193,888 221,473Auto repair, services, and parking ........... 64 22,607 24,190 25,924 27,830 30,388Miscellaneous repair services .................. 65 10,050 10,696 10,222 11,247 12,103Motion pictures .......................................... 66 11,680 13,171 14,426 16,837 18,956Amusement and recreation services ........ 67 26,512 29,190 31,264 34,526 37,235Health services ......................................... 68 293,705 308,893 325,041 344,680 359,179Legal services ........................................... 69 54,434 55,481 56,886 58,333 60,452Educational services ................................. 70 43,551 46,270 49,079 51,755 54,601Social services and membership
organizations.71 73,611 80,066 86,121 91,565 95,877
Social services ...................................... 72 36,007 39,122 42,375 45,862 48,350Membership organizations ................... 73 37,604 40,944 43,746 45,703 47,527
Other services 1 ........................................ 74 124,254 130,669 136,059 149,531 161,263Private households ................................... 75 10,087 10,669 11,035 11,821 11,457
Government ...................................................... 76 751,870 775,809 800,668 825,339 855,281Federal ........................................................... 77 258,779 258,875 258,006 258,051 264,853
General government ................................. 78 210,857 211,406 208,312 207,288 212,849Civilian .................................................. 79 115,929 122,365 123,976 123,427 125,174Military 2 ................................................ 80 94,928 89,041 84,336 83,861 87,675
Government enterprises ........................... 81 47,922 47,469 49,694 50,763 52,004State and local .............................................. 82 493,091 516,934 542,662 567,288 590,428
General government ................................. 83 459,970 482,796 506,154 529,188 551,031Education .............................................. 84 240,638 253,217 265,457 279,024 292,665Other ..................................................... 85 219,332 229,579 240,697 250,164 258,366
Government enterprises ........................... 86 33,121 34,138 36,508 38,100 39,397Rest of the world ................................................. 87 –104 –2,139 –2,480 –2,534 –2,560
Receipts from the rest of the world .................. 88 1,137 1,180 1,239 1,323 1,338Less: Payments to the rest of the world 3 ....... 89 1,241 3,319 3,719 3,857 3,898
Addenda:Households and institutions .............................. 90 279,072 296,496 312,741 331,760 346,034Nonfarm business .............................................. 91 2,681,988 2,812,068 2,972,798 3,134,144 3,303,173
1. Consists of museums, botanical, zoological gardens; engineering and management services; and services, notelsewhere classified.
2. Includes Coast Guard.3. Beginning with 1993, includes estimates of foreign professional workers and undocumented Mexican migratory
workers employed temporarily in the United States.NOTE.— Estimates in this table are based on the 1987 Standard Industrial Classification (SIC).
Table 6.3C.—Wage and Salary Accruals by Industry[Millions of dollars]
Line 1992 1993 1994 1995 1996
Wage and salary accruals ..................... 1 2,970,638 3,094,048 3,254,030 3,442,583 3,633,641
Domestic industries ............................................. 2 2,970,742 3,096,187 3,256,510 3,445,117 3,636,201
Private industries ............................................ 3 2,402,989 2,511,872 2,654,320 2,822,137 2,993,607
Agriculture, forestry, and fishing .............. 4 26,479 28,087 29,852 31,915 34,476Farms ........................................................ 5 11,253 12,049 12,325 13,309 14,163Agricultural services, forestry, and fishing 6 15,226 16,038 17,527 18,606 20,313
Mining ........................................................... 7 26,401 26,185 26,378 26,843 27,644Metal mining .............................................. 8 2,216 2,186 2,187 2,518 2,707Coal mining ............................................... 9 5,382 4,870 4,993 4,884 4,739Oil and gas extraction .............................. 10 15,467 15,707 15,606 15,628 16,240Nonmetallic minerals, except fuels .......... 11 3,336 3,422 3,592 3,813 3,958
Construction ................................................ 12 129,243 134,177 147,425 157,684 172,234
Manufacturing .............................................. 13 579,839 595,129 625,496 651,750 675,067Durable goods ........................................... 14 349,403 357,905 379,616 398,272 416,061
Lumber and wood products ................. 15 15,822 16,931 18,495 19,401 20,459Furniture and fixtures ........................... 16 10,736 11,312 11,986 12,584 12,964Stone, clay, and glass products .......... 17 15,427 15,884 17,054 17,706 18,548Primary metal industries ...................... 18 24,616 25,075 26,841 27,990 28,866Fabricated metal products ................... 19 40,109 41,111 44,496 46,794 48,553Industrial machinery and equipment .... 20 70,467 72,023 76,720 82,191 86,528Electronic and other electric
equipment.21 51,915 54,766 58,302 62,681 66,179
Motor vehicles and equipment ............. 22 33,268 36,935 42,384 44,886 46,377Other transportation equipment ........... 23 41,385 38,252 36,861 36,172 37,186Instruments and related products ........ 24 36,081 35,647 35,960 37,013 39,158Miscellaneous manufacturing industries 25 9,577 9,969 10,517 10,854 11,243
Nondurable goods ..................................... 26 230,436 237,224 245,880 253,478 259,006Food and kindred products .................. 27 44,721 46,186 47,614 49,527 50,746Tobacco products ................................. 28 2,124 1,986 2,062 2,215 2,268Textile mill products ............................. 29 14,885 15,316 15,840 15,697 15,544Apparel and other textile products ...... 30 17,018 17,057 17,442 17,322 16,816Paper and allied products .................... 31 24,552 25,263 26,230 27,058 27,672Printing and publishing ......................... 32 44,500 45,844 48,193 50,087 51,718Chemicals and allied products ............. 33 48,277 49,778 50,743 52,582 54,411Petroleum and coal products ............... 34 7,768 7,768 7,796 7,837 7,791Rubber and miscellaneous plastics
products.35 24,205 25,598 27,527 28,784 29,803
Leather and leather products ............... 36 2,386 2,428 2,433 2,369 2,237
Transportation and public utilities ........... 37 192,683 200,257 211,840 221,770 231,072Transportation ........................................... 38 103,145 106,904 113,626 119,110 124,815
Railroad transportation ......................... 39 11,522 11,239 11,249 11,271 11,422Local and interurban passenger transit 40 6,355 6,726 7,292 7,731 8,381Trucking and warehousing ................... 41 43,005 45,554 49,750 52,594 47,040Water transportation ............................. 42 5,955 6,003 6,238 6,323 6,429Transportation by air ............................ 43 25,986 26,490 27,189 28,339 38,220Pipelines, except natural gas ............... 44 981 959 929 869 829Transportation services ........................ 45 9,341 9,933 10,979 11,983 12,494
Communications ........................................ 46 48,924 51,011 55,320 58,933 62,279Telephone and telegraph ..................... 47 37,714 39,151 42,517 44,315 46,361Radio and television ............................. 48 11,210 11,860 12,803 14,618 15,918
Electric, gas, and sanitary services ......... 49 40,614 42,342 42,894 43,727 43,978
Wholesale trade ........................................... 50 201,235 204,618 217,964 234,467 246,452
Retail trade ................................................... 51 283,347 294,375 313,776 329,936 345,994
Finance, insurance, and real estate ......... 52 231,851 252,201 260,045 273,124 296,112Depository institutions ............................... 53 58,898 61,019 62,949 65,664 69,013Nondepository institutions ......................... 54 14,705 18,145 18,087 18,317 21,223Security and commodity brokers .............. 55 39,168 47,050 46,857 51,967 60,688Insurance carriers ..................................... 56 52,939 55,820 58,148 60,125 63,079Insurance agents, brokers, and service ... 57 22,256 23,340 25,039 26,384 28,031Real estate ................................................ 58 30,843 32,518 34,567 35,442 37,910Holding and other investment offices ...... 59 13,042 14,309 14,398 15,225 16,168
Services ........................................................ 60 731,911 776,843 821,544 894,648 964,556Hotels and other lodging places .............. 61 26,547 27,665 28,966 30,557 32,322Personal services ...................................... 62 18,157 18,836 19,383 20,405 21,518Business services ..................................... 63 116,501 129,068 142,292 165,300 190,526Auto repair, services, and parking ........... 64 19,233 20,593 22,053 23,824 26,212Miscellaneous repair services .................. 65 8,613 9,132 8,709 9,650 10,455Motion pictures .......................................... 66 9,949 11,157 12,224 14,399 16,289Amusement and recreation services ........ 67 22,278 24,471 26,179 29,150 31,764Health services ......................................... 68 247,664 258,872 271,678 289,564 303,790Legal services ........................................... 69 46,518 47,421 48,407 49,761 51,905Educational services ................................. 70 36,943 39,063 41,294 43,697 46,503Social services and membership
organizations.71 63,060 68,257 73,364 78,346 82,749
Social services ...................................... 72 29,955 32,428 35,109 38,282 40,766Membership organizations ................... 73 33,105 35,829 38,255 40,064 41,983
Other services 1 ........................................ 74 106,577 111,876 116,205 128,432 139,316Private households ................................... 75 9,871 10,432 10,790 11,563 11,207
Government ...................................................... 76 567,753 584,315 602,190 622,980 642,594Federal ........................................................... 77 173,663 174,102 173,413 175,045 177,228
General government ................................. 78 140,865 141,868 139,744 140,708 142,038Civilian .................................................. 79 79,840 83,710 84,864 84,540 85,541Military 2 ................................................ 80 61,025 58,158 54,880 56,168 56,497
Government enterprises ........................... 81 32,798 32,234 33,669 34,337 35,190State and local .............................................. 82 394,090 410,213 428,777 447,935 465,366
General government ................................. 83 367,133 382,616 399,489 417,381 433,845Education .............................................. 84 190,348 198,842 207,472 217,962 228,252Other ..................................................... 85 176,785 183,774 192,017 199,419 205,593
Government enterprises ........................... 86 26,957 27,597 29,288 30,554 31,521
Rest of the world ................................................. 87 –104 –2,139 –2,480 –2,534 –2,560Receipts from the rest of the world .................. 88 1,137 1,180 1,239 1,323 1,338Less: Payments to the rest of the world 3 ....... 89 1,241 3,319 3,719 3,857 3,898
1. Consists of museums, botanical, zoological gardens; engineering and management services; and services, notelsewhere classified.
2. Includes Coast Guard.3. Beginning with 1993, includes estimates of foreign professional workers and undocumented Mexican migratory
workers employed temporarily in the United States.NOTE.— Estimates in this table are based on the 1987 Standard Industrial Classification (SIC).
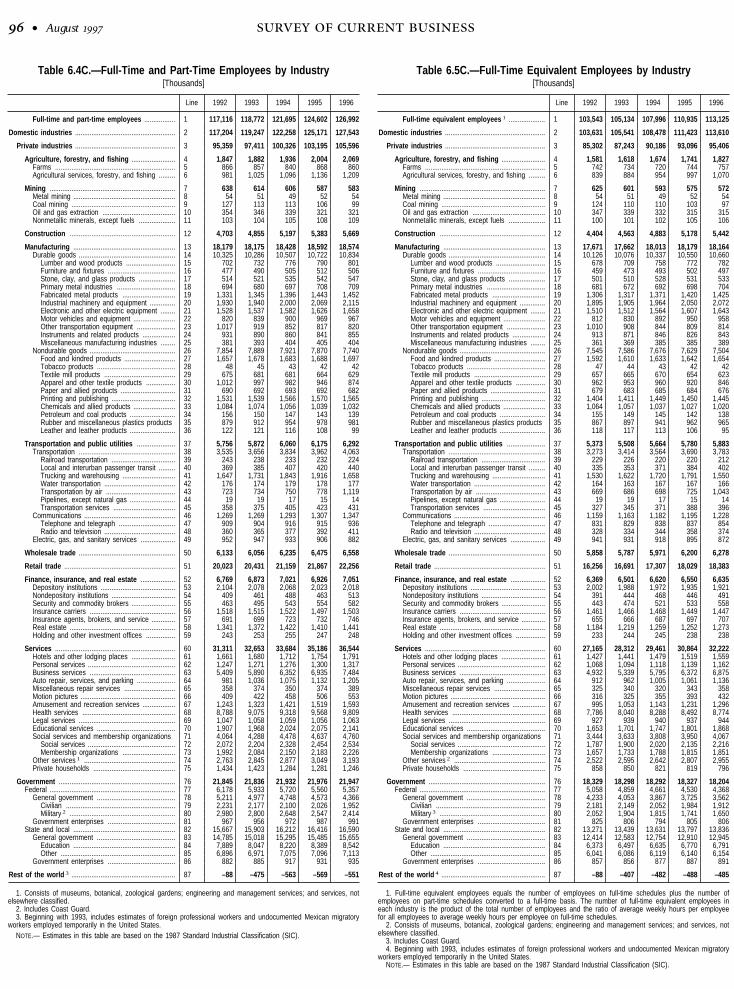
• August
Table 6.4C.—Full-Time and Part-Time Employees by Industry[Thousands]
Line 1992 1993 1994 1995 1996
Full-time and part-time employees ................. 1 117,116 118,772 121,695 124,602 126,992
Domestic industries ....................................................... 2 117,204 119,247 122,258 125,171 127,543
Private industries ....................................................... 3 95,359 97,411 100,326 103,195 105,596
Agriculture, forestry, and fishing ........................ 4 1,847 1,882 1,936 2,004 2,069Farms .................................................................. 5 866 857 840 868 860Agricultural services, forestry, and fishing ......... 6 981 1,025 1,096 1,136 1,209
Mining ..................................................................... 7 638 614 606 587 583Metal mining ........................................................ 8 54 51 49 52 54Coal mining ......................................................... 9 127 113 113 106 99Oil and gas extraction ........................................ 10 354 346 339 321 321Nonmetallic minerals, except fuels .................... 11 103 104 105 108 109
Construction .......................................................... 12 4,703 4,855 5,197 5,383 5,669
Manufacturing ........................................................ 13 18,179 18,175 18,428 18,592 18,574Durable goods ..................................................... 14 10,325 10,286 10,507 10,722 10,834
Lumber and wood products ........................... 15 702 732 776 790 801Furniture and fixtures ..................................... 16 477 490 505 512 506Stone, clay, and glass products .................... 17 514 521 535 542 547Primary metal industries ................................ 18 694 680 697 708 709Fabricated metal products ............................. 19 1,331 1,345 1,396 1,443 1,452Industrial machinery and equipment .............. 20 1,930 1,940 2,000 2,069 2,115Electronic and other electric equipment ........ 21 1,528 1,537 1,582 1,626 1,658Motor vehicles and equipment ....................... 22 820 839 900 969 967Other transportation equipment ..................... 23 1,017 919 852 817 820Instruments and related products .................. 24 931 890 860 841 855Miscellaneous manufacturing industries ........ 25 381 393 404 405 404
Nondurable goods ............................................... 26 7,854 7,889 7,921 7,870 7,740Food and kindred products ............................ 27 1,657 1,678 1,683 1,688 1,697Tobacco products ........................................... 28 48 45 43 42 42Textile mill products ....................................... 29 675 681 681 664 629Apparel and other textile products ................ 30 1,012 997 982 946 874Paper and allied products .............................. 31 690 692 693 692 682Printing and publishing ................................... 32 1,531 1,539 1,566 1,570 1,565Chemicals and allied products ....................... 33 1,084 1,074 1,056 1,039 1,032Petroleum and coal products ......................... 34 156 150 147 143 139Rubber and miscellaneous plastics products 35 879 912 954 978 981Leather and leather products ......................... 36 122 121 116 108 99
Transportation and public utilities ..................... 37 5,756 5,872 6,060 6,175 6,292Transportation ..................................................... 38 3,535 3,656 3,834 3,962 4,063
Railroad transportation ................................... 39 243 238 233 232 224Local and interurban passenger transit ......... 40 369 385 407 420 440Trucking and warehousing ............................. 41 1,647 1,731 1,843 1,916 1,658Water transportation ....................................... 42 176 174 179 178 177Transportation by air ...................................... 43 723 734 750 778 1,119Pipelines, except natural gas ......................... 44 19 19 17 15 14Transportation services .................................. 45 358 375 405 423 431
Communications .................................................. 46 1,269 1,269 1,293 1,307 1,347Telephone and telegraph ............................... 47 909 904 916 915 936Radio and television ....................................... 48 360 365 377 392 411
Electric, gas, and sanitary services ................... 49 952 947 933 906 882
Wholesale trade ..................................................... 50 6,133 6,056 6,235 6,475 6,558
Retail trade ............................................................. 51 20,023 20,431 21,159 21,867 22,256
Finance, insurance, and real estate ................... 52 6,769 6,873 7,021 6,926 7,051Depository institutions ......................................... 53 2,104 2,078 2,068 2,023 2,018Nondepository institutions ................................... 54 409 461 488 463 513Security and commodity brokers ........................ 55 463 495 543 554 582Insurance carriers ............................................... 56 1,518 1,515 1,522 1,497 1,503Insurance agents, brokers, and service ............. 57 691 699 723 732 746Real estate .......................................................... 58 1,341 1,372 1,422 1,410 1,441Holding and other investment offices ................ 59 243 253 255 247 248
Services .................................................................. 60 31,311 32,653 33,684 35,186 36,544Hotels and other lodging places ........................ 61 1,661 1,680 1,712 1,754 1,791Personal services ................................................ 62 1,247 1,271 1,276 1,300 1,317Business services ............................................... 63 5,409 5,890 6,352 6,935 7,484Auto repair, services, and parking ..................... 64 981 1,036 1,075 1,132 1,205Miscellaneous repair services ............................ 65 358 374 350 374 389Motion pictures .................................................... 66 409 422 458 506 553Amusement and recreation services .................. 67 1,243 1,323 1,421 1,519 1,593Health services ................................................... 68 8,788 9,075 9,318 9,568 9,809Legal services ..................................................... 69 1,047 1,058 1,059 1,056 1,063Educational services ........................................... 70 1,907 1,968 2,024 2,075 2,141Social services and membership organizations 71 4,064 4,288 4,478 4,637 4,760
Social services ................................................ 72 2,072 2,204 2,328 2,454 2,534Membership organizations ............................. 73 1,992 2,084 2,150 2,183 2,226
Other services 1 .................................................. 74 2,763 2,845 2,877 3,049 3,193Private households ............................................. 75 1,434 1,423 1,284 1,281 1,246
Government ................................................................ 76 21,845 21,836 21,932 21,976 21,947Federal ..................................................................... 77 6,178 5,933 5,720 5,560 5,357
General government ........................................... 78 5,211 4,977 4,748 4,573 4,366Civilian ............................................................ 79 2,231 2,177 2,100 2,026 1,952Military 2 .......................................................... 80 2,980 2,800 2,648 2,547 2,414
Government enterprises ..................................... 81 967 956 972 987 991State and local ........................................................ 82 15,667 15,903 16,212 16,416 16,590
General government ........................................... 83 14,785 15,018 15,295 15,485 15,655Education ........................................................ 84 7,889 8,047 8,220 8,389 8,542Other ............................................................... 85 6,896 6,971 7,075 7,096 7,113
Government enterprises ..................................... 86 882 885 917 931 935
Rest of the world 3 ......................................................... 87 –88 –475 –563 –569 –551
1. Consists of museums, botanical, zoological gardens; engineering and management services; and services, notelsewhere classified.
2. Includes Coast Guard.3. Beginning with 1993, includes estimates of foreign professional workers and undocumented Mexican migratory
workers employed temporarily in the United States.NOTE.— Estimates in this table are based on the 1987 Standard Industrial Classification (SIC).
Table 6.5C.—Full-Time Equivalent Employees by Industry[Thousands]
Line 1992 1993 1994 1995 1996
Full-time equivalent employees 1 .................... 1 103,543 105,134 107,996 110,935 113,125
Domestic industries ....................................................... 2 103,631 105,541 108,478 111,423 113,610
Private industries ....................................................... 3 85,302 87,243 90,186 93,096 95,406
Agriculture, forestry, and fishing ........................ 4 1,581 1,618 1,674 1,741 1,827Farms .................................................................. 5 742 734 720 744 757Agricultural services, forestry, and fishing ......... 6 839 884 954 997 1,070
Mining ..................................................................... 7 625 601 593 575 572Metal mining ........................................................ 8 54 51 49 52 54Coal mining ......................................................... 9 124 110 110 103 97Oil and gas extraction ........................................ 10 347 339 332 315 315Nonmetallic minerals, except fuels .................... 11 100 101 102 105 106
Construction .......................................................... 12 4,404 4,563 4,883 5,178 5,442
Manufacturing ........................................................ 13 17,671 17,662 18,013 18,179 18,164Durable goods ..................................................... 14 10,126 10,076 10,337 10,550 10,660
Lumber and wood products ........................... 15 678 709 758 772 782Furniture and fixtures ..................................... 16 459 473 493 502 497Stone, clay, and glass products .................... 17 501 510 528 531 533Primary metal industries ................................ 18 681 672 692 698 704Fabricated metal products ............................. 19 1,306 1,317 1,371 1,420 1,425Industrial machinery and equipment .............. 20 1,895 1,905 1,964 2,050 2,072Electronic and other electric equipment ........ 21 1,510 1,512 1,564 1,607 1,643Motor vehicles and equipment ....................... 22 812 830 892 950 958Other transportation equipment ..................... 23 1,010 908 844 809 814Instruments and related products .................. 24 913 871 846 826 843Miscellaneous manufacturing industries ........ 25 361 369 385 385 389
Nondurable goods ............................................... 26 7,545 7,586 7,676 7,629 7,504Food and kindred products ............................ 27 1,592 1,610 1,633 1,642 1,654Tobacco products ........................................... 28 47 44 43 42 42Textile mill products ....................................... 29 657 665 670 654 623Apparel and other textile products ................ 30 962 953 960 920 846Paper and allied products .............................. 31 679 683 685 684 676Printing and publishing ................................... 32 1,404 1,411 1,449 1,450 1,445Chemicals and allied products ....................... 33 1,064 1,057 1,037 1,027 1,020Petroleum and coal products ......................... 34 155 149 145 142 138Rubber and miscellaneous plastics products 35 867 897 941 962 965Leather and leather products ......................... 36 118 117 113 106 95
Transportation and public utilities ..................... 37 5,373 5,508 5,664 5,780 5,883Transportation ..................................................... 38 3,273 3,414 3,564 3,690 3,783
Railroad transportation ................................... 39 229 226 220 220 212Local and interurban passenger transit ......... 40 335 353 371 384 402Trucking and warehousing ............................. 41 1,530 1,622 1,720 1,791 1,550Water transportation ....................................... 42 164 163 167 167 166Transportation by air ...................................... 43 669 686 698 725 1,043Pipelines, except natural gas ......................... 44 19 19 17 15 14Transportation services .................................. 45 327 345 371 388 396
Communications .................................................. 46 1,159 1,163 1,182 1,195 1,228Telephone and telegraph ............................... 47 831 829 838 837 854Radio and television ....................................... 48 328 334 344 358 374
Electric, gas, and sanitary services ................... 49 941 931 918 895 872
Wholesale trade ..................................................... 50 5,858 5,787 5,971 6,200 6,278
Retail trade ............................................................. 51 16,256 16,691 17,307 18,029 18,383
Finance, insurance, and real estate ................... 52 6,369 6,501 6,620 6,550 6,635Depository institutions ......................................... 53 2,002 1,988 1,972 1,935 1,921Nondepository institutions ................................... 54 391 444 468 446 491Security and commodity brokers ........................ 55 443 474 521 533 558Insurance carriers ............................................... 56 1,461 1,466 1,468 1,449 1,447Insurance agents, brokers, and service ............. 57 655 666 687 697 707Real estate .......................................................... 58 1,184 1,219 1,259 1,252 1,273Holding and other investment offices ................ 59 233 244 245 238 238
Services .................................................................. 60 27,165 28,312 29,461 30,864 32,222Hotels and other lodging places ........................ 61 1,427 1,441 1,479 1,519 1,559Personal services ................................................ 62 1,068 1,094 1,118 1,139 1,162Business services ............................................... 63 4,932 5,339 5,795 6,372 6,875Auto repair, services, and parking ..................... 64 912 962 1,005 1,061 1,136Miscellaneous repair services ............................ 65 325 340 320 343 358Motion pictures .................................................... 66 316 325 355 393 432Amusement and recreation services .................. 67 995 1,053 1,143 1,231 1,296Health services ................................................... 68 7,786 8,040 8,288 8,492 8,774Legal services ..................................................... 69 927 939 940 937 944Educational services ........................................... 70 1,653 1,701 1,747 1,801 1,868Social services and membership organizations 71 3,444 3,633 3,808 3,950 4,067
Social services ................................................ 72 1,787 1,900 2,020 2,135 2,216Membership organizations ............................. 73 1,657 1,733 1,788 1,815 1,851
Other services 2 .................................................. 74 2,522 2,595 2,642 2,807 2,955Private households ............................................. 75 858 850 821 819 796
Government ................................................................ 76 18,329 18,298 18,292 18,327 18,204Federal ..................................................................... 77 5,058 4,859 4,661 4,530 4,368
General government ........................................... 78 4,233 4,053 3,867 3,725 3,562Civilian ............................................................ 79 2,181 2,149 2,052 1,984 1,912Military 3 .......................................................... 80 2,052 1,904 1,815 1,741 1,650
Government enterprises ..................................... 81 825 806 794 805 806State and local ........................................................ 82 13,271 13,439 13,631 13,797 13,836
General government ........................................... 83 12,414 12,583 12,754 12,910 12,945Education ........................................................ 84 6,373 6,497 6,635 6,770 6,791Other ............................................................... 85 6,041 6,086 6,119 6,140 6,154
Government enterprises ..................................... 86 857 856 877 887 891
Rest of the world 4 ......................................................... 87 –88 –407 –482 –488 –485
1. Full-time equivalent employees equals the number of employees on full-time schedules plus the number ofemployees on part-time schedules converted to a full-time basis. The number of full-time equivalent employees ineach industry is the product of the total number of employees and the ratio of average weekly hours per employeefor all employees to average weekly hours per employee on full-time schedules.
2. Consists of museums, botanical, zoological gardens; engineering and management services; and services, notelsewhere classified.
3. Includes Coast Guard.4. Beginning with 1993, includes estimates of foreign professional workers and undocumented Mexican migratory
workers employed temporarily in the United States.NOTE.— Estimates in this table are based on the 1987 Standard Industrial Classification (SIC).

August •
Table 6.6C.—Wage and Salary Accruals Per Full-Time EquivalentEmployee by Industry
[Dollars]
Line 1992 1993 1994 1995 1996
Wage and salary accruals per full-timeequivalent employee.
1 28,690 29,430 30,131 31,032 32,121
Domestic industries ....................................................... 2 28,667 29,336 30,020 30,919 32,006
Private industries ....................................................... 3 28,170 28,792 29,432 30,314 31,378
Agriculture, forestry, and fishing ........................ 4 16,748 17,359 17,833 18,331 18,870Farms .................................................................. 5 15,166 16,416 17,118 17,888 18,709Agricultural services, forestry, and fishing ......... 6 18,148 18,143 18,372 18,662 18,984
Mining ..................................................................... 7 42,242 43,569 44,482 46,683 48,329Metal mining ........................................................ 8 41,037 42,863 44,633 48,423 50,130Coal mining ......................................................... 9 43,403 44,273 45,391 47,417 48,856Oil and gas extraction ........................................ 10 44,573 46,333 47,006 49,613 51,556Nonmetallic minerals, except fuels .................... 11 33,360 33,881 35,216 36,314 37,340
Construction .......................................................... 12 29,347 29,405 30,191 30,453 31,649
Manufacturing ........................................................ 13 32,813 33,695 34,725 35,852 37,165Durable goods ..................................................... 14 34,506 35,521 36,724 37,751 39,030
Lumber and wood products ........................... 15 23,336 23,880 24,400 25,131 26,162Furniture and fixtures ..................................... 16 23,390 23,915 24,312 25,068 26,085Stone, clay, and glass products .................... 17 30,792 31,145 32,299 33,345 34,799Primary metal industries ................................ 18 36,147 37,314 38,788 40,100 41,003Fabricated metal products ............................. 19 30,711 31,216 32,455 32,954 34,072Industrial machinery and equipment .............. 20 37,186 37,807 39,063 40,093 41,761Electronic and other electric equipment ........ 21 34,381 36,221 37,277 39,005 40,279Motor vehicles and equipment ....................... 22 40,970 44,500 47,516 47,248 48,410Other transportation equipment ..................... 23 40,975 42,128 43,674 44,712 45,683Instruments and related products .................. 24 39,519 40,927 42,506 44,810 46,451Miscellaneous manufacturing industries ........ 25 26,529 27,016 27,317 28,192 28,902
Nondurable goods ............................................... 26 30,542 31,271 32,032 33,226 34,516Food and kindred products ............................ 27 28,091 28,687 29,157 30,163 30,681Tobacco products ........................................... 28 45,191 45,136 47,953 52,738 54,000Textile mill products ....................................... 29 22,656 23,032 23,642 24,002 24,950Apparel and other textile products ................ 30 17,690 17,898 18,169 18,828 19,877Paper and allied products .............................. 31 36,159 36,988 38,292 39,558 40,935Printing and publishing ................................... 32 31,695 32,490 33,259 34,543 35,791Chemicals and allied products ....................... 33 45,373 47,094 48,932 51,200 53,344Petroleum and coal products ......................... 34 50,116 52,134 53,766 55,190 56,457Rubber and miscellaneous plastics products 35 27,918 28,537 29,253 29,921 30,884Leather and leather products ......................... 36 20,220 20,752 21,531 22,349 23,547
Transportation and public utilities ..................... 37 35,861 36,357 37,401 38,369 39,278Transportation ..................................................... 38 31,514 31,313 31,882 32,279 32,994
Railroad transportation ................................... 39 50,314 49,730 51,132 51,232 53,877Local and interurban passenger transit ......... 40 18,970 19,054 19,655 20,133 20,848Trucking and warehousing ............................. 41 28,108 28,085 28,924 29,366 30,348Water transportation ....................................... 42 36,311 36,828 37,353 37,862 38,729Transportation by air ...................................... 43 38,843 38,615 38,953 39,088 36,644Pipelines, except natural gas ......................... 44 51,632 50,474 54,647 57,933 59,214Transportation services .................................. 45 28,566 28,791 29,593 30,884 31,551
Communications .................................................. 46 42,212 43,862 46,802 49,316 50,716Telephone and telegraph ............................... 47 45,384 47,227 50,736 52,945 54,287Radio and television ....................................... 48 34,177 35,509 37,218 40,832 42,561
Electric, gas, and sanitary services ................... 49 43,160 45,480 46,725 48,857 50,433
Wholesale trade ..................................................... 50 34,352 35,358 36,504 37,817 39,256
Retail trade ............................................................. 51 17,430 17,637 18,130 18,300 18,821
Finance, insurance, and real estate ................... 52 36,403 38,794 39,282 41,698 44,629Depository institutions ......................................... 53 29,420 30,694 31,921 33,935 35,926Nondepository institutions ................................... 54 37,609 40,867 38,647 41,070 43,224Security and commodity brokers ........................ 55 88,415 99,262 89,937 97,499 108,760Insurance carriers ............................................... 56 36,235 38,076 39,610 41,494 43,593Insurance agents, brokers, and services ........... 57 33,979 35,045 36,447 37,854 39,648Real estate .......................................................... 58 26,050 26,676 27,456 28,308 29,780Holding and other investment offices ................ 59 55,974 58,643 58,767 63,971 67,933
Services .................................................................. 60 26,943 27,439 27,886 28,987 29,935Hotels and other lodging places ........................ 61 18,603 19,198 19,585 20,117 20,733Personal services ................................................ 62 17,001 17,218 17,337 17,915 18,518Business services ............................................... 63 23,621 24,175 24,554 25,942 27,713Auto repair, services, and parking ..................... 64 21,089 21,406 21,943 22,454 23,074Miscellaneous repair services ............................ 65 26,502 26,859 27,216 28,134 29,204Motion pictures .................................................... 66 31,484 34,329 34,434 36,639 37,706Amusement and recreation services .................. 67 22,390 23,239 22,904 23,680 24,509Health services ................................................... 68 31,809 32,198 32,780 34,098 34,624Legal services ..................................................... 69 50,181 50,502 51,497 53,107 54,984Educational services ........................................... 70 22,349 22,965 23,637 24,263 24,895Social services and membership organizations 71 18,310 18,788 19,266 19,834 20,346
Social services ................................................ 72 16,763 17,067 17,381 17,931 18,396Membership organizations ............................. 73 19,979 20,675 21,395 22,074 22,681
Other services 1 .................................................. 74 42,259 43,112 43,984 45,754 47,146Private households ............................................. 75 11,505 12,273 13,143 14,118 14,079
Government ................................................................ 76 30,976 31,933 32,921 33,992 35,300Federal ..................................................................... 77 34,334 35,831 37,205 38,641 40,574
General government ........................................... 78 33,278 35,003 36,138 37,774 39,876Civilian ............................................................ 79 36,607 38,953 41,357 42,611 44,739Military 2 .......................................................... 80 29,739 30,545 30,237 32,262 34,241
Government enterprises ..................................... 81 39,755 39,993 42,404 42,655 43,660State and local ........................................................ 82 29,696 30,524 31,456 32,466 33,634
General government ........................................... 83 29,574 30,407 31,323 32,330 33,514Education ........................................................ 84 29,868 30,605 31,269 32,195 33,611Other ............................................................... 85 29,264 30,196 31,380 32,479 33,408
Government enterprises ..................................... 86 31,455 32,239 33,396 34,446 35,377
Rest of the world ........................................................... 87 .............. .............. .............. .............. ..............
1. Consists of museums, botanical, zoological gardens; engineering and management services; and services, notelsewhere classified.
2. Includes Coast Guard.NOTE.— Estimates in this table are based on the 1987 Standard Industrial Classification (SIC).
Table 6.7C.—Self-Employed Persons by Industry[Thousands]
Line 1992 1993 1994 1995 1996
Self-employed persons 1 .................................. 1 10,040 10,505 10,564 10,435 10,541
Agriculture, forestry, and fishing ...................................... 2 1,432 1,453 1,474 1,458 1,473
Farms ........................................................................... 3 1,061 1,066 1,071 1,066 1,061Agricultural services, forestry, and fishing .................. 4 371 387 403 392 412
Mining ............................................................................... 5 23 17 14 15 14
Construction ..................................................................... 6 1,471 1,566 1,523 1,476 1,512
Manufacturing ................................................................... 7 398 447 432 434 413Durable goods ............................................................. 8 247 264 247 252 251Nondurable goods ....................................................... 9 151 183 185 182 162
Transportation and public utilities .................................... 10 335 373 381 396 435
Wholesale trade ............................................................... 11 349 354 353 359 311
Retail trade ....................................................................... 12 1,439 1,569 1,590 1,447 1,483
Finance, insurance, and real estate ............................... 13 630 661 631 666 680
Services ............................................................................ 14 3,963 4,065 4,166 4,184 4,220
1. Consists of active proprietors or partners who devote a majority of their working hours to their unincorporatedbusinesses.
NOTE.— Estimates in this table are based on the 1987 Standard Industrial Classification (SIC).

• August
Table 6.8C.—Persons Engaged in Production by Industry[Thousands]
Line 1992 1993 1994 1995 1996
Persons engaged in production 1 ................... 1 113,583 115,639 118,560 121,370 123,666
Domestic industries ....................................................... 2 113,671 116,046 119,042 121,858 124,151
Private industries ....................................................... 3 95,342 97,748 100,750 103,531 105,947
Agriculture, forestry, and fishing ........................ 4 3,013 3,071 3,148 3,199 3,300Farms .................................................................. 5 1,803 1,800 1,791 1,810 1,818Agricultural services, forestry, and fishing ......... 6 1,210 1,271 1,357 1,389 1,482
Mining ..................................................................... 7 648 618 607 590 586Metal mining ........................................................ 8 55 51 49 52 54Coal mining ......................................................... 9 124 110 110 103 97Oil and gas extraction ........................................ 10 367 352 345 327 327Nonmetallic minerals, except fuels .................... 11 102 105 103 108 108
Construction .......................................................... 12 5,875 6,129 6,406 6,654 6,954
Manufacturing ........................................................ 13 18,069 18,109 18,445 18,613 18,577Durable goods ..................................................... 14 10,373 10,340 10,584 10,802 10,911
Lumber and wood products ........................... 15 751 790 835 857 858Furniture and fixtures ..................................... 16 485 497 515 525 521Stone, clay, and glass products .................... 17 518 524 544 550 558Primary metal industries ................................ 18 682 674 693 701 707Fabricated metal products ............................. 19 1,322 1,336 1,390 1,441 1,446Industrial machinery and equipment .............. 20 1,936 1,937 1,996 2,083 2,100Electronic and other electric equipment ........ 21 1,517 1,522 1,573 1,616 1,653Motor vehicles and equipment ....................... 22 816 835 895 952 960Other transportation equipment ..................... 23 1,017 918 850 816 819Instruments and related products .................. 24 919 880 853 834 850Miscellaneous manufacturing industries ........ 25 410 427 440 427 439
Nondurable goods ............................................... 26 7,696 7,769 7,861 7,811 7,666Food and kindred products ............................ 27 1,613 1,635 1,654 1,659 1,664Tobacco products ........................................... 28 47 44 43 42 42Textile mill products ....................................... 29 663 672 676 661 631Apparel and other textile products ................ 30 990 982 998 952 881Paper and allied products .............................. 31 681 684 686 686 677Printing and publishing ................................... 32 1,488 1,517 1,551 1,560 1,536Chemicals and allied products ....................... 33 1,069 1,062 1,039 1,032 1,024Petroleum and coal products ......................... 34 155 149 145 142 138Rubber and miscellaneous plastics products 35 870 903 951 967 971Leather and leather products ......................... 36 120 121 118 110 102
Transportation and public utilities ..................... 37 5,708 5,881 6,045 6,176 6,318Transportation ..................................................... 38 3,588 3,759 3,922 4,048 4,182
Railroad transportation ................................... 39 229 226 220 220 212Local and interurban passenger transit ......... 40 389 418 437 431 444Trucking and warehousing ............................. 41 1,755 1,851 1,977 2,054 1,854Water transportation ....................................... 42 167 171 175 178 174Transportation by air ...................................... 43 675 694 704 731 1,050Pipelines, except natural gas ......................... 44 19 19 17 15 14Transportation services .................................. 45 354 380 392 419 434
Communications .................................................. 46 1,171 1,180 1,192 1,219 1,258Telephone and telegraph ............................... 47 837 840 844 851 873Radio and television ....................................... 48 334 340 348 368 385
Electric, gas, and sanitary services ................... 49 949 942 931 909 878
Wholesale trade ..................................................... 50 6,207 6,141 6,324 6,559 6,589
Retail trade ............................................................. 51 17,695 18,260 18,897 19,476 19,866
Finance, insurance, and real estate ................... 52 6,999 7,162 7,251 7,216 7,315Depository institutions ......................................... 53 2,004 1,989 1,973 1,937 1,923Nondepository institutions ................................... 54 405 461 485 466 506Security and commodity brokers ........................ 55 510 553 592 622 648Insurance carriers ............................................... 56 1,462 1,466 1,468 1,449 1,447Insurance agents, brokers, and service ............. 57 821 847 853 856 873Real estate .......................................................... 58 1,564 1,602 1,635 1,648 1,680Holding and other investment offices ................ 59 233 244 245 238 238
Services .................................................................. 60 31,128 32,377 33,627 35,048 36,442Hotels and other lodging places ........................ 61 1,483 1,508 1,549 1,587 1,625Personal services ................................................ 62 1,707 1,737 1,725 1,776 1,805Business services ............................................... 63 5,552 6,012 6,538 7,109 7,664Auto repair, services, and parking ..................... 64 1,267 1,325 1,338 1,362 1,480Miscellaneous repair services ............................ 65 555 587 568 591 573Motion pictures .................................................... 66 461 468 498 543 583Amusement and recreation services .................. 67 1,089 1,169 1,264 1,327 1,420Health services ................................................... 68 8,205 8,451 8,677 8,903 9,168Legal services ..................................................... 69 1,148 1,163 1,184 1,173 1,147Educational services ........................................... 70 1,758 1,815 1,860 1,915 1,986Social services and membership organizations 71 3,905 4,066 4,351 4,504 4,623
Social services ................................................ 72 2,248 2,333 2,563 2,689 2,772Membership organizations ............................. 73 1,657 1,733 1,788 1,815 1,851
Other services 2 .................................................. 74 3,140 3,226 3,254 3,439 3,572Private households ............................................. 75 858 850 821 819 796
Government ................................................................ 76 18,329 18,298 18,292 18,327 18,204Federal ..................................................................... 77 5,058 4,859 4,661 4,530 4,368
General government ........................................... 78 4,233 4,053 3,867 3,725 3,562Civilian ............................................................ 79 2,181 2,149 2,052 1,984 1,912Military 3 .......................................................... 80 2,052 1,904 1,815 1,741 1,650
Government enterprises ..................................... 81 825 806 794 805 806State and local ........................................................ 82 13,271 13,439 13,631 13,797 13,836
General government ........................................... 83 12,414 12,583 12,754 12,910 12,945Education ........................................................ 84 6,373 6,497 6,635 6,770 6,791Other ............................................................... 85 6,041 6,086 6,119 6,140 6,154
Government enterprises ..................................... 86 857 856 877 887 891
Rest of the world 4 ......................................................... 87 –88 –407 –482 –488 –485
1. Equals the number of full-time equivalent employees (table 6.5) plus the number of self-employed persons(table 6.7). Unpaid family workers are not included.
2. Consists of museums, botanical, zoological gardens; engineering and management services; and services, notelsewhere classified.
3. Includes Coast Guard.4. Beginning with 1993, includes estimates of foreign professional workers and undocumented Mexican migratory
workers employed temporarily in the United States.NOTE.— Estimates in this table are based on the 1987 Standard Industrial Classification (SIC).
Table 6.9C.—Hours Worked by Full-Time and Part-Time Employees byIndustry
[Millions of hours]
Line 1992 1993 1994 1995 1996
Hours worked by full-time and part-timeemployees.
1 195,231 198,413 203,920 209,192 213,033
Domestic industries ....................................................... 2 195,414 199,362 205,067 210,346 214,156
Private industries ....................................................... 3 162,503 166,621 172,278 177,533 181,541
Agriculture, forestry, and fishing ............................. 4 3,294 3,329 3,442 3,578 3,685Farms .................................................................. 5 1,775 1,743 1,733 1,795 1,787Agricultural services, forestry, and fishing ......... 6 1,519 1,586 1,709 1,783 1,898
Mining ...................................................................... 7 1,348 1,320 1,296 1,281 1,290
Construction ............................................................. 8 9,119 9,492 10,177 10,541 11,158
Manufacturing .......................................................... 9 35,227 35,577 36,327 36,442 36,373Durable goods ..................................................... 10 20,076 20,327 20,944 21,204 21,398Nondurable goods ............................................... 11 15,151 15,250 15,383 15,238 14,975
Transportation and public utilities ........................... 12 10,515 10,760 11,279 11,729 11,937Transportation ..................................................... 13 6,432 6,622 7,131 7,515 7,677Communications .................................................. 14 2,246 2,298 2,351 2,427 2,529Electric, gas, and sanitary services ................... 15 1,837 1,840 1,797 1,787 1,731
Wholesale trade ...................................................... 16 11,437 11,065 11,601 12,146 12,301
Retail trade .............................................................. 17 29,464 30,155 31,491 32,424 32,998
Finance, insurance, and real estate ....................... 18 11,501 11,774 11,947 11,906 12,139
Services ................................................................... 19 50,598 53,149 54,718 57,486 59,660
Government ................................................................ 20 32,911 32,741 32,789 32,813 32,615General government ................................................ 21 29,573 29,415 29,398 29,375 29,158Government enterprises .......................................... 22 3,338 3,326 3,391 3,438 3,457
Rest of the world 1 ......................................................... 23 –183 –949 –1,147 –1,154 –1,123
1. Beginning with 1993, includes estimates of foreign professional workers and undocumented Mexican migratoryworkers employed temporarily in the United States.
NOTE.— Estimates in this table are based on the 1987 Standard Industrial Classification (SIC).

August •
Table 6.10C.—Employer Contributions for Social Insurance by Industry[Millions of dollars]
Line 1992 1993 1994 1995 1996
Employer contributions for social insurance 1 322,985 335,697 353,002 366,015 385,661
Domestic industries ....................................................... 2 322,985 335,697 353,002 366,015 385,661
Private industries ....................................................... 3 190,178 200,219 213,348 222,528 233,028
Agriculture, forestry, and fishing ............................. 4 2,335 2,547 2,657 2,768 2,834
Mining ...................................................................... 5 2,154 2,152 2,212 2,188 2,237
Construction ............................................................. 6 11,822 12,432 13,719 14,250 15,065
Manufacturing .......................................................... 7 47,561 49,376 52,340 53,481 54,575Durable goods ..................................................... 8 28,837 29,954 32,054 32,974 33,802Nondurable goods ............................................... 9 18,724 19,422 20,286 20,507 20,773
Transportation and public utilities ........................... 10 17,131 17,763 18,774 19,182 19,910Transportation ..................................................... 11 10,488 10,826 11,391 11,603 11,981Communications .................................................. 12 3,627 3,826 4,142 4,358 4,653Electric, gas, and sanitary services ................... 13 3,016 3,111 3,241 3,221 3,276
Wholesale trade ...................................................... 14 15,821 16,222 17,392 18,398 19,136
Retail trade .............................................................. 15 23,196 24,536 26,340 27,205 28,021
Finance, insurance, and real estate ....................... 16 17,064 18,201 18,997 19,710 21,444
Services ................................................................... 17 53,094 56,990 60,917 65,346 69,806
Government ................................................................ 18 132,807 135,478 139,654 143,487 152,633
Rest of the world ........................................................... 19 .............. .............. .............. .............. ..............
NOTE.— Estimates in this table are based on the 1987 Standard Industrial Classification (SIC).
Table 6.11C.—Other Labor Income by Industry and by Type[Millions of dollars]
Line 1992 1993 1994 1995 1996
Other labor income .......................................... 1 351,315 385,120 404,970 406,836 407,610
By industry
Domestic industries ....................................................... 2 351,315 385,120 404,970 406,836 407,610
Private industries ....................................................... 3 300,005 329,104 346,146 347,964 347,556
Agriculture, forestry, and fishing ............................. 4 1,918 2,222 2,271 2,328 2,309
Mining ...................................................................... 5 3,974 3,980 4,066 3,861 3,797
Construction ............................................................. 6 17,587 18,621 20,872 21,812 21,980
Manufacturing .......................................................... 7 96,007 108,770 114,198 111,622 110,112Durable goods ..................................................... 8 60,843 71,616 75,174 73,921 71,887Nondurable goods ............................................... 9 35,164 37,154 39,024 37,701 38,225
Transportation and public utilities ........................... 10 30,149 33,271 34,961 35,565 36,041Transportation ..................................................... 11 17,142 18,656 19,632 19,951 20,128Communications .................................................. 12 6,425 7,194 7,608 7,821 8,221Electric, gas, and sanitary services ................... 13 6,582 7,421 7,721 7,793 7,692
Wholesale trade ...................................................... 14 22,040 23,903 24,472 23,337 23,850
Retail trade .............................................................. 15 25,228 25,793 25,606 25,979 25,936
Finance, insurance, and real estate ....................... 16 28,324 30,088 31,169 32,060 32,624
Services ................................................................... 17 74,778 82,456 88,531 91,400 90,907
Government ................................................................ 18 51,310 56,016 58,824 58,872 60,054
Rest of the world ........................................................... 19 .............. .............. .............. .............. ..............
By type
Employer contributions to private pension andwelfare funds.
20 346,538 380,145 399,871 401,568 402,237
Pension and profit-sharing .......................................... 21 72,230 83,766 91,821 98,567 94,809Group insurance .......................................................... 22 234,327 254,295 266,998 263,907 270,170
Group health insurance .......................................... 23 228,222 247,564 259,820 256,687 262,738Group life insurance ................................................ 24 6,105 6,731 7,178 7,220 7,432
Workers’ compensation ............................................... 25 39,388 41,624 40,792 38,782 36,951Supplemental unemployment ...................................... 26 593 460 260 312 307
Other 1 .............................................................................. 27 4,777 4,975 5,099 5,268 5,373
Addenda:Benefits paid by private pension and welfare
funds.28 442,552 461,819 480,740 496,098 510,589
Pension and profit-sharing ...................................... 29 160,165 161,351 165,434 176,331 185,658Group health insurance .......................................... 30 236,579 252,467 267,120 272,435 278,884Group life insurance ................................................ 31 11,301 11,841 12,320 12,620 12,872Workers’ compensation ........................................... 32 33,900 35,717 35,647 34,504 32,975Supplemental unemployment .................................. 33 607 443 219 208 200
1. Consists largely of directors’ fees and of judicial fees.NOTE.— Estimates in this table are based on the 1987 Standard Industrial Classification (SIC).

• August
Table 6.12C.—Nonfarm Proprietors’ Income by Industry[Millions of dollars]
Line 1992 1993 1994 1995 1996
Nonfarm proprietors’ income .......................... 1 363,058 392,684 414,958 438,752 455,336
Agricultural services, forestry, and fishing ...................... 2 7,972 7,832 8,103 7,869 8,389
Mining ............................................................................... 3 3,694 4,809 4,471 5,885 5,995
Construction ..................................................................... 4 45,440 49,813 54,111 55,786 57,225
Manufacturing ................................................................... 5 21,841 23,266 27,585 30,802 31,368Durable goods ............................................................. 6 9,386 9,876 11,850 13,398 13,593Nondurable goods ....................................................... 7 12,455 13,390 15,735 17,404 17,775
Transportation and public utilities .................................... 8 25,248 31,760 33,126 35,798 37,288Transportation .............................................................. 9 13,486 14,544 15,200 15,885 16,252Communications .......................................................... 10 5,723 8,340 8,905 10,792 11,615Electric, gas, and sanitary services ............................ 11 6,039 8,876 9,021 9,121 9,421
Wholesale trade ............................................................... 12 13,542 12,685 13,536 14,059 14,280
Retail trade ....................................................................... 13 34,963 37,432 39,483 41,074 41,709
Finance, insurance, and real estate ............................... 14 19,137 33,348 36,981 44,069 44,870
Services ............................................................................ 15 191,221 191,739 197,562 203,410 214,212Hotels and other lodging places ................................. 16 581 1,150 1,445 1,887 1,984Personal services ........................................................ 17 13,151 15,515 15,433 15,308 15,532Business services ........................................................ 18 43,555 40,378 44,313 45,730 50,075Auto repair, services, and parking .............................. 19 8,936 9,380 10,587 10,146 10,505Miscellaneous repair services ..................................... 20 3,887 4,444 4,911 5,343 5,784Motion pictures ............................................................ 21 4,498 4,993 4,145 4,855 4,981Amusement and recreation services .......................... 22 8,044 5,959 5,633 7,191 7,714Health services ............................................................ 23 48,385 49,121 49,959 49,875 51,719Legal services .............................................................. 24 33,164 33,472 32,890 33,603 34,561Other 1 .......................................................................... 25 27,020 27,327 28,246 29,472 31,357
1. Consists of educational services; social services; museums, botanical, zoological gardens; membership organi-zations; engineering and management services, except for commercial research and testing services and for man-agement and public relations; and miscellaneous services, not elsewhere classified.
NOTE.— Estimates in this table are based on the 1987 Standard Industrial Classification (SIC).
Table 6.13C.—Noncorporate Capital Consumption Allowances byIndustry
[Millions of dollars]
Line 1992 1993 1994 1995 1996
Noncorporate capital consumptionallowances.
1 169,899 174,704 183,581 188,642 195,809
Agriculture, forestry, and fishing ...................................... 2 14,982 15,488 15,760 16,854 17,680Farms ........................................................................... 3 13,328 13,462 13,877 14,684 15,445Agricultural services, forestry, and fishing .................. 4 1,654 2,026 2,162 2,304 ..............
Mining ............................................................................... 5 6,251 5,748 5,238 5,268 5,193
Construction ..................................................................... 6 4,154 4,897 5,304 5,272 5,477
Manufacturing ................................................................... 7 5,767 6,046 5,628 6,061 6,328Durable goods ............................................................. 8 2,619 2,795 2,790 3,125 3,295Nondurable goods ....................................................... 9 3,148 3,251 2,838 2,936 3,033
Transportation and public utilities .................................... 10 11,394 14,360 13,366 15,236 15,901Transportation .............................................................. 11 3,802 4,228 4,604 4,764 4,929Communications .......................................................... 12 4,728 6,639 4,731 6,332 6,539Electric, gas, and sanitary services ............................ 13 2,864 3,493 4,032 4,140 4,433
Wholesale trade ............................................................... 14 1,018 1,126 1,705 1,686 1,710
Retail trade ....................................................................... 15 5,849 6,254 7,203 7,404 7,346
Finance, insurance, and real estate ............................... 16 96,269 95,777 103,518 103,991 109,283Finance and insurance ................................................ 17 1,456 1,758 2,004 2,282 2,350Real estate .................................................................. 18 94,813 94,019 101,513 101,709 106,933
Owner-occupied nonfarm housing .......................... 19 40,661 40,032 43,681 45,779 48,379Other ........................................................................ 20 54,152 53,987 57,833 55,930 58,554
Services ............................................................................ 21 24,215 25,009 25,858 26,871 26,890Hotels and other lodging places ................................. 22 4,344 4,223 3,857 4,031 ..............Personal services ........................................................ 23 1,421 1,486 1,627 1,444 ..............Business services ........................................................ 24 6,174 7,151 7,433 7,988 ..............Auto repair, services, and parking .............................. 25 1,727 1,715 2,075 2,288 ..............Miscellaneous repair services ..................................... 26 371 508 589 462 ..............Motion pictures ............................................................ 27 645 832 527 793 ..............Amusement and recreation services .......................... 28 1,929 762 1,143 1,131 ..............Health services ............................................................ 29 3,504 3,787 3,718 3,746 ..............Legal services .............................................................. 30 1,371 1,431 1,467 1,361 ..............Other 1 .......................................................................... 31 2,730 3,115 3,423 3,626 ..............
1. Consists of educational services; social services; museums, botanical, zoological gardens; membership organi-zations; engineering and management services, except for commercial research and testing services and for man-agement and public relations; and services, not elsewhere classified.
NOTE.— Estimates in this table are based on the 1987 Standard Industrial Classification (SIC).
Table 6.14C.—Inventory Valuation Adjustment to Nonfarm Incomes byLegal Form of Organization and Industry
[Millions of dollars]
Line 1992 1993 1994 1995 1996
Inventory valuation adjustment to nonfarmincomes.
1 –8,214 –9,658 –16,680 –24,750 –2,669
Corporate business ....................................................... 2 –7,497 –8,547 –16,065 –24,264 –2,489
Mining ........................................................................... 3 –50 300 –243 –9 –719
Construction ................................................................. 4 –658 –1,670 –1,451 –882 –540
Manufacturing .............................................................. 5 –1,899 –1,848 –7,209 –12,150 1,013Durable goods ......................................................... 6 –1,353 –1,380 –4,125 –4,995 1,518Nondurable goods ................................................... 7 –546 –468 –3,084 –7,155 –505
Transportation and public utilities ............................... 8 –594 252 –52 –102 –812Transportation .......................................................... 9 7 270 –62 –217 –682Communications ...................................................... 10 109 –55 –68 111 154Electric, gas, and sanitary services ........................ 11 –710 37 78 4 –284
Wholesale trade ........................................................... 12 –1,053 –3,035 –3,864 –5,914 508
Retail trade .................................................................. 13 –2,946 –2,354 –2,816 –3,216 –1,732
Other ............................................................................ 14 –297 –192 –430 –1,991 –207
Noncorporate business ................................................. 15 –717 –1,111 –615 –486 –180
Mining ........................................................................... 16 –11 54 –25 –1 –58
Construction ................................................................. 17 –90 –268 –223 –143 –88
Manufacturing .............................................................. 18 –10 –484 210 753 286Durable goods ......................................................... 19 –6 –142 130 276 –101Nondurable goods ................................................... 20 –4 –342 80 477 387
Wholesale trade ........................................................... 21 –31 –80 –111 –214 18
Retail trade .................................................................. 22 –422 –279 –348 –433 –311
Other ............................................................................ 23 –153 –54 –118 –448 –27
NOTE.— Estimates in this table are based on the 1987 Standard Industrial Classification (SIC).
Table 6.15C.—Net Interest by Industry[Millions of dollars]
Line 1992 1993 1994 1995 1996
Net interest ........................................................ 1 414,295 402,521 412,257 425,132 425,069
Domestic industries ....................................................... 2 468,057 455,522 474,978 504,068 516,741
Agriculture, forestry, and fishing ................................. 3 9,300 8,895 9,801 10,071 10,462
Mining ........................................................................... 4 1,816 1,510 1,847 1,754 1,464
Construction ................................................................. 5 719 814 801 367 154
Manufacturing .............................................................. 6 35,606 32,202 35,644 39,556 33,151Durable goods ......................................................... 7 3,262 2,263 2,256 4,135 266Nondurable goods ................................................... 8 32,345 29,939 33,389 35,421 32,886
Transportation and public utilities ............................... 9 42,151 40,766 39,688 42,019 40,752Transportation .......................................................... 10 6,546 6,112 6,072 6,484 6,192Communications ...................................................... 11 12,668 12,348 11,534 12,953 12,121Electric, gas, and sanitary services ........................ 12 22,937 22,305 22,082 22,582 22,439
Wholesale trade ........................................................... 13 6,046 4,519 6,381 8,518 7,096
Retail trade .................................................................. 14 12,253 10,365 10,994 14,392 13,440
Finance, insurance, and real estate ........................... 15 343,454 341,301 354,820 374,374 398,425Finance .................................................................... 16 12,191 23,282 40,062 44,283 62,948Real estate .............................................................. 17 337,831 324,742 324,351 346,196 356,626Other ........................................................................ 18 –6,568 –6,723 –9,593 –16,105 –21,148
Services ....................................................................... 19 16,712 15,149 15,002 13,018 11,798
Rest of the world ........................................................... 20 –53,762 –53,001 –62,720 –78,937 –91,672
Receipts from the rest of the world ............................ 21 68,746 66,383 78,376 101,262 100,292Less: Payments to the rest of the world .................... 22 122,508 119,384 141,096 180,199 191,964
NOTE.— Estimates in this table are based on the 1987 Standard Industrial Classification (SIC).

August •
Table 6.16C.—Corporate Profits by Industry[Billions of dollars]
Line 1992 1993 1994 1995 1996
Seasonally adjusted at annual rates
1992 1993 1994
IV I II III IV I II
Corporate profits with inventory valuation and capital consumption adjustments 1 428.0 492.8 570.5 650.0 735.9 454.6 459.2 478.2 492.8 541.2 512.0 562.0
Domestic industries ..................................................................................................................... 2 363.1 419.0 497.1 563.2 640.0 395.3 379.6 408.3 415.7 472.3 440.0 489.7
Financial ..................................................................................................................................... 3 67.5 72.5 60.0 88.7 94.2 67.1 63.6 73.9 70.1 82.4 34.7 62.8Nonfinancial ................................................................................................................................ 4 295.6 346.4 437.1 474.6 545.8 328.2 316.0 334.4 345.5 389.9 405.4 427.0
Rest of the world ......................................................................................................................... 5 64.9 73.9 73.4 86.7 95.9 59.3 79.5 69.9 77.1 68.9 71.9 72.3
Receipts from the rest of the world .......................................................................................... 6 68.0 83.3 96.8 120.2 132.7 63.1 80.6 81.8 85.0 85.6 89.0 91.9Less: Payments to the rest of the world .................................................................................. 7 3.1 9.4 23.5 33.5 36.7 3.8 1.1 11.9 7.9 16.7 17.1 19.6
Corporate profits with inventory valuation adjustment ................................................. 8 398.9 456.9 519.1 598.4 674.1 420.5 419.2 444.4 459.8 504.1 470.8 510.2
Domestic industries ..................................................................................................................... 9 334.0 383.0 445.7 511.7 578.2 361.2 339.7 374.5 382.7 435.2 398.9 437.9Financial ..................................................................................................................................... 10 83.7 82.9 69.4 97.6 103.5 83.1 76.6 84.7 79.4 91.0 44.1 72.3
Federal Reserve banks ......................................................................................................... 11 17.8 16.1 17.8 22.2 22.0 16.7 16.4 16.0 16.0 15.9 16.1 16.8Other ...................................................................................................................................... 12 65.9 66.8 51.7 75.4 81.5 66.4 60.2 68.6 63.4 75.0 28.1 55.5
Nonfinancial ................................................................................................................................ 13 250.3 300.1 376.3 414.1 474.7 278.1 263.1 289.8 303.3 344.2 354.7 365.6Manufacturing ........................................................................................................................ 14 96.3 116.7 151.6 181.3 205.5 105.1 95.8 115.1 113.8 142.2 149.7 138.8
Durable goods ................................................................................................................... 15 37.1 54.5 76.7 85.2 99.0 42.6 39.1 52.9 55.9 70.3 77.0 73.7Primary metal industries ............................................................................................... 16 –.1 .3 2.2 6.5 5.6 –.8 –1.9 1.2 –.3 2.1 2.2 1.7Fabricated metal products ............................................................................................ 17 6.5 7.4 11.0 12.4 17.1 6.4 5.4 7.3 7.6 9.1 10.6 10.0Industrial machinery and equipment ............................................................................ 18 5.6 7.5 12.7 22.0 25.8 6.4 4.2 8.1 9.3 8.4 9.8 12.5Electronic and other electric equipment ...................................................................... 19 10.0 15.3 22.5 19.2 23.9 11.8 13.8 12.4 16.8 18.3 20.1 20.8Motor vehicles and equipment ..................................................................................... 20 –1.1 5.5 7.5 –.2 –3.2 .4 –.3 4.7 4.7 12.9 14.1 8.8Other ............................................................................................................................. 21 16.2 18.6 20.9 25.3 29.8 18.4 18.0 19.2 17.8 19.4 20.1 20.0
Nondurable goods ............................................................................................................. 22 59.1 62.2 74.8 96.0 106.5 62.4 56.7 62.2 57.9 71.9 72.7 65.1Food and kindred products .......................................................................................... 23 18.3 16.5 20.0 27.1 28.5 17.2 18.1 15.9 16.4 15.6 19.3 18.5Chemicals and allied products ..................................................................................... 24 16.5 17.4 24.5 30.3 31.2 17.3 18.3 15.2 15.2 20.9 22.6 23.7Petroleum and coal products ....................................................................................... 25 –1.6 2.3 .1 6.0 10.0 .4 –6.1 2.7 3.8 8.8 0 –9.2Other ............................................................................................................................. 26 26.0 26.0 30.2 32.6 36.8 27.6 26.4 28.3 22.5 26.6 30.8 32.1
Transportation and public utilities ......................................................................................... 27 57.8 69.4 83.1 86.4 91.7 58.3 65.5 68.2 70.0 73.8 74.0 82.3Transportation ................................................................................................................... 28 2.3 7.0 10.3 11.4 11.7 2.7 5.2 6.5 7.5 8.6 7.5 9.3Communications ................................................................................................................ 29 27.9 33.0 36.8 33.6 36.0 28.6 30.1 34.0 33.5 34.3 35.5 37.2Electric, gas, and sanitary services ................................................................................. 30 27.6 29.4 36.0 41.4 44.0 27.0 30.2 27.8 28.9 30.9 31.1 35.8
Wholesale trade ..................................................................................................................... 31 23.0 24.3 29.4 26.9 38.3 28.3 20.5 26.3 24.8 25.4 28.1 33.8Retail trade ............................................................................................................................ 32 32.2 38.9 46.0 41.9 48.9 37.3 34.7 36.6 41.4 42.7 41.6 47.4Other ...................................................................................................................................... 33 41.0 50.9 66.2 77.6 90.3 49.3 46.5 43.6 53.3 60.2 61.3 63.2
Rest of the world ......................................................................................................................... 34 64.9 73.9 73.4 86.7 95.9 59.3 79.5 69.9 77.1 68.9 71.9 72.3
Line
Seasonally adjusted at annual rates
1994 1995 1996 1997
III IV I II III IV I II III IV I II
Corporate profits with inventory valuation and capital consumption adjustments 1 590.1 617.7 613.2 628.0 672.8 685.7 717.7 738.5 739.6 747.8 779.6 ...............
Domestic industries ..................................................................................................................... 2 515.9 542.6 529.7 537.6 592.4 593.2 626.6 645.2 647.8 640.3 682.2 ...............
Financial ..................................................................................................................................... 3 71.8 70.6 80.8 87.3 98.1 88.4 101.2 102.4 94.6 78.5 106.8 ...............Nonfinancial ................................................................................................................................ 4 444.1 472.0 449.0 450.3 494.3 504.8 525.4 542.8 553.3 561.7 575.4 ...............
Rest of the world ......................................................................................................................... 5 74.2 75.0 83.5 90.4 80.4 92.4 91.1 93.3 91.8 107.5 97.4 ...............
Receipts from the rest of the world .......................................................................................... 6 101.0 105.4 114.8 122.9 119.1 123.9 125.7 128.9 133.4 142.6 139.9 ...............Less: Payments to the rest of the world .................................................................................. 7 26.8 30.3 31.3 32.4 38.6 31.5 34.6 35.7 41.6 35.0 42.5 ...............
Corporate profits with inventory valuation adjustment ................................................. 8 535.0 560.3 560.4 577.2 621.4 634.5 659.8 676.8 676.4 683.4 711.9 ...............
Domestic industries ..................................................................................................................... 9 460.7 485.2 476.9 486.8 540.9 542.1 568.7 583.5 584.6 575.8 614.5 ...............Financial ..................................................................................................................................... 10 81.3 80.0 89.5 96.3 107.1 97.4 110.4 111.5 104.0 88.1 116.5 ...............
Federal Reserve banks ......................................................................................................... 11 18.2 20.0 21.6 22.5 22.4 22.1 21.8 21.9 22.0 22.3 22.8 ...............Other ...................................................................................................................................... 12 63.1 60.0 67.9 73.8 84.7 75.2 88.6 89.6 82.0 65.8 93.7 ...............
Nonfinancial ................................................................................................................................ 13 379.5 405.3 387.3 390.4 433.8 444.7 458.3 472.0 480.7 487.8 498.0 ...............Manufacturing ........................................................................................................................ 14 151.6 166.2 161.9 170.3 194.5 198.4 197.1 204.8 210.5 209.7 208.2 ...............
Durable goods ................................................................................................................... 15 73.3 83.0 81.1 78.6 88.3 93.0 94.5 98.9 102.9 99.7 101.3 ...............Primary metal industries ............................................................................................... 16 2.3 2.6 4.5 7.6 6.6 7.4 5.9 4.4 7.0 5.1 3.9 ...............Fabricated metal products ............................................................................................ 17 10.8 12.7 11.2 12.6 12.4 13.4 16.2 16.2 18.0 18.1 17.4 ...............Industrial machinery and equipment ............................................................................ 18 12.2 16.3 19.7 19.8 23.0 25.5 27.0 25.9 25.6 24.6 24.0 ...............Electronic and other electric equipment ...................................................................... 19 23.6 25.5 20.1 16.9 19.8 20.0 19.0 21.7 25.2 29.6 31.4 ...............Motor vehicles and equipment ..................................................................................... 20 3.7 3.3 2.5 –1.9 .1 –1.4 –2.7 –.1 –1.5 –8.3 –1.3 ...............Other ............................................................................................................................. 21 20.7 22.7 23.1 23.7 26.4 28.2 29.2 30.8 28.6 30.6 25.9 ...............
Nondurable goods ............................................................................................................. 22 78.3 83.2 80.8 91.7 106.2 105.4 102.7 105.8 107.7 109.9 106.9 ...............Food and kindred products .......................................................................................... 23 19.7 22.5 25.4 27.4 27.5 28.2 27.3 23.8 28.8 34.2 28.0 ...............Chemicals and allied products ..................................................................................... 24 24.0 27.8 25.7 30.0 33.2 32.1 31.8 32.4 31.5 28.9 28.8 ...............Petroleum and coal products ....................................................................................... 25 4.7 5.0 –.9 5.2 12.7 7.1 5.2 12.8 10.0 11.9 12.4 ...............Other ............................................................................................................................. 26 29.9 27.9 30.6 29.1 32.8 37.9 38.3 36.9 37.3 34.9 37.7 ...............
Transportation and public utilities ......................................................................................... 27 85.1 90.8 85.5 85.2 88.8 86.0 88.9 96.0 91.2 90.5 91.5 ...............Transportation ................................................................................................................... 28 10.9 13.7 11.5 11.8 11.4 11.0 9.6 12.5 13.0 11.4 14.9 ...............Communications ................................................................................................................ 29 35.7 38.6 34.4 33.0 34.9 31.9 34.4 37.3 37.6 34.8 33.8 ...............Electric, gas, and sanitary services ................................................................................. 30 38.5 38.6 39.5 40.4 42.5 43.1 44.9 46.2 40.6 44.3 42.8 ...............
Wholesale trade ..................................................................................................................... 31 27.3 28.6 25.5 20.3 28.5 33.2 37.2 30.8 37.7 47.4 49.0 ...............Retail trade ............................................................................................................................ 32 47.2 47.8 41.0 42.3 42.2 42.1 46.0 50.6 50.6 48.3 55.1 ...............Other ...................................................................................................................................... 33 68.3 71.8 73.5 72.3 79.7 85.0 89.1 89.7 90.6 91.9 94.2 ...............
Rest of the world ......................................................................................................................... 34 74.2 75.0 83.5 90.4 80.4 92.4 91.1 93.3 91.8 107.5 97.4 ...............
NOTE.— Estimates in this table are based on the 1987 Standard Industrial Classification.

• August
Table 6.17C.—Corporate Profits Before Tax by Industry[Millions of dollars]
Line 1992 1993 1994 1995 1996
Corporate profits before tax ........................... 1 406,415 465,429 535,133 622,625 676,576
Domestic industries ....................................................... 2 341,518 391,560 461,754 535,918 580,659
Agriculture, forestry, and fishing ............................ 3 1,947 1,909 1,384 1,852 2,038Farms ....................................................................... 4 1,226 1,207 400 .............. ..............Agricultural services, forestry, and fishing ............. 5 721 702 984 .............. ..............
Mining .......................................................................... 6 2,382 1,689 3,416 4,492 6,508Metal mining ............................................................ 7 91 –323 623 .............. ..............Coal mining ............................................................. 8 619 84 570 .............. ..............Oil and gas extraction ............................................. 9 1,026 1,645 1,257 .............. ..............Nonmetallic minerals, except fuels ......................... 10 646 283 966 .............. ..............
Construction ............................................................... 11 8,075 10,272 13,756 17,789 19,151
Manufacturing ............................................................ 12 98,168 118,554 158,788 193,432 204,520
Durable goods ......................................................... 13 38,474 55,920 80,874 90,241 97,490Lumber and wood products ............................... 14 3,326 4,491 4,862 .............. ..............Furniture and fixtures ......................................... 15 1,437 1,995 2,046 .............. ..............Stone, clay, and glass products ......................... 16 1,657 1,836 3,914 .............. ..............Primary metal industries ..................................... 17 –175 162 3,510 .............. ..............Fabricated metal products .................................. 18 6,224 7,518 11,714 .............. ..............Industrial machinery and equipment .................. 19 4,957 6,758 12,609 .............. ..............Electronic and other electric equipment ............ 20 9,704 15,430 22,688 .............. ..............Motor vehicles and equipment ........................... 21 –1,104 5,648 7,716 .............. ..............Other transportation equipment .......................... 22 5,555 5,649 3,987 .............. ..............Instruments and related products ...................... 23 3,803 2,951 3,905 .............. ..............Miscellaneous manufacturing industries ............ 24 3,090 3,482 3,923 .............. ..............
Nondurable goods ................................................... 25 59,694 62,634 77,914 103,191 107,030Food and kindred products ................................ 26 18,237 17,445 20,353 .............. ..............Tobacco products ............................................... 27 2,613 1,894 1,869 .............. ..............Textile mill products ............................................ 28 3,144 2,740 2,457 .............. ..............Apparel and other textile products ..................... 29 3,150 3,025 3,148 .............. ..............Paper and allied products .................................. 30 3,908 4,394 6,712 .............. ..............Printing and publishing ....................................... 31 10,422 10,550 13,269 .............. ..............Chemicals and allied products ........................... 32 16,639 17,620 25,431 .............. ..............Petroleum and coal products ............................. 33 –1,780 1,221 299 .............. ..............Rubber and miscellaneous plastics products .... 34 2,702 3,332 4,288 .............. ..............Leather and leather products ............................. 35 659 413 88 .............. ..............
Transportation and public utilities .......................... 36 58,385 69,108 83,138 86,477 92,475
Transportation .......................................................... 37 2,251 6,690 10,408 11,632 12,332Railroad transportation ........................................ 38 1,049 1,176 2,948 .............. ..............Local and interurban passenger transit ............. 39 321 226 320 .............. ..............Trucking and warehousing ................................. 40 4,522 5,202 5,162 .............. ..............Water transportation ........................................... 41 281 447 378 .............. ..............Transportation by air .......................................... 42 –5,326 –2,025 66 .............. ..............Pipelines, except natural gas ............................. 43 653 687 654 .............. ..............Transportation services ....................................... 44 751 977 880 .............. ..............
Communications ...................................................... 45 27,801 33,028 36,821 33,448 35,859Telephone and telegraph ................................... 46 25,367 28,990 31,839 .............. ..............Radio and television ........................................... 47 2,434 4,038 4,982 .............. ..............
Electric, gas, and sanitary services ........................ 48 28,333 29,390 35,909 41,397 44,284
Wholesale trade ......................................................... 49 24,085 27,315 33,311 32,797 37,783
Retail trade ................................................................. 50 35,130 41,229 48,803 45,114 50,603
Finance, insurance, and real estate ........................ 51 82,260 84,120 72,341 101,771 108,550
Depository institutions ............................................. 52 92,620 85,677 81,012 .............. ..............Federal Reserve banks ...................................... 53 17,797 16,095 17,764 .............. ..............Commercial and mutual depository institutions 54 74,823 69,582 63,248 .............. ..............
Nondepository institutions ....................................... 55 14,037 15,424 15,418 .............. ..............Security and commodity brokers ............................ 56 675 4,595 10,579 .............. ..............Insurance carriers .................................................... 57 –13,785 –7,898 –7,668 .............. ..............Insurance agents, brokers, and service ................. 58 2,950 3,109 3,862 .............. ..............Real estate .............................................................. 59 –4,131 –2,011 –776 .............. ..............Holding and other investment offices ..................... 60 –10,106 –14,776 –30,086 .............. ..............
Services ...................................................................... 61 31,086 37,364 46,817 52,194 59,031Hotels and other lodging places ............................. 62 –285 721 1,323 .............. ..............Personal services .................................................... 63 1,671 1,854 2,231 .............. ..............Business services .................................................... 64 10,637 12,605 14,431 .............. ..............Auto repair, services, and parking ......................... 65 –24 753 491 .............. ..............Miscellaneous repair services ................................. 66 781 870 908 .............. ..............Motion pictures ........................................................ 67 1,644 1,695 1,532 .............. ..............Amusement and recreation services ...................... 68 2,860 2,765 2,955 .............. ..............Other services ......................................................... 69 13,802 16,101 22,946 .............. ..............
Health services ................................................... 70 9,032 10,766 14,948 .............. ..............Legal services ..................................................... 71 1,180 1,223 2,217 .............. ..............Educational services ........................................... 72 582 474 687 .............. ..............Other 1 ................................................................. 73 3,008 3,638 5,094 .............. ..............
Rest of the world 2 ......................................................... 74 64,897 73,869 73,379 86,707 95,917
Receipts from the rest of the world ............................ 75 68,011 83,267 96,842 120,174 132,653Less: Payments to the rest of the world .................... 76 3,114 9,398 23,463 33,467 36,736
1. Consists of social services; membership organizations; engineering and management services, except for com-mercial research and testing services and for management and public relations; and services, not elsewhere classi-fied.
2. Consists of receipts by all U.S. residents, including both corporations and persons, of dividends from theirincorporated foreign affiliates, their share of reinvested earnings of their incorporated foreign affiliates, and earningsof unincorporated foreign affiliates, net of corresponding payments.
NOTE.— Estimates in this table are based on the 1987 Standard Industrial Classification (SIC).
Table 6.18C.—Federal, State, and Local Corporate Profits Tax Liability byIndustry
[Millions of dollars]
Line 1992 1993 1994 1995 1996
Corporate profits tax liability .......................... 1 143,024 165,187 186,644 213,224 229,017
Domestic industries ....................................................... 2 143,024 165,187 186,644 213,224 229,017
Agriculture, forestry, and fishing ............................ 3 602 711 703 750 819Farms ....................................................................... 4 447 510 486 .............. ..............Agricultural services, forestry, and fishing ............. 5 155 201 217 .............. ..............
Mining .......................................................................... 6 1,122 854 907 1,419 2,142Metal mining ............................................................ 7 187 195 280 .............. ..............Coal mining ............................................................. 8 281 117 171 .............. ..............Oil and gas extraction ............................................. 9 468 380 242 .............. ..............Nonmetallic minerals, except fuels ......................... 10 186 162 214 .............. ..............
Construction ............................................................... 11 1,648 1,887 2,309 2,904 3,360
Manufacturing ............................................................ 12 41,124 47,327 60,796 66,289 72,705
Durable goods ......................................................... 13 15,873 22,131 29,597 30,779 33,935Lumber and wood products ............................... 14 844 1,124 1,312 .............. ..............Furniture and fixtures ......................................... 15 468 539 626 .............. ..............Stone, clay, and glass products ......................... 16 596 658 1,137 .............. ..............Primary metal industries ..................................... 17 676 814 1,471 .............. ..............Fabricated metal products .................................. 18 1,760 2,075 3,029 .............. ..............Industrial machinery and equipment .................. 19 2,067 2,426 3,772 .............. ..............Electronic and other electric equipment ............ 20 4,145 6,275 8,682 .............. ..............Motor vehicles and equipment ........................... 21 1,002 2,452 3,316 .............. ..............Other transportation equipment .......................... 22 1,957 2,577 1,779 .............. ..............Instruments and related products ...................... 23 1,493 1,797 3,206 .............. ..............Miscellaneous manufacturing industries ............ 24 865 1,394 1,267 .............. ..............
Nondurable goods ................................................... 25 25,251 25,196 31,199 35,510 38,770Food and kindred products ................................ 26 6,492 6,162 7,446 .............. ..............Tobacco products ............................................... 27 1,034 766 978 .............. ..............Textile mill products ............................................ 28 879 807 771 .............. ..............Apparel and other textile products ..................... 29 843 869 944 .............. ..............Paper and allied products .................................. 30 1,608 1,681 2,427 .............. ..............Printing and publishing ....................................... 31 3,050 3,215 3,979 .............. ..............Chemicals and allied products ........................... 32 7,377 7,185 10,474 .............. ..............Petroleum and coal products ............................. 33 3,048 3,454 3,003 .............. ..............Rubber and miscellaneous plastics products .... 34 741 907 1,052 .............. ..............Leather and leather products ............................. 35 179 150 125 .............. ..............
Transportation and public utilities .......................... 36 21,337 24,238 28,319 31,792 34,564
Transportation .......................................................... 37 2,856 3,464 4,186 4,394 4,946Railroad transportation ........................................ 38 731 733 1,163 .............. ..............Local and interurban passenger transit ............. 39 72 72 82 .............. ..............Trucking and warehousing ................................. 40 1,212 1,461 1,440 .............. ..............Water transportation ........................................... 41 219 235 249 .............. ..............Transportation by air .......................................... 42 128 431 709 .............. ..............Pipelines, except natural gas ............................. 43 254 269 260 .............. ..............Transportation services ....................................... 44 240 263 283 .............. ..............
Communications ...................................................... 45 8,711 10,488 12,063 12,688 13,867Telephone and telegraph ................................... 46 7,865 9,123 10,239 .............. ..............Radio and television ........................................... 47 846 1,365 1,824 .............. ..............
Electric, gas, and sanitary services ........................ 48 9,770 10,286 12,070 14,710 15,751
Wholesale trade ......................................................... 49 6,562 7,742 8,826 9,616 11,249
Retail trade ................................................................. 50 9,834 11,339 13,364 12,511 13,891
Finance, insurance, and real estate ........................ 51 54,404 63,103 60,834 77,459 77,883
Depository institutions ............................................. 52 33,853 35,932 39,504 .............. ..............Federal Reserve banks ...................................... 53 16,774 15,987 20,470 .............. ..............Commercial and mutual depository institutions 54 17,079 19,945 19,034 .............. ..............
Nondepository institutions ....................................... 55 3,128 4,040 4,325 .............. ..............Security and commodity brokers ............................ 56 1,998 3,703 2,858 .............. ..............Insurance carriers .................................................... 57 12,904 16,481 11,168 .............. ..............Insurance agents, brokers, and service ................. 58 553 562 807 .............. ..............Real estate .............................................................. 59 957 1,135 999 .............. ..............Holding and other investment offices ..................... 60 1,011 1,250 1,173 .............. ..............
Services ...................................................................... 61 6,391 7,986 10,586 10,484 12,404Hotels and other lodging places ............................. 62 301 431 656 .............. ..............Personal services .................................................... 63 405 434 454 .............. ..............Business services .................................................... 64 2,307 2,737 3,199 .............. ..............Auto repair, services, and parking ......................... 65 266 362 352 .............. ..............Miscellaneous repair services ................................. 66 131 113 120 .............. ..............Motion pictures ........................................................ 67 156 180 232 .............. ..............Amusement and recreation services ...................... 68 513 570 629 .............. ..............Other services ......................................................... 69 2,312 3,159 4,944 .............. ..............
Health services ................................................... 70 1,573 2,249 3,766 .............. ..............Legal services ..................................................... 71 33 49 197 .............. ..............Educational services ........................................... 72 75 81 80 .............. ..............Other 1 ................................................................. 73 631 780 901 .............. ..............
Rest of the world ........................................................... 74 0 0 0 0 0
1. Consists of social services; membership organizations; engineering and management services, except for com-mercial research and testing services and for management and public relations; and services, not elsewhere classi-fied.
NOTE.— Estimates in this table are based on the 1987 Standard Industrial Classification (SIC).

August •
Table 6.19C.—Corporate Profits After Tax by Industry[Millions of dollars]
Line 1992 1993 1994 1995 1996
Corporate profits after tax ............................... 1 263,391 300,242 348,489 409,401 447,559
Domestic industries ....................................................... 2 198,494 226,373 275,110 322,694 351,642
Agriculture, forestry, and fishing ............................ 3 1,345 1,198 681 1,102 1,219Farms ....................................................................... 4 779 697 –86 .............. ..............Agricultural services, forestry, and fishing ............. 5 566 501 767 .............. ..............
Mining .......................................................................... 6 1,260 835 2,509 3,073 4,366Metal mining ............................................................ 7 –96 –518 343 .............. ..............Coal mining ............................................................. 8 338 –33 399 .............. ..............Oil and gas extraction ............................................. 9 558 1,265 1,015 .............. ..............Nonmetallic minerals, except fuels ......................... 10 460 121 752 .............. ..............
Construction ............................................................... 11 6,427 8,385 11,447 14,885 15,791
Manufacturing ............................................................ 12 57,044 71,227 97,992 127,143 131,815
Durable goods ......................................................... 13 22,601 33,789 51,277 59,462 63,555Lumber and wood products ............................... 14 2,482 3,367 3,550 .............. ..............Furniture and fixtures ......................................... 15 969 1,456 1,420 .............. ..............Stone, clay, and glass products ......................... 16 1,061 1,178 2,777 .............. ..............Primary metal industries ..................................... 17 –851 –652 2,039 .............. ..............Fabricated metal products .................................. 18 4,464 5,443 8,685 .............. ..............Industrial machinery and equipment .................. 19 2,890 4,332 8,837 .............. ..............Electronic and other electric equipment ............ 20 5,559 9,155 14,006 .............. ..............Motor vehicles and equipment ........................... 21 –2,106 3,196 4,400 .............. ..............Other transportation equipment .......................... 22 3,598 3,072 2,208 .............. ..............Instruments and related products ...................... 23 2,310 1,154 699 .............. ..............Miscellaneous manufacturing industries ............ 24 2,225 2,088 2,656 .............. ..............
Nondurable goods ................................................... 25 34,443 37,438 46,715 67,681 68,260Food and kindred products ................................ 26 11,745 11,283 12,907 .............. ..............Tobacco products ............................................... 27 1,579 1,128 891 .............. ..............Textile mill products ............................................ 28 2,265 1,933 1,686 .............. ..............Apparel and other textile products ..................... 29 2,307 2,156 2,204 .............. ..............Paper and allied products .................................. 30 2,300 2,713 4,285 .............. ..............Printing and publishing ....................................... 31 7,372 7,335 9,290 .............. ..............Chemicals and allied products ........................... 32 9,262 10,435 14,957 .............. ..............Petroleum and coal products ............................. 33 –4,828 –2,233 –2,704 .............. ..............Rubber and miscellaneous plastics products .... 34 1,961 2,425 3,236 .............. ..............Leather and leather products ............................. 35 480 263 –37 .............. ..............
Transportation and public utilities .......................... 36 37,048 44,870 54,819 54,685 57,911
Transportation .......................................................... 37 –605 3,226 6,222 7,238 7,386Railroad transportation ........................................ 38 318 443 1,785 .............. ..............Local and interurban passenger transit ............. 39 249 154 238 .............. ..............Trucking and warehousing ................................. 40 3,310 3,741 3,722 .............. ..............Water transportation ........................................... 41 62 212 129 .............. ..............Transportation by air .......................................... 42 –5,454 –2,456 –643 .............. ..............Pipelines, except natural gas ............................. 43 399 418 394 .............. ..............Transportation services ....................................... 44 511 714 597 .............. ..............
Communications ...................................................... 45 19,090 22,540 24,758 20,760 21,992Telephone and telegraph ................................... 46 17,502 19,867 21,600 .............. ..............Radio and television ........................................... 47 1,588 2,673 3,158 .............. ..............
Electric, gas, and sanitary services ........................ 48 18,563 19,104 23,839 26,687 28,533
Wholesale trade ......................................................... 49 17,523 19,573 24,485 23,181 26,534
Retail trade ................................................................. 50 25,296 29,890 35,439 32,603 36,712
Finance, insurance, and real estate ........................ 51 27,856 21,017 11,507 24,312 30,667
Depository institutions ............................................. 52 58,767 49,745 41,508 .............. ..............Federal Reserve banks ...................................... 53 1,023 108 –2,706 .............. ..............Commercial and mutual depository institutions 54 57,744 49,637 44,214 .............. ..............
Nondepository institutions ....................................... 55 10,909 11,384 11,093 .............. ..............Security and commodity brokers ............................ 56 –1,323 892 7,721 .............. ..............Insurance carriers .................................................... 57 –26,689 –24,379 –18,836 .............. ..............Insurance agents, brokers, and service ................. 58 2,397 2,547 3,055 .............. ..............Real estate .............................................................. 59 –5,088 –3,146 –1,775 .............. ..............Holding and other investment offices ..................... 60 –11,117 –16,026 –31,259 .............. ..............
Services ...................................................................... 61 24,695 29,378 36,231 41,710 46,627Hotels and other lodging places ............................. 62 –586 290 667 .............. ..............Personal services .................................................... 63 1,266 1,420 1,777 .............. ..............Business services .................................................... 64 8,330 9,868 11,232 .............. ..............Auto repair, services, and parking ......................... 65 –290 391 139 .............. ..............Miscellaneous repair services ................................. 66 650 757 788 .............. ..............Motion pictures ........................................................ 67 1,488 1,515 1,300 .............. ..............Amusement and recreation services ...................... 68 2,347 2,195 2,326 .............. ..............Other services ......................................................... 69 11,490 12,942 18,002 .............. ..............
Health services ................................................... 70 7,459 8,517 11,182 .............. ..............Legal services ..................................................... 71 1,147 1,174 2,020 .............. ..............Educational services ........................................... 72 507 393 607 .............. ..............Other 1 ................................................................. 73 2,377 2,858 4,193 .............. ..............
Rest of the world 2 ......................................................... 74 64,897 73,869 73,379 86,707 95,917
Receipts from the rest of the world ............................ 75 68,011 83,267 96,842 120,174 132,653Less: Payments to the rest of the world .................... 76 3,114 9,398 23,463 33,467 36,736
1. Consists of social services; membership organizations; engineering and management services, except for com-mercial research and testing services and for management and public relations; and services, not elsewhere classi-fied.
2. Consists of receipts by all U.S. residents, including both corporations and persons, of dividends from theirincorporated foreign affiliates, their share of reinvested earnings of their incorporated foreign affiliates, and earningsof unincorporated foreign affiliates, net of corresponding payments.
NOTE.— Estimates in this table are based on the 1987 Standard Industrial Classification (SIC).
Table 6.20C.—Net Corporate Dividend Payments by Industry[Millions of dollars]
Line 1992 1993 1994 1995 1996
Net corporate dividends .................................. 1 169,488 195,768 216,222 264,363 304,800
Domestic industries ....................................................... 2 146,046 174,938 184,420 236,923 270,847
Agriculture, forestry, and fishing ............................ 3 1,397 1,169 1,577 2,005 2,155Farms ....................................................................... 4 1,162 750 976 .............. ..............Agricultural services, forestry, and fishing ............. 5 235 419 601 .............. ..............
Mining .......................................................................... 6 2,168 2,890 2,821 3,840 4,112Metal mining ............................................................ 7 345 139 424 .............. ..............Coal mining ............................................................. 8 249 246 364 .............. ..............Oil and gas extraction ............................................. 9 1,295 2,052 1,804 .............. ..............Nonmetallic minerals, except fuels ......................... 10 279 453 229 .............. ..............
Construction ............................................................... 11 3,926 4,611 5,257 6,628 7,619
Manufacturing ............................................................ 12 55,373 58,614 56,352 73,075 75,888
Durable goods ......................................................... 13 16,451 17,966 17,687 27,655 30,335Lumber and wood products ............................... 14 1,092 1,069 1,445 .............. ..............Furniture and fixtures ......................................... 15 292 518 497 .............. ..............Stone, clay, and glass products ......................... 16 1,091 667 933 .............. ..............Primary metal industries ..................................... 17 2,137 1,145 1,436 .............. ..............Fabricated metal products .................................. 18 1,656 1,720 2,659 .............. ..............Industrial machinery and equipment .................. 19 1,505 2,730 2,790 .............. ..............Electronic and other electric equipment ............ 20 4,374 3,860 4,021 .............. ..............Motor vehicles and equipment ........................... 21 2,568 2,321 1,745 .............. ..............Other transportation equipment .......................... 22 –97 1,670 422 .............. ..............Instruments and related products ...................... 23 1,178 1,869 916 .............. ..............Miscellaneous manufacturing industries ............ 24 655 397 823 .............. ..............
Nondurable goods ................................................... 25 38,922 40,648 38,665 45,420 45,553Food and kindred products ................................ 26 7,439 8,840 8,922 .............. ..............Tobacco products ............................................... 27 1,131 –343 –361 .............. ..............Textile mill products ............................................ 28 691 1,031 811 .............. ..............Apparel and other textile products ..................... 29 1,414 991 849 .............. ..............Paper and allied products .................................. 30 2,583 2,161 2,377 .............. ..............Printing and publishing ....................................... 31 4,376 3,617 3,743 .............. ..............Chemicals and allied products ........................... 32 13,716 14,920 13,116 .............. ..............Petroleum and coal products ............................. 33 6,603 8,365 7,339 .............. ..............Rubber and miscellaneous plastics products .... 34 782 904 1,718 .............. ..............Leather and leather products ............................. 35 187 162 151 .............. ..............
Transportation and public utilities .......................... 36 36,723 39,584 41,440 43,816 44,893
Transportation .......................................................... 37 4,131 4,283 4,408 4,517 4,659Railroad transportation ........................................ 38 1,688 1,865 1,241 .............. ..............Local and interurban passenger transit ............. 39 133 80 132 .............. ..............Trucking and warehousing ................................. 40 1,086 1,075 1,466 .............. ..............Water transportation ........................................... 41 223 279 370 .............. ..............Transportation by air .......................................... 42 324 244 305 .............. ..............Pipelines, except natural gas ............................. 43 345 359 324 .............. ..............Transportation services ....................................... 44 332 381 570 .............. ..............
Communications ...................................................... 45 13,812 15,199 18,153 18,842 19,356Telephone and telegraph ................................... 46 12,782 15,148 17,223 .............. ..............Radio and television ........................................... 47 1,030 51 930 .............. ..............
Electric, gas, and sanitary services ........................ 48 18,780 20,102 18,879 20,457 20,878
Wholesale trade ......................................................... 49 7,454 9,641 11,318 12,867 13,711
Retail trade ................................................................. 50 11,625 12,571 15,193 16,418 16,450
Finance, insurance, and real estate ........................ 51 16,031 32,562 32,879 57,600 84,273
Depository institutions ............................................. 52 14,189 16,544 19,097 .............. ..............Federal Reserve banks ...................................... 53 172 195 212 .............. ..............Commercial and mutual depository institutions 54 14,017 16,349 18,885 .............. ..............
Nondepository institutions ....................................... 55 1,785 2,165 2,991 .............. ..............Security and commodity brokers ............................ 56 1,467 1,956 2,338 .............. ..............Insurance carriers .................................................... 57 –14,775 –13,563 –15,342 .............. ..............Insurance agents, brokers, and service ................. 58 1,684 1,582 2,339 .............. ..............Real estate .............................................................. 59 4,260 5,202 5,909 .............. ..............Holding and other investment offices ..................... 60 7,421 18,676 15,547 .............. ..............
Services ...................................................................... 61 11,349 13,296 17,583 20,674 21,746Hotels and other lodging places ............................. 62 481 586 1,090 .............. ..............Personal services .................................................... 63 491 602 732 .............. ..............Business services .................................................... 64 4,013 4,807 6,337 .............. ..............Auto repair, services, and parking ......................... 65 376 528 524 .............. ..............Miscellaneous repair services ................................. 66 260 304 241 .............. ..............Motion pictures ........................................................ 67 154 –449 123 .............. ..............Amusement and recreation services ...................... 68 1,184 1,517 1,501 .............. ..............Other services ......................................................... 69 4,390 5,401 7,035 .............. ..............
Health services ................................................... 70 2,503 2,818 3,557 .............. ..............Legal services ..................................................... 71 255 407 522 .............. ..............Educational services ........................................... 72 228 174 198 .............. ..............Other 1 ................................................................. 73 1,404 2,002 2,758 .............. ..............
Rest of the world ........................................................... 74 23,442 20,830 31,802 27,440 33,953
Receipts from the rest of the world 2 ......................... 75 39,751 39,467 52,536 50,887 58,305Less: Payments to the rest of the world 3 ................. 76 16,309 18,637 20,734 23,447 24,352
1. Consists of social services; membership organizations; engineering and management services, except for com-mercial research and testing services and for management and public relations; and services, not elsewhere classi-fied.
2. Consists of receipts by all U.S. residents of dividends paid by their incorporated foreign affiliates and remittedearnings of their unincorporated foreign affiliates.
3. Consists of payments by incorporated U.S. affiliates of dividends paid to foreign residents and earnings ofunincorporated U.S. affiliates remitted to foreign residents.
NOTE.— Estimates in this table are based on the 1987 Standard Industrial Classification (SIC).

• August
Table 6.21C.—Undistributed Corporate Profits by Industry[Millions of dollars]
Line 1992 1993 1994 1995 1996
Undistributed corporate profits ...................... 1 93,903 104,474 132,267 145,038 142,759
Domestic industries ....................................................... 2 52,448 51,435 90,690 85,771 80,795
Agriculture, forestry, and fishing ............................ 3 –52 29 –896 –903 –936Farms ....................................................................... 4 –383 –53 –1,062 .............. ..............Agricultural services, forestry, and fishing ............. 5 331 82 166 .............. ..............
Mining .......................................................................... 6 –908 –2,055 –312 –767 254Metal mining ............................................................ 7 –441 –657 –81 .............. ..............Coal mining ............................................................. 8 89 –279 35 .............. ..............Oil and gas extraction ............................................. 9 –737 –787 –789 .............. ..............Nonmetallic minerals, except fuels ......................... 10 181 –332 523 .............. ..............
Construction ............................................................... 11 2,501 3,774 6,190 8,257 8,172
Manufacturing ............................................................ 12 1,671 12,613 41,640 54,068 55,927
Durable goods ......................................................... 13 6,150 15,823 33,590 31,807 33,220Lumber and wood products ............................... 14 1,390 2,298 2,105 .............. ..............Furniture and fixtures ......................................... 15 677 938 923 .............. ..............Stone, clay, and glass products ......................... 16 –30 511 1,844 .............. ..............Primary metal industries ..................................... 17 –2,988 –1,797 603 .............. ..............Fabricated metal products .................................. 18 2,808 3,723 6,026 .............. ..............Industrial machinery and equipment .................. 19 1,385 1,602 6,047 .............. ..............Electronic and other electric equipment ............ 20 1,185 5,295 9,985 .............. ..............Motor vehicles and equipment ........................... 21 –4,674 875 2,655 .............. ..............Other transportation equipment .......................... 22 3,695 1,402 1,786 .............. ..............Instruments and related products ...................... 23 1,132 –715 –217 .............. ..............Miscellaneous manufacturing industries ............ 24 1,570 1,691 1,833 .............. ..............
Nondurable goods ................................................... 25 –4,479 –3,210 8,050 22,261 22,707Food and kindred products ................................ 26 4,306 2,443 3,985 .............. ..............Tobacco products ............................................... 27 448 1,471 1,252 .............. ..............Textile mill products ............................................ 28 1,574 902 875 .............. ..............Apparel and other textile products ..................... 29 893 1,165 1,355 .............. ..............Paper and allied products .................................. 30 –283 552 1,908 .............. ..............Printing and publishing ....................................... 31 2,996 3,718 5,547 .............. ..............Chemicals and allied products ........................... 32 –4,454 –4,485 1,841 .............. ..............Petroleum and coal products ............................. 33 –11,431 –10,598 –10,043 .............. ..............Rubber and miscellaneous plastics products .... 34 1,179 1,521 1,518 .............. ..............Leather and leather products ............................. 35 293 101 –188 .............. ..............
Transportation and public utilities .......................... 36 325 5,286 13,379 10,869 13,018
Transportation .......................................................... 37 –4,736 –1,057 1,814 2,721 2,727Railroad transportation ........................................ 38 –1,370 –1,422 544 .............. ..............Local and interurban passenger transit ............. 39 116 74 106 .............. ..............Trucking and warehousing ................................. 40 2,224 2,666 2,256 .............. ..............Water transportation ........................................... 41 –161 –67 –241 .............. ..............Transportation by air .......................................... 42 –5,778 –2,700 –948 .............. ..............Pipelines, except natural gas ............................. 43 54 59 70 .............. ..............Transportation services ....................................... 44 179 333 27 .............. ..............
Communications ...................................................... 45 5,278 7,341 6,605 1,918 2,636Telephone and telegraph ................................... 46 4,720 4,719 4,377 .............. ..............Radio and television ........................................... 47 558 2,622 2,228 .............. ..............
Electric, gas, and sanitary services ........................ 48 –217 –998 4,960 6,230 7,655
Wholesale trade ......................................................... 49 10,069 9,932 13,167 10,314 12,823
Retail trade ................................................................. 50 13,671 17,319 20,246 16,185 20,262
Finance, insurance, and real estate ........................ 51 11,825 –11,545 –21,372 –33,288 –53,606
Depository institutions ............................................. 52 44,578 33,201 22,411 .............. ..............Federal Reserve banks ...................................... 53 851 –87 –2,918 .............. ..............Commercial and mutual depository institutions 54 43,727 33,288 25,329 .............. ..............
Nondepository institutions ....................................... 55 9,124 9,219 8,102 .............. ..............Security and commodity brokers ............................ 56 –2,790 –1,064 5,383 .............. ..............Insurance carriers .................................................... 57 –11,914 –10,816 –3,494 .............. ..............Insurance agents, brokers, and service ................. 58 713 965 716 .............. ..............Real estate .............................................................. 59 –9,348 –8,348 –7,684 .............. ..............Holding and other investment offices ..................... 60 –18,538 –34,702 –46,806 .............. ..............
Services ...................................................................... 61 13,346 16,082 18,648 21,036 24,881
Hotels and other lodging places ............................. 62 –1,067 –296 –423 .............. ..............Personal services .................................................... 63 775 818 1,045 .............. ..............Business services .................................................... 64 4,317 5,061 4,895 .............. ..............Auto repair, services, and parking ......................... 65 –666 –137 –385 .............. ..............Miscellaneous repair services ................................. 66 390 453 547 .............. ..............Motion pictures ........................................................ 67 1,334 1,964 1,177 .............. ..............Amusement and recreation services ...................... 68 1,163 678 825 .............. ..............Other services ......................................................... 69 7,100 7,541 10,967 .............. ..............
Health services ................................................... 70 4,956 5,699 7,625 .............. ..............Legal services ..................................................... 71 892 767 1,498 .............. ..............Educational services ........................................... 72 279 219 409 .............. ..............Other 1 ................................................................. 73 973 856 1,435 .............. ..............
Rest of the world ........................................................... 74 41,455 53,039 41,577 59,267 61,964
Receipts from the rest of the world 2 ......................... 75 28,260 43,800 44,306 69,287 74,348Less: Payments to the rest of the world 3 ................. 76 –13,195 –9,239 2,729 10,020 12,384
1. Consists of social services; membership organizations; engineering and management services, except for com-mercial research and testing services and for management and public relations; and services, not elsewhere classi-fied.
2. Consists of receipts by all U.S. residents of their share of the reinvested earnings of their incorporated foreignaffiliates and reinvested earnings of their unincorporated foreign affiliates.
3. Consists of payments to foreign residents of their share of the reinvested earnings of their unincorporatedU.S. affiliates and reinvested earnings of their unincorporated U.S. affiliates.
NOTE.— Estimates in this table are based on the 1987 Standard Industrial Classification (SIC).
Table 6.22C.—Corporate Capital Consumption Allowances by Industry[Millions of dollars]
Line 1992 1993 1994 1995 1996
Corporate capital consumption allowances 1 405,474 424,358 463,725 480,479 514,052
Agriculture, forestry, and fishing ................................ 2 3,171 3,200 3,726 4,077 4,464Farms ........................................................................... 3 1,932 2,028 2,413 .............. ..............Agricultural services, forestry, and fishing .................. 4 1,239 1,172 1,313 .............. ..............
Mining .............................................................................. 5 7,936 8,335 8,851 9,313 10,068Metal mining ................................................................ 6 1,231 1,457 1,535 .............. ..............Coal mining .................................................................. 7 1,111 1,298 1,200 .............. ..............Oil and gas extraction ................................................. 8 4,493 4,489 4,936 .............. ..............Nonmetallic minerals, except fuels ............................. 9 1,101 1,091 1,180 .............. ..............
Construction ................................................................... 10 9,146 8,832 9,271 9,665 10,482
Manufacturing ................................................................. 11 154,832 160,719 173,426 181,832 193,400
Durable goods ............................................................. 12 75,972 79,970 89,865 97,860 105,003Lumber and wood products .................................... 13 2,908 2,725 2,890 .............. ..............Furniture and fixtures .............................................. 14 844 922 926 .............. ..............Stone, clay, and glass products ............................. 15 2,976 2,716 2,902 .............. ..............Primary metal industries ......................................... 16 5,497 5,591 5,880 .............. ..............Fabricated metal products ...................................... 17 4,904 5,545 6,182 .............. ..............Industrial machinery and equipment ...................... 18 9,254 9,173 8,947 .............. ..............Electronic and other electric equipment ................. 19 17,799 20,307 22,251 .............. ..............Motor vehicles and equipment ............................... 20 18,504 19,147 25,796 .............. ..............Other transportation equipment .............................. 21 5,919 6,415 7,085 .............. ..............Instruments and related products ........................... 22 5,321 5,344 4,944 .............. ..............Miscellaneous manufacturing industries ................. 23 2,046 2,085 2,062 .............. ..............
Nondurable goods ....................................................... 24 78,860 80,749 83,561 83,972 88,397Food and kindred products ..................................... 25 11,779 11,065 11,454 .............. ..............Tobacco products .................................................... 26 1,606 3,391 2,868 .............. ..............Textile mill products ................................................ 27 2,413 2,649 2,669 .............. ..............Apparel and other textile products ......................... 28 1,118 1,218 1,363 .............. ..............Paper and allied products ....................................... 29 7,869 8,301 8,523 .............. ..............Printing and publishing ........................................... 30 5,203 4,212 4,176 .............. ..............Chemicals and allied products ............................... 31 18,529 18,899 20,786 .............. ..............Petroleum and coal products .................................. 32 26,758 26,859 27,056 .............. ..............Rubber and miscellaneous plastics products ......... 33 3,232 3,746 3,979 .............. ..............Leather and leather products ................................. 34 353 409 687 .............. ..............
Transportation and public utilities .............................. 35 96,182 95,149 98,718 100,855 108,684
Transportation .............................................................. 36 23,286 21,599 22,877 23,707 25,733Railroad transportation ............................................ 37 4,057 4,023 4,171 .............. ..............Local and interurban passenger transit .................. 38 712 630 641 .............. ..............Trucking and warehousing ...................................... 39 6,798 6,113 7,165 .............. ..............Water transportation ................................................ 40 1,262 1,011 1,236 .............. ..............Transportation by air ............................................... 41 8,006 7,685 7,338 .............. ..............Pipelines, except natural gas ................................. 42 118 73 43 .............. ..............Transportation services ........................................... 43 2,333 2,064 2,283 .............. ..............
Communications .......................................................... 44 35,486 36,330 37,364 38,617 42,094Telephone and telegraph ........................................ 45 32,261 30,725 32,303 .............. ..............Radio and television ............................................... 46 3,225 5,605 5,061 .............. ..............
Electric, gas, and sanitary services ............................ 47 37,410 37,220 38,477 38,531 40,857
Wholesale trade ............................................................. 48 23,601 26,854 32,564 33,626 36,174
Retail trade ..................................................................... 49 30,140 32,604 35,364 35,310 36,902
Finance, insurance, and real estate ............................ 50 40,204 48,029 53,511 57,310 61,774
Depository institutions .................................................. 51 18,175 21,405 23,358 .............. ..............Federal Reserve banks ........................................... 52 136 163 178 .............. ..............Commercial and mutual depository institutions ..... 53 18,039 21,242 23,180 .............. ..............
Nondepository institutions ............................................ 54 2,360 3,890 3,820 .............. ..............Security and commodity brokers ................................ 55 1,240 1,303 1,561 .............. ..............Insurance carriers ........................................................ 56 7,334 10,473 12,426 .............. ..............Insurance agents, brokers, and service ..................... 57 1,005 816 903 .............. ..............Real estate .................................................................. 58 7,771 7,660 8,354 .............. ..............Holding and other investment offices ......................... 59 2,319 2,482 3,089 .............. ..............
Services ........................................................................... 60 40,262 40,636 48,294 48,491 52,104Hotels and other lodging places ................................. 61 2,778 2,497 3,114 .............. ..............Personal services ........................................................ 62 1,516 1,394 1,535 .............. ..............Business services ........................................................ 63 13,630 13,207 15,433 .............. ..............Auto repair, services, and parking .............................. 64 9,268 9,587 10,965 .............. ..............Miscellaneous repair services ..................................... 65 601 573 588 .............. ..............Motion pictures ............................................................ 66 671 1,361 1,145 .............. ..............Amusement and recreation services .......................... 67 3,375 3,897 4,652 .............. ..............Other services .............................................................. 68 8,423 8,119 10,861 .............. ..............
Health services ........................................................ 69 4,857 4,598 6,153 .............. ..............Legal services ......................................................... 70 113 123 495 .............. ..............Educational services ............................................... 71 400 336 344 .............. ..............Other 1 ..................................................................... 72 3,053 3,063 3,870 .............. ..............
1. Consists of social services; membership organizations; engineering and management services, except for com-mercial research and testing services and for management and public relations; and services, not elsewhere classi-fied.
NOTE.— Estimates in this table are based on the 1987 Standard Industrial Classification (SIC).

August •
. Quantity and Price Indexes
Table 7.1.—Quantity and Price Indexes for Gross Domestic Product[Index numbers, 1992=100]
Line 1992 1993 1994 1995 1996
Seasonally adjusted
1992 1993 1994
IV I II III IV I II
Gross domestic product:Current dollars ................................................................................................................... 1 100.00 105.02 111.25 116.35 122.29 102.22 103.20 104.24 105.29 107.36 108.81 110.68Chain-type quantity index ................................................................................................. 2 100.00 102.32 105.87 107.97 110.95 101.32 101.34 101.85 102.39 103.72 104.49 105.70Chain-type price index ...................................................................................................... 3 100.00 102.64 105.09 107.76 110.22 100.88 101.85 102.38 102.83 103.52 104.16 104.74Implicit price deflator ......................................................................................................... 4 100.00 102.64 105.09 107.76 110.21 100.88 101.84 102.35 102.83 103.51 104.13 104.71
Personal consumption expenditures:Current dollars ........................................................................................................................... 5 100.00 105.67 111.78 117.49 123.41 102.60 103.45 104.94 106.37 107.94 109.40 110.92Chain-type quantity index .......................................................................................................... 6 100.00 102.93 106.31 108.90 111.71 101.48 101.59 102.44 103.48 104.22 105.21 105.98Chain-type price index ............................................................................................................... 7 100.00 102.66 105.15 107.89 110.47 101.10 101.83 102.46 102.80 103.57 104.00 104.68Implicit price deflator ................................................................................................................. 8 100.00 102.66 105.15 107.89 110.47 101.10 101.83 102.44 102.79 103.57 103.99 104.66
Durable goods:Current dollars ....................................................................................................................... 9 100.00 108.53 118.63 124.57 129.88 103.62 103.66 107.30 109.96 113.22 115.29 117.17Chain-type quantity index ..................................................................................................... 10 100.00 107.23 114.87 119.46 125.09 103.36 103.18 106.29 108.47 110.97 112.72 113.77Chain-type price index .......................................................................................................... 11 100.00 101.22 103.27 104.27 103.83 100.23 100.47 101.00 101.38 102.03 102.28 103.02Implicit price deflator ............................................................................................................. 12 100.00 101.22 103.27 104.27 103.83 100.25 100.47 100.95 101.37 102.02 102.28 102.99
Nondurable goods:Current dollars ....................................................................................................................... 13 100.00 103.69 108.06 111.65 116.11 102.09 102.47 103.36 103.94 105.01 106.24 107.12Chain-type quantity index ..................................................................................................... 14 100.00 102.20 105.15 106.86 108.36 101.36 101.19 101.97 102.64 103.02 104.28 104.81Chain-type price index .......................................................................................................... 15 100.00 101.46 102.77 104.48 107.15 100.72 101.26 101.38 101.27 101.92 101.90 102.23Implicit price deflator ............................................................................................................. 16 100.00 101.46 102.77 104.48 107.15 100.72 101.27 101.37 101.26 101.93 101.89 102.20
Services:Current dollars ....................................................................................................................... 17 100.00 106.18 112.44 119.25 126.10 102.68 103.95 105.32 106.97 108.48 109.94 111.73Chain-type quantity index ..................................................................................................... 18 100.00 102.47 105.23 107.89 110.86 101.17 101.49 101.93 102.93 103.53 104.21 105.06Chain-type price index .......................................................................................................... 19 100.00 103.62 106.85 110.53 113.76 101.48 102.43 103.35 103.93 104.79 105.50 106.37Implicit price deflator ............................................................................................................. 20 100.00 103.62 106.85 110.53 113.76 101.49 102.42 103.33 103.93 104.79 105.50 106.35
Gross private domestic investment:Current dollars ........................................................................................................................... 21 100.00 110.85 127.51 131.34 141.26 103.25 108.08 108.47 110.42 116.43 121.88 128.78Chain-type quantity index .......................................................................................................... 22 100.00 109.25 123.44 125.44 135.26 102.75 106.96 107.05 108.63 114.37 118.91 124.96Chain-type price index ............................................................................................................... 23 100.00 101.50 103.32 104.71 104.50 100.49 101.06 101.42 101.65 101.85 102.57 103.10Implicit price deflator ................................................................................................................. 24 100.00 101.46 103.30 104.70 104.43 100.49 101.04 101.33 101.65 101.80 102.50 103.05
Fixed investment:Current dollars ....................................................................................................................... 25 100.00 109.22 120.83 128.67 139.22 103.35 105.12 107.59 109.62 114.56 116.28 120.20Chain-type quantity index ..................................................................................................... 26 100.00 107.58 116.86 122.81 132.97 102.85 104.00 106.08 107.79 112.43 113.32 116.56Chain-type price index .......................................................................................................... 27 100.00 101.53 103.40 104.78 104.70 100.50 101.08 101.45 101.69 101.91 102.64 103.19Implicit price deflator ............................................................................................................. 28 100.00 101.53 103.40 104.77 104.70 100.49 101.07 101.42 101.70 101.90 102.61 103.12
Nonresidential:Current dollars ................................................................................................................... 29 100.00 108.28 118.42 129.60 140.07 102.11 104.06 107.34 108.70 113.04 113.76 117.04Chain-type quantity index ................................................................................................. 30 100.00 107.58 116.22 126.65 138.33 102.01 103.57 106.67 107.96 112.13 112.25 114.94Chain-type price index ...................................................................................................... 31 100.00 100.65 101.89 102.33 101.26 100.11 100.49 100.66 100.66 100.80 101.36 101.89Implicit price deflator ......................................................................................................... 32 100.00 100.65 101.89 102.33 101.26 100.10 100.48 100.63 100.69 100.81 101.35 101.83
Structures:Current dollars .............................................................................................................. 33 100.00 104.24 109.07 118.57 127.22 98.79 101.47 103.57 105.10 106.83 103.67 109.47Chain-type quantity index ............................................................................................. 34 100.00 100.95 101.94 106.35 111.51 97.89 99.32 100.66 101.50 102.33 98.31 103.13Chain-type price index ................................................................................................. 35 100.00 103.26 107.00 111.49 114.09 100.91 102.15 102.90 103.56 104.42 105.46 106.16Implicit price deflator .................................................................................................... 36 100.00 103.26 107.00 111.49 114.09 100.92 102.16 102.89 103.54 104.40 105.45 106.15
Producers’ durable equipment:Current dollars .............................................................................................................. 37 100.00 110.04 122.49 134.40 145.67 103.55 105.19 108.98 110.26 115.74 118.16 120.33Chain-type quantity index ............................................................................................. 38 100.00 110.52 122.66 135.91 150.77 103.82 105.43 109.32 110.80 116.51 118.51 120.22Chain-type price index ................................................................................................. 39 100.00 99.57 99.86 98.89 96.62 99.77 99.80 99.72 99.45 99.32 99.69 100.15Implicit price deflator .................................................................................................... 40 100.00 99.57 99.86 98.89 96.62 99.74 99.77 99.69 99.51 99.34 99.70 100.10
Residential:Current dollars ................................................................................................................... 41 100.00 111.54 126.80 126.39 137.10 106.43 107.73 108.22 111.92 118.30 122.52 128.01Chain-type quantity index ................................................................................................. 42 100.00 107.56 118.39 113.94 120.64 104.93 105.08 104.67 107.38 113.10 115.84 120.37Chain-type price index ...................................................................................................... 43 100.00 103.71 107.11 110.93 113.64 101.46 102.54 103.41 104.25 104.64 105.79 106.36Implicit price deflator ......................................................................................................... 44 100.00 103.71 107.11 110.93 113.64 101.43 102.52 103.39 104.23 104.60 105.77 106.35
See note at end of table.

• August
Table 7.1.—Quantity and Price Indexes for Gross Domestic Product—Continued[Index numbers, 1992=100]
Line 1992 1993 1994 1995 1996
Seasonally adjusted
1992 1993 1994
IV I II III IV I II
Exports of goods and services:Current dollars ........................................................................................................................... 45 100.00 103.00 112.79 128.00 136.19 101.52 101.20 103.40 101.15 106.26 106.11 111.05Chain-type quantity index .......................................................................................................... 46 100.00 102.94 111.41 123.74 134.03 101.52 101.22 103.24 101.07 106.21 105.73 110.12Chain-type price index ............................................................................................................... 47 100.00 100.07 101.24 103.44 101.61 99.98 99.97 100.22 100.04 100.03 100.44 100.99Implicit price deflator ................................................................................................................. 48 100.00 100.07 101.23 103.44 101.61 100.00 99.98 100.16 100.08 100.04 100.36 100.84
Exports of goods:Current dollars ....................................................................................................................... 49 100.00 102.47 113.58 130.13 137.63 102.30 100.57 103.01 99.82 106.47 106.02 111.25Chain-type quantity index ..................................................................................................... 50 100.00 103.35 113.62 127.91 140.05 102.75 101.22 103.70 100.74 107.75 106.79 111.72Chain-type price index .......................................................................................................... 51 100.00 99.14 99.96 101.74 98.27 99.53 99.35 99.40 99.04 98.79 99.38 99.77Implicit price deflator ............................................................................................................. 52 100.00 99.14 99.96 101.74 98.27 99.56 99.36 99.33 99.09 98.81 99.28 99.59
Exports of services:Current dollars ....................................................................................................................... 53 100.00 104.26 110.93 122.97 132.81 99.68 102.67 104.33 104.28 105.75 106.32 110.56Chain-type quantity index ..................................................................................................... 54 100.00 101.96 106.38 114.27 120.51 98.65 101.21 102.15 101.81 102.68 103.28 106.46Chain-type price index .......................................................................................................... 55 100.00 102.25 104.28 107.61 110.21 101.04 101.43 102.17 102.41 103.00 102.97 103.87Implicit price deflator ............................................................................................................. 56 100.00 102.25 104.28 107.61 110.21 101.05 101.44 102.14 102.42 103.00 102.94 103.85
Imports of goods and services:Current dollars ........................................................................................................................... 57 100.00 107.53 121.39 135.20 144.36 103.42 103.70 107.43 107.46 111.52 112.88 119.28Chain-type quantity index .......................................................................................................... 58 100.00 108.89 122.13 133.05 145.22 103.02 104.93 108.03 109.04 113.56 115.65 120.79Chain-type price index ............................................................................................................... 59 100.00 98.75 99.39 101.62 99.41 100.42 98.82 99.45 98.55 98.19 97.64 98.87Implicit price deflator ................................................................................................................. 60 100.00 98.75 99.39 101.62 99.40 100.39 98.83 99.45 98.56 98.21 97.61 98.75
Imports of goods:Current dollars ....................................................................................................................... 61 100.00 108.80 124.21 139.04 148.49 103.59 104.76 108.88 108.79 112.77 114.22 121.83Chain-type quantity index ..................................................................................................... 62 100.00 110.49 125.56 137.50 151.06 103.10 106.20 109.72 110.70 115.32 117.72 123.81Chain-type price index .......................................................................................................... 63 100.00 98.48 98.93 101.12 98.30 100.48 98.63 99.24 98.27 97.77 97.06 98.54Implicit price deflator ............................................................................................................. 64 100.00 98.48 98.93 101.12 98.29 100.47 98.64 99.23 98.28 97.79 97.03 98.40
Imports of services:Current dollars ....................................................................................................................... 65 100.00 101.95 109.03 118.38 126.23 102.69 99.06 101.08 101.63 106.03 106.98 108.08Chain-type quantity index ..................................................................................................... 66 100.00 101.91 107.31 113.82 120.06 102.62 99.34 100.63 101.79 105.89 106.61 107.69Chain-type price index .......................................................................................................... 67 100.00 100.04 101.61 104.01 105.13 100.15 99.70 100.42 99.86 100.17 100.41 100.44Implicit price deflator ............................................................................................................. 68 100.00 100.04 101.61 104.01 105.13 100.07 99.72 100.45 99.84 100.13 100.35 100.36
Government consumption expenditures and gross investment:Current dollars ........................................................................................................................... 69 100.00 101.55 103.90 107.26 111.31 101.29 100.61 101.38 101.71 102.51 102.15 102.93Chain-type quantity index .......................................................................................................... 70 100.00 99.08 99.09 99.06 99.54 100.69 98.92 99.16 98.95 99.29 98.27 98.38Chain-type price index ............................................................................................................... 71 100.00 102.50 104.85 108.28 111.83 100.59 101.71 102.24 102.77 103.26 103.95 104.61Implicit price deflator ................................................................................................................. 72 100.00 102.50 104.85 108.28 111.83 100.59 101.71 102.24 102.78 103.25 103.95 104.62
Federal:Current dollars ....................................................................................................................... 73 100.00 98.17 96.64 96.51 98.49 101.32 98.74 98.07 97.68 98.21 96.00 95.70Chain-type quantity index ..................................................................................................... 74 100.00 95.78 92.17 89.08 87.92 101.14 97.00 96.19 94.98 94.95 92.28 91.13Chain-type price index .......................................................................................................... 75 100.00 102.51 104.84 108.34 112.03 100.17 101.79 101.94 102.83 103.48 104.04 104.97Implicit price deflator ............................................................................................................. 76 100.00 102.50 104.85 108.34 112.02 100.18 101.80 101.96 102.85 103.43 104.03 105.01
National defense:Current dollars ................................................................................................................... 77 100.00 95.98 92.92 91.70 93.87 99.87 96.76 96.26 95.27 95.63 91.78 92.73Chain-type quantity index ................................................................................................. 78 100.00 94.32 89.66 85.84 84.56 100.28 95.58 94.92 93.42 93.36 89.19 89.40Chain-type price index ...................................................................................................... 79 100.00 101.77 103.63 106.83 111.02 99.57 101.23 101.39 101.97 102.48 102.90 103.65Implicit price deflator ......................................................................................................... 80 100.00 101.76 103.64 106.83 111.02 99.59 101.23 101.42 101.98 102.44 102.91 103.73
Nondefense:Current dollars ................................................................................................................... 81 100.00 103.59 105.80 108.39 109.90 104.91 103.64 102.53 103.63 104.56 106.43 103.02Chain-type quantity index ................................................................................................. 82 100.00 99.33 98.24 96.88 96.01 103.23 100.46 99.29 98.76 98.81 99.77 95.36Chain-type price index ...................................................................................................... 83 100.00 104.29 107.70 111.88 114.47 101.61 103.15 103.27 104.89 105.84 106.73 108.08Implicit price deflator ......................................................................................................... 84 100.00 104.29 107.70 111.88 114.47 101.62 103.16 103.27 104.93 105.81 106.68 108.04
State and local:Current dollars ....................................................................................................................... 85 100.00 103.98 109.11 114.97 120.51 101.26 101.95 103.75 104.60 105.60 106.56 108.12Chain-type quantity index ..................................................................................................... 86 100.00 101.45 104.06 106.23 107.88 100.37 100.30 101.29 101.81 102.40 102.57 103.59Chain-type price index .......................................................................................................... 87 100.00 102.49 104.85 108.24 111.71 100.89 101.65 102.44 102.74 103.13 103.90 104.39Implicit price deflator ............................................................................................................. 88 100.00 102.49 104.85 108.24 111.71 100.89 101.65 102.43 102.74 103.13 103.89 104.37
See note at end of table.

August •
Table 7.1.—Quantity and Price Indexes for Gross Domestic Product—Continued[Index numbers, 1992=100]
Line
Seasonally adjusted
1994 1995 1996 1997
III IV I II III IV I II III IV I II
Gross domestic product:Current dollars ................................................................................................................... 1 111.88 113.63 114.80 115.45 116.92 118.22 119.59 121.83 122.93 124.80 127.05 128.19Chain-type quantity index ................................................................................................. 2 106.17 107.11 107.36 107.44 108.24 108.84 109.32 110.92 111.20 112.38 113.73 114.34Chain-type price index ...................................................................................................... 3 105.39 106.07 106.93 107.49 108.03 108.60 109.35 109.86 110.59 111.10 111.78 112.17Implicit price deflator ......................................................................................................... 4 105.39 106.09 106.94 107.46 108.02 108.61 109.39 109.84 110.54 111.05 111.71 112.12
Personal consumption expenditures:Current dollars ........................................................................................................................... 5 112.58 114.23 115.45 116.94 118.27 119.29 121.00 122.97 123.88 125.79 128.10 128.67Chain-type quantity index .......................................................................................................... 6 106.60 107.45 107.86 108.62 109.32 109.80 110.65 111.67 111.81 112.72 114.18 114.41Chain-type price index ............................................................................................................... 7 105.61 106.31 107.05 107.69 108.19 108.63 109.34 110.13 110.80 111.61 112.21 112.48Implicit price deflator ................................................................................................................. 8 105.61 106.31 107.04 107.66 108.19 108.64 109.35 110.12 110.79 111.60 112.20 112.47
Durable goods:Current dollars ....................................................................................................................... 9 119.40 122.67 122.19 123.39 126.10 126.59 128.29 130.72 129.87 130.64 134.77 131.83Chain-type quantity index ..................................................................................................... 10 114.99 118.02 117.13 118.25 120.93 121.53 122.95 125.84 125.25 126.32 130.55 128.65Chain-type price index .......................................................................................................... 11 103.85 103.94 104.35 104.43 104.25 104.07 104.25 103.89 103.72 103.45 103.27 102.50Implicit price deflator ............................................................................................................. 12 103.84 103.94 104.31 104.34 104.28 104.17 104.34 103.88 103.69 103.41 103.24 102.47
Nondurable goods:Current dollars ....................................................................................................................... 13 108.90 109.98 110.65 111.39 112.00 112.56 114.10 115.92 116.38 118.03 120.09 119.45Chain-type quantity index ..................................................................................................... 14 105.40 106.10 106.55 106.79 106.97 107.15 107.62 108.30 108.48 109.03 110.29 109.70Chain-type price index .......................................................................................................... 15 103.31 103.64 103.85 104.32 104.70 105.05 106.02 107.04 107.29 108.26 108.90 108.89Implicit price deflator ............................................................................................................. 16 103.32 103.65 103.85 104.31 104.70 105.05 106.02 107.03 107.28 108.25 108.89 108.89
Services:Current dollars ....................................................................................................................... 17 113.21 114.85 116.71 118.68 120.12 121.50 123.30 125.27 126.78 129.07 131.15 133.10Chain-type quantity index ..................................................................................................... 18 105.58 106.08 106.72 107.68 108.27 108.90 109.84 110.67 110.93 111.99 113.05 114.08Chain-type price index .......................................................................................................... 19 107.24 108.27 109.37 110.23 110.96 111.58 112.27 113.20 114.29 115.26 116.02 116.67Implicit price deflator ............................................................................................................. 20 107.24 108.27 109.37 110.22 110.94 111.57 112.26 113.19 114.28 115.25 116.01 116.66
Gross private domestic investment:Current dollars ........................................................................................................................... 21 127.41 131.97 132.94 129.56 130.16 132.72 134.17 139.85 145.38 145.63 151.01 155.26Chain-type quantity index .......................................................................................................... 22 123.00 126.89 127.25 123.66 124.24 126.62 128.06 134.00 139.21 139.77 145.39 150.01Chain-type price index ............................................................................................................... 23 103.63 103.96 104.43 104.86 104.82 104.74 104.57 104.31 104.63 104.50 104.23 103.84Implicit price deflator ................................................................................................................. 24 103.59 104.00 104.47 104.77 104.77 104.82 104.77 104.36 104.44 104.19 103.86 103.50
Fixed investment:Current dollars ....................................................................................................................... 25 122.15 124.70 127.47 127.59 128.84 130.78 133.96 138.11 141.94 142.86 143.91 147.78Chain-type quantity index ..................................................................................................... 26 117.78 119.79 122.01 121.78 122.83 124.62 127.84 132.20 135.42 136.41 137.73 141.80Chain-type price index .......................................................................................................... 27 103.71 104.04 104.48 104.90 104.88 104.83 104.70 104.50 104.85 104.75 104.52 104.25Implicit price deflator ............................................................................................................. 28 103.71 104.10 104.48 104.78 104.89 104.94 104.78 104.47 104.82 104.73 104.49 104.22
Nonresidential:Current dollars ................................................................................................................... 29 119.64 123.24 127.42 129.51 130.03 131.42 134.56 137.90 143.15 144.69 145.43 149.93Chain-type quantity index ................................................................................................. 30 117.08 120.62 124.70 126.44 126.95 128.49 132.10 136.19 141.48 143.54 145.00 150.19Chain-type price index ...................................................................................................... 31 102.20 102.12 102.21 102.61 102.40 102.11 101.74 101.29 101.21 100.82 100.31 99.85Implicit price deflator ......................................................................................................... 32 102.19 102.17 102.18 102.43 102.43 102.28 101.87 101.26 101.18 100.80 100.29 99.83
Structures:Current dollars .............................................................................................................. 33 110.40 112.73 116.84 118.89 119.88 118.65 121.57 124.47 128.66 134.16 134.40 136.16Chain-type quantity index ............................................................................................. 34 102.86 103.45 105.82 106.93 107.12 105.54 107.63 109.68 112.32 116.40 115.79 116.44Chain-type price index ................................................................................................. 35 107.37 109.00 110.40 111.19 111.92 112.43 112.97 113.50 114.58 115.30 116.11 116.98Implicit price deflator .................................................................................................... 36 107.34 108.98 110.42 111.19 111.92 112.42 112.96 113.48 114.55 115.26 116.07 116.94
Producers’ durable equipment:Current dollars .............................................................................................................. 37 123.66 127.81 132.03 134.14 134.45 136.97 140.22 143.74 149.45 149.27 150.23 155.92Chain-type quantity index ............................................................................................. 38 123.49 128.42 133.30 135.31 135.98 139.06 143.41 148.48 155.10 156.09 158.63 166.18Chain-type price index ................................................................................................. 39 100.14 99.46 99.09 99.35 98.83 98.29 97.60 96.84 96.38 95.65 94.72 93.84Implicit price deflator .................................................................................................... 40 100.13 99.53 99.05 99.13 98.87 98.50 97.78 96.81 96.36 95.63 94.70 93.83
Residential:Current dollars ................................................................................................................... 41 128.35 128.33 127.59 122.84 125.91 129.21 132.45 138.64 138.97 138.33 140.16 142.48Chain-type quantity index ................................................................................................. 42 119.44 117.90 115.80 111.02 113.29 115.63 117.96 122.91 121.51 120.18 121.17 122.83Chain-type price index ...................................................................................................... 43 107.45 108.83 110.17 110.65 111.15 111.75 112.29 112.80 114.37 115.10 115.68 116.00Implicit price deflator ......................................................................................................... 44 107.46 108.84 110.19 110.65 111.13 111.74 112.29 112.80 114.36 115.10 115.68 116.00
See note at end of table.

• August
Table 7.1.—Quantity and Price Indexes for Gross Domestic Product—Continued[Index numbers, 1992=100]
Line
Seasonally adjusted
1994 1995 1996 1997
III IV I II III IV I II III IV I II
Exports of goods and services:Current dollars ........................................................................................................................... 45 114.57 119.43 122.70 126.32 130.06 132.91 132.96 135.27 135.07 141.48 144.22 148.32Chain-type quantity index .......................................................................................................... 46 112.93 116.88 118.92 121.59 125.50 128.96 129.52 132.53 133.15 140.92 144.30 149.22Chain-type price index ............................................................................................................... 47 101.40 102.11 103.21 104.09 103.57 102.88 102.50 102.14 101.47 100.35 99.90 99.36Implicit price deflator ................................................................................................................. 48 101.45 102.19 103.18 103.89 103.63 103.06 102.66 102.07 101.44 100.39 99.95 99.40
Exports of goods:Current dollars ....................................................................................................................... 49 115.65 121.39 124.96 128.95 131.75 134.87 135.08 136.82 135.89 142.75 146.26 151.37Chain-type quantity index ..................................................................................................... 50 115.54 120.44 122.68 126.09 129.35 133.54 134.88 138.00 138.85 148.48 152.94 160.03Chain-type price index .......................................................................................................... 51 100.02 100.69 101.91 102.54 101.75 100.76 99.91 99.24 97.89 96.06 95.55 94.50Implicit price deflator ............................................................................................................. 52 100.10 100.79 101.86 102.27 101.85 101.00 100.15 99.14 97.86 96.14 95.63 94.58
Exports of services:Current dollars ....................................................................................................................... 53 112.02 114.83 117.37 120.13 126.07 128.30 127.96 131.64 133.14 138.49 139.43 141.17Chain-type quantity index ..................................................................................................... 54 106.99 108.79 110.39 111.42 116.70 118.59 117.43 120.19 120.28 124.14 125.27 125.79Chain-type price index .......................................................................................................... 55 104.73 105.54 106.34 107.85 108.07 108.19 109.06 109.53 110.70 111.55 111.29 112.21Implicit price deflator ............................................................................................................. 56 104.70 105.55 106.33 107.82 108.03 108.19 108.97 109.53 110.70 111.56 111.30 112.23
Imports of goods and services:Current dollars ........................................................................................................................... 57 124.97 128.44 131.96 136.49 136.33 136.02 139.50 143.32 146.14 148.47 152.63 157.22Chain-type quantity index .......................................................................................................... 58 124.56 127.54 130.63 133.09 133.85 134.65 138.87 143.51 148.03 150.48 156.80 164.73Chain-type price index ............................................................................................................... 59 100.34 100.72 101.12 102.82 101.77 100.75 100.28 99.83 98.76 98.75 97.42 95.53Implicit price deflator ................................................................................................................. 60 100.33 100.71 101.02 102.56 101.86 101.02 100.46 99.87 98.73 98.66 97.34 95.44
Imports of goods:Current dollars ....................................................................................................................... 61 128.32 132.46 135.69 140.77 140.02 139.67 142.87 147.37 150.53 153.18 157.07 162.15Chain-type quantity index ..................................................................................................... 62 128.48 132.22 134.62 137.92 138.31 139.15 143.42 148.97 154.49 157.37 163.58 172.91Chain-type price index .......................................................................................................... 63 99.90 100.22 100.93 102.38 101.12 100.05 99.41 98.88 97.47 97.42 96.11 93.86Implicit price deflator ............................................................................................................. 64 99.88 100.19 100.79 102.07 101.24 100.37 99.62 98.92 97.44 97.34 96.02 93.78
Imports of services:Current dollars ....................................................................................................................... 65 110.27 110.78 115.63 117.70 120.15 120.03 124.70 125.55 126.89 127.76 133.13 135.60Chain-type quantity index ..................................................................................................... 66 107.58 107.34 113.37 112.23 114.52 115.14 119.13 119.94 120.29 120.90 127.64 129.88Chain-type price index .......................................................................................................... 67 102.44 103.15 101.91 104.88 104.98 104.26 104.67 104.68 105.50 105.69 104.31 104.42Implicit price deflator ............................................................................................................. 68 102.50 103.21 101.99 104.88 104.91 104.24 104.68 104.68 105.49 105.68 104.30 104.40
Government consumption expenditures and gross investment:Current dollars ........................................................................................................................... 69 105.42 105.08 106.40 107.30 107.79 107.55 109.53 111.33 111.84 112.54 113.40 114.83Chain-type quantity index .......................................................................................................... 70 100.35 99.37 99.52 99.49 99.30 97.94 98.37 100.10 99.83 99.85 99.74 100.68Chain-type price index ............................................................................................................... 71 105.07 105.75 106.92 107.85 108.55 109.80 111.27 111.23 112.07 112.76 113.74 114.10Implicit price deflator ................................................................................................................. 72 105.06 105.75 106.92 107.85 108.55 109.81 111.34 111.22 112.04 112.71 113.69 114.05
Federal:Current dollars ....................................................................................................................... 73 98.56 96.28 97.28 96.82 97.14 94.81 97.80 99.37 98.79 98.03 97.75 100.00Chain-type quantity index ..................................................................................................... 74 94.02 91.23 90.99 89.95 89.66 85.72 87.29 89.15 88.21 87.04 85.76 87.50Chain-type price index .......................................................................................................... 75 104.83 105.53 106.89 107.59 108.33 110.56 111.85 111.47 112.05 112.74 114.10 114.39Implicit price deflator ............................................................................................................. 76 104.83 105.53 106.91 107.63 108.34 110.60 112.04 111.46 111.99 112.62 113.98 114.28
National defense:Current dollars ................................................................................................................... 77 95.73 91.45 92.17 92.65 92.43 89.56 92.71 95.09 94.41 93.29 91.37 93.84Chain-type quantity index ................................................................................................. 78 92.33 87.71 87.46 87.12 86.22 82.56 83.79 86.01 85.00 83.44 80.86 82.87Chain-type price index ...................................................................................................... 79 103.68 104.31 105.37 106.30 107.20 108.44 110.38 110.58 111.16 111.94 113.14 113.38Implicit price deflator ......................................................................................................... 80 103.68 104.26 105.37 106.35 107.20 108.47 110.64 110.56 111.07 111.80 112.99 113.24
Nondefense:Current dollars ................................................................................................................... 81 105.55 108.20 109.89 107.11 108.76 107.79 110.37 109.93 109.58 109.72 113.52 115.19Chain-type quantity index ................................................................................................. 82 98.13 99.69 99.46 96.80 97.94 93.33 95.70 96.72 95.93 95.69 97.54 98.64Chain-type price index ...................................................................................................... 83 107.57 108.42 110.44 110.61 111.03 115.44 115.28 113.63 114.25 114.72 116.44 116.83Implicit price deflator ......................................................................................................... 84 107.56 108.53 110.49 110.66 111.05 115.49 115.34 113.66 114.23 114.66 116.39 116.78
State and local:Current dollars ....................................................................................................................... 85 110.34 111.40 112.95 114.82 115.43 116.69 117.95 119.92 121.22 122.96 124.63 125.47Chain-type quantity index ..................................................................................................... 86 104.89 105.21 105.64 106.33 106.22 106.71 106.33 107.97 108.17 109.04 109.78 110.14Chain-type price index .......................................................................................................... 87 105.21 105.89 106.93 108.00 108.67 109.35 110.92 111.08 112.07 112.77 113.54 113.93Implicit price deflator ............................................................................................................. 88 105.20 105.89 106.92 107.99 108.67 109.35 110.93 111.07 112.07 112.76 113.52 113.92
NOTE.— Chain-type quantity and price indexes are calculated from weighted averages of the detailed output andprices used to prepare each aggregate and component. Implicit price deflators are weighted averages of the detailedprice indexes used to prepare each aggregate and component and are calculated as the ratio of current- to chained-
dollar output multiplied by 100.Percent changes from preceding period for items in this table are shown in table 8.1.

August •
Table 7.2.—Quantity and Price Indexes for Gross Domestic Product, Final Sales, and Purchases[Index numbers, 1992=100]
Line 1992 1993 1994 1995 1996
Seasonally adjusted
1992 1993 1994
IV I II III IV I II
Gross domestic product:Current dollars ........................................................................................................................... 1 100.00 105.02 111.25 116.35 122.29 102.22 103.20 104.24 105.29 107.36 108.81 110.68Chain-type quantity index .......................................................................................................... 2 100.00 102.32 105.87 107.97 110.95 101.32 101.34 101.85 102.39 103.72 104.49 105.70Chain-type price index ............................................................................................................... 3 100.00 102.64 105.09 107.76 110.22 100.88 101.85 102.38 102.83 103.52 104.16 104.74Implicit price deflator ................................................................................................................. 4 100.00 102.64 105.09 107.76 110.21 100.88 101.84 102.35 102.83 103.51 104.13 104.71
Final sales of domestic product:Current dollars ........................................................................................................................... 5 100.00 104.81 110.39 116.00 122.01 102.23 102.83 104.12 105.18 107.12 108.09 109.58Chain-type quantity index .......................................................................................................... 6 100.00 102.11 105.03 107.62 110.64 101.34 100.96 101.72 102.28 103.47 103.78 104.64Chain-type price index ............................................................................................................... 7 100.00 102.65 105.11 107.79 110.28 100.88 101.85 102.38 102.84 103.53 104.17 104.75Implicit price deflator ................................................................................................................. 8 100.00 102.65 105.11 107.79 110.28 100.88 101.85 102.36 102.84 103.52 104.15 104.73
Gross domestic purchases:Current dollars ........................................................................................................................... 9 100.00 105.50 112.18 117.17 123.22 102.42 103.46 104.66 105.94 107.92 109.51 111.56Chain-type quantity index .......................................................................................................... 10 100.00 102.95 106.99 108.98 112.17 101.48 101.73 102.36 103.21 104.50 105.52 106.82Chain-type price index ............................................................................................................... 11 100.00 102.48 104.85 107.52 109.86 100.92 101.71 102.28 102.64 103.28 103.80 104.46Implicit price deflator ................................................................................................................. 12 100.00 102.47 104.84 107.52 109.85 100.92 101.70 102.25 102.64 103.27 103.79 104.44
Final sales to domestic purchasers:Current dollars ........................................................................................................................... 13 100.00 105.29 111.32 116.82 122.95 102.43 103.09 104.55 105.84 107.67 108.80 110.47Chain-type quantity index .......................................................................................................... 14 100.00 102.73 106.16 108.63 111.86 101.50 101.35 102.23 103.10 104.25 104.82 105.76Chain-type price index ............................................................................................................... 15 100.00 102.49 104.86 107.54 109.91 100.92 101.71 102.29 102.65 103.29 103.81 104.47Implicit price deflator ................................................................................................................. 16 100.00 102.48 104.86 107.54 109.91 100.92 101.71 102.27 102.65 103.29 103.80 104.45
Addenda:Chain-type price indexes for gross domestic purchases:
Food ....................................................................................................................................... 17 100.00 101.72 103.83 106.38 109.42 100.54 100.94 101.52 101.83 102.58 102.88 103.18Energy .................................................................................................................................... 18 100.00 100.85 100.99 101.92 107.01 101.36 101.53 101.27 99.88 100.73 99.91 99.37Gross domestic purchases less food and energy ............................................................... 19 100.00 102.65 105.16 107.93 110.06 100.94 101.82 102.43 102.88 103.49 104.10 104.86
Line
Seasonally adjusted
1994 1995 1996 1997
III IV I II III IV I II III IV I II
Gross domestic product:Current dollars ........................................................................................................................... 1 111.88 113.63 114.80 115.45 116.92 118.22 119.59 121.83 122.93 124.80 127.05 128.19Chain-type quantity index .......................................................................................................... 2 106.17 107.11 107.36 107.44 108.24 108.84 109.32 110.92 111.20 112.38 113.73 114.34Chain-type price index ............................................................................................................... 3 105.39 106.07 106.93 107.49 108.03 108.60 109.35 109.86 110.59 111.10 111.78 112.17Implicit price deflator ................................................................................................................. 4 105.39 106.09 106.94 107.46 108.02 108.61 109.39 109.84 110.54 111.05 111.71 112.12
Final sales of domestic product:Current dollars ........................................................................................................................... 5 111.20 112.70 114.10 115.19 116.74 117.96 119.54 121.59 122.47 124.43 126.13 127.22Chain-type quantity index .......................................................................................................... 6 105.50 106.21 106.68 107.18 108.05 108.57 109.26 110.66 110.70 111.93 112.77 113.32Chain-type price index ............................................................................................................... 7 105.41 106.09 106.95 107.50 108.05 108.63 109.39 109.91 110.65 111.17 111.85 112.28Implicit price deflator ................................................................................................................. 8 105.41 106.11 106.95 107.47 108.05 108.65 109.41 109.88 110.63 111.16 111.85 112.27
Gross domestic purchases:Current dollars ........................................................................................................................... 9 113.01 114.62 115.83 116.59 117.66 118.62 120.35 122.75 124.16 125.62 128.03 129.23Chain-type quantity index .......................................................................................................... 10 107.39 108.25 108.60 108.66 109.16 109.51 110.35 112.11 112.77 113.46 115.09 115.99Chain-type price index ............................................................................................................... 11 105.24 105.88 106.66 107.33 107.79 108.29 109.01 109.50 110.15 110.79 111.32 111.50Implicit price deflator ................................................................................................................. 12 105.23 105.89 106.66 107.30 107.78 108.32 109.06 109.49 110.10 110.72 111.24 111.42
Final sales to domestic purchasers:Current dollars ........................................................................................................................... 13 112.33 113.69 115.13 116.33 117.48 118.36 120.30 122.52 123.71 125.25 127.11 128.27Chain-type quantity index .......................................................................................................... 14 106.72 107.35 107.93 108.41 108.97 109.24 110.29 111.86 112.28 113.02 114.14 114.97Chain-type price index ............................................................................................................... 15 105.26 105.90 106.68 107.34 107.81 108.32 109.05 109.54 110.20 110.85 111.39 111.60Implicit price deflator ................................................................................................................. 16 105.25 105.91 106.67 107.31 107.81 108.35 109.08 109.53 110.18 110.83 111.37 111.57
Addenda:Chain-type price indexes for gross domestic purchases:
Food ....................................................................................................................................... 17 104.36 104.88 105.52 106.16 106.62 107.22 107.93 108.76 109.98 111.02 111.35 111.79Energy .................................................................................................................................... 18 102.24 102.43 102.20 102.55 101.77 101.18 104.17 107.91 106.72 109.23 110.89 105.85Gross domestic purchases less food and energy ............................................................... 19 105.50 106.18 107.03 107.70 108.22 108.77 109.38 109.67 110.34 110.86 111.36 111.75
NOTE.—Percent changes from preceding period for selected items in this table are shown in table 8.1.

• August
Table 7.3.—Quantity and Price Indexes for Gross National Product and Command-Basis Gross National Product[Index numbers, 1992=100]
Line 1992 1993 1994 1995 1996
Seasonally adjusted
1992 1993 1994
IV I II III IV I II
Gross national product:Current dollars ........................................................................................................................... 1 100.00 105.14 111.18 116.23 122.10 102.16 103.40 104.31 105.46 107.38 108.88 110.63Chain-type quantity index .......................................................................................................... 2 100.00 102.44 105.81 107.88 110.81 101.26 101.53 101.93 102.55 103.74 104.56 105.66Chain-type price index ............................................................................................................... 3 100.00 102.64 105.08 107.74 110.19 100.87 101.84 102.37 102.83 103.51 104.16 104.73Implicit price deflator ................................................................................................................. 4 100.00 102.63 105.08 107.73 110.18 100.88 101.84 102.34 102.83 103.50 104.14 104.71
Less: Exports of goods and services and receipts of factor income:Chain-type quantity index ..................................................................................................... 5 100.00 103.63 113.35 128.61 137.88 100.57 101.70 103.66 102.38 106.77 106.96 111.35
Plus: Command-basis exports of goods and services and receipts of factor income:Chain-type quantity index ..................................................................................................... 6 100.00 104.80 115.14 130.43 140.35 100.22 102.70 104.29 103.73 108.48 109.61 113.37
Equals: Command-basis gross national product:Chain-type quantity index ..................................................................................................... 7 100.00 102.58 106.04 108.11 111.12 101.22 101.65 102.00 102.72 103.96 104.89 105.91
Line
Seasonally adjusted
1994 1995 1996 1997
III IV I II III IV I II III IV I II
Gross national product:Current dollars ........................................................................................................................... 1 111.78 113.45 114.70 115.43 116.67 118.11 119.50 121.66 122.60 124.63 126.60 ...............Chain-type quantity index .......................................................................................................... 2 106.08 106.97 107.29 107.44 108.04 108.77 109.26 110.78 110.95 112.27 113.37 ...............Chain-type price index ............................................................................................................... 3 105.38 106.05 106.90 107.46 108.00 108.58 109.33 109.83 110.55 111.06 111.73 ...............Implicit price deflator ................................................................................................................. 4 105.38 106.06 106.91 107.43 107.99 108.59 109.37 109.82 110.50 111.01 111.67 ...............
Less: Exports of goods and services and receipts of factor income:Chain-type quantity index ..................................................................................................... 5 115.20 119.90 123.76 127.36 129.95 133.38 133.37 135.83 137.24 145.06 147.60 ...............
Plus: Command-basis exports of goods and services and receipts of factor income:Chain-type quantity index ..................................................................................................... 6 116.30 121.28 125.81 128.60 131.74 135.56 135.80 138.30 140.23 147.07 150.74 ...............
Equals: Command-basis gross national product:Chain-type quantity index ..................................................................................................... 7 106.21 107.14 107.54 107.60 108.26 109.04 109.56 111.09 111.32 112.52 113.76 ...............
NOTE.—Percent changes from preceding period for selected items in this table are shown in table 8.1.
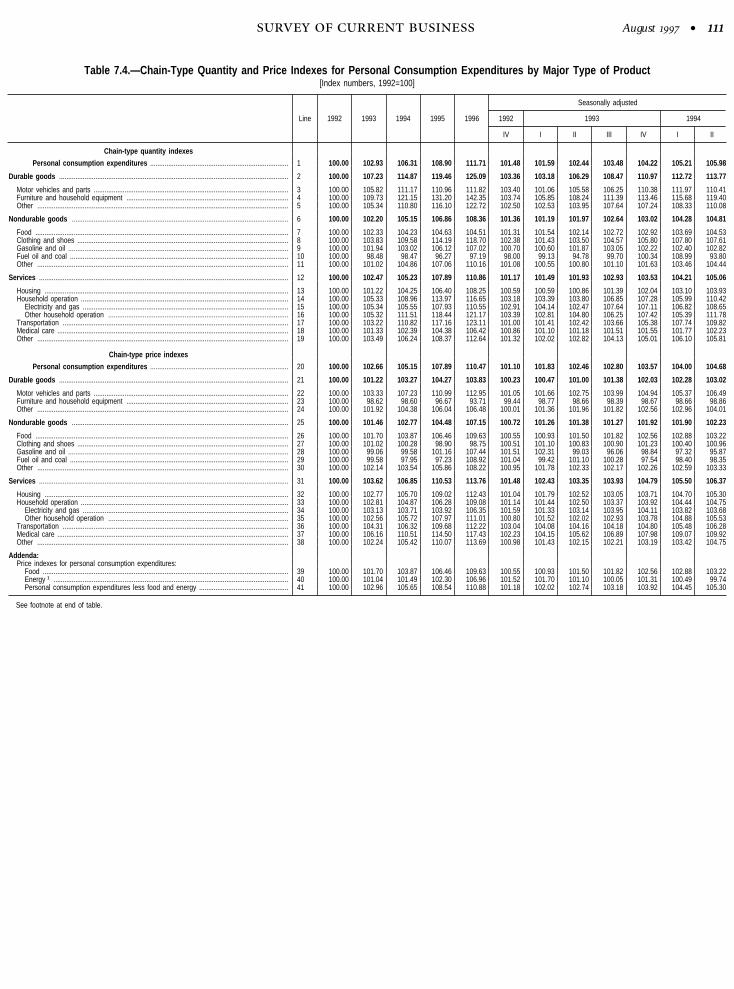
August •
Table 7.4.—Chain-Type Quantity and Price Indexes for Personal Consumption Expenditures by Major Type of Product[Index numbers, 1992=100]
Line 1992 1993 1994 1995 1996
Seasonally adjusted
1992 1993 1994
IV I II III IV I II
Chain-type quantity indexes
Personal consumption expenditures ............................................................................ 1 100.00 102.93 106.31 108.90 111.71 101.48 101.59 102.44 103.48 104.22 105.21 105.98
Durable goods .............................................................................................................................. 2 100.00 107.23 114.87 119.46 125.09 103.36 103.18 106.29 108.47 110.97 112.72 113.77
Motor vehicles and parts ........................................................................................................... 3 100.00 105.82 111.17 110.96 111.82 103.40 101.06 105.58 106.25 110.38 111.97 110.41Furniture and household equipment ......................................................................................... 4 100.00 109.73 121.15 131.20 142.35 103.74 105.85 108.24 111.39 113.46 115.68 119.40Other .......................................................................................................................................... 5 100.00 105.34 110.80 116.10 122.72 102.50 102.53 103.95 107.64 107.24 108.33 110.08
Nondurable goods ....................................................................................................................... 6 100.00 102.20 105.15 106.86 108.36 101.36 101.19 101.97 102.64 103.02 104.28 104.81
Food ........................................................................................................................................... 7 100.00 102.33 104.23 104.63 104.51 101.31 101.54 102.14 102.72 102.92 103.69 104.53Clothing and shoes .................................................................................................................... 8 100.00 103.83 109.58 114.19 118.70 102.38 101.43 103.50 104.57 105.80 107.80 107.61Gasoline and oil ......................................................................................................................... 9 100.00 101.94 103.02 106.12 107.02 100.70 100.60 101.87 103.05 102.22 102.40 102.82Fuel oil and coal ........................................................................................................................ 10 100.00 98.48 98.47 96.27 97.19 98.00 99.13 94.78 99.70 100.34 108.99 93.80Other .......................................................................................................................................... 11 100.00 101.02 104.86 107.06 110.16 101.08 100.55 100.80 101.10 101.63 103.46 104.44
Services ......................................................................................................................................... 12 100.00 102.47 105.23 107.89 110.86 101.17 101.49 101.93 102.93 103.53 104.21 105.06
Housing ...................................................................................................................................... 13 100.00 101.22 104.25 106.40 108.25 100.59 100.59 100.86 101.39 102.04 103.10 103.93Household operation .................................................................................................................. 14 100.00 105.33 108.96 113.97 116.65 103.18 103.39 103.80 106.85 107.28 105.99 110.42
Electricity and gas ................................................................................................................. 15 100.00 105.34 105.55 107.93 110.55 102.91 104.14 102.47 107.64 107.11 106.82 108.65Other household operation ................................................................................................... 16 100.00 105.32 111.51 118.44 121.17 103.39 102.81 104.80 106.25 107.42 105.39 111.78
Transportation ............................................................................................................................ 17 100.00 103.22 110.82 117.16 123.11 101.00 101.41 102.42 103.66 105.38 107.74 109.82Medical care ............................................................................................................................... 18 100.00 101.33 102.39 104.38 106.42 100.86 101.10 101.18 101.51 101.55 101.77 102.23Other .......................................................................................................................................... 19 100.00 103.49 106.24 108.37 112.64 101.32 102.02 102.82 104.13 105.01 106.10 105.81
Chain-type price indexes
Personal consumption expenditures ............................................................................ 20 100.00 102.66 105.15 107.89 110.47 101.10 101.83 102.46 102.80 103.57 104.00 104.68
Durable goods .............................................................................................................................. 21 100.00 101.22 103.27 104.27 103.83 100.23 100.47 101.00 101.38 102.03 102.28 103.02
Motor vehicles and parts ........................................................................................................... 22 100.00 103.33 107.23 110.99 112.95 101.05 101.66 102.75 103.99 104.94 105.37 106.49Furniture and household equipment ......................................................................................... 23 100.00 98.62 98.60 96.67 93.71 99.44 98.77 98.66 98.39 98.67 98.66 98.86Other .......................................................................................................................................... 24 100.00 101.92 104.38 106.04 106.48 100.01 101.36 101.96 101.82 102.56 102.96 104.01
Nondurable goods ....................................................................................................................... 25 100.00 101.46 102.77 104.48 107.15 100.72 101.26 101.38 101.27 101.92 101.90 102.23
Food ........................................................................................................................................... 26 100.00 101.70 103.87 106.46 109.63 100.55 100.93 101.50 101.82 102.56 102.88 103.22Clothing and shoes .................................................................................................................... 27 100.00 101.02 100.28 98.90 98.75 100.51 101.10 100.83 100.90 101.23 100.40 100.96Gasoline and oil ......................................................................................................................... 28 100.00 99.06 99.58 101.16 107.44 101.51 102.31 99.03 96.06 98.84 97.32 95.87Fuel oil and coal ........................................................................................................................ 29 100.00 99.58 97.95 97.23 108.92 101.04 99.42 101.10 100.28 97.54 98.40 98.35Other .......................................................................................................................................... 30 100.00 102.14 103.54 105.86 108.22 100.95 101.78 102.33 102.17 102.26 102.59 103.33
Services ......................................................................................................................................... 31 100.00 103.62 106.85 110.53 113.76 101.48 102.43 103.35 103.93 104.79 105.50 106.37
Housing ...................................................................................................................................... 32 100.00 102.77 105.70 109.02 112.43 101.04 101.79 102.52 103.05 103.71 104.70 105.30Household operation .................................................................................................................. 33 100.00 102.81 104.87 106.28 109.08 101.14 101.44 102.50 103.37 103.92 104.44 104.75
Electricity and gas ................................................................................................................. 34 100.00 103.13 103.71 103.92 106.35 101.59 101.33 103.14 103.95 104.11 103.82 103.68Other household operation ................................................................................................... 35 100.00 102.56 105.72 107.97 111.01 100.80 101.52 102.02 102.93 103.78 104.88 105.53
Transportation ............................................................................................................................ 36 100.00 104.31 106.32 109.68 112.22 103.04 104.08 104.16 104.18 104.80 105.48 106.28Medical care ............................................................................................................................... 37 100.00 106.16 110.51 114.50 117.43 102.23 104.15 105.62 106.89 107.98 109.07 109.92Other .......................................................................................................................................... 38 100.00 102.24 105.42 110.07 113.69 100.98 101.43 102.15 102.21 103.19 103.42 104.75
Addenda:Price indexes for personal consumption expenditures:
Food ....................................................................................................................................... 39 100.00 101.70 103.87 106.46 109.63 100.55 100.93 101.50 101.82 102.56 102.88 103.22Energy 1 ................................................................................................................................. 40 100.00 101.04 101.49 102.30 106.96 101.52 101.70 101.10 100.05 101.31 100.49 99.74Personal consumption expenditures less food and energy ................................................. 41 100.00 102.96 105.65 108.54 110.88 101.18 102.02 102.74 103.18 103.92 104.45 105.30
See footnote at end of table.

• August
Table 7.4.—Chain-Type Quantity and Price Indexes for Personal Consumption Expenditures by Major Type of Product—Continued[Index numbers, 1992=100]
Line
Seasonally adjusted
1994 1995 1996 1997
III IV I II III IV I II III IV I II
Chain-type quantity indexes
Personal consumption expenditures ............................................................................ 1 106.60 107.45 107.86 108.62 109.32 109.80 110.65 111.67 111.81 112.72 114.18 114.41
Durable goods .............................................................................................................................. 2 114.99 118.02 117.13 118.25 120.93 121.53 122.95 125.84 125.25 126.32 130.55 128.65
Motor vehicles and parts ........................................................................................................... 3 109.87 112.43 109.36 109.97 112.56 111.94 112.81 113.23 111.06 110.19 112.83 107.63Furniture and household equipment ......................................................................................... 4 122.63 126.90 127.48 129.19 132.82 135.31 136.86 142.54 143.80 146.18 151.75 154.66Other .......................................................................................................................................... 5 111.51 113.26 114.70 115.88 116.91 116.91 119.37 122.87 122.66 125.98 131.48 129.10
Nondurable goods ....................................................................................................................... 6 105.40 106.10 106.55 106.79 106.97 107.15 107.62 108.30 108.48 109.03 110.29 109.70
Food ........................................................................................................................................... 7 104.24 104.48 104.68 104.58 104.64 104.64 104.92 104.59 104.14 104.39 105.25 104.63Clothing and shoes .................................................................................................................... 8 109.99 112.93 113.22 113.96 114.87 114.71 115.97 118.99 120.09 119.73 122.88 121.05Gasoline and oil ......................................................................................................................... 9 103.05 103.82 105.71 106.18 106.02 106.59 105.94 107.43 107.01 107.69 107.56 108.25Fuel oil and coal ........................................................................................................................ 10 98.06 93.05 91.29 97.10 94.91 101.76 101.83 95.34 96.86 94.75 86.25 93.06Other .......................................................................................................................................... 11 105.61 105.94 106.60 106.97 107.11 107.54 108.24 109.50 110.55 112.37 114.07 113.66
Services ......................................................................................................................................... 12 105.58 106.08 106.72 107.68 108.27 108.90 109.84 110.67 110.93 111.99 113.05 114.08
Housing ...................................................................................................................................... 13 104.67 105.30 105.70 106.17 106.63 107.11 107.54 108.02 108.48 108.97 109.52 110.09Household operation .................................................................................................................. 14 109.71 109.73 110.52 113.76 115.80 115.81 116.30 117.64 115.15 117.51 116.02 118.65
Electricity and gas ................................................................................................................. 15 104.55 102.18 102.92 107.70 111.40 109.72 111.68 112.32 107.74 110.47 106.82 110.53Other household operation ................................................................................................... 16 113.55 115.31 116.13 118.25 119.09 120.31 119.74 121.60 120.61 122.71 122.79 124.64
Transportation ............................................................................................................................ 17 111.79 113.94 115.44 116.30 117.33 119.57 121.53 122.64 123.64 124.64 126.10 126.54Medical care ............................................................................................................................... 18 102.55 102.99 103.53 104.06 104.70 105.22 105.07 106.11 106.67 107.81 108.93 109.91Other .......................................................................................................................................... 19 106.40 106.65 107.35 108.42 108.51 109.20 111.55 112.27 112.84 113.91 116.15 117.23
Chain-type price indexes
Personal consumption expenditures ............................................................................ 20 105.61 106.31 107.05 107.69 108.19 108.63 109.34 110.13 110.80 111.61 112.21 112.48
Durable goods .............................................................................................................................. 21 103.85 103.94 104.35 104.43 104.25 104.07 104.25 103.89 103.72 103.45 103.27 102.50
Motor vehicles and parts ........................................................................................................... 22 107.96 109.10 110.13 111.06 111.16 111.61 112.42 112.70 113.15 113.55 113.84 113.26Furniture and household equipment ......................................................................................... 23 98.93 97.94 97.76 97.10 96.34 95.46 94.93 94.04 93.38 92.50 91.84 90.85Other .......................................................................................................................................... 24 105.14 105.39 105.80 105.64 106.29 106.42 106.98 106.53 106.26 106.14 106.22 105.64
Nondurable goods ....................................................................................................................... 25 103.31 103.64 103.85 104.32 104.70 105.05 106.02 107.04 107.29 108.26 108.90 108.89
Food ........................................................................................................................................... 26 104.42 104.95 105.56 106.23 106.73 107.33 108.08 108.98 110.20 111.27 111.65 112.09Clothing and shoes .................................................................................................................... 27 100.35 99.39 98.88 98.61 98.96 99.16 99.33 99.00 98.08 98.56 99.29 100.37Gasoline and oil ......................................................................................................................... 28 101.81 103.32 102.32 102.35 100.82 99.15 103.70 109.77 106.47 109.83 112.13 104.78Fuel oil and coal ........................................................................................................................ 29 98.72 96.33 96.02 97.65 98.54 96.71 105.15 108.68 105.69 116.17 116.49 108.77Other .......................................................................................................................................... 30 103.83 104.42 104.75 105.50 106.26 106.95 107.56 108.09 108.57 108.67 109.21 110.08
Services ......................................................................................................................................... 31 107.24 108.27 109.37 110.23 110.96 111.58 112.27 113.20 114.29 115.26 116.02 116.67
Housing ...................................................................................................................................... 32 106.02 106.78 107.68 108.59 109.43 110.38 111.25 112.00 112.85 113.60 114.42 115.34Household operation .................................................................................................................. 33 105.09 105.22 105.92 105.94 106.37 106.91 107.63 108.73 109.63 110.32 111.37 111.02
Electricity and gas ................................................................................................................. 34 103.70 103.63 103.80 103.54 103.83 104.52 104.88 105.87 106.92 107.73 109.66 107.91Other household operation ................................................................................................... 35 106.10 106.36 107.43 107.65 108.18 108.61 109.58 110.75 111.55 112.16 112.63 113.21
Transportation ............................................................................................................................ 36 106.57 106.94 107.68 109.42 110.96 110.69 110.55 111.76 112.43 114.15 114.88 116.42Medical care ............................................................................................................................... 37 110.97 112.07 113.60 114.20 114.70 115.49 116.32 117.07 117.72 118.62 119.41 119.84Other .......................................................................................................................................... 38 105.92 107.59 108.74 109.87 110.61 111.05 111.63 112.76 114.63 115.76 116.33 117.09
Addenda:Price indexes for personal consumption expenditures:
Food ....................................................................................................................................... 39 104.42 104.95 105.56 106.23 106.73 107.33 108.08 108.98 110.20 111.27 111.65 112.09Energy 1 ................................................................................................................................. 40 102.57 103.14 102.74 102.70 102.16 101.62 104.32 107.82 106.63 109.07 111.11 106.45Personal consumption expenditures less food and energy ................................................. 41 106.05 106.78 107.63 108.30 108.88 109.35 109.92 110.52 111.21 111.87 112.41 112.96
1. Consists of prices for gasoline and oil, fuel oil and coal, and electricity and gas.

August •
Table 7.5.—Chain-Type Quantity and Price Indexes for Personal Consumption Expenditures by Type of Product[Index numbers, 1992=100]
Line 1992 1993 1994 1995 1996
Chain-type quantity indexes
Personal consumption expenditures ........................ 1 100.00 102.93 106.31 108.90 111.71
Durable goods ........................................................................... 2 100.00 107.23 114.87 119.46 125.09
Motor vehicles and parts ....................................................... 3 100.00 105.82 111.17 110.96 111.82New autos (70) .................................................................. 4 100.00 102.82 105.00 98.13 95.25Net purchases of used autos (71) .................................... 5 100.00 103.47 105.81 115.12 118.72Other motor vehicles (72) .................................................. 6 100.00 110.36 119.92 120.42 121.78Tires, tubes, accessories, and other parts (73) ............... 7 100.00 107.88 117.62 121.57 128.41
Furniture and household equipment ...................................... 8 100.00 109.73 121.15 131.20 142.35Furniture, including mattresses and bedsprings (29) ....... 9 100.00 104.60 108.48 111.10 112.00Kitchen and other household appliances (30) .................. 10 100.00 107.23 112.36 119.54 122.06China, glassware, tableware, and utensils (31) ............... 11 100.00 106.59 113.36 120.57 129.90Video and audio products, computing equipment, and
musical instruments (91).12 100.00 118.71 142.81 166.44 195.37
Other durable house furnishings (32) ............................... 13 100.00 105.22 113.06 116.86 123.40
Other ....................................................................................... 14 100.00 105.34 110.80 116.10 122.72Ophthalmic products and orthopedic appliances (46) ...... 15 100.00 99.38 105.97 104.97 109.21Wheel goods, sports and photographic equipment,
boats, and pleasure aircraft (90).16 100.00 108.77 116.52 126.10 134.96
Jewelry and watches (18) ................................................. 17 100.00 104.77 107.40 110.99 119.57Books and maps (87) ........................................................ 18 100.00 104.58 110.85 116.44 117.48
Nondurable goods .................................................................... 19 100.00 102.20 105.15 106.86 108.36
Food ........................................................................................ 20 100.00 102.33 104.23 104.63 104.51Food purchased for off-premise consumption (3) ............ 21 100.00 101.30 102.64 102.37 102.67Purchased meals and beverages (4) ................................ 22 100.00 104.27 107.23 108.81 107.89Food furnished to employees (including military) and
food produced and consumed on farms (5+6).23 100.00 101.17 103.00 104.81 104.95
Addenda: Food excluding alcoholic beverages (8) .......... 24 100.00 102.43 104.23 104.49 104.24Alcoholic beverages purchased for off-
premise consumption (9).25 100.00 102.27 106.30 107.90 109.81
Other alcoholic beverages (10) ................... 26 100.00 100.23 100.31 101.67 100.74
Clothing and shoes ................................................................ 27 100.00 103.83 109.58 114.19 118.70Shoes (12) ......................................................................... 28 100.00 101.87 106.35 109.10 111.91Women’s and children’s clothing and accessories except
shoes (14).29 100.00 104.03 109.37 115.12 120.24
Men’s and boys’ clothing and accessories except shoes(15+16).
30 100.00 104.43 111.62 115.02 119.27
Gasoline and oil (75) ............................................................. 31 100.00 101.94 103.02 106.12 107.02
Fuel oil and coal (40) ............................................................ 32 100.00 98.48 98.47 96.27 97.19
Other ....................................................................................... 33 100.00 101.02 104.86 107.06 110.16Tobacco products (7) ......................................................... 34 100.00 90.43 95.26 95.68 94.46Toilet articles and preparations (21) ................................. 35 100.00 102.40 105.65 108.71 113.74Semidurable house furnishings (33) ................................. 36 100.00 106.32 110.48 115.93 121.31Cleaning and polishing preparations, and miscellaneous
household supplies and paper products (34).37 100.00 103.89 107.89 107.37 108.81
Drug preparations and sundries (45) ................................ 38 100.00 100.51 102.26 105.55 109.00Nondurable toys and sport supplies (89) ......................... 39 100.00 106.01 113.75 121.09 128.43Stationery and writing supplies (35) ................................. 40 100.00 103.13 106.24 106.07 109.32Net foreign remittances (109 less 111) ............................ 41 ............ ............ ............ ............ ............Magazines, newspapers, and sheet music (88) ............... 42 100.00 101.71 106.03 106.13 105.28Flowers, seeds, and potted plants (93) ............................ 43 100.00 105.01 109.24 107.94 117.11
Services ..................................................................................... 44 100.00 102.47 105.23 107.89 110.86
Housing ................................................................................... 45 100.00 101.22 104.25 106.40 108.25
Line 1992 1993 1994 1995 1996
Owner-occupied nonfarm dwellings—space rent (24) ...... 46 100.00 102.20 104.75 106.41 108.20Tenant-occupied nonfarm dwellings—rent (25) ................ 47 100.00 98.46 102.94 106.62 108.96Rental value of farm dwellings (26) .................................. 48 100.00 97.83 96.48 96.30 94.44Other (27) ........................................................................... 49 100.00 101.75 105.21 107.17 108.06
Household operation .............................................................. 50 100.00 105.33 108.96 113.97 116.65Electricity (37) .................................................................... 51 100.00 105.70 107.19 109.50 110.55Gas (38) ............................................................................. 52 100.00 104.43 101.45 104.03 110.75Water and other sanitary services (39) ............................ 53 100.00 102.70 106.07 108.61 110.98Telephone and telegraph (41) ........................................... 54 100.00 104.93 113.31 123.27 129.67Domestic service (42) ........................................................ 55 100.00 102.13 103.14 107.23 101.06Other (43) ........................................................................... 56 100.00 110.24 116.30 122.17 120.30
Transportation ......................................................................... 57 100.00 103.22 110.82 117.16 123.11User-operated transportation ............................................. 58 100.00 103.64 111.70 118.60 124.31
Repair, greasing, washing, parking, storage, rental,and leasing (74).
59 100.00 104.61 114.96 123.52 130.71
Other user-operated transportation (76+77) ................. 60 100.00 100.38 100.73 102.08 102.90Purchased local transportation .......................................... 61 100.00 101.91 106.84 106.31 106.52
Mass transit systems (79) ............................................. 62 100.00 100.23 105.15 102.10 102.83Taxicab (80) ................................................................... 63 100.00 105.44 110.37 115.18 114.28
Purchased intercity transportation ..................................... 64 100.00 101.75 108.10 113.83 122.81Railway (82) ................................................................... 65 100.00 97.50 90.99 88.09 86.29Bus (83) ......................................................................... 66 100.00 102.37 105.05 131.21 132.22Airline (84) ..................................................................... 67 100.00 102.63 109.66 115.36 123.74Other (85) ...................................................................... 68 100.00 95.42 100.97 102.71 121.12
Medical care ........................................................................... 69 100.00 101.33 102.39 104.38 106.42Physicians (47) .................................................................. 70 100.00 97.74 97.13 99.33 101.28Dentists (48) ....................................................................... 71 100.00 100.70 103.31 106.69 109.07Other professional services (49) ....................................... 72 100.00 108.56 113.98 122.12 126.62Hospitals and nursing homes (50) .................................... 73 100.00 102.18 103.61 105.18 107.22Health insurance (56) ........................................................ 74 100.00 97.16 93.80 87.88 86.55
Other ....................................................................................... 75 100.00 103.49 106.24 108.37 112.64Personal care ..................................................................... 76 100.00 99.99 102.10 108.19 109.38
Cleaning, storage, and repair of clothing and shoes(17).
77 100.00 97.24 96.85 101.47 99.24
Barbershops, beauty parlors, and health clubs (22) .... 78 100.00 98.09 100.09 105.12 105.85Other (19) ...................................................................... 79 100.00 105.39 109.78 118.87 123.70
Personal business .............................................................. 80 100.00 102.95 103.04 102.64 106.41Brokerage charges and investment counseling (61) ... 81 100.00 122.68 124.52 137.66 164.56Bank service charges, trust services, and safe
deposit box rental (62).82 100.00 103.43 98.21 99.14 103.26
Services furnished without payment by financialintermediaries except life insurance carriers andprivate noninsured pension plans (63).
83 100.00 101.12 102.51 99.31 100.71
Expense of handling life insurance (64) ....................... 84 100.00 101.17 100.99 100.70 101.52Legal services (65) ........................................................ 85 100.00 98.75 97.30 94.69 97.23Funeral and burial expenses (66) ................................ 86 100.00 102.10 100.65 104.02 103.52Other (67) ...................................................................... 87 100.00 102.35 104.68 107.54 114.48
Recreation .......................................................................... 88 100.00 107.24 111.59 119.96 125.74Admissions to specified spectator amusements (94) 89 100.00 107.51 107.62 110.19 114.08Other (92+98+99+100+101) .......................................... 90 100.00 107.21 112.15 121.35 127.40
Education and research ..................................................... 91 100.00 101.71 104.05 106.81 110.30Higher education (103) .................................................. 92 100.00 100.76 102.14 103.24 103.75Nursery, elementary, and secondary schools (104) .... 93 100.00 101.70 105.56 107.78 112.12Other (105) .................................................................... 94 100.00 104.06 107.44 114.89 125.27
Religious and welfare activities (106) ............................... 95 100.00 102.58 108.64 111.17 118.09Net foreign travel ............................................................... 96 ............ ............ ............ ............ ............
Foreign travel by U.S. residents (108) ......................... 97 100.00 105.79 112.29 112.48 116.93Less: Expenditures in the United States by
nonresidents (110).98 100.00 103.20 102.63 107.41 113.59
See note at end of table.

• August
Table 7.5.—Chain-Type Quantity and Price Indexes for Personal Consumption Expenditures by Type of Product—Continued[Index numbers, 1992=100]
Line 1992 1993 1994 1995 1996
Chain-type price indexes
Personal consumption expenditures ........................ 1 100.00 102.66 105.15 107.89 110.47
Durable goods ........................................................................... 2 100.00 101.22 103.27 104.27 103.83
Motor vehicles and parts ....................................................... 3 100.00 103.33 107.23 110.99 112.95New autos (70) .................................................................. 4 100.00 102.35 105.78 108.14 110.02Net purchases of used autos (71) .................................... 5 100.00 109.51 117.68 128.38 131.33Other motor vehicles (72) .................................................. 6 100.00 103.44 107.63 110.78 113.24Tires, tubes, accessories, and other parts (73) ............... 7 100.00 98.57 98.30 98.95 99.06
Furniture and household equipment ...................................... 8 100.00 98.62 98.60 96.67 93.71Furniture, including mattresses and bedsprings (29) ....... 9 100.00 102.44 106.29 108.51 111.19Kitchen and other household appliances (30) .................. 10 100.00 100.64 102.46 102.27 102.61China, glassware, tableware, and utensils (31) ............... 11 100.00 99.90 102.14 101.31 101.71Video and audio products, computing equipment, and
musical instruments (91).12 100.00 93.72 89.81 83.67 75.05
Other durable house furnishings (32) ............................... 13 100.00 100.78 101.75 102.65 103.68
Other ....................................................................................... 14 100.00 101.92 104.38 106.04 106.48Ophthalmic products and orthopedic appliances (46) ...... 15 100.00 102.67 104.76 107.91 109.71Wheel goods, sports and photographic equipment,
boats, and pleasure aircraft (90).16 100.00 100.42 102.37 103.79 104.12
Jewelry and watches (18) ................................................. 17 100.00 102.49 105.67 106.74 104.69Books and maps (87) ........................................................ 18 100.00 102.97 105.20 107.45 111.88
Nondurable goods .................................................................... 19 100.00 101.46 102.77 104.48 107.15
Food ........................................................................................ 20 100.00 101.70 103.87 106.46 109.63Food purchased for off-premise consumption (3) ............ 21 100.00 101.57 103.94 106.65 110.07Purchased meals and beverages (4) ................................ 22 100.00 101.95 103.76 106.17 108.93Food furnished to employees (including military) and
food produced and consumed on farms (5+6).23 100.00 101.87 103.05 105.19 107.83
Addenda: Food excluding alcoholic beverages (8) .......... 24 100.00 101.77 104.09 106.87 110.06Alcoholic beverages purchased for off-
premise consumption (9).25 100.00 100.22 100.37 100.78 103.36
Other alcoholic beverages (10) ................... 26 100.00 103.06 105.62 108.65 112.46
Clothing and shoes ................................................................ 27 100.00 101.02 100.28 98.90 98.75Shoes (12) ......................................................................... 28 100.00 100.75 100.82 100.36 101.32Women’s and children’s clothing and accessories except
shoes (14).29 100.00 101.22 100.30 97.94 96.79
Men’s and boys’ clothing and accessories except shoes(15+16).
30 100.00 100.77 99.96 99.99 101.17
Gasoline and oil (75) ............................................................. 31 100.00 99.06 99.58 101.16 107.44
Fuel oil and coal (40) ............................................................ 32 100.00 99.58 97.95 97.23 108.92
Other ....................................................................................... 33 100.00 102.14 103.54 105.86 108.22Tobacco products (7) ......................................................... 34 100.00 103.92 100.08 102.66 105.86Toilet articles and preparations (21) ................................. 35 100.00 101.86 103.73 104.88 106.11Semidurable house furnishings (33) ................................. 36 100.00 101.25 105.96 107.20 106.75Cleaning and polishing preparations, and miscellaneous
household supplies and paper products (34).37 100.00 100.33 101.10 104.65 107.71
Drug preparations and sundries (45) ................................ 38 100.00 103.57 106.41 108.24 111.19Nondurable toys and sport supplies (89) ......................... 39 100.00 100.81 102.11 101.91 103.37Stationery and writing supplies (35) ................................. 40 100.00 102.02 104.86 110.05 114.82Net foreign remittances (109 less 111) ............................ 41 ............ ............ ............ ............ ............Magazines, newspapers, and sheet music (88) ............... 42 100.00 103.54 106.92 111.33 116.81Flowers, seeds, and potted plants (93) ............................ 43 100.00 98.78 100.22 104.92 103.53
Services ..................................................................................... 44 100.00 103.62 106.85 110.53 113.76
Housing ................................................................................... 45 100.00 102.77 105.70 109.02 112.43
Line 1992 1993 1994 1995 1996
Owner-occupied nonfarm dwellings—space rent (24) ...... 46 100.00 102.77 105.71 109.24 112.72Tenant-occupied nonfarm dwellings—rent (25) ................ 47 100.00 102.57 105.31 107.88 110.74Rental value of farm dwellings (26) .................................. 48 100.00 106.01 112.00 114.87 121.10Other (27) ........................................................................... 49 100.00 103.26 106.73 111.07 116.45
Household operation .............................................................. 50 100.00 102.81 104.87 106.28 109.08Electricity (37) .................................................................... 51 100.00 101.98 102.02 104.36 106.10Gas (38) ............................................................................. 52 100.00 106.16 108.17 102.53 106.81Water and other sanitary services (39) ............................ 53 100.00 105.62 110.92 114.59 118.84Telephone and telegraph (41) ........................................... 54 100.00 100.98 103.80 104.11 106.30Domestic service (42) ........................................................ 55 100.00 103.18 106.30 109.62 113.53Other (43) ........................................................................... 56 100.00 102.89 104.75 109.87 113.58
Transportation ......................................................................... 57 100.00 104.31 106.32 109.68 112.22User-operated transportation ............................................. 58 100.00 103.98 107.41 111.06 114.47
Repair, greasing, washing, parking, storage, rental,and leasing (74).
59 100.00 103.77 107.34 110.45 113.58
Other user-operated transportation (76+77) ................. 60 100.00 104.71 107.62 113.39 118.00Purchased local transportation .......................................... 61 100.00 102.57 103.97 107.41 118.53
Mass transit systems (79) ............................................. 62 100.00 102.42 103.84 108.11 119.06Taxicab (80) ................................................................... 63 100.00 102.87 104.23 106.06 117.52
Purchased intercity transportation ..................................... 64 100.00 106.27 102.05 104.13 100.49Railway (82) ................................................................... 65 100.00 101.40 102.39 107.92 115.01Bus (83) ......................................................................... 66 100.00 96.85 96.73 93.87 95.67Airline (84) ..................................................................... 67 100.00 106.40 101.01 103.18 98.14Other (85) ...................................................................... 68 100.00 110.32 113.57 116.24 120.43
Medical care ........................................................................... 69 100.00 106.16 110.51 114.50 117.43Physicians (47) .................................................................. 70 100.00 105.57 110.86 115.24 116.02Dentists (48) ....................................................................... 71 100.00 105.26 110.31 115.76 121.17Other professional services (49) ....................................... 72 100.00 103.15 107.28 109.22 111.25Hospitals and nursing homes (50) .................................... 73 100.00 104.32 107.68 111.67 114.89Health insurance (56) ........................................................ 74 100.00 129.18 137.50 142.98 152.43
Other ....................................................................................... 75 100.00 102.24 105.42 110.07 113.69Personal care ..................................................................... 76 100.00 102.90 105.66 107.48 110.19
Cleaning, storage, and repair of clothing and shoes(17).
77 100.00 103.04 105.69 107.04 109.04
Barbershops, beauty parlors, and health clubs (22) .... 78 100.00 102.79 105.68 108.08 111.65Other (19) ...................................................................... 79 100.00 102.96 105.60 106.93 108.92
Personal business .............................................................. 80 100.00 101.61 105.21 110.96 115.81Brokerage charges and investment counseling (61) ... 81 100.00 95.78 95.85 92.88 94.46Bank service charges, trust services, and safe
deposit box rental (62).82 100.00 105.78 114.79 122.18 129.05
Services furnished without payment by financialintermediaries except life insurance carriers andprivate noninsured pension plans (63).
83 100.00 99.83 103.46 112.62 118.05
Expense of handling life insurance (64) ....................... 84 100.00 103.84 106.61 110.93 116.60Legal services (65) ........................................................ 85 100.00 104.29 107.83 111.41 115.45Funeral and burial expenses (66) ................................ 86 100.00 104.75 110.03 116.66 122.57Other (67) ...................................................................... 87 100.00 103.25 107.89 113.04 116.48
Recreation .......................................................................... 88 100.00 103.31 105.58 108.58 112.42Admissions to specified spectator amusements (94) 89 100.00 101.71 106.47 110.81 116.78Other (92+98+99+100+101) .......................................... 90 100.00 103.54 105.47 108.29 111.86
Education and research ..................................................... 91 100.00 104.10 108.14 112.89 116.48Higher education (103) .................................................. 92 100.00 105.81 110.98 115.86 120.86Nursery, elementary, and secondary schools (104) .... 93 100.00 102.16 104.93 109.33 110.94Other (105) .................................................................... 94 100.00 101.76 104.33 109.07 111.33
Religious and welfare activities (106) ............................... 95 100.00 102.22 104.43 108.77 110.20Net foreign travel ............................................................... 96 ............ ............ ............ ............ ............
Foreign travel by U.S. residents (108) ......................... 97 100.00 100.01 102.73 106.12 108.08Less: Expenditures in the United States by
nonresidents (110).98 100.00 102.71 105.04 108.22 112.54
NOTE.—See notes and footnotes to table 2.4. The figures in parentheses are the line numbers of the correspond-ing items in table 2.4.

August •
Table 7.6.—Chain-Type Quantity and Price Indexes for Private Fixed Investment by Type[Index numbers, 1992=100]
Line 1992 1993 1994 1995 1996
Seasonally adjusted
1992 1993 1994
IV I II III IV I II
Chain-type quantity indexes
Private fixed investment ................................................................................................ 1 100.00 107.58 116.86 122.81 132.97 102.85 104.00 106.08 107.79 112.43 113.32 116.56
Nonresidential ............................................................................................................................... 2 100.00 107.58 116.22 126.65 138.33 102.01 103.57 106.67 107.96 112.13 112.25 114.94
Structures ................................................................................................................................. 3 100.00 100.95 101.94 106.35 111.51 97.89 99.32 100.66 101.50 102.33 98.31 103.13Nonresidential buildings, including farm ............................................................................... 4 100.00 101.89 105.97 113.81 123.67 97.04 98.31 101.06 103.46 104.73 100.94 108.72Utilities ................................................................................................................................... 5 100.00 92.21 86.57 86.99 84.83 98.32 96.83 92.06 90.03 89.93 87.85 85.75Mining exploration, shafts, and wells ................................................................................... 6 100.00 120.05 118.55 107.86 104.18 103.21 113.92 121.46 122.98 121.83 113.24 113.66Other structures ..................................................................................................................... 7 100.00 93.75 83.48 81.72 66.68 99.03 100.09 97.63 87.71 89.56 81.34 81.33
Producers’ durable equipment .............................................................................................. 8 100.00 110.52 122.66 135.91 150.77 103.82 105.43 109.32 110.80 116.51 118.51 120.22Information processing and related equipment .................................................................... 9 100.00 110.23 123.07 150.40 188.61 103.54 104.69 106.72 113.63 115.89 117.81 119.82
Computers and peripheral equipment 1 ........................................................................... 10 100.00 127.63 152.80 233.89 365.81 108.02 116.11 121.00 132.99 140.43 141.44 145.77Other .................................................................................................................................. 11 100.00 102.32 110.17 118.57 128.90 101.37 99.33 100.05 104.87 105.04 107.33 108.34
Industrial equipment .............................................................................................................. 12 100.00 108.05 118.14 126.96 131.01 103.64 104.56 105.43 108.05 114.15 115.07 116.17Transportation and related equipment .................................................................................. 13 100.00 114.11 131.37 137.98 145.10 106.16 106.62 117.77 109.97 122.08 126.30 127.68Other ...................................................................................................................................... 14 100.00 109.83 117.59 122.68 127.58 101.87 106.23 108.59 110.48 114.03 114.98 117.19
Residential ..................................................................................................................................... 15 100.00 107.56 118.39 113.94 120.64 104.93 105.08 104.67 107.38 113.10 115.84 120.37
Structures ................................................................................................................................. 16 100.00 107.60 118.59 113.91 120.71 105.01 105.12 104.67 107.38 113.25 116.06 120.64Single family .......................................................................................................................... 17 100.00 109.06 120.26 108.94 117.22 104.39 106.01 106.05 108.88 115.29 119.65 123.99Multifamily .............................................................................................................................. 18 100.00 80.62 104.20 129.13 142.27 87.47 79.18 77.31 83.90 82.08 86.97 99.29Other structures ..................................................................................................................... 19 100.00 109.62 118.50 118.66 122.54 108.38 107.73 106.84 108.83 115.09 115.48 119.24
Producers’ durable equipment .............................................................................................. 20 100.00 105.86 110.85 115.09 118.12 102.00 103.89 104.65 107.53 107.35 107.46 110.40
Chain-type price indexes
Private fixed investment ................................................................................................ 21 100.00 101.53 103.40 104.78 104.70 100.50 101.08 101.45 101.69 101.91 102.64 103.19
Nonresidential ............................................................................................................................... 22 100.00 100.65 101.89 102.33 101.26 100.11 100.49 100.66 100.66 100.80 101.36 101.89
Structures ................................................................................................................................. 23 100.00 103.26 107.00 111.49 114.09 100.91 102.15 102.90 103.56 104.42 105.46 106.16Nonresidential buildings, including farm ............................................................................... 24 100.00 103.38 107.31 111.62 114.14 101.03 102.08 102.82 103.81 104.80 105.68 106.40Utilities ................................................................................................................................... 25 100.00 103.19 107.31 110.79 113.70 100.80 101.34 103.07 103.70 104.63 105.98 106.92Mining exploration, shafts, and wells ................................................................................... 26 100.00 103.66 105.69 113.66 115.89 100.64 105.44 103.98 102.61 102.62 104.42 104.33Other structures ..................................................................................................................... 27 100.00 101.11 103.85 108.30 112.33 100.20 100.47 101.19 101.23 101.57 102.47 103.41
Producers’ durable equipment .............................................................................................. 28 100.00 99.57 99.86 98.89 96.62 99.77 99.80 99.72 99.45 99.32 99.69 100.15Information processing and related equipment .................................................................... 29 100.00 95.72 92.08 85.64 77.09 98.44 97.70 96.45 95.00 93.74 93.30 93.00
Computers and peripheral equipment 1 ........................................................................... 30 100.00 86.69 77.13 63.84 48.98 94.42 92.20 88.33 84.81 81.40 80.20 78.95Other .................................................................................................................................. 31 100.00 100.69 100.87 100.21 100.04 100.52 100.57 100.76 100.64 100.77 100.84 101.07
Industrial equipment .............................................................................................................. 32 100.00 101.44 103.58 107.12 108.96 100.28 100.67 101.28 101.65 102.15 102.54 103.15Transportation and related equipment .................................................................................. 33 100.00 101.63 104.77 105.71 107.56 100.41 101.08 101.38 101.81 102.27 103.91 105.00Other ...................................................................................................................................... 34 100.00 101.76 103.48 105.64 108.24 100.72 100.95 101.71 101.99 102.38 102.64 103.47
Residential ..................................................................................................................................... 35 100.00 103.71 107.11 110.93 113.64 101.46 102.54 103.41 104.25 104.64 105.79 106.36
Structures ................................................................................................................................. 36 100.00 103.79 107.22 111.12 113.88 101.50 102.61 103.49 104.34 104.73 105.90 106.46Single family .......................................................................................................................... 37 100.00 104.90 109.80 114.40 116.50 101.64 103.19 104.03 105.40 106.80 107.92 108.64Multifamily .............................................................................................................................. 38 100.00 102.20 103.20 105.80 109.10 101.71 102.14 101.92 102.20 102.53 102.55 102.35Other structures ..................................................................................................................... 39 100.00 102.56 104.36 107.56 111.02 101.25 101.87 102.92 103.17 102.27 103.67 104.12
Producers’ durable equipment .............................................................................................. 40 100.00 100.64 102.96 103.91 104.84 100.01 99.69 100.54 100.92 101.39 101.85 102.80
See footnote at end of table.

• August
Table 7.6.—Chain-Type Quantity and Price Indexes for Private Fixed Investment by Type—Continued[Index numbers, 1992=100]
Line
Seasonally adjusted
1993 1994 1995 1996 1997
I II III IV I II III IV I II III IV I II III IV I II
Chain-type quantity indexes
Private fixed investment .............................................. 1 104.00 106.08 107.79 112.43 113.32 116.56 117.78 119.79 122.01 121.78 122.83 124.62 127.84 132.20 135.42 136.41 137.73 141.80
Nonresidential ............................................................................. 2 103.57 106.67 107.96 112.13 112.25 114.94 117.08 120.62 124.70 126.44 126.95 128.49 132.10 136.19 141.48 143.54 145.00 150.19
Structures ............................................................................... 3 99.32 100.66 101.50 102.33 98.31 103.13 102.86 103.45 105.82 106.93 107.12 105.54 107.63 109.68 112.32 116.40 115.79 116.44Nonresidential buildings, including farm ............................. 4 98.31 101.06 103.46 104.73 100.94 108.72 106.58 107.62 110.84 114.37 114.93 115.09 117.22 121.08 125.22 131.15 132.58 132.12Utilities ................................................................................. 5 96.83 92.06 90.03 89.93 87.85 85.75 86.34 86.35 88.05 88.11 87.15 84.64 86.02 84.43 83.23 85.66 79.80 84.60Mining exploration, shafts, and wells ................................. 6 113.92 121.46 122.98 121.83 113.24 113.66 121.61 125.67 122.86 106.57 103.47 98.55 102.62 104.36 106.20 103.54 102.45 100.98Other structures ................................................................... 7 100.09 97.63 87.71 89.56 81.34 81.33 90.11 81.14 82.81 83.25 88.60 72.24 73.43 66.10 65.30 61.90 55.98 57.88
Producers’ durable equipment ............................................ 8 105.43 109.32 110.80 116.51 118.51 120.22 123.49 128.42 133.30 135.31 135.98 139.06 143.41 148.48 155.10 156.09 158.63 166.18Information processing and related equipment .................. 9 104.69 106.72 113.63 115.89 117.81 119.82 123.79 130.88 137.51 148.53 152.94 162.62 173.50 182.43 196.97 201.54 209.70 217.95
Computers and peripheral equipment 1 ......................... 10 116.11 121.00 132.99 140.43 141.44 145.77 152.67 171.33 188.24 221.19 243.07 283.05 315.68 345.83 386.78 414.95 445.54 478.31Other ................................................................................ 11 99.33 100.05 104.87 105.04 107.33 108.34 111.10 113.89 116.44 119.54 118.79 119.51 123.76 126.35 133.29 132.21 134.66 136.94
Industrial equipment ............................................................ 12 104.56 105.43 108.05 114.15 115.07 116.17 119.43 121.88 125.46 128.66 127.75 125.96 128.50 133.01 131.64 130.91 130.81 138.37Transportation and related equipment ................................ 13 106.62 117.77 109.97 122.08 126.30 127.68 131.71 139.80 143.86 136.15 134.30 137.63 138.30 141.33 150.25 150.54 147.92 157.12Other .................................................................................... 14 106.23 108.59 110.48 114.03 114.98 117.19 118.59 119.59 124.04 122.19 122.42 122.07 123.88 126.68 130.11 129.66 134.23 138.66
Residential ................................................................................... 15 105.08 104.67 107.38 113.10 115.84 120.37 119.44 117.90 115.80 111.02 113.29 115.63 117.96 122.91 121.51 120.18 121.17 122.83
Structures ............................................................................... 16 105.12 104.67 107.38 113.25 116.06 120.64 119.66 118.00 115.83 110.96 113.22 115.62 118.03 123.01 121.59 120.21 121.13 122.80Single family ........................................................................ 17 106.01 106.05 108.88 115.29 119.65 123.99 120.56 116.84 112.77 105.65 106.70 110.65 114.23 118.96 118.73 116.95 116.95 116.50Multifamily ............................................................................ 18 79.18 77.31 83.90 82.08 86.97 99.29 112.02 118.52 125.54 124.58 131.44 134.96 144.22 153.96 133.41 137.49 149.84 155.00Other structures ................................................................... 19 107.73 106.84 108.83 115.09 115.48 119.24 119.63 119.65 118.78 116.41 119.68 119.79 119.62 124.26 123.96 122.33 122.86 126.87
Producers’ durable equipment ............................................ 20 103.89 104.65 107.53 107.35 107.46 110.40 111.28 114.28 114.59 113.51 116.09 116.16 115.34 119.04 118.83 119.28 122.83 124.32
Chain-type price indexes
Private fixed investment .............................................. 21 101.08 101.45 101.69 101.91 102.64 103.19 103.71 104.04 104.48 104.90 104.88 104.83 104.70 104.50 104.85 104.75 104.52 104.25
Nonresidential ............................................................................. 22 100.49 100.66 100.66 100.80 101.36 101.89 102.20 102.12 102.21 102.61 102.40 102.11 101.74 101.29 101.21 100.82 100.31 99.85
Structures ............................................................................... 23 102.15 102.90 103.56 104.42 105.46 106.16 107.37 109.00 110.40 111.19 111.92 112.43 112.97 113.50 114.58 115.30 116.11 116.98Nonresidential buildings, including farm ............................. 24 102.08 102.82 103.81 104.80 105.68 106.40 107.77 109.38 110.75 111.36 111.96 112.43 112.93 113.52 114.72 115.38 116.02 116.73Utilities ................................................................................. 25 101.34 103.07 103.70 104.63 105.98 106.92 107.58 108.74 109.41 110.25 111.37 112.11 112.68 113.07 113.75 115.29 116.17 117.44Mining exploration, shafts, and wells ................................. 26 105.44 103.98 102.61 102.62 104.42 104.33 105.47 108.55 111.75 113.71 114.58 114.59 115.19 115.59 116.56 116.21 118.47 120.11Other structures ................................................................... 27 100.47 101.19 101.23 101.57 102.47 103.41 104.24 105.26 106.43 107.72 108.83 110.23 111.51 111.93 112.46 113.43 114.82 116.09
Producers’ durable equipment ............................................ 28 99.80 99.72 99.45 99.32 99.69 100.15 100.14 99.46 99.09 99.35 98.83 98.29 97.60 96.84 96.38 95.65 94.72 93.84Information processing and related equipment .................. 29 97.70 96.45 95.00 93.74 93.30 93.00 91.96 90.07 88.29 87.06 84.73 82.49 80.34 77.91 76.06 74.05 72.06 70.15
Computers and peripheral equipment 1 ......................... 30 92.20 88.33 84.81 81.40 80.20 78.95 76.63 72.75 68.73 66.04 62.13 58.44 54.51 50.11 47.21 44.10 41.47 38.79Other ................................................................................ 31 100.57 100.76 100.64 100.77 100.84 101.07 100.95 100.59 100.50 100.41 100.13 99.80 99.96 100.10 100.02 100.07 99.65 99.67
Industrial equipment ............................................................ 32 100.67 101.28 101.65 102.15 102.54 103.15 103.90 104.72 105.42 107.01 107.78 108.26 108.62 108.75 109.06 109.41 109.34 109.22Transportation and related equipment ................................ 33 101.08 101.38 101.81 102.27 103.91 105.00 105.54 104.65 104.73 105.36 106.14 106.59 106.62 107.40 108.18 108.03 108.09 108.13Other .................................................................................... 34 100.95 101.71 101.99 102.38 102.64 103.47 103.84 103.97 104.34 105.39 105.93 106.89 107.56 107.74 108.46 109.20 109.05 109.07
Residential ................................................................................... 35 102.54 103.41 104.25 104.64 105.79 106.36 107.45 108.83 110.17 110.65 111.15 111.75 112.29 112.80 114.37 115.10 115.68 116.00
Structures ............................................................................... 36 102.61 103.49 104.34 104.73 105.90 106.46 107.56 108.97 110.34 110.83 111.35 111.96 112.50 113.03 114.62 115.36 115.94 116.29Single family ........................................................................ 37 103.19 104.03 105.40 106.80 107.92 108.64 110.36 112.38 113.80 114.13 114.67 115.01 115.26 115.61 117.27 117.84 118.15 118.45Multifamily ............................................................................ 38 102.14 101.92 102.20 102.53 102.55 102.35 103.18 104.42 105.40 105.46 105.91 106.39 106.97 107.85 110.17 111.69 111.87 112.16Other structures ................................................................... 39 101.87 102.92 103.17 102.27 103.67 104.12 104.49 105.17 106.51 107.25 107.76 108.71 109.61 110.31 111.68 112.50 113.47 113.90
Producers’ durable equipment ............................................ 40 99.69 100.54 100.92 101.39 101.85 102.80 103.61 103.59 103.84 103.83 103.95 104.03 104.59 104.22 104.94 105.59 106.27 105.27
1. Includes new computers and peripheral equipment only.

August •
Table 7.7.—Chain-Type Quantity and Price Indexes for Private Purchasesof Structures by Type
[Index numbers, 1992=100]
Line 1992 1993 1994 1995 1996
Chain-type quantity indexes
Private purchases of structures ............................... 1 100.00 104.71 111.35 110.63 116.72
Nonresidential ...................................................................... 2 100.00 100.95 101.94 106.35 111.51
New .................................................................................... 3 100.00 100.79 101.61 105.94 111.05
Nonresidential buildings, excluding farm ..................... 4 100.00 101.13 105.53 113.83 123.42Industrial ................................................................... 5 100.00 88.25 92.94 100.34 96.82Commercial ............................................................... 6 100.00 103.95 111.54 122.62 131.44
Office buildings 1 .................................................. 7 100.00 99.84 101.98 113.23 119.37Other 2 .................................................................. 8 100.00 107.40 119.55 130.49 141.57
Religious, educational, hospital and institutional,and other 3.
9 100.00 108.73 107.35 111.74 135.31
Utilities ........................................................................... 10 100.00 92.21 86.57 86.99 84.83Railroads ................................................................... 11 100.00 98.94 103.14 105.67 131.66Telecommunications ................................................. 12 100.00 104.87 107.19 113.33 116.82Electric light and power ........................................... 13 100.00 88.03 80.99 73.60 65.58Gas ........................................................................... 14 100.00 79.39 62.22 72.67 62.09Petroleum pipelines .................................................. 15 100.00 112.72 107.89 98.59 107.54
Farm .............................................................................. 16 100.00 136.82 126.19 112.64 135.03Mining exploration, shafts, and wells ........................... 17 100.00 120.05 118.55 107.86 104.18
Petroleum and natural gas ...................................... 18 100.00 121.66 117.30 109.23 106.91Other ......................................................................... 19 100.00 106.36 128.89 96.03 80.56
Other 4 ........................................................................... 20 100.00 90.67 77.61 74.33 59.09
Brokers’ commissions on sale of structures .................... 21 100.00 103.02 109.07 118.99 126.98Net purchases of used structures .................................... 22 ............ ............ ............ ............ ............
Residential ............................................................................ 23 100.00 107.60 118.59 113.91 120.71
New .................................................................................... 24 100.00 108.09 119.17 113.99 120.62
New housing units ........................................................ 25 100.00 106.84 119.96 113.31 122.31Permanent site ......................................................... 26 100.00 106.22 118.61 110.74 119.47
Single-family structures ........................................ 27 100.00 109.06 120.26 108.94 117.22Multifamily structures ........................................... 28 100.00 80.62 104.20 129.13 142.27
Mobile homes ........................................................... 29 100.00 121.64 151.51 172.70 187.84Improvements ................................................................ 30 100.00 110.77 117.42 115.55 116.25Other 5 ........................................................................... 31 100.00 147.83 85.51 124.06 147.25
Brokers’ commissions on sale of structures .................... 32 100.00 105.51 112.02 111.57 120.71Net purchases of used structures .................................... 33 ............ ............ ............ ............ ............
Chain-type price indexes
Private purchases of structures ............................... 34 100.00 103.56 107.12 111.26 113.95
Nonresidential ...................................................................... 35 100.00 103.26 107.00 111.49 114.09
New .................................................................................... 36 100.00 103.27 107.02 111.52 114.11
Nonresidential buildings, excluding farm ..................... 37 100.00 103.38 107.31 111.62 114.14Industrial ................................................................... 38 100.00 103.37 107.29 111.59 114.10Commercial ............................................................... 39 100.00 103.38 107.33 111.66 114.18
Office buildings 1 .................................................. 40 100.00 103.37 107.29 111.59 114.10Other 2 .................................................................. 41 100.00 103.40 107.37 111.71 114.23
Religious, educational, hospital and institutional,and other 3.
42 100.00 103.37 107.29 111.59 114.10
Utilities ........................................................................... 43 100.00 103.19 107.31 110.79 113.70Railroads ................................................................... 44 100.00 107.28 110.60 113.41 118.29Telecommunications ................................................. 45 100.00 102.00 105.01 109.00 114.00Electric light and power ........................................... 46 100.00 103.20 107.50 111.40 112.60Gas ........................................................................... 47 100.00 103.01 108.99 111.01 112.01Petroleum pipelines .................................................. 48 100.00 103.03 108.95 110.99 111.94
Farm .............................................................................. 49 100.00 103.38 107.27 111.59 114.11Mining exploration, shafts, and wells ........................... 50 100.00 103.66 105.69 113.66 115.89
Petroleum and natural gas ...................................... 51 100.00 103.70 105.50 113.90 116.10Other ......................................................................... 52 100.00 103.35 107.30 111.58 114.07
Other 4 ........................................................................... 53 100.00 101.36 104.31 109.02 112.86
Brokers’ commissions on sale of structures .................... 54 100.00 101.66 104.41 107.43 111.36Net purchases of used structures .................................... 55 100.00 102.99 106.95 111.02 114.02
Residential ............................................................................ 56 100.00 103.79 107.22 111.12 113.88
New .................................................................................... 57 100.00 104.12 107.67 111.82 114.29
New housing units ........................................................ 58 100.00 104.67 109.39 113.94 116.26Permanent site ......................................................... 59 100.00 104.66 109.24 113.64 115.88
Single-family structures ........................................ 60 100.00 104.90 109.80 114.40 116.50Multifamily structures ........................................... 61 100.00 102.20 103.20 105.80 109.10
Mobile homes ........................................................... 62 100.00 104.91 112.43 119.53 122.93Improvements ................................................................ 63 100.00 102.85 103.70 106.94 109.76Other 5 ........................................................................... 64 100.00 104.90 109.83 114.49 116.54
Brokers’ commissions on sale of structures .................... 65 100.00 101.50 104.10 106.10 111.00Net purchases of used structures .................................... 66 100.00 104.92 109.72 114.40 117.29
1. Consists of office buildings, except those constructed at industrial sites and those constructed by utilities fortheir own use.
2. Consists of stores, restaurants, garages, service stations, warehouses, mobile structures, and other buildingsused for commercial purposes.
3. Consists of hotels and motels, buildings used primarily for social and recreational activities, and buildings notelsewhere classified, such as passenger terminals, greenhouses, and animal hospitals.
4. Consists primarily of streets, dams and reservoirs, sewer and water facilities, parks, and airfields.5. Consists primarily of dormitories, fraternity and sorority houses, and nurses’ homes.
Table 7.8.—Chain-Type Quantity and Price Indexes for Private Purchasesof Producers’ Durable Equipment by Type
[Index numbers, 1992=100]
Line 1992 1993 1994 1995 1996
Chain-type quantity indexes
Private purchases of producers’ durableequipment.
1 100.00 110.44 122.48 135.59 150.25
Nonresidential equipment ....................................................... 2 100.00 110.52 122.66 135.91 150.77
Information processing and related equipment .................... 3 100.00 110.23 123.07 150.40 188.61Office, computing, and accounting machinery ................. 4 100.00 123.85 144.09 210.69 320.15
Computers and peripheral equipment 1 ....................... 5 100.00 127.63 152.80 233.89 365.81Other ............................................................................. 6 100.00 102.87 99.08 102.55 122.40
Communication equipment ................................................ 7 100.00 97.90 113.18 130.80 147.35Instruments ........................................................................ 8 100.00 106.04 102.56 102.39 105.20Photocopy and related equipment .................................... 9 100.00 110.87 117.41 112.72 111.10
Industrial equipment .............................................................. 10 100.00 108.05 118.14 126.96 131.01Fabricated metal products ................................................ 11 100.00 103.69 113.47 115.47 120.28Engines and turbines ........................................................ 12 100.00 100.25 105.53 90.50 83.92Metalworking machinery .................................................... 13 100.00 108.11 126.01 140.09 143.64Special industry machinery, n.e.c ..................................... 14 100.00 110.05 115.03 128.89 132.72General industrial, including materials handling,
equipment.15 100.00 112.65 122.88 130.62 141.47
Electrical transmission, distribution, and industrialapparatus.
16 100.00 104.52 114.03 121.16 120.76
Transportation and related equipment .................................. 17 100.00 114.11 131.37 137.98 145.10Trucks, buses, and truck trailers ...................................... 18 100.00 123.04 152.97 171.41 185.17Autos .................................................................................. 19 100.00 110.06 135.58 122.99 128.03Aircraft ............................................................................... 20 100.00 96.90 63.58 88.24 89.67Ships and boats ................................................................ 21 100.00 165.15 116.32 109.75 113.87Railroad equipment ........................................................... 22 100.00 115.39 146.08 153.39 137.85
Other equipment .................................................................... 23 100.00 110.34 117.31 122.53 127.87Furniture and fixtures ........................................................ 24 100.00 101.53 107.00 114.36 119.81Tractors .............................................................................. 25 100.00 116.43 131.32 135.33 140.98Agricultural machinery, except tractors ............................ 26 100.00 124.95 137.15 143.65 147.34Construction machinery, except tractors .......................... 27 100.00 126.28 146.59 159.62 166.76Mining and oilfield machinery ........................................... 28 100.00 134.34 126.55 143.07 180.91Service industry machinery ............................................... 29 100.00 106.59 118.39 123.45 127.77Electrical equipment, n.e.c ................................................ 30 100.00 101.37 94.91 93.92 96.97Other .................................................................................. 31 100.00 113.65 116.93 118.20 122.79
Less: Sale of equipment scrap, excluding autos ................. 32 100.00 124.75 111.40 119.58 135.16
Residential equipment ............................................................. 33 100.00 105.86 110.85 115.09 118.12
Chain-type price indexes
Private purchases of producers’ durableequipment.
34 100.00 99.59 99.91 98.96 96.73
Nonresidential equipment ....................................................... 35 100.00 99.57 99.86 98.89 96.62
Information processing and related equipment .................... 36 100.00 95.72 92.08 85.64 77.09Office, computing, and accounting machinery ................. 37 100.00 88.62 80.23 67.98 53.62
Computers and peripheral equipment 1 ....................... 38 100.00 86.69 77.13 63.84 48.98Other ............................................................................. 39 100.00 101.52 103.05 104.18 103.42
Communication equipment ................................................ 40 100.00 99.41 98.36 95.74 94.31Instruments ........................................................................ 41 100.00 102.40 104.05 105.77 107.49Photocopy and related equipment .................................... 42 100.00 101.79 103.16 105.53 108.18
Industrial equipment .............................................................. 43 100.00 101.44 103.58 107.12 108.96Fabricated metal products ................................................ 44 100.00 99.76 100.83 104.60 105.72Engines and turbines ........................................................ 45 100.00 99.75 103.01 106.13 107.74Metalworking machinery .................................................... 46 100.00 101.93 104.69 108.75 111.27Special industry machinery, n.e.c ..................................... 47 100.00 101.84 104.12 107.77 109.86General industrial, including materials handling,
equipment.48 100.00 102.10 104.40 107.51 109.52
Electrical transmission, distribution, and industrialapparatus.
49 100.00 100.90 102.22 105.44 106.23
Transportation and related equipment .................................. 50 100.00 101.63 104.77 105.71 107.56Trucks, buses, and truck trailers ...................................... 51 100.00 104.50 108.75 111.71 112.41Autos .................................................................................. 52 100.00 98.54 100.50 97.63 100.46Aircraft ............................................................................... 53 100.00 102.43 105.45 109.75 113.25Ships and boats ................................................................ 54 100.00 103.37 105.72 107.48 110.48Railroad equipment ........................................................... 55 100.00 100.52 104.23 110.97 113.77
Other equipment .................................................................... 56 100.00 101.80 104.07 106.66 108.67Furniture and fixtures ........................................................ 57 100.00 101.40 104.67 107.62 110.12Tractors .............................................................................. 58 100.00 101.74 104.57 106.03 107.37Agricultural machinery, except tractors ............................ 59 100.00 102.46 105.20 107.85 110.57Construction machinery, except tractors .......................... 60 100.00 102.82 105.27 108.59 111.05Mining and oilfield machinery ........................................... 61 100.00 101.55 103.23 106.98 109.35Service industry machinery ............................................... 62 100.00 101.85 103.51 106.42 108.58Electrical equipment, n.e.c ................................................ 63 100.00 101.11 101.86 103.32 103.07Other .................................................................................. 64 100.00 102.00 103.67 106.18 108.36
Less: Sale of equipment scrap, excluding autos ................. 65 100.00 102.79 119.89 135.26 120.83
Residential equipment ............................................................. 66 100.00 100.64 102.96 103.91 104.84
1. Includes new computers and peripheral equipment only.

• August
Table 7.9.—Chain-Type Quantity and Price Indexes for Exports and Imports of Goods and Services and for Receipts and Payments of Factor Income[Index numbers, 1992=100]
Line 1992 1993 1994 1995 1996
Seasonally adjusted
1992 1993 1994
IV I II III IV I II
Chain-type quantity indexes
Exports of goods and services .................................................................................................. 1 100.00 102.94 111.41 123.74 134.03 101.52 101.22 103.24 101.07 106.21 105.73 110.12Goods 1 ...................................................................................................................................... 2 100.00 103.35 113.62 127.91 140.05 102.75 101.22 103.70 100.74 107.75 106.79 111.72
Durable .................................................................................................................................. 3 100.00 105.53 118.49 136.66 153.97 103.38 102.36 105.79 102.97 111.00 111.28 117.19Nondurable ............................................................................................................................ 4 100.00 98.93 103.87 111.02 114.40 101.45 98.88 99.44 96.18 101.21 97.86 100.87
Services 1 ................................................................................................................................... 5 100.00 101.96 106.38 114.27 120.51 98.65 101.21 102.15 101.81 102.68 103.28 106.46
Receipts of factor income .......................................................................................................... 6 100.00 106.80 122.16 150.59 155.36 96.24 103.90 105.61 108.30 109.37 112.61 116.97
Imports of goods and services .................................................................................................. 7 100.00 108.89 122.13 133.05 145.22 103.02 104.93 108.03 109.04 113.56 115.65 120.79Goods 1 ...................................................................................................................................... 8 100.00 110.49 125.56 137.50 151.06 103.10 106.20 109.72 110.70 115.32 117.72 123.81
Durable .................................................................................................................................. 9 100.00 112.41 131.62 147.71 164.50 103.62 107.65 110.70 112.44 118.86 121.76 129.21Nondurable ............................................................................................................................ 10 100.00 107.09 114.81 119.57 127.78 102.19 103.66 108.02 107.63 109.05 110.57 114.20
Services 1 ................................................................................................................................... 11 100.00 101.91 107.31 113.82 120.06 102.62 99.34 100.63 101.79 105.89 106.61 107.69
Payments of factor income ........................................................................................................ 12 100.00 101.53 126.13 158.25 165.78 98.73 94.56 102.18 100.55 108.83 109.81 120.10
Chain-type price indexes
Exports of goods and services .................................................................................................. 13 100.00 100.07 101.24 103.44 101.61 99.98 99.97 100.22 100.04 100.03 100.44 100.99Goods 1 ...................................................................................................................................... 14 100.00 99.14 99.96 101.74 98.27 99.53 99.35 99.40 99.04 98.79 99.38 99.77
Durable .................................................................................................................................. 15 100.00 98.94 97.99 95.89 90.93 99.48 99.35 99.42 98.72 98.27 98.38 98.36Nondurable ............................................................................................................................ 16 100.00 99.58 104.39 115.55 116.09 99.62 99.32 99.34 99.73 99.92 101.54 102.84
Services 1 ................................................................................................................................... 17 100.00 102.25 104.28 107.61 110.21 101.04 101.43 102.17 102.41 103.00 102.97 103.87
Receipts of factor income .......................................................................................................... 18 100.00 102.42 104.75 107.28 109.36 100.88 101.66 102.24 102.60 103.16 103.76 104.33
Imports of goods and services .................................................................................................. 19 100.00 98.75 99.39 101.62 99.41 100.42 98.82 99.45 98.55 98.19 97.64 98.87Goods 1 ...................................................................................................................................... 20 100.00 98.48 98.93 101.12 98.30 100.48 98.63 99.24 98.27 97.77 97.06 98.54
Durable .................................................................................................................................. 21 100.00 99.09 99.49 99.71 93.63 99.87 99.02 99.16 99.08 99.11 99.11 99.33Nondurable ............................................................................................................................ 22 100.00 97.38 97.95 104.24 108.65 101.56 97.97 99.46 96.80 95.27 93.15 97.00
Services 1 ................................................................................................................................... 23 100.00 100.04 101.61 104.01 105.13 100.15 99.70 100.42 99.86 100.17 100.41 100.44
Payments of factor income ........................................................................................................ 24 100.00 102.60 105.20 108.39 110.63 100.99 101.82 102.41 102.72 103.44 103.71 104.73
Line
Seasonally adjusted
1994 1995 1996 1997
III IV I II III IV I II III IV I II
Chain-type quantity indexes
Exports of goods and services .................................................................................................. 1 112.93 116.88 118.92 121.59 125.50 128.96 129.52 132.53 133.15 140.92 144.30 149.22Goods 1 ...................................................................................................................................... 2 115.54 120.44 122.68 126.09 129.35 133.54 134.88 138.00 138.85 148.48 152.94 160.03
Durable .................................................................................................................................. 3 120.24 125.26 129.20 135.06 138.32 144.07 145.95 152.58 153.17 164.19 171.81 181.78Nondurable ............................................................................................................................ 4 106.07 110.69 109.80 108.77 111.98 113.52 113.97 111.30 112.57 119.77 119.12 121.46
Services 1 ................................................................................................................................... 5 106.99 108.79 110.39 111.42 116.70 118.59 117.43 120.19 120.28 124.14 125.27 125.79
Receipts of factor income .......................................................................................................... 6 125.49 133.56 145.59 153.29 150.09 153.38 150.85 150.91 155.79 163.87 162.90 162.21
Imports of goods and services .................................................................................................. 7 124.56 127.54 130.63 133.09 133.85 134.65 138.87 143.51 148.03 150.48 156.80 164.73Goods 1 ...................................................................................................................................... 8 128.48 132.22 134.62 137.92 138.31 139.15 143.42 148.97 154.49 157.37 163.58 172.91
Durable .................................................................................................................................. 9 134.17 141.35 144.24 147.98 147.75 150.85 156.00 161.60 168.17 172.22 182.08 192.23Nondurable ............................................................................................................................ 10 118.34 116.13 117.71 120.22 121.57 118.78 121.59 126.96 130.74 131.83 132.70 140.59
Services 1 ................................................................................................................................... 11 107.58 107.34 113.37 112.23 114.52 115.14 119.13 119.94 120.29 120.90 127.64 129.88
Payments of factor income ........................................................................................................ 12 131.58 143.05 152.11 156.82 163.66 160.43 157.21 160.60 171.97 173.34 184.53 ...............
Chain-type price indexes
Exports of goods and services .................................................................................................. 13 101.40 102.11 103.21 104.09 103.57 102.88 102.50 102.14 101.47 100.35 99.90 99.36Goods 1 ...................................................................................................................................... 14 100.02 100.69 101.91 102.54 101.75 100.76 99.91 99.24 97.89 96.06 95.55 94.50
Durable .................................................................................................................................. 15 97.90 97.32 97.22 96.66 95.39 94.29 93.17 91.57 90.21 88.77 88.13 87.41Nondurable ............................................................................................................................ 16 104.74 108.45 112.83 116.36 116.84 116.17 116.09 117.87 116.61 113.78 113.67 111.69
Services 1 ................................................................................................................................... 17 104.73 105.54 106.34 107.85 108.07 108.19 109.06 109.53 110.70 111.55 111.29 112.21
Receipts of factor income .......................................................................................................... 18 105.10 105.64 106.37 107.10 107.54 108.04 108.62 109.11 109.56 110.08 110.49 110.96
Imports of goods and services .................................................................................................. 19 100.34 100.72 101.12 102.82 101.77 100.75 100.28 99.83 98.76 98.75 97.42 95.53Goods 1 ...................................................................................................................................... 20 99.90 100.22 100.93 102.38 101.12 100.05 99.41 98.88 97.47 97.42 96.11 93.86
Durable .................................................................................................................................. 21 99.51 100.00 100.10 100.71 99.81 98.23 96.51 94.54 92.74 90.73 89.31 88.23Nondurable ............................................................................................................................ 22 100.82 100.81 102.83 106.05 104.01 104.07 105.84 108.49 107.94 112.34 111.27 106.27
Services 1 ................................................................................................................................... 23 102.44 103.15 101.91 104.88 104.98 104.26 104.67 104.68 105.50 105.69 104.31 104.42
Payments of factor income ........................................................................................................ 24 105.64 106.72 107.53 108.26 108.69 109.06 109.45 110.14 111.14 111.81 112.24 ...............
1. Exports and imports of certain goods, primarily military equipment purchased and sold by the Federal Govern-ment, are included in services. Beginning with 1986, repairs and alterations of equipment are reclassified from goodsto services.

August •
Table 7.10.—Chain-Type Quantity and Price Indexes for Exports and Imports of Goods and Services by Major Type of Product[Index numbers, 1992=100]
Line 1992 1993 1994 1995 1996
Seasonally adjusted
1992 1993 1994
IV I II III IV I II
Chain-type quantity indexes
Exports of goods and services .................................................................................... 1 100.00 102.94 111.41 123.74 134.03 101.52 101.22 103.24 101.07 106.21 105.73 110.12
Exports of goods 1 ....................................................................................................................... 2 100.00 103.35 113.62 127.91 140.05 102.75 101.22 103.70 100.74 107.75 106.79 111.72
Foods, feeds, and beverages ................................................................................................... 3 100.00 99.75 99.56 110.26 109.04 105.48 102.99 101.64 93.70 100.66 92.81 89.37Industrial supplies and materials ............................................................................................... 4 100.00 97.33 102.87 110.83 116.02 98.68 97.54 97.00 95.73 99.06 97.64 102.41
Durable goods ....................................................................................................................... 5 100.00 96.17 101.88 114.81 121.61 98.85 97.02 95.27 95.73 96.67 95.49 99.52Nondurable goods ................................................................................................................. 6 100.00 97.99 103.43 108.73 113.07 98.58 97.85 97.99 95.73 100.41 98.82 104.00
Capital goods, except automotive ............................................................................................. 7 100.00 106.98 124.07 149.65 176.29 104.08 103.14 107.30 103.71 113.75 116.63 122.74Civilian aircraft, engines, and parts ...................................................................................... 8 100.00 84.06 78.68 63.20 71.59 97.30 86.05 93.57 68.55 88.05 85.87 84.87Computers, peripherals, and parts ....................................................................................... 9 100.00 122.11 157.80 231.13 337.98 109.22 111.86 115.90 125.64 135.05 141.77 149.69Other ...................................................................................................................................... 10 100.00 111.36 132.68 164.91 185.57 104.97 106.77 109.73 111.20 117.74 121.58 129.76
Automotive vehicles, engines, and parts .................................................................................. 11 100.00 110.73 120.64 127.48 132.62 106.04 107.66 110.98 106.93 117.34 113.63 119.23Consumer goods, except automotive ....................................................................................... 12 100.00 105.05 114.89 121.74 130.81 102.77 102.74 105.05 105.02 107.39 107.73 113.92
Durable goods ....................................................................................................................... 13 100.00 106.75 114.38 121.60 131.21 102.26 103.63 107.57 106.58 109.23 107.77 115.03Nondurable goods ................................................................................................................. 14 100.00 103.25 115.40 121.88 130.37 103.31 101.79 102.40 103.38 105.43 107.67 112.73
Other .......................................................................................................................................... 15 100.00 93.45 98.05 105.54 109.60 100.38 87.20 94.91 92.77 98.93 89.92 97.13Durable goods ....................................................................................................................... 16 100.00 93.46 98.06 105.54 109.60 100.38 87.21 94.91 92.78 98.94 89.92 97.13Nondurable goods ................................................................................................................. 17 100.00 93.45 98.05 105.54 109.60 100.38 87.20 94.91 92.77 98.93 89.92 97.13
Exports of services 1 ................................................................................................................... 18 100.00 101.96 106.38 114.27 120.51 98.65 101.21 102.15 101.81 102.68 103.28 106.46
Transfers under U.S. military agency sales contracts ............................................................. 19 100.00 103.97 93.40 106.35 111.75 82.23 112.31 111.42 105.79 86.35 85.13 98.83Travel ......................................................................................................................................... 20 100.00 103.37 102.43 108.03 114.43 100.19 102.40 103.56 103.32 104.22 101.65 103.13Passenger fares ......................................................................................................................... 21 100.00 98.43 98.79 104.80 112.61 101.06 100.08 97.55 98.19 97.88 99.26 99.42Other transportation ................................................................................................................... 22 100.00 95.79 103.99 112.34 108.78 96.95 96.07 95.67 94.18 97.24 97.63 103.91Royalties and license fees ........................................................................................................ 23 100.00 98.99 108.04 127.45 136.87 97.39 97.20 100.86 97.59 100.30 102.29 106.12Other private services ............................................................................................................... 24 100.00 104.63 115.48 123.89 134.38 100.90 101.73 102.78 104.94 109.06 111.41 114.76Other .......................................................................................................................................... 25 100.00 104.07 110.12 107.56 109.14 99.13 101.76 105.01 104.59 104.93 110.10 108.86
Imports of goods and services ..................................................................................... 26 100.00 108.89 122.13 133.05 145.22 103.02 104.93 108.03 109.04 113.56 115.65 120.79
Imports of goods 1 ....................................................................................................................... 27 100.00 110.49 125.56 137.50 151.06 103.10 106.20 109.72 110.70 115.32 117.72 123.81
Foods, feeds, and beverages ................................................................................................... 28 100.00 101.39 103.94 106.18 116.82 100.21 101.68 101.64 100.18 102.06 104.65 105.50Industrial supplies and materials, except petroleum and products ......................................... 29 100.00 108.88 124.85 131.03 138.73 101.92 104.70 106.70 110.19 113.92 117.73 123.30
Durable goods ....................................................................................................................... 30 100.00 109.88 132.01 136.74 146.42 101.97 103.55 104.53 111.54 119.92 121.95 131.42Nondurable goods ................................................................................................................. 31 100.00 107.96 118.22 125.75 131.63 101.88 105.77 108.73 108.96 108.38 113.82 115.78
Petroleum and products ............................................................................................................ 32 100.00 109.94 116.75 114.94 123.72 102.73 104.03 112.34 110.31 113.07 110.56 117.42Capital goods, except automotive ............................................................................................. 33 100.00 118.04 146.69 183.62 219.36 106.24 110.12 116.87 118.24 126.91 134.36 142.31
Civilian aircraft, engines, and parts ...................................................................................... 34 100.00 86.91 84.58 78.27 88.71 101.93 82.46 90.45 80.19 94.55 85.24 91.67Computers, peripherals, and parts ....................................................................................... 35 100.00 140.67 196.41 279.82 373.29 112.77 123.48 135.34 146.76 157.10 168.68 186.14Other ...................................................................................................................................... 36 100.00 115.04 140.34 171.61 197.41 104.57 109.50 114.35 114.54 121.78 130.39 135.74
Automotive vehicles, engines, and parts .................................................................................. 37 100.00 109.93 122.97 125.02 129.38 102.67 109.00 109.54 108.03 113.13 113.48 120.63Consumer goods, except automotive ....................................................................................... 38 100.00 108.38 117.40 126.45 134.78 102.23 105.17 107.08 110.05 111.24 111.16 116.11
Durable goods ....................................................................................................................... 39 100.00 108.64 118.54 126.97 135.52 101.41 105.80 105.68 110.33 112.73 111.48 117.81Nondurable goods ................................................................................................................. 40 100.00 108.11 116.14 125.87 133.96 103.12 104.47 108.60 109.74 109.61 110.81 114.25
Other .......................................................................................................................................... 41 100.00 102.49 113.67 116.01 124.65 100.24 97.32 102.21 101.48 108.97 110.28 114.88Durable goods ....................................................................................................................... 42 100.00 102.49 113.67 116.01 124.65 100.24 97.32 102.21 101.48 108.97 110.28 114.88Nondurable goods ................................................................................................................. 43 100.00 102.49 113.67 116.01 124.65 100.24 97.32 102.21 101.48 108.97 110.28 114.88
Imports of services 1 ................................................................................................................... 44 100.00 101.91 107.31 113.82 120.06 102.62 99.34 100.63 101.79 105.89 106.61 107.69
Direct defense expenditures ...................................................................................................... 45 100.00 91.82 75.73 65.58 72.71 98.35 97.59 95.09 86.20 88.41 85.07 80.88Travel ......................................................................................................................................... 46 100.00 104.90 108.65 111.65 115.75 102.49 101.72 100.64 104.51 112.72 109.45 110.69Passenger fares ......................................................................................................................... 47 100.00 108.84 123.32 131.23 141.57 105.64 106.01 104.84 108.94 115.59 121.76 124.20Other transportation ................................................................................................................... 48 100.00 100.56 106.90 109.77 108.20 100.65 98.99 101.67 99.57 102.00 102.09 106.48Royalties and license fees ........................................................................................................ 49 100.00 92.68 104.62 119.41 131.88 86.78 84.81 92.63 95.76 97.54 116.87 94.19Other private services ............................................................................................................... 50 100.00 103.63 117.21 141.45 156.64 109.91 96.67 102.69 106.24 108.93 110.94 115.29Other .......................................................................................................................................... 51 100.00 99.78 104.21 105.62 107.59 99.27 101.72 100.09 103.05 94.26 101.45 103.57
Addenda:Exports of agricultural goods 2 .............................................................................................. 52 100.00 97.68 100.76 112.32 110.25 104.35 99.40 99.65 93.01 98.64 91.74 93.56Exports of nonagricultural goods .......................................................................................... 53 100.00 103.98 115.06 129.66 143.68 102.57 101.41 104.14 101.59 108.77 108.50 113.79Imports of nonpetroleum goods ............................................................................................ 54 100.00 110.54 126.37 139.59 153.63 103.10 106.41 109.47 110.74 115.54 118.39 124.40
See note at end of table.

• August
Table 7.10.—Chain-Type Quantity and Price Indexes for Exports and Imports of Goods and Services by Major Type of Product—Continued[Index numbers, 1992=100]
Line 1992 1993 1994 1995 1996
Seasonally adjusted
1992 1993 1994
IV I II III IV I II
Chain-type price indexes
Exports of goods and services .................................................................................... 55 100.00 100.07 101.24 103.44 101.61 99.98 99.97 100.22 100.04 100.03 100.44 100.99
Exports of goods 1 ....................................................................................................................... 56 100.00 99.14 99.96 101.74 98.27 99.53 99.35 99.40 99.04 98.79 99.38 99.77
Foods, feeds, and beverages ................................................................................................... 57 100.00 101.15 104.48 113.49 126.27 98.10 98.93 99.26 102.41 103.98 107.24 105.68Industrial supplies and materials ............................................................................................... 58 100.00 100.47 107.09 121.32 115.72 100.72 100.44 101.30 100.40 99.73 101.38 104.08
Durable goods ....................................................................................................................... 59 100.00 106.08 109.99 117.82 113.74 102.13 104.22 107.42 106.72 105.97 107.81 108.70Nondurable goods ................................................................................................................. 60 100.00 97.45 105.52 123.27 116.78 99.97 98.42 98.02 97.00 96.37 97.89 101.56
Capital goods, except automotive ............................................................................................. 61 100.00 96.68 93.96 88.73 81.56 98.45 97.70 97.21 96.26 95.54 95.15 94.82Civilian aircraft, engines, and parts ...................................................................................... 62 100.00 103.06 106.03 109.60 114.01 101.01 102.11 102.91 103.23 103.98 105.19 105.81Computers, peripherals, and parts ....................................................................................... 63 100.00 83.47 73.41 59.65 44.97 93.48 89.40 85.27 81.52 77.70 76.38 75.25Other ...................................................................................................................................... 64 100.00 98.42 96.61 92.97 87.85 98.96 98.57 98.69 98.28 98.14 97.66 97.31
Automotive vehicles, engines, and parts .................................................................................. 65 100.00 100.89 101.84 103.13 104.25 100.64 100.89 100.94 100.73 101.00 101.38 101.62Consumer goods, except automotive ....................................................................................... 66 100.00 101.17 101.53 102.91 104.27 100.63 101.19 101.14 101.10 101.26 101.50 101.54
Durable goods ....................................................................................................................... 67 100.00 100.23 100.68 101.52 102.71 100.42 100.65 100.14 100.02 100.11 100.66 100.78Nondurable goods ................................................................................................................. 68 100.00 102.20 102.45 104.40 105.95 100.85 101.78 102.23 102.28 102.50 102.42 102.37
Other .......................................................................................................................................... 69 100.00 100.60 102.48 105.79 103.61 99.96 100.34 100.69 100.61 100.75 101.36 101.95Durable goods ....................................................................................................................... 70 100.00 100.60 102.48 105.79 103.61 99.96 100.34 100.69 100.60 100.73 101.32 101.90Nondurable goods ................................................................................................................. 71 100.00 100.60 102.48 105.79 103.61 99.96 100.34 100.69 100.60 100.73 101.32 101.90
Exports of services 1 ................................................................................................................... 72 100.00 102.25 104.28 107.61 110.21 101.04 101.43 102.17 102.41 103.00 102.97 103.87
Transfers under U.S. military agency sales contracts ............................................................. 73 100.00 102.37 107.48 110.58 111.29 100.55 100.93 101.22 102.76 104.56 105.49 107.82Travel ......................................................................................................................................... 74 100.00 102.27 104.18 107.20 111.60 100.97 101.36 102.09 102.45 103.18 103.50 104.25Passenger fares ......................................................................................................................... 75 100.00 101.56 104.06 109.82 109.86 99.27 99.33 101.93 102.82 102.21 102.75 102.96Other transportation ................................................................................................................... 76 100.00 101.56 101.23 102.99 105.61 102.16 101.27 102.24 101.48 101.28 100.19 100.28Royalties and license fees ........................................................................................................ 77 100.00 102.47 104.79 107.34 109.41 100.93 101.71 102.29 102.65 103.21 103.81 104.38Other private services ............................................................................................................... 78 100.00 102.25 103.96 106.08 107.81 101.06 101.81 102.08 102.28 102.82 103.24 103.70Other .......................................................................................................................................... 79 100.00 103.65 107.73 117.80 122.10 101.92 102.93 103.48 103.20 104.99 101.69 106.02
Imports of goods and services ..................................................................................... 80 100.00 98.75 99.39 101.62 99.41 100.42 98.82 99.45 98.55 98.19 97.64 98.87
Imports of goods 1 ....................................................................................................................... 81 100.00 98.48 98.93 101.12 98.30 100.48 98.63 99.24 98.27 97.77 97.06 98.54
Foods, feeds, and beverages ................................................................................................... 82 100.00 99.55 107.88 113.17 110.72 99.00 97.34 98.41 100.63 101.80 101.53 104.63Industrial supplies and materials, except petroleum and products ......................................... 83 100.00 99.20 102.14 111.17 109.62 100.32 99.79 99.69 98.57 98.76 99.64 100.45
Durable goods ....................................................................................................................... 84 100.00 100.06 103.58 111.63 110.07 99.51 100.83 100.56 98.99 99.87 101.20 102.14Nondurable goods ................................................................................................................. 85 100.00 98.41 100.80 110.80 109.26 101.07 98.84 98.88 98.20 97.72 98.18 98.85
Petroleum and products ............................................................................................................ 86 100.00 90.78 85.15 94.73 113.99 103.53 95.05 98.75 88.06 81.58 73.45 85.02Capital goods, except automotive ............................................................................................. 87 100.00 96.11 93.62 89.83 77.78 98.89 97.06 96.42 96.08 94.90 94.19 94.03
Civilian aircraft, engines, and parts ...................................................................................... 88 100.00 103.12 106.19 108.75 113.54 101.07 102.00 103.08 103.41 104.00 105.50 106.08Computers, peripherals, and parts ....................................................................................... 89 100.00 85.31 74.17 63.47 52.01 95.08 91.84 87.14 83.28 79.00 77.56 75.79Other ...................................................................................................................................... 90 100.00 99.50 100.50 100.02 87.18 100.00 98.35 99.05 100.26 100.34 99.78 100.27
Automotive vehicles, engines, and parts .................................................................................. 91 100.00 101.51 104.79 107.88 108.57 100.80 100.03 101.15 101.70 103.15 103.64 104.23Consumer goods, except automotive ....................................................................................... 92 100.00 100.85 101.58 103.10 103.45 101.16 100.13 100.86 101.12 101.31 101.17 101.37
Durable goods ....................................................................................................................... 93 100.00 101.16 101.82 103.09 103.06 100.70 100.50 101.01 101.49 101.66 101.75 101.71Nondurable goods ................................................................................................................. 94 100.00 100.52 101.33 103.12 103.87 101.65 99.72 100.70 100.73 100.92 100.53 100.99
Other .......................................................................................................................................... 95 100.00 100.68 103.17 107.40 107.43 100.56 99.82 100.61 100.81 101.47 101.58 102.30Durable goods ....................................................................................................................... 96 100.00 100.68 103.17 107.40 107.43 100.56 99.82 100.61 100.81 101.47 101.58 102.30Nondurable goods ................................................................................................................. 97 100.00 100.68 103.17 107.40 107.43 100.56 99.82 100.61 100.81 101.47 101.58 102.30
Imports of services 1 ................................................................................................................... 98 100.00 100.04 101.61 104.01 105.13 100.15 99.70 100.42 99.86 100.17 100.41 100.44
Direct defense expenditures ...................................................................................................... 99 100.00 96.05 98.23 109.01 107.97 98.81 93.92 97.10 98.03 95.15 92.39 96.49Travel ......................................................................................................................................... 100 100.00 100.67 104.52 107.00 109.23 99.80 100.27 101.31 99.73 101.35 103.13 102.00Passenger fares ......................................................................................................................... 101 100.00 98.48 98.99 104.20 105.58 98.88 97.99 98.99 99.22 97.70 98.10 97.76Other transportation ................................................................................................................... 102 100.00 100.56 100.13 101.07 103.29 101.01 100.35 100.92 100.53 100.44 99.50 99.69Royalties and license fees ........................................................................................................ 103 100.00 102.49 104.74 107.35 109.42 100.93 101.71 102.29 102.65 103.21 103.81 104.38Other private services ............................................................................................................... 104 100.00 100.43 100.32 100.12 99.25 100.69 101.15 100.20 99.86 100.52 100.41 100.36Other .......................................................................................................................................... 105 100.00 101.71 104.68 107.16 109.36 100.45 101.11 101.87 101.43 102.42 103.53 103.40
Addenda:Exports of agricultural goods 2 .............................................................................................. 106 100.00 101.58 106.04 115.67 126.61 99.14 99.88 99.37 102.76 104.31 107.95 106.24Exports of nonagricultural goods .......................................................................................... 107 100.00 98.89 99.35 100.38 95.65 99.55 99.28 99.39 98.66 98.23 98.53 99.13Imports of nonpetroleum goods ............................................................................................ 108 100.00 99.28 100.34 101.86 97.16 100.16 99.03 99.33 99.33 99.42 99.42 99.87
See note at end of table.

August •
Table 7.10.—Chain-Type Quantity and Price Indexes for Exports and Imports of Goods and Services by Major Type of Product—Continued[Index numbers, 1992=100]
Line
Seasonally adjusted
1994 1995 1996 1997
III IV I II III IV I II III IV I II
Chain-type quantity indexes
Exports of goods and services .................................................................................... 1 112.93 116.88 118.92 121.59 125.50 128.96 129.52 132.53 133.15 140.92 144.30 149.22
Exports of goods 1 ....................................................................................................................... 2 115.54 120.44 122.68 126.09 129.35 133.54 134.88 138.00 138.85 148.48 152.94 160.03
Foods, feeds, and beverages ................................................................................................... 3 100.00 116.06 112.12 107.81 113.58 107.52 110.69 102.23 106.22 117.01 107.05 107.44Industrial supplies and materials ............................................................................................... 4 105.67 105.78 108.23 109.00 112.17 113.94 114.02 114.10 115.44 120.53 121.51 124.58
Durable goods ....................................................................................................................... 5 105.54 106.98 111.22 113.95 119.01 115.07 116.32 121.24 123.20 125.69 127.44 129.48Nondurable goods ................................................................................................................. 6 105.76 105.15 106.67 106.38 108.56 113.31 112.78 110.34 111.36 117.81 118.39 122.00
Capital goods, except automotive ............................................................................................. 7 125.79 131.12 135.89 147.61 152.75 162.33 165.84 174.12 173.67 191.52 202.24 219.21Civilian aircraft, engines, and parts ...................................................................................... 8 70.92 73.07 60.83 75.17 56.93 59.85 62.41 77.89 61.81 84.26 89.29 104.74Computers, peripherals, and parts ....................................................................................... 9 161.49 178.25 192.09 209.30 245.60 277.53 305.15 326.95 348.56 371.25 425.35 488.62Other ...................................................................................................................................... 10 137.60 141.76 151.02 160.16 170.06 178.38 178.36 181.01 184.71 198.17 205.08 215.34
Automotive vehicles, engines, and parts .................................................................................. 11 121.06 128.64 131.94 124.69 125.83 127.45 128.01 131.08 135.07 136.33 143.80 145.29Consumer goods, except automotive ....................................................................................... 12 116.95 120.95 119.65 122.07 122.03 123.22 127.85 130.46 129.26 135.65 139.66 144.59
Durable goods ....................................................................................................................... 13 114.60 120.11 121.01 123.56 119.46 122.37 126.06 130.61 129.81 138.38 138.59 145.11Nondurable goods ................................................................................................................. 14 119.40 121.80 118.21 120.51 124.69 124.10 129.70 130.29 128.68 132.80 140.75 144.02
Other .......................................................................................................................................... 15 101.64 103.53 103.79 102.82 101.53 114.03 102.27 111.59 109.92 114.59 122.19 122.09Durable goods ....................................................................................................................... 16 101.64 103.53 103.80 102.82 101.53 114.03 102.27 111.59 109.92 114.60 122.20 122.09Nondurable goods ................................................................................................................. 17 101.63 103.53 103.79 102.82 101.53 114.03 102.27 111.59 109.92 114.59 122.19 122.09
Exports of services 1 ................................................................................................................... 18 106.99 108.79 110.39 111.42 116.70 118.59 117.43 120.19 120.28 124.14 125.27 125.79
Transfers under U.S. military agency sales contracts ............................................................. 19 103.91 85.74 103.13 107.27 114.16 100.82 93.34 123.19 106.13 124.35 101.68 111.97Travel ......................................................................................................................................... 20 101.44 103.50 103.34 102.65 110.83 115.31 111.02 114.19 114.82 117.69 119.26 117.52Passenger fares ......................................................................................................................... 21 98.57 97.91 101.66 97.74 107.30 112.50 111.98 110.22 114.88 113.35 124.53 117.60Other transportation ................................................................................................................... 22 104.46 109.94 108.72 112.15 112.45 116.04 106.03 109.20 107.32 112.55 111.72 115.97Royalties and license fees ........................................................................................................ 23 110.29 113.45 121.80 125.61 131.45 130.92 136.65 134.45 136.63 139.76 139.78 140.31Other private services ............................................................................................................... 24 115.34 120.41 119.61 122.11 125.62 128.23 131.41 132.59 134.48 139.03 143.25 144.90Other .......................................................................................................................................... 25 110.50 111.01 108.26 106.72 108.31 106.93 110.81 108.54 108.48 108.73 109.21 109.68
Imports of goods and services ..................................................................................... 26 124.56 127.54 130.63 133.09 133.85 134.65 138.87 143.51 148.03 150.48 156.80 164.73
Imports of goods 1 ....................................................................................................................... 27 128.48 132.22 134.62 137.92 138.31 139.15 143.42 148.97 154.49 157.37 163.58 172.91
Foods, feeds, and beverages ................................................................................................... 28 103.99 101.61 107.89 105.21 105.18 106.44 114.15 115.13 117.84 120.16 123.78 130.65Industrial supplies and materials, except petroleum and products ......................................... 29 127.19 131.19 132.16 134.82 129.13 128.02 133.07 136.90 142.02 142.95 143.73 150.55
Durable goods ....................................................................................................................... 30 134.65 140.02 141.62 142.26 131.68 131.40 138.75 145.81 150.17 150.97 150.80 160.23Nondurable goods ................................................................................................................. 31 120.28 123.02 123.43 127.95 126.74 124.87 127.81 128.68 134.50 135.54 137.18 141.54
Petroleum and products ............................................................................................................ 32 126.21 112.80 110.46 113.76 121.00 114.53 112.29 127.68 130.93 123.98 120.50 131.68Capital goods, except automotive ............................................................................................. 33 149.72 160.38 166.98 178.99 188.91 199.58 205.30 211.66 222.42 238.05 253.47 276.03
Civilian aircraft, engines, and parts ...................................................................................... 34 73.29 88.10 77.98 82.32 75.73 77.04 77.75 89.74 90.58 96.77 92.67 106.14Computers, peripherals, and parts ....................................................................................... 35 203.28 227.54 232.02 259.83 294.85 332.56 337.78 361.15 383.34 410.89 455.71 530.25Other ...................................................................................................................................... 36 144.41 150.82 160.10 169.03 175.73 181.57 187.96 189.44 199.06 213.17 225.32 237.53
Automotive vehicles, engines, and parts .................................................................................. 37 126.11 131.64 132.28 127.35 121.30 119.16 124.44 129.70 134.07 129.32 142.67 140.64Consumer goods, except automotive ....................................................................................... 38 118.89 123.43 126.21 127.95 127.06 124.58 128.72 131.95 136.62 141.81 143.88 154.06
Durable goods ....................................................................................................................... 39 119.31 125.57 126.59 128.43 126.72 126.16 129.36 133.23 138.66 140.82 143.19 154.60Nondurable goods ................................................................................................................. 40 118.43 121.08 125.79 127.42 127.41 122.86 128.02 130.57 134.41 142.86 144.62 153.47
Other .......................................................................................................................................... 41 115.65 113.89 110.77 117.95 115.41 119.91 120.88 124.73 125.92 127.07 133.79 138.54Durable goods ....................................................................................................................... 42 115.65 113.89 110.77 117.95 115.41 119.91 120.88 124.73 125.92 127.07 133.79 138.54Nondurable goods ................................................................................................................. 43 115.65 113.89 110.77 117.95 115.41 119.91 120.88 124.73 125.92 127.07 133.79 138.54
Imports of services 1 ................................................................................................................... 44 107.58 107.34 113.37 112.23 114.52 115.14 119.13 119.94 120.29 120.90 127.64 129.88
Direct defense expenditures ...................................................................................................... 45 70.80 66.18 70.41 63.68 65.20 63.02 69.77 74.32 74.42 72.34 79.33 81.38Travel ......................................................................................................................................... 46 108.52 105.95 113.18 109.40 109.87 114.16 119.55 116.07 111.42 115.97 127.31 130.76Passenger fares ......................................................................................................................... 47 125.45 121.89 124.09 130.32 134.98 135.52 138.79 142.04 142.09 143.35 149.12 144.48Other transportation ................................................................................................................... 48 110.28 108.74 110.93 109.75 110.99 107.42 104.71 110.62 109.77 107.70 110.16 113.58Royalties and license fees ........................................................................................................ 49 101.66 105.76 111.92 114.98 123.83 126.90 125.05 121.60 154.18 126.69 135.99 135.28Other private services ............................................................................................................... 50 117.22 125.41 136.31 140.00 144.51 144.97 154.06 154.31 157.00 161.19 165.61 169.00Other .......................................................................................................................................... 51 106.86 104.95 110.07 103.39 105.12 103.90 105.46 106.28 108.64 109.99 111.87 112.44
Addenda:Exports of agricultural goods 2 .............................................................................................. 52 102.72 115.01 114.64 109.25 114.29 111.09 114.41 103.00 106.20 117.38 108.28 113.18Exports of nonagricultural goods .......................................................................................... 53 116.97 120.98 123.52 127.98 130.99 136.17 137.26 142.34 142.86 152.24 158.58 165.95Imports of nonpetroleum goods ............................................................................................ 54 128.68 134.02 136.89 140.19 139.83 141.45 146.41 150.84 156.57 160.69 168.20 177.24
See note at end of table.

• August
Table 7.10.—Chain-Type Quantity and Price Indexes for Exports and Imports of Goods and Services by Major Type of Product—Continued[Index numbers, 1992=100]
Line
Seasonally adjusted
1994 1995 1996 1997
III IV I II III IV I II III IV I II
Chain-type price indexes
Exports of goods and services .................................................................................... 55 101.40 102.11 103.21 104.09 103.57 102.88 102.50 102.14 101.47 100.35 99.90 99.36
Exports of goods 1 ....................................................................................................................... 56 100.02 100.69 101.91 102.54 101.75 100.76 99.91 99.24 97.89 96.06 95.55 94.50
Foods, feeds, and beverages ................................................................................................... 57 101.62 103.40 105.31 109.25 117.00 122.41 125.22 133.86 128.50 117.48 117.60 110.51Industrial supplies and materials ............................................................................................... 58 108.71 114.20 120.71 124.23 121.85 118.49 116.90 115.62 115.05 115.29 115.52 115.43
Durable goods ....................................................................................................................... 59 110.08 113.37 117.55 118.79 118.11 116.80 116.00 114.56 112.30 112.12 113.19 113.34Nondurable goods ................................................................................................................. 60 107.97 114.68 122.48 127.27 123.92 119.40 117.34 116.16 116.58 117.06 116.81 116.56
Capital goods, except automotive ............................................................................................. 61 93.80 92.06 91.00 89.80 87.89 86.21 84.59 82.36 80.68 78.60 77.42 76.31Civilian aircraft, engines, and parts ...................................................................................... 62 106.31 106.82 108.38 109.27 109.89 110.86 112.01 113.35 114.97 115.70 117.81 117.50Computers, peripherals, and parts ....................................................................................... 63 73.09 68.93 64.67 61.98 57.89 54.04 50.37 45.84 43.23 40.46 37.77 35.05Other ...................................................................................................................................... 64 96.38 95.08 94.62 93.57 92.35 91.32 90.28 88.68 87.16 85.25 84.49 84.29
Automotive vehicles, engines, and parts .................................................................................. 65 101.88 102.46 102.72 102.75 102.97 104.10 104.10 104.13 104.24 104.53 104.92 105.15Consumer goods, except automotive ....................................................................................... 66 101.36 101.71 102.21 102.93 103.20 103.30 103.91 104.25 104.39 104.53 104.80 104.84
Durable goods ....................................................................................................................... 67 100.46 100.83 101.05 101.32 101.84 101.88 102.33 102.75 102.86 102.92 103.38 103.83Nondurable goods ................................................................................................................. 68 102.33 102.67 103.45 104.65 104.65 104.84 105.60 105.87 106.05 106.27 106.32 105.93
Other .......................................................................................................................................... 69 102.73 103.90 105.62 106.40 105.94 105.21 104.92 104.52 103.38 101.61 101.12 100.65Durable goods ....................................................................................................................... 70 102.68 103.86 105.61 106.41 105.96 105.24 104.96 104.56 103.42 101.65 101.16 100.69Nondurable goods ................................................................................................................. 71 102.68 103.86 105.61 106.41 105.96 105.24 104.96 104.56 103.42 101.65 101.16 100.69
Exports of services 1 ................................................................................................................... 72 104.73 105.54 106.34 107.85 108.07 108.19 109.06 109.53 110.70 111.55 111.29 112.21
Transfers under U.S. military agency sales contracts ............................................................. 73 107.95 108.64 108.33 110.66 110.77 112.57 115.15 110.54 109.83 109.65 110.56 110.76Travel ......................................................................................................................................... 74 104.39 104.55 105.11 107.07 107.85 108.58 109.99 111.07 112.38 112.89 114.09 114.70Passenger fares ......................................................................................................................... 75 104.44 106.11 108.28 112.57 109.68 108.95 109.35 108.14 109.73 112.16 102.75 109.52Other transportation ................................................................................................................... 76 102.52 101.93 102.54 103.99 103.09 102.34 104.35 105.23 105.69 107.16 106.69 105.62Royalties and license fees ........................................................................................................ 77 105.16 105.70 106.43 107.16 107.60 108.10 108.68 109.17 109.62 110.14 110.55 111.02Other private services ............................................................................................................... 78 104.27 104.60 105.13 105.81 106.71 106.66 107.17 107.68 107.95 108.43 108.78 109.36Other .......................................................................................................................................... 79 108.27 114.93 117.25 118.02 118.42 117.49 115.58 118.51 126.05 128.28 129.06 130.09
Imports of goods and services ..................................................................................... 80 100.34 100.72 101.12 102.82 101.77 100.75 100.28 99.83 98.76 98.75 97.42 95.53
Imports of goods 1 ....................................................................................................................... 81 99.90 100.22 100.93 102.38 101.12 100.05 99.41 98.88 97.47 97.42 96.11 93.86
Foods, feeds, and beverages ................................................................................................... 82 111.59 113.76 114.61 112.99 113.50 111.56 109.23 112.89 110.06 110.71 111.37 113.45Industrial supplies and materials, except petroleum and products ......................................... 83 102.49 105.99 108.91 110.96 112.43 112.38 110.90 109.51 108.70 109.35 110.46 108.88
Durable goods ....................................................................................................................... 84 103.74 107.23 110.16 111.00 113.04 112.33 110.02 110.41 109.99 109.86 111.36 112.55Nondurable goods ................................................................................................................. 85 101.34 104.84 107.75 111.02 111.91 112.52 111.89 108.71 107.49 108.95 109.66 105.29
Petroleum and products ............................................................................................................ 86 93.08 87.88 92.73 101.53 92.17 92.60 100.96 112.45 112.85 128.60 123.38 105.04Capital goods, except automotive ............................................................................................. 87 93.51 92.74 91.88 91.86 89.33 86.23 83.27 79.47 76.05 72.32 69.65 67.82
Civilian aircraft, engines, and parts ...................................................................................... 88 106.37 106.79 107.84 108.57 108.90 109.70 111.56 113.14 114.47 114.99 117.21 118.31Computers, peripherals, and parts ....................................................................................... 89 73.03 70.30 67.67 64.87 62.22 59.12 56.35 52.87 50.65 48.16 45.26 41.98Other ...................................................................................................................................... 90 100.88 101.06 101.01 102.42 99.90 96.74 93.54 89.42 85.15 80.62 78.03 77.30
Automotive vehicles, engines, and parts .................................................................................. 91 104.86 106.42 106.51 107.91 108.34 108.74 108.56 108.43 108.64 108.67 108.67 108.50Consumer goods, except automotive ....................................................................................... 92 101.75 102.05 102.34 103.24 103.44 103.39 103.72 103.56 103.37 103.14 102.67 102.43
Durable goods ....................................................................................................................... 93 101.85 101.96 102.41 103.19 103.51 103.23 103.54 103.19 102.90 102.61 101.84 100.94Nondurable goods ................................................................................................................. 94 101.64 102.15 102.27 103.29 103.36 103.57 103.93 103.97 103.89 103.72 103.57 104.06
Other .......................................................................................................................................... 95 103.66 105.12 106.05 107.61 108.01 107.92 107.78 107.60 107.08 107.24 107.05 106.40Durable goods ....................................................................................................................... 96 103.66 105.12 106.05 107.61 108.01 107.92 107.78 107.60 107.08 107.24 107.05 106.40Nondurable goods ................................................................................................................. 97 103.66 105.12 106.05 107.61 108.01 107.92 107.78 107.60 107.08 107.24 107.05 106.40
Imports of services 1 ................................................................................................................... 98 102.44 103.15 101.91 104.88 104.98 104.26 104.67 104.68 105.50 105.69 104.31 104.42
Direct defense expenditures ...................................................................................................... 99 101.27 102.77 103.47 111.79 109.45 111.32 108.21 106.83 107.94 108.89 101.94 101.03Travel ......................................................................................................................................... 100 105.61 107.49 103.42 109.01 108.57 107.11 108.36 108.17 110.96 109.53 106.66 105.57Passenger fares ......................................................................................................................... 101 99.66 100.43 102.57 104.87 104.08 105.28 105.42 105.22 104.56 107.13 108.68 112.91Other transportation ................................................................................................................... 102 100.81 100.54 100.40 101.42 101.20 101.25 102.22 103.03 103.32 104.57 104.33 103.95Royalties and license fees ........................................................................................................ 103 105.16 105.70 106.43 107.16 107.60 108.10 108.68 109.17 109.62 110.14 110.55 111.02Other private services ............................................................................................................... 104 100.39 100.13 99.46 99.74 101.67 99.60 99.50 99.51 98.93 99.08 98.61 99.18Other .......................................................................................................................................... 105 105.36 106.44 105.13 107.88 107.96 107.66 108.52 108.76 110.20 109.96 109.04 108.87
Addenda:Exports of agricultural goods 2 .............................................................................................. 106 103.55 106.42 109.36 111.86 118.13 123.34 125.65 133.20 128.81 118.80 119.38 112.26Exports of nonagricultural goods .......................................................................................... 107 99.64 100.10 101.13 101.58 100.17 98.64 97.52 96.13 95.04 93.91 93.31 92.73Imports of nonpetroleum goods ............................................................................................ 108 100.62 101.46 101.84 102.65 102.08 100.88 99.47 97.92 96.32 94.93 93.92 92.91
NOTE.—See footnotes to table 4.3.

August •
Table 7.11.—Chain-Type Quantity and Price Indexes for Government Consumption Expenditures and Gross Investment by Type[Index numbers, 1992=100]
Line 1992 1993 1994 1995 1996
Seasonally adjusted
1992 1993 1994
IV I II III IV I II
Chain-type quantity indexes
Government consumption expenditures and gross investment 1 ................................ 1 100.00 99.08 99.09 99.06 99.54 100.69 98.92 99.16 98.95 99.29 98.27 98.38
Federal ........................................................................................................................................... 2 100.00 95.78 92.17 89.08 87.92 101.14 97.00 96.19 94.98 94.95 92.28 91.13
National defense ...................................................................................................................... 3 100.00 94.32 89.66 85.84 84.56 100.28 95.58 94.92 93.42 93.36 89.19 89.40Consumption expenditures .................................................................................................... 4 100.00 95.72 91.41 87.77 86.20 100.93 96.52 96.09 95.42 94.86 91.46 91.19
Durable goods 2 ................................................................................................................ 5 100.00 88.78 75.84 69.25 72.27 98.54 89.02 99.09 86.70 80.30 75.66 73.24Nondurable goods ............................................................................................................. 6 100.00 90.32 82.18 66.48 76.05 91.57 87.26 93.17 98.62 82.23 77.13 77.80Services ............................................................................................................................. 7 100.00 96.65 93.36 90.40 88.01 101.50 97.63 95.87 96.25 96.82 93.60 93.53
Compensation of general government employees, except force-accountconstruction 3.
8 100.00 95.35 90.42 85.49 81.89 98.89 97.40 95.95 94.98 93.06 92.05 91.14
Consumption of general government fixed capital 4 ................................................... 9 100.00 99.90 98.59 96.76 94.82 100.28 100.23 100.02 99.80 99.54 99.15 98.85Other services ............................................................................................................... 10 100.00 96.74 95.00 94.74 94.25 106.79 96.31 93.00 96.12 101.55 92.58 94.13
Gross investment ................................................................................................................... 11 100.00 86.35 79.76 74.99 75.34 96.62 90.23 88.26 82.10 84.82 76.35 79.27Structures .......................................................................................................................... 12 100.00 89.00 95.87 103.79 107.11 102.33 87.05 88.37 91.45 89.12 90.59 91.68Equipment ......................................................................................................................... 13 100.00 86.07 77.98 71.79 71.80 96.01 90.58 88.26 81.08 84.37 74.79 77.91
Nondefense ............................................................................................................................... 14 100.00 99.33 98.24 96.88 96.01 103.23 100.46 99.29 98.76 98.81 99.77 95.36Consumption expenditures .................................................................................................... 15 100.00 98.85 99.25 97.46 95.37 102.39 98.96 98.60 98.28 99.58 100.96 96.71
Durable goods 2 ................................................................................................................ 16 ............... ............... ............... ............... ............... ............... ............... ............... ............... ............... ............... ...............Nondurable goods ............................................................................................................. 17 ............... ............... ............... ............... ............... ............... ............... ............... ............... ............... ............... ...............
Commodity Credit Corporation inventory change ....................................................... 18 ............... ............... ............... ............... ............... ............... ............... ............... ............... ............... ............... ...............Other nondurables ........................................................................................................ 19 100.00 95.15 93.60 84.13 75.08 105.69 97.20 94.35 95.01 94.03 97.68 94.36
Services ............................................................................................................................. 20 100.00 98.62 98.84 97.37 95.57 101.38 98.81 98.43 98.45 98.78 100.22 96.08Compensation of general government employees, except force-account
construction 3.21 100.00 99.61 96.78 92.95 90.66 99.47 100.43 100.37 99.36 98.26 99.05 97.17
Consumption of general government fixed capital 4 ................................................... 22 100.00 103.39 106.62 110.42 115.70 101.32 102.21 102.98 103.78 104.60 105.36 106.23Other services ............................................................................................................... 23 100.00 96.24 100.57 101.84 99.49 104.13 95.75 94.65 96.08 98.49 100.98 92.36
Gross investment ................................................................................................................... 24 100.00 102.40 91.42 93.02 100.61 108.68 110.23 103.82 101.92 93.64 91.72 86.24Structures .......................................................................................................................... 25 100.00 106.75 96.35 96.90 97.44 106.41 111.07 104.06 107.12 104.73 96.59 90.13Equipment ......................................................................................................................... 26 100.00 98.10 86.51 89.24 104.93 110.93 109.47 103.71 96.76 82.47 86.93 82.42
State and local ............................................................................................................................. 27 100.00 101.45 104.06 106.23 107.88 100.37 100.30 101.29 101.81 102.40 102.57 103.59Consumption expenditures ........................................................................................................ 28 100.00 102.03 104.94 107.02 108.28 100.71 101.19 101.64 102.31 102.97 103.90 104.64
Durable goods 2 ..................................................................................................................... 29 100.00 104.94 109.71 112.02 115.98 102.02 103.11 104.43 105.47 106.77 108.76 109.56Nondurable goods ................................................................................................................. 30 100.00 105.06 110.66 113.65 117.38 101.90 103.01 104.24 105.75 107.22 109.23 110.21Services ................................................................................................................................. 31 100.00 101.62 104.19 106.16 107.08 100.54 100.94 101.27 101.84 102.40 103.19 103.90
Compensation of general government employees, except force-account construction 3 32 100.00 101.43 103.26 104.72 105.08 100.50 100.88 101.22 101.61 102.03 102.46 103.09Consumption of general government fixed capital 4 ........................................................ 33 100.00 103.12 105.87 108.66 111.57 101.39 102.09 102.77 103.47 104.14 104.83 105.52Other services ................................................................................................................... 34 100.00 102.13 119.02 129.97 138.73 99.71 99.89 99.38 103.15 106.09 114.17 116.55
Gross investment ....................................................................................................................... 35 100.00 98.81 100.06 102.60 106.03 98.84 96.20 99.73 99.53 99.79 96.51 98.78Structures ............................................................................................................................... 36 100.00 98.12 99.06 101.29 104.30 98.09 94.99 99.33 98.99 99.19 94.97 97.62Equipment .............................................................................................................................. 37 100.00 101.94 104.61 108.60 114.13 102.26 101.69 101.54 101.99 102.52 103.63 104.16
Addenda:Compensation of general government employees 3 ................................................................ 38 100.00 99.94 99.86 99.42 98.66 100.02 100.06 100.00 99.96 99.73 99.87 99.93
Federal ................................................................................................................................... 39 100.00 96.73 92.52 87.97 84.83 99.08 98.38 97.38 96.40 94.76 94.36 93.12State and local ...................................................................................................................... 40 100.00 101.41 103.23 104.69 105.06 100.45 100.83 101.20 101.58 102.01 102.40 103.05
Chain-type price indexes
Government consumption expenditures and gross investment 1 ................................ 41 100.00 102.50 104.85 108.28 111.83 100.59 101.71 102.24 102.77 103.26 103.95 104.61
Federal ........................................................................................................................................... 42 100.00 102.51 104.84 108.34 112.03 100.17 101.79 101.94 102.83 103.48 104.04 104.97
National defense ...................................................................................................................... 43 100.00 101.77 103.63 106.83 111.02 99.57 101.23 101.39 101.97 102.48 102.90 103.65Consumption expenditures .................................................................................................... 44 100.00 101.66 103.22 106.44 110.96 99.39 101.23 101.40 101.83 102.18 102.55 103.16
Durable goods 2 ................................................................................................................ 45 100.00 100.77 100.92 101.20 102.41 100.35 100.51 100.97 100.79 100.81 101.69 100.51Nondurable goods ............................................................................................................. 46 100.00 98.50 97.05 100.11 109.95 101.39 98.25 100.60 97.39 97.77 93.44 96.38Services ............................................................................................................................. 47 100.00 101.86 103.64 107.11 111.78 99.23 101.41 101.48 102.07 102.46 102.92 103.63
Compensation of general government employees, except force-accountconstruction 3.
48 100.00 101.74 103.44 107.45 115.40 97.82 102.16 101.54 101.59 101.68 102.92 103.63
Consumption of general government fixed capital 4 ................................................... 49 100.00 102.87 106.00 109.58 111.40 100.55 101.25 101.94 103.73 104.58 105.16 106.10Other services ............................................................................................................... 50 100.00 101.37 102.41 104.92 106.45 100.75 100.22 101.09 101.80 102.38 101.44 101.99
Gross investment ................................................................................................................... 51 100.00 102.40 106.21 109.27 111.22 100.65 101.20 101.24 102.80 104.35 105.12 106.70Structures .......................................................................................................................... 52 100.00 108.85 115.30 118.22 121.50 102.43 104.69 105.28 112.28 113.17 113.75 115.00Equipment ......................................................................................................................... 53 100.00 101.72 105.23 108.31 110.07 100.47 100.86 100.84 101.78 103.42 104.21 105.83
Nondefense ............................................................................................................................... 54 100.00 104.29 107.70 111.88 114.47 101.61 103.15 103.27 104.89 105.84 106.73 108.08Consumption expenditures .................................................................................................... 55 100.00 104.88 108.58 113.16 116.32 101.87 103.61 103.69 105.57 106.64 107.57 109.04
Durable goods 2 ................................................................................................................ 56 ............... ............... ............... ............... ............... ............... ............... ............... ............... ............... ............... ...............Nondurable goods ............................................................................................................. 57 ............... ............... ............... ............... ............... ............... ............... ............... ............... ............... ............... ...............
Commodity Credit Corporation inventory change ....................................................... 58 ............... ............... ............... ............... ............... ............... ............... ............... ............... ............... ............... ...............Other nondurables ........................................................................................................ 59 100.00 105.65 109.25 111.67 112.73 99.39 104.46 105.27 105.91 106.96 108.30 108.58
Services ............................................................................................................................. 60 100.00 104.84 108.68 113.39 116.89 102.03 103.57 103.66 105.53 106.62 107.63 109.19Compensation of general government employees, except force-account
construction 3.61 100.00 107.59 113.60 120.47 126.39 103.18 105.68 105.52 108.69 110.48 112.33 114.65
Consumption of general government fixed capital 4 ................................................... 62 100.00 101.20 102.99 104.55 104.51 100.27 100.67 101.38 101.20 101.54 102.22 103.04Other services ............................................................................................................... 63 100.00 101.61 102.79 105.26 106.39 100.73 101.09 101.39 101.85 102.13 102.04 102.65
Gross investment ................................................................................................................... 64 100.00 100.64 102.17 103.72 102.76 100.00 100.30 100.73 100.67 100.85 101.44 102.06Structures .......................................................................................................................... 65 100.00 102.17 105.43 109.99 113.14 100.57 101.00 101.91 102.42 103.34 104.03 104.88Equipment ......................................................................................................................... 66 100.00 99.08 98.75 97.07 92.16 99.41 99.61 99.55 98.87 98.28 98.75 99.12
State and local ............................................................................................................................. 67 100.00 102.49 104.85 108.24 111.71 100.89 101.65 102.44 102.74 103.13 103.90 104.39Consumption expenditures ........................................................................................................ 68 100.00 102.56 104.80 108.14 111.84 100.94 101.74 102.51 102.83 103.15 103.90 104.37
Durable goods 2 ..................................................................................................................... 69 100.00 101.10 102.27 105.75 106.39 100.36 100.69 101.01 101.29 101.40 101.61 101.80Nondurable goods ................................................................................................................. 70 100.00 100.43 100.62 105.51 109.36 100.17 101.25 101.94 99.67 98.87 99.36 99.62Services ................................................................................................................................. 71 100.00 102.84 105.36 108.51 112.25 101.04 101.82 102.61 103.24 103.70 104.50 105.00
Compensation of general government employees, except force-account construction 3 72 100.00 103.51 106.59 109.88 114.02 101.30 102.31 103.18 103.95 104.59 105.63 106.17Consumption of general government fixed capital 4 ........................................................ 73 100.00 101.54 103.92 106.88 108.74 100.32 100.76 101.41 101.77 102.20 102.90 103.44Other services ................................................................................................................... 74 100.00 93.89 87.68 88.97 90.09 97.85 95.35 94.97 93.82 91.42 88.53 88.32
Gross investment ....................................................................................................................... 75 100.00 102.17 105.06 108.69 111.14 100.66 101.25 102.10 102.31 103.01 103.87 104.47Structures ............................................................................................................................... 76 100.00 102.48 105.84 110.45 113.93 100.78 101.39 102.38 102.61 103.56 104.43 105.05Equipment .............................................................................................................................. 77 100.00 100.79 101.71 101.14 99.35 100.12 100.63 100.90 100.99 100.65 101.45 101.93
Addenda:Compensation of general government employees 3 ................................................................ 78 100.00 103.55 106.65 110.43 115.42 100.77 102.62 103.07 103.93 104.58 105.74 106.49
Federal ................................................................................................................................... 79 100.00 103.65 106.78 111.76 119.00 99.56 103.30 102.83 103.91 104.56 106.01 107.26State and local ...................................................................................................................... 80 100.00 103.51 106.59 109.89 114.03 101.30 102.31 103.18 103.95 104.60 105.64 106.17
See note at end of table.

• August
Table 7.11.—Chain-Type Quantity and Price Indexes for Government Consumption Expenditures and Gross Investment by Type—Continued[Index numbers, 1992=100]
Line
Seasonally adjusted
1994 1995 1996 1997
III IV I II III IV I II III IV I II
Chain-type quantity indexes
Government consumption expenditures and gross investment 1 ................................ 1 100.35 99.37 99.52 99.49 99.30 97.94 98.37 100.10 99.83 99.85 99.74 100.68
Federal ........................................................................................................................................... 2 94.02 91.23 90.99 89.95 89.66 85.72 87.29 89.15 88.21 87.04 85.76 87.50
National defense ...................................................................................................................... 3 92.33 87.71 87.46 87.12 86.22 82.56 83.79 86.01 85.00 83.44 80.86 82.87Consumption expenditures .................................................................................................... 4 93.44 89.54 89.34 88.57 88.78 84.38 84.86 87.09 86.99 85.84 84.57 86.52
Durable goods 2 ................................................................................................................ 5 81.72 72.75 70.77 64.91 77.21 64.11 65.49 76.56 79.98 67.04 66.37 69.64Nondurable goods ............................................................................................................. 6 86.68 87.12 65.95 69.69 71.91 58.36 75.35 80.52 82.30 66.02 70.26 66.29Services ............................................................................................................................. 7 94.92 91.40 92.04 91.65 90.59 87.34 87.20 88.45 87.94 88.45 86.93 88.95
Compensation of general government employees, except force-accountconstruction 3.
8 90.13 88.36 87.29 86.29 85.24 83.14 82.54 82.44 81.93 80.64 79.99 78.96
Consumption of general government fixed capital 4 ................................................... 9 98.40 97.96 97.50 96.98 96.53 96.00 95.52 95.08 94.57 94.12 93.62 93.17Other services ............................................................................................................... 10 101.00 92.30 96.71 97.49 95.97 88.79 89.72 94.59 94.08 98.60 94.74 104.31
Gross investment ................................................................................................................... 11 86.00 77.40 76.91 78.87 71.82 72.36 77.77 79.94 73.76 69.89 59.66 62.02Structures .......................................................................................................................... 12 101.04 100.15 113.77 100.74 97.53 103.12 107.04 114.86 103.75 102.80 96.54 97.58Equipment ......................................................................................................................... 13 84.34 74.88 72.81 76.45 68.97 68.94 74.52 76.05 70.43 66.21 55.49 58.01
Nondefense ............................................................................................................................... 14 98.13 99.69 99.46 96.80 97.94 93.33 95.70 96.72 95.93 95.69 97.54 98.64Consumption expenditures .................................................................................................... 15 99.57 99.75 98.76 98.18 98.93 93.96 95.16 96.28 94.84 95.21 97.18 97.45
Durable goods 2 ................................................................................................................ 16 ............... ............... ............... ............... ............... ............... ............... ............... ............... ............... ............... ...............Nondurable goods ............................................................................................................. 17 ............... ............... ............... ............... ............... ............... ............... ............... ............... ............... ............... ...............
Commodity Credit Corporation inventory change ....................................................... 18 ............... ............... ............... ............... ............... ............... ............... ............... ............... ............... ............... ...............Other nondurables ........................................................................................................ 19 89.72 92.62 87.56 84.16 82.87 81.93 79.12 75.96 70.86 74.38 83.75 86.12
Services ............................................................................................................................. 20 99.86 99.21 98.23 98.57 98.88 93.82 94.80 96.44 95.43 95.61 96.75 97.15Compensation of general government employees, except force-account
construction 3.21 96.30 94.60 94.47 95.25 95.02 87.07 88.65 92.07 91.20 90.70 91.10 91.26
Consumption of general government fixed capital 4 ................................................... 22 106.99 107.89 108.72 109.84 110.98 112.13 113.51 115.08 116.42 117.80 119.30 120.73Other services ............................................................................................................... 23 104.12 104.81 102.10 101.55 102.59 101.13 101.02 99.75 98.03 99.16 101.47 102.10
Gross investment ................................................................................................................... 24 88.41 99.33 104.25 87.44 91.27 89.13 99.65 99.96 103.75 99.08 100.06 107.28Structures .......................................................................................................................... 25 91.17 107.52 108.74 94.80 96.07 87.97 95.94 99.64 96.76 97.41 94.95 90.06Equipment ......................................................................................................................... 26 85.80 90.89 99.71 79.72 86.45 91.08 104.56 100.95 112.70 101.49 106.77 129.57
State and local ............................................................................................................................. 27 104.89 105.21 105.64 106.33 106.22 106.71 106.33 107.97 108.17 109.04 109.78 110.14Consumption expenditures ........................................................................................................ 28 105.34 105.87 106.56 106.86 107.16 107.50 107.13 108.38 108.63 108.98 109.53 110.09
Durable goods 2 ..................................................................................................................... 29 109.97 110.53 111.02 111.28 111.95 113.82 114.65 115.48 116.49 117.32 118.18 119.04Nondurable goods ................................................................................................................. 30 111.19 112.02 112.53 113.27 114.01 114.81 115.76 116.79 117.92 119.06 120.12 121.18Services ................................................................................................................................. 31 104.58 105.07 105.78 106.04 106.28 106.54 105.99 107.28 107.41 107.66 108.15 108.64
Compensation of general government employees, except force-account construction 3 32 103.58 103.91 104.54 104.66 104.78 104.89 103.98 105.35 105.44 105.54 105.87 106.33Consumption of general government fixed capital 4 ........................................................ 33 106.21 106.90 107.59 108.31 109.02 109.73 110.47 111.21 111.94 112.66 113.37 114.07Other services ................................................................................................................... 34 120.99 124.35 126.86 129.02 130.85 133.17 137.77 138.30 138.20 140.65 143.86 144.66
Gross investment ....................................................................................................................... 35 102.79 102.17 101.47 103.87 101.95 103.09 102.68 106.06 106.03 109.35 110.95 110.38Structures ............................................................................................................................... 36 102.31 101.37 100.27 102.95 100.41 101.53 100.76 104.45 104.15 107.84 109.49 108.61Equipment .............................................................................................................................. 37 104.86 105.79 106.95 108.00 109.12 110.33 111.74 113.54 114.91 116.33 117.57 118.75
Addenda:Compensation of general government employees 3 ................................................................ 38 99.99 99.66 99.84 99.82 99.64 98.39 97.82 99.13 98.98 98.72 98.87 98.96
Federal ................................................................................................................................... 39 92.17 90.42 89.66 89.28 88.53 84.40 84.56 85.68 85.07 84.02 83.73 83.11State and local ...................................................................................................................... 40 103.58 103.91 104.52 104.65 104.74 104.86 103.95 105.34 105.42 105.54 105.89 106.33
Chain-type price indexes
Government consumption expenditures and gross investment 1 ................................ 41 105.07 105.75 106.92 107.85 108.55 109.80 111.27 111.23 112.07 112.76 113.74 114.10
Federal ........................................................................................................................................... 42 104.83 105.53 106.89 107.59 108.33 110.56 111.85 111.47 112.05 112.74 114.10 114.39
National defense ...................................................................................................................... 43 103.68 104.31 105.37 106.30 107.20 108.44 110.38 110.58 111.16 111.94 113.14 113.38Consumption expenditures .................................................................................................... 44 103.29 103.89 105.03 105.86 106.83 108.03 109.87 110.56 111.26 112.16 113.39 113.63
Durable goods 2 ................................................................................................................ 45 101.23 100.25 100.48 101.56 101.53 101.22 102.05 102.82 102.60 102.17 102.89 103.15Nondurable goods ............................................................................................................. 46 98.46 99.92 97.43 99.94 100.22 102.84 106.22 108.19 109.14 116.27 114.14 107.46Services ............................................................................................................................. 47 103.65 104.36 105.67 106.44 107.52 108.80 110.69 111.35 112.12 112.96 114.31 114.74
Compensation of general government employees, except force-accountconstruction 3.
48 103.24 103.96 105.76 106.21 107.91 109.93 114.20 114.78 115.87 116.76 119.51 120.20
Consumption of general government fixed capital 4 ................................................... 49 105.76 106.96 108.26 109.42 109.90 110.73 110.43 111.67 111.61 111.91 112.50 112.78Other services ............................................................................................................... 50 102.92 103.27 103.80 104.81 105.31 105.77 105.46 105.84 106.69 107.82 107.65 107.78
Gross investment ................................................................................................................... 51 106.07 106.95 107.51 109.08 109.48 111.00 113.64 110.58 110.39 110.29 111.26 111.51Structures .......................................................................................................................... 52 115.74 116.69 117.10 117.51 118.64 119.63 119.17 121.04 122.21 123.57 124.09 125.20Equipment ......................................................................................................................... 53 105.01 105.88 106.45 108.19 108.48 110.10 113.22 109.40 109.00 108.67 109.72 109.82
Nondefense ............................................................................................................................... 54 107.57 108.42 110.44 110.61 111.03 115.44 115.28 113.63 114.25 114.72 116.44 116.83Consumption expenditures .................................................................................................... 55 108.38 109.33 111.57 111.66 112.17 117.24 117.11 115.32 116.10 116.74 118.80 119.26
Durable goods 2 ................................................................................................................ 56 ............... ............... ............... ............... ............... ............... ............... ............... ............... ............... ............... ...............Nondurable goods ............................................................................................................. 57 ............... ............... ............... ............... ............... ............... ............... ............... ............... ............... ............... ...............
Commodity Credit Corporation inventory change ....................................................... 58 ............... ............... ............... ............... ............... ............... ............... ............... ............... ............... ............... ...............Other nondurables ........................................................................................................ 59 109.71 110.41 110.62 111.50 111.85 112.72 113.24 113.87 113.82 109.98 110.07 111.09
Services ............................................................................................................................. 60 108.45 109.43 111.71 111.79 112.36 117.69 117.63 115.82 116.64 117.48 119.65 120.11Compensation of general government employees, except force-account
construction 3.61 112.99 114.43 117.99 117.27 118.14 128.49 128.46 124.47 125.72 126.91 130.91 131.63
Consumption of general government fixed capital 4 ................................................... 62 103.26 103.43 103.83 104.63 104.67 105.05 104.99 104.49 104.40 104.15 104.08 103.77Other services ............................................................................................................... 63 102.96 103.50 104.40 105.40 105.69 105.55 105.45 106.19 106.65 107.29 107.60 107.91
Gross investment ................................................................................................................... 64 102.49 102.71 103.22 103.91 103.78 103.95 103.63 102.90 102.53 101.99 101.63 101.66Structures .......................................................................................................................... 65 105.85 106.98 108.16 109.33 110.67 111.80 112.52 112.84 113.30 113.92 114.63 116.11Equipment ......................................................................................................................... 66 98.96 98.17 97.93 98.09 96.50 95.74 94.42 92.66 91.56 90.00 88.66 87.57
State and local ............................................................................................................................. 67 105.21 105.89 106.93 108.00 108.67 109.35 110.92 111.08 112.07 112.77 113.54 113.93Consumption expenditures ........................................................................................................ 68 105.15 105.79 106.80 107.95 108.59 109.23 110.97 111.13 112.23 113.01 113.71 114.02
Durable goods 2 ..................................................................................................................... 69 102.48 103.18 104.37 105.35 106.44 106.84 106.62 106.16 106.32 106.45 106.42 106.47Nondurable goods ................................................................................................................. 70 101.96 101.53 104.02 106.71 106.02 105.29 107.72 109.96 109.07 110.70 110.77 108.38Services ................................................................................................................................. 71 105.58 106.36 107.18 108.14 108.94 109.76 111.46 111.38 112.75 113.43 114.23 114.90
Compensation of general government employees, except force-account construction 3 72 106.90 107.65 108.44 109.44 110.33 111.33 113.33 113.07 114.45 115.24 116.04 116.74Consumption of general government fixed capital 4 ........................................................ 73 104.40 104.94 105.90 106.52 107.17 107.94 108.59 108.59 108.85 108.95 109.84 110.26Other services ................................................................................................................... 74 86.22 87.64 88.87 89.67 89.43 87.91 87.04 89.23 91.97 92.13 92.76 93.31
Gross investment ....................................................................................................................... 75 105.53 106.38 107.53 108.26 109.06 109.89 110.69 110.84 111.34 111.69 112.73 113.51Structures ............................................................................................................................... 76 106.30 107.57 108.96 109.86 110.97 112.02 113.10 113.48 114.25 114.90 116.36 117.60Equipment .............................................................................................................................. 77 102.17 101.27 101.40 101.38 100.91 100.86 100.44 99.68 99.09 98.20 97.49 96.34
Addenda:Compensation of general government employees 3 ................................................................ 78 106.78 107.59 108.84 109.58 110.62 112.67 114.89 114.43 115.75 116.59 118.03 118.73
Federal ................................................................................................................................... 79 106.44 107.41 109.79 109.85 111.27 116.12 118.92 117.94 119.08 120.08 123.26 123.95State and local ...................................................................................................................... 80 106.91 107.66 108.44 109.45 110.34 111.34 113.34 113.08 114.46 115.24 116.04 116.75
NOTE.—See footnotes to table 3.7.

August •
Table 7.12.—Chain-Type Quantity and Price Indexes for National Defense Consumption Expenditures and Gross Investment by Type[Index numbers, 1992=100]
Line 1992 1993 1994 1995 1996
Chain-type quantity indexes
National defense consumption expenditures andgross investment 1.
1 100.00 94.32 89.66 85.84 84.56
Consumption expenditures ..................................................... 2 100.00 95.72 91.41 87.77 86.20
Durable goods 2 .................................................................... 3 100.00 88.78 75.84 69.25 72.27Aircraft ................................................................................ 4 100.00 81.04 65.91 60.55 66.83Missiles ............................................................................... 5 100.00 85.11 75.39 70.13 71.28Ships ................................................................................... 6 100.00 106.32 73.79 54.22 37.44Vehicles .............................................................................. 7 100.00 94.83 63.50 80.94 73.07Electronics .......................................................................... 8 100.00 106.80 94.22 76.45 81.20Other durable goods .......................................................... 9 100.00 93.46 97.72 93.06 99.06
Nondurable goods ................................................................ 10 100.00 90.32 82.18 66.48 76.05Petroleum products ............................................................ 11 100.00 95.32 96.76 88.38 88.78Ammunition ......................................................................... 12 100.00 94.32 65.14 41.37 38.26Other nondurable goods .................................................... 13 100.00 82.27 81.39 65.69 94.36
Services ................................................................................. 14 100.00 96.65 93.36 90.40 88.01Compensation of general government employees, except
force-account construction 3.15 100.00 95.35 90.42 85.49 81.89
Military ............................................................................ 16 100.00 94.85 90.29 85.60 82.48Civilian ............................................................................ 17 100.00 96.26 90.70 85.36 80.94
Consumption of fixed capital 4 .......................................... 18 100.00 99.90 98.59 96.76 94.82Other services .................................................................... 19 100.00 96.74 95.00 94.74 94.25
Research and development .......................................... 20 100.00 98.90 95.41 79.75 90.16Installation support ........................................................ 21 100.00 107.07 107.53 109.76 107.11Weapons support .......................................................... 22 100.00 81.97 90.68 89.06 65.30Personnel support ......................................................... 23 100.00 97.53 106.90 111.13 109.55Transportation of material ............................................. 24 100.00 78.43 63.35 69.78 78.48Travel of persons .......................................................... 25 100.00 88.54 78.33 78.68 75.92Other .............................................................................. 26 100.00 107.62 169.57 69.39 82.42
Gross investment ..................................................................... 27 100.00 86.35 79.76 74.99 75.34
Structures .............................................................................. 28 100.00 89.00 95.87 103.79 107.11
Equipment ............................................................................. 29 100.00 86.07 77.98 71.79 71.80Aircraft ................................................................................ 30 100.00 104.35 103.26 83.57 82.03Missiles ............................................................................... 31 100.00 74.55 53.75 44.68 41.76Ships ................................................................................... 32 100.00 84.36 76.31 71.07 60.15Vehicles .............................................................................. 33 100.00 63.17 33.72 29.43 27.78Electronics .......................................................................... 34 100.00 109.59 101.33 93.90 105.26Other equipment ................................................................ 35 100.00 82.48 83.16 87.27 95.74
Addendum:Compensation of general government employees 3 ............. 36 100.00 95.35 90.42 85.49 81.89
Line 1992 1993 1994 1995 1996
Chain-type price indexes
National defense consumption expenditures andgross investment 1.
37 100.00 101.77 103.63 106.83 111.02
Consumption expenditures ..................................................... 38 100.00 101.66 103.22 106.44 110.96
Durable goods 2 .................................................................... 39 100.00 100.77 100.92 101.20 102.41Aircraft ................................................................................ 40 100.00 100.69 101.90 102.77 103.88Missiles ............................................................................... 41 100.00 101.33 96.21 92.58 92.72Ships ................................................................................... 42 100.00 100.73 101.53 104.48 107.54Vehicles .............................................................................. 43 100.00 101.95 103.04 102.86 102.32Electronics .......................................................................... 44 100.00 99.58 100.41 99.42 97.18Other durable goods .......................................................... 45 100.00 101.04 102.31 104.58 108.78
Nondurable goods ................................................................ 46 100.00 98.50 97.05 100.11 109.95Petroleum products ............................................................ 47 100.00 95.55 89.99 89.63 109.27Ammunition ......................................................................... 48 100.00 101.78 105.01 111.16 115.59Other nondurable goods .................................................... 49 100.00 99.14 99.24 104.97 105.32
Services ................................................................................. 50 100.00 101.86 103.64 107.11 111.78Compensation of general government employees, except
force-account construction 3.51 100.00 101.74 103.44 107.45 115.40
Military ............................................................................ 52 100.00 100.20 99.67 102.85 111.64Civilian ............................................................................ 53 100.00 104.61 110.41 116.00 122.35
Consumption of fixed capital 4 .......................................... 54 100.00 102.87 106.00 109.58 111.40Other services .................................................................... 55 100.00 101.37 102.41 104.92 106.45
Research and development .......................................... 56 100.00 100.77 100.58 100.30 100.07Installation support ........................................................ 57 100.00 101.47 104.39 108.53 109.82Weapons support .......................................................... 58 100.00 103.01 104.94 106.55 110.41Personnel support ......................................................... 59 100.00 101.62 100.71 105.06 110.46Transportation of material ............................................. 60 100.00 99.51 100.80 102.66 101.28Travel of persons .......................................................... 61 100.00 103.65 103.94 106.53 104.80Other .............................................................................. 62 100.00 103.42 101.30 103.69 111.20
Gross investment ..................................................................... 63 100.00 102.40 106.21 109.27 111.22
Structures .............................................................................. 64 100.00 108.85 115.30 118.22 121.50
Equipment ............................................................................. 65 100.00 101.72 105.23 108.31 110.07Aircraft ................................................................................ 66 100.00 103.45 116.80 124.11 130.93Missiles ............................................................................... 67 100.00 101.26 100.36 99.19 94.65Ships ................................................................................... 68 100.00 101.90 104.66 111.65 111.72Vehicles .............................................................................. 69 100.00 105.72 108.47 112.28 116.16Electronics .......................................................................... 70 100.00 96.64 94.72 89.35 80.97Other equipment ................................................................ 71 100.00 101.79 102.89 105.35 110.41
Addendum:Compensation of general government employees 3 ............. 72 100.00 101.74 103.44 107.45 115.40
1. Gross government investment consists of general government and government enterprise expenditures for fixedassets; inventory investment is included in government consumption expenditures.
2. Consumption expenditures for durable goods excludes expenditures classified as investment, except for goodstransferred to foreign countries.
3. Compensation of government employees engaged in new force-account construction and related expenditures
for goods and services are classified as investment in structures. The compensation of all general government em-ployees is shown in the addendum.
4. Consumption of fixed capital, or depreciation, is included in government consumption expenditures as a partialmeasure of the value of the services of general government fixed assets; use of depreciation assumes a zero netreturn on these assets.
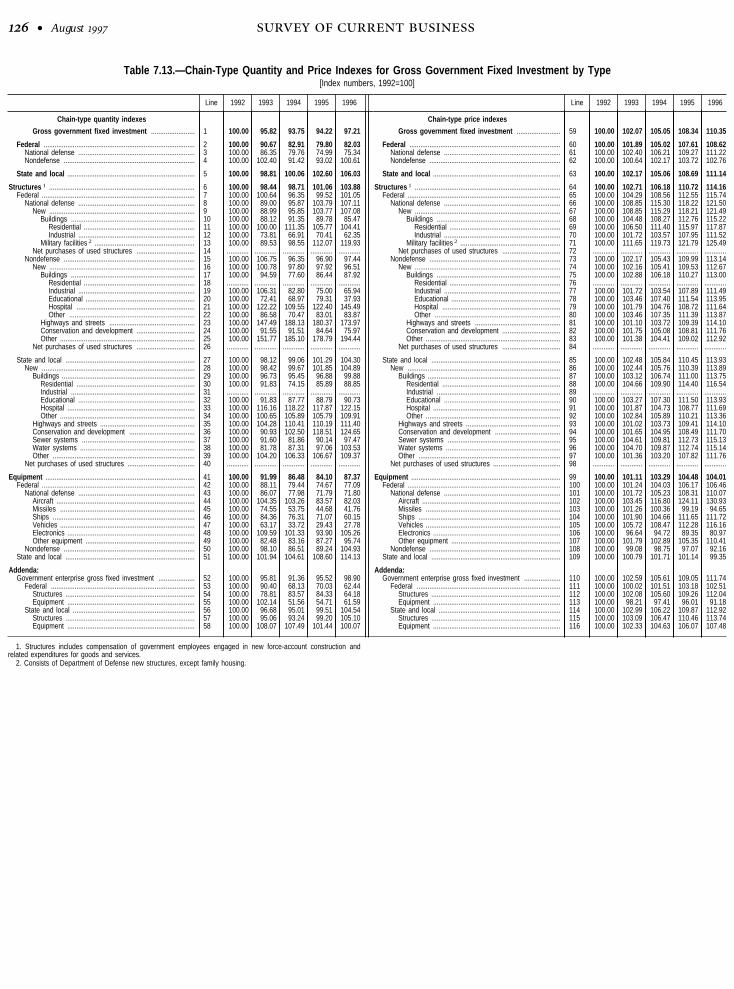
• August
Table 7.13.—Chain-Type Quantity and Price Indexes for Gross Government Fixed Investment by Type[Index numbers, 1992=100]
Line 1992 1993 1994 1995 1996
Chain-type quantity indexes
Gross government fixed investment ........................ 1 100.00 95.82 93.75 94.22 97.21
Federal ................................................................................... 2 100.00 90.67 82.91 79.80 82.03National defense ................................................................ 3 100.00 86.35 79.76 74.99 75.34Nondefense ........................................................................ 4 100.00 102.40 91.42 93.02 100.61
State and local ...................................................................... 5 100.00 98.81 100.06 102.60 106.03
Structures 1 ................................................................................ 6 100.00 98.44 98.71 101.06 103.88Federal .................................................................................... 7 100.00 100.64 96.35 99.52 101.05
National defense ................................................................ 8 100.00 89.00 95.87 103.79 107.11New ................................................................................ 9 100.00 88.99 95.85 103.77 107.08
Buildings .................................................................... 10 100.00 88.12 91.35 89.78 85.47Residential ............................................................. 11 100.00 100.00 111.35 105.77 104.41Industrial ................................................................ 12 100.00 73.81 66.91 70.41 62.35
Military facilities 2 ....................................................... 13 100.00 89.53 98.55 112.07 119.93Net purchases of used structures ................................ 14 ............ ............ ............ ............ ............
Nondefense ........................................................................ 15 100.00 106.75 96.35 96.90 97.44New ................................................................................ 16 100.00 100.78 97.80 97.92 96.51
Buildings .................................................................... 17 100.00 94.59 77.60 86.44 87.92Residential ............................................................. 18 ............ ............ ............ ............ ............Industrial ................................................................ 19 100.00 106.31 82.80 75.00 65.94Educational ............................................................ 20 100.00 72.41 68.97 79.31 37.93Hospital ................................................................. 21 100.00 122.22 109.55 122.40 145.49Other ..................................................................... 22 100.00 86.58 70.47 83.01 83.87
Highways and streets ............................................... 23 100.00 147.49 188.13 180.37 173.97Conservation and development ................................ 24 100.00 91.55 91.51 84.64 75.97Other .......................................................................... 25 100.00 151.77 185.10 178.79 194.44
Net purchases of used structures ................................ 26 ............ ............ ............ ............ ............
State and local ....................................................................... 27 100.00 98.12 99.06 101.29 104.30New .................................................................................... 28 100.00 98.42 99.67 101.85 104.89
Buildings ......................................................................... 29 100.00 96.73 95.45 96.88 99.88Residential ................................................................. 30 100.00 91.83 74.15 85.89 88.85Industrial .................................................................... 31 ............ ............ ............ ............ ............Educational ................................................................ 32 100.00 91.83 87.77 88.79 90.73Hospital ...................................................................... 33 100.00 116.16 118.22 117.87 122.15Other .......................................................................... 34 100.00 100.65 105.89 105.79 109.91
Highways and streets .................................................... 35 100.00 104.28 110.41 110.19 111.40Conservation and development .................................... 36 100.00 90.93 102.50 118.51 124.65Sewer systems .............................................................. 37 100.00 91.60 81.86 90.14 97.47Water systems ............................................................... 38 100.00 81.78 87.31 97.06 103.53Other .............................................................................. 39 100.00 104.20 106.33 106.67 109.37
Net purchases of used structures ..................................... 40 ............ ............ ............ ............ ............
Equipment .................................................................................. 41 100.00 91.99 86.48 84.10 87.37Federal .................................................................................... 42 100.00 88.11 79.44 74.67 77.09
National defense ................................................................ 43 100.00 86.07 77.98 71.79 71.80Aircraft ............................................................................ 44 100.00 104.35 103.26 83.57 82.03Missiles .......................................................................... 45 100.00 74.55 53.75 44.68 41.76Ships .............................................................................. 46 100.00 84.36 76.31 71.07 60.15Vehicles .......................................................................... 47 100.00 63.17 33.72 29.43 27.78Electronics ...................................................................... 48 100.00 109.59 101.33 93.90 105.26Other equipment ............................................................ 49 100.00 82.48 83.16 87.27 95.74
Nondefense ........................................................................ 50 100.00 98.10 86.51 89.24 104.93State and local ....................................................................... 51 100.00 101.94 104.61 108.60 114.13
Addenda:Government enterprise gross fixed investment .................... 52 100.00 95.81 91.36 95.52 98.90
Federal ............................................................................... 53 100.00 90.40 68.13 70.03 62.44Structures ....................................................................... 54 100.00 78.81 83.57 84.33 64.18Equipment ...................................................................... 55 100.00 102.14 51.56 54.71 61.59
State and local ................................................................... 56 100.00 96.68 95.01 99.51 104.54Structures ....................................................................... 57 100.00 95.06 93.24 99.20 105.10Equipment ...................................................................... 58 100.00 108.07 107.49 101.44 100.07
Line 1992 1993 1994 1995 1996
Chain-type price indexes
Gross government fixed investment ........................ 59 100.00 102.07 105.05 108.34 110.35
Federal ................................................................................... 60 100.00 101.89 105.02 107.61 108.62National defense ................................................................ 61 100.00 102.40 106.21 109.27 111.22Nondefense ........................................................................ 62 100.00 100.64 102.17 103.72 102.76
State and local ...................................................................... 63 100.00 102.17 105.06 108.69 111.14
Structures 1 ................................................................................ 64 100.00 102.71 106.18 110.72 114.16Federal .................................................................................... 65 100.00 104.29 108.56 112.55 115.74
National defense ................................................................ 66 100.00 108.85 115.30 118.22 121.50New ................................................................................ 67 100.00 108.85 115.29 118.21 121.49
Buildings .................................................................... 68 100.00 104.48 108.27 112.76 115.22Residential ............................................................. 69 100.00 106.50 111.40 115.97 117.87Industrial ................................................................ 70 100.00 101.72 103.57 107.95 111.52
Military facilities 2 ....................................................... 71 100.00 111.65 119.73 121.79 125.49Net purchases of used structures ................................ 72 ............ ............ ............ ............ ............
Nondefense ........................................................................ 73 100.00 102.17 105.43 109.99 113.14New ................................................................................ 74 100.00 102.16 105.41 109.53 112.67
Buildings .................................................................... 75 100.00 102.88 106.18 110.27 113.00Residential ............................................................. 76 ............ ............ ............ ............ ............Industrial ................................................................ 77 100.00 101.72 103.54 107.89 111.49Educational ............................................................ 78 100.00 103.46 107.40 111.54 113.95Hospital ................................................................. 79 100.00 101.79 104.76 108.72 111.64Other ..................................................................... 80 100.00 103.46 107.35 111.39 113.87
Highways and streets ............................................... 81 100.00 101.10 103.72 109.39 114.10Conservation and development ................................ 82 100.00 101.75 105.08 108.81 111.76Other .......................................................................... 83 100.00 101.38 104.41 109.02 112.92
Net purchases of used structures ................................ 84 ............ ............ ............ ............ ............
State and local ....................................................................... 85 100.00 102.48 105.84 110.45 113.93New .................................................................................... 86 100.00 102.44 105.76 110.39 113.89
Buildings ......................................................................... 87 100.00 103.12 106.74 111.00 113.75Residential ................................................................. 88 100.00 104.66 109.90 114.40 116.54Industrial .................................................................... 89 ............ ............ ............ ............ ............Educational ................................................................ 90 100.00 103.27 107.30 111.50 113.93Hospital ...................................................................... 91 100.00 101.87 104.73 108.77 111.69Other .......................................................................... 92 100.00 102.84 105.89 110.21 113.36
Highways and streets .................................................... 93 100.00 101.02 103.73 109.41 114.10Conservation and development .................................... 94 100.00 101.65 104.95 108.49 111.70Sewer systems .............................................................. 95 100.00 104.61 109.81 112.73 115.13Water systems ............................................................... 96 100.00 104.70 109.87 112.74 115.14Other .............................................................................. 97 100.00 101.36 103.20 107.82 111.76
Net purchases of used structures ..................................... 98 ............ ............ ............ ............ ............
Equipment .................................................................................. 99 100.00 101.11 103.29 104.48 104.01Federal .................................................................................... 100 100.00 101.24 104.03 106.17 106.46
National defense ................................................................ 101 100.00 101.72 105.23 108.31 110.07Aircraft ............................................................................ 102 100.00 103.45 116.80 124.11 130.93Missiles .......................................................................... 103 100.00 101.26 100.36 99.19 94.65Ships .............................................................................. 104 100.00 101.90 104.66 111.65 111.72Vehicles .......................................................................... 105 100.00 105.72 108.47 112.28 116.16Electronics ...................................................................... 106 100.00 96.64 94.72 89.35 80.97Other equipment ............................................................ 107 100.00 101.79 102.89 105.35 110.41
Nondefense ........................................................................ 108 100.00 99.08 98.75 97.07 92.16State and local ....................................................................... 109 100.00 100.79 101.71 101.14 99.35
Addenda:Government enterprise gross fixed investment .................... 110 100.00 102.59 105.61 109.05 111.74
Federal ............................................................................... 111 100.00 100.02 101.51 103.18 102.51Structures ....................................................................... 112 100.00 102.08 105.60 109.26 112.04Equipment ...................................................................... 113 100.00 98.21 97.41 96.01 91.18
State and local ................................................................... 114 100.00 102.99 106.22 109.87 112.92Structures ....................................................................... 115 100.00 103.09 106.47 110.46 113.74Equipment ...................................................................... 116 100.00 102.33 104.63 106.07 107.48
1. Structures includes compensation of government employees engaged in new force-account construction andrelated expenditures for goods and services.
2. Consists of Department of Defense new structures, except family housing.

August •
Table 7.14.—Chain-Type Quantity and Price Indexes for Gross Domestic Product by Sector[Index numbers, 1992=100]
Line 1992 1993 1994 1995 1996
Seasonally adjusted
1992 1993 1994
IV I II III IV I II
Chain-type quantity indexes
Gross domestic product ................................................................................................ 1 100.00 102.32 105.87 107.97 110.95 101.32 101.34 101.85 102.39 103.72 104.49 105.70
Business 1 ..................................................................................................................................... 2 100.00 102.56 106.68 109.13 112.70 101.52 101.47 102.00 102.59 104.20 105.08 106.49
Nonfarm 1 ................................................................................................................................... 3 100.00 102.79 106.70 109.38 112.99 101.58 101.63 102.15 103.00 104.39 105.05 106.51Nonfarm less housing ........................................................................................................... 4 100.00 103.15 107.08 109.76 113.61 101.87 101.75 102.45 103.42 104.97 105.25 107.04Housing .................................................................................................................................. 5 100.00 99.80 103.59 106.22 107.83 99.13 100.56 99.59 99.53 99.53 103.45 102.07
Farm ........................................................................................................................................... 6 100.00 88.13 105.49 92.13 93.75 97.68 91.85 92.66 75.71 92.30 107.16 105.94
Households and institutions ...................................................................................................... 7 100.00 103.95 106.75 109.32 111.52 101.04 101.98 103.69 104.83 105.32 105.66 106.41
Private households .................................................................................................................... 8 100.00 102.52 102.92 106.92 100.06 101.68 102.56 102.78 102.45 102.28 101.79 102.44Nonprofit institutions .................................................................................................................. 9 100.00 104.01 106.89 109.41 111.96 101.02 101.95 103.73 104.92 105.43 105.80 106.56
General government 2 .................................................................................................................. 10 100.00 100.16 100.21 99.91 99.34 100.13 100.22 100.20 100.20 100.03 100.18 100.26
Federal ....................................................................................................................................... 11 100.00 97.58 94.18 90.44 87.79 99.39 98.87 98.09 97.32 96.03 95.67 94.69State and local ........................................................................................................................... 12 100.00 101.56 103.47 105.05 105.65 100.53 100.95 101.34 101.76 102.20 102.62 103.27
Chain-type price indexes
Gross domestic product ................................................................................................ 13 100.00 102.64 105.09 107.76 110.22 100.88 101.85 102.38 102.83 103.52 104.16 104.74
Business 1 ..................................................................................................................................... 14 100.00 102.56 104.90 107.38 109.56 100.87 101.76 102.33 102.73 103.42 103.98 104.54
Nonfarm 1 ................................................................................................................................... 15 100.00 102.56 105.00 107.50 109.46 100.88 101.84 102.34 102.69 103.36 103.96 104.61Nonfarm less housing ........................................................................................................... 16 100.00 102.53 104.92 107.32 109.11 100.85 101.84 102.31 102.65 103.33 103.88 104.54Housing .................................................................................................................................. 17 100.00 102.77 105.65 109.05 112.48 101.10 101.88 102.53 103.03 103.63 104.64 105.22
Farm ........................................................................................................................................... 18 100.00 102.86 98.24 99.01 118.34 100.13 96.19 102.09 105.65 107.50 105.65 99.80
Households and institutions ...................................................................................................... 19 100.00 102.20 104.98 108.75 111.19 101.51 101.96 101.77 102.19 102.91 103.76 104.28
Private households .................................................................................................................... 20 100.00 103.17 106.30 109.61 113.51 101.53 101.81 102.53 103.69 104.66 105.21 105.78Nonprofit institutions .................................................................................................................. 21 100.00 102.17 104.94 108.71 111.10 101.51 101.96 101.74 102.13 102.84 103.70 104.22
General government 2 .................................................................................................................. 22 100.00 103.35 106.39 110.08 114.58 100.72 102.39 102.87 103.76 104.40 105.48 106.23
Federal ....................................................................................................................................... 23 100.00 103.41 106.49 111.04 116.82 99.79 102.80 102.60 103.78 104.46 105.70 106.87State and local ........................................................................................................................... 24 100.00 103.33 106.35 109.61 113.53 101.21 102.17 103.02 103.75 104.37 105.38 105.92
Line
Seasonally adjusted
1994 1995 1996 1997
III IV I II III IV I II III IV I II
Chain-type quantity indexes
Gross domestic product ................................................................................................ 1 106.17 107.11 107.36 107.44 108.24 108.84 109.32 110.92 111.20 112.38 113.73 114.34
Business 1 ..................................................................................................................................... 2 107.00 108.14 108.38 108.44 109.41 110.27 110.92 112.61 112.93 114.35 115.92 116.60
Nonfarm 1 ................................................................................................................................... 3 107.01 108.25 108.59 108.66 109.73 110.57 111.15 112.88 113.25 114.69 116.18 116.83Nonfarm less housing ........................................................................................................... 4 107.38 108.65 108.93 108.95 110.19 110.96 111.69 113.56 113.83 115.36 116.99 117.69Housing .................................................................................................................................. 5 103.92 104.90 105.66 106.17 105.84 107.22 106.66 107.26 108.37 109.05 109.53 109.71
Farm ........................................................................................................................................... 6 107.20 101.67 94.57 94.45 88.72 90.77 95.10 94.61 92.56 92.75 98.07 101.01
Households and institutions ...................................................................................................... 7 107.06 107.86 108.49 109.04 109.61 110.14 110.22 111.24 111.96 112.66 113.55 114.29
Private households .................................................................................................................... 8 103.11 104.32 106.90 107.55 107.34 105.87 104.24 102.26 98.67 95.09 94.77 95.53Nonprofit institutions .................................................................................................................. 9 107.21 108.00 108.55 109.09 109.70 110.30 110.45 111.58 112.47 113.33 114.27 115.01
General government 2 .................................................................................................................. 10 100.33 100.07 100.24 100.24 100.11 99.05 98.58 99.74 99.63 99.43 99.58 99.69
Federal ....................................................................................................................................... 11 93.89 92.48 91.84 91.48 90.85 87.57 87.64 88.48 87.94 87.08 86.80 86.27State and local ........................................................................................................................... 12 103.82 104.18 104.79 104.98 105.13 105.30 104.53 105.87 106.00 106.18 106.56 107.03
Chain-type price indexes
Gross domestic product ................................................................................................ 13 105.39 106.07 106.93 107.49 108.03 108.60 109.35 109.86 110.59 111.10 111.78 112.17
Business 1 ..................................................................................................................................... 14 105.22 105.86 106.66 107.16 107.65 108.03 108.62 109.26 109.95 110.43 111.00 111.33
Nonfarm 1 ................................................................................................................................... 15 105.39 106.03 106.88 107.35 107.73 108.04 108.67 109.20 109.76 110.21 110.88 111.18Nonfarm less housing ........................................................................................................... 16 105.33 105.94 106.78 107.21 107.53 107.76 108.36 108.88 109.40 109.82 110.47 110.70Housing .................................................................................................................................. 17 105.97 106.77 107.71 108.58 109.46 110.47 111.36 112.06 112.88 113.63 114.42 115.34
Farm ........................................................................................................................................... 18 93.29 94.23 91.35 93.48 102.82 108.39 105.84 114.23 125.11 128.16 121.56 124.04
Households and institutions ...................................................................................................... 19 105.42 106.49 107.53 108.50 109.03 109.93 110.62 110.78 111.36 111.98 112.87 113.95
Private households .................................................................................................................... 20 106.73 107.45 108.57 109.05 109.75 111.09 111.97 112.56 114.29 115.40 115.86 116.85Nonprofit institutions .................................................................................................................. 21 105.37 106.45 107.50 108.47 109.00 109.89 110.57 110.72 111.25 111.86 112.77 113.85
General government 2 .................................................................................................................. 22 106.52 107.34 108.56 109.32 110.28 112.15 114.07 113.75 114.89 115.62 116.95 117.59
Federal ....................................................................................................................................... 23 106.20 107.18 109.26 109.58 110.75 114.56 116.58 116.09 116.92 117.71 120.19 120.75State and local ........................................................................................................................... 24 106.68 107.41 108.21 109.18 110.04 111.02 112.89 112.65 113.93 114.64 115.46 116.13
NOTE.—See footnotes to table 1.7.

• August
Table 7.15.—Current-Dollar Cost and Profit Per Unit of Real Gross Domestic Product of Nonfinancial Corporate Business[Dollars]
Line 1992 1993 1994 1995 1996
Seasonally adjusted
1992 1993 1994
IV I II III IV I II
Current-dollar cost and profit per unit of real gross domestic product 1 .............. 1 1.000 1.017 1.034 1.050 1.063 1.004 1.013 1.014 1.017 1.022 1.028 1.031
Consumption of fixed capital ..................................................................................................... 2 .101 .101 .101 .100 .101 .099 .101 .101 .102 .100 .106 .099
Net domestic product .................................................................................................................. 3 .899 .916 .934 .950 .962 .905 .911 .914 .915 .923 .922 .932
Indirect business tax and nontax liability plus business transfer payments less subsidies ... 4 .103 .106 .108 .107 .108 .105 .105 .106 .106 .108 .108 .108Domestic income ....................................................................................................................... 5 .795 .810 .825 .842 .853 .800 .806 .808 .809 .815 .814 .823
Compensation of employees ................................................................................................ 6 .673 .679 .677 .687 .690 .672 .681 .680 .679 .675 .673 .677Corporate profits with inventory valuation and capital consumption adjustments .............. 7 .091 .103 .122 .128 .140 .099 .095 .100 .102 .113 .115 .120
Profits tax liability .............................................................................................................. 8 .028 .031 .036 .037 .040 .030 .028 .031 .030 .035 .034 .035Profits after tax with inventory valuation and capital consumption adjustments ............ 9 .063 .072 .086 .090 .101 .069 .068 .069 .072 .078 .081 .085
Net interest ............................................................................................................................ 10 .032 .028 .027 .027 .023 .030 .030 .028 .027 .027 .026 .026
Line
Seasonally adjusted
1994 1995 1996 1997
III IV I II III IV I II III IV I II
Current-dollar cost and profit per unit of real gross domestic product 1 .............. 1 1.037 1.041 1.046 1.048 1.051 1.054 1.060 1.062 1.064 1.065 1.069 ...............
Consumption of fixed capital ..................................................................................................... 2 .099 .098 .099 .101 .100 .101 .101 .101 .101 .101 .101 ...............
Net domestic product .................................................................................................................. 3 .938 .943 .947 .947 .951 .953 .959 .961 .963 .963 .968 ...............
Indirect business tax and nontax liability plus business transfer payments less subsidies ... 4 .109 .108 .108 .108 .107 .107 .109 .109 .108 .108 .107 ...............Domestic income ....................................................................................................................... 5 .829 .835 .839 .840 .844 .846 .850 .853 .855 .855 .861 ...............
Compensation of employees ................................................................................................ 6 .679 .678 .687 .689 .685 .686 .687 .689 .691 .693 .697 ...............Corporate profits with inventory valuation and capital consumption adjustments .............. 7 .124 .129 .123 .122 .132 .133 .138 .140 .141 .142 .143 ...............
Profits tax liability .............................................................................................................. 8 .036 .038 .038 .037 .037 .037 .039 .040 .040 .040 .040 ...............Profits after tax with inventory valuation and capital consumption adjustments ............ 9 .087 .090 .084 .086 .094 .096 .099 .100 .101 .102 .103 ...............
Net interest ............................................................................................................................ 10 .027 .028 .029 .028 .027 .026 .025 .024 .022 .021 .021 ...............
1. Equals the deflator for gross domestic product of nonfinancial corporate business with the decimal point shiftedtwo places to the left.
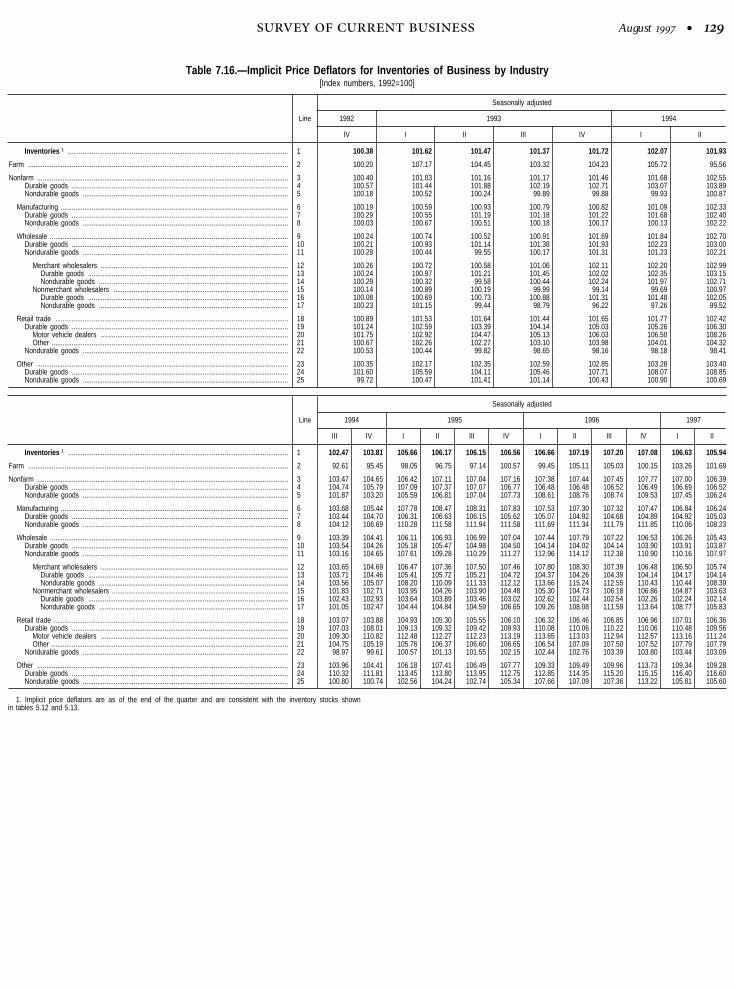
August •
Table 7.16.—Implicit Price Deflators for Inventories of Business by Industry[Index numbers, 1992=100]
Line
Seasonally adjusted
1992 1993 1994
IV I II III IV I II
Inventories 1 ......................................................................................................................... 1 100.38 101.62 101.47 101.37 101.72 102.07 101.93
Farm ............................................................................................................................................... 2 100.20 107.17 104.45 103.32 104.23 105.72 95.56
Nonfarm .......................................................................................................................................... 3 100.40 101.03 101.16 101.17 101.46 101.68 102.55Durable goods ....................................................................................................................... 4 100.57 101.44 101.88 102.19 102.71 103.07 103.89Nondurable goods ................................................................................................................. 5 100.18 100.52 100.24 99.89 99.88 99.93 100.87
Manufacturing ............................................................................................................................. 6 100.19 100.59 100.93 100.79 100.82 101.09 102.33Durable goods ....................................................................................................................... 7 100.29 100.55 101.19 101.18 101.22 101.68 102.40Nondurable goods ................................................................................................................. 8 100.03 100.67 100.51 100.18 100.17 100.13 102.22
Wholesale ................................................................................................................................... 9 100.24 100.74 100.52 100.91 101.69 101.84 102.70Durable goods ....................................................................................................................... 10 100.21 100.93 101.14 101.38 101.93 102.23 103.00Nondurable goods ................................................................................................................. 11 100.28 100.44 99.55 100.17 101.31 101.23 102.21
Merchant wholesalers ....................................................................................................... 12 100.26 100.72 100.58 101.06 102.11 102.20 102.99Durable goods .............................................................................................................. 13 100.24 100.97 101.21 101.45 102.02 102.35 103.15Nondurable goods ........................................................................................................ 14 100.29 100.32 99.58 100.44 102.24 101.97 102.71
Nonmerchant wholesalers ................................................................................................ 15 100.14 100.89 100.19 99.99 99.14 99.69 100.97Durable goods .............................................................................................................. 16 100.08 100.69 100.73 100.88 101.31 101.48 102.05Nondurable goods ........................................................................................................ 17 100.23 101.15 99.44 98.79 96.22 97.26 99.52
Retail trade ................................................................................................................................ 18 100.89 101.53 101.64 101.44 101.65 101.77 102.42Durable goods ....................................................................................................................... 19 101.24 102.59 103.39 104.14 105.03 105.26 106.30
Motor vehicle dealers ....................................................................................................... 20 101.75 102.92 104.47 105.13 106.03 106.50 108.26Other .................................................................................................................................. 21 100.67 102.26 102.27 103.10 103.98 104.01 104.32
Nondurable goods ................................................................................................................. 22 100.53 100.44 99.82 98.65 98.16 98.18 98.41
Other .......................................................................................................................................... 23 100.35 102.17 102.35 102.59 102.85 103.28 103.40Durable goods ....................................................................................................................... 24 101.60 105.59 104.11 105.46 107.71 108.07 108.85Nondurable goods ................................................................................................................. 25 99.72 100.47 101.41 101.14 100.43 100.90 100.69
Line
Seasonally adjusted
1994 1995 1996 1997
III IV I II III IV I II III IV I II
Inventories 1 ......................................................................................................................... 1 102.47 103.81 105.66 106.17 106.15 106.56 106.66 107.19 107.20 107.08 106.63 105.94
Farm ............................................................................................................................................... 2 92.61 95.45 98.05 96.75 97.14 100.57 99.45 105.11 105.03 100.15 103.26 101.69
Nonfarm .......................................................................................................................................... 3 103.47 104.65 106.42 107.11 107.04 107.16 107.38 107.44 107.45 107.77 107.00 106.39Durable goods ....................................................................................................................... 4 104.74 105.79 107.09 107.37 107.07 106.77 106.48 106.48 106.52 106.49 106.69 106.52Nondurable goods ................................................................................................................. 5 101.87 103.20 105.59 106.81 107.04 107.73 108.61 108.76 108.74 109.53 107.45 106.24
Manufacturing ............................................................................................................................. 6 103.68 105.44 107.78 108.47 108.31 107.83 107.53 107.30 107.32 107.47 106.84 106.24Durable goods ....................................................................................................................... 7 103.44 104.70 106.31 106.63 106.15 105.62 105.07 104.92 104.68 104.89 104.92 105.03Nondurable goods ................................................................................................................. 8 104.12 106.69 110.28 111.58 111.94 111.58 111.69 111.34 111.79 111.85 110.06 108.23
Wholesale ................................................................................................................................... 9 103.39 104.41 106.11 106.93 106.99 107.04 107.44 107.79 107.22 106.53 106.26 105.43Durable goods ....................................................................................................................... 10 103.54 104.26 105.18 105.47 104.98 104.50 104.14 104.02 104.14 103.90 103.91 103.87Nondurable goods ................................................................................................................. 11 103.16 104.65 107.61 109.28 110.29 111.27 112.96 114.12 112.38 110.90 110.16 107.97
Merchant wholesalers ....................................................................................................... 12 103.65 104.69 106.47 107.36 107.50 107.46 107.80 108.30 107.39 106.48 106.50 105.74Durable goods .............................................................................................................. 13 103.71 104.46 105.41 105.72 105.21 104.72 104.37 104.26 104.39 104.14 104.17 104.14Nondurable goods ........................................................................................................ 14 103.56 105.07 108.20 110.09 111.33 112.12 113.66 115.24 112.55 110.43 110.44 108.39
Nonmerchant wholesalers ................................................................................................. 15 101.83 102.71 103.95 104.26 103.90 104.48 105.30 104.73 106.18 106.86 104.87 103.63Durable goods .............................................................................................................. 16 102.43 102.93 103.64 103.89 103.46 103.02 102.62 102.44 102.54 102.26 102.24 102.14Nondurable goods ........................................................................................................ 17 101.05 102.47 104.44 104.84 104.59 106.65 109.26 108.08 111.59 113.64 108.77 105.83
Retail trade ................................................................................................................................. 18 103.07 103.88 104.93 105.30 105.55 106.10 106.32 106.46 106.85 106.96 107.01 106.36Durable goods ....................................................................................................................... 19 107.03 108.01 109.13 109.32 109.42 109.93 110.08 110.06 110.22 110.06 110.48 109.56
Motor vehicle dealers ....................................................................................................... 20 109.30 110.82 112.48 112.27 112.23 113.19 113.65 113.03 112.94 112.57 113.16 111.24Other .................................................................................................................................. 21 104.75 105.19 105.76 106.37 106.60 106.65 106.54 107.09 107.50 107.52 107.79 107.79
Nondurable goods ................................................................................................................. 22 98.97 99.61 100.57 101.13 101.55 102.15 102.44 102.76 103.39 103.80 103.44 103.09
Other .......................................................................................................................................... 23 103.96 104.41 106.18 107.41 106.49 107.77 109.33 109.49 109.96 113.73 109.34 109.28Durable goods ....................................................................................................................... 24 110.32 111.81 113.45 113.80 113.95 112.75 112.85 114.35 115.20 115.15 116.40 116.60Nondurable goods ................................................................................................................. 25 100.80 100.74 102.56 104.24 102.74 105.34 107.66 107.09 107.36 113.22 105.81 105.60
1. Implicit price deflators are as of the end of the quarter and are consistent with the inventory stocks shownin tables 5.12 and 5.13.

• August
Table 7.17.—Chain-Type Quantity Indexes for Gross Domestic Product by Major Type of Product[Index numbers, 1992=100]
Line 1992 1993 1994 1995 1996
Seasonally adjusted
1992 1993 1994
IV I II III IV I II
Gross domestic product .................................................................................................... 1 100.00 102.32 105.87 107.97 110.95 101.32 101.34 101.85 102.39 103.72 104.49 105.70
Final sales of domestic product ................................................................................................ 2 100.00 102.11 105.03 107.62 110.64 101.34 100.96 101.72 102.28 103.47 103.78 104.64Change in business inventories ................................................................................................ 3 ............... ............... ............... ............... ............... ............... ............... ............... ............... ............... ............... ...............
Goods ............................................................................................................................................ 4 100.00 103.04 108.32 110.91 114.72 101.96 101.83 102.68 102.66 104.98 106.71 108.08
Final sales ............................................................................................................................. 5 100.00 102.45 106.05 109.98 113.89 101.99 100.81 102.34 102.36 104.29 104.78 105.18Change in business inventories ............................................................................................ 6 ............... ............... ............... ............... ............... ............... ............... ............... ............... ............... ............... ...............
Durable goods ............................................................................................................................ 7 100.00 107.13 114.10 120.66 127.97 102.61 104.50 106.42 106.55 111.06 111.95 113.58Final sales ............................................................................................................................. 8 100.00 104.25 109.39 116.39 124.84 102.99 101.17 104.46 103.88 107.48 107.71 108.16Change in business inventories ............................................................................................ 9 ............... ............... ............... ............... ............... ............... ............... ............... ............... ............... ............... ...............
Nondurable goods ...................................................................................................................... 10 100.00 100.19 104.31 104.20 105.69 101.50 99.97 100.07 99.95 100.76 103.07 104.27Final sales ............................................................................................................................. 11 100.00 101.17 103.67 105.48 106.32 101.28 100.56 100.83 101.27 102.02 102.69 103.06Change in business inventories ............................................................................................ 12 ............... ............... ............... ............... ............... ............... ............... ............... ............... ............... ............... ...............
Services ......................................................................................................................................... 13 100.00 101.71 103.86 105.97 108.08 100.91 101.05 101.26 102.03 102.50 102.91 103.60
Structures ...................................................................................................................................... 14 100.00 103.20 108.32 108.33 113.63 101.20 101.00 102.04 103.50 106.27 105.12 109.12
Addenda:Motor vehicle output .................................................................................................................. 15 100.00 107.02 119.82 120.55 117.55 106.78 105.58 106.00 103.28 113.21 121.94 117.15Gross domestic product less motor vehicle output .................................................................. 16 100.00 102.16 105.39 107.54 110.73 101.14 101.19 101.71 102.36 103.40 103.88 105.31
Line
Seasonally adjusted
1994 1995 1996 1997
III IV I II III IV I II III IV I II
Gross domestic product .................................................................................................... 1 106.17 107.11 107.36 107.44 108.24 108.84 109.32 110.92 111.20 112.38 113.73 114.34
Final sales of domestic product ................................................................................................ 2 105.50 106.21 106.68 107.18 108.05 108.57 109.26 110.66 110.70 111.93 112.77 113.32Change in business inventories ................................................................................................ 3 ............... ............... ............... ............... ............... ............... ............... ............... ............... ............... ............... ...............
Goods ............................................................................................................................................ 4 108.07 110.43 110.44 109.80 111.02 112.37 112.65 114.55 115.17 116.51 119.31 119.37
Final sales ............................................................................................................................. 5 106.26 107.97 108.62 109.13 110.52 111.66 112.54 113.89 113.83 115.32 116.66 116.53Change in business inventories ............................................................................................ 6 ............... ............... ............... ............... ............... ............... ............... ............... ............... ............... ............... ...............
Durable goods ............................................................................................................................ 7 114.22 116.65 118.88 119.01 121.23 123.53 124.47 128.51 130.25 128.64 133.71 136.31Final sales ............................................................................................................................. 8 109.96 111.75 113.36 114.98 117.73 119.50 121.33 125.26 125.41 127.35 128.97 130.83Change in business inventories ............................................................................................ 9 ............... ............... ............... ............... ............... ............... ............... ............... ............... ............... ............... ...............
Nondurable goods ...................................................................................................................... 10 103.81 106.11 104.62 103.45 104.01 104.73 104.57 105.06 104.94 108.19 109.52 107.96Final sales ............................................................................................................................. 11 103.64 105.29 105.27 105.00 105.47 106.18 106.41 106.02 105.82 107.01 108.17 106.74Change in business inventories ............................................................................................ 12 ............... ............... ............... ............... ............... ............... ............... ............... ............... ............... ............... ...............
Services ......................................................................................................................................... 13 104.36 104.59 105.04 105.85 106.44 106.55 106.96 108.03 108.15 109.17 109.76 110.70
Structures ...................................................................................................................................... 14 109.71 109.32 109.11 107.53 108.02 108.66 110.42 114.17 114.19 115.73 116.16 116.81
Addenda:Motor vehicle output .................................................................................................................. 15 119.35 120.85 123.26 119.52 117.24 122.16 111.57 123.15 120.25 115.23 120.59 116.88Gross domestic product less motor vehicle output .................................................................. 16 105.71 106.64 106.81 107.02 107.94 108.38 109.25 110.50 110.89 112.28 113.50 114.25

August •
Table 7.18.—Chain-Type Quantity Indexes for Auto Output[Index numbers, 1992=100]
Line 1992 1993 1994 1995 1996
Seasonally adjusted
1992 1993 1994
IV I II III IV I II
Auto output ...................................................................................................................... 1 100.00 103.10 108.88 105.03 98.69 103.98 102.57 103.44 98.29 108.11 115.62 107.03
Final sales ..................................................................................................................................... 2 100.00 102.52 107.96 102.59 101.94 103.87 95.22 104.66 102.37 107.83 115.12 107.57Personal consumption expenditures ......................................................................................... 3 100.00 103.02 105.25 103.75 103.07 102.24 98.72 102.97 103.68 106.71 108.08 104.66
New autos .............................................................................................................................. 4 100.00 102.82 105.00 98.13 95.25 101.63 96.42 102.24 103.88 108.73 105.60 106.37Net purchases of used autos ............................................................................................... 5 ............... ............... ............... ............... ............... ............... ............... ............... ............... ............... ............... ...............
Producers’ durable equipment .................................................................................................. 6 100.00 110.07 135.58 122.99 128.03 103.79 99.75 114.94 108.43 117.15 130.45 134.53New autos .............................................................................................................................. 7 100.00 106.88 123.47 120.70 126.10 104.78 99.23 113.68 104.08 110.51 120.42 121.80Net purchases of used autos ............................................................................................... 8 ............... ............... ............... ............... ............... ............... ............... ............... ............... ............... ............... ...............
Net exports ................................................................................................................................. 9 ............... ............... ............... ............... ............... ............... ............... ............... ............... ............... ............... ...............Exports ................................................................................................................................... 10 100.00 101.15 112.84 112.40 112.16 110.11 97.80 104.04 93.93 108.84 112.99 114.18Imports ................................................................................................................................... 11 100.00 108.49 121.99 123.74 126.62 101.25 108.21 107.35 107.43 110.96 106.83 121.23
Gross government investment .................................................................................................. 12 100.00 92.50 100.29 111.19 102.75 96.12 96.76 96.99 95.19 81.08 96.12 100.92
Change in business inventories of new and used autos ...................................................... 13 ............... ............... ............... ............... ............... ............... ............... ............... ............... ............... ............... ...............New ............................................................................................................................................ 14 ............... ............... ............... ............... ............... ............... ............... ............... ............... ............... ............... ...............Used ........................................................................................................................................... 15 ............... ............... ............... ............... ............... ............... ............... ............... ............... ............... ............... ...............
Addenda:Domestic output of new autos 1 ................................................................................................ 16 100.00 104.65 119.32 114.30 110.93 104.12 103.57 104.69 98.09 112.25 124.07 116.65Sales of imported new autos 2 .................................................................................................. 17 100.00 104.00 104.18 101.14 98.06 102.97 97.18 106.24 109.25 103.33 98.66 107.24
Line
Seasonally adjusted
1994 1995 1996 1997
III IV I II III IV I II III IV I II
Auto output ...................................................................................................................... 1 106.75 106.12 109.84 103.12 101.18 105.97 89.25 106.68 105.25 93.58 98.45 95.55
Final sales ..................................................................................................................................... 2 107.07 102.08 97.60 99.27 107.94 105.55 102.33 104.64 101.44 99.35 99.31 94.57Personal consumption expenditures ......................................................................................... 3 104.36 103.90 101.45 103.04 106.80 103.72 102.81 106.14 102.94 100.38 105.11 100.14
New autos .............................................................................................................................. 4 104.81 103.24 96.21 97.09 98.60 100.62 97.19 96.55 93.43 93.83 96.91 88.93Net purchases of used autos ............................................................................................... 5 ............... ............... ............... ............... ............... ............... ............... ............... ............... ............... ............... ...............
Producers’ durable equipment .................................................................................................. 6 138.85 138.51 124.51 120.54 125.58 121.35 122.09 128.88 133.95 127.22 136.19 131.46New autos .............................................................................................................................. 7 124.92 126.73 120.78 117.45 124.87 119.70 120.60 129.07 133.00 121.72 130.80 127.02Net purchases of used autos ............................................................................................... 8 ............... ............... ............... ............... ............... ............... ............... ............... ............... ............... ............... ...............
Net exports ................................................................................................................................. 9 ............... ............... ............... ............... ............... ............... ............... ............... ............... ............... ............... ...............Exports ................................................................................................................................... 10 117.22 106.95 118.68 110.95 109.63 110.36 116.29 108.53 112.99 110.84 109.44 116.48Imports ................................................................................................................................... 11 125.95 133.96 133.09 128.61 118.39 114.87 122.86 126.36 131.31 125.96 143.81 141.24
Gross government investment .................................................................................................. 12 108.88 95.22 97.80 114.56 105.07 127.31 120.78 85.19 89.32 115.71 103.02 83.20
Change in business inventories of new and used autos ...................................................... 13 ............... ............... ............... ............... ............... ............... ............... ............... ............... ............... ............... ...............New ............................................................................................................................................ 14 ............... ............... ............... ............... ............... ............... ............... ............... ............... ............... ............... ...............Used ........................................................................................................................................... 15 ............... ............... ............... ............... ............... ............... ............... ............... ............... ............... ............... ...............
Addenda:Domestic output of new autos 1 ................................................................................................ 16 118.17 118.40 124.57 110.30 111.50 110.81 103.25 116.59 120.25 103.63 109.88 108.24Sales of imported new autos 2 .................................................................................................. 17 105.31 105.49 100.95 99.41 100.58 103.64 98.07 97.36 97.64 99.15 108.82 101.85
1. Consists of final sales and change in business inventories of new autos assembled in the United States.2. Consists of personal consumption expenditures, producers’ durable equipment, and gross government invest-
ment.

• August
Table 7.19.—Chain-Type Quantity Indexes for Truck Output[Index numbers, 1992=100]
Line 1992 1993 1994 1995 1996
Seasonally adjusted
1992 1993 1994
IV I II III IV I II
Truck output 1 .................................................................................................................. 1 100.00 112.68 135.54 142.80 144.61 110.83 109.94 109.72 110.46 120.58 131.04 131.70
Final sales ..................................................................................................................................... 2 100.00 114.96 134.29 142.00 147.62 109.72 103.53 115.43 115.56 125.32 130.01 130.71Personal consumption expenditures ......................................................................................... 3 100.00 110.19 122.49 121.45 121.78 106.05 104.62 109.96 108.42 117.77 119.58 121.73Producers’ durable equipment .................................................................................................. 4 100.00 122.45 149.75 167.88 181.34 108.43 109.75 122.45 124.19 133.43 143.57 142.84Net exports ................................................................................................................................. 5 ............... ............... ............... ............... ............... ............... ............... ............... ............... ............... ............... ...............
Exports ................................................................................................................................... 6 100.00 103.24 118.31 134.54 156.23 106.58 92.68 103.13 95.95 121.16 116.71 117.72Imports ................................................................................................................................... 7 100.00 103.53 105.04 110.36 116.45 100.56 108.92 111.05 97.24 96.90 98.82 101.08
Gross government investment .................................................................................................. 8 100.00 99.53 100.41 102.81 91.90 129.72 80.19 118.93 105.93 93.07 91.69 92.19
Change in business inventories ................................................................................................ 9 ............... ............... ............... ............... ............... ............... ............... ............... ............... ............... ............... ...............
Line
Seasonally adjusted
1994 1995 1996 1997
III IV I II III IV I II III IV I II
Truck output 1 .................................................................................................................. 1 137.44 141.99 142.54 143.04 140.27 145.37 143.59 146.75 141.72 146.38 152.43 147.55
Final sales ..................................................................................................................................... 2 134.55 141.87 142.17 139.41 140.40 146.01 149.53 144.57 144.35 152.03 150.72 147.89Personal consumption expenditures ......................................................................................... 3 120.12 128.54 123.28 119.71 119.18 123.65 127.03 120.92 118.29 120.90 119.17 111.70Producers’ durable equipment .................................................................................................. 4 151.12 161.47 167.91 163.91 167.80 171.91 173.64 176.45 184.46 190.80 193.20 195.67Net exports ................................................................................................................................. 5 ............... ............... ............... ............... ............... ............... ............... ............... ............... ............... ............... ...............
Exports ................................................................................................................................... 6 112.27 126.57 138.30 130.35 132.67 136.82 143.86 156.36 147.53 177.17 175.57 164.31Imports ................................................................................................................................... 7 107.35 112.90 114.06 109.10 108.53 109.77 107.25 119.27 125.33 113.92 133.14 126.36
Gross government investment .................................................................................................. 8 121.18 96.59 95.01 104.99 97.73 113.50 115.11 90.17 79.52 82.80 97.68 100.47
Change in business inventories ................................................................................................ 9 ............... ............... ............... ............... ............... ............... ............... ............... ............... ............... ............... ...............
1. Includes new trucks only.
Table 7.20.—Chain-Type Quantity Indexes for Gross and Net Investment by Major Type[Index numbers, 1992=100]
Line 1992 1993 1994 1995 1996
Gross private domestic investment ....................................... 1 100.00 109.25 123.44 125.44 135.26Less: Consumption of fixed capital ............................................ 2 100.00 99.62 105.09 105.85 109.75Equals: Net private domestic investment .................................. 3 100.00 136.74 175.81 181.37 208.09
Fixed investment .................................................................. 4 100.00 107.58 116.86 122.81 132.97Less: Consumption of fixed capital ....................................... 5 100.00 99.62 105.09 105.85 109.75Equals: Net fixed investment ................................................. 6 100.00 131.08 151.65 172.93 201.59
Nonresidential ................................................................... 7 100.00 107.58 116.22 126.65 138.33Less: Consumption of fixed capital ................................... 8 100.00 101.48 105.46 108.28 112.93Equals: Net nonresidential ................................................. 9 100.00 140.97 175.12 227.20 277.37
Structures ..................................................................... 10 100.00 100.95 101.94 106.35 111.51Less: Consumption of fixed capital .............................. 11 100.00 99.56 103.90 101.26 102.28Equals: Net structures ................................................... 12 100.00 104.34 97.17 118.72 133.91
Producers’ durable equipment .................................. 13 100.00 110.52 122.66 135.91 150.77Less: Consumption of fixed capital .............................. 14 100.00 102.15 106.00 110.79 116.78Equals: Net producers’ durable equipment .................. 15 100.00 190.46 281.85 375.96 475.54
Residential ........................................................................ 16 100.00 107.56 118.39 113.94 120.64Less: Consumption of fixed capital ................................... 17 100.00 91.99 103.45 96.06 97.01Equals: Net residential ....................................................... 18 100.00 123.37 133.56 132.09 144.64
Change in business inventories ........................................ 19 ............ ............ ............ ............ ............
Line 1992 1993 1994 1995 1996
Gross government investment 1 ............................................. 20 100.00 95.82 93.75 94.22 97.21Less: Consumption of fixed capital ............................................ 21 100.00 102.00 103.62 104.27 105.09Equals: Net government investment .......................................... 22 100.00 86.35 78.91 79.17 85.38
Federal .................................................................. 23 ............ ............ ............ ............ ............National defense ............................................... 24 ............ ............ ............ ............ ............Nondefense ....................................................... 25 100.00 100.67 71.79 71.25 82.21
State and local ...................................................... 26 100.00 95.00 94.42 97.20 101.19
Structures .............................................................................. 27 100.00 98.44 98.71 101.06 103.88Less: Consumption of fixed capital ....................................... 28 100.00 102.03 104.70 106.19 107.73Equals: Net structures ............................................................ 29 ............ ............ ............ ............ ............
Federal .............................................................. 30 ............ ............ ............ ............ ............National defense .......................................... 31 ............ ............ ............ ............ ............Nondefense .................................................. 32 100.00 112.23 89.59 89.14 87.67
State and local ................................................. 33 100.00 95.32 94.86 97.50 100.92
Equipment ............................................................................. 34 100.00 91.99 86.48 84.10 87.37Less: Consumption of fixed capital ....................................... 35 100.00 101.99 102.80 102.83 103.10Equals: Net equipment ........................................................... 36 ............ ............ ............ ............ ............
Federal .............................................................. 37 ............ ............ ............ ............ ............National defense .......................................... 38 ............ ............ ............ ............ ............Nondefense .................................................. 39 100.00 86.59 50.00 49.48 78.16
State and local ................................................. 40 100.00 90.39 88.21 93.14 105.85
1. Gross government investment consists of general government and government enterprise expenditures for fixedassets; change in inventories is included in government consumption expenditures.
.

August •
. Supplementary Tables
Table 8.1.—Percent Change From Preceding Period in Selected Series[Percent]
Line 1992 1993 1994 1995 1996
Seasonally adjusted at annual rates
1992 1993 1994
IV I II III IV I II
Gross domestic product:Current dollars .............................................................................................................. 1 5.5 5.0 5.9 4.6 5.1 7.3 3.9 4.1 4.1 8.1 5.5 7.1Chain-type quantity index ............................................................................................. 2 2.7 2.3 3.5 2.0 2.8 4.3 .1 2.0 2.1 5.3 3.0 4.7Chain-type price index ................................................................................................. 3 2.8 2.6 2.4 2.5 2.3 2.8 3.9 2.1 1.8 2.7 2.5 2.2Implicit price deflator .................................................................................................... 4 2.8 2.6 2.4 2.5 2.3 2.9 3.9 2.0 1.9 2.7 2.4 2.2
Personal consumption expenditures:Current dollars ........................................................................................................................... 5 6.2 5.7 5.8 5.1 5.0 8.8 3.3 5.9 5.6 6.0 5.5 5.7Chain-type quantity index .......................................................................................................... 6 2.8 2.9 3.3 2.4 2.6 5.4 .4 3.4 4.1 2.9 3.8 3.0Chain-type price index ............................................................................................................... 7 3.3 2.7 2.4 2.6 2.4 3.2 2.9 2.5 1.3 3.0 1.7 2.7Implicit price deflator ................................................................................................................. 8 3.3 2.7 2.4 2.6 2.4 3.3 2.9 2.4 1.4 3.0 1.6 2.6
Durable goods:Current dollars ....................................................................................................................... 9 7.3 8.5 9.3 5.0 4.3 11.6 .1 14.8 10.3 12.4 7.5 6.7Chain-type quantity index ..................................................................................................... 10 5.8 7.2 7.1 4.0 4.7 11.0 –.7 12.6 8.4 9.6 6.4 3.8Chain-type price index .......................................................................................................... 11 1.5 1.2 2.0 1.0 –.4 .5 1.0 2.1 1.5 2.6 1.0 2.9Implicit price deflator ............................................................................................................. 12 1.5 1.2 2.0 1.0 –.4 .5 .9 1.9 1.7 2.6 1.0 2.8
Nondurable goods:Current dollars ....................................................................................................................... 13 3.5 3.7 4.2 3.3 4.0 7.2 1.5 3.5 2.3 4.2 4.8 3.3Chain-type quantity index ..................................................................................................... 14 1.5 2.2 2.9 1.6 1.4 5.8 –.7 3.1 2.7 1.5 5.0 2.1Chain-type price index .......................................................................................................... 15 2.0 1.5 1.3 1.7 2.6 1.3 2.2 .5 –.4 2.6 –.1 1.3Implicit price deflator ............................................................................................................. 16 2.0 1.5 1.3 1.7 2.6 1.3 2.2 .4 –.4 2.6 –.2 1.2
Services:Current dollars ....................................................................................................................... 17 7.5 6.2 5.9 6.1 5.7 9.2 5.0 5.4 6.4 5.8 5.5 6.7Chain-type quantity index ..................................................................................................... 18 2.9 2.5 2.7 2.5 2.7 4.0 1.3 1.7 4.0 2.3 2.7 3.3Chain-type price index .......................................................................................................... 19 4.4 3.6 3.1 3.5 2.9 4.9 3.8 3.6 2.3 3.3 2.8 3.3Implicit price deflator ............................................................................................................. 20 4.4 3.6 3.1 3.4 2.9 5.0 3.7 3.6 2.3 3.3 2.8 3.3
Gross private domestic investment:Current dollars ........................................................................................................................... 21 7.4 10.8 15.0 3.0 7.5 8.5 20.0 1.5 7.4 23.6 20.1 24.6Chain-type quantity index .......................................................................................................... 22 7.1 9.3 13.0 1.6 7.8 7.0 17.4 .3 6.0 22.9 16.8 22.0Chain-type price index ............................................................................................................... 23 .3 1.5 1.8 1.4 –.2 1.5 2.3 1.4 .9 .8 2.8 2.1Implicit price deflator ................................................................................................................. 24 .3 1.5 1.8 1.4 –.3 1.4 2.2 1.1 1.3 .6 2.8 2.2
Fixed investment:Current dollars ....................................................................................................................... 25 6.1 9.2 10.6 6.5 8.2 11.4 7.0 9.8 7.8 19.2 6.2 14.2Chain-type quantity index ..................................................................................................... 26 5.7 7.6 8.6 5.1 8.3 9.7 4.5 8.2 6.6 18.3 3.2 11.9Chain-type price index .......................................................................................................... 27 .4 1.5 1.8 1.3 –.1 1.6 2.3 1.5 .9 .9 2.9 2.1Implicit price deflator ............................................................................................................. 28 .4 1.5 1.8 1.3 –.1 1.5 2.4 1.4 1.1 .8 2.9 2.0
Nonresidential:Current dollars ................................................................................................................... 29 1.9 8.3 9.4 9.4 8.1 6.3 7.9 13.2 5.2 17.0 2.6 12.0Chain-type quantity index ................................................................................................. 30 1.9 7.6 8.0 9.0 9.2 6.2 6.2 12.5 4.9 16.4 .4 9.9Chain-type price index ...................................................................................................... 31 .1 .7 1.2 .4 –1.0 .1 1.6 .7 0 .6 2.3 2.1Implicit price deflator ......................................................................................................... 32 .1 .7 1.2 .4 –1.0 .1 1.5 .6 .2 .5 2.2 1.9
Structures:Current dollars .............................................................................................................. 33 –6.9 4.2 4.6 8.7 7.3 –1.1 11.3 8.6 6.0 6.8 –11.3 24.3Chain-type quantity index ............................................................................................. 34 –6.8 1.0 1.0 4.3 4.8 –4.3 6.0 5.5 3.4 3.3 –14.8 21.1Chain-type price index ................................................................................................. 35 –.1 3.3 3.6 4.2 2.3 3.4 5.0 2.9 2.6 3.4 4.1 2.7Implicit price deflator .................................................................................................... 36 –.1 3.3 3.6 4.2 2.3 3.3 5.0 2.9 2.6 3.4 4.1 2.7
Producers’ durable equipment:Current dollars .............................................................................................................. 37 6.3 10.0 11.3 9.7 8.4 9.6 6.5 15.2 4.8 21.4 8.6 7.6Chain-type quantity index ............................................................................................. 38 6.2 10.5 11.0 10.8 10.9 11.0 6.4 15.6 5.5 22.3 7.0 5.9Chain-type price index ................................................................................................. 39 .2 –.4 .3 –1.0 –2.3 –1.2 .1 –.3 –1.1 –.5 1.5 1.9Implicit price deflator .................................................................................................... 40 .2 –.4 .3 –1.0 –2.3 –1.3 .1 –.3 –.7 –.7 1.5 1.6
Residential:Current dollars ................................................................................................................... 41 18.0 11.5 13.7 –.3 8.5 24.8 5.0 1.8 14.4 24.8 15.1 19.2Chain-type quantity index ................................................................................................. 42 16.6 7.6 10.1 –3.8 5.9 18.7 .6 –1.6 10.8 23.1 10.0 16.6Chain-type price index ...................................................................................................... 43 1.2 3.7 3.3 3.6 2.4 5.1 4.3 3.4 3.3 1.5 4.5 2.2Implicit price deflator ......................................................................................................... 44 1.2 3.7 3.3 3.6 2.4 5.2 4.4 3.5 3.3 1.4 4.5 2.2
Exports of goods and services:Current dollars ........................................................................................................................... 45 6.3 3.0 9.5 13.5 6.4 5.7 –1.3 9.0 –8.4 21.8 –.5 19.9Chain-type quantity index .......................................................................................................... 46 6.6 2.9 8.2 11.1 8.3 6.0 –1.2 8.2 –8.1 21.9 –1.8 17.7Chain-type price index ............................................................................................................... 47 –.3 .1 1.2 2.2 –1.8 –.4 0 1.0 –.7 0 1.6 2.2Implicit price deflator ................................................................................................................. 48 –.3 .1 1.2 2.2 –1.8 –.3 –.1 .7 –.3 –.1 1.3 1.9
Exports of goods:Current dollars ....................................................................................................................... 49 5.2 2.5 10.8 14.6 5.8 10.5 –6.6 10.0 –11.8 29.4 –1.7 21.2Chain-type quantity index ..................................................................................................... 50 7.0 3.4 9.9 12.6 9.5 11.8 –5.8 10.2 –11.0 30.9 –3.5 19.8Chain-type price index .......................................................................................................... 51 –1.7 –.9 .8 1.8 –3.4 –1.2 –.7 .2 –1.4 –1.0 2.4 1.6Implicit price deflator ............................................................................................................. 52 –1.7 –.9 .8 1.8 –3.4 –1.2 –.8 –.1 –.9 –1.1 1.9 1.2
Exports of services:Current dollars ....................................................................................................................... 53 8.7 4.3 6.4 10.9 8.0 –4.8 12.5 6.6 –.2 5.8 2.1 16.9Chain-type quantity index ..................................................................................................... 54 5.5 2.0 4.3 7.4 5.5 –6.4 10.8 3.7 –1.3 3.4 2.4 12.9Chain-type price index .......................................................................................................... 55 3.1 2.3 2.0 3.2 2.4 1.7 1.6 3.0 .9 2.3 –.1 3.6Implicit price deflator ............................................................................................................. 56 3.1 2.3 2.0 3.2 2.4 1.7 1.5 2.8 1.1 2.3 –.2 3.6
See note at end of table.

• August
Table 8.1.—Percent Change From Preceding Period in Selected Series—Continued[Percent]
Line 1992 1993 1994 1995 1996
Seasonally adjusted at annual rates
1992 1993 1994
IV I II III IV I II
Imports of goods and services:Current dollars ........................................................................................................................... 57 7.5 7.5 12.9 11.4 6.8 8.5 1.1 15.2 .1 16.0 5.0 24.7Chain-type quantity index .......................................................................................................... 58 7.5 8.9 12.2 8.9 9.1 11.6 7.6 12.4 3.8 17.7 7.6 19.0Chain-type price index ............................................................................................................... 59 0 –1.2 .6 2.2 –2.2 –2.4 –6.2 2.6 –3.6 –1.5 –2.2 5.1Implicit price deflator ................................................................................................................. 60 0 –1.2 .6 2.2 –2.2 –2.7 –6.1 2.5 –3.5 –1.4 –2.4 4.8
Imports of goods:Current dollars ....................................................................................................................... 61 8.8 8.8 14.2 11.9 6.8 5.3 4.6 16.7 –.3 15.5 5.3 29.4Chain-type quantity index ..................................................................................................... 62 9.6 10.5 13.6 9.5 9.9 6.6 12.6 13.9 3.6 17.8 8.6 22.3Chain-type price index .......................................................................................................... 63 –.7 –1.5 .5 2.2 –2.8 –1.3 –7.2 2.5 –3.9 –2.0 –2.9 6.2Implicit price deflator ............................................................................................................. 64 –.7 –1.5 .5 2.2 –2.8 –1.3 –7.1 2.4 –3.8 –2.0 –3.1 5.8
Imports of services:Current dollars ....................................................................................................................... 65 2.1 1.9 6.9 8.6 6.6 24.7 –13.4 8.4 2.2 18.5 3.7 4.2Chain-type quantity index ..................................................................................................... 66 –1.0 1.9 5.3 6.1 5.5 36.9 –12.2 5.3 4.7 17.1 2.7 4.1Chain-type price index .......................................................................................................... 67 3.1 0 1.6 2.4 1.1 –7.2 –1.8 2.9 –2.2 1.2 1.0 .1Implicit price deflator ............................................................................................................. 68 3.1 0 1.6 2.4 1.1 –8.9 –1.4 2.9 –2.4 1.2 .9 .1
Government consumption expenditures and gross investment:Current dollars ........................................................................................................................... 69 3.1 1.6 2.3 3.2 3.8 3.0 –2.6 3.1 1.3 3.2 –1.4 3.1Chain-type quantity index .......................................................................................................... 70 .5 –.9 0 0 .5 1.9 –6.9 1.0 –.8 1.3 –4.0 .4Chain-type price index ............................................................................................................... 71 2.6 2.5 2.3 3.3 3.3 1.1 4.5 2.1 2.1 1.9 2.7 2.6Implicit price deflator ................................................................................................................. 72 2.6 2.5 2.3 3.3 3.3 1.0 4.5 2.1 2.1 1.8 2.7 2.6
Federal:Current dollars ....................................................................................................................... 73 1.0 –1.8 –1.6 –.1 2.1 2.3 –9.8 –2.7 –1.6 2.2 –8.7 –1.3Chain-type quantity index ..................................................................................................... 74 –2.1 –4.2 –3.8 –3.3 –1.3 3.4 –15.4 –3.3 –4.9 –.1 –10.7 –4.9Chain-type price index .......................................................................................................... 75 3.2 2.5 2.3 3.3 3.4 –1.1 6.6 .6 3.5 2.6 2.2 3.6Implicit price deflator ............................................................................................................. 76 3.2 2.5 2.3 3.3 3.4 –1.1 6.6 .6 3.5 2.3 2.3 3.8
National defense:Current dollars ................................................................................................................... 77 –2.0 –4.0 –3.2 –1.3 2.4 –5.7 –11.9 –2.0 –4.1 1.5 –15.2 4.2Chain-type quantity index ................................................................................................. 78 –5.5 –5.7 –4.9 –4.3 –1.5 –2.0 –17.5 –2.7 –6.2 –.3 –16.7 1.0Chain-type price index ...................................................................................................... 79 3.7 1.8 1.8 3.1 3.9 –4.0 6.8 .6 2.3 2.1 1.6 2.9Implicit price deflator ......................................................................................................... 80 3.7 1.8 1.8 3.1 3.9 –3.8 6.8 .7 2.2 1.8 1.8 3.2
Nondefense:Current dollars ................................................................................................................... 81 9.5 3.6 2.1 2.4 1.4 24.8 –4.7 –4.2 4.4 3.6 7.4 –12.2Chain-type quantity index ................................................................................................. 82 7.2 –.7 –1.1 –1.4 –.9 17.6 –10.3 –4.6 –2.1 .2 3.9 –16.6Chain-type price index ...................................................................................................... 83 2.1 4.3 3.3 3.9 2.3 6.2 6.2 .5 6.4 3.7 3.4 5.2Implicit price deflator ......................................................................................................... 84 2.1 4.3 3.3 3.9 2.3 6.1 6.2 .4 6.6 3.4 3.3 5.2
State and local:Current dollars ....................................................................................................................... 85 4.6 4.0 4.9 5.4 4.8 3.5 2.8 7.2 3.3 3.9 3.7 6.0Chain-type quantity index ..................................................................................................... 86 2.4 1.5 2.6 2.1 1.6 .9 –.3 4.0 2.1 2.3 .7 4.0Chain-type price index .......................................................................................................... 87 2.2 2.5 2.3 3.2 3.2 2.6 3.1 3.1 1.2 1.5 3.0 1.9Implicit price deflator ............................................................................................................. 88 2.2 2.5 2.3 3.2 3.2 2.6 3.1 3.1 1.2 1.5 3.0 1.9
Addenda:Final sales of domestic product:
Current dollars ........................................................................................................................... 89 5.4 4.8 5.3 5.1 5.2 7.7 2.4 5.1 4.1 7.6 3.7 5.6Chain-type quantity index .......................................................................................................... 90 2.5 2.1 2.9 2.5 2.8 4.6 –1.5 3.1 2.2 4.8 1.2 3.4Chain-type price index ............................................................................................................... 91 2.8 2.7 2.4 2.5 2.3 2.8 3.9 2.1 1.8 2.7 2.5 2.3Implicit price deflator ................................................................................................................. 92 2.8 2.6 2.4 2.5 2.3 2.9 3.9 2.0 1.9 2.7 2.5 2.2
Gross domestic purchases:Current dollars ........................................................................................................................... 93 5.7 5.5 6.3 4.5 5.2 7.6 4.1 4.7 5.0 7.7 6.0 7.7Chain-type quantity index .......................................................................................................... 94 2.8 2.9 3.9 1.9 2.9 4.9 1.0 2.5 3.4 5.1 4.0 5.0Chain-type price index ............................................................................................................... 95 2.8 2.5 2.3 2.5 2.2 2.6 3.2 2.3 1.4 2.5 2.0 2.6Implicit price deflator ................................................................................................................. 96 2.8 2.5 2.3 2.6 2.2 2.6 3.1 2.2 1.5 2.5 2.0 2.5
Final sales to domestic purchasers:Current dollars ........................................................................................................................... 97 5.5 5.3 5.7 4.9 5.2 8.0 2.6 5.8 5.0 7.1 4.3 6.3Chain-type quantity index .......................................................................................................... 98 2.7 2.7 3.3 2.3 3.0 5.2 –.6 3.5 3.4 4.5 2.2 3.7Chain-type price index ............................................................................................................... 99 2.8 2.5 2.3 2.6 2.2 2.6 3.2 2.3 1.4 2.5 2.0 2.6Implicit price deflator ................................................................................................................. 100 2.8 2.5 2.3 2.6 2.2 2.6 3.2 2.2 1.5 2.5 2.0 2.5
Gross national product:Current dollars ........................................................................................................................... 101 5.4 5.1 5.8 4.5 5.0 7.2 4.9 3.6 4.5 7.5 5.7 6.6Chain-type quantity index .......................................................................................................... 102 2.6 2.4 3.3 2.0 2.7 4.2 1.1 1.6 2.5 4.7 3.2 4.3Chain-type price index ............................................................................................................... 103 2.7 2.6 2.4 2.5 2.3 2.8 3.9 2.1 1.8 2.7 2.5 2.2Implicit price deflator ................................................................................................................. 104 2.7 2.6 2.4 2.5 2.3 2.9 3.8 2.0 1.9 2.6 2.5 2.2
Command-basis gross national product:Chain-type quantity index .......................................................................................................... 105 2.6 2.6 3.4 2.0 2.8 4.4 1.7 1.4 2.8 4.9 3.6 3.9
Disposable personal income:Current dollars ........................................................................................................................... 106 6.2 4.4 4.6 6.0 4.7 11.5 –3.9 9.8 2.5 8.0 –3.1 9.5Chained (1992) dollars .............................................................................................................. 107 2.8 1.7 2.2 3.3 2.3 7.9 –6.7 7.3 1.1 4.8 –4.7 6.7
See note at end of table.

August •
Table 8.1.—Percent Change From Preceding Period in Selected Series—Continued[Percent]
Line
Seasonally adjusted at annual rates
1994 1995 1996 1997
III IV I II III IV I II III IV I II
Gross domestic product:Current dollars .............................................................................................................. 1 4.4 6.4 4.2 2.3 5.2 4.5 4.7 7.7 3.6 6.2 7.4 3.6Chain-type quantity index ............................................................................................. 2 1.8 3.6 .9 .3 3.0 2.2 1.8 6.0 1.0 4.3 4.9 2.2Chain-type price index ................................................................................................. 3 2.5 2.6 3.3 2.1 2.0 2.1 2.8 1.9 2.7 1.9 2.4 1.4Implicit price deflator .................................................................................................... 4 2.6 2.7 3.3 2.0 2.1 2.2 2.9 1.7 2.6 1.9 2.4 1.4
Personal consumption expenditures:Current dollars ........................................................................................................................... 5 6.1 6.0 4.3 5.3 4.6 3.5 5.9 6.7 3.0 6.3 7.6 1.8Chain-type quantity index .......................................................................................................... 6 2.3 3.2 1.5 2.9 2.6 1.8 3.1 3.7 .5 3.3 5.3 .8Chain-type price index ............................................................................................................... 7 3.6 2.7 2.8 2.4 1.9 1.6 2.6 2.9 2.5 3.0 2.2 1.0Implicit price deflator ................................................................................................................. 8 3.7 2.7 2.8 2.4 2.0 1.7 2.6 2.9 2.5 2.9 2.2 1.0
Durable goods:Current dollars ....................................................................................................................... 9 7.8 11.4 –1.6 4.0 9.1 1.6 5.5 7.8 –2.6 2.4 13.3 –8.5Chain-type quantity index ..................................................................................................... 10 4.3 11.0 –3.0 3.9 9.3 2.0 4.8 9.7 –1.9 3.5 14.1 –5.7Chain-type price index .......................................................................................................... 11 3.3 .4 1.6 .3 –.7 –.7 .7 –1.4 –.6 –1.0 –.7 –2.9Implicit price deflator ............................................................................................................. 12 3.3 .4 1.5 .1 –.2 –.4 .7 –1.8 –.7 –1.1 –.7 –2.9
Nondurable goods:Current dollars ....................................................................................................................... 13 6.8 4.0 2.5 2.7 2.2 2.0 5.6 6.6 1.6 5.8 7.2 –2.1Chain-type quantity index ..................................................................................................... 14 2.2 2.7 1.7 .9 .7 .7 1.7 2.6 .6 2.1 4.7 –2.1Chain-type price index .......................................................................................................... 15 4.3 1.3 .8 1.8 1.4 1.4 3.7 3.9 .9 3.7 2.4 0Implicit price deflator ............................................................................................................. 16 4.5 1.3 .8 1.8 1.5 1.3 3.8 3.9 .9 3.7 2.4 0
Services:Current dollars ....................................................................................................................... 17 5.4 5.9 6.7 6.9 4.9 4.7 6.1 6.5 4.9 7.4 6.6 6.1Chain-type quantity index ..................................................................................................... 18 2.0 1.9 2.4 3.7 2.2 2.3 3.5 3.1 1.0 3.9 3.9 3.7Chain-type price index .......................................................................................................... 19 3.3 3.9 4.1 3.2 2.7 2.3 2.5 3.4 3.9 3.4 2.6 2.3Implicit price deflator ............................................................................................................. 20 3.4 3.9 4.1 3.1 2.7 2.3 2.5 3.4 3.9 3.4 2.6 2.3
Gross private domestic investment:Current dollars ........................................................................................................................... 21 –4.2 15.1 3.0 –9.8 1.9 8.1 4.4 18.0 16.8 .7 15.6 11.7Chain-type quantity index .......................................................................................................... 22 –6.1 13.3 1.1 –10.8 1.9 7.9 4.6 19.9 16.5 1.6 17.1 13.3Chain-type price index ............................................................................................................... 23 2.1 1.3 1.8 1.6 –.2 –.3 –.7 –1.0 1.2 –.5 –1.0 –1.5Implicit price deflator ................................................................................................................. 24 2.1 1.6 1.8 1.1 0 .2 –.2 –1.5 .3 –.9 –1.3 –1.4
Fixed investment:Current dollars ....................................................................................................................... 25 6.6 8.6 9.2 .4 4.0 6.2 10.1 13.0 11.6 2.6 3.0 11.2Chain-type quantity index ..................................................................................................... 26 4.2 7.0 7.6 –.7 3.5 5.9 10.7 14.4 10.1 3.0 3.9 12.4Chain-type price index .......................................................................................................... 27 2.1 1.3 1.7 1.6 –.1 –.2 –.5 –.7 1.4 –.4 –.9 –1.0Implicit price deflator ............................................................................................................. 28 2.3 1.5 1.5 1.1 .4 .2 –.6 –1.2 1.3 –.4 –.9 –1.0
Nonresidential:Current dollars ................................................................................................................... 29 9.2 12.6 14.3 6.7 1.6 4.3 9.9 10.3 16.1 4.4 2.1 13.0Chain-type quantity index ................................................................................................. 30 7.7 12.6 14.2 5.7 1.6 4.9 11.7 13.0 16.5 5.9 4.1 15.1Chain-type price index ...................................................................................................... 31 1.2 –.3 .3 1.6 –.8 –1.1 –1.5 –1.7 –.3 –1.5 –2.0 –1.8Implicit price deflator ......................................................................................................... 32 1.4 0 0 1.0 0 –.6 –1.6 –2.4 –.3 –1.5 –2.0 –1.8
Structures:Current dollars .............................................................................................................. 33 3.5 8.7 15.4 7.2 3.4 –4.0 10.2 9.9 14.2 18.2 .7 5.4Chain-type quantity index ............................................................................................. 34 –1.1 2.3 9.5 4.3 .7 –5.8 8.2 7.9 10.0 15.3 –2.1 2.3Chain-type price index ................................................................................................. 35 4.6 6.2 5.3 2.9 2.6 1.8 1.9 1.9 3.9 2.5 2.8 3.0Implicit price deflator .................................................................................................... 36 4.6 6.3 5.4 2.8 2.6 1.8 1.9 1.9 3.8 2.5 2.8 3.0
Producers’ durable equipment:Current dollars .............................................................................................................. 37 11.5 14.1 13.9 6.5 .9 7.7 9.8 10.4 16.9 –.5 2.6 16.0Chain-type quantity index ............................................................................................. 38 11.4 16.9 16.1 6.2 2.0 9.4 13.1 14.9 19.1 2.6 6.7 20.4Chain-type price index ................................................................................................. 39 0 –2.7 –1.5 1.0 –2.1 –2.2 –2.7 –3.1 –1.9 –3.0 –3.8 –3.6Implicit price deflator .................................................................................................... 40 .1 –2.4 –1.9 .3 –1.0 –1.5 –2.9 –3.9 –1.9 –3.0 –3.8 –3.7
Residential:Current dollars ................................................................................................................... 41 1.1 –.1 –2.3 –14.1 10.4 10.9 10.4 20.0 1.0 –1.8 5.4 6.8Chain-type quantity index ................................................................................................. 42 –3.1 –5.0 –7.0 –15.5 8.4 8.5 8.3 17.9 –4.5 –4.3 3.3 5.6Chain-type price index ...................................................................................................... 43 4.2 5.2 5.0 1.7 1.8 2.2 2.0 1.8 5.7 2.6 2.0 1.1Implicit price deflator ......................................................................................................... 44 4.2 5.2 5.0 1.7 1.8 2.2 2.0 1.8 5.7 2.6 2.0 1.1
Exports of goods and services:Current dollars ........................................................................................................................... 45 13.3 18.1 11.4 12.4 12.4 9.1 .1 7.1 –.6 20.4 8.0 11.9Chain-type quantity index .......................................................................................................... 46 10.6 14.7 7.2 9.3 13.5 11.5 1.7 9.6 1.9 25.5 9.9 14.4Chain-type price index ............................................................................................................... 47 1.6 2.9 4.4 3.4 –2.0 –2.6 –1.5 –1.4 –2.6 –4.3 –1.8 –2.2Implicit price deflator ................................................................................................................. 48 2.4 2.9 3.9 2.8 –1.0 –2.2 –1.6 –2.3 –2.4 –4.1 –1.8 –2.2
Exports of goods:Current dollars ....................................................................................................................... 49 16.8 21.4 12.3 13.4 9.0 9.8 .6 5.2 –2.7 21.8 10.2 14.7Chain-type quantity index ..................................................................................................... 50 14.4 18.1 7.7 11.6 10.8 13.6 4.1 9.6 2.5 30.7 12.6 19.9Chain-type price index .......................................................................................................... 51 1.0 2.7 4.9 2.5 –3.0 –3.8 –3.3 –2.7 –5.3 –7.3 –2.1 –4.3Implicit price deflator ............................................................................................................. 52 2.1 2.8 4.3 1.7 –1.6 –3.3 –3.3 –4.0 –5.1 –6.9 –2.1 –4.3
Exports of services:Current dollars ....................................................................................................................... 53 5.4 10.4 9.2 9.7 21.3 7.3 –1.1 12.0 4.6 17.1 2.7 5.1Chain-type quantity index ..................................................................................................... 54 2.0 6.9 6.0 3.8 20.3 6.6 –3.8 9.7 .3 13.5 3.7 1.7Chain-type price index .......................................................................................................... 55 3.4 3.1 3.0 5.8 .8 .5 3.2 1.7 4.3 3.1 –.9 3.4Implicit price deflator ............................................................................................................. 56 3.3 3.3 3.0 5.7 .8 .6 2.9 2.1 4.3 3.1 –.9 3.4
See note at end of table.

• August
Table 8.1.—Percent Change From Preceding Period in Selected Series—Continued[Percent]
Line
Seasonally adjusted at annual rates
1994 1995 1996 1997
III IV I II III IV I II III IV I II
Imports of goods and services:Current dollars ........................................................................................................................... 57 20.5 11.6 11.4 14.4 –.5 –.9 10.6 11.4 8.1 6.5 11.7 12.6Chain-type quantity index .......................................................................................................... 58 13.1 9.9 10.0 7.7 2.3 2.4 13.1 14.1 13.2 6.8 17.9 21.8Chain-type price index ............................................................................................................... 59 6.1 1.5 1.6 6.9 –4.0 –3.9 –1.9 –1.8 –4.2 0 –5.3 –7.6Implicit price deflator ................................................................................................................. 60 6.6 1.5 1.3 6.2 –2.7 –3.2 –2.2 –2.3 –4.5 –.3 –5.3 –7.6
Imports of goods:Current dollars ....................................................................................................................... 61 23.1 13.6 10.1 15.9 –2.1 –1.0 9.5 13.2 8.9 7.2 10.5 13.6Chain-type quantity index ..................................................................................................... 62 16.0 12.2 7.5 10.2 1.1 2.5 12.8 16.4 15.7 7.7 16.7 24.8Chain-type price index .......................................................................................................... 63 5.6 1.3 2.9 5.9 –4.8 –4.2 –2.5 –2.1 –5.6 –.2 –5.3 –9.0Implicit price deflator ............................................................................................................. 64 6.1 1.2 2.4 5.2 –3.2 –3.4 –3.0 –2.8 –5.9 –.4 –5.3 –9.0
Imports of services:Current dollars ....................................................................................................................... 65 8.4 1.9 18.7 7.4 8.6 –.4 16.5 2.7 4.3 2.8 17.9 7.6Chain-type quantity index ..................................................................................................... 66 –.4 –.9 24.4 –4.0 8.4 2.2 14.6 2.7 1.2 2.1 24.2 7.2Chain-type price index .......................................................................................................... 67 8.2 2.8 –4.7 12.1 .4 –2.7 1.6 .1 3.1 .7 –5.1 .4Implicit price deflator ............................................................................................................. 68 8.8 2.8 –4.6 11.8 .1 –2.5 1.7 0 3.1 .7 –5.1 .4
Government consumption expenditures and gross investment:Current dollars ........................................................................................................................... 69 10.0 –1.3 5.1 3.4 1.8 –.9 7.6 6.8 1.8 2.5 3.1 5.1Chain-type quantity index .......................................................................................................... 70 8.2 –3.8 .6 –.1 –.7 –5.4 1.8 7.2 –1.1 .1 –.4 3.8Chain-type price index ............................................................................................................... 71 1.8 2.6 4.5 3.5 2.6 4.7 5.5 –.2 3.1 2.5 3.5 1.3Implicit price deflator ................................................................................................................. 72 1.7 2.7 4.5 3.6 2.6 4.8 5.7 –.4 3.0 2.4 3.5 1.3
Federal:Current dollars ....................................................................................................................... 73 12.5 –8.9 4.2 –1.9 1.3 –9.2 13.2 6.6 –2.3 –3.0 –1.1 9.5Chain-type quantity index ..................................................................................................... 74 13.3 –11.3 –1.1 –4.5 –1.3 –16.4 7.5 8.8 –4.2 –5.2 –5.8 8.4Chain-type price index .......................................................................................................... 75 –.5 2.7 5.2 2.6 2.8 8.5 4.7 –1.4 2.1 2.5 4.9 1.0Implicit price deflator ............................................................................................................. 76 –.7 2.7 5.3 2.7 2.6 8.6 5.3 –2.1 1.9 2.3 4.9 1.0
National defense:Current dollars ................................................................................................................... 77 13.6 –16.7 3.2 2.1 –.9 –11.9 14.8 10.7 –2.8 –4.7 –8.0 11.3Chain-type quantity index ................................................................................................. 78 13.8 –18.6 –1.1 –1.6 –4.0 –15.9 6.1 11.0 –4.6 –7.1 –11.8 10.3Chain-type price index ...................................................................................................... 79 .1 2.5 4.1 3.6 3.4 4.7 7.4 .7 2.1 2.8 4.3 .9Implicit price deflator ......................................................................................................... 80 –.2 2.3 4.3 3.8 3.2 4.8 8.3 –.3 1.9 2.6 4.3 .9
Nondefense:Current dollars ................................................................................................................... 81 10.2 10.4 6.4 –9.7 6.3 –3.5 9.9 –1.6 –1.3 .5 14.6 6.0Chain-type quantity index ................................................................................................. 82 12.2 6.5 –.9 –10.3 4.8 –17.5 10.5 4.3 –3.2 –1.0 8.0 4.6Chain-type price index ...................................................................................................... 83 –1.9 3.2 7.7 .6 1.5 16.8 –.5 –5.6 2.2 1.7 6.1 1.4Implicit price deflator ......................................................................................................... 84 –1.8 3.7 7.4 .6 1.4 17.0 –.5 –5.7 2.0 1.5 6.1 1.4
State and local:Current dollars ....................................................................................................................... 85 8.5 3.9 5.7 6.8 2.2 4.4 4.4 6.9 4.4 5.9 5.5 2.7Chain-type quantity index ..................................................................................................... 86 5.1 1.2 1.7 2.6 –.4 1.9 –1.4 6.3 .7 3.3 2.7 1.3Chain-type price index .......................................................................................................... 87 3.2 2.6 4.0 4.1 2.5 2.5 5.9 .6 3.6 2.5 2.7 1.4Implicit price deflator ............................................................................................................. 88 3.2 2.6 4.0 4.0 2.6 2.5 5.9 .5 3.6 2.5 2.7 1.4
Addenda:Final sales of domestic product:
Current dollars ........................................................................................................................... 89 6.1 5.5 5.1 3.9 5.5 4.2 5.5 7.0 2.9 6.6 5.6 3.5Chain-type quantity index .......................................................................................................... 90 3.3 2.7 1.8 1.9 3.3 2.0 2.6 5.2 .2 4.5 3.0 1.9Chain-type price index ............................................................................................................... 91 2.5 2.6 3.3 2.1 2.1 2.2 2.8 1.9 2.7 1.9 2.5 1.5Implicit price deflator ................................................................................................................. 92 2.6 2.7 3.2 2.0 2.2 2.2 2.9 1.7 2.7 2.0 2.5 1.5
Gross domestic purchases:Current dollars ........................................................................................................................... 93 5.3 5.8 4.3 2.6 3.7 3.3 6.0 8.2 4.7 4.8 7.9 3.8Chain-type quantity index .......................................................................................................... 94 2.1 3.2 1.3 .2 1.9 1.3 3.1 6.5 2.4 2.5 5.9 3.1Chain-type price index ............................................................................................................... 95 3.0 2.5 3.0 2.5 1.7 1.9 2.7 1.8 2.4 2.4 1.9 .6Implicit price deflator ................................................................................................................. 96 3.1 2.5 3.0 2.4 1.8 2.0 2.8 1.6 2.2 2.3 1.9 .7
Final sales to domestic purchasers:Current dollars ........................................................................................................................... 97 6.9 4.9 5.1 4.2 4.0 3.0 6.7 7.6 4.0 5.1 6.1 3.7Chain-type quantity index .......................................................................................................... 98 3.7 2.4 2.2 1.8 2.1 1.0 3.9 5.8 1.5 2.7 4.0 2.9Chain-type price index ............................................................................................................... 99 3.0 2.5 3.0 2.5 1.7 1.9 2.7 1.8 2.4 2.4 2.0 .7Implicit price deflator ................................................................................................................. 100 3.1 2.5 2.9 2.4 1.9 2.0 2.7 1.7 2.4 2.4 2.0 .7
Gross national product:Current dollars ........................................................................................................................... 101 4.2 6.1 4.5 2.6 4.4 5.0 4.8 7.4 3.1 6.8 6.5 ...............Chain-type quantity index .......................................................................................................... 102 1.6 3.4 1.2 .6 2.2 2.7 1.8 5.7 .6 4.9 4.0 ...............Chain-type price index ............................................................................................................... 103 2.5 2.6 3.3 2.1 2.0 2.2 2.8 1.9 2.6 1.9 2.4 ...............Implicit price deflator ................................................................................................................. 104 2.6 2.6 3.2 2.0 2.1 2.2 2.9 1.6 2.5 1.8 2.4 ...............
Command-basis gross national product:Chain-type quantity index .......................................................................................................... 105 1.2 3.5 1.5 .2 2.5 2.9 1.9 5.7 .8 4.4 4.5 ...............
Disposable personal income:Current dollars ........................................................................................................................... 106 6.7 7.7 7.4 2.5 4.6 4.2 6.3 4.0 5.2 3.7 6.8 4.0Chained (1992) dollars .............................................................................................................. 107 2.9 4.9 4.5 .2 2.6 2.5 3.5 1.1 2.7 .7 4.6 3.0
NOTE.—Except for disposable personal income, the quantity and price indexes are calculated from weighted aver-ages of the detailed output and prices used to prepare each aggregate and component. Prior to the third quarterof 1996, these indexes use the geometric mean of weights that reflect the composition of output for the precedingand current years. Beginning with the third quarter of 1996, these indexes use weights that reflect the composition
of output in the two adjacent quarters. Implicit price deflators are weighted averages of the detailed price indexesused to prepare each aggregate and component and are calculated as the ratio of current- to chained-dollar outputmultiplied by 100. (Contributions to the percent change in real gross domestic product are shown in table 8.2.)

August •
Table 8.2.—Contributions to Percent Change in Real Gross Domestic Product[Percent]
Line 1992 1993 1994 1995 1996
Seasonally adjusted at annual rates
1992 1993 1994
IV I II III IV I II
Percent change at annual rate:
Gross domestic product .................................................................................................... 1 2.7 2.3 3.5 2.0 2.8 4.3 0.1 2.0 2.1 5.3 3.0 4.7
Percentage points at annual rates:
Personal consumption expenditures .................................................................................... 2 1.9 2.0 2.2 1.7 1.8 3.6 .5 2.3 2.8 2.0 2.6 2.0
Durable goods ....................................................................................................................... 3 .4 .6 .6 .3 .4 .8 –.1 1.0 .7 .8 .5 .3Nondurable goods ................................................................................................................. 4 .3 .5 .6 .3 .3 1.2 –.2 .7 .6 .3 1.0 .4Services ................................................................................................................................. 5 1.1 1.0 1.1 1.0 1.1 1.6 .8 .7 1.6 .9 1.0 1.3
Gross private domestic investment ...................................................................................... 6 .8 1.2 1.7 .2 1.1 .9 3.4 0 .8 2.8 2.2 2.9
Fixed investment ................................................................................................................... 7 .7 .9 1.1 .7 1.1 1.2 .9 1.0 .8 2.3 .4 1.5Nonresidential .................................................................................................................... 8 .1 .7 .7 .8 .9 .5 .9 1.1 .4 1.4 0 .9
Structures ...................................................................................................................... 9 –.2 0 0 .1 .1 –.1 .3 .1 .1 .1 –.4 .5Producers’ durable equipment ..................................................................................... 10 .3 .6 .7 .7 .8 .7 .6 1.0 .4 1.3 .5 .4
Residential ......................................................................................................................... 11 .5 .3 .4 –.2 .2 .6 0 –.1 .4 .8 .4 .6Change in business inventories ............................................................................................ 12 .2 .2 .6 –.5 0 –.3 2.5 –1.0 –.1 .6 1.8 1.4
Net exports of goods and services ...................................................................................... 13 –.1 –.6 –.5 .1 –.2 –.6 –1.5 –.5 –1.3 .2 –1.0 –.3
Exports ................................................................................................................................... 14 .6 .3 .8 1.1 .9 .6 –.2 .8 –.9 2.0 –.2 1.7Goods ................................................................................................................................ 15 .5 .2 .7 .9 .7 .8 –.7 .7 –.8 1.9 –.3 1.3Services ............................................................................................................................. 16 .2 .1 .1 .2 .2 –.2 .5 .1 0 .1 .1 .4
Imports ................................................................................................................................... 17 –.7 –.9 –1.3 –1.0 –1.1 –1.2 –1.3 –1.3 –.4 –1.8 –.8 –2.0Goods ................................................................................................................................ 18 –.8 –.9 –1.2 –.9 –1.0 –.6 –1.7 –1.2 –.3 –1.5 –.8 –1.9Services ............................................................................................................................. 19 0 0 –.1 –.1 –.1 –.6 .4 –.1 –.1 –.3 –.1 –.1
Government consumption expenditures and gross investment ....................................... 20 .1 –.2 0 0 .1 .4 –2.3 .2 –.2 .3 –.8 .1
Federal ................................................................................................................................... 21 –.2 –.4 –.3 –.2 –.1 .3 –2.2 –.3 –.4 0 –.9 –.4National defense ............................................................................................................... 22 –.4 –.3 –.3 –.2 –.1 –.1 –1.8 –.2 –.4 0 –1.0 0Nondefense ....................................................................................................................... 23 .2 0 0 0 0 .4 –.4 –.1 –.1 0 .1 –.4
State and local ...................................................................................................................... 24 .3 .2 .3 .2 .2 .1 –.1 .5 .2 .3 .1 .5
Line
Seasonally adjusted at annual rates
1994 1995 1996 1997
III IV I II III IV I II III IV I II
Percent change at annual rate:
Gross domestic product .................................................................................................... 1 1.8 3.6 0.9 0.3 3.0 2.2 1.8 6.0 1.0 4.3 4.9 2.2
Percentage points at annual rates:
Personal consumption expenditures .................................................................................... 2 1.6 2.2 1.0 1.9 1.8 1.2 2.1 2.5 .4 2.2 3.6 .6
Durable goods ....................................................................................................................... 3 .3 .9 –.3 .3 .7 .2 .4 .8 –.2 .3 1.1 –.5Nondurable goods ................................................................................................................. 4 .5 .5 .3 .2 .1 .1 .4 .5 .1 .4 .9 –.4Services ................................................................................................................................. 5 .8 .7 .9 1.4 .9 .9 1.4 1.2 .4 1.5 1.5 1.5
Gross private domestic investment ...................................................................................... 6 –.9 1.8 .2 –1.7 .3 1.1 .6 2.6 2.3 .2 2.4 1.9
Fixed investment ................................................................................................................... 7 .6 .9 1.0 –.1 .5 .8 1.4 1.9 1.4 .4 .6 1.7Nonresidential .................................................................................................................... 8 .7 1.1 1.3 .6 .2 .5 1.1 1.3 1.6 .6 .4 1.5
Structures ...................................................................................................................... 9 0 .1 .2 .1 0 –.2 .2 .2 .3 .4 –.1 .1Producers’ durable equipment ..................................................................................... 10 .7 1.1 1.0 .4 .1 .6 .9 1.0 1.3 .2 .5 1.4
Residential ......................................................................................................................... 11 –.1 –.2 –.3 –.7 .3 .3 .3 .7 –.2 –.2 .1 .2Change in business inventories ............................................................................................ 12 –1.5 .9 –.8 –1.6 –.2 .3 –.8 .7 .8 –.2 1.8 .2
Net exports of goods and services ...................................................................................... 13 –.4 .3 –.4 .1 1.1 1.0 –1.3 –.6 –1.4 1.8 –1.0 –1.0
Exports ................................................................................................................................... 14 1.0 1.4 .7 1.0 1.4 1.2 .2 1.1 .2 2.7 1.1 1.6Goods ................................................................................................................................ 15 1.0 1.2 .5 .9 .8 1.0 .3 .8 .2 2.2 1.0 1.5Services ............................................................................................................................. 16 .1 .2 .2 .1 .6 .2 –.1 .3 0 .4 .1 .1
Imports ................................................................................................................................... 17 –1.4 –1.1 –1.1 –.9 –.2 –.3 –1.5 –1.7 –1.6 –.8 –2.1 –2.6Goods ................................................................................................................................ 18 –1.4 –1.1 –.6 –1.0 –.1 –.2 –1.2 –1.6 –1.6 –.8 –1.7 –2.5Services ............................................................................................................................. 19 0 0 –.4 .1 –.2 0 –.3 –.1 0 0 –.5 –.1
Government consumption expenditures and gross investment ....................................... 20 1.5 –.7 .1 0 –.1 –1.0 .3 1.3 –.2 0 –.1 .7
Federal ................................................................................................................................... 21 .9 –.9 –.1 –.3 –.1 –1.2 .5 .6 –.3 –.4 –.4 .5National defense ............................................................................................................... 22 .7 –1.0 –.1 –.1 –.2 –.8 .3 .5 –.2 –.3 –.6 .4Nondefense ....................................................................................................................... 23 .3 .1 0 –.3 .1 –.4 .2 .1 –.1 0 .2 .1
State and local ...................................................................................................................... 24 .6 .1 .2 .3 0 .2 –.2 .7 .1 .4 .3 .2

• August
Table 8.3.—Selected Per Capita Product and Income Series in Current and Chained Dollars[Dollars]
Line 1992 1993 1994 1995 1996
Seasonally adjusted at annual rates
1992 1993 1994
IV I II III IV I II
Current dollars:
Gross domestic product ............................................................................................................. 1 24,447 25,403 26,647 27,605 28,752 24,881 25,061 25,250 25,432 25,866 26,158 26,546Gross national product .............................................................................................................. 2 24,490 25,476 26,678 27,625 28,759 24,910 25,153 25,313 25,518 25,915 26,223 26,581Personal income ........................................................................................................................ 3 20,660 21,379 22,216 23,370 24,457 21,163 20,880 21,351 21,446 21,834 21,623 22,149Disposable personal income ..................................................................................................... 4 18,113 18,706 19,381 20,349 21,117 18,533 18,304 18,692 18,756 19,070 18,878 19,267Personal consumption expenditures ......................................................................................... 5 16,520 17,273 18,093 18,837 19,608 16,877 16,976 17,177 17,363 17,574 17,774 17,978
Durable goods ....................................................................................................................... 6 1,913 2,054 2,223 2,312 2,389 1,973 1,969 2,033 2,078 2,134 2,168 2,199Nondurable goods ................................................................................................................. 7 5,175 5,309 5,479 5,607 5,779 5,260 5,267 5,300 5,315 5,355 5,407 5,439Services ................................................................................................................................. 8 9,433 9,910 10,391 10,917 11,441 9,643 9,740 9,844 9,970 10,084 10,199 10,341
Chained (1992) dollars:
Gross domestic product ............................................................................................................. 9 24,447 24,750 25,357 25,616 26,088 24,663 24,608 24,671 24,732 24,989 25,120 25,352Gross national product .............................................................................................................. 10 24,490 24,822 25,389 25,642 26,101 24,692 24,699 24,734 24,816 25,038 25,181 25,386Disposable personal income ..................................................................................................... 11 18,113 18,221 18,431 18,861 19,116 18,330 17,975 18,247 18,246 18,413 18,154 18,409Personal consumption expenditures ......................................................................................... 12 16,520 16,825 17,207 17,460 17,750 16,692 16,671 16,769 16,891 16,968 17,092 17,178
Durable goods ....................................................................................................................... 13 1,913 2,029 2,153 2,217 2,301 1,968 1,960 2,014 2,050 2,092 2,120 2,135Nondurable goods ................................................................................................................. 14 5,175 5,233 5,331 5,367 5,393 5,223 5,201 5,228 5,248 5,254 5,307 5,322Services ................................................................................................................................. 15 9,433 9,563 9,725 9,877 10,057 9,502 9,509 9,527 9,593 9,624 9,667 9,723
Population (mid-period, thousands) ............................................................................................... 16 255,432 258,161 260,705 263,194 265,579 256,543 257,151 257,785 258,516 259,191 259,738 260,351
Line
Seasonally adjusted at annual rates
1994 1995 1996 1997
III IV I II III IV I II III IV I II
Current dollars:
Gross domestic product ............................................................................................................. 1 26,764 27,115 27,338 27,428 27,706 27,944 28,213 28,680 28,869 29,243 29,715 29,919Gross national product .............................................................................................................. 2 26,786 27,119 27,361 27,471 27,695 27,969 28,243 28,691 28,843 29,254 29,662 ...............Personal income ........................................................................................................................ 3 22,365 22,722 23,083 23,264 23,448 23,683 24,027 24,359 24,604 24,835 25,268 25,529Disposable personal income ..................................................................................................... 4 19,530 19,844 20,160 20,239 20,416 20,579 20,853 21,012 21,229 21,373 21,689 21,858Personal consumption expenditures ......................................................................................... 5 18,199 18,419 18,578 18,774 18,938 19,055 19,291 19,562 19,660 19,919 20,247 20,295
Durable goods ....................................................................................................................... 6 2,235 2,290 2,276 2,293 2,338 2,341 2,368 2,407 2,386 2,395 2,466 2,407Nondurable goods ................................................................................................................. 7 5,514 5,555 5,578 5,602 5,618 5,632 5,698 5,776 5,786 5,854 5,945 5,902Services ................................................................................................................................. 8 10,450 10,574 10,724 10,879 10,983 11,082 11,225 11,378 11,488 11,669 11,836 11,986
Chained (1992) dollars:
Gross domestic product ............................................................................................................. 9 25,396 25,559 25,564 25,524 25,649 25,728 25,791 26,111 26,116 26,333 26,599 26,686Gross national product .............................................................................................................. 10 25,420 25,569 25,593 25,570 25,645 25,757 25,822 26,126 26,102 26,354 26,562 ...............Disposable personal income ..................................................................................................... 11 18,493 18,667 18,834 18,798 18,871 18,942 19,071 19,081 19,161 19,152 19,331 19,435Personal consumption expenditures ......................................................................................... 12 17,232 17,326 17,356 17,438 17,505 17,540 17,642 17,765 17,745 17,848 18,046 18,045
Durable goods ....................................................................................................................... 13 2,152 2,203 2,182 2,198 2,242 2,247 2,269 2,318 2,301 2,316 2,389 2,349Nondurable goods ................................................................................................................. 14 5,337 5,359 5,371 5,370 5,365 5,361 5,374 5,397 5,393 5,408 5,460 5,420Services ................................................................................................................................. 15 9,745 9,767 9,805 9,871 9,899 9,932 9,999 10,052 10,052 10,125 10,202 10,274
Population (mid-period, thousands) ............................................................................................... 16 261,040 261,692 262,235 262,847 263,527 264,169 264,680 265,258 265,887 266,491 266,987 267,545

August •
Table 8.4.—Auto Output[Billions of dollars]
Line 1992 1993 1994 1995 1996
Seasonally adjusted at annual rates
1992 1993 1994
IV I II III IV I II
Auto output ...................................................................................................................... 1 121.5 130.8 142.8 140.4 134.6 127.5 128.5 131.1 124.5 139.3 148.4 140.5
Final sales ..................................................................................................................................... 2 122.1 129.0 140.9 137.2 140.0 128.0 118.2 130.9 129.6 137.2 147.5 139.6Personal consumption expenditures ......................................................................................... 3 117.6 126.6 135.3 139.5 141.3 122.1 118.5 125.5 128.4 133.9 135.9 133.2
New autos .............................................................................................................................. 4 82.1 86.4 91.2 87.1 86.1 84.1 80.0 85.5 87.6 92.5 90.4 92.0Net purchases of used autos ............................................................................................... 5 35.5 40.2 44.1 52.4 55.3 38.0 38.5 40.0 40.8 41.4 45.5 41.2
Producers’ durable equipment .................................................................................................. 6 35.3 38.2 48.0 42.3 45.3 36.3 34.8 39.9 37.5 40.7 46.1 47.9New autos .............................................................................................................................. 7 57.1 62.4 74.6 74.5 79.2 60.3 57.3 66.1 61.0 65.4 71.7 73.2Net purchases of used autos ............................................................................................... 8 –21.8 –24.2 –26.6 –32.2 –33.9 –24.0 –22.5 –26.2 –23.5 –24.7 –25.6 –25.3
Net exports ................................................................................................................................. 9 –32.8 –37.7 –44.7 –47.1 –48.9 –32.4 –37.2 –36.5 –38.3 –39.0 –36.5 –43.8Exports ................................................................................................................................... 10 14.3 14.5 16.4 16.7 17.0 15.8 14.0 14.9 13.5 15.6 16.4 16.6Imports ................................................................................................................................... 11 47.0 52.2 61.1 63.8 65.9 48.3 51.2 51.4 51.7 54.6 52.9 60.4
Gross government investment .................................................................................................. 12 2.0 1.9 2.1 2.4 2.3 2.0 2.0 2.0 2.0 1.7 2.0 2.2
Change in business inventories of new and used autos ...................................................... 13 –.5 1.8 1.9 3.2 –5.4 –.4 10.3 .2 –5.2 2.0 .8 1.0New ............................................................................................................................................ 14 0 2.0 1.6 3.1 –5.6 –.3 12.0 –1.6 –4.6 2.3 3.5 –.2Used ........................................................................................................................................... 15 –.5 –.2 .4 .2 .2 –.1 –1.7 1.8 –.6 –.3 –2.7 1.2
Addenda:Domestic output of new autos 1 ................................................................................................ 16 100.0 107.3 125.7 122.8 121.1 105.1 105.5 107.0 99.8 116.9 129.4 123.2Sales of imported new autos 2 .................................................................................................. 17 53.9 57.4 59.4 59.0 58.2 56.0 53.0 58.3 60.5 57.7 55.5 60.9
Line
Seasonally adjusted at annual rates
1994 1995 1996 1997
III IV I II III IV I II III IV I II
Auto output ...................................................................................................................... 1 141.0 141.4 146.8 136.5 135.0 143.3 120.7 144.6 144.5 128.7 136.4 130.2
Final sales ..................................................................................................................................... 2 141.1 135.2 129.9 132.9 144.2 141.7 138.9 143.0 140.2 138.0 137.9 130.7Personal consumption expenditures ......................................................................................... 3 135.3 136.9 135.6 138.9 143.6 140.1 140.3 145.0 141.5 138.4 145.2 137.3
New autos .............................................................................................................................. 4 91.7 90.7 84.8 86.2 87.7 89.8 87.1 87.0 84.8 85.3 87.9 80.6Net purchases of used autos ............................................................................................... 5 43.6 46.2 50.7 52.7 55.9 50.3 53.2 58.1 56.7 53.2 57.3 56.8
Producers’ durable equipment .................................................................................................. 6 49.5 48.7 42.6 41.3 43.4 42.1 42.2 45.3 48.0 45.9 48.8 47.6New autos .............................................................................................................................. 7 76.0 77.4 74.1 72.5 77.2 74.3 75.2 80.8 84.0 76.9 82.5 80.0Net purchases of used autos ............................................................................................... 8 –26.5 –28.8 –31.5 –31.3 –33.8 –32.2 –33.0 –35.5 –35.9 –31.1 –33.7 –32.4
Net exports ................................................................................................................................. 9 –46.0 –52.4 –50.3 –49.8 –45.1 –43.3 –46.3 –49.2 –51.3 –48.8 –58.4 –56.1Exports ................................................................................................................................... 10 17.1 15.8 17.6 16.4 16.3 16.7 17.6 16.4 17.1 16.8 16.6 17.7Imports ................................................................................................................................... 11 63.0 68.2 67.8 66.2 61.3 59.9 63.8 65.6 68.3 65.7 75.0 73.8
Gross government investment .................................................................................................. 12 2.3 2.0 2.1 2.5 2.3 2.8 2.7 1.9 2.0 2.6 2.3 1.9
Change in business inventories of new and used autos ...................................................... 13 –.2 6.2 16.9 3.6 –9.2 1.6 –18.1 1.6 4.3 –9.3 –1.5 –.5New ............................................................................................................................................ 14 –.5 3.5 15.7 4.0 –7.5 0 –19.5 2.5 3.7 –9.0 –.8 .9Used ........................................................................................................................................... 15 .3 2.7 1.1 –.4 –1.7 1.6 1.4 –.9 .6 –.4 –.6 –1.4
Addenda:Domestic output of new autos 1 ................................................................................................ 16 124.5 125.8 132.5 117.7 120.3 120.9 111.8 127.3 131.6 113.5 120.8 117.6Sales of imported new autos 2 .................................................................................................. 17 60.5 60.9 58.5 58.0 58.7 60.7 57.7 57.6 58.2 59.2 64.8 60.6
1. Consists of final sales and change in business inventories of new autos assembled in the United States.2. Consists of personal consumption expenditures, producers’ durable equipment, and gross government invest-
ment.

• August
Table 8.5.—Real Auto Output[Billions of chained (1992) dollars]
Line 1992 1993 1994 1995 1996
Seasonally adjusted at annual rates
1992 1993 1994
IV I II III IV I II
Auto output ...................................................................................................................... 1 121.5 125.3 132.3 127.6 119.9 126.4 124.7 125.7 119.5 131.4 140.5 130.1
Final sales ..................................................................................................................................... 2 122.1 125.2 131.8 125.2 124.4 126.8 116.2 127.8 125.0 131.6 140.5 131.3Personal consumption expenditures ......................................................................................... 3 117.6 121.1 123.7 122.0 121.2 120.2 116.1 121.1 121.9 125.4 127.1 123.0
New autos .............................................................................................................................. 4 82.1 84.4 86.2 80.6 78.2 83.5 79.2 83.9 85.3 89.3 86.7 87.3Net purchases of used autos ............................................................................................... 5 35.5 36.7 37.5 40.8 42.1 36.7 36.8 37.0 36.6 36.3 40.2 35.9
Producers’ durable equipment .................................................................................................. 6 35.3 38.8 47.8 43.4 45.1 36.6 35.2 40.5 38.2 41.3 46.0 47.4New autos .............................................................................................................................. 7 57.1 61.0 70.5 68.9 72.0 59.8 56.7 64.9 59.4 63.1 68.8 69.5Net purchases of used autos ............................................................................................... 8 –21.8 –22.3 –23.1 –25.3 –26.6 –23.2 –21.5 –24.4 –21.3 –22.0 –23.1 –22.5
Net exports ................................................................................................................................. 9 –32.8 –36.6 –41.3 –42.2 –43.6 –31.9 –36.9 –35.6 –37.1 –36.7 –34.1 –40.7Exports ................................................................................................................................... 10 14.3 14.4 16.1 16.0 16.0 15.7 14.0 14.8 13.4 15.5 16.1 16.3Imports ................................................................................................................................... 11 47.0 51.0 57.4 58.2 59.6 47.6 50.9 50.5 50.5 52.2 50.2 57.0
Gross government investment .................................................................................................. 12 2.0 1.9 2.0 2.2 2.1 1.9 2.0 2.0 1.9 1.6 1.9 2.0
Change in business inventories of new and used autos ...................................................... 13 –.5 .1 .4 2.2 –4.7 –.6 8.4 –2.1 –5.4 –.3 –.1 –1.3New ............................................................................................................................................ 14 0 1.0 .9 2.5 –5.2 –.5 10.8 –2.9 –4.0 0 2.3 –1.6Used ........................................................................................................................................... 15 –.5 –.8 –.4 –.1 .3 –.1 –2.2 .7 –1.4 –.3 –2.2 .3
Residual .......................................................................................................................................... 16 –.2 0 0 .2 .6 .2 –.2 .2 .1 .1 0 –.1
Addenda:Domestic output of new autos 1 ................................................................................................ 17 100.0 104.6 119.3 114.2 110.9 104.1 103.5 104.6 98.0 112.2 124.0 116.6Sales of imported new autos 2 .................................................................................................. 18 53.9 56.1 56.2 54.5 52.9 55.5 52.4 57.3 58.9 55.7 53.2 57.8
Line
Seasonally adjusted at annual rates
1994 1995 1996 1997
III IV I II III IV I II III IV I II
Auto output ...................................................................................................................... 1 129.7 129.0 133.5 125.3 123.0 128.8 108.5 129.6 127.9 113.7 119.7 116.1
Final sales ..................................................................................................................................... 2 130.7 124.6 119.1 121.2 131.8 128.8 124.9 127.7 123.8 121.3 121.2 115.4Personal consumption expenditures ......................................................................................... 3 122.7 122.2 119.3 121.1 125.6 121.9 120.9 124.8 121.0 118.0 123.6 117.7
New autos .............................................................................................................................. 4 86.1 84.8 79.0 79.7 81.0 82.6 79.8 79.3 76.7 77.0 79.6 73.0Net purchases of used autos ............................................................................................... 5 36.7 37.3 39.7 40.8 43.7 39.1 40.5 44.4 43.2 40.2 43.1 43.4
Producers’ durable equipment .................................................................................................. 6 49.0 48.8 43.9 42.5 44.3 42.8 43.0 45.4 47.2 44.9 48.0 46.3New autos .............................................................................................................................. 7 71.3 72.4 69.0 67.1 71.3 68.3 68.9 73.7 75.9 69.5 74.7 72.5Net purchases of used autos ............................................................................................... 8 –22.9 –23.9 –24.9 –24.4 –26.7 –25.3 –25.5 –27.8 –28.4 –24.6 –26.6 –26.1
Net exports ................................................................................................................................. 9 –42.5 –47.7 –45.7 –44.7 –40.0 –38.3 –41.2 –43.9 –45.6 –43.4 –52.0 –49.8Exports ................................................................................................................................... 10 16.7 15.3 16.9 15.8 15.6 15.7 16.6 15.5 16.1 15.8 15.6 16.6Imports ................................................................................................................................... 11 59.2 63.0 62.6 60.5 55.7 54.0 57.8 59.4 61.8 59.2 67.6 66.4
Gross government investment .................................................................................................. 12 2.2 1.9 2.0 2.3 2.1 2.6 2.4 1.7 1.8 2.3 2.1 1.7
Change in business inventories of new and used autos ...................................................... 13 –1.0 4.2 14.0 4.0 –8.9 –.2 –16.5 1.8 4.0 –7.9 –1.8 .5New ............................................................................................................................................ 14 –.4 3.2 14.8 4.3 –7.9 –1.3 –18.1 2.0 3.6 –8.1 –1.0 2.2Used ........................................................................................................................................... 15 –.6 1.0 –.3 –.1 –1.1 .9 .8 –.1 .5 0 –.7 –1.4
Residual .......................................................................................................................................... 16 –.2 0 –.1 .3 .7 .2 .9 .3 .3 .8 .5 .6
Addenda:Domestic output of new autos 1 ................................................................................................ 17 118.1 118.3 124.5 110.3 111.5 110.8 103.2 116.5 120.2 103.6 109.8 108.2Sales of imported new autos 2 .................................................................................................. 18 56.8 56.9 54.4 53.6 54.2 55.9 52.9 52.5 52.6 53.5 58.7 54.9
1. Consists of final sales and change in business inventories of new autos assembled in the United States.2. Consists of personal consumption expenditures, producers’ durable equipment, and gross government invest-
ment.NOTE.—Chained (1992) dollar series are calculated as the product of the chain-type quantity index and the 1992
current-dollar value of the corresponding series, divided by 100. Because the formula for the chain-type quantityindexes uses weights of more than one period, the corresponding chained-dollar estimates are usually not additive.The residual line is the difference between the first line and the sum of the most detailed lines, excluding the linesin the addenda.

August •
Table 8.6.—Truck Output[Billions of dollars]
Line 1992 1993 1994 1995 1996
Seasonally adjusted at annual rates
1992 1993 1994
IV I II III IV I II
Truck output 1 .................................................................................................................. 1 83.7 98.3 123.1 133.1 136.7 93.8 94.5 95.2 97.0 106.5 117.3 119.4
Final sales ..................................................................................................................................... 2 82.4 98.7 120.1 130.3 137.4 91.3 87.5 98.5 99.9 108.9 114.5 116.6Personal consumption expenditures ......................................................................................... 3 45.8 52.4 60.7 62.0 63.7 48.9 48.8 51.9 51.9 56.9 58.2 60.1Producers’ durable equipment .................................................................................................. 4 35.1 44.9 57.2 65.8 71.6 38.6 39.7 44.7 45.8 49.4 54.1 54.6Net exports ................................................................................................................................. 5 –5.1 –5.5 –5.1 –5.1 –4.7 –4.8 –6.4 –6.2 –5.2 –3.9 –4.3 –4.6
Exports ................................................................................................................................... 6 5.6 5.8 6.7 7.7 9.0 6.0 5.2 5.8 5.4 6.8 6.6 6.7Imports ................................................................................................................................... 7 10.7 11.2 11.8 12.8 13.7 10.8 11.6 12.0 10.6 10.7 10.9 11.3
Gross government investment .................................................................................................. 8 6.6 6.9 7.2 7.6 6.8 8.7 5.4 8.2 7.3 6.5 6.5 6.6
Change in business inventories ................................................................................................ 9 1.3 –.4 3.1 2.8 –.7 2.4 7.0 –3.4 –2.8 –2.4 2.8 2.8
Line
Seasonally adjusted at annual rates
1994 1995 1996 1997
III IV I II III IV I II III IV I II
Truck output 1 .................................................................................................................. 1 126.1 129.7 131.6 133.1 131.3 136.6 135.3 138.9 134.2 138.5 145.0 140.0
Final sales ..................................................................................................................................... 2 121.5 127.6 129.2 127.7 129.4 135.1 138.7 134.7 134.6 141.6 141.1 138.2Personal consumption expenditures ......................................................................................... 3 60.1 64.6 62.1 60.9 61.2 63.9 65.8 63.1 62.1 63.9 63.2 59.2Producers’ durable equipment .................................................................................................. 4 58.3 61.8 65.3 64.2 66.0 67.8 68.6 69.8 72.9 74.9 76.1 76.8Net exports ................................................................................................................................. 5 –5.7 –5.7 –5.2 –5.2 –5.0 –5.0 –4.2 –4.9 –6.3 –3.2 –5.4 –5.2
Exports ................................................................................................................................... 6 6.4 7.2 7.9 7.5 7.6 7.9 8.3 9.0 8.5 10.2 10.2 9.6Imports ................................................................................................................................... 7 12.1 12.9 13.1 12.6 12.7 12.9 12.5 14.0 14.8 13.4 15.7 14.8
Gross government investment .................................................................................................. 8 8.8 6.9 6.9 7.7 7.2 8.4 8.5 6.7 5.9 6.1 7.2 7.4
Change in business inventories ................................................................................................ 9 4.6 2.1 2.4 5.4 1.9 1.5 –3.4 4.1 –.4 –3.1 3.8 1.8
1. Includes new trucks only.
Table 8.7.—Real Truck Output[Billions of chained (1992) dollars]
Line 1992 1993 1994 1995 1996
Seasonally adjusted at annual rates
1992 1993 1994
IV I II III IV I II
Truck output 1 .................................................................................................................. 1 83.7 94.4 113.5 119.6 121.1 92.8 92.1 91.9 92.5 101.0 109.7 110.3
Final sales ..................................................................................................................................... 2 82.4 94.7 110.7 117.0 121.7 90.4 85.3 95.1 95.2 103.3 107.2 107.7Personal consumption expenditures ......................................................................................... 3 45.8 50.5 56.1 55.6 55.8 48.6 47.9 50.4 49.7 54.0 54.8 55.8Producers’ durable equipment .................................................................................................. 4 35.1 43.0 52.6 58.9 63.7 38.1 38.5 43.0 43.6 46.8 50.4 50.1Net exports ................................................................................................................................. 5 –5.1 –5.3 –4.6 –4.3 –3.7 –4.8 –6.5 –6.1 –5.0 –3.6 –4.0 –4.2
Exports ................................................................................................................................... 6 5.6 5.7 6.6 7.5 8.7 5.9 5.2 5.7 5.3 6.7 6.5 6.5Imports ................................................................................................................................... 7 10.7 11.0 11.2 11.8 12.4 10.7 11.6 11.8 10.4 10.3 10.5 10.8
Gross government investment .................................................................................................. 8 6.6 6.6 6.6 6.8 6.1 8.6 5.3 7.8 7.0 6.1 6.0 6.1
Change in business inventories ................................................................................................ 9 1.3 –.4 2.9 2.6 –.6 2.4 6.8 –3.3 –2.8 –2.3 2.7 2.6
Residual .......................................................................................................................................... 10 0 0 –.1 0 –.2 –.1 0 .1 .1 0 –.2 0
Line
Seasonally adjusted at annual rates
1994 1995 1996 1997
III IV I II III IV I II III IV I II
Truck output 1 .................................................................................................................. 1 115.1 118.9 119.4 119.8 117.5 121.7 120.2 122.9 118.7 122.6 127.6 123.6
Final sales ..................................................................................................................................... 2 110.9 116.9 117.2 114.9 115.7 120.3 123.2 119.1 119.0 125.3 124.2 121.9Personal consumption expenditures ......................................................................................... 3 55.0 58.9 56.5 54.8 54.6 56.6 58.2 55.4 54.2 55.4 54.6 51.2Producers’ durable equipment .................................................................................................. 4 53.0 56.7 58.9 57.5 58.9 60.3 60.9 61.9 64.7 67.0 67.8 68.7Net exports ................................................................................................................................. 5 –5.2 –5.0 –4.5 –4.4 –4.2 –4.1 –3.4 –4.0 –5.1 –2.3 –4.4 –4.3
Exports ................................................................................................................................... 6 6.2 7.0 7.7 7.2 7.4 7.6 8.0 8.7 8.2 9.8 9.8 9.1Imports ................................................................................................................................... 7 11.4 12.0 12.2 11.6 11.6 11.7 11.4 12.7 13.4 12.1 14.2 13.5
Gross government investment .................................................................................................. 8 8.0 6.4 6.3 6.9 6.4 7.5 7.6 5.9 5.2 5.5 6.4 6.6
Change in business inventories ................................................................................................ 9 4.3 2.0 2.2 5.0 1.8 1.4 –3.2 3.9 –.3 –2.9 3.6 1.7
Residual .......................................................................................................................................... 10 0 –.1 0 0 0 0 .1 –.2 .1 –.1 –.4 –.2
1. Includes new trucks only.NOTE.—Chained (1992) dollar series are calculated as the product of the chain-type quantity index and the 1992
current-dollar value of the corresponding series, divided by 100. Because the formula for the chain-type quantityindexes uses weights of more than one period, the corresponding chained-dollar estimates are usually not additive.The residual line is the difference between the first line and the sum of the most detailed lines.

• August
Table 8.8.—Farm Sector Output, Gross Product, and National Income[Billions of dollars]
Line 1992 1993 1994 1995 1996
Farm output ........................................................................................ 1 187.7 186.5 202.9 197.9 219.9
Cash receipts from farm marketings .............................................. 2 172.2 181.7 180.9 193.9 204.2Crops ........................................................................................... 3 86.6 91.6 92.8 106.9 111.4Livestock ...................................................................................... 4 85.6 90.1 88.1 87.0 92.9
Farm housing ................................................................................... 5 5.3 5.5 5.8 5.9 6.1Farm products consumed on farms ............................................... 6 .6 .5 .5 .5 .4Other farm income .......................................................................... 7 4.6 4.9 4.9 5.6 6.3Change in farm inventories ............................................................. 8 5.0 –6.2 10.8 –7.9 2.9
Crops ........................................................................................... 9 4.0 –7.3 9.7 –8.2 4.1Livestock ...................................................................................... 10 1.0 1.1 1.1 .2 –1.3
Less: Intermediate goods and services purchased ............................ 11 107.1 113.5 119.4 124.4 130.6Intermediate goods and services, other than rent ............ 12 94.0 101.0 105.3 110.0 113.7Rent paid to nonoperator landlords ................................... 13 13.1 12.5 14.1 14.3 16.8
Equals: Gross farm product ............................................................. 14 80.6 73.0 83.5 73.5 89.4
Less: Consumption of fixed capital ..................................................... 15 23.2 23.4 23.7 24.7 25.6
Equals: Net farm product ................................................................. 16 57.3 49.7 59.8 48.8 63.8
Less: Indirect business tax and nontax liability .................................. 17 4.5 4.4 4.8 5.1 5.1Plus: Subsidies to operators ............................................................... 18 7.7 11.3 6.6 6.1 6.1
Equals: Farm national income ......................................................... 19 60.5 56.5 61.5 49.7 64.9
Compensation of employees ......................................... 20 13.2 14.3 14.6 15.7 16.5Wage and salary accruals ........................................ 21 11.2 12.0 12.3 13.3 14.2Supplements to wages and salaries ......................... 22 2.0 2.3 2.2 2.4 2.3
Proprietors’ income and corporate profits withinventory valuation and capital consumptionadjustments.
23 38.6 33.8 37.8 24.7 38.6
Proprietors’ income .................................................... 24 37.1 32.4 36.9 23.4 37.2Corporate profits ........................................................ 25 1.5 1.4 .9 1.2 1.4
Net interest ..................................................................... 26 8.7 8.4 9.1 9.4 9.8
Table 8.9.—Real Farm Sector Output, Real Gross Product, and Real NetProduct
[Billions of chained (1992) dollars]
Line 1992 1993 1994 1995 1996
Farm output ........................................................................................ 1 187.7 182.4 199.4 192.0 193.1
Cash receipts from farm marketings .............................................. 2 172.2 177.9 178.2 188.5 179.0Crops ........................................................................................... 3 86.6 90.7 88.4 96.9 88.9Livestock ...................................................................................... 4 85.6 87.2 89.9 91.3 90.5
Farm housing ................................................................................... 5 5.3 5.2 5.2 5.2 5.1Farm products consumed on farms ............................................... 6 .6 .5 .5 .5 .4Other farm income .......................................................................... 7 4.6 4.8 4.8 5.2 5.3Change in farm inventories ............................................................. 8 5.0 –7.3 11.7 –9.2 2.6
Crops ........................................................................................... 9 4.0 –7.4 9.2 –7.7 3.0Livestock ...................................................................................... 10 1.0 1.0 1.2 .3 –1.5
Less: Intermediate goods and services purchased ............................ 11 107.1 111.4 114.7 117.6 117.3Intermediate goods and services, other than rent ............ 12 94.0 99.2 100.7 103.4 101.2Rent paid to nonoperator landlords ................................... 13 13.1 12.2 14.0 14.2 16.2
Equals: Gross farm product ............................................................. 14 80.6 71.0 85.0 74.2 75.5
Less: Consumption of fixed capital ..................................................... 15 23.2 22.7 22.4 22.8 23.2
Equals: Net farm product ................................................................. 16 57.3 48.3 62.9 51.3 52.2
NOTE.—Chained (1992) dollar series are calculated as the product of the chain-type quantity index and the 1992current-dollar value of the corresponding series, divided by 100. Because the formula for the chain-type quantityindexes uses weights of more than one period, the corresponding chained-dollar estimates are usually not additive.
Table 8.10.—Housing Sector Output, Gross Product, and NationalIncome
[Billions of dollars]
Line 1992 1993 1994 1995 1996
Housing output 1 ................................................................................ 1 623.7 648.5 686.7 722.7 758.1
Nonfarm housing ............................................................................. 2 618.3 642.9 680.9 716.8 752.0Owner-occupied ........................................................................... 3 457.8 480.9 507.0 532.2 558.3Tenant-occupied .......................................................................... 4 160.5 162.1 174.0 184.6 193.6
Farm housing ................................................................................... 5 5.3 5.5 5.8 5.9 6.1
Less: Intermediate goods and services consumed ............................ 6 76.2 86.8 87.6 88.5 94.1
Equals: Gross housing product ...................................................... 7 547.5 561.7 599.1 634.2 664.0
Nonfarm housing ............................................................ 8 543.2 557.1 594.4 629.2 658.8Owner-occupied ......................................................... 9 399.8 414.9 439.5 462.8 484.0Tenant-occupied ........................................................ 10 143.4 142.2 155.0 166.4 174.9
Farm housing ................................................................. 11 4.3 4.6 4.7 5.0 5.1
Less: Consumption of fixed capital ..................................................... 12 108.6 103.5 120.5 114.8 118.2Capital consumption allowances ........................................ 13 53.1 52.8 60.9 59.6 62.8Less: Capital consumption adjustment .............................. 14 –55.5 –50.6 –59.6 –55.1 –55.4
Equals: Net housing product ........................................................... 15 438.9 458.2 478.6 519.4 545.8
Less: Indirect business tax and nontax liability plus businesstransfer payments.
16 104.2 109.0 112.9 116.2 119.5
Plus: Subsidies less current surplus of government enterprises ....... 17 17.0 18.7 20.6 20.8 22.6
Equals: Housing national income ................................................... 18 351.7 367.9 386.4 424.0 448.9
Compensation of employees ......................................... 19 7.0 7.3 7.7 8.1 8.5Proprietors’ income with inventory valuation and
capital consumption adjustments.20 18.8 18.8 17.6 25.2 27.1
Rental income of persons with capital consumptionadjustment.
21 52.6 78.5 96.7 104.3 115.8
Corporate profits with inventory valuation and capitalconsumption adjustments.
22 4.2 3.9 4.2 5.1 5.6
Net interest ..................................................................... 23 269.2 259.3 260.2 281.3 292.0
1. Equals personal consumption expenditures for housing less expenditures for other housing as shown in table2.4.
Table 8.11.—Real Housing Sector Output, Real Gross Product, and RealNet Product
[Billions of chained (1992) dollars]
Line 1992 1993 1994 1995 1996
Housing output 1 ................................................................................ 1 623.7 631.1 649.9 663.4 675.2
Nonfarm housing ............................................................................. 2 618.3 625.9 644.8 658.3 670.2Owner-occupied ........................................................................... 3 457.8 467.9 479.6 487.2 495.3Tenant-occupied .......................................................................... 4 160.5 158.0 165.2 171.1 174.9
Farm housing ................................................................................... 5 5.3 5.2 5.2 5.2 5.1
Less: Intermediate goods and services consumed ............................ 6 76.2 84.7 83.1 82.1 85.3
Equals: Gross housing product ...................................................... 7 547.5 546.4 566.8 581.3 589.9
Nonfarm housing ............................................................ 8 543.2 542.1 562.7 577.0 585.7Owner-occupied ......................................................... 9 399.8 403.4 415.6 423.1 428.3Tenant-occupied ........................................................ 10 143.4 138.7 147.1 153.9 157.5
Farm housing ................................................................. 11 4.3 4.3 4.2 4.3 4.2
Less: Consumption of fixed capital ..................................................... 12 108.6 99.3 112.2 103.6 104.6
Equals: Net housing product ........................................................... 13 438.9 447.2 454.5 477.8 485.5
1. Equals personal consumption expenditures for housing less expenditures for other housing as shown in table2.5.
NOTE.—Chained (1992) dollar series are calculated as the product of the chain-type quantity index and the 1992current-dollar value of the corresponding series, divided by 100. Because the formula for the chain-type quantityindexes uses weights of more than one period, the corresponding chained-dollar estimates are usually not additive.

August •
Table 8.12.—Consumption of Fixed Capital by Legal Form ofOrganization[Billions of dollars]
Line 1992 1993 1994 1995 1996
Consumption of fixed capital .............................................. 1 713.5 727.9 777.5 796.8 830.1
Private .................................................................................................. 2 585.4 594.5 638.6 653.0 682.7
Domestic corporate business ...................................................... 3 376.4 388.4 412.3 428.9 452.3Financial ...................................................................................... 4 45.9 48.2 51.7 55.5 58.8Nonfinancial ................................................................................. 5 330.5 340.3 360.7 373.4 393.4
Sole proprietorships and partnerships ...................................... 6 89.3 90.4 99.4 94.4 96.4Farm ............................................................................................ 7 21.4 21.5 21.8 22.6 23.3Nonfarm ....................................................................................... 8 67.9 68.9 77.6 71.8 73.1
Other private business ................................................................. 9 119.7 115.7 126.9 129.7 134.1Rental income of persons ........................................................... 10 96.1 90.3 99.7 100.8 103.7
Nonfarm housing .................................................................... 11 95.1 89.4 98.7 99.8 102.7Owner-occupied .................................................................. 12 81.1 74.8 82.2 84.1 86.6Tenant-occupied ................................................................. 13 14.0 14.6 16.6 15.7 16.1
Farms owned by nonoperator landlords ................................ 14 0 .1 .1 .1 .1Nonfarm nonresidential properties ......................................... 15 .9 .9 .9 .9 .9
Buildings and equipment owned and used by nonprofitinstitutions serving individuals.
16 21.6 23.0 24.3 25.7 27.0
Proprietors’ income ..................................................................... 17 2.0 2.4 2.9 3.3 3.5
Government ........................................................................................ 18 128.2 133.4 138.8 143.8 147.4
General government ........................................................................ 19 110.2 114.3 118.2 122.4 125.1Federal ......................................................................................... 20 63.5 65.5 66.9 68.2 68.5State and local ............................................................................ 21 46.6 48.8 51.3 54.2 56.6
Government enterprises .................................................................. 22 18.0 19.1 20.6 21.4 22.3Federal ......................................................................................... 23 2.3 2.5 2.6 2.6 2.7State and local ............................................................................ 24 15.6 16.6 18.0 18.7 19.6
Addenda:Nonfarm business ............................................................................ 25 562.1 571.1 614.9 628.3 657.2Nonfarm business less housing ...................................................... 26 451.2 465.2 491.9 510.9 536.2
Table 8.13.—Capital Consumption Adjustment by Legal Form ofOrganization and Type of Adjustment
[Billions of dollars]
Line 1992 1993 1994 1995 1996
Capital consumption adjustment 1 ........................... 1 –10.0 4.6 8.7 16.1 27.1
For consistent accounting at historical cost ..................... 2 143.7 150.2 164.3 165.2 173.7For current replacement cost ........................................... 3 –153.7 –145.6 –155.6 –149.1 –146.6
Domestic corporate business ................................................ 4 29.1 36.0 51.4 51.6 61.8For consistent accounting at historical cost ..................... 5 103.9 107.8 124.2 121.9 129.8For current replacement cost ........................................... 6 –74.8 –71.8 –72.8 –70.3 –68.0
Financial ................................................................................. 7 –16.2 –10.4 –9.5 –8.9 –9.3For consistent accounting at historical cost ..................... 8 –12.6 –7.3 –6.5 –6.2 –7.1For current replacement cost ........................................... 9 –3.7 –3.1 –3.0 –2.7 –2.2
Nonfinancial ........................................................................... 10 45.3 46.3 60.8 60.5 71.1For consistent accounting at historical cost ..................... 11 116.4 115.1 130.7 128.2 136.9For current replacement cost ........................................... 12 –71.1 –68.7 –69.9 –67.7 –65.8
Sole proprietorships and partnerships ................................. 13 16.9 19.5 13.1 20.0 20.8Farm 1 .................................................................................... 14 –8.1 –8.0 –7.9 –7.9 –7.8Nonfarm ................................................................................. 15 25.0 27.5 21.0 27.9 28.7
For consistent accounting at historical cost ..................... 16 39.9 42.5 40.1 43.3 43.9For current replacement cost ........................................... 17 –14.9 –15.0 –19.0 –15.4 –15.3
Other private business 1 ......................................................... 18 –56.0 –50.8 –55.8 –55.5 –55.5Rental income of persons ..................................................... 19 –48.1 –42.8 –47.6 –47.0 –47.0
Nonfarm housing ............................................................... 20 –47.9 –42.5 –47.3 –46.7 –46.7Owner-occupied ............................................................ 21 –40.4 –34.7 –38.5 –38.3 –38.2Tenant-occupied ............................................................ 22 –7.4 –7.8 –8.8 –8.4 –8.5
Farms owned by nonoperator landlords .......................... 23 0 0 0 0 0Nonfarm nonresidential properties .................................... 24 –.2 –.2 –.3 –.3 –.3
Buildings and equipment owned and used by nonprofitinstitutions serving individuals.
25 –7.2 –7.4 –7.6 –7.8 –7.8
Proprietors’ income ................................................................ 26 –.7 –.7 –.7 –.7 –.7
Addendum:Capital consumption adjustment for national income
(4+13+19+26).27 –2.8 12.0 16.2 23.9 34.9
1. Except for farm proprietorships and partnerships (line 14) and other private business (line 18), the capitalconsumption adjustment is calculated in two parts. The adjustment for consistent accounting at historical cost con-verts depreciation, based on the service lives and depreciation schedules employed by firms when filing their incometax returns, to consistent service lives and empirically based depreciation schedules. The adjustment for currentreplacement cost converts the historical-cost series with consistent accounting to a current-replacement-cost series.For farm proprietorships and partnerships and other private business, the historical-cost series is based on consist-ent service lives and empirically based depreciation schedules so that the adjustment reflects only a conversionto current replacement cost.
Table 8.14.—Business Transfer Payments by Type[Billions of dollars]
Line 1992 1993 1994 1995 1996
Business transfer payments ..................................... 1 28.4 28.2 30.5 32.2 33.6
Payments to persons .............................................................. 2 22.5 22.1 23.7 25.0 26.0Insurance payments to persons by business ....................... 3 13.1 12.3 12.4 13.4 14.3
Automobile insurance ........................................................ 4 10.1 9.7 10.1 11.1 12.0Medical malpractice insurance ......................................... 5 3.0 2.5 2.3 2.3 2.3
Donations by corporate business to nonprofit institutionsserving individuals.
6 5.5 6.3 7.1 7.4 7.6
Other 1 .................................................................................... 7 3.9 3.6 4.2 4.2 4.1
Payments to the rest of the world 2 ...................................... 8 5.8 6.0 6.8 7.3 7.6
1. Consists largely of cash prizes from business and losses by business due to fraud and unrecovered thefts.2. Consists of income taxes paid by domestic business to foreign governments on income earned abroad.
Table 8.15.—Supplements to Wages and Salaries by Type[Billions of dollars]
Line 1992 1993 1994 1995 1996
Supplements to wages and salaries ........................ 1 674.3 720.8 758.0 772.9 793.3
Employer contributions for social insurance (3.6;2) ................. 2 323.0 335.7 353.0 366.0 385.7Other labor income (6.11;1) ...................................................... 3 351.3 385.1 405.0 406.8 407.6
By type
Pension, profit-sharing, and other retirement benefit plans ..... 4 320.2 337.8 357.2 374.4 387.8Old-age, survivors, and disability insurance (3.6;5) ............. 5 149.2 154.4 162.8 170.9 179.7Federal civilian employee retirement (3.6;13) ...................... 6 31.9 33.0 33.5 33.7 34.6Federal military employee retirement (3.6;14) ...................... 7 28.3 25.5 24.7 23.2 26.9Railroad retirement (3.6;15) .................................................. 8 2.7 2.6 2.6 2.5 2.6Pension benefit guaranty (3.6;16) ......................................... 9 .9 .9 1.0 .9 1.3State and local employee retirement (3.6;21) ...................... 10 35.1 37.6 40.8 44.5 48.0Private pension and profit-sharing (6.11;21) ........................ 11 72.2 83.8 91.8 98.6 94.8
Health insurance ........................................................................ 12 266.5 288.4 305.0 304.7 313.8Federal hospital insurance (3.6;6) ........................................ 13 36.6 39.2 43.7 46.7 49.9Military medical insurance (3.6;19) ....................................... 14 1.7 1.6 1.4 1.3 1.2Temporary disability insurance (3.6;22) ................................ 15 0 0 0 0 0Private group health insurance (6.11;23) 1 ........................... 16 228.2 247.6 259.8 256.7 262.7
Life insurance ............................................................................. 17 6.1 6.7 7.2 7.3 7.5Veterans life insurance (3.6;17) ............................................ 18 0 0 0 0 0Private group life insurance (6.11;24) 1 ................................ 19 6.1 6.7 7.2 7.2 7.4
Workers’ compensation .............................................................. 20 51.1 54.3 53.8 51.6 49.9Federal (3.6;18) ..................................................................... 21 1.8 1.8 1.9 1.9 1.9State and local (3.6;23) ......................................................... 22 9.9 10.8 11.2 11.0 11.0Private insurance 1 (6.11;25) ................................................. 23 39.4 41.6 40.8 38.8 37.0
Unemployment insurance .......................................................... 24 25.5 28.6 29.7 29.6 28.9State unemployment insurance (3.6;8) ................................. 25 18.3 21.4 23.2 22.9 22.1Federal unemployment tax (3.6;9) ........................................ 26 5.4 5.6 5.5 5.8 5.8Railroad employees unemployment insurance (3.6;10) ....... 27 .1 0 0 0 0Federal employees unemployment insurance (3.6;11) ........ 28 1.1 1.2 .7 .7 .6Private supplemental unemployment (6.11;26) .................... 29 .6 .5 .3 .3 .3
Other (6.11;27) 2 ........................................................................ 30 4.8 5.0 5.1 5.3 5.4
1. Employer contributions to publicly administered programs are classified as employer contributions for socialinsurance. Employer contributions to privately administered programs are classified as other labor income. Con-sequently, government contributions to privately administered health and life insurance and to workers’ compensationplans for government employees are classified as other labor income.
2. Consists largely of directors’ fees and of judicial fees.NOTE.—The numbers in parentheses indicate the tables and line numbers from which the entries in this table
are derived.

• August
Table 8.16.—Rental Income of Persons by Type[Billions of dollars]
Line 1992 1993 1994 1995 1996
Rental income of persons ......................................... 1 127.5 148.5 172.0 179.8 193.3
Rental income ............................................................................ 2 119.5 140.7 164.1 171.8 185.0
Nonfarm housing ................................................................... 3 100.4 121.0 143.9 150.9 162.4
Owner-occupied ................................................................. 4 65.6 85.0 102.3 102.6 109.7Permanent site .............................................................. 5 57.1 76.0 93.5 93.7 100.8Mobile homes ................................................................ 6 8.5 9.0 8.8 8.9 8.9
Tenant-occupied (permanent site) .................................... 7 34.8 36.1 41.6 48.3 52.7
Farms owned by nonoperator landlords 1 ............................ 8 5.4 5.3 5.6 5.7 6.8
Nonfarm nonresidential properties ........................................ 9 13.7 14.3 14.5 15.2 15.8
Royalties ..................................................................................... 10 8.0 7.9 7.9 8.0 8.3
1. Rental income of owner-occupied farm housing is included in farm income as shown in table 8.8.
Table 8.17.—Dividends Paid and Received by Sector[Billions of dollars]
Line 1992 1993 1994 1995 1996
Dividends paid ............................................................ 1 269.1 299.6 334.6 393.5 447.9
Domestic corporate business 1 .................................................. 2 229.3 260.2 282.1 342.6 389.6
Financial ................................................................................. 3 55.2 75.2 80.5 110.6 142.7Nonfinancial ........................................................................... 4 174.1 185.0 201.6 232.0 246.9
Rest of the world 2 ..................................................................... 5 39.8 39.5 52.5 50.9 58.3
Dividends received ..................................................... 6 269.1 299.6 334.6 393.5 447.9
Domestic corporate business 2 .................................................. 7 83.3 85.2 97.7 105.7 118.7
Financial ................................................................................. 8 42.8 48.0 54.7 61.9 68.2Nonfinancial ........................................................................... 9 40.5 37.3 43.0 43.7 50.5
Rest of the world 1 ..................................................................... 10 16.3 18.6 20.7 23.4 24.4
Government ................................................................................ 11 10.1 10.5 11.4 12.5 13.6
Persons ...................................................................................... 12 159.4 185.3 204.8 251.9 291.2
Addenda:
Net corporate dividend payments (14+15) ........................... 13 169.5 195.8 216.2 264.4 304.8Domestic corporate business (2–7) .................................. 14 146.0 174.9 184.4 236.9 270.8Rest of the world (5–10) ................................................... 15 23.4 20.8 31.8 27.4 34.0
Personal income dividends (13–11) ..................................... 16 159.4 185.3 204.8 251.9 291.2
1. Remitted earnings to foreign residents from their unincorporated U.S. affiliates are treated as dividends paidby domestic corporate business (line 2) and as dividends received by the rest of the world (line 10).
2. Earnings of U.S. residents remitted by their unincorporated foreign affiliates are treated as dividends paid bythe rest of the world (line 5) and as dividends received by domestic corporate business (line 7).
Table 8.18.—Interest Paid and Received by Sector and Legal Form ofOrganization[Billions of dollars]
Line 1992 1993 1994 1995 1996
Monetary interest paid ............................................... 1 1,540.9 1,474.5 1,594.1 1,826.3 1,923.2
Domestic business 1 .................................................................. 2 1,077.8 1,020.9 1,118.4 1,282.4 1,360.0Corporate business ................................................................ 3 695.8 648.5 733.9 867.9 934.3
Financial ............................................................................ 4 394.8 367.7 431.6 529.7 588.4On deposits 2 ................................................................ 5 131.5 98.6 97.0 126.5 132.1On other liabilities ......................................................... 6 263.3 269.0 334.6 403.2 456.3
Nonfinancial ....................................................................... 7 301.0 280.9 302.4 338.3 345.9Sole proprietorships and partnerships .................................. 8 103.8 103.1 113.3 122.1 122.3
Farm .................................................................................. 9 8.5 8.4 9.3 9.9 10.2Nonfarm ............................................................................. 10 95.3 94.6 104.0 112.3 112.1
Other private business .......................................................... 11 278.3 269.3 271.1 292.3 303.4Rental income of persons ................................................. 12 262.1 252.9 254.4 275.4 286.5Nonprofit institutions serving individuals .......................... 13 14.1 14.5 14.9 15.4 15.4Proprietors’ income ........................................................... 14 2.0 1.9 1.9 1.6 1.6
Persons ...................................................................................... 15 111.7 108.2 110.9 128.5 145.2
Government ................................................................................ 16 282.7 279.0 286.4 314.1 317.7Federal ................................................................................... 17 217.9 214.5 222.7 250.0 253.1State and local ...................................................................... 18 64.8 64.5 63.7 64.1 64.6
Rest of the world ....................................................................... 19 68.7 66.4 78.4 101.3 100.3To business and persons ...................................................... 20 63.6 62.5 75.2 97.4 96.1To Federal Government ........................................................ 21 5.1 3.8 3.2 3.9 4.2
Monetary interest received ........................................ 22 1,540.9 1,474.5 1,594.1 1,826.3 1,923.2
Domestic business 1 .................................................................. 23 971.7 944.0 1,023.1 1,189.8 1,272.4Corporate business ................................................................ 24 959.9 928.7 1,003.7 1,165.5 1,243.6
Financial ............................................................................ 25 790.5 772.1 828.6 963.7 1,020.7Nonfinancial ....................................................................... 26 169.4 156.6 175.1 201.9 223.0
Financial sole proprietorships and partnerships 3 ................ 27 11.6 15.1 19.2 24.3 28.7Other private business .......................................................... 28 .2 .1 .1 0 0
Persons 3 .................................................................................... 29 324.1 292.1 310.0 331.5 332.1
Government ................................................................................ 30 133.5 130.9 133.3 139.3 142.1Federal ................................................................................... 31 21.0 20.8 21.6 24.0 24.7State and local ...................................................................... 32 112.5 110.1 111.7 115.3 117.4
Rest of the world ....................................................................... 33 111.6 107.5 127.8 165.7 176.7From business ....................................................................... 34 71.1 65.9 80.7 104.4 105.3From Federal Government .................................................... 35 40.5 41.6 47.0 61.3 71.3
Imputed interest paid ................................................. 36 416.2 434.8 438.5 479.0 498.8
Domestic corporate business (financial) ................................... 37 416.2 434.8 438.5 479.0 498.8Banks, credit agencies, and investment companies ............ 38 216.0 220.2 231.9 251.4 265.1Life insurance carriers and private noninsured pension
plans.39 200.2 214.6 206.6 227.6 233.7
Imputed interest received .......................................... 40 416.2 434.8 438.5 479.0 498.8
Domestic business 1 .................................................................. 41 54.3 56.2 58.8 67.5 69.7Corporate business ................................................................ 42 37.0 39.3 41.8 45.8 47.4
Financial ............................................................................ 43 9.6 9.5 10.8 11.3 13.0Nonfinancial ....................................................................... 44 27.4 29.7 31.0 34.4 34.4
Sole proprietorships and partnerships .................................. 45 17.2 16.8 16.9 21.5 22.1Farm .................................................................................. 46 1.1 1.1 1.2 1.7 1.9Nonfarm ............................................................................. 47 16.1 15.6 15.7 19.8 20.2
Other private business .......................................................... 48 .2 .2 .2 .2 .2
Persons ...................................................................................... 49 343.1 358.8 358.1 387.4 403.6From banks, credit agencies, and investment companies 50 142.9 144.2 151.5 159.8 169.9From life insurance carriers and private noninsured
pension plans.51 200.2 214.6 206.6 227.6 233.7
Government ................................................................................ 52 7.9 7.8 8.2 9.7 10.2Federal ................................................................................... 53 1.0 1.1 1.1 1.2 1.3State and local ...................................................................... 54 6.9 6.8 7.2 8.4 8.9
Rest of the world ....................................................................... 55 10.9 11.9 13.3 14.5 15.3
Addenda:Net interest (57+61) .............................................................. 56 414.3 402.5 412.3 425.1 425.1
Domestic business (2+37–23–41) .................................... 57 468.1 455.5 475.0 504.1 516.7Corporate (3+37–24–42) .............................................. 58 115.1 115.3 126.9 135.6 142.1Sole proprietorships and partnerships (8–27–45) ....... 59 75.1 71.2 77.2 76.4 71.5Other private business (11–28–48) .............................. 60 277.9 269.0 270.8 292.1 303.2
Rest of the world (19–33–55) ........................................... 61 –53.8 –53.0 –62.7 –78.9 –91.7Net interest paid by government (16–30–52)) ..................... 62 141.2 140.3 144.9 165.2 165.4Interest paid by persons (15) ................................................ 63 111.7 108.2 110.9 128.5 145.2Personal interest income (56+62+63) or (29+49) ................ 64 667.2 651.0 668.1 718.9 735.7
1. Excludes interest paid or received by government enterprises, whose interest is included in the governmentsector.
2. Consists of interest paid on the deposit liabilities of commercial and mutual savings banks, savings and loanassociations, and credit unions.
3. Interest received by nonfinancial sole proprietorships and partnerships is considered interest received by per-sons and is included in line 29.
NOTE.—In table 8.18, imputed interest paid (line 36) is the difference between the property income received byfinancial intermediaries from the investment of depositors’ or beneficiaries’ funds and the interest paid by them tobusiness, persons, and governments, and the rest of the world. In table 8.19, imputed interest (line 55)—the interestcomponent of imputations that affect GNP—consists of the imputed interest paid by financial intermediaries otherthan life insurance carriers and private noninsured pension plans to persons and government, and the interest paidon owner-occupied housing and on buildings and equipment owned and used by nonprofit institutions serving individ-uals.
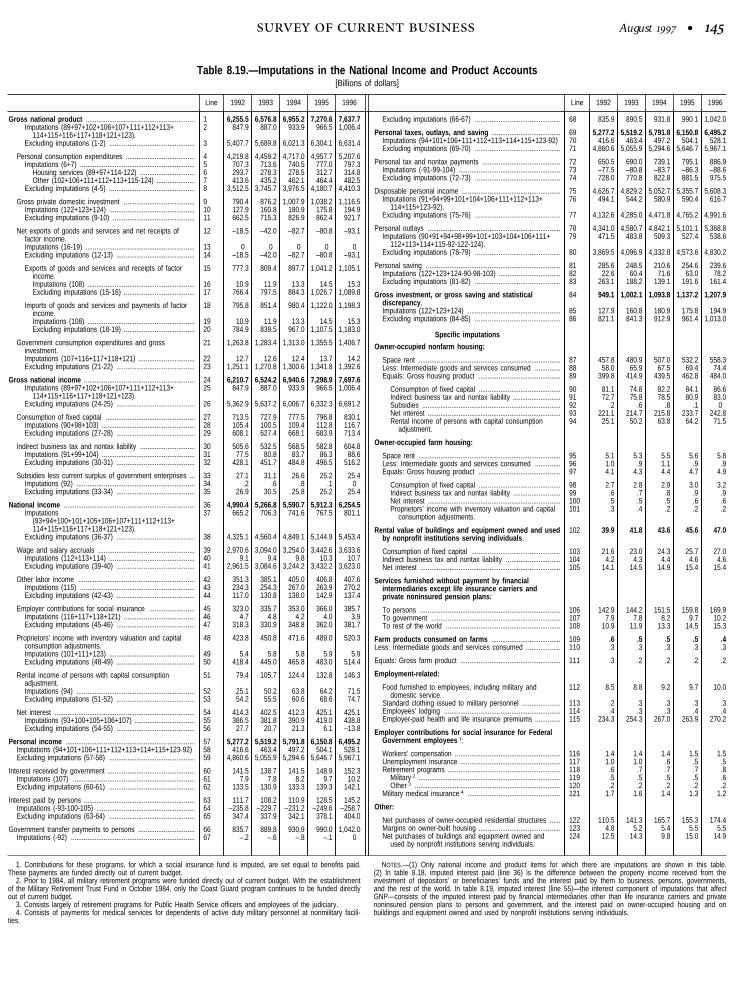
August •
Table 8.19.—Imputations in the National Income and Product Accounts[Billions of dollars]
Line 1992 1993 1994 1995 1996
Gross national product ............................................................ 1 6,255.5 6,576.8 6,955.2 7,270.6 7,637.7Imputations (89+97+102+106+107+111+112+113+
114+115+116+117+118+121+123).2 847.9 887.0 933.9 966.5 1,006.4
Excluding imputations (1-2) ............................................... 3 5,407.7 5,689.8 6,021.3 6,304.1 6,631.4
Personal consumption expenditures ...................................... 4 4,219.8 4,459.2 4,717.0 4,957.7 5,207.6Imputations (6+7) ............................................................... 5 707.3 713.6 740.5 777.0 797.3
Housing services (89+97+114-122) .............................. 6 293.7 278.3 278.5 312.7 314.8Other (102+106+111+112+113+115-124) ..................... 7 413.6 435.2 462.1 464.4 482.5
Excluding imputations (4-5) ............................................... 8 3,512.5 3,745.7 3,976.5 4,180.7 4,410.3
Gross private domestic investment ....................................... 9 790.4 876.2 1,007.9 1,038.2 1,116.5Imputations (122+123+124) ............................................... 10 127.9 160.8 180.9 175.8 194.9Excluding imputations (9-10) ............................................. 11 662.5 715.3 826.9 862.4 921.7
Net exports of goods and services and net receipts offactor income.
12 –18.5 –42.0 –82.7 –80.8 –93.1
Imputations (16-19) ............................................................ 13 0 0 0 0 0Excluding imputations (12-13) ........................................... 14 –18.5 –42.0 –82.7 –80.8 –93.1
Exports of goods and services and receipts of factorincome.
15 777.3 809.4 897.7 1,041.2 1,105.1
Imputations (108) ........................................................... 16 10.9 11.9 13.3 14.5 15.3Excluding imputations (15-16) ....................................... 17 766.4 797.5 884.3 1,026.7 1,089.8
Imports of goods and services and payments of factorincome.
18 795.8 851.4 980.4 1,122.0 1,198.3
Imputations (108) ........................................................... 19 10.9 11.9 13.3 14.5 15.3Excluding imputations (18-19) ....................................... 20 784.9 839.5 967.0 1,107.5 1,183.0
Government consumption expenditures and grossinvestment.
21 1,263.8 1,283.4 1,313.0 1,355.5 1,406.7
Imputations (107+116+117+118+121) ............................... 22 12.7 12.6 12.4 13.7 14.2Excluding imputations (21-22) ........................................... 23 1,251.1 1,270.8 1,300.6 1,341.8 1,392.6
Gross national income ............................................................. 24 6,210.7 6,524.2 6,940.6 7,298.9 7,697.6Imputations (89+97+102+106+107+111+112+113+
114+115+116+117+118+121+123).25 847.9 887.0 933.9 966.5 1,006.4
Excluding imputations (24-25) ........................................... 26 5,362.9 5,637.2 6,006.7 6,332.3 6,691.2
Consumption of fixed capital ................................................. 27 713.5 727.9 777.5 796.8 830.1Imputations (90+98+103) ................................................... 28 105.4 100.5 109.4 112.8 116.7Excluding imputations (27-28) ........................................... 29 608.1 627.4 668.1 683.9 713.4
Indirect business tax and nontax liability .............................. 30 505.6 532.5 568.5 582.8 604.8Imputations (91+99+104) ................................................... 31 77.5 80.8 83.7 86.3 88.6Excluding imputations (30-31) ........................................... 32 428.1 451.7 484.8 496.5 516.2
Subsidies less current surplus of government enterprises ... 33 27.1 31.1 26.6 25.2 25.4Imputations (92) ................................................................. 34 .2 .6 .8 .1 0Excluding imputations (33-34) ........................................... 35 26.9 30.5 25.8 25.2 25.4
National income ........................................................................ 36 4,990.4 5,266.8 5,590.7 5,912.3 6,254.5Imputations
(93+94+100+101+105+106+107+111+112+113+114+115+116+117+118+121+123).
37 665.2 706.3 741.6 767.5 801.1
Excluding imputations (36-37) ........................................... 38 4,325.1 4,560.4 4,849.1 5,144.9 5,453.4
Wage and salary accruals ..................................................... 39 2,970.6 3,094.0 3,254.0 3,442.6 3,633.6Imputations (112+113+114) ............................................... 40 9.1 9.4 9.8 10.3 10.7Excluding imputations (39-40) ........................................... 41 2,961.5 3,084.6 3,244.2 3,432.2 3,623.0
Other labor income ................................................................ 42 351.3 385.1 405.0 406.8 407.6Imputations (115) ............................................................... 43 234.3 254.3 267.0 263.9 270.2Excluding imputations (42-43) ........................................... 44 117.0 130.8 138.0 142.9 137.4
Employer contributions for social insurance ......................... 45 323.0 335.7 353.0 366.0 385.7Imputations (116+117+118+121) ....................................... 46 4.7 4.8 4.2 4.0 3.9Excluding imputations (45-46) ........................................... 47 318.3 330.9 348.8 362.0 381.7
Proprietors’ income with inventory valuation and capitalconsumption adjustments.
48 423.8 450.8 471.6 489.0 520.3
Imputations (101+111+123) ............................................... 49 5.4 5.8 5.8 5.9 5.9Excluding imputations (48-49) ........................................... 50 418.4 445.0 465.8 483.0 514.4
Rental income of persons with capital consumptionadjustment.
51 79.4 105.7 124.4 132.8 146.3
Imputations (94) ................................................................. 52 25.1 50.2 63.8 64.2 71.5Excluding imputations (51-52) ........................................... 53 54.2 55.5 60.6 68.6 74.7
Net interest ............................................................................. 54 414.3 402.5 412.3 425.1 425.1Imputations (93+100+105+106+107) ................................. 55 386.5 381.8 390.9 419.0 438.8Excluding imputations (54-55) ........................................... 56 27.7 20.7 21.3 6.1 –13.8
Personal income ....................................................................... 57 5,277.2 5,519.2 5,791.8 6,150.8 6,495.2Imputations (94+101+106+111+112+113+114+115+123-92) 58 416.6 463.4 497.2 504.1 528.1Excluding imputations (57-58) ............................................... 59 4,860.6 5,055.9 5,294.6 5,646.7 5,967.1
Interest received by government ................................................ 60 141.5 138.7 141.5 148.9 152.3Imputations (107) ................................................................... 61 7.9 7.8 8.2 9.7 10.2Excluding imputations (60-61) ............................................... 62 133.5 130.9 133.3 139.3 142.1
Interest paid by persons ............................................................. 63 111.7 108.2 110.9 128.5 145.2Imputations (-93-100-105) ...................................................... 64 –235.8 –229.7 –231.2 –249.6 –258.7Excluding imputations (63-64) ............................................... 65 347.4 337.9 342.1 378.1 404.0
Government transfer payments to persons ............................... 66 835.7 889.8 930.9 990.0 1,042.0Imputations (-92) .................................................................... 67 –.2 –.6 –.8 –.1 0
Line 1992 1993 1994 1995 1996
Excluding imputations (66-67) ............................................... 68 835.9 890.5 931.8 990.1 1,042.0
Personal taxes, outlays, and saving ...................................... 69 5,277.2 5,519.2 5,791.8 6,150.8 6,495.2Imputations (94+101+106+111+112+113+114+115+123-92) 70 416.6 463.4 497.2 504.1 528.1Excluding imputations (69-70) ............................................... 71 4,860.6 5,055.9 5,294.6 5,646.7 5,967.1
Personal tax and nontax payments ........................................... 72 650.5 690.0 739.1 795.1 886.9Imputations (-91-99-104) ........................................................ 73 –77.5 –80.8 –83.7 –86.3 –88.6Excluding imputations (72-73) ............................................... 74 728.0 770.8 822.8 881.5 975.5
Disposable personal income ...................................................... 75 4,626.7 4,829.2 5,052.7 5,355.7 5,608.3Imputations (91+94+99+101+104+106+111+112+113+
114+115+123-92).76 494.1 544.2 580.9 590.4 616.7
Excluding imputations (75-76) ............................................... 77 4,132.6 4,285.0 4,471.8 4,765.2 4,991.6
Personal outlays ......................................................................... 78 4,341.0 4,580.7 4,842.1 5,101.1 5,368.8Imputations (90+91+94+98+99+101+103+104+106+111+
112+113+114+115-92-122-124).79 471.5 483.8 509.3 527.4 538.6
Excluding imputations (78-79) ............................................... 80 3,869.5 4,096.9 4,332.8 4,573.6 4,830.2
Personal saving .......................................................................... 81 285.6 248.5 210.6 254.6 239.6Imputations (122+123+124-90-98-103) .................................. 82 22.6 60.4 71.6 63.0 78.2Excluding imputations (81-82) ............................................... 83 263.1 188.2 139.1 191.6 161.4
Gross investment, or gross saving and statisticaldiscrepancy.
84 949.1 1,002.1 1,093.8 1,137.2 1,207.9
Imputations (122+123+124) ................................................... 85 127.9 160.8 180.9 175.8 194.9Excluding imputations (84-85) ............................................... 86 821.1 841.3 912.9 961.4 1,013.0
Specific imputations
Owner-occupied nonfarm housing:
Space rent .............................................................................. 87 457.8 480.9 507.0 532.2 558.3Less: Intermediate goods and services consumed .............. 88 58.0 65.9 67.5 69.4 74.4Equals: Gross housing product ............................................. 89 399.8 414.9 439.5 462.8 484.0
Consumption of fixed capital ............................................. 90 81.1 74.8 82.2 84.1 86.6Indirect business tax and nontax liability .......................... 91 72.7 75.8 78.5 80.9 83.0Subsidies ............................................................................ 92 .2 .6 .8 .1 0Net interest ......................................................................... 93 221.1 214.7 215.8 233.7 242.8Rental income of persons with capital consumption
adjustment.94 25.1 50.2 63.8 64.2 71.5
Owner-occupied farm housing:
Space rent .............................................................................. 95 5.1 5.3 5.5 5.6 5.8Less: Intermediate goods and services consumed .............. 96 1.0 .9 1.1 .9 .9Equals: Gross housing product ............................................. 97 4.1 4.3 4.4 4.7 4.9
Consumption of fixed capital ............................................. 98 2.7 2.8 2.9 3.0 3.2Indirect business tax and nontax liability .......................... 99 .6 .7 .8 .9 .9Net interest ......................................................................... 100 .5 .5 .5 .6 .6Proprietors’ income with inventory valuation and capital
consumption adjustments.101 .3 .4 .2 .2 .2
Rental value of buildings and equipment owned and usedby nonprofit institutions serving individuals.
102 39.9 41.8 43.6 45.6 47.0
Consumption of fixed capital ................................................. 103 21.6 23.0 24.3 25.7 27.0Indirect business tax and nontax liability .............................. 104 4.2 4.3 4.4 4.6 4.6Net interest ............................................................................. 105 14.1 14.5 14.9 15.4 15.4
Services furnished without payment by financialintermediaries except life insurance carriers andprivate noninsured pension plans:
To persons ............................................................................. 106 142.9 144.2 151.5 159.8 169.9To government ....................................................................... 107 7.9 7.8 8.2 9.7 10.2To rest of the world ............................................................... 108 10.9 11.9 13.3 14.5 15.3
Farm products consumed on farms ...................................... 109 .6 .5 .5 .5 .4Less: Intermediate goods and services consumed ................... 110 .3 .3 .3 .3 .3
Equals: Gross farm product ....................................................... 111 .3 .2 .2 .2 .2
Employment-related:
Food furnished to employees, including military anddomestic service.
112 8.5 8.8 9.2 9.7 10.0
Standard clothing issued to military personnel ..................... 113 .2 .3 .3 .3 .3Employees’ lodging ................................................................ 114 .4 .3 .3 .4 .4Employer-paid health and life insurance premiums .............. 115 234.3 254.3 267.0 263.9 270.2
Employer contributions for social insurance for FederalGovernment employees 1:
Workers’ compensation .......................................................... 116 1.4 1.4 1.4 1.5 1.5Unemployment insurance ....................................................... 117 1.0 1.0 .6 .5 .5Retirement programs .............................................................. 118 .6 .7 .7 .7 .8
Military 2 .............................................................................. 119 .5 .5 .5 .5 .6Other 3 ................................................................................ 120 .2 .2 .2 .2 .2
Military medical insurance 4 ................................................... 121 1.7 1.6 1.4 1.3 1.2
Other:
Net purchases of owner-occupied residential structures ...... 122 110.5 141.3 165.7 155.3 174.4Margins on owner-built housing ............................................. 123 4.8 5.2 5.4 5.5 5.5Net purchases of buildings and equipment owned and
used by nonprofit institutions serving individuals.124 12.5 14.3 9.8 15.0 14.9
1. Contributions for these programs, for which a social insurance fund is imputed, are set equal to benefits paid.These payments are funded directly out of current budget.
2. Prior to 1984, all military retirement programs were funded directly out of current budget. With the establishmentof the Military Retirement Trust Fund in October 1984, only the Coast Guard program continues to be funded directlyout of current budget.
3. Consists largely of retirement programs for Public Health Service officers and employees of the judiciary.4. Consists of payments for medical services for dependents of active duty military personnel at nonmilitary facili-
ties.
NOTES.—(1) Only national income and product items for which there are imputations are shown in this table.(2) In table 8.18, imputed interest paid (line 36) is the difference between the property income received from theinvestment of depositors’ or beneficiaries’ funds and the interest paid by them to business, persons, governments,and the rest of the world. In table 8.19, imputed interest (line 55)—the interest component of imputations that affectGNP—consists of the imputed interest paid by financial intermediaries other than life insurance carriers and privatenoninsured pension plans to persons and government, and the interest paid on owner-occupied housing and onbuildings and equipment owned and used by nonprofit institutions serving individuals.

• August
Table 8.27.—Quantity Indexes and Percent Change from Preceding Period in Selected Series, Fixed 1992 Weights
Line 1992 1993 1994 1995 1996
Seasonally adjusted
1992 1993 1994
IV I II III IV I II
Index numbers, 1992=100
Gross domestic product .................................................................................................... 1 100.00 102.37 106.06 108.65 112.39 101.34 101.35 101.87 102.45 103.82 104.62 105.83
Personal consumption expenditures ......................................................................................... 2 100.00 102.99 106.48 109.25 112.42 101.49 101.61 102.47 103.54 104.32 105.33 106.13
Durable goods ............................................................................................................................ 3 100.00 107.37 115.45 120.89 128.97 103.37 103.21 106.34 108.66 111.28 113.07 114.26Nondurable goods ...................................................................................................................... 4 100.00 102.22 105.17 106.95 108.50 101.36 101.19 101.98 102.66 103.03 104.28 104.81Services ...................................................................................................................................... 5 100.00 102.52 105.38 108.15 111.22 101.18 101.51 101.95 102.99 103.62 104.33 105.20
Gross private domestic investment .......................................................................................... 6 100.00 109.33 123.85 127.90 140.92 102.77 106.92 107.07 108.80 114.52 119.08 125.07
Fixed investment ........................................................................................................................ 7 100.00 107.69 117.33 125.28 139.13 102.85 104.02 106.12 107.97 112.64 113.57 116.83Nonresidential ........................................................................................................................ 8 100.00 107.74 116.93 129.80 146.57 102.01 103.59 106.71 108.21 112.47 112.70 115.44
Structures .......................................................................................................................... 9 100.00 100.95 101.91 106.32 111.45 97.88 99.32 100.66 101.49 102.33 98.30 103.10Producers’ durable equipment .......................................................................................... 10 100.00 110.70 123.46 140.02 161.86 103.81 105.45 109.34 111.13 116.88 118.97 120.81
Residential ............................................................................................................................. 11 100.00 107.54 118.34 114.10 120.73 104.93 105.08 104.66 107.37 113.06 115.74 120.27Change in business inventories ................................................................................................ 12 ............... ............... ............... ............... ............... ............... ............... ............... ............... ............... ............... ...............
Net exports of goods and services ........................................................................................... 13 ............... ............... ............... ............... ............... ............... ............... ............... ............... ............... ............... ...............
Exports ....................................................................................................................................... 14 100.00 103.19 112.45 127.67 143.03 101.54 101.31 103.35 101.46 106.65 106.45 110.87Goods .................................................................................................................................... 15 100.00 103.70 115.01 133.21 152.39 102.77 101.33 103.85 101.30 108.31 107.79 112.74Services ................................................................................................................................. 16 100.00 102.00 106.43 114.62 121.01 98.65 101.24 102.18 101.84 102.73 103.32 106.48
Imports ....................................................................................................................................... 17 100.00 109.05 122.82 135.65 152.28 102.98 104.96 108.15 109.27 113.83 116.04 121.30Goods .................................................................................................................................... 18 100.00 110.71 126.42 140.68 159.54 103.09 106.27 109.89 111.00 115.67 118.25 124.48Services ................................................................................................................................. 19 100.00 101.79 107.02 113.61 120.43 102.49 99.22 100.53 101.67 105.74 106.38 107.37
Government consumption expenditures and gross investment ........................................... 20 100.00 99.10 99.19 99.30 100.07 100.69 98.93 99.18 98.95 99.33 98.33 98.42
Federal ....................................................................................................................................... 21 100.00 95.80 92.28 89.40 88.61 101.13 97.03 96.23 94.93 94.99 92.32 91.13National defense .................................................................................................................... 22 100.00 94.35 89.85 86.18 85.11 100.26 95.61 94.96 93.41 93.44 89.29 89.46Nondefense ............................................................................................................................ 23 100.00 99.36 98.28 97.35 97.25 103.29 100.54 99.38 98.69 98.81 99.81 95.25
State and local ........................................................................................................................... 24 100.00 101.47 104.14 106.41 108.30 100.37 100.30 101.30 101.83 102.45 102.64 103.66
Percent change from preceding period
Gross domestic product .................................................................................................... 25 2.7 2.4 3.6 2.4 3.4 4.4 0 2.1 2.3 5.5 3.1 4.7
Personal consumption expenditures ......................................................................................... 26 2.7 3.0 3.4 2.6 2.9 5.4 .5 3.4 4.3 3.0 3.9 3.1
Durable goods ............................................................................................................................ 27 5.6 7.4 7.5 4.7 6.7 11.1 –.6 12.7 9.0 10.0 6.6 4.3Nondurable goods ...................................................................................................................... 28 1.4 2.2 2.9 1.7 1.4 5.8 –.7 3.1 2.7 1.5 4.9 2.0Services ...................................................................................................................................... 29 2.9 2.5 2.8 2.6 2.8 4.1 1.3 1.8 4.1 2.5 2.8 3.4
Gross private domestic investment .......................................................................................... 30 7.0 9.3 13.3 3.3 10.2 6.9 17.2 .6 6.6 22.8 16.9 21.7
Fixed investment ........................................................................................................................ 31 5.5 7.7 9.0 6.8 11.1 9.8 4.6 8.3 7.1 18.5 3.4 12.0Nonresidential ........................................................................................................................ 32 1.6 7.7 8.5 11.0 12.9 6.3 6.3 12.6 5.7 16.7 .8 10.1
Structures .......................................................................................................................... 33 –6.8 .9 1.0 4.3 4.8 –4.3 6.0 5.5 3.3 3.3 –14.8 21.0Producers’ durable equipment .......................................................................................... 34 5.7 10.7 11.5 13.4 15.6 11.1 6.5 15.6 6.7 22.4 7.3 6.3
Residential ............................................................................................................................. 35 16.6 7.5 10.0 –3.6 5.8 18.7 .6 –1.6 10.8 23.0 9.8 16.6Change in business inventories ................................................................................................ 36 ............... ............... ............... ............... ............... ............... ............... ............... ............... ............... ............... ...............
Net exports of goods and services ........................................................................................... 37 ............... ............... ............... ............... ............... ............... ............... ............... ............... ............... ............... ...............
Exports ....................................................................................................................................... 38 6.3 3.2 9.0 13.5 12.0 6.3 –.9 8.3 –7.1 22.1 –.7 17.7Goods .................................................................................................................................... 39 6.6 3.7 10.9 15.8 14.4 12.1 –5.5 10.3 –9.5 30.7 –1.9 19.7Services ................................................................................................................................. 40 5.5 2.0 4.3 7.7 5.6 –6.4 10.9 3.8 –1.3 3.5 2.3 12.8
Imports ....................................................................................................................................... 41 7.2 9.1 12.6 10.5 12.3 11.3 7.9 12.7 4.2 17.7 8.0 19.4Goods .................................................................................................................................... 42 9.3 10.7 14.2 11.3 13.4 6.7 12.9 14.3 4.1 17.9 9.2 22.8Services ................................................................................................................................. 43 –.9 1.8 5.1 6.2 6.0 34.5 –12.1 5.4 4.6 17.0 2.4 3.8
Government consumption expenditures and gross investment ........................................... 44 .4 –.9 .1 .1 .8 1.9 –6.8 1.0 –.9 1.5 –4.0 .4
Federal ....................................................................................................................................... 45 –2.2 –4.2 –3.7 –3.1 –.9 3.3 –15.3 –3.2 –5.3 .2 –10.8 –5.1National defense .................................................................................................................... 46 –5.5 –5.6 –4.8 –4.1 –1.2 –2.1 –17.3 –2.7 –6.4 .1 –16.6 .7Nondefense ............................................................................................................................ 47 7.1 –.6 –1.1 –.9 –.1 17.7 –10.2 –4.5 –2.8 .5 4.1 –17.1
State and local ........................................................................................................................... 48 2.3 1.5 2.6 2.2 1.8 .9 –.3 4.0 2.1 2.4 .7 4.0
See note at end of table.

August •
Table 8.27.—Quantity Indexes and Percent Change from Preceding Period in Selected Series, Fixed 1992 Weights—Continued
Line
Seasonally adjusted
1994 1995 1996 1997
III IV I II III IV I II III IV I II
Index numbers, 1992=100
Gross domestic product .................................................................................................... 1 106.37 107.44 107.85 108.04 108.96 109.76 110.47 112.28 112.80 114.02 115.69 116.60
Personal consumption expenditures ......................................................................................... 2 106.79 107.69 108.12 108.92 109.68 110.27 111.20 112.35 112.56 113.58 115.24 115.68
Durable goods ............................................................................................................................ 3 115.63 118.86 118.06 119.37 122.37 123.75 125.58 129.34 129.60 131.35 136.80 137.13Nondurable goods ...................................................................................................................... 4 105.43 106.16 106.61 106.87 107.07 107.24 107.72 108.45 108.64 109.19 110.48 109.87Services ...................................................................................................................................... 5 105.73 106.27 106.93 107.92 108.54 109.19 110.19 111.04 111.26 112.38 113.49 114.52
Gross private domestic investment .......................................................................................... 6 123.47 127.76 128.67 125.87 126.83 130.24 132.53 139.05 145.65 146.45 153.56 159.39
Fixed investment ........................................................................................................................ 7 118.25 120.68 123.31 123.86 125.54 128.43 132.42 137.71 142.23 144.17 147.01 152.18Nonresidential ........................................................................................................................ 8 117.79 121.79 126.29 128.97 130.40 133.55 138.22 143.65 150.59 153.83 157.40 163.98
Structures .......................................................................................................................... 9 102.84 103.42 105.79 106.91 107.10 105.51 107.59 109.63 112.25 116.32 115.74 116.40Producers’ durable equipment .......................................................................................... 10 124.29 129.79 135.22 138.57 140.54 145.75 151.55 158.45 167.28 170.16 175.53 184.69
Residential ............................................................................................................................. 11 119.41 117.93 115.92 111.22 113.51 115.77 118.09 123.01 121.56 120.26 121.31 122.98Change in business inventories ................................................................................................ 12 ............... ............... ............... ............... ............... ............... ............... ............... ............... ............... ............... ...............
Net exports of goods and services ........................................................................................... 13 ............... ............... ............... ............... ............... ............... ............... ............... ............... ............... ............... ...............
Exports ....................................................................................................................................... 14 114.00 118.48 121.09 124.54 130.06 134.98 136.53 140.64 142.52 152.42 158.67 165.75Goods .................................................................................................................................... 15 116.97 122.55 125.52 129.99 135.61 141.73 144.43 149.10 151.81 164.22 172.61 182.48Services ................................................................................................................................. 16 107.02 108.91 110.66 111.72 116.99 119.11 117.96 120.75 120.68 124.66 125.87 126.41
Imports ....................................................................................................................................... 17 125.40 128.53 131.50 134.59 137.06 139.46 143.93 149.25 155.21 160.74 169.95 179.82Goods .................................................................................................................................... 18 129.52 133.42 135.70 139.74 142.27 145.00 149.53 155.85 163.06 169.71 179.46 191.07Services ................................................................................................................................. 19 107.32 107.01 113.08 112.00 114.19 115.17 119.34 120.27 120.73 121.40 128.19 130.43
Government consumption expenditures and gross investment ........................................... 20 100.51 99.48 99.73 99.67 99.57 98.24 98.75 100.54 100.49 100.51 100.46 101.48
Federal ....................................................................................................................................... 21 94.29 91.36 91.32 90.17 90.03 86.09 87.72 89.65 89.17 87.89 86.61 88.43National defense .................................................................................................................... 22 92.71 87.93 87.80 87.38 86.68 82.88 84.11 86.44 85.80 84.08 81.49 83.65Nondefense ............................................................................................................................ 23 98.20 99.84 100.02 97.05 98.31 94.03 96.62 97.57 97.50 97.30 99.26 100.25
State and local ........................................................................................................................... 24 104.97 105.31 105.77 106.48 106.42 106.96 106.67 108.35 108.61 109.57 110.41 110.84
Percent change from preceding period
Gross domestic product .................................................................................................... 25 2.1 4.1 1.5 .7 3.4 3.0 2.6 6.7 1.9 4.4 6.0 3.2
Personal consumption expenditures ......................................................................................... 26 2.5 3.4 1.6 3.0 2.8 2.2 3.4 4.2 .8 3.7 6.0 1.5
Durable goods ............................................................................................................................ 27 4.9 11.6 –2.6 4.5 10.5 4.6 6.0 12.5 .8 5.5 17.7 1.0Nondurable goods ...................................................................................................................... 28 2.4 2.8 1.7 1.0 .7 .7 1.8 2.7 .7 2.1 4.8 –2.2Services ...................................................................................................................................... 29 2.0 2.0 2.5 3.8 2.3 2.4 3.7 3.1 .8 4.1 4.0 3.7
Gross private domestic investment .......................................................................................... 30 –5.0 14.6 2.9 –8.4 3.1 11.2 7.2 21.2 20.4 2.2 20.9 16.1
Fixed investment ........................................................................................................................ 31 5.0 8.5 9.0 1.8 5.5 9.5 13.0 16.9 13.8 5.5 8.1 14.8Nonresidential ........................................................................................................................ 32 8.4 14.3 15.6 8.7 4.5 10.0 14.7 16.7 20.8 8.9 9.6 17.8
Structures .......................................................................................................................... 33 –1.0 2.3 9.5 4.3 .7 –5.8 8.1 7.8 9.9 15.3 –2.0 2.3Producers’ durable equipment .......................................................................................... 34 12.0 18.9 17.8 10.3 5.8 15.7 16.9 19.5 24.2 7.1 13.2 22.6
Residential ............................................................................................................................. 35 –2.8 –4.8 –6.7 –15.3 8.5 8.2 8.3 17.8 –4.6 –4.2 3.5 5.6Change in business inventories ................................................................................................ 36 ............... ............... ............... ............... ............... ............... ............... ............... ............... ............... ............... ...............
Net exports of goods and services ........................................................................................... 37 ............... ............... ............... ............... ............... ............... ............... ............... ............... ............... ............... ...............
Exports ....................................................................................................................................... 38 11.8 16.7 9.1 11.9 18.9 16.0 4.7 12.6 5.5 30.8 17.4 19.1Goods .................................................................................................................................... 39 15.9 20.5 10.1 15.0 18.5 19.3 7.8 13.6 7.5 36.9 22.0 24.9Services ................................................................................................................................. 40 2.0 7.3 6.6 3.9 20.3 7.4 –3.8 9.8 –.3 13.9 3.9 1.7
Imports ....................................................................................................................................... 41 14.2 10.4 9.6 9.7 7.5 7.2 13.4 15.6 17.0 15.0 25.0 25.3Goods .................................................................................................................................... 42 17.2 12.6 7.0 12.5 7.5 7.9 13.1 18.0 19.8 17.3 25.1 28.5Services ................................................................................................................................. 43 –.2 –1.1 24.7 –3.8 8.1 3.5 15.3 3.2 1.5 2.2 24.3 7.2
Government consumption expenditures and gross investment ........................................... 44 8.8 –4.0 1.0 –.3 –.4 –5.2 2.1 7.4 –.2 .1 –.2 4.1
Federal ....................................................................................................................................... 45 14.6 –11.9 –.2 –5.0 –.6 –16.4 7.8 9.1 –2.1 –5.6 –5.7 8.7National defense .................................................................................................................... 46 15.4 –19.1 –.6 –1.9 –3.2 –16.4 6.1 11.6 –3.0 –7.8 –11.8 11.0Nondefense ............................................................................................................................ 47 13.0 6.8 .7 –11.4 5.3 –16.3 11.5 4.0 –.3 –.8 8.3 4.1
State and local ........................................................................................................................... 48 5.2 1.3 1.8 2.7 –.2 2.0 –1.1 6.5 1.0 3.6 3.1 1.6
NOTE.—Fixed-weighted quantity indexes shown in this table are calculated using the detailed composition of outputin 1992 as weights for each aggregate and component.