national innovation systems in the eu · introduction methodology findings final...
TRANSCRIPT

Introduction Methodology Findings Final remarks Bibliography References
National Innovation Systems in the EU
Maria SavonaJoint work with Tommaso Ciarli and Ariel L. Wirkierman
Science Policy Research Unit (SPRU), University of Sussex
XII Annual Conference Fondazione Edison and Accademia dei Lincei
Rome, Accademia Nazionale dei Lincei
The ISIGrowth Project is funded by the European Union Horizon 2020

Introduction Methodology Findings Final remarks Bibliography References
Structure of the talk
B The appeal of the NIS framework and...
B ..the need for empirical grounding: what we do.
B Is there such a thing as a European Innovation System?
B No, there is not: A map of the European Technology Clubs and what’sbehind them.
B Industrial and Innovation Policy Challenges

Introduction Methodology Findings Final remarks Bibliography References
What is a NIS?
Interacting Firms
�Institutions� (B): PolicyPolicy Organisation/process
Policy regime/orientation
S & T Organisations
�Institutions� (A):Social, Political, &
Cultural Context
Markets &Demand
Innovation
EconomicSocialEnvironmentalPolitical
Impacts/Effects
Inputs
‘Social’ technologies and innovation systems (Nelson, 2007) Performance, Inputs, Outputs and Outcomes/Impacts

Introduction Methodology Findings Final remarks Bibliography References
The influential concept of National Innovation System
B Highlights the complexity of national characteristics that explaineconomic performance (but no theoretical grounding)
B Each component of NIS might be a potential instrument for publicpolicy (private sector, public-private links, local and nationalgovernment, battery of instruments)
B The very notion of a successful pathway to catch up (‘one size fits all’)is nonsensical (but very few empirical grounding, (Castellacci andArchibugi, 2008; Castellacci and Natera, 2013; Fagerberg and Srholec,2008))

Introduction Methodology Findings Final remarks Bibliography References
Is there such a thing as a European Innovation System?
B We empirically unravel the latent dimension of NIS, rank countries alongthese and ground the micro-level sources of countries’ differences
B There are several European ‘Technology Clubs’
B Some NIS clusters have interesting patterns that disprove the theory andchallenge policy

Introduction Methodology Findings Final remarks Bibliography References
Empirically grounding a map of European TechnologyClubs
B Starting from 2014 micro-aggregated Eurostat CIS data
B Actors: Private firms, government, public institutions - Activities:investments strategies, cooperation, innovation performance
B NIS Dimensions: Firm efforts and demand; cooperations (private, public,domestic, foreign); firm performance; Public support
B Country rankings in NIS dimensions
B Country clustering in NIS dimensions
B Map of the European NIS ’Clubs’
Introduction Methodology Findings Final remarks Bibliography References
26 Countries included in the analysis
Austria (AT), Belgium (BE), Bulgaria (BG), Cyprus (CY), CzechRepublic (CZ), Germany (DE), Denmark (DK), Estonia (EE), Greece(EL), Spain (ES), Finland (FI), France (FR), Croatia (HR), Hungary(HU), Ireland (IE), Italy (IT), Lithuania (LT), Latvia (LV), Netherlands(NL), Norway (NO), Poland (PL), Portugal (PT), Romania (RO),Sweden (SE), Slovenia (SI) and Slovakia (SK).

Introduction Methodology Findings Final remarks Bibliography References
33 Variables included in the analysisSelectedvariablesof/derivedfromtheCommunityInnovationSurvey2014Ed.(CIS-2014)usedinthepaper:
#Variable FactorAnalysis VariableLabel FirmType IndicatorShortDescription Unit Indicatorfulldescription(derivedfromEUROSTAT)
1 INNO_PPANPP_LARMAR_EU Innovativefirmsalldimensions Largestmarket:EU % Enterprisesforwhichthelargestmarketintermsofturnoveris:EU/EFTA/EU-candidates2 INNO_PPANPP_LARMAR_LREG Innovativefirmsalldimensions Largestmarket:Local/Regional % Enterprisesforwhichthelargestmarketintermsofturnoveristhelocal/regionalmarket3 INNO_PPANPP_LARMAR_NAT Innovativefirmsalldimensions Largestmarket:National % Enterprisesforwhichthelargestmarketintermsofturnoveristhenationalmarket4 INNO_PPANPP_ENMRG_YES Innovativefirmsalldimensions Firmmerged/tookover % Enterprisesthathavemergedwith/takeoveranotherenterprise5 INNO_PPANPP_GP_YES Product/Processinnovativefirms Firmpartofenterprisegroup % Enterprisesthatarepartofanenterprisegroup6 INNOACT_EXPTOT14_ENT_POPU14 Product/Processinnovativefirms R&Dexpenditureperfirm EUR/NR Averagetotalinnovationexpendituresin2014perfirm7 INNOACT_RRDEX14_PC Product/Processinnovativefirms ShareofexternalR&D %ofTIE ShareofexpendituresinexternalR&Din2014overtotalinnovationexpenditures8 INNOACT_RRDIN14_PC Product/Processinnovativefirms Shareofin-houseR&D %ofTIE Shareofexpendituresinin-houseR&Din2014overtotalinnovationexpenditures9 INNOACT_EXPTOT14_C Product/Processinnovativefirms Manufacturing/AggregateR&D %ofTIE Shareoftotalinnovationexpendituresin2014inManufacturing10 INNOACT_ROEK14_PC Product/Processinnovativefirms Acquisitionofexternalknowledge %ofTIE Shareofexpendituresinacquisitionofexternalknowledgein2014
11 INNOACT_C01 Product/Processinnovativefirms Cooperationwithintheenterprisegroup % Enterprisesco-operatingwithotherenterpriseswithintheenterprisegroup12 INNOACT_COEUR_YES Product/Processinnovativefirms CooperationwithEUpartners % Enterprisesengagedininnovationco-operationwithapartnerinEU/EFTA/EU-candidates13 INNOACT_CONAT_YES Product/Processinnovativefirms CooperationwithNationalpartners % Enterprisesengagedinanytypeofinnovationco-operationwithanationalpartner14 INNOACT_COCNIN_YES Product/Processinnovativefirms CooperationwithChina/India % Enterprisesengagedinanytypeofinnovationco-operationwithapartnerinChinaorIndia15 INNOACT_COUS_YES Product/Processinnovativefirms CooperationwiththeUS % Enterprisesengagedinanytypeofinnovationco-operationwithapartnerinUnitedStates16 INNOACT_C02 Product/Processinnovativefirms Cooperationwithcompetitors,samesector % Enterprisesco-operatingwithcompetitorsorotherenterprisesofthesamesector17 INNOACT_C031 Product/Processinnovativefirms Cooperationwithprivateclients/customers % Enterprisesco-operatingwithclientsorcustomersfromtheprivatesector
18 INNOACT_FUNGMT Product/Processinnovativefirms FundingfromCentralGovernment % Enterprisesthatreceivedfundingfromcentralgovernment19 INNOACT_C032 Product/Processinnovativefirms Coop.withpublicsectorclients/customers % Enterprisesco-operatingwithclientsorcustomersfromthepublicsector20 INNOACT_C06 Product/Processinnovativefirms Cooperationwithuniversities/HEI % Enterprisesco-operatingwithuniversitiesorotherhighereducationinstitutions21 INNOACT_C09 Product/Processinnovativefirms CooperationwithGvt/ResearchInst. % Enterprisesco-operatingwithGovernment,publicorprivateresearchinstitutes22 INNOACT_FUNLOC Product/Processinnovativefirms FundingfromLocal/RegionalAuth. % Enterprisesthatreceivedfundingfromlocalorregionalauthorities23 TOTAL_PUBDOM Totalfirms DomesticProcurement % Enterpriseswithprocurementcontractfordomesticpublicsector24 TOTAL_PUBFINRQ Totalfirms Foreignproc.req.innovationactivities % Enterpriseswithprocurementcontractforforeignpublicsector/innovationactivitiesrequired25 TOTAL_PUBFOR Totalfirms ForeignProcurement % Enterpriseswithprocurementcontractforforeignpublicsector
26 INNO_PROPAT Innovativefirms Applicationforapatent % Enterprisesthatappliedforapatent27 INNO_PROTM Innovativefirms Registrationofatrademark % Enterprisesthatregisteredatrademark28 INPDT_NEWFRM_YES Productinnovativefirms Turnoverfromporductsnewtofirm % Enterprisesintroducedneworsignificantlyimprovedproductsthatwereonlynewtothefirm29 INPDT_NEWMAR_YES Productinnovativefirms Turnoverfromporductsnewtomarket % Enterprisesintroducedneworsignificantlyimprovedproductsthatwerenewtothemarket30 INPCS_INPSNM0 Processinnovativefirms Processinnovationnewtofirm % Enterprisesthathaveintroducedprocessinnovationnotnewtothemarket31 INPCS_INPSNM1 Processinnovativefirms Processinnovationnewtomarket % Enterprisesthathaveintroducedprocessinnovationnewtothemarket32 INONG_ENT_POPU14 Firmswithongoinginnovation Ongoinginnovationactivities % Enterpriseswithon-goinginnovationactivitiesonly33 INNO_TURN_EMP Innovativefirms Turnoverperemployee EUR/EMP Totalturnoverin2014peremployee
References:%(percentages)areexpressedinrelationtothetotaloffirmsofthecorrespondingfirmtypeNR:number;EUR:eurosatcurrentprices;EMP:employees;%ofTIE:percentageofTotalInnovationExpenditure;%ofTurnover:percentageoftotalfirmturnoverInnovativefirmsalldimensionscorrespondstofirmtypeINNO_PPANPP:Productand/orprocessinnativeenterprisesandorganisationand/ormarketinginnovativeenterprisesSource:OwnelaborationbasedonEUROSTATCIS2014Database
GovernmentRoleand
PublicSectorPolicies
FirmInnovationOutputs
FirmInnovationInputsandDemandSources
CooperationLinks

Introduction Methodology Findings Final remarks Bibliography References
NIS Dimensions
Factor 1: Innovation Investments and Demand sources
Panel(A)Firminnovationinputs&demandconditions CountryRankingacrossfactors:(factorloadings) iMarket iFirmStr iRD Mean RankCode Label iMarket iFirmStr iRD AT 5 3 12 6.5 7INNO_PPANPP_LARMAR_EU Largestmarket:EU 0.972 -0.186 BE 3 10 4 5.7 5INNO_PPANPP_LARMAR_LREG Largestmarket:Local/Regional 0.843 0.255 BG 21 25 18 21.5 23INNO_PPANPP_LARMAR_NAT Largestmarket:National 0.690 0.224 0.104 CY 18 8 25 16.7 17INNO_PPANPP_ENMRG_YES Firmmerged/tookover 0.977 CZ 16 16 10 14.1 13INNO_PPANPP_GP_YES Firmpartofenterprisegroup 0.770 0.168 DE 4 4 7 4.9 3INNOACT_EXPTOT14_ENT_POPU14 R&Dexpenditureperfirm 0.446 0.621 DK 13 9 1 7.9 8INNOACT_RRDEX14_PC ShareofexternalR&D 0.923 EE 22 19 17 19.4 22INNOACT_RRDIN14_PC Shareofin-houseR&D 0.120 0.264 0.565 EL 6 14 24 14.3 14INNOACT_EXPTOT14_C Manufacturing/AggregateR&D -0.133 0.555 ES 17 20 6 14.6 15INNOACT_ROEK14_PC Acquisitionofexternalknowledge 0.158 FI 12 7 5 8.1 9SSloadings 2.180 2.005 1.916 FR 7 6 3 5.4 4ProportionVar 0.218 0.201 0.192 HR 11 12 22 14.8 16CumulativeVar 0.218 0.418 0.610 HU 23 21 8 17.7 18
IE 1 5 14 6.4 6Factorsdictionary IT 8 11 16 11.5 10
iMarket Mainsourceofdemand LT 15 17 26 19.1 20iFirmStr Firmownershipstructure LV 25 24 23 24.0 25iRD R&Dintensityandcomposition NL 14 13 9 12.1 11
NO 2 2 11 4.8 2Testofthehypothesisthat3factorsaresufficient. PL 24 23 19 22.1 24Thechisquarestatisticis11.58on18degreesoffreedom. PT 19 18 20 19.0 19Thep-valueis0.868 RO 26 26 21 24.5 26Wedonotrejectthenullhypothesisthat3factorsaresufficient SE 10 1 2 4.4 1todescribethecorrelationstructurebetweenmanifestvariables SI 9 15 13 12.3 12
SK 20 22 15 19.1 21

Introduction Methodology Findings Final remarks Bibliography References
NIS Dimensions
Factor 2: Geography and Type of Cooperation strategies
Panel(B)Firmcooperationlinks CountryRankingacrossfactors:(factorloadings) cEURNAT cUSCNIN cCCC Mean RankCode Label cEURNAT cUSCNIN cCCC AT 3 8 6 5.3 6INNOACT_C01 Cooperationwithintheenterprisegroup 0.876 0.259 -0.146 BE 1 5 7 3.6 2INNOACT_COEUR_YES CooperationwithEUpartners 0.836 BG 25 23 24 24.1 24INNOACT_CONAT_YES CooperationwithNationalpartners 0.958 -0.163 0.177 CY 16 11 10 13.0 13INNOACT_COCNIN_YES CooperationwithChina/India 0.806 0.138 CZ 14 14 18 14.9 16INNOACT_COUS_YES CooperationwiththeUS 0.907 DE 17 15 12 15.3 17INNOACT_C02 Cooperationwithcompetitors,samesector 0.152 0.794 DK 9 3 9 7.0 7INNOACT_C031 Cooperationwithprivateclients/customers 0.271 0.338 0.502 EE 12 13 11 12.1 11SSloadings 2.469 1.712 0.961 EL 13 18 2 12.3 12ProportionVar 0.353 0.245 0.137 ES 20 22 19 20.5 21CumulativeVar 0.353 0.597 0.735 FI 4 2 1 2.7 1
FR 7 9 21 10.7 10Factorsdictionary HR 19 17 14 17.3 18
cEURNAT LinkstoEUandnationalpartners HU 21 19 17 19.5 20cUSCNIN LinkstoChina,India,US IE 8 4 20 9.2 8cCCC Linkstocompetitors,clients,customers IT 22 25 22 23.0 23
LT 11 16 16 13.8 14Testofthehypothesisthat3factorsaresufficient. LV 23 21 23 22.3 22Thechisquarestatisticis3.65on3degreesoffreedom. NL 5 7 3 5.3 5Thep-valueis0.302 NO 2 6 4 3.8 3Wedonotrejectthenullhypothesisthat3factorsaresufficient PL 24 24 26 24.4 25todescribethecorrelationstructurebetweenmanifestvariables PT 18 20 13 17.6 19
RO 26 26 25 25.8 26SE 6 1 5 4.1 4SI 10 10 8 9.6 9SK 15 12 15 14.0 15

Introduction Methodology Findings Final remarks Bibliography References
NIS Dimensions
Factor 3: Public Innovation policies
Panel(C)Governmentinnovationpolicies CountryRankingacrossfactors:(factorloadings) gGvtFCo gLRFDoPr gForPr Mean RankCode Label gGvtFCo gLRFDoPr gForPr AT 3 4 2 3.0 3INNOACT_FUNGMT FundingfromCentralGovernment 0.781 BE 2 2 1 1.7 1INNOACT_C032 Coop.withpublicsectorclients/customers 0.572 0.261 BG 26 24 20 23.9 25INNOACT_C06 Cooperationwithuniversities/HEI 0.846 0.137 CY 20 14 11 16.1 18INNOACT_C09 CooperationwithGvt/ResearchInst. 0.957 CZ 13 16 17 14.8 15INNOACT_FUNLOC FundingfromLocal/RegionalAuth. 0.202 0.775 -0.183 DE 5 6 22 9.7 8TOTAL_PUBDOM DomesticProcurement 0.932 0.162 DK 11 11 10 10.7 10TOTAL_PUBFINRQ Foreignproc.req.innovationactivities 0.35 0.625 EE 16 18 8 14.5 14TOTAL_PUBFOR ForeignProcurement 0.119 0.886 EL 12 10 18 13.0 13SSloadings 2.738 1.491 1.326 ES 15 15 23 17.1 19ProportionVar 0.342 0.186 0.166 FI 1 3 3 2.0 2CumulativeVar 0.342 0.529 0.694 FR 10 7 16 10.8 11
HR 21 8 14 15.8 17Factorsdictionary HU 23 17 19 20.4 22
gGvtFCo Fund.Gvt/Coop.HEI/ResearchInst. IE 9 1 12 7.7 6gLRFDoPr Local/Reg.Fund./Dom.Procurement IT 17 20 24 19.6 21gForPr ForeignProcurement LT 18 12 4 12.8 12
LV 24 23 21 23.0 23Testofthehypothesisthat3factorsaresufficient. NL 6 21 9 10.7 9Thechisquarestatisticis7.75on7degreesoffreedom. NO 4 5 6 4.8 4Thep-valueis0.355 PL 22 25 26 23.8 24Wedonotrejectthenullhypothesisthat3factorsaresufficient PT 14 19 15 15.6 16todescribethecorrelationstructurebetweenmanifestvariables RO 25 26 25 25.3 26
SE 8 9 5 7.5 5SI 7 13 7 8.6 7SK 19 22 13 18.2 20

Introduction Methodology Findings Final remarks Bibliography References
NIS Dimensions
Factor 4: Innovation Performance
Panel(D)Firminnovationouptuts CountryRankingacrossfactors:(factorloadings) oRadPat oIncrPcs oOng oPtvty Mean RankCode Label oRadPat oIncrPcs oOng oPtvty AT 2 6 17 10 7.2 6INNO_PROPAT Applicationforapatent 0.672 0.243 BE 1 5 3 3 3.0 1INNO_PROTM Applicationforatrademark 0.876 0.133 BG 22 19 15 26 20.5 22INPDT_NEWMAR_YES Turnoverfromporductsnewtomarket 0.855 0.113 -0.204 0.16 CY 16 3 26 13 13.0 12INPDT_NEWFRM_YES Turnoverfromporductsnewtofirm 0.923 0.142 CZ 12 14 8 21 13.5 15INPCS_INPSNM0 Processinnovationnewtofirm 0.756 DE 8 2 1 12 5.6 3INPCS_INPSNM1 Processinnovationnewtomarket 0.686 -0.163 0.299 DK 15 18 10 4 13.2 14INONG_ENT_POPU14 Ongoinginnovationactivities 0.924 0.111 EE 25 26 12 20 22.3 23INNO_TURN_EMP Turnoverperemployee 0.118 0.886 EL 14 10 20 14 13.7 16SSloadings 1.970 1.912 1.035 0.924 ES 21 20 7 11 16.6 17ProportionVar 0.246 0.239 0.129 0.116 FI 5 4 11 7 6.0 4CumulativeVar 0.246 0.485 0.615 0.730 FR 7 12 9 6 8.8 9
HR 20 16 25 24 20.3 21Factorsdictionary HU 19 21 14 17 18.4 20
oRadPat RadicalProd.Innov./PatentApp. IE 9 1 23 1 7.4 7oIncrPcs Incr.Prod./Rad.Proc.Innov. IT 11 17 5 9 11.6 10oOng Ongoinginnovation LT 17 13 19 25 17.4 18oPtvty Productivity LV 23 22 24 22 22.7 25
NL 6 11 6 8 7.9 8Testofthehypothesisthat4factorsaresufficient. NO 4 7 4 2 4.6 2Thechisquarestatisticis3.73on2degreesoffreedom. PL 24 24 22 18 22.6 24Thep-valueis0.155 PT 13 8 16 15 12.3 11Wedonotrejectthenullhypothesisthat4factorsaresufficient RO 26 25 18 23 23.8 26todescribethecorrelationstructurebetweenmanifestvariables SE 3 15 2 5 7.0 5
SI 10 9 21 19 13.1 13SK 18 23 13 16 18.4 19

Introduction Methodology Findings Final remarks Bibliography References
Country rankings in NIS Dimensions
Ranking differences in pairs of dimensions:Innovation Inputs to Outputs

Introduction Methodology Findings Final remarks Bibliography References
Country rankings in NIS Dimensions
Ranking differences in pairs of dimensions:Cooperation to Inputs

Introduction Methodology Findings Final remarks Bibliography References
Country rankings in NIS Dimensions
Ranking differences in pairs of dimensions:Cooperation to Outputs

Introduction Methodology Findings Final remarks Bibliography References
Country rankings in NIS Dimensions
Ranking differences in pairs of dimensions:Public policy to Inputs
Introduction Methodology Findings Final remarks Bibliography References
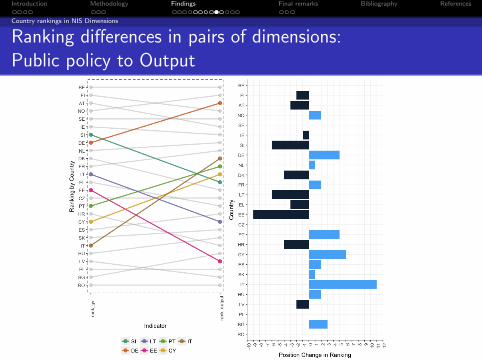
Country rankings in NIS Dimensions
Ranking differences in pairs of dimensions:Public policy to Output

Introduction Methodology Findings Final remarks Bibliography References
Country rankings in NIS Dimensions
Ranking differences in pairs of dimensions:Public policy to Cooperation

Introduction Methodology Findings Final remarks Bibliography References
Country Clustering in NIS Dimensions
Factor Correlation across countries

Introduction Methodology Findings Final remarks Bibliography References
Country Clustering in NIS Dimensions
What characterise NIS across countries?
B Little crowding out in public-private links and more additionality
B Close cooperation with firms, with public institutions and high domesticprocurement associated with radical innovation (rather than internalR&D)
B International cooperation for innovation associated to high productivityperformance

Introduction Methodology Findings Final remarks Bibliography References
Country Clustering in NIS Dimensions
Country clustering according to factor rankings
CountryclusteringaccordingtofactorrankingsClustermeansbyfactoriMarket iFirmStr iRD cEURNAT cUSCNIN cCCC gGvtFCo gLRFDoPr gForPr oRadPat oIncrPcs oOng oPtvty
Frontier 7 5.5 5.5 8.0 2.5 5.3 4.5 2.5 3.5 3.0 3.0 5.5 8.8 5.5Nordic 2 12.3 7.7 4.0 6.7 3.7 5.7 8.3 13.7 8.0 8.0 14.7 6.0 5.7G7_IE 3 4.0 5.0 8.0 10.7 9.3 17.7 8.0 4.7 16.7 8.0 5.0 11.0 6.3
LargeMed_CE 1 13.7 15.7 10.7 18.7 20.3 19.7 15.0 17.0 21.3 14.7 17.0 6.7 13.7
Med_Balkan 4 13.0 14.0 21.7 14.5 15.3 10.5 15.3 12.7 11.5 15.0 9.8 21.2 18.3North_CE 5 21.7 20.7 13.3 16.0 14.7 14.3 19.3 19.0 13.3 20.7 23.3 13.0 17.7CEE 6 24.0 24.5 20.3 24.5 23.5 24.5 24.3 24.5 23.0 23.8 22.5 19.8 22.3
AT 7 CZ 1 CY 4 BG 6BE 7 ES 1 EL 4 LV 6FI 7 IT 1 HR 4 PL 6NO 7 LT 4 RO 6
PT 4DK 2 SI 4NL 2SE 2 EE 5
HU 5DE 3 SK 5FR 3IE 3
CEEFrontier
Nordic
G7_IE
LargeMed_CE
Med_Balkan
North_CE

Introduction Methodology Findings Final remarks Bibliography References
European NIS Clubs
Key findings: The European Technology Clubs
There is not such a thing as a European Innovation Systems. Clubs of NISthat are
B Top-Notch: Frontier Small (AT,BE,FI,NO). Highest rank in mostfactors, high public support complemented by high public private links;high innovation performance
B Demand-pulled: G7+IE (DE,FR,IE). Highly ranked in demand and innational public procurement and local public support
B Linear R&D-based: North Small (DK,NL,SE). High private investmentin R&D, coupled with high (not the highest in NL) public support andoutward cooperation
B Coping: Large Med + CZ (IT,ES,CZ). Above av inno inputs andoutputs, relatively low public support, relatively less cooperative
B ”Spoiled” Under-performing: Small Med + LT (HR,CY,EL,LT,PT,SI).Specular with the Coping, above av public support but low in innooutputs
B Embryonic: CEE and CE+EE (EE,HU,SK,BG,PO,RO). Rank low in allfactors

Introduction Methodology Findings Final remarks Bibliography References
Implications for policy and research
What to do? Challenges for policy
B Speeding up the process of moving away from unfavourable initialconditions
B Timing of public intervention with respect to the actual absorptivecapacity of firms
B Identification of technological opportunities that fit with the (initial)industrial structure
B To be able to favour technological upgrading and structural change
B Coordination with macro economic policy: favourable demand conditionsare a must for the achievement of the above

Introduction Methodology Findings Final remarks Bibliography References
Implications for policy and research
Our research agenda
B From Technological Clubs to varieties of growth regimes looking atemploymemt and distributional polarisation
B How are these countries facing the employment emergency posed by thefourth industrial revolution?
B An empirically grounded devised concerted vision of innovation,industrial policy and fiscal policies.
B European Technology clubs within Global Value Chains

Introduction Methodology Findings Final remarks Bibliography References
Bibliography
Castellacci, F. and Archibugi, D. (2008). The technology clubs: Thedistribution of knowledge across nations. Research Policy, 37(10):1659 –1673. Special Section Knowledge Dynamics out of Balance: KnowledgeBiased, Skewed and Unmatched.
Castellacci, F. and Natera, J. M. (2013). The dynamics of nationalinnovation systems: A panel cointegration analysis of the coevolutionbetween innovative capability and absorptive capacity. Research Policy,42(3):579 – 594.
Fagerberg, J. and Srholec, M. (2008). National innovation systems,capabilities and economic development. Research Policy, 37:14171435.