national institute of standards and … national institute of standards and technology center for...
TRANSCRIPT
�
1
NATIONAL INSTITUTE OF STANDARDS AND TECHNOLOGY
CENTER FOR NEUTRON RESEARCH
NG3 AND NG7 30-METER SANS INSTRUMENTS
DATA ACQUISITION MANUAL
June 2002

�
�
2
Table of Contents Page 1. GENERAL INFORMATION. . . . . . . . . . . . . . . . . . . . . . . . . . . . . . . . . . . . . . . 3 1.1 Description of the Instruments. . . . . . . . . . . . . . . . . . . . . . . . 3 1.2 Data Acquisition System . . . . . . . . . . . . . . . . . . . . . . . . . . . . . 4 1.3 Data Files Convention . . . . . . . . . . . . . . . . . . . . . . . . . . . . . . 4 1.4 Choosing an Instrument Configuration. . . . . . . . . . . . . . . . . . 5 1.5 The SASCALC Program . . . . . . . . . . . . . . . . . . . . . . . . . . . . . . 6 1.6 Measurements Required for a SANS Experiment. . . . . . . . . . 6 2. DATA ACQUISITION SOFTWARE. . . . . . . . . . . . . . . . . . . . . . . . . . . . . . . . . . 7 2.1 The SANS Data Acquisition Program. . . . . . . . . . . . . . . . . . . . . . 7 2.1.1. Getting Started . . . . . . . . . . . . . . . . . . . . . . . . . . . . . . . . . . 7 2.1.2. “Single Run/Setup Run Params” Menu . . . . . . . . . . . . . . . . 8 2.1.3. “Manual Operations” Menu . . . . . . . . . . . . . . . . . . . . . . . . . 8 2.1.4. “Automatic Data Collection” Menu . . . . . . . . . . . . . . . . . . . . 9 2.1.5. The “Data” Screen . . . . . . . . . . . . . . . . . . . . . . . . . . . . . . . . 10 2.2 The Run STATUS Program and the SANS LOG File . . . . . . . . . . 10 2.3 On-line Data Display using SANS IMAGE on the Power Macintosh 10 3. OPERATING PROCEDURES . . . . . . . . . . . . . . . . . . . . . . . . . . . . . . . . . . . 11 3.1 Logging On/Off . . . . . . . . . . . . . . . . . . . . . . . . . . . . . . . . . . . . . 11 3.2 Aligning the Sample Stage . . . . . . . . . . . . . . . . . . . . . . . . . . . . 11 3.3 Beamstop Alignment and Beam Center Location. . . . . . . . . . 12 3.4 Count Rate Limit for the 2D Detector. . . . . . . . . . . . . . . . . . 12 3.5 Transmission Measurements . . . . . . . . . . . . . . . . . . . . . . . . . 13 4. THINGS TO REMEMBER/USEFUL ADVICE . . . . . . . . . . . . . . . . . . . . . . . . . 13 5. COMPUTERS IP ADDRESSES . . . . . . . . . . . . . . . . . . . . . . . . . . . . . . . . . . . 14 6. REFERENCES/SUGGESTED READING . . . . . . . . . . . . . . . . . . . . . . . . . . . . . 15 MISCELLANEOUS INFORMATION Sample Preparation Laboratories, Guest Offices . . . . . . . . . . . . . . . . . . . 15 The NIST SANS Internet Homepage: http://www.ncnr.nist.gov/programs/sans/ Setup for use of lenses or Prisms at NG3 . . . . . . . . . . . . . . . . . . . . . . . . 16 TABLES Table 1: 30 m-SANS Instruments Characteristics. . . . . . . . . . . . . . . . . . 17 Table 2: Wavelength Dependence of the Monitor Count Rates . . . . . . . . . 18 Table 3: Wavelength Calibration . . . . . . . . . . . . . . . . . . . . . . . . . . . . . . . . 18 Table 4: Wavelength Dependence of the Attenuators' Transmission. . . . . 19 Table 5: List of Available Absolute Standards . . . . . . . . . . . . . . . . . . . . . . 20 Table 6: Wavelength Dependence of the Standards' Transmission. . . . . . . 20 FIGURES Figure 1: Schematic of the 30 m SANS Instruments Figure 2: Schematic of the Data Acquisition Hardware Figure 3: Collimation Geometry Figure 4: Neutron Flux at the Sample Position Figure 5: Flow Chart of the Main Data Acquisition Program, SANS

�
The post-sample flight path consists of a long cylindrical section that forms a vacuum enclosure for a large 2D position-sensitive neutron detector. The high count-rate area detector (64 cm x 64 cm with 0.5 cm spatial resolution) moves along rails that are parallel to the neutron beam (inside the cylindrical vessel). The sample-to-detector distance can be varied continuously from 1.3 m to 13.2 m for NG3-SANS and from 1.0 m to 15 m for NG7-SANS. In addition, the detector moves transversely to the beam direction (by up to 30 cm) to extend the Q range covered at a given detector distance. The resulting Q range of the instrument extends approximately from 0.015 to 6 nm-1 for both instruments.
3
1. GENERAL INFORMATION 1.1 Description of the Instruments The 30 meter SANS instruments were developed jointly by NIST and the National Science Foundation (NG3-SANS) and NIST/Exxon and U. of Minnesota (NG7-SANS). The instruments are located in the guide hall of the NIST Center for Neutron Research (NCNR) facility, where they are installed at the end of straight neutron guides (6 x 6 cm2 guide section for Neutron Guide-3 or NG3, and 5 x 5 cm2 guide section for NG7). Designed to cover a wide Q range, from 0.015 to nearly 6 nm-1, they are suitable for examining structural features in materials ranging from roughly 0.6 to 600 nm. Before entering the neutron guide, neutrons from the 20 MW NCNR source are slowed down in the cold neutron moderator, or cold source (liquid hydrogen), which is cooled to approximately 20 K by cold helium refrigeration. The temperature distribution in the cold source is somewhat inhomogeneous, but the neutron spectrum leaving the moderator can be reasonably approximated by a Maxwellian distribution. Neutron and gamma filters (Be and Bi respectively) are used (in guide cuts) to eliminate epithermal neutrons and core gamma radiation from the beam. These are cooled down to liquid nitrogen temperature. An optical filter has been installed on the NG3 neutron guide in order to replace these filters. This filter eliminates the direct line-of-sight to the cold source and therefore gamma and non-cold neutron backgrounds. The layouts of the instruments are shown in Figure 1. Neutrons from the cold source are monochromated mechanically by a helical channel velocity selector with variable speed and pitch which enables both the mean wavelength (0.5 to 2.0 nm) and wavelength spread (0.10 to 0.30 FWHM) to be varied. The monochromated beam is collimated using circular pinhole irises in a 15 m long evacuated presample flight path. Incorporated into this flight path are eight 1.5 m long neutron guide sections that can be easily shifted in or out of the beam to vary the beam divergence and flux on sample by changing the effective source-to-sample distance from 3.5 m to 15 m in 1.5 m increments. The presample flight path boxes also contain beam-defining apertures and "empty" positions. The presample collimation is set by choosing the number of guides to be inserted in the beam. The guide motion software then inserts a "source" defining aperture just after the last guide and keeps all remaining downstream positions empty. A polarized beam option is available on the NG3-SANS instrument; a polarizer has been installed in presample flight box #7. It is based on a transmission (Mezei) polarizing cavity, which reflects one spin state and transmits the other spin state. The 1.2 m long polarizing device consists of silicon wafers coated with Fe/Si supermirror aligned to form a V inside a neutron guide section coated with copper. This device polarizes large section neutron beams (4cmx5cm) over a wavelength range of 5A to 15A. Immediately following the polarizer a spin flipper is available to rotate the neutron spin orientation from the longitudinal (along the beam) direction to a transverse one. This flipper requires a vertical coil current of 1.42 Amp and a horizontal current of 2.7 Amp (power supply boxes are mounted on the electronics rack). Because of the polarizer location, instrument configurations with 6 guides inserted in the beam cannot be used. The instrument has two choices of sample location. (1) A permanently installed sample chamber (that can be used in air, under vacuum or under inert gas environment) with a computer-controlled sample stage. (2) A 60 cm diameter sample table, between the presample flight path and the sample chamber, which can accommodate large pieces of apparatus such as a Couette or Plate/Plate shear cell, a high-field electromagnet, a large cryostat, etc. Multi-specimen sample holders with temperature control (-10 to 200oC) are available for use in the sample chamber. The sample table consists of a Huber stage with computer-controlled rotation and a manual translation stage for alignment. This location can only be used after major reconfiguration, which should be performed at the beginning of the allocated beam time. It consists in the following procedure. (1) Closing the two gate valves in order to vent the areas containing the neutron windows. (2) Removing the presample flight path extension containing the flexible bellow outside of the tenth box as well as the aperture holder extension located inside the sample chamber. (3) Relocating the large silicon neutron window from inside the chamber to outside of it. (4) Evacuating both the sample chamber and the short presample extension. (5) Finally opening the gate valves. Because this procedure is complicated, it is be performed by the instrument scientist in charge (local contact).

The appropriate Q range can be chosen for a given sample by keeping in mind the relations, �
4
� Qmin ~ 2π/Rmax Qmax ~ 2π/Rmin
The last presample flight path box of the NG3-SANS instrument contains two MgF2 focussing devices: (1) a 30-lens system used with 8.4 A neutrons and (2) a 7-lens/2-prism system that focusses 17.2 A neutrons as well as corrects for gravity fall of the neutrons. These devices can be inserted into the beam and used with the following high-resolution instrument configuration: wavelength spread=14%, collimation=0 guide, neutron source diameter=1.43 cm, sample aperture diameter=1.59 cm, sample-to-detector distance=13.17 cm, beamstop size=2.54 cm. The 7-lens/2-prism system improves the minimum Q limit down to 0.0048 nm-1 (=0.00048 A-1). 1.2 Data Acquisition System Figure 2 includes a schematic diagram of the SANS data acquisition system hardware. Data from the 2D detector are stored in CAMAC-based histogramming memory modules under the control of a Microvax 4000 series computer. Data are written to a file at the end of each counting interval (set by the user to be usually 10 minutes) and sent across the network to a Power Macintosh computer every 20 seconds (default value which can be changed by the user) for real-time imaging. The system includes a menu-driven user interface with on-line help. The SANS data acquisition and reduction computer is linked to other computers, terminals and printers in the building via an Ethernet connection. A PC running Windows (called “SANS Acquisition” PC) is used as a terminal connected (hardwired RS232 connection) to the data acquisition Microvax. Data acquisition is performed from this terminal only. Another PC running Windows (called “SANS Reduction” PC) is also used as a terminal on the Microvax as well as on the Microsoft Network Neighborhood. Both of these PCs run specific Macros to initiate the terminal emulator software TeraTerm (Shortcut icons are included on the desktop). The Macro on the SANS Acquisition PC also opens a Log Screen where run information is recorded. SANS data files are stored on the Microvax hard drive and also transferred to a storage computer (charlotte.ncnr.nist.gov) that can be reached from any PC using the Network Neighborhood and from any Macintosh using Apple Share. A Power Macintosh is used for on-line imaging of the SANS data (using the SANS IMAGE program). It also contains a few useful applications such as Claris Draw that could be used to cut and paste SANS images on the same page before printing them on the Color DeskJet. Spyglass could be used for plotting of the 2D data. 1.3 Data Files Convention The raw data are stored in discrete binary files with the name convention XXXXXNNN.SA?_INI_AMMM, where XXXXX is a 5-character project name, NNN is a user-defined run number which is automatically incremented at the end of each run, SA? identifies the SANS instrument used (SA4 for the NG3-SANS and SA2 for the NG7-SANS instruments), INI are the user's initials and AMMM is a unique run identifier used for archival purposes. Raw data are automatically archived to a magneto-optical disk on a daily basis. It is recommended to keep the same name XXXXX for the same set of measurements. The last X is often chosen as an alphabetical increment to differentiate data taken on the same project at different times (for example, in a project on ionomers, project names could be IONOA, IONOB, etc). The raw data file consists of a data header record followed by the data record. The header contains the run parameters such as wavelength, count interval, sample name, etc., which were entered at the time of data collection from the "Single Run/Setup Run Params", "Manual Operations" and "Automatic Data Collection" menus (see sections 2.1 for further details). The raw data themselves are never modified; only raw data headers can be edited. SANS data can be reduced from any PC or Macintosh running IGOR with the SANS Macros installed as described in the SANS Data Reduction Tutorial manual and on our web site (http://www.ncnr.nist.gov/programs/sans). A folder containing the SANS data is created on the charlotte computer for each of the user accounts (NG3SANS10 for example). 1.4 Choosing an Instrument Configuration The 30 m instruments, with their variable wavelength and wavelength resolution and their adjustable pre- and post-sample flight paths, offer a wide range of possible configurations. The proper configuration for a given sample depends upon many factors. These are the sample size and density, the size of the scatterers (which determines the desired Q range) in the sample, the neutron scattering and absorption cross-sections of the sample, the available beam time, the number of samples to measure, etc.

SASCALC should be used to experiment with different combinations of the above parameters in order to obtain the desired Q range while maintaining the highest possible neutron intensity on the sample. This program has no control whatsoever on the instrument and is used only to "simulate" various possible instrument configurations. For this reason, it can be run from any terminal. �
1.6 Measurements Required for a SANS Experiment
5
where Rmax and Rmin are the largest and shortest scale lengths in the sample respectively. The beam apertures and distances which determine the instrument resolution (and hence the minimum Q) as well as the intensity on the sample are indicated in the diagram in Figure 3. Collimation is achieved by adjusting the incident flight path using the neutron guide sections that can be moved into the beam in order to bring the effective neutron source closer to the sample. Figure 4 shows the neutron flux at the sample position as a function of wavelength. As more neutron guides are moved into the incident flight path, the neutron flux increases at the expense of Qmin. The values of Qmin for a given configuration can be computed from Qmin = (2π/λ) ϑmin where ϑmin (see Figure 3) is the nominal value of the scattering angle at which the measured incident beam intensity would go to zero. Thus, ϑmin = (B/2 + a3/2 )/L2 where a3 is the FWHM (5 mm) of the detector spatial resolution function and B is the penumbra beam size at the detector, given by B = (L2/L1) (a1 + a2 ) + a2 . Therefore, Qmin = (π/λ){(a1+a2)/L1 + (a2+a3)/L2}. Here a1, a2 and a3 are the source aperture, sample aperture and detector cell diameters respectively, and L1 and L2 are the source-to-sample and sample-to-detector distances. In general, long flight paths rather than long wavelengths should be used first to reduce Qmin. One should always make sure that the beam spot on the detector is smaller than the beamstop size. Neutron intensity values can be calculated for different configurations from one known value assuming that the intensity (n/sec) on the sample, Is, scales as (a1a2/L1)2 for a given wavelength λ. These intensity values
can be extrapolated to longer wavelengths knowing that Is ~ (1/λ4) at long wavelengths when the wavelength spread, ∆λ/λ, is fixed. Flux can be increased by inserting guides (i.e., shortening L1) at the expense of Qmin. It can also be increased by relaxing the wavelength resolution (∆λ/λ) at the expense of ∆Q. When tighter resolution is desired even though the detector is at its farthest distance from the sample (and all guides have been moved out of the beam) then wavelength is increased. 1.5 The SASCALC Program The SASCALC program calculates the Q-range and neutron intensity (n/sec) on the sample for a specific instrument configuration. The beam size is also determined and a beamstop size is suggested. A warning is issued if the beam size becomes too large for any of the available beamstops. An attenuation factor is also displayed for transmission measurements. The required input parameters are: - sample aperture diameter (cm) - number of guides in incident flight path - sample area (Huber table or sample chamber) - sample-to-detector distance (cm) - detector offset (cm) - neutron wavelength (A) - wavelength spread (FWHM).
A complete SANS experiment requires not only the measurement of the scattering pattern for a sample but also the measurement of the empty cell and blocked beam. These last two measurements are

- "Manual Operations" and - "Automatic Data Collection". �
6
�
The initial instrument configuration should be performed using the "Single Run/Setup Run Params" and "Manual Operations" screens. The "Single Run/Setup Run Params" option (see section 2.1.2) is used mainly to set up as well as start a single run and to record run parameters which will appear in the data file header. The "Manual Operations" option (see section 2.1.3) is used to change/initialize neutron wavelength, detector or sample holder parameters, presample flight path collimation, to choose/move
repeated for each instrument configuration. If the sample is not contained in a cell, an empty beam replaces the empty cell. The sample transmission must also be measured for each different neutron wavelength used. In order to put the data on an absolute cross section scale (units of cm-1), an attenuated direct beam or an absolute standard sample must be measured under identical conditions. The incoherent scattering from a plexiglass or water sample must also be measured and used to correct for detector non-uniformities. Such sensitivity runs (from plexiglass) require good statistics and are performed periodically by the staff and made available to users (file PLEX_DATE_NG?.DIV where NG? Stands for NG3 or NG7 and MMMYY stands for JUN02 for example). These sensitivity files can be found on the Vax drive (directory [NG3SANS0.MMMYY] or [NG7SANS0.MMMYY]) as well as on the charlotte computer (NG3 and NG7 Files folder). According to counting statistics, the noise level of an experiment decreases with the square root of the measurement time. In any experiment, a judicious choice must be made between number of samples, environmental conditions, counting statistics and the available beam time for the measurement. The counting times needed for different experiments vary widely depending upon how strongly the samples scatter and what kind of information is sought. Total detector counts per measurement vary widely depending on scattering strength. Radially averaged data consist roughly of 100 data points. To achieve a 1% noise level, a total of 1x10⁶ detector counts is needed if the intensity is evenly distributed radially. At the beginning of an experiment, an estimate is made of the time needed for a given measurement and a typical sample is measured to check count rates. It is recommended to split individual runs into small (e.g., 10 minute) intervals so that a file is saved and a printout of the total monitor and total detector counts is made at the end of each one of these intervals. Within the same run, changes in monitor counts (from prefactor to prefactor) points to changes in the neutron source or beam filter, whereas changes in total detector counts indicates changes in the sample. Background correction runs such as from the empty cell, blocked beam, solvent, or control samples should normally have measurement times of the same length as the sample runs. Only when the sample's weakest scattering (often at the largest Q of interest) is much larger than that of the strongest background run should the background runs be made shorter in length than the sample runs. Please, remember to fill out the logbook for each instrument configuration used. This information will be useful to you as well as to NCNR staff at later times. 2. DATA ACQUISITION SOFTWARE 2.1 The SANS Data Acquisition Program The SANS program is a menu-driven user interface, with on-line help, and controls all aspects of the data acquisition process. Through a series of menus and tables, the user can execute the chosen instrument configuration (set neutron wavelength, detector position, number of guides, etc.) and setup a single run or a series of runs under computer control. A dedicated Power Macintosh computer performs the task of on-line imaging of the 2D data. Data from the 2D detector are automatically transferred to the Power Macintosh where they can be viewed using the SANS IMAGE program. Thus, only two programs, SANS on the Microvax 4000 and SANS IMAGE on the Power Macintosh, need to be run in order to collect SANS data and view 2D data images in real time. A schematic of the structure of the SANS user interface is shown in Figure 5. Brief HELP lines are provided at the bottom of each screen and a more extensive help file can be accessed from most screens by pressing the F15 function key. The active function keys (F9 - F20) for each screen, are described just above the HELP lines. Data collection functions are only available at the instrument control (SANS Acquisition) terminal. The SANS program must be started from a SANS user account. Log into the assigned account (see section 3.1) and type SANS to display the "Main" menu on the screen. Data reduction is performed using the IGOR software package with the SANS Macros installed (refer to the IGOR SANS Data Reduction Tutorial manual). 2.1.1 Getting Started The "Data Acquisition" menu has three options: - "Single Run/Setup Run Params",

�
7
beamstops, to determine the beam monitor and transmission detector count rates, to control temperature, magnetic field, to setup beam attenuation, etc. After the initial setup is completed, the "Automatic Data Collection" option can be used to set up and start a series of runs. All three "Data Acquisition" options are explained in more detail below. The raw data file header incorporates the parameters entered from the "Single Run/Setup Run Params" and "Manual Operations" screens into a single record, which precedes the raw data record in the file. Some of these run parameters are essential in the data reduction procedure while others are used more for informational purposes. The required run parameters are listed below: - sample label (it is important to have the right descriptive label) - sample name (5-character maximum) - sample run number (user-defined, automatically incremented) - count interval (10 minute intervals are recommended) - number of count intervals per run - sample-to-detector distance - neutron wavelength - sample location (sample chamber or sample table, holder and position number) - beam center location (X,Y) in pixel coordinates. It is useful to include the following run parameters as well since they are needed if resolution corrections must be made to the data and/or for record keeping: - source aperture size - sample aperture size - number of guides in incident flight path (which determines the source-to-sample distance) - beamstop number (which determines the beamstop size) - wavelength resolution (FWHM) - temperature - magnetic field, etc. 2.1.2 "Single Run/Setup Run Params" Menu Choosing "Single Run/Setup Run Params" displays the first setup screen. The two available screens should be used to initialize all run parameters before starting a single run or a series of runs. The first screen contains the parameters that are most often changed between runs. The Sample Label line may be edited. Toggle between INSERT and OVERSTRIKE mode by pressing F16. The edit mode is active for the Sample Label only. Use the arrow keys to move between the various parameters. The parameters on the upper portion of the screen represent some active parameters. A parameter is designated as active if it can be changed automatically between runs. Currently recognized active parameters are: Run Label, Run Number, Sample Label, Counting Interval, Number of Intervals per Run, Neutron Wavelength and Wavelength Spread, Detector Position and Offset, Number of Guides, Sample Position, Beamstop Size and Position (X and Y), Beam Center (in pixel coordinates), Attenuator No, Sample Temperature, Hold Time and Set Point, Magnetic Field or Electric Field. While the first five parameters are always active, the others must be enabled or disabled through the "Manual Operations" menu as described below. The second "Single Run/Setup Run Params" screen is displayed when F18 is pressed. This screen is reserved for run parameters that are less often changed. Data collection may not be initiated from this screen. No other functions can be accessed from this screen except F20 which must be pressed to return to the first "Single Run/Setup Run Params" screen. A single run can be started at the instrument control (SANS Acquisition PC) terminal only, by pressing F12 from the first "Single Run/Setup Run Params" screen. During the data collection, output is printed to the "Data" screen as well as to the Log Screen, a status file and a file on disk. At the same time, the raw data are transferred to the Power Macintosh, where they can be viewed on-line using the SANS IMAGE program. At the end of each run, the data file is also sent to the charlotte computer. For more information on the "Data" screen, see section 2.1.5. Data collection can be PAUSED or RESUMED using the F11 key or STOPPED using the F10 key. Mapping parameters for the data being transferred to the Power Macintosh can be changed by pressing F13, which displays the "Mac Display Control" screen. The current instrument configuration can be saved to a file by pressing F9 then Filename (use, for example, IONOA_1G13M.CFG for 1 guide/13m detector distance as part of the IONOA project). The configuration can be recalled from this file into the “Run List” in the “Automatic Data Collection” screen (use F16 to load a configuration file). 2.1.3 "Manual Operations" Menu If "Manual Operations" is selected from the SANS program menu, a menu describing run parameters that can be initialized or changed, is displayed. When a menu item is selected, a screen dedicated to the run parameter is entered. The following "Manual Operations" menus can currently be accessed:

�
�
8
- "Change/Initialize Sample POSITION/ANGLE" is used to initialize or move the sample stage or to rotate the sample table. Choosing between the two possible sample positions (sample chamber or Huber table) is performed using F13. Another sample holder is selected using F14 and the sample position is initialized through F9. - "Select/Move BEAMSTOP" is used to translate (X-Y) the beamstop carriage or select a different beamstop (#1=1", #2=2", #3=3", #4=4”). - "Change/Initialize DETECTOR DISTANCE/OFFSET" is used to move the area detector along the beam direction (F17) and/or perpendicular to it by as much as 30 cm (F18). - "Change/Initialize WAVELENGTH" is used to change neutron wavelength (F17) and the tilt angle or wavelength spread (F18). F14 is used to initialize the current wavelength. Note that a voltmeter is available for checking the encoder zero tilt angle position (reads about 3 Volts). - "Change/Initialize ATTENUATION" is used to insert or change beam attenuation by inserting thicker attenuators (choice of 9 attenuators between 1/8” and 9/8”). MCU # 16 displays the attenuator No (No 0 corresponds to no attenuation at all, and No 10 corresponds to maximum attenuation). - "Change/Initialize COLLIMATION" is used to move guides into the beam. Note that the source aperture diameter is equal to 50 mm except if no guide is in the beam, in which case it is can be one of three choices (14.3 mm, 38 mm or 25.4 mm). Due to the location of the polarizer in the 7th box on the NG3 instrument only, one cannot insert 6 guides in the beam. - "Change/Initialize Sample TEMPERATURE" is used to set the target temperature, with an allowed error and hold time (remember that after 10 hold times, the software will give up trying to reach the target temperature). F14 is used to select another temperature controller. - "Change/Initialize Sample Magnetic FIELD" is used to apply current to a magnet. F13 is used to switch to the superconducting magnet. - "Monitor Count/Transmission MEASUREMENT" is used to obtain a monitor count rate. - "Change/Initialize VOLTAGE on Sample" is used to change an applied 0-10V voltage through the CAMAC DAC module (lowest connector which corresponds to Register No 0). - "Change/Initialize Timeslice INTERVAL". This option requires an external synchronization of the data acquisition electronics (input to RESCAN on the Router Module). F14 is used to select another timeslice interval.
Press the first letter of the CAPITALIZED words to move quickly to that selection. The "Manual Operations" menu should be accessed while setting up a run in order to designate run parameters as active and/or to initialize or change run parameters. This menu is disabled when data collection is in progress. The current instrument configuration is saved to a file (.CFG extension) by pressing F9 from the “Single Run/Setup Run Params” or “Manual Operations” menus. Supply a file name at the prompt (default = DEFAULT.CFG). A warning will be issued if the configuration results in a beamsize that is incompatible with the selected beamstops. The configuration can be recalled from this file into the “Run List” in the “Automatic Data Collection” screen. 2.1.4 "Automatic Data Collection" Menu The "Automatic Data Collection" screen is accessed from the "Data Acquisition" menu. This screen is used to initialize or edit a master "run list" which controls the automatic data collection. The default active parameters, plus those which can be set through the "Manual Operations" menu, appear in the “Run List” menu which contains 99 lines, each representing one run setup. One can scroll through the menu using the arrow keys or by pressing the numbers 1, 2, 3, or 4 to jump to runs 10, 20, 30 or 40 as instructed in the HELP display at the bottom of the screen. Press 0 to return to the top of the run list. Available Run Manipulation function keys: - F16 to load a configuration from a file (you will be shown a list of all *.CFG files in your directory) - F9 to print the full or partial run list - F14 to initialize the entire run list - F17 to duplicate a run or a block or runs - F18 to remove (cut) a run or block of runs - F19 to insert (paste) a run or block of runs - F12 to start data collection. - F20 to return to the previous (higher level). This command is used throughout the SANS program. For a more complete description of each of these function keys, access the extended HELP file by pressing F15 from the "Automatic Data Collection" screen. The "run list" should be "initialized" once at the beginning of an experiment and again if the instrument configuration is changed. An old configuration can be loaded from a file using the F16 key. To edit an individual run, highlight it in the menu and press RETURN. The parameters are then displayed fully. Move through the display with the arrow keys and edit the appropriate parameters. Press F20 to return to the

�
9
"Run List" menu. Note that only those parameters that have been designated as active can be edited at this time. Parameters can only be activated from the "Manual Operations" menu. The run list is executed sequentially, at the instrument control terminal only, by pressing F12 from the "Automatic Data Collection" screen. During the data collection, output is printed to the Data Screen as well as to the Log Screen, a status file and a file on disk. At the same time, the raw data are transferred to the Power Macintosh, where they can be viewed on-line using the SANS IMAGE program. For more information on the "Data" screen, see section 2.1.5. Data collection can be "paused" or "resumed" using the F11 key or "stopped" using the F10 key. After pressing F11, data acquisition pauses only after finishing the current counting interval. Mapping parameters for the data being transferred to the Power Macintosh can be changed by pressing F13, which displays the "Mac Display Control" screen. If data collection is "stopped" before all runs in the list are executed, it can be started again (for the selected runs in the “Run List") by pressing F12 again. 2.1.5 The "Data" Screen The "Data" screen is a limited function screen that becomes active once data collection has started. This screen can only accept output from the data collection program and a limited set of instructions, i.e., "Pause/Resume" (F11), "Stop" (F10) and "Mac Display Control" (F13). Output to the "Data" screen includes information such as sample name, counting time per interval, number of counting intervals, monitor counts per interval, total detector counts per interval and sample temperature if active, etc. Pressing ANY OTHER KEY will return control to the “Setup” screen. If data collection is already in progress, pressing F12 from the “Setup” screen will display the “Data” screen again. All but the "Manual Operations" screens can be accessed while data collection is in progress. 2.2 The Run STATUS Program and the SANS LOG File The status of the current run can be monitored from any terminal by typing STATUS from any SANS user account. As a run is being executed, the same run information that is printed at the instrument terminal is written to a status file. If a single run has been started from the "Single Run/Setup Run Params" screen, only the information from that run will be in the file. However, if a series of runs has been started from the "Automatic Data Collection" screen, the file contains the information from all executed runs, including the current run. Thus, the current run information will be at the end of the file. Scroll through the pages in the file (by hitting RETURN) until the desired run information is displayed. A quick inspection of this printout (which can also be obtained, even remotely, on the screen by typing STATUS) can alert you to problems either in the neutron source (changes in beam monitor count rate) or in the sample (changes in detector count rate). A detailed log of your measurement session is kept in a file in your account named SANS_DDMMMYY.LOG where DDMMMYY is the starting date for your experiment. Unlike the file accessed by typing STATUS, this file (for example SANS_28AUG97.LOG) is not overwritten. It can be typed or edited and constitutes a permanent record for your experiment. A hard copy can be obtained by typing Print_Log at the Microvax prompt (use the SANS Reduction PC for example). 2.3 Online Data Display using SANS IMAGE on the Power Macintosh The SANS IMAGE program on the Power Macintosh is used for on-line imaging of the data at the instrument. When data collection is begun from either the "Single Run/Setup Run Params" or "Automatic Data Collection" screens, the data are automatically transferred to the default Power Macintosh node, MACNG3 or MACNG7, at the instruments. The SANS IMAGE program must be running on the Power Macintosh and the IMAGE1.SANS file must be opened in order to view the image. If the SANS IMAGE program is already running, select the SANS (Realtime) option from the "File" menu. Then click OK and choose IMAGE1.SANS from the list, if necessary, and finally click on OK to open the file. The transfer interval time and mapping type (log or linear scale) parameters may be changed, once data collection has begun, through the "Mac Display Control" on the main console Microvax terminal. Mapping parameters can be changed by the user. In order to reduce traffic on the network, data transfer to the Power Macintosh is stopped if no key is pressed for 5 minutes and data transfer is resumed when any key is pressed. This default time can be changed by clicking on the Set Timeout option from the "Options" Power Macintosh menu. Data from a stored file may also be displayed using the VIEW command on the Microvax at another terminal. The selected file will be transferred to the SANSNG3 or SANSNG7 folder on the default Power Macintosh (MACNG3 or MACNG7). The "Import SANS" command from the "File" menu displays the image of the transferred file. If the on-line image file, IMAGE1.SANS is left opened, it continues to update as a background window. Real-time data transfer to the Mac can be manually paused/resumed by choosing “Pause Updating” or “Resume Updating”. The data will still be transferred to the image file on the Power Macintosh and the updated image can be seen at any time by choosing the “Resume Updating” from the “Options” menu. For further details regarding the VIEW command, see the "SANS Data Reduction and Imaging Software" manual. If the real time data transfer from the Vax to

�
�
10
the Power Mac computers happens to stop (image does not update anymore), use the Data Reduction PC terminal to type: $SUBMIT/QUE=DATA$XFER CSANS:SANSNG?XFER (where ? should be 3 for NG3 and 7 for NG7). In order to make sure that the submitted batch job is running type $SHOW SYS (you will see the letter B for Batch job on the rightmost column). 3. OPERATING PROCEDURES 3.1 Logging On/Off A SANS user account is assigned to each user by an instrument scientist. The user accounts are named NGnSANSm where n=3 or 7 and m is 1-40. Each user account requires a password (which can be chosen by the user) during the setup procedure. SANS user accounts have 90-day expiration dates so they cannot be used as permanent storage areas for SANS data. To log into a SANS user account from the SANS Acquisition PC, click on the SANS Acquisition icon to run a Macro that opens a Microvax window. At the Username: prompt, type in the SANS user account name. At the Password: prompt, type in the chosen password, which will not be echoed at the terminal. Logins to the Microvax computers can be performed from inside NIST over the network by using a terminal emulator (for example TeraTerm from the PC or NCSA from the Mac). TELNET to sans3.ncnr.nist.gov, IP number 129.6.120.14 for NG3-SANS or sans2.ncnr.nist.gov, IP number 129.6.120.12 for NG7-SANS. From outside of NIST, however, the only way to connect across the fire wall is by going through a secure shell connection to the gate.ncnr.nist.gov computer. A password to this computer is assigned to every SANS user account. 3.2 Aligning the Sample Stage A low power laser is available for rough centering of the sample translation stage and is located outside of the ninth presample flight path box. The laser beam is reflected by a silicon wafer which is transparent to neutrons (and is oriented at 45 degrees from the beam direction). Turn on the power supply of the laser located on the lower leg of the presample flight path box. At the sample stage, align the stage so that the laser spot is centered in the middle sample holder position. The vertical adjustment is made by turning the large knob on the (Labjack) stage itself. The horizontal alignment is made by turning the crank outside of the chamber. When the crank is turned, the display on MCU#3 changes because an encoder is used on the sample position motor. For fine stage alignment, it is suggested that a double exposure Polaroid photograph be taken. To do that, two exposures are taken with and without the sample holder aperture making sure that the camera is not moved. For this procedure, the holder aperture must be smaller than the “overkill” aperture located in the chamber wall. The beam must be attenuated to achieve correct exposure of the film (for example, Attenuator No 6 or 7 is needed for 6A wavelength and zero degree velocity selector tilt angle). The photograph will show the outline of both apertures. Adjust the holder position to make both images concentric. Repeat the process to check the alignment. When the sample stage is aligned, turn MCU#3 to MANual, push the CLEAR button, then back to AUTomatic. Once the holder is aligned, the current for MCU#3 should be turned back on (AUTomatic position) and the motor controller position must be reinitialized. To do this, go to the "Manual Operations" menu (described in section 2.1.3 above), choose the "Change/Initialize Sample POSITION/ANGLE" option and press F9. If need be, move the cursor to any position in the window, and press F15 for on-line help. 3.3 Beamstop Alignment and Beam Center Location Place one of the strong forward scattering samples (e.g., Teflon kept at the instrument storage cabinet) in the sample holder and start data acquisition. After about 20 seconds, the image on the Power Macintosh display should reveal strong scattering around the beamstop. Stop this run before saving a data file and move the beamstop (X-Y motions) using the "BEAMSTOP" option of the "Manual Operations" menu (See section 2.1.3). Restart the data acquisition and note change in the scattering pattern. Repeat this procedure until the scattering image is symmetric around the beamstop. Note the final beamstop position in the logbook. A precise method of determining the beam center involves attenuating the neutron beam (Attenuator No 6 or 7 for 6A wavelength and zero degree VS tilt angle) and moving the beamstop X-coordinate away (-15 cm for example) from the beam location on the detector. Care must be taken to attenuate the beam before moving the beamstop out. The X-Y coordinates of the center of the data can be located using the wand (auto-outline) tool on the Power Macintosh (see Appendix B of the "SANS Data Reduction and Imaging Software" manual). 1) If measuring on the real-time image, IMAGE1.SANS, choose PAUSE UPDATING from the OPTIONS menu.

2) transfer reduced data to floppy disks or to a remote computer; � 3) empty and clean all sample cells provided by NIST;
11
packing list); 5) collect any used chemicals to be left behind for disposal and store in
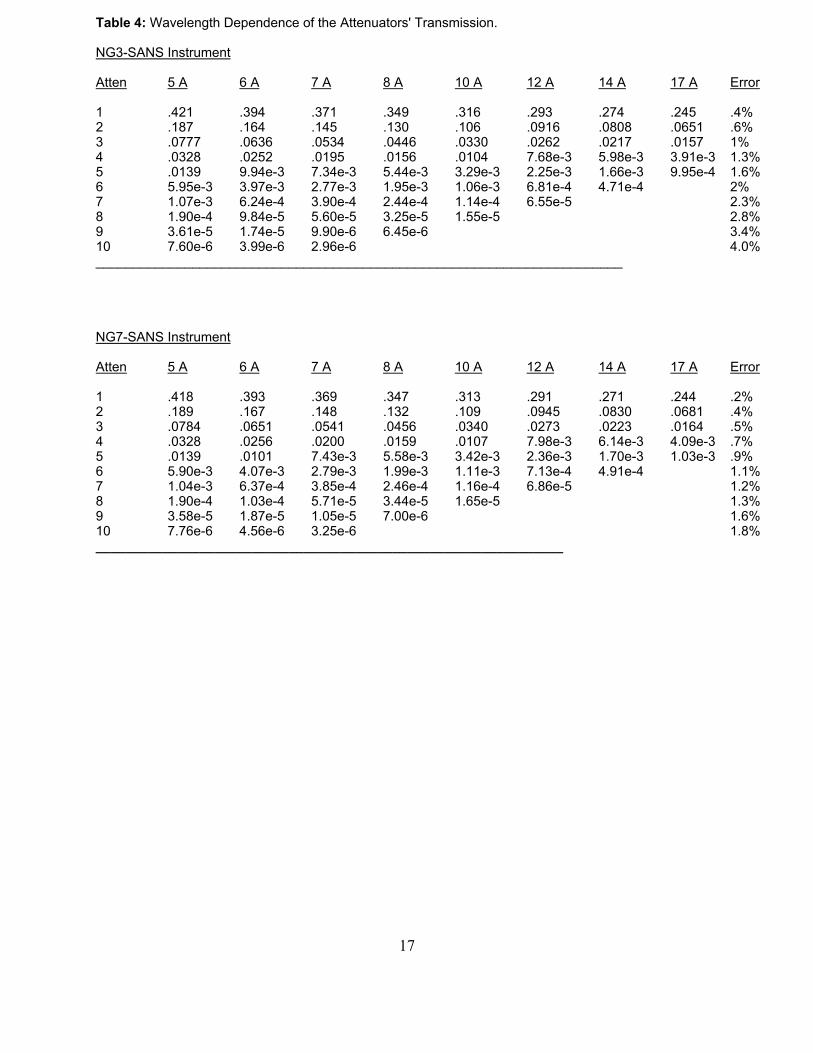
2) Double-click on the wand tool or select DENSITY SLICE from the OPTIONS menu to enable density slicing. A selection region, which can be moved, shrunk or stretched in the same manner as the entire color palette, appears in a red color within the LUT. Manipulate the selection region in the LUT window until the region of the data corresponds to the intensity contours surrounding the data center. Only the highlighted pixels will be included in the measurement. 3) Select MEASURE from the ANALYZE menu. 4) Read the X-Y coordinates by selecting SHOW RESULTS from the ANALYZE menu 5) Choose RESUME UPDATING from the OPTIONS menu if updating was paused. Note the beam center location in the logbook and enter it in the file header ("Single Run/Setup Run Params" F18 function). 3.4 Count Rate Limit for the 2D Detector Because the area detector can be permanently damaged by a prolonged exposure to a strong neutron beam, care must be taken to never expose the detector to the direct beam. The following guidelines should be observed in order to keep the detector count rate (which is monitored on the detector ratemeter at the instrument electronics rack) within safe levels. An automatic (secondary) beam shutter will close (and could be reset manually) if the total count rate on the detector exceeds the maximum value for the ratemeter settings. The secondary shutter is located between the velocity selector shield and the first presample-flight path box. The control for this automatic beam shutter is located in the electronics rack and consists of a module labeled ALARM CONTROL that has a small button at the top labeled RESET. When the button is pressed, the secondary shutter should swing out of the beam again. Be sure that you have reduced the beam intensity before attempting to reset the ALARM CONTROL module. For scattering measurements, where the intensity is widely distributed over the detector and the main beam is blocked by a beamstop, the total count rate should not exceed 30,000 cps. However, if the scattering is highly localized, for example, near the beamstop, then the count rate is kept lower by the data acquisition program (SANS). Count rates above these levels endanger the detector. The program checks to make sure that count rates do not go over 100 counts per cell for 12 cells, in which case the small shutter is closed, the next attenuator is put in and the run is restarted automatically. The attenuator number that is put into the beam is recorded in the header. A table of the attenuation factors is included in Table 4 at the end of this manual. The data acquisition software also resets the alarm module once a run is started. Detector count rates are also monitored in the main program for each detector cell during data acquisition so that the secondary beam shutter is also automatically closed if these levels are beyond preset limits. If this shutter is closed from the software, starting a new run is the only way to reopen it. 3.5 Transmission Measurements In order to measure sample transmission, the following method is used. One must attenuate the neutron beam using the "Change/Initialize ATTENUATION" menu from the "Manual Operations" screen. In order to find out what attenuator to use, run the SASCALC program or consult the Attenuators Transmission Table at the end of this manual. Then move the beamstop out (X-motion to -15 cm) using the "Select/Move BEAMSTOP" menu, and use the area detector to collect data (single run for one sample or series of runs for a set of samples). The sample transmission will be calculated internally by the IGOR program. The sample transmission is calculated as the ratio Ts = Is/Ie, where Is and Ie are the accumulated detector counts for the Sample and Empty beam intensities, respectively, whereas the empty cell transmission is the ratio Tc=Ib/Ie where Ib is the intensity for the empty cell (Blank). It is recommended to measure the standards transmissions even though these are tabulated at the end of this manual. 4. THINGS TO REMEMBER/USEFUL ADVICE Following are some things to remember when planning an experiment: - Notify your local contact in advance of any special requirements for your experiment. - Arrive in time to have all necessary training completed before your experiment begins. - Allow enough time after your experiment to: 1) finish reducing data;
4) package and address any supplies or equipment to be shipped (include a
suitable, labeled containers.

�
�
12
Other useful advice: - A SANS experiment is better performed by two to three researchers. - Load your samples in appropriate sample holders and check about your computer account. - Run the SASCALC program to decide on what instrument configuration to use. - Be prepared to spend a couple of hours for the initial instrument setup. - Develop the reflex of closing the beam shutter as soon as you get close to the sample stage in order to avoid any radiation exposure. - Having fixed the wavelength and wavelength spread, choose a good sample-to-detector distance for which the scattering varies appreciably over the area detector. - If you change the wavelength during an experiment, it may be necessary to realign the beamstop to compensate for the fall of the beam due to gravity (a 10 A neutron falls 1.6 cm in traveling 15 m). - Align the sample stage before aligning the beamstop. - Move-in the right-size beamstop and center it using a strong scatterer (Teflon). - Find the beam center (attenuate, move beamstop out, take short run). - Measure transmissions early in the experiment. - Fill-in as much of the data header as possible in order to avoid too much PATCHing later. - Take short monitor count rates from selected samples to get a feel for their scattering intensity. - When doing temperature scans, it is desirable to check reversibility (for example, scan going up and then down in temperature). - Reduce data as soon as it is collected in order to monitor data acquisition closely (one could quickly reduce even raw data without proper background subtractions). This could lead to changes in the data acquisition strategy or modification of the instrument configuration. - Make sure that you have taken all of the necessary runs (empties, standard, transmissions, etc) that will allow you to reduce your data before the end of your allocated beam time. - Because the instrument control system has been designed with user-friendliness in mind, one does not have to "babysit" the instrument more than necessary. Taking the required breaks will keep you fresh and alert and minimize chances for error. - It is advised to finish reducing your data before you leave. 5. COMPUTERS IP ADDRESSES Following are the IP addresses for the Microvax computers used with the 30 m SANS instruments: NG3 SANS Instrument: 129.6.120.14 sans3.ncnr.nist.gov NG7 SANS Instrument: 129.6.120.13 sans2.ncnr.nist.gov 6. REFERENCES/SUGGESTED READING G.D. Wignall, in "Encyclopedia of Polymer Science and Engineering, Vol 10", 2nd Edition, Mark, Bikales, Overberger, Menges, Editors, Wiley, New York (1987) "International Conference on Small Angle Scattering", Argonne, Oct. 26-29, 1987, J. Appl. Cryst. 21, 581-1009 (1988) V.F. Sears, "Neutron Scattering Lengths and Cross Sections", Neutron News 3, 26 (1992) C. Williams, "Small Angle Scattering from Solids and Solutions", in "Neutron and Synchrotron Radiation for Condensed Matter Studies. Vol 1, Theory, Instruments and Methods", Baruchel, Hodeau, Lehmann, Regnard, Schlinker Editors, Springer-Verlag (1993) C. Glinka, J. Barker, B. Hammouda, S. Krueger, J. Moyer and W. Orts, “The 30 m SANS Instruments at NIST”, J. Appl. Cryst. 31, 430 (1998)

�
13
MISCELLANEOUS INFORMATION: Sample Preparation Laboratories, Guest Offices, Etc Two sample preparation laboratories are available to SANS users in rooms E132 and E138. Basic laboratory needs (glassware, solvents, hoods, syringes, etc) as well as weighing balances are available in both laboratories. Various SANS sample holders are located in room E138. Other equipment is listed below: - Hot press (room E138) - Optical microscope (room E138) Office space is available for guest researchers in rooms E120 and E115. A telephone line for long distance calls is available in room E120 (Dial 9 then area code). Internet access with RJ45 plugs is also available in room E120. Coke and candy machines are located in room A133. A coffee room with refrigerator and a microwave oven for food use is located in room E110. THE NIST SANS INTERNET HOMEPAGE: http://www.ncnr.nist.gov/programs/sans/ This homepage gathers useful information for users. It contains: - NIST SANS Instruments describes the two 30m NIST-SANS instruments - NIST SANS Schedules contains the online schedules (for the NIST SANS instruments) - NIST SANS Equipment contains information about sample environments. - NIST SANS Scientists contains coordinates of SANS scientists (local contacts). - Information to SANS Users includes: How to Obtain Beam Time, How to Gain Access to the Neutron Scattering Facilties, How to Reserve Dosimeters, Local Area Hotels, Maps, Airport Shuttles, etc. - SANS Manuals/Tutorials available in the Adobe PDF format.

�
�
14
Setup for Use of Lenses or Prisms at NG3 A set of 30 MgF2 lenses and 7 lens / 2 prism set are installed in guide box #10. For the 30 lens configuration: SDD = 1317 cm A1 = 2.54 cm or 1.43 cm A2 = 5/8” = 1.59 cm L = 8.4 A ∆λ/λ = 0.15 1” beamstop Qmin = 0.0014 A-1 if well aligned For the 7 lens/2 prism configuration: SDD = 1317 cm A1 = 1.43 cm A2 = 5/8”=1.59 cm λ = 17.2 A ∆λ/λ = 0.15 1” beamstop Qmin = 0.00048 A-1 if well aligned Moving lenses or prisms into the beam 1) From any SANS account, type: RUN ASANS:TESTAM 2) The program will respond with: ENTER COMMAND: 3) Enter 10PR (reports the position of actuator 10) 4) Check to see if this corresponds to the empty position. 5) If not, re-zero the motor by entering: 10OSH1 (to set the reference edge at the home position) 10GH (to send the actuator to the home position) 10PZ (to set the current position to zero) 6) If actuator position is correct, Enter: 10D+10000 (to set the target position to 7 lens/2 prism) Or: (10D-1205000 is the 30 lens position) (10D-3465000 is the empty position) 7) 10G (to move the actuator to the target position) 8)Ctrl-C to exit the program 9) Be sure to move box 10 back to the empty position when your experiment is finished.

�
15
Table 1: 30 m SANS Instruments Characteristics. Source: neutron guide (NG3), 6 x 6 cm2 neutron guide (NG7), 5 x 5 cm2 Monochromator: mechanical velocity selector with variable speed and pitch Wavelength Range: variable from 0.5 to 2.0 nm Wavelength Resol.: 10 to 30% for ∆λ/λ (FWHM) Source-to-Sample 3.5 to 15 m in 1.5 m steps via insertion of Distance: neutron guide segments Sample-to-Det. Dist.: 1.3 to 13.2 m continuously variable for NG3 1.0 to 16 m continuously variable for NG7 Collimation: circular pinhole collimation Sample Size: 0.5 to 2.5 cm diameter Q range: 0.015 to 6 nm-1 Size Regime: 1 to 600 nm Detector: 64 x 64 cm2 He-3 position-sensitive proportional counter (0.5 cm resolution), ORDELA type NG3-SANS Special Features: Neutron polarizer in presample flight path box #7
Set of focussing MgF2 lenses and gravity-correcting prisms in presample flight path box #10 (Qmin=0.00048 A-1).
Ancillary Equipment: Automatic Multi-specimen Sample Changer with the following sample blocks are available: 9P: 9-Position Changer (Ambient Temperature), 7CB: 7 Position Circulating Bath (-10oC-90oC), 10CB: 10 Position Circulating Bath (-10oC-90oC), 7H: 7 Position Heating Block (Ambient to 200oC), 7HB: 7 Position Heating Block (Ambient to 300oC), 2H: 2 Position Heating Block (Very good temp accuracy), Other Pieces of Equipment include: BM: Big Magnet; SM: Small Magnet (0 to 2 Tesla), NSM: New Superconducting Magnet (0-9 Tesla), DI: Displex, Cryostat, OF: Old Furnace, NF: New Furnace (10 to 1800 K) BSC: Boulder Couette Shear Cell, MSC: Minnesota Plate/Plate Shear Cell, NPC: NIST Pressure Cell (0 to 1kBar, 25oC to 190oC) SE: Special Environment (user built special equipment).

�
�
16
Table 2: Wavelength Dependence of the Monitor Count Rates. Tilt Angle: 0 deg Tilt Angle: 0 deg Tilt Angle: -3 deg Tilt Ang: +3 deg Wavel. (A) NG3 Mon. Rate NG7 Mon. Rate NG3 Mon. Rate NG7 Mon. Rate 5 17,679 cps 56,256 cps 28,379 cps 6 52,651 19,867 67,415 32,222 7 55,661 20,095 70,293 31,600 8 55,878 18,056 70,008 28,670 10 50,079 12,819 64,994 20,783 12 41,909 8,989 57,651 14,285 14 33,771 5,941 48,572 9,552 16 26,743 3,835 40,100 6,440 18 21,227 2,482 32,914 4,371 20 16,890 1,633 27,151 2,970 Table 3: Wavelength Calibration for the Velocity Selectors. NG3 SANS Instrument +3 degree tilt (∆λ/λ=13.1%) λ(A)=3.603x10⁴/RPM + 0.704 0 degree tilt (∆λ/λ=14.3%) λ(A)=2.662x10⁴/RPM + 0.333 -3 degree tilt (∆λ/λ=26.4%) λ(A)=1.449x10⁴/RPM + 0.715 NG7 SANS Instrument +3 degree tilt (∆λ/λ=22%) λ(A)=1.345x10⁴/RPM + 0.500 0 degree tilt (∆λ/λ=10%) λ(A)=2.561x10⁴/RPM + 0.092 -3 degree tilt (∆λ/λ=9%) λ(A)=3.716x10⁴/RPM + 0.036 Note that the tilt angle trend for the NG7 instrument is opposite to that of NG3 because of the opposite Velocity Selector spinning direction.
�
17
Table 4: Wavelength Dependence of the Attenuators' Transmission. NG3-SANS Instrument Atten 5 A 6 A 7 A 8 A 10 A 12 A 14 A 17 A Error 1 .421 .394 .371 .349 .316 .293 .274 .245 .4% 2 .187 .164 .145 .130 .106 .0916 .0808 .0651 .6% 3 .0777 .0636 .0534 .0446 .0330 .0262 .0217 .0157 1% 4 .0328 .0252 .0195 .0156 .0104 7.68e-3 5.98e-3 3.91e-3 1.3% 5 .0139 9.94e-3 7.34e-3 5.44e-3 3.29e-3 2.25e-3 1.66e-3 9.95e-4 1.6% 6 5.95e-3 3.97e-3 2.77e-3 1.95e-3 1.06e-3 6.81e-4 4.71e-4 2% 7 1.07e-3 6.24e-4 3.90e-4 2.44e-4 1.14e-4 6.55e-5 2.3% 8 1.90e-4 9.84e-5 5.60e-5 3.25e-5 1.55e-5 2.8% 9 3.61e-5 1.74e-5 9.90e-6 6.45e-6 3.4% 10 7.60e-6 3.99e-6 2.96e-6 4.0% _______________________________________________________________________ NG7-SANS Instrument Atten 5 A 6 A 7 A 8 A 10 A 12 A 14 A 17 A Error 1 .418 .393 .369 .347 .313 .291 .271 .244 .2% 2 .189 .167 .148 .132 .109 .0945 .0830 .0681 .4% 3 .0784 .0651 .0541 .0456 .0340 .0273 .0223 .0164 .5% 4 .0328 .0256 .0200 .0159 .0107 7.98e-3 6.14e-3 4.09e-3 .7% 5 .0139 .0101 7.43e-3 5.58e-3 3.42e-3 2.36e-3 1.70e-3 1.03e-3 .9% 6 5.90e-3 4.07e-3 2.79e-3 1.99e-3 1.11e-3 7.13e-4 4.91e-4 1.1% 7 1.04e-3 6.37e-4 3.85e-4 2.46e-4 1.16e-4 6.86e-5 1.2% 8 1.90e-4 1.03e-4 5.71e-5 3.44e-5 1.65e-5 1.3% 9 3.58e-5 1.87e-5 1.05e-5 7.00e-6 1.6% 10 7.76e-6 4.56e-6 3.25e-6 1.8% _______________________________________________________________

�
�
18
Table 5: List of Available Absolute Standards __________________________________________________________________________ Standard Cross Section Thickness Rg Trans Q-Range Program
Name (cm-1) (mm) (A) @ 6A (A-1) _________ _____________ ________ ___ ____ _______ _________ Sil A1 25.7 1 30.8 .921 .02-.04 FIT Sil A2 27.9 1 30.8 .921 .02-.04 FIT Sil A5 23.7 1 30.5 .930 .02-.04 FIT Sil A6 22.3 1 31.1 .923 .02-.04 FIT Sil A7 22.4 1 30.8 .918 .02-.04 FIT Sil A8 23.7 1 30.8 .910 .02-.04 FIT Sil B1 56.6 1 58.0 .92 .01-.025 FIT Sil B2 54 1 58.3 .92 .01-.025 FIT Pol AS1 65.7 1 75.3 .43 .01-.03 FIT/RPA Pol AS2 63.8 1 76.1 .43 .01-.03 FIT/RPA Pol B1 220 1.53 110 .56 .005-.03 FIT/RPA Pol B2 220 1.53 110 .56 .005-.03 FIT/RPA Pol C2 650 1.53 195 .55 .003-.03 FIT/RPA Al-7 199 10.0 216 .003-.014 FIT __________________________________________________________________________ Use the FIT program (Guinier plot) for the Sil standards and FIT/RPA for the polymer standards. For the polymer standards, FIT/RPA yields a segment length of 6.7 A (polystyrene). Note that a wavelength standard (used to double-check the wavelength) is available; Silver Behenate has a peak in the SANS range at Q=0.1076 A-1 which corresponds to a d-spacing of 59 A. Table 6: Wavelength Dependence of the Standards' Transmission. _____________________________________________________________________________ Wavel. Sil A1 Sil B1 Pol AS1 Pol B1 Water Quartz (A) Sil A2 Sil B2 Pol AS2 Pol B2 Pol C2 1 mm Cell _____ ___ ____ ____ _____ ____ ______ _____ 5 .92 .93 .47 .59 .59 .52 .95 6 .92 .92 .43 .56 .55 .50 .95 8 .87 .90 .39 .50 .49 .45 .96 10 .86 .90 .36 .45 .42 .41 .96 12 .81 .88 .32 .39 .36 .38 .97 15 .73 .83 .28 .31 .28 .34 .97 ____________________________________________________________________________

�
19
FIGURES FOR THE DATA ACQUISITION MANUAL: Figure 1: Schematic of the30 m SANS instruments. The main difference in size between the two instruments is the sample-to-detector distance (13 m for NG3 and 15 m for NG7). Figure 2: Schematic of the data acquisition hardware. Figure 3: Collimation geometry. Figure 4a: Neutron Flux (n/cm2sec) at the sample position for the NG3-SANS instrument. Data are shown for 15% wavelength spread and 20 MW NCNR source power and correspond to 0 guide and 8 guides inserted respectively. Gain factors due to the new cold source and optical filter are also shown. Figure 4b: Neutron Flux (n/cm2sec) at the sample position for the NG7-SANS instrument. Figure 5: Flow chart of the main data acquisition program, SANS.

�
�
20
Figure 1: Schematics of the 30 m SANS instruments. The main difference in size between the two instruments is the sample-to-detector distance (13 m for NG3 and 15 m for NG7)

Figure 2: Schematics of the data acquisition hardware
�
21
Figure 3: Collimation Geometry

1000
10 4
10 5
10 6
10 7
4 6 8 10 12 14 16 18 20
Estimated F lux at S am ple for NG3 SANSV elocity S elector T ilt Angle = 0 (Dlam /lam =14%)
Flux (Ng=8, A1=5 cm)Flux (Ng=0, A1=3.8 cm)
W ave length (A) Figure 4a: Neutron Flux (n/cm2sec) at the sample position for the NG3-SANS instrument. Data are shown for 15% wavelength spread and 20 MW NCNR source power and correspond to 0 guide and 8 guides inserted respectively. Gain factors due to the new cold source and optical filter are also shown.
�
�
221000
10 4
10 5
10 6
10 7
4 6 8 10 12 14 16 18 20
Flux (Ng=0, A1=3.8 cm)
Flux (Ng=8, A1=5 cm)
W avelength (A)
4/29/02Estimated Flux at Sample for NG7 SANS. Velocity Selector tilt angle = 0 degrees (Dlam/lam = 11 % ).
Figure 4b: Neutron Flux (n/cm2sec) at the sample position for the NG7-SANS instrument.

Figure 5: Flow Chart of the main data acquisition program, SANS.
�
23