national monitoring program (nmp) long-term monitoring projects to document water quality...
TRANSCRIPT

National Monitoring Program (NMP)
Long-Term Monitoring Projects to Document Water Quality Improvements
from BMPs
Jean Spooner, Laura Szpir, Garry Grabow, Dan Line, Deanna Osmond,
NCSU
Don Meals and Steve Dressing, Tetra Tech, Inc
In cooperation withIn cooperation with
NMP Project Personnel NationwideNMP Project Personnel Nationwide
U.S. EPAU.S. EPA

28 projects in U.S. (24 completed monitoring) “Long-term”
BMPs, land use tracking, and water quality monitoring
More projects wanted
USEPA Section 319 National Monitoring Projects (NMP)
Corsica River, MD
Kickapoo Creek, IL
Stamp Sands, MI
Project summaries http://ncsu.edu/waterqualityNWQEP NOTES2008 Draft Summary Report

Section 319 National Monitoring Program (NMP) Projects
Successes & Recommendations:
1. Experimental Design
2. Lag Time
3. Nutrient Management & Nutrient Mass Balance
4. Livestock Exclusion/Fencing & Grazing Management
5. Stream & Riparian Restoration
6. LID & Better Site Design
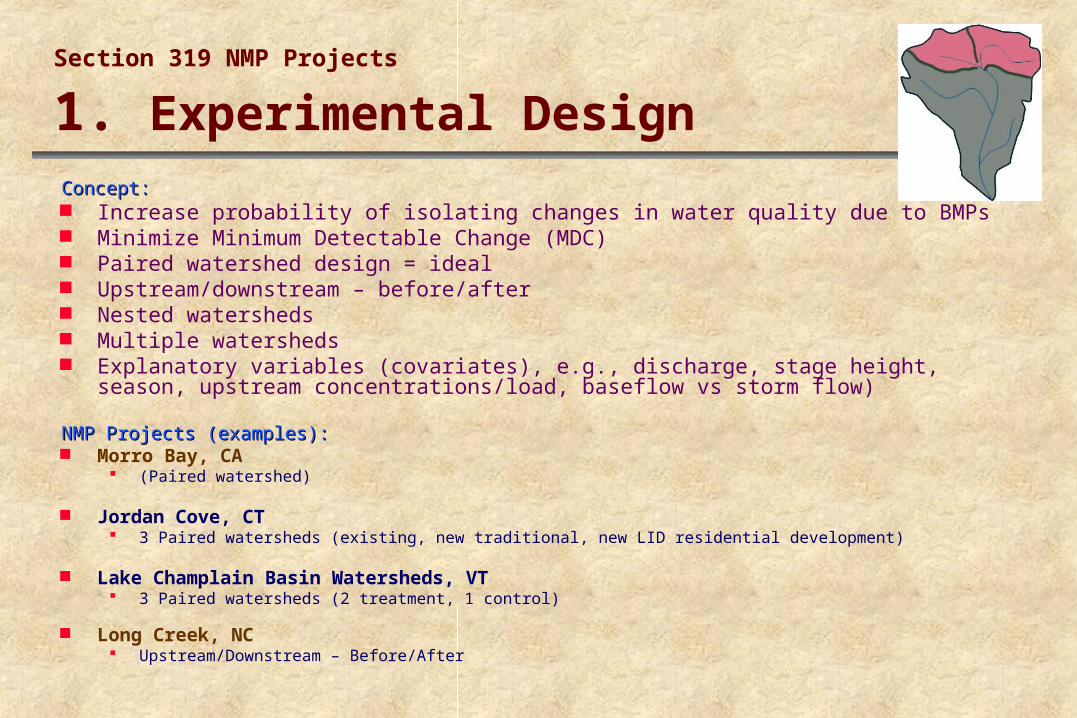
Section 319 NMP Projects 1. Experimental DesignConcept:Concept: Increase probability of isolating changes in water quality due to BMPs Minimize Minimum Detectable Change (MDC) Paired watershed design = ideal Upstream/downstream – before/after Nested watersheds Multiple watersheds Explanatory variables (covariates), e.g., discharge, stage height, season, upstream
concentrations/load, baseflow vs storm flow)
NMP Projects (examples): NMP Projects (examples): Morro Bay, CA
(Paired watershed)
Jordan Cove, CT 3 Paired watersheds (existing, new traditional, new LID residential development)
Lake Champlain Basin Watersheds, VT 3 Paired watersheds (2 treatment, 1 control)
Long Creek, NC Upstream/Downstream – Before/After
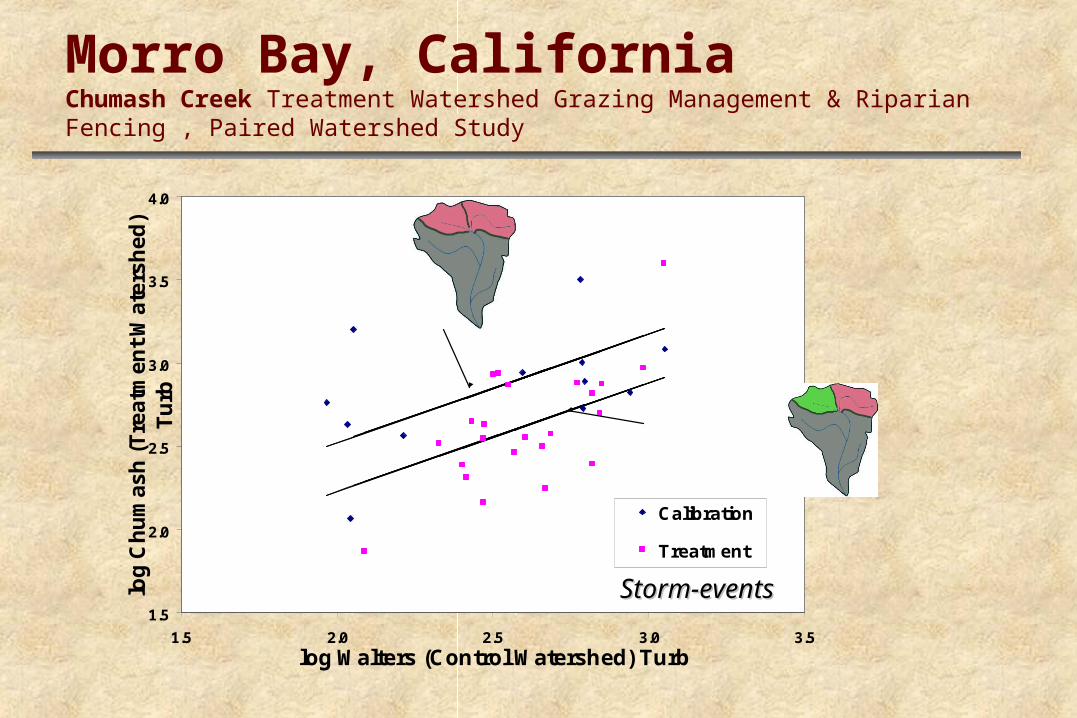
Morro Bay, California Chumash Creek Treatment Watershed Grazing Management & Riparian Fencing , Paired Watershed Study
1.5
2.0
2.5
3.0
3.5
4.0
1.5 2.0 2.5 3.0 3.5
log Walters (Control Watershed) Turb
log
Ch
um
as
h (
Tre
atm
en
t W
ate
rsh
ed
) T
urb
Calibration
Treatment
CalibrationLineTreatmentLine
Calibration
Treatmenty = 0.654x + 0.920
y = 0.6540x +1.212
Storm-eventsStorm-events
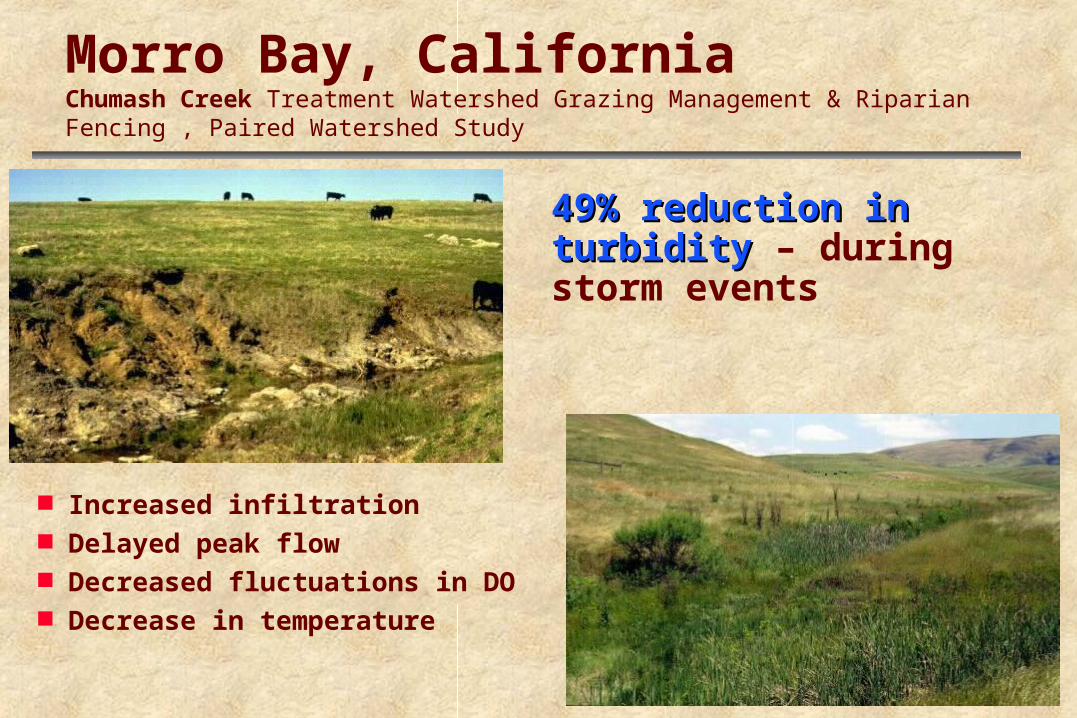
Morro Bay, California Chumash Creek Treatment Watershed Grazing Management & Riparian Fencing , Paired Watershed Study
Increased infiltration Delayed peak flow Decreased fluctuations in DO Decrease in temperature
49% reduction in turbidity49% reduction in turbidity – during storm events

Section 319 NMP Project Long Creek, North Carolina
Experimental Design – Upstream-Downstream/ Before-After BMP Implementation
BMPs:BMPs:o livestock exclusion fencing
o cattle crossings
o (with Bank full culverts)
o riparian area vegetation
o streambank restoration
o alternative watering system
o Nutrient management
o Waste management UpstreamUpstream

Long Creek, NC NMP - Upstream-Downstream/ Before-After BMP Implementation
BMPs: BMPs: livestock exclusion (fencing, alt. water, crossings, riparian plantings, nutrient waste mgt)
Pollutant Load Decr. Conc. Decr.
TSS 83 % 74 %
Turbidity 69 %
TP 76 %
Fecal Coli/step
85/ 81 %
State Program:State Program: Monitoring guidance for CWMTF funding: storm composites for load calculations
BMP effectiveness of fencing (low cost) and increased awareness
CREP and Tar PAM NEP using effectiveness
(Discussions on-going) target small streams/headwaters
TMDL (pathogen)
Decrease flashy / high values

2.Lag Time
Long-term response time to document WQ change common with:Long-term response time to document WQ change common with: High soil test P Riparian revegetation / reforestation
Stroud Preserve, PA (Reduction in groundwater nitrate from cropland took 10 years) Walnut Creek, IA (prairie restoration)
Nitrate in groundwater Pequea & Mill Creek, PA (reduction in N fertilizer did not document NO3 reduction in stream.
Ground water age dating: 3-4 years for land applied nutrients to reach springs 15-39 years for ground water to reach stream channel
Benthic macroinvertebrates & fish Lake Champlain Watersheds, VT (no improvements in fish communities despite improved habitat
and temperature)
Recommendations:Recommendations: Emphasizes need for long-term projects to measure success Target land treatment with short flow path Monitor small watersheds close to pollutant source Select indicator variables for short & long term monitoring
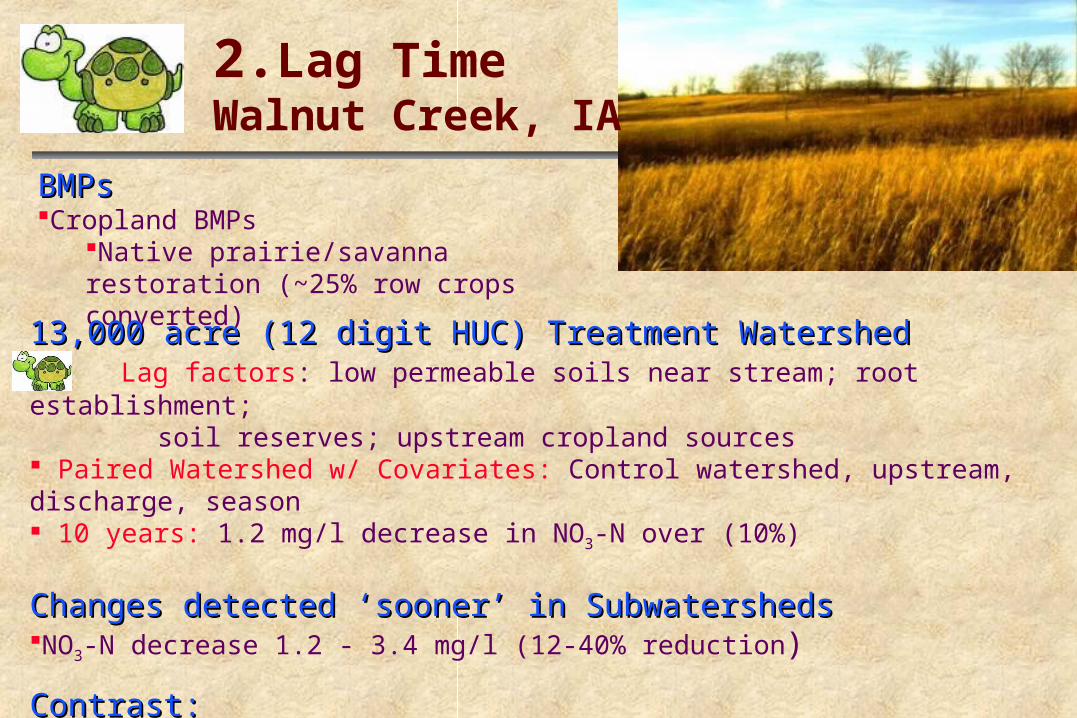
2.Lag Time Walnut Creek, IA
BMPsBMPsCropland BMPs
Native prairie/savanna restoration (~25% row crops converted)
13,000 acre (12 digit HUC) Treatment Watershed13,000 acre (12 digit HUC) Treatment Watershed Lag factors: low permeable soils near stream; root establishment; soil reserves; upstream cropland sources Paired Watershed w/ Covariates: Control watershed, upstream, discharge, season 10 years: 1.2 mg/l decrease in NO3-N over (10%)
Changes detected ‘sooner’ in SubwatershedsChanges detected ‘sooner’ in SubwatershedsNO3-N decrease 1.2 - 3.4 mg/l (12-40% reduction)
Contrast:Contrast:Stream NO3-N increased rapidly after CRP lands converted back to cropland in control watershed

3. Nutrient Management & Nutrient Mass Balance
Concept:Concept: Source reduction = key to water quality improvements Nutrient inputs ‘balance’ outputs E.g., Precision Feeding & Nutrient management
NMP Projects with documented improvements in nutrients:NMP Projects with documented improvements in nutrients: New York City Watershed, NY (precision feeding, nutrient management)
Lightwood Knot Creek, AL (cover, poultry litter storage/waste utilization)
Syn Magill, IA (animal waste management systems)
Long Creek, NC (manure spreading timing, nutrient management, pasture management)
Peacheater Creek, OK (fertilizer rates based on soil testing)
Otter Creek, WI (nutrient & pesticide management)
Findings: Findings: All document significant reductions in nutrients (N, P), most 50%; up to 75% All had nutrient management or mass balance as part of a SYSTEM of BMPs

Precision Feeding Reduce P imports to farm in purchased feed Feed & home-grown forages analyzed for
nutritional content & diets adjusted Dietary input of P reduced 25% Excretion of P reduced 33%
Manure storage & spreading - timing Manure application based on soil test (P) – rates Other BMPs in Whole Farm Planning
Livestock exclusion & alternative water supply Relocated stream channel away from barn Elevated stream crossings Rotational grazing & crop rotations
New York City Watershed, NY

Successes - Load ReductionsSuccesses - Load Reductions 64% NH3 53% TDP 36% PP 28% TSS 23% NOX
- Improved farm P mass balance
- Slowed net soil P accumulation
New York City Watershed

4. Livestock Exclusion/Fencing, Grazing Management
Concept:Concept: Remove immediate source of N&P
(fencing, alternative water supply, raised stream crossing) Riparian plantings
Revegetate streambanks Moderate water temperatures Improved habitat
NMP Projects: NMP Projects: Pequea & Mill Creek, PA (reductions: TP 14%, TKN 26%, TN 19%, TSS 37%) Morro Bay, CA Peacheater Creek, OK New York City Watershed, NY Long Creek, NC Lake Champlain Watersheds, VT

Section 319 NMP Project Lake Champlain Basin, VT
Results:Results:•Riparian buffers cost-effective
•50% decrease in bacteria & TP (greater reduction at high loading rates)
Pollutants:Pollutants:Phosphorus Bacteria
“Build it ……

5. Stream & Riparian Restoration
Concept:Concept: Channel modification (dimension, pattern, profile) Revegetate & stabilize streambanks Habitat improvement Moderated water temperatures Channel pool and riffle creation
NMP Projects:NMP Projects: Upper Grande Ronde River Basin, OR Peacheater Creek, OK Waukegan River, IL Stroud Preserve, PA

Upper Grande Ronde River, OR Channel Restoration, Cattle Exclusion/Fencing
Water Quality Impairment. Water Quality Impairment. Rainbow trout: temperature-sensitive SuccessesSuccesses
Improved slope, W/D ratios, sinuosity, pools, cool water habitat
Improved number of trout RecommendationsRecommendations
Livestock exclusion alone is not enough to recover sensitive aquatic life if stream channel & habitat remain degraded
Pool habitat provided critical temperature refuge

Section 319 NMP Projects 6. Low Impact Development (LID) / Better Site DesignConcept:Concept: Decreases development impact from large ‘footprint’ to smaller footprint Mimic pre-development hydrology (water quality, quantity, baseflow) Innovative site design & stormwater management to reduce environmental impacts Manages stormwater close to the source (e.g., where it falls) Using on-site vegetation & soils for water quality & quantity treatment Minimize clearing & grading, working with existing topography and native vegetation
NMP Projects: NMP Projects: Villanova Stormwater BMPs, PA
Long-term monitoring of individual stormwater BMPs (inflow / outflow) to measure effectiveness, BMP Demonstration & Research Park
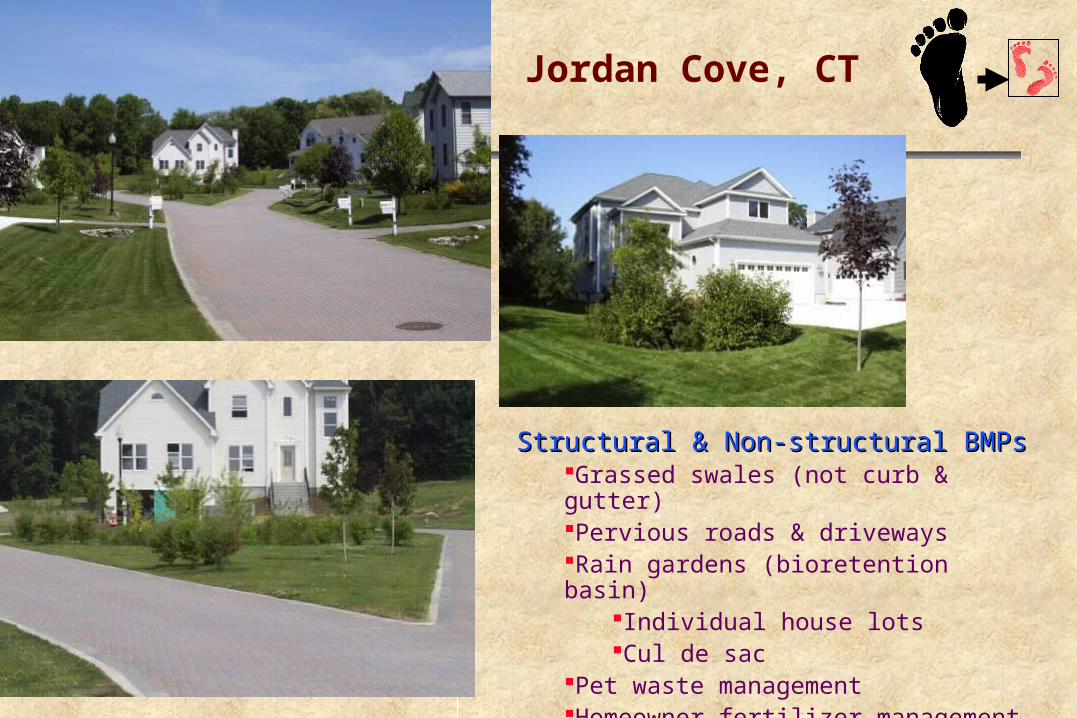
Jordon Cove, CT First LID project in nation to evaluate with a paired watershed design
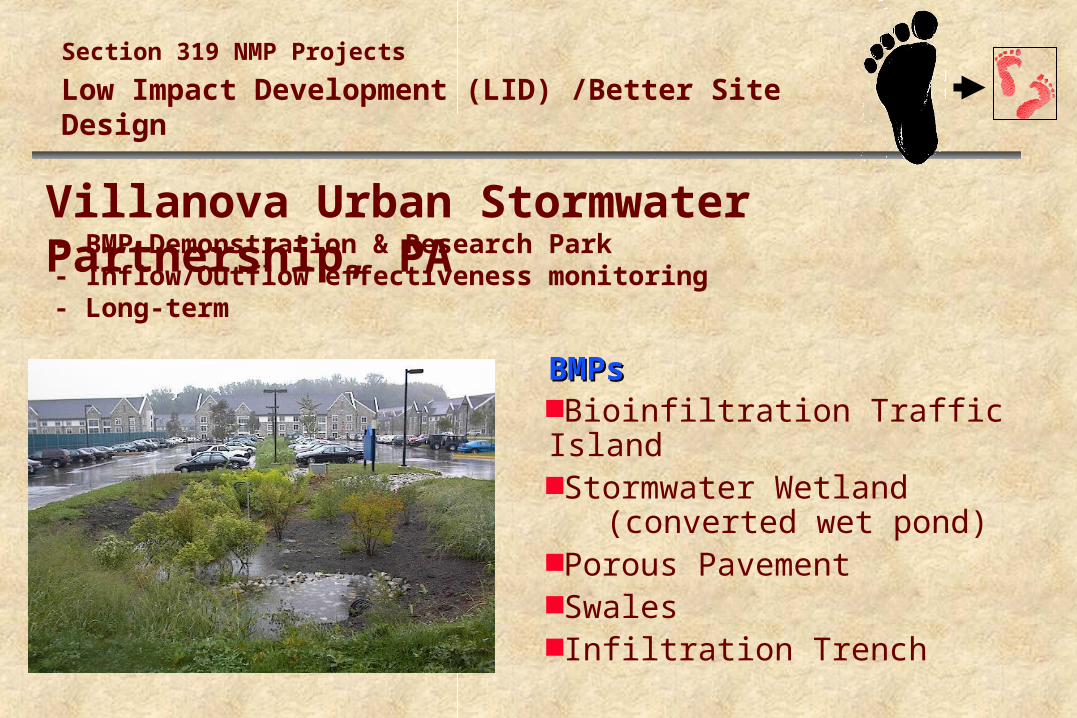
- BMP Demonstration & Research Park- Inflow/Outflow effectiveness monitoring- Long-term
BMPs BMPs Bioinfiltration Traffic IslandStormwater Wetland (converted wet pond)Porous PavementSwalesInfiltration Trench
Villanova Urban Stormwater Partnership, PA
Section 319 NMP Projects Low Impact Development (LID) /Better Site Design

BMP Subdivision
Construction BMPsConstruction BMPsBasement excavationsPhased gradingImmediate seeding of stockpiled topsoil & proposed lawn areasSediment detention basins & swales
Site DesignSite DesignCluster design with shared open spaceMinimization of impervious surfaces (narrow road, shared driveways)
Low Impact Development (LID) /Better Site Design
Jordan Cove, CT
Traditional Subdivision
Jordan Cove, CT
Structural & Non-structural BMPsStructural & Non-structural BMPsGrassed swales (not curb & gutter)Pervious roads & driveways Rain gardens (bioretention basin)
Individual house lotsCul de sac
Pet waste managementHomeowner fertilizer management plans
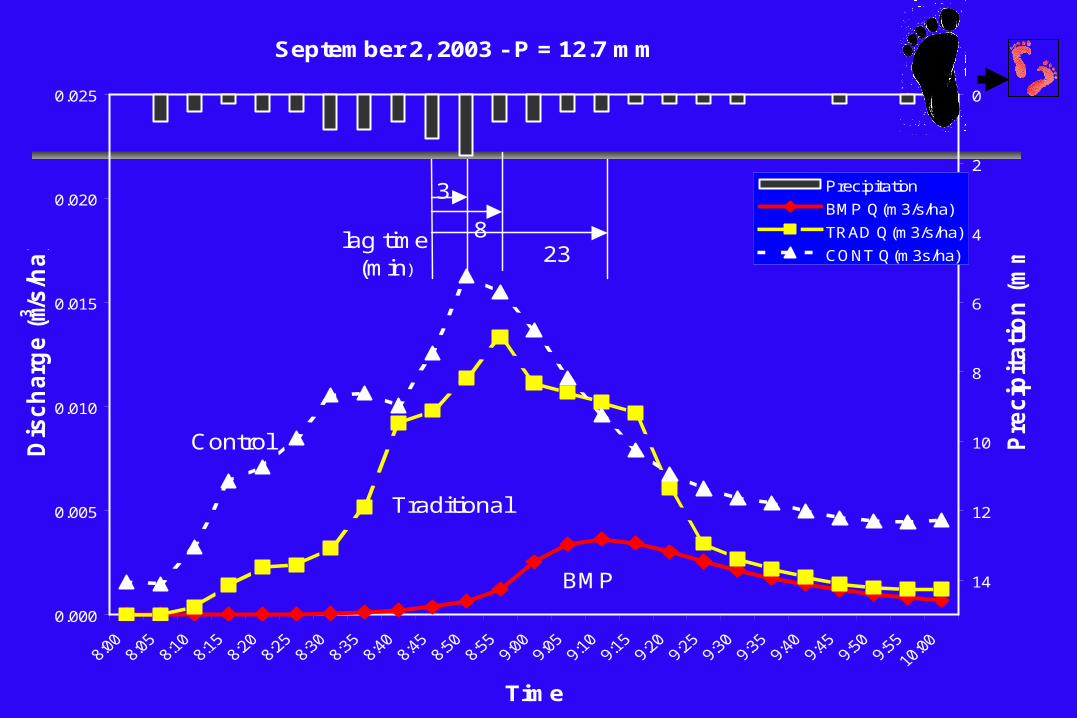
September 2, 2003 - P = 12.7 mm
0.000
0.005
0.010
0.015
0.020
0.025
Time
Dis
ch
arg
e (
m3 /s/h
a)
0
2
4
6
8
10
12
14
Pre
cip
ita
tio
n (
mm
)
Precipitation
BMP Q(m3/s/ha)
TRAD Q(m3/s/ha)
CONT Q(m3s/ha)lag time
(min)23
8
3
Control
Traditional
BMP

BMP Watershed-1
00
-50 0 50
10
01
50
20
02
50
30
03
50
40
04
50
50
05
50
60
06
50
70
07
50
80
08
50
Zn
Pb
Cu
TSS
TP
TKN
NO3+NO2-N
Qp
Stormflow
% Change in Export
Post-construction – flow & export
LID goal
Traditional Watershed
-100
4900
9900
1490
019
900
2490
029
900
3490
039
900
4490
049
900
5490
059
900
6490
069
900
7490
079
900
8490
089
900
9490
099
900
1049
0010
9900
Zn
Pb
Cu
TSS
TP
TKN
NH3-N
NO3+NO2-N
Qp
Stormflow
% Change in Export
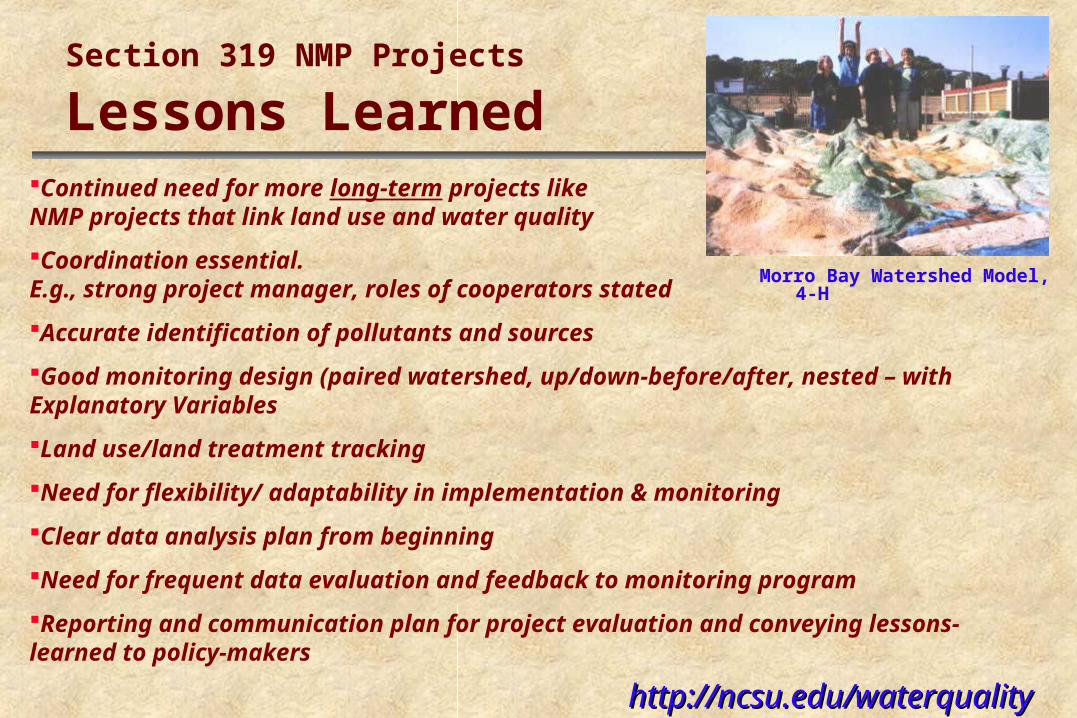
Section 319 NMP Projects Lessons Learned
Morro Bay Watershed Model, 4-H
Continued need for more long-term projects like NMP projects that link land use and water quality
Coordination essential. E.g., strong project manager, roles of cooperators stated
Accurate identification of pollutants and sources
Good monitoring design (paired watershed, up/down-before/after, nested – with Explanatory Variables
Land use/land treatment tracking
Need for flexibility/ adaptability in implementation & monitoring
Clear data analysis plan from beginning
Need for frequent data evaluation and feedback to monitoring program
Reporting and communication plan for project evaluation and conveying lessons-learned to policy-makers
http://ncsu.edu/waterqualityhttp://ncsu.edu/waterquality