national park service of the report ... cuyahoga river gives way to deep forests, ... cuyahoga...
TRANSCRIPT

National Park Service U.S. Department of the Interior
Cuyahoga Valley National Park Visitor Use Study Summer, 2015

ON THE COVER Cuyahoga Valley Scenic Railroad, courtesy of National Park Service

Cuyahoga Valley National Park Visitor Use Study Summer, 2015
Resource Systems Group 55 Railroad Row White River Junction, VT 05001

Cuyahoga Valley National Park-Visitor Use Study July 24 – August 2, 2015
Executive Summary • This report presents the results of a visitor study at Cuyahoga Valley National Park (NP)
during July 24 – August 2, 2015. A total of 1,229 questionnaires were distributed to visitors groups. Of those, 1,180 questionnaires were returned, achieving an overall response rate of 70.4%.
• This report describes a random sample of Cuyahoga Valley NP visitors. Most results are presented in graphs and frequency tables. Summaries of open-ended visitor comments are included in this report and complete comments can be reviewed in the Visitor Comments Appendix.
• Forty-one percent of visitor groups had two members and 32% were alone. Half of groups were visiting with their family. Forty-one percent of visitors were between ages 36 and 65, and 17% were 15 or younger.
• The majority of visitors were from Ohio (80%) while the others were from 36 other states. One percent of visitors (21 total) were from other countries. Within the last 12 months, this trip was the only time 30% of visitors visited the park and 26% had visited several times per month.
• Ninety-six percent of visitor groups were visiting Cuyahoga Valley NP as part of a day trip. Thirty-two percent of visitor groups visiting on a day trip spent 2 hours in the park and the average length of stay was 2.9 hours.
• Only 38 visitor groups (4%) were not on a day trip. Of those visitor groups that spent more than one day, 74% percent spent 2 days in the park and the average length of stay was 3.7 days.
• Eighty-nine percent of all visitor groups entered or re-entered the park on one day. This trip to the park was the primary or sole purpose for the trip away from home for 75% of visitor groups.
• Prior to this visit to Cuyahoga Valley NP, visitor groups most often used previous visits (65%), the park’s website (37%), and friends/relatives/word of mouth (32%) for obtaining information. Ninety-five percent of visitor groups felt that they had the information they needed on this trip. Eleven percent did not obtain any information prior to visiting.
• Getting physical exercise was the most important reason for visiting the park for 38% of visitor groups. Being outdoors (92%), getting physical exercise (86%), and viewing wildlife or natural scenery (84%) were all considered important reasons for visiting. The most common activities included viewing scenery (59%), hiking/walking (58%), and taking a scenic drive/driving for pleasure (37%). Hiking/walking (29%) and bicycling (28%) were the primary activities in which visitor groups participated.
• Trailhead bulletin boards (77%), printed materials (75%), and educational signs/outdoor exhibits (63%) were the most frequently used information sources while visiting the park on
Cuyahoga Valley National Park-Visitor Use Study July 24 – August 2, 2015
this trip and/or previous trips. Ranger-led programs (27%), self-guided materials (27%), and guest lectures/workshops (21%) were used the least.
• The most visited sites or trails in the park were the Towpath Trail (68%), the Boston Store Visitor Center (27%), and Brandywine Falls (26%). Fifteen percent of visitor groups rode the Cuyahoga Valley Scenic Railroad train on this trip. Fifty-four percent rode it on a previous trip and 36% had not at all.
• Seventy-six percent of visitor groups were aware that the park is located in the Ohio & Erie Canalway National Heritage Area prior to their visit. Sixty-three percent were not aware of the Conservancy for Cuyahoga Valley National Park and 77% were not aware of the Countryside Conservancy prior to their trip.
• Generally, visitor groups to Cuyahoga Valley NP do not feel crowded; the majority of visitor groups (78%) reported not feeling crowded. Of those visitor groups that did feel crowded, the most commonly reported locations where they felt crowded were the Towpath Trail and Brandywine Falls.
• Eighty-nine percent of visitor groups are not likely to use a shuttle service to reach park destinations on a future visit, and 71% are not likely to combine a shuttle service with a ride on the Cuyahoga Valley Scenic Railroad train on a future visit.

Cuyahoga Valley National Park-Visitor Use Study July 24 – August 2, 2015
Contents Page
Executive Summary ............................................................................................................................... ii
Acknowledgments .................................................................................................................................. 1
List of Terms .......................................................................................................................................... 1
Introduction ............................................................................................................................................ 1
Organization of the Report ............................................................................................................. 1
Presentation of the results ............................................................................................................... 2
Methods .................................................................................................................................................. 3
Survey Method and Sampling Plan ................................................................................................ 3
Questionnaire Design ..................................................................................................................... 5
Sampling Procedures ...................................................................................................................... 5
Sampling Results ............................................................................................................................ 6
Data Entry and Cleaning ................................................................................................................ 6
Checking Non-response Bias ......................................................................................................... 6
Weighting of Survey Response Data ............................................................................................ 11
Data Analysis................................................................................................................................ 11
Limitations .................................................................................................................................... 11
Special Conditions ........................................................................................................................ 12
Results .................................................................................................................................................. 13
Demographics ............................................................................................................................... 13
Visitor group size .................................................................................................................... 13
Number of adults within group................................................................................................ 13
Number of children within group ............................................................................................ 14
Visitor group type .................................................................................................................... 14
Visitor ethnicity ....................................................................................................................... 15
Visitor race .............................................................................................................................. 15
Visitors with physical conditions ............................................................................................ 16
Visitor gender .......................................................................................................................... 17
Visitor age ............................................................................................................................... 18

Cuyahoga Valley National Park-Visitor Use Study July 24 – August 2, 2015
Frequency of visits to park ...................................................................................................... 19
Visitor level of education ........................................................................................................ 19
U.S. visitors’ state of residence ............................................................................................... 20
International visitor’s country of residence ............................................................................. 21
Visitor speaking language ....................................................................................................... 22
Visitor reading language .......................................................................................................... 22
Live in nearby area .................................................................................................................. 23
Household size......................................................................................................................... 23
Trip Information ........................................................................................................................... 24
Overnight stay ......................................................................................................................... 24
Nights spent in overnight accommodations ............................................................................ 25
Days entered or re-entered park .............................................................................................. 28
Role of park visit in trip away from home .............................................................................. 29
Role of park visit in trip away from home .............................................................................. 30
Visits to other National Park Service sites .............................................................................. 31
Other national parks visited ..................................................................................................... 31
Information Prior to Visit ............................................................................................................. 32
Information sources prior to visit ............................................................................................ 32
Information needed .................................................................................................................. 32
Information visitors needed but did not have .......................................................................... 33
Awareness of park in national heritage area ............................................................................ 34
Information During Visit .............................................................................................................. 35
Reasons for visiting the park on this trip ................................................................................. 35
Most important reason for visiting on this trip ........................................................................ 40
Forms of transportation ........................................................................................................... 41
Number of people in vehicle ................................................................................................... 41
Number of people in recreational vehicle or motorhome ........................................................ 42
Signage on interstates directing visitors to the park ................................................................ 43
Signage on local roadways directing visitors to the park ........................................................ 43
Difficulty locating park ........................................................................................................... 44

Cuyahoga Valley National Park-Visitor Use Study July 24 – August 2, 2015
Signs inside the park ................................................................................................................ 45
Length of stay in the park ........................................................................................................ 46
Park Activities, Programs, and Services ....................................................................................... 47
Activity participation ............................................................................................................... 47
Farmers’ markets attended ...................................................................................................... 48
Farms visited ........................................................................................................................... 48
Primary activity on this trip ..................................................................................................... 49
Expenditures ................................................................................................................................. 50
Total expenditures inside the park and nearby area ................................................................ 50
Total expenditures inside the park and nearby area ................................................................ 51
Number of people covered by expenditures ............................................................................ 53
Adults covered by expenses .................................................................................................... 53
Children covered by expenses ................................................................................................. 54
Sharing of expenses ................................................................................................................. 54
Awareness of Park Partners .......................................................................................................... 55
Riding on the Cuyahoga Valley Scenic Railroad train ............................................................ 55
Expectations for the Cuyahoga Valley Scenic Railroad train ................................................. 55
Awareness of Conservancy for Cuyahoga Valley National Park ............................................ 56
Becoming a Conservancy member .......................................................................................... 57
Reasons why visitors are not likely to become a member of Conservancy ............................ 57
Making a charitable donation to the Conservancy .................................................................. 58
Reasons why visitors are not likely to make a charitable donation to the Conservancy ............................................................................................................................ 58
Awareness of the Countryside Conservancy ........................................................................... 59
Sites Visited, Crowding, and Safety Concerns ............................................................................. 60
Sites and trails visited .............................................................................................................. 60
Perceived crowding during visit .............................................................................................. 61
Areas perceived as crowded .................................................................................................... 61
Safety concerns while visiting the park ................................................................................... 62
Safety concerns while visiting park: why visitors felt unsafe ................................................. 64
Information Services Used on this Trip or Prior .......................................................................... 65

Cuyahoga Valley National Park-Visitor Use Study July 24 – August 2, 2015
Information services used ........................................................................................................ 65
Information services used on this trip ..................................................................................... 66
Information services used on a previous trip ........................................................................... 67
Use of shuttle bus service ........................................................................................................ 68
Use of shuttle bus service with ride on train ........................................................................... 68
Information about Future Visits ................................................................................................... 69
Information source preferences for future visits ..................................................................... 69
Preferred information sources for future visits ........................................................................ 70
Visitor Comments ......................................................................................................................... 71
Additional comments............................................................................................................... 71
Literature Cited .................................................................................................................................... 73
Cuyahoga Valley National Park-Visitor Use Study July 24 – August 2, 2015
Acknowledgments We thank the staff of Cuyahoga Valley National Park and the National Park Service for their assistance and support with this visitor use study. In particular, the contributions of the many volunteers and staff that administered the visitor surveys and the National Park Service’s Social Science Branch are to be acknowledged.
List of Terms NPS National Park Service
SSB Social Science Branch
VSP Visitor Services Project
CVNP Cuyahoga Valley National Park
Cuyahoga Valley National Park-Visitor Use Study July 24 – August 2, 2015
1
Introduction This report describes the results of a visitor use study at Cuyahoga Valley National Park (NP), conducted July 20th – 26th, 2015 by RSG Inc. on behalf of Cuyahoga Valley NP and the National Park Service (NPS).
The NPS website for Cuyahoga Valley NP describes the park: “Though a short distance from the urban areas of Cleveland and Akron, Cuyahoga Valley National Park seems worlds away. The park is a refuge for native plants and wildlife, and provides routes of discovery for visitors. The winding Cuyahoga River gives way to deep forests, rolling hills, and open farmlands. Walk or ride the Towpath Trail to follow the historic route of the Ohio & Erie Canal.” (www.nps.gov/cuva; retrieved January 2016).
Organization of the Report This report is organized into three sections
Section 1: Methods This section discusses the procedures, limitations, and special conditions that may affect the results of this study.
Section 2: Results This section provides summary information for each question in the questionnaire and includes a summary of visitor comments. The presentation of the results of this study does not follow the order of questions in the questionnaire, but instead is organized according to topic areas, as outlined in the Table of Contents.
Section 3: Appendices
Appendix 1. Descriptive Statistics. Descriptive statistics for those variables for which measures of central tendency can be computed.
Appendix 2. The Questionnaire. A copy of the questionnaire distributed to visitor groups.
Appendix 3. Tabular Unweighted and Weighted Results. Tabular results of unweighted and weighted survey results.
Appendix 4. Additional Analysis. A list of sample questions for cross-references and cross comparisons. Comparisons can be analyzed within park and between parks.
Appendix 5. Detailed Sampling Procedures. A detailed description of sampling locations and procedures.
Visitor Comments Appendix. A separate appendix provides visitor responses to open-ended questions. It is bound separately from this report due to its size.

Cuyahoga Valley National Park-Visitor Use Study July 24 – August 2, 2015
2
Presentation of the results Results are represented in the form of graphs (see example below), scatter plots, pie charts, tables, or text.
SAMPLE ONLY
1: The figure title describes the graph’s information.
2: Listed above the graph, the “N” shows the number of individuals or visitor groups responding to the question. If “N: is less than 30, “CAUTION!” is shown on the graph to indicate the results are unreliable.
* appears when total percentages do not equal 100 due to rounding.
** appears when total percentages do not equal 100 because visitors could select more than one answer choice.
3: Vertical information describes the response categories.
4: Horizontal information shows the number or proportion of responses in each category.
5: In most graphs, percentages provide additional information.
66%
14%
8%
8%
3%
0 100 200 300 400 500 600
Family
Friends
Family andfriends
Alone
Other
Group type
Number of respondents
N = 807 visitor groups
Figure 1: Visitor group type 4
2
3
1
5

Cuyahoga Valley National Park-Visitor Use Study July 24 – August 2, 2015
3
Methods Survey Method and Sampling Plan This visitor survey was conducted as a mailback survey and follows the principles outlined in Don A. Dillman’s book Internet, Phone, Mail, and Mixed-Mode Surveys: The Tailored Design Method (2014). This method, combined with visitation data from Cuyahoga Valley National Park and a target margin of error for summary statistics of no greater than +/-5% (Fowler 1993), were used to establish the sampling plan for the survey (Table 1). The study population included visitor groups with at least one group member 18 years of age or older visiting Cuyahoga Valley National Park for a recreational visit at one of the 12 locations sampled from July 24 – August 2, 2015.

Cuyahoga Valley National Park-Visitor Use Study July 24 – August 2, 2015
4
Table 1: Sampling plan
Site Friday July 24
Saturday July 25
Sunday July 26
Monday July 27
Tuesday July 28
Wednesday July 29
Thursday July 30
Friday July 31
Saturday August 1
Sunday August 2
Ledges 9am-5pm X 11:30 am-7:30 pm X 11am-7pm X X X 8am-4pm X
Brandywine Trails X 11am-7pm X x 9am-5pm X X X X 10am-6pm
Kendall Lake 9am-5pm X 11:30 am-7:30 pm X 11am-7pm X X X 8am-4pm X
Oak Hill Trailhead X 9am-5pm X 9am-5pm X X X X X 10am-6pm Rockside & Akron Northside Stations
8:30am-4:30pm X
8:30am-4:30pm X X x X
8am-4:30pm
8:30am-4:30pm X
Peninsula Depot Parking/Lock 29 8am-4pm 7am-3pm X X x X X 11am-7pm X 10am-6pm
Station Road Trail 8am-4pm 7am-3pm 11:30 am-7:30 pm X X X 10am-6pm X X X
Canal Exploration Center X 8:30am-5pm X X X X X 8:30-5 pm X 8:30-5 pm
Boston Store 8am-4pm X 7am-3pm X X 11:30am-7:30pm 8am-4pm X 9am-5pm X
Ira Road Trailhead X 8am-4pm X 10am-6pm X X X X X 10am-6pm Everett Covered Bridge X 8am-4pm X 9am-5pm X X X 11am-7pm 10am-6pm X

Cuyahoga Valley National Park-Visitor Use Study July 24 – August 2, 2015
5
Questionnaire Design The Cuyahoga Valley National Park Visitor Use Study questionnaire was developed through a collaborative process between Cuyahoga Valley National Park staff, NPS Social Science Branch staff, and RSG staff. Many of the questions within the questionnaire are comparable with previous surveys conducted in Cuyahoga Valley National Park, including the 2005 Visitor Services Project (VSP) survey. Many of the questions asked visitors to choose answers from a list of responses, often with an open-ended option, while others were completely open-ended.
All questions within the questionnaire followed Office of Management and Budget (OMB) guidelines, thus the clarity and consistency of the survey instrument have been tested and formally approved.
Sampling Procedures Visitor groups were greeted, briefly introduced to the purpose of the study, and asked to participate. If visitors agreed, they were asked which member (at least 18 years old) had the next birthday. The individual with the next birthday was selected to complete the questionnaire for the group. An interview, lasting approximately two minutes, was conducted with all contacted visitor groups to determine group size, group type, length of trip to the park, and if anyone in the group had a physical condition that would make it difficult to participate in or access any park activities or services. Individuals selected to complete the questionnaire were asked their names and addresses in order to mail them reminder/thank you postcards and follow-ups. Visitors were asked to complete the survey after their trip to the park and return the questionnaire by mail. International visitors were specifically asked to mail their completed questionnaires before leaving the country. The questionnaires were pre-addressed and affixed with a U.S. first class postage stamp.
Table 2: Number of questionnaires distributed, by sampling location
Sampling Site N % Ledges 97 8% Brandywine Trail 136 11% Kendall Lake 83 7% Oak Hill Trailhead 47 4% Rockside & Akron Northside Stations 129 10% Peninsula Depot Parking/Lock 29 165 13% Station Road Trail 141 11% Canal Exploration Center 83 7% Boston Store 152 12% Ira Road Trailhead 110 9% Everett Covered Bridge 86 7% Total 1,229 100%
Two weeks after field survey administration concluded, all survey participants were sent thank you/reminder postcards (Table 3). Approximately two weeks after mailing the postcards, individuals who agreed to participate but had not yet returned their questionnaires were sent replacement questionnaire packets. Two distinct packets were sent, one to US addresses, which included a pre-addressed return envelope affixed with a U.S. first class postage stamp; and one to international

Cuyahoga Valley National Park-Visitor Use Study July 24 – August 2, 2015
6
addresses, which included a pre-addressed return envelope printed with international business reply mail postage.
Table 3: Follow-up mailing distribution
Mailing Date US International Total Postcards August 14, 2015 1,209 9 1,218 Replacement Mailing September 1, 2015 505 4 509
Sampling Results During the sampling period, 1,420 visitor groups were contacted to participate in the survey (Table 4). Of these groups, 1,229 agreed to participate in the study (86.5% participation rate). Questionnaires were completed and returned by 865 visitor groups resulting in a 70.4% response rate for this study. The 2005 VSP survey for Cuyahoga Valley National Park, which included two replacement mailings, had a participation rate and response rate of 91.8% and 76.2%, respectively (Blotkamp, et al, 2010).
Table 4: Number of completed questionnaires, by sampling location
Sampling Site N % Ledges 63 7% Brandywine Trail 86 10% Kendall Lake 58 7% Oak Hill Trailhead 35 4% Rockside & Akron Northside Stations 88 10% Peninsula Depot Parking/Lock 29 116 13% Station Road Trail 109 13% Canal Exploration Center 66 8% Boston Store 107 12% Ira Road Trailhead 81 9% Everett Covered Bridge 56 6% Total 865 100%
Data Entry and Cleaning Data from returned questionnaires were entered into a database using Teleform, an optical recognition data coding software application. Each questionnaire was scanned and loaded into Teleform, which automatically coded responses and highlighted potential coding errors. Potential coding errors were reviewed and corrected by research staff.
Corrected data were subjected to additional cleaning and proofing using Microsoft Excel and SPSS statistical software. Data cleaning and proofing included identification and correction of invalid and/or erroneous values, and complete manual verification of data entry for a randomly selected subset (5%) of the completed questionnaires for quality assurance.
Checking Non-response Bias Non-response bias is one of the major threats to the quality of a survey project. It affects the ability to generalize from a sample to the study’s target population (Salant and Dillamn, 1994; Dillman, 2014; Stoop, 2004; Filion, 1976; Dey, 1997). The presence of non-response bias indicates a systematic difference between visitor groups who responded to the questionnaire (i.e. who are included in the

Cuyahoga Valley National Park-Visitor Use Study July 24 – August 2, 2015
7
study’s results) and visitor groups who were asked to participate but did not respond to the questionnaire (i.e., who are not included in the study’s results). It should be noted, that while surveys were only administered in English, only four refusals occurred that were classified as potential “language barriers” between the survey administrator and visitor.
To check for non-response bias, this study used a series of non-response bias questions to compare visitor groups who completed and returned questionnaires (respondents) with those who were contacted to participate in the study but did not complete and return questionnaires (non-respondents). The non-response bias questions were asked of all visitor groups contacted to participate in the study.
Six non-response bias variables were collected:
1. Visitor group size
2. Number of adults in the group
3. Number of children in the group
4. Visitor group type
5. Length of visit to the park
6. Presence of a group member with a physical condition that might make it difficult to participate in or access park activities or services.
An effort was made to obtain answers to these questions from all visitor groups contacted, including those that otherwise declined to participate in the survey. Responses were obtained from most of the participating visitor groups, and from many but not all of those declining to participate in the study. In addition to these non-response bias questions, visitor group size, group adult gender mix, and the initial contact gender were estimated for both participating and non-participating groups from direct observation by the survey administrators.
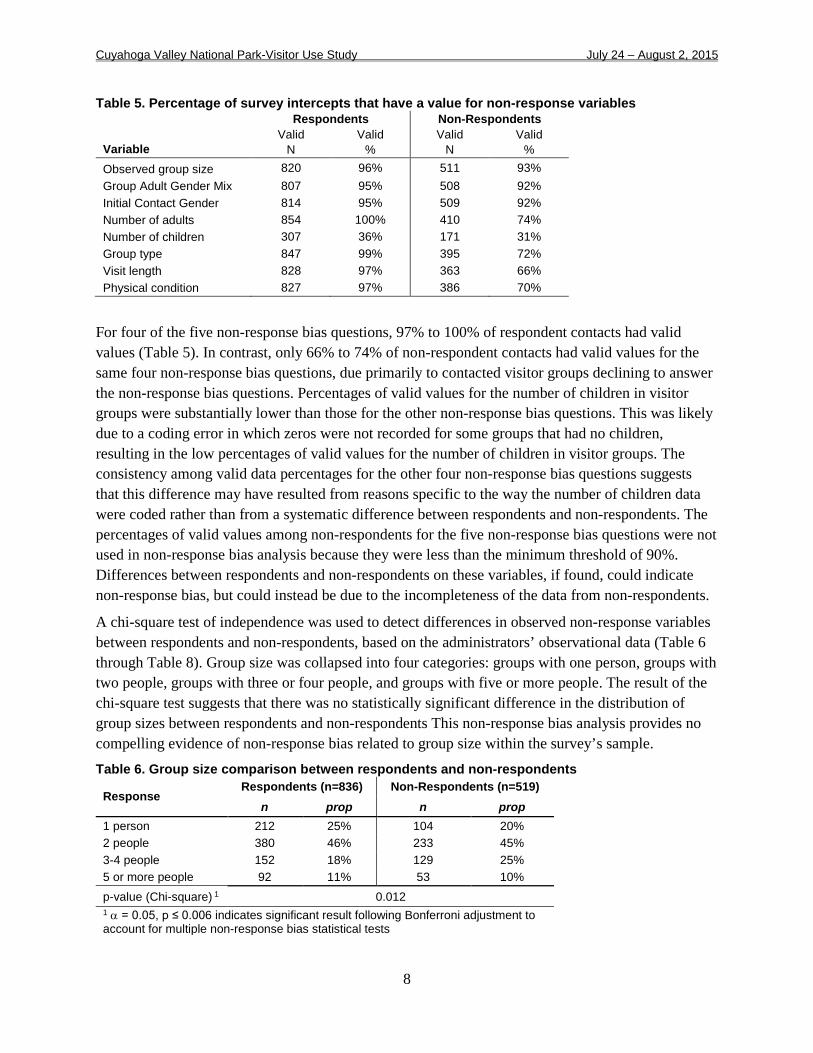
To be maximally useful for non-response bias analysis, responses or observed estimates for non-response bias variables should ideally be present for 100% of both respondents and non-respondents. More practically, a very substantial majority of responses or observed estimates must be present, or else the respondent and non-respondent groups cannot be adequately characterized to conduct non-response bias analysis. Ninety percent was used as the minimum percentage for this survey. Of the eight non-response bias variables in this survey, only the observed variables had valid values for at least 90% of respondents (95%+) and non-respondents (92%+; Table 5). Consequently, it was the main variable used in non-response bias analysis.
Cuyahoga Valley National Park-Visitor Use Study July 24 – August 2, 2015
8
Table 5. Percentage of survey intercepts that have a value for non-response variables Respondents Non-Respondents
Variable Valid
N Valid
% Valid
N Valid
% Observed group size 820 96% 511 93% Group Adult Gender Mix 807 95% 508 92% Initial Contact Gender 814 95% 509 92% Number of adults 854 100% 410 74% Number of children 307 36% 171 31% Group type 847 99% 395 72% Visit length 828 97% 363 66% Physical condition 827 97% 386 70%
For four of the five non-response bias questions, 97% to 100% of respondent contacts had valid values (Table 5). In contrast, only 66% to 74% of non-respondent contacts had valid values for the same four non-response bias questions, due primarily to contacted visitor groups declining to answer the non-response bias questions. Percentages of valid values for the number of children in visitor groups were substantially lower than those for the other non-response bias questions. This was likely due to a coding error in which zeros were not recorded for some groups that had no children, resulting in the low percentages of valid values for the number of children in visitor groups. The consistency among valid data percentages for the other four non-response bias questions suggests that this difference may have resulted from reasons specific to the way the number of children data were coded rather than from a systematic difference between respondents and non-respondents. The percentages of valid values among non-respondents for the five non-response bias questions were not used in non-response bias analysis because they were less than the minimum threshold of 90%. Differences between respondents and non-respondents on these variables, if found, could indicate non-response bias, but could instead be due to the incompleteness of the data from non-respondents.
A chi-square test of independence was used to detect differences in observed non-response variables between respondents and non-respondents, based on the administrators’ observational data (Table 6 through Table 8). Group size was collapsed into four categories: groups with one person, groups with two people, groups with three or four people, and groups with five or more people. The result of the chi-square test suggests that there was no statistically significant difference in the distribution of group sizes between respondents and non-respondents This non-response bias analysis provides no compelling evidence of non-response bias related to group size within the survey’s sample. Table 6. Group size comparison between respondents and non-respondents
Response Respondents (n=836) Non-Respondents (n=519)
n prop n prop 1 person 212 25% 104 20% 2 people 380 46% 233 45% 3-4 people 152 18% 129 25% 5 or more people 92 11% 53 10% p-value (Chi-square) 1 0.012 1 α = 0.05, p ≤ 0.006 indicates significant result following Bonferroni adjustment to account for multiple non-response bias statistical tests

Cuyahoga Valley National Park-Visitor Use Study July 24 – August 2, 2015
9
Table 7. Adult gender mix comparison between respondents and non-respondents
Response Respondents (n=816) Non-Respondents (n=517)
n prop n prop Mixed gender 484 59% 315 61% All female 160 20% 70 14% All male 172 21% 132 26% p-value (Chi-square) 0.008 1 α = 0.05, p ≤ 0.006 indicates significant result following Bonferroni adjustment to account for multiple non-response bias statistical tests
Table 8. Initial contact gender comparison between respondents and non-respondents
Response Respondents (n=821) Non-Respondents (n=518)
n prop n prop Female 417 51% 234 45% Male 404 49% 284 55% p-value (Chi-square) 1 0.045 1 α = 0.05, p ≤ 0.006 indicates significant result following Bonferroni adjustment to account for multiple non-response bias statistical tests
For descriptive purposes, results from the non-response bias questions for which less than the minimum threshold (90%) of valid responses were collected are presented below; however the results are not considered to adequately address potential non-response bias because percentages of valid responses for these variables are below the minimum threshold. Continuous variables, including the number of adults in visitor groups, the number of children in visitor groups, and the length of groups’ visits, were categorized for analysis.
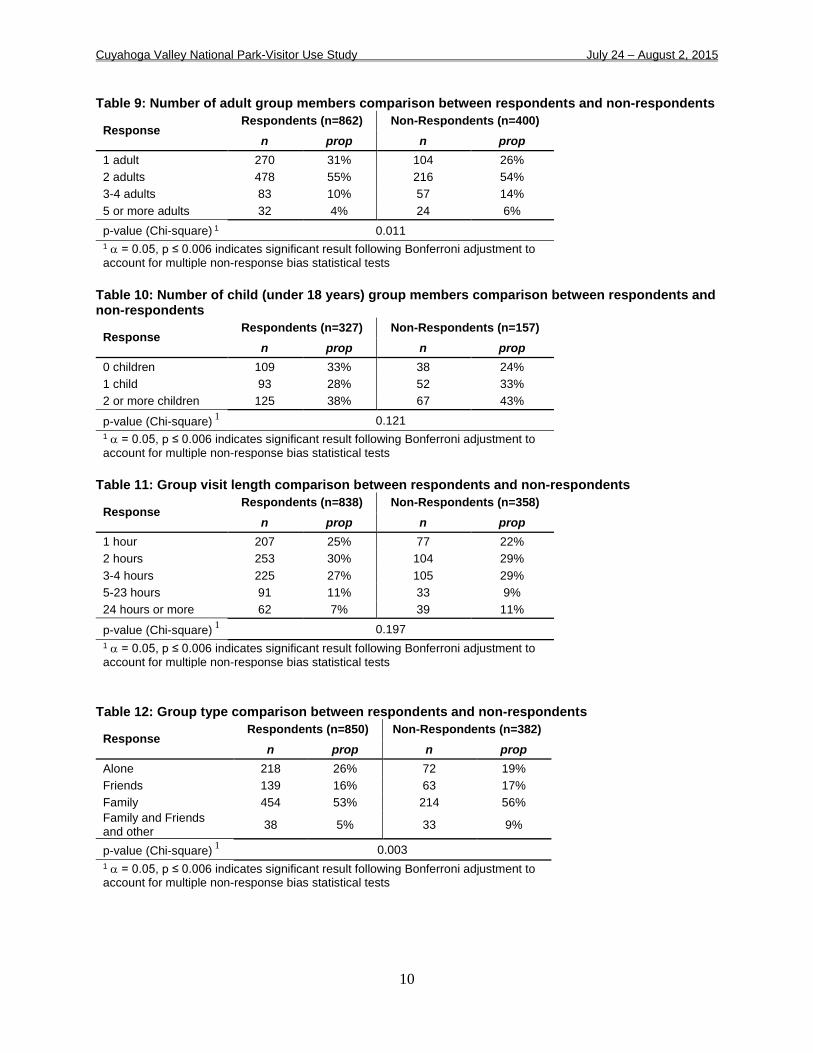
Results of these tests indicate that, among those visitor groups who provided responses to the non-response bias questions, there were no significant differences between respondents and non-respondents on either the number of adults in the group, the number of children, visit length, or presence of physical condition (Table 9, Table 10, Table 11, and Table 13). These findings were consistent with the non-significance of the results of the main analysis on group size. On the other hand, respondent groups were somewhat more likely than non-respondent groups visit in family groups (Table 12). Although statistically significant, this difference was not particularly large. Respondents and non-respondents had the same modal category on each of the variables, as well as generally similar percentage distributions overall. As noted above, the differences that did exist might indicate some non-response bias on these characteristics, but could just as plausibly be attributed to incomplete data on the non-respondents.
Cuyahoga Valley National Park-Visitor Use Study July 24 – August 2, 2015
10
Table 9: Number of adult group members comparison between respondents and non-respondents
Response Respondents (n=862) Non-Respondents (n=400)
n prop n prop 1 adult 270 31% 104 26% 2 adults 478 55% 216 54% 3-4 adults 83 10% 57 14% 5 or more adults 32 4% 24 6% p-value (Chi-square) 1 0.011 1 α = 0.05, p ≤ 0.006 indicates significant result following Bonferroni adjustment to account for multiple non-response bias statistical tests
Table 10: Number of child (under 18 years) group members comparison between respondents and non-respondents
Response Respondents (n=327) Non-Respondents (n=157)
n prop n prop 0 children 109 33% 38 24% 1 child 93 28% 52 33% 2 or more children 125 38% 67 43%
p-value (Chi-square) 1 0.121 1 α = 0.05, p ≤ 0.006 indicates significant result following Bonferroni adjustment to account for multiple non-response bias statistical tests
Table 11: Group visit length comparison between respondents and non-respondents
Response Respondents (n=838) Non-Respondents (n=358)
n prop n prop 1 hour 207 25% 77 22% 2 hours 253 30% 104 29% 3-4 hours 225 27% 105 29% 5-23 hours 91 11% 33 9% 24 hours or more 62 7% 39 11%
p-value (Chi-square) 1 0.197 1 α = 0.05, p ≤ 0.006 indicates significant result following Bonferroni adjustment to account for multiple non-response bias statistical tests
Table 12: Group type comparison between respondents and non-respondents
Response Respondents (n=850) Non-Respondents (n=382)
n prop n prop Alone 218 26% 72 19% Friends 139 16% 63 17% Family 454 53% 214 56% Family and Friends and other 38 5% 33 9%
p-value (Chi-square) 1 0.003 1 α = 0.05, p ≤ 0.006 indicates significant result following Bonferroni adjustment to account for multiple non-response bias statistical tests

Cuyahoga Valley National Park-Visitor Use Study July 24 – August 2, 2015
11
Table 13: Presence of a group member with a physical condition that might make it difficult to access or participate in park activities or services comparison between respondents and non-respondents
Response Respondents (n=839) Non-Respondents (n=371)
n prop n prop No 787 94% 344 93% Yes 52 6% 27 7%
p-value (Chi-square) 1 0.483 1 α = 0.05, p ≤ 0.006 indicates significant result following Bonferroni adjustment to account for multiple non-response bias statistical tests
Taken together, the results of the main analysis and these supplemental descriptive analyses suggest that non-response bias, if any, need not be a major concern for interpreting the survey’s substantive findings.
Weighting of Survey Response Data The survey data were weighted using count data acquired by survey administrators. At most survey sampling sites (all except the train station sites), count data were collected for four 30-minute time periods throughout the sampling day at each site. At each survey sampling site, the number of visitors passing the survey administration threshold were counted. These data were used to estimate the probability of selection for each contacted visitor group. The reciprocal of this number was then used as a temporary weight for each completed survey response. The temporary weights were then deflated to reduce the overall weighted sample size for the survey sample. This deflation of the weighted sample size was performed to compensate for any increase in the margin of error that is produced due to weighting the survey sample data (Dorofeev and Grant, 2006). This also provides a weighted sample size the same as the number of surveys collected. All percentages reported in figures are weighted percentages, unless otherwise noted. Unweighted and weighted frequencies can be found in Appendix 3.
Data Analysis Descriptive statistics and cross-tabulations were calculated for the coded data and response to open-ended questions were categorized and summarized. SPSS statistical software was used for data analysis. Cross-tabulations are presented in the following results sections. Descriptive statistics for those variables for which measures of central tendency can be computed are presented in Appendix 1.
Limitations Like all surveys, this study has limitations that should be considered when interpreting the results.
1. This was a self-administered survey. Respondents completed the questionnaire after the visit, which may have resulted in poor recall. Thus, it is not possible to know whether visitor responses reflect actual behavior.
2. The data reflect visitor use patterns at the selected sites during the study period of July 24 – August 2, 2015. The results present a ‘snapshot-in-time’ and do not necessarily apply to visitors during other times of the year.
Cuyahoga Valley National Park-Visitor Use Study July 24 – August 2, 2015
12
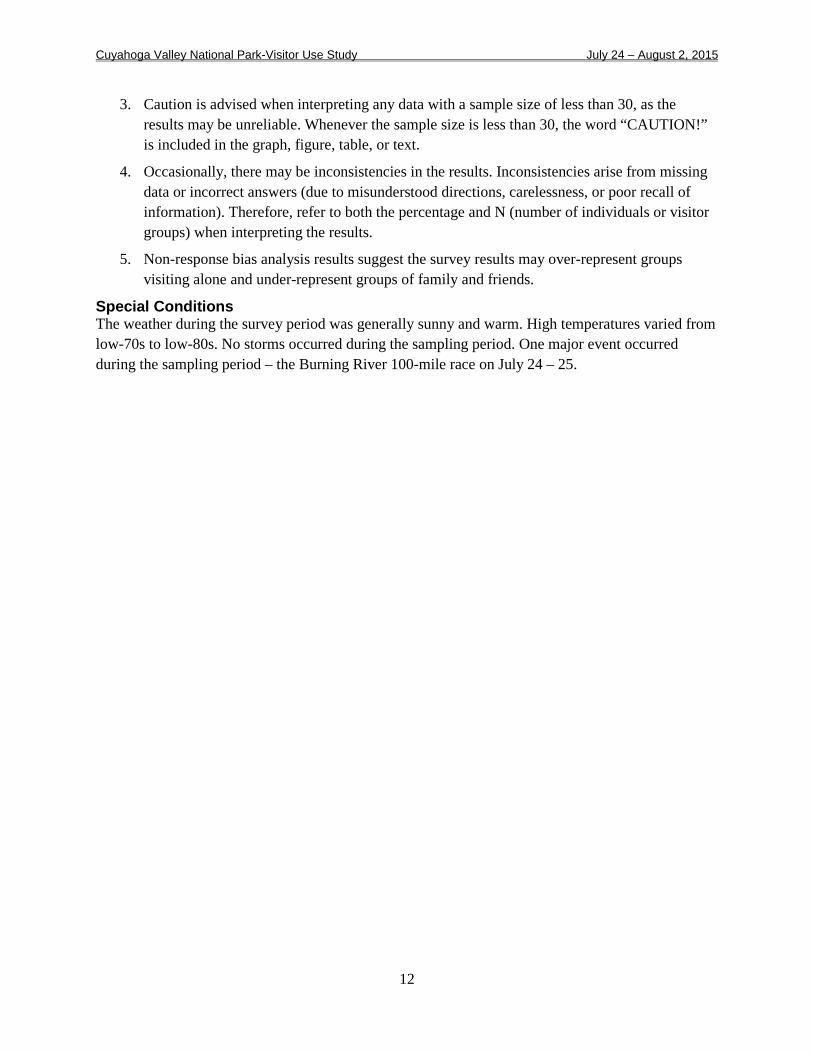
3. Caution is advised when interpreting any data with a sample size of less than 30, as the results may be unreliable. Whenever the sample size is less than 30, the word “CAUTION!” is included in the graph, figure, table, or text.
4. Occasionally, there may be inconsistencies in the results. Inconsistencies arise from missing data or incorrect answers (due to misunderstood directions, carelessness, or poor recall of information). Therefore, refer to both the percentage and N (number of individuals or visitor groups) when interpreting the results.
5. Non-response bias analysis results suggest the survey results may over-represent groups visiting alone and under-represent groups of family and friends.
Special Conditions The weather during the survey period was generally sunny and warm. High temperatures varied from low-70s to low-80s. No storms occurred during the sampling period. One major event occurred during the sampling period – the Burning River 100-mile race on July 24 – 25.

Cuyahoga Valley National Park-Visitor Use Study July 24 – August 2, 2015
13
Results Demographics Visitor group size Question 1
Including yourself, how many people were in your personal group on this trip to Cuyahoga Valley National Park?
Results (Figure 2)
• 41% of visitors were in groups of two.
• 32% of groups consisted of one person.
• 26% of visitors were in groups of 3 or more.
See Appendix 1 for more details.
Number of adults within group Question 1
Including yourself, how many people were in your personal group on this trip to Cuyahoga Valley National Park? Number of adults (18 years and older).
Results (Figure 3)
• 47% of visitor groups contained two adults.
• 42% of groups contained one adult.
• 11% of groups contained 3 or more adults.
See Appendix 1 for more details.
8%
7%
11%
41%
32%
0 100 200 300 400
5 or more
4
3
2
1
Group size
Number of respondents
N = 865 visitor groups*
Figure 2: Visitor group size
2%
3%
6%
47%
42%
0 200 400 600
5 or more
4
3
2
1
Number of adults
Number of respondents
N = 865 visitor groups
Figure 3: Number of adults in personal group

Cuyahoga Valley National Park-Visitor Use Study July 24 – August 2, 2015
*total percentages do not equal 100 due to rounding **total percentages do not equal 100 because visitors could select more than 1 answer
14
Number of children within group Question 1
Including yourself, how many people were in your personal group on this trip to Cuyahoga Valley National Park? Number of children (under 18 years).
Results (Figure 4)
• 73% of visitor groups contained no children.
• 12% of visitor groups contained only one child.
• 15% of visitor groups contained two or more children.
See Appendix 1 for more details.
Visitor group type Question 2
On this trip to Cuyahoga Valley National Park, what type of group were you with?
Results (Figure 5)
• Half of visitor groups were made up of family members.
• 30% were alone.
• Of those groups who responded “other” (5%), group types included:
o Couples/significant others o Accompanied by dogs o Running/hiking clubs o Painting clubs o Habitat restoration o Field trip/summer program o Church o Co-workers
50%
30%
12%
3%
5%
0 100 200 300 400 500
Family
Alone
Friends
Family & Friends
Other
Group type
Number of respondents
N = 865 visitor groups
Figure 5: Visitor group type
Figure 4: Number of children in personal group
<1%
2%
3%
9%
12%
73%
0 200 400 600 800
5 or more
4
3
2
1
0
Number of children
Number of respondents
N = 865 visitor groups

Cuyahoga Valley National Park-Visitor Use Study July 24 – August 2, 2015
*total percentages do not equal 100 due to rounding **total percentages do not equal 100 because visitors could select more than 1 answer
15
Visitor ethnicity Question 37b
For your personal group (up to seven members) on this trip to Cuyahoga Valley National Park, please provide your ethnicity.
Note: Response was limited to seven members from each visitor group.
Results (Figure 6)
• 2% of visitors were Hispanic or Latino.
Visitor race Question 38
For your personal group on this trip to Cuyahoga Valley National Park, please provide your race.
Note: Response was limited to seven members from each visitor group.
Results (Figure 7)
• 94% of visitors were White.
• 3% of visitors were Asian.
• Very few visitors were Black or African American (1%), American Indian or Alaskan Native (1%), or Native Hawaiian or other Pacific Islander (<1%).
Figure 6: Visitor ethnicity
98%
2%
0 500 1,000 1,500
Not Hispanicor Latino
Hispanicor Latino
Hispanic/Latino?
Number of respondents
N = 1359 visitors
Figure 7: Visitor race
94%
1%
3%
1%
<1%
0 1,000 2,000 3,000
White
Black orAfrican American
Asian
American Indianor Alaskan Native
Native Hawaiian orother Pacific Islander
Race
Number of respondents
N = 2044 visitors**
Cuyahoga Valley National Park-Visitor Use Study July 24 – August 2, 2015
*total percentages do not equal 100 due to rounding **total percentages do not equal 100 because visitors could select more than 1 answer
16
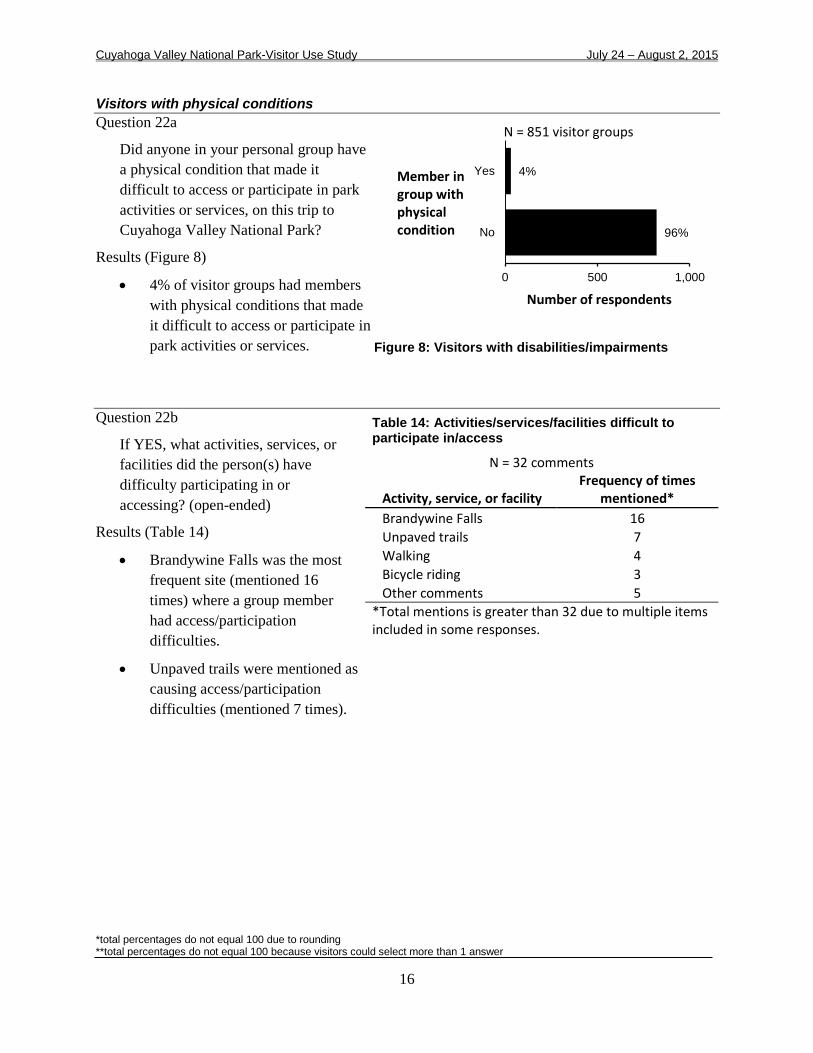
Visitors with physical conditions Question 22a
Did anyone in your personal group have a physical condition that made it difficult to access or participate in park activities or services, on this trip to Cuyahoga Valley National Park?
Results (Figure 8)
• 4% of visitor groups had members with physical conditions that made it difficult to access or participate in park activities or services.
Question 22b
If YES, what activities, services, or facilities did the person(s) have difficulty participating in or accessing? (open-ended)
Results (Table 14)
• Brandywine Falls was the most frequent site (mentioned 16 times) where a group member had access/participation difficulties.
• Unpaved trails were mentioned as causing access/participation difficulties (mentioned 7 times).
Table 14: Activities/services/facilities difficult to participate in/access
N = 32 comments
Activity, service, or facility Frequency of times
mentioned* Brandywine Falls 16 Unpaved trails 7 Walking 4 Bicycle riding 3 Other comments 5 *Total mentions is greater than 32 due to multiple items included in some responses.
4%
96%
0 500 1,000
Yes
No
Member in group with physical condition
Number of respondents
N = 851 visitor groups
Figure 8: Visitors with disabilities/impairments
Cuyahoga Valley National Park-Visitor Use Study July 24 – August 2, 2015
*total percentages do not equal 100 due to rounding **total percentages do not equal 100 because visitors could select more than 1 answer
17
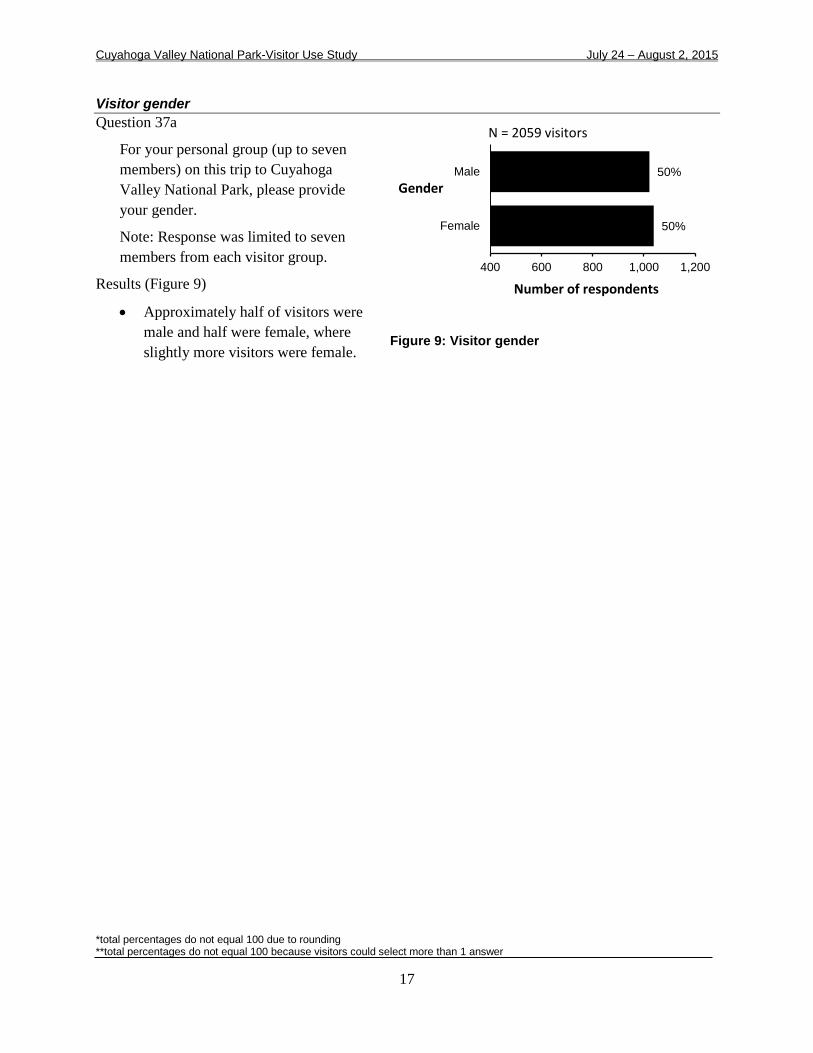
Visitor gender Question 37a
For your personal group (up to seven members) on this trip to Cuyahoga Valley National Park, please provide your gender.
Note: Response was limited to seven members from each visitor group.
Results (Figure 9)
• Approximately half of visitors were male and half were female, where slightly more visitors were female.
Figure 9: Visitor gender
50%
50%
400 600 800 1,000 1,200
Male
Female
Gender
Number of respondents
N = 2059 visitors

Cuyahoga Valley National Park-Visitor Use Study July 24 – August 2, 2015
*total percentages do not equal 100 due to rounding **total percentages do not equal 100 because visitors could select more than 1 answer
18
Visitor age Question 36a
For your personal group on this trip to Cuyahoga Valley National Park, please provide your current age.
Note: Response was limited to seven members from each visitor group.
Results (Figure 10)
• Visitor ages ranged from less than 1 year old to 92 years old.
• 53% of visitors were in the 36-65 age group.
• 19% of visitors were 15 years or younger.
• 13% of visitors were 66 years or older.
2%
4%
7%
11%
11%
10%
8%
6%
7%
5%
5%
4%
3%
6%
13%
0 50 100 150 200 250 300
76 or older
71-75
66-70
61-65
56-60
51-55
46-50
41-45
36-40
31-35
26-30
21-25
16-20
11-15
10 or younger
Age group(years)
Number of respondents
N = 2083 visitors*
Figure 10: Visitor age

Cuyahoga Valley National Park-Visitor Use Study July 24 – August 2, 2015
*total percentages do not equal 100 due to rounding **total percentages do not equal 100 because visitors could select more than 1 answer
19
Frequency of visits to park Question 35
How frequently have you personally visited Cuyahoga Valley National Park during the last 12 months?
Results (Figure 11).
• 30% of visitors visited the park only once in the last 12 months.
• 26% of visitors visited several times per month in the last 12 months.
Visitor level of education Question 39
What is the highest level of formal education completed by each member of your personal group on this trip to Cuyahoga Valley National Park?
Note: Response was limited to seven members from each visitor group.
Results (Figure 12)
• 32% of visitors graduated from a college, business, or trade school.
• 26% of visitors completed a Master’s, doctoral, or professional degree.
4%
18%
26%
22%
30%
0 200 400
Daily
Several timesper week
Several timesper month
Several times in thepast 12 months
Only once (this trip)
Frequency
Number of respondents
N = 851 visitor groups
Figure 11: Park visits in last 12 months
Figure 12: Visitor level of education
15%
2%
8%
11%
32%
5%
26%
0 500 1,000
Less than high school
Some high school
High school graduate or GED
Some college, business,or trade school
College, business, ortrade school graduate
Some graduate school
Master's, doctoral, orprofessional degree
Education
Number of respondents
N = 2005 visitors*

Cuyahoga Valley National Park-Visitor Use Study July 24 – August 2, 2015
*total percentages do not equal 100 due to rounding **total percentages do not equal 100 because visitors could select more than 1 answer
20
U.S. visitors’ state of residence Question 36b
For your personal group on this trip to Cuyahoga Valley National Park, please provide your U.S. zip code.
Note: Response was limited to seven members from each visitor group.
Results (Table 15 and Figure 13)
• U.S. visitors came from 37 states and comprised 99% of total visitation to the park during the survey period.
• 80% of U.S. visitors came from Ohio.
• Much smaller proportions came from 36 other states.
Figure 13: Proportion of US visitors by state of residence
Table 15: United States visitors by state of residence
State Number of
visitors
Percent of U.S. visitors
N = 1,894 individuals
Percent of all visitors N = 1,915
individuals Ohio 1519 80 79 Illinois 65 3 3 Michigan 52 3 3 Pennsylvania 51 3 3 New Jersey 28 1 1 Florida 28 1 1 Texas 23 1 1 Maryland 20 1 1 North Carolina 19 <1 <1 Kentucky 13 <1 <1 Indiana 12 <1 <1 26 other states 64 3 3

Cuyahoga Valley National Park-Visitor Use Study July 24 – August 2, 2015
*total percentages do not equal 100 due to rounding **total percentages do not equal 100 because visitors could select more than 1 answer
21
International visitor’s country of residence Question 36c
For your personal group on this trip to Cuyahoga Valley National Park, please provide your U.S. zip code or name of country other than U.S.
Note: Response was limited to seven members from each visitor group.
Results (Table 16)
• International visitors were from four countries and comprised 1% of total visitation to the park during the survey period.
• 52% of international visitors came from Canada.
Table 16: International visitors by country of residence
Country Number of
visitors*
Percent of International
visitors N = 21
individuals
Percent of all visitors N = 1915
individuals Canada 11 52 <1 Macedonia 7 33 <1 Germany 2 10 <1 Luxembourg 1 5 <1 *CAUTION: Number of respondents less than 30 visitor groups
Cuyahoga Valley National Park-Visitor Use Study July 24 – August 2, 2015
*total percentages do not equal 100 due to rounding **total percentages do not equal 100 because visitors could select more than 1 answer
22
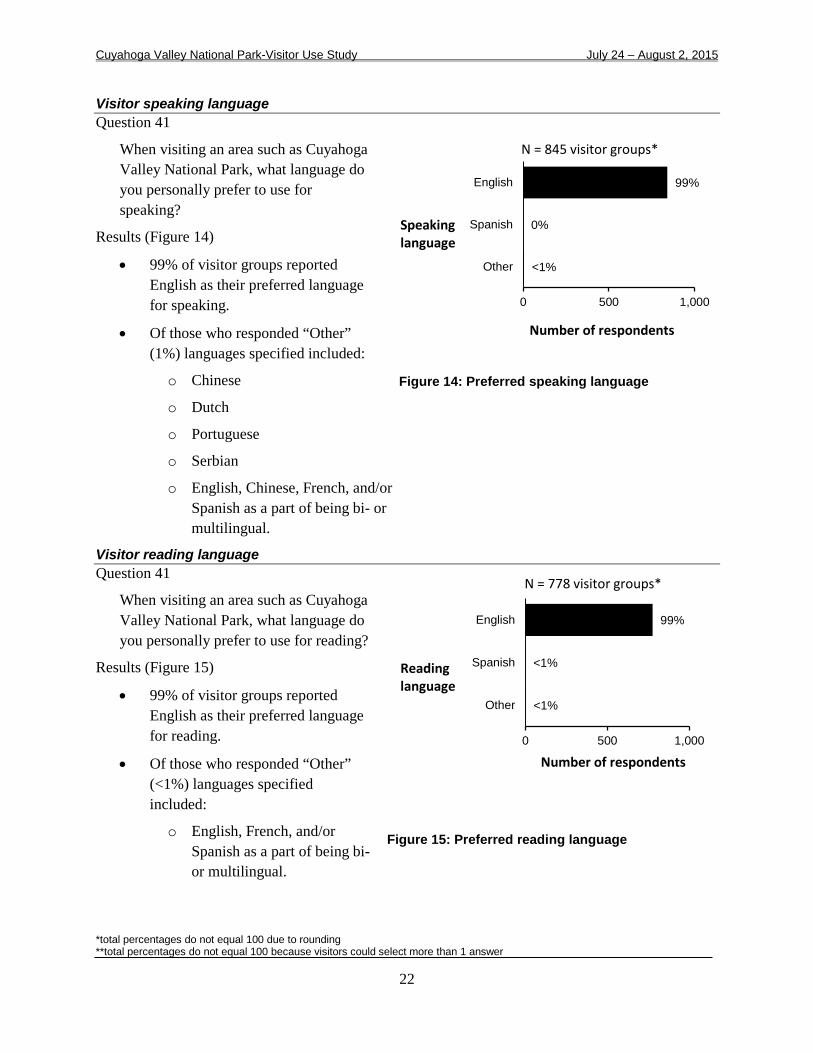
Visitor speaking language Question 41
When visiting an area such as Cuyahoga Valley National Park, what language do you personally prefer to use for speaking?
Results (Figure 14)
• 99% of visitor groups reported English as their preferred language for speaking.
• Of those who responded “Other” (1%) languages specified included:
o Chinese
o Dutch
o Portuguese
o Serbian
o English, Chinese, French, and/or Spanish as a part of being bi- or multilingual.
Visitor reading language Question 41
When visiting an area such as Cuyahoga Valley National Park, what language do you personally prefer to use for reading?
Results (Figure 15)
• 99% of visitor groups reported English as their preferred language for reading.
• Of those who responded “Other” (<1%) languages specified included:
o English, French, and/or Spanish as a part of being bi- or multilingual.
Figure 14: Preferred speaking language
Figure 15: Preferred reading language
99%
0%
<1%
0 500 1,000
English
Spanish
Other
Speaking language
Number of respondents
N = 845 visitor groups*
99%
<1%
<1%
0 500 1,000
English
Spanish
Other
Reading language
Number of respondents
N = 778 visitor groups*

Cuyahoga Valley National Park-Visitor Use Study July 24 – August 2, 2015
*total percentages do not equal 100 due to rounding **total percentages do not equal 100 because visitors could select more than 1 answer
23
Live in nearby area Question 28
Do you live within the shaded area shown on the map (i.e., nearby area)?
See Appendix 2 for map.
Results (Figure 16)
• 66% of visitor groups live within the shaded area on the map (i.e., nearby area).
• 34% of visitor groups did not live in the shaded area (i.e., nearby area).
Household size Question 40
Including yourself, how many people are in your household?
Results (Figure 17)
• 44% of visitor groups had a household two.
• 17% of had a household of four.
• 2.7 was the mean household size.
11%
17%
13%
44%
15%
0 200 400
5 or more
4
3
2
1
Size of household
Number of respondents
N = 834 visitor groups
Figure 17: Size of household
66%
34%
0 200 400 600
Yes
NoLive nearby
Number of respondents
N = 843 visitor groups
Figure 16: Visitors who live in nearby area
Cuyahoga Valley National Park-Visitor Use Study July 24 – August 2, 2015
*total percentages do not equal 100 due to rounding **total percentages do not equal 100 because visitors could select more than 1 answer
24
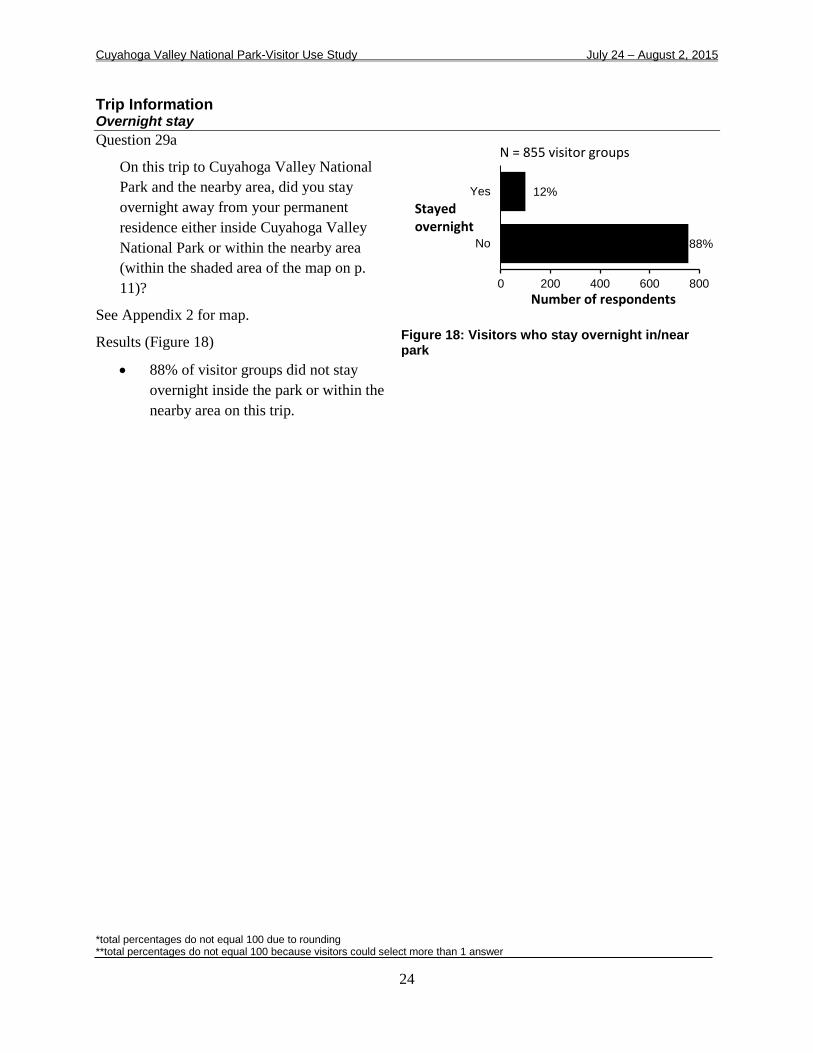
Trip Information Overnight stay Question 29a
On this trip to Cuyahoga Valley National Park and the nearby area, did you stay overnight away from your permanent residence either inside Cuyahoga Valley National Park or within the nearby area (within the shaded area of the map on p. 11)?
See Appendix 2 for map.
Results (Figure 18)
• 88% of visitor groups did not stay overnight inside the park or within the nearby area on this trip.
12%
88%
0 200 400 600 800
Yes
No
Stayed overnight
Number of respondents
N = 855 visitor groups
Figure 18: Visitors who stay overnight in/near park

Cuyahoga Valley National Park-Visitor Use Study July 24 – August 2, 2015
*total percentages do not equal 100 due to rounding **total percentages do not equal 100 because visitors could select more than 1 answer
25
Nights spent in overnight accommodations Question 29b
If you stayed overnight, please list the number of nights you stayed in Cuyahoga Valley National Park and/or in the nearby area on this trip.
Results (Figure 19)
• 44% of visitor groups who stayed overnight stayed in “Lodging outside the park.”
• 19% stayed in “Other accommodations.”
Results (Table 17)
• Table 17 shows to total nights spent in different accommodations in and outside the park.
• 52 visitor groups stayed in “Lodging outside the park,” with an average stay of 1.9 nights.
• 22 visitor groups stayed in “Other accommodations,” with an average stay of 3.7 nights.
• 7 visitor groups stayed overnight “camping in park,” with an average stay of 9.7 nights.
Table 17: Nights spent in accommodations
Accommodations N Total nights Average per visitor group
Reported minimum
Reported maximum
Camping in park 7 72 9.7 1 59 Camping outside park 8 24 2.9 1 5 Lodging in park 8 18 2.1 1 4 Lodging outside park 52 99 1.9 1 12 Other accommodations 22 82 3.7 1 14 Total 295
6%
7%
7%
44%
19%
0 50 100
Camping in park
Camping outside park
Lodging in park
Lodging outside park
Other accommodations
Accomodation
Number of respondents
N = 118 visitor groups
Figure 19: Visitors who stayed overnight, by accommodation

Cuyahoga Valley National Park-Visitor Use Study July 24 – August 2, 2015
*total percentages do not equal 100 due to rounding **total percentages do not equal 100 because visitors could select more than 1 answer
26
15%
0%
0%
0%
85%
0 2 4 6 8
5 or more
4
3
2
1Nights
Number of respondents
N = 7 visitor groups*
*CAUTION: Number of respondents less than 30 visitor groups.
11%
25%
19%
29%
16%
0 1 2 3
5 or more
4
3
2
1
Nights
Number of respondents
N = 8 visitor groups*
*CAUTION: Number of respondents less than 30 visitor groups.
Figure 20: Nights camping in park Figure 21: Nights camping outside park
0%
6%
34%
27%
33%
0 2 4
5 or more
4
3
2
1
Nights
Number of respondents
N = 8 visitor groups*
*CAUTION: Number of respondents less than 30 visitor groups.
Figure 23: Nights in lodging in park
4%
1%
13%
28%
54%
0 10 20 30
5 or more
4
3
2
1
Nights
Number of respondents
N = 52 visitor groups
Figure 22: Nights in lodging outside park

Cuyahoga Valley National Park-Visitor Use Study July 24 – August 2, 2015
*total percentages do not equal 100 due to rounding **total percentages do not equal 100 because visitors could select more than 1 answer
27
32%
12%
7%
35%
14%
0 5 10
5 or more
4
3
2
1
Nights
Number of respondents
N = 22 visitor groups*
*CAUTION: Number of respondents less than 30 visitor groups.
Figure 24: Nights spent in other accommodations
Cuyahoga Valley National Park-Visitor Use Study July 24 – August 2, 2015
*total percentages do not equal 100 due to rounding **total percentages do not equal 100 because visitors could select more than 1 answer
28
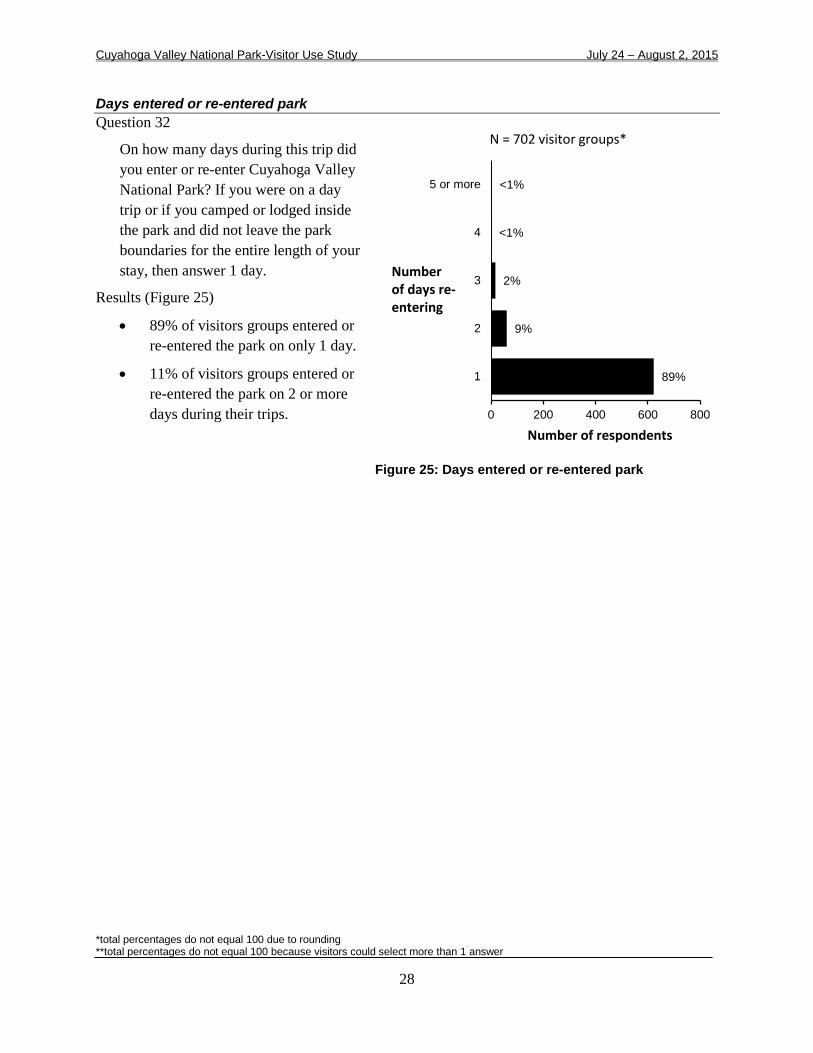
Days entered or re-entered park Question 32
On how many days during this trip did you enter or re-enter Cuyahoga Valley National Park? If you were on a day trip or if you camped or lodged inside the park and did not leave the park boundaries for the entire length of your stay, then answer 1 day.
Results (Figure 25)
• 89% of visitors groups entered or re-entered the park on only 1 day.
• 11% of visitors groups entered or re-entered the park on 2 or more days during their trips.
Figure 25: Days entered or re-entered park
<1%
<1%
2%
9%
89%
0 200 400 600 800
5 or more
4
3
2
1
Number of days re-entering
Number of respondents
N = 702 visitor groups*

Cuyahoga Valley National Park-Visitor Use Study July 24 – August 2, 2015
*total percentages do not equal 100 due to rounding **total percentages do not equal 100 because visitors could select more than 1 answer
29
Role of park visit in trip away from home Question 30
What was this trip to Cuyahoga Valley National Park your primary or sole purpose for your trip away from home, one of several equally important destinations on your trip away from home, or just an incidental or spur of the moment stop on your trip away from home?
Results (Figure 26)
• Visiting Cuyahoga Valley National Park was the primary purpose of the trip for 75% of visitor groups.
75%
16%
9%
0 200 400 600 800
The primary or solepurpose
for trip away from home
One of several equallyimportant destinations
An incidental/spur-of-the-moment stop
Number of
N = 834 visitor groups
Figure 26: Role of park visit in trip away from home
Cuyahoga Valley National Park-Visitor Use Study July 24 – August 2, 2015
*total percentages do not equal 100 due to rounding **total percentages do not equal 100 because visitors could select more than 1 answer
30
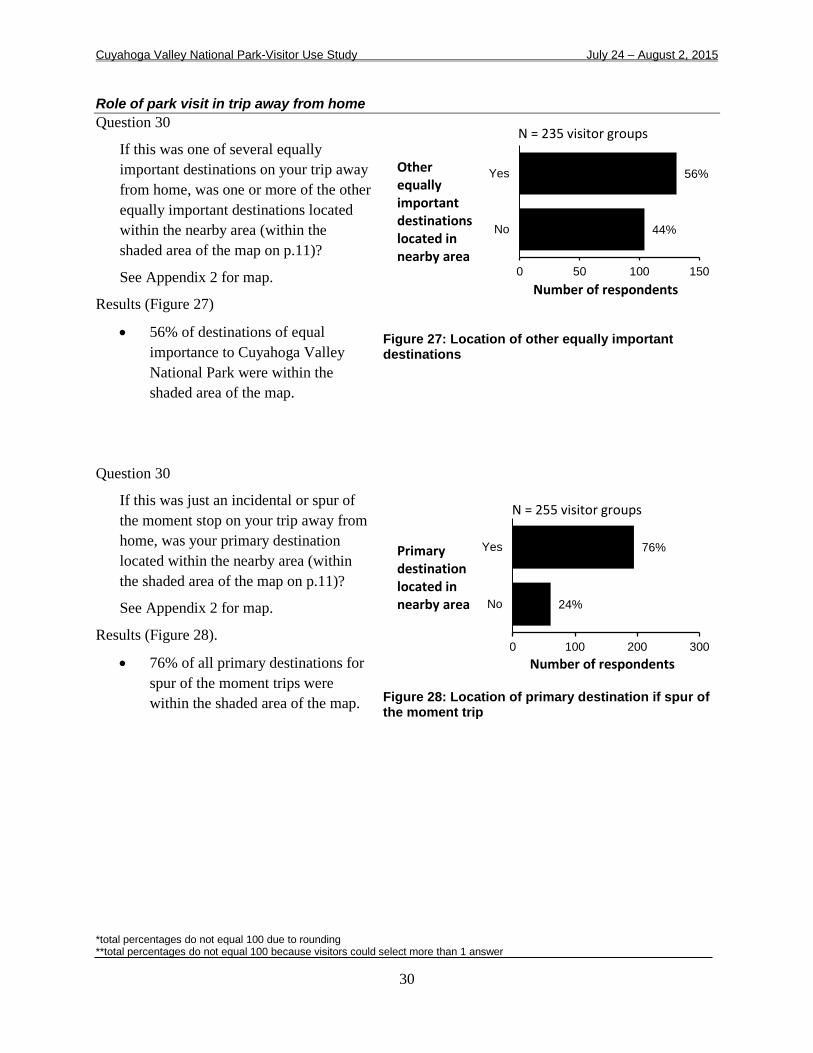
Role of park visit in trip away from home Question 30
If this was one of several equally important destinations on your trip away from home, was one or more of the other equally important destinations located within the nearby area (within the shaded area of the map on p.11)?
See Appendix 2 for map.
Results (Figure 27)
• 56% of destinations of equal importance to Cuyahoga Valley National Park were within the shaded area of the map.
Question 30
If this was just an incidental or spur of the moment stop on your trip away from home, was your primary destination located within the nearby area (within the shaded area of the map on p.11)?
See Appendix 2 for map.
Results (Figure 28).
• 76% of all primary destinations for spur of the moment trips were within the shaded area of the map.
Figure 27: Location of other equally important destinations
76%
24%
0 100 200 300
Yes
No
Primary destination located in nearby area
Number of respondents
N = 255 visitor groups
Figure 28: Location of primary destination if spur of the moment trip
56%
44%
0 50 100 150
Yes
No
Other equally important destinations located in nearby area
Number of respondents
N = 235 visitor groups
Cuyahoga Valley National Park-Visitor Use Study July 24 – August 2, 2015
*total percentages do not equal 100 due to rounding **total percentages do not equal 100 because visitors could select more than 1 answer
31
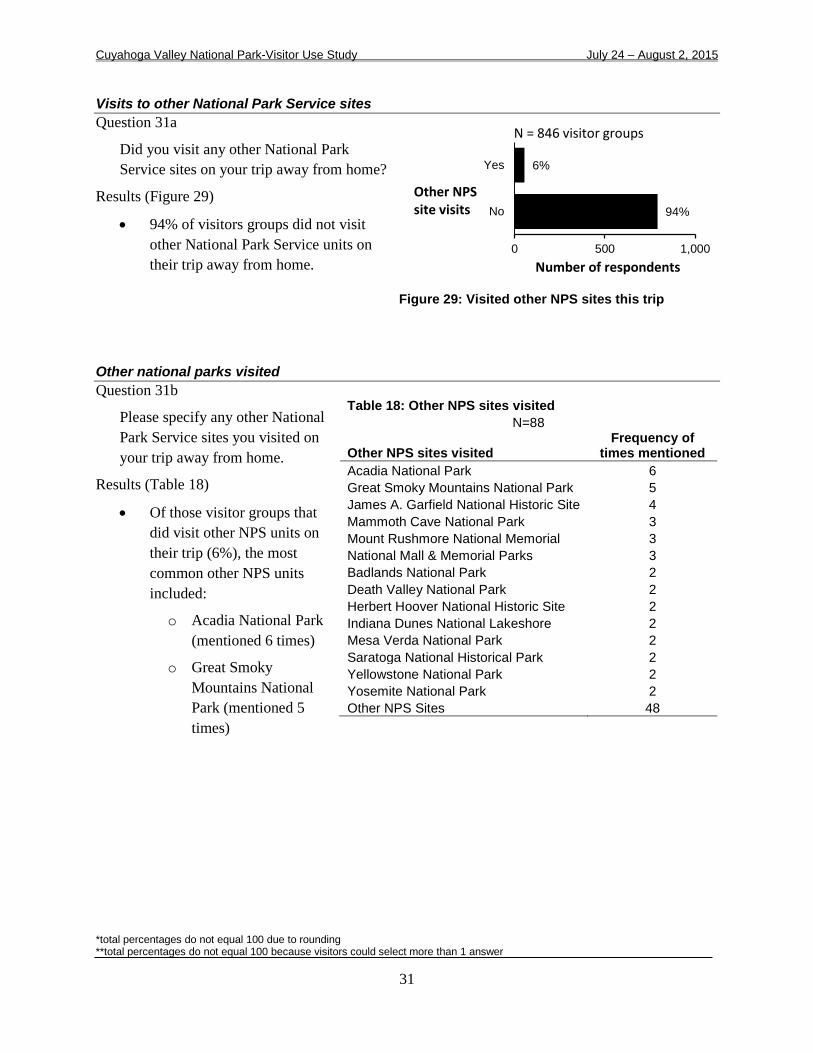
Visits to other National Park Service sites Question 31a
Did you visit any other National Park Service sites on your trip away from home?
Results (Figure 29)
• 94% of visitors groups did not visit other National Park Service units on their trip away from home.
Other national parks visited Question 31b
Please specify any other National Park Service sites you visited on your trip away from home.
Results (Table 18)
• Of those visitor groups that did visit other NPS units on their trip (6%), the most common other NPS units included:
o Acadia National Park (mentioned 6 times)
o Great Smoky Mountains National Park (mentioned 5 times)
Table 18: Other NPS sites visited N=88
Other NPS sites visited Frequency of
times mentioned Acadia National Park 6 Great Smoky Mountains National Park 5 James A. Garfield National Historic Site 4 Mammoth Cave National Park 3 Mount Rushmore National Memorial 3 National Mall & Memorial Parks 3 Badlands National Park 2 Death Valley National Park 2 Herbert Hoover National Historic Site 2 Indiana Dunes National Lakeshore 2 Mesa Verda National Park 2 Saratoga National Historical Park 2 Yellowstone National Park 2 Yosemite National Park 2 Other NPS Sites 48
6%
94%
0 500 1,000
Yes
NoOther NPS site visits
Number of respondents
N = 846 visitor groups
Figure 29: Visited other NPS sites this trip

Cuyahoga Valley National Park-Visitor Use Study July 24 – August 2, 2015
*total percentages do not equal 100 due to rounding **total percentages do not equal 100 because visitors could select more than 1 answer
32
Information Prior to Visit Information sources prior to visit Question 5
Prior to this visit, how did you and any other member of your personal group obtain information about Cuyahoga Valley National Park?
Results (Figure 30 and Figure 31)
• 89% of visitor groups obtained information about Cuyahoga Valley National Park prior to their visit.
• As shown in Figure 31, among those visitor groups who obtained information about Cuyahoga Valley National Park prior to their visit, the most common information sources were:
o 65% previous visits
o 37% Cuyahoga Valley National Park’s website
o 32% friends, relatives, or word of mouth
89%
11%
0 500 1,000
Yes
No
Obtainedinformation
Number of respondents
N = 861 visitor groups
Figure 30: Visitor groups that obtained information about the park prior to visit
65%
37%
32%
20%
13%
7%
6%
5%
5%
5%
4%
2%
2%
1%
6%
0 200 400 600
Previous visit
Park website
Friends/relatives/word of mouth
Walking/driving byand saw park signsTravel guides/tourbooks/brochures
Ohio and EerieCanal webpage
Park staff/volunteers atevent in my community
Social media
Conservancy webpage
Other website
Television/radio/newspapers/magazines
Mobile app
School class or program
Telephone/email/written inquiry to park
Other
Source
Number of respondents
N = 861 visitor groups**
Figure 31: Information sources used prior to trip

Cuyahoga Valley National Park-Visitor Use Study July 24 – August 2, 2015
*total percentages do not equal 100 due to rounding **total percentages do not equal 100 because visitors could select more than 1 answer
33
Information needed Question 6a
Did you and your personal group have the type of information about Cuyahoga Valley National Park you needed on this trip?
Results (Figure 32)
• 95% of visitor groups had the information they needed prior to their visit.
Information visitors needed but did not have Question 6b
If NO, what type of park information did you and your personal group need that was not available? (open-ended)
Results (Table 19)
• Of those who did not have the information they needed, “Park map/more detailed map” and “train information” were mentioned the most frequently (mentioned 9 times).
• “Closures and alternate routes” was second most frequent (mentioned 8 times).
• “Things to do/trip planner” was third most frequent (mentioned 5 times).
Table 19: Information needed N = 38 comments
Information
Frequency of times
mentioned* Park map/more detailed map 9 Train information 9 Closures and alternate routes 8 Things to do/trip planner 5 Trail surfaces 2 Schedule of events 1 Restaurant hours of operation 1 Other comments 4 *Total mentions is greater than 38 due to multiple items included in some responses.
95%
5%
0 500 1,000
Yes
No
Had information needed
Number of respondents
N = 852 visitor groups
Figure 32: Had information needed on this trip

Cuyahoga Valley National Park-Visitor Use Study July 24 – August 2, 2015
*total percentages do not equal 100 due to rounding **total percentages do not equal 100 because visitors could select more than 1 answer
34
Awareness of park in national heritage area Question 27
Prior to this visit, were you aware that Cuyahoga Valley National Park is located in the Ohio & Erie Canalway National Heritage Area?
Results (Figure 33)
• 76% of visitor groups were aware, prior to their visit, that the park is located in the Ohio & Erie Canalway National Heritage Area.
76%
24%
0 200 400 600 800
Yes
No
Aware park is in National Heritage Area
Number of respondents
N = 846 visitor groups
Figure 33: Awareness of park in National Heritage Area

Cuyahoga Valley National Park-Visitor Use Study July 24 – August 2, 2015
*total percentages do not equal 100 due to rounding **total percentages do not equal 100 because visitors could select more than 1 answer
35
Information During Visit Reasons for visiting the park on this trip Question 10
How important to you was each of the following resources, qualities, and attributes as a reason for visiting the park on this trip?
Rating choices: 1 = Extremely important 2 = Very important 3 = Moderately important 4 = Slightly important 5 = Not important.
Results
• Figure 34 Shows the combined proportions of “extremely important” and “very important” ratings for reasons for visiting the park. N does not include “Not applicable” response.
• The reasons that received the highest combined proportions or “extremely important” and “very important” ratings were:
o 92% Be outdoors o 86% Get physical exercise o 84% View wildlife or scenery
• The reasons that received the highest “not important” ratings included:
o 25% View dark night sky/stars o 23% Attend a special event
• Of those who responded “Other” (7%), reasons specified included:
o Ride the train o Ride a bike o Exercise dog o Because it was convenient o Therapy o Family history o See accessible sights
Figure 34: Reasons for visiting the park this trip
N=828, 92%
N=826, 86%
N=834, 84%
N=700, 79%
N=805, 78%
N=782, 73%
N=810, 64%
N=750, 48%
N=762, 47%
N=777, 39%
N=754, 28%
N=329, 25%
N=268, 23%
N=59, 89%
0% 25% 50% 75% 100%
Be outdoors
Get physical exercise
View wildlife ornatural scenery
Spend time withfamily/friends
Relax
Escape fromurban setting
Hear sounds ofnature/quiet
Visit a NPS site
Experience solitude
Learn about nature
Learn about Americanhistory and culture
View dark nightsky/stars
Attend special event
Other
Reason
Proportion of respondents
N = number of visitor groups who rated each item

Cuyahoga Valley National Park-Visitor Use Study July 24 – August 2, 2015
*total percentages do not equal 100 due to rounding **total percentages do not equal 100 because visitors could select more than 1 answer
36
57%
28%
9%
4%
1%
0 500
Extremelyimportant
Veryimportant
Moderatelyimportant
Slightlyimportant
Not at allimportant
Rating
Number of respondents
N = 826 visitor groups*
61%
32%
5%
2%
<1%
0 500 1,000
Extremelyimportant
Veryimportant
Moderatelyimportant
Slightlyimportant
Not at allimportant
Rating
Number of respondents
N = 828 visitor groups*
Figure 35: Importance of being outdoors Figure 36: Importance of getting physical exercise
48%
36%
12%
3%
<1%
0 500
Extremelyimportant
Veryimportant
Moderatelyimportant
Slightlyimportant
Not at allimportant
Rating
Number of respondents
N = 834 visitor groups*
Figure 37: Importance of viewing wildlife or natural scenery
Figure 38: Importance of spending time with friends/family
49%
30%
10%
5%
5%
0 200 400
Extremelyimportant
Veryimportant
Moderatelyimportant
Slightlyimportant
Not at allimportant
Rating
Number of respondents
N = 700 visitor groups*
Cuyahoga Valley National Park-Visitor Use Study July 24 – August 2, 2015
*total percentages do not equal 100 due to rounding **total percentages do not equal 100 because visitors could select more than 1 answer
37
44%
30%
18%
4%
5%
0 200 400
Extremelyimportant
Veryimportant
Moderatelyimportant
Slightlyimportant
Not at allimportant
Rating
Number of respondents
N = 782 visitor groups*
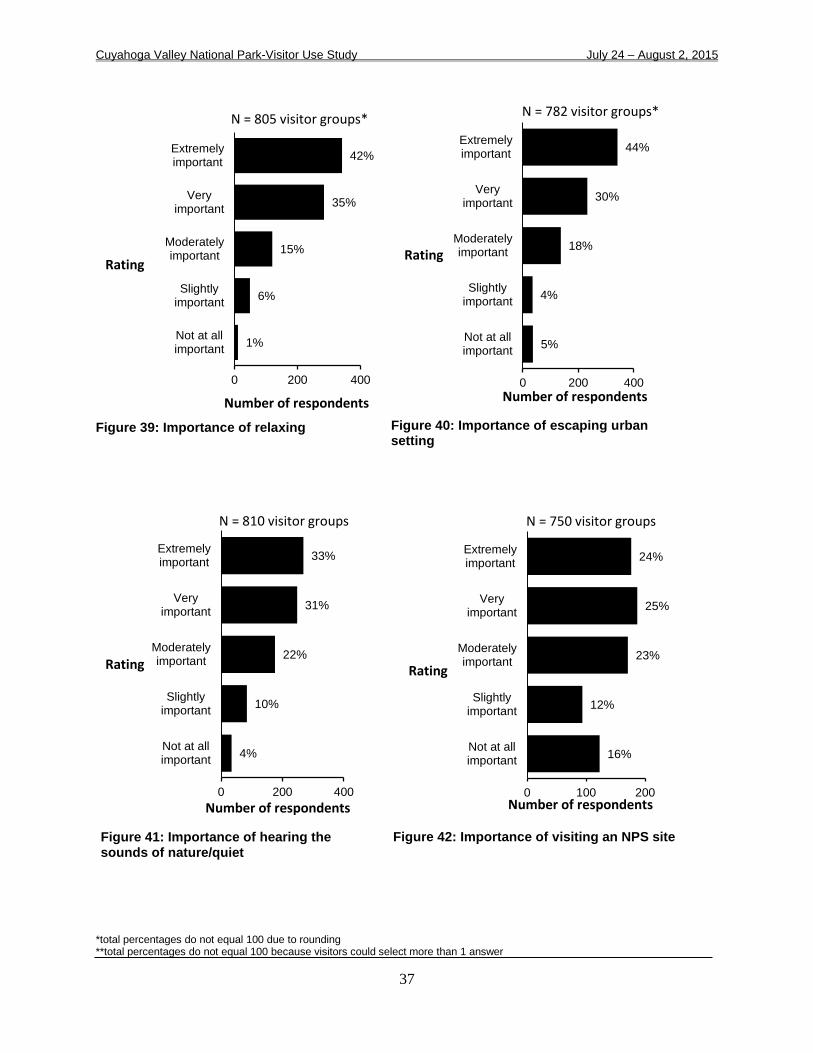
Figure 39: Importance of relaxing Figure 40: Importance of escaping urban setting
33%
31%
22%
10%
4%
0 200 400
Extremelyimportant
Veryimportant
Moderatelyimportant
Slightlyimportant
Not at allimportant
Rating
Number of respondents
N = 810 visitor groups
Figure 41: Importance of hearing the sounds of nature/quiet
24%
25%
23%
12%
16%
0 100 200
Extremelyimportant
Veryimportant
Moderatelyimportant
Slightlyimportant
Not at allimportant
Rating
Number of respondents
N = 750 visitor groups
Figure 42: Importance of visiting an NPS site
42%
35%
15%
6%
1%
0 200 400
Extremelyimportant
Veryimportant
Moderatelyimportant
Slightlyimportant
Not at allimportant
Rating
Number of respondents
N = 805 visitor groups*
Cuyahoga Valley National Park-Visitor Use Study July 24 – August 2, 2015
*total percentages do not equal 100 due to rounding **total percentages do not equal 100 because visitors could select more than 1 answer
38
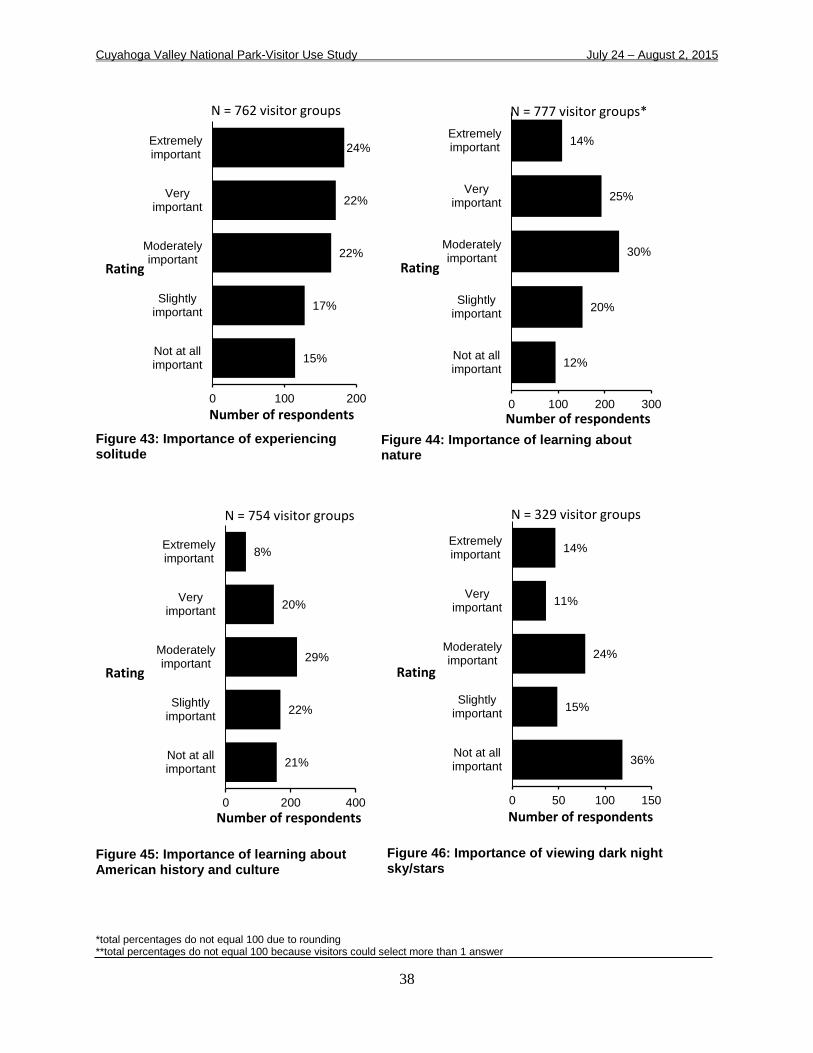
Figure 43: Importance of experiencing solitude
Figure 44: Importance of learning about nature
8%
20%
29%
22%
21%
0 200 400
Extremelyimportant
Veryimportant
Moderatelyimportant
Slightlyimportant
Not at allimportant
Rating
Number of respondents
N = 754 visitor groups
Figure 45: Importance of learning about American history and culture
14%
11%
24%
15%
36%
0 50 100 150
Extremelyimportant
Veryimportant
Moderatelyimportant
Slightlyimportant
Not at allimportant
Rating
Number of respondents
N = 329 visitor groups
Figure 46: Importance of viewing dark night sky/stars
24%
22%
22%
17%
15%
0 100 200
Extremelyimportant
Veryimportant
Moderatelyimportant
Slightlyimportant
Not at allimportant
Rating
Number of respondents
N = 762 visitor groups
14%
25%
30%
20%
12%
0 100 200 300
Extremelyimportant
Veryimportant
Moderatelyimportant
Slightlyimportant
Not at allimportant
Rating
Number of respondents
N = 777 visitor groups*

Cuyahoga Valley National Park-Visitor Use Study July 24 – August 2, 2015
*total percentages do not equal 100 due to rounding **total percentages do not equal 100 because visitors could select more than 1 answer
39
12%
10%
16%
21%
40%
0 100 200
Extremelyimportant
Veryimportant
Moderatelyimportant
Slightlyimportant
Not at allimportant
Rating
Number of respondents
N = 268 visitor groups*
Figure 47: Importance of attending a special event
Figure 48: Importance of other resource, quality, or attribute
60%
29%
2%
0%
9%
0 20 40
Extremelyimportant
Veryimportant
Moderatelyimportant
Slightlyimportant
Not at allimportant
Rating
Number of respondents
N = 59 visitor groups
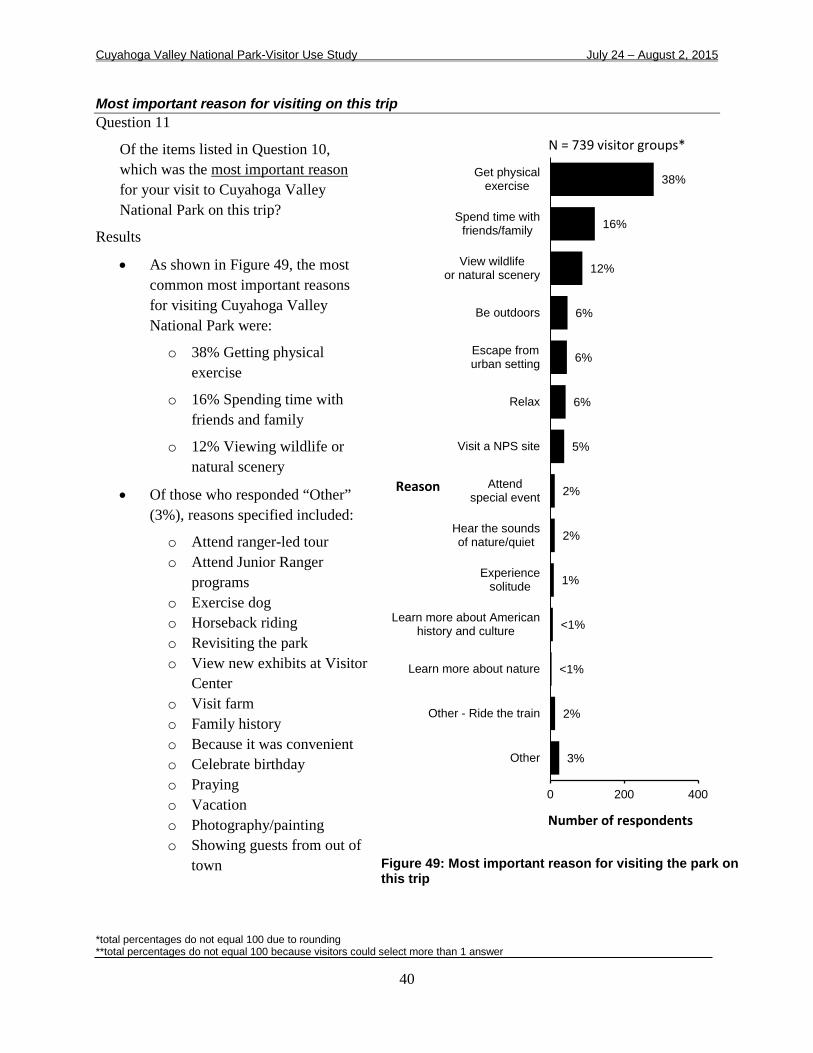
Cuyahoga Valley National Park-Visitor Use Study July 24 – August 2, 2015
*total percentages do not equal 100 due to rounding **total percentages do not equal 100 because visitors could select more than 1 answer
40
Most important reason for visiting on this trip Question 11
Of the items listed in Question 10, which was the most important reason for your visit to Cuyahoga Valley National Park on this trip?
Results
• As shown in Figure 49, the most common most important reasons for visiting Cuyahoga Valley National Park were:
o 38% Getting physical exercise
o 16% Spending time with friends and family
o 12% Viewing wildlife or natural scenery
• Of those who responded “Other” (3%), reasons specified included:
o Attend ranger-led tour o Attend Junior Ranger
programs o Exercise dog o Horseback riding o Revisiting the park o View new exhibits at Visitor
Center o Visit farm o Family history o Because it was convenient o Celebrate birthday o Praying o Vacation o Photography/painting o Showing guests from out of
town
38%
16%
12%
6%
6%
6%
5%
2%
2%
1%
<1%
<1%
2%
3%
0 200 400
Get physicalexercise
Spend time withfriends/family
View wildlifeor natural scenery
Be outdoors
Escape fromurban setting
Relax
Visit a NPS site
Attendspecial event
Hear the soundsof nature/quiet
Experiencesolitude
Learn more about Americanhistory and culture
Learn more about nature
Other - Ride the train
Other
Reason
Number of respondents
N = 739 visitor groups*
Figure 49: Most important reason for visiting the park on this trip

Cuyahoga Valley National Park-Visitor Use Study July 24 – August 2, 2015
*total percentages do not equal 100 due to rounding **total percentages do not equal 100 because visitors could select more than 1 answer
41
Forms of transportation Question 3a
Which of the following forms of transportation did you personally use to enter Cuyahoga Valley National Park on this trip?
Results (Figure 50)
• 90% of visitor groups used a car, truck, or SUV.
• 6% of visitor groups used a bicycle.
• Of those who responded “Other” (1%) forms of transportation specified included:
o Train
o Motorcycle
o Bus
o Scooter
Number of people in vehicle Question 3b
Number of people in car, truck, or SUV, including you.
Results (Figure 51)
• 42% of visitor groups traveled in a vehicle with one other person.
• 33% of visitor groups entered the park as the only person in the vehicle.
Figure 50: Transportation used to enter park
9%
7%
10%
42%
33%
0 100 200
5 or more
4
3
2
1
Number of people
Number of respondents
N = 426 visitor groups*
Figure 51: Number in car, truck, or SUV
90%
6%
2%
<1%
<1%
1%
0 500 1,000
Car, truck, or SUV
Bicycle
Walk/hike
Recreational vehicle ormotorhome
Tour bus or tour van
Other
Form of Transportation
Number of respondents
N = 862 visitor groups*

Cuyahoga Valley National Park-Visitor Use Study July 24 – August 2, 2015
*total percentages do not equal 100 due to rounding **total percentages do not equal 100 because visitors could select more than 1 answer
42
Number of people in recreational vehicle or motorhome Question 3c
Number of people in recreational vehicle or motorhome, including you.
Results (Figure 52)
• 41% of visitor groups entered the park as the only person in the RV/motorhome.
• 59% of visitor groups traveled in a RV/motorhome with one or more other people.
Figure 52: Number in RV or motorhome
0%
20%
18%
21%
41%
0 1 2 3
5 or more
4
3
2
1
Number of people
Number of respondents
N = 4 visitor groups*
*CAUTION: Number of respondents less than 30 visitor groups.

Cuyahoga Valley National Park-Visitor Use Study July 24 – August 2, 2015
*total percentages do not equal 100 due to rounding **total percentages do not equal 100 because visitors could select more than 1 answer
43
Signage on interstates directing visitors to the park Question 7a
On this visit, were the signs on interstates directing you to Cuyahoga Valley National Park adequate?
Results (Figure 53)
• 69% of visitor groups reported that signs on interstates were adequate.
Signage on local roadways directing visitors to the park Question 7b
On this visit, were the signs on local roadways directing you to Cuyahoga Valley National Park adequate?
Results (Figure 54)
• 85% of visitor groups reported that signs on local roadways were adequate.
Figure 53: Adequacy of signs on interstates
Figure 54: Adequacy of signs on local roadways
64%
6%
31%
0 200 400 600
Yes
No
Not sure
Adequate signs on interstates
Number of respondents
N = 785 visitor groups*
85%
4%
10%
0 200 400 600 800
Yes
No
Not sure
Adequate signs on local roadways
Number of respondents
N = 837 visitor groups*
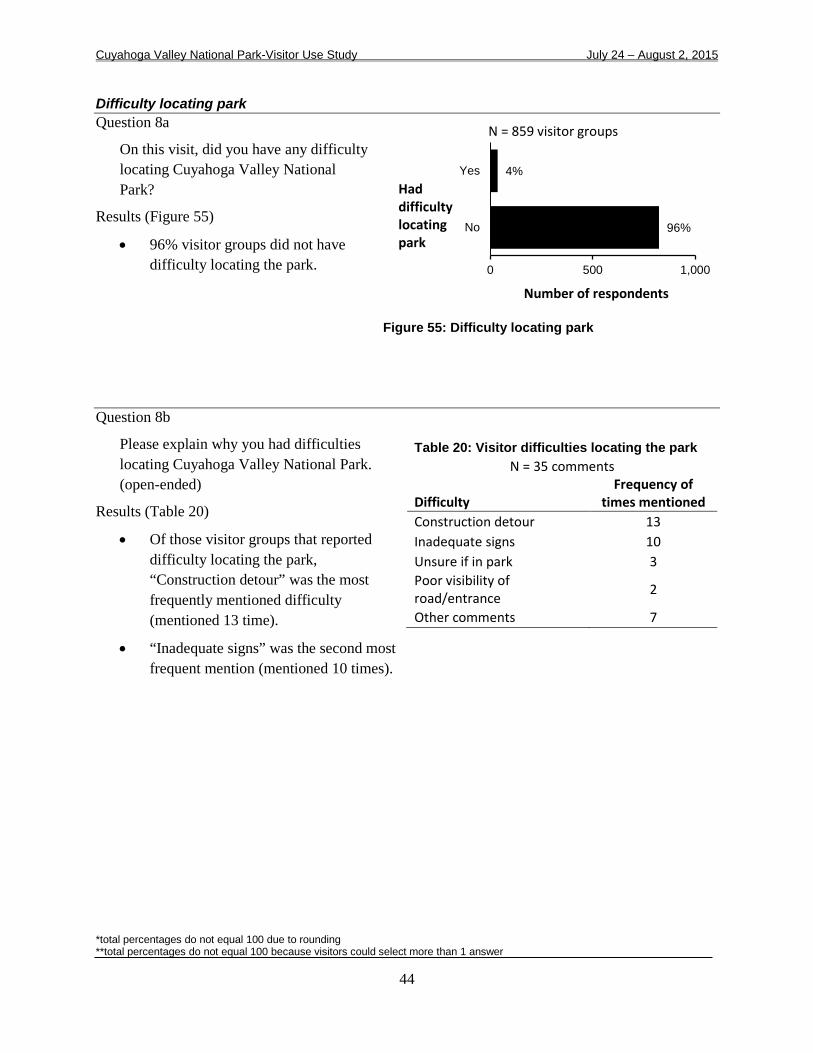
Cuyahoga Valley National Park-Visitor Use Study July 24 – August 2, 2015
*total percentages do not equal 100 due to rounding **total percentages do not equal 100 because visitors could select more than 1 answer
44
Difficulty locating park Question 8a
On this visit, did you have any difficulty locating Cuyahoga Valley National Park?
Results (Figure 55)
• 96% visitor groups did not have difficulty locating the park.
Question 8b
Please explain why you had difficulties locating Cuyahoga Valley National Park. (open-ended)
Results (Table 20)
• Of those visitor groups that reported difficulty locating the park, “Construction detour” was the most frequently mentioned difficulty (mentioned 13 time).
• “Inadequate signs” was the second most frequent mention (mentioned 10 times).
Table 20: Visitor difficulties locating the park N = 35 comments
Difficulty Frequency of
times mentioned Construction detour 13 Inadequate signs 10 Unsure if in park 3 Poor visibility of road/entrance 2
Other comments 7
4%
96%
0 500 1,000
Yes
No
Had difficulty locating park
Number of respondents
N = 859 visitor groups
Figure 55: Difficulty locating park

Cuyahoga Valley National Park-Visitor Use Study July 24 – August 2, 2015
*total percentages do not equal 100 due to rounding **total percentages do not equal 100 because visitors could select more than 1 answer
45
Signs inside the park Question 9a
On this visit, were the signs inside Cuyahoga Valley National Park adequate for you to find your way around the park?
Results (Figure 56)
• 92% of visitor groups reported that signs inside the park were adequate.
Question 9b
Please explain why signs inside the park were inadequate. (open-ended)
Results (Table 21)
• Of those visitor groups that reported that signs were in the park were not adequate, “Poor and/or inadequate signs in general” in the park was most frequent issue (mentioned 18 times).
• “Poor and/or inadequate signs on trails” in the park (mentioned 17 times).
• “Poor and/or inadequate signs at sites” in the park (mentioned 11 times).
Table 21: Issues with signs in park
N = 67 comments
Issue
Frequency of times
mentioned* Poor/inadequate signs 18 Poor/inadequate signs - trails 17 Poor/inadequate signs - sites 11 No signs to stay on trail 9 Poor/inadequate signs - roads 6 Poor/inadequate signs - Visitor Center 5 *Total mentions does not equal 67 due to weighting of responses.
92%
8%
0 500 1,000
Yes
No
Adequate signs in park
Number of respondents
N = 853 visitor groups
Figure 56: Adequacy of signs inside park
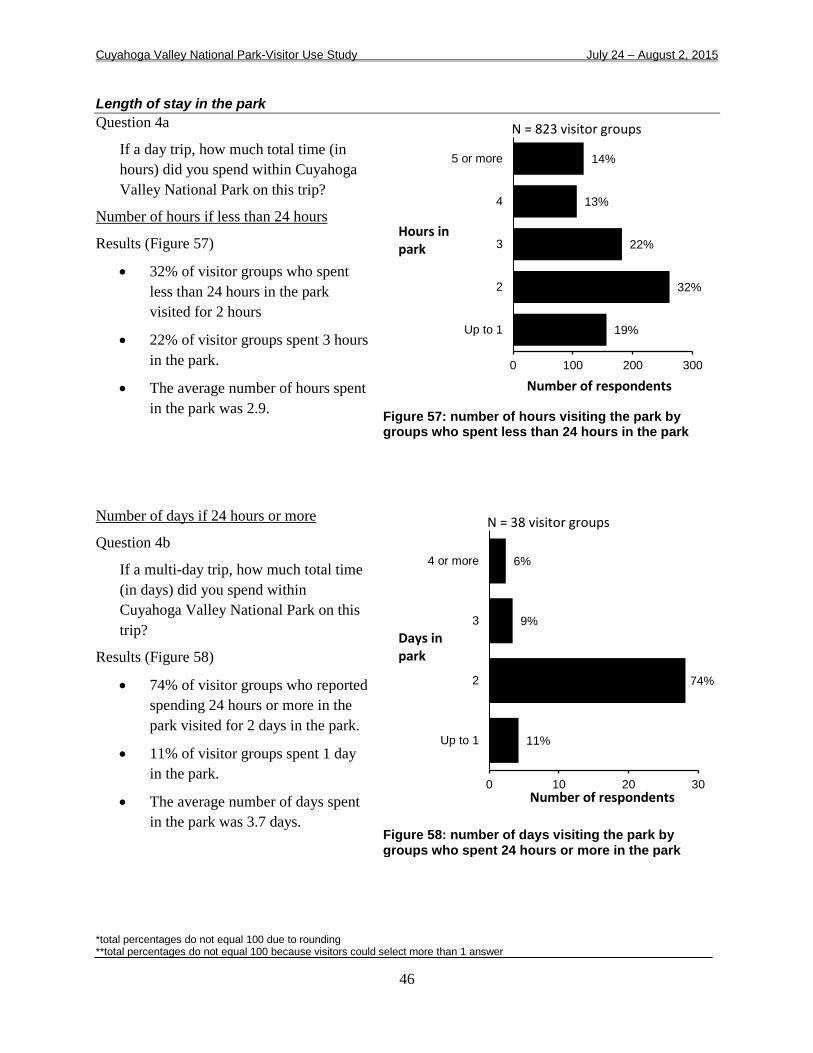
Cuyahoga Valley National Park-Visitor Use Study July 24 – August 2, 2015
*total percentages do not equal 100 due to rounding **total percentages do not equal 100 because visitors could select more than 1 answer
46
Length of stay in the park Question 4a
If a day trip, how much total time (in hours) did you spend within Cuyahoga Valley National Park on this trip?
Number of hours if less than 24 hours
Results (Figure 57)
• 32% of visitor groups who spent less than 24 hours in the park visited for 2 hours
• 22% of visitor groups spent 3 hours in the park.
• The average number of hours spent in the park was 2.9.
Number of days if 24 hours or more
Question 4b
If a multi-day trip, how much total time (in days) did you spend within Cuyahoga Valley National Park on this trip?
Results (Figure 58)
• 74% of visitor groups who reported spending 24 hours or more in the park visited for 2 days in the park.
• 11% of visitor groups spent 1 day in the park.
• The average number of days spent in the park was 3.7 days.
Figure 57: number of hours visiting the park by groups who spent less than 24 hours in the park
Figure 58: number of days visiting the park by groups who spent 24 hours or more in the park
14%
13%
22%
32%
19%
0 100 200 300
5 or more
4
3
2
Up to 1
Hours in park
Number of respondents
N = 823 visitor groups
6%
9%
74%
11%
0 10 20 30
4 or more
3
2
Up to 1
Days in park
Number of respondents
N = 38 visitor groups

Cuyahoga Valley National Park-Visitor Use Study July 24 – August 2, 2015
*total percentages do not equal 100 due to rounding **total percentages do not equal 100 because visitors could select more than 1 answer
47
Park Activities, Programs, and Services Activity participation Question 12
In which of the following activities did you personally participate, on this trip to Cuyahoga Valley National Park?
Results
• As shown in Figure 59, the most common activities in which visitor groups participated were:
o 59% View scenery
o 58% Hiked/walked.
o 37% Take a scenic drive/ Drive for pleasure.
• Of those who responded “Other” (4%), activities in which groups participated included:
o Buying park passes
o Visit Visitor Centers
o Playing
o Nature Quest
o Nature Realm
o Therapy
o Habitat restoration
o Visit a lodge
o Watch park movie
o Relaxing
o Visit with friends
59%
58%
37%
34%
21%
15%
14%
13%
11%
7%
7%
4%
4%
2%
<1%
<1%
<1%
6%
1%
4%
0 200 400 600
View scenery
Hiking/walking
Take a scenic drive/drive for pleasure
Bicycling
Visit historic houses/sites
Photography/painting
Jogging/running
Birdwatching/nature study
Dog walking
Picnicking
Attending farmers' market
Attend special programs/events/tours
Visiting a farm
Fishing
Canoeing/kayaking
Camping
Horseback riding
Other - train ride
Other - visit restaurant
Other
Activity
Number of respondents
N = 852 visitor groups**
Figure 59: Participation in activities on this trip
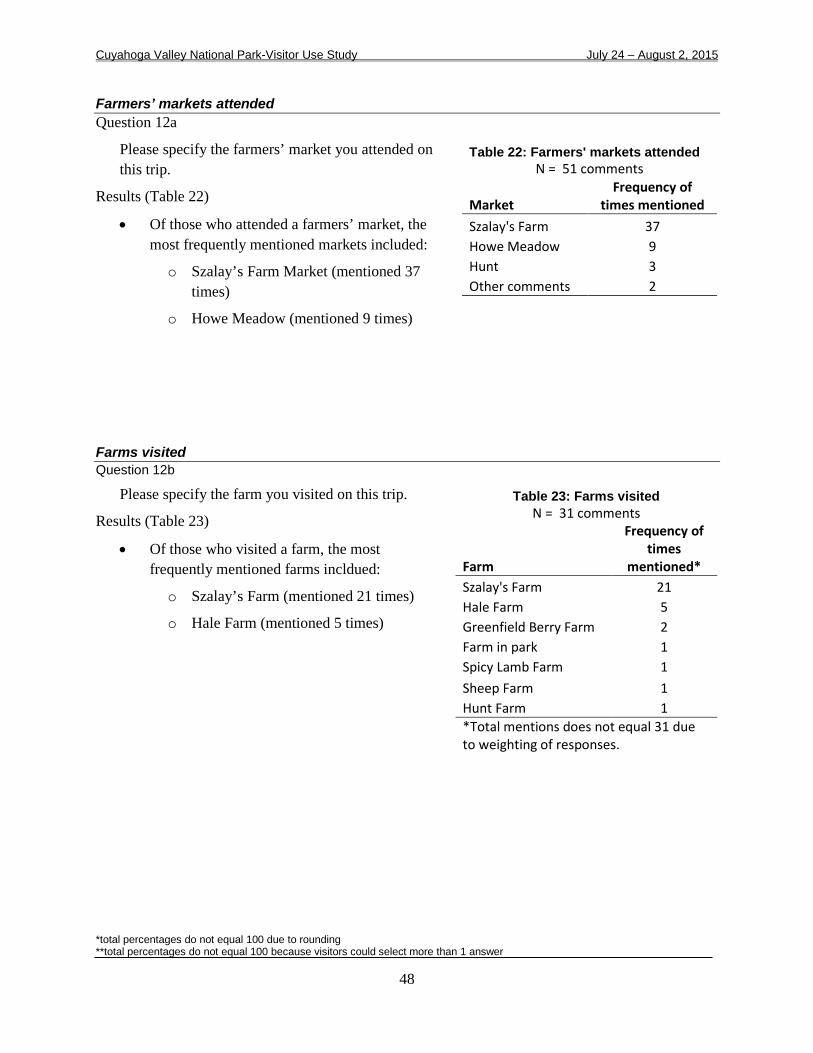
Cuyahoga Valley National Park-Visitor Use Study July 24 – August 2, 2015
*total percentages do not equal 100 due to rounding **total percentages do not equal 100 because visitors could select more than 1 answer
48
Farmers’ markets attended Question 12a
Please specify the farmers’ market you attended on this trip.
Results (Table 22)
• Of those who attended a farmers’ market, the most frequently mentioned markets included:
o Szalay’s Farm Market (mentioned 37 times)
o Howe Meadow (mentioned 9 times)
Farms visited Question 12b
Please specify the farm you visited on this trip.
Results (Table 23)
• Of those who visited a farm, the most frequently mentioned farms incldued:
o Szalay’s Farm (mentioned 21 times)
o Hale Farm (mentioned 5 times)
Table 22: Farmers' markets attended N = 51 comments
Market Frequency of
times mentioned Szalay's Farm 37 Howe Meadow 9 Hunt 3 Other comments 2
Table 23: Farms visited N = 31 comments
Farm
Frequency of times
mentioned* Szalay's Farm 21 Hale Farm 5 Greenfield Berry Farm 2 Farm in park 1 Spicy Lamb Farm 1 Sheep Farm 1 Hunt Farm 1 *Total mentions does not equal 31 due to weighting of responses.

Cuyahoga Valley National Park-Visitor Use Study July 24 – August 2, 2015
*total percentages do not equal 100 due to rounding **total percentages do not equal 100 because visitors could select more than 1 answer
49
Primary activity on this trip Question 13
Of the activities listed in Question 12, which was your primary activity on this trip to Cuyahoga Valley National Park?
Results
• As shown in Figure 60, the most common primary activities listed by visitors groups were:
o 29% Hiking/walking
o 28% Bicycling
• Of those who responded “Other” (1%), activities specified included:
o Buying park passes
o Visit Visitor Center
o Playing
o Nature Quest
o Relaxing
o Celebrate birthday
29%
28%
10%
7%
6%
5%
2%
1%
1%
1%
1%
<1%
<1%
<1%
<1%
<1%
<1%
<1%
1%
3%
0 100 200 300
Hiking/walking
Bicycling
Jogging/running
Dog walking
View scenery
Other - Riding the train
Photography/painting
Attend special events/programs/tours
Birdwatching/nature study
Take a scenic drive/drive for pleasure
Visit historichouses/sites
Attendingfarmers' market
Fishing
Picnicking
Canoeing/kayaking
Visiting a farm
Horseback riding
Camping
Other
No primary activity
Primary activity
Number of respondents
N = 820 visitor groups*
Figure 60: Primary activity on this trip to the park

Cuyahoga Valley National Park-Visitor Use Study July 24 – August 2, 2015
*total percentages do not equal 100 due to rounding **total percentages do not equal 100 because visitors could select more than 1 answer
50
Expenditures Total expenditures inside the park and nearby area Question 33
Please estimate how much you and your personal group with whom you shared expenses (e.g., other family members, traveling companions) spent both inside Cuyahoga Valley National Park and within the nearby area (within the shaded area of the map on p. 11) during this trip to Cuyahoga Valley National Park and the nearby area.
See Appendix 2 for map.
Results (Figure 61)
• 18% of visitor groups spent no money.
• 32% of visitor groups spent $1 to $25.
• The median group expenditure (50% of groups spent more and 50% of groups spent less) was $45.
• Average total expenditure per person (per capita, for those visitor groups that spent money) was $54.
Figure 61: Total expenditures inside the park and in nearby area
20%
3%
6%
9%
13%
32%
18%
0 100 200 300
$126 or more
$101-125
$76-100
$51-75
$26-50
$1-25
Spent no money
Total expenditures
Number of respondents
N = 724 visitor groups*

Cuyahoga Valley National Park-Visitor Use Study July 24 – August 2, 2015
*total percentages do not equal 100 due to rounding **total percentages do not equal 100 because visitors could select more than 1 answer
51
Total expenditures inside the park and nearby area Question 33
Please estimate how much you and your personal group with whom you shared expenses (e.g., other family members, traveling companions) spent both inside Cuyahoga Valley National Park and within the nearby area (within the shaded area of the map on p. 11) during this trip to Cuyahoga Valley National Park and the nearby area.
See Appendix 2 for map.
Results (Figure 62)
• The largest portions of total expenditures inside and near the park were for:
o 36% Hotels, motels, resorts
o 12% Snacks/beverages
o 12% Gas and oil
Hotels, motels, resorts, 36%
Gas and oil, 12%Snacks/beverages,
12%
Cuyahoga Valley Scenic Railroad, 8%
Groceries and convenience foods,
8%
Souvenirs, clothing, supplies, other retail,
6%
Camping fees, 2%
Equipment rental, 2%
Recreation and entertainment, 2%
Rental cars, 1%
Taxis, shuttles, and public transportation,
<1%, Guides and tour fees,
<1%
Other, 13% N = 724 visitor groups*
Figure 62: Proportion of total expenditures within park and nearby
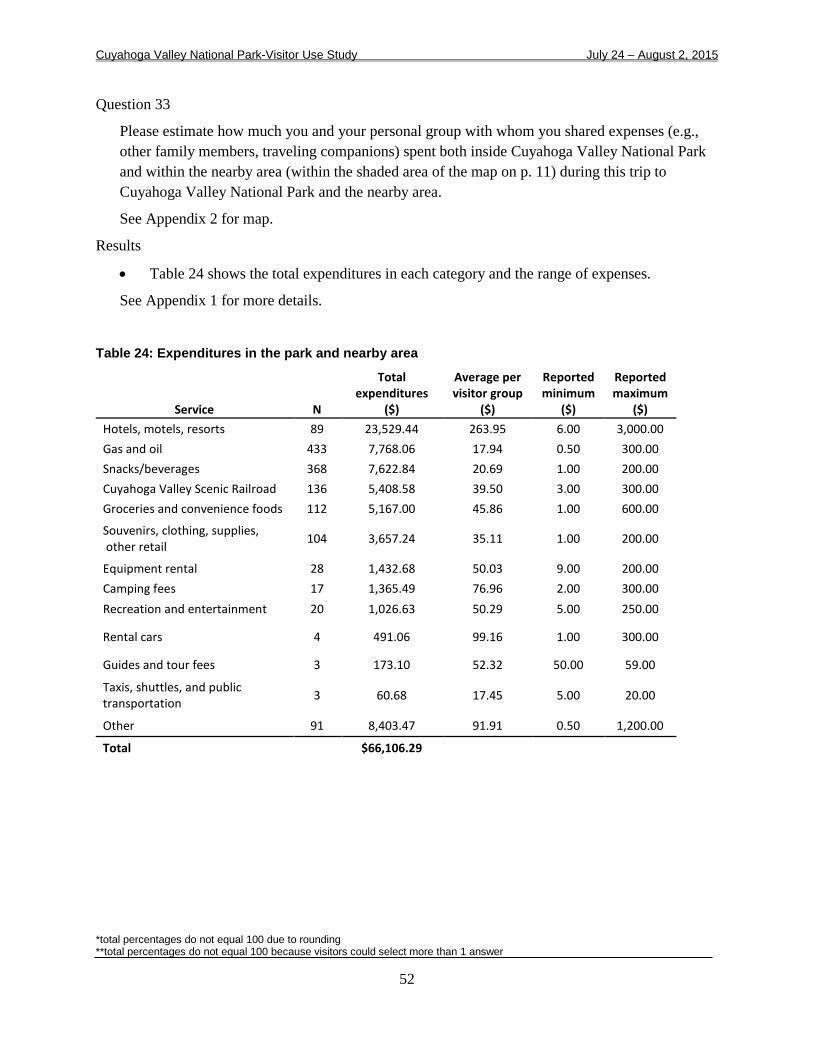
Cuyahoga Valley National Park-Visitor Use Study July 24 – August 2, 2015
*total percentages do not equal 100 due to rounding **total percentages do not equal 100 because visitors could select more than 1 answer
52
Question 33
Please estimate how much you and your personal group with whom you shared expenses (e.g., other family members, traveling companions) spent both inside Cuyahoga Valley National Park and within the nearby area (within the shaded area of the map on p. 11) during this trip to Cuyahoga Valley National Park and the nearby area.
See Appendix 2 for map.
Results
• Table 24 shows the total expenditures in each category and the range of expenses.
See Appendix 1 for more details.
Table 24: Expenditures in the park and nearby area
Service N
Total expenditures
($)
Average per visitor group
($)
Reported minimum
($)
Reported maximum
($) Hotels, motels, resorts 89 23,529.44 263.95 6.00 3,000.00 Gas and oil 433 7,768.06 17.94 0.50 300.00 Snacks/beverages 368 7,622.84 20.69 1.00 200.00 Cuyahoga Valley Scenic Railroad 136 5,408.58 39.50 3.00 300.00 Groceries and convenience foods 112 5,167.00 45.86 1.00 600.00
Souvenirs, clothing, supplies, other retail 104 3,657.24 35.11 1.00 200.00
Equipment rental 28 1,432.68 50.03 9.00 200.00 Camping fees 17 1,365.49 76.96 2.00 300.00 Recreation and entertainment 20 1,026.63 50.29 5.00 250.00
Rental cars 4 491.06 99.16 1.00 300.00
Guides and tour fees 3 173.10 52.32 50.00 59.00
Taxis, shuttles, and public transportation 3 60.68 17.45 5.00 20.00
Other 91 8,403.47 91.91 0.50 1,200.00
Total $66,106.29

Cuyahoga Valley National Park-Visitor Use Study July 24 – August 2, 2015
*total percentages do not equal 100 due to rounding **total percentages do not equal 100 because visitors could select more than 1 answer
53
Number of people covered by expenditures Question 34a
Including yourself, how many people in your personal group were covered by the expenses for this trip away from home?
Results (Figure 63)
• 41% of visitor groups had two members covered by expenses.
• 26% of visitor groups had one member covered by expenses.
See Appendix 1 for more details. Adults covered by expenses Question 34a
Including yourself, how many adults in your personal group were covered by the expenses for this trip away from home?
Results (Figure 64)
• 54% of visitor groups had two adults covered by expenses.
• 30% of visitor groups had one adult covered by expenses.
Figure 64: Adults covered by expenses
Figure 63: Visitors covered by expenses
11%
10%
11%
41%
26%
0 100 200 300
5 or more
4
3
2
1
Total visitors covered by expenses
Number of respondents
N = 672 visitor groups*
5%
3%
8%
54%
30%
0 100 200 300 400
5 or more
4
3
2
1
Adults covered by expenses
Number of respondents
N = 672 visitor groups

Cuyahoga Valley National Park-Visitor Use Study July 24 – August 2, 2015
*total percentages do not equal 100 due to rounding **total percentages do not equal 100 because visitors could select more than 1 answer
54
Children covered by expenses Question 34b
How many children in your personal group were covered by the expenses for this trip away from home?
Results (Figure 65)
• 44% of visitor groups that had children had two children covered by expenses.
• 32% of visitor groups that had children had one child covered by expenses.
Sharing of expenses Question 34c
Including yourself, how many people in your group split these trip expenses?
Results (Figure 66)
• 52% of visitor groups did not share trip expenses.
• 40% of visitor groups had two people split the expenses.
Figure 65: Children covered by expenses
Figure 66: Sharing of expenses in visitor group
3%
5%
16%
44%
32%
0 20 40 60 80 100
5 or more
4
3
2
1
Children covered by expenses
Number of respondents
N = 174 visitor groups
3%
2%
3%
40%
52%
0 50 100 150 200 250 300
5 or more
4
3
2
1
Number of people
Number of respondents
N = 478 visitor groups

Cuyahoga Valley National Park-Visitor Use Study July 24 – August 2, 2015
*total percentages do not equal 100 due to rounding **total percentages do not equal 100 because visitors could select more than 1 answer
55
Awareness of Park Partners Riding on the Cuyahoga Valley Scenic Railroad train Question 15
Have you or any of your group members ridden the Cuyahoga Valley Scenic Railroad train?
Results (Figure 67)
• 54% of visitor groups have ridden the train on a previous trip.
• 36% of visitor groups have not ridden the train.
Expectations for the Cuyahoga Valley Scenic Railroad train Question 16a
If you rode on the train on this trip to Cuyahoga Valley National Park, did it meet your expectations?
Results (Figure 68)
• 95% of visitor groups felt their expectations were met for the ride on the train.
15%
54%
36%
0 200 400 600
Yes, on this trip
Yes, on aprevious trip
No
Ridden train
Number of respondents
N = 855 visitor groups**
Figure 67: Riding the Scenic Railroad train
95%
5%
0 100 200 300
Yes
No
Train ride met expectations
Number of respondents
N = 266 visitor groups
Figure 68: Were expectations for train ride met?
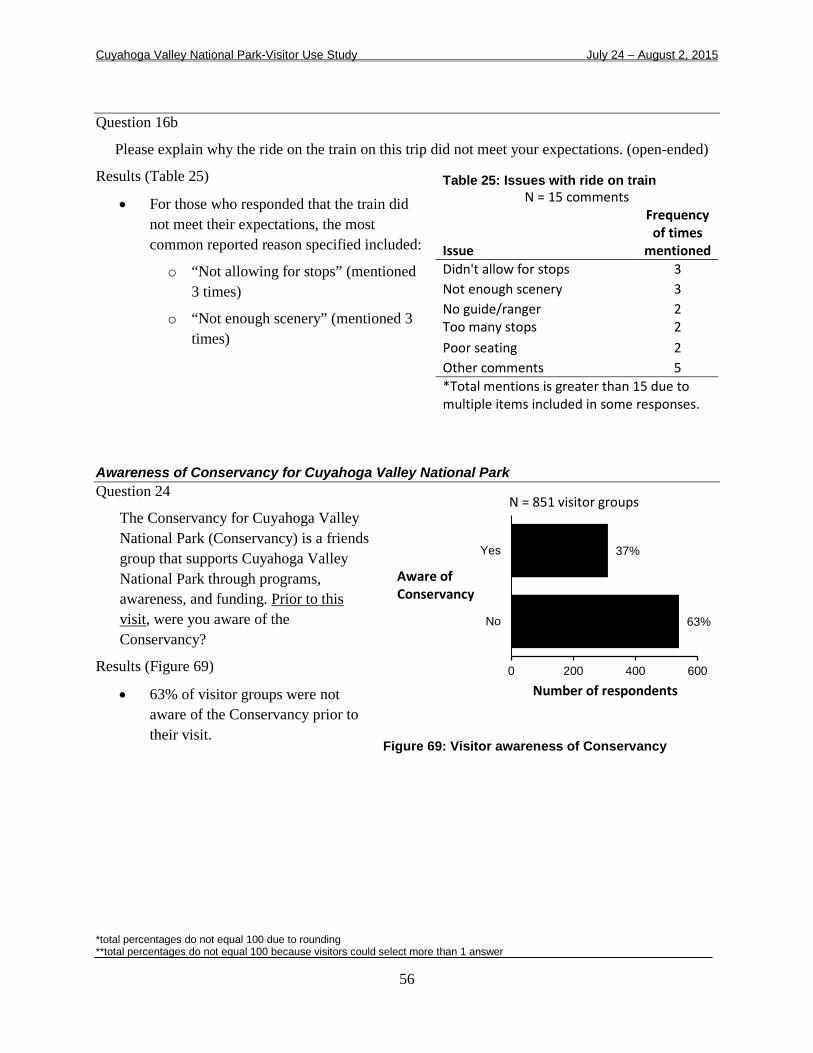
Cuyahoga Valley National Park-Visitor Use Study July 24 – August 2, 2015
*total percentages do not equal 100 due to rounding **total percentages do not equal 100 because visitors could select more than 1 answer
56
Question 16b
Please explain why the ride on the train on this trip did not meet your expectations. (open-ended)
Results (Table 25)
• For those who responded that the train did not meet their expectations, the most common reported reason specified included:
o “Not allowing for stops” (mentioned 3 times)
o “Not enough scenery” (mentioned 3 times)
Awareness of Conservancy for Cuyahoga Valley National Park Question 24
The Conservancy for Cuyahoga Valley National Park (Conservancy) is a friends group that supports Cuyahoga Valley National Park through programs, awareness, and funding. Prior to this visit, were you aware of the Conservancy?
Results (Figure 69)
• 63% of visitor groups were not aware of the Conservancy prior to their visit.
Table 25: Issues with ride on train N = 15 comments
Issue
Frequency of times
mentioned Didn't allow for stops 3 Not enough scenery 3 No guide/ranger 2 Too many stops 2 Poor seating 2 Other comments 5 *Total mentions is greater than 15 due to multiple items included in some responses.
37%
63%
0 200 400 600
Yes
No
Aware of Conservancy
Number of respondents
N = 851 visitor groups
Figure 69: Visitor awareness of Conservancy

Cuyahoga Valley National Park-Visitor Use Study July 24 – August 2, 2015
*total percentages do not equal 100 due to rounding **total percentages do not equal 100 because visitors could select more than 1 answer
57
Becoming a Conservancy member Question 25
Do you or would you be willing to support the Conservancy by becoming a member?
Results (Figure 70)
• 52% of visitor groups were not likely to become a member.
• 34% were likely to become a member in the future.
Reasons why visitors are not likely to become a member of Conservancy Question 25
If you are not likely to become a Conservancy member, please explain.
Results (Table 26)
• Of those visitor groups that were not likely to become a member of the Conservancy (52%), the most common reasons for why not likely included:
o “Distance from park” (mentioned 94 times)
o “No time” (mentioned 61 times)
o “Can’t afford” (mentioned 44 times)
Table 26: Reasons why not likely to become a member of Conservancy
N = 255 comments
Reason Frequency of times
mentioned Distance from park 94 No time 61 Can't afford 44 Not interested 32 Need more information 28 Committed to others 27 Infrequent visitor 23 Not sure 4 Used to be member 2 Other comments 1 *Total mentions is greater than 255 due to multiple items included in some responses.
9%
34%
52%
0 200 400 600
Already do this
Likely to dothis in future
Not likelyto do this
Become a member
Number of respondents
N = 865 visitor groups**
Figure 70: Likelihood of becoming member
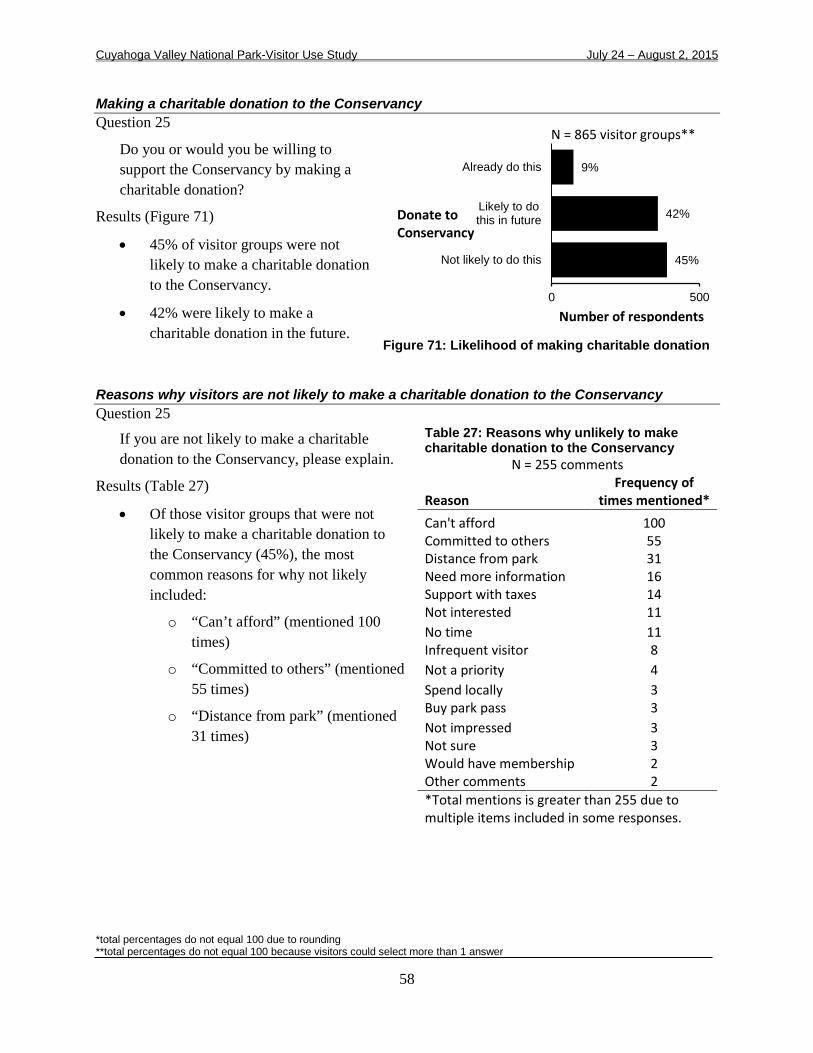
Cuyahoga Valley National Park-Visitor Use Study July 24 – August 2, 2015
*total percentages do not equal 100 due to rounding **total percentages do not equal 100 because visitors could select more than 1 answer
58
Making a charitable donation to the Conservancy Question 25
Do you or would you be willing to support the Conservancy by making a charitable donation?
Results (Figure 71)
• 45% of visitor groups were not likely to make a charitable donation to the Conservancy.
• 42% were likely to make a charitable donation in the future.
Reasons why visitors are not likely to make a charitable donation to the Conservancy Question 25
If you are not likely to make a charitable donation to the Conservancy, please explain.
Results (Table 27)
• Of those visitor groups that were not likely to make a charitable donation to the Conservancy (45%), the most common reasons for why not likely included:
o “Can’t afford” (mentioned 100 times)
o “Committed to others” (mentioned 55 times)
o “Distance from park” (mentioned 31 times)
Table 27: Reasons why unlikely to make charitable donation to the Conservancy
N = 255 comments
Reason Frequency of
times mentioned* Can't afford 100 Committed to others 55 Distance from park 31 Need more information 16 Support with taxes 14 Not interested 11 No time 11 Infrequent visitor 8 Not a priority 4 Spend locally 3 Buy park pass 3 Not impressed 3 Not sure 3 Would have membership 2 Other comments 2 *Total mentions is greater than 255 due to multiple items included in some responses.
9%
42%
45%
0 500
Already do this
Likely to dothis in future
Not likely to do this
Donate to Conservancy
Number of respondents
N = 865 visitor groups**
Figure 71: Likelihood of making charitable donation

Cuyahoga Valley National Park-Visitor Use Study July 24 – August 2, 2015
*total percentages do not equal 100 due to rounding **total percentages do not equal 100 because visitors could select more than 1 answer
59
Awareness of the Countryside Conservancy Question 26
The Countryside Conservancy has a partnership with Cuyahoga Valley National Park to increase public awareness about sustainable food and farming. Prior to this visit, were you aware of the Countryside Conservancy?
Results (Figure 72)
• 77% of visitor groups were not aware of the Countryside Conservancy prior to their visit.
23%
77%
0 500 1,000
Yes
No
Aware of Countryside Conservancy
Number of respondents
N = 849 visitor groups
Figure 72: Awareness of the Countryside Conservancy
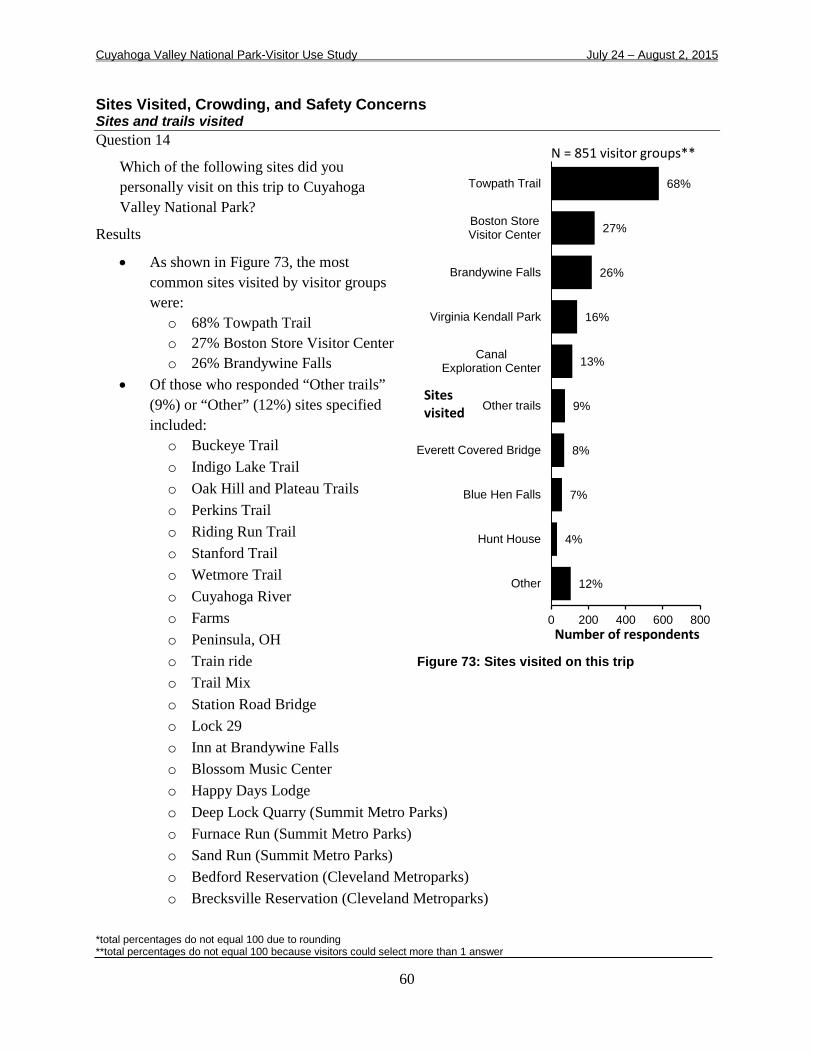
Cuyahoga Valley National Park-Visitor Use Study July 24 – August 2, 2015
*total percentages do not equal 100 due to rounding **total percentages do not equal 100 because visitors could select more than 1 answer
60
Sites Visited, Crowding, and Safety Concerns Sites and trails visited Question 14
Which of the following sites did you personally visit on this trip to Cuyahoga Valley National Park?
Results
• As shown in Figure 73, the most common sites visited by visitor groups were: o 68% Towpath Trail o 27% Boston Store Visitor Center o 26% Brandywine Falls
• Of those who responded “Other trails” (9%) or “Other” (12%) sites specified included: o Buckeye Trail o Indigo Lake Trail o Oak Hill and Plateau Trails o Perkins Trail o Riding Run Trail o Stanford Trail o Wetmore Trail o Cuyahoga River o Farms o Peninsula, OH o Train ride o Trail Mix o Station Road Bridge o Lock 29 o Inn at Brandywine Falls o Blossom Music Center o Happy Days Lodge o Deep Lock Quarry (Summit Metro Parks) o Furnace Run (Summit Metro Parks) o Sand Run (Summit Metro Parks) o Bedford Reservation (Cleveland Metroparks) o Brecksville Reservation (Cleveland Metroparks)
68%
27%
26%
16%
13%
9%
8%
7%
4%
12%
0 200 400 600 800
Towpath Trail
Boston StoreVisitor Center
Brandywine Falls
Virginia Kendall Park
CanalExploration Center
Other trails
Everett Covered Bridge
Blue Hen Falls
Hunt House
Other
Sites visited
Number of respondents
N = 851 visitor groups**
Figure 73: Sites visited on this trip

Cuyahoga Valley National Park-Visitor Use Study July 24 – August 2, 2015
*total percentages do not equal 100 due to rounding **total percentages do not equal 100 because visitors could select more than 1 answer
61
Perceived crowding during visit Question 19a
Did you feel crowded at any time during your visit to Cuyahoga Valley National Park on this trip?
Results (Figure 74)
• 78% of visitor groups did not feel crowded at any time.
Areas perceived as crowded Question 19b
Please list places where you felt crowded.
Results (Table 28)
• Of those visitor groups that reported feeling crowded, the following are the most frequently mentioned places were respondents felt crowded:
o Towpath Trail (mentioned 102 times)
o Brandywine falls (mentioned 21 times)
Table 28: Areas of perceived crowding N = 184 comments
Location
Frequency of times
mentioned* Towpath Trail 102 Brandywine Falls 21 Parking lots 11 Train station 7 Peninsula 6 Ira Road Trailhead 6 Other trailheads 5 Trails 4 Boston Store Visitor Center 4 Beaver Marsh 4 Szalay's Farm 3 Station Road 3 On train 2 Stanford House 2 Farmers' market 2 Road 2 Ledges 2 Other waterfalls 2 Trail Mix 2 Other comments 6 *Total mentions is greater than 184 due to multiple items included in some responses.
22%
78%
0 200 400 600 800
Yes
NoCrowded
Number of respondents
N = 851 visitor groups
Figure 74: Perceived crowding

Cuyahoga Valley National Park-Visitor Use Study July 24 – August 2, 2015
*total percentages do not equal 100 due to rounding **total percentages do not equal 100 because visitors could select more than 1 answer
62
Safety concerns while visiting the park Question 20
How safe did you feel during your visit to Cuyahoga Valley National Park on this trip?
Rating choices: 1 = Very safe 2 = Somewhat safe 3 = No opinion 4 = Somewhat unsafe 5 = Very unsafe
Results (Figure 75)
• 89% of visitor groups felt very safe from crime.
• 84% felt personal property was very safe from crime.
• 71% felt very safe from accidents.
Personal safety from crime Question 20
How safe did you feel during your visit to Cuyahoga Valley National Park on this trip?
Results (Figure 76)
• 89% of visitor groups felt very safe.
• 9% felt somewhat safe.
89%
9%
<1%
<1%
<1%
0 500 1,000
Very safe
Somewhat safe
No opinion
Somewhat unsafe
Very unsafe
Level of safety
Number of respondents
N = 852 visitor groups*
Figure 76: Ratings of personal safety from crime while visiting the park
Figure 75: Safety issues and visitors who felt "very safe"
N=852, 89%
N=852, 84%
N=851, 71%
0% 25% 50% 75% 100%
Personal safetyfrom crime
Personal propertysafety from crime
Personal safetyfrom accidents
Safety issue
Proportion of respondents
N = visitor groups that rated each

Cuyahoga Valley National Park-Visitor Use Study July 24 – August 2, 2015
*total percentages do not equal 100 due to rounding **total percentages do not equal 100 because visitors could select more than 1 answer
63
Personal property safety from crime Question 20
How safe did you feel during your visit to Cuyahoga Valley National Park on this trip?
Results (Figure 77)
• 84% of visitor groups felt very safe.
• 14% felt somewhat safe.
Personal safety from accidents Question 20
How safe did you feel during your visit to Cuyahoga Valley National Park on this trip?
Results (Figure 78)
• 71% of visitor groups felt very safe.
• 22% felt somewhat safe.
84%
14%
2%
<1%
<1%
0 500 1,000
Very safe
Somewhat safe
No opinion
Somewhat unsafe
Very unsafe
Level of safety
Number of respondents
N = 852 visitor groups*
Figure 77: Ratings of personal property safety from crime while visiting the park
71%
22%
2%
4%
<1%
0 500 1,000
Very safe
Somewhat safe
No opinion
Somewhat unsafe
Very unsafe
Level of safety
Number of respondents
N = 851 visitor groups*
Figure 78: Ratings of personal safety from accidents while visiting the park
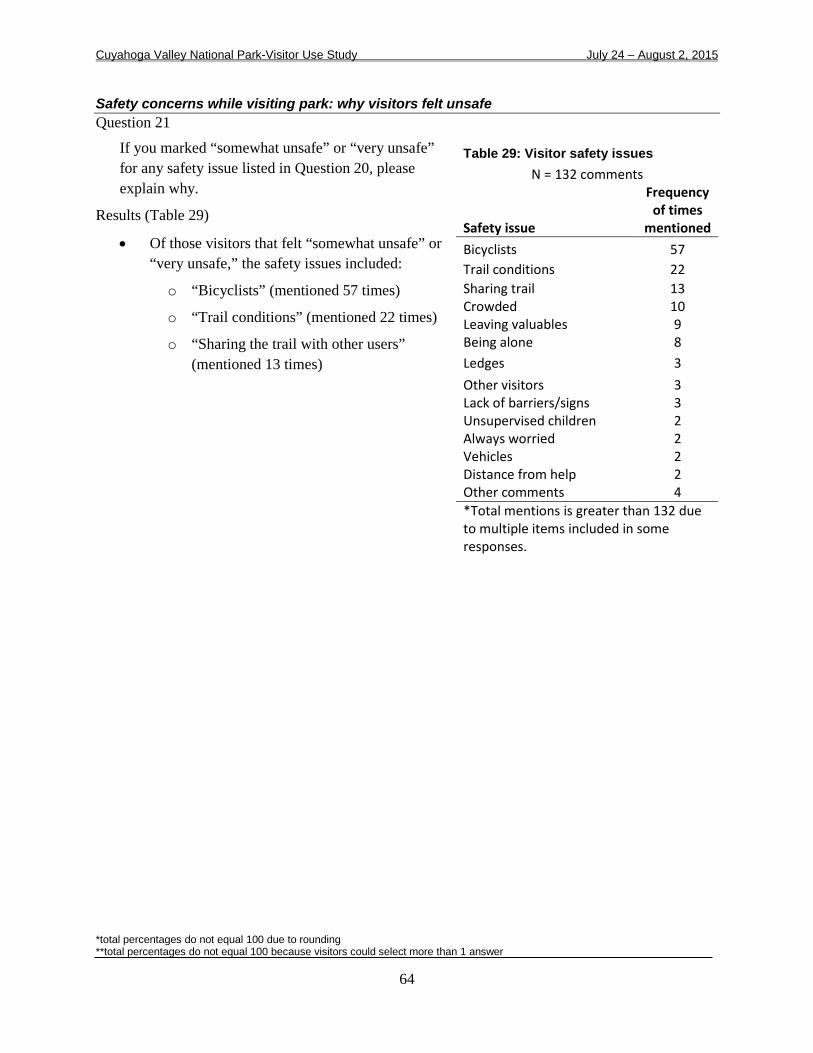
Cuyahoga Valley National Park-Visitor Use Study July 24 – August 2, 2015
*total percentages do not equal 100 due to rounding **total percentages do not equal 100 because visitors could select more than 1 answer
64
Safety concerns while visiting park: why visitors felt unsafe Question 21
If you marked “somewhat unsafe” or “very unsafe” for any safety issue listed in Question 20, please explain why.
Results (Table 29)
• Of those visitors that felt “somewhat unsafe” or “very unsafe,” the safety issues included:
o “Bicyclists” (mentioned 57 times)
o “Trail conditions” (mentioned 22 times)
o “Sharing the trail with other users” (mentioned 13 times)
Table 29: Visitor safety issues
N = 132 comments
Safety issue
Frequency of times
mentioned Bicyclists 57 Trail conditions 22 Sharing trail 13 Crowded 10 Leaving valuables 9 Being alone 8 Ledges 3 Other visitors 3 Lack of barriers/signs 3 Unsupervised children 2 Always worried 2 Vehicles 2 Distance from help 2 Other comments 4 *Total mentions is greater than 132 due to multiple items included in some responses.

Cuyahoga Valley National Park-Visitor Use Study July 24 – August 2, 2015
*total percentages do not equal 100 due to rounding **total percentages do not equal 100 because visitors could select more than 1 answer
65
Information Services Used on this Trip or Prior Information services used Question 17
Which of the following information services did you personally use on this trip and/or any previous trips to Cuyahoga Valley National Park?
Results
• As show in Figure 79, the most common information services used by visitor groups were:
o 77% Trailhead bulletin boards
o 75% Printed materials
o 63% Education signs/ outdoor exhibits
• The least common information services used by visitor groups on this trip were:
o 27% Ranger-led programs
o 27% Self-guided materials
o 21% Guest lectures and/or workshops
Figure 79: Information services used on this trip
21%
27%
27%
29%
29%
36%
38%
52%
56%
61%
63%
75%
77%
0 100 200 300 400 500 600 700
Guest lectures and/or workshops
Self-guidedmaterials
Ranger-ledtour programs
Audio tour on CuyahogaValley Scenic Railroad train
Audio-visualprograms
Concerts/cultural events/special events
Bookstore sales fromVisitor Center
Informationdesk staff
Roving rangers/volunteers
Visitor centerindoor exhibits
Education signs/outdoor exhibits
Printedmaterials
Trailheadbulletin boards
Service
Number of respondents
N = 851 visitor groups**

Cuyahoga Valley National Park-Visitor Use Study July 24 – August 2, 2015
*total percentages do not equal 100 due to rounding **total percentages do not equal 100 because visitors could select more than 1 answer
66
Information services used on this trip Question 17a
Which of the following information services did you personally use on this trip to Cuyahoga Valley National Park?
Results
• As show in Figure 80, the most common information services used by visitor groups on this trip were:
o 45% Trailhead bulletin boards
o 38% Printed materials
o 27% Roving rangers/volunteers who were available to answer questions
• The least common information services used by visitor groups on this trip were:
o 3% Ranger-led programs
o 2% Concerts, cultural events, and/or special events
o <1% Guest lectures and/or workshops
45%
38%
27%
24%
21%
19%
6%
5%
5%
4%
3%
2%
<1%
0 200 400
Trailheadbulletin boards
Printedmaterials
Roving rangers/volunteers
Education signs/outdoor exhibits
Informationdesk staff
Visitor centerindoor exhibits
Bookstore sales itemsfrom Visitor Center
Audio tour on CuyahogaValley Scenic Railroad train
Self-guidedmaterials
Audio-visualprograms
Ranger-ledtour programs
Concerts/cultural events/special events
Guest lecturesand/or workshops
Service
Number of respondents
N = 851 visitor groups**
Figure 80: Information services used on this trip

Cuyahoga Valley National Park-Visitor Use Study July 24 – August 2, 2015
*total percentages do not equal 100 due to rounding **total percentages do not equal 100 because visitors could select more than 1 answer
67
Information services used on a previous trip Question 17b
Which of the following information services did you personally use on a previous trip to Cuyahoga Valley National Park?
Results
• As show in Figure 81, the most common information services used by visitor groups on a previous trip were:
o 39% Printed materials
o 34% Visitor center indoor exhibits
o 34% Trailhead bulletin boards
• The least common information services used by visitor groups on a previous trip were:
o 9% Self-guided materials
o 8% Guest lectures and/or workshops
39%
34%
34%
31%
24%
23%
23%
19%
13%
12%
12%
9%
8%
0 200 400
Printedmaterials
Visitor centerindoor exhibits
Trailheadbulletin boards
Education signs/outdoor exhibits
Informationdesk staff
Concerts/cultural events/special events
Roving rangers/volunteers
Bookstore salesfrom Visitor Center
Ranger-ledtour programs
Audio tour on CuyahogaValley Scenic Railroad train
Audio-visualprograms
Self-guidedmaterials
Guest lecturesand/or workshops
Service
Number of respondents
N = 851 visitor groups**
Figure 81: Information services used on previous trips

Cuyahoga Valley National Park-Visitor Use Study July 24 – August 2, 2015
*total percentages do not equal 100 due to rounding **total percentages do not equal 100 because visitors could select more than 1 answer
68
Use of shuttle bus service Question 23a
Would you be likely to ride a shuttle bus, rather than drive, to your park destinations if you were to visit Cuyahoga Valley National Park in the future and such a service was available?
Results (Figure 82)
• 89% of visitor groups would not be likely to ride a shuttle bus in the future.
Use of shuttle bus service with ride on train Question 23b
Would you be likely to combine shuttle service with a ride on the Cuyahoga Valley Scenic Railroad if you were to visit Cuyahoga Valley National Park in the future and such a service was available?
Results (Figure 83)
• 71% of visitor groups would not be likely to combine shuttle service with a ride on the Cuyahoga Valley Scenic Railroad.
11%
89%
0 200 400 600 800
Likely
Not likely
Ride a shuttle bus
Number of respondents
N = 724 visitor groups
Figure 82: Use a shuttle service
29%
71%
0 500 1,000
Likely
Not likely
Combine shuttle bus with train
Number of respondents
N = 688 visitor groups
Figure 83: Combine shuttle service with train ride

Cuyahoga Valley National Park-Visitor Use Study July 24 – August 2, 2015
*total percentages do not equal 100 due to rounding **total percentages do not equal 100 because visitors could select more than 1 answer
69
Information about Future Visits Information source preferences for future visits Question 18a
If you were to visit in the future, are there information sources that you would prefer to use to learn about the natural and cultural history of Cuyahoga Valley National Park?
Results (Figure 84)
• 73% of visitor groups do not have information sources they would prefer to use.
27%
73%
0 500 1,000
Yes
No
Preference forinformation sources
Number of respondents
N = 807 visitor groups
Figure 84: Visitor groups with preferred information sources

Cuyahoga Valley National Park-Visitor Use Study July 24 – August 2, 2015
*total percentages do not equal 100 due to rounding **total percentages do not equal 100 because visitors could select more than 1 answer
70
Preferred information sources for future visits Question 18b
Specify information sources you would like to use.
Results (Figure 85)
• Of those visitor groups that had a preference for information sources (27%), the most common specified sources included:
o Printed materials (mentioned 58 times)
o The Internet mentioned (mentioned 54 times)
o Education signs/outdoor exhibits (mentioned 27 times)
• Guest lectures and/or workshops was mentioned least frequently (mentioned 2 times).
29%
26%
13%
11%
7%
6%
5%
5%
5%
4%
3%
2%
2%
2%
1%
1%
<1%
0 10 20 30 40 50 60 70
Printed materials
Internet
Education signs/outsideexhibits
Mobile app
Ranger-led tour programs
Park website
Roving rangers/volunteers
Audio tour on train
Trailhead bulletin boards
Audio tour
Visitor center indoor exhibits
Calendar of events
Concerts/culturalevents/special events
Audio-visual programs
Information desk staff
Guest lectures and/orworkshops
Other
Service
Number of respondents
N = 204 visitor groups***
Figure 85: Preferred information sources

Cuyahoga Valley National Park-Visitor Use Study July 24 – August 2, 2015
*total percentages do not equal 100 due to rounding **total percentages do not equal 100 because visitors could select more than 1 answer
71
Visitor Comments Additional comments Question 42
Is there anything else you and your groups would like to tell us about your trip to Cuyahoga Valley National Park?
Table 30: Additional comments N=463 comments
some visitor groups may have made more than one comment
Comment Frequency of times mentioned
PERSONNEL Park personnel helpful/friendly/knowledgeable/etc. 27 Volunteers helpful/friendly/knowledgeable/etc. 3
POLICIES/MANAGEMENT Well managed 11 Glad the park is preserved 4 Keep the park as is 3 Dog management/policies are appreciated 2 Allow camping 2 Other comments 17
INTERPRETIVE AND INFORMATION SERVICES Needed additional information 15 Provide information/teach visitors about trail courtesy 6 More programs should be offered 1 Other comments 4
FACILITIES AND MAINTENANCE Improve trails (e.g., quality of trail, bridges) 11 The park is well maintained 9 Improve general park maintenance 6 Improve trail signage 6 Add additional trash receptacles 4 Trails are well maintained 6 The park was very clean 2 Other comments 10

Cuyahoga Valley National Park-Visitor Use Study July 24 – August 2, 2015
*total percentages do not equal 100 due to rounding **total percentages do not equal 100 because visitors could select more than 1 answer
72
Table 30: Additional comments N=463 comments
some visitor groups may have made more than one comment
Comment Frequency of times mentioned
GENERAL COMMENTS Enjoyed the park 105 Live nearby 32 Beautiful 17 Will return 16 Good work, keep it up 9 Enjoyed biking in the park 8 Enjoyed hiking in the park 7 Visit often 7 Bike aboard program is great 6 Enjoyed the railroad 6 Local treasure 6 Thank you 5 The park adds to the quality of life 4 Enjoyed being in nature 3 Enjoyed running in the park 3 Park was clean 2 Other comments 74

Cuyahoga Valley National Park-Visitor Use Study July 24 – August 2, 2015
*total percentages do not equal 100 due to rounding **total percentages do not equal 100 because visitors could select more than 1 answer
73
Literature Cited Dillman, D. A., J. D. Smyth, and L. M. Christian. 2014. Internet, Phone, Mail, and Mixed-Mode
Surveys: The Tailored Design, 4th edition. Wiley, Hoboken, New Jersey.
Dorofeev, S. and P. Grant. 2006. Statistics for Real Life Sample Surveys: Non-simple-random Samples and Weighted Data. London, Cambridge University Press.
Fowler, F.J. 1993. Survey Research Methods, 2nd Edition. SAGE Publications, Newbury Park, California.

Cuyahoga Valley National Park-Visitor Use Study July 24 – August 2, 2015
74
Appendix 1: Descriptive Statistics Table 31 shows the mean, median, and standard deviation for those variables for which measures of central tendency can be computed.
Table 31: Mean/median/standard deviation of selected variables Question Number Description N Mean Median
Standard Deviation
Q01A Number of adults in personal group 865 1.90 2.00 2.18 Q01B Number of children in personal group 231 2.11 2.00 2.47 Q01C Group size 865 2.46 2.00 3.26 Q03B Number of people per vehicle 426 2.22 2.00 1.35 Q03C Number of people within RV 4 2.18 1.98 1.33 Q04A Number of hours in the park 823 2.91 2.00 2.32 Q04B Number of days in the park 38 3.73 2.00 9.91 Q10A Importance of reason for visiting: to visit a NPS site 750 2.73 3.00 1.38
Q10B Importance of reason for visiting: to escape from urban setting 782 1.97 2.00 1.10
Q10C Importance of reason for visiting: to spend time with friends/family 700 1.87 2.00 1.12
Q10D Importance of reason for visiting: to view wildlife or natural scenery 834 1.72 2.00 0.83
Q10E Importance of reason for visiting: to get physical exercise 826 1.63 1.00 0.89
Q10F Importance of reason for visiting: to relax 805 1.89 2.00 0.96
Q10G Importance of reason for visiting: to learn more about American history and culture 754 3.28 3.00 1.23
Q10H Importance of reason for visiting: to learn more about nature 777 2.91 3.00 1.22
Q10I Importance of reason for visiting: to attend a special event 268 3.67 4.00 1.40
Q10J Importance of reason for visiting: to hear the sounds of nature/quiet 810 2.22 2.00 1.14
Q10K Importance of reason for visiting: to experience solitude 762 2.76 3.00 1.38
Q10L Importance of reason for visiting: to be outdoors 828 1.50 1.00 0.72
Q10M Importance of reason for visiting: to view dark night sky/stars 329 3.48 4.00 1.43
Q10N Importance of reason for visiting: other 59 1.69 1.00 1.16 Q20A How safe did you feel: personal property from crime 852 1.20 1.00 0.50 Q20B How safe did you feel: personal safety from crime 852 1.13 1.00 0.41 Q20C How safe did you feel: personal safety from accidents 851 1.41 1.00 0.79 Q29B Nights camping in the park 7 9.74 1.00 22.32 Q29B Nights camping outside the park 8 2.87 2.90 1.35 Q29B Nights in lodging in the park 8 2.13 2.00 1.00 Q29B Nights lodging outside the park 52 1.93 1.00 1.85 Q29B Nights in other accommodations 22 3.71 2.80 2.75 Q32A Numbers of days entering or re-entering the park 691 1.16 1.00 0.53 Q33A Expenditures on gas and oil 433 17.*4 10.00 27.81 Q33B Expenditures on rental cars 4 99.16 100.00 89.98

Cuyahoga Valley National Park-Visitor Use Study July 24 – August 2, 2015
75
Table 31: Mean/median/standard deviation of selected variables Question Number Description N Mean Median
Standard Deviation
Q33C Expenditures on taxis, shuttles, and public transportation 3 17.45 20.00 6.68
Q33D Expenditures on snacks/beverages 368 20.69 15.00 23.46 Q33E Expenditures on groceries and convenience foods 115 45.86 20.00 99.68 Q33F Expenditures on hotels, motels, resorts 89 263.95 150.00 331.15 Q33G Expenditures on camping feeds 17 76.96 91.54 58.96
Q33H Expenditures on recreation and entertainment expenses 20 50.29 47.03 48.86
Q33I Expenditures on souvenirs, clothing, supplies, other retail 104 35.11 25.00 37.19
Q33J Expenditures on equipment rental 28 50.03 40.00 41.16 Q33K Expenditures on Cuyahoga Valley Scenic Railroad 136 39.50 32.00 40.41 Q33L Expenditures on guides and tour fees 3 52.32 50.00 4.71 Q33M Expenditures on other 91 91.91 35.00 163.93 Q33 Total expenditures inside and nearby the park 596 123.95 45.00 257.38
Q34A Adults covered by expenses 672 2.12 2.00 1.86 Q34B Children covered by expenses 174 2.16 2.00 1.69 Q34 Visitors covered by expenses 672 2.66 2.00 2.41
Q34C Visitors splitting expenses 478 1.79 1.00 1.98 Q36A Current age: respondent 846 51.50 53.00 14.45 Q40 Number of people in household 834 2.71 2.00 1.39

Cuyahoga Valley National Park-Visitor Use Study July 24 – August 2, 2015
76
Appendix 2: The Questionnaire

Social Science Program National Park Service U.S. Department of the Interior Visitor Services Project
Cuyahoga Valley
National Park
Visitor Study
2015

Cuyahoga Valley National Park Visitor Survey

Cuyahoga Valley National Park Visitor Survey
OMB Approval 1024-0224 Expiration date: 10-31-2015
United States Department of the Interior
NATIONAL PARK SERVICE Cuyahoga Valley National Park
15610 Vaughn Road Brecksville, OH 44141-3018
July 2015 Dear Visitor: Thank you for participating in this important study. We want to learn about the expectations, opinions, and interests of visitors to Cuyahoga Valley National Park. This information will help us improve our management of this park and better serve you, our visitor. This questionnaire will be given to only a few visitors, so your participation is very important! It should only take about 20 minutes after your visit to complete. When your visit is over, please complete the questionnaire. Place the completed questionnaire in the pre-paid envelope provided, and drop it in any U.S. Postal Service mailbox. If you have any questions, please contact the Social Science Program Chief, National Park Service, 1201 Oakridge Drive, Fort Collins, CO, 80525-5596; [email protected] (email). We appreciate your help. Sincerely,
Craig Kenkel Superintendent

Cuyahoga Valley National Park Visitor Survey
DIRECTIONS
At the end of your visit:
1. Please have the adult in your group (at least 18 years old) who has the next birthday complete this questionnaire. That will help give us a statistically reliable sample.
2. For questions that use circles (O), please mark your answer by filling in the
circle with black or blue ink. Please do not use pencil.
3. Seal the completed questionnaire in the postage-paid envelope provided. 4. Drop the sealed envelope in a U.S. Postal Service mailbox.
Paperwork Reduction and Privacy Act Statement: The Paperwork Reduction Act requires us to tell you why we are collecting this information, how we will use it, and whether or not you have to respond. This information will be used by the National Park Service as authorized by 16 U.S.C. 1a-7. We will use this information to evaluate visitor services and facilities managed by Cuyahoga Valley National Park. Your responses are voluntary and anonymous. Your name and address have been requested for follow-up purposes only. At the completion of this collection all names and personal information will be destroyed and in no way be connected with the results of this survey. A Federal agency may not conduct or sponsor and you are not required to respond to, a collection of information unless it displays a currently valid OMB Control Number. BURDEN ESTIMATE: We estimate that it will take an average of 20 minutes to complete the survey associated with this collection of information. You may send comments concerning the burden estimates or any aspect of this information collection to the Social Science Program Chief, National Park Service, 1201 Oakridge Drive, Fort Collins, CO, 80525-5596; [email protected] (email).

Cuyahoga Valley National Park Visitor Survey 1
A. Trip Description
Please have the adult (at least 18 years old) in your group, who has the next birthday, complete this questionnaire.
NOTE: In this questionnaire, your personal group is defined as anyone with whom you visited Cuyahoga Valley National Park on this trip, such as a spouse, family, friends, etc. This does not include the larger group that you might have traveled with, such as a school, church, scout, or tour group.
1. Including yourself, how many people were in your personal group on this trip to Cuyahoga Valley National Park?
Number of adults (18 years or older)
Number of children (under 18 years)
2. On this trip to Cuyahoga Valley National Park, what type of group were you with? Please mark (●) one.
O Alone
O Friends
O Family
O Family and friends
O Other (Please specify)
3. Which of the following forms of transportation did you personally use to enter Cuyahoga Valley National Park on this trip? Please mark (●) one.
O Car, truck, or SUV (Number of people in vehicle, including you)
O Recreational vehicle or motorhome
(Number of people in vehicle, including you) __________
O Tour bus or tour van
O Bicycle
O Walk/hike
O Other (Please specify)

2 Cuyahoga Valley National Park Visitor Survey 4. On this trip, how much total time did you spend within Cuyahoga Valley
National Park?
Number of hours, if a day trip
Number of days, if greater than 1 day
B. Trip Planning and Motivations
5. Prior to this visit, how did you and any other member of your personal group obtain information about Cuyahoga Valley National Park? Please mark (●) all that apply.
O Did not obtain information prior to this visit
O Previous visits
O Friends/relatives/word of mouth
O Park staff/volunteer at an event in my community
O Walking/driving by and saw park signs
O Travel guides/tour books/brochures
O Television/radio/newspapers/magazines
O Telephone/e-mail/written inquiry to park
O Cuyahoga Valley National Park webpage (www.nps.gov/cuva)
O Conservancy webpage (www.conservancyforcvnp.org)
O Ohio and Erie Canal webpage (www.ohioanderiecanalway.org)
O Other website (Please specify)
O Social media
O Mobile app
O School class or program
O Other (Please specify)
Cuyahoga Valley National Park Visitor Survey 3 6. Did you and your personal group have the type of information about Cuyahoga
Valley National Park you needed on this trip? Please mark (●) one.
O Yes
O No (Please specify information you needed but didn’t have on this trip)
7. On this visit, were the signs directing you to Cuyahoga Valley National Park adequate? Please mark (●) one for each row.
Yes No Not sure
Signs on interstates O O O
Signs on local roadways O O O
8. On this visit, did you have any difficulty locating Cuyahoga Valley National Park? Please mark (●) one.
O Yes (Please explain)
O No
9. On this visit, were the signs inside Cuyahoga Valley National Park adequate for you to find your way around the park? Please mark (●) one.
O Yes
O No (Please explain)
4 Cuyahoga Valley National Park Visitor Survey
10. Cuyahoga Valley National Park protects cultural and natural resources, while at the same time also providing for public enjoyment. How important to you was each of the following resources/qualities/attributes as a reason for visiting the park on this trip? Please mark (●) one for each row.
Extr
emel
y Im
port
ant
Very
Im
port
ant
Mod
erat
ely
Impo
rtan
t
Slig
htly
Im
port
ant
Not
at A
ll Im
port
ant
Not
Ap
plic
able
To visit a National Park Service site O O O O O O
To escape from urban setting O O O O O O
To spend time with friends/family O O O O O O
To view wildlife or natural scenery O O O O O O
To get physical exercise O O O O O O
To relax O O O O O O
To learn more about American history and culture O O O O O O
To learn more about nature O O O O O O
To attend a special event
(Please specify)________________ O O O O O O
To hear the sounds of nature/quiet O O O O O O
To experience solitude O O O O O O
To be outdoors O O O O O O
To view dark night sky/stars O O O O O O
Other (Please specify) ____________________________ O O O O O O
11. Of the items listed in Question 10, which was the most important reason for
you to visit Cuyahoga Valley National Park on this trip?
Cuyahoga Valley National Park Visitor Survey 5
C. Park Activities, Programs, and Services
12. In which of the following activities did you personally participate, on this trip to Cuyahoga Valley National Park? Please mark (●) all that apply.
O Take a scenic drive/drive for pleasure
O Visit historic houses/sites
O Attend special programs/events/tours (nature walks, concerts, etc.)
O Hiking/walking
O Dog-walking
O Jogging/running
O Bicycling
O Horseback riding
O Canoeing/kayaking
O Fishing
O Attending farmers’ market (Please specify)
O Visiting a farm (Please specify)
O Picnicking
O Photography/painting
O View scenery
O Birdwatching/nature study
O Camping
O Other (Please specify)
13. Of the activities listed in Question 12, which was your primary activity on this
trip to Cuyahoga Valley National Park? Please list one activity.
OR
O I did not have a primary activity on this trip to Cuyahoga Valley National Park.

6 Cuyahoga Valley National Park Visitor Survey 14. Which of the following sites did you personally visit on this trip to Cuyahoga Valley
National Park? Please mark (●) one for each row.
Visited this site
Did not visit this site
Don’t know/ Not sure
Canal Exploration Center O O O Boston Store Visitor Center O O O Hunt House O O O Towpath Trail O O O Virginia Kendall Park (Ledges, Octagon, Salt Run, Virginia Kendall Lake & Hills, Cross Country)
O O O
Other Trails (Please specify) _____________________________ O O O
Everett Covered Bridge O O O Brandywine Falls O O O Blue Hen Falls O O O Other (Please specify) _____________________________ O O O Other (Please specify) _____________________________ O O O
15. Have you or any of your group members ridden the Cuyahoga Valley Scenic Railroad train? Please mark (●) all that apply.
O Yes, on this trip to Cuyahoga Valley National Park
O Yes, on a previous trip to Cuyahoga Valley National Park
O No
16. If you rode on the train on this trip to Cuyahoga Valley National Park, did it meet your expectations? Please mark (●) one.
O Yes
O No (Please explain)
O Not applicable (Didn’t ride the train on this trip)
Cuyahoga Valley National Park Visitor Survey 7 17. Which of the following information services did you personally use on this trip
and/or any previous trips to Cuyahoga Valley National Park? Please mark (●) all that apply for this trip and any previous trips.
Used on
this trip Used on a
previous trip Did not
use Printed materials (e.g., books, brochures, maps, park newspaper) O O O Concerts/cultural events/special events O O O
Ranger-led tour programs O O O Guest lectures and/or workshops to improve skills (e.g., birdwatching, photography)
O O O
Assistance from information desk staff O O O Roving rangers/volunteers available to answer questions O O O
Trailhead bulletin boards O O O Self-guided materials (e.g., Quests, Junior Ranger activity books) O O O
Education signs/outside exhibits O O O Visitor center indoor exhibits O O O Bookstore sales items from Visitor Center O O O Audio-visual programs (e.g., videos, movies, slideshows) O O O Audio tour on Cuyahoga Valley Scenic Railroad train O O O
18. If you were to visit in the future, are there information sources that you would
prefer to use to learn about the natural and cultural history of Cuyahoga Valley National Park? Please mark (●) one.
O Yes (Specify information sources you’d like to use)
O No

8 Cuyahoga Valley National Park Visitor Survey 19. Did you feel crowded at any time during your visit to Cuyahoga Valley National
Park on this trip? Please mark (●) one.
O Yes (Please list places where you felt crowded)
O No
20. How safe did you feel during your visit to Cuyahoga Valley National Park on this trip? Please mark (●) one for each row.
Safety Issue Very safe
Somewhat safe
No opinion
Somewhat unsafe
Very unsafe
Personal property from crime O O O O O
Personal safety
from crime O O O O O
Personal safety
from accidents O O O O O
21. If you marked “somewhat unsafe” or “very unsafe” for any safety issue listed in Question 20, please explain why.
22. a) Did anyone in your personal group have a physical condition that made it difficult to access or participate in park activities or services, on this trip to Cuyahoga Valley National Park? Please mark (●) one.
O Yes
O No Go to Question 23
b) If YES, what activities, services, or facilities did the person(s) have difficulty participating in or accessing? Please be specific.
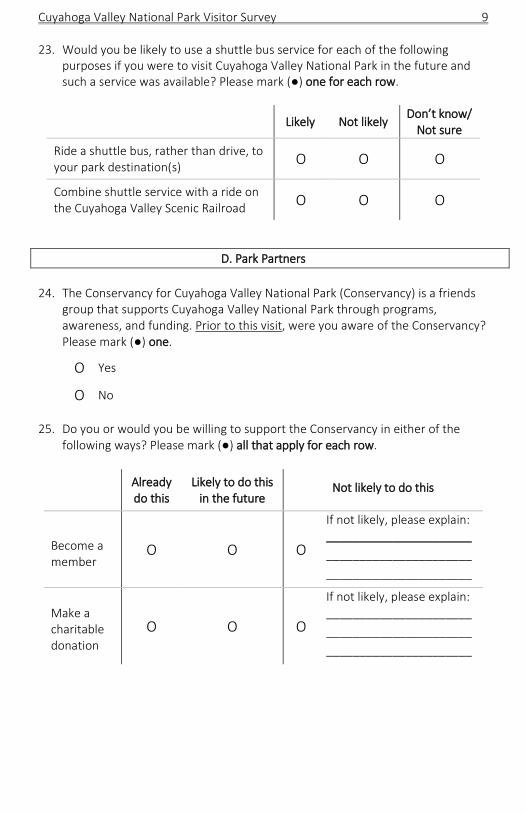
Cuyahoga Valley National Park Visitor Survey 9 23. Would you be likely to use a shuttle bus service for each of the following
purposes if you were to visit Cuyahoga Valley National Park in the future and such a service was available? Please mark (●) one for each row.
Likely Not likely Don’t know/
Not sure
Ride a shuttle bus, rather than drive, to your park destination(s) O O O
Combine shuttle service with a ride on the Cuyahoga Valley Scenic Railroad O O O
D. Park Partners 24. The Conservancy for Cuyahoga Valley National Park (Conservancy) is a friends
group that supports Cuyahoga Valley National Park through programs, awareness, and funding. Prior to this visit, were you aware of the Conservancy? Please mark (●) one.
O Yes
O No
25. Do you or would you be willing to support the Conservancy in either of the following ways? Please mark (●) all that apply for each row.
Already do this
Likely to do this in the future
Not likely to do this
Become a member
O O O
If not likely, please explain: ______________________ ____________________________________________
Make a charitable donation
O O O
If not likely, please explain: ______________________ ____________________________________________

10 Cuyahoga Valley National Park Visitor Survey 26. The Countryside Conservancy has a partnership with Cuyahoga Valley National
Park to increase public awareness about sustainable food and farming. Prior to this visit, were you aware of the Countryside Conservancy? Please mark (●) one.
O Yes
O No 27. Prior to this visit, were you aware that Cuyahoga Valley National Park is located
in the Ohio and Erie Canalway National Heritage Area? Please mark (●) one.
O Yes
O No

Cuyahoga Valley National Park Visitor Survey 11
E. Expenditures on This Trip
Please refer to the map shown below when answering the questions in this section.
28. Do you live within the shaded area shown on the map? Please mark (●) one.
O Yes
O No

12 Cuyahoga Valley National Park Visitor Survey 29. a) On this trip to Cuyahoga Valley National Park and the nearby area, did
you stay overnight away from your permanent residence either inside Cuyahoga Valley National Park or within the nearby area (within the shaded area of the map on p.11)? Please mark (●) one.
O Yes
O No Go to Question 30
b) If YES, please list the number of nights you stayed in Cuyahoga Valley National Park (NP) and/or in the nearby area (within the shaded area of the map on p.11) on this trip.
Accommodation Number of nights
Camping in Cuyahoga Valley NP ________
Camping outside Cuyahoga Valley NP ________
Lodging in Cuyahoga Valley NP ________
Lodging outside Cuyahoga Valley NP ________
Other accommodations (e.g., friends/relatives) ________
30. Was this trip to Cuyahoga Valley National Park? Please mark (●) one.
O Your primary or sole purpose of your trip away from home?
O One of several equally important destinations on your trip away from home?
Was one or more of the other equally important destinations located within the nearby area (within the shaded area of the map on p.11)? Please mark (●) one.
O Yes
O No
O Just an incidental or spur-of-the-moment stop on your trip away from home?
Was your primary destination located within the nearby area (within the shaded area of the map on p.11)? Please mark (●) one.
O Yes
O No

Cuyahoga Valley National Park Visitor Survey 13 31. Did you visit any other National Park Service sites on your trip away from
home? Please mark (●) one.
O Yes (Please specify)
O No
32. On how many days during this trip did you enter or re-enter Cuyahoga Valley National Park? If you were on a day trip or if you camped or lodged inside the park and did not leave the park boundaries for the entire length of your stay, then answer 1 day.
________ Number of days entering or re-entering Cuyahoga Valley National
Park OR
O Don’t know/Not sure
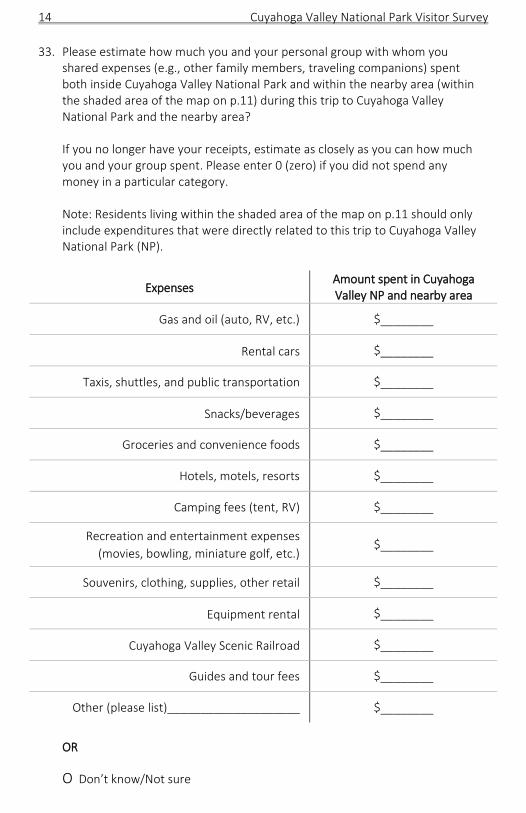
14 Cuyahoga Valley National Park Visitor Survey 33. Please estimate how much you and your personal group with whom you
shared expenses (e.g., other family members, traveling companions) spent both inside Cuyahoga Valley National Park and within the nearby area (within the shaded area of the map on p.11) during this trip to Cuyahoga Valley National Park and the nearby area?
If you no longer have your receipts, estimate as closely as you can how much
you and your group spent. Please enter 0 (zero) if you did not spend any money in a particular category.
Note: Residents living within the shaded area of the map on p.11 should only
include expenditures that were directly related to this trip to Cuyahoga Valley National Park (NP).
Expenses Amount spent in Cuyahoga Valley NP and nearby area
Gas and oil (auto, RV, etc.) $________
Rental cars $________
Taxis, shuttles, and public transportation $________
Snacks/beverages $________
Groceries and convenience foods $________
Hotels, motels, resorts $________
Camping fees (tent, RV) $________
Recreation and entertainment expenses (movies, bowling, miniature golf, etc.)
$________
Souvenirs, clothing, supplies, other retail $________
Equipment rental $________
Cuyahoga Valley Scenic Railroad $________
Guides and tour fees $________
Other (please list)____________________ $________
OR O Don’t know/Not sure

Cuyahoga Valley National Park Visitor Survey 15 34. a) Including yourself, how many people in your personal group were
covered by the expenses for this trip away from home?
Number of adults (18 years or older)
Number of children (under 18 years)
b) Including yourself, how many people in your group split these trip expenses?
Number of people
F. Background
35. How frequently have you personally visited Cuyahoga Valley National Park during the last 12 months? Please mark (●) one.
O Daily
O Several times per week
O Several times per month
O Several times in the past 12 months
O Only once (this trip)
36. For your personal group on this trip to Cuyahoga Valley National Park, please provide the following information.
If you do not know the answer, please write “DK” in the space.
Current age U.S. ZIP code or name of country other than U.S.
Yourself ________ ________________________
Member #2 ________ ________________________ Member #3 _______ ________________________ Member #4 _______ ________________________ Member #5 _______ ________________________ Member #6 _______ ________________________ Member #7 _______ ________________________

16 Cuyahoga Valley National Park Visitor Survey 37. For your personal group on this trip to Cuyahoga Valley National Park, please
provide the following information.
If you do not know the answer, fill in the circle for “Don’t know.”
Additional members of your personal group
Yourself #2 #3 #4 #5 #6 #7
Male O O O O O O O Female O O O O O O O Hispanic or Latino O O O O O O O Not Hispanic or Latino O O O O O O O
Don’t know --- O O O O O O 38. What is the race of each member of your personal group on this trip to
Cuyahoga Valley National Park? Please mark (●) one or more for each group member, including yourself. If you do not know the answer, fill in the circle for “Don’t know.”
Additional members of your personal group
Yourself #2 #3 #4 #5 #6 #7
American Indian or Alaskan Native O O O O O O O
Asian O O O O O O O Black or African American O O O O O O O Native Hawaiian or other Pacific Islander O O O O O O O
White O O O O O O O Don’t know --- O O O O O O

Cuyahoga Valley National Park Visitor Survey 17 39. What is the highest level of formal education completed by each member of
your personal group on this trip to Cuyahoga Valley National Park? Please mark (●) one for each group member, including yourself.
If you do not know the answer, fill in the circle for “Don’t know.”
Additional members of your personal group
Yourself #2 #3 #4 #5 #6 #7
Less than high school O O O O O O O
Some high school O O O O O O O High school graduate or GED O O O O O O O Some college, business, or trade school O O O O O O O College, business, or trade school graduate O O O O O O O
Some graduate school O O O O O O O Master’s, doctoral, or professional degree O O O O O O O
Don’t know --- O O O O O O
40. Including yourself, how many people are in your household?
Number of people
41. When visiting an area such as Cuyahoga Valley National Park, what language do you personally prefer to use? Please mark (●) one for speaking and one for reading. Speaking Reading
English O O
Spanish O O
Other (Please specify) ___________________ O O 42. Is there anything else you and your group would like to tell us about your trip
to Cuyahoga Valley National Park?
Thank you for your help! Please place the questionnaire in the pre-paid envelope and drop it in any U.S. Postal Service mailbox.

Cuyahoga Valley National Park Visitor Survey

Cuyahoga Valley National Park Visitor Survey
Thank you for your help!
Please place the questionnaire in the envelope provided and drop it in any U.S.
Postal Service mailbox.

SURVEY ID NUMBER:
Printed on recycled paper
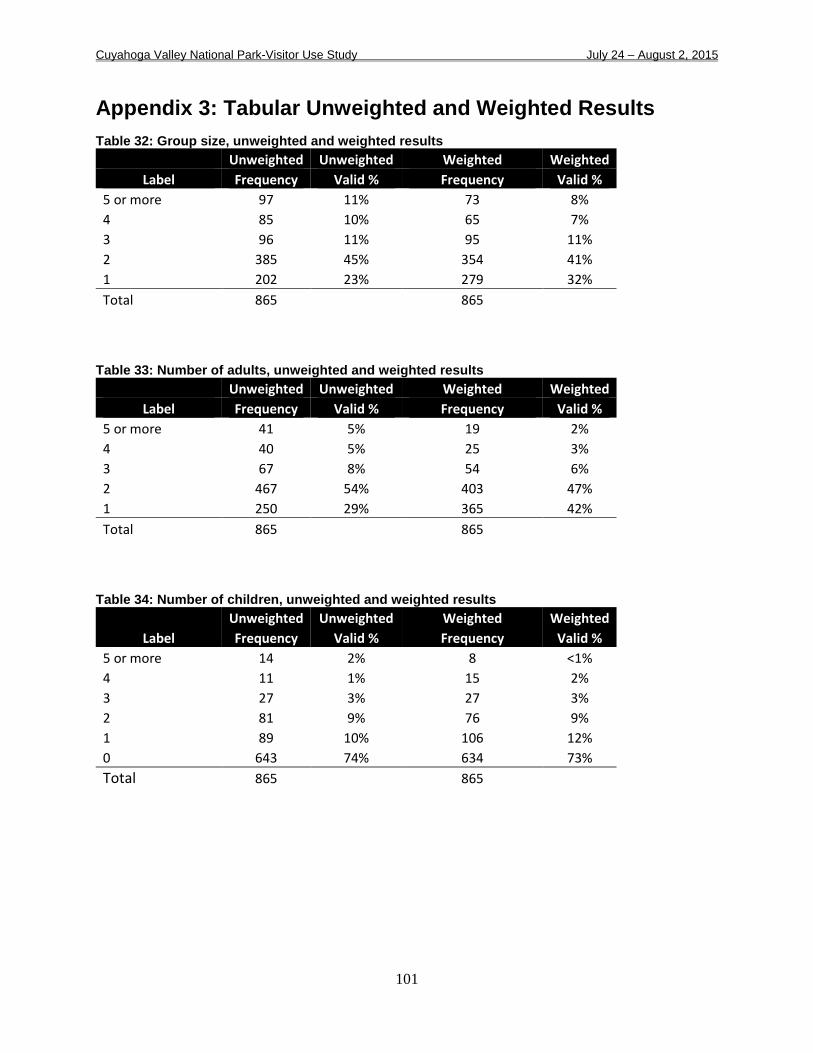
Cuyahoga Valley National Park-Visitor Use Study July 24 – August 2, 2015
101
Appendix 3: Tabular Unweighted and Weighted Results Table 32: Group size, unweighted and weighted results Unweighted Unweighted Weighted Weighted
Label Frequency Valid % Frequency Valid % 5 or more 97 11% 73 8% 4 85 10% 65 7% 3 96 11% 95 11% 2 385 45% 354 41% 1 202 23% 279 32% Total 865 865
Table 33: Number of adults, unweighted and weighted results Unweighted Unweighted Weighted Weighted
Label Frequency Valid % Frequency Valid % 5 or more 41 5% 19 2% 4 40 5% 25 3% 3 67 8% 54 6% 2 467 54% 403 47% 1 250 29% 365 42% Total 865 865
Table 34: Number of children, unweighted and weighted results Unweighted Unweighted Weighted Weighted
Label Frequency Valid % Frequency Valid % 5 or more 14 2% 8 <1% 4 11 1% 15 2% 3 27 3% 27 3% 2 81 9% 76 9% 1 89 10% 106 12% 0 643 74% 634 73% Total 865 865

Cuyahoga Valley National Park-Visitor Use Study July 24 – August 2, 2015
102
Table 35: Group type, unweighted and weighted results Unweighted Unweighted Weighted Weighted
Label Frequency Valid % Frequency Valid % Family 472 55% 437 50% Alone 198 23% 262 30% Friends 132 15% 103 12% Family & Friends 33 4% 24 3% Other 30 3% 40 5% Total 865 865
Table 36: Ethnicity, unweighted and weighted results Unweighted Unweighted Weighted Weighted
Label Frequency Valid % Frequency Valid % Not Hispanic or Latino 1293 98% 1328 98% Hispanic or Latino 30 2% 31 2% Total 1323 1359
Table 37: Race, unweighted and weighted results Unweighted Unweighted Weighted Weighted
Label Frequency Valid % Frequency Valid % White 1925 93% 1927 94% Asian 28 1% 63 3% Black or African American 62 3% 25 1% American Indian or Alaskan Native 23 1% 25 1%
Native Hawaiian or other Pacific Islander 5 <1% 3 <1% Total 2060 2044

Cuyahoga Valley National Park-Visitor Use Study July 24 – August 2, 2015
103
Table 38: Physical disability, unweighted and weighted results Unweighted Unweighted Weighted Weighted Label Frequency Valid % Frequency Valid % Yes 26 3% 31 4% No 828 97% 820 96% Total 854 851
Table 39: Gender, unweighted and weighted results Unweighted Unweighted Weighted Weighted
Label Frequency Valid % Frequency Valid % Male 1024 50% 1021 50% Female 1032 50% 1038 50% Total 2056 2059
Table 40: Age, unweighted and weighted results Unweighted Unweighted Weighted Weighted
Label Frequency Valid % Frequency Valid % 76 or older 48 2% 50 2% 71-75 64 3% 74 4% 66-70 142 7% 144 7% 61-65 222 11% 222 11% 56-60 225 11% 237 11% 51-55 188 9% 203 10% 46-50 189 9% 174 8% 41-45 143 7% 125 6% 36-40 140 7% 137 7% 31-35 106 5% 101 5% 26-30 103 5% 108 5% 21-25 59 3% 75 4% 16-20 64 3% 54 3% 11-15 120 6% 115 6% 10 or younger 247 12% 264 13% Total 2060 2083

Cuyahoga Valley National Park-Visitor Use Study July 24 – August 2, 2015
104
Table 41: Number of park visits in last 12 months, unweighted and weighted results Unweighted Unweighted Weighted Weighted
Label Frequency Valid % Frequency Valid % Daily 32 4% 34 4% Several times per week 155 18% 152 18% Several times per month 216 25% 221 26%
Several times in the past 12 months 208 24% 187 22% Only once (this trip) 243 28% 257 30% Total 854 851
Table 42: Education, unweighted and weighted results Unweighted Unweighted Weighted Weighted
Label Frequency Valid % Frequency Valid % Less than high school 306 15% 310 15% Some high school 55 3% 45 2% High school graduate or GED 157 8% 165 8%
Some college, business, or trade school 255 13% 229 11%
College, business, or trade school graduate 607 30% 642 32% Some graduate school 110 5% 98 5%
Master's, doctoral, or professional degree 513 26% 517 26% Total 2003 2005

Cuyahoga Valley National Park-Visitor Use Study July 24 – August 2, 2015
105
Table 43: Speaking language, unweighted and weighted results Unweighted Unweighted Weighted Weighted
Label Frequency Valid % Frequency Valid % English 833 99% 841 99% Spanish 0% 0 0% Other 9 1% 4 <1% Total 842 845
Table 44: Reading language, unweighted and weighted results Unweighted Unweighted Weighted Weighted
Label Frequency Valid % Frequency Valid % English 776 99% 775 100% Spanish 1 <1% 1 <1% Other 3 <1% 2 <1% Total 780 778
Table 45: Live nearby, unweighted and weighted results Unweighted Unweighted Weighted Weighted Label Frequency Valid % Frequency Valid % Yes 524 62% 555 66% No 317 38% 287 34% 841 843
Table 46: Household size, unweighted and weighted results Unweighted Unweighted Weighted Weighted
Label Frequency Valid % Frequency Valid % 5 or more 85 10% 95 11% 4 143 17% 138 17% 3 122 15% 106 13% 2 358 43% 369 44% 1 124 15% 125 15% Total 832 834
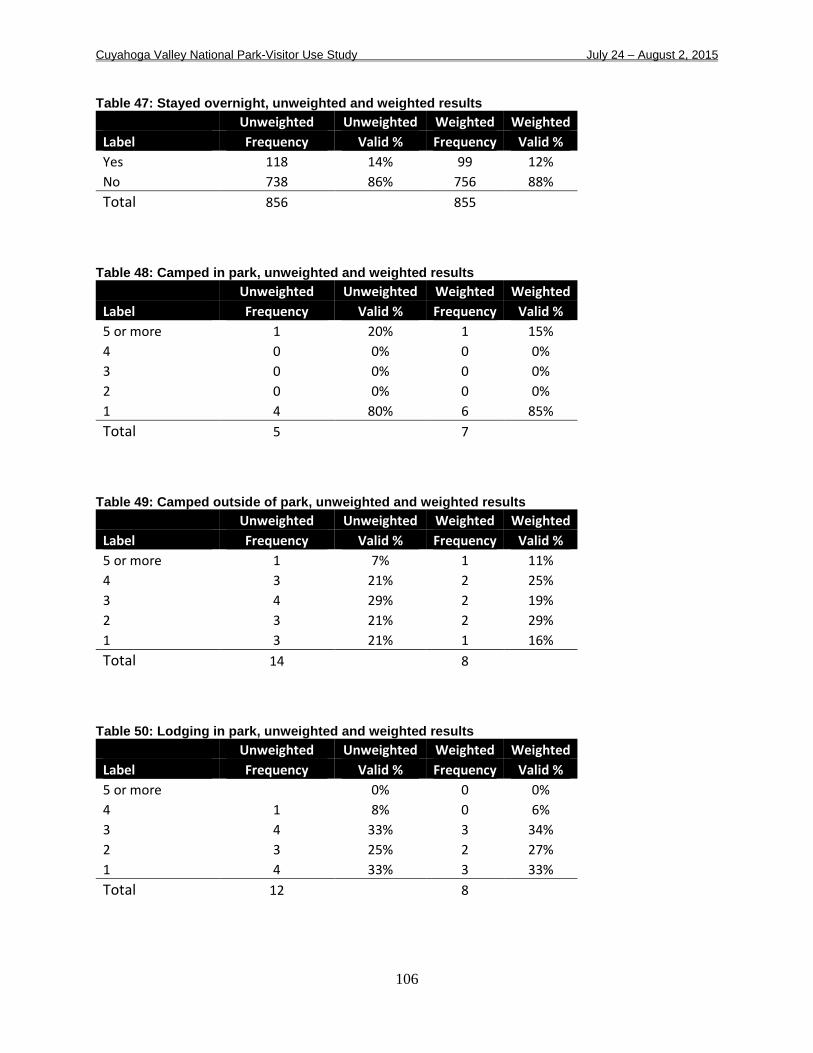
Cuyahoga Valley National Park-Visitor Use Study July 24 – August 2, 2015
106
Table 47: Stayed overnight, unweighted and weighted results Unweighted Unweighted Weighted Weighted Label Frequency Valid % Frequency Valid % Yes 118 14% 99 12% No 738 86% 756 88% Total 856 855
Table 48: Camped in park, unweighted and weighted results Unweighted Unweighted Weighted Weighted Label Frequency Valid % Frequency Valid % 5 or more 1 20% 1 15% 4 0 0% 0 0% 3 0 0% 0 0% 2 0 0% 0 0% 1 4 80% 6 85% Total 5 7
Table 49: Camped outside of park, unweighted and weighted results Unweighted Unweighted Weighted Weighted Label Frequency Valid % Frequency Valid % 5 or more 1 7% 1 11% 4 3 21% 2 25% 3 4 29% 2 19% 2 3 21% 2 29% 1 3 21% 1 16% Total 14 8
Table 50: Lodging in park, unweighted and weighted results Unweighted Unweighted Weighted Weighted Label Frequency Valid % Frequency Valid % 5 or more 0% 0 0% 4 1 8% 0 6% 3 4 33% 3 34% 2 3 25% 2 27% 1 4 33% 3 33% Total 12 8

Cuyahoga Valley National Park-Visitor Use Study July 24 – August 2, 2015
107
Table 51: Lodge outside of park, unweighted and weighted results Unweighted Unweighted Weighted Weighted Label Frequency Valid % Frequency Valid % 5 or more 3 5% 2 4% 4 1 2% 1 1% 3 10 16% 7 13% 2 21 33% 14 28% 1 29 45% 28 54% Total 64 52
Table 52: Other accommodations, unweighted and weighted results Unweighted Unweighted Weighted Weighted Label Frequency Valid % Frequency Valid % 5 or more 7 32% 7 32% 4 2 9% 3 12% 3 2 9% 2 7% 2 6 27% 8 35% 1 5 23% 3 14% Total 22 22
Table 53: Number of days enter or re-enter park, unweighted and weighted results Unweighted Unweighted Weighted Weighted
Label Frequency Valid % Frequency Valid % 5 or more 4 <1% 3 <1% 4 2 <1% 1 <1% 3 15 2% 17 2% 2 46 7% 60 9% 1 626 90% 622 89% Total 693 702

Cuyahoga Valley National Park-Visitor Use Study July 24 – August 2, 2015
108
Table 54: Purpose of trip, unweighted and weighted results Unweighted Unweighted Weighted Weighted Label Frequency Valid % Frequency Valid %
The primary or sole purpose for trip away from home 622 74% 626 75%
One of several equally important destinations 145 17% 133 16%
An incidental/ spur-of-the-moment stop 70 8% 76 9% Total 837 834
Table 55: Visit other destinations nearby, unweighted and weighted results Unweighted Unweighted Weighted Weighted Label Frequency Valid % Frequency Valid % Yes 139 57% 131 56% No 106 43% 104 44% Total 245 235
Table 56: Primary location located nearby, unweighted and weighted results Unweighted Unweighted Weighted Weighted Label Frequency Valid % Frequency Valid % Yes 189 73% 195 76% No 70 27% 61 24% Total 259 255
Table 57: Visited other Nation Park Service sites on trip, unweighted and weighted results Unweighted Unweighted Weighted Weighted Label Frequency Valid % Frequency Valid % Yes 70 8% 55 6% No 773 92% 791 94% Total 843 846

Cuyahoga Valley National Park-Visitor Use Study July 24 – August 2, 2015
109
Table 58: Information sources, unweighted and weighted results Unweighted Unweighted Weighted Weighted Label Frequency Valid % Frequency Valid % Previous visit 545 63% 558 65% Park website 334 39% 319 37% Friends/relatives/word of mouth 281 33% 279 32% Walking/driving by and saw park signs 154 18% 169 20% Travel guides/tour books/brochures 128 15% 115 13% Did not obtain information prior to visit 99 11% 97 11% Ohio and Eerie Canal webpage 66 8% 58 7% Park staff/volunteers at event in my community 44 5% 48 6% Social media 46 5% 45 5% Conservancy webpage 50 6% 45 5% Other website 42 5% 39 5% Television/radio/newspapers/magazines 39 5% 35 4% Mobile app 17 2% 20 2% School class or program 17 2% 16 2% Telephone/email/written inquiry to park 9 1% 10 1% Other 46 5% 51 6% Total 861 861
Table 59: Had information needed, unweighted and weighted results
Unweighted Unweighted Weighted Weighted Label Frequency Valid % Frequency Valid %
Yes 817 96% 812 95% No 38 4% 40 5% Total 855 852
Table 60: Aware the park is in National Heritage Area, unweighted and weighted results Unweighted Unweighted Weighted Weighted Label Frequency Valid % Frequency Valid % Yes 629 74% 644 76% No 222 26% 202 24% Total 851 846

Cuyahoga Valley National Park-Visitor Use Study July 24 – August 2, 2015
110
Table 61: Most important reason for visit, unweighted and weighted results Unweighted Unweighted Weighted Weighted
Label Frequency Valid % Frequency Valid % Get physical exercise 254 34% 280 38% Spend time with friends/family 145 19% 121 16% View wildlife or natural scenery 93 12% 87 12% Be outdoors 56 7% 47 6% Escape from urban setting 40 5% 45 6% Relax 36 5% 41 6% Visit a NPS site 46 6% 38 5% Attend special event 11 1% 12 2% Hear the sounds of nature/quiet 10 1% 12 2% Experience solitude 10 1% 10 1% Learn more about American history and culture 12 2% 7 <1% Learn more about nature 2 <1% 3 <1% Other - Ride the train 16 2% 13 2% Other 25 3% 24 3% Total 756 739
Table 62: Importance: to visit a National Park Service site, unweighted and weighted results Unweighted Unweighted Weighted Weighted Label Frequency Valid % Frequency Valid % Extremely important 178 23% 176 24% Very important 188 25% 187 25% Moderately important 186 25% 171 23% Slightly important 84 11% 94 12% Not at all important 122 16% 123 16% Total 758 750

Cuyahoga Valley National Park-Visitor Use Study July 24 – August 2, 2015
111
Table 63: Importance: escape from urban setting, unweighted and weighted results Unweighted Unweighted Weighted Weighted Label Frequency Valid % Frequency Valid % Extremely important 327 42% 341 44% Very important 244 31% 232 30% Moderately important 137 17% 137 18% Slightly important 34 4% 35 4% Not at all important 42 5% 36 5% Total 784 782
Table 64: Importance: spend time with friends/family, unweighted and weighted results Unweighted Unweighted Weighted Weighted Label Frequency Valid % Frequency Valid % Extremely important 385 51% 344 49% Very important 231 31% 212 30% Moderately important 67 9% 73 10% Slightly important 32 4% 34 5% Not at all important 33 4% 38 5% Total 748 700

Cuyahoga Valley National Park-Visitor Use Study July 24 – August 2, 2015
112
Table 65: Importance: view nature, unweighted and weighted results Unweighted Unweighted Weighted Weighted Label Frequency Valid % Frequency Valid % Extremely important 409 49% 403 48% Very important 312 37% 299 36% Moderately important 95 11% 101 12% Slightly important 20 2% 28 3% Not at all important 5 <1% 3 <1% Total 841 834
Table 66: Importance: exercise, unweighted and weighted results Unweighted Unweighted Weighted Weighted Label Frequency Valid % Frequency Valid % Extremely important 463 56% 473 57% Very important 223 27% 234 28% Moderately important 93 11% 76 9% Slightly important 34 4% 33 4% Not at all important 16 2% 10 1% Total 829 826

Cuyahoga Valley National Park-Visitor Use Study July 24 – August 2, 2015
113
Table 67: Importance: relax Unweighted Unweighted Weighted Weighted Label Frequency Valid % Frequency Valid % Extremely important 360 44% 341 42% Very important 285 35% 284 35% Moderately important 119 15% 120 15% Slightly important 42 5% 49 6% Not at all important 11 1% 11 1% Total 817 805
Table 68: Importance: to learn more American history and culture, unweighted and weighted results Unweighted Unweighted Weighted Weighted Label Frequency Valid % Frequency Valid % Extremely important 75 10% 62 8% Very important 152 20% 148 20% Moderately important 216 28% 219 29% Slightly important 167 22% 168 22% Not at all important 150 20% 157 21% Total 760 754

Cuyahoga Valley National Park-Visitor Use Study July 24 – August 2, 2015
114
Table 69: Importance: to learn about nature, unweighted and weighted results Unweighted Unweighted Weighted Weighted Label Frequency Valid % Frequency Valid % Extremely important 111 14% 108 14% Very important 199 25% 193 25% Moderately important 240 31% 230 30% Slightly important 145 18% 152 20% Not at all important 91 12% 94 12% Total 786 777
Table 70: Importance: to attend special events, unweighted and weighted results Unweighted Unweighted Weighted Weighted Label Frequency Valid % Frequency Valid % Extremely important 34 13% 32 12% Very important 25 10% 28 10% Moderately important 47 18% 43 16% Slightly important 42 16% 56 21% Not at all important 110 43% 108 40% Total 258 268
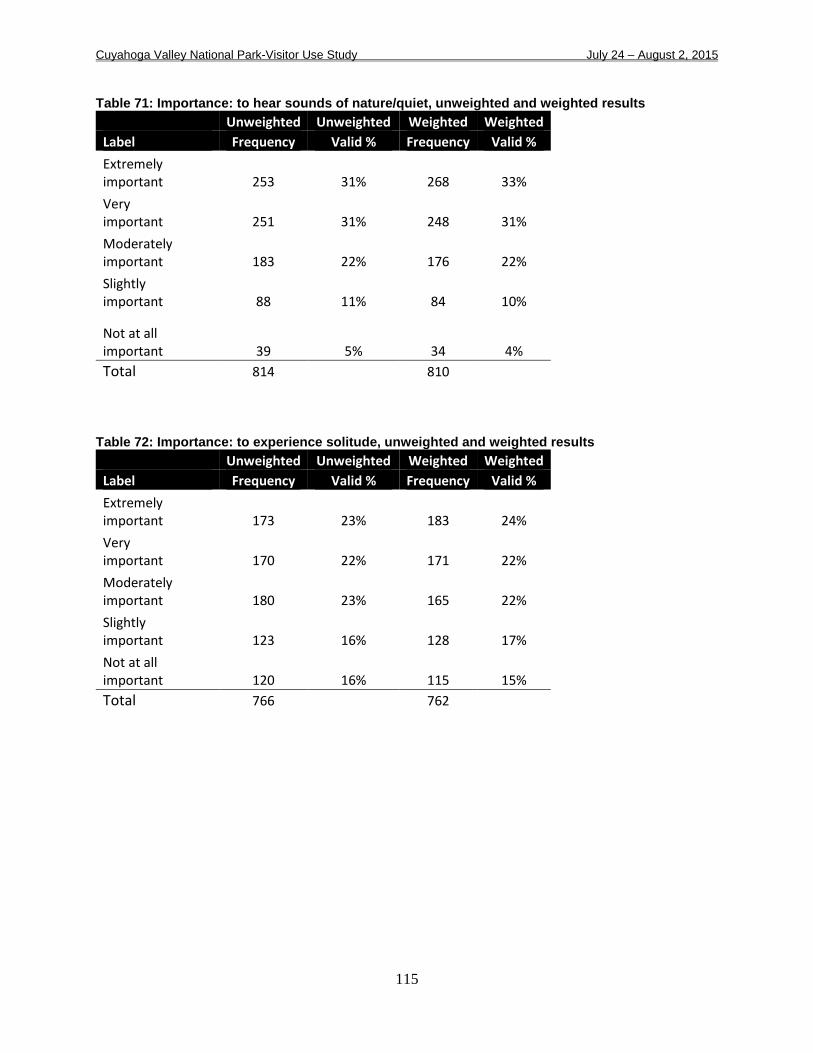
Cuyahoga Valley National Park-Visitor Use Study July 24 – August 2, 2015
115
Table 71: Importance: to hear sounds of nature/quiet, unweighted and weighted results Unweighted Unweighted Weighted Weighted Label Frequency Valid % Frequency Valid % Extremely important 253 31% 268 33% Very important 251 31% 248 31% Moderately important 183 22% 176 22% Slightly important 88 11% 84 10%
Not at all important 39 5% 34 4% Total 814 810
Table 72: Importance: to experience solitude, unweighted and weighted results Unweighted Unweighted Weighted Weighted Label Frequency Valid % Frequency Valid % Extremely important 173 23% 183 24% Very important 170 22% 171 22% Moderately important 180 23% 165 22% Slightly important 123 16% 128 17% Not at all important 120 16% 115 15% Total 766 762

Cuyahoga Valley National Park-Visitor Use Study July 24 – August 2, 2015
116
Table 73: Importance: to be outdoors, unweighted and weighted results Unweighted Unweighted Weighted Weighted Label Frequency Valid % Frequency Valid % Extremely important 504 60% 502 61% Very important 263 32% 263 32% Moderately important 46 6% 44 5% Slightly important 16 2% 15 2% Not at all important 5 <1% 4 <1% Total 834 828
Table 74: Importance: to view dark sky/stars, unweighted and weighted results Unweighted Unweighted Weighted Weighted Label Frequency Valid % Frequency Valid % Extremely important 42 13% 46 14% Very important 40 12% 36 11% Moderately important 77 24% 79 24% Slightly important 50 15% 49 15% Not at all important 115 35% 119 36% Total 324 329
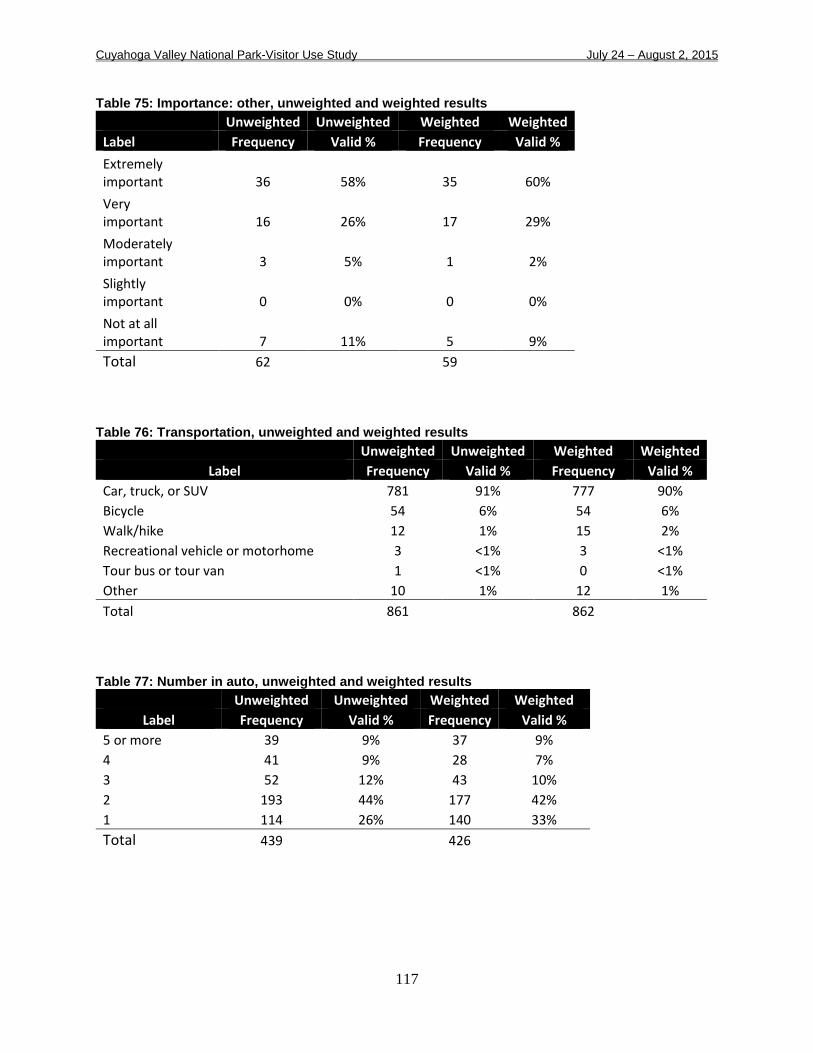
Cuyahoga Valley National Park-Visitor Use Study July 24 – August 2, 2015
117
Table 75: Importance: other, unweighted and weighted results Unweighted Unweighted Weighted Weighted Label Frequency Valid % Frequency Valid % Extremely important 36 58% 35 60% Very important 16 26% 17 29% Moderately important 3 5% 1 2% Slightly important 0 0% 0 0% Not at all important 7 11% 5 9% Total 62 59
Table 76: Transportation, unweighted and weighted results Unweighted Unweighted Weighted Weighted
Label Frequency Valid % Frequency Valid % Car, truck, or SUV 781 91% 777 90% Bicycle 54 6% 54 6% Walk/hike 12 1% 15 2% Recreational vehicle or motorhome 3 <1% 3 <1% Tour bus or tour van 1 <1% 0 <1% Other 10 1% 12 1% Total 861 862
Table 77: Number in auto, unweighted and weighted results Unweighted Unweighted Weighted Weighted
Label Frequency Valid % Frequency Valid % 5 or more 39 9% 37 9% 4 41 9% 28 7% 3 52 12% 43 10% 2 193 44% 177 42% 1 114 26% 140 33% Total 439 426

Cuyahoga Valley National Park-Visitor Use Study July 24 – August 2, 2015
118
Table 78: Number in RV, unweighted and weighted results Unweighted Unweighted Weighted Weighted
Label Frequency Valid % Frequency Valid % 5 or more 0 0% 0 0% 4 1 20% 1 20% 3 1 20% 1 18% 2 2 40% 1 21% 1 1 20% 2 41% Total 5.0 4.4
Table 79: Interstate signs adequate, unweighted and weighted results Unweighted Unweighted Weighted Weighted
Label Frequency Valid % Frequency Valid % Yes 508 92% 500 92% No 42 8% 44 8% Total 550 544
Table 80: Local signs adequate, unweighted and weighted results Unweighted Unweighted Weighted Weighted
Label Frequency Valid % Frequency Valid % Yes 720 95% 715 95% No 39 5% 35 5% Total 759 750
Table 81: Difficulty locating park, unweighted and weighted results Unweighted Unweighted Weighted Weighted
Label Frequency Valid % Frequency Valid % Yes 45 5% 36 4% No 814 95% 823 96% Total 859 859

Cuyahoga Valley National Park-Visitor Use Study July 24 – August 2, 2015
119
Table 82: Adequate signage in park, unweighted and weighted results Unweighted Unweighted Weighted Weighted
Label Frequency Valid % Frequency Valid % Yes 776 91% 788 92% No 79 9% 65 8% Total 855 853
Table 83: Hours in park, unweighted and weighted results Unweighted Unweighted Weighted Weighted
Label Frequency Valid % Frequency Valid % 5 or more 132 16% 118 14% 4 113 14% 106 13% 3 196 24% 182 22% 2 237 29% 261 32% Up to 1 136 17% 156 19% Total 814 823
Table 84: Days in park, unweighted and weighted results Unweighted Unweighted Weighted Weighted
Label Frequency Valid % Frequency Valid % 4 or more 3 6% 2 6% 3 7 14% 3 9% 2 34 68% 28 74% Up to 1 6 12% 4 11% Total 50 38

Cuyahoga Valley National Park-Visitor Use Study July 24 – August 2, 2015
120
Table 85: Activities, unweighted and weighted results Unweighted Unweighted Weighted Weighted Label Frequency Valid % Frequency Valid % View scenery 515 60% 505 59% Hiking/walking 512 60% 492 58%
Take a scenic drive/ drive for pleasure 341 40% 316 37% Bicycling 274 32% 291 34% Visit historic houses/sites 184 21% 175 21% Photography/painting 129 15% 129 15% Jogging/running 101 12% 120 14% Bird watching/ nature study 118 14% 114 13% Dog walking 95 11% 98 11% Picnicking 71 8% 63 7% Attending farmers' market 68 8% 57 7%
Attend special programs/ events/tours 40 5% 38 4% Visiting a farm 34 4% 32 4% Fishing 13 2% 18 2% Canoeing/kayaking 6 <1% 4 <1% Camping 8 <1% 4 <1% Horseback riding 4 <1% 1 <1% Other - train ride . . 53 6% Other - visit restaurant . . 10 1% Other 106 12% 34 4% Total 856 852

Cuyahoga Valley National Park-Visitor Use Study July 24 – August 2, 2015
121
Table 86: Primary activity, unweighted and weighted results Unweighted Unweighted Weighted Weighted
Label Frequency Valid % Frequency Valid % Hiking/walking 268 32% 241 29% Bicycling 227 27% 233 28% Jogging/running 73 9% 82 10% Dog walking 41 5% 54 7% View scenery 47 6% 50 6% Other - Riding the train 52 6% 45 5% Photography/painting 15 2% 17 2%
Attend special events/ programs/tours 12 1% 12 1% Bird watching/ nature study 9 1% 11 1%
Take a scenic drive/ drive for pleasure 17 2% 10 1% Visit historic houses/sites 10 1% 9 1% Attending farmers' market 4 <1% 5 <1% Fishing 2 <1% 5 <1% Picnicking 5 <1% 4 <1% Canoeing/kayaking 4 <1% 3 <1% Visiting a farm 3 <1% 3 <1% Horseback riding 4 <1% 1 <1% Camping 1 <1% 1 <1% Other 10 1% 8 1% No primary activity 23 3% 24 3% Total 827 820
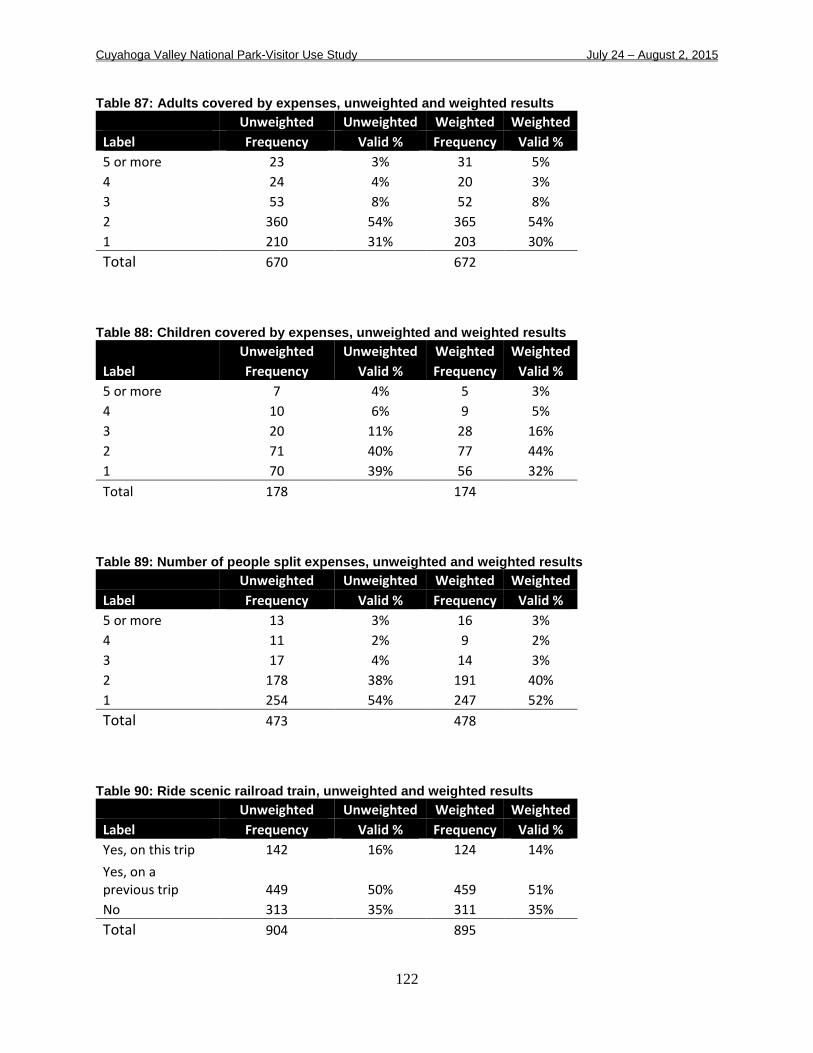
Cuyahoga Valley National Park-Visitor Use Study July 24 – August 2, 2015
122
Table 87: Adults covered by expenses, unweighted and weighted results Unweighted Unweighted Weighted Weighted Label Frequency Valid % Frequency Valid % 5 or more 23 3% 31 5% 4 24 4% 20 3% 3 53 8% 52 8% 2 360 54% 365 54% 1 210 31% 203 30% Total 670 672
Table 88: Children covered by expenses, unweighted and weighted results Unweighted Unweighted Weighted Weighted Label Frequency Valid % Frequency Valid % 5 or more 7 4% 5 3% 4 10 6% 9 5% 3 20 11% 28 16% 2 71 40% 77 44% 1 70 39% 56 32% Total 178 174
Table 89: Number of people split expenses, unweighted and weighted results Unweighted Unweighted Weighted Weighted Label Frequency Valid % Frequency Valid % 5 or more 13 3% 16 3% 4 11 2% 9 2% 3 17 4% 14 3% 2 178 38% 191 40% 1 254 54% 247 52% Total 473 478
Table 90: Ride scenic railroad train, unweighted and weighted results Unweighted Unweighted Weighted Weighted Label Frequency Valid % Frequency Valid % Yes, on this trip 142 16% 124 14% Yes, on a previous trip 449 50% 459 51% No 313 35% 311 35% Total 904 895

Cuyahoga Valley National Park-Visitor Use Study July 24 – August 2, 2015
123
Table 91: Train ride met expectations, unweighted and weighted results Unweighted Unweighted Weighted Weighted
Label Frequency Valid % Frequency Valid % Yes 252 94% 252 95% No 15 6% 14 5% Total 267 266
Table 92: Aware of the Conservancy, unweighted and weighted results Unweighted Unweighted Weighted Weighted Label Frequency Valid % Frequency Valid % Yes 317 37% 311 37% No 538 63% 540 63% Total 855 851
Table 93: Become a member of the Conservancy, unweighted and weighted results Unweighted Unweighted Weighted Weighted Label Frequency Valid % Frequency Valid % Already do this 73 9% 74 9% Likely to do this in future 302 37% 290 36% Not likely to do this 437 54% 452 55% Total 812 816
Table 94: Donate to Conservancy, unweighted and weighted results Unweighted Unweighted Weighted Weighted Label Frequency Valid % Frequency Valid % Already do this 81 10% 74 9% Likely to do this in future 343 42% 359 44% Not likely to do this 393 48% 390 47% Total 817 823
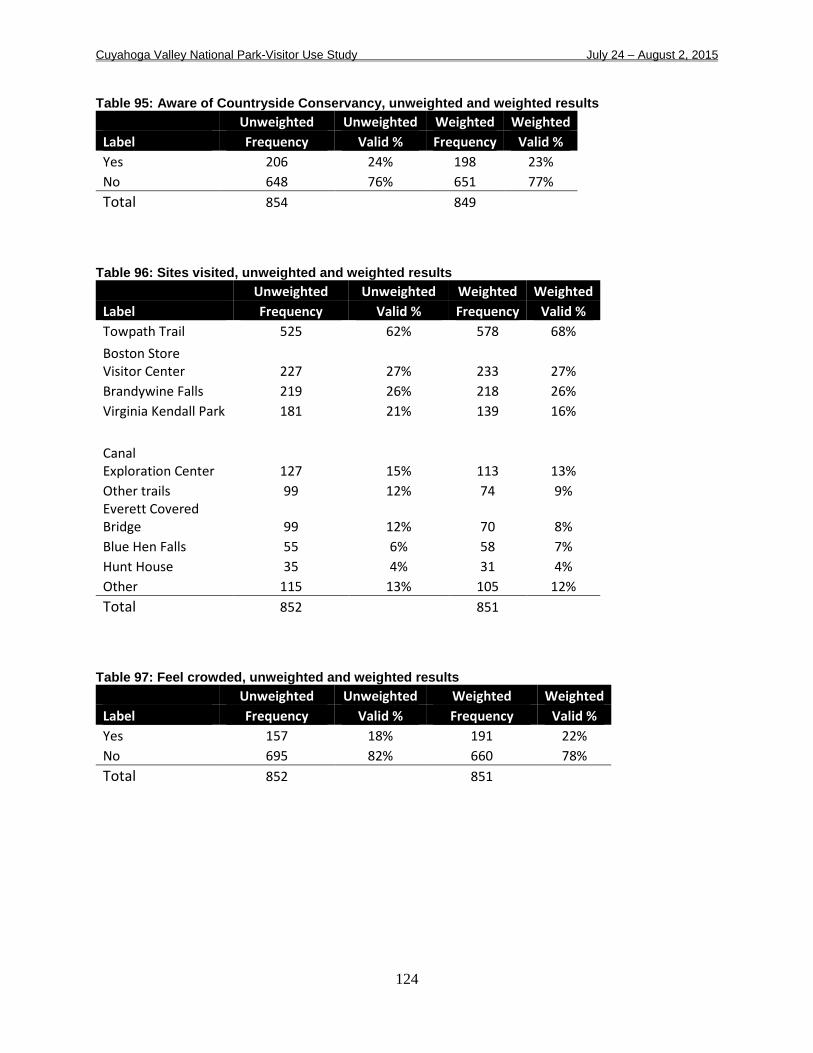
Cuyahoga Valley National Park-Visitor Use Study July 24 – August 2, 2015
124
Table 95: Aware of Countryside Conservancy, unweighted and weighted results Unweighted Unweighted Weighted Weighted Label Frequency Valid % Frequency Valid % Yes 206 24% 198 23% No 648 76% 651 77% Total 854 849
Table 96: Sites visited, unweighted and weighted results Unweighted Unweighted Weighted Weighted Label Frequency Valid % Frequency Valid % Towpath Trail 525 62% 578 68% Boston Store Visitor Center 227 27% 233 27% Brandywine Falls 219 26% 218 26% Virginia Kendall Park 181 21% 139 16%
Canal Exploration Center 127 15% 113 13% Other trails 99 12% 74 9% Everett Covered Bridge 99 12% 70 8% Blue Hen Falls 55 6% 58 7% Hunt House 35 4% 31 4% Other 115 13% 105 12% Total 852 851
Table 97: Feel crowded, unweighted and weighted results Unweighted Unweighted Weighted Weighted Label Frequency Valid % Frequency Valid % Yes 157 18% 191 22% No 695 82% 660 78% Total 852 851

Cuyahoga Valley National Park-Visitor Use Study July 24 – August 2, 2015
125
Table 98: Personal property safety, unweighted and weighted results Unweighted Unweighted Weighted Weighted Label Frequency Valid % Frequency Valid % Very safe 713 83% 713 84% Somewhat safe 121 14% 121 14% No opinion 18 2% 13 2% Somewhat unsafe 4 <1% 3 <1% Very unsafe 2 <1% 3 <1% Total 858 852
Table 99: Personal safety, unweighted and weighted results Unweighted Unweighted Weighted Weighted Label Frequency Valid % Frequency Valid % Very safe 755 88% 759 89% Somewhat safe 83 10% 81 9% No opinion 15 2% 8 <1% Somewhat unsafe 3 <1% 3 <1% Very unsafe 1 <1% 1 <1% Total 857 852
Table 100: Safe from accidents, unweighted and weighted results Unweighted Unweighted Weighted Weighted Label Frequency Valid % Frequency Valid % Very safe 619 72% 606 71% Somewhat safe 185 22% 186 22% No opinion 24 3% 21 2% Somewhat unsafe 22 3% 30 4% Very unsafe 5 <1% 9 <1% Total 855 851
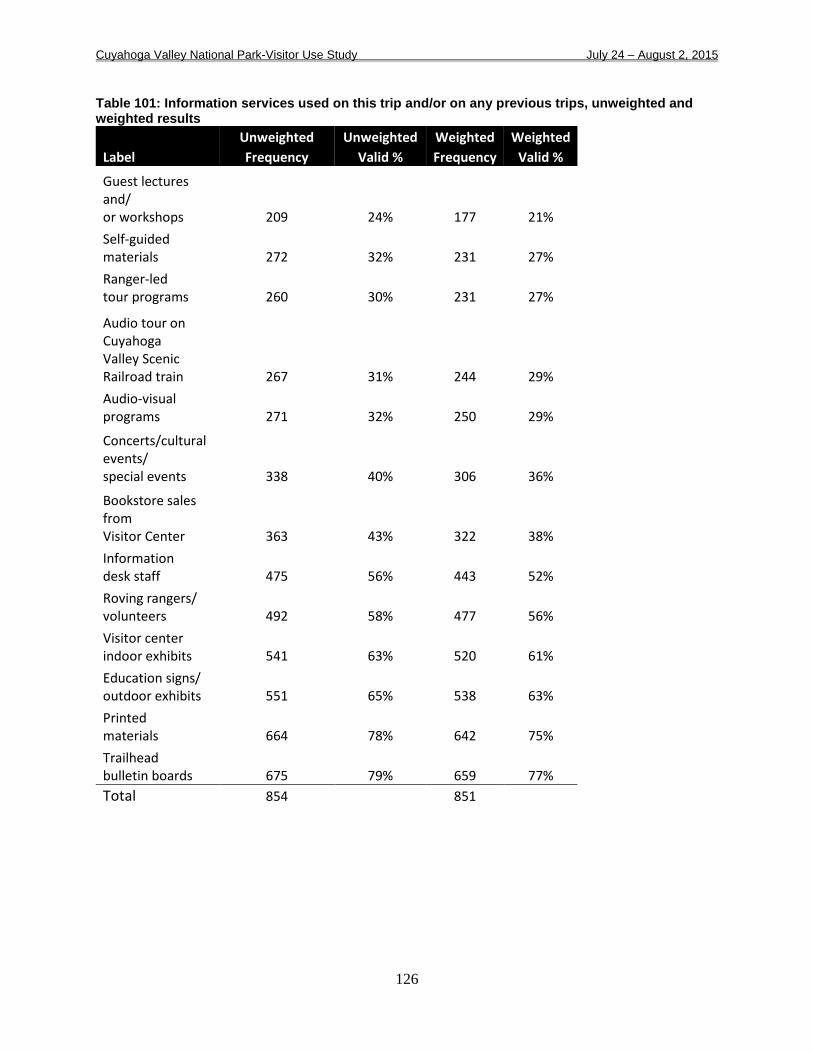
Cuyahoga Valley National Park-Visitor Use Study July 24 – August 2, 2015
126
Table 101: Information services used on this trip and/or on any previous trips, unweighted and weighted results Unweighted Unweighted Weighted Weighted Label Frequency Valid % Frequency Valid %
Guest lectures and/ or workshops 209 24% 177 21% Self-guided materials 272 32% 231 27% Ranger-led tour programs 260 30% 231 27%
Audio tour on Cuyahoga Valley Scenic Railroad train 267 31% 244 29% Audio-visual programs 271 32% 250 29%
Concerts/cultural events/ special events 338 40% 306 36%
Bookstore sales from Visitor Center 363 43% 322 38% Information desk staff 475 56% 443 52% Roving rangers/ volunteers 492 58% 477 56% Visitor center indoor exhibits 541 63% 520 61% Education signs/ outdoor exhibits 551 65% 538 63% Printed materials 664 78% 642 75% Trailhead bulletin boards 675 79% 659 77% Total 854 851
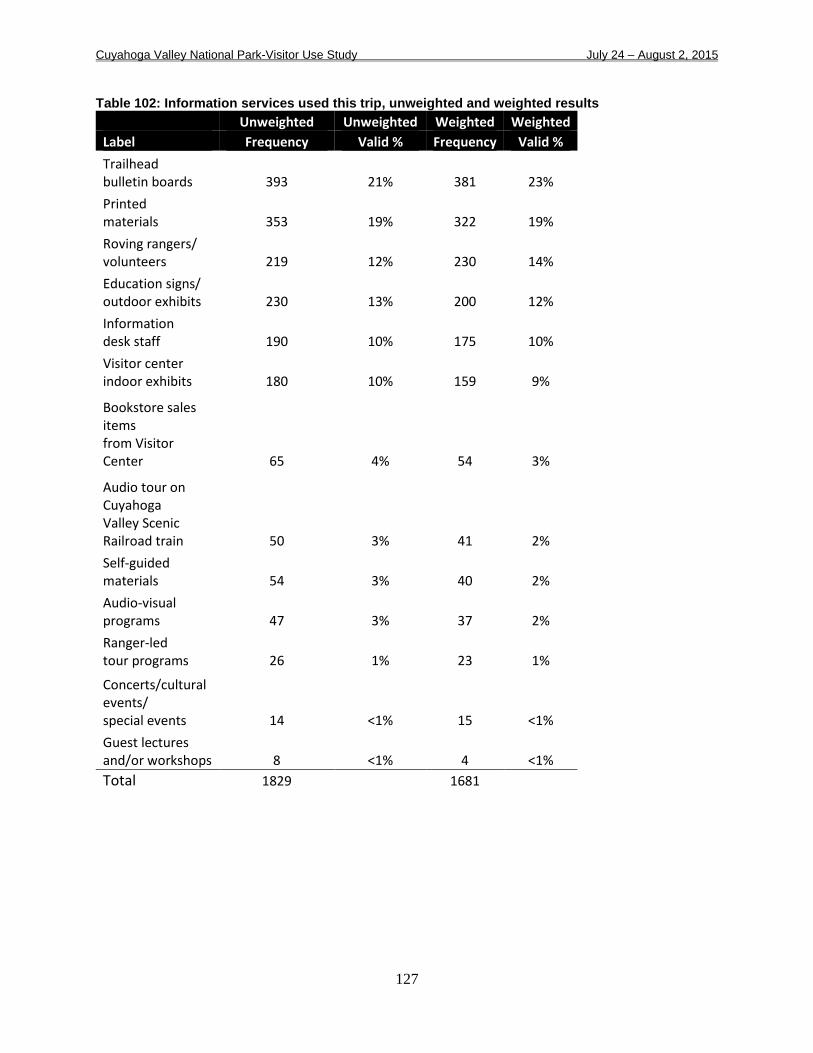
Cuyahoga Valley National Park-Visitor Use Study July 24 – August 2, 2015
127
Table 102: Information services used this trip, unweighted and weighted results Unweighted Unweighted Weighted Weighted Label Frequency Valid % Frequency Valid % Trailhead bulletin boards 393 21% 381 23% Printed materials 353 19% 322 19% Roving rangers/ volunteers 219 12% 230 14% Education signs/ outdoor exhibits 230 13% 200 12% Information desk staff 190 10% 175 10% Visitor center indoor exhibits 180 10% 159 9%
Bookstore sales items from Visitor Center 65 4% 54 3%
Audio tour on Cuyahoga Valley Scenic Railroad train 50 3% 41 2% Self-guided materials 54 3% 40 2% Audio-visual programs 47 3% 37 2% Ranger-led tour programs 26 1% 23 1%
Concerts/cultural events/ special events 14 <1% 15 <1% Guest lectures and/or workshops 8 <1% 4 <1% Total 1829 1681

Cuyahoga Valley National Park-Visitor Use Study July 24 – August 2, 2015
128
Table 103: Information services used on previous trip, unweighted and weighted results Unweighted Unweighted Weighted Weighted Label Frequency Valid % Frequency Valid % Printed materials 325 38% 328 39% Visitor center indoor exhibits 284 33% 293 34% Trailhead bulletin boards 284 33% 290 34% Education signs/ outdoor exhibits 238 28% 260 31% Information desk staff 206 24% 205 24%
Concerts/cultural events/ special events 205 24% 200 23% Roving rangers/ volunteers 198 23% 192 23%
Bookstore sales from Visitor Center 181 21% 162 19% Ranger-led tour programs 112 13% 113 13%
Audio tour on Cuyahoga Valley Scenic Railroad train 90 11% 100 12% Audio-visual programs 96 11% 98 12% Self-guided materials 92 11% 79 9% Guest lectures and/or workshops 73 9% 68 8% Total 854 851

Cuyahoga Valley National Park-Visitor Use Study July 24 – August 2, 2015
129
Table 104: Use a shuttle bus, unweighted and weighted results Unweighted Unweighted Weighted Weighted
Label Frequency Valid % Frequency Valid % Likely 88 12% 80 11% Not likely 624 88% 643 89% Total 712 724
Table 105: Combine a shuttle service and scenic train ride, unweighted and weighted results Unweighted Unweighted Weighted Weighted
Label Frequency Valid % Frequency Valid % Likely 197 29% 201 29% Not likely 480 71% 487 71% Total 677 688
Table 106: Prefer other information sources on future visits, unweighted and weighted results Unweighted Unweighted Weighted Weighted Label Frequency Valid % Frequency Valid % Yes 210 26% 222 27% No 607 74% 585 73% Total 817 807

Cuyahoga Valley National Park-Visitor Use Study July 24 – August 2, 2015
130
Appendix 4: Additional Analysis Below are some examples of the types of cross tabulations that can be performed with the data available from this study.
1. How do importance of reasons to visit differ among visitors who live in Ohio, other US states, and other countries?
2. Are visitors who spend more money in the park and nearby area more or less likely to evaluate park services and facilities highly?
3. Is there a correlation between visitors’ ages and their preferred sources of information about the park?
4. Are visitors who rate the quality of services/facilities highly more likely to return for future visits?
5. Is there a correlation between visitor groups’ ratings of the importance of different reasons to visit and the activities in which they participated?
6. Do larger visitor groups (e.g. four or more) participate in different activities than smaller groups?
The methodological similarity of this study and previous VSP studies in Cuyahoga Valley National Park facilitates longitudinal analysis of visitor group and trip characteristics. Some examples of these types of longitudinal analyses include:
1. How have park visitor demographics changed since previous similar studies?
2. Did visitors use the same sources of information to plan their trips in 2015 as in 2005?
3. Did visitors visit the same locations (in relative frequency) in 2015 as in 2005?
4. What are the trends over time for importance of reasons to visit?
5. Have expenditures in the park and nearby area changed since 2005 and, if they have, what is the relationship between that change and other economic indicators like the inflation rate and median household income?
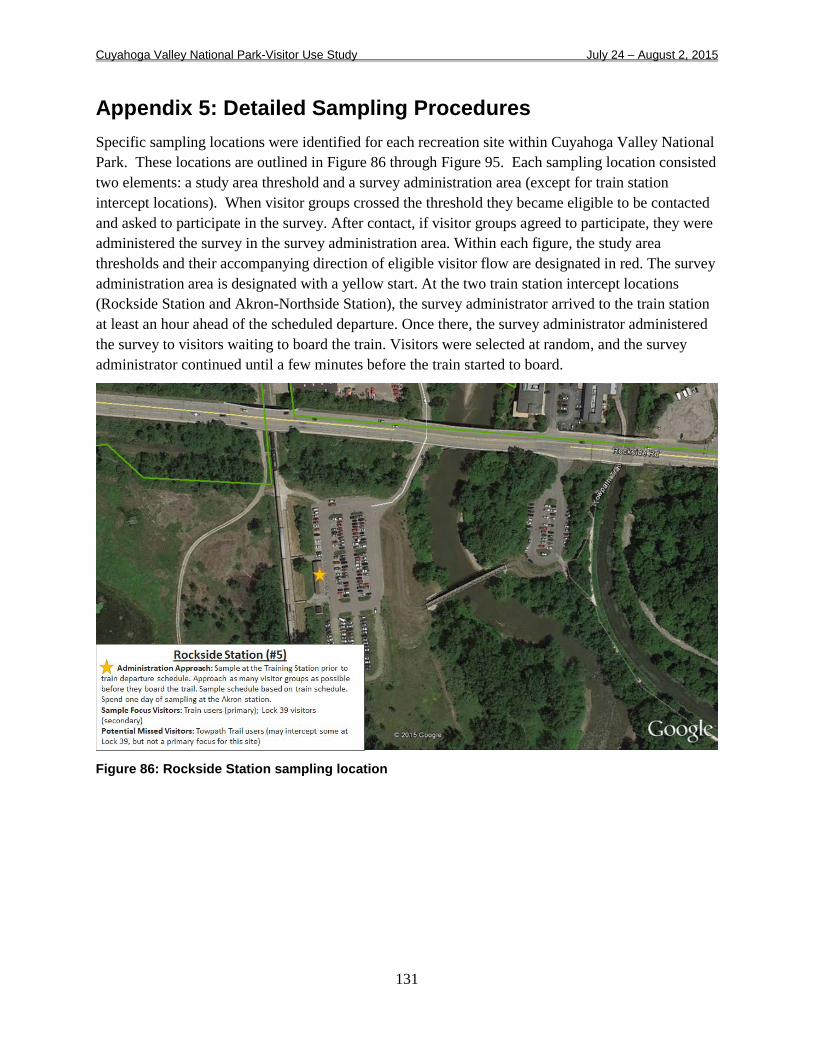
Cuyahoga Valley National Park-Visitor Use Study July 24 – August 2, 2015
131
Appendix 5: Detailed Sampling Procedures Specific sampling locations were identified for each recreation site within Cuyahoga Valley National Park. These locations are outlined in Figure 86 through Figure 95. Each sampling location consisted two elements: a study area threshold and a survey administration area (except for train station intercept locations). When visitor groups crossed the threshold they became eligible to be contacted and asked to participate in the survey. After contact, if visitor groups agreed to participate, they were administered the survey in the survey administration area. Within each figure, the study area thresholds and their accompanying direction of eligible visitor flow are designated in red. The survey administration area is designated with a yellow start. At the two train station intercept locations (Rockside Station and Akron-Northside Station), the survey administrator arrived to the train station at least an hour ahead of the scheduled departure. Once there, the survey administrator administered the survey to visitors waiting to board the train. Visitors were selected at random, and the survey administrator continued until a few minutes before the train started to board.
Figure 86: Rockside Station sampling location

Cuyahoga Valley National Park-Visitor Use Study July 24 – August 2, 2015
132
Figure 87: Canal Exploration Center sampling location
Figure 88: Station Road sampling location

Cuyahoga Valley National Park-Visitor Use Study July 24 – August 2, 2015
133
Figure 89: Boston Store sampling location
Figure 90: Peninsula Depot and Lock 29 sampling location
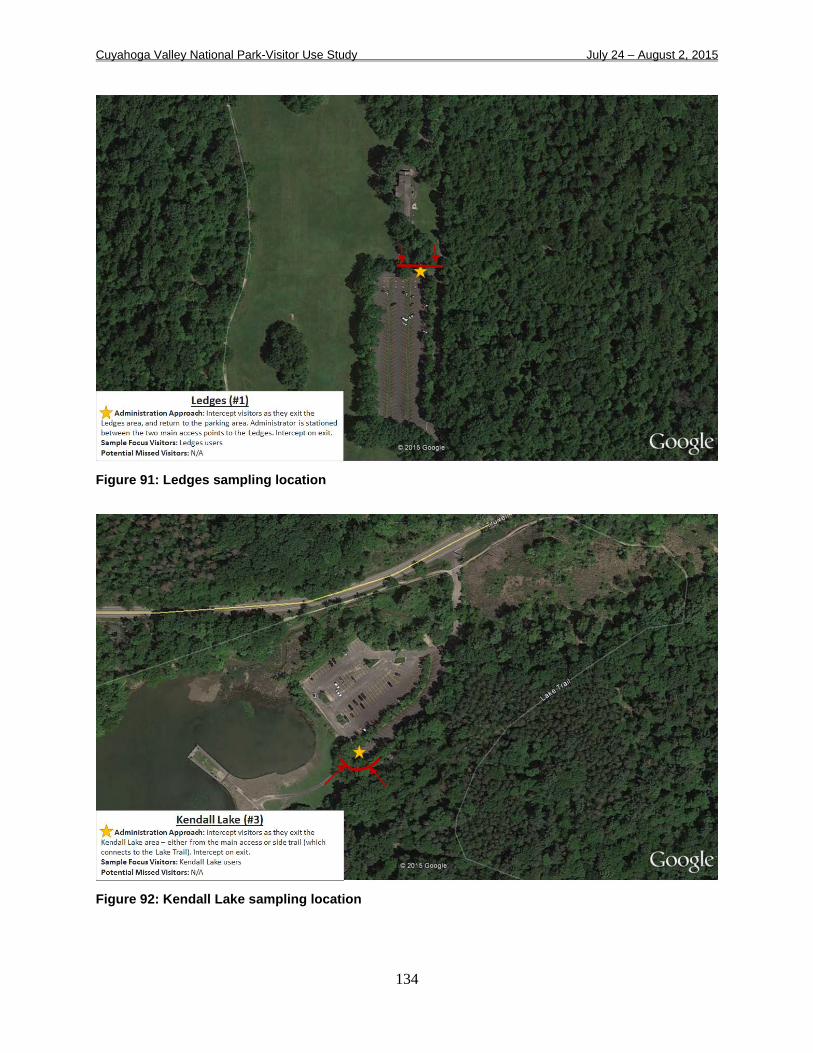
Cuyahoga Valley National Park-Visitor Use Study July 24 – August 2, 2015
134
Figure 91: Ledges sampling location
Figure 92: Kendall Lake sampling location

Cuyahoga Valley National Park-Visitor Use Study July 24 – August 2, 2015
135
Figure 93: Oak Hill sampling location
Figure 94: Everett Road Covered Bridge sampling location

Cuyahoga Valley National Park-Visitor Use Study July 24 – August 2, 2015
136
Figure 95: Ira Road sampling location

National Park Service U.S. Department of the Interior