national park service visibility monitoring...
TRANSCRIPT
National Park Service Visibility Monitoring Network
IMPROVE Meeting October 24, 2017 Ely, Minnesota
Joe Adlhoch, Mark Tigges, Scott Cismoski Air Resource Specialists
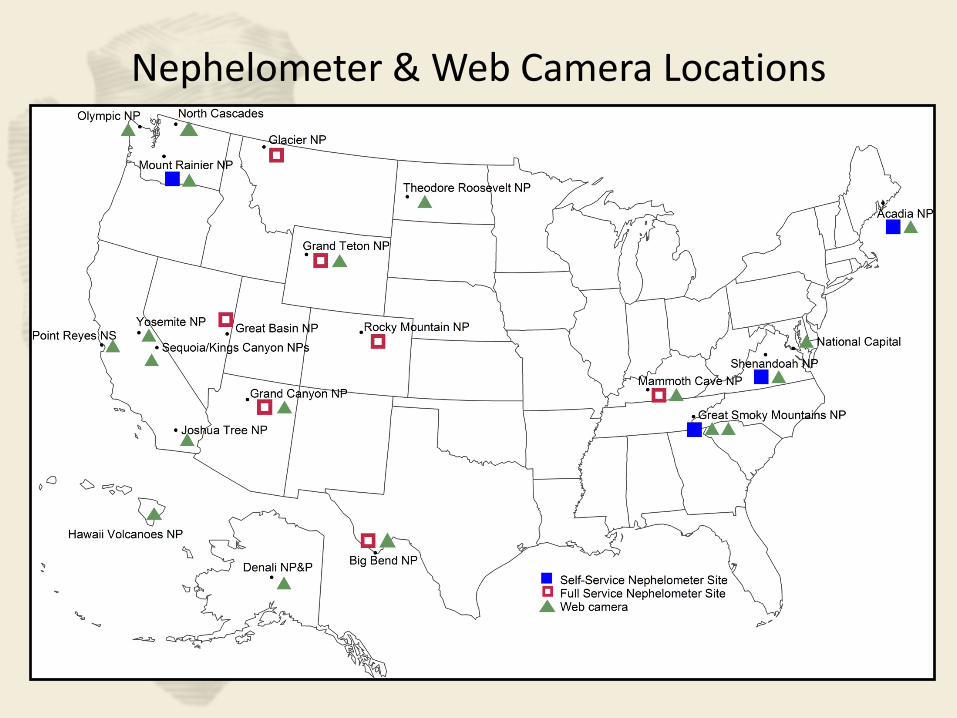
Nephelometer & Web Camera Locations
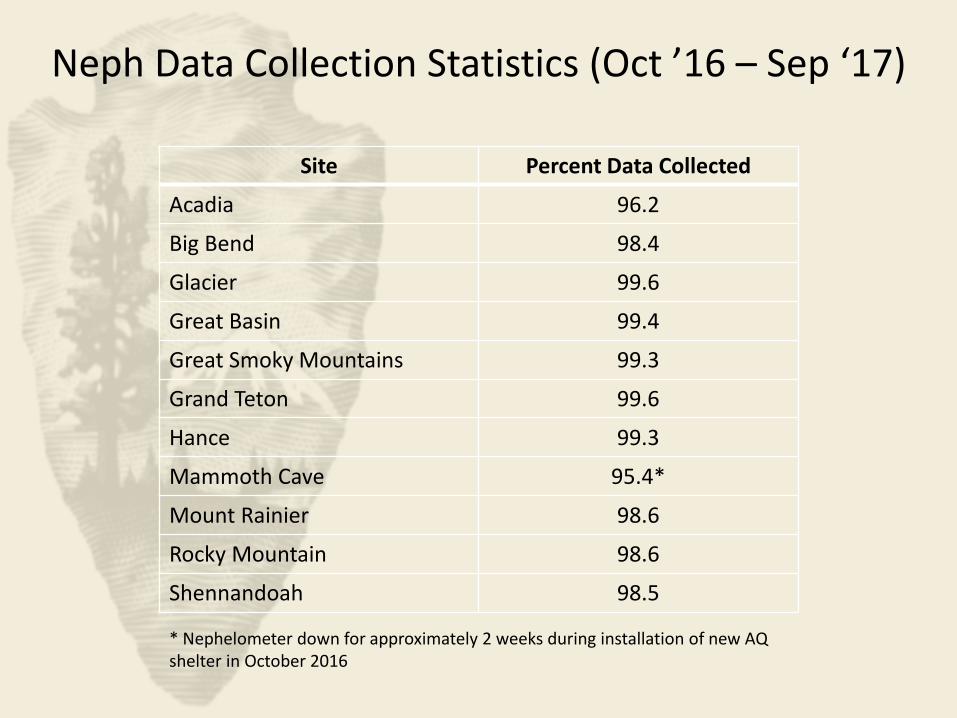
Neph Data Collection Statistics (Oct ’16 – Sep ‘17)
Site Percent Data Collected
Acadia 96.2
Big Bend 98.4
Glacier 99.6
Great Basin 99.4
Great Smoky Mountains 99.3
Grand Teton 99.6
Hance 99.3
Mammoth Cave 95.4*
Mount Rainier 98.6
Rocky Mountain 98.6
Shennandoah 98.5
* Nephelometer down for approximately 2 weeks during installation of new AQ shelter in October 2016
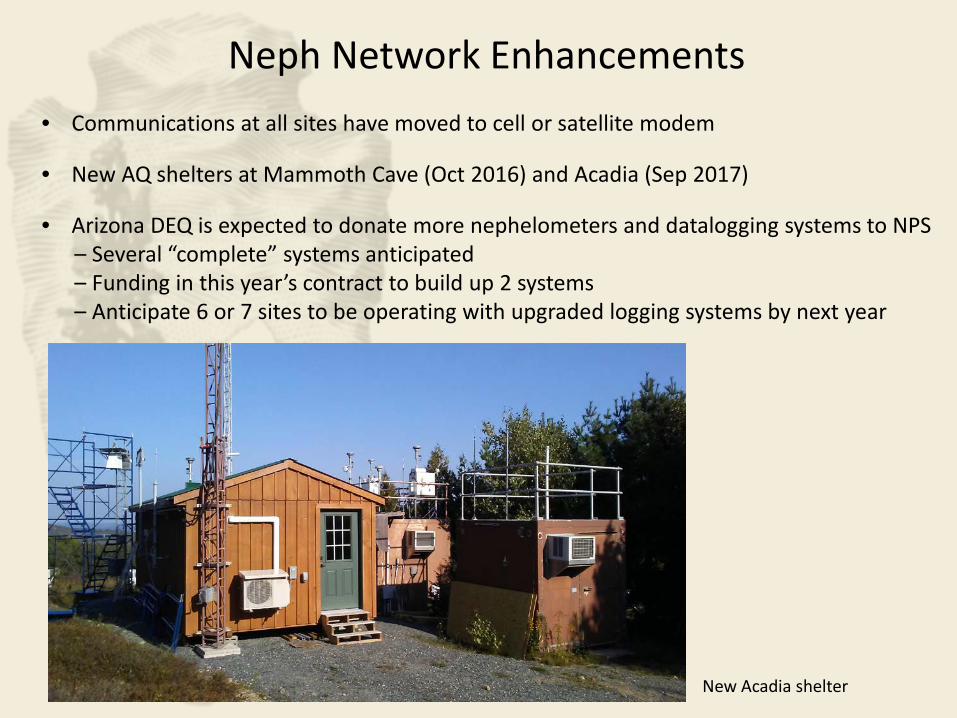
Neph Network Enhancements • Communications at all sites have moved to cell or satellite modem
• New AQ shelters at Mammoth Cave (Oct 2016) and Acadia (Sep 2017)
• Arizona DEQ is expected to donate more nephelometers and datalogging systems to NPS – Several “complete” systems anticipated – Funding in this year’s contract to build up 2 systems – Anticipate 6 or 7 sites to be operating with upgraded logging systems by next year
New Acadia shelter
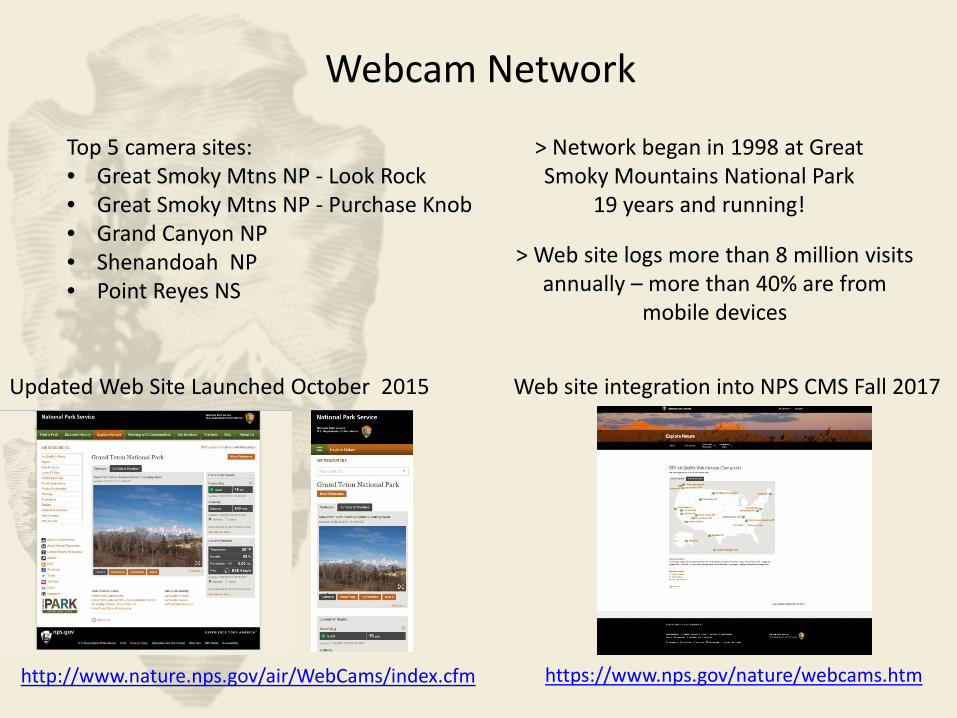
Webcam Network
http://www.nature.nps.gov/air/WebCams/index.cfm
Updated Web Site Launched October 2015
> Network began in 1998 at Great Smoky Mountains National Park
19 years and running!
Web site integration into NPS CMS Fall 2017
https://www.nps.gov/nature/webcams.htm
> Web site logs more than 8 million visits annually – more than 40% are from
mobile devices
Top 5 camera sites: • Great Smoky Mtns NP - Look Rock • Great Smoky Mtns NP - Purchase Knob • Grand Canyon NP • Shenandoah NP • Point Reyes NS

Webcam Archive Site
Standard resolution images added shortly following image capture. High resolution images added twice annually.
https://npgallery.nps.gov/AirWebCams/
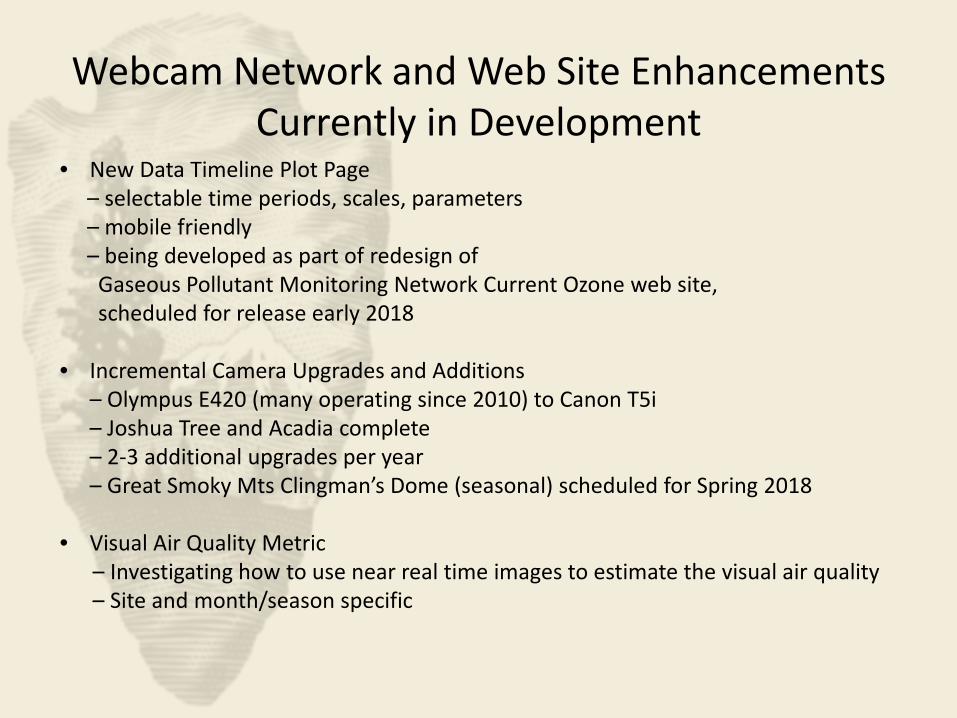
• New Data Timeline Plot Page – selectable time periods, scales, parameters – mobile friendly – being developed as part of redesign of Gaseous Pollutant Monitoring Network Current Ozone web site, scheduled for release early 2018 • Incremental Camera Upgrades and Additions
– Olympus E420 (many operating since 2010) to Canon T5i – Joshua Tree and Acadia complete – 2-3 additional upgrades per year – Great Smoky Mts Clingman’s Dome (seasonal) scheduled for Spring 2018
• Visual Air Quality Metric – Investigating how to use near real time images to estimate the visual air quality – Site and month/season specific
Webcam Network and Web Site Enhancements Currently in Development
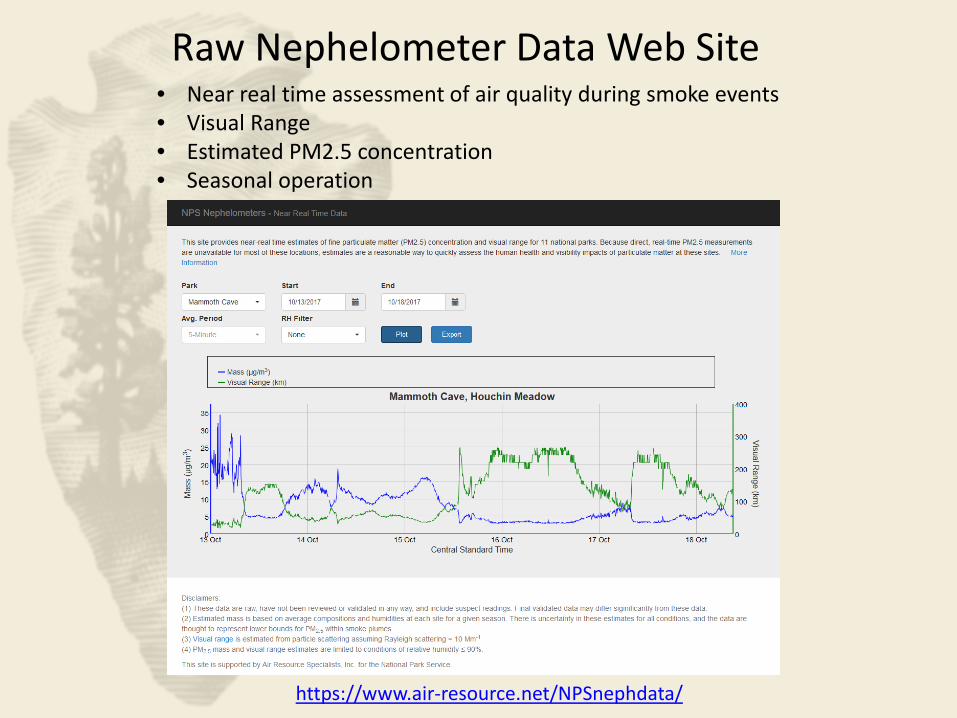
https://www.air-resource.net/NPSnephdata/
Raw Nephelometer Data Web Site • Near real time assessment of air quality during smoke events • Visual Range • Estimated PM2.5 concentration • Seasonal operation
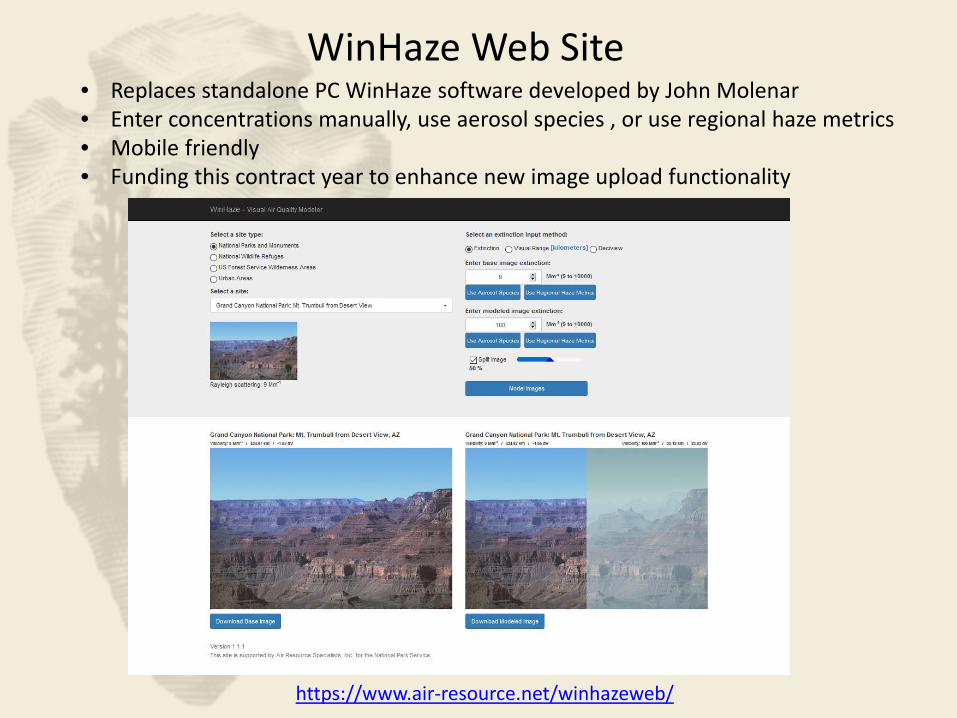
https://www.air-resource.net/winhazeweb/
WinHaze Web Site • Replaces standalone PC WinHaze software developed by John Molenar • Enter concentrations manually, use aerosol species , or use regional haze metrics • Mobile friendly • Funding this contract year to enhance new image upload functionality
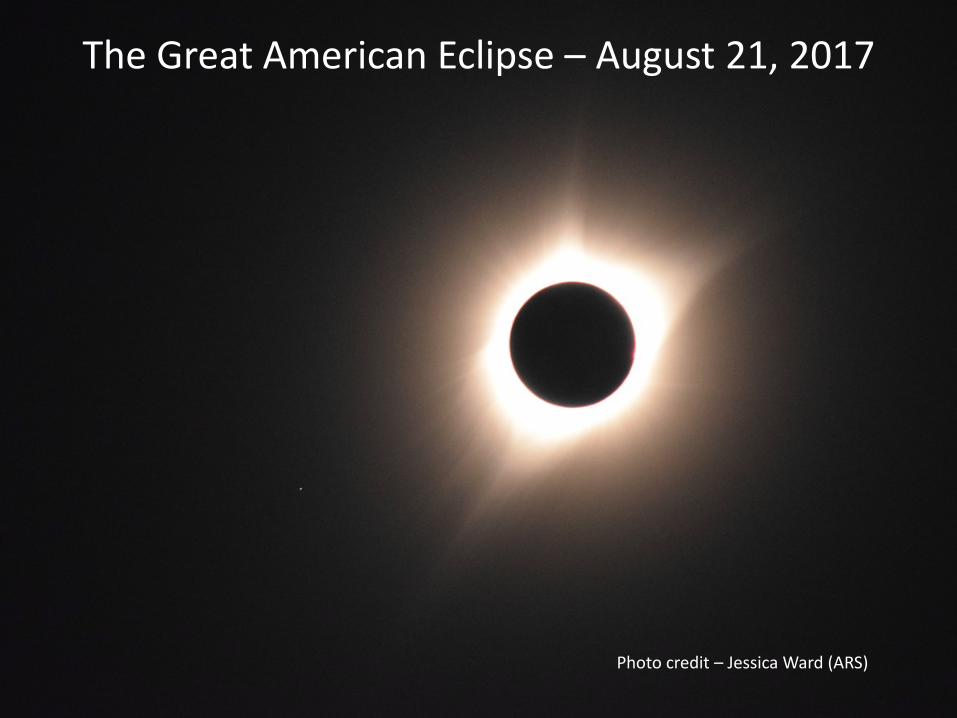
The Great American Eclipse – August 21, 2017
Photo credit – Jessica Ward (ARS)
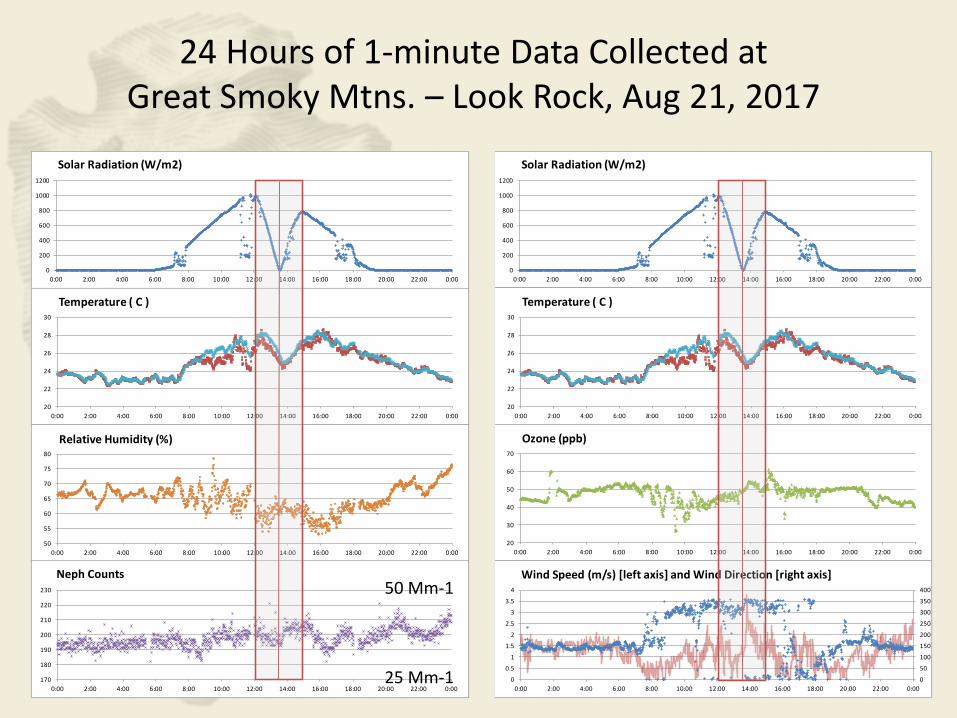
24 Hours of 1-minute Data Collected at Great Smoky Mtns. – Look Rock, Aug 21, 2017
0
200
400
600
800
1000
1200
0:00 2:00 4:00 6:00 8:00 10:00 12:00 14:00 16:00 18:00 20:00 22:00 0:00
Solar Radiation (W/m2)
20
22
24
26
28
30
0:00 2:00 4:00 6:00 8:00 10:00 12:00 14:00 16:00 18:00 20:00 22:00 0:00
Temperature ( C )
50
55
60
65
70
75
80
0:00 2:00 4:00 6:00 8:00 10:00 12:00 14:00 16:00 18:00 20:00 22:00 0:00
Relative Humidity (%)
170
180
190
200
210
220
230
0:00 2:00 4:00 6:00 8:00 10:00 12:00 14:00 16:00 18:00 20:00 22:00 0:00
Neph Counts
0
50
100
150
200
250
300
350
400
0
0.5
1
1.5
2
2.5
3
3.5
4
0:00 2:00 4:00 6:00 8:00 10:00 12:00 14:00 16:00 18:00 20:00 22:00 0:00
Wind Speed (m/s) [left axis] and Wind Direction [right axis]
0
200
400
600
800
1000
1200
0:00 2:00 4:00 6:00 8:00 10:00 12:00 14:00 16:00 18:00 20:00 22:00 0:00
Solar Radiation (W/m2)
20
22
24
26
28
30
0:00 2:00 4:00 6:00 8:00 10:00 12:00 14:00 16:00 18:00 20:00 22:00 0:00
Temperature ( C )
20
30
40
50
60
70
0:00 2:00 4:00 6:00 8:00 10:00 12:00 14:00 16:00 18:00 20:00 22:00 0:00
Ozone (ppb)
50 Mm-1 25 Mm-1