national political economy analysis and fiscal space ... · case study – tanzania mainland fiscal...
TRANSCRIPT

Fiscal Space Profiles of Countries in
Eastern and Southern Africa
Case Study – Tanzania Mainland
Fiscal Space Analysis
June 2017


3
Table of Contents
List of abbreviations 5
Executive Summary 7
1 Introduction and methodology 9
2 Defining the Fiscal space 13
2.1 Macroeconomic and fiscal characteristics 13
2.2 Tanzania’s priority expenditure and fiscal space in recent years 16
2.2.1 Current and future challenges and implications for the fiscal space in the priority
sectors 18
3 Tanzania’s options for enhancing the fiscal space 23
3.1.1 Base scenario and fiscal space “mapping” 23
3.1.2 Option to increase fiscal space: increasing tax and non tax-revenue (Scenario 1-3) 25
3.1.3 Other scenarios (4 and 5) 28
3.1.4 Effects of scaling up priority expenditure in line with current policies and
programmes 29
3.1.5 Other options to increase fiscal space 32
4 Conclusions 35
Appendix 1: Fiscal space projections 37


5
List of abbreviations
AFDB African Development Bank
CCHP Comprehensive Council Health Plan
CCM Chama Cha Mapinduzi
CSO Civil Society Organisations
EAC East African Community
FY Fiscal Year
FYDP Five Year Development Plan
GDP Gross Domestic Product
IDA International Development Association
IMTC Inter-Ministerial Technical Committee
IMF International Monetary Fund
LGA Local Government Authority
LIC Lower Income Country
MDA Ministries, departments and agencies
MoFP Ministry of Finance and Planning
MP Member of Parliament
MTEF Medium-term expenditure framework
MVC Most vulnerable children
NCPA National Costed Plan of Action
NGO Non-government organisation
NMNAP National Multi-sectoral Nutrition Action Plan
NPAC-VACW National Plan of Action to End Violence Against Children and Women
ODA Official Development Assistance
PANITA Partnership for Nutrition in Tanzania
PO-RALG President's Office Regional and Local Government
PSSN Productive Social Safety Net
SUN Scaling up Nutrition
SWO Social Welfare Officers
TASAF Tanzania Social Action Fund
TFNC Tanzania Food and Nutrition Centre
TPSF Tanzania Private Sector Foundation
TZS Tanzanian Shilling
UKAWA Umoja wa Katiba ya Wananchi [Coalition for the People’s Constitution]
US United States
VAT Value Added Tax

6
Preface
This report is part of a series of country studies carried out by Ecorys and associates for UNICEF in
Eastern and Southern Africa. The project aims to strengthen UNICEF’s advocacy efforts through a
better understanding of the role of political economy factors in processes and decisions around the
creation and use of fiscal space for investments in children.
This report was written by Paul Beckerman, Dafina Dimitrova, Jan-Willem Knippels, Gabriele Pinto
and Ivo Gijsberts.
The writers of this report wish to thank the staff from UNICEF Tanzania for their support and
guidance. They also express gratitude to the various government officials and other stakeholders
who provided inputs.
The findings, interpretations and conclusions expressed in this report are those of the authors and
do not necessarily reflect the policies or views of UNICEF or of the United Nations. The text has not
been edited to official publication standards, and UNICEF accepts no responsibility for errors. The
designations in this publication do not imply an opinion on legal status of any country or territory, or
of its authorities, or the delimitation of frontiers.

7
Executive Summary
The main challenges to expanding Tanzania’s fiscal space for priority sectors for children
include an ambitious infrastructure program, budget deficit targets, an outflow of donor
funding and rapid population growth. Tanzania recently initiated a Five Year Development Plan
(FYDP II). This includes major investments to improve facilities and infrastructure and will require a
significant increase in development spending. The government also aims to keep the fiscal balance
at -3% of GDP. Given that the fiscal balance in fiscal year (FY) 2016/17 amounted to -4.5% of GDP
and that donor funding is likely to diminish, resources will need to come from other parts of the
budget, potentially from priority sectors. At the same time, the number of children and young people
is projected to rise significantly over the coming years, and simply maintaining current levels of
spending will create additional budgetary pressures.
Among priority sectors – defined for the purpose of this study as education, health,
nutrition, social assistance and child protection – government spending has grown in recent
years, but there is still a need to improve budget execution rates and plug funding gaps.
Between FY2011/12 and FY2014/15, the Government of Tanzania spent an average of 16% of its
total budget on education, and around 8% on health. Over this period, actual expenditures on both
sectors also grew significantly in real terms. In addition, the reduction in donor support to education
and health has been met with an increase in domestic funding. Despite the increase in budgets of
the major social sectors, execution rates have not performed well, especially at sub-national levels.
Other priority areas, including nutrition, social assistance and child protection, are characterized by
low budget credibility, with major variances between budget allocations and releases.
In a baseline status-quo scenario where economic growth is in line with recent trends,
increasing spending on priority sectors based on projected needs will lead to a fiscal deficit.
Between FY2016/17 and FY2020/21, overall priority expenditure is projected to average 6.3% of
GDP, which amounts to approximately US$145 per child (at FY2015/16 prices and exchange rate).
Under this scenario, the fiscal deficit would average 3.9% of GDP.
Improving the VAT tax administration system is a first option to raise funds to pay for more
education and social protection staff. Assuming a 20% improvement in domestic and import
VAT collection, coupled with an increase in education and social protection staff, the internal debt
would be 3.0% of GDP, which is below the baseline scenario. Total government debt in FY2020/21
would total 30.8% of GDP, which is also below the baseline forecast of 31.7% of GDP.
Maintaining the current level of economic growth is another option to increase spending on
sectors that are important to children. A minor slowdown in economic growth below the
projected rate of 6.9% of GDP will not affect priority expenditure. However, if average GDP growth
slows to 4.0% or less over the projection period, the fiscal gap would be significantly larger and
likely result in an increase of total government debt by 3% of GDP compared to the baseline
scenario. This underlines the importance of sustaining current levels of GDP growth to allow for
increases in priority expenditure on children.
A third option to scale up priority expenditure is to increase administrative efficiencies.
Achieving higher budget execution rates would allow for greater actual expenditure, as available
funds would be used. The total effect on fiscal space, however, is likely to be minimal, although the
impact of current budgets would be improved. Likewise, increasing expenditure, such as by hiring
8
more staff in the education sector, will only result in a small negative effect on the fiscal space gap
since these policies are already captured in FYDP II.
Less feasible options to create fiscal space include expanding external and internal debt
levels as well as receiving greater foreign aid. Non-concessional external debt is not
recommended to fund social sector expenditure as yields from these investments are only reaped
over the long term, which extend far beyond the terms of these types of debt arrangements; the
same rationale applies to internal debt for these purposes. Moreover, in line with global trends,
external grants are likely to decline over the projection period and are not expected to be a potential
source for expanding priority spending.
Despite the challenges presented by self-imposed budget deficit targets, other spending
priorities, lower donor funding and population growth, there are many options that would
allow Tanzania to continue its commitment to boosting spending on sectors that matter for
children. The most beneficial and strategic approach is for the government to foster robust
economic growth over the near term, which will naturally increase the available revenue pool that
can be accessed for priority sectors. Other possibilities include strengthening the VAT
administration system as well as addressing existing inefficiencies in social sectors, especially
related to budget execution. Whether combined or pursued individually, these options can go a long
way to expand fiscal space and improve the lives of children across the country.

9
1 Introduction and methodology
This chapter analyses the Tanzanian government’s recent and future financial capacity to carry out
expenditure on which children depend for their human development and general welfare. This
financial capacity is understood to be the “fiscal space” underlying such expenditure. The fiscal-
space analysis has been carried out using a fiscal-projection exercise in Excel (TzFS.xlsm).
Priority expenditure categories for children
This chapter refers to expenditure categories regarded as beneficial to children as “priority”
expenditure. For Tanzania, such priority expenditure categories for children comprise the following
five “institutional” expenditure categories:
1. Education;
2. Health;
3. Social Assistance;
4. Nutrition; and
5. Child protection.
The composition of the government’s priority expenditures for children is, inevitably, somewhat
arbitrary. Government expenditure classified as “as priority” includes aspects that are unrelated, or
only loosely related, to children’s welfare, such as higher education expenditure. At the same time,
some expenditure categories classified as non-priority are highly relevant to children, notably, for
example, in the water and sanitation sector. This is especially important to bear in mind when
considering possible scenarios to enhance priority expenditure by reducing non-priority
expenditure. Future analyses of this kind may work with different definitions of priority expenditures
for children. Even so, however, the methodological approach used in this study could work in the
same way. That is, the methodological approach in itself is the fundamental recommendation.
It is also important to bear in mind that the fiscal space discussion concerns only expenditure
carried out by government within its budget, as reflected in the consolidated budget of national
government entities. Government expenditure on education and health plainly constitutes the bulk
of the resources dedicated to education and public health in Tanzania. Much of this expenditure is
in categories that only the government carries out, or could carry out. Nevertheless, non-
governmental expenditure in these sectors is also significant. Especially in the health and social
protection sector, some important programmes are funded by private and NGO entities, some of
which receive donor support. These would not be included in the government budget. The present
focus, however, is the expenditure flows in the priority sectors that flow through Tanzania’s fiscal
accounts.1
A final note refers to one of the key measures used in the FSA in order to examine and compare
both historical spending and the variation in priority expenditure under different scenarios, namely
priority spending per child. This measure takes the total spending in the priority expenditure
categories, and divides this by the total number of children aged 15 or less in Tanzania2. The
1 While it would be possible to carry out the kind of analysis this chapter describes using an enhanced set of accounts going
beyond the official budget accounts, it may prove challenging to identify and incorporate all relevant expenditure programs
and funding sources. 2 The report uses the World Development Indicators (original) United Nation’s population statistics to obtain time-series data
on age cohorts. Accordingly, data for the age cohort 0-14 is used, in the absence of statistics for the age cohort 0-17.

10
figures on per-child priority spending obtained in this way are to be treated with caution since only a
proportion of total expenditure at the institutional level benefits children directly.
Priority expenditure ‘identity’ and analysis
To analyse the fiscal space for priority expenditure, the methodology first sets from the “identity”
that governs the relationship of priority spending with its
underlying fiscal space.
This identity states that total expenditure (comprising current,
non-interest, interest, and capital expenditure) less the sum of
total revenue and external grants is equal to the overall
deficit, which is in turn equal to the net flow of external and
internal financing. If total expenditure is broken down into the
three categories of (1) priority and (2) non-priority non-interest
expenditure and (3) interest expenditure, this identity can be
rearranged for any year as shown in the box.
The “below-the-line” accounts taken together constitute the
fiscal space for the priority-expenditure flow. For a
retrospective analysis – that is, for analysis of fiscal performance in historical years – this structure
can be applied directly to show how the below-the-line flows (the retrospective fiscal space)
combined to finance the priority expenditure flows. Section 1.3 describes the historical quantitative
analysis for Tanzania, for the years FY2011/12- 2014/15.
For the projection analysis, the accounting identity is applied in a different way. For each projection
year, the priority-expenditure flow is projected on the basis of programming assumptions,
encompassing the various determinants of recurrent and non-recurrent expenditure in the
education, health, nutrition, child protection and social assistance categories. Similarly, the below-
the-line accounts, except for the net internal financing flows, are projected on the basis of
programming assumptions. The total net internal financing flow for each year is then calculated
residually, to ensure that the accounting identity is satisfied.
For any projection year, this net internal financing flow is the fiscal-space “gap”, that is, the
difference between the projected priority-expenditure flow and the fiscal space. If this gap is “too
large,” then the programming assumptions, taken together, would be considered unfeasible. The
criteria for “too large” include the limits on the government’s capacity to borrow in domestic financial
markets and the implied increase in the government’s debt-GDP ratio. Policy-makers would
presumably want to avoid having the net internal borrowing flow exceed 2-3 per cent of GDP in
coming years, to avoid having the internal-debt burden rise as a percentage of GDP.
The projection exercise is formulated by applying various assumptions, together constituting a
“scenario,” to the historical data base. The relatively simplified, illustrative projection exercise
applies scenarios to historical data (as discussed in Appendix 1). Each scenario comprises
programming assumptions for the years FY2016-2020, covering:
world economic conditions;
basic Tanzanian macroeconomic variables;
merchandise exports and imports;
tax and non-tax revenue;
external grants to the government;
government expenditure in the priority and non-priority categories; and
external and internal debt.
Fiscal identity
Priority expenditure
=
Tax and non-tax revenue
+ External grants
- Non-priority expenditure
- External debt service
- Internal interest
expenditure
+ External debt
disbursements
+ Net internal financing flows

11
For each scenario, some of the assumptions lines are set as simple numbers (growth rates,
percentages of GDP, etc.). Many of the assumptions, however, are constructed from other
assumptions. For example, the growth rates of real GDP and of the price level are numbers that the
analyst chooses for any given scenario. It is straightforward to combine these assumptions into an
assumed growth rate for nominal GDP.
Limitations of the data
This analysis is based on budgetary data covering actual figures (budget outturn) for the fiscal
years (FY) 2011/12- 2014/15. The main data source has been the Tanzania Ministry of Finance,
which publishes quarterly budget-spending reports. Additional data sources include the Bank of
Tanzania, UNICEF, as well as the World Bank/ IFC. Despite a substantial data-collection effort, the
quantitative analysis presented in the sections below is subjected to two important caveats. First,
budget execution data were unavailable for FY2015/16. Thus, the projection exercise does not take
account of actual spending figures past June 2015. Second, data on spending in the priority-
expenditure categories is limited. Functional level breakdown of data, and associated expenditure
classified under the economic classification, were not readily available in more detail. Time and
resource restructions for this study did not allow for an in-depth reclassification of expenditure.
Thus, as noted before, for the modelling exercise, which looks into aspects such as increases in
staff levels, priority expenditure categories were taken to be those of the main government
institution responsible for the respective area. Since disaggregated data were not available for more
detailed expenditure categories, we could not produce more refined definitions and calculations for
scenarios involving relevant sub-categories.
Organization of the FSA
The remainder of this report is organized as follows. Chapter 2 summarizes Tanzania’s present
macroeconomic and fiscal circumstances. It also analyses the recent evolution of the priority
expenditure flows in the categories of priority expenditure and outlines some specific challenges in
the various areas relevant for expenditure on children. Chapter 3 discusses various options
available to policy makers to enhance the fiscal space with an illustrative projection exercise for the
priority expenditure flows and the fiscal space that would fund them for the years FY2016/17-
FY2020/21. The exercise consists of a base scenario, comprising a broad range of macroeconomic
and fiscal-policy assumptions, and various alternative scenarios. Chapter 4 summarises the main
findings from the analysis. Further projection details are included in Annex 1.


13
2 Defining the Fiscal space
2.1 Macroeconomic and fiscal characteristics
Table 2.1 shows some of the basic macroeconomic indicators for Tanzania for the fiscal years
FY2011/12-FY2015/16.
Table 2.1 Tanzania: Selected macroeconomic indicators, FY2011-2016
FY11-12 FY12-13 FY13-14 FY14-15 FY15-16
Gross domestic product* $34.612.5 $36.768.3 $39.382.2 $42.124.0 $45.086.2
Growth rate 6.5% 6.2% 7.1% 7.0% 7.0%
Per-capita:
Gross domestic product** $722.8 $743.9 $771.9 $800.1 $830.0
Growth rate 3.1% 2.9% 3.8% 3.7% 3.7%
Non-government consumption** $487.8 $495.2 $503.7 $480.4 $499.7
Growth rate 2.5% 1.5% 1.7% -4.6% 4.0%
Per cent of GDP:
Gross fixed capital formation 31.6% 30.5% 31.6% 33.6% 35.6%
Central-government fiscal surplus -3.2% -4.6% -3.1% -3.6% 0.0%
Merchandise-trade surplus -13.4% -13.9% -14.4% -11.5% -9.2%
Growth rate:
Consumer prices (December) 17.4% 7.6% 6.4% 6.2% 5.5%
Exchange rate (December) 1.5% 1.6% 2.6% 24.8% 6.2%
Growth rate:
Population 3.2% 3.2% 3.2% 3.2% 3.2%
Population under fifteen 3.3% 3.3% 3.2% 3.3% 3.1%
* US$ million at 2015 prices and exchange rate.
** US$ at 2015 prices and exchange rate.
Data sources: International Financial Statistics, World Development Indicators, Tanzania Ministry of Finance.
Recent economic developments
The economic performance of the Tanzanian economy has followed a relatively strong and stable
pattern over the period under consideration. As reported in Table 1-1, real GDP has grown at an
annual average rate of 6.7 per cent over the period FY2011/12 – FY 2015/16. The growth of per-
capita real GDP has risen since FY201/12. International observers have noted that a combination
of stable performance in agriculture, as well as sustained improvements in sectors such as mining,
communications and financial services, is likely to underpin relatively high real growth rates over
the medium term.3 Reform efforts in areas such as taxation and governance may also contribute to
growth performance, even in the medium term.
GDP growth has been accompanied by strong growth in private consumption and investment, while
there was a slowdown in government consumption. The economic activities that have played a
major role in the growth rate include construction, services and basic manufacturing, as well as,
3 Tanzania has been categorized as a ‘stable grower’ whose economic growth has been based on economic reforms and
competitiveness improvements. (McKinsey&Company, 2016).

14
more recently, communications and transport. The agriculture sector remains crucial for Tanzania,
since it engages most of the labour force, however it has grown more slowly.
Constraints to growth include access to finance, issues in governance development, and problems
with infrastructure and public investment implementation4. Those are addressed in the second Five
Year Development Plan 2016/17 - 2020/21 (FYDP II) of Tanzania, launched in 2016. Under the
theme “Nurturing Industrialization for Economic Transformation and Human Development”, the
FYDP II continues the focus on growth and transformation from the first FYDP, and emphasises the
importance of addressing infrastructure gaps and job creation. Despite its emphasis on
industrialisation and economic restructuring, the FYDP II also incorporates an enhanced framework
for investment in human development and poverty reduction from the previous National Strategy for
Growth and Poverty Reduction (MKUKUTA II).5
Monetary policy has generally been steady and cautious. The slowdown in the depreciation path of
the local currency (Tanzanian Shilling, TZS) in 2016 is believed to result from a weaker United
States dollar (US$) and an improvement in domestic market expectations. However, some reversal
in the evolution of the local currency could occur if the current appreciation trend of the US$
continues. Borrowing costs remain high, with lending rates driven largely by liquidity requirements
of large firms and government institutions, although to some degree by the monetary authorities’
intervention.6
Tanzania’s external debt was significantly reduced in 2006/2007 by the Multilateral Debt Relief
Initiative, although since then it has grown as Tanzania has received new concessional credit. Over
the past decade, total public sector debt (including an estimation of arrears) has gradually
increased, reaching 37.5 percent of GDP in 2015/16. Currently, it is estimated that external public
debt amounts to around three-quarters of total public sector debt. Tanzania’s largest creditors are
the International Development Association (IDA) and the African Development Bank (AfDB),
accounting for more than two-thirds of its public external debt. A July 2016 IMF Debt Sustainability
Analysis argues that Tanzania continues to have a low risk of external debt distress, although the
relevant stress tests have pointed to some vulnerabilities related to exchange rate depreciation and
the lack of fiscal consolidation. In particular, the IMF’s recommendations to ensure debt
sustainability are: (i) to maintain a gradual increase in non-concessional borrowing; (ii) to
strengthen Tanzania’s debt management capacity; and (iii) to implement further public financial
reforms.7
Tanzania’s economy has also been affected by the overall reduction in financial-resource flows
from international donors to low income countries. The overall value of donor financing (external
grants and concessional loans) relative to total government expenditure has declined dramatically
over the past decade, dropping from 44 per cent in FY2004/05 to 19 per cent in FY2013/14. It is
estimated that it has decreased further to 14 percent in 2014/15. One reason for this development
is the overall decline in Official Development Assistance (ODA) due to political pressures in
development partners ‘own countries. Another is the halt in the provision of budget support in 2014,
due to allegations of mismanagement, as well as the delays in release of funds in 2016 due to
difficulties in meeting disbursement conditions. A new agreement on sector budget support from the
EU is currently being prepared, however such issues may continue to play a role. Among bilateral
donors, the largest contribution comes from the United States, with an average contribution of US$
4 World Bank Ease of Doing Business 2016, and IMF Art. IV Report 2017. 5 President’s Office Planning Commission, Supporting the preparation of Tanzania’s second five year development plan
(FYDP II) 2016/17-2021/22, May 2016. 6 Deloitte, Tanzania Economic Outlook 2016: The story behind the numbers. June 2016. 7 IMF, Tanzania Debt Sustainability Analysis. June 2016.

15
623 million in the fiscal year 2013/14 allocated mainly to education, infrastructure, health and
population issues.8
Current and future challenges and implications for the fiscal space
While Tanzania has made impressive progress in recent years in improving its fiscal position, it
continues to face a policy challenge, especially in light of the ambitious infrastructure spending it is
aiming at.9 On the one hand, Tanzanian revenue collection has recently been enhanced, and
should continue to improve, as a consequence of administrative reforms implemented as of
November 2015. A sharper focus on tax administration has led to significant gains, with tax
collection for January 2016 doubling as compared to the same period in 2015. For the fiscal year
2016/17 the Tanzania Revenue Authority has set a revenue collection target at 13.8 per cent of
GDP. Also, the government has made significant reductions in public expenditures, notably the
reduction of civil service overheads.
On the other hand, the government has accumulated large arrears with pensions funds and the
private sector (amounting to US$ 700 million and US$ 400 million respectively). 10,11 This increase
came about in part because revenue collection fell below government targets for FY 2013/14 and
2014/15. Moreover, the government has accumulated arrears with the national power companies.
The full amounts due to utility providers such as TANESCO and DAWASCO have not yet been
completely clarified.12 In order to be able to expand its expenditure on infrastructure, Tanzanian
policy-makers have concluded that they need to pursue a fiscal policy that targets a fiscal deficit of
3 percent of GDP.13 That level should permit them to limit net internal financing. In such a scenario,
Tanzanian policy makers would rely on external financing to help fund the government’s
infrastructure investment.
Another significant pressure on the fiscal space stems from the already mentioned outflow in donor
funding. External aid, including concessional loans, still provides more than 10 per cent of the
government budget and a disproportionate share of the financing for development and investment,
but given that the trend of declining ODA is highly likely to continue, the Government of Tanzania is
facing increasing pressures to substitute the respective funding. This is particularly relevant in light
of the various infrastructure-related goals of the FYDP II, including concrete objectives on improving
facilities and infrastructure in priority areas for children, where substantial parts of development
spending are currently donor-funded.
For the future, Tanzania’s main challenge in macro-fiscal terms stem from the interplay between
relative poverty and rapid population growth. As a result of those, the Tanzanian government
effectively faces a three-way set of policy imperatives. First, it must promote real growth, which is
ultimately Tanzania’s best hope of reducing poverty over the longer term. Second, it must invest in
human capital, dedicating the “right” amount of resources to addressing children’s welfare, in the
areas of education, health, social protection, nutrition, water and sanitation, and child protection.
With the share of children and young people projected to rise significantly over the coming period,
this will put significant pressure to maintain current levels of related spending. Thus, third, the
8 UN Economic Commission for Africa, Tanzania Country Profile 2015. March 2016. 9 World Bank, Why Should Tanzanians Pay Taxes? The Unavoidable Need to Finance Economic Development. July 2015. 10 In order to clear these arrears issuing bonds and injecting funds seem to be the most suitable options. See, also, World
Bank (2015) for further details. 11 The consultation during the PEA exercise with the country authorities has revealed that clearing the arrears became a
priority and some efforts in this area have already been done. 12 The consultation with TFNC revealed that they were not able to face some of their commitments with the utility providers
due to a shortage of finance that was expected to come from MoFP. 13 IMF, Tanzania Debt Sustainability Analysis. June 2015.

16
Tanzania Government must pursue the first two objectives while sustaining the government’s fiscal
balance.
The fact that so far Tanzania has been managing its fiscal accounts conservatively, and has
maintained a relatively high growth rate, can be interpreted positively in terms of future prospects. If
these circumstances continue, it should be possible for the authorities to maintain a sustained and
growing expenditure flow in the priority areas. Sustained growth should enable Tanzania to
maintain the fiscal space required to keep its priority expenditures for children growing in real terms
and to maintain pace with its rapidly growing population. This would be possible in particular
through maintaining a steady growth of tax revenue, which would be expected to be the mainstay of
the growth of priority expenditures for children. In this context, whatever serves to enhance revenue
performance would also help enhance the fiscal space: improved tax administration, diminishing
informality, and solid company profitability would all contribute to the fiscal space. For the medium
term, an additional source of fiscal space for Tanzania is its continuing access to concessional IDA
funds. Because IDA loans (and of course IDA grants) are highly concessional carrying no or low
interest rates, it makes sense to use them in social sectors such as education, health and social
protection.
Keeping in mind Tanzania’s plan to implement an ambitious infrastructure programme, which will
put pressure on the fiscal balance and is projected to lead to a fiscal deficit of 4.5 per cent for
FY2016/17, policy-makers aim to reduce the size of the informal sector. This would increase the
tax-revenue flow and open the way for formal financial operations to large segments of the
economically active population. However, the large proportion of the population who live in
extremely poor conditions may make it challenging to decrease informality.
Efficiency gains in current spending, in particular for investment, as well as clear prioritisation of
foreseen policies and projects, are another pathway to providing room to finance the increases in
infrastructure spending. Even in this case, Tanzania will likely continue to rely on funds provided by
the international community for some years to come. Thus, a conservative approach in which
priority expenditure is maintained seems to be a sensible ‘avenue’ to follow.
2.2 Tanzania’s priority expenditure and fiscal space in recent years
Over the years FY2011/12- 2014/15 Tanzania’s priority expenditure for children and the fiscal-
space flows evolved as shown in Table 2.2. It depicts the composition and the identity of Tanzania’s
priority expenditure, that is, expenditure relevant for children’s development and welfare, in terms of
percentages of GDP; as well as priority expenditures for children (based on the priority spending
categories defined at the beginning of the report) expressed as spending per child.
Table 2.2 Tanzania: Priority expenditure for children and its fiscal space FY 2011/12-2014/15
Fiscal year FY11/12 FY12/13 FY13/14 FY14/15
Per cent of GDP
Total priority expenditures for children 4.9% 5.2% 5.2% 5.2%
Total education expenditure14 3.57% 3.67% 3.45% 3.61%
Total health expenditure 1.15% 1.37% 1.49% 1.38%
14 Education expenditure shown here is equated to the budget of the Ministry of Education, and thus differs somewhat from
the total education expenditure at sector level.

17
Fiscal year FY11/12 FY12/13 FY13/14 FY14/15
Total social assistance expenditure15 0.14% 0.16% 0.19% 0.22%
Total nutrition expenditure 0.02% 0.02% 0.03% 0.03%
Total child protection expenditure16 0.01% 0.01% 0.01% 0.01%
Overall fiscal space 4.9% 5.2% 5.2% 5.2%
Tax and non-tax revenue (excl. external grants) (+) 12.5% 12.8% 13.4% 12.8%
External grants (+) 3.1% 2.6% 2.1% 1.1%
Total non-priority non-interest expenditure (-) -11.8% -11.2% -9.0% -9.1%
External-debt disbursements (+) 2.8% 2.9% 2.4% 2.6%
External debt service (-) -0.3% -0.5% -0.5% -0.7%
Net internal financial flows (incl. internal interest) (+) -1.4% -1.4% -3.2% -1.6%
Growth rates (US$ per child)
Total priority non-interest expenditure: 10.24% 2.29% 5.14%
Contribution to the growth of total priority expenditure:
Tax and non-tax revenue (excl. external grants) (+) 21.59% -2.27% 24.7%
External grants (+) -7.89% -18.47% 0.9%
Total non-priority non-interest expenditure (-) 34.79% -7.10% -9.0%
External-debt disbursements (+) -8.35% 6.96% -25.2%
External debt service (-) -1.06% -4.25% -11.7%
Net internal financial flows (incl. internal interest) (+) -36.80% 30.27% 30.9%
Data source: Tanzania Ministry of Finance, International Financial Statistics.
Over the observed years, the structure of priority expenditures for children has remained relatively
steady as a percentage of GDP, ranging between 4.9 and 5.2 per cent, while increases in the
various expenditure categories have been marginal (Table 2). The fiscal-space analysis shows
broadly how the flows of priority expenditures for children have been funded. In the structure set out
in Section 2.1 above, tax and non-tax revenue, external grants, external-debt disbursements, and
the net internal debt flow including internal interest contribute positively to the fiscal space that
funds priority expenditures for children, while non-priority expenditure and external debt service
contribute negatively to the fiscal space for priority expenditures for children.17 From the historical
analysis, the following can be noted:
Tax and non-tax revenue has been stable at around 12.5 per cent of GDP for all years apart
from FY2013/14, when it demonstrates a one-off increase up to 13.5 per cent of GDP, before
diminishing again to its FY2013/14 level. The authorities intend to improve revenue
15 Due to data availability, social assistance spending has been equated to spending on the Productive Social Safety Net
(PSSN) program under the Tanzania Social Action Fund (TASAF). PSSN spending amounts to 90 per cent of social
protection spending. Other programmes under TASAF include a complementary public works program, as well as
interventions to support livelihoods enhancement and targeted infrastructure. Spending on social assistance as used in
this report and the underlying modelling framework does not include spending on other social assistance programs,
including those specifically targeting children such as the Most Vulnerable Children (MVC) program and school feeding
programs under the Ministry of Social Welfare. No historical data on spending on those programmes could be obtained.
Social assistance as included in the model also excludes contributory spending on social insurance measures. 16 Child protection expenditure, for the purposes of this analysis, is estimated to equal 0.3 per cent of the budgets of the
ministries of Constitutional and Legal Affairs, Education, Health and Social Welfare, and Home Affairs (Police and Prison).
This estimate is based on data that shows spending on nutrition to be of a similar magnitude. The estimate also takes into
account findings from a 2011 Public Expenditure Identification Survey that estimated child protection spending at the
district level to be 0.2 per cent of total allocation at the district level. 17 Note that internal interest payments contribute negatively to the fiscal space. It may help to note that while, for example,
infrastructure expenditure is non-priority expenditure and so contributes negatively to the fiscal space, an external
disbursement that funds it would contribute positively to the fiscal space, and at least partially offset the effect of the
infrastructure expenditure.

18
performance principally through improved tax administration, increased formalization, and
maintenance of high real growth;
External grants declined markedly as a percentage of GDP, from 3.1 per cent of GDP in
FY2011/12 to 1.1 per cent in FY2-14/15, which is consistent with the decline in the ODA that is
provided through the government budget. This is the consequence of political pressures in
donor countries, but also of the difficulty in meeting disbursement conditions;
Non-priority non-interest expenditure also declined some as a percentage of GDP, from
11.8 per cent of GDP in FY2011/12 to 9.1 per cent in FY2014/15. This is partly the
consequence of strong policy efforts by the fiscal authorities to carry out significant reductions in
overhead expenditure. This decline had the effect of opening fiscal space for priority
expenditure;
External-debt disbursements remained relatively steady averaging 2.7 per cent of GDP.
External-debt service was also relatively stable, remaining below 1 per cent although drifting
upward over the period;
Finally, net internal-debt flows taking account of interest due were almost constant (apart from a
sharp jump to 3.2 per cent in FY2013/14) although the overall flow is negative because of the
interest bill. This is evidence of the conservative management of the fiscal accounts.
The historical performance of the fiscal space components demonstrates that despite pressures
stemming from decreases in external grans, the Government of Tanzania has been able not only to
maintain, but even to increase spending on the priority expenditure categories. The second part of
Table 2.2 shows that when expressed in $US at 2015 prices, total priority expenditure growth
averaged 5.9 per cent over the period, with the highest year on year increase of 10.4 per cent being
recorded between per cent between FY2011/12 and FY 2012/13. This growth is also evident when
considering that total real expenditure over the number of children aged 15 or less has increased
from $US 78.24 in FY2011/12 to $US 92.75 in FY2014/2015 (Table 2.3). A combination of savings
in non-priority expenditure, and a stable (though not necessarily improving) tax and non-tax
revenue performance has supported this development. A contribution analysis shows that the 0.6
per cent of GDP increase in tax and non-tax revenue receipts in FY2013/14 funded a quarter of the
increase in total priority spending observed over the following year. This demonstrates that the
Government of Tanzania has maintained a strong commitment to funding policies and programmes
affecting child well-being.
Table 2.3 Per child spending in priority expenditure categories18 US$
US$ per child at prices and exchange rate of 2015 FY11/12 FY12/13 FY13/14 FY14/15
Total priority expenditures for children $78.24 $86.25 $88.22 $92.75
Total education expenditure $57.07 $60.44 $58.94 $63.81
Total health expenditure $18.48 $22.59 $25.44 $24.34
Total social assistance expenditure $2.21 $2.64 $3.23 $3.97
Total nutrition expenditure $0.29 $0.41 $0.44 $0.47
Total child protection expenditure $0.18 $0.16 $0.17 $0.17
2.2.1 Current and future challenges and implications for the fiscal space in the priority sectors
Table 2.4 shows again the composition of priority expenditures for children, not expressed in
percentage of GDP but as percentage of total priority expenditures for children. The expenditure
18 As highlighted in the methodological introduction to this report, the herewith constructed measure of per child priority
expenditure should be interpreted with care, as it is based on total institutional spending in priority areas, which may
include expenditures that are not at all, or only loosely related to children.

19
categories here are defined institutionally.19 The budget data are for the general government,
comprising the central and the subnational government levels.
Table 2.4 Priority expenditure for children, relative shares of total, FY 2012/13 – FY 2014/15
Fiscal year: FY12/13 FY13/14 FY14/15
Per cent of total priority expenditure:
Total priority non-interest expenditure: 100.00% 100.00% 100.00%
Total education expenditure 70.08% 66.81% 68.79%
Total health expenditure 26.19% 28.84% 26.24%
Total social assistance expenditure 3.06% 3.66% 4.28%
Total nutrition expenditure 0.47% 0.50% 0.50%
Total child protection expenditure 0.19% 0.19% 0.18%
As evident, education constitutes the bulk of spending on priority categories (ca. 66-70 per cent),
followed by health (ca. 26-29 per cent). Furthermore, the relative shares of the various categories in
the total priority expenditure for children appear to be remarkably stable over the period. The only
exception is expenditure on social assistance, which is equated to spending on PSSN in this
analysis, and which increases somewhat.
Education and health spending together amounts to over 90 per cent of total priority spending. As a
share of the total budget, over the period FY2011/12 – FY2014/15, the Government of Tanzania
has spent on average around 16 per cent on education, and around 7.7 per cent on health.
Importantly, allocations to both sectors have grown significantly in nominal terms over the examined
period, both in terms of budgeted and actual amounts.
Education
Current priorities in the area of education are defined in the recent FYDP II, which sets out to
address in particular issues related to improving teacher-pupil ratios, since there is a strong need to
further increase staff numbers at primary and secondary level. In budgetary terms, this objective
implies the need for a significant increase in recurrent spending, which amounted to around 86 per
cent of total education spending in FY2014/15. At the same time, further objectives in education
pertain to improving the quality of educational facilities and related infrastructure, which will in turn
put pressure on development spending in the education area. In terms of funding sources,
education spending has been affected by the decline in foreign assistance, especially for the
development part of the budget, however the Government of Tanzania has responded by
increasing domestic resource allocation in this area (Figure 2.1). Finally, budget execution rates in
education still leave room for improvement, especially for the development part of the budget, and
there is a trend of growing disparities at sub-national level. Addressing stated objectives in
education for both the recurrent and development part will thus put significant pressure on the fiscal
space, which could be further exacerbated by the limitations in absorption capacity and the outflow
of donor funding.
19 Thus, for example, any expenditure by the armed forces on education of children of staff is classified as defence
expenditure rather than education expenditure.

20
Figure 2.1 Funding sources of education sector expenditure, FY2011/12 – FY2014/15
Source: UNICEF based on MoFP IFMS data.
Health
The FYDP II states a number of objectives in the area of health. Many of those aim at addressing
issues related to quality of health systems, equipment and training. The FYDP II also reiterates the
emphasis on preventive health care, which is a key priority from a child-friendly perspective. In fact,
spending on preventive services has already outpaced spending on curative services in 2014/15
(Figure 2.2). In nominal terms, allocations and spending on health have continuously increased
over the period FY2011/12 – FY2014/15, and this has also led to a real increase in the per child
expenditure in the health sector20 from $ US18.48 to $US 24.34 between FY2011/12 and
FY2014/15. As in the education sector, the outflow of donor funding poses an important challenge
for achieving the stated objectives in health and bears implications for the fiscal space, as it implies
the need to free up additional resources. In areas where the reductions in donor support have been
particularly high, such as drugs and medical supplies, there have been significant increases in the
own government contributions, e.g. a threefold increase in the funding of medicines for preventive
services, but previous levels are yet to be matched. Taken as whole, budget execution in health is
strong (Figure 2. 3), averaging 88 per cent over the period FY2011/12-FY2014/15. Nevertheless,
the trend is a declining one, and there are substantial geographical variations.
Figure 2.2 Health education spending FY2014/15, % of total government spending
Figure 2.3 Allocated vs. actual spending in health, FY2011/12-FY2014/15
Source: UNCIEF based on MoH data.
Social assistance21
Despite the impressive and continuous economic growth experienced by Tanzania for over a
decade, poverty levels in the country are still very high. According to a 2012 national survey, 28.2
20 Estimated as total spending in the health sector over the number of children aged 15 or less. 21 For the purposes of this analysis, due to data availability, social protection is equalled to TASAF expenditure on the PSSN
programme. Therefore the term “social assistance” is used as the PSSN is a social assistance cash transfer programme to
the most vulnerable.
0
5
10
15
20
25
30
FY 2011/12 FY 2012/13 FY 2013/14 FY 2014/15
Bil
lio
ns
Sh
illi
ng
s (
at
2013
-2014 p
rices)
Recurrent(PE)
Recurrent(OC)
Developmentforeign
Developmentlocal

21
per cent of the population were found to live under the national poverty line22. The World Bank
estimated that in absolute terms, the number of Tanzanians who live below the national poverty line
has not changed since 2001, and is still about 12 million. If a different poverty line of US$ 1.25
(2005 PPP) a day is considered, then 43.5 per cent of the population would be considered income
poor23. The combination of staggering poverty prevalence and strong population growth bears
enormous challenges for the future in terms of ensuring the well-being of a significant part of the
Tanzanian population.
Social Protection is mentioned in the FYDP II as part of the larger agenda to reduce poverty by
addressing social and economic risks, deprivation and vulnerability; protecting human rights and
improving capabilities and labour market results. The flagship project in the field of social protection
is the Tanzania Social Action Fund (TASAF) which was initiated in 2000. Under the current third
(TASAF III), a key intervention is the PSSN (Productive Social Safety Net), which is a nation-wide
conditional cash transfer programme. While a means-tested cash benefit is provided under PSSN,
TSAAF III emphasis lies on enabling productivity and participation in income-generating activities.
Therefore, it is complemented by a public works, livelihoods enhancement and infrastructure
interventions.
Tanzania has recently scaled up the PSSN to target more extreme poor across the country and in
addition, there have been moves to finalise a national social protection framework. However, while
overall TASAF III expenditure has been mainly donor-funded (World Bank, DIFD, SIDA), the recent
scale up has put more pressure on the Government to add own resources. Allocated amounts have
indeed increase substantially, however this has not necessarily resulted in higher actual spending.
In FY2015/16, US$7 million was allocated in the government budget for the entire TASAF III
project, with PSSN comprising roughly 90 per cent of this. However, only US$300,000 were
released. For the fiscal year 2016/2017 the Government allocated additional US$7 million but in
2013, at the beginning of the scale up, the government had committed to provide US$ 100 million
per year. The existing financial support by the government is not enough to sustain the program
beyond early 2018.
Nutrition and child protection
Nutrition and child protection are key focus areas of UNICEF’s engagement in Tanzania. UNICEF
works here in strong partnership with the government in policy development and implementation
and has supported the development of new National Action Plans have been developed in both
sectors. For nutrition this is the National Multi-sectoral Nutrition Action Plan (NMNAP) 2016-2021
while for Child protection this is the National Plan of Action to End Violence against Women and
Children (NPA-VAWC) 2017- 2021.
The NMNAP seeks to scale up of evidence-based multisectoral nutrition specific and nutrition
sensitive interventions to all segments of the population and providing a conducive enabling
environment. The overall financial requirement for the NMNAP is about TZS 590 billion (US$ 268
million) of which TZS 254 billion (US$ 115 million) is to be provided by the government of Tanzania.
In addition, the Government of Tanzania is committed to continue24:
Strengthening capacities of regional and district nutrition officers in planning, budgeting and
coordination of nutrition activities;
22 Ulriksen, M. (2016) The development of social protection policies in Tanzania, 2000-2015, CSSR Working Paper No. 337. 23 World Bank (2015), United Republic of Tanzania: Tanzania Mainland Poverty Assessment. Washington DC: World Bank. 24 Mpango, P. Human Capital Summit: Investing in the Early Years for Growth and Productivity. Speech by Tanzania Minister
of Finance and Planning, Honourable Minister Philip Mpango.

22
Strengthening multi-sectoral coordination and accountability to national nutrition commitments
through annual review of Common, Results, Resources and Accountability Framework for
nutrition and roll out of multi-sectoral nutrition scorecard at decentralized level.
Nutrition is a cross-institutional sector, and thus spending on nutrition-related activities comprises
expenditure under, among others, education, health, agriculture, water and sanitation and other
areas. Importantly, allocations to fund nutrition-specific activities have been rising, and actual
spending has more than doubled in the period FY201-/11-FY2014/15. Nevertheless, nutrition-
related spending comprises only 0.03 per cent of GDP and 0.13 per cent of total public spending
(Figure 2.4). In addition, a significant proportion of the resources in nutrition are donor-funded,
which raises questions about the sustainability of spending. Another issue is the gap between
allocated and actual expenditure for the realisation of the NMNAP, with the latter reaching less than
a quarter of the originally budgeted amounts for the FY 2011/12 and FY2012/13 according to MoF
data. Finally, from a budgetary perspective, a significant challenge is related to devolved spending.
Differences between allocated and released funds appear to be significant for sub-national level as
well. What is more, there are issues with prioritisation of nutrition spending at that level.
Figure 2.4 Nutrition and child protection spending (actual), FY 2011/12-FY2014/15, % of GDP
Source: UNCIEF based on MoF data.
As for child protection, the NPA-VAWC has been developed by consolidating eight different action
plans addressing violence against women and children to create a single comprehensive, National
Plan of Action. Linking to the FYDP II the NPA-VAWC recognizes that investing in violence
prevention initiatives has a positive impact on inclusive growth and creating human capital.
However, as evident from Figure 2.4, spending on child protection related activities is very small
(0.01 per cent of GDP). UNICEF estimates the funding gap for the realization of the objectives and
activities of the NPA-VAWC to be more than 60 per cent25.
25 UNICEF (2016), Child protection factsheet.
0
0.005
0.01
0.015
0.02
0.025
0.03
FY11-12 FY12-13 FY13-14 FY14-15
% o
f G
DP Total nutrition
expenditure
Total childprotectionexpenditure

23
3 Tanzania’s options for enhancing the fiscal space
The first part of this chapter discusses a multiannual projection in Excel of Tanzania’s fiscal space
under a set of “base-scenario” assumptions. (Appendix 1 describes the base-scenario assumptions
in detail.) The second and third part describes alternative scenarios and the consequences of the
options they embody on the fiscal space, as determined quantitatively by the projection exercise.
While each option takes account of Tanzania’s specific circumstances, it is important to remember
that the projection results are based on specified, quantitative programming assumptions. In no
case should the results be regarded as forecasts. Also important to keep in mind is the fact that the
“priority expenditure per child” measure is calculated on the basis of projected total expenditure at
institutional level (including such spending that is not directly child-related), divided by population
projections for the number of children aged 15 or less. The final part of the section discusses some
options that are less feasible in Tanzania’s present circumstances, but have figured in other many
governments’ fiscal-reform approaches.
3.1.1 Base scenario and fiscal space “mapping”
In its presentation of the base scenario, Appendix 1 describes its programming assumptions and
characterizes the projection results. The real-GDP annual growth rate is assumed to average 7 per
cent over the projection period in keeping with recent IMF projections. Most of the remaining
programming assumptions are intended as “neutral”, non-controversial, base-line assumptions that
would produce no significant changes in the fiscal structure as the real economy grows. The results
of the base scenario provide a basis for comparison with alternative scenarios incorporating
different assumptions.
Under the base scenario, priority expenditures in categories relevant for children would average 6.3
per cent of GDP over the years FY2016/17-2020/21. Over these same years, in real terms, total
priority expenditures for children would average US$144.87 per child at FY2015/16 prices and
exchange rate. Under the base-scenario assumptions regarding tax and non-tax revenue, external
grants, non-priority expenditure, and external- and internal-debt stocks and flows, the projected
flows of priority expenditures for children would produce a fiscal-space financing “gap” that would
have to be covered with internal financing. For the specific quantitative assumptions, the required
internal-financing flow would average 3.2 per cent of GDP over the projection years. The implied
fiscal deficit would average 3.9 per cent of GDP, on the order of the deficit outturns for FY13/14 and
FY14/15.
Figure 3.1 shows a fiscal-mapping chart for FY2011/12-2019/20, with projections according to the
base scenario. The projections are set out as percentages of GDP26. In the “stacked-bar”
presentation, funding sources are above and expenditure flows below the horizontal axis: in effect,
the sum of everything above the horizontal axis effectively funds everything below. For each year,
the sum of all flows above the horizontal axis is precisely equal to the sum of all flows below the
horizontal axis. Stated differently, the tax and non-tax revenue, the external grants, and external-
debt disbursements, shown above the horizontal axis, together fund the priority expenditure, the
non-interest non-priority expenditure, the external-debt service, and the (negative) internal financing
26 In the Excel file, it is straightforward to select alternative units of account, such as U.S. dollars, U.S. dollars at base-year
prices and exchange rate, or U.S. dollars at base-year prices and exchange rate per child.

24
flow including internal interest. The net internal financing flows include the interest on the internal
debt.
Figure 3.1 Fiscal space and its components over the historical and projection period in the base
scenario (FY2011/12-FY2019/20)
Source: TzFS.xls model calculations based on Government of Tanzania, UNICEF and IFS data.
The projection exercise can be used to evaluate different policy approaches involving priority
expenditure and its fiscal space. In general, if a scenario is proposed that involves an increase in
the priority-expenditure flow relative to what is in the base scenario, the “fiscal gap” would
presumably increase. The exercise would show an increase in the net internal financing flow to the
government compared with the base scenario. On the other hand, if a scenario is proposed
involving an enhancement through one or more elements of the fiscal space, the exercise would
show a reduction in the net internal financing flow to the government compared with the base
scenario. Naturally, combined scenarios are possible, in which both the priority-expenditure and the
fiscal-space flows are increased. The idea would be to determine the net consequence of the two
changes. The exercise shows the multiannual internal financing flows for the whole projection
period, and accumulates these flows so that the exercise shows the government’s total debt at the
end of the projection period.
Since these results are quantitative, they can be discussed in terms of their feasibility: Would the
net internal financing flow be likely to exceed the capacity of internal financial markets?, and would
the government’s total debt stock rise too high too quickly as a percentage of GDP?
In principle, policy-makers could be asked to consider enhancements to the fiscal space for priority
expenditure by considering the following options: (1) increasing tax and non-tax revenue; (2)
increasing external grants for budget support and projects; (3) reducing non-priority expenditures;
(4) reducing external debt service through agreements with creditors; (5) increasing external debt
disbursements; and (6) increasing net internal borrowing flows. In general, evaluation of the
alternative-scenario results suggests that the best policy approaches to securing sustained
increases in the fiscal space and so in the priority-expenditure flows appear to lie with improved tax
administration. As explained below, the other approaches are likely, in the base of tax increases
and reducing non-priority expenditure, to face political obstacles and may be counterproductive in
the medium term, since they might reduce the GDP growth that powers the revenue flows. Debt
funding for priority expenditure is inherently undesirable, because the cost of the debt is likely to

25
exceed the return on priority expenditure, at least until the long term. Finally, agreed reductions in
external-debt service are unlikely to be feasible – the international debt-reduction programs of the
1990s and 2000s are unlikely to be repeated in coming years.
Of course, other pathways to achieving improvements in the fiscal space are possible as well, most
notably in terms of improving allocative and cost-efficiency in the priority expenditure categories. In
all priority categories, achievement of development targets and objectives falls short of the original
aims. Some examples include the continued prevalence of stunting among Tanzanian children
younger than 5, high neonatal mortality, or access to pre-primary education. It is plausible to
assume that significant resources could be freed up through improving decision-making and
management through the continuous use and analysis of performance information, monitoring and
evaluation in conjunction with budgetary allocation information.
3.1.2 Option to increase fiscal space: increasing tax and non tax-revenue (Scenario 1-3)
Broadly speaking, Tanzania appears to possess potential to enhance its revenue flow by increasing
the efficiency of tax collection, broadening the tax base, and changing the cultural perception
towards taxation. Non-tax revenue might also be increased by increased efficiency in the
performance of State-Owned Enterprises. A possible future source for tax- as well as non-tax
revenue could be the extraction and selling of natural gas. It is unlikely, however, that overall tax-
rate increases will prove possible in the present political context, and might, in any case,
discourage economic activity. In 2016 the government of Tanzania in its pursuit of increasing
income has decided to go ahead with the introduction of an 18% VAT to all tourism activities that
were earlier exempt, including park entry fees. Critics warn that Tanzania will become prohibitively
expensive compared with rival destinations and point to Kenya which learned a hard lesson in 2015
when it imposed VAT on tourist services.
Despite expectations of growing tax revenue if the current high GDP growth is maintained and the
credibility in the system improves, Tanzania will also need to make a determined effort to narrow
the gap between potential and actual revenue collection under existing rules. IMF calculations
suggest that the revenue gap is now around 4 percentage points of GDP.27 The actual tax revenue
collection for 2014/15 amounted to 88 percent of the government’s target (TZS 9,892 billion versus
TZS 11,297 billion). However, there is some agreement that revenue collection targets set by GoT
are rather ambitious, and thus mask the impressive growth of actual revenue collection. In 2014/15,
revenue grew 6.4 per cent in nominal terms with respect to 2013/14. As reported by Lee et al.
(2015), the 88-per-cent collection rate was the lowest registered in the last 10 years - performance
had previously reached at least 90 per cent of the target.
To improve collection performance and reduce evasion, the Government of Tanzania has begun to
promote the use of Electronic Fiscal Device machines by the Tanzania Revenue Authority to
traders, regardless of whether they charge VAT on their transactions. Their use should improve
collection efficiency through automatic issuance of receipts, storage of sales transactions on
computer networks, as well as the generation of unique signatures.
Several initiatives to improve tax performance are now under consideration. During the mission,
policy-makers mentioned the possibility of reducing the current general VAT rate from 18 per cent
to 16 per cent. In itself, this reduction would reduce the revenue flow, but might encourage
compliance.
27 IMF, Tanzania selected issues paper, July 2016.

26
Although several changes in the existing body of legislation have been implemented since 2014,
such as a new VAT Act, policy-makers believe further efforts to enhance the relevant tax bases are
required. Options include a reduction in the list of exemptions, adopting recommended “best
practices” in the design of the taxation system, and simplification of administrative procedures.
An additional challenge for Tanzania’s revenue authorities is the huge size of the informal sector. It
is estimated that only 2.3 million workers, 12 per cent of the total labour force, work in the formal
sector. Increased formalization would increase the tax base (as well as open opportunities to
citizens to use financial services to save and to secure credit on reasonable terms).
Overall, further tax policy and administration reforms will be required to close the revenue gap
efficiently without compromising economic growth, while public financial management, governance,
and more broadly, government effectiveness also needs to be improved. An improved cultural
perception of taxation would also help. There have been proposals for a “social pact” between the
government and business organizations, among other purposes, to help promote tax compliance.
There may also be some scope for increasing non-tax revenue by improving the performance of
state-owned enterprises. In 2011 there were 283 state-owned enterprises, many of which have
been underperforming on both service delivery and profitability. Although enterprises are likely to
reinvest resources secured through higher profitability,28 it would also open the way to higher
taxation and at least some dividend income for the government.
An eventual potential source of fiscal-space enhancement is revenue from natural gas. The recent
discovery of additional natural gas reserves has raised expectations. However, private investors as
well as policy-makers have been cautious regarding the stream of revenue that could eventually be
obtained since sustained low oil prices affect investment decisions to exploit natural-gas deposits
(LNG contracts are indexed to oil prices). It is believed that extraction in Tanzania would be cost-
effective as long as world gas prices do not fall below US$ 10-12/mm BTU,29 but, even so, there
would have to be solid prospects of sustained high prices to persuade firms to undertake the
investment.
The first of the “alternative” scenarios, Scenario 1 suggests that a realistic improvement in the
VAT tax administration could bring about some reduction in the fiscal-space gap. The assumptions
of Scenario 1 are the same as those of the base scenario, except that in Scenario 1 the collection
efficiency of domestic and import VAT would gradually increase from 12.7 to 15.2 per cent and 28.2
to 33.8 respectively (a 20-per-cent improvement in both instances). The projection exercise
suggests that this would lead to a 0.4 percentage-points increase in the average tax revenue to
GDP over the projection period, reduce the net internal debt flow to GDP by 0.5 percentage-points,
and reduce the end-FY2020 government debt stock to 29.7 per cent of GDP from 31.72 per cent of
the base scenario. While, as mentioned, this suggests some reduction of the fiscal space gap, the
question is whether this would be sufficient to offset fiscal pressures through increased spending on
priority categories.
Box A Enhanced VAT administration
Results Scenario 0 Scenario 1 Variation
Average tax revenue/GDP, FY2016-2020 13,10 13,48 0,38
Average priority expenditure/GDP, FY2016-2020 6,27 6,27 0,00
28 OECD, CEOs roundtable dinner comments by Zitto Kabwe. October 2011. 29 World Bank, Why Should Tanzanians Pay Taxes? The Unavoidable Need to Finance Economic Development. July 2015
Roe, A. Tanzania: From mining to oil and gas. United Nations University. June 2016.

27
Results Scenario 0 Scenario 1 Variation
Average priority expenditure per child (USD at 2016 prices and
exchange rate), FY2016-2020 $ 144,87 $ 144,87 $ -
Net internal debt flow/GDP, FY2016-2020 3,21 2,67 -0,54
Total government debt/GDP, 2020 31,72 29,25 -2,47
Scenario 2 considers an increase of priority expenditure compared with the base scenario: the
elasticities of staff in the education and child-protection sectors with respect to the child population,
and the elasticities of all other priority sectors with respect to the overall population would rise to 1.3
for the entire projection period.( This means, for example, that each per cent increase in the child
population would lead to a 1.3-per cent increase, rather than a 1 per cent increase, in the education
staff.) This change would require an increase in the fiscal-space gap. With this change, total real
per-child priority expenditure would average US$150.53 over the projection period, an increase of
$5.66 compared to the base scenario. The net internal debt flow would have to rise to 3.55 per cent
of GDP, compared with 3.2 per cent of GDP in the base scenario. Total government debt would
conclude 2020 at 33.3 per cent of GDP, compared with 31.7 per cent of GDP in the base scenario.
BOX B Increased priority expenditure
Results Scenario 0 Scenario 2 Variation
Average tax revenue/GDP, FY2016-2020 13,1 13,1 0,00
Average priority expenditure/GDP, FY2016-2020 6,27 6,51 0,24
Average priority expenditure per child (USD at 2016 prices and
exchange rate), FY2016-2020 $ 144,87 $ 150,53 $5,66
Net internal debt flow/GDP, FY2016-2020 3,21 3,55 0,34
Total government debt/GDP, 2020 31,72 33,26 1,53
Scenario 3 combines the first two scenarios to set up an increase in priority expenditure funded by
improved tax collection efficiency. With the specific figures assumed, total real per-child priority
expenditure would (again) average US$150.53 over the projection period, thus 5.6 US$ more than
in the base scenario. The net internal debt flow would be 3.0 per cent of GDP, less than the 3.2 per
cent of GDP in the base scenario. Total government debt would conclude 2020 at 30.78 per cent of
GDP, compared with 31.73 per cent of GDP in the base scenario.
BOX C Enhanced VAT administration and increase priority expenditure
Results Scenario 0 Scenario 3 Variation
Average tax revenue/GDP, FY2016-2020 13,10 13,48 0,38
Average priority expenditure/GDP, FY2016-2020 6,27 6,51 0,24
Average priority expenditure per child (USD at 2016 prices and
exchange rate), FY2016-2020 $ 144,87 $ 150,53 $5,66
Net internal debt flow/GDP, FY2016-2020 3,21 3,00 -0,21
Total government debt/GDP, 2020 31,72 30,78 -0,94
As a conclusion, the scenarios examined in this section clearly reveal that a realistic improvement
in VAT administration could successfully be used to fund additional expenditure on children. Given
the objectives in the FYDP II aiming at improving staff levels in education, the existing shortages in
health personnel, as well as further needs to scale up personnel e.g. in relation to social welfare
officers and specialized police units that are sensitized on children’s issues, increases in priority
recurrent and in particular personnel costs expenditure are likely. At the same time, there are signs
that the Government of Tanzania is taking decisive steps towards improving VAT administration.
What is more, only recently an increase in VAT levied on tourism services has been announced.

28
This will probably result in additional revenue windfall. As evident from Scenario 3, under the
concrete assumptions outlined above, the revenue increase from revenue administration
improvements alone would be sufficient not only to fund the increase in priority expenditure, but
also to further reduce the fiscal space gap as compared to the base scenario. If additional revenue
collection can be realised, this is a strong signal that envisaged child-friendly policies are
affordable.
3.1.3 Other scenarios (4 and 5)
Scenario 4 considers the consequences of lower real-GDP growth for the projection. Lower real-
GDP growth would reduce real tax-revenue flows, because the revenue flows positively related to
GDP. In Scenario 4 (Box D), real-GDP growth is assumed to average 6.5 per cent of GDP over the
projection period, as compared to 6.9 average GDP growth in the base scenario. This scenario is
based on recent IMF assessment that points to the potential risks of weaker economic activity due
to the slow growth of private sector credit, further accumulation of arrears, as well as possible
adverse effects from an eventual slowdown in Europe and China30.
Under the assumption of slower economic growth, total real per-child priority expenditure would
(again) average US$144 over the projection period, which is the corresponding figure in the base
scenario. Economic slowdown to the extent assumed in the scenario would not have any further
impact on the average priority expenditure per child, and would increase the fiscal space gap only
marginally. However, in the same scenario, but under the assumption of average GDP growth of
only 4 per cent over the projection period, the fiscal space gap would be significantly larger.
Namely, lower GDP growth would result in 0.3 per cent of GDP increase in the net internal debt
flow, and in almost 3 per cent of GDP increase in total government debt. At the same time, priority
expenditure on children would fall with almost 2 US$ over the projection period. This underlines the
importance of strong GDP growth in view of maintaining and possibly increasing priority
expenditure on children.
BOX D Lower real GDP growth (6.5 percent over the period)
Results Scenario 0 Scenario
4
Variation
Average tax revenue/GDP, FY2016-2020 13,10 13,09 -0,01
Average priority expenditure/GDP, FY2016-2020 6,27 6,30 0,03
Average priority expenditure per child (USD at 2016 prices and
exchange rate), FY2016-2020 $ 144,87 $ 144,30 -$ 0.57
Net internal debt flow/GDP, FY2016-2020 3,21 3,29 0,08
Total government debt/GDP, 2020 31,72 32,51 0,78
Although in simple arithmetic terms reductions in non-priority expenditure would be a source of
enhanced fiscal space for priority expenditures for children, matters are not so straightforward. In
the recent years, inadequate financial resources have forced Tanzanian policy-makers to reduce
public expenditure and postpone investment plans. This inevitably affected Tanzania’s real growth.
Since revenue depends directly and indirectly on GDP, lower real growth reduced the revenue flow
from what it would otherwise have been, and so reduced the fiscal space.
Indeed, for 2015/2016, the government has prioritized strategic infrastructure projects such as: (I)
development of an integrated land management information system; (ii) strengthening and
30 IMF Country Report No. 17/13, January 2017.

29
improving working tools and services for the central railway; (iv) construction of phase III of the
National Optic Fibre; and (v) extension of Julius Nyerere International Airport.31 These projects can
be expected to maintain or enhance real-GDP growth for the medium term. This is one reason why
policy-makers would probably prefer not to finance priority expenditure by reducing non-priority
expenditure.
Scenario 5 considers the consequence of a specific kind of reduction in non-priority expenditure. In
the base scenario, the real growth rate of current non-priority expenditure on goods and services is
related to the growth rate of non-priority staff with an elasticity of one. In Scenario 5, the real growth
rate of current non-priority expenditure on goods and services would be related to the growth rate of
non-priority staff with an elasticity of 0.3. (That is, a percentage increase of 0.3 per cent, rather than
1 per cent as in the base scenario, would accompany each percentage increase in non-priority
staff). In other words, this scenario considers a lower spending (compared to the base scenario) on
goods and services that are not used in the priority sector.The projection calculation suggests that
this change would lead to a barely significant degree of improvement in the fiscal space, basically
because goods-and-services expenditure is relatively small compared with staff expenditure. Under
this scenario, the net internal debt flow would be 3.20 per cent of GDP, just less than the 3.21 per
cent of GDP in the base scenario. Total government debt would conclude 2020 at 31.70 per cent of
GDP compared with 31.72 per cent of GDP in the base scenario.
BOX E Relatively lower growth of non-priority non-staff expenditure
Results Scenario 0 Scenario 5 Variation
Average tax revenue/GDP, FY2016-2020 13,10 13,10 0,00
Average priority expenditure/GDP, FY2016-2020 6,27 6,27 0,00
Average priority expenditure per child (USD at 2016 prices and
exchange rate), FY2016-2020 $ 144,87 $ 144,87 $ -
Net internal debt flow/GDP, FY2016-2020 3,21 3,20 -0,01
Total government debt/GDP, 2020 31,72 31,70 -0,03
3.1.4 Effects of scaling up priority expenditure in line with current policies and programmes
As discussed in Section 2.2.1, some of the key challenges related to expenditure in priority sectors
relate to ensuring that allocated and executed amounts are in line with the costs estimated for
achieving the objectives in the respective policy documents (FYDP II, sector plans). Obtaining an
estimate of the fiscal gap that would occur in case all spending for the realisation of policy priorities
and goals was funded by own resources, may aide decision-making around resource allocations for
the priority expenditure categories. Scenario 6 to 10 consider the effects of current policies
(programmed or already implemented) in Tanzania, in particular their effect on the fiscal space.
Again, it should be noted that projections presented here are illustrative only, and are based on a
set of programming assumptions.
Scenario 6 considers an increase in education staff size with respect to child population in line with
the FYIDP II. In the scenario, the elasticity of education staff size with respect to child population
rises to 1.3, which means that for every 1 per cent increase in child population there is a 3 per cent
increase in teacher staff numbers. Under this scenario, total real per-child priority expenditure
would average US$145.43 over the projection period, which is a less than 1 US$ increase as
compared to the base scenario. The net internal debt flow would be 3.25 per cent of GDP, just less
than the 3.21 per cent of GDP in the base scenario. Total government debt would conclude 2020 at
31 Further details on the strategic ‘flagship’ projects are available at: United Republic of Tanzania, National Five Year
Development Plan 2016/17 – 2020/2021. June 2016.

30
31.9 per cent of GDP compared with 31.7 per cent of GDP in the base scenario. As a
consequence, under the assumptions in the projection model, the increases in education staff as
envisaged in FYDP II would be affordable and would not increase the fiscal space gap.
BOX F Increase of education staff size
Results Scenario 0 Scenario 6 Variation
Average tax revenue/GDP, FY2016-2020 13,10 13,10 0,00
Average priority expenditure/GDP, FY2016-2020 6,27 6,29 0,02
Average priority expenditure per child (USD at 2016 prices and
exchange rate), FY2016-2020 $ 144,87 $ 145,43 $0,57
Net internal debt flow/GDP, FY2016-2020 3,21 3,25 0,04
Total government debt/GDP, 2020 31,72 31,88 0,16
Scenario 7 considers the consequences of having expenditure on nutrition programs jump to a
significantly higher level in FY2016/17 and then continue to grow over the remaining projection
years. Expenditure in the projection years would follow the specific amounts under the proposed
National Multi-sectoral Nutrition Action Plan (NMNAP). Under Scenario 7, the assumed growth
rates of this expenditure component of priority expenditure would be such as to produce those
specific amounts (see Appendix 1). Similar to the previous scenario, the projections reveal that
increasing nutrition expenditure to meet the NMNAP objectives would not bear any significant
consequences in terms of budgetary pressures and fiscal space gap. Average priority expenditure
per child would increase by US$ 1.7 as compared to the base scenario, with a corresponding
increase of 0.12 percentage points of net internal debt flow to GDP, and 0.53 percentage points of
government debt stock to GDP.
BOX G Nutrition spending will be following projections of the National Multi-sectoral Nutrition Action Plan
Results Scenario 0 Scenario 7 Variation
Average tax revenue/GDP, FY2016-2020 13,10 13,10 0,00
Average priority expenditure/GDP, FY2016-2020 6,27 6,34 0,08
Average priority expenditure per child (USD at 2016 prices and
exchange rate), FY2016-2020 $ 144,87 $ 146,61 $1,7
Net internal debt flow/GDP, FY2016-2020 3,21 3,33 0,12
Total government debt/GDP, 2020 31,72 32,25 0,53
Scenario 8 considers the consequences of having expenditure on child-protection programs jump
to a significantly higher level in FY2017/1832 and then continue to grow at slower rates over the
remaining projection years. Expenditure in the projection years would follow the specific amounts
under the proposed National Plan of Action – Violence against Children and Women (NAC-VACW)
program. Under Scenario 8, the assumed growth rates of this expenditure component of priority
expenditure would be such as to produce those specific amounts (see Appendix 1). Again, while
the percentage increase in the expenditure flows would be large, the change from the base
scenario would be almost insignificant, because this category of expenditure is so small.
32 Since the programme only starts in2017, for FY2016/17 child-protection expenditure will follow the base scenario growth
rate.

31
BOX H Child protection spending will follow the projections of the National Plan of Action
Results Scenario 0 Scenario 8 Variation
Average tax revenue/GDP, FY2016-2020 13,10 13,10 0,00
Average priority expenditure/GDP, FY2016-2020 6,27 6,30 0,03
Average priority expenditure per child (USD at 2016 prices and
exchange rate), FY2016-2020 $ 144,87 $ 145,51 $0,64
Net internal debt flow/GDP, FY2016-2020 3,21 3,25 0,04
Total government debt/GDP, 2020 31,72 31,88 0,16
Scenario 9 considers the consequences of having expenditure on both nutrition programs and on
child-protection programs jump to the significantly higher levels of Scenarios 7 and 8. Overall
priority expenditure would average 6.37 per cent of GDP over the same projection period,
compared with 6.27 in the base scenario. Again, the percentage increase in the expenditure flows
would be substantial, especially for FY2016/17 (about 230 per cent). The change from the base
scenario would lead to an increase of 0.15 per cent of the net internal debt flow and an increase of
0.7 per cent of total government debt.
BOX I Increasing nutrition and child protection spending (Scenario 7+8)
Results Scenario 0 Scenario 9 Variation
Average tax revenue/GDP, FY2016-2020 13,10 13,10 0,00
Average priority expenditure/GDP, FY2016-2020 6,27 6,37 0,10
Average priority expenditure per child (USD at 2016 prices and
exchange rate), FY2016-2020 $ 144,87 $ 147,25 $2,39
Net internal debt flow/GDP, FY2016-2020 3,21 3,36 0,15
Total government debt/GDP, 2020 31,72 32,41 0,69
Finally, Scenario 10 is the same as Scenario 7, with substantial percentage increases in
government nutrition programs (230 per cent in FY2016/17 and an average of about 30 per cent for
the years thereafter), but it also incorporates a large increase in nutrition programs by local
governments. Thus, Scenario 10 assumes both an increase in local recurrent expenditure
(amounting to a real expenditure for child of 20,000 shillings per children aged 0-5), but also an
increase in nutrition remuneration rates, general nutrition expenditure and non-staff recurrent
expenditure. In this scenario, expenditure by local governments would be very much larger over the
five projection years FY2016/17-FY2020/21, on average around 8 times as much as in FY2014/15.
The net internal debt flow would average 3.6 per cent of GDP over the projection period, well above
the 3.2 per cent of GDP in the base scenario. Total government debt would conclude 2020 at
33.7 per cent of GDP which is two percentage points higher than in the base scenario. This
suggests that, should local government further engage in service delivery in the nutrition area, with
the assumptions in the model, this will lead to a sizable increase in the fiscal space gap.
BOX J Local government authorities nutrition spending amount to 20.000 TZS per 0-5 years
Results Scenario 0 Scenario
10
Variation
Average tax revenue/GDP, FY2016-2020 13,10 13,10 0,00
Average priority expenditure/GDP, FY2016-2020 6,27 6,53 0,26
Average priority expenditure per child (USD at 2016 prices
and exchange rate), FY2016-2020 $ 144,87 $ 150,91 $6,04
Net internal debt flow/GDP, FY2016-2020 3,21 3,66 0,45
Total government debt/GDP, 2020 31,72 33,71 1,99

32
3.1.5 Other options to increase fiscal space
As emphasised previously, one of the most promising pathways to increasing the available fiscal
space would result from achieving allocative and cost efficiencies within the priority expenditure
categories. Obtaining estimates on the potential for funding gains through this way is beyond the
scope of this study and therefore no quantitative scenarios or specific discussion on such options is
presented. Beyond efficiency gains however, a few other channels that may offer scope for
increasing the fiscal space are briefly explored in the following paragraphs.
Increasing external grants for budget support and projects
Historically, grants for general budget support have been a large source of funding for Tanzania, in
both absolute and relative terms. However, a decline in this type of aid has taken place since
2010/11. Similar trends have characterized other African economies. The general reasons include
growing political opposition to grant aid in OECD economies and the difficulties associated with
satisfying conditionality. There has also been a growing preference on the part of donors for
providing aid outside the fiscal accounts. For Tanzania, despite the declining trend of budget
support, foreign observers believe that general budget support has had a positive impact in
promoting macro-economic stability, fostering economic growth, reducing non-income poverty, and
has increased the government’s resources for the priority areas of the Second National Strategy for
Growth and Reduction of Poverty II (MKUKUTA II).33, 34 The EU is still considering additional budget
support to Tanzania, with EUR200 million for sector budget support and EUR5 million for
complementary support.
Reducing external-debt service through agreements with creditors
Tanzania was one of the countries that reduced its external debt through the multilateral debt-
reduction initiative (MDRI) in 2006/07. The MDRI is now past, and is unlikely to be repeated in
coming years. Since that time, Tanzania has accumulated new external debt. As the accumulated
debt is mostly concessional, the growing debt-GDP ratio is unlikely to lead to debt-service
payments difficulties over coming years.
Debt service would only become a significant issue in the unlikely event Tanzania decided to
increase its external borrowing significantly, as discussed in the paragraphs following.
Increasing external-debt disbursements
In general, macroeconomic policy specialists concur that it is not advisable to use commercial
external debt to fund education, health, or social-protection expenditure. The reasoning is
straightforward: eventual returns to education and health expenditure are realized over decades,
but debt service on commercial external debt is generally due within a decade. Concessional debt,
with multi-decade terms and near-zero interest rate, is more realistic for such purposes. Because
Tanzania remains relatively poor, and is some way from graduating to middle income status, it is
likely to retain access to concessional borrowing from multilateral lenders for some years to come.
As recommended by the IMF and the World Bank, it is important that Tanzania continues to access
loans (and grants, if available), since they would be appropriate to fund expenditure in the priority
sectors.
Commercial borrowing has gained increasing importance as a source of finance for Tanzania’s
government, increasing from US$ 1 billion to US$ 5.2 billion over the period 2008-2016. In relative
terms, government’s commercial borrowing amounted to about 30 percent of the public external
33 Dutch Ministry of Foreign Affairs, Impact of ending aid: Tanzania country study. July 2016. 34 IMF, Tanzania Poverty Reduction Strategy Paper. January 2011.

33
debt stock in 2014/15, while it was about 2 percent in the fiscal year 2009/10. According to the
Ministry of Finance’s estimates, commercial borrowing will rise to 51 per cent of the total by 2035.35
A 2016 IMF Staff report notes that central government debt has increased in recent years, although
for now Tanzania remains well within benchmark indicators of unsustainability.36
One important class of borrowing that has taken on increasing significance has been bilateral
borrowing from China. This borrowing is non-concessional, and, as in many African economies, its
growth has generated some concern. As in other African economies, it has generally been used for
infrastructure, which should help sustain or enhance growth prospects.
Unlike other African economies such as Zambia and Kenya, Tanzania has been unable to issue
Eurobonds. This is largely because it is a relatively poorer economy and its ratings are inevitably
insufficient. Tanzania remains IDA eligible, which means that it has access to concessional funds
that could be used. The IMF has made some recommendations intended to make it possible
eventually for Tanzania to achieve ratings that would enable it to access international financial
markets. These include making its budget more credible and improving the fiscal authorities’ cash-
forecasting capacity. However, prudence has been advised regarding the future issuance of bonds
for the payment of arrears, since they will increase debt servicing costs.37
As of June 2016, Tanzania was still awaiting the issuance of a credit rating, which would, in
principle, enable the country to carry out a Eurobond placement.38 The Government’s hope is to
borrow as much as US$ 2 billion through a Eurobond issue. Eurobond proceeds would be applied
to infrastructure, and to this extent their positive contribution to the fiscal space would be offset.
Moreover, it is important to remember that the infrastructure expenditure would only be partially
financed by the Eurobond proceeds: there would also be a substantial counterpart requirement,
which in principle could reduce the fiscal space. Nevertheless, to the extent the infrastructure
supports growth in the medium term, it would enhance the fiscal space in coming years.
Increasing net internal borrowing flows
In the analytical structure of the projection exercise, net internal borrowing is calculated residually.
In effect, it is the consequence of all the programming assumptions taken together. Evaluation of its
feasibility therefore amounts to evaluation of the feasibility of all the programming assumptions
taken together. Since internal borrowing is for shorter terms and have higher interest rates than
external debt, it would be even more inappropriate to use domestic loans specifically to fund priority
expenditure. Nevertheless, any fiscal-space financing gap would be covered with internal borrowing
flows. Tanzania’s net internal financing flows (including interest) averaged about 1.9 per cent of
GDP over the FY2010/11-2015/16 period.
35 Kanyabwoya, D. Tanzania: Budget 2016 - the Sh8 Trillion Debt Trap. The Citizen, June 2016. 36 IMF, Staff report for the 2016 article IV consultation. July 2016. 37 World Bank, Why Should Tanzanians Pay Taxes? The Unavoidable Need to Finance Economic Development. July 2015. 38 Further details on African Eurobonds issued by other countries are available at: Deutsche Bank Research, African
Eurobonds: Will the boom continue? November 2015.


35
4 Conclusions
This chapter’s fundamental recommendation is that, in support of its advocacy on behalf of
expenditure beneficial for children, UNICEF should continually formulate quantitative projections,
and make use of these in its dialogue with the Tanzanian government and other stakeholders.
These projections should not only cover future expenditure needs in education, health, social
protection, nutrition, child protection and other sectors relevant for children, but should also
encompass the main components of the “fiscal space” that provides the funding for such
expenditure. Quantitative projections of this kind should assist UNICEF to engage in more effective
dialogue.
The analysis this report describes is intended to be essentially illustrative, to show how the
methodology it recommends can be used to address the relevant policy issues. But certain tentative
conclusions regarding the substantive issues do emerge, including the following:
1. While the economic and political context offers little likelihood that tax revenue could be
increased by raising rates or introducing new taxes, there is considerable potential for improving
tax revenue through improved administration. Improved tax administration is likely to be
politically acceptable, especially if it is perceived as favouring fairness and equity. Most recently,
the Tanzania Revenue Authority has achieved remarkable success in improving revenue
collection, which represents an important opportunity to scale up spending in priority
expenditure categories. In contrast, recent debates about the increase in the VAT rate on
tourism underline that any decisions about raising the level of taxes will be highly politicized and
contested;
2. The required resources to fund programmes and achieve respective objectives in the nutrition
and child protection sectors are likely to have a marginal impact on the fiscal space gap under
the model assumptions. Increases in education and health staff in line with strategic priorities of
the FYDP II also do not appear to be too burdensome with view of the fiscal position. At the
same time, the effects on associated outcomes in the priority sectors through scaling up are
likely to be substantial;
3. As Tanzania’s devolution process continues, it may offer some possibilities to increase the fiscal
space in coming years through local-level taxes. Nevertheless, the magnitudes of the local fiscal
flows will remain small relative to the size of the central government’s. While the local
authorities are likely to take on additional expenditure responsibilities for health, they are less
likely to do so for education. The nutrition and child-protection initiatives discussed above will be
mainly central-government activities, but local authorities are likely to undertake some
coordinated initiatives;
4. External grants carried out through the fiscal accounts, which have been diminishing for some
years, are likely to be a diminishing and even disappearing source of fiscal space for priority
expenditure. This will imply an increasing pressure on national resources to compensate such
losses. At the same time, external grants are likely to maintain and even increase their
importance outside the fiscal accounts;
5. In general, non-concessional external debt should never be used to fund priority expenditure
such as education and health. The basic reason is that the yields from education and health
expenditure come only in the long term, beyond the terms typical of non-concessional external

36
debt. For similar reasons, internal term debt should not be used to fund education and health
expenditure;
6. It may seem that there is some potential for enhancing the fiscal space by reducing, or
improving efficiency, in non-priority expenditure. It is not likely, however, that this can be as
reliable and stable approach to shoring up the fiscal space as the effort to improve tax
administration. In particular, it is important to remember that non-priority expenditure includes
infrastructure development, and this is crucial for sustaining real growth, which is crucial, in turn,
for sustaining revenue growth, and hence for sustaining the fiscal space in the medium term;
7. Efficiency gains in the priority expenditure areas, most notably through achieving better cost
efficiency, and improved allocation of resources, have not been explored in this model, as they
go beyond the macro-fiscal level. Nevertheless, such gains are a fundamental pathway to
freeing up “locked up” resources and fund additional activities in the priority expenditure
categories. In this respect, it is also important to underline the importance of addressing
shortcomings in budget execution rates and improving absorption capacity. While higher budget
execution rates would have a negative effect on the fiscal space (as more funds would be
actually spent), this effect is still likely to be small. At the same time, improved actual spending
is likely to lead to substantial improvements in associated development goals in the priority
expenditure categories.

37
Appendix 1: Fiscal space projections
This Appendix describes the details of the base-scenario projection exercise discussed in
Section 1.6 above, and then describes the results of a sensitivity analysis.
The base-scenario programming assumptions are intended to be relatively simplified, to make the
calculation relatively easy to carry out and to understand. The following general explanatory points
are noted:
1. The assumptions are “programming” assumptions. They are not intended, and should not be
understood, as forecasts, but rather as plausible possibilities for planning purposes. In
particular, the growth rates of government expenditure are intended as plausible policy settings;
2. In general, the aim for the base scenario is to set programming assumptions that are “neutral.”
For example, Tanzania`s merchandise export volumes are assumed to grow at the same rates
as the world trade volume, so Tanzanian exports maintain the same share of the world trade
volume. The volume of Tanzania’s merchandise imports is assumed to grow at the same rates
as real GDP, so merchandise imports would tend to maintain the percentage of GDP. For
recurrent expenditure, the assumption that staff sizes will grow at the same rate as the
population would be neutral in a similar sense. So is the assumption that government wage
rates would grow at the same rate as per-capita nominal GDP;
3. The elasticities that help determine the government’s revenue performance are taken to be
somewhat higher than one in the initial projection year, and then to decline gradually toward one
over the projection period. In general, it is inadvisable to apply econometric point estimates
based on historical data for these values, for at least two reasons. The first is that future
elasticities are likely to differ from historical elasticities. The second is that, say, if the elasticity
of a given revenue line with respect to nominal GDP is assumed always to exceed (be less
than) one, the projected revenue flow would rise (diminish) indefinitely as a percentage of GDP;
4. It is straightforward to set programming assumptions that adjust gradually over the projection
period, using (“geometric”) adjustment formulas. This is useful for several different assumption
lines. For example, a large proportion of the assumptions are set as growth rates. These can be
assumed to rise or diminish gradually from their initial projection values toward their final
projection values. Another way to use a gradual adjustment would be for the elasticity of a given
revenue line with respect to nominal GDP to take on an initial value somewhat different from
one, but then gradually adjust toward a long-term value of one.
For the base scenario, the programming assumptions are as follows:
(A) World economic conditions (1-3):
(1) The growth rate of the world trade volume rises gradually from its estimated FY14-15 value of
4,3 per cent to a FY19-20 value of 6 per cent.
(2) The growth rate of the U.S.-dollar world price level rises gradually from its estimated FY14-15
value of 1 per cent to a FY19-20 value of 2 per cent.
(3) The London Interbank Offer Rate rises gradually from its FY14-15 value of 0,34 per cent to a
FY19-20 value of 1,5 per cent.
(B) Basic Tanzanian macroeconomic variables (4-10):
(4) The growth rate of real GDP remains at a value of 6,9 per cent over the projection years.

38
(5) The GDP deflator grows at the same rate as the year-average consumer price index.
(6) The December-December growth rate of the consumer price index (CPI) declines gradually
from 5,5 per cent in FY15-16 to 3 per cent in FY19-20.
(7) The December-December growth rate of the U.S. dollar exchange rate grows at a rate
(approximately) equal to the differential of the Tanzanian and the world U.S.-dollar inflation rates.
(8) The overall population growth rate declines gradually from 3,19 per cent in FY15-16 to
3,05 per cent in FY19-20.
(9) The growth rate of the population under fifteen years of age declines gradually from 3,26 per
cent in FY15-16 to 2,75 per cent in FY19-20.
(10) The headcount poverty incidence declines gradually from 40,4 per cent in FY15-16 to
35,4 per cent in FY19-20.
Exports and imports of goods and non-factor services (11-17):
(11) The export volume grows at the same rate as the world trade volume.
(12) Export prices grow at the same rate as the world U.S.-dollar price level.
(13) The import volume grows at the same rate as real GDP.
(14) Import prices grow at the same rate as the world U.S.-dollar price level.
(15) Non-factor service exports grow at a rate equal to the combined growth rates of world trade
volume and the world US$ price level.
(16) Non-factor service imports excluding insurance and freight charges for merchandise imports
grow at a rate equal to the combined growth rates of world trade volume and the world US$ price
level.
(17) Insurance and freight charges for decline gradually from 11,8 per cent of the value of
merchandise imports in FY15-16 to 11 per cent in FY19-20.
National-expenditure accounts (18-20):
(18) Consumption expenditure by government entities outside the central government remains at
8,3 per cent of GDP over the projection period.
(19) Gross fixed capital formation remains at 33,6 per cent of GDP.
(20) The net increase in inventory stocks remains at 0 per cent over the projection period.
(C) Tax and non-tax revenue (21-33):
(21) The elasticity of personal income tax with respect to nominal GDP declines from 1,3 in
FY15-16 to 1 in FY19-20.
(22) The elasticity of company-tax revenue with respect to nominal GDP declines from 1,3 in
FY15-16 to 1 in FY19-20.
(23) The elasticity of other income-tax revenue with respect to nominal GDP declines from 1,3 in
FY15-16 to 1 in FY19-20.
(24) The elasticity of customs revenue with respect to merchandise-imports value declines from
1,3 in FY15-16 to 1 in FY19-20.
(25) The elasticity of excise revenue with respect to nominal GDP declines from 1,3 in FY15-16
to 1 in FY19-20.
(26) The elasticity of export-duty revenue with respect to export value declines from 1,3 in FY15-
16 to 1 in FY19-20.
(27) The elasticity of local-government tax revenue with respect to nominal GDP declines from
1,1 in FY15-16 to 1 in FY19-20.
(28) The internal value-added tax rate remains unchanged at 18 per cent.

39
(29) The internal value-added tax collection efficiency remains unchanged from its FY14-15
value.
(30) The import-based value-added tax rate remains at 18 per cent.
(31) The import-based value-added tax collection efficiency remains unchanged from its FY14-
15 value.
(31) The import-based value-added tax collection efficiency remains unchanged from its FY14-
15 value.
(32) The import-based value-added tax collection efficiency remains unchanged from its FY14-
15 value.
(32) The elasticity of central-government non-tax revenue with respect to nominal GDP declines
from 1,1 in FY15-16 to 1 in FY19-20.
(33) The elasticity of local-government non-tax revenue with respect to nominal GDP declines
from 1,1 in FY15-16 to 1 in FY19-20.
(D) External grants to the government (34-37):
(34) Central-government external grants for current expenditure would remain at 0,6 per cent of
GDP.
(35) local-government external grants for current expenditure would remain at 0 per cent of GDP.
(36) Central-government external grants for capital expenditure (projects) would remain at 0,5
per cent of GDP.
(37) local-government external grants for capital expenditure (projects) would remain at 0 per
cent of GDP.
(E) Government expenditure in the priority and non-priority categories (50-76):
(E.1) For non-interest recurrent expenditure,
(E.1.a) In the education sector,
(38) The staff size grows at the same rate as the number of children.
(39) Staff salaries grow at a rate equal to the growth rate of per-capita nominal GDP.
(40) Expenditure on current goods and services grows at a rate equal to the combined growth
rates of the year-average CPI and the sectoral staff size.
(41) Expenditure on non-staff recurrent expenditure excluding current goods and services grows
at a rate equal to the combined growth rates of the year-average CPI and the number of
children.
(42) Local recurrent expenditure grows at a rate equal to the combined growth rates of the year-
average CPI and the child population.
(E.1.b) In the health sector,
(43) The staff size grows at the same rate as the population.
(44) Staff salaries grow at a rate equal to the growth rate of per-capita nominal GDP.
(45) Expenditure on current goods and services grows at a rate equal to the combined growth
rates of the year-average CPI and the sectoral staff size.
(46) Expenditure on non-staff recurrent expenditure excluding current goods and services grows
at a rate equal to the combined growth rates of the year-average CPI and the population growth
rate.
(47) Local recurrent expenditure grows at a rate equal to the combined growth rates of the year-
average CPI and the population.
40
(E.1.c) In the social-protection sector,
(48) Central-government recurrent expenditure grows at a rate equal to the combined growth
rates of the year-average CPI and the population.
(49) Central-government recurrent expenditure grows at a rate equal to the combined growth
rates of the year-average CPI and the population.
(E.1.d) In the nutrition sector,
(50) The staff size grows at the same rate as the number of children.
(51) Staff salaries grow at a rate equal to the growth rate of per-capita nominal GDP.
(52) Expenditure on current goods and services grows at a rate equal to the combined growth
rates of the year-average CPI and the sectoral staff size.
(53) Expenditure on non-staff recurrent expenditure excluding current goods and services grows
at a rate equal to the combined growth rates of the year-average CPI and the population growth
rate.
(54) Local recurrent expenditure grows at a rate equal to the combined growth rates of the year-
average CPI and the child population.
(E.1.e) In the child-protection sector,
(55) The staff size grows at the same rate as the number of children.
(56) Staff salaries grow at a rate equal to the growth rate of per-capita nominal GDP.
(57) Expenditure on current goods and services grows at a rate equal to the combined growth
rates of the year-average CPI and the sectoral staff size.
(58) Expenditure on non-staff recurrent expenditure excluding current goods and services grows
at a rate equal to the combined growth rates of the year-average CPI and the population growth
rate.
(59) Local recurrent expenditure grows at a rate equal to the combined growth rates of the year-
average CPI and the child population.
(E.1.f) In the non-priority expenditure sectors,
(60) The staff size grows at the same rate as the population.
(61) Staff salaries grow at a rate equal to the growth rate of per-capita nominal GDP.
(62) Expenditure on current goods and services grows at a rate equal to the combined growth
rates of the year-average CPI and the sectoral staff size.
(63) Expenditure on non-staff recurrent expenditure excluding current goods and services grows
at a rate equal to the combined growth rates of the year-average CPI and the population growth
rate.
(64) Local recurrent expenditure grows at a rate equal to the combined growth rates of the year-
average CPI and the population.
(E.2) For non-recurrent expenditure, over the projection years,
(65) Education non-recurrent central-government expenditure increases gradually from the
FY14-15 value of 0,5 per cent of GDP to a FY19-20 value of 1 per cent of GDP.
(66) Education non-recurrent local-government expenditure increases gradually from the FY14-
15 value of 0 per cent of GDP to a FY19-20 value of 0,3 per cent of GDP.
(67) Health non-recurrent central-government expenditure increases gradually from the FY14-15
value of 0,3 per cent of GDP to a FY19-20 value of 1 per cent of GDP.
(68) Health non-recurrent local-government expenditure increases gradually from the FY14-15
value of 0 per cent of GDP to a FY19-20 value of 0,3 per cent of GDP.
(69) Social-protection non-recurrent central-government expenditure remains at 0 per cent of
GDP.
(70) Social-protection non-recurrent local-government expenditure increases gradually from the
FY14-15 value of 0 per cent of GDP to a FY19-20 value of 0,3 per cent of GDP.
41
(71) Social-protection non-recurrent central-government expenditure remains at 0 per cent of
GDP.
(72) Nutrition non-recurrent local-government expenditure increases gradually from the FY14-15
value of 0 per cent of GDP to a FY19-20 value of 0,2 per cent of GDP.
(73) Social-protection non-recurrent central-government expenditure remains at 0 per cent of
GDP.
(74) Child-protection non-recurrent local-government expenditure increases gradually from the
FY14-15 value of 0 per cent of GDP to a FY19-20 value of 0,2 per cent of GDP.
(75) Non-priority non-recurrent central-government expenditure increases gradually from the
FY14-15 value of 3,3 per cent of GDP to a FY19-20 value of 3,6 per cent of GDP.
(76) Non-priority non-recurrent local-government expenditure increases gradually from the FY14-
15 value of 0,2 per cent of GDP to a FY19-20 value of 0,4 per cent of GDP.
(F) For external and internal debt (77-80):
(77) Average interest rates on the previous year’s year-end external debt stock increase
(decrease) with LIBOR.
(78) Average interest rates on the previous year’s year-end internal debt stock decline gradually
from 53,8 per cent in FY14-15 to 26,9 per cent in FY19-20.
(79) External-debt repayments in each projection year amount to 5 per cent of the preceding
year’s year-end external-debt stock; and
(80) External-debt disbursements in each projection year amount to 35 per cent of total non-
recurrent expenditure.
Table A.1.1 immediately following lists these assumptions, and Table A.1.2 shows the base-
scenario projection results. (Table A.1.1 shows only the assumption values. Consult the listing
above to understand the reasoning underlying any specific assumption.).
Table A.1.1 Tanzania: Programming assumptions for the fiscal-space projection exercise (base
scenario)
Initial projection year: 2016 FY14-15
Average
FY15-16-
FY19-20 FY19-20
(A) EXTERNAL'STATE-OF-THE-WORLD' VARIABLES:
Growth rates:
World trade volume* 4,3% 5,3% 6,0%
World U.S.-dollar price level** 1,0% 1,6% 2,0%
Interest rates: London Interbank Offer Rate (LIBOR) 0,3% 1,0% 1,5%
*Source: IMF World Economic Report **U.S. GDP deflator.
(B) BASIC MACROECONOMIC VARIABLES:
Growth rates: Gross domestic product (national currency - millions) 13,2% 10,8% 8,3%
Gross domestic product at 2016 prices and exchange rate (US$
million) 7,0% 6,9% 6,8%
GDP deflator 5,8% 3,6% 1,4%
Consumer prices (year-average) 5,4% 3,6% 1,4%

42
Initial projection year: 2016 FY14-15
Average
FY15-16-
FY19-20 FY19-20
Consumer prices (December) 6,2% 4,3% 3,0%
Exchange rate (year-average) 8,6% 6,8% 1,8%
Exchange rate (December) 24,8% 2,6% 1,0%
Population (millions) 3,2% 3,1% 3,1%
Population under fifteen (millions) 3,3% 2,8% 2,8%
Population in poverty -0,7% -2,2%
Headcount poverty incidence 41,7% 37,9% 35,4%
Growth rates (US$ million):
Merchandise exports: 7,0% 8,1%
Unit value
Volume
Merchandise imports: 8,7% 8,9%
Unit value
Volume
Growth rates:
Non-factor services receipts 7,0% 8,1%
Non-factor services payments, excluding merchandise-imports
insurance and freight 8,7% 8,9%
Ratios:
Ratio, insurance and freight costs/merchandise imports value 12,0% 11,4% 11,0%
Incremental capital-output ratio 4,7 4,9 4,9
Per cent of GDP:
Consumption expenditure by governments excl. central
government 8,3% 8,3% 8,3%
Gross fixed capital formation 33,6% 33,6% 33,6%
Net increase in inventory stocks 0,0% 0,0% 0,0%
(C) GENERAL-GOVERNMENT FINANCIAL ACCOUNTS: Tax and non-tax revenue (excl. external grants) (+):
TAX REVENUE:
Central government:
Elasticities of...
personal income tax with respect to nominal GDP
company-tax revenue with respect to nominal GDP 1,1 1,0
other income-tax revenue with respect to nominal
GDP 1,1 1,0
customs revenue with respect to merchandise-
imports value 1,1 1,0
excise revenue with respect to nominal GDP 1,1 1,0
export-duty revenue with respect to export value 1,1 1,0
internal value-added tax revenue with respect to
nominal GDP 1,1 1,0
value-added tax revenue from imports with respect
to the value of merchandise imports 1,0 1,0

43
Initial projection year: 2016 FY14-15
Average
FY15-16-
FY19-20 FY19-20
County government: 2,0 1,0
Elasticities of...
county-government tax revenue with respect to
nominal GDP
Value-added tax: 1,0 1,0
Internal value-added tax:
Internal value-added tax rate
Internal value-added tax collection efficiency 18,0% 18,0% 18,0%
Value-added tax revenue from imports: 10,3% 10,3% 10,3%
External value-added tax rate
External value-added tax collection efficiency 18,0% 18,0% 18,0%
NON-TAX REVENUE: 28,2% 28,2% 28,2%
Elasticities of...
central-government non-tax revenue with respect to
nominal GDP
county-government non-tax revenue with respect to
nominal GDP 1,0 1,0
1,0 1,0
(D)External grants (+): Per cent of GDP:
Central-government external grants for current expenditure
County-government external grants for current expenditure 0,6% 0,6% 0,6%
Central-government external grants for capital expenditure
(projects) 0,0% 0,0% 0,0%
County-government external grants for capital expenditure
(projects) 0,5% 0,5% 0,5%
0,0% 0,0% 0,0%
(E) CENTRAL-GOVERNMENT EXPENDITURE:
Growth rates:
Recurrent education expenditure:
Central-government recurrent education expenditure: 6,9% 4,6%
Education staff
Education remuneration rates 2,8% 2,8%
Non-staff recurrent education expenditure: 7,5% 5,1%
Recurrent education expenditure on goods and services 6,5% 4,2%
Other non-staff recurrent education expenditure 6,5% 4,2%
Local government authorities recurrent education
expenditure: 6,5% 4,2%
Recurrent health expenditure: 6,5% 4,2%
Central-government recurrent health expenditure: 6,8% 4,5%
Health staff 10,5% 8,0%
Health remuneration rates 3,1% 3,1%
Non-staff recurrent health expenditure: 7,5% 5,1%
Recurrent health expenditure on goods and services 6,8% 4,5%

44
Initial projection year: 2016 FY14-15
Average
FY15-16-
FY19-20 FY19-20
Other non-staff recurrent health expenditure 6,8% 4,5%
Local government authorities recurrent health
expenditure: 6,8% 4,5%
Recurrent social assistance expenditure: 6,8% 4,5%
Central government recurrent social assistance expenditure: 6,8% 4,5%
Local government authorities recurrent social assistance
expenditure: 2,1% 2,2%
Recurrent nutrition expenditure: 2,1% 2,2%
Central government recurrent nutrition expenditure: 6,9% 4,6%
Nutrition staff 6,9% 4,6%
Nutrition remuneration rates 2,8% 2,8%
Non-staff recurrent nutrition expenditure: 7,5% 5,1%
Recurrent nutrition expenditure on goods and services 6,5% 4,2%
Other non-staff recurrent nutrition expenditure 6,5% 4,2%
Local government authorities recurrent nutrition
expenditure: 6,5% 4,2%
Recurrent child protection expenditure: 6,5% 4,2%
Central government recurrent child protection
expenditure: 7,4% 5,1%
Child protection staff 7,7% 5,4%
Child protection remuneration rates 2,8% 2,8%
Non-staff recurrent child protection expenditure: 7,5% 5,1%
Recurrent child protection expenditure on goods and
services 6,5% 4,2%
Other non-staff recurrent child protection expenditure 6,5% 4,2%
Local government authorities recurrent child protection
expenditure: 6,5% 4,2%
Non-priority recurrent expenditure: 6,5% 4,2%
Central-government non-priority recurrent expenditure: 6,5% 4,2%
Non-priority staff 29,2% 21,2%
Remuneration rates in non-priority sectors 3,1% 3,1%
Non-staff recurrent non-priority expenditure: 7,5% 5,1%
Recurrent non-priority expenditure on goods and
services 5,4% 4,0%
Other non-staff recurrent non-priority expenditure 3,2% 3,1%
County-government non-priority recurrent expenditure 6,8% 4,5%
Per cent of GDP: 6,8% 4,5%
Non-recurrent education expenditure:
Central government non-recurrent education expenditure: 0,5% 1,0% 1,3%
Local government authorities non-recurrent education
expenditure: 0,8% 1,0%
Non-recurrent health expenditure: 0,2% 0,3%
Central government non-recurrent health expenditure: 0,3% 0,9% 1,3%
Local government authorities non-recurrent health
expenditure: 0,7% 1,0%

45
Initial projection year: 2016 FY14-15
Average
FY15-16-
FY19-20 FY19-20
Non-recurrent social assistance expenditure 0,2% 0,3%
Central government non-recurrent social assistance
expenditure: 0,0% 0,2% 0,3%
Local government authorities non-recurrent social assistance
expenditure: 0,0% 0,0%
Non-recurrent nutrition expenditure: 0,2% 0,3%
Central government non-recurrent nutrition expenditure: 0,0% 0,1% 0,2%
Local government authorities non-recurrent nutrition
expenditure: 0,0% 0,0%
Non-recurrent child protection expenditure: 0,1% 0,2%
Central government non-recurrent child protection
expenditure: 0,0% 0,1% 0,2%
Local government authorities non-recurrent child protection
expenditure: 0,0% 0,0%
Non-priority non-recurrent expenditure: 0,1% 0,2%
Central-government non-priority non-recurrent expenditure 3,5% 3,8% 4,0%
County-government non-priority non-recurrent expenditure 3,5% 3,6%
0,3% 0,4%
(F) EXTERNAL AND INTERNAL DEBT:
Average interest rates (applied to preceding year-end debt
stock):
Average interest rates on external debt
Average interest rates on internal debt 2,3% 3,0% 3,5%
Per cent of preceding year-end debt stock: 53,8% 37,2% 26,9%
External-debt repayments (-)
Per cent of GDP: -5,0% -5,0%
External-debt disbursements (+): External-debt disbursements/total non-recurrent expenditure 2,6% 1,3% 1,4%
External-debt repayments (-) 74,7% 35,0% 35,0%
Net internal-debt flow (+): -0,3% -0,8% -0,7%
Source: Estimates and calculations from the projection workbook TZFS.xlsm.
In Table A.1.1, assumption lines whose sequence numbers are shaded in green are those which
vary in the specific scenarios of the sensitivity analysis discussed below.
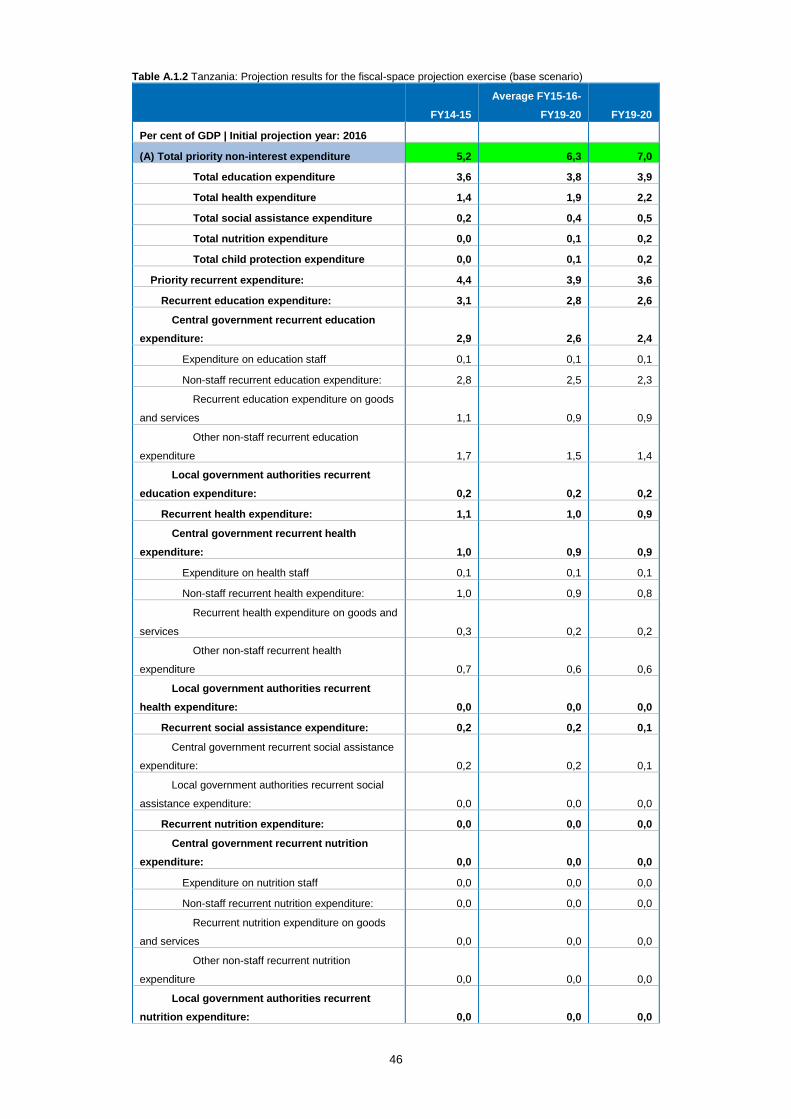
46
Table A.1.2 Tanzania: Projection results for the fiscal-space projection exercise (base scenario)
FY14-15
Average FY15-16-
FY19-20 FY19-20
Per cent of GDP | Initial projection year: 2016
(A) Total priority non-interest expenditure 5,2 6,3 7,0
Total education expenditure 3,6 3,8 3,9
Total health expenditure 1,4 1,9 2,2
Total social assistance expenditure 0,2 0,4 0,5
Total nutrition expenditure 0,0 0,1 0,2
Total child protection expenditure 0,0 0,1 0,2
Priority recurrent expenditure: 4,4 3,9 3,6
Recurrent education expenditure: 3,1 2,8 2,6
Central government recurrent education
expenditure: 2,9 2,6 2,4
Expenditure on education staff 0,1 0,1 0,1
Non-staff recurrent education expenditure: 2,8 2,5 2,3
Recurrent education expenditure on goods
and services 1,1 0,9 0,9
Other non-staff recurrent education
expenditure 1,7 1,5 1,4
Local government authorities recurrent
education expenditure: 0,2 0,2 0,2
Recurrent health expenditure: 1,1 1,0 0,9
Central government recurrent health
expenditure: 1,0 0,9 0,9
Expenditure on health staff 0,1 0,1 0,1
Non-staff recurrent health expenditure: 1,0 0,9 0,8
Recurrent health expenditure on goods and
services 0,3 0,2 0,2
Other non-staff recurrent health
expenditure 0,7 0,6 0,6
Local government authorities recurrent
health expenditure: 0,0 0,0 0,0
Recurrent social assistance expenditure: 0,2 0,2 0,1
Central government recurrent social assistance
expenditure: 0,2 0,2 0,1
Local government authorities recurrent social
assistance expenditure: 0,0 0,0 0,0
Recurrent nutrition expenditure: 0,0 0,0 0,0
Central government recurrent nutrition
expenditure: 0,0 0,0 0,0
Expenditure on nutrition staff 0,0 0,0 0,0
Non-staff recurrent nutrition expenditure: 0,0 0,0 0,0
Recurrent nutrition expenditure on goods
and services 0,0 0,0 0,0
Other non-staff recurrent nutrition
expenditure 0,0 0,0 0,0
Local government authorities recurrent
nutrition expenditure: 0,0 0,0 0,0
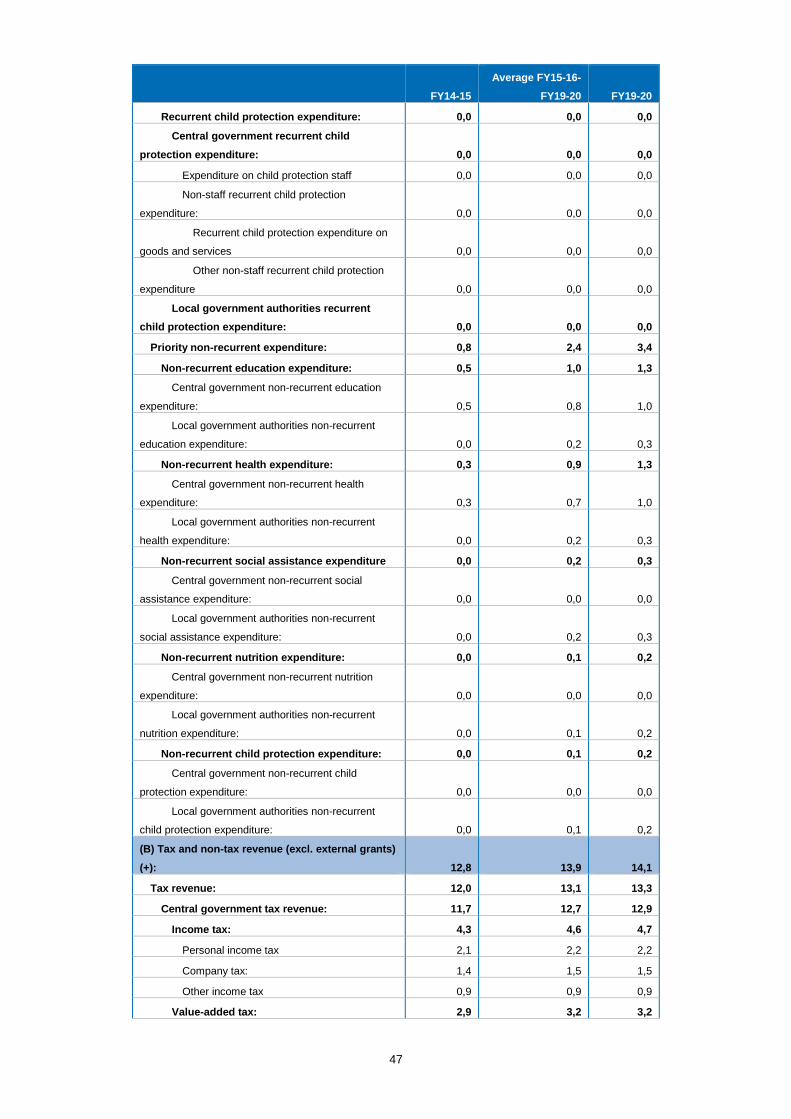
47
FY14-15
Average FY15-16-
FY19-20 FY19-20
Recurrent child protection expenditure: 0,0 0,0 0,0
Central government recurrent child
protection expenditure: 0,0 0,0 0,0
Expenditure on child protection staff 0,0 0,0 0,0
Non-staff recurrent child protection
expenditure: 0,0 0,0 0,0
Recurrent child protection expenditure on
goods and services 0,0 0,0 0,0
Other non-staff recurrent child protection
expenditure 0,0 0,0 0,0
Local government authorities recurrent
child protection expenditure: 0,0 0,0 0,0
Priority non-recurrent expenditure: 0,8 2,4 3,4
Non-recurrent education expenditure: 0,5 1,0 1,3
Central government non-recurrent education
expenditure: 0,5 0,8 1,0
Local government authorities non-recurrent
education expenditure: 0,0 0,2 0,3
Non-recurrent health expenditure: 0,3 0,9 1,3
Central government non-recurrent health
expenditure: 0,3 0,7 1,0
Local government authorities non-recurrent
health expenditure: 0,0 0,2 0,3
Non-recurrent social assistance expenditure 0,0 0,2 0,3
Central government non-recurrent social
assistance expenditure: 0,0 0,0 0,0
Local government authorities non-recurrent
social assistance expenditure: 0,0 0,2 0,3
Non-recurrent nutrition expenditure: 0,0 0,1 0,2
Central government non-recurrent nutrition
expenditure: 0,0 0,0 0,0
Local government authorities non-recurrent
nutrition expenditure: 0,0 0,1 0,2
Non-recurrent child protection expenditure: 0,0 0,1 0,2
Central government non-recurrent child
protection expenditure: 0,0 0,0 0,0
Local government authorities non-recurrent
child protection expenditure: 0,0 0,1 0,2
(B) Tax and non-tax revenue (excl. external grants)
(+): 12,8 13,9 14,1
Tax revenue: 12,0 13,1 13,3
Central government tax revenue: 11,7 12,7 12,9
Income tax: 4,3 4,6 4,7
Personal income tax 2,1 2,2 2,2
Company tax: 1,4 1,5 1,5
Other income tax 0,9 0,9 0,9
Value-added tax: 2,9 3,2 3,2

48
FY14-15
Average FY15-16-
FY19-20 FY19-20
Value-added tax on internal transactions 1,8 1,8 1,8
Value-added tax on imports 1,1 1,3 1,4
Customs and excise duties: 4,4 5,0 5,1
Customs duties 1,0 1,3 1,4
Excises 3,5 3,7 3,7
Export duties 0,0 0,0 0,0
Local government authorities tax revenue: 0,4 0,4 0,4
Non-tax revenue (excl. external grants) (+): 0,8 0,8 0,8
Central government non-tax revenue: 0,8 0,8 0,8
Local government authorities non-tax revenue: 0,0 0,0 0,0
(C) External grants (+): 1,1 1,1 1,1
External grants for current expenditure: 0,6 0,6 0,6
Central government external grants for current
expenditure: 0,6 0,6 0,6
Local government authorities external grants for
current expenditure: 0,0 0,0 0,0
External grants for capital expenditure
(projects): 0,5 0,5 0,5
Central government external grants for capital
expenditure (projects): 0,5 0,5 0,5
Local government authorities external grants for
capital expenditure (projects): 0,0 0,0 0,0
(D) Total non-priority non-interest expenditure (-): -9,1 -9,3 -9,5
Non-priority recurrent expenditure: -5,5 -5,5 -5,5
Central government non-priority recurrent
expenditure: -5,5 -5,5 -5,5
Non-priority expenditure on staff -5,3 -5,3 -5,3
Non-staff recurrent non-priority expenditure: -0,2 -0,2 -0,2
Recurrent non-priority expenditure on
goods and services -0,1 -0,1 -0,1
Other non-staff recurrent non-priority
expenditure -0,1 -0,1 -0,1
Local government authorities non-priority
recurrent expenditure: 0,0 0,0 0,0
Non-priority non-recurrent expenditure: -3,5 -3,8 -4,0
Central government non-priority non-recurrent
expenditure: -3,3 -3,5 -3,6
Local government authorities non-priority non-
recurrent expenditure: -0,2 -0,3 -0,4
(E) External-debt disbursements (+): 2,6 1,3 1,4
External-debt disbursements (+) (US$ millions): $1,3 $0,7 $0,8
(F) External debt service (-): -0,7 -1,2 -1,2
External interest expenditure (-) -0,4 -0,5 -0,5
External interest expenditure (-) (US$ million) -$0,2 -$0,2 -$0,3
External debt repayments (-) -0,3 -0,8 -0,7
External debt repayments (-) (US$ million) -$0,1 -$0,4 -$0,4

49
FY14-15
Average FY15-16-
FY19-20 FY19-20
(G) Net internal financial flows (incl. internal
interest) (+): -1,6 0,4 1,0
Net internal-debt flow (+): 1,2 3,2 4,4
Internal-debt disbursements (+)
Internal debt repayments (-)
Internal interest expenditure (-) -2,5 -2,8 -3,4
Discrepancy (+) -0,3 0,0 0,0
Revenue and grants 14,0 15,0 15,3
Expenditure: -17,2 -18,8 -20,4
Recurrent expenditure: -12,9 -12,7 -13,0
Non-interest recurrent expenditure -10,0 -9,4 -9,1
Interest -2,9 -3,2 -3,9
Non-recurrent expenditure: -4,4 -6,2 -7,4
Discrepancy -0,3 0,0 0,0
Surplus (deficit): -3,6 -3,8 -5,1
Primary surplus (deficit) -0,7 -0,5 -1,2
Interest -2,9 -3,2 -3,9
Financing: 3,6 3,8 5,1
Net external financing 2,4 0,6 0,7
Net internal financing 1,2 3,2 4,4
External and internal debt
Net debt: 23,0 27,0 31,7
External debt 23,0 27,0 31,7
External (US$ millions) 18,1 15,7 14,7
Internal: $7,5 $8,3 $9,0
Internal debt 5,0 11,2 17,0
5,0 11,2 17,0
0,0 0,0 0,0
MACROECONOMIC AGGREGATES:
Gross domestic product (US$ million)
Gross domestic product at 2015 prices and
exchange rate (US$ million)
Gross domestic product (national currency -
billions)
GDP deflator
Consumer prices (year-average)
Consumer prices (December) $48.446,1 $52.012,3 $58.980,8
Exchange rate (year-average) $42.124,0 $51.834,3 $58.942,9
Exchange rate (December) 85.291,0 120.026,4 142.429,1
Population (millions) 105,8 120,6 126,3
Population under fifteen (millions) 153,2 174,5 182,8
Headcount poverty incidence 158,4 181,9 195,1
1.760,5 2.298,9 2.414,8

50
FY14-15
Average FY15-16-
FY19-20 FY19-20
net exports of goods and non-factor services
(us$ million): 2.060,2 2.263,2 2.343,9
exports of goods and non-factor services 52,6 57,7 61,2
Merchandise exports: 23,8 25,9 27,3
41,7% 37,9% 35,4%
Non-factor services receipts -$3.969,9 -$5.669,8 -$6.875,7
imports of goods and non-factor services $9.087,3 $11.072,0 $12.745,7
Merchandise imports: $5.515,2 $6.719,7 $7.735,5
Non-factor services payments: $3.572,2 $4.352,3 $5.010,3
Insurance and freight payments for
merchandise imports -$13.057,3 -$16.741,8 -$19.621,4
Other non-factor services payments -$10.380,4 -$13.377,0 -$15.723,8
Per cent of GDP:
gross domestic product (national currency): -$2.676,9 -$3.364,8 -$3.897,6
Total consumption: -$1.245,6 -$1.520,4 -$1.729,6
Non-government consumption -$1.431,2 -$1.844,4 -$2.168,0
Government consumption:
Central-government consumption
Consumption of other governments 100,0 100,0 100,0
Total investment: 73,8 76,4 77,2
Gross fixed capital formation 60,0 62,7 63,5
Net increase in inventory stocks 13,7 13,7 13,7
Net exports of goods and non-factor services: 5,4 5,4 5,4
Exports of goods and non-factor services 8,3 8,3 8,3
Imports of goods and non-factor services (-) 33,6 33,6 33,6
33,6 33,6 33,6
Per-capita non-government consumption at 2015
prices and exchange rate 0,0 0,0 0,0
Growth rate -7,4 -10,0 -10,8
Source: Estimates and calculations from the projection workbook TZFS.xlsm.
The projections in Table A.1.2 show the evolution of Tanzania’s fiscal accounts under the
assumptions listed in Table A.1.1. Results shaded in green are those of particular interest.
The top line of the projection (A) shows the evolution of priority expenditure, and the lines below
show the evolution of the components of its fiscal space: tax and non-tax revenue (B), external
grants (C), non-priority expenditure (-) (D), external-debt disbursements (E), external-debt service (-
) (F), and the “fiscal gap” (G).
The net internal-debt flow as a percentage of GDP is the “bottom-line” result, determined residually
for each year from the assumed priority-expenditure and fiscal-space flows. The net internal-debt
flow over the five years FY2017-2021 would average +0.7 per cent of GDP, a relatively optimistic
projection compared with the FY2009-2015 average of +1.9 per cent of GDP. The government’s
overall debt stock would rise modestly as a percentage of GDP over the projection years, from 28.4
per cent of GDP at the end of FY2015 to 31.3 per cent of GDP at the end of FY2020.

51
Priority expenditure would grow at an annual average real rate of 4 per cent per year, above the
assumed 2.1-per-cent average growth rate of the child population. Table A.1.3 shows its evolution
of priority expenditure in real per-child terms (U.S. dollars per child at FY2016 prices and exchange
rate).
Table A.1.3 Tanzania: Projected priority expenditure (U.S. dollars per child and prices and exchange rate
of FY2016), FY2017-2020 (base scenario)
FY14-15
Average
FY15-16-
FY19-20 FY19-20
U.S. dollars per child and prices and exchange rate of FY2016 | Initial projection year: 2016
(A) Total priority non-interest expenditure 106,7 144,9 173,8
Total education expenditure 73,4 86,6 96,6
Total health expenditure 28,0 43,5 55,2
Total social assistance expenditure 4,6 8,2 11,2
Total nutrition expenditure 0,5 3,4 5,6
Total child protection expenditure 0,2 3,0 5,2
Priority recurrent expenditure: 89,8 89,7 89,8
Recurrent education expenditure: 63,4 63,5 63,6
Central government recurrent education expenditure: 58,4 58,6 58,7
Expenditure on education staff 1,3 1,5 1,6
Non-staff recurrent education expenditure: 57,1 57,1 57,1
Recurrent education expenditure on goods and services 21,7 21,7 21,7
Other non-staff recurrent education expenditure 35,4 35,4 35,4
Local government authorities recurrent education
expenditure: 5,0 5,0 5,0
Recurrent health expenditure: 21,6 21,9 22,1
Central government recurrent health expenditure: 20,7 21,1 21,3
Expenditure on health staff 1,0 1,2 1,3
Non-staff recurrent health expenditure: 19,7 19,9 20,0
Recurrent health expenditure on goods and services 5,1 5,2 5,2
Other non-staff recurrent health expenditure 14,6 14,7 14,8
Local government authorities recurrent health expenditure: 0,8 0,8 0,8
Recurrent social assistance expenditure: 4,4 3,8 3,6
Central government recurrent social assistance expenditure: 4,3 3,8 3,5
Local government authorities recurrent social assistance
expenditure: 0,0 0,0 0,0
Recurrent nutrition expenditure: 0,4 0,4 0,4
Central government recurrent nutrition expenditure: 0,2 0,2 0,2
Expenditure on nutrition staff 0,0 0,0 0,0
Non-staff recurrent nutrition expenditure: 0,2 0,2 0,2
Recurrent nutrition expenditure on goods and services 0,2 0,2 0,2
Other non-staff recurrent nutrition expenditure 0,0 0,0 0,0
Local government authorities recurrent nutrition
expenditure: 0,1 0,1 0,1
Recurrent child protection expenditure: 0,1 0,1 0,2
Central government recurrent child protection expenditure: 0,1 0,1 0,1

52
FY14-15
Average
FY15-16-
FY19-20 FY19-20
Expenditure on child protection staff 0,0 0,0 0,0
Non-staff recurrent child protection expenditure: 0,1 0,1 0,1
Recurrent child protection expenditure on goods and services 0,1 0,1 0,1
Other non-staff recurrent child protection expenditure 0,0 0,0 0,0
Local government authorities recurrent child protection
expenditure: 0,0 0,0 0,0
Priority non-recurrent expenditure: 16,8 55,2 83,9
Non-recurrent education expenditure: 10,0 23,1 32,9
Central government non-recurrent education expenditure: 9,5 18,3 24,9
Local government authorities non-recurrent education
expenditure: 0,5 4,8 8,1
Non-recurrent health expenditure: 6,4 21,6 33,1
Central government non-recurrent health expenditure: 5,8 16,7 24,9
Local government authorities non-recurrent health expenditure: 0,6 5,0 8,2
Non-recurrent social assistance expenditure 0,2 4,5 7,7
Central government non-recurrent social assistance
expenditure: 0,2 0,2 0,2
Local government authorities non-recurrent social assistance
expenditure: 0,0 4,3 7,5
Non-recurrent nutrition expenditure: 0,2 3,1 5,2
Central government non-recurrent nutrition expenditure: 0,2 0,2 0,2
Local government authorities non-recurrent nutrition
expenditure: 0,0 2,8 5,0
Non-recurrent child protection expenditure: 0,1 2,9 5,0
Central government non-recurrent child protection expenditure: 0,0 0,1 0,1
Local government authorities non-recurrent child protection
expenditure: 0,0 2,8 5,0
Source: Estimates and calculations from the projection workbook TZFS.xlsm.

53
Table A.1.4 Tanzania: Sensitivity analysis for the fiscal-space projection exercise
Scenario: 0 1 2 3 4 5 6
Assumptions that vary with scenarios:
Real GDP growth, FY2016-
2020
Growth rate starts
from 7.1 per cent
and slightly
decline to 6.8 per
cent over the
projection years
Growth rate
starts from 7.1
per cent and
slightly decline
to 6.8 per cent
over the
projection years
Growth rate starts
from 7.1 per cent
and slightly
decline to 6.8 per
cent over the
projection years
Growth rate
starts from 7.1
per cent and
slightly decline
to 6.8 per cent
over the
projection years
Growth declines
gradually from 7
to 6 per cent
over the
projection years
Growth rate starts
from 7.1 per cent
and slightly
decline to 6.8 per
cent over the
projection years
Growth rate starts
from 7.1 per cent
and slightly
decline to 6.8 per
cent over the
projection years
Domestic VAT collection
efficiency, FY2016-2020
Remains
unchanged at
10.3 per cent
over the
projection period
Gradually
increases to
12.3 per cent
over the
projection period
Remains
unchanged at
10.3 per cent
over the
projection period
Gradually
increases to
12.3per cent
over the
projection period
Remains
unchanged at
10.3 per cent
over the
projection period
Remains
unchanged at
10.3 per cent
over the
projection period
Remains
unchanged at
10.3 per cent
over the
projection period
Import VAT collection
efficiency, FY2016-2020
Remains
unchanged at
28.2 per cent
over the
projection period
Gradually
increases to
33.8 per cent
over the
projection period
Remains
unchanged at
28.2 per cent
over the
projection period
Gradually
increases to
33.8 per cent
over the
projection period
Remains
unchanged at
28.2 per cent
over the
projection period
Remains
unchanged at
28.2 per cent
over the
projection period
Remains
unchanged at
28.2 per cent
over the
projection period
Growth rate of education
expenditure/growth rate of
child population, FY2016-2020
Remains at one
over the
projection period
Remains at one
over the
projection period
Remains at 1.3
over the
projection period
Remains at 1.3
over the
projection period
Remains at one
over the
projection period
Remains at one
over the
projection period
Remains at one
over the
projection period
Growth rate of health
expenditure/growth rate of
overall population, FY2016-
2020
Remains at one
over the
projection period
Remains at one
over the
projection period
Remains at 1.3
over the
projection period
Remains at 1.3
over the
projection period
Remains at one
over the
projection period
Remains at one
over the
projection period
Remains at one
over the
projection period
Elasticity of county tax
collection with respect to
GDP, FY2016-2020
Declines
gradually from 1.1
to 1 over the
projection period
Declines
gradually from
1.1 to 1 over the
projection period
Declines
gradually from 1.1
to 1 over the
projection period
Declines
gradually from
1.1 to 1 over the
projection period
Declines
gradually from 1.1
to 1 over the
projection period
Declines
gradually from 1.1
to 1 over the
projection period
Declines
gradually from 1.1
to 1 over the
projection period

54
Scenario: 0 1 2 3 4 5 6
Elasticity of central-
government non-priority
expenditure on goods and
services with respect to non-
priority staff size
Remains at one
over the
projection period
Remains at one
over the
projection period
Remains at one
over the
projection period
Remains at one
over the
projection period
Remains at one
over the
projection period
Remains at 0.3
over the
projection period
Remains at one
over the
projection period
Elasticity of education staff
size with respect to child
population
Remains at one
over the
projection period
Remains at 1.3
over the
projection period
Remains at one
over the
projection period
Remains at 1.3
over the
projection period
Remains at one
over the
projection period
Remains at one
over the
projection period
Remains at 1.3
over the
projection period
Results:
Average tax revenue/GDP,
FY2016-2020 13,1 13,5 13,1 13,5 13,1 13,1 13,1
Average priority
expenditure/GDP, FY2016-
2020 6,3 6,3 6,5 6,5 6,3 6,3 6,3
Average priority expenditure
per child (U.S. dollars at
FY2016 prices and exchange
rate), FY2016-2020 $144,9 $144,9 $150,5 $150,5 $144,3 $144,9 $145,4
Net internal debt flow/GDP,
FY2016-2020 3,2 2,7 3,5 3,0 3,3 3,2 3,2
Total government debt/GDP,
FY2020 31,7 29,2 33,3 30,8 32,5 31,7 31,9

55
Table A.1.5 Tanzania: Additional sensitivity analysis for the fiscal-space projection exercise – enhanced expenditure on nutrition and child protection
Scenario: 0 7 8 9 10
Assumptions that vary with scenarios:
Real GDP growth,
FY2016-2020
Growth rate starts from 7.1
per cent and slightly
decline to 6.8 per cent
over the projection years
Growth rate starts from 7.1
per cent and slightly
decline to 6.8 per cent
over the projection years
Growth rate starts from 7.1
per cent and slightly
decline to 6.8 per cent
over the projection years
Growth rate starts from 7.1
per cent and slightly
decline to 6.8 per cent
over the projection years
Growth rate starts from 7.1
per cent and slightly
decline to 6.8 per cent
over the projection years
Growth rate of nutrition
recurrent expenditure
FY2016-2020
Growth rates would follow
the general rules for
growth rates of priority
expenditure
Growth rates would
follow the NMNAP
Growth rates would follow
the general rules for
growth rates of priority
expenditure
Growth rates would
follow the NMNAP
Growth rates would
follow the NMNAP
Growth rate of child-
protection recurrent
expenditure FY2016-2020
Growth rates would follow
the general rules for
growth rates of priority
expenditure
Growth rates would follow
the general rules for
growth rates of priority
expenditure
Growth rates would
follow the NPAC-VACW
Growth rates would
follow the NPAC-VACW
Growth rates would follow
the general rules for
growth rates of priority
expenditure
Growth rate of nutrition
recurrent expenditure at
the local level FY2016-
2020
Growth rates would follow
the general rules for
growth rates of nutrition
expenditure
Growth rates would follow
the general rules for
growth rates of nutrition
expenditure
Growth rates would follow
the general rules for
growth rates of nutrition
expenditure
Growth rates would follow
the general rules for
growth rates of nutrition
expenditure
Growth rates would be
significantly higher on a
per-child basis than in
the other scenarios
Results:
Average tax
revenue/GDP, FY2016-
2020 13,1 13,1 13,1 13,1 13,1
Average priority
expenditure/GDP,
FY2016-2020 6,3 6,3 6,3 6,4 6,5
Average priority
expenditure per child
(U.S. dollars at FY2016
prices and exchange
rate), FY2016-2020 $144,9 $146,6 $145,5 $147,3 $150,9
Net internal debt
flow/GDP, FY2016-2020 3,2 3,3 3,2 3,4 3,7

56
Scenario: 0 7 8 9 10
Total government
debt/GDP,FY2020 31,7 32,3 31,9 32,4 33,7

57
Table A.1.6 Tanzania: Real growth rate of child and nutrition expenditure for scenario 7,8,9 and 10
Scena
rio
FY15-16 FY16-17 FY17-18 FY18-19 FY19-20
7 Nutrition spending will follow the projections of the Nutrition Multiannual Action Plan
(NMAP)
Growth rate of nutrition remuneration
rates
232% 77% 73% 6% -34%
Real growth rate of recurrent nutrition
expenditure on goods and services
232% 77% 73% 6% -34%
Real growth rate of other non-staff
recurrent nutrition expenditure
232% 77% 73% 6% -34%
Real growth rate of local government
authorities recurrent nutrition
expenditure:
232% 77% 73% 6% -34%
8 Child protection spending will follow the projections of the National Plan of Action –
Violence Against Children (NAP-VAC)
Real growth rate of child protection
remuneration rates
50% 101% 50% 227% -26%
Real growth rate of recurrent child
protection expenditure on goods and
services
50% 101% 50% 227% -26%
Real growth rate of other non-staff
recurrent child protection expenditure
50% 101% 50% 227% -26%
Real growth rate of local government
authorities recurrent child protection
expenditure:
50% 101% 50% 227% -26%
9 Nutrition spending will follow the projections of the Nutrition Multiannual Action Plan
(NMAP) & Child protection spending will follow the projections of the National Plan of
Action – Violence Against Children (NAP-VAC)
Growth rate of nutrition remuneration
rates
232% 77% 73% 6% -34%
Real growth rate of recurrent nutrition
expenditure on goods and services
232% 77% 73% 6% -34%
Real growth rate of other non-staff
recurrent nutrition expenditure
232% 77% 73% 6% -34%
Real growth rate of local government
authorities recurrent nutrition
expenditure:
232% 77% 73% 6% -34%
Real growth rate of child protection
remuneration rates
50% 101% 50% 227% -26%
Real growth rate of recurrent child
protection expenditure on goods and
services
50% 101% 50% 227% -26%
Real growth rate of other non-staff
recurrent child protection expenditure
50% 101% 50% 227% -26%
Real growth rate of local government
authorities recurrent child protection
expenditure:
50% 101% 50% 227% -26%

58
Scena
rio
FY15-16 FY16-17 FY17-18 FY18-19 FY19-20
10 Local government authorities nutrition spending amounts to 20,000 TZS per 0-5 y/o
Growth rate of nutrition remuneration
rates
232% 77% 73% 6% -34%
Real growth rate of recurrent nutrition
expenditure on goods and services
232% 77% 73% 6% -34%
Real growth rate of other non-staff
recurrent nutrition expenditure
232% 77% 73% 6% -34%
Real growth rate of local government
authorities recurrent nutrition
expenditure:
4123% 8% 7% 5% 4%
Table A.1.7 Tanzania: Projected increases of nutrition and child protection expenditure as percentage of
GDP for scenario 7,8 and 9
FY11-
12
FY12-
13
FY13-
14
FY14-
15
FY15-
16
FY16-
17
FY17-
18
FY18-
19
FY19-
20
Total nutrition
expenditure
0,02
%
0,02
%
0,03
%
0,03
%
0,10
%
0,17
%
0,25
%
0,29
%
0,28
%
Total child protection
expenditure
0,01
%
0,01
%
0,01
%
0,01
%
0,05
%
0,10
%
0,15
%
0,23
%
0,25
%


60