national quality improvement center on the privatization of child
TRANSCRIPT

National Quality Improvement Center on the Privatization of Child Welfare Services
Portrait of Private Agencies in the Child Welfare System: Principal Results from the National Survey of PrivateChild and Family Serving Agencies Written by Bowen McBeath, PhD, Portland State University; Crystal Collins-Camargo, PhD, University of Louisville; andEmmeline Chuang, PhD, San Diego State University September 2011

i
Table of Contents List of Tables iii List of Figures iv Author Information v Acknowledgements vi Executive Summary viii 1. Introduction 1 1.1. Study Purpose 1 1.2. Overview of NSPCFSA and Major Research Topics 1 1.3. Organization of the Report 2 2. Methodology 3 2.1. Survey Instrument Development 3 2.2. Sampling Strategy 3 2.3. Data Collection 4 2.4. State Location 4 2.5. Analytical Methods 5 3. Respondent Characteristics 6 4. Organizational Demographics 6 4.1. Agency Age and Auspices 6 4.2. Staff Size 6 4.3. Staff Composition 7 4.4. Specialized Administrative Units and Staff 8 4.5. Service Delivery Context 9 4.6. Autonomous vs. Confederated Agencies 9 4.7. Membership in National and State Associations 9 4.8. Accreditation 11 5. Funding 11 5.1. Total Annual Operating Budget 11 5.2. Sources of Revenue 12 5.3. Contracting with the Public Child Welfare Agency: Programmatic Area(s) 13 5.4. Contracting with the Public Child Welfare Agency: Use of Performance
Contracting 15
5.5. Contracting with County Public Child Welfare Agencies 15 5.6. Contracting with Other Public or Private Entities 15 6. Agency Service Array 16 6.1. Direct and Indirect Provision of Child Welfare Services 16 6.2. Agency Autonomy in Foster Care Decision Making 17 6.3. Direct and Indirect Provision of Health and Behavioral Health Services 17 6.4. Direct and Indirect Provision of Other Social Services 18 7. Inter-organizational Relationships 19 7.1. Quality of Relationship with Different Agencies 19 7.2. Collaboration: Data Sharing and Information Sharing 20 7.3. Collaboration: Cross-Training of Staff 21 7.4. Collaboration: Joint Delivery of Services to Children and Families 21 7.5. Collaboration: Budgeting or Resource Allocation 22

ii
7.6. Competition for Public Funding 22 7.7. Competition for Private Funding 23 7.8. Competition for Staff 24 7.9. Competition for Clientele 24 8. Pressures on Organizational Maintenance 25 8.1. Relationship with the Public Child Welfare Agency: Effects on Private Agencies 25 8.2. Internal and External Influences on the Development of New Programs 26 8.3. Internal and External Influences on the Delivery of Long-Standing Programs 27 8.4. Internal and External Influences on Frontline Staff Training 27 8.5. Internal and External Influences on Interagency Relationships 28 9. Performance Measurement and Management 29 9.1. Perceptions of the Appropriateness and Adequacy of Performance Measurement 29 9.2. Staff Comprehension and Articulation of Performance Expectations 29 9.3. Effectiveness of Agency Performance Management Strategies 30 10. Discussion and Conclusions 31 10.1. Major NSPCFSA Results 32 10.2. Study Limitations 33 10.3. Recommendations for Research 34 10.4. Recommendations for Policy and Practice 36 References 39

iii
List of Tables
2-1. State Location of NSPCFSA Agencies 5 4-1. Differences between Autonomous and Confederated Agencies 9 4-2. Agencies’ Memberships in State Associations for Children and Families (N=407) 10

iv
List of Figures
4-1. Distribution of Full-Time Staff 7 4-2. Agency Employs 0-20% of Workers in this Role 8 4-3. Percentages of Agencies with 50-100% Non-Caucasian Staff, by Role 8 4-4. Overlap in Agencies’ Associational Memberships 11 5-1. Composition of Revenue, Most Recent Fiscal Year 12 5-2. Degree of Dependence on Public Contracts for Child and Family Services 13 5-3. Percentage of Agencies with <25% Expenditures in Different Child Welfare Programs 14 5-4. Distribution of Agency Expenditures on Foster Care Placement Services and
Residential Treatment/Congregate Care 14
5-5. Use of Performance Contracting by Programmatic Area 15 5-6. Contracts with Other Public or Private Entities 16 6-1. Direct and Indirect Provision of Child Welfare Services 17 6-2. Direct and Indirect Access to Health and Behavioral Health Services 18 6-3. Direct and Indirect Access to Other Services 19 7-1. Quality of Relationship with Different Agencies 20 7-2. Collaboration around Data and Information Sharing 20 7-3. Collaboration around Staff Training 21 7-4. Collaboration around Service Delivery 22 7-5. Collaboration around Budgeting 22 7-6. Competition for Public Funds 23 7-7. Competition for Private Funds 23 7-8. Competition for Staff 24 7-9. Competition for Clientele 25 8-1. Effects of Relationship with Public Child Welfare Agency 26 8-2. Effects on the Development of New Programming 27 8-3. Effects on Program Delivery 27 8-4. Effects on Training of Frontline Caseworkers 28 8-5. Effects on Formation of Interagency Alliances 28 9-1. Degree of Frontline Understanding of Performance Measures 29 9-2. Methods Used to Promote Understanding of Performance Measures 30 9-3. Effectiveness of Different Performance Management Strategies 31

v
Author Information Bowen McBeath is concerned with the architecture, financing, and development of consumer-centered human service delivery systems and in particular with how child welfare agencies provide effective, efficient, and equitable services to children, youth, and families. Currently an Associate Professor in the School of Social Work and Hatfield School of Government (Division of Public Administration) at Portland State University and an Affiliate Scientist at the Oregon Social Learning Center, Dr. McBeath is involved in clinical-translational studies focused upon promoting sibling and peer relationship development for foster youth as well as a study applying parent management training methods to the community corrections population. He is engaged in research on the organizational correlates of service provision and child welfare system outcomes, and is interested in improving how child welfare agencies use performance information to improve agency outcomes. His scholarship has been published in the premier scientific journals in social work and public administration. He can be contacted at [email protected]. Crystal Collins-Camargo is on the faculty at the University of Louisville Kent School of Social Work and is the director of the National Quality Improvement Center on the Privatization of Child Welfare Services, a knowledge development initiative that involves multi-site research and demonstration projects assessing the effectiveness and efficiency of the provision of child welfare services by private organizations, and the nature of the public/private partnership required in such an approach. She also directed the Southern Regional Quality Improvement Center for Child Protection, which worked in a ten-state region to assess the impact of clinical supervision on agency and client outcomes in child welfare as well as to forge public agency/university partnerships. She conducts applied research in child welfare and juvenile court systems using collaborative, participatory approaches to engage practitioners in social work and other fields in developing knowledge to promote practice improvement. She formerly worked in the public child protection system as a worker, supervisor, and statewide specialist. She can be contacted at [email protected]. Emmeline Chuang is an Assistant Professor in the Graduate School of Public Health (Division of Health Management and Policy) at San Diego State University. Her work examines how health and human service organizations improve service access and quality of care for vulnerable populations. She is particularly interested in how public policy and local resources impact organizational behavior at the frontlines of service delivery and in the coordination of care for families involved with multiple public sectors. Dr. Chuang has been involved with evaluations of child welfare services and substance abuse treatment at the state and county level as well as on several national and regional mixed methods program evaluations focused on workforce development in the health care sector. Her research has been published in scientific journals in health care management, behavioral health, and social work. She can be contacted at [email protected].

vi
Acknowledgements This study began with a conversation that two of us (Drs. McBeath and Collins-Camargo) had fall 2010. In that conversation, we acknowledged the critical need for a national survey of private agencies serving child welfare populations, which the National Quality Improvement Center on the Privatization of Child Welfare Services (QIC PCW) Advisory Board and many others had identified as an important but neglected research topic. We then listed the many logistical, political, and scientific reasons why such a study had never been conducted successfully. Despite these expected challenges, we proceeded to sketch out with Dr. Chuang an ambitious study that we hoped would collect multi-state agency data on topics of high relevance to child welfare researchers and practitioners. That our effort has been at all successful is attributable to the strong support we have received in planning, designing, and implementing the survey. We extend our sincere appreciation to Polina Makievsky of the Alliance for Children and Families and Christine James-Brown of the Child Welfare League of America. Polina and Christine supported our study from its inception, and showed an incredible willingness to provide feedback on early versions of the survey instrument and share our call for participation with their organizations’ memberships. We would like to express our gratitude to the many directors of state associations of private child and family serving agencies, who took enormous pains to ask their member agencies (repeatedly) to participate in the survey. Without their and their staff’s direct assistance, we are convinced that we would have had many fewer responses from the states represented in our study. We list them alphabetically by state: Emily Jenkins, Arizona Council of Human Service Providers Carroll Schroeder, California Alliance of Child and Family Services Dr. Skip Barber, Colorado Association of Family and Children's Agencies Michael Cusick, Florida Coalition for Children Normer Adams, Georgia Association of Homes and Services for Children Margaret Berglind, Child Care Association of Illinois Cathy Graham, Indiana Association of Residential Caring Agencies Kristie Oliver, Coalition for Family and Children's Services in Iowa Bruce Linhos, Children's Alliance of Kansas Michelle Sandborn, The Children's Alliance of Kentucky Shelley Tinney, Maryland Association of Resources for Family and Youth Barbara Talkov, Children's League of Massachusetts Janet Reynolds Snyder, Michigan Federation for Children and Families Mary Regan, Minnesota Council of Child Caring Agencies Carmen Schulze, Missouri Coalition of Children's Agencies Megann Anderson, New Jersey Alliance for Children, Youth, and Families Jim Purcell, New York Council of Family and Child Caring Agencies Karen Taylor McLeod, Benchmarks (North Carolina) Penny Wyman, Ohio Association of Child Caring Agencies Bernadette Bianchi, Pennsylvania Council of Children, Youth, and Family Services Paula Fendley, South Carolina Association of Children's Homes

vii
Darci Halfman, Tennessee Alliance for Children and Families Nancy Holman, Texas Association of Leaders in Children and Family Services Linda Hall, Wisconsin Association of Family and Children's Agencies
Great thanks are also due to the agency administrators who responded to our survey. Despite their overflowing schedules and the fact that the survey was distributed in the midst of critical state legislative sessions, agency directors took time to share with us their opinions on a range of sensitive agency topics. We are humbled by these individuals’ contributions to our study and privileged to bear witness to their commitment to the private child and family serving sector. Lastly but certainly not least of all, we would like to thank Jennifer Hall and Ramie Martin-Galijatovic of the QIC PCW, who helped edit and format this report.

viii
Executive Summary The National Survey of Private Child and Family Serving Agencies (NSPCFSA) was developed to gather information on the critical role of the private sector in serving children and families involved with the formal child welfare system. Developed by the National Quality Improvement Center on the Privatization of Child Welfare Services in partnership with the Child Welfare League of America and the Alliance for Children and Families, NSPCFSA provides detailed information concerning the private agencies across the country serving the child welfare population, the services these agencies contract with public child welfare agencies to provide, and the inter-organizational relationships private child and family serving agencies have with other public and private entities. Major Study Results Survey data were collected from administrators from 446 private agencies over May 1-June 30, 2011. These data provide the first portrait of private child and family serving agencies across state child welfare systems. Major study results are organized around the following nine themes. Theme 1: Agency leaders are experienced and highly educated. On average, respondents had been in their current position for 10 years and employed in agencies serving child welfare-involved children and families for 24 years. Respondents were also highly educated, with over 80% of the sample having at least one advanced degree. Theme 2: Agencies are mature, large, and have specialized administrative supports. On average, agencies had been operating for 63 years, and were predominantly located in metropolitan areas. Over half of agencies employed more than 100 FTEs, and most agencies had specialized administrative units or staff (e.g., chief financial officer, quality assurance/quality improvement unit/manager, information technology department/manager, program evaluation department/manager). Theme 3: Agencies are autonomous, strongly networked, and accredited. Most agencies operated autonomously rather than as part of a confederation of multiple branch offices under a common agency name. Nearly half of agencies were a member of either the Child Welfare League of America or the Alliance for Children and Families, and over 90% of agencies were members of their state association representing child and family serving agencies. Nearly two thirds of agencies held some type of accreditation. Theme 4: Agency budgets are large and disproportionately drawn from purchase of service contracts. The average agency budget was over $20M, with a median budget size of $7.5M. Agencies relied upon government contracts for serving children and families for 69% of their current revenue, with much smaller percentages from other government contracts (8%), private fee-for-service income (6%), donations (6%), and foundation grants (5%). Theme 5: Agencies have diversified contractual arrangements within and outside of child welfare. Agencies contracted to provide many different types of child welfare services (e.g., family reunification services, foster care placement services, residential treatment or congregate

ix
care, adoption services) and generally did not contract in only one programmatic area. Agencies also commonly contracted with more than one county public child welfare agency and with different public and private entities (e.g., public schools, public mental health service authorities, public juvenile justice agencies) to support their programming and service delivery. Theme 6: Agencies provide multiple types of child welfare, health and behavioral health, and social services. In terms of child welfare services, over half of agencies provided ongoing out-of-home services, screening/intake/emergency services, reunification services, and ongoing in-home services. Concerning the provision of health and behavioral health services, although 80% of agencies provided mental health services for children, modest proportions of agencies provided other health, mental health, or substance abuse treatment services. Finally, over half of agencies provided supports for transition-age youth, parenting classes, wraparound or system of care services, and respite care. Most of these services were provided directly in-house by agencies rather than through subcontracts with other service providers. Theme 7: Agencies collaborate with other organizations and perceive low levels of competition for funding, staff, or clientele. Agencies reported modest levels of collaboration with other agencies around data/information sharing and joint service delivery, but significantly less collaboration around cross-training of staff and/or joint budgeting or resource allocation. Agencies reported low levels of competition with other organizations for public and private funding, staff, and clientele. When present, competition with other private child and family serving agencies (local or non-local) was perceived to be greater than competition from any other type of agency. In general, however, agencies perceived their relationships with nearly all types of agencies to be positive. Theme 8: Agencies face multiple internal and external pressures. A number of different internal and external pressures influenced agency efforts to develop new programs, deliver existing programs, train new frontline caseworkers, and/or partner with other agencies. The strongest pressures affecting agency operations were changes in agencies’ financial outlook, pressures related to financial risk, efforts to stay abreast of best practices, changing reimbursement rates, efforts to streamline agency operations, and efforts to respond to the changing needs of children and families. Agencies suggested that their relationship with the public child welfare agency had neither a positive nor negative effect on most of their agency’s core operations. Theme 9: Agencies use multiple methods to improve performance in serving children and families. Over half of agencies suggested that their agency’s performance with children and families was being evaluated using appropriate outcomes, indicators, and data. Agencies reported using a variety of methods to promote frontline staff and supervisors’ understanding of agency performance measures, including staff discussions, staff training, and written policies. Finally, performance management approaches deemed most effective in improving agency performance with children and families included different case review methods, outcomes management, consumer input, staff quality improvement training, and program evaluation. Recommendations for Research These results as well as future planned research using NSPCFSA data are expected to provide

x
essential information for researchers interested in the organization, financing, management, and frontline functioning of child welfare systems. One recommendation for future research focuses upon identifying the implications of the organizational processes uncovered in this report for agency and client outcomes. Research should also test for cross-sector (public vs. private) and state-based differences in child welfare agencies and the characteristics of, services to, and outcomes for children, youth, and families served by these agencies. Finally, future research should seek to identify how private and public agency staff interact around contracting and service provision and, in particular, under what conditions staff from different agencies collaborate to promote desired client outcomes. Recommendations for Practice These results are also expected to help the private child and family serving sector highlight its critical role as a partner in delivering public services to child welfare-involved children and families. Practitioners, policymakers, and funders should seek to: improve understanding and cultivate the diversity within the private child and family serving agency sector; invest in agency administration; build capacity for sustainable cross-sector partnerships; and focus upon agency performance. These stakeholders should also be encouraged to collaborate to improve the evidence base for research and practice with private child and family serving agencies and their client populations. Finally, political leadership is needed within the private child welfare sector and at the federal level to improve privately-provided services to and outcomes for child welfare-involved children, youth, and families.

1
1. Introduction 1.1. Study Purpose In 2005, the Children’s Bureau funded the National Quality Improvement Center on the Privatization of Child Welfare Services (QIC PCW) in recognition that state child welfare administrators needed access to research-based evidence to improve decision-making regarding the use and evaluation of public-private partnerships in child welfare service delivery (U.S. Department for Health and Human Services, 2005; Wright & Radel, 2007). The work of the QIC PCW has involved assessing the scope and incidence of child welfare privatization, facilitating national dialogue regarding the applicability and appropriateness of privatization in child welfare and the broader continuum of public/private partnership, and administering research and demonstration projects on performance-based contracting and quality assurance systems in order to promote organizational and client outcomes (Collins-Camargo, Ensign, & Flaherty, 2008). The QIC PCW developed the National Survey of Private Child and Family Serving Agencies (NSPCFSA) in 2011 to gather information on the critical role of the private sector in serving children and families involved with the formal child welfare system. Developed in collaboration with the Child Welfare League of America and the Alliance for Children and Families, NSPCFSA provides the first portrait of private child and family serving agencies across state child welfare systems. In all states, the public child welfare agency contracts with private providers to provide services to children and families (e.g., foster care case management, pre- and post-adoption assistance, and family support programming); in some states, case management responsibility for families whose children are in out-of-home care is shifted via contract to the private sector (Collins-Camargo, McBeath, & Ensign, in press). Although public child welfare agencies have historically relied upon private agencies to deliver programs and services (Smith, 2002), very few studies to date have described the characteristics of the private agencies providing child welfare services or the challenges these agencies face (McBeath & Meezan, 2006; Meezan & McBeath, 2011; Smith, 2009). NSPCFSA provides detailed information concerning the private agencies across the country serving the child welfare population, the services these agencies contract with public child welfare agencies to provide, and the inter-organizational relationships private child and family serving agencies have with other public and private entities. This information is expected to help the private child and family serving sector better advocate with policymakers and funders to improve conditions for private agencies and enhance services to and outcomes for children and families. 1.2. Overview of NSPCFSA and Major Research Topics Survey data were collected from administrators from 446 private agencies over May 1-June 30, 2011. This report reviews major results from NSPCFSA, and is organized around the following topics (which correspond with the major areas of survey coverage): Respondent Characteristics. We present information pertaining to survey respondents’ educational background and years of experience in their current position and in the child welfare system.

2
Organizational Demographics. We present information on the basic demographic characteristics of private agencies, including their age, auspices, staff size and staff composition, and whether agencies serve clients in rural, suburban/non-metropolitan, and/or metropolitan areas. We identify whether agencies operate autonomously or as part of a confederation of multiple branch offices under a common agency name (e.g., Boys and Girls Aid-Northwest, Boys and Girls Aid-Southeast, and Boys and Girls Aid-Central). We also present information concerning the degree to which private agencies are linked with formal membership associations (e.g., the Alliance for Children and Families, Child Welfare League of America, and state associations representing child and family serving agencies) as well as with accrediting bodies. Agency Funding. We present information on agencies’ overall budget size and budget composition from different funding sources. We also describe whether agencies contract with public child welfare agencies to deliver different programs, what proportion of agency expenditures come from these contracts, and whether these contracts are performance-based. Service Array. We report on the services agencies are providing currently, either directly or through a subcontract with one or more other agencies. Specifically, we present detailed information concerning the child welfare services (ranging from screening and intake services to post-reunification programming) and health, mental health, and social services that agencies deliver directly or via subcontract with other providers. Inter-organizational Relationships. Inter-organizational relationships are a major focus of NSPCFSA. We report on the types of public and private entities with which agencies contract to support their programs as well as respondents’ perceptions of the general quality of their agencies’ relationships with these entities. We also present information concerning the extent of collaboration and competition between private agencies and public and private organizations. Internal and External Pressures on Organizational Maintenance. Organizational maintenance concerns agencies’ ability to develop new programs, deliver long-standing programs, train frontline caseworkers, and form interagency relationships. We present information concerning the extent to which agencies’ operations in these areas are influenced by internal pressures (e.g., fiscal changes and feedback from families and clients) and external pressures (e.g., state regulations and court requirements/consent decrees). Performance Measurement and Management. We report on the different strategies agencies use to articulate performance outcomes to frontline staff and to improve agency and client performance. We also present information on respondents’ perceptions of the effectiveness of different performance management strategies in improving outcomes for children and families. 1.3. Organization of the Report This report is organized into 10 sections. The next section describes the research methodology used to gather and analyze NSPCFSA data. Sections 3 through 9 present study results that correspond with the above major study areas. We conclude in Section 10 with a discussion of overarching results as well as a consideration of implications of our major findings for research and practice.

3
2. Methodology NSPCFSA was developed to provide a statistical portrait of private child and family serving agencies across state child welfare systems. Specific attention was paid to gathering information on agencies’ current funding composition, service arrays, relationships with public and private organizations and public authorities, and organizational maintenance strategies. Study results were expected to provide essential information for researchers, advocates, and policymakers interested in the organization, financing, management, and frontline functioning of child welfare systems. Ideally, study findings will be used to improve public-private partnerships in the child welfare system, enhance service provision, and promote better outcomes for child welfare-involved children and families. 2.1. Survey Instrument Development NSPCFSA was developed for use with administrators of private agencies serving child welfare-involved children and families. Survey content and format were developed initially based upon a review of the empirical literature as well as prior research conducted by the study investigators (Chuang & Wells, 2010; Collins-Camargo, Sullivan, & Murphy, 2010; McBeath, Briggs, & Aisenberg, 2009). Although most survey questions were developed specifically for NSPCFSA, some questions pertaining to agencies’ service arrays and inter-organizational relationships were adapted from the National Survey of Child and Adolescent Well-Being Local Area Directors Interview (Dowd et al., 2010). The survey instrument was piloted with agency administrators across multiple states. Pretest agencies were located in different states with large, diverse child welfare client populations and were chosen based upon their organizational size (large vs. small) and anticipated service focus (traditional child welfare vs. behavioral health care). The survey was revised based upon pretest results as well as feedback from the Alliance for Children and Families, Child Welfare League of America, and a number of state associations representing child and family serving agencies. 2.2. Sampling Strategy NSPCFSA utilized a purposive non-probability sample of private nonprofit and for-profit agencies currently serving child welfare-involved children and families. Because no database exists to define the study population, a precise sampling frame could not be developed.1 In lieu of probability sampling, eligibility for study participation was extended to all members of the Alliance for Children and Families, Child Welfare League of America, and state associations for children and families involved in the National Organization of State Associations for Children as well as non-member agencies that were on these associations’ listservs. These membership associations constitute the major organizations representing private child welfare agencies in
1 While the Urban Institute National Center for Charitable Statistics (NCCS) manages a comprehensive database of IRS-defined nonprofit human service organizations (Boris, de Leon, Roeger, & Nikolova, 2010), it would not have been possible to use NCCS IRS Core Files to determine which of these agencies served child welfare-involved children and families. IRS 501(c) national taxonomic codes only designate whether nonprofit agencies provide child and family services. Additionally, NCCS does not gather information on for-profit organizations.

4
state and federal policymaking.2 The exact number of private agencies that are members of one or more of these associations is unknown, although based on membership numbers for the organizations it is estimated that there are between 600 to 1,000 unique agencies. The study target population therefore includes private (nonprofit and for-profit) agencies currently serving child welfare-involved children and families that are associated either through active membership or via an informal capacity with the Alliance for Children and Families, Child Welfare League of America, and/or a state association representing child and family serving agencies. We did not limit study eligibility to agencies providing only traditional child welfare services (e.g., family support, foster care case management, and/or adoption assistance) because pretest results indicated that some private agencies serving child welfare client populations do not consider themselves to be “child welfare” agencies. Use of a broader sampling strategy allowed for survey participation by agencies providing behavioral health and/or social services to child welfare-involved children and families. 2.3. Data Collection NSPCFSA was administered through an online survey format. This data collection strategy was employed to preserve anonymity and confidentiality for participating individuals and agencies as well as to reduce response bias related to administrators being asked questions concerning agency finances, relationships with public and private agencies and entities, and perceptions of their own organization. The aforementioned associations sent an invitation for agency directors to participate in NSPCFSA through electronic listservs to their membership agencies and affiliated non-member agencies.3 This letter of invitation contained information on the study’s purpose, information on human subjects’ protections through the University of Louisville, and a hyperlink to the survey. Respondents were asked to complete the survey only once per agency. Each association also sent follow-up e-mails to listserv members periodically over the eight weeks of data collection. In total, the online survey portal collected 446 agency responses between May 1 - June 30, 2011. 2.4. State Location As shown in Table 2-1, the majority of agencies in the NSPCFSA sample were located in states with large child welfare client populations. For example, 64% of study agencies (n=287) were located in the following 10 states: California, Indiana, Pennsylvania, New York, Kentucky, Texas, Arizona, Wisconsin, Michigan, and Missouri. Most NSPCFSA agencies reported providing services in a single state; only 13 respondents (3%) indicated that their agency was located in more than one state.
2 The Alliance for Children and Families and the Child Welfare League of America are national membership organizations of which many private child welfare agencies are members. The National Organization of State Associations for Children is a federation of state-level membership associations spanning 28 states (including D.C.). 3 For example, the request for study participation was forwarded to the 120 member agencies of the American Alliance for Children’s Residential Programs.

5
Table 2-1. State Location of NSPCFSA Agencies n % n %
California 63 14.13 Kansas 8 1.79 Indiana 43 9.64 New Jersey 8 1.79
Pennsylvania 41 9.19 South Carolina 8 1.79 New York 28 6.28 Minnesota 6 1.35 Kentucky 20 4.48 Connecticut 4 0.90
Texas 20 4.48 Hawaii 3 0.67 Arizona 19 4.26 Nebraska 3 0.67
Wisconsin 19 4.26 Oregon 3 0.67 Michigan 18 4.04 Alabama 2 0.45 Missouri 16 3.59 Maine 2 0.45 Florida 14 3.14 Tennessee 2 0.45 Ohio 13 2.91 Arkansas 1 0.22
Maryland 11 2.47 Louisiana 1 0.22 Georgia 9 2.02 New Hampshire 1 0.22
Massachusetts 9 2.02 New Mexico 1 0.22 North Carolina 9 2.02 Utah 1 0.22
Colorado 8 1.79 Washington 1 0.22 Iowa 8 1.79 Multiple States 13 2.91
Illinois 8 1.79 Unknown 2 0.45 2.5. Analytical Methods NSPCFSA data were first cleaned to ensure consistency and validity of responses to survey questions. This cleaning process included clarifying missing values and identifying outliers.4 Basic descriptive analyses were then conducted. Univariate analyses were used to describe full sample results for survey questions. For key variables, bivariate analyses were used to identify group-based differences based upon the following contrasts: Comparisons by organizational autonomy: independent agencies (n=376, 86%) vs.
confederated agencies (n=61, 14%). Comparisons by organizational auspices: nonprofit organizations (n=399, 92%) vs. for-
profit organizations (n=37, 8%). Comparisons in relation to median agency budget size: agencies whose most recent
annual operating budget was less than $7.425M (n=209, 50%) vs. agencies whose most recent annual operating budget was $7.5M or greater (n=210, 50%).
Comparisons in relation to median level of reliance on public contracts for child and family services: agencies that relied on government contracts for serving children and families for less than 79.51% of the agency’s income in the most recent fiscal year (n=213, 49%) vs. agencies that relied on government contracts for serving children and families for greater than 80% of the agency’s income (n=221, 51%).
Depending on measurement and normality considerations, mean differences were examined using ANOVA, Kruskal-Wallis, or Chi-Square tests.
4 For the analyses in this report, no data imputation strategies were utilized. Nor were any outliers transformed.

6
3. Respondent Characteristics We preface our presentation of NSPCFSA results with summary information on the characteristics of survey respondents. Respondents were asked about their years of experience in their current position and in the child welfare system as well as their educational background. On average, respondents had been in their current position for 10 years and had been employed in agencies serving child welfare-involved children and families for 24 years. Concerning their educational background, respondents were highly educated, with 84% of the sample (n=376) having at least one advanced degree. This group of highly educated respondents included 148 individuals (33%) with MSWs, 183 individuals (41%) with some other master’s degree, and 45 individuals (10%) with a doctoral degree.
4. Organizational Demographics Our statistical portrait of private child and family serving agencies begins with a presentation on the demographic characteristics of NSPCFSA agencies, including agency age, auspices, staff size and staff composition, service delivery context for NSPCFSA agencies, and whether agencies operate autonomously or as part of a confederation of multiple branch offices under a common agency name. We also provide information concerning whether agencies are members of the Alliance for Children and Families, Child Welfare League of America, and individual state associations representing child and family serving agencies; and agencies’ accreditation status. 4.1. Agency Age and Auspices On average, NSPCFSA agencies reported being in operation for 63 years and serving children and families for 62 years. In terms of their organizational auspices, 37 agencies (8%) were for-profit firms and 399 agencies (92%) held 501(c) tax status. 4.2. Staff Size A 9-point scale was used to determine the number of full-time staff that each agency employed in the most recent fiscal year; this scale ranged in value from “1” = “fewer than 10 FTEs” to “9” = “1,000 or more FTEs”. As can be seen in Figure 4-1, 44% of agencies (n=200) employed less than 100 full-time staff, 29% of agencies (n=130) employed 100-249 staff, and 26% of agencies (n=115) had 250 or more full-time employees.

7
Figure 4-1. Distribution of Full-Time Staff
We also examined whether average staff size values were related to agencies’ degree of organizational autonomy, auspices, budget size, and reliance on public contracts. Although detailed results are not provided in this report, analyses identified statistically significant differences in agency staff size for each of these four groups. Federated agencies and agencies with larger than average budget sizes employed more staff than independent agencies and agencies with smaller than average budget sizes. Nonprofit agencies and agencies reporting less reliance on public contracts for child and family services had larger staff sizes than for-profit agencies and organizations that relied more heavily on public child and family service contracts. 4.3. Staff Composition To assess the distribution of formal staff roles in study agencies, respondents were asked to report on the percentage of current employees who were frontline staff, supervisors, and administrators. As shown in Figure 4-2, agencies employed greater percentages of frontline staff than managerial staff. In more than three quarters of the agencies in our sample, supervisors and/or managers comprised 20% or less of total agency staff. Agency directors reported employing greater percentages of non-clinical frontline, clinical frontline, and other agency staff than supervisors or administrators.

8
Figure 4-2. Agency Employs 0-20% of Workers in this Role
Respondents also provided information concerning the distribution of agency employees who were non-Caucasian in racial and/or ethnic background. Non-clinical frontline staff were more likely to be of diverse racial/ethnic backgrounds than any other type of staff. As shown in Figure 4-3, a quarter of agencies (n=95) indicated that 50% or more of their non-clinical staff were non-Caucasian. In contrast, only 8% of agencies (n=34) indicated that a majority of their administrators belonged to non-Caucasian racial and/or ethnic groups. Figure 4-3. Percentages of Agencies with 50-100% Non-Caucasian Staff, by Role
4.4. Specialized Administrative Units and Staff Most agencies in the NSPCFSA sample reported employing specialized administrative units and/or staff. Seventy-four percent of agencies (n=327) employed a full-time chief financial

9
officer, 74% of agencies (n=328) had a quality assurance/quality improvement unit or manager, 64% of agencies (n=285) had an information technology department or manager, and 52% of agencies (n=228) had a program evaluation department or manager. It was not possible to determine whether there was overlap in these administrative units’ mandates or activities (e.g., whether the same unit or staff member conducted quality assurance/quality improvement and program evaluation for the agency). 4.5. Service Delivery Context Respondents were asked to indicate whether their agency served clients in rural, suburban/non-metropolitan, and/or metropolitan settings.5 Thirty-nine percent of agencies (n=172) were serving clients in rural settings, 60% of agencies (n=265) served clients in suburban/non-metropolitan settings, and 65% of agencies were serving clients in metropolitan settings (n=289). 4.6. Autonomous vs. Confederated Agencies Autonomous agencies constituted 86% of the study sample (n=376); only 14% of study agencies were confederated (n=61). As shown in Table 4-1, between-group comparisons of autonomous vs. confederated agencies indicate that confederated agencies were more likely than autonomous agencies to be for-profit and have budgets larger than the median (>$7.5 million). A significantly greater percentage were for-profit than non-profit in tax status (36% vs. 12%, respectively). Similarly, a greater proportion of confederated agencies had large rather than small budgets (16% vs. 7%, respectively). No statistically significant differences exist, however, in autonomous and confederated agencies’ degree of reliance on public contracts. Table 4-1. Differences between Autonomous and Confederated Agencies
Organizational Auspices Agency Budget Size Reliance on Public Contracts
Autonomous Nonprofit For-Profit Small Large Less More
88% 64% 93% 84% 87% 87% Confederated 12% 36% 7% 16% 13% 13%
χ2 = 16.41, p < 0.05 χ2 = 7.95, p < 0.05 χ2 = 0.00, ns 4.7. Membership in National and State Associations Concerning membership in national associations representing agencies serving children and families, 25% of agencies (n=100) were members of the Alliance for Children and Families and 32% of agencies (n=133) were members of the Child Welfare League of America. Nearly half the sample (45%, n=200) was a member of either national association. In contrast, a larger percentage of study agencies were members of one of the 28 registered state associations for private child and family serving agencies (92%, n=409). Table 4-2 provides information concerning agencies’ state association memberships for the 407 agencies for which we had information, listed in order of each association’s contribution to the study sample.
5 Agencies could note that they were serving clients in more than one geographic context.

10
Table 4-2. Agencies’ Memberships in State Associations for Children and Families (N=407) n % California Alliance of Child and Family Services 62 15.23 Pennsylvania Council of Children, Youth, and Family Services 42 10.32 Indiana Association of Residential Caring Agencies 41 10.07 New York Council of Family and Child Caring Agencies 25 6.14 Wisconsin Association of Family and Children's Agencies 21 5.16 The Children's Alliance of Kentucky 19 4.67 Michigan Federation for Children and Families 16 3.93 Arizona Council of Human Service Providers 14 3.44 Missouri Coalition of Children's Agencies 14 3.44 Texas Association of Leaders in Children and Family Services 12 2.95 Florida Coalition for Children 11 2.7 Ohio Association of Child Caring Agencies 11 2.7 Children's Alliance of Kansas 9 2.21 Children's League of Massachusetts 9 2.21 South Carolina Association of Children's Homes 8 1.97 Colorado Association of Family and Children's Agencies 7 1.72 Child Care Association of Illinois 7 1.72 Coalition for Family and Children's Services in Iowa 7 1.72 Maryland Association of Resources for Family and Youth 7 1.72 Minnesota Council of Child Caring Agencies 7 1.72 New Jersey Alliance for Children, Youth, and Families 7 1.72 North Carolina Children and Family Services Association 6 1.47 Georgia Association of Homes and Services for Children 5 1.23 Tennessee Alliance for Children and Families 5 1.23 Oregon Alliance of Children's Programs 3 0.74 Louisiana Association of Child Caring Agencies 2 0.49 Other Association Not Listed 30 7.37 Although the degree of overlap in agencies’ state and national association memberships was considerable, a large proportion of study agencies were members of a state association but not of either the Alliance for Children and Families or the Child Welfare League of America. As illustrated in Figure 4-4, 19 of 446 agencies (4%) were members of neither a state association nor a national association; 227 agencies (51%) were members of a state association but not a national association; 182 agencies (41%) were members of a state association as well as either the Alliance for Children and Families or the Child Welfare League of America; and 18 agencies (4%) were members of a national association but not a state association.

11
Figure 4-4. Overlap in Agencies’ Associational Memberships
4.8. Accreditation Nearly two thirds of the study sample (68%, n=298) was accredited by one or more bodies. Agencies reported being accredited through the Council on Accreditation (43%, n=191); the Joint Commission (7%, n=32); CARF International (6%, n=25); and/or another accrediting body (16%, n=71).6 Roughly a quarter of respondents (24%, n=106) noted that their agencies were required by state agencies to be accredited.
5. Funding Agencies serving child welfare-involved children and families rely upon public and private sources of revenue to carry out core organizational functions. This section presents information on agencies’ overall budget size and budget composition from different funding sources. We also review whether agencies contract with public child welfare agencies to deliver many or only a few different programs as well as whether agencies contract with different public and private entities. 5.1. Total Annual Operating Budget As of the current fiscal year, the average agency budget was $20.6M (median = $7.5M). This positively skewed distribution for agency budget size was due to the presence of a small number of agencies reporting very large budgets. A quarter of agencies had budgets up to $2.4M; another 25% of agencies had budgets between $2.4M and $7.5M. Turning to the upper two quartiles, 25% of agencies had budgets ranging from $7.5M to $17M; and the largest 25% of agencies’ budgets ranged from $17M to $140M. As noted in Section 4.6, compared to autonomous agencies, a significantly greater percentage of
6 Agencies could select more than one accreditation body.

12
confederated agencies had larger than median budgets. A marginally significant association exists between agency budget size and organizational auspices (χ2 = 2.82, p < 0.10), with nonprofit agencies more likely than for-profit firms to have had large budgets. No statistically significant relationship exists, however, between agencies’ budget size and their reliance on public contracts. 5.2. Sources of Revenue Respondents were asked to identify the approximate percentage of agency revenue in the most recent fiscal year from the following sources: government contracts for serving children and families; government contracts for other services; private fees for services rendered (e.g., client-paid services, or services that are reimbursed through insurance); foundation grants; donations from individuals and/or corporations; other earned income; and other sources. As can be seen in Figure 5-1, agencies relied upon government contracts for serving children and families for 69% of their current revenue. This percentage greatly exceeded that of the next largest sources of agency revenue, including government contracts for other services (8%), private fee-for-service income (6%), donations (6%), and foundation grants (5%). Figure 5-1. Composition of Revenue, Most Recent Fiscal Year
Given the importance of public child and family service contracts to NSPCFSA agencies, a closer look at the distribution of agencies’ dependence upon this revenue stream was warranted. As shown in Figure 5-2, only a quarter of agencies indicated that public child and family service contracts accounted for less than half (0-50%) of their annual revenue. Of the remaining 75% of agencies, 25% of agencies indicated that public child and family service contracts constituted 50-80% of annual revenue and another 25% of agencies reported relying upon public contracts for child and family services for 80-95% of their revenue. The remaining 25% of agencies were completely dependent upon public contracts for child and family services (95-100% of annual revenue).

13
Figure 5-2. Degree of Dependence on Public Contracts for Child and Family Services
011
5Fr
eque
ncy
0 20 40 60 80 100% Agency Revenue from Public Contracts for Child and Family Services
As mentioned previously, agencies’ reliance on public contracts for child and family services is not significantly associated with either organizational autonomy or agency budget size. However, significantly greater percentages of for-profit than nonprofit organizations were dependent upon public child and family service contracts for more than 80% of their annual revenue (81% vs. 48% respectively, χ2 = 14.24, p < 0.05). 5.3. Contracting with the Public Child Welfare Agency: Programmatic Area(s) As shown in Section 5.2, purchase of service contracting with public child welfare agencies is the major revenue source for the NSPCFSA study sample. To ascertain the specific programmatic area(s) in which contracting to deliver services occurred, respondents were asked to identify whether their agency currently contracted with any public child welfare agency for: child abuse prevention services (i.e., primary prevention) and/or family support services; CPS investigation or assessment; family preservation/in-home services; family reunification services; foster care placement services; residential treatment or congregate care; adoption services; foster parent recruitment; adoptive parent recruitment; independent living services; and counseling, therapy, or mentoring programs. Overall, 89% of agencies (n=396) had current contracts with public child welfare agencies in one or more of these 11 programmatic areas, and nearly half of agencies (47%, n=209) had contracts in two to five areas. Figure 5-3 identifies the proportion of NSPCFSA agencies’ expenditures in each of these different areas. Tracking expenditures in this manner allowed us to identify whether agencies focused their operations in one or multiple programmatic areas. As shown in Figure 5-3, study agencies with public child welfare contracts generally did not focus on delivering services in a single programmatic area but instead contracted to provide many different types of services. The vast majority of agencies (>70%) reported devoting less than a quarter of their overall expenditures to each of the following programmatic areas: child abuse prevention services; family reunification services; foster care placement services; residential treatment or congregate care; adoption services; independent living services; and counseling,

14
therapy, or mentoring programs. Figure 5-3. Percentage of Agencies with <25% Expenditures in Different Child Welfare Programs
0%
10%
20%
30%
40%
50%
60%
70%
80%
90%
100%
Agencies in which program is <25% of overallexpenditures
Child Abuse Prevention
CPS Investigation
Family Preservation
Family Reunification
Foster Care Placement
Residential/Congregate
Adoption
Foster Parent Recruit
Adoptive Parent Recruit
Independent Living
Counseling
Exceptions to this trend of diversified programming and generally low levels of expenditures across programmatic areas include foster care placement services and residential treatment/congregate care. NSPCFSA agencies reported relatively high levels of expenditures in both of these areas, particularly for residential/congregate programming. As seen in Figure 5-4, 130 of 241 agencies (55%) providing fiscal information indicated that residential treatment/congregate care accounted for more than half of their agency’s expenditures. Figure 5-4. Distribution of Agency Expenditures on Foster Care Placement Services and Residential Treatment/Congregate Care
55%
20%
14% 12%
24% 22%25%
30%
0%
10%
20%
30%
40%
50%
60%
0-24% 25-49% 50-74% 75-100%
Foster Care Placement Services Residential Treatment or Congregate Care

15
5.4. Contracting with the Public Child Welfare Agency: Use of Performance Contracting Agencies noted little use of performance contracting overall, with over three quarters of agencies (78%, n=347) having no performance contracts across the 11 areas of child welfare programming. Figure 5-5 identifies the percentage of agencies that were engaged in performance-based contracting with the public child welfare agency by programmatic area.7 Performance contracting was used most frequently in the areas of: foster care placement (14%, n=49), residential treatment/congregate services (11%, n=40), family preservation (8%, n=27), adoption services (8%, n=27), and adoptive parent recruitment (8%, n=25). Figure 5-5. Use of Performance Contracting by Programmatic Area
5.5. Contracting with County Public Child Welfare Agencies We also examined whether agencies contracted with one or more county-level public child welfare agencies. 24% of agencies (n=103) had no contracts with any county public child welfare agency, 15% of agencies (n=65) contracted with only one county public child welfare agency, and 61% of agencies (n=260) were contracting with more than one county public child welfare agency.8 5.6. Contracting with Other Public or Private Entities As can be seen in Figure 5-6, NSPCFSA agencies contracted with a variety of different public and private entities to support agency programming. Large proportions of agencies reported current contracts with public schools (45%, n=201), public mental health service authorities (44%, n=196), public juvenile justice agencies (35%, n=156), family and/or juvenile courts 7 A performance-based contract was defined for respondents as one in which agency revenue for service delivery depends at least partly upon the achievement of goals tied to client outcomes or other benchmarks. 8 The 103 agencies that were not contracting currently with any county public child welfare agency relied on public child and family service contracts for 66% of their current revenue, which suggests that these agencies may have been contracting with the state public child welfare agency rather than a county agency.

16
(30%, n=133), private mental health providers (25%, n=110), private child and family serving agencies within the immediate area (24%, n=106), private child and family serving agencies outside of the immediate area (16%, n=69), and public drug/alcohol service authorities (16%, n=69). Figure 5-6. Contracts with Other Public or Private Entities
6. Agency Service Array Meeting the needs of child welfare-involved children and families through the provision of a continuum of community-based services is a long-standing best practice in child welfare. Yet little is known about the range of services that private agencies have available for children and families either through in-house programming or via subcontracts with other agencies. This section presents information on the child welfare services, health and behavioral health services, and other services to children and families that NSPCFSA agencies provide directly and those that agencies access through contracts with other providers. 6.1. Direct and Indirect Provision of Child Welfare Services Respondents were asked to report whether their agency provided different child welfare services either directly (in-house) or indirectly (by contracting with other providers). These services included: screening, intake services, and/or emergency arrangements for placements and services; investigation/assessment of child maltreatment; ongoing services for cases in which children have not been removed from the home; ongoing services for cases in which children are removed from the home (where reunification is not a goal); reunification of children with birth parents or other permanency arrangements; pre-adoption or adoption services; and post-reunification services.9 9 Section 5.3 provided information concerning the programmatic areas in which private agencies contracted but not the specific services that agencies were currently providing.

17
As shown in Figure 6-1, over half of agencies provided ongoing out-of-home services (73%, n=304), screening, intake services, and/or emergency arrangements for placements and services (67%, n=283), reunification services (66%, n=272), and ongoing in-home services (57%, n=235). In contrast, few agencies provided any child welfare services through subcontract with another provider. With the exception of investigation/assessment of child maltreatment—which was neither provided frequently by private agencies nor accessed frequently via subcontract through other agencies—agencies were at least four times more likely to deliver child welfare services directly than via subcontract. Figure 6-1. Direct and Indirect Provision of Child Welfare Services
6.2. Agency Autonomy in Foster Care Decision Making Respondents were asked whether their agency had authority over its in-home services or foster care case management decisions. The public child welfare agency had authority over these decisions for 47% of agencies (n=200), 20% of private agencies (n=84) retained authority over in-home services or foster care case management decisions, and the remainder of the sample (33%, n=141) provided neither in-home services nor foster care case management programming. 6.3. Direct and Indirect Provision of Health and Behavioral Health Services Respondents were asked to identify whether their agency provided the following services to children and/or adults directly (in-house) or indirectly (by contracting with other agencies): substance abuse treatment services (“SATx”); physical health services (“health”); and mental health services. In contrast to the large percentage of agencies delivering different types of child welfare services identified in Section 6.1, considerably smaller proportions of agencies delivered health and behavioral health services either in-house or through subcontracts with other agencies. The only exception was mental health services, which a majority of agencies (80%, n=337) provided in house for children.10 Overall, as shown in Figure 6-2, agencies reported providing 10 100 of these 337 agencies (30%) also had a subcontract to deliver mental health programming for children.

18
more services for children either in-house or via subcontract than for adults. Figure 6-2. Direct and Indirect Access to Health and Behavioral Health Services
6.4. Direct and Indirect Provision of Other Social Services We also gauged whether agencies provided other social services frequently needed and utilized by child welfare-involved families, including: child care; respite care; parenting classes or support; domestic violence services; juvenile justice services; services for transition-age youth; employment assistance; housing assistance; income assistance; transportation assistance; and other wraparound or systems of care services. As can be seen in Figure 6-3, the percentage of agencies directly providing these family-centered services varied considerably. While over two-thirds of agencies provided supports for transition-aged youth (69%, n=289) and parenting classes (68%, n=283), less than a sixth of agencies reported providing income assistance to families (14%, n=54). Consistent with trends in other service areas, agencies that did provide these services were more likely to provide them in-house rather than via subcontract with other providers.

19
Figure 6-3. Direct and Indirect Access to Other Services
26%
54%
68%
19%
46%
69%
40%34%
14%
47%
62%
13%17%
22%17% 15%
18% 16%12% 11%
17%
25%
0%
10%
20%
30%
40%
50%
60%
70%
80%
Child Care
Respite
Parenting
Domestic Violence
Juvenile Ju
stice
Transition-A
ge
Employment
Housing
Income Support
Transporta
tion
Wraparo
und
Provide Directly Contract For
7. Inter-organizational Relationships This section presents information on NSPCFSA respondents’ perceptions of the general quality of their agency’s inter-organizational relationships as well as the current level of collaboration and competition between their agency and other public and private entities. We review agencies’ levels of collaboration around data sharing and information sharing, cross-training of staff, joint delivery of services to children and families, and budgeting or resource allocation. We also provide information concerning respondents’ perceptions of the level of interagency competition for public and private funding, staff, and clientele. 7.1. Quality of Relationship with Different Agencies Respondents were asked to rate the general quality of their agency’s relationships with different public and private entities. A 5-point scale was used whose values included “1” = “In general, this relationship is very poor”, “3” = “In general, this relationship is neither poor nor good”, and “5” = “In general, this relationship is very good”. As can be seen in Figure 7-1, respondents rated their relationships with nearly all types of agencies to be positive.

20
Figure 7-1. Quality of Relationship with Different Agencies
7.2. Collaboration: Data Sharing and Information Sharing Respondents were asked to identify the extent to which their agency collaborated with other public and private entities around data sharing and information sharing, using a 5-point scale where “1” = “No collaboration”, “3” = Some collaboration”, and “5” = Constant collaboration”.11 As can be seen in Figure 7-2, private agencies collaborated more intensively around data and information sharing with public child welfare agencies, the state association of private providers, and schools than with other types of agencies. In general, however, agencies’ level of collaboration in this area was modest. Figure 7-2. Collaboration around Data and Information Sharing
11 This 5-point Likert scale was used for other questions reviewed in Sections 7.3 through 7.5.

21
7.3. Collaboration: Cross-Training of Staff Respondents were asked to specify the extent to which their agency collaborated with other agencies in cross-training staff. In general and as can be seen in Figure 7-3, agencies engaged in little joint staff training. Respondents noted a higher level of cross-training staff with their state association of private providers than with other agencies. Figure 7-3. Collaboration around Staff Training
7.4. Collaboration: Joint Delivery of Services to Children and Families Respondents were also asked how much their agency collaborated with other agencies to jointly deliver services to children and families. As illustrated in Figure 7-4, private agencies engaged in higher levels of service-focused collaboration with public child welfare agencies, schools, mental health service providers, and local private child and family serving agencies than with other types of agencies, such as welfare offices, courts, or substance abuse treatment providers.

22
Figure 7-4. Collaboration around Service Delivery
7.5. Collaboration: Budgeting or Resource Allocation Finally, respondents were asked to note their agency’s current level of collaboration with other public and private entities around budgeting or resource allocation. As shown in Figure 7-5, study agencies collaborated rarely if at all with other agencies around budgeting or resource allocation. Figure 7-5. Collaboration around Budgeting
7.6. Competition for Public Funding Respondents were also asked how much their agency was currently competing with other public and private entities, using a 5-point scale where “1” = No competition”, “3” = “Some

23
competition”, and “5” = “Constant competition”. Overall, respondents perceived little interagency competition for public funding (from governmental sources). Yet as can be seen in Figure 7-6, a greater level of competition was noted with local and non-local private child and family serving agencies than with other agencies. Figure 7-6. Competition for Public Funds
7.7. Competition for Private Funding Respondents generally noted low levels of inter-organizational competition for private funding (e.g., from donors or fee-for-service activity). As shown in Figure 7-7, competition with local and non-local private service providers was perceived by respondents to be greater than competition from any other type of agency. Figure 7-7. Competition for Private Funds

24
7.8. Competition for Staff As with competition for public and private funding, respondents reported the highest levels of competition for staff from local private child and family serving agencies (Figure 7-8). Respondents also identified some competition for staff from public child welfare agencies and mental health service providers; however, little to no competition for staff was reported with any other types of agencies. Figure 7-8. Competition for Staff
7.9. Competition for Clientele Finally, while respondents perceived little overall competition for clients, Figure 7-9 suggests that the level of competition among local and non-local private child and family serving agencies was greater than that involving other types of agencies.

25
Figure 7-9. Competition for Clientele
8. Pressures on Organizational Maintenance Private child and family serving agencies often must manage competing pressures from funders, policymakers, courts, regulators, other service providers, and clients while seeking to maintain core agency operations. We begin this section by presenting information concerning the effect of private agencies’ relationship with public child welfare agencies. We then examine the effects of different internal and external pressures on NSPCFSA agencies’ efforts to develop new programs, deliver existing programs, train new frontline caseworkers, and partner with other agencies. 8.1. Relationship with the Public Child Welfare Agency: Effects on Private Agencies Respondents were asked what effect their agency’s relationship with the public child welfare agency had on their agency’s overall financial outlook; level of financial risk; financial outlook of agencies with which their agency contracts; development of new programs; delivery of long-standing programs; recruitment and retention of staff; ability to serve children and families well; and ability to meet key agency performance outcomes. Respondents used a 5-point scale whose values included “1” = “Our agency’s relationship with the public child welfare has made this area of our agency much worse”, “3” = “Our agency’s relationship with the public child welfare has made this area of our agency neither better nor worse”, and “5” = “Our agency’s relationship with the public child welfare has made this area of our agency much better”. As shown in Figure 8-1, respondents generally suggested that their agency’s relationship with the public child welfare agency had neither a positive nor a negative effect on most of their agency’s core operations.

26
Figure 8-1. Effects of Relationship with Public Child Welfare Agency
8.2. Internal and External Influences on the Development of New Programs Respondents were asked whether any of the following internal and external factors affected how their agency developed new programs in this past fiscal year: Changes in their agency’s financial outlook. Changes in reimbursement rates. Efforts to streamline agency operations. Pressures related to financial risk. Performance expectations embedded in contracts with public child welfare agencies. Analysis of data regarding agency performance/outcome achievement. State Child and Family Service Review findings and state Program Improvement Plans. Keeping ahead of other agencies. State regulations. Court requirements and/or consent decrees. Lawsuits involving their agency. Changes in the needs of children and families. Advice from experts and researchers. Feedback and input from families and clients served. Keeping abreast of best practices.
A 5-point scale was used whose values included “1” = “This had no influence at all”, “3” = “This had some influence”, and “5” = “This had a very strong influence”. As can be seen in Figure 8-2, the strongest influences on private agencies’ efforts to develop new programs included: changes in agencies’ financial outlook; pressures related to financial risk; staying abreast of best practices; changing reimbursement rates; efforts to streamline agency operations; and changing needs of children and families.

27
Figure 8-2. Effects on the Development of New Programming
8.3. Internal and External Influences on the Delivery of Long-Standing Programs Using the same 5-point scale, respondents were asked to identify how strongly these factors affected their agencies’ delivery of long-standing programs. As can be seen in Figure 8-3, program delivery was most influenced by private agencies’ efforts to stay abreast of best practices; changes in agencies’ financial outlook; changing reimbursement rates; pressures related to financial risk; and efforts to streamline agency operations. Figure 8-3. Effects on Program Delivery
8.4. Internal and External Influences on Frontline Staff Training Respondents suggested that their agencies’ efforts to train frontline caseworkers were somewhat

28
influenced by the search for best practices, changes in the needs of children and families, client feedback, and state regulations. Other factors did not appear to substantially affect private agencies’ frontline staff training operations (as perceived by respondents), as can be seen in Figure 8-4. Figure 8-4. Effects on Training of Frontline Caseworkers
8.5. Internal and External Influences on Interagency Relationships Finally, study agencies’ efforts to develop interagency relationships were weakly affected by the factors shown in Figure 8-5. Only one factor—staying abreast of best practices—was judged by respondents to be at least somewhat influential in interagency partnership development.
Figure 8-5. Effects on Formation of Interagency Alliances

29
9. Performance Measurement and Management Private child and family serving agencies are often required to document the performance of their publicly-funded programs by tracking client and programmatic outcomes. This section reviews information on respondents’ perceptions of how aware agency staff are of how agency performance is assessed, how performance expectations are shared with agency staff, and whether agencies’ performance management strategies are effective in improving child and family outcomes. 9.1. Perceptions of the Appropriateness and Adequacy of Performance Measurement Respondents were asked whether their agency’s performance was being evaluated using appropriate outcomes or contractual indicators. Fifty-eight percent of respondents (n=227) suggested that their agency’s performance was being evaluated correctly and 42% of respondents (n=163) disagreed with the metrics and/or evaluation methods being used currently to gauge agency performance. Respondents were also asked the extent to which their agency collected adequate data to assess performance regarding its services to children and families. Roughly two-thirds of respondents (65%, n=258) felt that their agency collected adequate amounts of performance data. 9.2. Staff Comprehension and Articulation of Performance Expectations As can be seen in Figure 9-1, the great majority of respondents (44%, n=175) noted that agency frontline staff had some understanding of the metrics upon which their agency’s performance is evaluated. In contrast, less than a tenth of respondents (8%, n=32) suggested that their frontline staff had no to little understanding of these performance measures. Figure 9-1. Degree of Frontline Understanding of Performance Measures
As can be seen in Figure 9-2, agencies were using a variety of methods to promote frontline staff

30
and supervisors’ understanding of agency performance measures and increase their awareness of the importance of monitoring and improving agency performance. Roughly two-thirds of agencies used: discussion in staff meetings (96%, n=382); frontline staff discussions with supervisors (80%, n=319); formal communication by agency leadership (74%, n=295); formal training in performance measures (70%, n=278); and written policies concerning performance outcomes (64%, n=255). Roughly a third of agencies (38%, n=151) involved their agency board of directors in performance reviews or discussions; and a small fraction of agencies (8%, n=32) used some alternate means to articulate performance outcomes to staff. Figure 9-2. Methods Used to Promote Understanding of Performance Measures
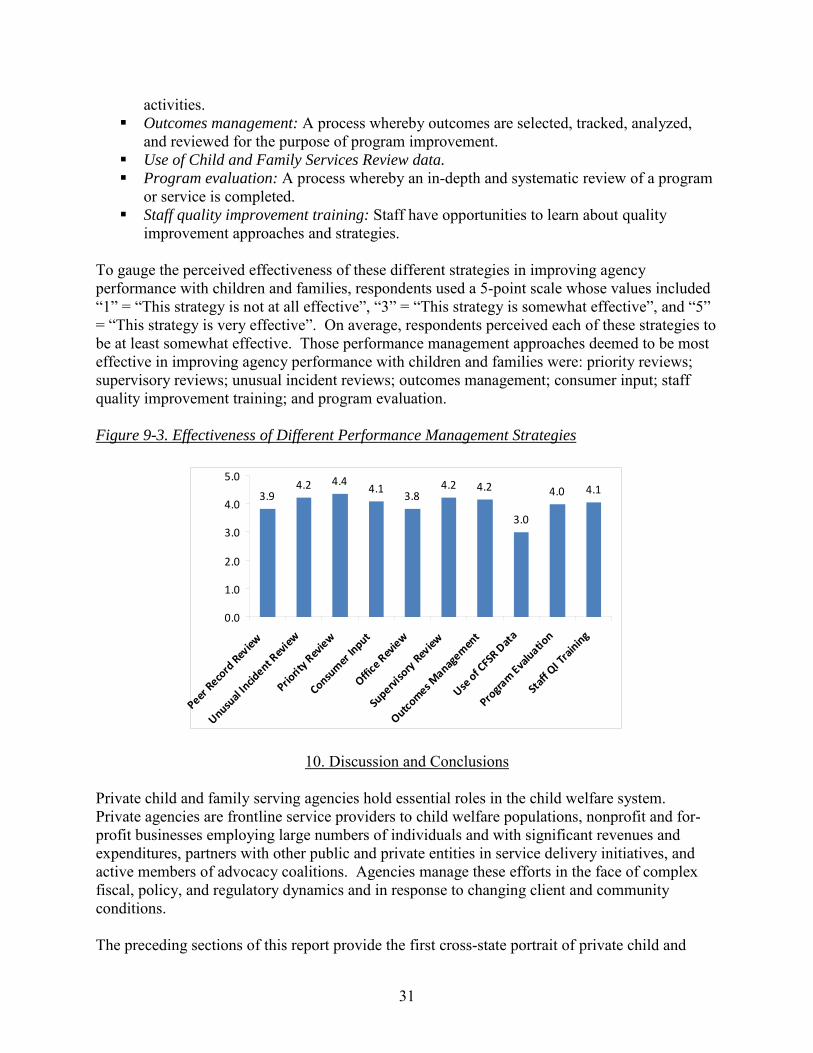
9.3. Effectiveness of Agency Performance Management Strategies Finally, Figure 9-3 summarizes respondents’ perceptions of the effectiveness of different strategies agencies may use to improve the performance of their child and family serving programs.12 These strategies include: Peer record review: Objective, trained peers review records to gauge agency compliance
with policies and quality of agency programs/services. Unusual incident review: Incidents are tracked, analyzed, and regularly reviewed to
assess trends and decrease risks. Priority review: Serious incidents (e.g., death, suicide attempt, felony charge) are
afforded a higher level of scrutiny and review. Consumer input: A process to gain input from key agency stakeholders (e.g., clients,
referral sources, and staff). Office review: A process of checking for the presence and use of necessary documents
(e.g., policy manuals, human resource documents, client rights). Supervisory review: A process of checking the frequency as well as the quality of
supervision of key processes and ensuring appropriate documentation of supervision 12 Respondents whose agencies did not use these strategies were omitted from this analysis.
31
activities. Outcomes management: A process whereby outcomes are selected, tracked, analyzed,
and reviewed for the purpose of program improvement. Use of Child and Family Services Review data. Program evaluation: A process whereby an in-depth and systematic review of a program
or service is completed. Staff quality improvement training: Staff have opportunities to learn about quality
improvement approaches and strategies. To gauge the perceived effectiveness of these different strategies in improving agency performance with children and families, respondents used a 5-point scale whose values included “1” = “This strategy is not at all effective”, “3” = “This strategy is somewhat effective”, and “5” = “This strategy is very effective”. On average, respondents perceived each of these strategies to be at least somewhat effective. Those performance management approaches deemed to be most effective in improving agency performance with children and families were: priority reviews; supervisory reviews; unusual incident reviews; outcomes management; consumer input; staff quality improvement training; and program evaluation. Figure 9-3. Effectiveness of Different Performance Management Strategies
3.94.2 4.4
4.13.8
4.2 4.2
3.0
4.0 4.1
0.0
1.0
2.0
3.0
4.0
5.0
Peer Reco
rd Rev
iew
Unusual
Incid
ent Rev
iew
Priorit
y Rev
iew
Consum
er In
put
Office
Rev
iew
Supervi
sory
Review
Outcomes M
anagem
ent
Use of C
FSR D
ata
Progra
m Evaluatio
n
Staff
QI T
raining
10. Discussion and Conclusions Private child and family serving agencies hold essential roles in the child welfare system. Private agencies are frontline service providers to child welfare populations, nonprofit and for-profit businesses employing large numbers of individuals and with significant revenues and expenditures, partners with other public and private entities in service delivery initiatives, and active members of advocacy coalitions. Agencies manage these efforts in the face of complex fiscal, policy, and regulatory dynamics and in response to changing client and community conditions. The preceding sections of this report provide the first cross-state portrait of private child and
32
family serving agencies’ internal and external environments. These survey results also document agencies’ key characteristics, service delivery arrangements, and efforts to manage organizational pressures and meet performance outcomes. In concluding the report, we review major study results and identify study limitations due to survey scope and research design. We then end with recommendations for researchers and practitioners. 10.1. Major NSPCFSA Results We organize major study results around the following nine themes. Theme 1: Agency leaders are experienced and highly educated. On average, respondents had been in their current position for 10 years and employed in agencies serving child welfare-involved children and families for 24 years. Respondents were also highly educated, with over 80% of the sample having at least one advanced degree. Theme 2: Agencies are mature, large, and have specialized administrative supports. On average, agencies had been operating for 63 years, and were predominantly located in metropolitan areas. Over half of agencies employed more than 100 FTEs, and most agencies had specialized administrative units or staff (e.g., chief financial officer, quality assurance/quality improvement unit/manager, information technology department/manager, program evaluation department/manager). Theme 3: Agencies are autonomous, strongly networked, and accredited. Most agencies operated autonomously rather than as part of a confederation of multiple branch offices under a common agency name. Nearly half of agencies were a member of either the Child Welfare League of America or the Alliance for Children and Families, and over 90% of agencies were members of their state association representing child and family serving agencies. Nearly two thirds of agencies held some type of accreditation. Theme 4: Agency budgets are large and disproportionately drawn from purchase of service contracts. The average agency budget was over $20M, with a median budget size of $7.5M. Agencies relied upon government contracts for serving children and families for 69% of their current revenue, with much smaller percentages from other government contracts (8%), private fee-for-service income (6%), donations (6%), and foundation grants (5%). Theme 5: Agencies have diversified contractual arrangements within and outside of child welfare. Agencies contracted to provide many different types of child welfare services (e.g., family reunification services, foster care placement services, residential treatment or congregate care, adoption services) and generally did not contract in only one programmatic area. Agencies also commonly contracted with more than one county public child welfare agency and with different public and private entities (e.g., public schools, public mental health service authorities, public juvenile justice agencies) to support their programming and service delivery. Theme 6: Agencies provide multiple types of child welfare, health and behavioral health, and social services. In terms of child welfare services, over half of agencies provided ongoing out-of-home services, screening/intake/emergency services, reunification services, and ongoing in-

33
home services. Concerning the provision of health and behavioral health services, although 80% of agencies provided mental health services for children, modest proportions of agencies provided other health, mental health, or substance abuse treatment services. Finally, over half of agencies provided supports for transition-age youth, parenting classes, wraparound or system of care services, and respite care. Most of these services were provided directly in-house by agencies rather than through subcontracts with other service providers. Theme 7: Agencies collaborate with other organizations and perceive low levels of competition for funding, staff, or clientele. Agencies reported modest levels of collaboration with other agencies around data/information sharing and joint service delivery, but significantly less collaboration around cross-training of staff and/or joint budgeting or resource allocation. Agencies reported low levels of competition with other organizations for public and private funding, staff, and clientele. When present, competition with other private child and family serving agencies (local or non-local) was perceived to be greater than competition from any other type of agency. In general, however, agencies perceived their relationships with nearly all types of agencies to be positive. Theme 8: Agencies face multiple internal and external pressures. A number of different internal and external pressures influenced agency efforts to develop new programs, deliver existing programs, train new frontline caseworkers, and/or partner with other agencies. The strongest pressures affecting agency operations were changes in agencies’ financial outlook, pressures related to financial risk, efforts to stay abreast of best practices, changing reimbursement rates, efforts to streamline agency operations, and efforts to respond to the changing needs of children and families. Agencies suggested that their relationship with the public child welfare agency had neither a positive nor negative effect on most of their agency’s core operations. Theme 9: Agencies use multiple methods to improve performance in serving children and families. Over half of agencies suggested that their agency’s performance with children and families was being evaluated using appropriate outcomes, indicators, and data. Agencies reported using a variety of methods to promote frontline staff and supervisors’ understanding of agency performance measures, including staff discussions, staff training, and written policies. Finally, performance management approaches deemed most effective in improving agency performance with children and families included different case review methods, outcomes management, consumer input, staff quality improvement training, and program evaluation. 10.2. Study Limitations These themes should be considered in relation to three major methodological limitations. First, the generalizability of NSPCFSA results may be limited due to study recruitment methods. Specifically, the recruitment of private agencies through national and state associations of private child and family serving agencies likely resulted in decreased survey response from non-member agencies and agencies located in states without these state associations. Related to this issue is the possibility of agency-based selection bias. Given the financial dues required for membership in these associations, large, well-funded agencies may have been more likely to participate in the study than other agencies. Therefore, NSPCFSA survey results may be most representative of large, private agencies located in states with well-organized associations of private child and

34
family serving agencies (and large child welfare populations). Second, the validity of survey responses may be limited due to issues of temporality, respondent knowledge, and agency type. Survey data were gathered from May 1-June 30, 2011, a period that coincided with the close of most state legislative sessions. Given the austere budget situations facing state human service agencies and the financial difficulties likely experienced by private agencies dependent upon public child welfare and human service contracts, it is possible that respondents were more negatively disposed towards public funders and public agencies than they might have been at other times. Additionally, while it was presumed that agency administrators could provide valid information on all areas under investigation, administrators may have had limited knowledge in essential areas. Finally, it is unclear whether confederated agencies responded from the perspective of their local branch office or as an entire federation. These limitations may have biased results significantly on some measures (although the direction and magnitude of such biases would be difficult to determine). Third, while not due to weaknesses in the study design per se, these major study results are also limited by their descriptive nature. This focus upon research for the purpose of description as opposed to research for the purpose of hypothesis testing or causal inference—whereby research is used to test the relationship between two or more processes and/or to identify cause-and-effect relationships—corresponds with the exploratory nature of the overall study and the goal of providing an initial portrait of the private child welfare sector. Yet this focus on descriptive research prevented the examination of issues of importance to child welfare researchers and practitioners. We identify some of these issues in the final two subsections of this report. 10.3. Recommendations for Research Despite these limitations, the current study provides important knowledge for child welfare, social policy, and organizational researchers. NSPCFSA constitutes the first systematic attempt to catalogue private child and family serving agencies’ characteristics, funding composition, service arrays, inter-organizational relationships, and efforts to manage intra- and extra-organizational contingencies. Although the findings summarized in Subsection 10.1 should be viewed as preliminary in nature due to the exploratory study design, this report as well as future planned research using NSPCFSA data should contribute to the small set of studies that investigate child welfare agencies as the unit of analysis (Mosley & Ros, 2011; Wells, 2006; Yang & Van Landingham, 2011). Our main recommendation for future research focuses upon identifying the implications of the organizational processes uncovered in this report for agency and client outcomes. Additional research is needed to investigate possible associations between major agency attributes (e.g., budget composition, institutional embeddedness), organizational processes (e.g., contractual arrangements, service array, inter-organizational collaboration and competition, and performance management strategies), and frontline service delivery and child and family outcomes. Recent studies have uncovered relationships between agency inter-organizational relationships and frontline service provision (Chuang & Wells, 2010; Wells, Chuang, Haynes, Lee, & Bai, 2011) as well as between contracting mechanisms, frontline service provision, and permanency outcomes (Chuang, Wells, Green, & Reiter, 2011; McBeath & Meezan, 2010). Certainly these

35
are areas in need of further study. In contrast, the following questions illustrate research topics for which little or no scholarship exists: What types of private agencies have more vs. less comprehensive service arrays? What
is the relationship between agencies’ service portfolios, funding composition, and the distribution of staff across the frontline, supervisory, and administrative levels?
Do children and families served by agencies with different service arrays and interagency networks have different service and permanency histories?
What relationships exist between inter-organizational collaboration and competition, private agencies’ make-or-buy decisions (to deliver services directly or via subcontract), and frontline service provision?
What mixture(s) of public and private funding may buffer agencies from different internal and external pressures? Do private agencies face greater child welfare system-related pressures if they are heavily dependent upon public child welfare funding or if they contract primarily with public child welfare agencies?
What is the relationship between private agencies’ institutional embeddedness and child and family service and permanency outcomes?
For what types of agencies is the presence of performance contracting associated with the use of different performance management strategies? In turn, which organizational management strategies are associated with achievement of contractually-specified performance milestones?
Do well-supported agencies (in terms of agency size, administrative resources, and accreditation status) perceive fewer internal and external organizational pressures than other agencies?
We plan to address some of these research questions using NSPCFSA. We also intend to examine a set of questions concerning cross-sector (public vs. private) differences in child welfare agencies. In size and geographical scope, NSPCFSA contrasts with prior child welfare agency studies, which have generally relied upon small samples of either private or public agencies that were geographically bounded within a single state or county child welfare system. NSPCFSA is also distinctive in its attention to private agencies’ contractual partnerships, provision of different child welfare services and other services, and collaborative and competitive efforts. In these methodological and substantive areas, NSPCFSA most closely approximates the National Survey of Child and Adolescent Well-Being Local Area Directors Interview (LADI), which gathered data from 86 child welfare agency administrators as part of a larger effort to understand factors impacting outcomes for families investigated for maltreatment in the U.S. (Dowd et al., 2010). Comparable survey items exist in NSPCFSA and LADI concerning agency demographics, fiscal expenditures, direct provision vs. subcontracting for different child welfare services, use of performance-based contracting, and inter-organizational collaboration. As LADI data are publicly available, overlapping survey coverage across NSPCFSA and LADI will allow us to conduct the first quantitative tests of public vs. private differences in these organizational domains. Because NSPCFSA did not include measures for child and family safety, permanency, or well-

36
being, it will not be possible to use study data to investigate cross-sector differences in child welfare outcomes. Yet such cross-sector comparisons are essential for understanding the performance of child welfare systems. If federal child welfare system outcomes can be conceived of as an aggregation of state-level child welfare system outcomes, then an argument can be made that state child welfare system outcomes can be understood to be a product of local public and private agency outcomes. Future testing for sector-based differences in child welfare outcomes may begin to clarify the organizational factors contributing to system performance.13 Research on public and private agencies’ workforce is also necessary. As the NSPCFSA survey instrument focused upon agency-based as opposed to staff-level processes, this report provides no information on staff interactions within private agencies or between public and private agency staff. At the managerial and frontline levels, relationships between public and private agencies have been characterized as either adversarial (McBeath & Meezan, 2006; Smith & Lipsky, 1993) or collaborative (Collins-Camargo, McBeath, & Ensign, in press; Van Slyke, 2007). Future research should examine in greater detail how private and public agency staff interact around contracting and service provision. Understanding the policies, processes, and norms shaping these interactions may help stakeholders optimize cross-sector relationships and better promote desired client outcomes. One additional recommendation for future research pertains to exploration of state-based and cross-system differences in child welfare agencies and their behavior. Analyses for the current report used the full sample and did not test for agency-based differences related to geography or jurisdiction. In-depth studies of agencies from carefully selected states may contribute knowledge regarding how private agencies contract and collaborate with public child welfare agencies and other entities. Research may also explore whether these agency activities correspond with state child welfare population demographics, child welfare policies and funding arrangements, and other state-level influences. We anticipate combining NSPCFSA and LADI data to examine these questions for private and public child welfare agencies. 10.4. Recommendations for Policy and Practice We conclude with recommendations for practitioners and policymakers. Our recommendations reflect not only major findings from the current study but areas of agreement in the child welfare and human service management scholarly literatures. Although crafted primarily for private agency administrators, these recommendations are also relevant to public child welfare agencies and other stakeholders with an interest in developing and sustaining effective public/private child welfare partnerships. Given the roles public and private agencies hold in the child welfare system as revealed in this study, our recommendations may be best addressed through joint efforts between the public and private child welfare sectors. Understand and Cultivate the Diversity within the Private Child and Family Serving Agency Sector Identify major similarities and differences between large and small agencies in terms of
agency resources, funding streams, service arrays, inter-organizational relations, and 13 For an example drawn from the welfare-to-work literature, see Heinrich (2000).

37
ability to manage external agency pressures. Consider the unique contributions of agencies of differing size to the service system, so as to optimize decisions regarding purchase of services to meet the needs of the diverse client population.
Reduce private agencies’ barriers to participation in national and state membership associations, in policymaking initiatives, and in contract development and procurement efforts.
Ensure that sector-wide advocacy and policy initiatives represent all private agencies, not just large, highly-networked agencies from large metropolitan areas.
Invest in Agency Administration Ensure that agencies have sufficient administrative expertise and resources to manage
current and anticipated fiscal, programmatic, interagency, and client challenges. Develop and implement executive succession and leadership development programs that
include training on fiscal management, contract procurement and management, strategic alliance development, and performance management.
Ensure that the benefits associated with specialized administrative supports are shared throughout the organization. For example, sharing QI/QA and/or program evaluation results with middle managers and frontline staff may help them serve children and families more effectively and efficiently.
Cultivate those administrative skills that prepare managers to collaborate effectively with public agencies, external systems, and policymakers in pursuit of systems of care that maximize use of limited resources and take advantage of the strengths of both the public and private sectors to meet client needs (Collins-Camargo, McBeath & Ensign, in press).
Build Capacity for Sustainable Cross-Sector Partnerships Explore the fiscal and programmatic implications of dependency on service contracts
with public child welfare agencies. Ensure that agencies’ contractual obligations are sustainable given existing agency
resources and staff expertise. Identify cost savings from linked contracts and programs that share common administrative, supervisory, and frontline staff.
Identify the benefits and challenges associated with agencies’ current service array, justify the value of each service (in terms of its responsiveness to client needs, fiscal impact, and contribution to agency distinctiveness), and identify service gaps in the agency and community. Where such gaps exist, consider subcontracting with other providers to access key services.
Support interagency partnerships that complement agency missions, increase access to critical client services, support programmatic and organizational innovation, and reduce balkanization among service providers.
Coordinate service networks across fields of practice (e.g., child welfare, mental health, substance abuse treatment, schools, and income support) using service integration models that expand access to care for children, youth, and families and that allow for experimentation with evidence-based service delivery models.

38
Focus Upon Agency Performance Identify the positive and negative consequences of agency pressures for fiscal, staff, and
client outcomes. Respond to these negative consequences (e.g., from diminished public revenue) by coordinating advocacy efforts with other agencies experiencing similar pressures.
Clarify for policymakers and public funders the impact that fiscal reductions and other agency pressures may have on agencies’ ability to serve client populations optimally.
Ensure that “agency performance” is captured in a way that is meaningful to clients, staff, and other agency stakeholders and use this information to improve stakeholders’ agency-based experiences. Engage in sustained discussion with the public sector, policymakers, and external partners regarding desired outcomes, performance indicators, and strategies for reaching performance targets.
Invest in multiple strategies to improve agency performance with children, families, and communities.
When developing purchase of service contracts and performance contracts with other public and private agencies, examine trends in client characteristics and service needs, and address barriers to agency performance prior to initiating programming.
We end with two final suggestions for practitioners, policymakers, and researchers. First, we note the considerable benefits of systematic cross-pollination—between practitioners and researchers; between diverse types of private agencies; and between the public and private child welfare sectors—for improving the evidence base for research and practice with private child and family serving agencies. Such cross-pollination should focus upon addressing questions of importance to child welfare systems and other linked human services. In nearly all jurisdictions, child welfare systems operate through a deliberate and historic partnership between public and private agencies. This partnership is ubiquitous, necessary, and paradoxically, poorly understood in crucial areas of study. Thus, child welfare systems should seek to bring diverse groups of stakeholders together to identify the contributions of and challenges facing private and public agencies. We believe that this process of cross-pollination may improve our understanding of different public-private service delivery arrangements and, in the long term, enhance our ability to develop system-level best practice models and evidence-based interventions that benefit child welfare populations and the agencies serving them. Finally, we argue for the importance of political leadership within the private child welfare sector and at the federal level for advancing knowledge of public-private child welfare partnerships. The current study could not have been completed without the strong assistance of the Child Welfare League of America, Alliance for Children and Families, and state associations for child and family serving agencies. Equally important has been the role of the federal government in supporting the QIC PCW over the past six years. With the QIC PCW ending its federally funded work September 2011, it will be important to identify new catalysts and funding sources for research and practice with private child and family serving agencies. To what extent might federal, state, and county governments, and/or national foundations, support research and practice improvements on public-private partnerships? A coordinated and well-supported strategy of knowledge building will be needed to improve privately-provided services to and outcomes for child welfare-involved children, youth, and families.

39
References Boris, E.T., De Leon, E., Roeger, K.L., & Nikolova, M. (2010). Human service nonprofits and
government collaboration: Findings from the 2010 National Survey of Nonprofit Government Contracting and Grants. Washington, D.C.: The Urban Institute.
Chuang, E., & Wells, R. (2010). The role of interagency collaboration in facilitating receipt of behavioral health services for youth involved with child welfare and juvenile justice. Children and Youth Services Review, 32, 1814-1822.
Chuang, E., Wells, R., Green, S., & Reiter, K. (2011). Performance-based contracting and the moderating influence of caseworker role overload on outcomes in child welfare. Administration in Social Work, 35, 1-22.
Collins-Camargo, C., Ensign, K., & Flaherty, C. (2008). The National Quality Improvement Center on the Privatization of Child Welfare Services: A program description. Research on Social Work Practice, 18, 72-81.
Collins-Camargo, C., McBeath, B., & Ensign, K.E. (In press). Privatization and performance-based contracting in child welfare: Recent trends and implications for social service administrators. Administration in Social Work.
Collins-Camargo, C., Sullivan, D., & Murphy A. (2011). Use of data to assess performance and promote outcome achievement by public and private child welfare agency staff. Children and Youth Services Review, 33, 330-339.
Dowd, K., Dolan, M., Wallin, J., Miller, K., Biemer, P., Aragon-Logan, E., Wheeless, S., Day, O., Suresh, R., & Smith, K. (2010). National Survey of Child and Adolescent Well-Being II: Data file user's manual restricted release version. Ithaca, NY: National Data Archive on Child Abuse and Neglect.
Heinrich, C.J. (2000). Organizational form and performance: An empirical investigation of nonprofit and for-profit job-training service providers. Journal of Policy Analysis and Management, 19, 233-261.
McBeath, B., & Meezan, W. (2006). Nonprofit adaptation to performance-based, managed care contracting in Michigan’s foster care system. Administration in Social Work, 30, 39-71.
McBeath, B., & Meezan, W. (2010). Governance in motion: Service provision and child welfare outcomes in a performance-based, managed care contracting environment. Journal of Public Administration Research and Theory, 20, i101-i123.
McBeath, B., Briggs, H.E., & Aisenberg, G.A. (2009). The role of child welfare managers in promoting agency performance through experimentation. Children and Youth Services Review, 31, 112-118.
Meezan, W., & McBeath, B. (2011). Moving towards managed care in child welfare: Perspectives on staff development, financial management, and information technology. Administration in Social Work, 35, 180-206.
Mosley, J.E., & Ros, A. (2011). Nonprofits in public child welfare: Their role and involvement in policy advocacy. Journal of Public Child Welfare, 5, 1-21.
Smith, B.D. (2009). Service technologies and the conditions of work in child welfare. In Y. Hasenfeld, Ed. Human services as complex organizations (2nd ed.) (pp. 253-268). Newbury Park, CA: Sage Publications.
Smith, S.R. (2002). Social services. In L.M. Salamon, Ed. The state of nonprofit America (pp. 151-188). Washington, D.C.: Brookings Institution Press.
Smith, S.R., & Lipsky, M. (1993). Nonprofits for hire: The welfare state in an age of

40
contracting. Cambridge, MA: Harvard University Press. U.S. Department of Health and Human Services. (2005). Federal Register, 70(107), 32825-
32838. Washington, D.C.: Author. Van Slyke, D.M. (2007). Agents or stewards: Using theory to understand the government–
nonprofit social services contracting relationship. Journal of Public Administration Research and Theory, 17, 157-187.
Wells, R. (2006). Managing child welfare agencies: What do we know about what works? Children and Youth Services Review, 28, 1181-1194.
Wells, R., Chuang, E., Haynes, L., Lee, I., & Bai, Y. (2011). Child welfare agency ties to providers and schools and substance abuse treatment use by adolescents. Journal of Substance Abuse Treatment, 40, 26-34.
Wright, V., & Radel, L. (2007). The privatization of child welfare services: Issues and efforts at the federal level. Professional Development: The International Journal of Continuing Social Work Education, 10, 7-13.
Yang, K., & Van Landingham, G. (In press). How hollow can we go? A case study of Florida’s efforts to outsource oversight of privatized child welfare services. American Review of Public Administration.