national registry of childhood tumours progress report, 2012
TRANSCRIPT

1
National Registry of Childhood Tumours
Progress Report, 2012
The contents of this report follow a scheme that was approved by the NCIN Children, Teenagers
and Young Adults Clinical Reference Group (CTYA CRG) in 2010.
1. Registration and Follow-up
The NRCT is population-based for cases of cancer diagnosed among children aged under 15 years in Great Britain (England, Scotland and Wales) from 1962 onwards. Since 1993 ascertainment of cases in Northern Ireland has also been virtually complete, hence the NRCT is population-based for the whole of the UK from 1993 onwards. Cases are ascertained from national and regional cancer registries throughout the UK, from specialist children’s tumour registries in certain regions of England, from death certificates throughout Great Britain, from entries to clinical trials, and from the paediatric oncology principal treatment centres affiliated to the CCLG throughout the UK. Registration data are also collected from the CCLG centre in Dublin, thus providing complete coverage of CCLG patients throughout the British Isles. Table 1.1 shows numbers of registered cases of cancer in the NRCT for children resident in Great Britain at diagnosis from 1962 to 2010, the latest year for which registration is virtually complete from all sources. Table 1.2 shows the numbers for the whole of the UK for 1993-2010. The diagnostic categories in Tables 1.1 and 1.2 are the 12 main groups of the International Classification of Childhood Cancer, Third Edition (ICCC-3). The NRCT now contains 68,572 registrations for children with cancer in Great Britain over the 49-year period 1962-2010, and 28,328 registrations for the UK over the 18-year period 1993-2010. At the time of writing, registration data for over 46,000 CCLG patients aged under 15 at diagnosis and diagnosed during 1977 onwards have been entered into the NRCT database. Throughout this report, numbers of CCLG registrations include registrations for non-malignant neoplasms and allied conditions in addition to those for cancers contained in ICCC-3, except where otherwise stated. Registration of CCLG patients up to 2010 is virtually complete and about 40% of registrations for 2011 have been processed. Table 1.3 shows all registered children under 15 years of age at diagnosis on the database, classified by CCLG centre and year of diagnosis. The centres at Nottingham and Leicester recently amalgamated to form a single East Midlands centre, and there is close co-operation between GOS and UCLH. Throughout this report, data are shown separately for each of these centres. Table 1.4 shows the same patients

2
classified by detailed diagnostic category and year of diagnosis. Table 1.5(i) shows the numbers of registrations for 2001-2005 by centre and broad diagnostic group. Overall, the two most frequent diagnostic groups were leukaemia (30%) and CNS tumours (22%). A similar pattern was found at most individual centres, but there were several exceptions. At Bart’s/Royal London, the equal largest groups were leukaemia and retinoblastoma (36%). CNS tumours outnumbered leukaemia by a considerable margin at Nottingham, but were hardly ever registered from Leicester, Bart’s/Royal London and Middlesex/UCLH. Bone tumours were the largest group at Middlesex/UCLH, accounting for 31% of registrations. Table 1.5(ii) shows similar data for 2006-2011. Registration from Bart’s/Royal London ceased in 2005. GOS, like Nottingham, had more registrations for CNS tumours than for leukaemia. Otherwise, there was little change from the patterns observed in 2001-2005.
Follow-up information is obtained from matching with population-based death notifications for
children dying of neoplasms in Great Britain, from flagging at the NHS Information Centre and
(especially for recently diagnosed patients and for those registered in Ireland) from direct
enquiry to CCLG centres.

3
Table 1.1 Numbers of registrations by ICCC-3 main diagnostic group. National Registry of Childhood
Tumours, Great Britain, 1962-2010
1962-2010 1962-1990 1991-2000 2001-2010
Leukaemias, myeloproliferative & myelodysplastic diseases
22143 12669 4695 4779
Lymphomas & reticuloendothelial neoplasms 7043 4032 1425 1586
CNS & miscellaneous intracranial & intraspinal neoplasms
16592 8977 3623 3992
Neuroblastoma & other peripheral nervous cell tumours
4433 2617 896 920
Retinoblastoma 1969 1118 429 422
Renal tumours 3947 2298 798 851
Hepatic tumours 609 295 138 176
Malignant bone tumours 2959 1748 5674 647
Soft tissue & other extarosseous sarcomas 4357 2306 1027 1024
Germ cell tumours, trophoblastic tumours & neoplasms of gonads
2109 1088 491 530
Other malignant epithelial neoplasms & malignant melanomas
2024 1023 479 522
Other & unspecified malignant neoplasms 387 202 93 92
Total 68572 38373 14658 15541
Table 1.2 Numbers of registrations by ICCC-3 main diagnostic group. National Registry of Childhood
Tumours, United Kingdom, 1993-2010
1993-2010 1993-2000 2001-2010
Leukaemias, myeloproliferative & myelodysplastic diseases
8859 3945 4914
Lymphomas & reticuloendothelial neoplasms 2828 1187 1641
CNS & miscellaneous intracranial & intraspinal neoplasms
7208 3084 4124
Neuroblastoma & other peripheral nervous cell tumours
1684 741 943
Retinoblastoma 781 345 436
Renal tumours 1542 664 878
Hepatic tumours 302 116 186
Malignant bone tumours 1137 475 662
Soft tissue & other extarosseous sarcomas 1908 853 1055
Germ cell tumours, trophoblastic tumours & neoplasms of gonads
944 401 543
Other malignant epithelial neoplasms & malignant melanomas
955 417 538
Other & unspecified malignant neoplasms 180 79 101
Total 28328 12307 16021

4
TABLE 1.3 CCLG REGISTRATIONS FOR CHILDREN AGED UNDER 15, BY CENTRE, 1977-2011
Diag Year
Centre 1977-
1978
1979-
1980
1981-
1982
1983-
1984
1985-
1986
1987-
1988
1989-
1990
1991-
1992
1993-
1994
1995 1996 1997 1998 1999 2000 2001 2002 2003 2004 2005 2006 2007 2008 2009 2010 2011 Total
Aberdeen 1 3 17 25 21 22 36 24 28 15 8 18 21 14 9 11 16 17 15 12 8 10 14 10 10 3 388
Barts/RLH 56 65 73 78 126 130 146 166 161 76 79 79 59 74 67 69 55 51 36 6 1652
Belfast 41 45 55 53 65 78 70 69 29 37 37 35 30 33 29 33 49 31 36 35 36 31 40 48 17 1062
Birmingham 95 160 182 188 221 253 279 301 293 170 151 152 161 144 142 141 170 165 191 158 150 174 168 174 172 96 4651
Bristol 81 101 124 111 123 151 175 146 194 123 114 105 99 110 79 86 103 92 89 89 101 96 113 111 92 34 2842
Cambridge 33 29 39 58 78 96 111 89 60 51 66 73 83 65 71 85 83 99 82 113 101 97 124 125 68 1979
Cardiff 45 57 67 72 59 76 82 81 82 53 45 44 56 71 48 57 56 47 33 62 66 55 73 52 51 16 1506
Dublin 12 81 100 132 139 132 126 163 82 69 79 98 91 100 119 115 120 129 99 113 122 128 142 84 2575
Edinburgh 20 25 24 44 63 64 49 54 70 42 36 53 42 44 47 51 68 49 58 47 44 39 54 48 29 18 1182
Glasgow 69 76 75 118 111 111 130 125 140 63 53 64 63 60 46 62 61 61 68 63 56 64 88 74 74 40 2015
GOS 203 235 309 306 275 282 257 296 381 193 188 210 155 187 157 145 214 176 184 180 197 203 219 183 154 58 5547
Leeds 84 109 109 108 129 150 169 183 187 98 90 91 107 90 97 108 108 92 88 81 97 88 87 89 85 36 2760
Leicester 18 39 51 31 49 36 41 23 19 15 21 15 28 23 26 20 30 23 33 26 24 21 22 5 639
Liverpool 70 94 76 88 101 99 116 124 141 76 89 70 77 85 77 84 100 84 109 90 80 83 83 79 83 49 2307
Manchester 131 183 177 185 158 183 173 182 229 124 120 122 97 122 111 134 117 136 104 123 112 104 120 107 131 48 3533
Middlesex/UCLH 1 4 23 50 25 24 32 46 36 40 30 36 40 44 43 28 39 42 43 36 13 675
Newcastle 55 104 110 110 119 124 120 134 128 69 78 78 71 73 80 91 90 70 85 87 92 65 82 72 73 37 2297
Nottingham 28 23 60 47 65 77 90 94 91 61 47 49 72 65 76 62 52 59 60 46 73 50 67 75 73 41 1603
Oxford 1 2 1 4 32 90 45 52 49 56 57 57 56 55 69 70 77 67 74 71 56 74 25 1140
Royal Marsden 71 99 83 90 80 113 113 129 115 70 83 83 111 90 116 109 125 84 88 128 109 111 151 148 140 60 2699
Sheffield 65 76 77 61 80 80 86 83 86 45 50 50 51 58 59 63 69 58 48 56 63 66 49 57 58 29 1623
Southampton 13 52 59 56 61 77 92 125 129 53 74 70 70 62 59 68 68 73 67 81 61 69 74 70 86 31 1800
Total 1087 1548 1795 1921 2088 2307 2476 2645 2957 1595 1557 1616 1641 1661 1593 1669 1822 1695 1726 1669 1698 1675 1835 1775 1700 724 46475

5
TABLE 1.4 CCLG REGISTRATIONS FOR CHILDREN AGED UNDER 15, BY DIAGNOSTIC GROUP, 1977-2011
Diag Year
DiagGpText 1977-
1978
1979-
1980
1981-
1982
1983-
1984
1985-
1986
1987-
1988
1989-
1990
1991-
1992
1993-
1994
1995 1996 1997 1998 1999 2000 2001 2002 2003 2004 2005 2006 2007 2008 2009 2010 2011 Total
Precursor-cell ALL 332 485 531 570 577 631 695 711 763 378 379 377 427 389 377 369 454 394 427 399 403 369 414 433 417 152 11853
Mature B-cell leukaemia 7 6 11 14 6 5 16 11 5 5 5 5 5 5 8 7 3 2 1 2 2 2 1 1 135
AML 77 86 108 101 127 125 135 120 155 68 81 75 66 85 69 74 81 89 82 70 76 71 77 87 75 35 2295
CML 4 7 5 10 15 8 15 5 8 5 6 13 4 6 7 4 8 13 6 3 11 13 5 7 4 3 195
MDS 1 3 1 3 6 9 21 11 10 12 7 15 11 5 9 11 3 4 8 3 8 5 5 1 172
JMML/CMML 2 4 8 6 10 7 8 10 7 2 6 10 4 12 6 7 5 9 10 15 4 5 6 4 2 1 170
Other and unspecified leukaemia 5 5 6 3 6 5 8 4 5 6 2 7 5 3 3 5 2 4 4 4 2 5 3 5 3 110
Hodgkin lymphoma 58 78 90 85 110 72 74 105 95 65 57 61 59 64 69 82 100 55 84 82 79 70 80 78 60 43 1955
NHL 84 115 111 117 131 152 154 162 153 93 74 92 103 93 91 79 100 73 83 82 89 82 100 83 81 28 2605
Other lymphoreticular 4 10 5 3 2 2 3 2 1 1 2 1 1 1 1 1 1 41
Ependymoma 15 19 20 27 23 33 38 35 49 30 22 29 32 27 32 27 31 30 32 22 27 37 36 31 29 15 748
Choroid plexus tumours 2 3 7 2 5 8 10 20 7 10 12 6 10 10 11 8 10 12 13 12 10 12 11 10 5 226
Low-grade astrocytoma 33 58 32 60 86 86 115 133 206 128 109 129 128 132 129 166 126 129 128 143 139 146 143 136 121 38 2979
High-grade astrocytoma 6 11 8 20 17 27 38 48 48 34 28 25 26 25 19 22 28 30 23 33 18 24 27 17 27 11 640
Unspecified astrocytoma 11 2 13 8 9 9 7 18 27 6 2 3 4 3 5 6 2 4 3 2 3 4 20 13 7 191
Medulloblastoma 42 58 65 71 59 66 73 98 100 48 52 51 54 56 49 51 64 60 62 54 62 49 47 52 64 26 1533
Other embryonal CNS 1 4 7 14 25 33 35 30 18 19 18 22 25 18 22 19 15 15 23 30 13 21 30 20 10 487
Other glioma 23 25 24 37 38 40 56 53 46 36 30 35 39 37 41 45 35 39 40 27 50 46 41 44 38 16 981
Pituitary adenoma and carcinoma 1 1 2 2 1 4 1 2 2 2 2 4 3 4 6 3 5 2 6 53
Craniopharyngioma 10 6 5 4 9 10 13 22 28 20 21 14 18 18 20 13 19 17 21 19 20 17 27 17 18 8 414
Pineal parenchymal tumours 6 3 6 5 4 6 3 3 10 2 2 5 6 5 4 4 5 4 7 6 6 5 2 3 5 3 120
Neuronal and neuronal-glial tumours 1 1 2 1 1 3 3 8 21 12 14 23 16 15 20 11 19 9 20 32 28 16 27 15 19 13 350
Meningioma 1 2 2 1 2 4 7 9 3 3 4 8 1 2 1 4 3 5 6 2 7 4 2 83
Unspecified CNS tumours 8 4 8 3 7 3 5 5 7 13 2 5 7 6 3 4 8 8 10 8 6 10 13 11 8 172
Neuroblastoma 71 106 162 151 149 210 212 195 176 92 101 97 103 110 78 106 106 121 88 104 81 100 95 101 104 50 3069
Other malignant peripheral nerve cell 2 2 2 3 1 2 2 1 2 3 1 1 1 3 2 2 2 32
Retinoblastoma 5 13 14 42 66 74 75 92 109 39 36 43 31 35 42 35 52 42 43 33 41 46 38 42 25 16 1129
Wilms Tumour 77 97 111 132 130 157 164 146 166 66 83 88 82 66 81 91 98 86 87 83 77 81 83 77 77 46 2532
Rhabdoid renal tumour 2 6 4 3 4 3 5 4 1 4 5 2 3 1 3 4 5 5 3 5 4 1 2 3 1 83
Renal sarcomas 1 3 3 6 6 9 3 4 8 2 2 4 2 3 5 4 5 4 2 3 4 2 5 6 1 2 99
Renal pPNET 1 1 2 2 2 1 2 3 1 1 1 1 18
Renal carcinoma 1 3 1 3 3 1 3 5 1 4 1 2 1 1 4 3 2 1 5 4 1 50
Unspecified malignant renal 1 1
Hepatoblastoma 11 8 15 13 15 19 14 21 27 8 16 13 9 9 15 20 16 19 16 15 22 19 11 14 15 16 396
Hepatic carcinoma 2 2 3 6 2 7 4 3 4 2 2 2 2 5 2 1 2 2 7 2 4 3 2 2 73
Unspecified malignant hepatic 1 1
Osteosarcoma 12 36 42 33 38 42 35 39 66 47 36 30 28 34 32 34 44 35 28 34 35 29 54 33 36 18 930
Chondrosarcoma 1 1 1 1 2 1 1 1 1 1 1 2 1 1 1 17
ESFT of bone 17 49 43 50 43 45 48 45 40 27 24 20 21 27 25 37 31 42 27 19 30 22 28 20 24 10 814
Other malignant bone 4 3 3 4 4 1 2 1 3 3 3 2 3 1 3 1 3 1 3 1 2 1 1 3 56
Rhabdomyosarcoma 46 82 100 111 117 124 117 128 134 62 65 55 51 58 55 45 52 71 65 60 38 54 54 62 59 30 1895
Fibrosarcoma, etc. 4 2 15 4 9 7 8 8 4 3 1 5 1 4 4 4 2 1 6 3 4 1 9 6 8 2 125

6
TABLE 1.4 CCLG REGISTRATIONS FOR CHILDREN AGED UNDER 15, BY DIAGNOSTIC GROUP, 1977-2011
Diag Year
DiagGpText 1977-
1978
1979-
1980
1981-
1982
1983-
1984
1985-
1986
1987-
1988
1989-
1990
1991-
1992
1993-
1994
1995 1996 1997 1998 1999 2000 2001 2002 2003 2004 2005 2006 2007 2008 2009 2010 2011 Total
MPNST 1 1 2 3 1 3 5 5 3 6 3 4 3 6 2 3 1 5 4 2 2 4 3 2 2 1 77
Kaposi sarcoma 1 1 3 5
Extraosseous ESFT 2 7 4 8 10 15 21 29 30 16 14 23 17 13 15 21 19 18 19 10 15 11 15 17 16 5 390
Extrarenal rhabdoid tumour 2 2 3 3 6 3 3 2 3 2 2 1 3 3 6 8 11 4 5 72
Fibrohistiocytic sarcomas 1 1 5 1 3 3 2 4 1 2 2 1 2 3 1 2 3 4 4 45
Synovial sarcoma 3 2 2 3 6 5 6 12 9 1 5 6 9 5 5 7 4 8 4 8 7 7 6 5 2 137
Other specified soft-tissue sarcomas 5 9 4 6 7 9 5 10 13 11 3 7 1 4 8 11 7 4 8 5 11 5 8 2 1 3 167
Unspecified soft-tissue sarcoma 8 8 2 11 6 11 10 6 5 9 6 9 3 4 4 8 6 6 7 5 3 7 7 5 5 2 163
Intracranial & intraspinal germ cell tumours 6 10 9 9 16 9 12 35 29 9 20 9 11 18 16 16 15 19 17 14 16 22 13 18 17 7 392
Other malignant extragonadal germ cell tumours 11 8 18 10 11 26 24 14 22 9 13 7 11 12 12 14 15 11 15 17 17 13 16 15 16 5 362
Gonadal germ cell tumours 18 23 27 30 46 37 26 26 35 26 21 22 14 21 22 20 14 12 14 17 19 23 24 19 23 5 584
Other malignant gonadal tumours 2 1 3 5 2 1 1 1 1 1 1 2 2 2 1 26
Adrenocortical carcinoma 4 3 4 3 3 1 1 6 2 2 2 2 4 2 5 7 1 3 2 1 3 1 1 63
Thyroid carcinoma 1 4 1 3 4 4 4 3 3 2 7 2 7 5 7 13 6 6 9 11 8 11 10 10 14 155
Nasopharyngeal carcinoma 4 6 7 5 5 5 1 7 3 3 4 2 3 3 3 1 5 4 1 5 4 2 3 1 87
Malignant melanoma 2 6 2 4 3 4 1 7 10 7 4 3 3 7 4 3 9 3 6 3 4 7 5 3 1 111
Skin carcinoma 1 1 1 1 2 1 2 1 1 2 1 1 2 1 18
Other carcinomas 5 2 7 8 4 10 8 4 11 6 9 6 7 5 6 4 8 1 8 6 5 7 7 4 9 3 160
Pancreatoblastoma 2 1 1 1 1 2 1 1 1 11
Pleuropulmonary blastoma 2 1 1 2 1 3 1 4 3 3 1 3 3 28
Other specified malignant 1 2 2 1 1 1 1 1 10
Unspecified malignant 2 1 5 3 2 4 4 1 1 1 1 1 1 27
Lymphoproliferative disease 1 1 4 3 3 3 4 4 3 3 4 3 4 1 3 1 3 48
LCH single system 10 15 20 22 27 26 30 33 47 23 30 38 27 28 32 25 37 30 24 33 30 34 39 4 664
LCH multi system 10 13 26 20 17 21 19 18 17 5 6 11 10 9 8 7 8 3 9 3 3 2 12 8 1 266
LCH unspecified 2 2 4 1 4 2 1 2 4 4 1 3 4 34 35 14 117
HLH 3 2 2 3 2 6 6 12 9 5 10 5 14 4 5 6 13 6 10 18 10 14 14 10 3 192
Ganglioneuroma 1 1 3 7 7 6 13 10 9 7 3 6 10 7 12 10 5 12 5 9 5 4 10 11 3 2 178
Other non-malignant peripheral nervous cell 3 1 2 3 5 2 3 3 4 6 5 2 2 2 4 2 2 2 3 1 4 5 2 68
Non-malignant embryonal renal 2 6 7 11 6 6 5 9 12 7 5 3 7 7 4 3 6 7 4 5 9 11 5 7 14 4 172
Non-malignant bone 1 1 1 5 3 3 3 4 2 2 1 1 5 1 3 1 5 2 4 1 2 4 6 7 2 70
Fibromatosis 1 4 3 4 6 7 10 3 6 10 4 5 7 5 6 10 5 5 4 3 10 9 10 6 143
NF & neurofibromatosis 3 4 3 4 13 8 9 11 11 6 5 11 12 7 8 7 12 7 2 9 10 12 6 15 5 200
Other non-malignant soft-tissue 3 3 8 4 12 9 8 13 22 8 6 11 22 14 19 11 13 11 15 20 20 30 33 23 43 8 389
Non-CNS non-gonadal non-malignant germ cell 5 10 17 8 13 10 13 17 27 16 16 7 14 15 18 13 18 13 19 10 13 24 18 23 16 3 376
Gonadal non-malignant germ-cell 1 1 6 4 7 6 17 12 13 12 15 14 13 15 16 18 11 20 14 12 17 13 21 14 15 2 309
Other non-malignant gonadal 1 2 2 2 3 5 7 4 8 4 4 8 5 6 4 7 5 4 6 8 7 7 12 4 125
Adrenocortical adenoma 2 2 2 1 2 2 2 3 3 1 3 1 3 2 2 4 2 2 2 2 1 2 46
Other non-malignant 1 3 2 4 4 6 5 7 3 12 7 16 6 12 10 10 4 8 11 6 10 12 16 8 9 192
Total 1087 1548 1795 1921 2088 2307 2476 2644 2957 1595 1557 1616 1641 1661 1593 1669 1822 1695 1726 1669 1697 1675 1835 1775 1700 724 46473

7
TABLE 1.5(i) CCLG REGISTRATIONS FOR CHILDREN AGED UNDER 15, BY CENTRE AND DIAGNOSTIC GROUP, 2001-2005
Centre Leukaemia Lymphomas CNS SNS Retino-
blastoma
Renal Hepatic Bone Soft tissue
sarcoma
Germ-cell etc Epithelial Other
malignant
Other non-
malignant
Total
Aberdeen 25 5 11 7 4 3 6 2 1 7 71
Barts/RLH 79 18 3 9 79 11 2 2 3 3 4 4 217
Belfast 56 21 37 9 2 20 3 7 12 3 1 1 6 178
Birmingham 244 64 164 40 79 41 11 25 45 25 17 70 825
Bristol 123 43 109 29 2 33 5 15 24 15 11 2 48 459
Cambridge 128 39 109 23 4 23 3 12 32 13 4 1 29 420
Cardiff 80 22 57 13 2 13 1 8 19 9 2 1 28 255
Dublin 184 65 87 50 7 39 11 32 46 11 4 2 44 582
Edinburgh 77 27 64 18 3 15 10 24 9 1 25 273
GOS 271 42 233 83 60 16 6 44 23 8 1 112 899
Glasgow 112 39 56 19 2 12 4 16 34 4 2 1 14 315
Leeds 144 61 100 24 4 19 5 20 23 15 8 54 477
Leicester 50 12 1 16 1 12 6 8 4 1 11 122
Liverpool 153 41 127 20 1 22 6 13 22 8 3 51 467
Manchester 182 52 136 32 3 40 6 30 37 17 13 1 65 614
Middlesex/UCLH 55 40 4 4 5 1 59 13 3 4 5 193
Newcastle 115 42 120 25 5 17 6 15 30 13 10 25 423
Nottingham 67 34 101 13 7 1 9 13 5 3 1 25 279
Oxford 101 25 92 24 22 1 11 21 6 6 18 327
Royal Marsden 152 73 141 36 40 9 16 26 18 10 13 534
Sheffield 81 26 69 15 11 18 4 14 13 12 7 24 294
Southampton 114 33 68 22 26 6 16 27 14 5 26 357
Total 2593 824 1889 531 205 499 101 345 522 232 124 12 704 8581

8
TABLE 1.5(ii) CCLG REGISTRATIONS FOR CHILDREN AGED UNDER 15, BY CENTRE AND DIAGNOSTIC GROUP, 2006-2011
Centre Leukaemia Lymphomas CNS SNS Retino-
blastoma
Renal Hepatic Bone Soft tissue
sarcoma
Germ-cell etc Epithelial Other
malignant
Other non-
malignant
Total
Aberdeen 16 4 10 7 4 1 2 4 2 1 4 55
Belfast 67 27 39 11 9 8 7 12 14 6 3 4 207
Birmingham 248 73 194 35 110 45 10 28 50 29 12 1 99 934
Bristol 153 42 123 40 5 27 6 28 43 20 9 51 547
Cambridge 179 55 125 35 7 28 3 13 39 29 9 106 628
Cardiff 100 19 79 15 1 14 3 9 25 6 8 34 313
Dublin 185 53 133 46 13 35 7 13 43 15 4 2 40 589
Edinburgh 70 10 70 12 1 13 1 7 9 3 3 33 232
GOS 276 65 281 67 9 76 11 2 54 29 3 1 140 1014
Glasgow 120 31 81 23 5 14 5 19 26 14 4 54 396
Leeds 127 51 102 38 2 22 8 23 29 23 6 51 482
Leicester 64 12 7 8 2 5 5 12 2 14 131
Liverpool 118 46 113 24 9 16 5 19 25 18 5 1 58 457
Manchester 168 68 133 33 5 28 7 27 47 18 11 77 622
Middlesex/UCLH 34 38 15 2 1 58 17 12 10 14 201
Newcastle 115 38 117 27 2 18 2 18 24 14 12 34 421
Nottingham 100 45 111 17 3 32 8 10 16 11 4 1 21 379
Oxford 114 35 99 20 7 13 2 10 12 12 4 38 366
Royal Marsden 241 90 163 41 48 10 15 41 19 15 3 33 719
Sheffield 100 39 69 15 3 19 4 11 15 5 4 1 37 322
Southampton 131 36 66 21 15 26 8 18 20 10 5 1 34 391
Total 2726 877 2130 537 208 492 108 347 565 295 133 12 976 9406

9
2. Patterns of Referral to CCLG Centres
The National Registry of Childhood Tumours receives copies of all notifications to cancer registries in the UK for children aged under 15 at diagnosis. By linking these records with CCLG (formerly UKCCSG) registrations the proportion of children initially referred to CCLG centres can be estimated as the proportion notified by cancer registration who have also been registered at diagnosis with the CCLG. Children with a CCLG registration who have not been notified through general (all ages) cancer registration cannot be included in these calculations as the number of non-CCLG patients who have also not been notified by cancer registration is unknown. Ascertainment by the Northern Ireland Cancer Registry is considered to be virtually complete only for 1993 onwards. Therefore, for continuity between calendar periods, the analyses of national data in Tables 2.1 and 2.2 refer to Great Britain only. Analysis by diagnostic group and age at diagnosis in Great Britain Table 2.1 shows the estimated proportions of children aged under 15 in the principal diagnostic groups who were registered with UKCCSG/CCLG during successive calendar periods. By 1998-2002, 90% of children with cancer were registered at diagnosis from a CCLG centre. Between the 1980s and 1990s there was a marked increase in percentage referred for CNS tumours and bone sarcomas. The only main diagnostic groups with a referral rate below 85% were epithelial tumours (two thirds of which were melanomas and carcinomas of the thyroid and skin) and the small and heterogeneous group of other and unspecified tumours. In 2008-10 the registration rate for retinoblastoma fell to 70% but this resulted from late registration for a time at one national referral centre rather than any decrease in the referral rate. Table 2.2 shows the estimated proportions referred by age group during successive calendar periods. The referral rate has always been relatively low for children aged 10 years and above, and especially for those aged 13-14, but the gap has diminished. Analysis by country and region of residence in the UK Table 2.3 shows the estimated proportions of children referred by region of domicile. In England, the classification is by Strategic Health Authorities. In the most recent years, at least 80% of children in every English region, Wales and Scotland were referred to UKCCSG/CCLG centres. The referral rate in Northern Ireland was considerably lower until recently, largely because referral of children with CNS tumours was only 11% in 1993-97 and 24% in 1998-2002, but this proportion increased to 56% in 2003-10.
Langerhans cell histiocytosis LCH is not routinely registered by cancer registries. A recent study from the BPSU, CCLG and Newcastle University estimated incidence per million child years in the UK and Ireland as 9.9 at age 0, 4.8 at age 1-4, 4.5 at age 5-9 and 1.8 at age 10-14 [Salotti et al., 2009]. Table 2.4 shows numbers of cases of LCH initially referred to a UKCCSG/CCLG centre in successive calendar periods with estimates of the referral rate based on expected numbers derived by applying the rates from this study to the child population of Great Britain. The estimated percentage of children with LCH who were referred to a UKCCSG/CCLG centre rose from 38% in 1978-82 to around 80% in 1998-2007 and 98% in 2008-10. Referral by centre and region of residence Table 2.5 shows the regions of residence for children registered at each centre during 1978-92, 1993-97, 1998-2002, 2003-2007 and 2008-2011. The great majority of children were treated at centres within their region of residence or an adjoining region. Referral patterns within South East England (London and South East Coast) have been complex but children have usually been referred to one of the London centres. In more recent years, a higher proportion of patients at GOS have been London residents and there has been a corresponding shift from GOS to Royal Marsden as the main referral centre for the South East Coast. Referral by Cancer Network (England and Wales) Since 2001, England has been covered by Cancer Networks, numbering 28 at the end of 2011, whose areas are each comprised of those of several Primary Care Trusts. A further three Cancer Networks cover Wales. Table 2.6 shows the CCLG centres from which children resident in each Cancer Network area were registered during 2001-2005 and 2006-2011. Retinoblastoma is excluded from this table because many children are registered from the two supraregional referral centres for this tumour. Thirteen of the 28 English Networks and all three Welsh Networks had more than 80% of their registrations from a single centre in both periods. More complicated referral patterns were seen in the remaining English Networks, predominantly in a large area of southern England including much of East Anglia, but also in the Severn valley and Humber and Yorkshire coast areas. In 2006-2011 there were a number of changes in referral from 2001-2005, many of which were direct, or presumed indirect, consequences of the cessation of paediatric oncology at Barts/RLH. In 2001-2005, Barts/RLH accounted for 37% of referrals in NE London and 6-11% of those in North London and Essex. In 2006-2011, those components of referral seem largely to have moved to GOS in North East and North London and to UCLH in Essex. For NW London, GOS and UCLH both saw increases in registrations while registration of children from this Network ceased at Royal Marsden. The increase in referrals to GOS from the Networks mentioned above was offset by reductions in referrals from Anglia (with corresponding increase at Cambridge) and from SE London, Kent & Medway and Sussex (with increases mainly

at Royal Marsden). In Sussex, a reduction in referral to Southampton was also balanced by an increase at Royal Marsden. Referral by Health Board (Scotland) Table 2.7 shows CCLG centre of non-retinoblastoma registrations by Health Board for 2001-2011. As in the analysis of referral by Cancer Network, centres with fewer than 5% of the registrations for a Health Board are not shown. Most Health Boards had at least 80% of their registrations at a single centre. The exceptions were Central (Forth Valley), Highland and Orkney. Irish Republic Individual cancer registration records are not received from the Irish Republic. Table 2.8 shows estimated referral rates for 1994-2000 based on published data from the National Cancer Registry of Ireland (Stack et al, 2007). Referral rates were lower than in the UK overall and for several diagnostic groups, notably leukaemia, CNS tumours and retinoblastoma. Table 2.9 shows CCLG registrations for 2001-2009. The annual number of registrations was 112 compared with 77 in 1994-2000. The size of the population at risk was similar during the two periods. The annual numbers of CCLG patients in 2001-2009 and cancer registrations in 1994-2000 were very similar for leukaemias, lymphomas, retinoblastoma and bone tumours. There were more CCLG registrations than cancer registrations for several diagnostic groups, notably neuroblastoma etc., renal tumours, hepatic tumours and soft tissue sarcomas, indicating increased incidence for these groups. For CNS tumours, germ-cell and gonadal tumours, epithelial tumours and other and unspecified tumours, the annual number of CCLG patients in 2001-2009 was lower than the annual number of cancer registrations in 1994-2000, suggesting that incidence has decreased or referral to CCLG was incomplete.

12
Table 2.1 Percentages of children aged under 15 with cancer or non-malignant CNS tumour initially referred to UKCCSG/CCLG, classified by diagnostic group. Great Britain 1978-2010
Diagnostic Group Year of diagnosis 1978-82 1983-87 1988-92 1993-97 1998-2002 2003-2007 2008-2010 I Leukaemia 69 81 86 92 94 97 96 Lymphoid 70 83 88 92 95 98 97 AML 71 81 87 98 97 95 93 CML 43 67 68 69 75 95 100 JMML/CMML 65 100 100 100 94 98 91 Myelodysplasia - - 78 70 69 63 41 Other & unspecified 43 32 38 66 79 80 72 II Lymphomas 69 78 84 91 92 92 93 Hodgkin lymphoma 64 72 77 89 93 96 95 NHL & other lymphoma 74 83 88 92 92 88 90 III CNS etc 32 41 56 81 89 89 87 Choroid plexus tumours 16 44 59 88 89 95 90 Ependymoma 30 47 63 90 93 93 93 Astrocytoma 26 40 54 82 90 91 89 Embryonal 49 56 71 94 98 96 97 Other gliomas 31 39 55 81 92 93 90 Craniopharyngioma 22 15 40 72 86 92 87 Other CNS 26 21 27 56 62 71 64
- Fewer than 10 children with cancer registrations in this category

Table 2.1 (continued)
Diagnostic Group Year of diagnosis 1978-82 1983-87 1988-92 1993-97 1998-2002 2003-2007 2008-2010 IV Neuroblastoma etc 79 93 95 99 99 98 95 Neuroblastoma 81 93 95 99 99 98 95 V Retinoblastoma 10 68 84 94 92 92 70 VI Renal tumours 75 91 93 97 98 99 98 Wilms tumour etc 75 91 93 97 99 99 98 Renal carcinoma - - - 83 - 73 - VII Hepatic tumours 65 75 83 96 93 96 93 Hepatoblastoma 71 83 91 98 97 100 94 Hepatic carcinoma 45 53 63 - 71 88 - VIII Bone tumours 48 66 66 91 94 95 88 Osteosarcoma 41 58 57 92 95 96 92 Ewing sarcoma of bone 59 78 83 97 96 98 97 All other malignant bone 32 45 25 50 63 50 19 IX Soft tissue sarcomas 67 81 84 88 88 88 91 Rhabdomyosarcoma 77 90 94 97 98 98 98 Fibrosarcoma etc 51 49 61 63 74 68 76 Extraosseous ESFT 85 88 91 96 99 97 95 Synovial sarcoma 33 60 75 81 82 78 88 All other specified 45 54 52 68 58 69 76
- Fewer than 10 children with cancer registrations in this category

Table 2.1 (continued)
Diagnostic Group Year of diagnosis 1978-82 1983-87 1988-92 1993-97 1998-2002 2003-2007 2008-2010 X Germ-cell and gonadal 49 63 71 84 87 87 90 CNS germ-cell 39 36 63 88 85 96 91 Other non-gonadal germ cell 69 94 82 85 92 86 85 Malignant gonadal germ-cell 50 76 75 81 86 80 95 All other malignant gonadal - 21 - - - - - XI Epithelial 27 19 23 28 41 42 44 Adrenocortical carcinoma 77 42 - - 100 - - Thyroid carcinoma 21 19 36 41 56 69 78 Nasopharyngeal carcinoma 58 86 58 92 - 95 - Malignant melanoma 10 6 11 13 33 28 31 Skin carcinoma 9 2 0 4 4 6 7 Other carcinoma 29 22 29 35 40 40 43 XII Other & unspecified 33 41 21 15 39 18 12 Total 57 69 76 87 90 91 90
- Fewer than 10 children with cancer registrations in this category.

15
Table 2.2 Percentages of children with cancer or non-malignant CNS tumour initially referred to UKCCSG/CCLG, classified by age at diagnosis, Great Britain 1978-2010
Year of diagnosis Age at diagnosis 1978-82 1983-87 1988-92 1993-97 1998-2002 2003-2007 2008-2010 0-9 62 74 81 90 93 93 91 10-12 54 63 68 81 88 86 87 13-14 35 45 51 70 79 84 83 Total 57 69 76 87 90 91 90

Table 2.3 Percentages of children in the UK with cancer or non-malignant CNS tumour initially referred to UKCCSG/CCLG, classified by country of domicile, and Strategic Health Authority (SHA) within England, 1978-2010
Region 1978-82 1983-87 1988-92 1993-97 1998-2002 2003-2007 2008-2010 North East 72 81 87 92 95 97 96 North West 78 79 83 91 95 94 93 Yorks & Humber 70 74 88 91 95 92 93 East Midlands 48 74 83 88 92 92 91 West Midlands 55 75 83 92 96 96 95 East of England 57 65 74 90 91 91 95 London 50 59 63 82 86 88 80 South East Coast 53 64 69 85 88 86 85 South Central 39 47 57 79 89 91 89 South West 52 64 78 86 87 89 91 England 58 69 76 88 91 90 90 Wales 60 64 77 76 84 86 96 England & Wales 58 68 76 87 91 91 90 Scotland 43 74 75 83 87 91 95 Great Britain 57 69 76 87 90 91 90 N Ireland 60 63 72 73 UK 86 90 90 90

Table 2.4 Expected numbers of incident cases of children with LCH and estimated percentage initially referred to UKCCSG/CCLG, Great Britain 1978-2010
Expected numbers are based on the incidence rates given by Salotti JA, Nanduri V, Pearce MS, Parker L, Lynn R, Windebank KP. Incidence and clinical features of Langerhans cell histiocytosis in the UK and Ireland. Arch Dis Child. 2009;94:376-80
Year of diagnosis
1978-82 1983-87 1988-92 1993-97 1998-2002 2003-2007 2008-2010 Expected 220 210 217 221 215 208 128 UKCCSG/CCLG (%) 84 (38) 95 (45) 109 (50) 166 (75) 175 (81) 166 (80) 125 (98)

Table 2.5(i) Region of residence by centre for children in CCLG Register 1978-1992
Centre North East North
West
Yorks/
Humber
East
Midlands
West
Midlands East Anglia London
South East
Coast
South
Central
South
West Wales Scotland
Northern
Ireland
Channel
Islands Isle of Man Ireland BFPO Total
Aberdeen 148 148
Barts/RLH 8 39 24 29 14 201 240 106 79 27 19 8 12 2 7 5 820
Belfast 1 1 405 407
Birmingham 1 5 68 1536 3 2 1 5 5 18 1 1 1 1647
Bristol 1 3 1 7 960 4 2 1 3 982
Cambridge 16 423 4 1 444
Cardiff 1 1 526 528
Dublin 722 722
Edinburgh 2 1 335 2 340
Glasgow 1 1 1 789 2 794
GOS 2 2 40 2 582 770 460 156 34 1 10 1 30 2090
Leeds 8 6 987 4 1 1006
Leicester 221 1 1 1 224
Liverpool 565 1 3 145 22 2 738
Manchester 1279 6 27 2 1 1 4 1320
Middlesex/UCLH 1 7 15 5 28
Newcastle 753 104 12 1 3 873
Nottingham 6 469 1 1 1 478
Oxford 3 1 35 1 40
Royal Marsden 1 1 6 5 23 296 312 88 13 2 1 1 11 1 761
Sheffield 446 142 1 2 591
Southampton 1 1 1 16 364 131 17 4 535
Total 772 2004 1486 1028 1570 1242 1327 901 740 1172 718 1288 418 32 22 745 51 15516
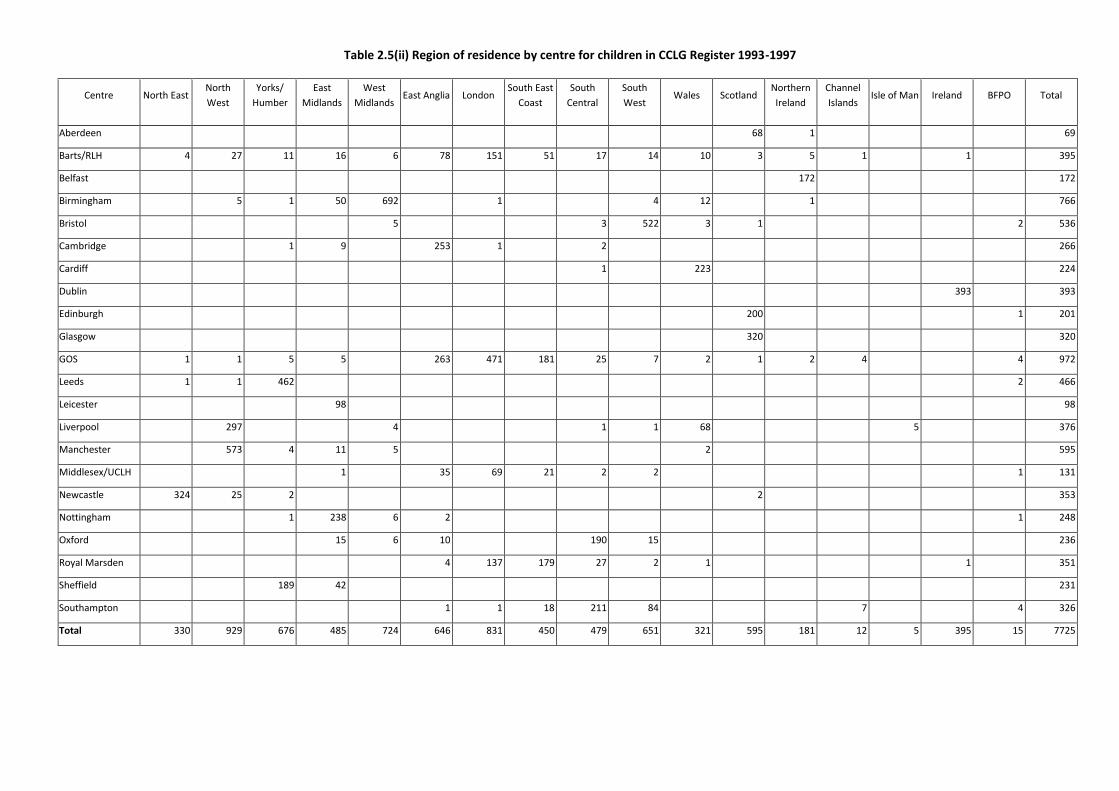
Table 2.5(ii) Region of residence by centre for children in CCLG Register 1993-1997
Centre North East North
West
Yorks/
Humber
East
Midlands
West
Midlands East Anglia London
South East
Coast
South
Central
South
West Wales Scotland
Northern
Ireland
Channel
Islands Isle of Man Ireland BFPO Total
Aberdeen 68 1 69
Barts/RLH 4 27 11 16 6 78 151 51 17 14 10 3 5 1 1 395
Belfast 172 172
Birmingham 5 1 50 692 1 4 12 1 766
Bristol 5 3 522 3 1 2 536
Cambridge 1 9 253 1 2 266
Cardiff 1 223 224
Dublin 393 393
Edinburgh 200 1 201
Glasgow 320 320
GOS 1 1 5 5 263 471 181 25 7 2 1 2 4 4 972
Leeds 1 1 462 2 466
Leicester 98 98
Liverpool 297 4 1 1 68 5 376
Manchester 573 4 11 5 2 595
Middlesex/UCLH 1 35 69 21 2 2 1 131
Newcastle 324 25 2 2 353
Nottingham 1 238 6 2 1 248
Oxford 15 6 10 190 15 236
Royal Marsden 4 137 179 27 2 1 1 351
Sheffield 189 42 231
Southampton 1 1 18 211 84 7 4 326
Total 330 929 676 485 724 646 831 450 479 651 321 595 181 12 5 395 15 7725
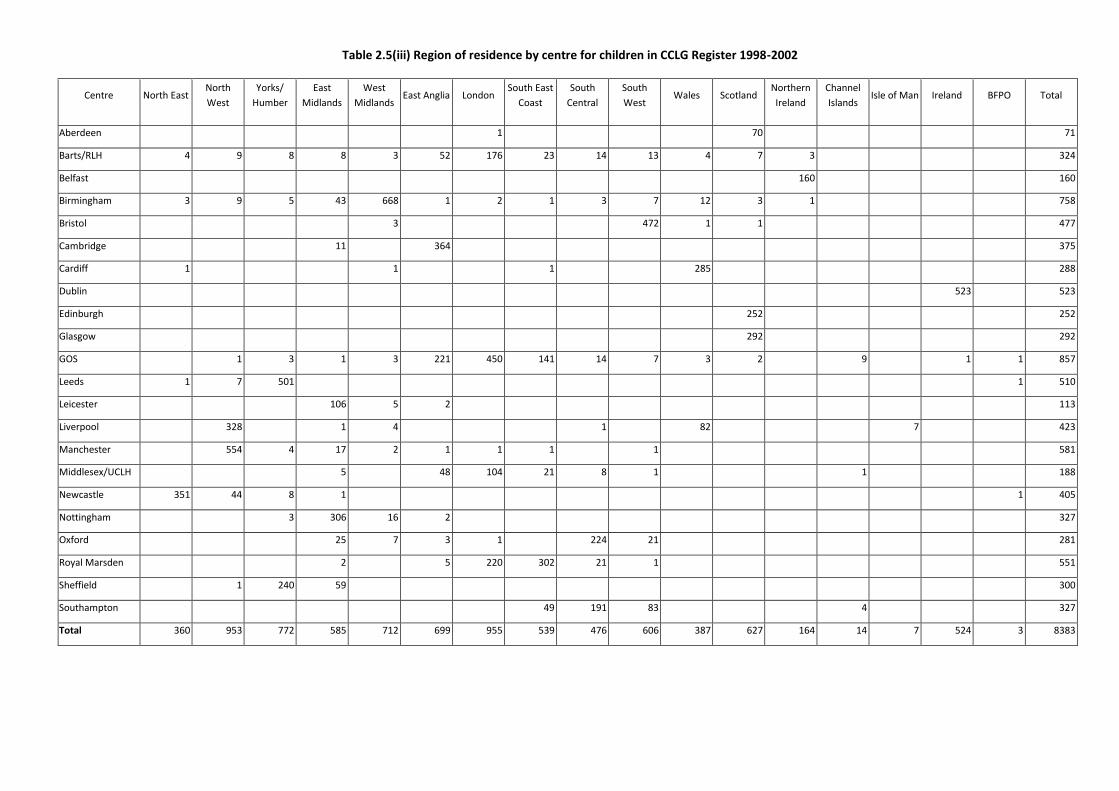
Table 2.5(iii) Region of residence by centre for children in CCLG Register 1998-2002
Centre North East North
West
Yorks/
Humber
East
Midlands
West
Midlands East Anglia London
South East
Coast
South
Central
South
West Wales Scotland
Northern
Ireland
Channel
Islands Isle of Man Ireland BFPO Total
Aberdeen 1 70 71
Barts/RLH 4 9 8 8 3 52 176 23 14 13 4 7 3 324
Belfast 160 160
Birmingham 3 9 5 43 668 1 2 1 3 7 12 3 1 758
Bristol 3 472 1 1 477
Cambridge 11 364 375
Cardiff 1 1 1 285 288
Dublin 523 523
Edinburgh 252 252
Glasgow 292 292
GOS 1 3 1 3 221 450 141 14 7 3 2 9 1 1 857
Leeds 1 7 501 1 510
Leicester 106 5 2 113
Liverpool 328 1 4 1 82 7 423
Manchester 554 4 17 2 1 1 1 1 581
Middlesex/UCLH 5 48 104 21 8 1 1 188
Newcastle 351 44 8 1 1 405
Nottingham 3 306 16 2 327
Oxford 25 7 3 1 224 21 281
Royal Marsden 2 5 220 302 21 1 551
Sheffield 1 240 59 300
Southampton 49 191 83 4 327
Total 360 953 772 585 712 699 955 539 476 606 387 627 164 14 7 524 3 8383

Table 2.5(iv) Region of residence by centre for children in CCLG Register 2003-2007
Centre North East North
West
Yorks/
Humber
East
Midlands
West
Midlands East Anglia London
South East
Coast
South
Central
South
West Wales Scotland
Northern
Ireland
Channel
Islands Isle of Man Ireland BFPO Total
Aberdeen 62 62
Barts/RLH 4 2 1 14 54 8 4 3 1 1 1 93
Belfast 1 186 187
Birmingham 11 17 7 62 694 4 1 4 8 17 12 1 838
Bristol 6 1 1 458 1 467
Cambridge 14 455 2 2 2 475
Cardiff 1 2 260 263
Dublin 1 582 583
Edinburgh 1 236 237
Glasgow 1 311 312
GOS 2 2 3 1 209 581 122 11 1 2 2 1 3 940
Leeds 1 2 438 2 1 1 445
Leicester 121 7 3 1 132
Liverpool 340 6 86 13 1 446
Manchester 565 9 3 2 579
Middlesex/UCLH 42 126 21 4 1 194
Newcastle 349 40 7 1 1 1 399
Nottingham 271 17 288
Oxford 21 3 6 5 286 35 1 357
Royal Marsden 2 184 304 30 520
Sheffield 1 224 63 1 1 1 291
Southampton 1 23 212 104 11 351
Total 364 970 680 567 739 739 955 482 555 611 368 625 189 12 13 586 4 8459

Table 2.5(v) Region of residence by centre for children in CCLG Register 2008-2011
Centre North East North
West
Yorks/
Humber
East
Midlands
West
Midlands
East Anglia London South East
Coast
South
Central
South
West
Wales Scotland Northern
Ireland
Channel
Islands
Isle of Man Ireland BFPO Total
Aberdeen 37 37
Barts/RLH
Belfast 135 135
Birmingham 4 17 20 41 499 4 4 14 6 1 610
Bristol 349 1 350
Cambridge 7 1 388 10 3 409
Cardiff 1 1 190 192
Dublin 354 354
Edinburgh 1 148 149
Glasgow 276 276
GOS 1 1 3 1 146 391 54 11 2 1 1 1 1 614
Leeds 2 293 1 1 297
Leicester 63 6 2 1 72
Liverpool 208 1 9 68 1 5 2 294
Manchester 393 3 7 2 1 406
Middlesex/UCLH 41 72 19 2 134
Newcastle 232 25 6 1 264
Nottingham 2 244 9 1 256
Oxford 7 1 7 6 1 176 28 226
Royal Marsden 7 185 291 16 499
Sheffield 153 39 1 193
Southampton 1 14 146 80 20 261
Total 236 646 478 412 529 593 667 383 356 465 274 470 136 21 5 356 1 6028
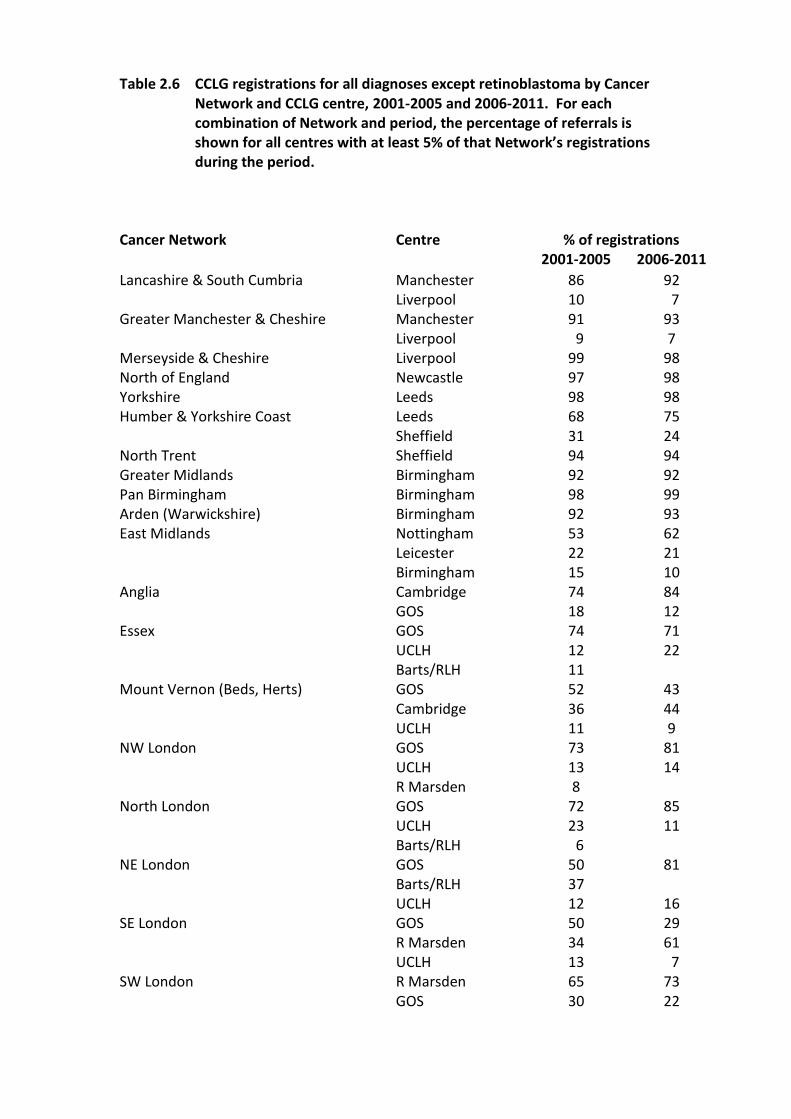
Table 2.6 CCLG registrations for all diagnoses except retinoblastoma by Cancer Network and CCLG centre, 2001-2005 and 2006-2011. For each combination of Network and period, the percentage of referrals is shown for all centres with at least 5% of that Network’s registrations during the period.
Cancer Network Centre % of registrations 2001-2005 2006-2011
Lancashire & South Cumbria Manchester 86 92 Liverpool 10 7 Greater Manchester & Cheshire Manchester 91 93 Liverpool 9 7 Merseyside & Cheshire Liverpool 99 98 North of England Newcastle 97 98 Yorkshire Leeds 98 98 Humber & Yorkshire Coast Leeds 68 75 Sheffield 31 24 North Trent Sheffield 94 94 Greater Midlands Birmingham 92 92 Pan Birmingham Birmingham 98 99 Arden (Warwickshire) Birmingham 92 93 East Midlands Nottingham 53 62 Leicester 22 21 Birmingham 15 10 Anglia Cambridge 74 84 GOS 18 12 Essex GOS 74 71 UCLH 12 22 Barts/RLH 11 Mount Vernon (Beds, Herts) GOS 52 43 Cambridge 36 44 UCLH 11 9 NW London GOS 73 81 UCLH 13 14 R Marsden 8 North London GOS 72 85 UCLH 23 11 Barts/RLH 6 NE London GOS 50 81 Barts/RLH 37 UCLH 12 16 SE London GOS 50 29 R Marsden 34 61 UCLH 13 7 SW London R Marsden 65 73 GOS 30 22

Peninsula (Devon, Cornwall) Bristol 98 98 Dorset Southampton 96 97 Avon, Somerset & Wilts Bristol 88 84 Oxford 10 13 Three Counties (Herefs, Worcs, Gloucs) Bristol 49 51 Birmingham 47 43 Thames Valley Oxford 91 88 Central South Coast Southampton 93 96 Surrey, W Sussex & Hants R Marsden 72 76 GOS 18 18 Southampton 5 Sussex R Marsden 67 82 GOS 22 11 Southampton 7 Kent & Medway R Marsden 51 68 GOS 39 21 UCLH 7 8 North Wales Liverpool 97 100 Mid & West Wales Cardiff 91 84 Birmingham 8 12 SE Wales Cardiff 99 98

Table 2.7 CCLG registrations for all diagnoses except retinoblastoma by Scottish Health Board and CCLG centre, 2001-2011. For each Health Board, the percentage of referrals is shown for all centres with at least 5% of that Board’s registrations.
Health Board Centres % of registrations Highland Glasgow 75 Edinburgh 14 Aberdeen 11 Grampian Aberdeen 90 Edinburgh 6 Tayside Edinburgh 98 Fife Edinburgh 100 Lothian Edinburgh 98 Borders Edinburgh 93 Central (Forth Valley) Glasgow 70 Edinburgh 28 Argyll & Clyde Glasgow 98 Greater Glasgow Glasgow 100 Lanark Glasgow 95 Ayrshire & Arran Glasgow 100 Dumfries & Galloway Glasgow 80 Edinburgh 17 Orkney Aberdeen 67 Glasgow 17 Edinburgh 17 Shetland Aberdeen 83 Edinburgh 17 Western Isles Glasgow 100
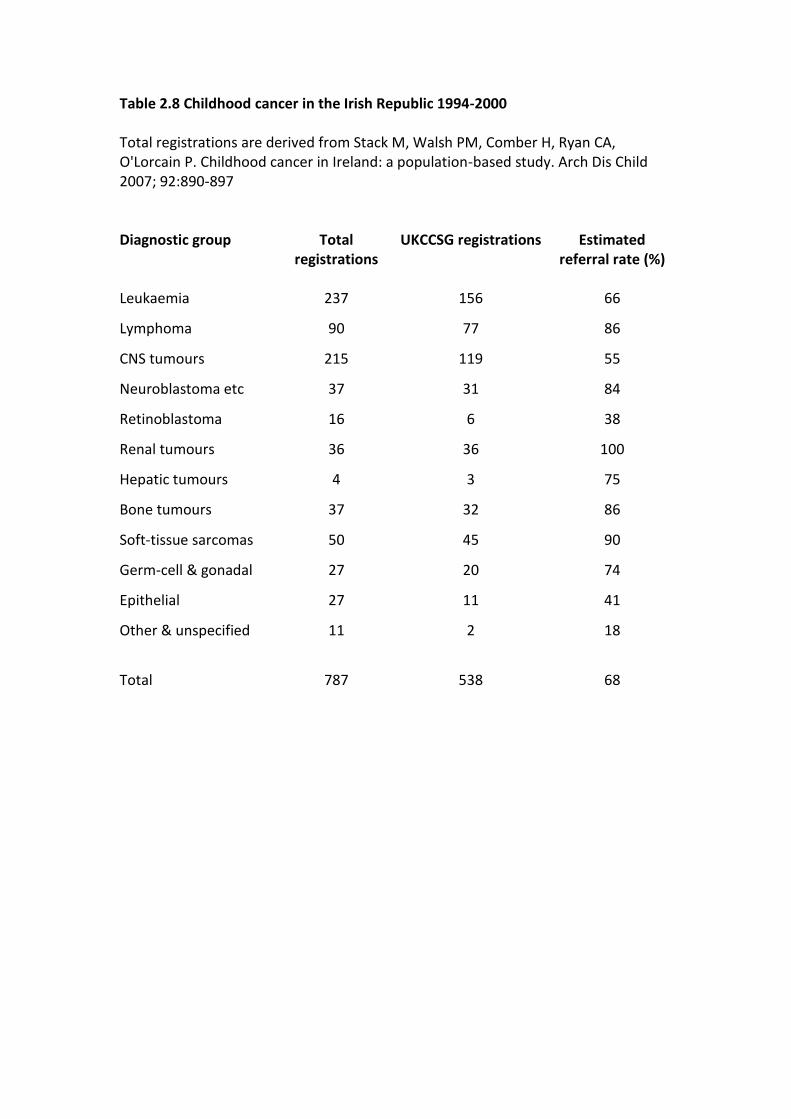
Table 2.8 Childhood cancer in the Irish Republic 1994-2000 Total registrations are derived from Stack M, Walsh PM, Comber H, Ryan CA, O'Lorcain P. Childhood cancer in Ireland: a population-based study. Arch Dis Child 2007; 92:890-897 Diagnostic group Total
registrations UKCCSG registrations Estimated
referral rate (%) Leukaemia 237 156 66
Lymphoma 90 77 86
CNS tumours 215 119 55
Neuroblastoma etc 37 31 84
Retinoblastoma 16 6 38
Renal tumours 36 36 100
Hepatic tumours 4 3 75
Bone tumours 37 32 86
Soft-tissue sarcomas 50 45 90
Germ-cell & gonadal 27 20 74
Epithelial 27 11 41
Other & unspecified 11 2 18
Total 787 538 68

Table 2.9 Childhood cancer in the Irish Republic 2001-2009 Total numbers of children initially referred to a UKCCSG/CCLG centre 2001-2009, with 1994-2000 annual average UKCCSG referrals and total cancer registrations for comparison Diagnostic group UKCCSG/CCLG UKCCSG Cancer
registrations 2001-2009 1994-2000 1994-2000 Total Annual Annual Annual Leukaemia 338 37.5 22.3 33.9
Lymphoma 108 12.0 11.0 12.9
CNS tumours 201 22.3 17.0 30.7
Neuroblastoma etc 87 9.7 4.4 5.3
Retinoblastoma 20 2.2 0.9 2.3
Renal tumours 72 8.0 5.1
5.1
Hepatic tumours 18 2.0 0.4 0.6
Bone tumours 44 4.9 4.6 5.3
Soft-tissue sarcomas 80 8.9 6.4 7.1
Germ-cell & gonadal 27 3.0 2.9 3.9
Epithelial 7 0.8 1.6 3.9
Other & unspecified 4 0.4 0.3 1.6
Total 1006 111.8 76.9 112.4

3. Survival Population-based survival 1971-2010
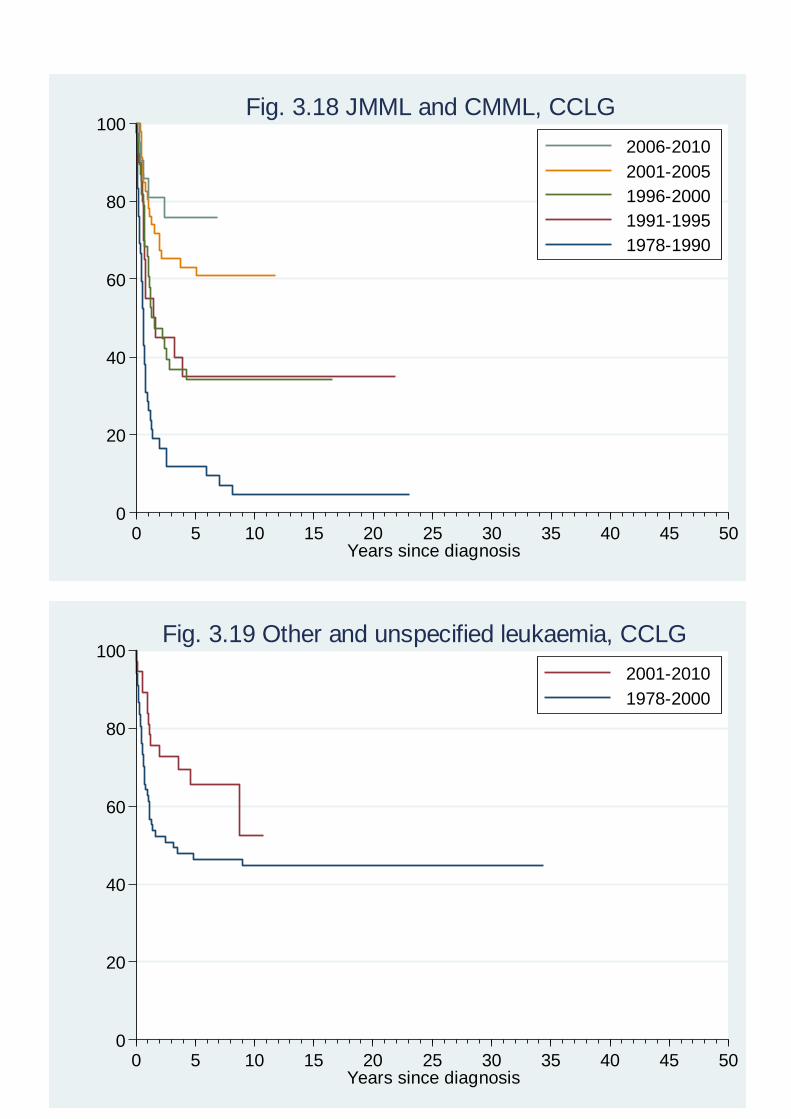
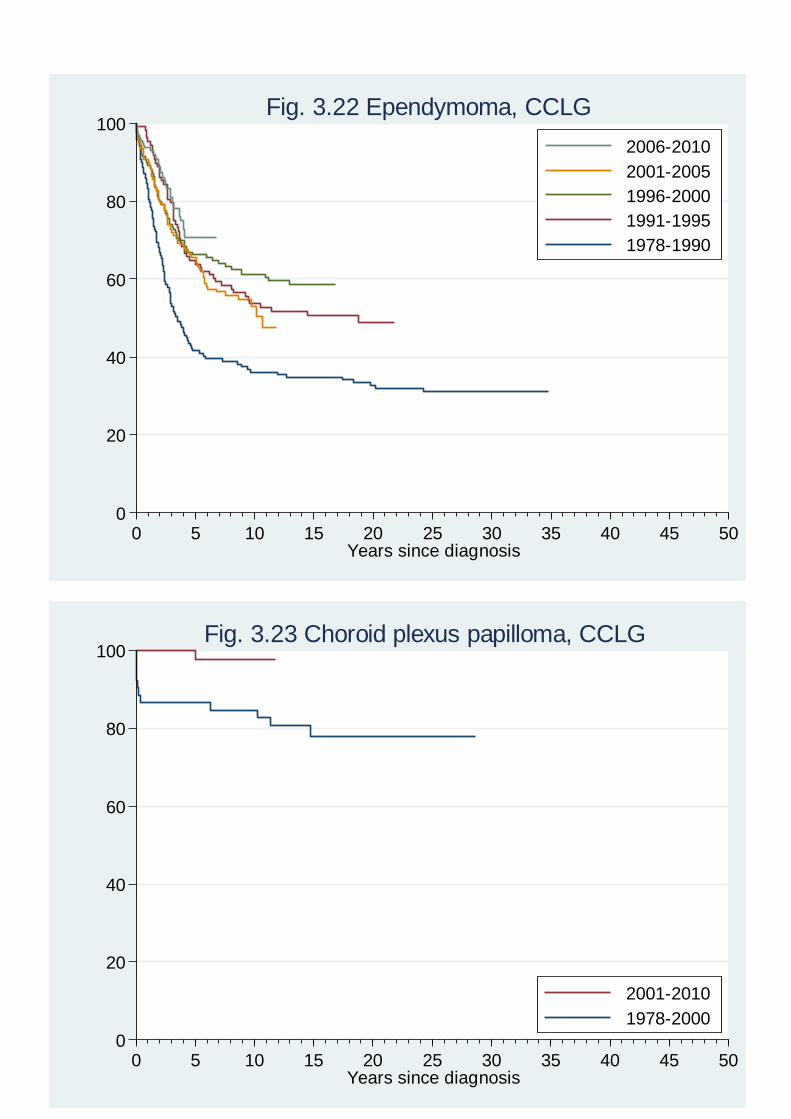
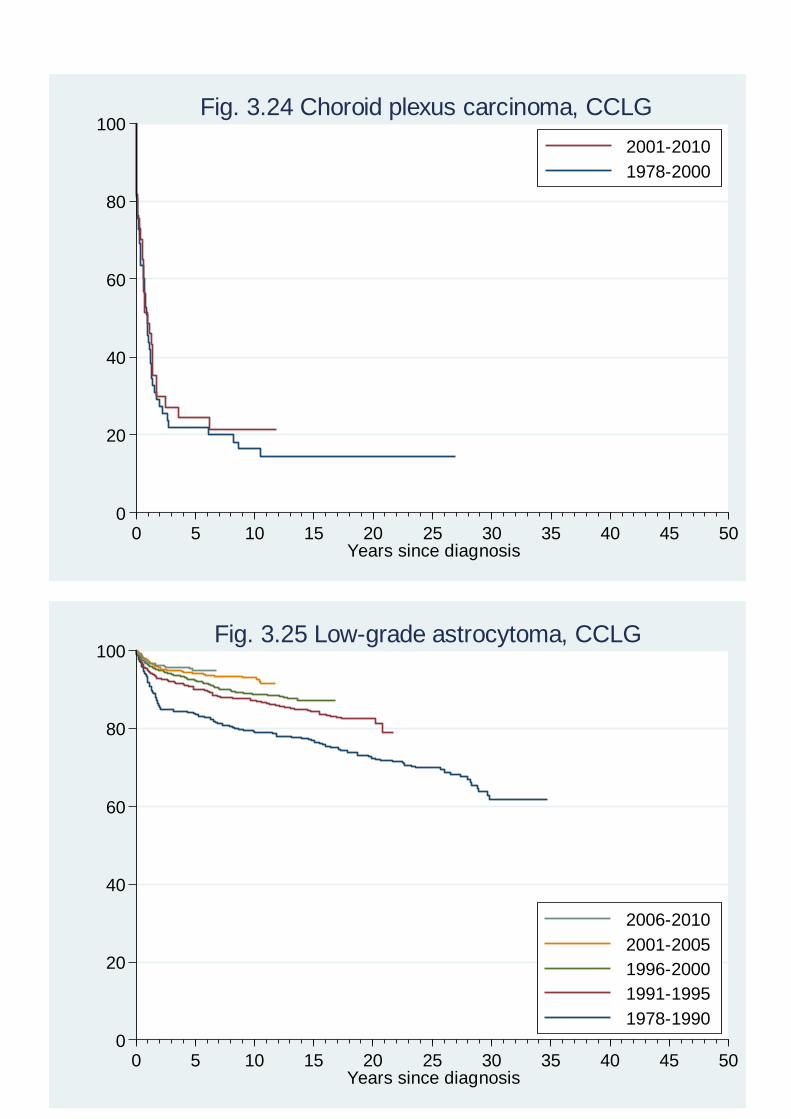
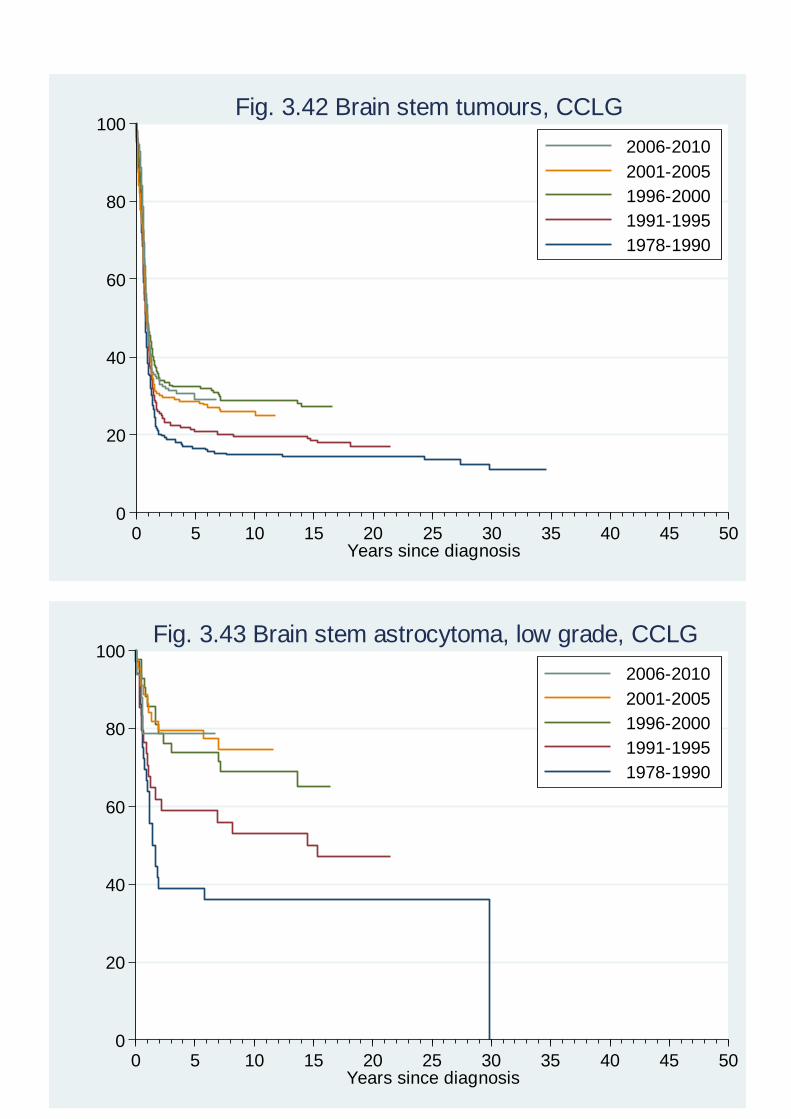
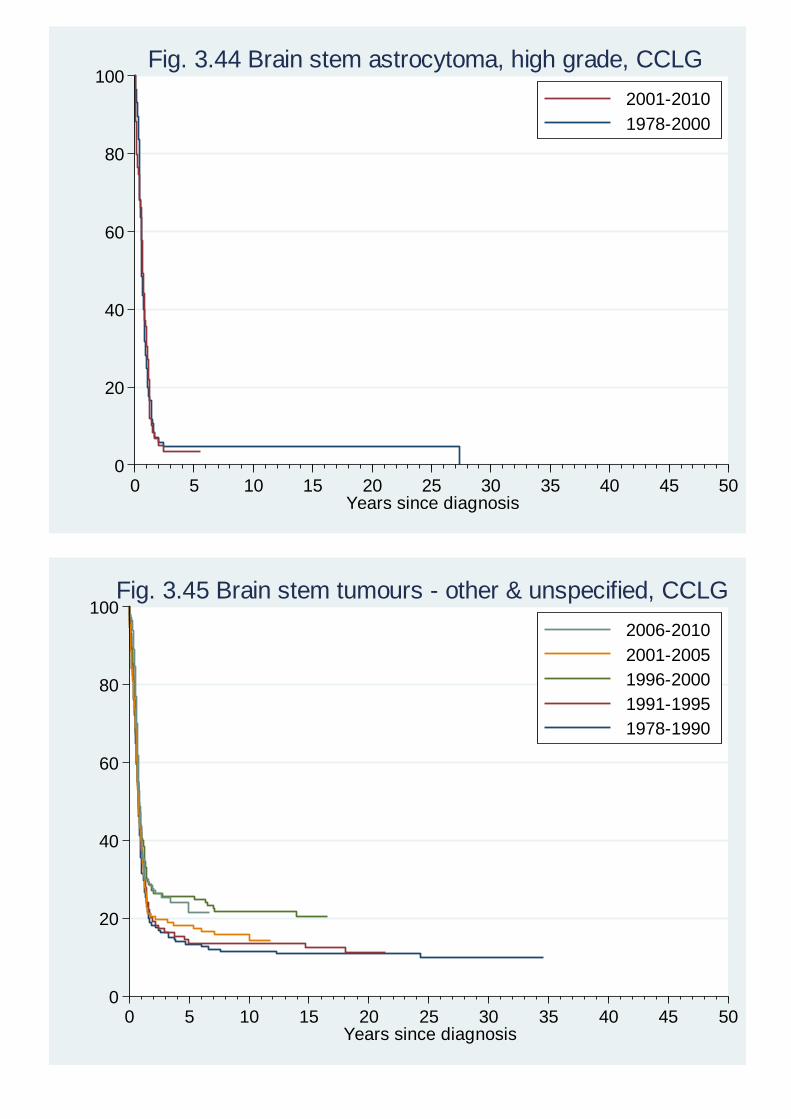
Table 3.1 and Figures 3.1-3.11 present population-based survival rates for all childhood cancers and for each of Groups I-X in ICCC-3. The results are for children from Great Britain who were diagnosed during 1971-2010 and included in the National Registry of Childhood Tumours. Most survivors have been followed up until the end of October 2012. Cases ascertained by death certificate only have been excluded. Overall and for all diagnostic groups, the trend in survival by year of diagnosis was highly significant (p<0.0001). The largest percentage-point increase in five-year survival compared with the previous period for all cancers combined was in 1981-85. The largest such increases for leukaemias, lymphomas and neuroblastoma etc. were also in 1981-85. The largest increases were in 1976-80 for renal tumours, soft-tissue sarcomas and germ-cell and gonadal tumours, in 1986-90 for retinoblastoma and bone tumours and in 1991-95 for CNS tumours and hepatic tumours. The predominance of earlier calendar periods in these comparisons is quite largely accounted by the fact that as survival rates increased over time there was much less room for further large increases. An alternative way of comparing changes in survival between successive periods is to calculate the reduction in the risk of death within 5 years from diagnosis as a percentage of the risk for the previous period. For all cancers combined the largest proportional reduction in the risk of death was in 1981-85 compared with 1976-80; the probability of death within five years for children diagnosed in 1981-85 was 0.392, a reduction of 22% from the probability of 0.504 in 1976-80. Among individual broad diagnostic groups, the largest percentage reductions in mortality were in 1976-80 for soft-tissue sarcomas (18%), in 1981-85 for lymphomas (37%), in 1986-90 for bone tumours (26%), in 1991-95 for CNS tumours (23%) and neuroblastoma etc (19%) and in 2001-05 for germ-cell and gonadal tumours (36%). For leukaemia, there were proportional reductions in mortality of 28% in 1981-85 and again in 2006-10. For retinoblastoma there were reductions in mortality of more than 50% in 1986-90, 2001-05 and 2006-10 but these were based on very small numbers of deaths. For renal tumours there was an alternating pattern of rising and falling survival rates from 1986-90 onwards; before then, the largest reduction in mortality was in 1976-80 (39%). For hepatic tumours, there were reductions in mortality of 49% in 1991-95 and 46% in 2006-10. Survival of CCLG Patients 1978-2010 Tables 3.2-3.4 and Figures 3.12-3.132 present survival data for all CCLG patients registered at diagnosis throughout the UK and Ireland. Table 3.2 gives five-year survival rates with the results of a test for trend for diagnostic groups with at least 50 registrations. For most of those with at least 150 registrations, survival rates are shown for five periods of diagnosis (1978-90, 1991-
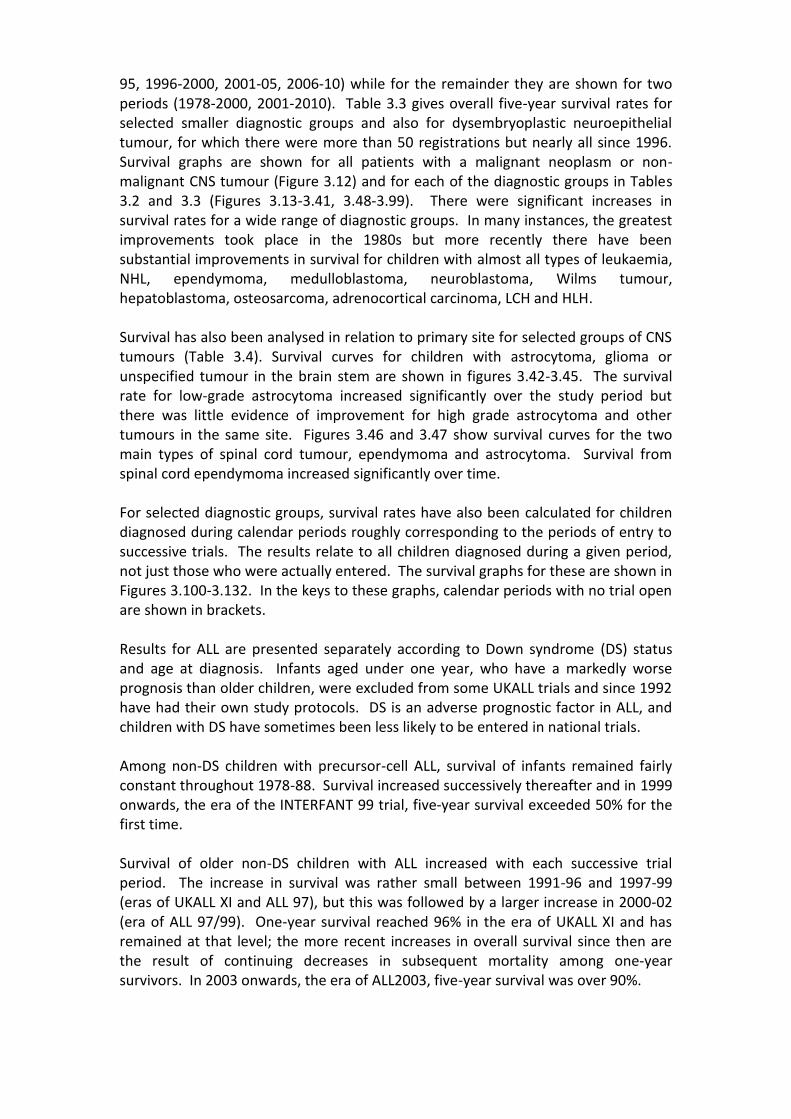
95, 1996-2000, 2001-05, 2006-10) while for the remainder they are shown for two periods (1978-2000, 2001-2010). Table 3.3 gives overall five-year survival rates for selected smaller diagnostic groups and also for dysembryoplastic neuroepithelial tumour, for which there were more than 50 registrations but nearly all since 1996. Survival graphs are shown for all patients with a malignant neoplasm or non-malignant CNS tumour (Figure 3.12) and for each of the diagnostic groups in Tables 3.2 and 3.3 (Figures 3.13-3.41, 3.48-3.99). There were significant increases in survival rates for a wide range of diagnostic groups. In many instances, the greatest improvements took place in the 1980s but more recently there have been substantial improvements in survival for children with almost all types of leukaemia, NHL, ependymoma, medulloblastoma, neuroblastoma, Wilms tumour, hepatoblastoma, osteosarcoma, adrenocortical carcinoma, LCH and HLH. Survival has also been analysed in relation to primary site for selected groups of CNS tumours (Table 3.4). Survival curves for children with astrocytoma, glioma or unspecified tumour in the brain stem are shown in figures 3.42-3.45. The survival rate for low-grade astrocytoma increased significantly over the study period but there was little evidence of improvement for high grade astrocytoma and other tumours in the same site. Figures 3.46 and 3.47 show survival curves for the two main types of spinal cord tumour, ependymoma and astrocytoma. Survival from spinal cord ependymoma increased significantly over time. For selected diagnostic groups, survival rates have also been calculated for children diagnosed during calendar periods roughly corresponding to the periods of entry to successive trials. The results relate to all children diagnosed during a given period, not just those who were actually entered. The survival graphs for these are shown in Figures 3.100-3.132. In the keys to these graphs, calendar periods with no trial open are shown in brackets. Results for ALL are presented separately according to Down syndrome (DS) status and age at diagnosis. Infants aged under one year, who have a markedly worse prognosis than older children, were excluded from some UKALL trials and since 1992 have had their own study protocols. DS is an adverse prognostic factor in ALL, and children with DS have sometimes been less likely to be entered in national trials. Among non-DS children with precursor-cell ALL, survival of infants remained fairly constant throughout 1978-88. Survival increased successively thereafter and in 1999 onwards, the era of the INTERFANT 99 trial, five-year survival exceeded 50% for the first time. Survival of older non-DS children with ALL increased with each successive trial period. The increase in survival was rather small between 1991-96 and 1997-99 (eras of UKALL XI and ALL 97), but this was followed by a larger increase in 2000-02 (era of ALL 97/99). One-year survival reached 96% in the era of UKALL XI and has remained at that level; the more recent increases in overall survival since then are the result of continuing decreases in subsequent mortality among one-year survivors. In 2003 onwards, the era of ALL2003, five-year survival was over 90%.
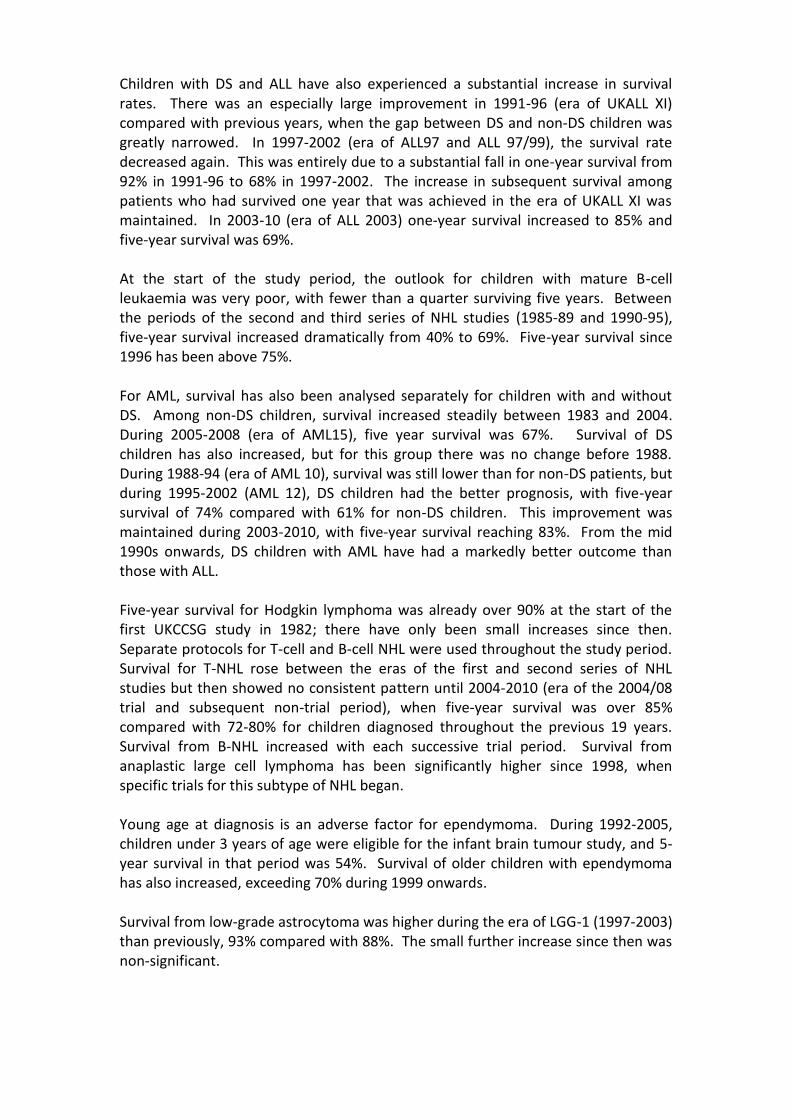
Children with DS and ALL have also experienced a substantial increase in survival rates. There was an especially large improvement in 1991-96 (era of UKALL XI) compared with previous years, when the gap between DS and non-DS children was greatly narrowed. In 1997-2002 (era of ALL97 and ALL 97/99), the survival rate decreased again. This was entirely due to a substantial fall in one-year survival from 92% in 1991-96 to 68% in 1997-2002. The increase in subsequent survival among patients who had survived one year that was achieved in the era of UKALL XI was maintained. In 2003-10 (era of ALL 2003) one-year survival increased to 85% and five-year survival was 69%.
At the start of the study period, the outlook for children with mature B-cell leukaemia was very poor, with fewer than a quarter surviving five years. Between the periods of the second and third series of NHL studies (1985-89 and 1990-95), five-year survival increased dramatically from 40% to 69%. Five-year survival since 1996 has been above 75%. For AML, survival has also been analysed separately for children with and without DS. Among non-DS children, survival increased steadily between 1983 and 2004. During 2005-2008 (era of AML15), five year survival was 67%. Survival of DS children has also increased, but for this group there was no change before 1988. During 1988-94 (era of AML 10), survival was still lower than for non-DS patients, but during 1995-2002 (AML 12), DS children had the better prognosis, with five-year survival of 74% compared with 61% for non-DS children. This improvement was maintained during 2003-2010, with five-year survival reaching 83%. From the mid 1990s onwards, DS children with AML have had a markedly better outcome than those with ALL. Five-year survival for Hodgkin lymphoma was already over 90% at the start of the first UKCCSG study in 1982; there have only been small increases since then. Separate protocols for T-cell and B-cell NHL were used throughout the study period. Survival for T-NHL rose between the eras of the first and second series of NHL studies but then showed no consistent pattern until 2004-2010 (era of the 2004/08 trial and subsequent non-trial period), when five-year survival was over 85% compared with 72-80% for children diagnosed throughout the previous 19 years. Survival from B-NHL increased with each successive trial period. Survival from anaplastic large cell lymphoma has been significantly higher since 1998, when specific trials for this subtype of NHL began. Young age at diagnosis is an adverse factor for ependymoma. During 1992-2005, children under 3 years of age were eligible for the infant brain tumour study, and 5-year survival in that period was 54%. Survival of older children with ependymoma has also increased, exceeding 70% during 1999 onwards. Survival from low-grade astrocytoma was higher during the era of LGG-1 (1997-2003) than previously, 93% compared with 88%. The small further increase since then was non-significant.
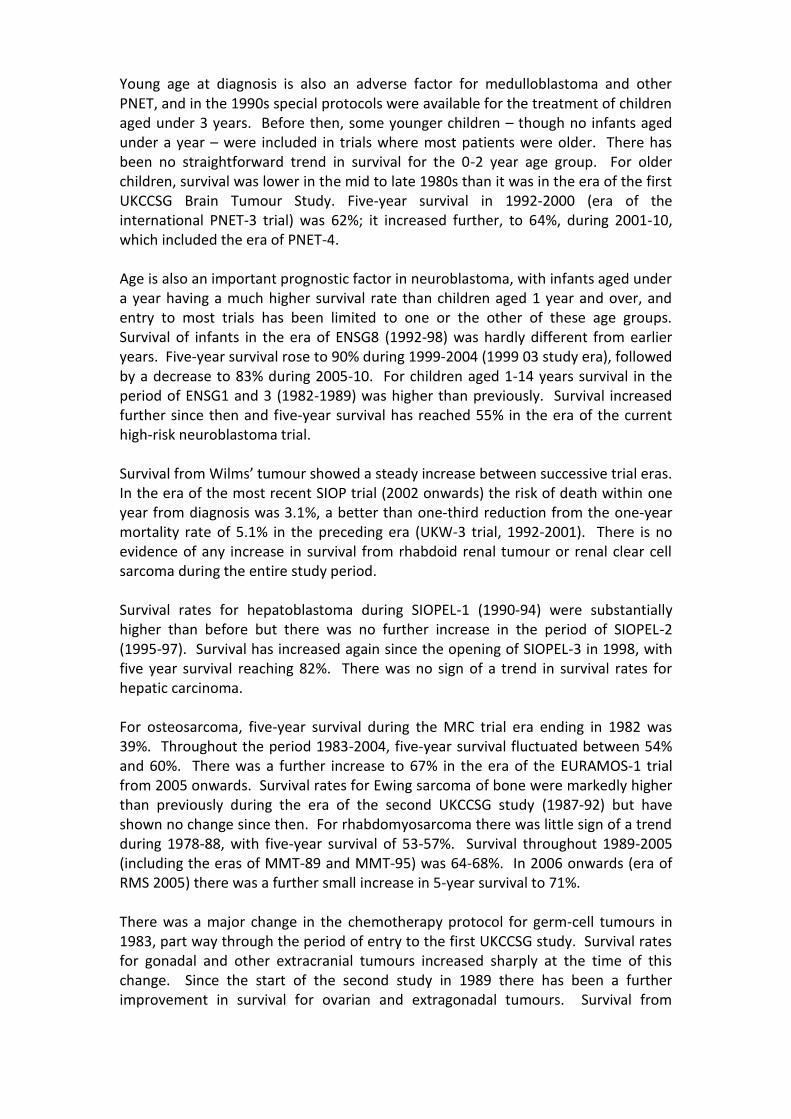
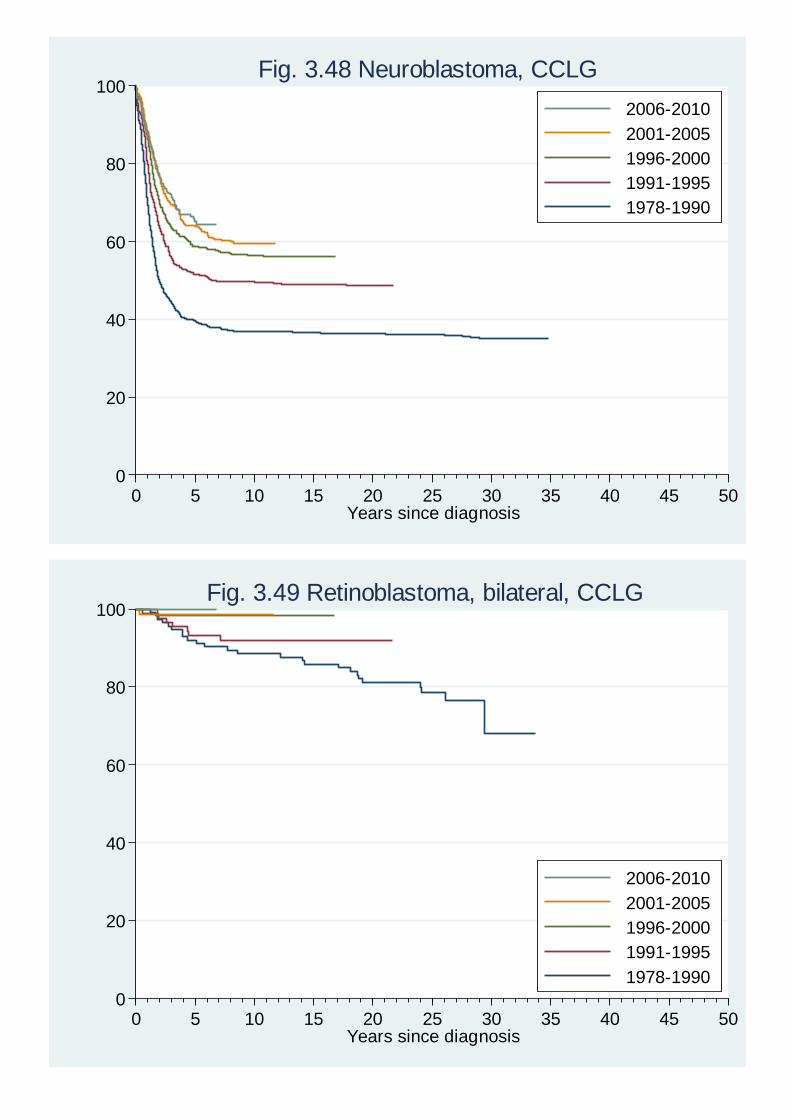
Young age at diagnosis is also an adverse factor for medulloblastoma and other PNET, and in the 1990s special protocols were available for the treatment of children aged under 3 years. Before then, some younger children – though no infants aged under a year – were included in trials where most patients were older. There has been no straightforward trend in survival for the 0-2 year age group. For older children, survival was lower in the mid to late 1980s than it was in the era of the first UKCCSG Brain Tumour Study. Five-year survival in 1992-2000 (era of the international PNET-3 trial) was 62%; it increased further, to 64%, during 2001-10, which included the era of PNET-4. Age is also an important prognostic factor in neuroblastoma, with infants aged under a year having a much higher survival rate than children aged 1 year and over, and entry to most trials has been limited to one or the other of these age groups. Survival of infants in the era of ENSG8 (1992-98) was hardly different from earlier years. Five-year survival rose to 90% during 1999-2004 (1999 03 study era), followed by a decrease to 83% during 2005-10. For children aged 1-14 years survival in the period of ENSG1 and 3 (1982-1989) was higher than previously. Survival increased further since then and five-year survival has reached 55% in the era of the current high-risk neuroblastoma trial.
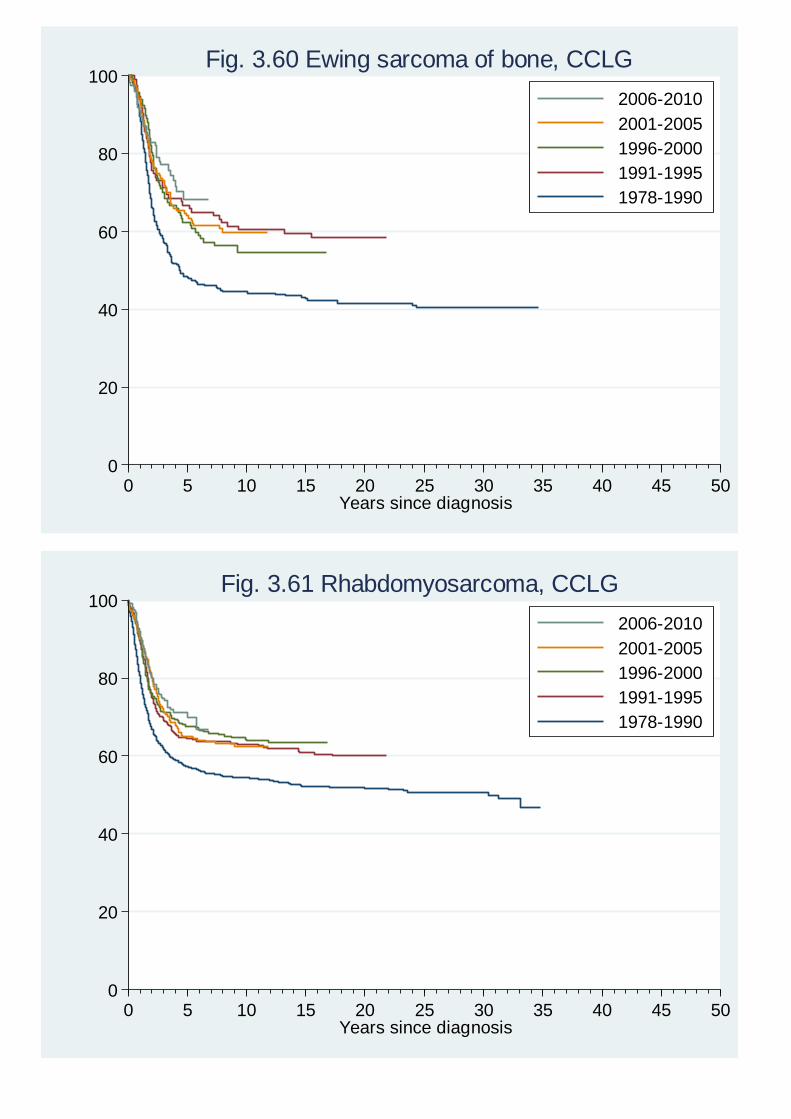
Survival from Wilms’ tumour showed a steady increase between successive trial eras. In the era of the most recent SIOP trial (2002 onwards) the risk of death within one year from diagnosis was 3.1%, a better than one-third reduction from the one-year mortality rate of 5.1% in the preceding era (UKW-3 trial, 1992-2001). There is no evidence of any increase in survival from rhabdoid renal tumour or renal clear cell sarcoma during the entire study period. Survival rates for hepatoblastoma during SIOPEL-1 (1990-94) were substantially higher than before but there was no further increase in the period of SIOPEL-2 (1995-97). Survival has increased again since the opening of SIOPEL-3 in 1998, with five year survival reaching 82%. There was no sign of a trend in survival rates for hepatic carcinoma. For osteosarcoma, five-year survival during the MRC trial era ending in 1982 was 39%. Throughout the period 1983-2004, five-year survival fluctuated between 54% and 60%. There was a further increase to 67% in the era of the EURAMOS-1 trial from 2005 onwards. Survival rates for Ewing sarcoma of bone were markedly higher than previously during the era of the second UKCCSG study (1987-92) but have shown no change since then. For rhabdomyosarcoma there was little sign of a trend during 1978-88, with five-year survival of 53-57%. Survival throughout 1989-2005 (including the eras of MMT-89 and MMT-95) was 64-68%. In 2006 onwards (era of RMS 2005) there was a further small increase in 5-year survival to 71%. There was a major change in the chemotherapy protocol for germ-cell tumours in 1983, part way through the period of entry to the first UKCCSG study. Survival rates for gonadal and other extracranial tumours increased sharply at the time of this change. Since the start of the second study in 1989 there has been a further improvement in survival for ovarian and extragonadal tumours. Survival from

intracranial germinoma and other types of CNS germ-cell tumours increased substantially to just over 90% since the opening of the SIOP study in 1997. Five-year survival from single-system Langerhans cell histiocytosis (LCH) was already 95% during 1978-90, before the first LCH trial opened, but has increased still further since then. There was little change in survival from multi-system LCH from 1978-90 until the era of the third trial, starting in 2002, since when five-year survival has been above 95%. For haemophagocytic lymphohistiocytosis (HLH) five-year survival increased from 14% during 1978-94, before the start of HLH-94, to 34% during the era of HLH-94 (1995-2003). Survival increased further since then, to 65% during 2006 onwards. The reader is also referred to the recent paper on population-based survival by eras of entry to clinical trials (Stiller, et al, 2012; full reference in section 4 below).
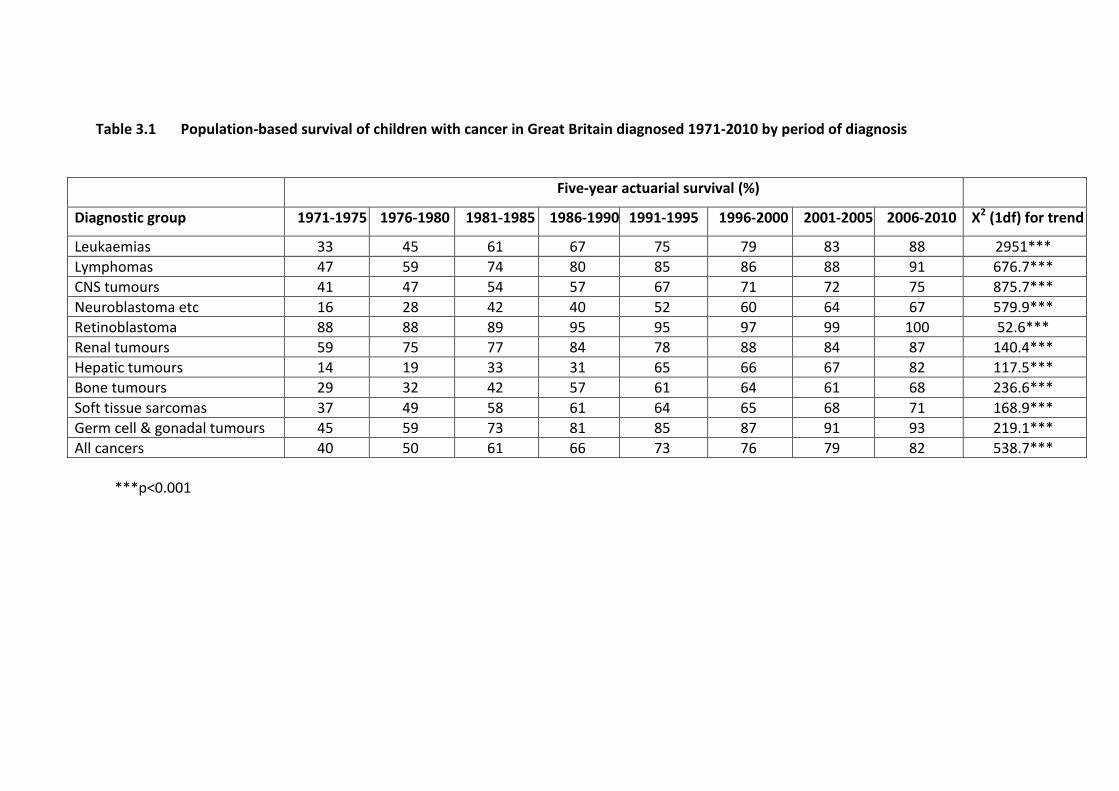
Table 3.1 Population-based survival of children with cancer in Great Britain diagnosed 1971-2010 by period of diagnosis
Five-year actuarial survival (%)
Diagnostic group 1971-1975 1976-1980 1981-1985 1986-1990 1991-1995 1996-2000 2001-2005 2006-2010 X2 (1df) for trend
Leukaemias 33 45 61 67 75 79 83 88 2951***
Lymphomas 47 59 74 80 85 86 88 91 676.7***
CNS tumours 41 47 54 57 67 71 72 75 875.7***
Neuroblastoma etc 16 28 42 40 52 60 64 67 579.9***
Retinoblastoma 88 88 89 95 95 97 99 100 52.6***
Renal tumours 59 75 77 84 78 88 84 87 140.4***
Hepatic tumours 14 19 33 31 65 66 67 82 117.5***
Bone tumours 29 32 42 57 61 64 61 68 236.6***
Soft tissue sarcomas 37 49 58 61 64 65 68 71 168.9***
Germ cell & gonadal tumours 45 59 73 81 85 87 91 93 219.1***
All cancers 40 50 61 66 73 76 79 82 538.7***
***p<0.001

Table 3.2 Survival of CCLG patients diagnosed 1978-2010 by period of diagnosis. In the test for trend by year of diagnosis, brackets around the X2 value indicate a negative trend. Results for certain diagnostic subgroups, mainly ‘other and unspecified’, whose composition may have changed over the years are printed in italics.
Five-year actuarial survival (%)
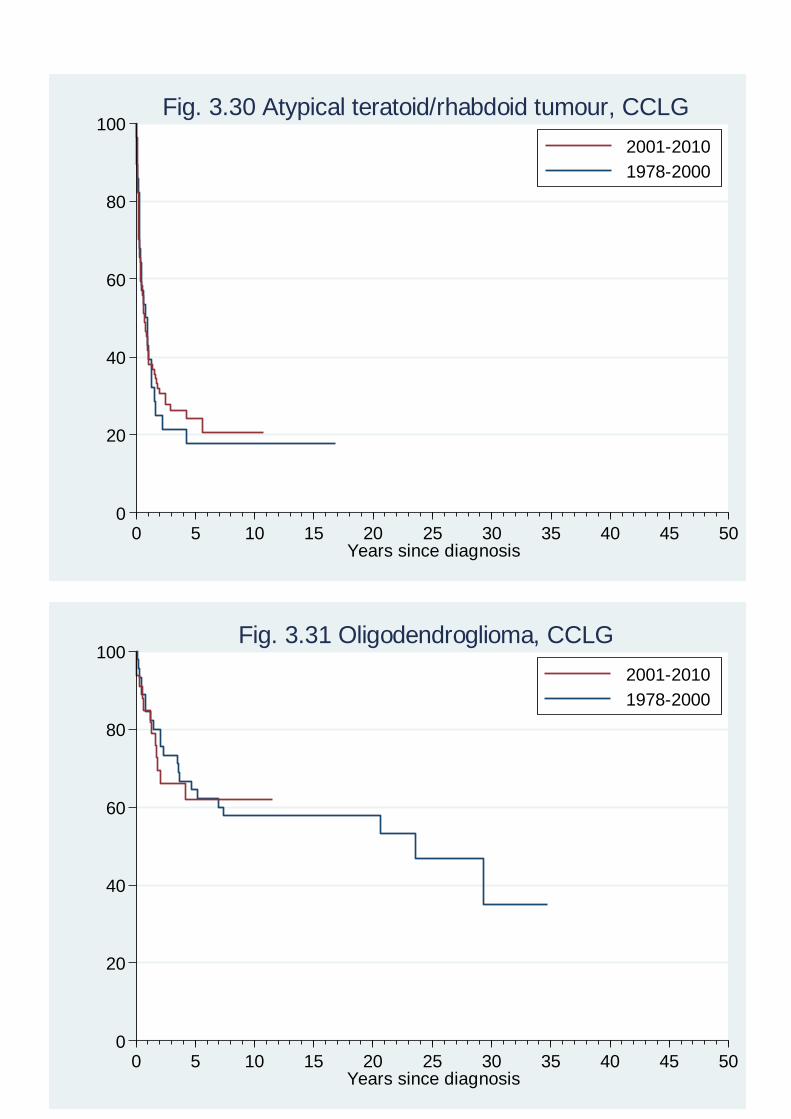
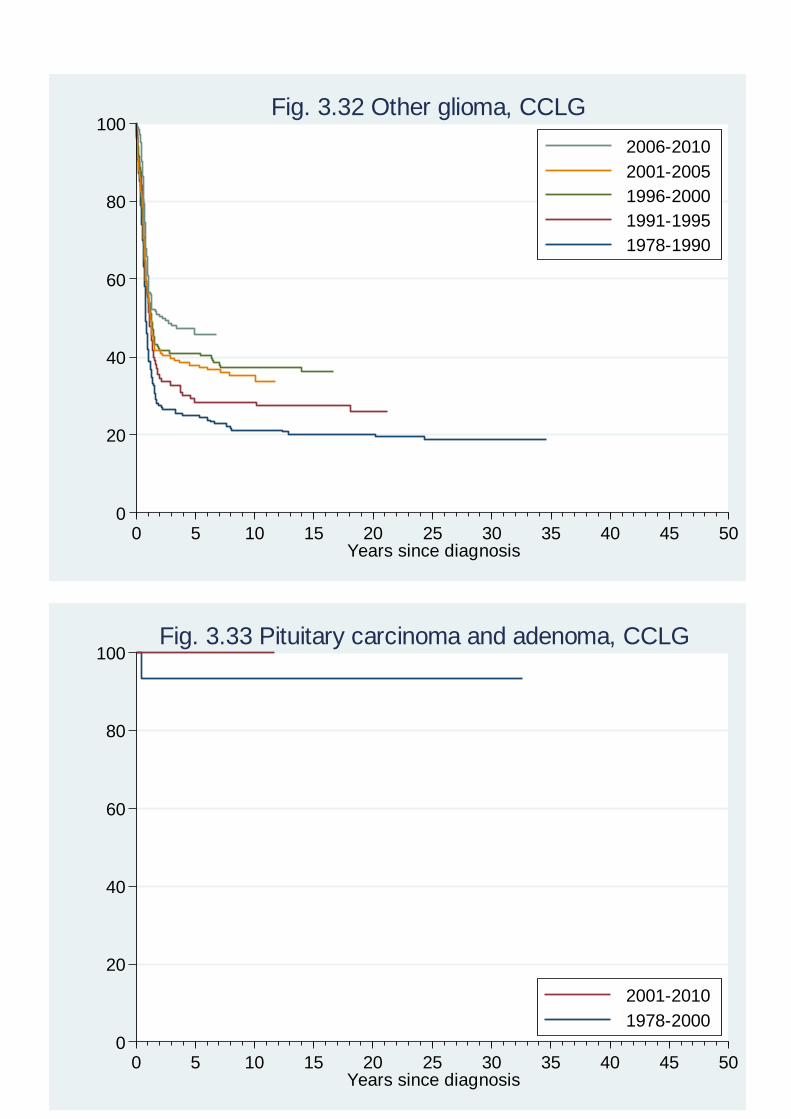
Diagnostic Group 1978-90 1991-95 1996-2000 2001-05 2006-10 1978-2000 2001-2010 X2 (1df) for trend
Precursor ALL 69 81 83 88 92 683.4*** Mature B-cell leukaemia 54 79 31.4*** AML 33 53 67 65 69 244.6*** CML 41 56 74 79 93 44.7*** Myelodysplasia 21 55 53 66 63 10.1** JMML & CMML 12 35 34 63 76 45.9*** Other & unspecified leukaemia 46 66 21.6*** Hodgkin lymphoma 91 96 93 95 96 13.1*** NHL 68 78 81 86 88 106.7*** Ependymoma 42 65 66 65 71 23.7*** Choroid plexus papilloma 87 98 21.6*** Choroid plexus carcinoma 22 24 (0.05) Low grade astrocytoma 84 90 92 94 95 60.0*** High grade astrocytoma 23 18 18 11 17 (1.79) Unspec. Astrocytoma 55 42 45 72 66 4.58* Medulloblastoma 51 54 66 65 64 24.4***
CNS PNET 36 26 33 37 36 2.05
ATRT 18 24 0.13
Oligodendroglioma 64 62 (0.46) Other glioma 25 28 41 38 46 19.8*** Pituitary carcinoma & adenoma 93 100 1.57

Table 3.2 (continued)
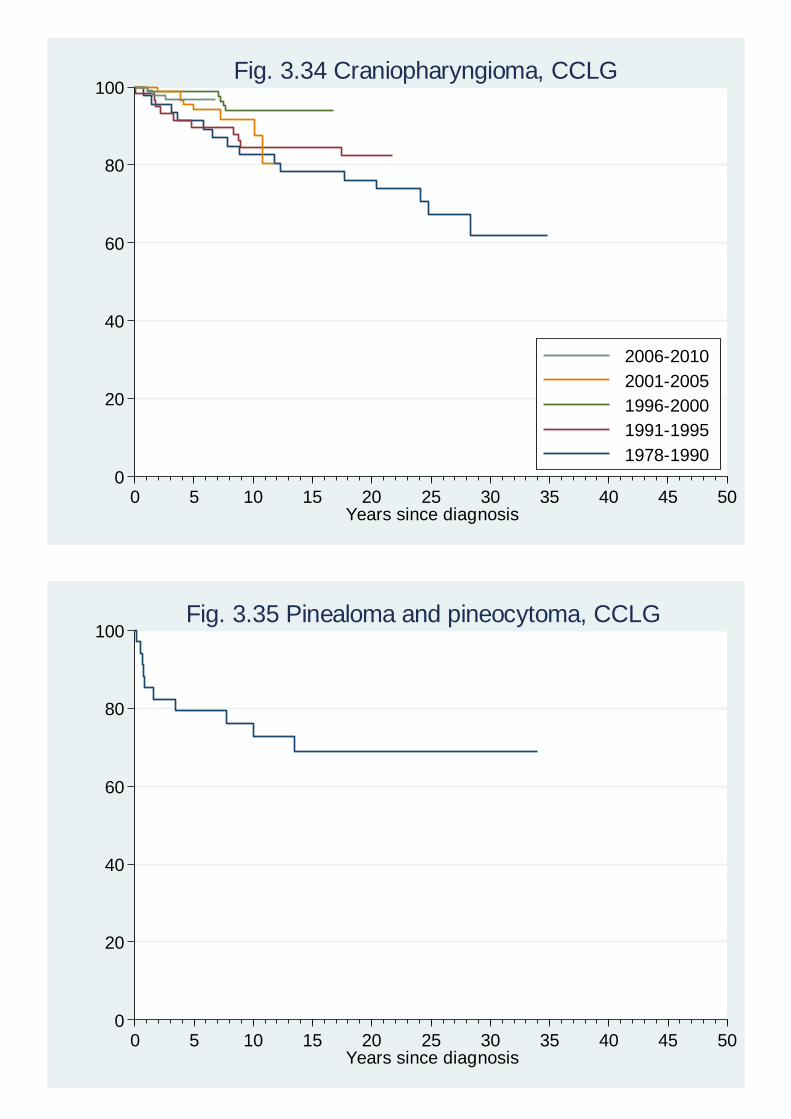
Diagnostic Group 1978-90 1991-95 1996-2000 2001-05 2006-10 1978-2000 2001-2010 X2 (1df) for trend Craniopharyngioma 91 90 99 94 97 3.73 Pineoblastoma 28 46 9.16** Ganglioglioma 85 92 3.32 Meningioma 78 97 12.9*** Unspecified CNS 36 65 55 32 49 0.06 Neuroblastoma 40 52 59 64 65 174.7*** Retinoblastoma bilateral 92 93 98 99 100 19.6*** Retinoblastoma unilateral 92 97 96 98 99 8.83** Wilms tumour 83 80 92 90 90 38.6*** Rhabdoid renal tumour 26 11 (1.71) Renal clear cell sarcoma 78 85 0.01 Hepatoblastoma 40 71 79 77 86 46.8*** Hepatic carcinoma 23 29 0.01 Osteosarcoma 49 53 62 56 65 14.1*** Ewing sarcoma of bone 48 67 62 64 68 29.2*** Rhabdomyosarcoma 57 65 68 65 71 25.4*** MPNST 34 59 2.13 Other fibrosarcoma etc 72 90 11.1*** Extraosseous ESFT 51 53 55 66 58 3.46 Extrarenal rhabdoid tumour 15 21 0.10 Synovial sarcoma 81 81 1.31 Other specified soft tissue sarcoma 62 66 0.08 Unspecified soft-tissue sarcoma 40 40 33 45 68 2.26 Hepatic sarcoma, all types 48 56 0.67 Intracranial & intra-spinal germinoma 73 83 87 92 92 8.72**

Table 3.2 (continued)
Diagnostic Group 1978-90 1991-95 1996-2000 2001-05 2006-10 1978-2000 2001-2010 X2 (1df) for trend Other CNS germ-cell 50 72 10.2*** Other malig. extra-gonadal germ-cell 68 81 82 90 91 33.1*** Gonadal malig. germ-cell 92 96 96 97 99 21.0*** Adrenocortical carcinoma 36 63 16.1*** Thyroid carcinoma, non-medullary 100 99 (0.02) Nasopharyngeal carcinoma 73 88 6.09* Malignant melanoma 52 59 2.67 Misc. other carcinoma 50 63 1.63 LCH single system 95 97 99 99 99 9.01** LCH multi system 68 72 73 97 96 11.4*** HLH 6 19 33 44 65 32.9*** Ganglioneuroma 100 100 97 100 100 0.25 Mesoblastic nephroma 99 96 0.04 Fibromatosis 94 98 3.66 Misc non-malig soft tissue 95 97 97 100 99 2.06 Other non-gonadal non-malig. germ-cell
96 98 97 99 100 1.76
Gonadal non-malig. germ-cell 100 100 99 100 100 0.15 Non-malignant specialised gonadal 94 98 0.03
* P<0.05 ** P<0.01 *** P<0.001

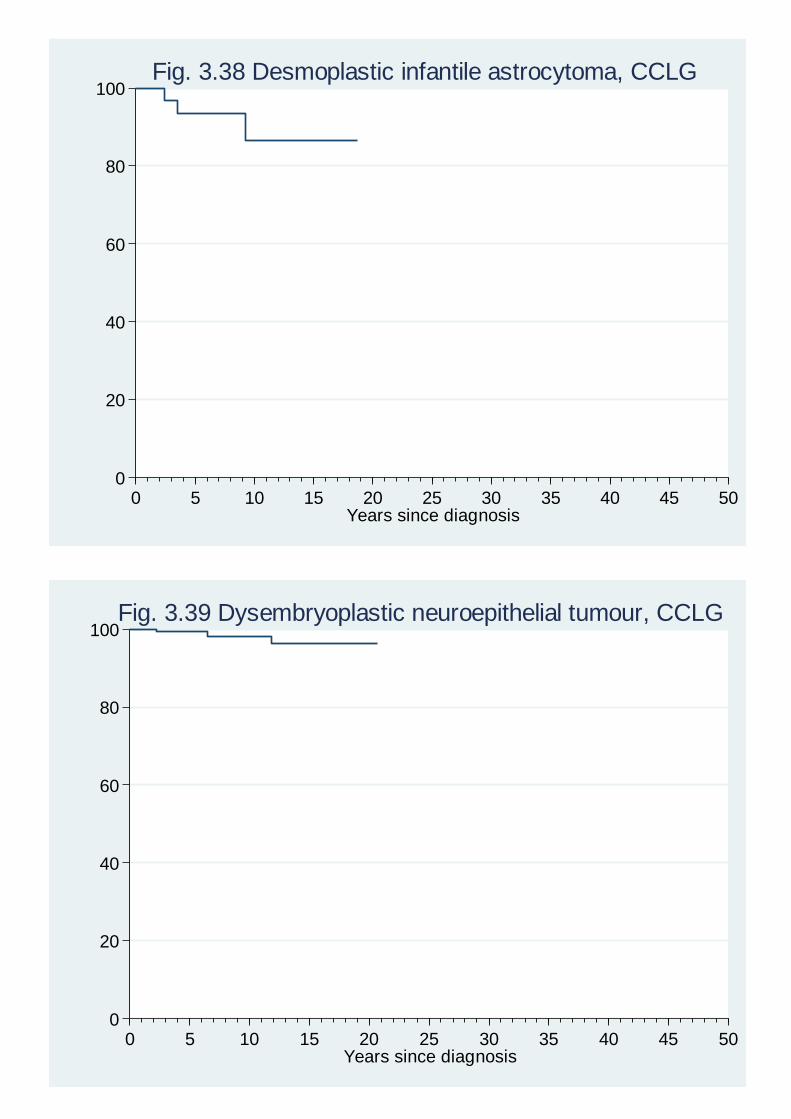
Table 3.3 Survival of CCLG patients diagnosed 1978-2010 Diagnostic group Five-year actuarial survival (%) Pinealoma & Pineocytoma 79 Desmoplastic infantile astrocytoma 93 DNET 99 Renal PNET 28 Renal carcinoma 68 Chondrosarcoma 50 Leiomyosarcoma 84 Fibrohistiocytic tumours 92 Alveolar soft part sarcoma 95 Desmoplastic small round cell tumour 25 Other malignant gonadal tumours 53 Thyroid carcinoma, medullary 95 Salivary gland carcinoma 94 Colorectal carcinoma 16 Pleuropulmonary blastoma 78 Lymphoproliferative disease 66 Adrenocortical adenoma 100

Table 3.4 Survival of CCLG patients diagnosed 1978-2010 with selected CNS tumours. Note that these results relate to patients also included in Table 3.2.
Five-year actuarial survival (%)
Diagnostic group 1978-90 1991-95 1996-2000 2001-05 2006-10 1978-2000 2001-10 X2 (1df) for trend
(i) Astrocytoma, glioma or unspecified tumour of brain stem
Total 17 21 32 29 29 8.55**
Low-grade astrocytoma 39 59 74 80 79 16.8***
High-grade astrocytoma 5 3 0.10
Unspec astrocytoma, other glioma & unspecified
13 13 26 18 21 2.30
(ii) Spinal cord
Ependymoma 93 100 8.54**
Astrocytoma 66 75 85 67 87 1.63
** P<0.01 *** P<0.001

Survival graphs
Figures 3.1-3.11 Population-based survival of children with cancer in Great Britain diagnosed 1971-2010 by
5-year period of diagnosis, 1971-75, 1976-80, … , 2001-05, 2006-10. Source: National Registry of Childhood Tumours Figures 3.12-3.99 Survival of CCLG patients diagnosed 1978-2010 by period of diagnosis, subdivided as
1978-90, 1991-95, 1996-2000, 2001-2005, 2006-2010 or 1978-2000, 2001-10 for diagnostic groups and subgroups with larger numbers of patients.
Source: National Registry of Childhood Tumours / CCLG Figures 3.100-3.132 Survival of CCLG patients in selected diagnostic subgroups diagnosed 1978-2010 by
period of diagnosis, subdivided into periods roughly corresponding to the periods of entry to successive trials. The results relate to all children diagnosed during a given period, not just those who were actually entered. In the keys to these graphs, calendar periods with no trial open are shown in brackets.
Source: National Registry of Childhood Tumours / CCLG
0
20
40
60
80
100
Perc
enta
ge s
urv
ivin
g
0 5 10 15 20 25 30 35 40 45 50Years since diagnosis
2006-2010
2001-2005
1996-2000
1991-1995
1986-1990
1981-1985
1976-1980
1971-1975
Fig. 3.1 All childhood cancers, Great Britain, 1971-2010

0
20
40
60
80
100
Perc
enta
ge s
urv
ivin
g
0 5 10 15 20 25 30 35 40 45 50Years since diagnosis
2006-2010
2001-2005
1996-2000
1991-1995
1986-1990
1981-1985
1976-1980
1971-1975
Fig. 3.2 Leukaemias, Great Britain, 1971-2010
0
20
40
60
80
100
Perc
enta
ge s
urv
ivin
g
0 5 10 15 20 25 30 35 40 45 50Years since diagnosis
2006-2010
2001-2005
1996-2000
1991-1995
1986-1990
1981-1985
1976-1980
1971-1975
Fig. 3.3 Lymphomas, Great Britain, 1971-2010

0
20
40
60
80
100
Perc
enta
ge s
urv
ivin
g
0 5 10 15 20 25 30 35 40 45 50Years since diagnosis
2006-2010
2001-2005
1996-2000
1991-1995
1986-1990
1981-1985
1976-1980
1971-1975
Fig. 3.4 CNS tumours, Great Britain, 1971-2010
0
20
40
60
80
100
Perc
enta
ge s
urv
ivin
g
0 5 10 15 20 25 30 35 40 45 50Years since diagnosis
2006-2010
2001-2005
1996-2000
1991-1995
1986-1990
1981-1985
1976-1980
1971-1975
Fig. 3.5 Neuroblastoma etc., Great Britain, 1971-2010

0
20
40
60
80
100
Perc
enta
ge s
urv
ivin
g
0 5 10 15 20 25 30 35 40 45 50Years since diagnosis
2006-2010
2001-2005
1996-2000
1991-1995
1986-1990
1981-1985
1976-1980
1971-1975
Fig. 3.6 Retinoblastoma, Great Britain, 1971-2010
0
20
40
60
80
100
Perc
enta
ge s
urv
ivin
g
0 5 10 15 20 25 30 35 40 45 50Years since diagnosis
2006-2010
2001-2005
1996-2000
1991-1995
1986-1990
1981-1985
1976-1980
1971-1975
Fig. 3.7 Renal tumours, Great Britain, 1971-2010

0
20
40
60
80
100
Perc
enta
ge s
urv
ivin
g
0 5 10 15 20 25 30 35 40 45 50Years since diagnosis
2006-2010
2001-2005
1996-2000
1991-1995
1986-1990
1981-1985
1976-1980
1971-1975
Fig. 3.8 Hepatic tumours, Great Britain, 1971-2010
0
20
40
60
80
100
Perc
enta
ge s
urv
ivin
g
0 5 10 15 20 25 30 35 40 45 50Years since diagnosis
2006-2010
2001-2005
1996-2000
1991-1995
1986-1990
1981-1985
1976-1980
1971-1975
Fig. 3.9 Bone tumours, Great Britain, 1971-2010

0
20
40
60
80
100
Perc
enta
ge s
urv
ivin
g
0 5 10 15 20 25 30 35 40 45 50Years since diagnosis
2006-2010
2001-2005
1996-2000
1991-1995
1986-1990
1981-1985
1976-1980
1971-1975
Fig. 3.10 Soft tissue sarcomas, Great Britain, 1971-2010
0
20
40
60
80
100
Perc
enta
ge s
urv
ivin
g
0 5 10 15 20 25 30 35 40 45 50Years since diagnosis
2006-2010
2001-2005
1996-2000
1991-1995
1986-1990
1981-1985
1976-1980
1971-1975
Fig. 3.11 Germ-cell & gonadal, Great Britain, 1971-2010

0
20
40
60
80
100
Perc
enta
ge s
urv
ivin
g
0 5 10 15 20 25 30 35 40 45 50Years since diagnosis
2006-2010
2001-2005
1996-2000
1991-1995
1978-1990
Fig. 3.12 All childhood cancers, CCLG
0
20
40
60
80
100
Perc
enta
ge s
urv
ivin
g
0 5 10 15 20 25 30 35 40 45 50Years since diagnosis
2006-2010
2001-2005
1996-2000
1991-1995
1978-1990
Fig. 3.13 Precursor-cell ALL, CCLG

0
20
40
60
80
100
Perc
enta
ge s
urv
ivin
g
0 5 10 15 20 25 30 35 40 45 50Years since diagnosis
2001-2010
1978-2000
Fig. 3.14 Mature B-cell leukaemia, CCLG
0
20
40
60
80
100
Perc
enta
ge s
urv
ivin
g
0 5 10 15 20 25 30 35 40 45 50Years since diagnosis
2006-2010
2001-2005
1996-2000
1991-1995
1978-1990
Fig. 3.15 Acute myeloid leukaemia, CCLG

0
20
40
60
80
100
Perc
enta
ge s
urv
ivin
g
0 5 10 15 20 25 30 35 40 45 50Years since diagnosis
2006-2010
2001-2005
1996-2000
1991-1995
1978-1990
Fig. 3.16 Chronic myeloid leukaemia, CCLG
0
20
40
60
80
100
Perc
enta
ge s
urv
ivin
g
0 5 10 15 20 25 30 35 40 45 50Years since diagnosis
2006-2010
2001-2005
1996-2000
1991-1995
1978-1990
Fig. 3.17 Myelodysplasia, CCLG
0
20
40
60
80
100
Perc
enta
ge s
urv
ivin
g
0 5 10 15 20 25 30 35 40 45 50Years since diagnosis
2006-2010
2001-2005
1996-2000
1991-1995
1978-1990
Fig. 3.18 JMML and CMML, CCLG
0
20
40
60
80
100
Perc
enta
ge s
urv
ivin
g
0 5 10 15 20 25 30 35 40 45 50Years since diagnosis
2001-2010
1978-2000
Fig. 3.19 Other and unspecified leukaemia, CCLG

0
20
40
60
80
100
Perc
enta
ge s
urv
ivin
g
0 5 10 15 20 25 30 35 40 45 50Years since diagnosis
2006-2010
2001-2005
1996-2000
1991-1995
1978-1990
Fig. 3.20 Hodgkin lymphoma, CCLG
0
20
40
60
80
100
Perc
enta
ge s
urv
ivin
g
0 5 10 15 20 25 30 35 40 45 50Years since diagnosis
2006-2010
2001-2005
1996-2000
1991-1995
1978-1990
Fig. 3.21 Non-Hodgkin lymphoma, CCLG
0
20
40
60
80
100
Perc
enta
ge s
urv
ivin
g
0 5 10 15 20 25 30 35 40 45 50Years since diagnosis
2006-2010
2001-2005
1996-2000
1991-1995
1978-1990
Fig. 3.22 Ependymoma, CCLG
0
20
40
60
80
100
Perc
enta
ge s
urv
ivin
g
0 5 10 15 20 25 30 35 40 45 50Years since diagnosis
2001-2010
1978-2000
Fig. 3.23 Choroid plexus papilloma, CCLG
0
20
40
60
80
100
Perc
enta
ge s
urv
ivin
g
0 5 10 15 20 25 30 35 40 45 50Years since diagnosis
2001-2010
1978-2000
Fig. 3.24 Choroid plexus carcinoma, CCLG
0
20
40
60
80
100
Perc
enta
ge s
urv
ivin
g
0 5 10 15 20 25 30 35 40 45 50Years since diagnosis
2006-2010
2001-2005
1996-2000
1991-1995
1978-1990
Fig. 3.25 Low-grade astrocytoma, CCLG

0
20
40
60
80
100
Perc
enta
ge s
urv
ivin
g
0 5 10 15 20 25 30 35 40 45 50Years since diagnosis
2006-2010
2001-2005
1996-2000
1991-1995
1978-1990
Fig. 3.26 High-grade astrocytoma, CCLG
0
20
40
60
80
100
Perc
enta
ge s
urv
ivin
g
0 5 10 15 20 25 30 35 40 45 50Years since diagnosis
2006-2010
2001-2005
1996-2000
1991-1995
1978-1990
Fig. 3.27 Unspecified astrocytoma, CCLG

0
20
40
60
80
100
Perc
enta
ge s
urv
ivin
g
0 5 10 15 20 25 30 35 40 45 50Years since diagnosis
2006-2010
2001-2005
1996-2000
1991-1995
1978-1990
Fig. 3.28 Medulloblastoma, CCLG
0
20
40
60
80
100
Perc
enta
ge s
urv
ivin
g
0 5 10 15 20 25 30 35 40 45 50Years since diagnosis
2006-2010
2001-2005
1996-2000
1991-1995
1978-1990
Fig. 3.29 CNS PNET, CCLG
0
20
40
60
80
100
Perc
enta
ge s
urv
ivin
g
0 5 10 15 20 25 30 35 40 45 50Years since diagnosis
2001-2010
1978-2000
Fig. 3.30 Atypical teratoid/rhabdoid tumour, CCLG
0
20
40
60
80
100
Perc
enta
ge s
urv
ivin
g
0 5 10 15 20 25 30 35 40 45 50Years since diagnosis
2001-2010
1978-2000
Fig. 3.31 Oligodendroglioma, CCLG
0
20
40
60
80
100
Perc
enta
ge s
urv
ivin
g
0 5 10 15 20 25 30 35 40 45 50Years since diagnosis
2006-2010
2001-2005
1996-2000
1991-1995
1978-1990
Fig. 3.32 Other glioma, CCLG
0
20
40
60
80
100
Perc
enta
ge s
urv
ivin
g
0 5 10 15 20 25 30 35 40 45 50Years since diagnosis
2001-2010
1978-2000
Fig. 3.33 Pituitary carcinoma and adenoma, CCLG
0
20
40
60
80
100
Perc
enta
ge s
urv
ivin
g
0 5 10 15 20 25 30 35 40 45 50Years since diagnosis
Fig. 3.35 Pinealoma and pineocytoma, CCLG
0
20
40
60
80
100
Perc
enta
ge s
urv
ivin
g
0 5 10 15 20 25 30 35 40 45 50Years since diagnosis
2006-2010
2001-2005
1996-2000
1991-1995
1978-1990
Fig. 3.34 Craniopharyngioma, CCLG

0
20
40
60
80
100
Perc
enta
ge s
urv
ivin
g
0 5 10 15 20 25 30 35 40 45 50Years since diagnosis
2001-2010
1978-2000
Fig. 3.36 Pineoblastoma, CCLG
0
20
40
60
80
100
Perc
enta
ge s
urv
ivin
g
0 5 10 15 20 25 30 35 40 45 50Years since diagnosis
2001-2010
1978-2000
Fig. 3.37 Ganglioglioma, CCLG
0
20
40
60
80
100
Perc
enta
ge s
urv
ivin
g
0 5 10 15 20 25 30 35 40 45 50Years since diagnosis
Fig. 3.38 Desmoplastic infantile astrocytoma, CCLG
0
20
40
60
80
100
Perc
enta
ge s
urv
ivin
g
0 5 10 15 20 25 30 35 40 45 50Years since diagnosis
Fig. 3.39 Dysembryoplastic neuroepithelial tumour, CCLG

0
20
40
60
80
100
Perc
enta
ge s
urv
ivin
g
0 5 10 15 20 25 30 35 40 45 50Years since diagnosis
2006-2010
2001-2005
1996-2000
1991-1995
1978-1990
Fig. 3.41 Unspecified CNS tumours, CCLG
0
20
40
60
80
100
Perc
enta
ge s
urv
ivin
g
0 5 10 15 20 25 30 35 40 45 50Years since diagnosis
2001-2010
1978-2000
Fig. 3.40 Meningioma, CCLG
0
20
40
60
80
100
Perc
enta
ge s
urv
ivin
g
0 5 10 15 20 25 30 35 40 45 50Years since diagnosis
2006-2010
2001-2005
1996-2000
1991-1995
1978-1990
Fig. 3.42 Brain stem tumours, CCLG
0
20
40
60
80
100
Perc
enta
ge s
urv
ivin
g
0 5 10 15 20 25 30 35 40 45 50Years since diagnosis
2006-2010
2001-2005
1996-2000
1991-1995
1978-1990
Fig. 3.43 Brain stem astrocytoma, low grade, CCLG
0
20
40
60
80
100
Perc
enta
ge s
urv
ivin
g
0 5 10 15 20 25 30 35 40 45 50Years since diagnosis
2001-2010
1978-2000
Fig. 3.44 Brain stem astrocytoma, high grade, CCLG
0
20
40
60
80
100
Perc
enta
ge s
urv
ivin
g
0 5 10 15 20 25 30 35 40 45 50Years since diagnosis
2006-2010
2001-2005
1996-2000
1991-1995
1978-1990
Fig. 3.45 Brain stem tumours - other & unspecified, CCLG

0
20
40
60
80
100
Perc
enta
ge s
urv
ivin
g
0 5 10 15 20 25 30 35 40 45 50Years since diagnosis
2001-2010
1978-2000
Fig. 3.46 Spinal cord ependymoma, CCLG
0
20
40
60
80
100
Perc
enta
ge s
urv
ivin
g
0 5 10 15 20 25 30 35 40 45 50Years since diagnosis
2006-2010
2001-2005
1996-2000
1991-1995
1978-1990
Fig. 3.47 Spinal cord astrocytoma, CCLG
0
20
40
60
80
100
Perc
enta
ge s
urv
ivin
g
0 5 10 15 20 25 30 35 40 45 50Years since diagnosis
2006-2010
2001-2005
1996-2000
1991-1995
1978-1990
Fig. 3.48 Neuroblastoma, CCLG
0
20
40
60
80
100
Perc
enta
ge s
urv
ivin
g
0 5 10 15 20 25 30 35 40 45 50Years since diagnosis
2006-2010
2001-2005
1996-2000
1991-1995
1978-1990
Fig. 3.49 Retinoblastoma, bilateral, CCLG

0
20
40
60
80
100
Perc
enta
ge s
urv
ivin
g
0 5 10 15 20 25 30 35 40 45 50Years since diagnosis
2006-2010
2001-2005
1996-2000
1991-1995
1978-1990
Fig. 3.50 Retinoblastoma, unilateral, CCLG
0
20
40
60
80
100
Perc
enta
ge s
urv
ivin
g
0 5 10 15 20 25 30 35 40 45 50Years since diagnosis
2006-2010
2001-2005
1996-2000
1991-1995
1978-1990
Fig. 3.51 Wilms tumour, CCLG

0
20
40
60
80
100
Perc
enta
ge s
urv
ivin
g
0 5 10 15 20 25 30 35 40 45 50Years since diagnosis
2001-2010
1978-2000
Fig. 3.52 Rhabdoid renal tumour, CCLG
0
20
40
60
80
100
Perc
enta
ge s
urv
ivin
g
0 5 10 15 20 25 30 35 40 45 50Years since diagnosis
2001-2010
1978-2000
Fig. 3.53 Renal clear-cell sarcoma, CCLG

0
20
40
60
80
100
Perc
enta
ge s
urv
ivin
g
0 5 10 15 20 25 30 35 40 45 50Years since diagnosis
Fig. 3.54 Renal PNET, CCLG
0
20
40
60
80
100
Perc
enta
ge s
urv
ivin
g
0 5 10 15 20 25 30 35 40 45 50Years since diagnosis
Fig. 3.55 Renal carcinoma, CCLG

0
20
40
60
80
100
Perc
enta
ge s
urv
ivin
g
0 5 10 15 20 25 30 35 40 45 50Years since diagnosis
2006-2010
2001-2005
1996-2000
1991-1995
1978-1990
Fig. 3.56 Hepatoblastoma, CCLG
0
20
40
60
80
100
Perc
enta
ge s
urv
ivin
g
0 5 10 15 20 25 30 35 40 45 50Years since diagnosis
2001-2010
1978-2000
Fig. 3.57 Hepatic carcinoma, CCLG

0
20
40
60
80
100
Perc
enta
ge s
urv
ivin
g
0 5 10 15 20 25 30 35 40 45 50Years since diagnosis
2006-2010
2001-2005
1996-2000
1991-1995
1978-1990
Fig. 3.58 Osteosarcoma, CCLG
0
20
40
60
80
100
Perc
enta
ge s
urv
ivin
g
0 5 10 15 20 25 30 35 40 45 50Years since diagnosis
Fig. 3.59 Chondrosarcoma, CCLG
0
20
40
60
80
100
Perc
enta
ge s
urv
ivin
g
0 5 10 15 20 25 30 35 40 45 50Years since diagnosis
2006-2010
2001-2005
1996-2000
1991-1995
1978-1990
Fig. 3.60 Ewing sarcoma of bone, CCLG
0
20
40
60
80
100
Perc
enta
ge s
urv
ivin
g
0 5 10 15 20 25 30 35 40 45 50Years since diagnosis
2006-2010
2001-2005
1996-2000
1991-1995
1978-1990
Fig. 3.61 Rhabdomyosarcoma, CCLG

0
20
40
60
80
100
Perc
enta
ge s
urv
ivin
g
0 5 10 15 20 25 30 35 40 45 50Years since diagnosis
2001-2010
1978-2000
Fig. 3.62 Malignant peripheral nerve sheath tumour, CCLG
0
20
40
60
80
100
Perc
enta
ge s
urv
ivin
g
0 5 10 15 20 25 30 35 40 45 50Years since diagnosis
2001-2010
1978-2000
Fig. 3.63 Other fibrosarcoma etc, CCLG
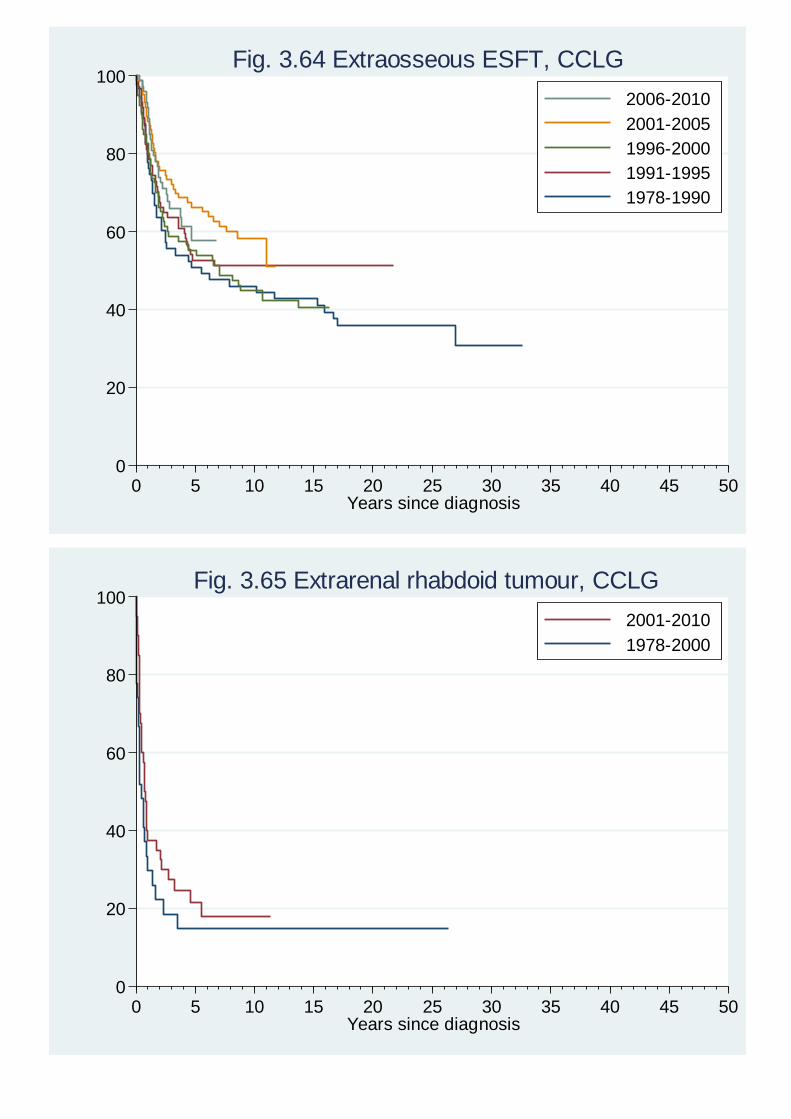
0
20
40
60
80
100
Perc
enta
ge s
urv
ivin
g
0 5 10 15 20 25 30 35 40 45 50Years since diagnosis
2006-2010
2001-2005
1996-2000
1991-1995
1978-1990
Fig. 3.64 Extraosseous ESFT, CCLG
0
20
40
60
80
100
Perc
enta
ge s
urv
ivin
g
0 5 10 15 20 25 30 35 40 45 50Years since diagnosis
2001-2010
1978-2000
Fig. 3.65 Extrarenal rhabdoid tumour, CCLG

0
20
40
60
80
100
Perc
enta
ge s
urv
ivin
g
0 5 10 15 20 25 30 35 40 45 50Years since diagnosis
2001-2010
1978-2000
Fig. 3.66 Synovial sarcoma, CCLG
0
20
40
60
80
100
Perc
enta
ge s
urv
ivin
g
0 5 10 15 20 25 30 35 40 45 50Years since diagnosis
Fig. 3.67 Leiomyosarcoma, CCLG

0
20
40
60
80
100
Perc
enta
ge s
urv
ivin
g
0 5 10 15 20 25 30 35 40 45 50Years since diagnosis
Fig. 3.68 Fibrohistiocytic tumours, CCLG
0
20
40
60
80
100
Perc
enta
ge s
urv
ivin
g
0 5 10 15 20 25 30 35 40 45 50Years since diagnosis
Fig. 3.69 Alveolar soft part sarcoma, CCLG

0
20
40
60
80
100
Perc
enta
ge s
urv
ivin
g
0 5 10 15 20 25 30 35 40 45 50Years since diagnosis
Fig. 3.70 Desmoplastic small round cell tumour, CCLG
0
20
40
60
80
100
Perc
enta
ge s
urv
ivin
g
0 5 10 15 20 25 30 35 40 45 50Years since diagnosis
2001-2010
1978-2000
Fig. 3.71 Other specified soft-tissue sarcoma, CCLG
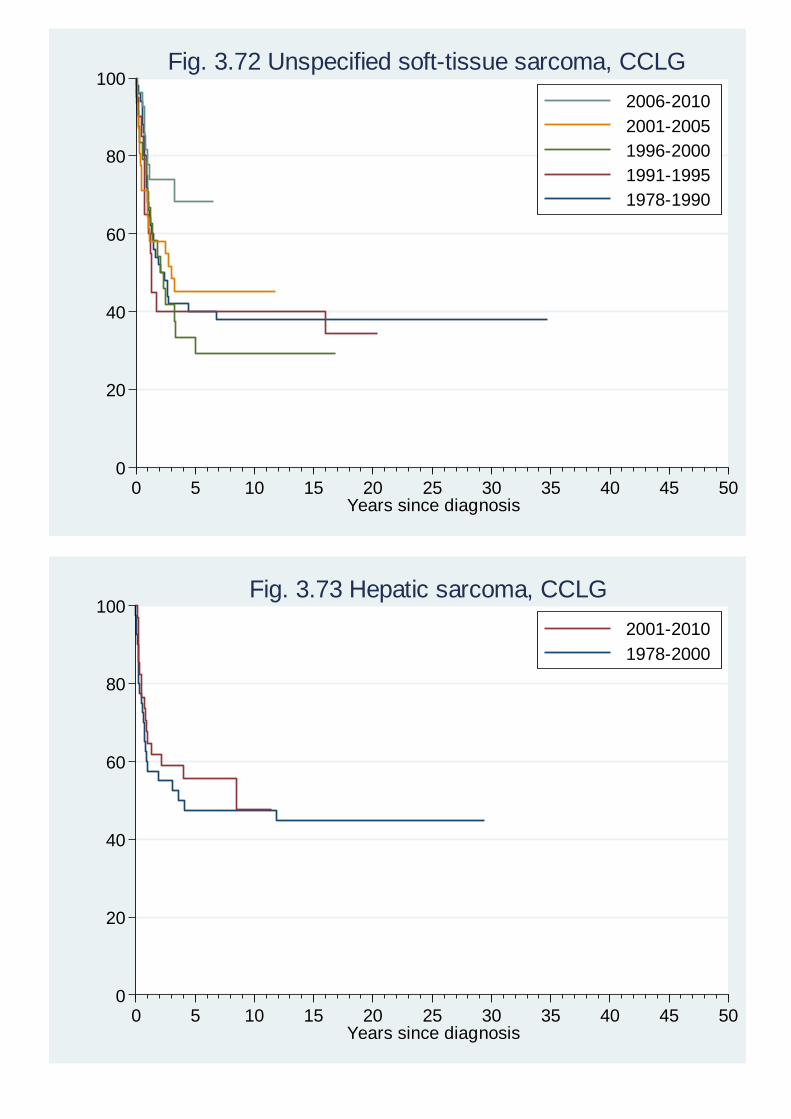
0
20
40
60
80
100
Perc
enta
ge s
urv
ivin
g
0 5 10 15 20 25 30 35 40 45 50Years since diagnosis
2006-2010
2001-2005
1996-2000
1991-1995
1978-1990
Fig. 3.72 Unspecified soft-tissue sarcoma, CCLG
0
20
40
60
80
100
Perc
enta
ge s
urv
ivin
g
0 5 10 15 20 25 30 35 40 45 50Years since diagnosis
2001-2010
1978-2000
Fig. 3.73 Hepatic sarcoma, CCLG
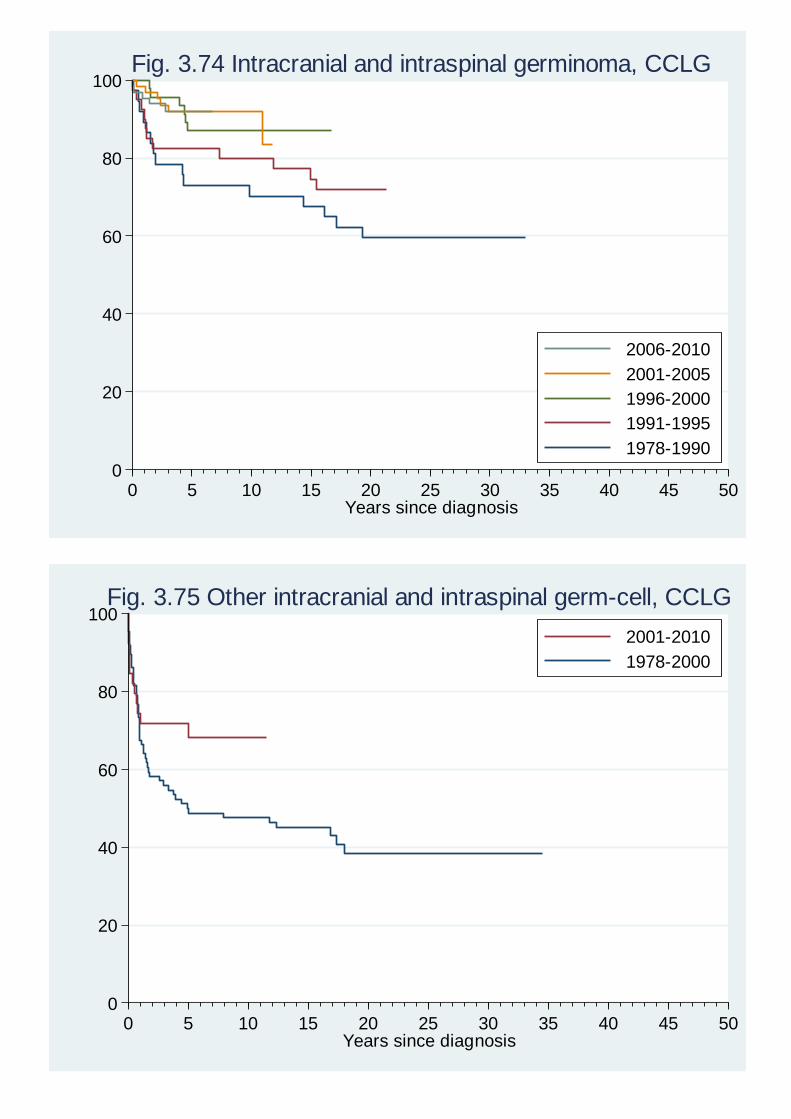
0
20
40
60
80
100
Perc
enta
ge s
urv
ivin
g
0 5 10 15 20 25 30 35 40 45 50Years since diagnosis
2006-2010
2001-2005
1996-2000
1991-1995
1978-1990
Fig. 3.74 Intracranial and intraspinal germinoma, CCLG
0
20
40
60
80
100
Perc
enta
ge s
urv
ivin
g
0 5 10 15 20 25 30 35 40 45 50Years since diagnosis
2001-2010
1978-2000
Fig. 3.75 Other intracranial and intraspinal germ-cell, CCLG

0
20
40
60
80
100
Perc
enta
ge s
urv
ivin
g
0 5 10 15 20 25 30 35 40 45 50Years since diagnosis
2006-2010
2001-2005
1996-2000
1991-1995
1978-1990
Fig. 3.76 Other malignant extragonadal germ-cell, CCLG
0
20
40
60
80
100
Perc
enta
ge s
urv
ivin
g
0 5 10 15 20 25 30 35 40 45 50Years since diagnosis
2006-2010
2001-2005
1996-2000
1991-1995
1978-1990
Fig. 3.77 Malignant gonadal germ-cell tumours, CCLG

0
20
40
60
80
100
Perc
enta
ge s
urv
ivin
g
0 5 10 15 20 25 30 35 40 45 50Years since diagnosis
Fig. 3.78 Other malignant gonadal tumours, CCLG
0
20
40
60
80
100
Perc
enta
ge s
urv
ivin
g
0 5 10 15 20 25 30 35 40 45 50Years since diagnosis
2001-2010
1978-2000
Fig. 3.79 Adrenocortical carcinoma, CCLG

0
20
40
60
80
100
Perc
enta
ge s
urv
ivin
g
0 5 10 15 20 25 30 35 40 45 50Years since diagnosis
2001-2010
1978-2000
Fig. 3.80 Thyroid carcinoma, non-medullary, CCLG
0
20
40
60
80
100
Perc
enta
ge s
urv
ivin
g
0 5 10 15 20 25 30 35 40 45 50Years since diagnosis
Fig. 3.81 Thyroid carcinoma, medullary, CCLG

0
20
40
60
80
100
Perc
enta
ge s
urv
ivin
g
0 5 10 15 20 25 30 35 40 45 50Years since diagnosis
2001-2010
1978-2000
Fig. 3.82 Nasopharyngeal carcinoma, CCLG
0
20
40
60
80
100
Perc
enta
ge s
urv
ivin
g
0 5 10 15 20 25 30 35 40 45 50Years since diagnosis
2001-2010
1978-2000
Fig. 3.83 Malignant melanoma, CCLG

0
20
40
60
80
100
Perc
enta
ge s
urv
ivin
g
0 5 10 15 20 25 30 35 40 45 50Years since diagnosis
Fig. 3.84 Salivary gland carcinoma, CCLG
0
20
40
60
80
100
Perc
enta
ge s
urv
ivin
g
0 5 10 15 20 25 30 35 40 45 50Years since diagnosis
Fig. 3.85 Colorectal carcinoma, CCLG

0
20
40
60
80
100
Perc
enta
ge s
urv
ivin
g
0 5 10 15 20 25 30 35 40 45 50Years since diagnosis
2001-2010
1978-2000
Fig. 3.86 Miscellaneous other carcinoma, CCLG
0
20
40
60
80
100
Perc
enta
ge s
urv
ivin
g
0 5 10 15 20 25 30 35 40 45 50Years since diagnosis
Fig. 3.87 Pleuropulmonary blastoma, CCLG

0
20
40
60
80
100
Perc
enta
ge s
urv
ivin
g
0 5 10 15 20 25 30 35 40 45 50Years since diagnosis
Fig. 3.88 Lymphoproliferative disease, CCLG
0
20
40
60
80
100
Perc
enta
ge s
urv
ivin
g
0 5 10 15 20 25 30 35 40 45 50Years since diagnosis
2006-2010
2001-2005
1996-2000
1991-1995
1978-1990
Fig. 3.89 Langerhans cell histiocytosis, single system, CCLG

0
20
40
60
80
100
Perc
enta
ge s
urv
ivin
g
0 5 10 15 20 25 30 35 40 45 50Years since diagnosis
2006-2010
2001-2005
1996-2000
1991-1995
1978-1990
Fig. 3.90 Langerhans cell histiocytosis, multi system, CCLG
0
20
40
60
80
100
Perc
enta
ge s
urv
ivin
g
0 5 10 15 20 25 30 35 40 45 50Years since diagnosis
2006-2010
2001-2005
1996-2000
1991-1995
1978-1990
Fig. 3.91 Haemophagocytic lymphohistiocytosis, CCLG

0
20
40
60
80
100
Perc
enta
ge s
urv
ivin
g
0 5 10 15 20 25 30 35 40 45 50Years since diagnosis
2006-2010
2001-2005
1996-2000
1991-1995
1978-1990
Fig. 3.92 Ganglioneuroma, CCLG
0
20
40
60
80
100
Perc
enta
ge s
urv
ivin
g
0 5 10 15 20 25 30 35 40 45 50Years since diagnosis
2001-2010
1978-2000
Fig. 3.93 Mesoblastic nephroma, CCLG

0
20
40
60
80
100
Perc
enta
ge s
urv
ivin
g
0 5 10 15 20 25 30 35 40 45 50Years since diagnosis
2001-2010
1978-2000
Fig. 3.94 Fibromatosis, CCLG
0
20
40
60
80
100
Perc
enta
ge s
urv
ivin
g
0 5 10 15 20 25 30 35 40 45 50Years since diagnosis
2006-2010
2001-2005
1996-2000
1991-1995
1978-1990
Fig. 3.95 Misc non-malignant soft-tissue tumours, CCLG
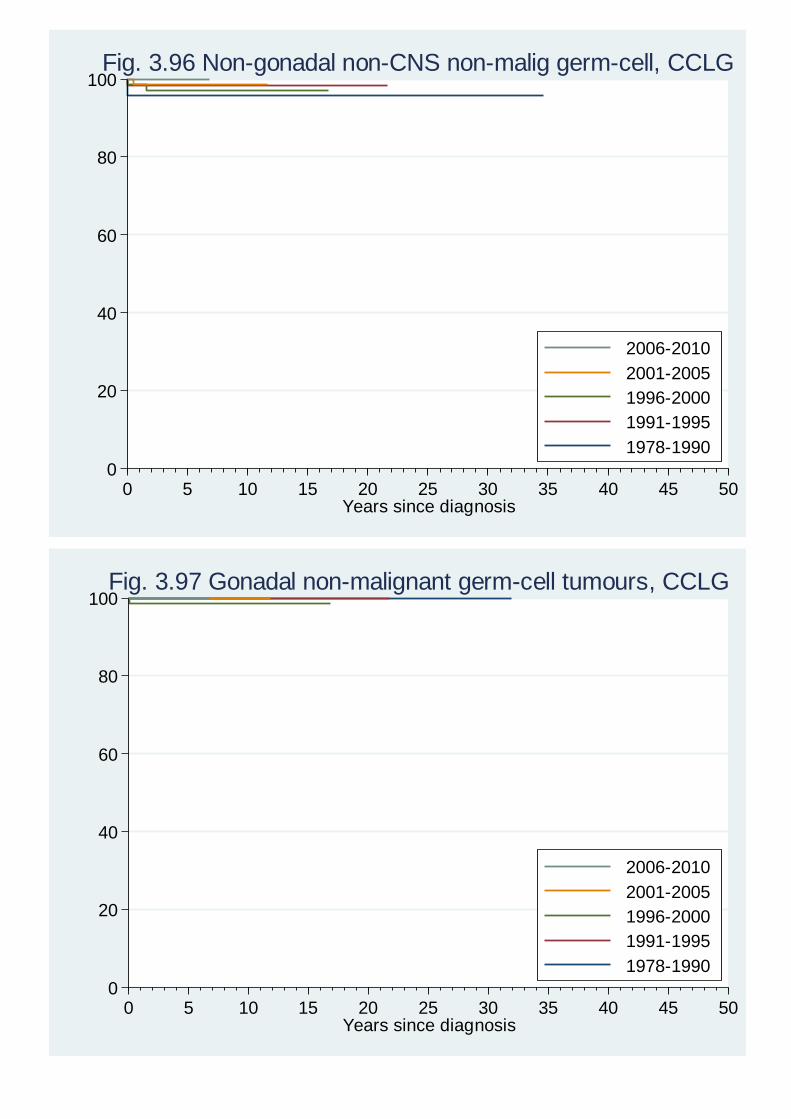
0
20
40
60
80
100
Perc
enta
ge s
urv
ivin
g
0 5 10 15 20 25 30 35 40 45 50Years since diagnosis
2006-2010
2001-2005
1996-2000
1991-1995
1978-1990
Fig. 3.96 Non-gonadal non-CNS non-malig germ-cell, CCLG
0
20
40
60
80
100
Perc
enta
ge s
urv
ivin
g
0 5 10 15 20 25 30 35 40 45 50Years since diagnosis
2006-2010
2001-2005
1996-2000
1991-1995
1978-1990
Fig. 3.97 Gonadal non-malignant germ-cell tumours, CCLG

0
20
40
60
80
100
Perc
enta
ge s
urv
ivin
g
0 5 10 15 20 25 30 35 40 45 50Years since diagnosis
2001-2010
1978-2000
Fig. 3.98 Non-malignant specialised gonadal tumours, CCLG
0
20
40
60
80
100
Perc
enta
ge s
urv
ivin
g
0 5 10 15 20 25 30 35 40 45 50Years since diagnosis
Fig. 3.99 Adrenocortical adenoma, CCLG
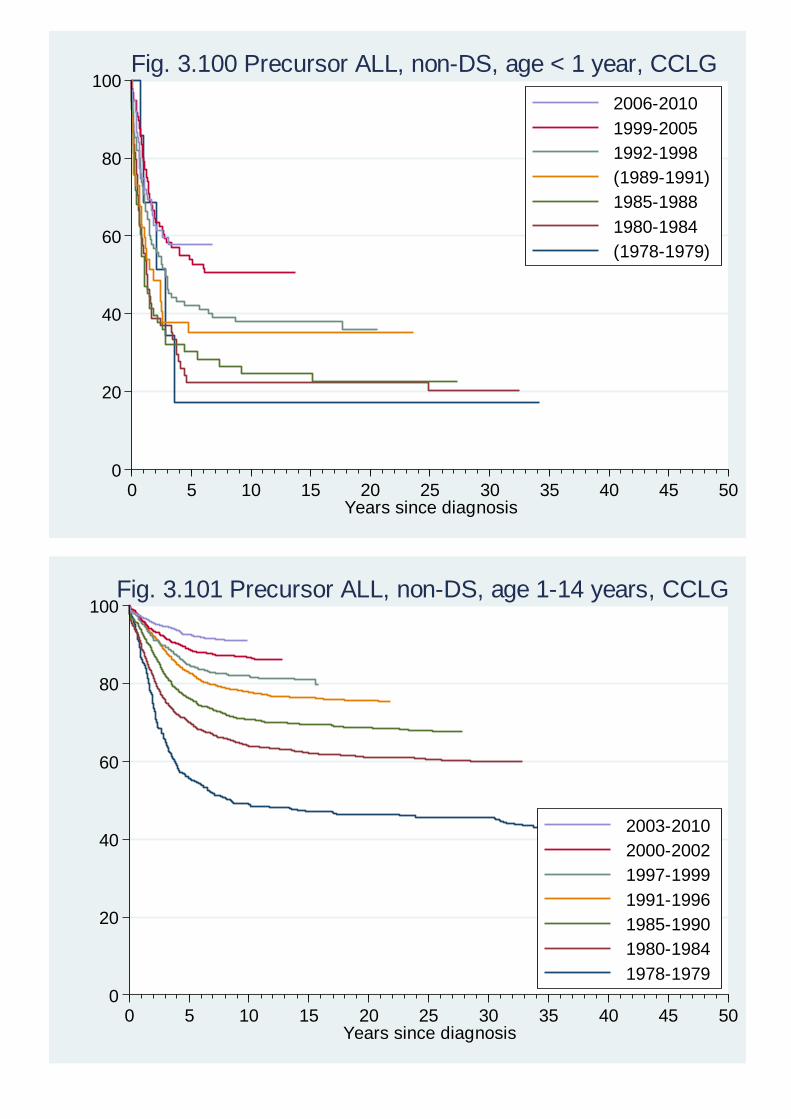
0
20
40
60
80
100
Perc
enta
ge s
urv
ivin
g
0 5 10 15 20 25 30 35 40 45 50Years since diagnosis
2006-2010
1999-2005
1992-1998
(1989-1991)
1985-1988
1980-1984
(1978-1979)
Fig. 3.100 Precursor ALL, non-DS, age < 1 year, CCLG
0
20
40
60
80
100
Perc
enta
ge s
urv
ivin
g
0 5 10 15 20 25 30 35 40 45 50Years since diagnosis
2003-2010
2000-2002
1997-1999
1991-1996
1985-1990
1980-1984
1978-1979
Fig. 3.101 Precursor ALL, non-DS, age 1-14 years, CCLG
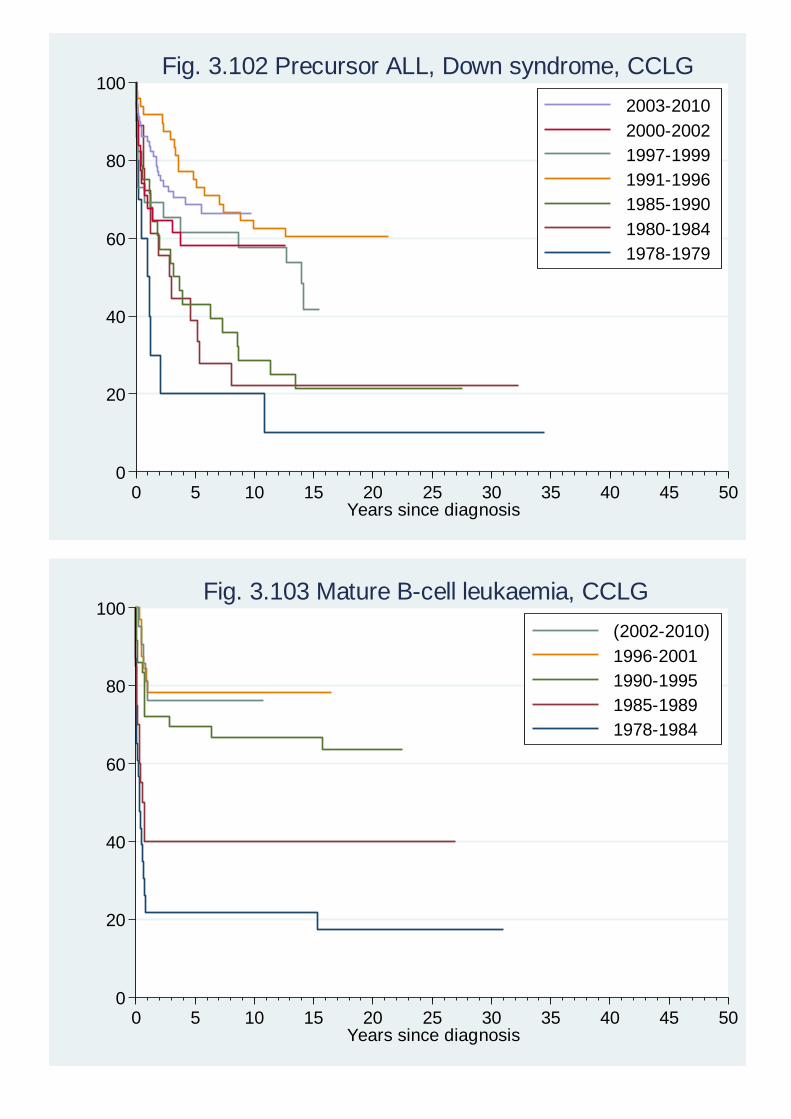
0
20
40
60
80
100
Perc
enta
ge s
urv
ivin
g
0 5 10 15 20 25 30 35 40 45 50Years since diagnosis
2003-2010
2000-2002
1997-1999
1991-1996
1985-1990
1980-1984
1978-1979
Fig. 3.102 Precursor ALL, Down syndrome, CCLG
0
20
40
60
80
100
Perc
enta
ge s
urv
ivin
g
0 5 10 15 20 25 30 35 40 45 50Years since diagnosis
(2002-2010)
1996-2001
1990-1995
1985-1989
1978-1984
Fig. 3.103 Mature B-cell leukaemia, CCLG
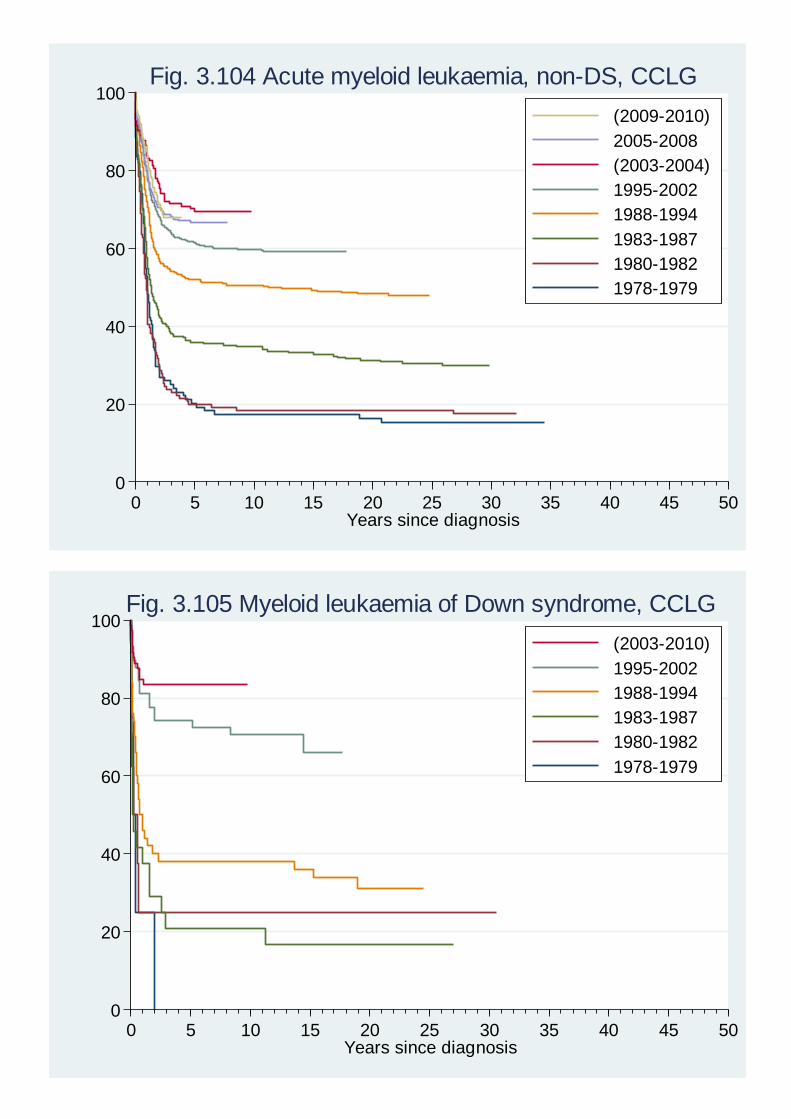
0
20
40
60
80
100
Perc
enta
ge s
urv
ivin
g
0 5 10 15 20 25 30 35 40 45 50Years since diagnosis
(2009-2010)
2005-2008
(2003-2004)
1995-2002
1988-1994
1983-1987
1980-1982
1978-1979
Fig. 3.104 Acute myeloid leukaemia, non-DS, CCLG
0
20
40
60
80
100
Perc
enta
ge s
urv
ivin
g
0 5 10 15 20 25 30 35 40 45 50Years since diagnosis
(2003-2010)
1995-2002
1988-1994
1983-1987
1980-1982
1978-1979
Fig. 3.105 Myeloid leukaemia of Down syndrome, CCLG

0
20
40
60
80
100
Perc
enta
ge s
urv
ivin
g
0 5 10 15 20 25 30 35 40 45 50Years since diagnosis
2008-2010
(2006-2007)
2000-2005
1992-1999
1982-1991
(1978-1981)
Fig. 3.106 Hodgkin lymphoma, CCLG
0
20
40
60
80
100
Perc
enta
ge s
urv
ivin
g
0 5 10 15 20 25 30 35 40 45 50Years since diagnosis
2000-2010
1998-1999
1978-1997
Fig. 3.107 Anaplastic large cell lymphoma, CCLG

0
20
40
60
80
100
Perc
enta
ge s
urv
ivin
g
0 5 10 15 20 25 30 35 40 45 50Years since diagnosis
(2006-2010)
2004-2005
(2000-2003)
1995-1999
1990-1994
1985-1989
1978-1984
Fig. 3.108 Other T-cell non-Hodgkin lymphoma, CCLG
0
20
40
60
80
100
Perc
enta
ge s
urv
ivin
g
0 5 10 15 20 25 30 35 40 45 50Years since diagnosis
(2002-2010)
1996-2001
1990-1995
1985-1989
1978-1984
Fig. 3.109 B-cell non-Hodgkin lymphoma, CCLG

0
20
40
60
80
100
Perc
enta
ge s
urv
ivin
g
0 5 10 15 20 25 30 35 40 45 50Years since diagnosis
(2006-2010)
1992-2005
(1984-1991)
1978-1983
Fig. 3.110 Ependymoma, age 0-2 years, CCLG
0
20
40
60
80
100
Perc
enta
ge s
urv
ivin
g
0 5 10 15 20 25 30 35 40 45 50Years since diagnosis
(2008-2010)
1999-2007
(1984-1998)
1978-1983
Fig. 3.111 Ependymoma, age 3-14 years, CCLG

0
20
40
60
80
100
Perc
enta
ge s
urv
ivin
g
0 5 10 15 20 25 30 35 40 45 50Years since diagnosis
2004-2010
1997-2003
(1978-1996)
Fig. 3.112 Low-grade astrocytoma, CCLG
0
20
40
60
80
100
Perc
enta
ge s
urv
ivin
g
0 5 10 15 20 25 30 35 40 45 50Years since diagnosis
(2004-2010)
2001-2003
(1997-2000)
1992-1996
(1989-1991)
1984-1988
1978-1983
Fig. 3.113 Embryonal CNS tumours, age 0-2 years, CCLG

0
20
40
60
80
100
Perc
enta
ge s
urv
ivin
g
0 5 10 15 20 25 30 35 40 45 50Years since diagnosis
(2007-2010)
2004-2006
(2001-2003)
1992-2000
1984-1991
1978-1983
Fig. 3.114 Embryonal CNS tumours, age 3-14 years, CCLG
0
20
40
60
80
100
Perc
enta
ge s
urv
ivin
g
0 5 10 15 20 25 30 35 40 45 50Years since diagnosis
(2005-2010)
1999-2004
1992-1998
(1978-1991)
Fig. 3.115 Neuroblastoma, age < 1 year, CCLG

0
20
40
60
80
100
Perc
enta
ge s
urv
ivin
g
0 5 10 15 20 25 30 35 40 45 50Years since diagnosis
2003-2010
1999-2002
1990-1998
1985-1989
1982-1984
(1978-1981)
Fig. 3.116 Neuroblastoma, age 1-14 years, CCLG
0
20
40
60
80
100
Perc
enta
ge s
urv
ivin
g
0 5 10 15 20 25 30 35 40 45 50Years since diagnosis
2002-2010
1992-2001
1986-1991
1980-1985
1978-1979
Fig. 3.117 Wilms tumour, CCLG

0
20
40
60
80
100
Perc
enta
ge s
urv
ivin
g
0 5 10 15 20 25 30 35 40 45 50Years since diagnosis
1992-2010
1978-1991
Fig. 3.118 Rhabdoid renal tumour, CCLG
0
20
40
60
80
100
Perc
enta
ge s
urv
ivin
g
0 5 10 15 20 25 30 35 40 45 50Years since diagnosis
1992-2010
1978-1991
Fig. 3.119 Renal clear-cell sarcoma, CCLG

0
20
40
60
80
100
Perc
enta
ge s
urv
ivin
g
0 5 10 15 20 25 30 35 40 45 50Years since diagnosis
diagera120 = 2007-2010
1998-2006
1995-1997
1990-1994
(1978-1989)
Fig. 3.120 Hepatoblastoma, CCLG
0
20
40
60
80
100
Perc
enta
ge s
urv
ivin
g
0 5 10 15 20 25 30 35 40 45 50Years since diagnosis
1998-2010
1990-1997
(1978-1989)
Fig. 3.121 Hepatic carcinoma, CCLG

0
20
40
60
80
100
Perc
enta
ge s
urv
ivin
g
0 5 10 15 20 25 30 35 40 45 50Years since diagnosis
2005-2010
(2003-2004)
1993-2002
1986-1992
1983-1985
1978-1982
Fig. 3.122 Osteosarcoma, CCLG
0
20
40
60
80
100
Perc
enta
ge s
urv
ivin
g
0 5 10 15 20 25 30 35 40 45 50Years since diagnosis
2000-2010
1993-1999
1987-1992
1978-1986
Fig. 3.123 Ewing sarcoma of bone, CCLG
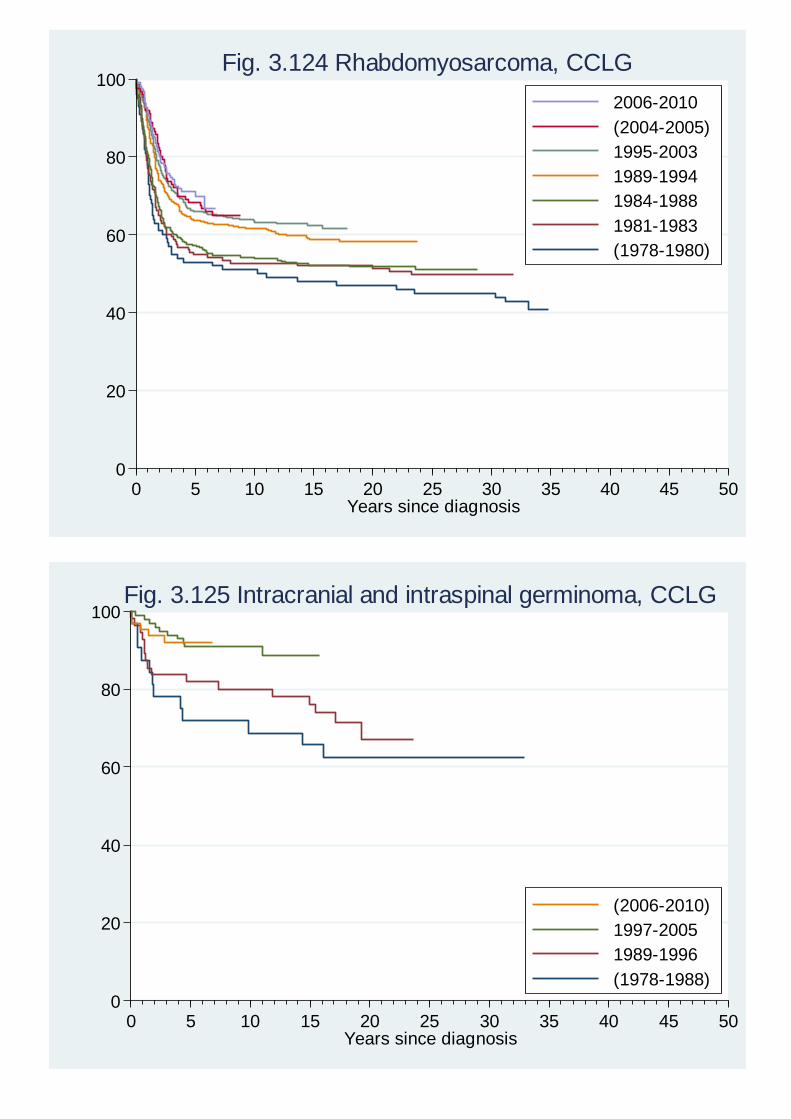
0
20
40
60
80
100
Perc
enta
ge s
urv
ivin
g
0 5 10 15 20 25 30 35 40 45 50Years since diagnosis
2006-2010
(2004-2005)
1995-2003
1989-1994
1984-1988
1981-1983
(1978-1980)
Fig. 3.124 Rhabdomyosarcoma, CCLG
0
20
40
60
80
100
Perc
enta
ge s
urv
ivin
g
0 5 10 15 20 25 30 35 40 45 50Years since diagnosis
(2006-2010)
1997-2005
1989-1996
(1978-1988)
Fig. 3.125 Intracranial and intraspinal germinoma, CCLG

0
20
40
60
80
100
Perc
enta
ge s
urv
ivin
g
0 5 10 15 20 25 30 35 40 45 50Years since diagnosis
(2006-2010)
1997-2005
1989-1996
(1978-1988)
Fig. 3.126 Other intracranial and intraspinal germ-cell, CCLG
0
20
40
60
80
100
Perc
enta
ge s
urv
ivin
g
0 5 10 15 20 25 30 35 40 45 50Years since diagnosis
2005-2010
1989-2004
1983-1988
1978-1982
Fig. 3.127 Other malignant extragonadal germ-cell, CCLG

0
20
40
60
80
100
Perc
enta
ge s
urv
ivin
g
0 5 10 15 20 25 30 35 40 45 50Years since diagnosis
2005-2010
1989-2004
1983-1988
1978-1982
Fig. 3.128 Testicular malignant germ-cell tumours, CCLG
0
20
40
60
80
100
Perc
enta
ge s
urv
ivin
g
0 5 10 15 20 25 30 35 40 45 50Years since diagnosis
2005-2010
1989-2004
1983-1988
1978-1982
Fig. 3.129 Ovarian malignant germ-cell tumours, CCLG
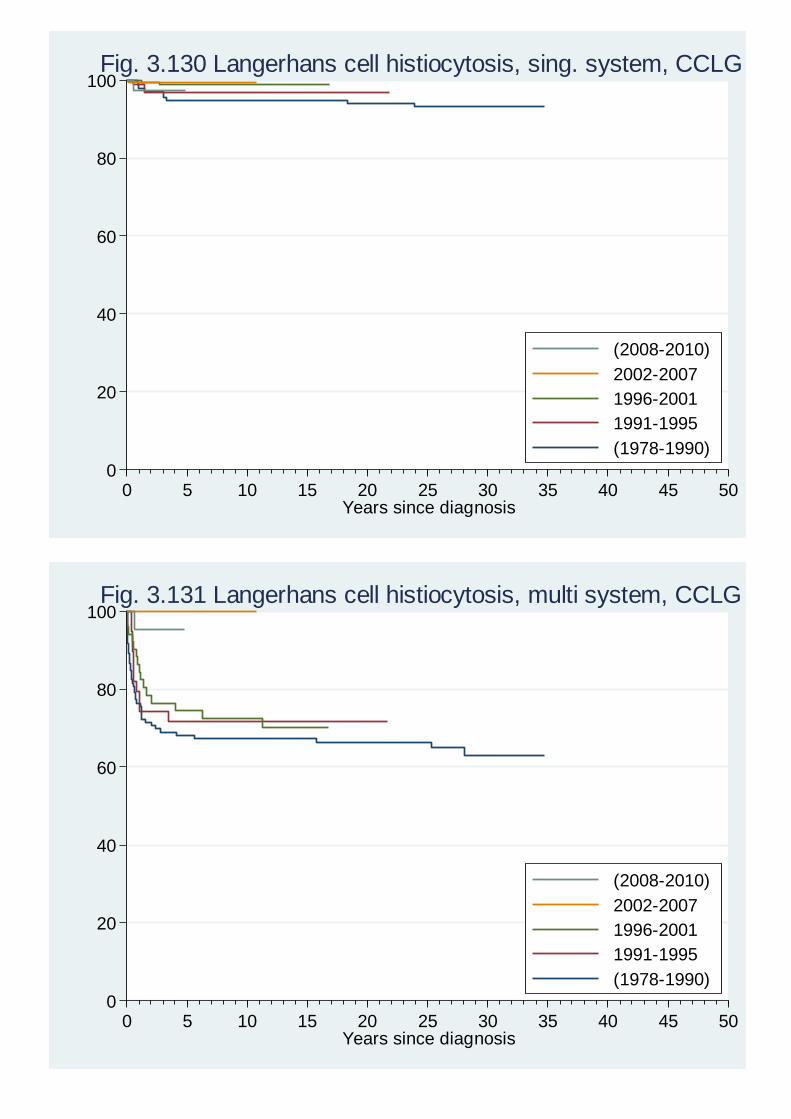
0
20
40
60
80
100
Perc
enta
ge s
urv
ivin
g
0 5 10 15 20 25 30 35 40 45 50Years since diagnosis
(2008-2010)
2002-2007
1996-2001
1991-1995
(1978-1990)
Fig. 3.130 Langerhans cell histiocytosis, sing. system, CCLG
0
20
40
60
80
100
Perc
enta
ge s
urv
ivin
g
0 5 10 15 20 25 30 35 40 45 50Years since diagnosis
(2008-2010)
2002-2007
1996-2001
1991-1995
(1978-1990)
Fig. 3.131 Langerhans cell histiocytosis, multi system, CCLG

0
20
40
60
80
100
Perc
enta
ge s
urv
ivin
g
0 5 10 15 20 25 30 35 40 45 50Years since diagnosis
2006-2010
(2004-2005)
1995-2003
(1978-1994)
Fig. 3.132 Haemophagocytic lymphohistiocytosis, CCLG
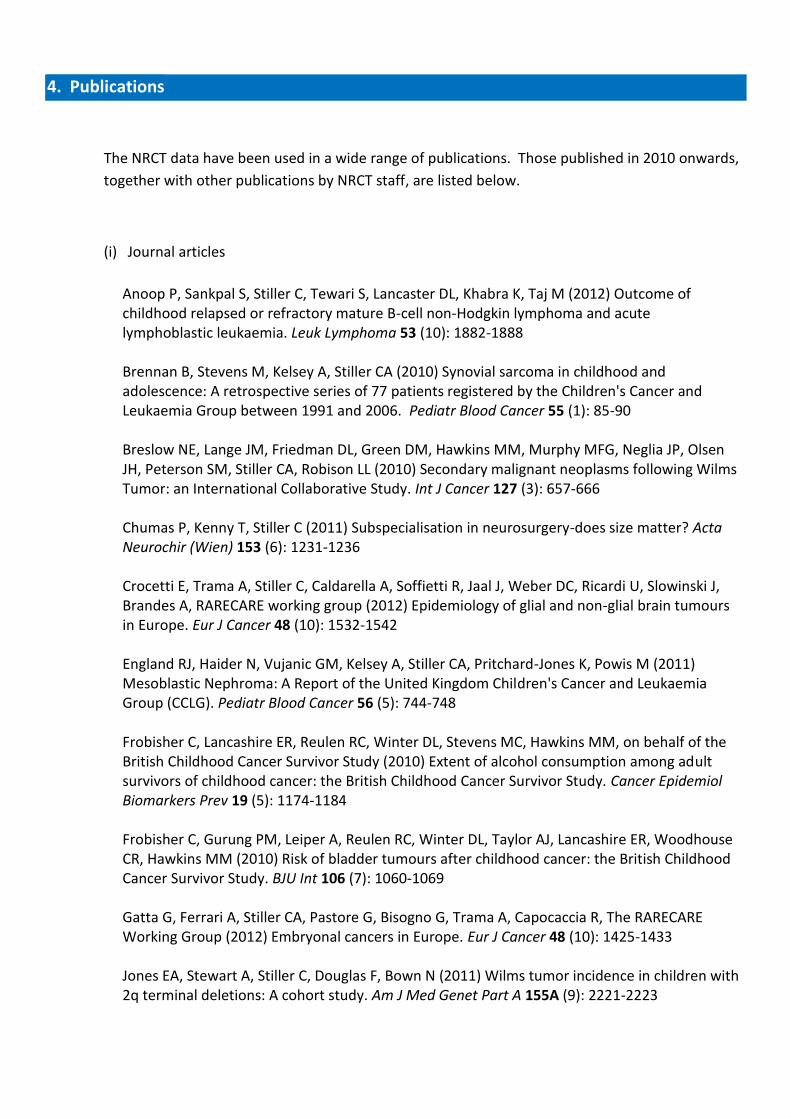
4. Publications
The NRCT data have been used in a wide range of publications. Those published in 2010 onwards,
together with other publications by NRCT staff, are listed below.
(i) Journal articles
Anoop P, Sankpal S, Stiller C, Tewari S, Lancaster DL, Khabra K, Taj M (2012) Outcome of childhood relapsed or refractory mature B-cell non-Hodgkin lymphoma and acute lymphoblastic leukaemia. Leuk Lymphoma 53 (10): 1882-1888 Brennan B, Stevens M, Kelsey A, Stiller CA (2010) Synovial sarcoma in childhood and adolescence: A retrospective series of 77 patients registered by the Children's Cancer and Leukaemia Group between 1991 and 2006. Pediatr Blood Cancer 55 (1): 85-90 Breslow NE, Lange JM, Friedman DL, Green DM, Hawkins MM, Murphy MFG, Neglia JP, Olsen JH, Peterson SM, Stiller CA, Robison LL (2010) Secondary malignant neoplasms following Wilms Tumor: an International Collaborative Study. Int J Cancer 127 (3): 657-666 Chumas P, Kenny T, Stiller C (2011) Subspecialisation in neurosurgery-does size matter? Acta Neurochir (Wien) 153 (6): 1231-1236 Crocetti E, Trama A, Stiller C, Caldarella A, Soffietti R, Jaal J, Weber DC, Ricardi U, Slowinski J, Brandes A, RARECARE working group (2012) Epidemiology of glial and non-glial brain tumours in Europe. Eur J Cancer 48 (10): 1532-1542 England RJ, Haider N, Vujanic GM, Kelsey A, Stiller CA, Pritchard-Jones K, Powis M (2011) Mesoblastic Nephroma: A Report of the United Kingdom Children's Cancer and Leukaemia Group (CCLG). Pediatr Blood Cancer 56 (5): 744-748 Frobisher C, Lancashire ER, Reulen RC, Winter DL, Stevens MC, Hawkins MM, on behalf of the British Childhood Cancer Survivor Study (2010) Extent of alcohol consumption among adult survivors of childhood cancer: the British Childhood Cancer Survivor Study. Cancer Epidemiol Biomarkers Prev 19 (5): 1174-1184 Frobisher C, Gurung PM, Leiper A, Reulen RC, Winter DL, Taylor AJ, Lancashire ER, Woodhouse CR, Hawkins MM (2010) Risk of bladder tumours after childhood cancer: the British Childhood Cancer Survivor Study. BJU Int 106 (7): 1060-1069 Gatta G, Ferrari A, Stiller CA, Pastore G, Bisogno G, Trama A, Capocaccia R, The RARECARE Working Group (2012) Embryonal cancers in Europe. Eur J Cancer 48 (10): 1425-1433 Jones EA, Stewart A, Stiller C, Douglas F, Bown N (2011) Wilms tumor incidence in children with 2q terminal deletions: A cohort study. Am J Med Genet Part A 155A (9): 2221-2223
Keegan TJ, Bunch KJ, Vincent TJ, King JC, O'Neill KA, Kendall GM, MacCarthy A, Fear NT, Murphy MFG (2012) Case-control study of paternal occupation and risk of childhood leukaemia in Great Britain, 1962-2006. Br J Cancer 107 (9): 1652-1659 Kendall GM, Little MP, Wakeford R, Bunch KJ, Miles JCH, Vincent TJ, Meara JR, Murphy MFG (2013) A record-based case-control study of natural background radiation and the incidence of childhood leukaemia and other cancers in Great Britain during 1980-2006. Leukemia 27 (1): 3-9 Kendall GM, Little MP, Wakeford R (2011) Numbers and proportions of leukemias in young people and adults induced by radiation of natural origin. Leuk Res 35 (8): 1039-1043 Kheifets L, Ahlbom A, Crespi CM, Feychting M, Johansen C, Monroe J, Murphy MF, Oksuzyan S, Preston-Martin S, Roman E, Saito T, Savitz D, Schüz J, Simpson J, Swanson J, Tynes T, Verkasalo P, Mezei G (2010) A Pooled Analysis of Extremely Low-Frequency Magnetic Fields and Childhood Brain Tumors. Am J Epidemiol 172 (7): 752-761 Kheifets L, Ahlbom A, Crespi CM, Draper G, Hagihara J, Lowenthal RM, Mezei G, Oksuzyan S, Schüz J, Swanson J, Tittarelli A, Vinceti M, Wunsch Filho V (2010) Pooled analysis of recent studies on magnetic fields and childhood leukaemia. Br J Cancer 103 (7): 1128-1135 Kroll ME, Swanson J, Vincent TJ, Draper GJ (2010) Childhood cancer and magnetic fields from high-voltage power lines in England and Wales: a case-control study. Br J Cancer 103 (7): 1122-1127 Kroll ME, Murphy MFG, Carpenter LM, Stiller CA (2011) Childhood cancer registration in Britain: capture-recapture estimates of completeness of ascertainment. Br J Cancer 104 (7): 1227-1233 Kroll ME, Stiller CA, Murphy MFG, Carpenter LM (2011) Childhood leukaemia and socioeconomic status in England and Wales 1976-2005: evidence of higher incidence in relatively affluent communities persists over time. Br J Cancer 105 (11): 1783-1787 Kroll ME, Carpenter LM, Murphy MFG, Stiller CA (2012) Effects of changes in diagnosis and registration on time trends in recorded childhood cancer incidence in Great Britain. Br J Cancer 107 (7): 1159-1162 Kroll ME, Stiller CA, Richards S, Mitchell C, Carpenter LM (2012) Evidence for under-diagnosis of childhood acute lymphoblastic leukaemia in poorer communities within Great Britain. Br J Cancer 106 (9): 1556-1559 Lancashire ER, Frobisher C, Reulen RC, Winter DL, Glaser A, Hawkins MM (2010) Educational attainment among adult survivors of childhood cancer in great britain: a population-based cohort study. J Natl Cancer Inst 102 (4): 254-270 Little MP, Kleinerman RA, Stiller CA, Li G, Kroll ME, Murphy MFG (2012) Analysis of retinoblastoma age incidence data using a fully stochastic cancer model. Int J Cancer 130 (3): 631-640

MacCarthy A, Bunch KJ, Fear NT, King JC, Vincent TJ, Murphy MFG (2010) Paternal occupation and neuroblastoma: a case-control study based on cancer registry data for Great Britain 1962-1999. Br J Cancer 102 (3): 615-619 McNally RJQ, Blakey K, Parslow RC, James PW, Goméz Pozo B, Stiller C, Vincent TJ, Norman P, McKinney PA, Murphy MF, Craft AW, Feltbower RG (2012) Small-area analyses of bone cancer diagnosed in Great Britain provide clues to aetiology. BMC cancer 12 270 O'Neill KA, Bunch KJ, Vincent TJ, Spector LG, Moorman AV, Murphy MFG (2012) Immunophenotype and cytogenetic characteristics in the relationship between birth weight and childhood leukemia. Pediatr Blood Cancer 58 (1): 7-11 Rebholz CE, Reulen RC, Toogood AA, Frobisher C, Lancashire ER, Winter DL, Kuehni CE, Hawkins MM (2011) Health care use of long-term survivors of childhood cancer: the british childhood cancer survivor study. J Clin Oncol 29 (31): 4181-4188 Reulen RC, Winter DL, Frobisher C, Lancashire ER, Stiller CA, Jenney ME, Skinner R, Stevens MC, Hawkins MM, for the British Childhood Cancer Survivor Study Steering Group (2010) Long-term cause-specific mortality among survivors of childhood cancer. JAMA 304 (2): 172-179 Reulen RC, Frobisher C, Winter DL, Kelly J, Lancashire ER, Stiller CA, Pritchard-Jones K, Jenkinson HC, Hawkins MM, for the British Childhood Cancer Survivor Study Steering Group (2011) Long-term risks of subsequent primary neoplasms among survivors of childhood cancer. JAMA 305 (22): 2311-2319 Satgé D, Stiller CA, Rutkowski S, von Bueren AO, Lacour B, Sommelet D, Nishi M, Massimino M, Garré ML, Moreno F, Hasle H, Jakab Z, Greenberg M, von der Weid N, Kuehni C, Zurriaga O, Vicente ML, Peris-Bonet R, Benesch M, Vekemans M, Sullivan SG, Rickert C (2013) A very rare cancer in Down syndrome: medulloblastoma. Epidemiological data from 13 countries. J Neurooncol 112 (1): 107-114 Scott RH, Murray A, Baskcomb L, Turnbull C, Loveday C, Al-Saadi R, Williams R, Breatnach F, Gerrard M, Hale J, Kohler J, Lapunzina P, Levitt GA, Picton S, Pizer B, Ronghe MD, Traunecker H, Williams D, Kelsey A, Vujanic GM, Sebire NJ, Grundy P, Stiller CA, Pritchard Jones K, Douglas J, Rahman N (2012) Stratification of Wilms tumor by genetic and epigenetic analysis. Oncotarget 3 (3): 327-335 Shah A, Stiller C, Lancaster D, Vincent T, Coleman MP (2010) Leukaemia survival trends in children with Down's syndrome in Great Britain, 1971-2000: a population-based study. J Epidemiol Community Health 64 (7): 604-609
Shah A, Diggens N, Stiller C, Murphy D, Passmore SJ, Murphy MFG (2011) Place of death and hospital care for children who died of cancer in England, 1999-2006. Eur J Cancer 47 (14): 2175-2181
Slade I, Stephens P, Douglas J, Barker K, Stebbings L, Abbaszadeh F, Pritchard-Jones K, FACT collaboration., Cole R, Pizer B, Stiller C, Vujanic G, Scott RH, Stratton MR, Rahman N (2010) Constitutional translocation breakpoint mapping by genome-wide paired-end sequencing identifies HACE1 as a putative Wilms tumor susceptibility gene. J Med Genet 47 (5): 342-347

Slade I, Bacchelli C, Davies H, Murray A, Abbaszadeh F, Hanks S, Barfoot R, Burke A, Chisholm J, Hewitt M, Jenkinson H, King D, Morland B, Pizer B, Prescott K, Sagger A, Side L, Traunecker H, Vaidya S, Ward P, Futreal PA, Vujanic G, Nicholson AG, Sebire N, Turnbull C, Priest JR, Pritchard-Jones K, Houlston R, Stiller C, Stratton MR, Douglas J, Rahman N (2011) DICER1 syndrome: clarifying the diagnosis, clinical features and management implications of a pleiotropic tumour predisposition syndrome. J Med Genet 48 (4): 273-278
Slade I, Murray A, Hanks S, Kumar A, Walker L, Hargrave D, Douglas J, Stiller C, Izatt L, Rahman N (2011) Heterogeneity of familial medulloblastoma and contribution of germline PTCH1 and SUFU mutations to sporadic medulloblastoma. Fam Cancer 10 (2): 337-342
Stiller CA, Trama A, Serraino D, Rossi S, Navarro C, Chirlaque MD, Casali PG, The RARECARE Working Group (2013) Descriptive Epidemiology of Sarcomas in Europe. Report from the RARECARE Project. Eur J Cancer 49 (3): 684-695
Stiller CA, Kroll ME, Pritchard-Jones K (2012) Population survival from childhood cancer in Britain during 1978–2005 by eras of entry to clinical trials. Ann Oncol 23 (9): 2464-2469
Taylor AJ, Little MP, Winter DL, Sugden E, Ellison DW, Stiller CA, Stovall M, Frobisher C, Lancashire ER, Reulen RC, Hawkins MM (2010) Population-based risks of CNS tumors in survivors of childhood cancer: The British Childhood Cancer Survivor Study. J Clin Oncol 28 (36): 5287-5293
Turnbull C, Perdeaux ER, Pernet D, Naranjo A, Renwick A, Seal S, Munoz-Xicola RM, Hanks S, Slade I, Zachariou A, Warren-Perry M, Ruark E, Gerrard M, Hale J, Hewitt M, Kohler J, Lane S, Levitt G, Madi M, Morland B, Neefjes V, Nicholson J, Picton S, Pizer B, Ronghe M, Stevens M, Traunecker H, Stiller CA, Pritchard-Jones K, Dome J, Grundy P, Rahman N (2012) A genome-wide association study identifies susceptibility loci for Wilms tumor. Nat Genet 44 (6): 681-684
Visser O, Trama A, Maynadié M, Stiller C, Marcos-Gragera R, De Angelis R, Mallone S, Tereanu C, Allemani C, Ricardi U, Schouten HC, The RARECARE Working Group (2012) Incidence, survival and prevalence of myeloid malignancies in Europe. Eur J Cancer 48 (17): 3257-3266
Wakeford R, Darby SC, Murphy MFG (2010) Temporal trends in childhood leukaemia incidence following exposure to radioactive fallout from atmospheric nuclear weapons testing. Radiat Environ Biophys 49 (2): 213-247
(ii) Book chapters etc
AGIR. Risk of Solid Cancers following Radiation Exposure: Estimates for the UK Population. Report of the independent Advisory Group on Ionising Radiation. RCE-19, 1-258. 2011. Chilton, HPA. Brennan B, Stiller C (2010) Rare tumours. In Pediatric Hematology and Oncology. Scientific Principles and Clinical Practice, Estlin EJ, Gilbertson RJ, Wynn RF (eds) pp 319-332. Wiley-Blackwell: Chichester.
Stiller CA, Shah A (2012) The epidemiology of cancer in children and adolescents. In Cancer in children: clinical management, 6th edition, Stevens MCG, Caron HN, Biondi A (eds) pp 1-13. Oxford University Press: Oxford.
(iii) NCIN Reports and Data Briefings (all available on NCIN website)
Reports
Shared care and survival from childhood cancer in the UK 1997-2009 2013
Multiple neoplasms in patients with cancer diagnosed during childhood 2012
Supra-regional referral patterns of childhood cancer patients 2012
Data briefings
Short-term survival of children with cancer 2013
Occurrence of cancer among five-year survivors of childhood cancer 2012
Place of death for children, teenagers and young adults with cancer in England 2011
Survival of children, teenagers and young adults with cancer in England 2011
Authorship and Acknowledgements This report was written by Charles Stiller, many of the analyses and tabulations were done by Nicole Diggens and Tim Vincent, and data collection was managed by Anita Bayne, all at the Childhood Cancer Research Group (CCRG). We are, as always, very grateful to all those organisations and individuals that have provided information on which the report is based.