national report on students - otago.ac.nz · national report on students graduating medical school...
TRANSCRIPT

National report on students graduating medical school
in New Zealand in 2015
February 2017
Prepared by: The New Zealand MSOD Steering Group. University of Otago: Prof T. Wilkinson, J. Rudland, B. Smith, F. Hyland, S. Paterson. University of Auckland: Prof P. Poole, Prof W. Bagg, Assoc Prof M. Barrow, A. Verstappen.
ISSN 2537-‐7833 www.otago.ac.nz/NZMSOD
Enquiries to: MSOD Project <[email protected]>
Contents
1. Introduction .................................................................................................................................... 1
2. Method ........................................................................................................................................... 2
2.1. Questionnaire ....................................................................................................................... 2
2.2. Response rate ....................................................................................................................... 2
3. Results ............................................................................................................................................. 4
3.1. Respondents characteristics ................................................................................................. 4
3.2. Marital status and dependents ............................................................................................ 6
3.3. Employment ......................................................................................................................... 7
3.4. Future medical practice ........................................................................................................ 8
3.5. Medical program and internships ...................................................................................... 16
4. Discussion ..................................................................................................................................... 19

List of Tables
Table 1. Response rate by university .................................................................................................... 2 Table 2. Number of respondents by university ..................................................................................... 2 Table 3. Status of University of Otago respondents who completed the 2015 EQ ............................... 3 Table 4. Gender of respondents ............................................................................................................ 4 Table 5. Age of respondents .................................................................................................................. 4 Table 6. Ethnicity of respondents .......................................................................................................... 4 Table 7. Citizenship of respondents ...................................................................................................... 5 Table 8. Ethnicity of domestic student respondents ............................................................................. 5 Table 9. Marital status of respondents ................................................................................................. 6 Table 10. Number of children reported by respondents ...................................................................... 6 Table 11. Number of dependents reported by respondents ................................................................ 7 Table 12. Hours of paid employment undertaken while completing medical degree .......................... 7 Table 13. Preferred country of future practice ..................................................................................... 8 Table 14. Preferred region of future practice ....................................................................................... 9 Table 15. Preferred population centre size of future practice ............................................................ 10 Table 16. Decided on specialisation .................................................................................................... 10 Table 17. Specialisation preferences for all respondents ................................................................... 11 Table 18. Specialisation preference of respondents who had decided on their speciality ................. 12 Table 19. Specialisation preferences of respondents who had not decided on their specialty ......... 13 Table 20. Respondents’ interest in medical teaching ......................................................................... 14 Table 21. Respondents’ interest in research ....................................................................................... 14 Table 22. Certainty of practising in preferred specialisation .............................................................. 14 Table 23. Factors influencing choice of specialty ................................................................................ 15 Table 24. Satisfaction with medical program ...................................................................................... 16 Table 25. Internship preferences ........................................................................................................ 17 Table 26. Internship acceptance ......................................................................................................... 18

National report on students graduating medical school in NZ in 2015 page 1 of 19
1. Introduction The Medical Schools Outcomes Database and Longitudinal Tracking Project (MSOD) is an on-‐going collaborative longitudinal study that is conducted by Medical Deans Australia and New Zealand (MDANZ). The project has been operating since 2005.
Data are collected directly from students at entry to medical school/programme (Year 2 in NZ), through the Commencing Medical Students Questionnaire (CMSQ); in the final year of medical school, through the Exit Questionnaire (EQ); and one, three, and five year(s) after graduation (PGY1, PGY3, PGY3).
Information on student placements and electives is being collected directly from medical schools throughout the duration of the program.
This report presents summary data from the 2015 EQ for University of Auckland and Otago medical students.
National report on students graduating medical school in NZ in 2015 page 2 of 19
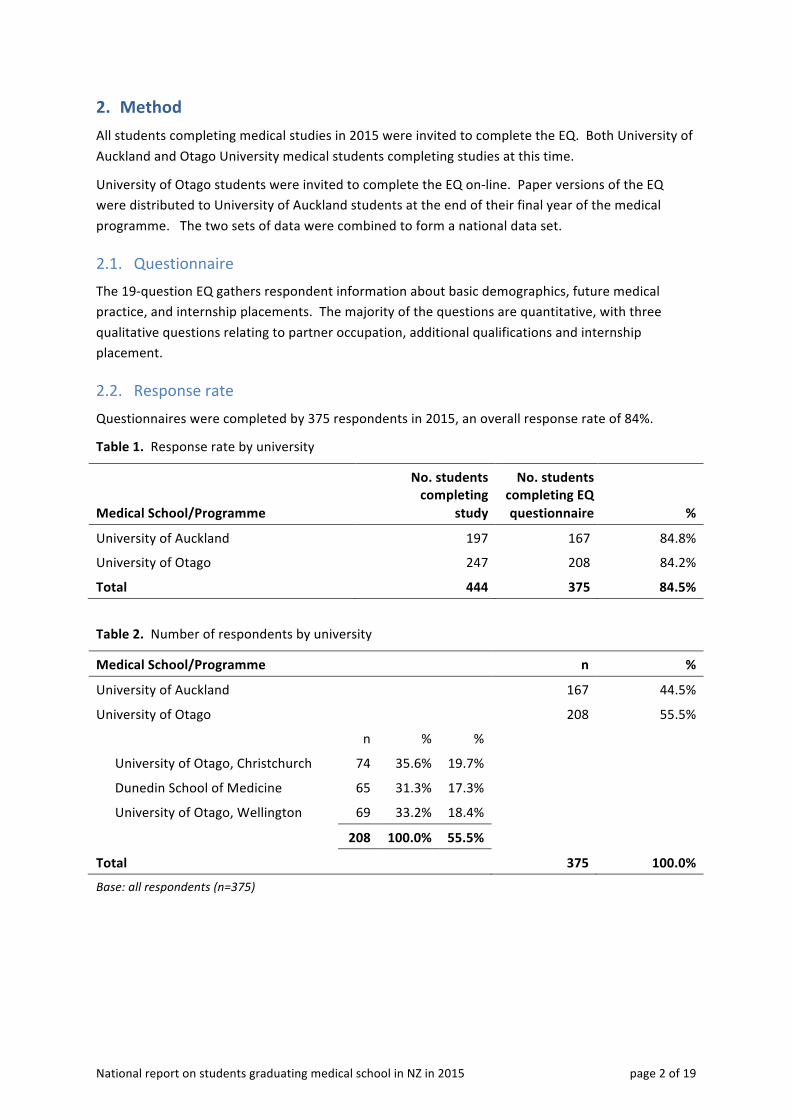
2. Method All students completing medical studies in 2015 were invited to complete the EQ. Both University of Auckland and Otago University medical students completing studies at this time.
University of Otago students were invited to complete the EQ on-‐line. Paper versions of the EQ were distributed to University of Auckland students at the end of their final year of the medical programme. The two sets of data were combined to form a national data set.
2.1. Questionnaire The 19-‐question EQ gathers respondent information about basic demographics, future medical practice, and internship placements. The majority of the questions are quantitative, with three qualitative questions relating to partner occupation, additional qualifications and internship placement.
2.2. Response rate Questionnaires were completed by 375 respondents in 2015, an overall response rate of 84%.
Table 1. Response rate by university
Medical School/Programme
No. students completing
study
No. students completing EQ questionnaire %
University of Auckland 197 167 84.8%
University of Otago 247 208 84.2%
Total 444 375 84.5%
Table 2. Number of respondents by university
Medical School/Programme n %
University of Auckland 167 44.5%
University of Otago 208 55.5%
n % %
University of Otago, Christchurch 74 35.6% 19.7%
Dunedin School of Medicine 65 31.3% 17.3%
University of Otago, Wellington 69 33.2% 18.4%
208 100.0% 55.5%
Total 375 100.0%
Base: all respondents (n=375)
National report on students graduating medical school in NZ in 2015 page 3 of 19
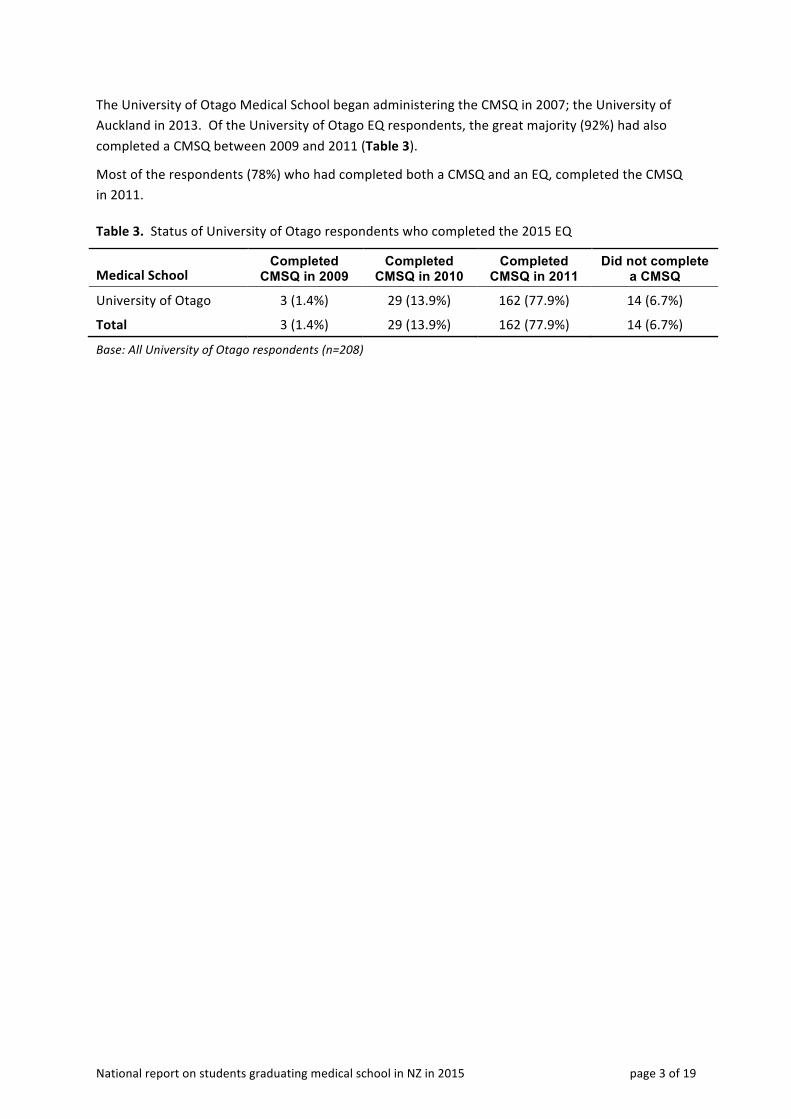
The University of Otago Medical School began administering the CMSQ in 2007; the University of Auckland in 2013. Of the University of Otago EQ respondents, the great majority (92%) had also completed a CMSQ between 2009 and 2011 (Table 3).
Most of the respondents (78%) who had completed both a CMSQ and an EQ, completed the CMSQ in 2011.
Table 3. Status of University of Otago respondents who completed the 2015 EQ
Medical School Completed
CMSQ in 2009 Completed
CMSQ in 2010 Completed
CMSQ in 2011 Did not complete
a CMSQ
University of Otago 3 (1.4%) 29 (13.9%) 162 (77.9%) 14 (6.7%)
Total 3 (1.4%) 29 (13.9%) 162 (77.9%) 14 (6.7%)
Base: All University of Otago respondents (n=208)

National report on students graduating medical school in NZ in 2015 page 4 of 19
3. Results
3.1. Respondents characteristics More respondents were female (54%) than were male (44%).
Table 4. Gender of respondents
Gender n %
Female 202 53.9%
Male 166 44.3%
Total responses 368 98.1%
Missing 7 1.9%
Total 375 100.0%
Base: all respondents (n=375)
Respondents’ ages, as calculated at 30 November 2015, were grouped into 5-‐year age ranges; the results are presented in Table 5. The great majority (92%) of respondents were under 30 years of age, with 60% of respondents under 25 years, and 32% aged between 25 and 30 years.
The mean (standard deviation) age of respondents was 25.7 (3.0) years old.
Table 5. Age of respondents
Age group n %
20-‐24 years 225 60.0% 25-‐29 years 119 31.7% 30-‐34 years 17 4.5% 35-‐39 years 10 2.7% 40 years and over 2 0.5% Total responses 373 99.5% Missing 2 0.5% Total 375 100.0% Base: all respondents (n=375)
Ten percent of all respondents identified themselves as Māori and 5% as Pacific people; 13% of respondents identified with more than one ethnic group.
Table 6. Ethnicity of respondents
Ethnicity n %
New Zealand European 231 61.6% Māori 38 10.1% Pacific peoples 20 5.3% Other 136 36.3% Missing 3 0.8% Base: all respondents (n=375) Percentages total more than 100% as multiple responses were accepted.

National report on students graduating medical school in NZ in 2015 page 5 of 19
Most respondents (89%) held New Zealand citizenship or were New Zealand Permanent Residents (5%). Australian citizens – those not holding dual Australian-‐New Zealand citizenship – accounted for less than 1% of respondents.
Table 7. Citizenship of respondents
Citizenship n %
New Zealand citizen 335 89.3%
New Zealand Permanent Resident 19 5.1%
Australian citizen 1 0.3%
Student Visa holder 17 4.5%
Other 1 0.3%
Total responses 373 99.5%
Missing 2 0.5%
Total 375 100.0%
Base: all respondents (n=375)
Eleven percent of domestic student respondents (those identifying as New Zealand citizens, New Zealand Permanent Residents, or Australians) identified themselves as Māori and 5% as Pacific people; 13% of respondents identified with more than one ethnic group.
Table 8. Ethnicity of domestic student respondents
Ethnicity n %
New Zealand European 229 64.5% Māori 38 10.7% Pacific peoples 19 5.4% Other 120 33.8% Missing 1 0.3% Base: Individuals identifying as domestic students (n=355) Percentages total more than 100% as multiple responses were accepted.

National report on students graduating medical school in NZ in 2015 page 6 of 19
3.2. Marital status and dependents The majority of respondents (68%) indicated they were single or in a relationship but not living with partner.
Table 9. Marital status of respondents
Marital status n %
Single 187 49.9%
In a relationship but not living with partner 69 18.4%
Living with partner 74 19.7%
Married 44 11.7%
Separated – –
Divorced – –
Total responses 374 99.7%
Missing 1 0.3%
Total 375 100.0%
Base: all respondents (n=375)
The number of respondents with children under the age of 16 is shown in Table 10. Ninety-‐four percent of respondents reported having no children, 4% reported having one or two, and less than 1% reported having three or more children.
Similarly 93% of respondents reported having no dependents (people who are financially dependent on them excluding children under the age of 16 – refer Table 11).
Table 10. Number of children reported by respondents
Number of children n %
0 352 93.9%
1 11 2.9%
2 5 1.3%
3 1 0.3%
4 1 0.3%
Total responses 370 98.7%
Missing 5 1.3%
Total 375 100.0%
Base: all respondents (n=375)

National report on students graduating medical school in NZ in 2015 page 7 of 19
Table 11. Number of dependents reported by respondents
Number of dependents n %
0 347 92.5%
1 12 3.2%
2 5 1.3%
3 1 0.3%
4 2 0.5%
Total responses 367 97.9%
Missing 8 2.1%
Total 375 100.0%
Base: all respondents (n=375)
3.3. Employment Respondents were asked to indicate “the average number of hours worked per week in all paid employment (full time, part-‐time, casual and/or vacation) while undertaking your medical degree.” A significant number of students (10%) did not answer this question, however, 32% of respondents indicated that they had not undertaken any paid employment, while 19% indicated they had worked in paid employment on average 1-‐4 hours per week; 11%, 5-‐9 hours per week; 9% worked an average of 10-‐14 hours per week; and a further 9% worked more than 15 hours per week.
Table 12. Hours of paid employment undertaken while completing medical degree
Hours per week of paid employment n %
No paid employment 120 32.0%
1-‐4 hrs 71 18.9%
5-‐9 hrs 78 20.8%
10-‐14 hrs 35 9.3%
15-‐19 hrs 11 2.9%
20-‐24 hrs 7 1.9%
25-‐29 hrs 3 0.8%
30+ hrs 13 3.5%
Total responses 338 90.1%
Missing 37 9.9%
Total 375 100.0%
Base: all respondents (n=375)
National report on students graduating medical school in NZ in 2015 page 8 of 19
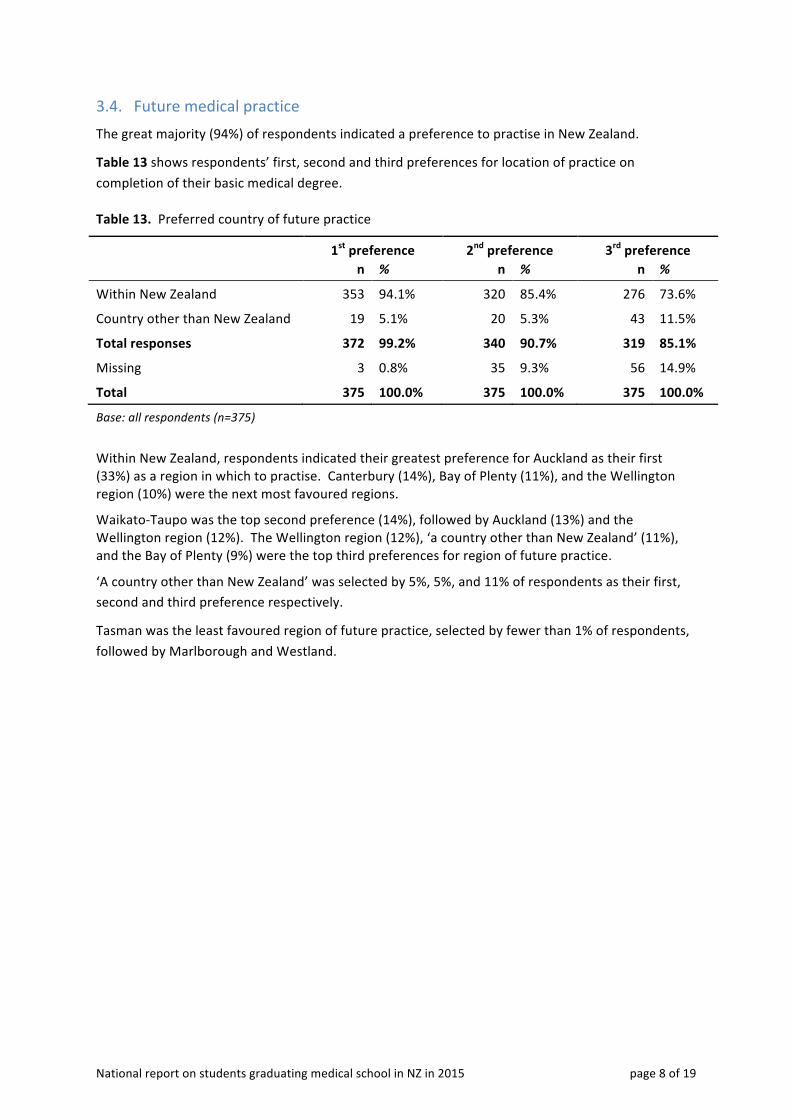
3.4. Future medical practice The great majority (94%) of respondents indicated a preference to practise in New Zealand.
Table 13 shows respondents’ first, second and third preferences for location of practice on completion of their basic medical degree.
Table 13. Preferred country of future practice
1st preference 2nd preference 3rd preference n % n % n %
Within New Zealand 353 94.1% 320 85.4% 276 73.6%
Country other than New Zealand 19 5.1% 20 5.3% 43 11.5%
Total responses 372 99.2% 340 90.7% 319 85.1%
Missing 3 0.8% 35 9.3% 56 14.9%
Total 375 100.0% 375 100.0% 375 100.0%
Base: all respondents (n=375)
Within New Zealand, respondents indicated their greatest preference for Auckland as their first (33%) as a region in which to practise. Canterbury (14%), Bay of Plenty (11%), and the Wellington region (10%) were the next most favoured regions.
Waikato-‐Taupo was the top second preference (14%), followed by Auckland (13%) and the Wellington region (12%). The Wellington region (12%), ‘a country other than New Zealand’ (11%), and the Bay of Plenty (9%) were the top third preferences for region of future practice.
‘A country other than New Zealand’ was selected by 5%, 5%, and 11% of respondents as their first, second and third preference respectively.
Tasman was the least favoured region of future practice, selected by fewer than 1% of respondents, followed by Marlborough and Westland.

National report on students graduating medical school in NZ in 2015 page 9 of 19
Table 14. Preferred region of future practice
1st preference 2nd preference 3rd preference Region n % n % n %
Auckland 123 32.8% 48 12.8% 28 7.5%
Bay of Plenty 40 10.7% 34 9.1% 32 8.5%
Canterbury 54 14.4% 30 8.0% 23 6.1%
Gisborne 6 1.6% 8 2.1% 8 2.1%
Hawkes Bay 15 4.0% 14 3.7% 30 8.0%
Manawatu-‐Whanganui 5 1.3% 4 1.1% 12 3.2%
Marlborough 2 0.5% 2 0.5% 4 1.1%
Nelson 13 3.5% 12 3.2% 30 8.0%
Northland 18 4.8% 23 6.1% 22 5.9%
Otago 13 3.5% 24 6.4% 12 3.2%
Southland 3 0.8% 2 0.5% 5 1.3%
Taranaki 5 1.3% 12 3.2% 12 3.2%
Tasman 1 0.3% 2 0.5% – –
Waikato-‐Taupo 18 4.8% 54 14.4% 12 3.2%
Wellington region 36 9.6% 46 12.3% 44 11.7%
Westland 1 0.3% 5 1.3% 2 0.5%
Country other than New Zealand 19 5.1% 20 5.3% 43 11.5%
Total responses 372 99.2% 340 90.7% 319 85.1%
Missing 3 0.8% 35 9.3% 56 14.9%
Total 375 100.0% 375 100.0% 375 100.0%
Base: all respondents (n=375)

National report on students graduating medical school in NZ in 2015 page 10 of 19
Respondents indicated that major cities were the most preferred for future practice (60%). The percentage of respondents expressing a preference for a population centre decreased as the size of the centre decreased, with just 2% preferring communities of less than ten-‐thousand (Table 15).
Table 15. Preferred population centre size of future practice
Location within New Zealand n %
Major city (population over 100,000) i.e. Auckland, Tauranga, Hamilton, Wellington, Lower Hutt, Christchurch, Dunedin
226 60.3%
Regional city or large town (population 25,000-‐100,000) e.g. Rotorua, Napier, New Plymouth, Palmerston North, Blenheim, Timaru, Invercargill
104 27.7%
Town (population 10,000-‐24,999) e.g. Whakatane, Tokoroa, Taupo, Levin, Masterton, Ashburton, Queenstown
24 6.4%
Small town (population under 10,000) e.g. Huntly, Dannevirke, Gore
6 1.6%
Not applicable, not intending to work in New Zealand 6 1.6%
Total responses 366 97.6%
Missing 9 2.4%
Total 375 100.0%
Base: all respondents (n=375)
The following three tables show the preferred specialisation respondents reported being most interested in on completion of their basic medical degree.
As can be seen in Table 16, just over half (52%) the respondents reported that they had decided in which field of medicine they would specialise.
Table 16. Decided on specialisation
Response n %
Yes 194 51.7%
No 180 48.0%
Total responses 374 99.7%
Missing 1 0.3%
Total 375 100.0%
Base: all respondents (n=375)
The tables below group the results into the following categories: all respondents regardless of whether they indicated they have decided on which specialisation they would pursue (Table 17); those who indicated they had decided on the specialisation they are interested in pursuing (Table 18); and those who had not yet decided (Table 17).
National report on students graduating medical school in NZ in 2015 page 11 of 19
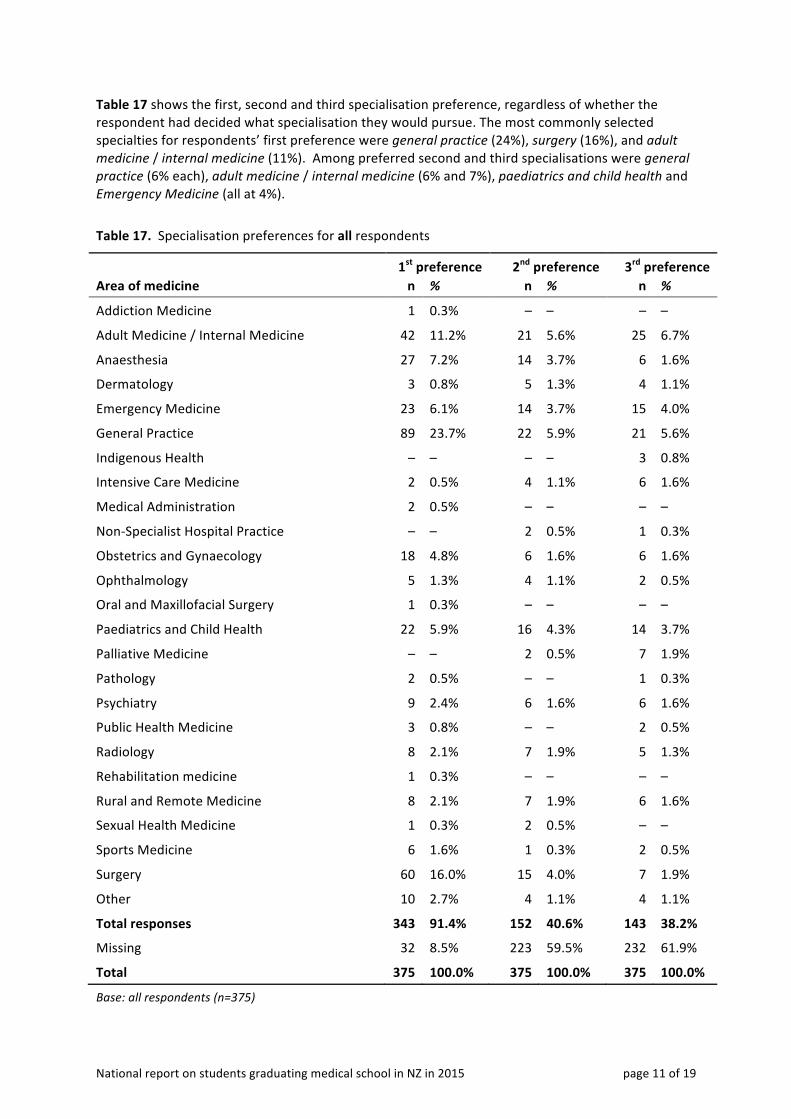
Table 17 shows the first, second and third specialisation preference, regardless of whether the respondent had decided what specialisation they would pursue. The most commonly selected specialties for respondents’ first preference were general practice (24%), surgery (16%), and adult medicine / internal medicine (11%). Among preferred second and third specialisations were general practice (6% each), adult medicine / internal medicine (6% and 7%), paediatrics and child health and Emergency Medicine (all at 4%).
Table 17. Specialisation preferences for all respondents
1st preference 2nd preference 3rd preference Area of medicine n % n % n %
Addiction Medicine 1 0.3% – – – –
Adult Medicine / Internal Medicine 42 11.2% 21 5.6% 25 6.7%
Anaesthesia 27 7.2% 14 3.7% 6 1.6%
Dermatology 3 0.8% 5 1.3% 4 1.1%
Emergency Medicine 23 6.1% 14 3.7% 15 4.0%
General Practice 89 23.7% 22 5.9% 21 5.6%
Indigenous Health – – – – 3 0.8%
Intensive Care Medicine 2 0.5% 4 1.1% 6 1.6%
Medical Administration 2 0.5% – – – –
Non-‐Specialist Hospital Practice – – 2 0.5% 1 0.3%
Obstetrics and Gynaecology 18 4.8% 6 1.6% 6 1.6%
Ophthalmology 5 1.3% 4 1.1% 2 0.5%
Oral and Maxillofacial Surgery 1 0.3% – – – –
Paediatrics and Child Health 22 5.9% 16 4.3% 14 3.7%
Palliative Medicine – – 2 0.5% 7 1.9%
Pathology 2 0.5% – – 1 0.3%
Psychiatry 9 2.4% 6 1.6% 6 1.6%
Public Health Medicine 3 0.8% – – 2 0.5%
Radiology 8 2.1% 7 1.9% 5 1.3%
Rehabilitation medicine 1 0.3% – – – –
Rural and Remote Medicine 8 2.1% 7 1.9% 6 1.6%
Sexual Health Medicine 1 0.3% 2 0.5% – –
Sports Medicine 6 1.6% 1 0.3% 2 0.5%
Surgery 60 16.0% 15 4.0% 7 1.9%
Other 10 2.7% 4 1.1% 4 1.1%
Total responses 343 91.4% 152 40.6% 143 38.2%
Missing 32 8.5% 223 59.5% 232 61.9%
Total 375 100.0% 375 100.0% 375 100.0%
Base: all respondents (n=375)
National report on students graduating medical school in NZ in 2015 page 12 of 19
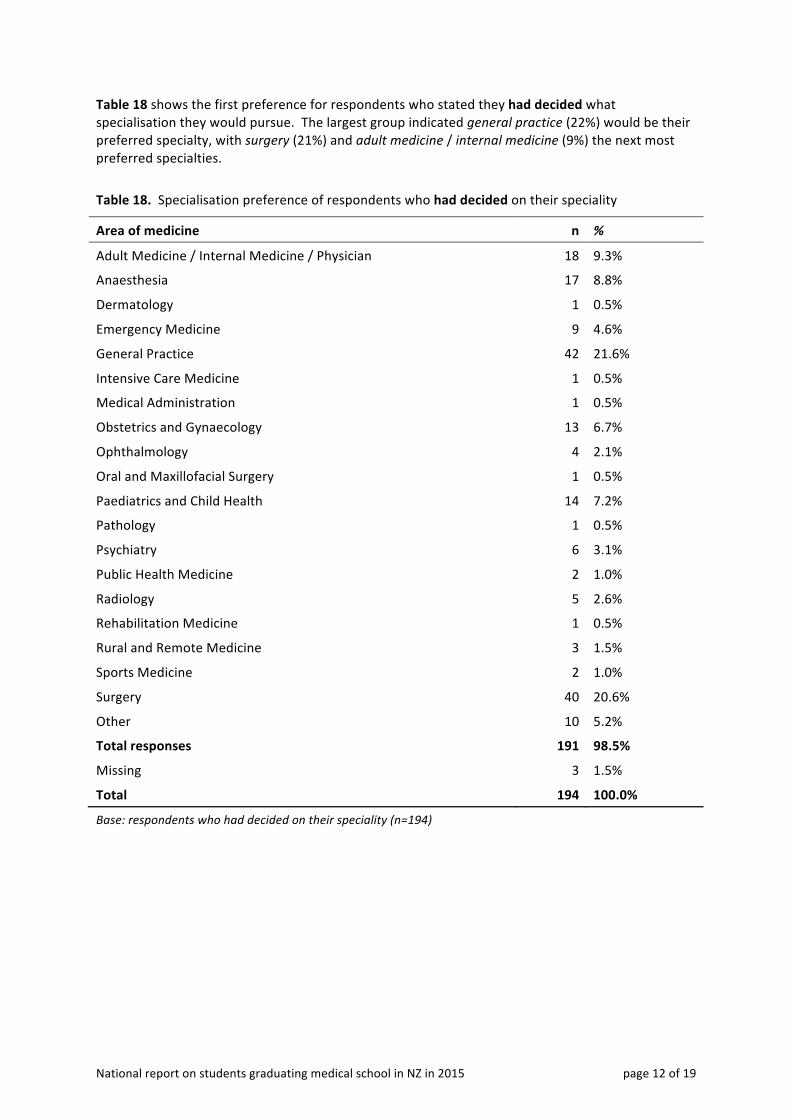
Table 18 shows the first preference for respondents who stated they had decided what specialisation they would pursue. The largest group indicated general practice (22%) would be their preferred specialty, with surgery (21%) and adult medicine / internal medicine (9%) the next most preferred specialties.
Table 18. Specialisation preference of respondents who had decided on their speciality
Area of medicine n %
Adult Medicine / Internal Medicine / Physician 18 9.3%
Anaesthesia 17 8.8%
Dermatology 1 0.5%
Emergency Medicine 9 4.6%
General Practice 42 21.6%
Intensive Care Medicine 1 0.5%
Medical Administration 1 0.5%
Obstetrics and Gynaecology 13 6.7%
Ophthalmology 4 2.1%
Oral and Maxillofacial Surgery 1 0.5%
Paediatrics and Child Health 14 7.2%
Pathology 1 0.5%
Psychiatry 6 3.1%
Public Health Medicine 2 1.0%
Radiology 5 2.6%
Rehabilitation Medicine 1 0.5%
Rural and Remote Medicine 3 1.5%
Sports Medicine 2 1.0%
Surgery 40 20.6%
Other 10 5.2%
Total responses 191 98.5%
Missing 3 1.5%
Total 194 100.0%
Base: respondents who had decided on their speciality (n=194)

National report on students graduating medical school in NZ in 2015 page 13 of 19
Those who stated they had not decided what specialisation they would pursue were still asked to rank the areas in terms of their interest. The first, second and third preferences for these respondents are shown in Table 17. The leading choices for respondents’ first preference were general practice (26%), adult medicine / internal medicine (13%), and surgery (11%). As a second preference paediatrics and child health (9%) joined general practice and adult medicine / internal medicine (12% each), while emergency medicine (8%) joined adult medicine / internal medicine (14%) and general practice (12%) as a third preference.
Table 19. Specialisation preferences of respondents who had not decided on their specialty
1st preference 2nd preference 3rd preference Area of medicine n % n % n %
Addiction Medicine 1 0.6% – – – –
Adult Medicine / Internal Medicine 24 13.3% 21 11.7% 25 13.9%
Anaesthesia 10 5.6% 14 7.8% 6 3.3%
Dermatology 2 1.1% 5 2.8% 4 2.2%
Emergency Medicine 14 7.8% 14 7.8% 15 8.3%
General Practice 47 26.1% 22 12.2% 21 11.7%
Indigenous Health – – – – 3 1.7%
Intensive Care Medicine 1 0.6% 4 2.2% 6 3.3%
Medical Administration 1 0.6% – – – –
Non-‐Specialist Hospital Practice – – 2 1.1% 1 0.6%
Obstetrics and Gynaecology 5 2.8% 6 3.3% 6 3.3%
Ophthalmology 1 0.6% 4 2.2% 2 1.1%
Paediatrics and Child Health 8 4.4% 16 8.9% 14 7.8%
Palliative Medicine – – 2 1.1% 7 3.9%
Pathology 1 0.6% – – 1 0.6%
Psychiatry 3 1.7% 6 3.3% 6 3.3%
Public Health Medicine 1 0.6% – – 2 1.1%
Radiology 3 1.7% 7 3.9% 5 2.8%
Rural and Remote Medicine 5 2.8% 7 3.9% 6 3.3%
Sexual Health Medicine 1 0.6% 2 1.1% – –
Sports Medicine 4 2.2% 1 0.6% 2 1.1%
Surgery 20 11.1% 15 8.3% 7 3.9%
Other – – 4 2.2% 4 2.2%
Total responses 152 84.8% 152 84.4% 143 79.4%
Missing 28 15.6% 28 15.6% 37 20.6%
Total 180 100.0% 180 100.0% 180 100.0%
Base: respondents who had not decided on their specialty (n=180)
National report on students graduating medical school in NZ in 2015 page 14 of 19
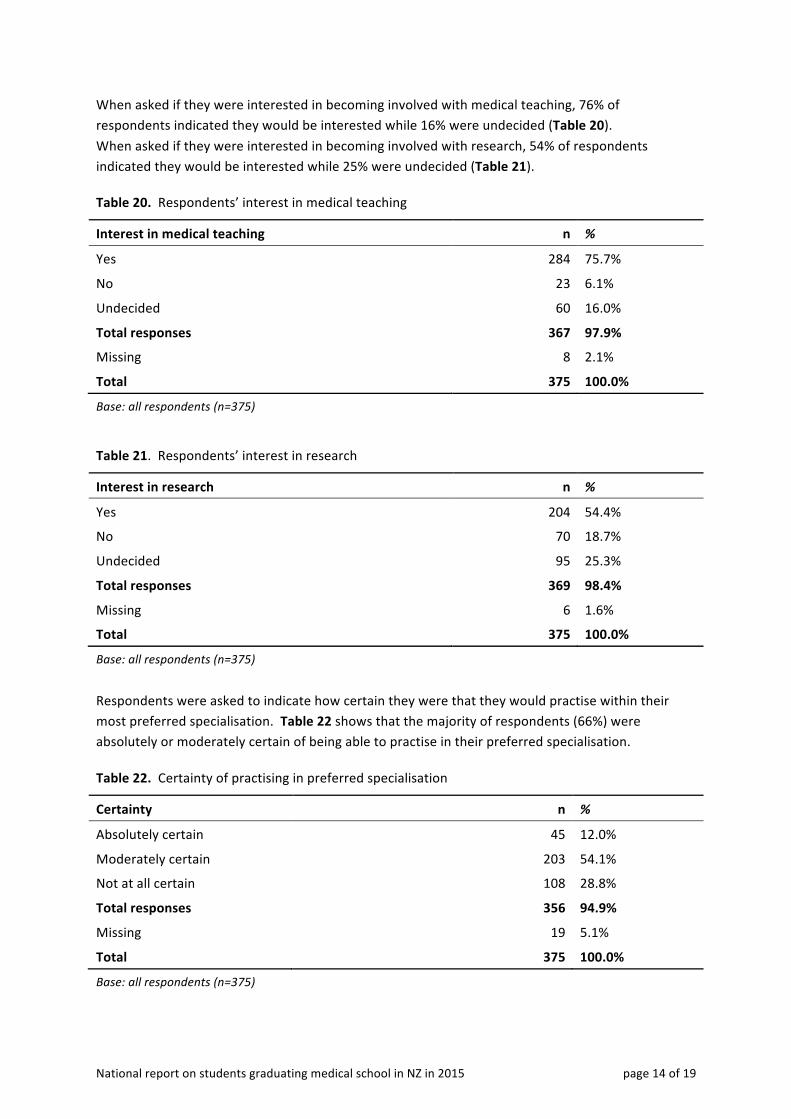
When asked if they were interested in becoming involved with medical teaching, 76% of respondents indicated they would be interested while 16% were undecided (Table 20). When asked if they were interested in becoming involved with research, 54% of respondents indicated they would be interested while 25% were undecided (Table 21).
Table 20. Respondents’ interest in medical teaching
Interest in medical teaching n %
Yes 284 75.7%
No 23 6.1%
Undecided 60 16.0%
Total responses 367 97.9%
Missing 8 2.1%
Total 375 100.0%
Base: all respondents (n=375)
Table 21. Respondents’ interest in research
Interest in research n %
Yes 204 54.4%
No 70 18.7%
Undecided 95 25.3%
Total responses 369 98.4%
Missing 6 1.6%
Total 375 100.0%
Base: all respondents (n=375)
Respondents were asked to indicate how certain they were that they would practise within their most preferred specialisation. Table 22 shows that the majority of respondents (66%) were absolutely or moderately certain of being able to practise in their preferred specialisation.
Table 22. Certainty of practising in preferred specialisation
Certainty n %
Absolutely certain 45 12.0%
Moderately certain 203 54.1%
Not at all certain 108 28.8%
Total responses 356 94.9%
Missing 19 5.1%
Total 375 100.0%
Base: all respondents (n=375)

National report on students graduating medical school in NZ in 2015 page 15 of 19
Respondents were asked to rate on a scale of one to five (where 0=not at all and 5=a great deal) how a certain factor would influence entering their most preferred specialisation. Table 23 lists each factor along with the mean score and standard deviation (SD).
The factor reported as having the most influence was interest in helping people (mean=4.17), followed by atmosphere/work culture typical of the discipline (mean=4.04), experience of specialty as a medical student (mean=3.99) and influence of consultants/mentors (mean=3.90).
Specific factors reported as having the least influence were financial cost of vocational training (mean=1.63) and financial costs of medical school education and/or debt (mean=1.67) and risk of litigation and associated insurance costs (mean=1.76).
Table 23. Factors influencing choice of specialty
Factor Mean
influence score SD
Interest in helping people 4.17 0.98
Atmosphere/work culture typical of the discipline 4.04 1.00
Experience of specialty as a medical student 3.99 1.04
Influence of consultants/mentors 3.90 1.03
General medical school experiences 3.71 1.11
Opportunity for procedural work 3.67 1.30
Intellectual content of the specialty 3.66 1.04
Self-‐appraisal of own skills/aptitudes 3.65 1.05
Perceived amount of working hours 3.43 1.18
Perceived opportunity to work flexible hours 3.39 1.27
Type of patients typical of the discipline 3.37 1.18
Self-‐appraisal of own domestic circumstances 3.20 1.26
Perceived job security 3.15 1.24
Availability of a vocational training placement 3.13 1.19
Perceived career advancement prospects 3.07 1.26
Geographical location of most preferred specialty 2.93 1.38
Number of years required to complete training 2.82 1.23
Opportunity for research and /or teaching 2.74 1.30
Perceived financial prospects 2.36 1.18
Perceived prestige of the discipline 2.21 1.18
Influence of parents/relatives 1.91 1.15
Other1 1.82 1.36
Risk of litigation and associated insurance costs 1.76 1.01
Financial costs of medical school education and/or debt 1.67 0.98
Financial costs of vocational training 1.63 0.96
Base: all respondents (n=375) 1 Indicative only, due to missing data

National report on students graduating medical school in NZ in 2015 page 16 of 19
Medical program and internships Respondents’ satisfaction with their medical programs is presented in Table 24. The majority (80%) of respondents were either satisfied or very satisfied with their medical program. Seven percent of respondents were either dissatisfied or very dissatisfied.
Table 24. Satisfaction with medical program
Satisfaction n %
Very satisfied 83 22.1%
Satisfied 209 55.7%
Neither satisfied nor dissatisfied 51 13.6%
Dissatisfied 20 5.3%
Very dissatisfied 5 1.3%
Total responses 368 98.1%
Missing 7 1.9%
Total 375 100.0%
Base: all respondents (n=375)

National report on students graduating medical school in NZ in 2015 page 17 of 19
Respondents were asked to list, in order of preference, the regions within New Zealand in which they have applied for an internship (Table 25).
Auckland was clearly the most preferred region across all preferences; 31% selecting it as their first preference, 26% as their second, 27% as their third, and 13% as fourth preference.
Canterbury, Bay of Plenty, the Wellington region and Waikato-‐Taupo were preferred by significant proportions of students.
Westland, Tasman, Southland, Manawatu-‐Whanganui and Marlborough were the least favoured New Zealand regions of first preference.
Table 25. Internship preferences
1st preference 2nd preference 3rd preference 4th preference Region n % n % n % n %
Auckland 117 31.2% 97 25.9% 100 26.7% 48 12.8%
Bay of Plenty 46 12.3% 32 8.5% 23 6.1% 22 5.9%
Canterbury 53 14.1% 38 10.1% 21 5.6% 13 3.5%
Gisborne 8 2.1% 9 2.4% 12 3.2% 11 2.9%
Hawkes Bay 18 4.8% 12 3.2% 16 4.3% 11 2.9%
Manawatu-‐Whanganui 4 1.1% 13 3.5% 21 5.6% 13 3.5%
Marlborough 1 0.3% 3 0.8% 4 1.1% 6 1.6%
Nelson 15 4.0% 12 3.2% 8 2.1% 14 3.7%
Northland 9 2.4% 8 2.1% 9 2.4% 16 4.3%
Otago 12 3.2% 17 4.5% 15 4.0% 7 1.9%
Southland 7 1.9% 2 0.5% 4 1.1% 2 0.5%
Taranaki 7 1.9% 15 4.0% 20 5.3% 17 4.5%
Tasman 1 0.3% 1 0.3% 2 0.5% 2 0.5%
Waikato-‐Taupo 19 5.1% 40 10.7% 31 8.3% 39 10.4%
Wellington region 36 9.6% 29 7.7% 15 4.0% 32 8.5%
Westland – – – – – – 1 0.3%
Country other than New Zealand
5 1.3% 1 0.3% – – 1 0.3%
Total responses 358 95.5% 329 87.7% 301 80.3% 255 68.0%
Missing 17 4.5% 46 12.3% 74 19.7% 120 32.0%
Total 375 100.0% 375 100.0% 375 100.0% 375 100.0%
Base: all respondents (n=375)

National report on students graduating medical school in NZ in 2015 page 18 of 19
Respondents were then asked to indicate which region they had been accepted to undertake their internship (Table 26). The greatest number of respondents had been accepted to hospitals in the Auckland region (27%), followed by Canterbury (12%), Bay of Plenty (9%) and the Wellington region (8%).
Table 26. Internship acceptance
Region n %
Auckland 99 26.4%
Bay of Plenty 34 9.1%
Canterbury 45 12.0%
Gisborne 7 1.9%
Hawkes Bay 14 3.7%
Manawatu-‐Whanganui 18 4.8%
Marlborough 2 0.5%
Nelson 10 2.7%
Northland 11 2.9%
Otago 19 5.1%
Southland 5 1.3%
Taranaki 9 2.4%
Tasman 1 0.3%
Waikato-‐Taupo 25 6.7%
Wellington region 30 8.0%
Westland – –
Country other than New Zealand 4 1.1%
Total responses 333 88.8%
Missing 42 11.2%
Total 375 100.0%
Base: all respondents (n=375)
National report on students graduating medical school in NZ in 2015 page 19 of 19
4. Discussion This is the fourth set of national data (the first being 2012) on medical student demographics and career intentions on graduating from a New Zealand medical school. Given the response rate and no reason to suggest the data are inherently biased, the data are robust.
The main limitation is that these data reflect career intentions and not actual practice. This will take several years to determine. Nonetheless, as they stand, these data give a flavour of the shape of the future New Zealand medical workforce. Another limitation is the way that the specialties are listed. This reflects the Australian origin of the MSOD project.
Finally, these data are descriptive only. To strengthen the findings several analyses are possible:
• Conduct of paired analyses i.e. comparing career choices at the beginning of medical school with those at exit and in PGY1, 3, and 5 to see what changes;
• Inclusion in the database information about student electives and attachments during medical school;
• Monitoring of trends over time by serial sampling on an annual basis; • Comparison of these data with that published in the literature or from other New Zealand
workforce surveys (MCNZ, MTB, HWNZ); • Modeling of factors that influence specific career choices e.g. general practice, psychiatry.
This may point to demographic, curricular, or sociopolitical factors that might be amenable to change.