national rivers and streams assessment 2013‐2014
TRANSCRIPT
UnitedStatesEnvironmentalProtectionAgency
OfficeofWater
Washington,DC
EPA841‐B‐12‐010
NationalRiversandStreamsAssessment
2013‐2014
LaboratoryOperationsManualVersion2.0May2014


2013‐2014 National Rivers & Streams Assessment Laboratory Operations Manual
Version 1.3, May 2014 Page ii of 224
ii
NOTICE
NOTICE
The intention of the National Rivers and Streams Assessment 2013‐2014 is to provide a comprehensive “State of Flowing Waters” assessment for rivers and streams across the United States. The complete documentation of overall project management, design, methods, quality assurance, and standards is contained in five companion documents:
National Rivers and Streams Assessment 2013‐14: Quality Assurance Project Plan EPA‐841‐B‐12‐007
National Rivers and Streams Assessment 2013‐14: Site Evaluation Guidelines EPA‐841‐B‐12‐008
National Rivers and Streams Assessment 2013‐14: Non‐Wadeable Field Operations Manual EPA‐841‐B‐12‐009a
National Rivers and Streams Assessment 2013‐14: Wadeable Field Operations Manual EPA‐841‐B‐12‐009b
National Rivers and Streams Assessment 2013‐14: Laboratory Operations Manual EPA 841‐B‐12‐010
Addendum to the National Rivers and Streams Assessment 2013‐14: Wadeable & Non‐Wadeable Field Operations Manuals
This document (Laboratory Operations Manual) contains information on the methods for analyses of the samples to be collected during the project, quality assurance objectives, sample handling, and data reporting. These methods are based on the guidelines developed and followed in the Western Environmental Monitoring and Assessment Program (Peck et al. 2003). Methods described in this document are to be used specifically in work relating to the NRSA 2013‐2014. All Project Cooperator laboratories should follow these guidelines. Mention of trade names or commercial products in this document does not constitute endorsement or recommendation for use. More details on specific methods for site evaluation, sampling, and sample processing can be found in the appropriate companion document.
The suggested citation for this document is:
USEPA. 2012. National Rivers and Streams Assessment 2013‐2014: Laboratory Operations Manual. EPA‐841‐B‐12‐010. U.S. Environmental Protection Agency, Office of Water, Washington, DC.

2013‐2014 National Rivers & Streams Assessment Laboratory Operations Manual Version 1.3, May 2014 Page iii of 224
iii
TABLE OF CONTENTS
TABLEOFCONTENTSNOTICE ...............................................................................................................................................................ii
TABLE OF CONTENTS .......................................................................................................................................... iii
LIST OF TABLES ................................................................................................................................................... vi
LIST OF FIGURES ................................................................................................................................................ vii
LIST OF ACRONYMS ........................................................................................................................................... vii
1.0 INTRODUCTION .................................................................................................................................... 10
2.0 GENERAL LABORATORY GUIDELINES ..................................................................................................... 11
2.1 RESPONSIBILITY AND PERSONNEL QUALIFICATIONS ................................................................................................ 11 2.2 ROLES AND CONTACT INFORMATION ................................................................................................................... 11 2.3 SAMPLE TRACKING .......................................................................................................................................... 11 2.4 REPORTING .................................................................................................................................................... 12
3.0 ALGAL TOXIN (MICROCYSTIN) IMMUNOASSAY PROCEDURE .................................................................. 13
3.1 SUMMARY OF THE PROCEDURE .......................................................................................................................... 13 3.2 HEALTH AND SAFETY WARNINGS ........................................................................................................................ 14 3.3 DEFINITIONS AND REQUIRED RESOURCES (PERSONNEL, LABORATORIES, AND EQUIPMENT) ........................................... 14
3.3.1 Definitions .............................................................................................................................................. 14 3.4 GENERAL REQUIREMENTS FOR LABORATORIES ...................................................................................................... 15
3.4.1 Expertise ................................................................................................................................................ 15 3.4.2 Quality assurance and quality control requirements ............................................................................. 15 3.4.3 Personnel ............................................................................................................................................... 16 3.4.4 Equipment/Materials ............................................................................................................................. 16
3.5 SAMPLE RECEIPT ............................................................................................................................................. 16 3.6 PROCEDURE ................................................................................................................................................... 17
3.6.1 Sample Preparation ............................................................................................................................... 18 3.6.2 Kit Preparation ....................................................................................................................................... 18 3.6.3 Insertion of Contents into Wells ............................................................................................................. 19 3.6.4 Dilutions (if needed) ............................................................................................................................... 23
3.7 QUALITY MEASURES ........................................................................................................................................ 24 3.7.1 Assistance Visits ..................................................................................................................................... 24 3.7.2 QC Samples ............................................................................................................................................ 24 3.7.3 Summary of QA/QC Requirements ........................................................................................................ 24
3.8 SAMPLE AND RECORD RETENTION ...................................................................................................................... 26 3.9 REFERENCES ................................................................................................................................................... 26
4.0 BENTHIC MACROINVERTEBRATES ......................................................................................................... 27
4.1 INTRODUCTION ............................................................................................................................................... 27 4.2 SUMMARY OF METHOD .................................................................................................................................... 28 4.3 HEALTH AND SAFETY WARNINGS ........................................................................................................................ 28 4.4 DEFINITIONS AND REQUIRED RESOURCES (LABORATORY, PERSONNEL, AND EQUIPMENT) .............................................. 28
4.4.1 Definitions .............................................................................................................................................. 28 4.4.2 Laboratory ............................................................................................................................................. 32 4.4.3 Personnel ............................................................................................................................................... 33 4.4.4 Equipment/Materials ............................................................................................................................. 34
4.4.4.1 Sample Preparation (Subsampling) and Sorting Equipment/Materials ........................................................ 34 4.4.4.2 Taxonomy Identification Equipment/Materials ............................................................................................ 35
4.5 SAMPLE RECEIPT ............................................................................................................................................. 35 4.6 SAMPLE PREPARATION (SUBSAMPLING) .............................................................................................................. 36

2013‐2014 National Rivers & Streams Assessment Laboratory Operations Manual
Version 1.3, May 2014 Page iv of 224
iv
TABLE OF CONTENTS
4.7 SORTING ....................................................................................................................................................... 40 4.8 TAXONOMY IDENTIFICATION .............................................................................................................................. 44 4.9 DATA ENTRY .................................................................................................................................................. 51 4.10 SAMPLE AND RECORD RETENTION ...................................................................................................................... 51 4.11 EXTERNAL TAXONOMIC QUALITY CONTROL .......................................................................................................... 51 4.12 QUALITY ASSURANCE/QUALITY CONTROL (QA/QC) ............................................................................................. 53 4.13 REFERENCES ................................................................................................................................................... 56
5.0 FECAL INDICATOR: ENTEROCOCCI ......................................................................................................... 57
5.1 SCOPE & APPLICATION ..................................................................................................................................... 57 5.2 SUMMARY OF METHOD .................................................................................................................................... 57 5.3 DEFINITIONS OF METHOD ................................................................................................................................. 57 5.4 INTERFERENCES ............................................................................................................................................... 58 5.5 HEALTH & SAFETY WARNINGS ........................................................................................................................... 58 5.6 PERSONNEL QUALIFICATIONS ............................................................................................................................ 59 5.7 EQUIPMENT AND SUPPLIES................................................................................................................................ 59 5.8 REAGENTS & STANDARDS ................................................................................................................................. 59 5.9 PREPARATIONS PRIOR TO DNA EXTRACTION & ANALYSIS ....................................................................................... 60 5.10 PROCEDURES FOR PROCESSING & QPCR ANALYSIS OF SAMPLE CONCENTRATES. ......................................................... 61
5.10.1 Sample Processing (DNA Extraction) ................................................................................................. 61 5.10.2 Sample Analysis by Enterococcus qPCR ............................................................................................. 62
5.10.2.1 Preparation of qPCR assay mix ...................................................................................................................... 62 5.10.3 Sample analysis sequence for SmartCycler ........................................................................................ 64
5.11 STORAGE & TIMING OF PROCESSING/ANALYSIS OF FILTER CONCENTRATES ................................................................. 64 5.12 CHAIN OF CUSTODY ......................................................................................................................................... 64 5.13 QUALITY ASSURANCE/QUALITY CONTROL (QA/QC) PROCEDURES ........................................................................... 64 5.14 METHOD PERFORMANCE .................................................................................................................................. 65 5.15 RECORD KEEPING & DATA MANAGEMENT ........................................................................................................... 65 5.16 WASTE MANAGEMENT & POLLUTION PREVENTION ............................................................................................... 65 5.17 LITERATURE CITED ........................................................................................................................................... 66 5.18 TABLES, DIAGRAMS, FLOWCHARTS, CHECKLISTS, AND VALIDATION DATA ................................................................... 66
5.18.1 Enterococcus qPCR Analysis Decision Tree (ADT) .............................................................................. 69 5.18.2 “Modified” MagNA Pure LC DNA Purification Kit III Protocol ............................................................ 69
6.0 FISH VOUCHER SPECIMENS ................................................................................................................... 72
6.1 SUMMARY OF PROCEDURES .............................................................................................................................. 72 6.2 HEALTH AND SAFETY WARNINGS ........................................................................................................................ 72 6.3 DEFINITIONS AND REQUIRED RESOURCES (PERSONNEL, TAXONOMY LABORATORIES, AND EQUIPMENT) ........................... 73
6.3.1 Definitions .............................................................................................................................................. 73 6.3.2 General Requirements for Taxonomists and Taxonomy Laboratories ................................................... 74 6.3.3 Personnel ............................................................................................................................................... 74 6.3.4 Equipment/Materials ............................................................................................................................. 74
6.4 SAMPLE RECEIPT ............................................................................................................................................. 75 6.5 QC IDENTIFICATION ......................................................................................................................................... 76 6.6 ASSISTANCE VISITS .......................................................................................................................................... 81 6.7 SAMPLE AND RECORD RETENTION ...................................................................................................................... 81 6.8 SUMMARY OF QC REQUIREMENTS FOR FISH VOUCHER SPECIMENS........................................................................... 81 6.9 REFERENCES ................................................................................................................................................... 82
7.0 FISH TISSUE FILLET (Whole Fish Collection) ............................................................................................ 84
8.0 FISH TISSUE PLUG ................................................................................................................................. 85
9.0 PERIPHYTON ......................................................................................................................................... 87

2013‐2014 National Rivers & Streams Assessment Laboratory Operations Manual Version 1.3, May 2014 Page v of 224
v
TABLE OF CONTENTS
9.1 SUMMARY OF PROCEDURE ................................................................................................................................ 87 9.2 HEALTH AND SAFETY WARNINGS ........................................................................................................................ 88 9.3 DEFINITIONS AND REQUIRED RESOURCES (LABORATORY, PERSONNEL, AND EQUIPMENT) .............................................. 89
9.3.1 Definitions .............................................................................................................................................. 89 9.3.2 Laboratory ............................................................................................................................................. 90 9.3.3 Lab Personnel ......................................................................................................................................... 91 9.3.4 Equipment/Materials ............................................................................................................................. 91
9.3.4.1 Subsampling Equipment/Materials (Section 9.5) .......................................................................................... 91 9.3.4.2 Diatoms ......................................................................................................................................................... 92
9.3.4.2.1 Cleaning Equipment/Materials (Section 9.6 Diatom Cleaning and Mounting) ........................................ 92 9.3.4.2.2 Preparation of Diatom Slides (Section 9.6) .............................................................................................. 92 9.3.4.2.3 Analysis of Diatoms (Section 9.7Analysis of Diatoms and Soft Algae) ...................................................... 92
9.3.4.3 Soft algae (Section 9.7) ................................................................................................................................. 93 9.4 SAMPLE RECEIPT ............................................................................................................................................. 93 9.5 SAMPLE PREPARATION (SUBSAMPLING) .............................................................................................................. 94 9.6 DIATOM CLEANING AND MOUNTING .................................................................................................................. 97 9.7 ANALYSIS OF DIATOMS AND SOFT ALGAE ........................................................................................................... 102
9.7.1 Taxonomic Nomenclature and Photographic Specifications ............................................................... 103 9.7.2 Analysis of Diatoms .............................................................................................................................. 104 9.7.3 Analysis of Soft Algae ........................................................................................................................... 107 9.7.4 Internal Quality Control ....................................................................................................................... 111 9.7.5 Required Data Elements for Diatom and Soft Algae Analyses ............................................................. 111
9.8 DATA ENTRY ................................................................................................................................................ 114 9.9 SAMPLE AND RECORD RETENTION .................................................................................................................... 119 9.10 EXTERNAL TAXONOMIC QUALITY CONTROL EVALUATION ...................................................................................... 120 9.11 REFERENCES ................................................................................................................................................. 124
10.0 PERIPHYTON META‐GENOMICS (Pilot Research Effort) ........................................................................ 128
11.0 WATER CHEMISTRY and CHLOROPHYLL A ............................................................................................ 129
11.1 ANALYTICAL PARAMETERS............................................................................................................................... 129 11.2 SAMPLE PROCESSING AND PRESERVATION .......................................................................................................... 129
11.2.1 Water Chemistry Samples ............................................................................................................... 130 11.2.2 Chlorophyll‐a Samples ..................................................................................................................... 131
11.3 PERFORMANCE‐BASED METHODS ..................................................................................................................... 131 11.4 PERTINENT QA/QC PROCEDURES .................................................................................................................... 133
11.4.1 Laboratory Performance Requirements .......................................................................................... 133 11.4.2 Laboratory Quality Control Samples ................................................................................................ 133 11.4.3 Data Reporting, Review, and Management .................................................................................... 138
11.5 LITERATURE CITED ......................................................................................................................................... 140
APPENDIX A: CONTACT INFORMATION ............................................................................................................ 141
APPENDIX B: LABORATORY REMOTE EVALUATION FORMS .............................................................................. 143
APPENDIX C: SAMPLE LABORATORY FORMS .................................................................................................... 150
BENTHIC MACROINVERTEBRATE: SORTING BENCH SHEET ................................................................................................... 151 BENTHIC MACROINVERTEBRATES: TAXONOMY BENCH SHEET (OPTIONAL) ............................................................................. 152 ENTERROCOCCI (EPA METHOD 1606) LABORATORY BENCH SHEET ..................................................................................... 153 FISH VOUCHER: TAXONOMY BENCH SHEET (OPTIONAL) ..................................................................................................... 154
APPENDIX D: OTHER PERTINENT ATTACHMENTS ............................................................................................. 155
APPENDIX E: REPORTING TEMPLATES .............................................................................................................. 182
APPENDIX F: EXAMPLE SOPs FOR MERCURY IN FISH TISSUE PLUG ANALYSES .................................................. 184

2013‐2014 National Rivers & Streams Assessment Laboratory Operations Manual
Version 1.3, May 2014 Page vi of 224
vi
LIST OF TA
BLES
LISTOFTABLESTABLE 2.1 CONTACT INFORMATION ..................................................................................................................................... 11 TABLE 3.1 MICROCYSTIN: REQUIRED DATA ELEMENTS – LOGIN .................................................................................................. 17 TABLE 3.2 MICROCYSTIN: REQUIRED DATA ELEMENTS – DATA SUBMISSION .................................................................................. 22 TABLE 3.3 MICROCYSTIN: QUALITY CONTROL – SAMPLE ANALYSIS .............................................................................................. 24 TABLE 4.1 BENTHIC MACROINVERTEBRATE: REQUIRED DATA ELEMENTS – LOGIN ........................................................................... 36 TABLE 4.2 BENTHIC MACROINVERTEBRATE: LIST OF TAXA THAT ARE NOT TO BE SORTED/COUNTED .................................................... 41 TABLE 4.3 BENTHIC MACROINVERTEBRATE: REQUIRED DATA ELEMENTS – SORTING ....................................................................... 43 TABLE 4.4 BENTHIC MACROINVERTEBRATE: TARGET LEVEL OF TAXONOMIC IDENTIFICATION – BENTHICS COMMONLY FOUND IN
FRESHWATER ........................................................................................................................................................... 47 TABLE 4.5 BENTHIC MACROINVERTEBRATE: TARGET LEVEL OF TAXONOMIC IDENTIFICATION – CHIRONOMIDAE .................................... 48 TABLE 4.6 BENTHIC MACROINVERTEBRATE: REQUIRED DATA ELEMENTS – TAXONOMIC IDENTIFICATION ............................................. 50 TABLE 4.7 BENTHIC MACROINVERTEBRATE: MEASUREMENT DATA QUALITY OBJECTIVES .................................................................. 54 TABLE 4.8 BENTHIC MACROINVERTEBRATE: QUALITY CONTROL – LABORATORY ............................................................................. 55 TABLE 5.1 ENTEROCOCCI: PCR ASSAY MIX COMPOSITION (ACCORDING TO DRAFT EPA METHOD 1606) ............................................ 66 TABLE 5.2 ENTEROCOCCI: BATCH CALIBRATOR & ENTEROCOCCUS STANDARDS PCR RUN – 7 SAMPLES .............................................. 66 TABLE 5.3 ENTEROCOCCI: SUB BATCH TEST SAMPLE PCR RUN – 26 SAMPLES & 1 METHOD BLANK ................................................... 66 TABLE 5.4 ENTEROCOCCI: LABORATORY METHODS .................................................................................................................. 67 TABLE 5.5 ENTEROCOCCI: PARAMETER MEASUREMENT DATA QUALITY OBJECTIVES ........................................................................ 68 TABLE 5.6 ENTEROCOCCI: LABORATORY QC PROCEDURES – ENTEROCOCCI DNA SEQUENCES .......................................................... 68 TABLE 6.1 FISH VOUCHER: REQUIRED DATA ELEMENTS – LOGIN ................................................................................................. 76 TABLE 6.2 FISH VOUCHER: REQUIRED DATA ELEMENTS – DATA SUBMISSION WORKSHEET ................................................................ 80 TABLE 6.3 FISH VOUCHER: MEASUREMENT DATA QUALITY OBJECTIVES ........................................................................................ 81 TABLE 6.4 FISH VOUCHER: QUALITY CONTROL – TAXONOMIC IDENTIFICATION .............................................................................. 82 TABLE 6.5 FISH VOUCHER: DATA VALIDATION ......................................................................................................................... 82 TABLE 8.1 FISH TISSUE PLUG: MEASUREMENT DATA QUALITY OBJECTIVES .................................................................................... 85 TABLE 8.2 FISH TISSUE PLUG: QUALITY CONTROL .................................................................................................................... 85 TABLE 9.2 PERIPHYTON: REQUIRED DATA ELEMENTS – LOGIN .................................................................................................... 94 TABLE 9.3 PERIPHYTON: REQUIRED DATA ELEMENTS – SUBSAMPLING ......................................................................................... 97 TABLE 9.4 PERIPHYTON: REQUIRED DATA ELEMENTS – DIATOM CLEANING & MOUNTING .............................................................. 102 TABLE 9.5 PERIPHYTON: REQUIRED DATA ELEMENTS – ANALYSIS .............................................................................................. 112 TABLE 9.6 PERIPHYTON: REQUIRED DATA ELEMENTS – ALL ...................................................................................................... 116 TABLE 9.7 PERIPHYTON: MEASUREMENT DATA QUALITY OBJECTIVES – DIATOMS ......................................................................... 126 TABLE 9.8 PERIPHYTON: MEASUREMENT DATA QUALITY OBJECTIVES – SOFT BODIED ALGAE ........................................................... 126 TABLE 9.9 PERIPHYTON: QUALITY CONTROL – ALL ACTIVITIES .................................................................................................. 126 TABLE 9.10 PERIPHYTON: DATA VALIDATION ....................................................................................................................... 127 TABLE 10.1 WATER CHEMISTRY: NRSA 2013/14 PARAMETERS ............................................................................................. 129 TABLE 10.2 WATER CHEMISTRY: ACID PRESERVATIVES ADDED FOR VARIOUS ANALYTES ................................................................. 131 TABLE 10.3 WATER CHEMISTRY: NRSA 2013/14 ANALYTICAL METHODS (CENTRAL LABORATORY, EPA ORD‐CORVALLIS) ............... 132 TABLE 10.4 WATER CHEMISTRY & CHLOROPHYLL‐A: LABORATORY METHOD PERFORMANCE REQUIREMENTS .................................... 134 TABLE 10.5 WATER CHEMISTRY: QUALITY CONTROL – LABORATORY SAMPLES ............................................................................ 136 TABLE 10.6 WATER CHEMISTRY: QUALITY CONTROL – DATA VALIDATION................................................................................... 138 TABLE 10.7 WATER CHEMISTRY: DATA REPORTING CRITERIA ................................................................................................... 138 TABLE 10.8 WATER CHEMISTRY: CONSTANTS FOR CONVERTING MAJOR ION CONCENTRATION FROM MG/L TO µEQ/L ........................ 139 TABLE 10.9 WATER CHEMISTRY: FACTORS TO CALCULATE EQUIVALENT CONDUCTIVITIES OF MAJOR IONS. ........................................ 140 TABLE D.0.1 FISH IDENTIFICATION: STANDARD COMMON AND SCIENTIFIC NAMES ....................................................................... 156

2013‐2014 National Rivers & Streams Assessment Laboratory Operations Manual Version 1.3, May 2014 Page vii of 224
vii
LIST OF FIGURES
LISTOFFIGURESFIGURE 3.1 MICROCYSTIN: ABRAXIS MICROCYSTIN TEST KIT ...................................................................................................... 13 FIGURE 3.2 MICROCYSTIN: SAMPLE TEMPLATE ....................................................................................................................... 20 FIGURE 4.1 BENTHIC MACROINVERTEBRATE: SUMMARY OF SORTING .......................................................................................... 37 FIGURE 4.2 BENTHIC MACROINVERTEBRATE: SORTING METHOD EXAMPLE ................................................................................... 40 FIGURE 5.1 ENTEROCOCCI: QPCR ANALYSIS DECISION TREE (ADT) ............................................................................................ 69 FIGURE 6.1 FISH VOUCHER: EXAMPLE QC FISH TAXONOMY BENCH SHEET (OPTIONAL) .................................................................... 83 FIGURE 9.1 PERIPHYTON: SUMMARY OF PROCEDURE FOR IDENTIFYING SOFT ALGAE AND DIATOMS ................................................... 88 FIGURE 10.1 WATER CHEMISTRY: SAMPLE PROCESSING PROCEDURES ....................................................................................... 130
LISTOFACRONYMSA absorbance ADT analysis decision tree AFDM ash‐free dry mass ANC acid neutralizing capacity ANS Academy of Natural Sciences AQM absolute quantitation method ASTM American Society for Testing and Materials Avg Average BHI brain heart infusion BV biovolume Ca Calcium CCE calibrator cell equivalents CEQ cell equivalent Chl‐a chlorophyll‐a CO2 carbon dioxide Ct threshold cycle CPR cardiopulmonary resuscitation cv curriculum vitae CV coefficent of variation DCF dilution/concentration factor DI de‐ionized DIC differential interference contrast DL detection limit DNA Deoxyribo‐nucleic Acid DO dissolved oxygen DOC dissolved organic carbon DTH depositional targeted habitat DW distilled water ELISA enzyme‐linked Immunosorbent assay EMAP Environmental Monitoring and Assessment
Program ENT enterococci EPA Environmental Protection Agency ETOH ethyl alcohol FOM Field Operations Manual GEQ genomic equivalent GIS geographic information system GPS global positioning device
HCl hydrogen chloride HDPE high density polyethylene HNO3 nitric acid HQ headquarters HRP antibody‐Horseradish Peroxidase H2S hydrogen sulfide H2SO4 sulphuric acid IBD ionic balance difference ID Identification IM information management IPC internal positive control ISBN International Standard Book Number ISO International Organization for
Standardization IT IS Integrated Taxonomic Information System
(IT IS) K potassium KC kit control LFB lab fortified blanks LFM lab fortified matrices LIMS Laboratory Information Management
System LOM Lab Operations Manual LRL lower reporting limit Mg magnesium MDL method detection limit MPCA Minnesota Pollution Control Agency MSDS Materials Safety Data Sheet N nitrogen Na sodium NABS North American Benthological Society NALMS North American Lakes Management Society NARS National Aquatic Resource Surveys NAWQA National Water Quality Assessment
Program NC negative control ND nondetect
2013‐2014 National Rivers & Streams Assessment Laboratory Operations Manual Version 1.3, May 2014 Page iii of 224
iii
LIST OF FIGURES
NELAC National Environmental Laboratory Accreditation Conference
NELAP National Environmental Laboratory Accreditation Program
NH4 ammonium NIST National Institute of Standards NO2 nitrite NO3 nitrate NRSA National Rivers and Streams Assessment NTL no template control NTU Nephelometric Turbidity Units OD optical density OSHA Occupational Safety and Health
Administration PBS phosphate buffered saline PCB polychlorinated biphenyl PctDIFF percent difference PDE percent disagreement in enumeration PCR polymerase chain reaction PE performance evaluation PES performance evaluation samples PHab physical habitat P‐M Palmer‐Maloney (P‐M) count PDE percent difference in enumeration PSE percent sorting efficiency PT performance testing PTD percent taxonomic disagreement QA quality assurance QAPP Quality Assurance Project Plan QA/QC quality assurance/quality control QC quality control QCCS quality control check solution QMP Quality Management Plan
qPCR quantitative polymerase chain reaction QRG Quick Reference Guide RL reporting limit RMSE root mean square error RO reverse‐osmosis RPD relative percent difference RQM relative quantitation method RSD relative standard deviation RTH richest targeted habitat S standard deviation S0‐S5 standards provided with microcystin kit SFS Society of Freshwater Science SEG Site Evaluation Guidelines SiO2 silica SO4 sulphate SOPs Standard Operating Procedures SPC sample processing control S‐R Sedgewick‐Rafter count SRM standard reference material SS salmon sperm TMB tetramethylbenzidine TN total nitrogen TOC total organic carbon TP total phosphorus TRANS transect TSN taxonomic serial number TSS total suspended solids TVS total volatile solids UNK unknown USGS United States Geological Survey WSA Wadeable Streams Assessment WQX Water Quality Exchange


2013‐2014 National Rivers & Streams Assessment Laboratory Operations Manual
Version 1.3, May 2014 Page 10 of 224
10
INTR
ODUCTION
1.0 INTRODUCTIONThis manual describes methods for analyses of the samples to be collected during the National Rivers and Streams Assessment (NRSA), including quality assurance objectives, sample handling, and data reporting. The NRSA is a probabilistic assessment of the condition of our Nation’s rivers and streams and is designed to:
Assess the condition of the Nation’s rivers and streams
Establish a baseline to compare future rivers and streams surveys for trends assessments
Evaluate changes in condition from the 2004 Wadeable Streams Assessment
Help build State and Tribal capacity for monitoring and assessment and promote collaboration across jurisdictional boundaries
This is one of a series of water assessments being conducted by states, tribes, the U.S. Environmental Protection Agency (EPA), and other partners. In addition to rivers and streams, the water assessments will also focus on coastal waters, lakes, and wetlands in a revolving sequence. The purpose of these assessments is to generate statistically‐valid reports on the condition of our Nation’s water resources and identify key stressors to these systems.
The goal of the NRSA is to address two key questions about the quality of the Nation’s rivers and streams:
What percent of the Nation’s rivers and streams are in good, fair, and poor condition for key indicators of water quality, ecological health, and recreation?
What is the relative importance of key stressors such as nutrients and pathogens?
EPA selected sampling locations using a probability based survey design. Sample surveys have been used in a variety of fields (e.g., election polls, monthly labor estimates, forest inventory analysis) to determine the status of populations or resources of interest using a representative sample of a relatively few members or sites. Using this survey design allows data from the subset of sampled sites to be applied to the larger target population, and assessments with known confidence bounds to be made.
With input from the states and other partners, EPA used an unequal probability design to select 900 wadeable streams and 900 non‐wadeable rivers. To estimate change from the 2004 Wadeable Streams Assessment (WSA), 450 of the 900 wadeable sites were selected using an unequal probability design from the WSA original sites. Field crews will collect a variety of measurements and samples from randomly predetermined sampling reaches (located with an assigned set of coordinates), and from randomized stations along the sampling reach.

2013‐2014 National Rivers & Streams Assessment Laboratory Operations Manual Version 1.3, May 2014 Page 11 of 224
11
GEN
ERAL LABORATO
RY GUIDELINES
2.0 GENERALLABORATORYGUIDELINES
2.1 ResponsibilityandPersonnelQualifications
All laboratory personnel shall be trained in advance in the use of equipment and procedures used for the standard operating procedure (SOP) in which they are responsible. All personnel shall be responsible for complying with all of the QA/QC requirements that pertain to the samples to be analyzed. Each lab should follow its institutional or organizational requirements for instrument maintenance. Specific lab qualification documentation required for analysis is contained in the Quality Assurance Project Plan (QAPP).
2.2 RolesandContactInformation
The EPA Headquarters Project Management Team consists of the Project Leader, Alternate Project Leaders, Project QA Lead, and Laboratory Review Manager. The Team is responsible for overseeing all aspects of the project and ensuring technical and quality assurance requirements are properly carried out. The Team is the final authority on all decisions regarding laboratory analysis.
The NARS Information Management (IM) Coordinator tracks the location of each NRSA 2013‐2014 sample that involves post‐processing. The coordinator will be the labs main point of contact in regards to sample tracking and data submission.
Table 2.1 Contact information
Title Name Contact Information
EPA HQ NRSA Project Lead Ellen Tarquinio, OW [email protected]
202‐566‐2267
EPA HQ NRSA Project QA Lead
Sarah Lehmann, OW [email protected]
202‐566‐1379
EPA HQ NRSA Laboratory Review Manager
Kendra Forde, OW [email protected]
202‐564‐0417
Information Management Center Coordinator
Marlys Cappaert, SRA International Inc.
541‐754‐4467
541‐754‐4799 (fax)
2.3 SampleTracking
Samples are collected by a large number of different field crews during the index period (May through September). The actual number of rivers and streams sampled on a given day will vary widely during this time. Field crews will submit electronic forms when they have shipped samples and the NARS IM Center will input each sample into the NARS IM database. Laboratories can track sample shipment from field crews by accessing the NARS IM database. Participating laboratories will be given access to the NARS IM system, where they can acquire tracking numbers and information on samples that have been shipped to them by field crews (either by overnight shipment for perishable samples or batch shipments for preserved samples). Upon sample receipt, the laboratory must immediately log in to the database and confirm that samples have arrived. Overnight samples may not be loaded into the database prior to sample arrival, but should be tracked by the laboratory and receipt information inputted into the database when sample information is loaded. Each lab will make arrangements with the NARS IM Coordinator, listed above, to ensure access is granted.

2013‐2014 National Rivers & Streams Assessment Laboratory Operations Manual
Version 1.3, May 2014 Page 12 of 224
12
GEN
ERAL LABORATO
RY GUIDELINES
When the samples arrive from the field crews, laboratories should also receive tracking forms in the shipment (refer to the NRSA 2013‐2014 FOM). These forms will list the samples that should be included in the shipment. Laboratory personnel should cross check the forms with the samples received to verify that there are not any inconsistencies. If any sample is missing or damaged, contact the NARS IM Coordinator immediately.
2.4 Reporting
All labs must provide data analysis information to the HQ Project Management Team and the NARS IM Center by March 30, 2015 or as stipulated in contractual agreements. These reports must include the following information:
Sample Type (indicator)
Site ID (ex: CAS9‐0918)
Sample ID (ex: 999000)
Pertinent information to the indicator
Metadata for all fields
See Appendix C for reporting templates that labs will submit electronically.
The submitted file name must state the following:
Indicator name (ex: microcystin)
Date of files submission to NARS IM Center by year, month, and day (ex: 2013_11_01)
Lab name (ex: MyLab)
Combined, the file name would look as follows: WaterChemistry_2013_11_01_MyLab.xlsx
As specified in the QAPP, remaining sample material and specimens must be maintained by the EPA’s designated laboratory or facilities as directed by the NRSA 2013‐2014 Project Lead. All samples and raw data files (including logbooks, bench sheets, and instrument tracings) are to be retained by the laboratory for 3 years or until authorized for disposal, in writing, by the EPA Project Lead. Deliverables from contractors and cooperators, including raw data, are permanent as per EPA Record Schedule 258. EPA’s project records are scheduled 501 and are also permanent.

2013‐2014 National Rivers & Streams Assessment Laboratory Operations Manual Version 1.3, May 2014 Page 13 of 224
13
ALG
AL TO
XIN (MICROCYSTIN) IM
MUNOASSAY PROCED
URE
3.0 ALGALTOXIN(MICROCYSTIN)IMMUNOASSAYPROCEDUREThis chapter describes an immunoassay procedure that measures concentrations of total microcystins in water samples. In applying the procedure, the laboratory uses Abraxis’ Microcystins‐ADDA Test Kits (Figure 3.1; “kits”). Each kit is an enzyme‐linked immunosorbent assay (ELISA) for the determination of microcystins and nodularins in water samples. Microcystins refers to the entire group of toxins, all of the different congeners, rather than just one congener. Algae can produce one or many different congeners at any one time, including Microcystin‐LR (used in the kit’s calibration standards), Microcystin‐LA, and Microcystin‐RR. The different letters on the end signify the chemical structure (each one is slightly different) which makes each congener different.
Figure 3.1 Microcystin: Abraxis microcystin test kit
(from James, page 3, 2010)
3.1 SummaryoftheProcedure
The procedure is an adaption of the instructions provided by Abraxis for determining total microcystins concentrations using its ELISA‐ADDA kits.a For freshwater samples, the procedure’s reporting range is 0.15 µg/L to 5.0 µg/L, although, theoretically, the procedure can detect, not quantify, microcystins concentrations as low as 0.10 µg/L. For samples with higher concentrations of microcystins, the procedure includes the necessary dilution steps.
a Abraxis, “Microcystins‐ADDA ELISA (Microtiter Plate): User’s Guide R021412.” Retrieved on January 14, 2014 from http://www.abraxiskits.com/uploads/products/docfiles/278_Microcystin%20PL%20ADDA%20users%20R120214.pdf.

2013‐2014 National Rivers & Streams Assessment Laboratory Operations Manual
Version 1.3, May 2014 Page 14 of 224
14
ALG
AL TO
XIN (MICROCYSTIN) IM
MUNOASSAY PROCED
URE
3.2 HealthandSafetyWarnings
The laboratory must require its staff to abide by appropriate health and safety precautions, because the kit substrate solution contains tetramethylbenzidine (TMB) and the stop solution contains diluted sulfuric acid. In addition to the laboratory’s usual requirements such as a Chemical Hygiene Plan, the laboratory must adhere to the following health and safety procedures:
1. Laboratory facilities must properly store and dispose of solutions of weak acid.
2. Laboratory personnel must wear proper personal protection clothing and equipment (e.g. lab
coat, protective eyeware, gloves).
3. When working with potential hazardous chemicals (e.g., weak acid), laboratory personnel must
avoid inhalation, skin contact, eye contact, or ingestion. Laboratory personnel must avoid
contacting skin and mucous membranes with the TMB and stopping solution. If skin contact
occurs, remove clothing immediately. Wash and rinse the affected skin areas thoroughly with
large amounts of water.
3.3 DefinitionsandRequiredResources(Personnel,Laboratories,andEquipment)
This section provides definitions and required resources for using the procedure.
3.3.1 Definitions
The following terms are used throughout the procedure:
Absorbance (A) is a measure of the amount of light in a sample. A standard statistical curve is used to convert the absorbance value to the concentration value of microcystins.
Calibration Range is the assay range for which analysis results can be reported with confidence. For undiluted samples, it ranges from the reporting limit of 0.15 µg/L to a maximum value of 5.0 µg/L. Values outside the range are handled as follows. If the value is:
< 0.10 µg/L, then the laboratory reports the result as being non‐detected (“<0.10 µg/L”).
Between 0.10 µg/L and the reporting limit of 0.15 µg/L (i.e., >0.10 µg/L and <0.15 µg/L), the
laboratory should record the value, but assign a QC code to the value (i.e., DATA_FLAG=J).
5.0 µg/L, the laboratory must dilute and reanalyze the sample.
Coefficient of Variation (CV): The precision for a sample is reported in terms of the percent CV of its absorbance values. To calculate the %CV, first calculate S (standard deviation) as follows:
11
/
where n is the number of replicate samples, Ai, is the absorbance measured for the ith replicate. Per Section 3.5.3, samples are evaluated in duplicate (i=1 or 2); controls are either evaluated in duplicate or
triplicate (i=1, 2, 3). is the average absorbance of the replicates. Then, calculate %CV as:
% 100
Dark or Dimly Lit: Away from sunlight, but under incandescent lighting is acceptable.

2013‐2014 National Rivers & Streams Assessment Laboratory Operations Manual Version 1.3, May 2014 Page 15 of 224
15
ALG
AL TO
XIN (MICROCYSTIN) IM
MUNOASSAY PROCED
URE
Detection Limit is the minimum concentration at which the analyte can be detected with confidence. In other words, the outcome can be reported with confidence that it is greater than zero (i.e., present in the sample). The detection limit is less than the reporting limit of 0.15 µg/L at which the measured value of the analyte can be reported with confidence. Also see “Sample‐Specific Detection Limit.”
Duplicates are defined as two aliquots of the same sample which are analyzed separately using identical procedures. The results are used to evaluate the precision of the laboratory analyses. Per Section 3.5.3, controls are evaluated in duplicate or triplicate (i.e., three aliquots).
NARS: National Aquatic Resource Surveys. The National Rivers and Streams Assessment (NRSA) is part of the NARS program.
NARS Information Management System (NARS IM): The IM system established to support all surveys, including NRSA, in the NARS program. The IM system is used to track the samples from field collection to the laboratory.
NRSA: National Rivers and Streams Assessment. Freshwater samples will be collected during the field stage of NRSA.
Relative Standard Deviation (RSD) is the same as the coefficient of variation (%CV). Because many of the plate reader software programs provides the CV in their outputs, the procedure presents the quality control requirement in terms of %CV instead of RSD.
Reporting Limit: For undiluted freshwater sample, the reporting limit is 0.15 µg/L. A reporting limit is the point at which the measured value of the analyte can be reported with confidence.
Standard Deviation (S) shows variation from the average
Sample‐Specific Detection Limit: Most samples will have a sample‐specific detection equal to the method’s detection limit of 0.1 µg/L. For diluted samples, the sample‐specific detection limit will be the product of the method’s detection limit of 0.1 µg/L and the dilution factor. Typical values for the dilution factor will be 10 or 100.
3.4 GeneralRequirementsforLaboratories
3.4.1 Expertise
To demonstrate its expertise, the laboratory shall provide EPA with one or more of the following:
Memorandum that identifies the relevant services that the laboratory provided for the National
Aquatic Resource Surveys in the past five years.
Documentation detailing the expertise of the organization, including professional certifications
for water‐related analyses, membership in professional societies, and experience with analyses
that are the same or similar to the requirements of this method.
3.4.2 Qualityassuranceandqualitycontrolrequirements
To demonstrate its expertise in quality assurance and quality control procedures, the organization shall provide EPA with copies of the quality‐related documents relevant to the procedure. Examples include Quality Management Plans (QMP), QAPPs, and applicable Standard Operating Procedures (SOPs).
To demonstrate its ongoing commitment, the person in charge of quality issues for the organization shall sign the NRSA QAPP Certification Page.

2013‐2014 National Rivers & Streams Assessment Laboratory Operations Manual
Version 1.3, May 2014 Page 16 of 224
16
ALG
AL TO
XIN (MICROCYSTIN) IM
MUNOASSAY PROCED
URE
3.4.3 Personnel
Laboratory Technician: This procedure may be used by any laboratory technician who is familiar with the NRSA 2013‐14 QAPP, and this procedure in the NRSA 2013‐14 LOM (which differs from the Abraxis instructions). The laboratory technician also must be familiar with the use of a multichannel pipette and plate readers.
External QC Coordinator is an EPA staff person who is responsible for selecting and managing the “QC contractor.” To eliminate the appearance of any inherent bias, the QC contractor must be dedicated to QA/QC functions, and thus, must not be a primary laboratory or a field sampling contractor for NRSA. The QC contractor is responsible for complying with instructions from the External QC Coordinator; coordinating and paying for shipments of the performance samples to participating laboratories; comparing immunoassay results from the laboratories; and preparing brief summary reports.
3.4.4 Equipment/Materials
The procedures require the following equipment and information:
Abraxis ADDA Test Kit, Product #520011 (see items in Section 3.6.2)
Adhesive Sealing Film (Parafilm) for Micro Plates (such as Rainin, non‐sterile, Cat. No. 96‐SP‐
100): Used to cover plates during incubation.
Data Template – See Figure 3.2
Distilled or Deionized Water: For diluting samples when necessary.
ELISA evaluation software
Glass scintillation, LC, vials (two vials of 2 mL each)
Glass vials with Teflon‐lined caps of size:
o 20 mL
o 4 mL (for dilutions)
Multichannel Pipette & Tips: A single‐channel and an 8‐channel pipette are used for this
method.
Norm‐ject syringes (or equivalent)
Paper Towels: For blotting the microtiter plates dry after washing.
Permanent Marker (Sharpie Fine Point): For labeling samples, bottles, plates and covers.
Plate Reader (e.g., Metertech Model M965 AccuReader; ChroMate®; or equivalent readers with
software to read the microtiter plates and measure absorbances).
Reagent Reservoirs (e.g., Costar Cat Number 4870): Plain plastic reservoir for reagents that
accommodate the use of a multi‐channel pipette.
Test tubes: For dilutions, if needed.
Timer: For measuring incubation times.
Vortex Genie: For mixing dilutions.
Whatman Glass fiber syringe filter (25mm, GF 0.45 µm filter)
3.5 SampleReceipt
Field crews hold the microcystins samples on ice while in the field and then pack the samples in ice for delivery to a central facility (“batching laboratory”) or the State’s laboratory. The batching and State laboratories freeze the samples upon receipt. Periodically, the batching laboratory ships samples to the

2013‐2014 National Rivers & Streams Assessment Laboratory Operations Manual Version 1.3, May 2014 Page 17 of 224
17
ALG
AL TO
XIN (MICROCYSTIN) IM
MUNOASSAY PROCED
URE
microcystins laboratory. The batching and microcystins laboratory may retain the frozen samples for several months before analysis.
Because EPA initiates tracking procedures designed to recover any missing shipment, the laboratory personnel responsible for tracking samples must start the following login steps within 24 clock hours of receiving a delivery.
1. Report receipt of samples in the NARS IM sample tracking system (within 24 clock hours).
2. Inspect each sample THE SAME DAY THEY ARE RECEIVED:
a. Verify that the sample IDs in the shipment match those recorded on the:
i. Chain of custody forms when the batching laboratory sends the samples to the
microcystins laboratory; or
ii. Sample tracking form if the field crew sends the shipment directly to the State
laboratory.
b. Record the information in Table 3.1 into NARS IM, including the Condition Code for each
sample:
i. OK: Sample is in good condition
ii. C: Sample container was cracked
iii. L: Sample container is leaking
iv. ML: Sample label is missing
v. NF: Sample not frozen c. If any sample is damaged or missing, contact the EPA HQ Laboratory Review Manager to
discuss whether the sample can be analyzed. (See contact information in Table 2.1).
3. Store samples in the freezer until sample preparation begins.
4. Maintain the chain of custody or sample tracking forms with the samples.
Table 3.1 Microcystin: required data elements – login
FIELD FORMAT DESCRIPTION
LAB ID text Name or abbreviation for QC laboratory
DATE RECEIVED MMDDYY Date sample was received by lab
SITE ID text NRSA site id as used on sample label
VISIT NUMBER numeric Sequential visits to site (1 or 2)
SAMPLE ID numeric Sample id as used on field sheet (on sample label)
DATE COLLECTED MMDDYY Date sample was collected
CONDITION CODE text Condition codes describing the condition of the sample upon arrival at the laboratory.
Flag Definition
OK Sample is in good condition
C Sample container is cracked
L Sample or container is leaking
ML Sample label is missing
NF Sample is not frozen
Q Other quality concerns, not identified above
3.6 Procedure
The following sections describe the sample and kit preparation and analysis.

2013‐2014 National Rivers & Streams Assessment Laboratory Operations Manual
Version 1.3, May 2014 Page 18 of 224
18
ALG
AL TO
XIN (MICROCYSTIN) IM
MUNOASSAY PROCED
URE
3.6.1 SamplePreparation
For each frozen sample (500 mL per sample), the laboratory technician runs it through a freeze‐thaw cycle three times to lyse the cells as follows:
1. All cycles: Keep the samples in dark or dimly lit areas (i.e., away from sunlight, but under
incandescent lighting is acceptable).
2. First freeze‐thaw cycle:
a. Start with a frozen 500 ml sample.
b. Thaw the sample to room temperature (approximately 25o C). Swirl the sample to check for
ice crystals. At this temperature, no ice crystals should be present in the sample.
c. Shake well to homogenize the sample, then transfer 10 mL to an appropriately labeled clean
20 mL glass vial.
3. Second freeze‐thaw cycle:
a. Freeze the vial.
b. Keep the large sample bottle (from the 500 mL initial sample) frozen for future use.
c. Thaw the sample vial contents to room temperature.
4. Third freeze‐thaw cycle:
a. Freeze the vial.
b. Thaw the vial contents to room temperature.
c. Filter the vial contents through a new, syringe filter (0.45 µm) into a new, labeled 20 mL
glass scintillation vial. Norm‐ject syringes and Whatman Glass fiber syringe filters (25mm, GF
0.45 µm filter) or other similar alternative are acceptable. One new syringe and filter should
be used per sample.
3.6.2 KitPreparation
The technician prepares the kits using the following instructions:
1. Check the expiration date on the kit box and verify that it has not expired. If the kit has expired,
discard and select a kit that is still within its marked shelf life. (Instead of discarding the kit,
consider keeping it for training activities.)
2. Verify that each kit contains all of the required contents:
Microtiter plate
Standards (6) referenced in this procedure as follows with the associated concentration:
o S0: 0 µg/L
o S1: 0.15 µg/L
o S2: 0.40 µg/L,
o S3: 1.0 µg/L
o S4: 2.0 µg/L
o S5: 5.0 µg/L
Kit Control (KC): 0.75 µg/L
Antibody solution
Anti‐Sheep‐HRP Conjugate

2013‐2014 National Rivers & Streams Assessment Laboratory Operations Manual Version 1.3, May 2014 Page 19 of 224
19
ALG
AL TO
XIN (MICROCYSTIN) IM
MUNOASSAY PROCED
URE
Wash Solution 5X Concentrate
Color Solution
Stop Solution
Diluent
3. If any bottles are missing or damaged, discard the kit. This step is important because Abraxis has
calibrated the standards and reagents separately for each kit.
4. Adjust the microtiter plate, samples, standards, and the reagents to room temperature.
5. Remove 12 microtiter plate strips (each for 8 wells) from the foil bag for each kit. The plates
contain 12 strips of 8 wells. If running less than a whole plate, remove unneeded strips from the
strip holder and store in the foil bag, ziplocked closed, and place in the refrigerator.
6. Store the remaining strips in the refrigerator (4‐8o C).
7. Prepare a negative control (NC) using distilled water
8. The standards, controls, antibody solution, enzyme conjugate, color solution, and stop solutions
are ready to use and do not require any further dilutions.
9. Dilute the wash solution with deionized water. (The wash solution is a 5X concentrated
solution.) In a 1L container, dilute the 5X solution 1:5 (i.e., 100 mL of the 5X wash solution plus
400 mL of deionized water). Mix thoroughly. Set aside the diluted solution to wash the
microtiter wells later.
10. Handle the stop solution containing diluted H2SO4 with care.
3.6.3 InsertionofContentsintoWells
This section describes the steps for placing the different solutions into the 96 wells. Because of the potential for cross contamination using a shaker table, the following steps specify manual shaking of the kits instead mechanized shaking.
1. While preparing the samples and kit, turn the plate reader on so it can warm up. The plate
reader needs a minimum of 30 minutes to warm up.
2. Turn on the computer so that it can control and access the plate reader.
3. Print the template (Figure 3.2) to use as reference when loading the standards, controls, and
samples as described in the next step. Templates contain rows, labeled with a marking pen, of
strips of 8 wells that snap into the blank frame. (If the laboratory wishes to use a different
template, provide a copy to the EPA HQ Laboratory Review Manager for approval prior to first
use. (See Section 2 of the manual for contact information.)
4. Using the 100‐µL pipette, add 50 µL, each, of the standards, controls, and samples to the
appropriate wells in the plate. Place all six standards (0.00, 0.15, 0.40, 1.00, 2.0 and 5.0 µg/L),
the kit control (0.75 µL), and negative control, in pairs, starting in the well in the upper left‐hand
corner of the kit as shown in Figure 3.2. Verify that the software displays the same template or
make any necessary corrections.
1 2 3 4 5 6 7 8 9 10 11 12
A S0 S4 NC U4 U8 U12 U16 U20 U24 U28 U32 U36
B S0 S4 NC U4 U8 U12 U16 U20 U24 U28 U32 U36

2013‐2014 National Rivers & Streams Assessment Laboratory Operations Manual
Version 1.3, May 2014 Page 20 of 224
20
ALG
AL TO
XIN (MICROCYSTIN) IM
MUNOASSAY PROCED
URE
C S1 S5 U1 U5 U9 U13 U17 U21 U25 U29 U33 U37
D S1 S5 U1 U5 U9 U13 U17 U21 U25 U29 U33 U37
E S2 KC U2 U6 U10 U14 U18 U22 U26 U30 U34 U38
F S2 KC U2 U6 U10 U14 U18 U22 U26 U30 U34 U38
G S3 KC U3 U7 U11 U15 U19 U23 U27 U31 U35 U39
H S3 NC U3 U7 U11 U15 U19 U23 U27 U31 U35 U39
Figure 3.2 Microcystin: sample template
Key:
S0‐S5 = Standards;
KC = Control supplied with Kit (i.e., Kit Control);
NC = Negative Control;
U = Unknown (sample collected by the field crew);
5. Add 50 μL of the pink antibody solution to each well using the multi‐channel pipettor and a
reagent reservoir. Use dedicated reagent reservoirs for each reagent to avoid contamination
from one reagent to another.
6. Place the sealing Parafilm over the wells.
7. Manually mix the contents by moving the strip holder in a rapid circular motion on the benchtop
for 30 seconds. Be careful not to spill the contents.
8. Place the plate in an area away from light for 90 minutes.
9. After 90 minutes, carefully remove the Parafilm.
10. Empty the contents of the plate into the sink, pat inverted plate dry on a stack of paper towels,
and then wash the wells of the plate three times with 250 μL of washing solution using the
multi‐channel pipette. After adding the washing solution each time, empty the solution into the
sink and use the paper towels as before.
11. Add 100 µL of enzyme conjugate solution to all wells using the multi‐channel pipettor.
12. Cover the wells with Parafilm.
13. Manually mix the contents by moving the strip holder in a rapid circular motion on the benchtop
for 30 seconds. Be careful not to spill the contents.
14. Place the strip holder in an area away from light for 30 minutes.
15. After 30 minutes, remove the Parafilm, decant, and rinse the wells three times again with 250
µL of washing solution as described in step 10.
16. Add 100 µL of color solution to the wells using the multi‐channel pipette and reagent reservoir.
This color solution will make the contents have a blue hue.
17. Cover the wells with Parafilm.
18. Manually mix the contents by moving the strip holder in a rapid circular motion on the benchtop
for 30 seconds. Be careful not to spill the contents.
19. Place the plate in an area away from light for 20 minutes.
20. After 20 minutes, remove the Parafilm and add 50 µL of stopping solution to the wells in the
same sequence as for the color solution. This will turn the contents a bright yellow color. After
adding the stopping solution, read the plate within 15 minutes.

2013‐2014 National Rivers & Streams Assessment Laboratory Operations Manual Version 1.3, May 2014 Page 21 of 224
21
ALG
AL TO
XIN (MICROCYSTIN) IM
MUNOASSAY PROCED
URE
21. Within 15 minutes of adding the stopping solution, use the microplate ELISA photometer (plate
reader) to determine the absorbance at 450 nm. The software (i.e., commercial ELISA evaluation
program) calculates the absorbance and concentration values of the samples from the
calibration curve and the average values for each pair. Use a 4‐parameter standard curve fit to
determine the concentrations.
22. Dispose of solution in plates in a lab sink. Rinse plates and sink with water to dilute the weak
acid present.
23. Perform QC evaluations of the data as follows:
a. If the following failures occur, then the laboratory must reanalyze all samples in the
analytical run:
i. Standard curve with a correlation coefficient of less than 0.99 (i.e., R<0.99)
ii. Standards S0‐S5 must have decreasing absorbance values. First, calculate the average
values for each standard. That is, if Āi is the absorbance average for Si, then the
absorbance averages must be:
iii. Ā0 > Ā1 > Ā2 > Ā3 > Ā4 >Ā5
iv. The average absorbance of the standard S0 less than 0.8 (i.e., Ā0 < 0.8).
v. Two or more negative control samples with detectable concentrations of microcystins
(i.e., values > 0.1 µg/L). If this occurs, then evaluate possible causes (e.g., cross‐
contamination between samples), and if appropriate, modify laboratory processes
before the next analytical run.
vi. Results for control samples of outside the acceptable range of 0.75 +/‐ 0.185 ppb. That
is, results must be between 0.565 and 0.935.
b. If either, or both, of the following failures occur, then the sample must be reanalyzed
(maximum of two analyses, consisting of the original analysis and, if necessary, one
reanalysis):
i. The concentration value registers as HIGH (exceeds the calibration range). Dilute the
sample for the reanalysis per Section 3.6.4.
ii. The %CV > 15% between the duplicate absorbance values for a sample.
24. Record the results, even if the data failed the quality control requirements in #23b, for each well
in EPA’s data template (see Table 3.2 for required elements). The required entries are for the
following columns:
a. TYPE should be one of the following codes: S0‐S5 for standards; KC, NC, or SC for controls; U
for unknown sample.
b. CONC contains the numeric concentration value. Two special cases:
i. Non‐detected concentrations: If the sample is non‐detected, then provide the sample‐
specific detection limit which is 0.1 µg/L if the sample is undiluted. See Section 3.6.4 for
calculating the sample‐specific detection limit for a diluted sample.
ii. If the result shows that it is “HI,” this indicates that the sample value is outside of the
calibration range and must be diluted and re‐run using another analytical run. Leave the
CONC column blank and record ‘HI’ in the DATA FLAG column.
c. DATA FLAGS have codes for the following special cases:
i. ND if the sample was non‐detected;

2013‐2014 National Rivers & Streams Assessment Laboratory Operations Manual
Version 1.3, May 2014 Page 22 of 224
22
ALG
AL TO
XIN (MICROCYSTIN) IM
MUNOASSAY PROCED
URE
ii. J if the value is detected but at a level below the reporting limit of 0.15 µg/L (for
undiluted samples);
iii. HI if the concentration value registers as HIGH (exceeds the calibration range).
d. QUALITY FLAGS have codes for the following special cases:
i. QCF if there is a QC failure per step 23 above. The QCF code must be used for all failures
to facilitate data analysis.
ii. Q for any other quality issue (describe in COMMENTS)
e. DILUTION FACTOR is only required if the sample was diluted.
f. DUP AVG and DUP CV are required for duplicate samples and control samples (use all three
values if the controls are used in triplicate).
Table 3.2 Microcystin: required data elements – data submission
STAGE FIELD FORMAT DESCRIPTION
LOGIN LAB ID text Name or abbreviation for QC laboratory
DATE RECEIVED text Date sample was received by lab
SITE ID text NRSA site ID code as recorded on sample label or tracking form (blank if standard or control)
VISIT NUMBER numeric Sequential visits to site (1 or 2) (blank if standard or control)
SAMPLE ID numeric 6‐digit Sample ID number as recorded on sample jar or tracking form (blank if standard or control)
DATE COLLECTED MMDDYY Date sample was collected (blank if standard or control)
CONDITION CODE text Sample condition upon arrival at the laboratory (blank if standard or control)
Flag Definition
Blank or N Not a sample (blank, standard, or control)
OK Sample is in good condition
C Sample container is cracked
L Sample or container is leaking
ML Sample label is missing
NF Sample is not frozen
ANALYSIS TECHNICIAN text Name or initials of technician performing the procedure
KIT EXPIRE DATE MMDDYY Expiration date on kit box
KIT ID text Kit identification code. If one does not exist, assign a unique code to each kit.
R2 numeric R2 from curve fit to the average absorbance values for the standards. Value is between 0 and 1.
TYPE text Type of solution being tested in the well
Code Definition
KC Kit Control
NC Negative Control
S0,S1, S2,S3, S4, S5 Standard
U Sample of unknown concentration
LOCATION text Location of well in the kit (e.g., B5 would be the fifth well from the left in the second row B)
SALINITY numeric If the sample vial has the salinity marked on the vial, record the value in units of parts per thousand. Otherwise, leave blank.

2013‐2014 National Rivers & Streams Assessment Laboratory Operations Manual Version 1.3, May 2014 Page 23 of 224
23
ALG
AL TO
XIN (MICROCYSTIN) IM
MUNOASSAY PROCED
URE
CONC numeric Concentration or sample‐specific detection limit of contents of well in µg/L. Sample‐specific detection limit should be 0.1 µg/L if the sample hasn’t been diluted.
ABSORBANCE numeric Absorbance value
DILUTION FACTOR numeric 10, 100, etc for number of times the sample was diluted. If not diluted, leave blank or record 1
CV_ABSORB numeric Calculated %CV of duplicate values of absorbance for a sample. Only calculated for TYPE=U, KC, or NC. Enter %CV. Value is between 0 and 100%.
AVG_ABSORB numeric Calculated average of absorbance values for a sample. Only provided for TYPE=U, KC, NC, or SC. Average value of the original sample and its duplicate (or replicates for KC and NC).
AVG_CONC numeric Calculated average of concentration values for a sample.Substitute 0.15 µg/L for any result recorded as <0.15 µg/L
DATA FLAG (if appropriate)
text Data qualifier codes associated with specific identifications of voucher samples. These codes provide more information that those used when reporting receipt of samples. A technician may use alternative or additional qualifiers if definitions are provided as part of the submitted data package (e.g., as a separate worksheet page of the data submission file).
Flag Definition
ND Concentration below detection. Unless the sample was diluted, the concentration will be 0.1 µg/L
HI Result indicated that a high concentration (i.e., outside calibration range)
J Concentration above detection but below reporting limit. Without dilution, these values are between 0.1 and 0.15 µg/L
QUAL_FLAG QCF/Q QCF QC failure
Q Other quality concerns, not identified above
COMMENTS text Explanation for data flag(s) (if needed) or other comments.
3.6.4 Dilutions(ifneeded)
Dilutions if needed are prepared as follows (using clean glass tubes):
1:10 dilution
a. Add 900 µL of distilled water to a clean vial. (Note: Dilutions may also be made using the
kit’s diluent rather than distilled water.)
b. Pipette 100 µL from the sample into the vial. (To provide more accurate dilutions and less
chance of contaminating the diluent, the diluent should be added to the vial before the
sample.)
c. Mix by vortexing.
d. Multiply final concentration and Abraxis’ detection limit of 0.1 µg/L by 10 to obtain the
sample‐specific detection limit of 1.0 µg/L.
1:100 dilution

2013‐2014 National Rivers & Streams Assessment Laboratory Operations Manual
Version 1.3, May 2014 Page 24 of 224
24
ALG
AL TO
XIN (MICROCYSTIN) IM
MUNOASSAY PROCED
URE
a. Add 3.96 mL of distilled water to a clean, appropriately labeled glass vial. (Note: Dilutions
may also be made using the kit's diluent rather than distilled water.)
b. Vortex the sample to mix thoroughly, then pipette 40 µL from the sample and add to the
water (or diluent) in the appropriate labeled vial. Vortex.
c. Multiply the final concentration and Abraxis' detection limit of 0.1 µg/L by 100 to obtain the
sample‐specific detection limit of 10 µg/L.
Other dilutions can be calculated in the same manner as #1 and #2 if needed.
3.7 QualityMeasures
This section describes the quality assurance and quality control measures used to ensure that the data will meet NRSA’s requirements.
3.7.1 AssistanceVisits
Assistance visits are intended to familiarize EPA with actual procedures being implemented by different laboratories; and to ensure a clear and consistent understanding of procedures and activities by both EPA and the laboratories. If EPA decides to conduct an assistance visit, a qualified EPA scientist or contractor will administer a checklist based upon the steps described in this chapter.
3.7.2 QCSamples
During the course of the survey, the External QC Coordinator will instruct the QC contractor to provide one or two identical sets of QC samples to all participating laboratories. Each set will contain up to five QC samples. As determined by the External QC Coordinator, the QC samples may be synthetic; aliquots of additional samples collected at NRSA reference sites; or reference samples obtained from an organization such as the National Institute of Standards. Each laboratory will run the QC samples following the same procedures used for the other samples. The QC contractor will compare the results and assess patterns in the data (e.g., one laboratory being consistently higher or lower than all others). Based upon the evaluation, the External QC Coordinator may request additional information from one or more laboratories about any deviations from the Method or unique laboratory practices that might account for differences between the laboratory and others. With this additional information, the External QC Coordinator will determine an appropriate course of action, including no action, flagging the data, or excluding some or all of the laboratory’s data.
3.7.3 SummaryofQA/QCRequirements
Table 3.3 provides a summary of the quality control requirements described in Sections 3.5 and 3.6.
Table 3.3 Microcystin: quality control – sample analysis
Quality Control Activity
Description and Requirements Corrective Action
Kit – Shelf Life Is within its expiration date listed on kit box. If kit has expired, then discard or set aside for training activities.
Kit – Contents All required contents must be present and in acceptable condition. This is important because Abraxis has calibrated the standards and reagents separately for each kit.
If any bottles are missing or damaged, discard the kit.
Calibration All of the following must be met: If any requirement fails:
2013‐2014 National Rivers & Streams Assessment Laboratory Operations Manual Version 1.3, May 2014 Page 25 of 224
25
ALG
AL TO
XIN (MICROCYSTIN) IM
MUNOASSAY PROCED
URE
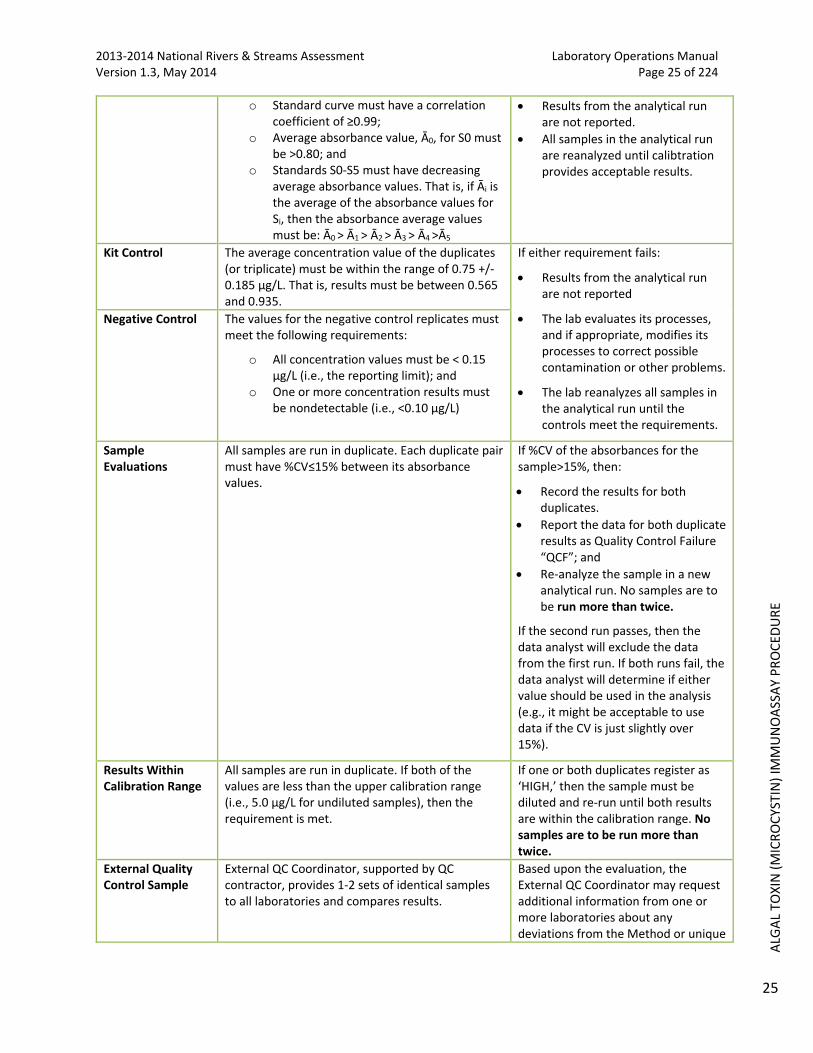
o Standard curve must have a correlation coefficient of ≥0.99;
o Average absorbance value, Ā0, for S0 must be >0.80; and
o Standards S0‐S5 must have decreasing average absorbance values. That is, if Āi is the average of the absorbance values for Si, then the absorbance average values must be: Ā0 > Ā1 > Ā2 > Ā3 > Ā4 >Ā5
Results from the analytical run are not reported.
All samples in the analytical run are reanalyzed until calibtration provides acceptable results.
Kit Control The average concentration value of the duplicates (or triplicate) must be within the range of 0.75 +/‐ 0.185 µg/L. That is, results must be between 0.565 and 0.935.
If either requirement fails:
Results from the analytical run are not reported
The lab evaluates its processes, and if appropriate, modifies its processes to correct possible contamination or other problems.
The lab reanalyzes all samples in the analytical run until the controls meet the requirements.
Negative Control The values for the negative control replicates must meet the following requirements:
o All concentration values must be < 0.15 µg/L (i.e., the reporting limit); and
o One or more concentration results must be nondetectable (i.e., <0.10 µg/L)
Sample Evaluations
All samples are run in duplicate. Each duplicate pair must have %CV≤15% between its absorbance values.
If %CV of the absorbances for the sample>15%, then:
Record the results for both duplicates.
Report the data for both duplicate results as Quality Control Failure “QCF”; and
Re‐analyze the sample in a new analytical run. No samples are to be run more than twice.
If the second run passes, then the data analyst will exclude the data from the first run. If both runs fail, the data analyst will determine if either value should be used in the analysis (e.g., it might be acceptable to use data if the CV is just slightly over 15%).
Results Within Calibration Range
All samples are run in duplicate. If both of the values are less than the upper calibration range (i.e., 5.0 µg/L for undiluted samples), then the requirement is met.
If one or both duplicates register as ‘HIGH,’ then the sample must be diluted and re‐run until both results are within the calibration range. No samples are to be run more than twice.
External Quality Control Sample
External QC Coordinator, supported by QC contractor, provides 1‐2 sets of identical samples to all laboratories and compares results.
Based upon the evaluation, the External QC Coordinator may request additional information from one or more laboratories about any deviations from the Method or unique

2013‐2014 National Rivers & Streams Assessment Laboratory Operations Manual
Version 1.3, May 2014 Page 26 of 224
26
ALG
AL TO
XIN (MICROCYSTIN) IM
MUNOASSAY PROCED
URE
laboratory practices that might account for differences between the laboratory and others. With this additional information, the External QC Coordinator will determine an appropriate course of action, including no action, flagging the data, or excluding some or all of the laboratory’s data.
3.8 SampleandRecordRetention
The laboratory shall retain:
1. The sample materials, including vials, for a minimum of 3 years from the date the EPA publishes
the final report. During this time, the laboratory shall freeze the materials. The laboratory shall
periodically check the sample materials for degradation.
2. Original records, including laboratory notebooks and the reference library, for a minimum of 10
years from the date that EPA publishes the final report.
After the stated time periods, the laboratory shall follow its internal protocols for disposal.
3.9 References
Abraxis, “Microcystins‐ADDA ELISA (Microtiter Plate),” Product 520011, R021412, Undated. Retrieved January 2014 from http://www.abraxiskits.com/uploads/products/docfiles/278_Microcystin%20PL%20ADDA%20users%20R120214.p
df.
Abraxis, “Microcystin‐ADDA ELISA Kit, Detailed Procedure,” Undated. Retrieved January 2014 from http://www.abraxiskits.com/uploads/products/docfiles/253_PN520011FLOW.pdf.
James, R., et al., “Environmental Technology Verification Report: Abraxis Microcystin Test Kits: ADDA ELISA Test Kit; DM ELISA Test Kit; Strip Test Kit,” in Environmental Technology Verification System Center 2010. Retrieved March 2013 from http://nepis.epa.gov/Adobe/PDF/P100EL6B.pdf
2013‐2014 National Rivers & Streams Assessment Laboratory Operations Manual Version 1.3, May 2014 Page 27 of 224
27
BEN
THIC M
ACROINVER
TEBRATES
4.0 BENTHICMACROINVERTEBRATES
4.1 Introduction
This chapter describes the steps for identifying benthic macroinvertebrate organisms in samples collected in the National Rivers and Streams Assessment (NRSA). The procedure is adapted from Wadeable Streams Assessment: Benthic Laboratory Methods (USEPA. 2004), and is modified to facilitate processing and identification of benthic organisms collected in the littoral zone of rivers and streams. Field crews preserve samples in the field with ethanol and ship them to a central holding facility or directly to the laboratory. Samples are sent to the laboratory on a regular basis to avoid delays in processing and sample identification.
In the following discussion, Sections 4.1, 4.2, 4.3, and 4.4 summarize the procedure; health and safety concerns; and required resources. Section 4.5 provides the steps for acknowledging sample receipt. Section 4.6 and Section 4.7 provide the steps for preparing and sorting the sample. Sections 4.8 – 4.10 provide the steps for the taxonomy identification, data entry, and sample and record retention. Section 4.11 describes EPA’s external review of laboratory operations. Section 4.12 identifies references used in developing the procedure.
2013‐2014 National Rivers & Streams Assessment Laboratory Operations Manual
Version 1.3, May 2014 Page 28 of 224
28
BEN
THIC M
ACROINVER
TEBRATES
Table 4.8 summarizes the quality control measures.
4.2 SummaryofMethod
The procedure is designed to pick and identify organisms from sediment samples. This section provides a summary of the procedure and quality control measures.
The sorter evenly distributes each sample across a sorting tray(s), and then places an evenly divided grid over the sample, usually 30 grids per tray (“Caton‐style tray”). The sorter randomly selects a minimum of three grids for sorting and picking organisms. The sorter continues until all grids are sorted or the sorter has picked the 500th organism from a subsample. If a sorter reaches 500 organisms in the middle of a subsample, then the sorter continues until that the subsample is completed. Figure 4.1 summarizes the sorting process.
During the identification step, a taxonomist identifies the picked organisms to the target taxonomic levels for the survey and discards materials that do not meet the identification criteria. If necessary, the sorter repeats the sorting and identification process to ensure that the target of 500 organisms is reached. The taxonomist also creates a reference collection with at least one organism from each genus or lowest taxonomic level identified.
As part of the quality control measures, a second taxonomist will re‐identify a subset of the samples to quantify enumeration and taxonomic precision, or consistency, as percent difference in enumeration (PDE) and percent taxonomic disagreement (PTD), to help target corrective actions, and ultimately to help minimize problems during data analysis.
4.3 HealthandSafetyWarnings
In addition to the laboratory’s usual requirements, the following health and safety procedures must be followed for this procedure:
1. All proper personal protection clothing and equipment (e.g. lab coat, protective eyewear /
goggles) must be worn or applied.
2. When working with potential hazardous chemicals (e.g. 95% ethanol) or biological agents
(benthic organisms and sediments) avoid inhalation, skin contact, eye contact, or ingestion. If
skin contact occurs remove clothing immediately and wash / rinse thoroughly. Wash the
affected skin areas thoroughly with large amounts of soap and water.
4.4 DefinitionsandRequiredResources(Laboratory,Personnel,andEquipment)
This section provides definitions and required resources for using this procedure. Section 4.4.1 defines the terms used throughout the procedure. Section 4.4.2 describes the expertise required for each laboratory using the procedure. Section 4.4.3 describes the roles and responsibilities of the personnel involved in the procedure. Section 4.4.4 identifies the equipment necessary to apply the procedure in preparing, sorting, and identifying benthic macroinvertebrate organisms in samples.
4.4.1 Definitions
The following terms are used throughout the procedure:
Caton‐style grid: Subsampling grid that consists of a solid outer tray, a mesh‐bottomed inner tray, evenly spaced squares (e.g., 30 or 36), a square “cookie cutter” and a scoop.
Dissecting microscope: Microscope that is configured to allow low magnification of three‐dimensional objects that are larger or thicker than the compound microscope can accommodate.

2013‐2014 National Rivers & Streams Assessment Laboratory Operations Manual Version 1.3, May 2014 Page 29 of 224
29
BEN
THIC M
ACROINVER
TEBRATES
Distinct taxa: Data analysts use the number of distinct (i.e., unique) taxa within a given sample to evaluate the richness associated with the sample location. The distinctness attribute is assessed sample by sample, and not across all samples. To facilitate the data analyses, the database includes an additional variable (“flag”) that is used for the first identification of a particular taxon in a sample. Section 4.8 provides the steps used to identify which taxa are flagged.
Good quality digital photograph: Good quality means that other taxonomists can readily identify the taxon from one or multiple photographs and the library can readily locate the photographs. To ensure that the photographs meet these objectives, the image must be:
Taken through the microscope at a high enough resolution so that the key diagnostic features
are distinguishable and clear. Include all features that would be necessary for an experienced
taxonomist to identify the specimen, this may require multiple photographs and at different
magnifications.
Positioned so that it includes:
o Only one taxon in the photo. If necessary, the laboratory may edit (e.g., crop) the digital
photograph and save the file with a new filename. Both the original and edited files
must be included in the digital library.
o A scale bar or measurements in an appropriate location to indicate the size of the
specimen.
o One specimen that lies flat on the surface instead of tilted (to the extent practicable).
Saved using a format that preserves the image in the highest resolution possible.
Saved with a filename that is consistent within the digital library and shall include the following
elements in the order listed below:
o NRSA2 (for the second NRSA conducted in 2013‐2014)
o Laboratory name (or abbreviation)
o Sample number
o Taxa name
o Magnification (if applicable, otherwise indicate no magnification as “1x”)
o Date (format YYYYMMDD) that the photograph was taken.
o Appendage of “e” if the photograph was edited (e.g., cropped).
For example, on September 8, 2013, laboratory ABC identified the specimen in sample 1234 to
be a Homoeothrix janthina and took a digital photograph at a resolution of 40x and then
cropped the photograph to eliminate extraneous material. The filenames of the original and
edited photographs would be: NRSA2_ABC_1234_ homoeothrix janthina_40x_20130908.gif and
NRSA2_ABC_1234_ homoeothrix janthina_40x_20130908e.gif.
Elutriate: Circulate water over the sample in order to wash away the lighter or finer particles of the detritus.
Grid: Each individual square within the Caton tray
Inorganic material: Material that is not part of the animal or vegetable kingdom (e.g., gravel, sand, silt)
Integrated Taxonomic Information System (ITIS): Database with standardized, reliable information on species nomenclature and their hierarchical taxonomic classification. EPA has incorporated the ITIS information into classifications used by WQX.
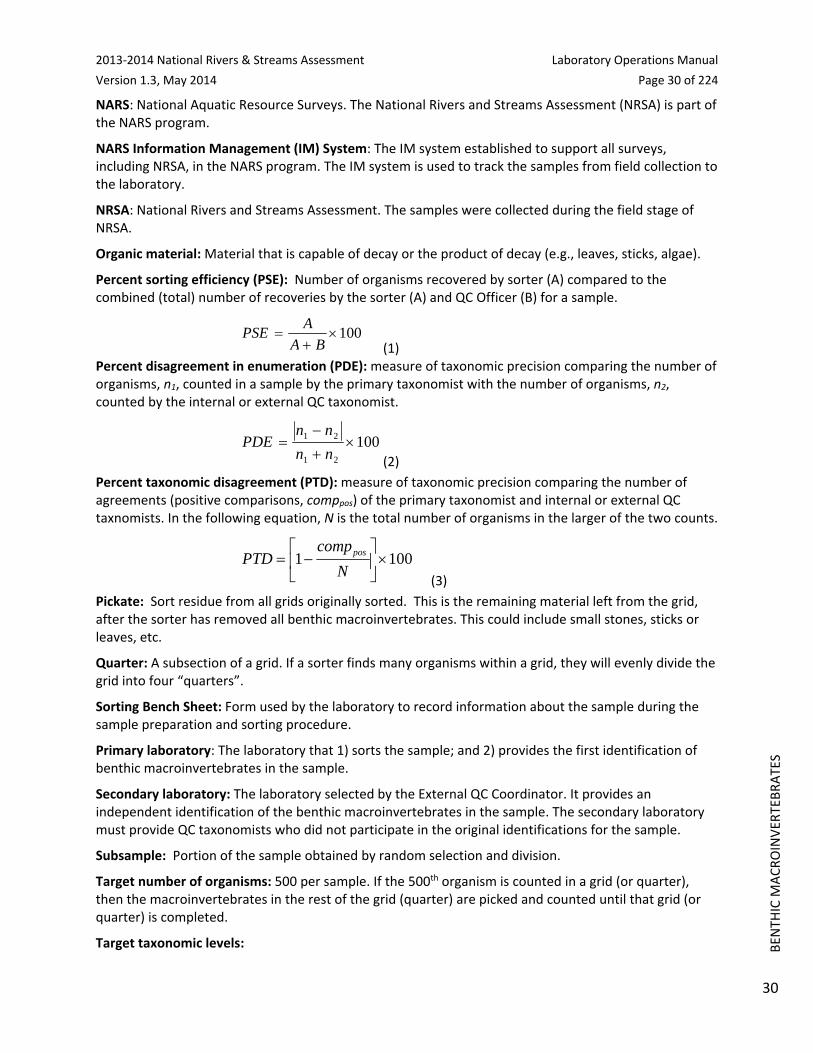
2013‐2014 National Rivers & Streams Assessment Laboratory Operations Manual
Version 1.3, May 2014 Page 30 of 224
30
BEN
THIC M
ACROINVER
TEBRATES
NARS: National Aquatic Resource Surveys. The National Rivers and Streams Assessment (NRSA) is part of the NARS program.
NARS Information Management (IM) System: The IM system established to support all surveys, including NRSA, in the NARS program. The IM system is used to track the samples from field collection to the laboratory.
NRSA: National Rivers and Streams Assessment. The samples were collected during the field stage of NRSA.
Organic material: Material that is capable of decay or the product of decay (e.g., leaves, sticks, algae).
Percent sorting efficiency (PSE): Number of organisms recovered by sorter (A) compared to the combined (total) number of recoveries by the sorter (A) and QC Officer (B) for a sample.
100
BA
APSE
(1)
Percent disagreement in enumeration (PDE): measure of taxonomic precision comparing the number of organisms, n1, counted in a sample by the primary taxonomist with the number of organisms, n2, counted by the internal or external QC taxonomist.
10021
21
nn
nnPDE
(2)
Percent taxonomic disagreement (PTD): measure of taxonomic precision comparing the number of agreements (positive comparisons, comppos) of the primary taxonomist and internal or external QC taxnomists. In the following equation, N is the total number of organisms in the larger of the two counts.
1001
N
compPTD pos
(3)
Pickate: Sort residue from all grids originally sorted. This is the remaining material left from the grid, after the sorter has removed all benthic macroinvertebrates. This could include small stones, sticks or leaves, etc.
Quarter: A subsection of a grid. If a sorter finds many organisms within a grid, they will evenly divide the grid into four “quarters”.
Sorting Bench Sheet: Form used by the laboratory to record information about the sample during the sample preparation and sorting procedure.
Primary laboratory: The laboratory that 1) sorts the sample; and 2) provides the first identification of benthic macroinvertebrates in the sample.
Secondary laboratory: The laboratory selected by the External QC Coordinator. It provides an independent identification of the benthic macroinvertebrates in the sample. The secondary laboratory must provide QC taxonomists who did not participate in the original identifications for the sample.
Subsample: Portion of the sample obtained by random selection and division.
Target number of organisms: 500 per sample. If the 500th organism is counted in a grid (or quarter), then the macroinvertebrates in the rest of the grid (quarter) are picked and counted until that grid (or quarter) is completed.
Target taxonomic levels:

2013‐2014 National Rivers & Streams Assessment Laboratory Operations Manual Version 1.3, May 2014 Page 31 of 224
31
BEN
THIC M
ACROINVER
TEBRATES
Table 4.4 and Table 4.5 provide the target taxonomic levels for typical benthic macroinvertebrates found in freshwater. EPA developed these tables considering its data analysis objectives, and thus, does not require more specific identifications. In other words, taxonomists need only identify benthic macroinvertebrates to the level specified in

2013‐2014 National Rivers & Streams Assessment Laboratory Operations Manual
Version 1.3, May 2014 Page 32 of 224
32
BEN
THIC M
ACROINVER
TEBRATES
Table 4.4 and Table 4.5.
Taxonomic Bench Sheet: Form used by the laboratory to record information about the sample during the identification procedure.
Taxonomic Serial Number (TSN): stable and unique identifier that the Integrated Taxonomic Information System (ITIS), Encyclopedia of Life, and/or Catalogue of Life couples with each scientific name to serve as the "common denominator" for accessing information. ITIS numbers are preferred, but when they are not available secondary sources are acceptable. WQX incorporates this identifier into its “ExternalID” variable in the database. For entries that are not present in the other databases, WQX assigns an identification number that should be used in the same manner as the TSNs. (This is not the identifier that should be used to identify organisms with this procedure. See WQX below for appropriate identifier.)
Water Quality Exchange (WQX): a database framework that allows for data submissions and sharing of water quality monitoring data, including data about benthic macroinvertebrates. It has assigned identification numbers using information from ITIS, Encyclopedia of Life, and Catalogue of Life. The following steps will retrieve the taxon information:
1. Access the WQX database at
http://www.epa.gov/storet/wqx/wqx_getdomainvalueswebservice.html
2. Click on the link for “Taxon” listed near the bottom of the webpage.
3. Select “Save” to the file download popup box that asks “Do you want to open or save this file?”
4. Extract the saved file using software such as WinZip.
5. To open the extracted file in Excel:
a. When prompted, select “Open the file with the following stylesheet applied (select one):”
The selection should show the default of
“http://www.epa.gov/storet/download/domain_value_use.xsl”
b. Click “yes” to the warning about format (i.e., “The file you are trying to open…is in a
different format…Do you want to open the file now?”)
6. Search for the taxon in the “Name” column. The “Description” column identifies a citation to a
webpage with more information about the taxon. The “ExternalID” column provides an
identifier commonly used by other references, and is left blank if none exists. Because the
“UniqueIdentifier” column has a value for every taxon listed, its identifier is the one that should
be used in recording the findings from this procedure.
4.4.2 Laboratory
The procedure may be used by any laboratory that has expertise in each of the following areas:
1. Analytical work: To demonstrate its expertise, the laboratory shall provide EPA with one or more
of the following:
a. Memorandum that identifies the relevant services that the laboratory provided for the
National Aquatic Resource Surveys in the past five years.
b. Dated copy of relevant Accreditation or Certification (NELAC, ISO, state, etc.) for the
laboratory and/or its experts who will perform and/or oversee the analyses. The
accreditation must be for the entirety of analysis that the laboratory will be performing.

2013‐2014 National Rivers & Streams Assessment Laboratory Operations Manual Version 1.3, May 2014 Page 33 of 224
33
BEN
THIC M
ACROINVER
TEBRATES
c. Memorandum that describes the laboratory’s participation in round robin studies and/or
performance studies.
d. Report of findings from an on‐site technical assessment or audit.
2. Quality procedures:
a. To demonstrate its expertise in quality assurance and quality control procedures, the
laboratory shall provide EPA with copies of the quality‐related documents relevant to the
procedure. Examples include Quality Management Plans (QMP), QAPPs, and applicable
Standard Operating Procedures (SOPs). b. To demonstrate its ongoing commitment, the person in charge of quality issues for the
laboratory shall sign the NRSA 13/14 QAPP Certification Page. 3. Reporting standardized data. To demonstrate its expertise, the laboratory shall provide EPA with
a memorandum that confirms that the laboratory has a computerized Laboratory Information
Management System (LIMS) that is routinely used to track samples and record laboratory
results. The memorandum also shall confirm that the laboratory will use LIMS to record and
report results from the procedure.
4.4.3 Personnel
The procedure may be used by any person who has received training in processing and identification of benthic macroinvertebrates; however, within a given laboratory, the work is generally parsed out to several personnel:
Quality Control (QC) Officers provide oversight of daily operations, sample processing, monitors QC activities to determine conformance, and conducts performance and systems audits of the procedures. Documentation for the QC Officer meeting these requirements must be kept at the lab, and made available to the EPA QC officer if requested. The following types of QC Officers are used by this procedure:
Sorting QC Officer is an experienced sorter who:
Demonstrated an initial sorting proficiency (measured by PSE) of ≥90% in 5 consecutive
samples evaluated by an experienced sorter; and
Maintains a sorting proficiency of ≥90% in periodic QC checks (i.e., 1 in 10 samples).
Verifies the completeness of every Preparation/Sorting Bench Sheet to ensure header
information is correctly entered.
Checks sorted grids of all inexperienced laboratory personnel (those who have not achieved
a ≥90% sorting efficiency) for missed organisms and records the number of missed
organisms in the appropriate field of the Bench Sheet.
Checks 1 in 10 of an experienced individual’s samples, with a minimum of 1 NRSA sample. If
the Sorting QC Officer performs the QC check more frequently, then the additional QC
results must be submitted with the data for the required QC checks.
Determines the sorting efficiency for each sample and sorter. The sorter’s sorting efficiency
is recorded on the Sorter Bench Sheet.
Internal Taxonomy QC Officer is an experienced taxonomist who:

2013‐2014 National Rivers & Streams Assessment Laboratory Operations Manual
Version 1.3, May 2014 Page 34 of 224
34
BEN
THIC M
ACROINVER
TEBRATES
Demonstrated an initial enumeration and identification proficiency (as measured by
PDE≤5% and PTD≤15%.
Maintains enumeration and identification proficiency in periodic QC checks (i.e., 1 in 10
samples with a minimum of one sample checked).
External QC Coordinator is an EPA staff person. Alternatively, the External QC Coordinator may be a contractor that has not previously been involved with field sampling and/or benthic macroinvertebrate analyses. Because the assigned duties are primarily logistical in nature, the QC Coordinator is not required to have laboratory experience, although such experience would be preferable.
External QC Taxonomists, are selected by the External QC Coordinator, and have demonstrated expertise and experience to be used as a quasi “gold standard” for taxonomic evaluations.
Taxonomists are trained, and have considerable experience, in identifying benthic macroinvertebrates, i.e., taxonomy. It is also important that the taxonomist maintains contact with other taxonomists through professional societies and other interactions, and keeps up with the pertinent literature, since systematics and species identifications change over time. EPA prefers, but does not require, that the taxonomists are certified by the Society of Freshwater Science (SFS). Each laboratory must submit the resume or curriculum vitae for the taxonomists who identify benthic macroinvertebrates for the NRSA samples to the EPA Project QC Officer.
Sorters are laboratory technicians who have basic training in laboratory procedures; and training in the use of the Caton‐style tray. An “experienced” sorter is one that has achieved ≥90% sorting efficiency in 5 consecutive samples. An experienced sorter can serve as the Sorting QC Officer.
4.4.4 Equipment/Materials
The procedure requires the following equipment and materials for sample preparation (subsampling), sorting, and taxonomic identifications.
4.4.4.1 SamplePreparation(Subsampling)andSortingEquipment/Materials
U.S. 35 sieve (500 μm)
Round buckets
Standardized gridded screen (40 Mesh (380‐μm openings, T304 stainless steel wire, 34GA
(0.010”))
Mesh screen, square grids (e.g., 30 squares of 6 cm2 each) with white plastic holding tray (e.g.,
Caton tray, 30cm x 36cm, 4cm deep)
6‐cm scoop
6‐cm2 metal dividing frame (“cookie cutter”)
White plastic or enamel pan (6" x 9") for sorting
Scissors
Teaspoon
Permanent ink pen (e.g Pigma Micron® pen)
Dropper
Fine‐tipped forceps (watchmaker type, straight and curved)
Vials with caps or stoppers

2013‐2014 National Rivers & Streams Assessment Laboratory Operations Manual Version 1.3, May 2014 Page 35 of 224
35
BEN
THIC M
ACROINVER
TEBRATES
Sample labels for vials
70‐80% ethanol ( denatured or non‐denatured)
Sorting Bench Sheet or other Sheet or database approved by EPA’s External QC Coordinator
Stereo zoom microscope (6‐10X magnification)
4.4.4.2 TaxonomyIdentificationEquipment/Materials
Stereo dissecting microscope with fiber optics light source (50‐60X magnification)
Compound microscope (10, 40, and 100X objectives, with phase‐contrast capability)
Digital camera with high resolution capability mounted on a microscope
Petri dishes
Microscope slides (1" x 3" flat, precleaned)
Cover slips (appropriately sized)
CMCP‐10 (or other appropriate mounting medium)
Permanent ink pen (e.g Pigma Micron® pen)
Dropper
Fine‐tipped forceps (watchmaker type, straight and curved)
Vials with caps or stoppers
Sample labels for vials
70 ‐ 80% non‐denatured ethanol in plastic wash bottle
Taxonomic Bench Sheet ( provided to each participating laboratory by EPA)
Hand tally counter
4.5 SampleReceipt
Under U.S. regulations, samples preserved in ethanol are classified as “Dangerous Goods” and must be shipped according to hazardous material shipping requirements and regulations. Laboratory personnel receiving the shipment must be certified to handle hazardous material. Because EPA initiates tracking procedures designed to recover any missing shipment, the laboratory personnel should start the following login steps within 24 clock hours of receiving a delivery.
1. Record receipt of samples in the NARS IM system (within 24 clock hours) and the laboratory’s
Information Management System (LIMS). Assign the appropriate chronological bench number to
each sample.
2. Inspect each jar THE SAME DAY THEY ARE RECEIVED:
a. Refill them with 70‐80% ethanol if necessary.
b. Verify that the site identification and sample number on the label also appear on the chain
of custody form in the shipment.
c. Notify the NARS IM team if any jars were broken and/or there are discrepancies between
the custody form and jars.
3. After refilling the sample containers, store them at room temperature until sorting begins.
4. Maintain the chain‐of‐custody form with the samples; it will be needed if the samples are
transported to any other location (e.g., for taxonomic identification, external QC evaluation).

2013‐2014 National Rivers & Streams Assessment Laboratory Operations Manual
Version 1.3, May 2014 Page 36 of 224
36
BEN
THIC M
ACROINVER
TEBRATES
5. Verify that the login information includes the required data elements in Table 4.1. After
completing all required elements, provide the information to the data entry personnel.
Table 4.1 Benthic macroinvertebrate: required data elements – login
FIELD FORMAT DESCRIPTION
LAB NAME text name of lab
LAB ID (optional) text lab sample id
DATE RECEIVED MMDDYY date sample was received by lab
SITE ID text NRSA site identification code as used on sample label
VISIT NUMBER numeric sequential visits to site (1 or 2, if specified on label)
SAMPLE ID numeric sample number as used on field sheet (on sample label)
DATE COLLECTED MMDDYY date sample was taken
QA FLAG (if appropriate)
text QA/QC flag (lab may use its own flags, if defined in QA_COMMENTS field or provided to NARS IM team)
Flag Definition
NP Not enough preservative used
S Sample shipping problem (explain in QA_COMMENTS field)
Q Other quality concerns, not identified above
QA_COMMENTS text explanation for QA FLAG (if needed)
LAB COMMENTS text general laboratory analysis comments
4.6 SamplePreparation(Subsampling)
In preparation for sorting and picking organisms from the samples as described in Section 4.5, the sorters first prepare the sample as described in the following steps.

2013‐2014 National Rivers & Streams Assessment Laboratory Operations Manual Version 1.3, May 2014 Page 37 of 224
37
BEN
THIC M
ACROINVER
TEBRATES
Figure 4.1 Benthic macroinvertebrate: summary of sorting
Figure 4.1 provides a simplified version that may be useful as a quick reference guide to the steps in Sections 4.6 and 4.7. APPENDIX C: SAMPLE LABORATORY FORMS provides an example of the Benthic Macroinvertebrate: Sorting Bench Sheet. If EPA’s External QC Coordinator agrees, the laboratory may substitute its own Sorting Bench Sheet or computer format instead of using the example. The alternative must include the QC elements used for the evaluations described in Table 4.6.
1. Remove the lid from the sample container and remove the internal sample label (save the
label—it will need to be returned to the sample container with the archived portion of the
sample that does not get processed). Record the sample collection information on a Sorting
Bench Sheet. Header information required includes station name, station location, station
number, project name, bench number, sample type, date the sample was collected, and the
Ensure all sorted organisms are place in a single vial; bottle unsorted material and pickate; label all vials and bottles
with proper labels
Sorting should result in at least: 1 jar of organisms 1 jar of pickate/unsorted sample
Sample received
Sample logged
Removal of all inorganic and large organic material and spread in a Caton‐style tray
Randomly select three sample grids (may need more if target of 500 organisms is not reached in first three)
The sorter should subdivided a sample grid into fourths if it appears that sorting the entire subsample grid will exceed 600 organisms; as with the larger subsample grids, once sorting beings in a quarter grid, it must be completed, even if 500 organisms are counted part way
through the quarter grid
Once a sorter begins a sample grid, that sample grid most be completedly sorted even if 500 organisms are counted
before the sample grid is complete

2013‐2014 National Rivers & Streams Assessment Laboratory Operations Manual
Version 1.3, May 2014 Page 38 of 224
38
BEN
THIC M
ACROINVER
TEBRATES
field team who collected the sample (e.g., Team 1). After the Sorting QC Officer verifies the
information, set the bench sheet aside.
2. Consider the contents of the sample:
3. If the sample has heavy amounts of inorganic substrate (e.g., sample that has 4 or 5 jars total
and 2 or 3 with gravel or sand), it is acceptable for the sorter to elutriate the sample, before
subsampling. An example of an acceptable elutriation method is as follows:
4. Pour ethanol off of sample containers through sieve (500 μm or smaller). Also deposit leaf litter
and any other organic material (leaves, sticks, algae) onto sieve.
5. Depending on amount of inorganic material (gravel, sand, silt), pour all or a portion of this
material into a rectangular Tupperware®/Rubbermaid® container and cover with water.
6. Circulate (elutriate) sample with water and allow any organisms that might be in the gravel/sand
to float to the top of the water and pour the water through a sieve (U.S. 35).
7. Repeat this until the water runs clear.
8. Fill the plastic container (that still has the inorganic material in it) with water one more time and
take it to a well lit, flat surface. Inspect it here under a ring light with 3x magnification for any
remaining organisms. Have another sorter double check for organisms.
9. Once no organisms remain in the plastic container, wash the water through the sieve and dump
the inorganic material into a waste bucket.
10. Repeat this process until all of the inorganic material has been elutriated and checked for
heavier organisms, such as clams, mussels, or worms.
a. For all other samples:
i. Carefully decant the ethanol from the sample container by pouring the fluid through
a sieve (U.S. 35) into a separate container.
ii. Inspect the mesh of the sieve for any organisms and return any organisms found to
the sample container so they can be included in the sample sort process.
11. Spread the sample now in the circular sieve over the Caton‐style tray. Use multiple trays if
necessary. If there is more than one jar for any particular sample, empty and wash each jar onto
the tray one at a time, making sure to spread each jar’s contents evenly across the gridded
screen. If the amount of leaf litter or other detrital material fills the tray to the top of the wall
panels, divide it among two or more trays.
12. Mix the sample around in the tray(s) so that large and small particles are evenly distributed
throughout.
13. Add enough water to spread the sample evenly throughout the grid (the water level should be
relatively close to the top of the white tray). Spread the sample material over the bottom of the
pan as evenly as possible. Move the sample into the corners of the pan using forceps, spoon, or
by hand. Vibrate or shake the pan gently to help spread the sample.
14. Lift the screen out of the white tray to drain. Pour off or siphon excess water from the white tray
and set the screen back into the tray. Leave just enough water in the bottom of the tray so that
it barely covers the screen once it is returned to the tray to allow the sample to remain moist.
15. Label the grids by marking the side of the gridded tray with letters on one side and numbers on
the connecting side. For example, each grid could be labeled with one letter and one number,
e.g., A‐5, E‐1, to represent its position in the tray as shown in the example of the sorting method

2013‐2014 National Rivers & Streams Assessment Laboratory Operations Manual Version 1.3, May 2014 Page 39 of 224
39
BEN
THIC M
ACROINVER
TEBRATES
(Figure 4.2). If the sample is spread over more than one tray, label the grids identically in each
tray. See Example.
16. Use a random number generator to select at least 10% of the grids to ensure that the subsample
material is representative of the overall sample. For example, if the tray is subdivided into 30
squares (<6 cm2 each), then 3 squares (“grids”) would be selected for sorting.
17. Make an initial assessment of the sample. If the number of organisms appears to exceed the
target number (500 organisms) in the collective three grids (or however many grids were
selected), quarter each grid, label the quarters (see example below) and randomly select a
quarter for initial sorting.
18. Assign unique identifiers on the Benthic Macroinvertebrate: Sorting Bench Sheet for each grid
and quarter processed. Provide a copy of the Sorting Bench Sheet, or its approved alternative, to
EPA’s External QC Coordinator.
19. Remove all the material from the selected grid/quarter as follows:
20. Place the metal dividing frame or “cookie cutter” over the sample at the approximate location of
the grid selected for processing (based on the letters and numbers marked on the sides of the
gridded tray). Use a pair of rulers or other straight edges to facilitate lining up the cookie cutter
at the intersection if necessary.
21. Remove the material within the “cookie cutter” using the 6‐cm scoop, a teaspoon, forceps, or
dropper. Depending on the consistency of what is in the sample, it might be necessary to cut the
material along the outside of the “cookie cutter” with scissors or separate it with forceps so that
only one grid’s (or quarter’s) worth of sample material is used. Inspect the screen for any
remaining organisms. Use the following rules when dealing with organisms that lie on the line
between two grids:
22. An organism belongs to the grid containing its head.
23. If it is not possible to determine the location of the head (i.e., for worms), the organism is
considered to be in the grid containing most of its body.
24. If the head of an organism lies on the line between two grids, all organisms on the top of a grid
and those on the right side of a grid belong in that grid, and are picked with that grid.
25. Place the material from each selected grid(s) into a separate white plastic or enamel pan. Add
the necessary amount of water to the pan to facilitate sorting.

2013‐2014 National Rivers & Streams Assessment Laboratory Operations Manual
Version 1.3, May 2014 Page 40 of 224
40
BEN
THIC M
ACROINVER
TEBRATES
Figure 4.2 Benthic Macroinvertebrate: sorting method example
26. Set the subsampling device aside in case more grids need to be retrieved during the sorting
process. Cover the sample with aluminum foil to prevent desiccation of the sample and damage
to organisms (periodically moisten the sample with water from a spray bottle if the top layer
begins to dry). Between each subsampling operation, be careful not to disturb the subsampling
device to prevent redistribution of organisms, which could possibly change the probability of
selection.
4.7 Sorting
After dividing the sample into grids as described in Section 4.6, the sorter follows the following steps to pick the organisms from the sample:
1. Remove the macroinvertebrates from the detritus with forceps.
a. In general, do not remove or count:
i. Empty snail or bivalve shells
ii. Organisms of surface‐dwelling or strict water column2 arthropod taxa (e.g., Collembola,
Veliidae, Gerridae, Notonectidae, Corixidae, Culicidae, Cladocera, or Copepoda, see
Table 4.2)
iii. Incidentally‐collected terrestrial taxa.
2Strict water column taxa are those that do not have at least one life stage that is benthic (i.e., bottom‐dwelling).
EXAMPLE: The sorter spreads the sample into a single Caton tray and labels the sides with letters and numbers as shown below. The sorter randomly selects grids E‐1, A‐5, and B‐4, in that order. The sorter processes grid E‐1 and finds 50 organisms, and then continues to grid A‐5 and finds 40 organisms. The sorter then assesses grid B‐4 and decides that it will produce more than 410 organisms needed to reach the sample target of 500 organisms. The sorter then quarters grid B‐4 and randomly selects the quarter labeled α‐1. The quarter has 350 organisms. The sorter then randomly selects a second quarter β‐2. The sorter processes the quarter and counts 75 organisms. The sorter now has picked a total of 515 organisms in the sample.
Place an X to indicate each grid sorted:If more than one tray needed for the sample, Tray #:___1 of 1___
1 2 3 4 5 6
A X
B X
C
D
E X
If a grid has been quartered, complete the following (see example in Step 10):
Grid #:__B‐4___
Place an X to indicate each quarter sorted:
1 2
α X
β X

2013‐2014 National Rivers & Streams Assessment Laboratory Operations Manual Version 1.3, May 2014 Page 41 of 224
41
BEN
THIC M
ACROINVER
TEBRATES
iv. Fragments such as legs, antennae, gills, or wings.
Table 4.2 Benthic macroinvertebrate: list of taxa that are not to be sorted/counted
All terrestrial life history stages are to be excluded from the counts.
TAXON
Phylum Class (or Subclass) Order Family
ANNELIDA Clitellata Branchiobdellida
ARTHROPODA Cladocera and other Branchiopoda
Collembola
Insecta Ephemeroptera (adults only)
Diptera (larvae of listed families, plus all adults)
Chaoboridae
Culicidae
Coleoptera Dytiscidae (adult)
Gyrinidae (adult)
Heteroptera Corixidae
Gerridae
Mesoveliidae
Notonectidae
Pleidae
Neuroptera (adults)
Odonata (adults)
Plecoptera (adults)
Trichoptera (adults)
Ostracoda
BRYOZOA
NEMATODA
b. For Oligochaeta, attempt to remove and count only whole organisms and fragments that
include the head; also, do not count fragments that do not include the head.
c. In case of uncertainties, place the organism in the sort vial without counting it (the final
count is made by the taxonomist).
2. Place picked organisms for the selected grids and quarters into a single set of jars and vials for
the sample.
3. Sort all samples under a minimum of 6x (maximum of 10x) dissecting microscope. Once a grid,
or quarter, enters the sorting process, all organisms must be sorted to minimize bias. For the
survey, the target number of organisms is 500 per sample. If the 500th organism is counted in a
grid (or quarter), then the macroinvertebrates in the rest of the grid (quarter) are picked until
that grid (or quarter) is completed.
a. If the sample covers more than one tray, then sort the first selected grid in each tray, before
moving to the second grid, etc. For example, assume that a sample covers 3 trays T1, T2,
and T3. Further assume that grids E1, A3, and B5 were randomly selected in that order.
Then, in this example, the sorting order would be: T1E1, T2E1, T3E1, T1A3, T2A3, T3A3, and
T1B5, T2B5, and T3B5.

2013‐2014 National Rivers & Streams Assessment Laboratory Operations Manual
Version 1.3, May 2014 Page 42 of 224
42
BEN
THIC M
ACROINVER
TEBRATES
b. If the grids have been quartered, then sort the first selected quarter in each grid. If the
target count has not been reached after sorting the selected quarter in the selected grids,
then randomly select another quarter for sorting. For example, if a sample covers a single
tray; grids E1, A3, and B5 were randomly selected in that order; and quarter Q3 was
randomly selected; then the sorting order would be: E1Q3, A3Q3, B5Q3 before randomly
selecting another quarter.
4. Keep a rough count of the number of organisms removed and enter the number of organisms
found in each grid under that column on the Sorting Bench Sheet.
5. When all randomly selected grids have been sorted, verify that the cumulative count is greater
than 500 organisms.
6. This step is performed if: 1) the sorter has not reached 90% proficiency in 5 consecutive samples
(“proficiency QC check”, see Section 4.4.1 for definition and explanation); or 2) the Sorting QC
Officer has selected this sample to use as the 1 in 10 sample QC check for experienced sorters
(“periodic QC check”). (The Sorting QC Officer must check a minimum of one NRSA sample if an
experienced sorter processes less than ten NRSA samples. If the laboratory performs QC checks
more frequently, then the all of the QC data must be submitted to EPA.) The Sorting QC Officer:
a. Performs QC checks using the same power microscope as the sorter;
b. Counts any missed organisms found and places them into the sample vial, or other suitable
sample vial;
c. Notes the number of organisms missed on the Sorting Bench Sheet; and
d. Adds that number to the final count of the sample.
e. Calculates the PSE for the sample (see Section 4.4.1 for definition; equation 1). If the PSE is:
i. <90% and the sample is the:
1) Proficiency QC check, the Sorting QC Officer must check the next 5 samples until the
sorter has PSE≥90% for 5 consecutive samples.
2) Periodic QC check, then the sorter’s samples since the last QC check are examined
for organisms missed in sorted grids and quarters. The sorter must again
demonstrate proficiency by achieving a PSE≥90% in 5 consecutive samples, unless
he or she shows marked improvement in their sorting efficiency prior to completion
of the next five samples, the Sorting QC Officer may, at his/her discretion, consider
this individual to be “experienced” and check only 1 in the next 10 samples.
ii. ≥90% and the sample is the:
1) Proficiency QC check, the sample counts towards the 1 in 5 consecutive samples
used to establish proficiency.
2) Periodic QC check, no corrective action is required.
7. Place organisms removed from grid to an internally‐labeled vial (or larger container, if
necessary) containing 70‐80% ethanol. Record the following information on internal sample
labels used for vials of sorted material with Pigma Micron® pen on cotton rag paper or an
acceptable substitute.
8. Remove the remaining material from that particular grid that was just sorted left on the sorting
pan ( i.e. material such as sticks, organic debris)and place it in a separate container with
preservative (70‐80% ethanol). Label the container “Pickate,” on both internal and external

2013‐2014 National Rivers & Streams Assessment Laboratory Operations Manual Version 1.3, May 2014 Page 43 of 224
43
BEN
THIC M
ACROINVER
TEBRATES
labels. This material is kept by the lab until notified by TOPO. Internal sample labels should be
made of cotton rag paper or an acceptable substitute. Include the following information on the
label:
a. Station Name
b. Station Location
c. Station Number
d. Date Sorted
e. Sorter’s Initials
f. “1 of x” or “2 of x”, etc. if the sample is sorted into more than one vial (where x is the total
number of vials for the sorted sample)
9. Search the entire caton tray for 5‐10 minutes, looking for large/rare organisms (Vinson and
Hawkins, 1996). Large/rare is defined as any organism larger than 0.5" long and found in less
than one eighth of the tray holding the entire sample. Place any organisms found into a vial
labeled “L/R” for “Large/Rare.”
10. Return all material not subsampled (remaining on the Caton tray) to the original container with
the preservative that was set aside. This container will include the original sample labels.
Prepare two additional labels “Unsorted Sample Remains” and place one inside the container
and attach the other to the outside of the container. Replace the lid and tighten securely.
Archive the container until all appropriate QC checks are completed (subsampling and
taxonomy), and in accordance with survey and laboratory requirements.
11. Verify that the bench sheet includes the required data elements in Table 4.3. After completing
all required elements, provide the sorting bench sheets to the data entry personnel.
12. Thoroughly clean all sample preparation and sorting equipment and make sure all equipment is
free of organisms prior to sorting the next sample.
Table 4.3 Benthic macroinvertebrate: required data elements – sorting
FIELD FORMAT DESCRIPTION
LAB NAME Text name of lab
LAB ID (optional) Text lab sample id
DATE RECEIVED MMDDYY date sample was received by lab
SITE ID Text NRSA site identification code as used on sample label
VISIT NUMBER numeric sequential visits to site (1 or 2, if specified on label)
SAMPLE ID numeric sample number as used on field sheet (on sample label)
DATE COLLECTED MMDDYY date sample was taken
DATE SORTED MMDDYY date that the sorter started working on the sample
PROPORTION SORTED
numeric proportion of sample sorted based upon number of grids and quarters selected and available
CORRECTION FACTOR
numeric subsampling correction factor
QA FLAG (if appropriate)
text QA/QC flag (lab may use its own flags, if defined in QA_COMMENTS field or provided to NARS IM team)
Flag Definition
C Organism in poor condition or fragments
DD Damaged Organism
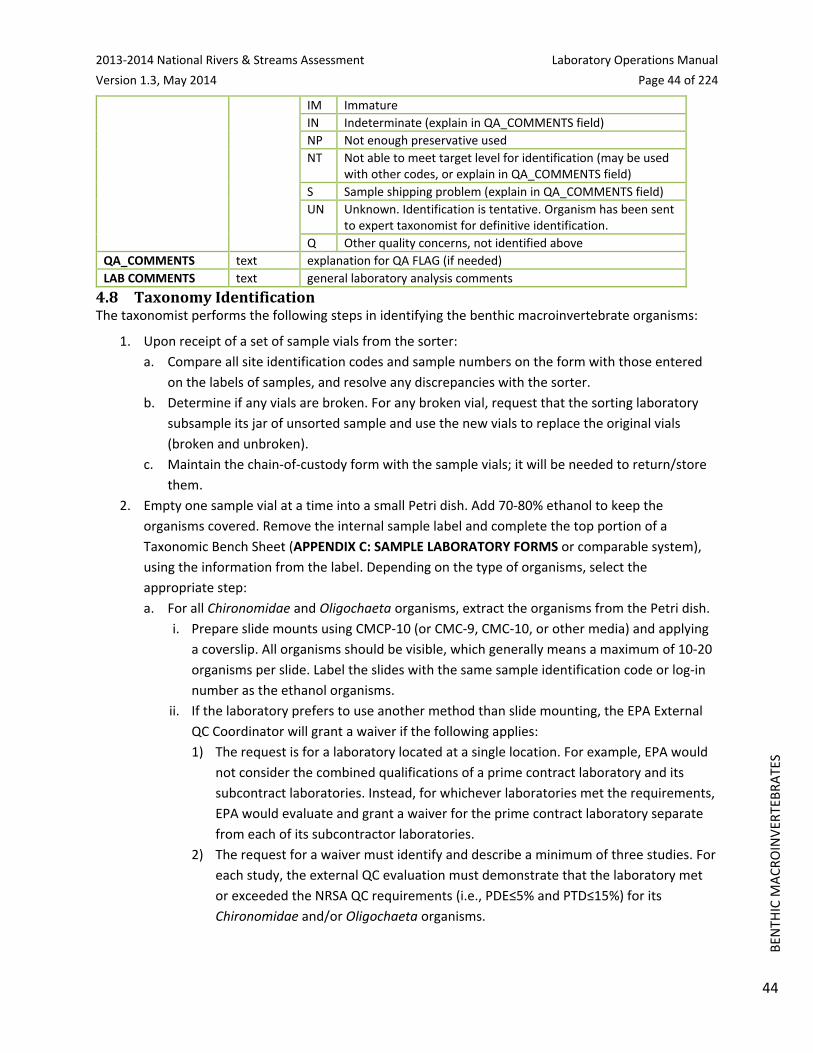
2013‐2014 National Rivers & Streams Assessment Laboratory Operations Manual
Version 1.3, May 2014 Page 44 of 224
44
BEN
THIC M
ACROINVER
TEBRATES
IM Immature
IN Indeterminate (explain in QA_COMMENTS field)
NP Not enough preservative used
NT Not able to meet target level for identification (may be used with other codes, or explain in QA_COMMENTS field)
S Sample shipping problem (explain in QA_COMMENTS field)
UN Unknown. Identification is tentative. Organism has been sent to expert taxonomist for definitive identification.
Q Other quality concerns, not identified above
QA_COMMENTS text explanation for QA FLAG (if needed)
LAB COMMENTS text general laboratory analysis comments
4.8 TaxonomyIdentificationThe taxonomist performs the following steps in identifying the benthic macroinvertebrate organisms:
1. Upon receipt of a set of sample vials from the sorter:
a. Compare all site identification codes and sample numbers on the form with those entered
on the labels of samples, and resolve any discrepancies with the sorter.
b. Determine if any vials are broken. For any broken vial, request that the sorting laboratory
subsample its jar of unsorted sample and use the new vials to replace the original vials
(broken and unbroken).
c. Maintain the chain‐of‐custody form with the sample vials; it will be needed to return/store
them.
2. Empty one sample vial at a time into a small Petri dish. Add 70‐80% ethanol to keep the
organisms covered. Remove the internal sample label and complete the top portion of a
Taxonomic Bench Sheet (APPENDIX C: SAMPLE LABORATORY FORMS or comparable system),
using the information from the label. Depending on the type of organisms, select the
appropriate step:
a. For all Chironomidae and Oligochaeta organisms, extract the organisms from the Petri dish.
i. Prepare slide mounts using CMCP‐10 (or CMC‐9, CMC‐10, or other media) and applying
a coverslip. All organisms should be visible, which generally means a maximum of 10‐20
organisms per slide. Label the slides with the same sample identification code or log‐in
number as the ethanol organisms.
ii. If the laboratory prefers to use another method than slide mounting, the EPA External
QC Coordinator will grant a waiver if the following applies:
1) The request is for a laboratory located at a single location. For example, EPA would
not consider the combined qualifications of a prime contract laboratory and its
subcontract laboratories. Instead, for whichever laboratories met the requirements,
EPA would evaluate and grant a waiver for the prime contract laboratory separate
from each of its subcontractor laboratories.
2) The request for a waiver must identify and describe a minimum of three studies. For
each study, the external QC evaluation must demonstrate that the laboratory met
or exceeded the NRSA QC requirements (i.e., PDE≤5% and PTD≤15%) for its
Chironomidae and/or Oligochaeta organisms.
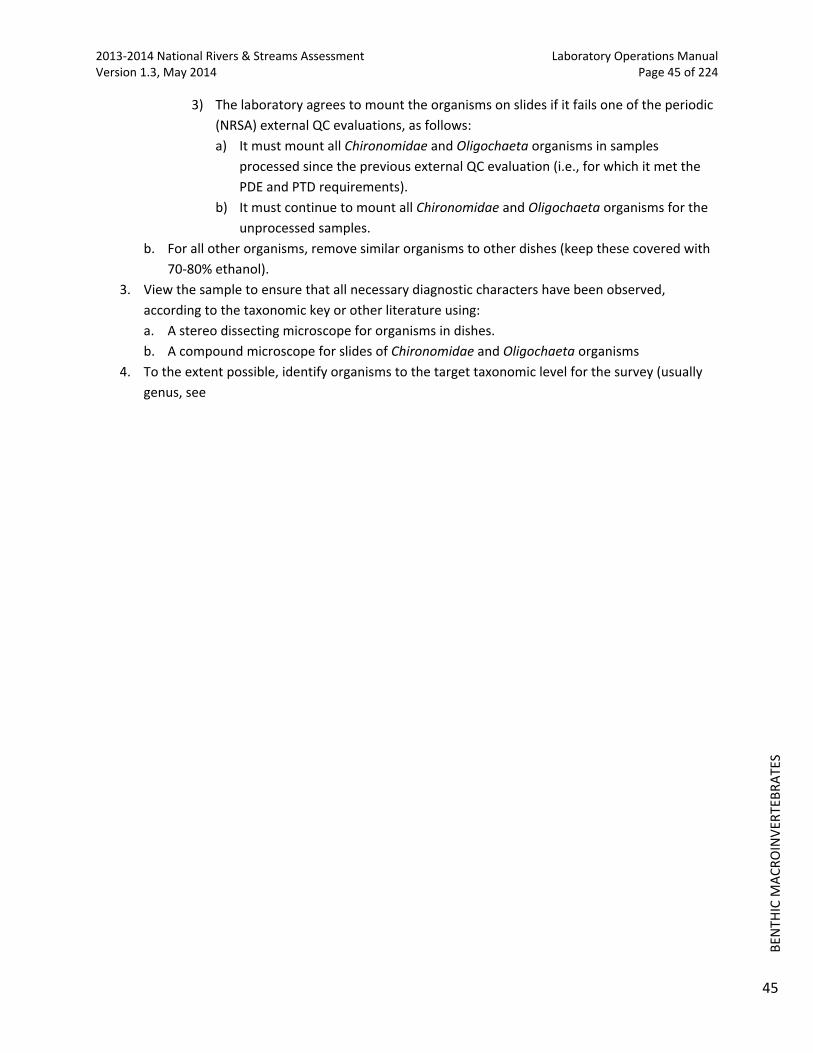
2013‐2014 National Rivers & Streams Assessment Laboratory Operations Manual Version 1.3, May 2014 Page 45 of 224
45
BEN
THIC M
ACROINVER
TEBRATES
3) The laboratory agrees to mount the organisms on slides if it fails one of the periodic
(NRSA) external QC evaluations, as follows:
a) It must mount all Chironomidae and Oligochaeta organisms in samples
processed since the previous external QC evaluation (i.e., for which it met the
PDE and PTD requirements).
b) It must continue to mount all Chironomidae and Oligochaeta organisms for the
unprocessed samples.
b. For all other organisms, remove similar organisms to other dishes (keep these covered with
70‐80% ethanol).
3. View the sample to ensure that all necessary diagnostic characters have been observed,
according to the taxonomic key or other literature using:
a. A stereo dissecting microscope for organisms in dishes.
b. A compound microscope for slides of Chironomidae and Oligochaeta organisms
4. To the extent possible, identify organisms to the target taxonomic level for the survey (usually
genus, see

2013‐2014 National Rivers & Streams Assessment Laboratory Operations Manual
Version 1.3, May 2014 Page 46 of 224
46
BEN
THIC M
ACROINVER
TEBRATES
5. Table 4.4 for the typical benthic macroinvertebrates found in freshwater and their target
taxonomic levels). Add any necessary data qualifiers (see list provided with Required Data
Elements in Table 4.6).
a. Enter the Taxonomic Serial Number (TSN) as it appears in the column “Unique Identifier” of
EPA’s WQX taxon database. Section 4.4.1 provides instructions in extracting the TSN values
from WQX.
b. Note whether the identification of a group of organisms is distinct (Distinct=Y/N) from other
organisms in the same sample as follows:
i. If the organisms can be identified to the target level, then Distinct=”Y.”
ii. If an organism cannot be identified to the target level then assign values as follows:
1) If at least some of the organisms in the sample can be identified to the target level,
then:
a) Distinct=”Y” for organisms identified at the target level; and
b) Distinct=”N” for organisms that were identified at a higher taxonomic level (e.g.,
family) that may contain a target level taxa already identified in a given sample
(e.g., genus).
c) An example would be, if some organisms from a sample are identified to Baetis,
but other organisms in the sample could only be identified to Baetidae and/or
Ephemeroptera, then Baetis would be distinct, but Baetidae and/or
Ephemeroptera would not be Distinct.
2) If none of the organisms in the sample could be identified at the target level, then:
a) Distinct=”Y” for organisms identified at the lowest taxonomic level (e.g., family);
and
b) Distinct=”N” for organisms identified at a higher level (e.g., order).
c) For example, if a taxonomist can identify a number of Ephemeroptera (Order)
families, but a number of the organisms could not be taken past
Ephemeroptera, then the individual families would be distinct, but the order
would not be distinct.

2013‐2014 National Rivers & Streams Assessment Laboratory Operations Manual Version 1.3, May 2014 Page 47 of 224
47
BEN
THIC M
ACROINVER
TEBRATES
Table 4.4 Benthic macroinvertebrate: target level of taxonomic identification – benthics commonly found in freshwater
TAXON Target Level of Identification
Phylum Class (or Subclass)
Order Family Family Genus
ANNELIDA (any, except Hirudinea, Polychaeta)
X
Hirudinea X
Oligochaeta (any, including Tubificinae, except as noted below)
X
Enchytraeidae X
Lumbriculidae X
Polychaeta X
ARTHROPODA Arachnoidea (any) X
Acari X
Insecta (any, except as noted) X
Coleoptera X
Diptera (any, except as noted)
X
Ceratogopogoninae subfamily
Chironomidae see Table 4
Dolichopodidae X
Empididae X
Ephydiridae X
Muscidae X
Phoridae X
Scathophagidae X
Sciomyzidae X
Stratiomyidae X
Syrphidae X
Tabanidae X
Ephemeroptera X
Hemiptera (Heteroptera) X
Lepidoptera X
Megaloptera X
Odonata X
Plecoptera X
Trichoptera X
Malacostraca (any) X
Amphipoda X
Decapoda X
Isopoda X
Mysidacea X
COELENTERATA†

2013‐2014 National Rivers & Streams Assessment Laboratory Operations Manual
Version 1.3, May 2014 Page 48 of 224
48
BEN
THIC M
ACROINVER
TEBRATES
MOLLUSCA (any, except Hydrobiidae)
X
Bivalvia X
Gastropoda (any, except Hydrobiidae) X
Hydrobiidae X
NEMERTEA X
†Colelenterata need only be identified to the phylum level.
Table 4.5 Benthic macroinvertebrate: target Level of taxonomic identification – chironomidae
FAMILY GENUS REQUIRED LEVEL OF IDENTIFICATION
Chironomidae (except as noted) Genus
Cricotopus Cricotopus/Orthocladius if a clear distinction can not be made
Orthocladius Cricotopus/Orthocladius if a clear distinction can not be made
Conchapelopia Thienemannimyia genus group
Hayesomyia
Helopelopia
Meropelopia
Rheopelopia
Telopelopia
Thienemannimyia
6. Record the identifications. For example, using the taxonomic bench sheet in Appendix C, the
identification would be recorded in the Column labeled “taxon.” Enter the number of larvae,
pupae, and adults, or total count (e.g. mollusks), if appropriate life history column does not
apply, of each taxon under the appropriate columns.
a. If the target taxonomic level cannot be achieved due to immature or damaged organisms
this should be noted in the data file in the QA_FLAG field (e.g., QA_FLAG=IM). Appendix 2
provides other codes for the QA_FLAG field.
b. If damaged organisms can be identified, they are counted ONLY if the:
i. Fragment includes the head, and, in the case of arthropods, the thorax;
ii. Oligochaetes have a sufficient number of segments in the head;
iii. Mollusk shell (bivalve or gastropod) is occupied by a organism;
iv. Organism is the sole representative of a taxon in the sample.
c. If a unique taxon is determined for which the appropriate taxonomic level is not available in
the literature and there are other taxa in that taxonomic level:
i. Provide good quality digital photographs of the organism to outside experts for
identification; and
ii. Include the tentative identification in the database with a data qualifier code of
QA_FLAG=’UN’ so that these organisms can be distinguished from other organisms in
the data analysis.
iii. When the outside expert identifies the organism, update the database with the correct
identification.
7. Compare taxa names from WQX (see Section 4.4.1) to the names used for the identifications.
Check the non‐matches for the following common problems and correct them.

2013‐2014 National Rivers & Streams Assessment Laboratory Operations Manual Version 1.3, May 2014 Page 49 of 224
49
BEN
THIC M
ACROINVER
TEBRATES
a. Abbreviations
b. Extra information identifiers (e.g., sp., spp., , nr., cf., genus 1, w/ hair chaetae)
c. Extra character (e.g., “?”, “Acentrella ?turbida”, blank space)
d. The word “probably” or “prob” (e.g., “Microcylloepus prob. similis”)
e. Identifying to a lower level than in WQX (e.g, to species rather than genus)
f. Double names (e.g., Callibaetis callibaetis)
g. Common misspellings
h. Tribes/subfamilies/subgenus sometimes do not appear in WQX
i. Species with incorrect genus (Hydatopsyche betteni)
j. Split level taxonomy (e.g., Cricotopus/Orthocladius)
k. Invalid name (e.g., taxonomic change, synonym; Sphaeriidae vs. Pisiidae)
8. Complete the identification by entering the totals for each developmental stage and the total
number of each taxon in the cells at the bottom of the sheet. Cross‐check to be sure the totals
were summed correctly.
9. If the number of counted organisms is <500 and part of the sample is still unprocessed, return to
the sorting steps to obtain more organisms for identifying and counting.
10. Provide the data to the Internal Taxonomic Officer for another review to confirm that the
identifications use the same nomenclature as the WQX database and the laboratory’s reference
collection.
11. Make two copies of the bench sheet or computer file used to record the identifications. They
are distributed as follows: 1) the project file; and 2) EPA’s External QC Coordinator.
12. Prepare a list of primary and secondary technical literature used in completing the
identifications. Provide complete citations in bibliographic format, including authors’ names,
date of publication, title of document, name of journal or publisher, volume and page numbers,
or ISBN number, as appropriate. These will be kept on file with the Internal Taxonomic QC
Officer, who will periodically review the reference collection to ensure that it is complete.
13. Verify that the reference collection contains at least one organism that represents each genus
(or lowest taxonomic level) identified from all sample. For any missing references, choose an
appropriate organism(s) from the sample to represent a taxon name in the master taxa list:
a. Place the physical specimen in the reference library.
b. Place two labels in the sample container to identify: organisms placed in the reference
collection, and those in the non‐reference organisms.
c. Obtain a good quality representative digital photographs of the specimen (see instructions
in Section 4.4.1).
14. If the Internal Taxonomy QC Officer selects the sample for a QC check, the Internal Taxonomy
QC Officer re‐counts and re‐identifies the organisms in the sample following the same steps
above for the original taxonomist. One in 10 of the taxonomist’s samples must be checked. The
Internal Taxonomy QC Officer records the independent verifications on a bench sheet or
computer file. The Internal Taxonomy QC Officer will also supply a list of taxa that were found
to be problematic during their QC sorting check, which can be submitted in an Excel or Word
document format. (If the Internal Taxonomy QC Officer performs the QC check more frequently,
then all QC data must be submitted.)

2013‐2014 National Rivers & Streams Assessment Laboratory Operations Manual
Version 1.3, May 2014 Page 50 of 224
50
BEN
THIC M
ACROINVER
TEBRATES
15. Carefully return the rest of the organisms to the original sample vial, fill with 70‐80% ethanol,
and cap tightly.
16. Re‐package the samples and slide‐mounted organisms carefully, and sign and date the chain‐of‐
custody form. Return or store the samples according to laboratory protocols and any
contractual requirements.
17. Verify that all required data elements in Table 4.6 have been recorded by the taxonomist and
Internal Taxonomy QC Officer. If the results were recorded on paper, provide the Taxonomic
Bench Sheet to the data entry personnel.
Table 4.6 Benthic macroinvertebrate: required data elements – taxonomic identification
FIELD FORMAT DESCRIPTION
LAB NAME text name of lab
LAB ID (optional) text lab sample id
DATE RECEIVED MMDDYY date sample was received by lab
SITE ID text NRSA site identification code as used on sample label
VISIT NUMBER numeric sequential visits to site (1 or 2, if specified on label)
SAMPLE ID numeric sample number as used on field sheet (on sample label)
DATE COLLECTED MMDDYY date sample was taken
DATE TAXON MMDDYY date that the taxonomist started identifying organisms in the sample
ANALYST NAME text name of taxonomist or Internal Taxonomy QC Officer (if record provides results of QC check)
QC VERIFICATION text Y if the record provides the results from the QC check
FAMILY text taxonomic family
SUBFAMILY text taxonomic subfamily
TRIBE text taxonomic tribe
GENUS GROUP text taxonomic genus group (e.g., Thienemannimyia)
GENUS text taxonomic genus
SPECIES text taxonomic species
WQX_TSN numeric Taxonomic Serial Number as defined by “UniqueIdentifier” in WQX. If taxon is not in WQX, provide citation for reference used to identify organism in CITATION field
LAB TIN (OPTIONAL) text lab taxa ID number
TAXANAME text unique taxon name in WQX
ABUNDANCE LARVAE numeric number of individual larvae or immature bugs
ABUNDANCE PUPAE numeric number of individual pupae
ABUNDANCE ADULT numeric number of individual adults
ABUNDANCE TOTAL numeric total number of individuals
DISTINCT text distinct taxa in sample (y/n) (See description in Section 4.8)
CITATION text citation for reference used to identify organism, if taxon not present in WQX database
QA FLAG (if appropriate) text QA/QC flag (lab may use its own flags, if defined in QA_COMMENTS field or provided to NARS IM team)
Flag Definition
DD Damaged Organism, poor condition or fragments
IM Immature
IN Indeterminate (explain in QA_COMMENTS field)
NP Not enough preservative used
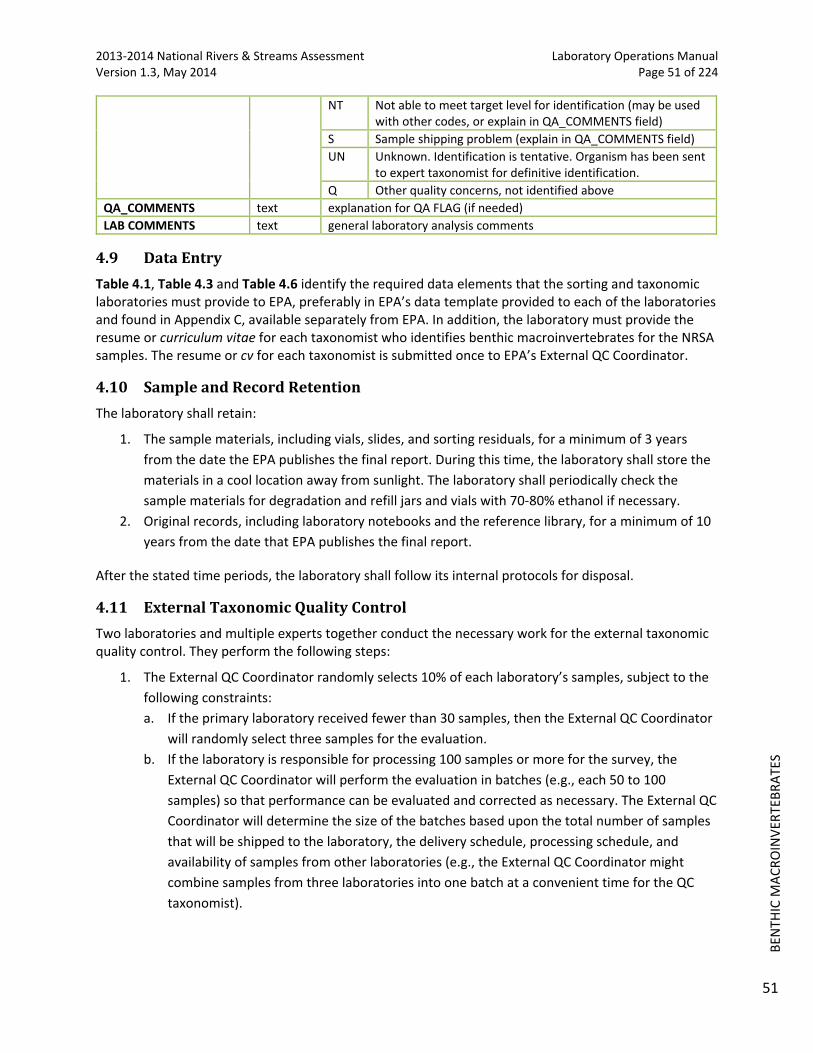
2013‐2014 National Rivers & Streams Assessment Laboratory Operations Manual Version 1.3, May 2014 Page 51 of 224
51
BEN
THIC M
ACROINVER
TEBRATES
NT Not able to meet target level for identification (may be used with other codes, or explain in QA_COMMENTS field)
S Sample shipping problem (explain in QA_COMMENTS field)
UN Unknown. Identification is tentative. Organism has been sent to expert taxonomist for definitive identification.
Q Other quality concerns, not identified above
QA_COMMENTS text explanation for QA FLAG (if needed)
LAB COMMENTS text general laboratory analysis comments
4.9 DataEntry
Table 4.1, Table 4.3 and Table 4.6 identify the required data elements that the sorting and taxonomic laboratories must provide to EPA, preferably in EPA’s data template provided to each of the laboratories and found in Appendix C, available separately from EPA. In addition, the laboratory must provide the resume or curriculum vitae for each taxonomist who identifies benthic macroinvertebrates for the NRSA samples. The resume or cv for each taxonomist is submitted once to EPA’s External QC Coordinator.
4.10 SampleandRecordRetention
The laboratory shall retain:
1. The sample materials, including vials, slides, and sorting residuals, for a minimum of 3 years
from the date the EPA publishes the final report. During this time, the laboratory shall store the
materials in a cool location away from sunlight. The laboratory shall periodically check the
sample materials for degradation and refill jars and vials with 70‐80% ethanol if necessary.
2. Original records, including laboratory notebooks and the reference library, for a minimum of 10
years from the date that EPA publishes the final report.
After the stated time periods, the laboratory shall follow its internal protocols for disposal.
4.11 ExternalTaxonomicQualityControl
Two laboratories and multiple experts together conduct the necessary work for the external taxonomic quality control. They perform the following steps:
1. The External QC Coordinator randomly selects 10% of each laboratory’s samples, subject to the
following constraints:
a. If the primary laboratory received fewer than 30 samples, then the External QC Coordinator
will randomly select three samples for the evaluation.
b. If the laboratory is responsible for processing 100 samples or more for the survey, the
External QC Coordinator will perform the evaluation in batches (e.g., each 50 to 100
samples) so that performance can be evaluated and corrected as necessary. The External QC
Coordinator will determine the size of the batches based upon the total number of samples
that will be shipped to the laboratory, the delivery schedule, processing schedule, and
availability of samples from other laboratories (e.g., the External QC Coordinator might
combine samples from three laboratories into one batch at a convenient time for the QC
taxonomist).

2013‐2014 National Rivers & Streams Assessment Laboratory Operations Manual
Version 1.3, May 2014 Page 52 of 224
52
BEN
THIC M
ACROINVER
TEBRATES
c. The External QC Coordinator will arrange for a minimum of 4 QC evaluations in each year
(2013, 2014). To the extent practicable, the QC Coordinator will schedule batch evaluations
evenly throughout the project period.
2. The External QC Coordinator coordinates and pays for delivery of the selected samples, bench
sheets, and chain‐of‐custody form.
3. The primary laboratory packs the selected samples for shipping. The QC taxonomist’s review will
be independent, and thus, will not have access to the original laboratory results. Although the
External QC Coordinator may tailor the directions for the independent taxonomist’s
preferences, the directions are likely to include instructions such as:
a. Containers (e.g., jars, slides, vials) must include the site identification code and sample
number.
b. Containers must not contain the complete identification of the organisms. If reference
specimens were kept from a sample that is being QC’d, then these taxa must be noted and
this information must be given to the External QC Coordinator. In the event that the
reference specimens are the only organisms representing a given taxa for a given sample,
then these specimens must be made available to the QC taxonomist, through the External
QC coordinator.
c. Shipment must contain chain‐of‐custody documentation.
4. Upon receipt, the secondary laboratory follows the tracking procedures in Section 4.5.
5. The QC taxonomist:
a. Performs whole‐sample re‐identifications following the procedures in Section 4.8, taking
care to ensure inclusion of all slide‐mounted organisms.
b. Completes a separate copy of the taxonomic bench sheet for each sample.
c. Enters the data using EPA’s template (Template found in APPENDIX C: SAMPLE
LABORATORY FORMS, see Section 4.9 for data entry instructions). The QC taxonomist shall
label the bench sheet and database entries with the term “QC Re‐ID.”
6. The External QC Coordinator will compare the taxonomic results (counts AND identifications)
generated by the primary and secondary laboratories. If either laboratory identified the
organisms to a lower level than required by

2013‐2014 National Rivers & Streams Assessment Laboratory Operations Manual Version 1.3, May 2014 Page 53 of 224
53
BEN
THIC M
ACROINVER
TEBRATES
7. Table 4.4 and Table 4.5 or by nomenclature different than used by WQX, the External QC
Coordinator will substitute the required level or name, respectively, in the comparisons. The
External QC Coordinator will calculate the percent difference in:
a. Enumeration as measured by PDE defined in Section 4.4.1; and
b. Taxonomy as measured by PTD defined in Section 4.4.1. Table 3 of Stribling (2003) provides
examples of what would be considered agreements.
8. If any sample has PDE>5% and/or PTD>15%, the External QC Coordinator will facilitate a
reconciliation call with EPA and the laboratories. The External QC Coordinator may decide that a
reconciliation call is unnecessary if there appears to be an obvious explanation for differences,
few samples are affected or other reasons.
9. After completing the reconciliation calls and/or documenting decisions to skip them, the
External QC Coordinator will provide EPA with a report or memorandum with recommendations
for resolving the differences. Significant differences may result in the re‐identification of
samples by the primary taxonomist and a second QC check by the secondary taxonomist.
10. As a final QC check on the data, the External QC Coordinator will arrange for an independent
data validation of the database. For each sample, the data analyst will evaluate whether the
reported taxa are known to occur in geographic area in which the sample site resides. For any
discrepancy, the External QC Coordinator will arrange for another taxonomist to evaluate the
specimen or its digital photograph.
11. As an additional verification on the generation of the data, EPA may conduct assistance visits at
the laboratories. If EPA decides to conduct an assistance visit, a qualified EPA scientist or
contractor will administer a checklist based upon the steps described in this LOM. The objective
of the visit would be to:
Confirm the sorting and identification steps are properly implemented.
Assist with questions from laboratory personnel.
Suggest corrections if any errors are made.
4.12 QualityAssurance/QualityControl(QA/QC)
Equation 4.1 Percent sorting efficiency (PSE).
Number of organisms recovered by the sorter compared to the combined (total) number of recoveries by the sorter (A) and QC Officer (B) for a sample. PSE should be >90%.
PSEA
A B
100
Equation 4.2 Percent disagreement in enumeration (PDE).
Measure of taxonomic precision comparing the number of organisms, n1, counted in a sample by the primary taxonomist with the number of organisms, n2, counted by the internal or external QC taxonomist. PDE should be <5%.
10021
21
nn
nnPDE
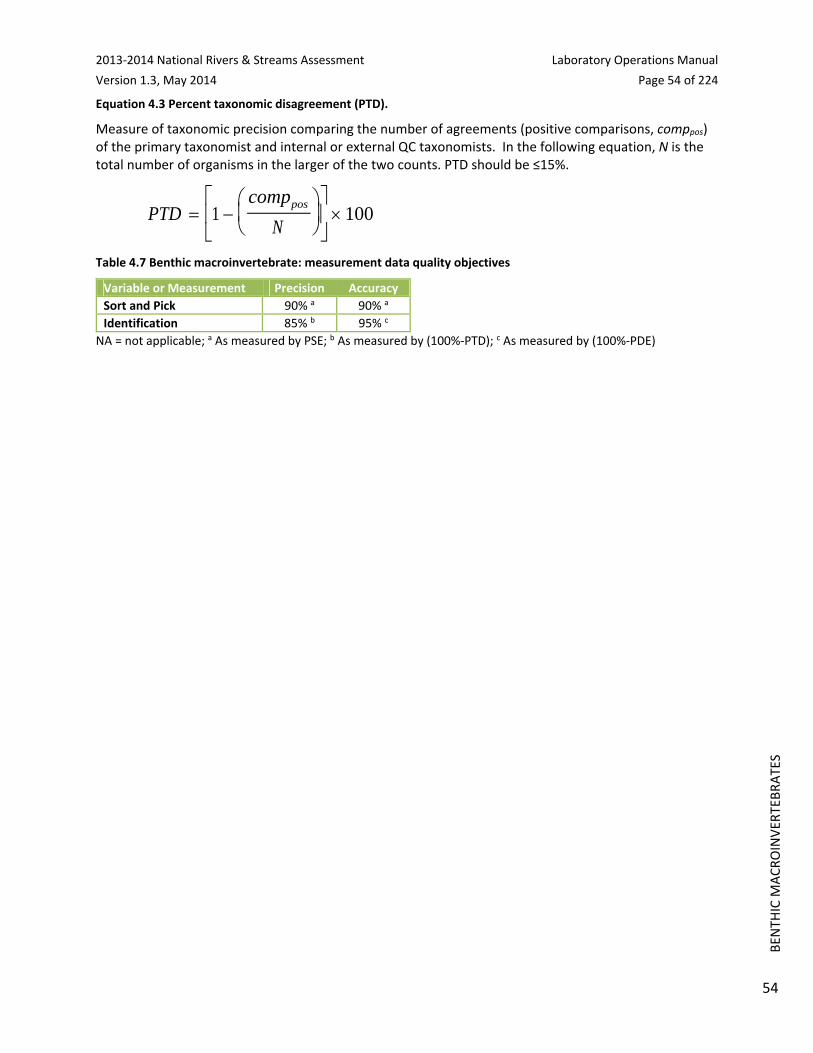
2013‐2014 National Rivers & Streams Assessment Laboratory Operations Manual
Version 1.3, May 2014 Page 54 of 224
54
BEN
THIC M
ACROINVER
TEBRATES
Equation 4.3 Percent taxonomic disagreement (PTD).
Measure of taxonomic precision comparing the number of agreements (positive comparisons, comppos) of the primary taxonomist and internal or external QC taxonomists. In the following equation, N is the total number of organisms in the larger of the two counts. PTD should be ≤15%.
PTDcomp
Npos
1 100
Table 4.7 Benthic macroinvertebrate: measurement data quality objectives
Variable or Measurement Precision Accuracy
Sort and Pick 90% a 90% a
Identification 85% b 95% c
NA = not applicable; a As measured by PSE; b As measured by (100%‐PTD); c As measured by (100%‐PDE)

2013‐2014 National Rivers & Streams Assessment Laboratory Operations Manual Version 1.3, May 2014 Page 55 of 224
55
BEN
THIC M
ACROINVER
TEBRATES
Table 4.8 Benthic macroinvertebrate: quality control – laboratory
Check or Sample Description
Frequency Acceptance Criteria Corrective Action
SAMPLE PROCESSING AND SORTING
Sample pickate examined by different analyst within lab
10% of all samples completed per analyst
PSE ≥ 90% If < 90%, examine all residuals of samples by that analyst and retrain analyst
Sorting QC Officer counts number of organisms not found in sorted grids
All samples Sorter achieves PSE ≥90% in 5 consecutive samples. Sorter is now considered “experienced”
Sorting QC Officer checks all samples until acceptance criteria met
Sorting QC Officer counts number of organisms not found in sorted grids for experienced sorters
1 in 10 samples completed per sorter
Sorter achieves PSE ≥90% If <90%, examine all sorted grids in samples assigned to sorter since last achieving proficiency (i.e., PSE≥90%). Sorter loses “experienced” status and must again show proficiency by achieving PSE ≥90% in 5 consecutive samples. If the sorter shows marked improvement in their sorting efficiency prior to completion of the next five samples, the Sorting QC Officer may, at his/her discretion, consider this individual to be “experienced” and check only 1 in the next 10 samples.
External QC Coordinator evaluates grid and quarter data to determine if the sample was well mixed as demonstrated by consistency in counts between grids (or quarters)
All grids and quarters within each sample
Sorter demonstrates relative consistency for 90% of assigned samples
If <90%, evaluate whether: 1) the sorter’s consistency is similar to other sorters; or 2) few samples were assigned the sorter. If neither explanation applies, EPA’s External QC Coordinator contacts the laboratory to discuss possible corrective action (e.g., resorting of sorter’s samples)
IDENTIFICATION
Duplicate identification by Internal Taxonomy QC Officer
1 in 10 samples per taxonomist,
PTD ≤15% If PTD >15%, reidentify all samples completed by that taxonomist since last meeting the acceptance criteria, focusing on taxa of concern
Independent identification by outside, expert, taxonomist
All uncertain taxa Uncertain identifications to be confirmed by expert in particular taxa
Record both tentative and independent IDs

2013‐2014 National Rivers & Streams Assessment Laboratory Operations Manual
Version 1.3, May 2014 Page 56 of 224
56
BEN
THIC M
ACROINVER
TEBRATES
External QC 10% of all samples completed per laboratory
PDE ≤ 5%PTD ≤ 15%
If PDE > 5%, implement recommended corrective actions. If PTD > 15%, implement recommended corrective actions.
Use of widely/commonly accepted taxonomic references by all NRSA labs
For all identifications
All keys and references used by each lab must be on bibliography prepared by one or more additional NRSA labs or in WQX (see Section 4.4.1 for retrieval instructions). This requirement demonstrates the general acceptance of the references by the scientific community.
If a lab proposes to use other references, the lab must obtain prior permission from Project QA Officer before submitting the data with the identifications based upon the references.
Prepare reference collection
Each new taxon per laboratory
Complete reference collection to be maintained by each individual laboratory
Internal Taxonomy QC Officer periodically reviews data and reference collection to ensure reference collection is complete and identifications are accurate
DATA VALIDATION
Taxonomic "reasonable‐ness" checks
All data sheets Taxa known to occur in given rivers or streams or geographic area
Second or third identification by expert in that taxon
4.13 References
Epler, J.H. 2001. Identification manual for the larval chironomidae (Diptera) of North and South Carolina. A guide to the taxonomy of the midges of the southeastern United States, including Florida. Special Publication SJ2001‐SP13. North Carolina Department of Environment and Natural Resources, Raleigh, NC, and St. Johns River Water Management District, Palatka, FL. 526 pp.
Merritt, R.W., K.W. Cummins, and M.B. Berg (editors). 2008. An introduction to the aquatic insects of North America, 4rd edition. Kendall/Hunt Publishing Company, Dubuque, Iowa.
Stribling, J.B., S.R. Moulton, and G.T. Lester. 2003. Determining the quality of taxonomic data. Journal of the North American Benthological Society 22(4):621‐631.
Vinson, M.R. and C.P. Hawkins. 1996. Effects of sampling area and subsampling procedure on comparisons of taxa richness among streams. Journal of the North American Benthological Society 15(3): 392‐3.
USEPA. 2004. Wadeable Stream Assessment: Benthic Laboratory Methods. EPA841‐B‐04‐007. U.S. Environmental Protection Agency, Office of Water and Office of Research and Development, Washington, DC.

2013‐2014 National Rivers & Streams Assessment Laboratory Operations Manual
Version 1.3, May 2014 Page 57 of 224
57
FECAL INDICATO
R: ENTEROCOCCI
5.0 FECALINDICATOR:ENTEROCOCCI
5.1 Scope&Application
This document describes the application of Draft EPA Method 1606 for the processing and qPCR analysis of water sample concentrates from rivers and streams for the purpose of determining water quality by Real‐Time Quantitative Polymerase Chain Reaction (qPCR) assays that determine the concentration of bacteria such as the fecal indicator, Enterococcus, by measuring the concentration of their DNA in the water sample.
This method facilitates the microbiological determination of water quality of water bodies at remote locations from which collected water samples cannot feasibly be analyzed for the enumeration of viable (culturable) indicator bacteria because they cannot be transported to an analytical laboratory within 6 hours of collection time for analysis by membrane filtration and / or selective media inoculation and incubation (e.g. MPN broth analysis) methods (EPA method 1600). Prior to qPCR analysis of the water samples, the bacterial cells present in a water sample will have been concentrated by “field” filtration within 6 hours after collection of the samples. The filter retentate preserved by freezing of the sample filters on dry ice and in < ‐20˚C freezers will be subjected to DNA extraction (e.g. bead‐beating) and purification processes leading up to qPCR analysis. This processing can be completed up to 1 year after cell concentration if the sample filter retentates are maintained frozen at ‐20 to ‐80˚C.
5.2 SummaryofMethod
Each sub‐sample has previously been filtered aseptically and folded inward in half three times to form an umbrella or in half and rolled up and then inserted into sterile sample extraction tubes containing sterile glass beads or Roche MagNA Lyser Green BeadsTM (actually siliconized white ceramic beads in a green capped tube). Extraction tubes containing filter concentrates (retentates) have been stored on dry ice until transport to the analytical laboratory by air courier. Filter concentrates will be shipped by air courier on dry ice from the field to the analytical team at EPA New England Regional Laboratory. Filter concentrates received by NERL staff will be subjected to DNA extraction procedures and subsequently analyzed by Draft EPA Method 1606 or 1607 for Total Enterococcus along with modifications to the QA/QC procedures described below. The laboratory methods are summarized in Table 5.4 of Section 5.18.
5.3 DefinitionsofMethod
Batch Size: The number of samples that will be processed by filter extraction with the same batch (volume) of SAE buffer and analyzed by the same qPCR assay(s) using the same batch of qPCR master mix. A batch is covered for quantitation purposes by the same “batch” calibrator samples, a minimum of three, analyzed during the same week.
Bottle Blank: Analyte‐free water is collected into a sample container, of the same lot number as the containers used for collection of the environmental samples. Analysis of this sample is performed to evaluate the level of contamination, if any, introduced into the environmental and control samples from the sample container(s) from a common vendor’s lot.
DNA: Deoxyribo‐Nucleic Acid, double‐stranded genetic molecules containing sequences of the four nucleotide bases, adenine, thymine, guanidine, and cytosine that encode rRNA, mRNA, and tRNA involved in protein synthesis.

2013‐2014 National Rivers & Streams Assessment Laboratory Operations Manual
Version 1.3, May 2014 Page 58 of 224
58
FECAL INDICATO
R: ENTEROCOCCI
Field Filter Blank: A volume of sterile PBS, free of target organisms (i.e. Enterococcus) filtered through a sterile filter and processed in parallel with all other samples to serve as a sentinel for detection of reagent contamination or contamination transferred between samples by processing and analysis.
Field Replicates: Samples collected from rivers and streams that are collected at the same sampling site one right after the other with only slight temporal variation. They are not “splits” of the same sample volume.
Filtrate: Sample liquid or buffer rinsate passing through the filter into the vacuum flask.
Laboratory Quality Samples: Mock samples created in the lab such as lab blanks, lab‐fortified blanks (LFBs), and Lab‐Fortified Matrices (LFMs) used to assure lack of sample contamination and to measure analytical recovery during performance of sample processing and analysis methods.
Performance Testing (PT) / Performance Evaluation Sample (PES): Calibrator samples (filters spiked with E. faecalis grown in Brain Heart Infusion Broth) and Laboratory Fortified Blanks (Phosphate Buffered Saline; PBS) spiked with Enterococcus faecalis cells from BHI Broth suspension) will be assayed by EPA Method 1600 and Draft EPA Method 1606 to ascertain method performance. Ball‐T Bioballs® which contain a specified number of E. faecalis cells may also be acquired to determine the performance of the Relative Quantitation Method. Purified E. faecalis DNA acquired from the American Type Culture Collection and TIB Mol Biol Inc. is used to test the performance of the Absolute Quantitation Method.
Retentate: The sample residue retained by the filter after the sample is vacuum‐filtered. The retentate contains particulates, microbiota, and macrobiota from which the DNA is extracted into buffer by bead‐beating for subsequent qPCR analysis.
Rinsate: The volume of phosphate buffered saline (PBS) applied to a sample’s filter retentate in order to “wash” any residual fine particles, smaller than the filter’s nominal pore size, through the retentate and the filter.
Sample Processing Control (SPC): A surrogate homologue analyte (e.g. Salmon DNA) spiked into each sample to determine the recovery of target analyte and/or detect assay inhibition caused by matrix effects.
Standards: Known amounts or numbers of copies of Enterococcus genomic DNA analyzed by the Enterococcus qPCR assay to generate a Standard Curve (Log Copy Number vs. Crossing Point Value) in order to determine Enterococcus genomic copy numbers in “Unknown” test sample extracts by Absolute Quantitation Method.
5.4 Interferences
Low pH (acidic) water
Humic and fulvic acid content
Suspended solids (e.g. fecal matter) and particulates (sand, dirt)
Excessive algal growth
5.5 Health&SafetyWarnings
All proper personal protection clothing and equipment (e.g. lab coat, protective eyewear/goggles) must be worn or applied.
When working with potential hazardous chemicals (e.g. 95% ethanol) or biological agents (fecally‐contaminated water) avoid inhalation, skin contact, eye contact, or ingestion. If skin contact occurs

2013‐2014 National Rivers & Streams Assessment Laboratory Operations Manual
Version 1.3, May 2014 Page 59 of 224
59
FECAL INDICATO
R: ENTEROCOCCI
remove clothing immediately and wash/ rinse thoroughly. Wash the affected skin areas thoroughly with large amounts of soap and water. If available consult the MSDS for prompt action, and in all cases seek medical attention immediately. If inhalation, eye contact or ingestion occurs, consult the MSDS for prompt action, and in all cases seek medical attention immediately.
5.6 PersonnelQualifications
All laboratory personnel shall be trained in advance in the use of equipment and procedures used during the sample extraction and qPCR analysis steps of this SOP. All personnel shall be responsible for complying with all of the quality assurance/quality control requirements that pertain to their organizational/technical function. All personnel shall be responsible for being aware of proper health and safety precautions and emergency procedures.
5.7 EquipmentandSupplies
Clean powderless latex or vinyl gloves
Goggles or Face Shield
Roche MagNA Lyser
Roche MagNA Pure LC (automated nucleic acid isolation and purification platform)
High Speed Microfuge
Micropipettors
Semi‐conical, screw cap microcentrifuge tubes (PGC, #506‐636 or equivalent) pre‐filled with 0.3
+ 0.02 g Acid‐washed glass beads (Sigma, # G‐1277 or equivalent). Filled tubes are autoclaved
15‐min. Liquid Cycle (Slow Exhaust) OR
Roche MagNA Lyser Green Bead tubes (Roche Applied Science, #03‐358‐941‐001) sterile,
siliconized 3‐mm diameter ceramic beads in a siliconized 2‐mL microfuge tube.
Roche MagNA Lyser Rotor Cooling Block
2‐mL tube racks
Permanent marking pens (fine point and regular point) for labeling tubes
Bench Sheets & Printouts of Computer Software Sampling Loading Screen
5.8 Reagents&Standards
Qiagen AE buffer (Qiagen 19077)
Salmon DNA (Sigma D1626)
Frozen tubes of Enterococcus faecalis (ATCC #29212) calibrator cell stock
Purified Enterococcus faecalis (ATCC #29212d) genomic DNA
ABI TaqMan® Universal PCR Master Mix (ABI #4304437)
Enterococcus PCR primers and TaqMan® probe
Sketa PCR primers and TaqMan® probe
Bovine Serum Albumen (BSA) Sigma Cat. #B‐4287)
Roche MagNA Pure LC DNA Isolation Kit III for Fungi & Bacteria

2013‐2014 National Rivers & Streams Assessment Laboratory Operations Manual
Version 1.3, May 2014 Page 60 of 224
60
FECAL INDICATO
R: ENTEROCOCCI
5.9 PreparationsPriortoDNAExtraction&Analysis
Determine/estimate the sample batch size (number of samples) for one‐week of sample processing and qPCR analysis. The batch size is the number of samples that will be processed by filter extraction with the same batch (volume) of SAE buffer and analyzed by the same qPCR assay(s) using the same batch of qPCR master mix. A batch is covered for quantitation purposes by the batch calibrator samples, (a minimum of three) whose 5‐fold and 25‐fold diluted extracts are analyzed at the outset of the week along with a reagent blank. The lab will fill out a batch sample analysis bench sheet.
1. Micropipettors are calibrated annually and tested for accuracy on a weekly basis. Follow
manufacturer instructions for calibration check. Measure three replicate volumes per pipettor
and keep log book of their weights on a calibrated balance scale.
2. Preparation of stock Salmon Sperm (SS) DNA: Dissolve Salmon DNA in PCR grade water at a
concentration of ~10 µg/mL. Determine concentration of Salmon testes DNA stock by OD260
reading in a spectrophotometer. A DNA solution with an OD260 of 1.0 has a concentration equal
to approximately 50 µg/mL depending on the GC content of the DNA’s sequence(s).
3. Dilute Salmon testes DNA stock with AE buffer to make 0.2 μg/mL Salmon DNA Extraction Buffer
(SAE). Extraction buffer may be prepared in advance and stored at 4 ºC for a maximum of 1
week.
Note: Determine the total volume of Salmon DNA Extraction Buffer required for each day or week by multiplying the volume (600 μL) times the total number of samples to be analyzed including controls, water samples, and calibrator samples. For example, for 18 samples, prepare enough Salmon/DNA extraction buffer for 24 extraction tubes (18 ) / 6 = 3, therefore, 3 extra tubes for water sample filtration blanks (method blanks) and 3 extra tubes for calibrator samples). Note that the number of samples is divided by 6 because you should conduct one method blank for every 6 samples analyzed. Additionally, prepare excess volume to allow for accurate dispensing of 600 μL per tube, generally 1 extra tube. Thus, in this example, prepare sufficient Salmon DNA Extraction Buffer for 24 tubes plus one extra. The total volume SAE needed per sample is 600 μL. Hence for the SAE volume for 25 sample tubes is equal to 15,000 μL. Dilute the Salmon DNA working stock 1:50, for a total volume needed (15,000 μL) 50 = 300 μL of 10 μg/mL Salmon DNA working stock. The AE buffer needed is the difference between the total volume and the Salmon testes DNA working stock. For this example, 15,000 μL ‐ 300 μL = 14,700 μL AE buffer needed.
4. Make Dilution Series of Enterococcus faecalis purified genomic DNA for use as internal standards
in individual qPCR runs and to generate the weekly Enterococcus qPCR Standard Curve for
quantitation purposes.
5. Enterococcus faecalis DNA for Standards.
6. Frozen Reference Stock (20‐µL) at 2.89 x 10⁶ GEQs per µL.
7. Dilute 10‐µL of the Frozen Reference stock 363‐fold to a final volume of 3,630 µL AE buffer.
Aliquot 20‐µL volumes into many 200‐µL microfuge tubes and store frozen at ‐20 ºC. The net
concentration of Enterococcus GEQs is 8,000 / µL. Each week perform a series of 10‐fold and 4‐
fold dilutions from one thawed tube of the 8,000 GEQ/µL standard solution to create 800
GEQ/µL, 80 GQ/µL and 20 GEQ/µL standard solutions. The analyst performs Enterococcus qPCR
upon duplicate 5‐µL volumes of each of the four standards yielding a Standard Curve of Log

2013‐2014 National Rivers & Streams Assessment Laboratory Operations Manual
Version 1.3, May 2014 Page 61 of 224
61
FECAL INDICATO
R: ENTEROCOCCI
GEQs ENT versus Ct value from which the assays “efficiency” is subsequently calculated in the
Relative Quantitation EXCEL Spreadsheet.
a. Make Enterococcus faecalis calibrator filter samples:
i. Assemble calibrator positive control samples by thawing tubes of E. faecalis cell stocks,
diluting their contents (10‐µL) up to 1‐mL AE buffer and spotting 10‐µL on sterile PC
filter previously folded and inserted into a pre‐chilled Green Bead tube.
ii. Spot a sufficient number of calibrator filter samples for the entire study to insure
uniform, consistent relative quantitation of study samples. Store the calibrator filter
samples in ‐20ºC freezer and thaw individual calibrators (three per week) for extraction
with each week’s batch of samples.
8. The calibrator sample filters are spotted with 104 or 105 Enterococcus faecalis cells and this
number is incorporated into the Relative Quantitation EXCEL spreadsheet.
9. Prior to and after conducting work with cells and / or genomic DNA standards, disinfect and
inactivate (render non‐amplifiable) DNA in the Sample Extraction Hood, the qPCR Cabinet, and
the qPCR Sample Loading Hood with 10% bleach and > 15‐min. exposure to high intensity
germicidal (254 nm) ultraviolet light.
5.10 ProceduresforProcessing&qPCRAnalysisofSampleConcentrates.
5.10.1 SampleProcessing(DNAExtraction)
Typically, 100‐mL volumes of surface water are filtered according to EPA Method 1606 for processing and analysis by PCR assays. Due to the limitations of field crew sampling time and the performance limitations of the manually‐operated vacuum pumps used in the field sampling operations, only 50‐mL surface water samples were filtered. Lower volumes (< 50‐mL) are acceptable if suspended particulates hinder the filtering of the standard 50‐mL volume but equivalent volumes for each filter replicate were requested. Filtration of lower sample volumes necessitated modifications to Method 1606 which are directed by the Analysis Decision Tree (ADT; Section 5.18.1).
In accordance with the ADT, if < 40‐mL of a water sample is filtered per filter replicate, then the laboratory analyst extracts two replicate filters in parallel and combines equivalent volumes of the filter extracts to form one composite filter extract. Each individual filter is extracted with only 300‐µL of SAE Extraction Buffer instead of the usual prescribed 600‐µL volume of SAE buffer. Halving the SAE buffer volume enables the analyst to maintain an equivalent Method Detection Limit and maintain a similar Sample Equivalence Volume (SEQ; i.e. water sample volume per extract volume) in the extract volumes (e.g. 5‐µL) of each sample filter concentrate added to the PCR reactions.
1. Pre‐chill MagNA Lyser Rotor Cooling Block in ‐20˚C freezer. Label 1.7‐mL sterile microfuge tubes
with sample ID number to match them with Green Bead Tubes. Two supernatant recovery tubes
and one “5‐fold” dilution tube is needed per sample and should be labeled accordingly. The
dilution tube shall be filled with 80‐µL AE buffer using a micropipettor.
2. To extract sample filters, uncap green bead tube (cold) and add 0.6‐mL (600‐µL) SAE Buffer
(Qiagen AE Buffer spiked with Salmon DNA). Re‐cap tubes tightly.
3. Insert Green Bead tubes of samples into MagNA Lyser and bead‐beat for 60‐sec (1‐min) at 5,000
rpm at Room Temperature. Transfer sample tubes to microfuge. Spin tubes at 12,000 rpm for 2‐

2013‐2014 National Rivers & Streams Assessment Laboratory Operations Manual
Version 1.3, May 2014 Page 62 of 224
62
FECAL INDICATO
R: ENTEROCOCCI
min. Being careful to move filter aside, recover and transfer up to 400‐µL of supernatant (sans
debris) to new tube with a P‐200 or P‐1000 micropipettor.
4. Spin the supernatant tubes for 5‐min at 14,000 rpm at Room Temperature. Recover >350‐µL
supernatant and transfer to new 1.7‐mL tube. When all samples in a batch have been extracted
transfer dilute 20‐µL of DNA extract (2nd supernatant) five‐fold (5X) in 80‐µL AE buffer (sans SS‐
DNA) and store at 4˚C for qPCR assays. (If supernatant, 5X and even 25X sample dilutions
possess dark pigment and exhibit severe qPCR inhibition in Sketa assays, consider extracting
replicate filters of samples using the Modified MagNA Pure LC DNA Isolation Protocol (see
Section 5.18.2).
5.10.2 SampleAnalysisbyEnterococcusqPCR
5.10.2.1 PreparationofqPCRassaymix
1. To minimize environmental DNA contamination, routinely treat all work surfaces with a 10%
bleach solution, allowing the bleach to contact the work surface for a minimum of 15 minutes
prior to rinsing with sterile water. If available, turn on UV light for 15 minutes.
2. Using a micropipettor with aerosol barrier tips, add PCR grade water to the lyophilized primers
and probe from the vendor to create stock solutions of 500 μM primer and 100 μM probe and
dissolve by extensive vortexing. Pulse centrifuge to coalesce droplets. Store stock solutions at ‐
20ºC.
3. Prepare working stocks of Enterococcus, and Salmon DNA primer/probe mixes by adding 10 μL
of each Enterococcus or Salmon DNA primer stock and 4 μL of respective probe stock to 676 μL
of PCR grade water, and vortex. Pulse centrifuge to create pellet. Use a micropipettor with
aerosol barrier tips for all liquid transfers. Transfer aliquots of working stocks for single day use
to separate tubes and store at 4ºC.
4. Using a micropipettor, prepare assay mix of the Enterococcus, and Salmon DNA reactions in
separate, sterile, labeled 1.7 mL microcentrifuge tubes as described in Table 5.1.
5. Finger vortex the assay mix working stocks; then pulse microcentrifuge to coalesce droplets.
Return the primer/probe working stocks and other reagents to the refrigerator.
6. Thaw and finger vortex sample extract (dilution) tubes that will be assayed in PCR run.
Microfuge a few seconds to coalesce droplets. Finger mix and spin the standards and calibrator
samples (dilutions). Temporarily store all samples in 4˚C refrigerators until use in assay or return
to long term storage at ‐20˚C. Discard disposable gloves and put on a new pair.
7. Set 32 Smart tubes in Cepheid Racks in PCR cabinet along with micro‐pippetors and expose to
germicidal UV lamp for 15‐min.
8. Pipette 20‐uL of respective Master Mix into each labeled Smart tube. Transfer Smart tubes
(racks) from PCR cabinet to disinfected Sample Loading Fume Hood.
9. Using P‐10 or P‐20 micro‐pipettor load each Smart tube with 5‐uL volume of respectively
designated sample extract (dilution), standard, or buffer blank (SAE). Cap each sample’s Smart
tube after loading.
10. Check to make sure each Smart tube is properly labeled and identifiable by sample number or I‐
core position (e.g. A4). Insert loaded Smart tubes into Smart Tube microfuge. Close lid and spin

2013‐2014 National Rivers & Streams Assessment Laboratory Operations Manual
Version 1.3, May 2014 Page 63 of 224
63
FECAL INDICATO
R: ENTEROCOCCI
5‐sec. Pop lid to stop. Remove Smart Tubes from microfuge and insert into proper position in
SmartCycler.
Enterococcus (Ludwig) and Salmon (Sketa) qPCR assays (EPA Method 1606) will be performed upon 5‐uL aliquots of un‐diluted & 5X diluted extracts of sample unknowns, calibrator, field blank, and lab blank. A “No Template Controls” (NTC) shall be analyzed on an ongoing basis to ensure that the Master Mix PCR reagents are not contaminated. To minimize the number of Enterococcus qPCR reactions needed to be performed upon samples, Sketa qPCR assays will be performed upon the 5‐fold diluted DNA extracts of samples before any Enterococcus qPCR assays are run in order to screen samples for the presence and dilution of PCR inhibitors by comparison with the undiluted and 5‐fold dilution DNA extract of the calibrator samples and unused portions of SAE buffer. Each sample’s lowest dilution DNA extract not exhibiting PCR inhibition in the Sketa qPCR assay will be re‐assayed by the Enterococcus qPCR assay and it’s results will be used for quantitation of Enterococcus DNA sequences and CCEs.
Detection of reduced levels of Salmon DNA (higher instrument Ct values) is indicative of technical error during extract dilution or excessive levels of PCR inhibitors or nuclease activity which could impact detection of the Enterococcus DNA target sequences in the Enterococcus PCR assay. Alternatively, the high Sketa Ct value may be indicative of the occurrence of a technical error during extract dilution. If a test sample’s Ct value is less than 3 cycles different than the blank negative control and calibrator samples, indicating only negligible or marginal inhibition (the Sketa Assay is more sensitive to inhibitors than the ENT Assay), an aliquot of its five‐fold diluted extract is analyzed in the Enterococcus Assay. If an abundance of PCR inhibitors or DNA nucleases are present in a sample extract which are causing a greater increase in an extract’s Ct value (> 3 cycles increase), then the extract is diluted an additional five‐fold (net 25‐fold dilution) and re‐assayed by both the Sketa and ENT assays. If the inhibition is not ameliorated by the additional dilution, which should restore the Sketa Ct value to that of the 25‐fold diluted calibrator samples’ extracts, the following actions are taken by the analyst. First, the analyst re‐dilutes the sample’s undiluted DNA extract five‐fold and re‐analyzes the dilution with the Sketa PCR assay to confirm that Ct variance is not due to a dilution error. If the Ct difference is not attributed to a dilution error, replicate sample filters of the “inhibited” samples are subjected to DNA extraction and purification by the MagNA Pure LC automated platform loaded with the Roche DNA Kit III (Bacteria; Fungi) reagents (see Section 5.18.2).
The EPA Modified MagNA Pure LC extraction process which includes the spiking of the Lysis Binding Buffer with the Salmon (IPC) DNA is more effective, but more costly, than EPA Method 1606 in neutralizing severe levels of PCR inhibitors and DNA nucleases present in some environmental samples, especially those containing high levels of algae or phytoplankton. The purified DNA extract yielded by MagNA Pure extraction of the few (<5%) “severely inhibited” samples is subsequently analyzed by the Sketa and Enterococcus qPCR assays and the number of Enterococcus CCEs per 100‐mL determined by the delta Ct and delta delta Ct Relative Quantitation Methods. While the MagNA Pure LC extraction method is not 100% conservative (no partitioning or recovery issues) like EPA Method 1606, it typically exhibits DNA recoveries in the range of 25‐50%. DNA recoveries and Enterococcus CCE concentrations are calculated using only the Delta‐Delta Ct Relative Quantitation Method. The relative DNA recoveries are determined by comparison of the Sketa results from purified DNA eluates of each test sample with those of the extracted lab blank and calibrator samples. The absolute DNA recovery is calculated by comparison of the former Sketa results with those of elution buffer spiked with an amount of Salmon DNA equivalent to the amount in the Salmon‐spiked Lysis Binding Buffer added to each sample filter lysate during the MagNA Pure LC DNA extraction process.

2013‐2014 National Rivers & Streams Assessment Laboratory Operations Manual
Version 1.3, May 2014 Page 64 of 224
64
FECAL INDICATO
R: ENTEROCOCCI
The “Unknown” and “Control” sample extracts whether processed using the SAE buffer or MagNA Pure LC Kit III reagents are analyzed according to the Cepheid SmartCycler Enterococcus and Sketa qPCR protocols described in Appendix A of the Draft EPA Method 1606 with Ct determination made by the software using Manual Determination (equivalent of Fit Points Method of Roche LightCycler) with the fluorescence threshold set at 8.0 units which enables uniform analysis and comparability of all samples’ qPCR results.
5.10.3 SampleanalysissequenceforSmartCycler
Example: For analyses on a single 16‐position SmartCycler, calibrator samples and water samples are analyzed in separate runs and a maximum of 6 water samples (or 2 replicates of 3 samples) are analyzed per run, as described in Table 5.2 and Table 5.3 of Section 5.18.
Enterococcus and Sketa (Salmon DNA = SPC) qPCR results are exported to an EXCEL spreadsheet in which relative quantitation calculations are performed by analysts. The Method 1606 results are reported in terms (units of measure) of Number of Enterococcus Sequences and Number of Enterococcus Calibrator Cell Equivalents (CCEs) per 100‐mL sample volume. The qPCR results are converted to this standardized unit of measure based on the volume of water sample actually filtered (e.g., 10‐mL, 25‐mL, or 50‐mL). Non‐detects are reported as below the reporting limit (RL) which varies proportionally to the volume of sample filtered by each sample crew at a specific site. Reporting limits and Method Detection Limits (MDLs) will be higher among samples for which a volume of water <50‐mL was filtered.
Enterococcus qPCR results are flagged if some part of the sample collection, hold‐time, processing, shipment, storage, sample extraction, or qPCR analysis are compromised and did not meet the requirements of the Sampling and Analysis SOPs.
5.11 Storage&TimingofProcessing/AnalysisofFilterConcentrates
When a sufficient number of water sample filter concentrates (filters and retentates) have been received by NERL and qPCR analytical reagents have been obtained the samples will be logged into LIMS. Sample processing and qPCR will commence and results will be entered into the LIMS upon completion of analysis.
5.12 ChainofCustody
Follow the Sample Control Procedures, Field Sampling Form/Enterococci Filtration/Sample Processing Standard Operating Procedures.
Field Sampling forms and NRSA 2013‐2014 Sample Tracking EXCEL Spreadsheet shall be consulted to determine if a sample has been properly preserved during collection and transport prior to analysis and that it has passed all criteria permitting its analysis. The qPCR results of samples exceeding established criteria or whose associated field/lab blanks had positive Enterococcus qPCR detections of DNA shall be flagged.
5.13 QualityAssurance/QualityControl(QA/QC)Procedures
The Data Quality Objectives and the Laboratory QC Procedures are listed and summarized in Table 5.5 and Table 5.6 of Section 5.18.
The number of field blanks (dilution buffer only) shipped by field crews performing the resampling of 91 re‐visited rivers and streams represents a frequency of 5‐10% of the total number of samples extracted and analyzed by qPCR. All field blanks (negative controls) will be extracted and analyzed by qPCR for the

2013‐2014 National Rivers & Streams Assessment Laboratory Operations Manual
Version 1.3, May 2014 Page 65 of 224
65
FECAL INDICATO
R: ENTEROCOCCI
detection of Enterococcus. The blanks will be analyzed in these cases to insure that positive detections in field samples are not due to contamination by sampling crews.
One Lab / Method Blank (LB; sterile filters) will be run per batch week in order to insure the sterility (lack of DNA contamination) in the SAE buffer and pipette tips used to process all of the samples. The LB sample will be processed and diluted like all other “Unknown” samples.
Up to four replicate filter concentrates (retentates) derived from the field filtration of 50‐mL (in some cases 10‐mL and 25‐mL) sample volumes of every sample will be received by NERL and stored at ‐20 to ‐80˚C. One filter retentate of each sample (and duplicates for 10% of samples) will be extracted to obtain DNA lysates for Enterococcus qPCR analysis. The remaining filter concentrates will be archived for possible extraction and analysis at a later time if needed.
Enterococcus and Sketa qPCR analysis will be performed upon 5‐µL volumes of the non‐diluted and 5‐fold diluted (in AE buffer) extracts which will be added to 20‐µL qPCR Master Mix volumes and analyzed in the Cepheid SmartCycler qPCR instrument in accordance with draft EPA Method 1606.
Duplicate Enterococcus and Sketa qPCR assays will be performed upon 10% of the sample extracts (diluted and un‐diluted) each week (batch) to determine qPCR assay variance.
5.14 MethodPerformance
Method Performance will be determined by the use of Performance Testing (PT)/Performance Evaluation Samples (PES). Calibrator samples (filters spiked with frozen stocks of E. faecalis grown in Brain Heart Infusion Broth) and Lab‐Fortified Matrices (LFMs; duplicate sample filters spiked with frozen stocks of E. faecalis grown in Brain Heart Infusion Broth) will be extracted and assayed by EPA Method 1606 Enterococcus and Sketa qPCR assays in order to ascertain method performance. The LFMs are performed upon several samples (approx. 5% frequency) per batch, typically samples exhibiting non‐detection of Enterococcus, in order to determine method performance and also to insure that non‐detects are not due to poor DNA recovery caused by matrix effects.
5.15 RecordKeeping&DataManagement
Laboratory analysts shall follow the EPA OEME Laboratory Data Management SOP. Each lab analyst shall record all details pertaining to sample processing and analysis in a designated, bound laboratory notebook. Pertinent sample collection and analysis data shall be entered into the Laboratory Information Management System (LIMS) and SeaGate Crystal Reports shall be generated as required by the EPA (TOPO).
An EXCEL spreadsheet of sample analysis data and associated calculations used to derive a field sample’s or control sample’s Enterococcus genomic DNA (GEQ) and Cell Equivalent (CEQ) concentration shall be uploaded to the NRSA 2013‐2014 database stored on a computer server in Corvallis, Oregon.
5.16 WasteManagement&PollutionPrevention
During the sample processing procedures there may be hazardous waste produced. The waste must be handled and disposed of in accordance with federal, state, and municipal regulations. All recyclable and non‐recyclable materials for disposal will be properly sorted for their respective waste streams and placed into proper containers for janitorial staff to collect and process according to EPA guidelines.
All ethanol used shall be consumed by ignition or evaporation. Volumes of ethanol remaining at the end of the project can be stored for later use in a flammable cabinet or disposed of through appropriate hazardous waste disposal vendors. Reagent ethanol shall be contained in screw cap tubes along with the

2013‐2014 National Rivers & Streams Assessment Laboratory Operations Manual
Version 1.3, May 2014 Page 66 of 224
66
FECAL INDICATO
R: ENTEROCOCCI
filter forceps to sterilize the latter and to prevent ethanol spillage during transport between sampling sites.
After the DNA extract is recovered from the sample filter after bead‐beating in buffer and centrifugation, the filter and bead‐tube will be discarded in autoclave bags and sterilized for 30‐min at 121˚C/30 psi to inactivate any potential pathogens that may be associated with the samples.
5.17 LiteratureCited
USEPA Region 1 (New England) OEME NERL Standard Operating Procedure for the Collection of Chemical & Biological Ambient Water Samples (ECASOP‐Ambient Water Sampling 2; January 31, 2007)
USEPA Draft Method 1606: Enterococci in Water and Wastewater by TaqMan® Quantitative Polymerase Chain Reaction (qPCR) Assay. December 2006 (12/15/06 a)
USEPA NERL OEME Draft Bench SOP for Real‐Time PCR Method Quantifying Enterococci in Recreational Water Samples (August 2006)
5.18 Tables,Diagrams,Flowcharts,Checklists,andValidationData
Table 5.1 Enterococci: PCR assay mix composition (according to draft EPA method 1606)
Reagent Volume/Sample (multiply by # samples to be analyzed per day)
Sterile H2O 1.5 μL
Bovine Serum Albumen (20 mg/mL) 2.5 μL
TaqMan® master mix 12.5 μL
Primer/probe working stock solution 3.5 μL*
Note: This will give a final concentration of 1 μM of each primer and 80 nM of probe in the reactions. Prepare sufficient quantity of assay mix for the number of samples to be analyzed per day including calibrators and negative controls plus at least two extra samples. It is strongly recommended that preparation of assay mixes be performed each day before handling of DNA samples.
Table 5.2 Enterococci: batch calibrator & enterococcus standards PCR run – 7 samples
Sample Description* Quantity Samples PCR Assay Master Mix
Quantity PCR Reactions
3 Calibrators (5‐ and/or 25‐fold dilution) 3 Salmon DNA (Sketa) 6
3 Calibrators (5‐ and/or 25‐fold dilution) 3 Enterococcus 6
4 Enterococcus faecalis DNA Standards 4 Enterococcus 8
No template control (reagent blank) 1 Enterococcus 1
* Diluted equivalently to the water samples
Table 5.3 Enterococci: sub batch test sample PCR run – 26 samples & 1 method blank
Sample Description* Quantity Samples PCR Assay Master Mix
Quantity PCR Reactions
Water samples, (5‐fold dilution) 26 Enterococcus 26

2013‐2014 National Rivers & Streams Assessment Laboratory Operations Manual
Version 1.3, May 2014 Page 67 of 224
67
FECAL INDICATO
R: ENTEROCOCCI
Method blank or Sample PCR Reaction Duplicate, (1‐ or 5‐fold dilution)
1 Enterococcus 1
Non‐diluted SAE Buffer 1 Enterococcus 1
Water samples, (1‐ or 5‐fold dilution) 26 Salmon DNA 26
Method blank or Sample PCR Reaction Duplicate, (1‐ & 5‐fold dilution)
1 Salmon DNA 1
* Use of 5‐fold diluted samples for analysis is currently recommended if only one dilution can be analyzed. Analyses of undiluted water sample extracts have been observed to cause a significantly higher incidence of PCR inhibition while 25‐fold dilutions analyses may unnecessarily sacrifice sensitivity.
Table 5.4 Enterococci: laboratory methods
Variable or Measurement
QA Class
Expected Range and/ or Units Summary of Method References
Sample Collection
C NA Sterile sample bottle submerged to collect 250‐mL sample 6‐12” below surface at 1‐m from shore
NRSA Field Operations Manual
2008
Sub‐sampling N NA 4 x 50‐mL sub‐samples poured in sterile 50‐mL tube after mixing by inversion 25 times.
NRSA Laboratory Methods Manual
2008
Sub‐sample
(& Buffer Blank) Filtration
N NA Up to 50‐mL sub‐sample filtered through sterile polycarbonate filter. Funnel rinsed with minimal amount of buffer. Filter folded, inserted in tube then frozen.
NRSA Laboratory Methods Manual
2008
Preservation & Shipment
C ‐40Cto+40 C Batches of sample tubes shipped on dry ice to lab for analysis.
NRSA Laboratory Methods Manual
2008
DNA Extraction
(Recovery)
C 10‐141% Bead‐beating of filter in buffer containing Extraction Control (SPC) DNA. DNA recovery measured
EPA Draft Method 1606 Enterococcus
qPCR
Method 1606 (Enterococcus &
SPC qPCR)
C <60 (RL) to >100,000 ENT CCEs /100‐mL
5‐µL aliquots of sample extract are analyzed by ENT & Sketa qPCR assays along with blanks, calibrator samples & standards. Field and lab duplicates are analyzed at 5% frequency. Field blanks analyzed along with test samples.
EPA Draft Method 1606 Enterococcus
qPCR
NERL NRSA 2008 qPCR Analytical SOP
C = critical, N = non‐critical quality assurance classification.

2013‐2014 National Rivers & Streams Assessment Laboratory Operations Manual
Version 1.3, May 2014 Page 68 of 224
68
FECAL INDICATO
R: ENTEROCOCCI
Table 5.5 Enterococci: parameter measurement data quality objectives
Variable or Measurement
QA Class
Expected Range and/or Units Summary of Method References
DNA Extraction (Recovery)
C 10‐141% Bead‐beating of filter in buffer containing Extraction Control (SPC) DNA. DNA recovery measured
EPA Draft Method 1606 Enterococcus qPCR
Enterococcus & SPC qPCR
C <60 to >10,000 ENT CEQs /100‐mL
5‐µL aliquots of sample extract are analyzed by ENT & Sketa qPCR assays along with blanks, calibrator samples & standards. Field and lab duplicates are analyzed at 5% frequency. Field blanks analyzed at end of testing only if significant detections observed.
EPA Draft Method 1606 Enterococcus qPCR; NERL NRSA 2008 2009 qPCR Analytical SOP (QAPP)
SPC & ENT DNA sequence numbers of Calibrators & Standards by AQM
RSD = 30%
80% 95%
ENT CCEs by dCt RQM
RSD = 55%
40% 95%
ENT CCEs by ddCt RQM
RSD = 55%
50% 95%
C = critical, N = non‐critical quality assurance classification. *AQM = Absolute Quantitation Method; RQM = Relative Quantitation Method; SPC = Sample Processing Control (Salmon DNA / Sketa); CCEs = Calibrator Cell Equivalents
Table 5.6 Enterococci: laboratory QC procedures – enterococci DNA sequences
Check or Sample Description Frequency Acceptance Criteria Corrective Action
SAMPLE PROCESSING
Re‐process sub‐samples (duplicates)
10% of all samples completed per laboratory
Percent Similarity ≥70% If <70%, re‐process additional sub‐samples
qPCR ANALYSIS
Duplicate analysis by different biologist within lab
10% of all samples completed per laboratory
Percent Congruence <30% RSD If >30%, determine reason and if cause is systemic, re‐analyze all samples in question.
Independent analysis by external laboratory
None Independent analysis TBD Determine if independent analysis can be funded and conducted.
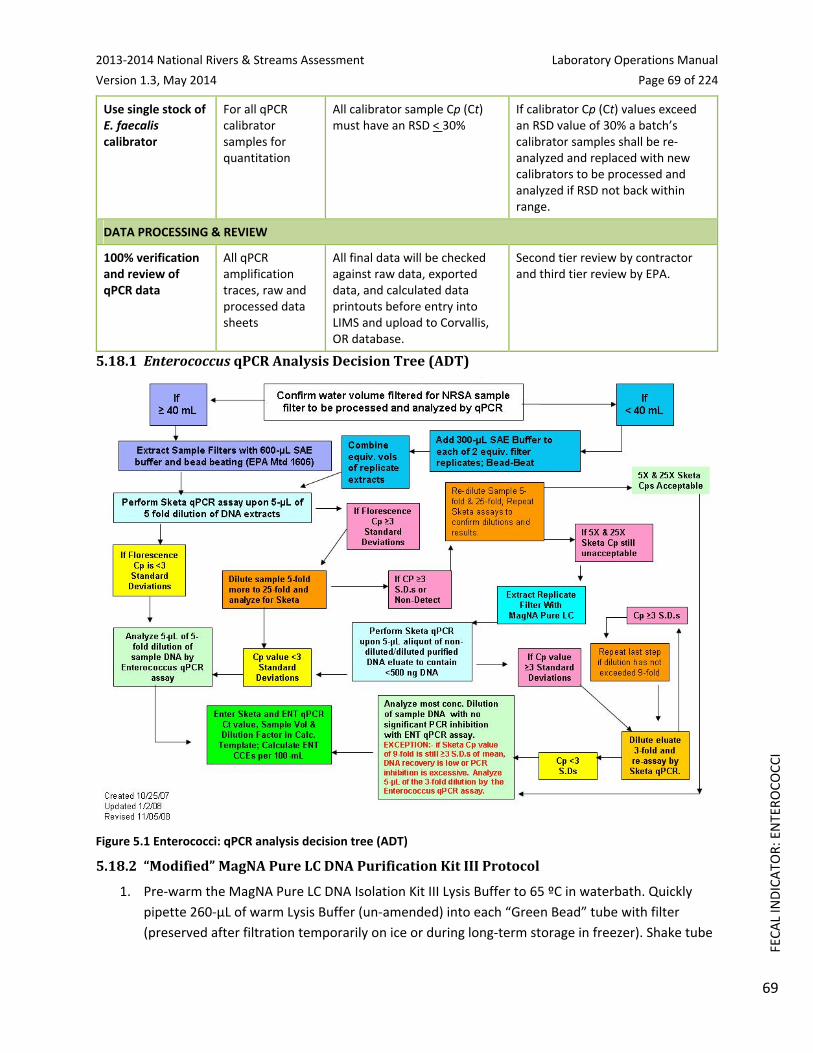
2013‐2014 National Rivers & Streams Assessment Laboratory Operations Manual
Version 1.3, May 2014 Page 69 of 224
69
FECAL INDICATO
R: ENTEROCOCCI
Use single stock of E. faecalis calibrator
For all qPCR calibrator samples for quantitation
All calibrator sample Cp (Ct) must have an RSD < 30%
If calibrator Cp (Ct) values exceed an RSD value of 30% a batch’s calibrator samples shall be re‐analyzed and replaced with new calibrators to be processed and analyzed if RSD not back within range.
DATA PROCESSING & REVIEW
100% verification and review of qPCR data
All qPCR amplification traces, raw and processed data sheets
All final data will be checked against raw data, exported data, and calculated data printouts before entry into LIMS and upload to Corvallis, OR database.
Second tier review by contractor and third tier review by EPA.
5.18.1 EnterococcusqPCRAnalysisDecisionTree(ADT)
Figure 5.1 Enterococci: qPCR analysis decision tree (ADT)
5.18.2 “Modified”MagNAPureLCDNAPurificationKitIIIProtocol
1. Pre‐warm the MagNA Pure LC DNA Isolation Kit III Lysis Buffer to 65 ºC in waterbath. Quickly
pipette 260‐µL of warm Lysis Buffer (un‐amended) into each “Green Bead” tube with filter
(preserved after filtration temporarily on ice or during long‐term storage in freezer). Shake tube

2013‐2014 National Rivers & Streams Assessment Laboratory Operations Manual
Version 1.3, May 2014 Page 70 of 224
70
FECAL INDICATO
R: ENTEROCOCCI
5 to 10 seconds to mix buffer with beads and filter. Let stand at RT until batch of 16 samples
(including positive control LFB or LFM and negative control LB samples) have all had Lysis Buffer
and had their caps sealed tight. Leave water bath on to use during 30‐minute Proteinase K
treatment period.
2. Load the 16 samples into MagNA Lyser Rotor Plate and insert into MagNA Lyser. Tighten the
three handscrews of the locking mechanism. Close the lid tightly. Set controls to shake for 60‐
sec at 5,000 rpm. Press the start button.
3. When the shake cycle has ended press the Open Lid Button. Open the lid and unlock the locking
mechanism screws. Remove tube plate and set on bench top MagNA Lyser tube ring hub.
Remove tubes, insert into tube styrofoam water bath float and cool tubes in ice water for 2‐min.
or place directly into 24‐place microfuge rotor, pre‐chilled in freezer.
4. Insert tubes into centrifuge rotor symmetrically in order to balance rotor. Close lid of centrifuge.
Set spin parameters for 3,000 rpm for 1‐min at 4ºC. Press Start button. Centrifuge to collect
drops and foam off of cap down into tube.
5. When centrifuge stops, open lid and remove tubes from rotor. Uncap tubes in order and add 40‐
µL of Proteinase K (dissolved in Lysis Buffer Elution Buffer). Re‐cap tubes and mix lysate by
inversion. Do not vortex. Knock beads and filter down from cap into bottom of tube by tapping
tubes on bench countertop.
6. Insert tubes into styrofoam floating rack. Incubate tubes 30‐min at 65ºC in water bath. Set timer
for 15‐min. At end of 15‐min remove rack from water bath and inverts several times to mix
samples and tap beads and filter back down into tube. Re‐place rack in 65ºC waterbath for 15‐
min. for total of 30‐min.
7. Repeat steps 3 to 8 to process 16 more samples in parallel for loading MagNA Pure LC sample
cartridge with 32 DNA extracts for downstream processing in the robotic platform.
8. After 30‐min in 65 ºC waterbath remove tubes from water bath and place in MagNA Lyser Bead
Beater for 15 seconds at 5,000 rpm. After 15 seconds of bead‐beating, place in ice bath for 5‐
min to cool.
9. Insert tubes in centrifuge rotor and spin 3‐min at 12,000 rpm and 4 ºC to pellet sediment and
cell debris. When spinning is complete, open lid of centrifuge and rotor and mark side of outer
side of cap where pellet should have formed.
10. Carefully remove rotor from centrifuge and set on bench. Remove tubes one at a time from
rotor and use 200‐µL pipettor and sterile aerosol‐proof tips to transfer approximately 150µL
lysate supernatant from tube to wells in MagNA Pure LC Sample Cartridge in pre‐designated
order.
11. When all 16 sample supernatants transferred to sample cartridge put adhesive film over
cartridge to prevent contamination and evaporation. Put sample cartridge in ice water bath or
fridge to maintain 4 ºC.
12. Repeat steps 9 to 13 for second batch of 16 samples (lysates). Re‐cover sample cartridge with
adhesive film for storage. Centrifuge sample cartridge opposite a balance cartridge for 75‐sec (1‐
min, 15‐sec) at 2800 rpm in IEC centrifuge (or equivalent) with rotor adaptors for microtiter
plates in place. Insert the film‐covered sample cartridge in MagNA Pure LC platform.

2013‐2014 National Rivers & Streams Assessment Laboratory Operations Manual
Version 1.3, May 2014 Page 71 of 224
71
FECAL INDICATO
R: ENTEROCOCCI
13. Load the MagNa Pure LC platform with volumes of extraction kit reagents prescribed by MagNA
Pure LC computer software for the number of samples being extracted. Before closing the
platform’ lid and starting the extraction process add 1.34µL of 9.3µg/mL Salmon DNA Stock (10
µg/mL nominal concentration) per 1mL Lysis Binding Buffer (blue soapy solution) as the Sample
Processing Control (SPC). If the amount of Salmon DNA stock to be added is less than 10‐µL,
dilute the Salmon DNA stock so that a volume > 10‐µL can be pipetted into the Lysis Binding
Buffer. Rinse pipette tip up and down three times in Lysis Binding Buffer.
14. Remove film from top of sample cartridge and re‐insert in Roche MagNA Pure LC platform set up
with DNA Purification Kit III (Fungi; Bacteria) reagents in tubs, tips, tip holders, and processing /
elution cartridges. Close platform lid and after checking off checklist of loaded items (e.g.
reagents, tips) lock the lid and start the automated DNA III Extraction Protocol which purifies
each sample’s DNA and elutes it into 100‐µL Elution Buffer.
15. When extraction process is complete, unlock the MagNA Pure LC platform lid and remove the
sample eluate cartridge. Cover the cartridge with adhesive film and store at 4 C until qPCR
analysis. Store cartridge at < ‐20 ºC for long term preservation.
16. Prepare Elution Buffer Control from 9.3µg/mL Salmon DNA Stock by diluting a small volume to
37.2pg/1000µL (1‐mL). This control sample is only analyzed by the Sketa qPCR assay. The Ct
value obtained represents that value expected in Sketa qPCR assays of each MagNA Pure LC
purified sample if 100% of the Salmon DNA was recovered and detected. Vortex to mix on low
speed briefly prior qPCR analysis. Centrifuge for 1.5‐min to coalesce droplets. Remove film to
aliquot sub‐samples and re‐place with new film cover to restore at cool temperatures.

2013‐2014 National Rivers & Streams Assessment Laboratory Operations Manual
Version 1.3, May 2014 Page 72 of 224
72
FISH
VOUCHER
SPEC
IMEN
S
6.0 FISHVOUCHERSPECIMENSThis chapter describes the procedures for taxonomic identification of fish voucher specimens collected from river and streams as part of the EPA’s National Rivers and Streams Assessment. Two types of voucher samples are collected and sent to a laboratory.
The first type is the QC voucher sample prepared by the field crew at sites identified by EPA. The QC voucher sample includes specimens (preserved or digital images) of all types of fish, identified to the lowest practicable taxon level at the site by the field taxonomist. QC voucher samples are sent to the QC laboratory to assess the accuracy of the field identifications.
The second type is the Unknown (UNK) voucher sample that includes physical specimens or digital images for fish that the field fish taxonomist could not positively identify during the site visit. Field crews also label as “UNK” specimens for fish collected outside their usual or known range. In most cases, the field fish taxonomist will retain the UNK samples for further study and identification. However, in some instances, the field crew will opt to send the UNK voucher sample to the QC laboratory for identification.
This chapter describes the procedures and data reporting for the QC laboratory. The Field Operations Manual describes the procedures for the field fish taxonomist. In the following discussion, the first three sections summarize the procedure; health and safety concerns; and required resources. Section 6.4 describes the sample receipt and login procedures. Section 6.5 describes the identification steps. Section 6.6 describes laboratory assistance visits. Section 6.7 identifies the sample and record retention requirements. Section 6.9 provides a summary of the quality control requirements. The final section provides references to aid in identifications.
6.1 SummaryofProcedures
Each field crew includes a field fish taxonomist approved by EPA based upon a review of their qualifications and experience. At each site with sufficient fish, field crews collect a minimum of 500 fish of length greater than 25 millimeters (mm). The fish taxonomist on the field crew (“field fish taxonomist”) quickly identifies and enumerates the fish, and then returns them to the water m.
In accordance with quality control requirements, EPA selected sites (“QC sites”) for independent, taxonomic confirmation. At each QC site, the field fish taxonomist prepares a QC voucher sample that includes specimens, preserved or digital images, for each taxon of fish collected at the site. The field fish taxonomist identifies each fish taxon to the lowest practicable level. Instead of specimens, digital images are required for listed or trophy game specimens that must be released alive, specimens that are too large to preserve, or very common and easily identified fish types. EPA uses the QC taxonomists’ identifications of the QC voucher samples as a “gold standard” in determining the accuracy of the field identifications.
In addition to providing vouchers for QC evaluations, the field fish taxonomist may opt to send the QC taxonomist any specimen, or its image, that cannot be identified in the field (“UNK voucher sample”). The QC taxonomist uses the same identification procedures, regardless of whether the specimens are from QC or UNK voucher samples.
6.2 HealthandSafetyWarnings
In addition to the laboratory’s usual requirements, laboratories must adhere to the following health and safety procedures:
1. Laboratory facilities must properly store and dispose of solutions of 10% formalin and/or 75‐
95% ethanol.
2013‐2014 National Rivers & Streams Assessment Laboratory Operations Manual
Version 1.3, May 2014 Page 73 of 224
73
FISH
VOUCHER
SPEC
IMEN
S
2. Laboratory personnel must wear proper personal protection clothing and equipment (e.g. lab
coat, protective eyeware, gloves).
3. When working with potential hazardous chemicals (e.g. formalin, ethanol), laboratory personnel
must avoid inhalation, skin contact, eye contact, or ingestion. If skin contact occurs, remove
clothing immediately. Wash and rinse the affected skin areas thoroughly with large amounts of
soap and water.
6.3 DefinitionsandRequiredResources(Personnel,TaxonomyLaboratories,andEquipment)
This section provides definitions and required resources for using the procedure. Section 6.3.1 defines the terms used throughout the procedure. Section 6.3.2 describes the taxonomic expertise required for each QC taxonomist using the procedure. Section 6.3.3 describes the roles and responsibilities of the personnel involved in the procedure. Section 6.3.4 identifies the equipment necessary to apply the procedure in identifying fish voucher specimens in samples.
6.3.1 Definitions
The following terms are used throughout the procedure:
Bench Sheet: Optional form used by the QC taxonomist to record information about the voucher specimen. See Figure 6.1 for an example.
Dissecting microscope: Microscope that is configured to allow low magnification of three‐dimensional objects that are larger or thicker than the compound microscope can accommodate.
External QC Coordinator is an EPA staff person. For some activities, the External QC Coordinator may be supported by a contractor that is not involved with field sampling. The External QC Coordinator is responsible for arranging for laboratory assistance visits; comparing fish voucher identifications by the field and QC taxonomists; and assessing other quality control issues.
NARS: National Aquatic Resource Surveys. The National Rivers and Streams Assessment (NRSA) is part of the NARS program.
NARS Information Management System (NARS IM): The IM system established to support all surveys, including NRSA, in the NARS program. The NARS IM system is used to track the samples from field collection to the laboratory.
NRSA: National Rivers and Streams Assessment. The samples will be collected during the field stage of NRSA.
Photovoucher: Digital image of the fish specimen.
QC Site: site where a QC voucher specimen is prepared.
QC Voucher: Fish voucher sample collected at the QC site.
Reference Collection: A collection of voucher specimens and digital images that provide examples of each taxon identified from the NRSA samples sent to the laboratory. A reference collection is used to help with future identifications of unknown specimens, and to provide physical documentation of reported identifications.
Tagged lot: A group of voucher specimens believed to represent a single taxon based on field identifications. Tagged lots are maintained separately in a voucher sample, and are associated with a unique voucher tag number.

2013‐2014 National Rivers & Streams Assessment Laboratory Operations Manual
Version 1.3, May 2014 Page 74 of 224
74
FISH
VOUCHER
SPEC
IMEN
S
UNK voucher specimen: A voucher specimen of fish that could not be positively identified in the field.
Voucher collection: an assortment of preserved specimens maintained for validating taxonomic identifications. For each selected QC site, the field crew submits up to 20 examples of each taxon of fish identified at the site. If the fish is endangered, rare, or too large to preserve, the field crew will provide digital images instead of physical specimens.
Voucher sample: a collection of voucher specimens from a single site.
Voucher Specimens: Preserved specimens or digital images of one or more individual fish used to identify the taxa collected at a site.
Voucher Specimen Tag: A pre‐numbered paper tag included in the mesh bag with each fish voucher specimen (or included with each digital image). Tags are used to distinguish between tagged lots in a sample.
6.3.2 GeneralRequirementsforTaxonomistsandTaxonomyLaboratories
The procedures may be used by any fish taxonomist and associated taxonomy laboratory that has expertise in each of the following areas:
Taxonomic expertise. To demonstrate its expertise, the organization with the QC taxonomists shall provide EPA with one or more of the following:
1. Memorandum that identifies the relevant services that the organization or its taxonomists
provided for a large national survey in the past five years.
2. A vitae, resume, or equivalent documentation detailing the taxonomic expertise of the
organization and its taxonomists, including coursework, professional certifications, membership
in professional societies, job experience specifically related to fish taxonomy (especially with
taxa that are difficult to identify), and any experience with the curation of museum or other
voucher collections.
3. Quality assurance and quality control requirements. To demonstrate its expertise in quality
assurance and quality control procedures, the organization shall provide EPA with copies of the
quality‐related documents relevant to the procedure. Examples include Quality Management
Plans (QMP), QAPPs, and applicable Standard Operating Procedures (SOPs).
4. To demonstrate its ongoing commitment, the person in charge of quality issues for the
organization shall sign the NRSA QAPP Certification Page.
6.3.3 Personnel
QC Taxonomist: A systematic ichthyologist having considerable training and considerable experience in identifying fish taxa from large regions of the U.S., and experience with difficult groups of taxa. A QC taxonomist maintains contact with other taxonomists through professional societies and other interactions, and keeps up with the pertinent literature, since systematics and taxa identifications change over time. Taxa identifications by QC taxonomists represent the standard against which EPA evaluates identifications by field taxonomists. It is acceptable for the QC taxonomist to also serve as a field fish taxonomist, but not for the same sample. In other words, for any given sample, the field fish taxonomist and QC taxonomist must be two different persons.
6.3.4 Equipment/Materials
The procedures require the following equipment and information for taxonomic identifications.

2013‐2014 National Rivers & Streams Assessment Laboratory Operations Manual
Version 1.3, May 2014 Page 75 of 224
75
FISH
VOUCHER
SPEC
IMEN
S
Fine‐tipped forceps (watchmaker type, straight and curved)
Dissecting microscope (3.5‐12X magnification)
Dividers and/or calipers for obtaining measurement and proportional measurement data from
specimens
Scalpel
List of standard common and scientific names used in NRSA (Appendix D)
Taxonomic keys or published descriptions in up‐to‐date, regional faunal works including online
resources
Keys or descriptions for the most recent, accepted taxonomic revisions of individual groups
Descriptions in other taxonomic studies, especially original descriptions (preferably published).
Voucher samples
o Sample tracking form that accompanies each shipment of samples
o Site location
o Physical specimens or image file
o Access to additional site information upon request to EPA
Reporting data template file
6.4 SampleReceipt
Field crews ship the QC and UNK voucher specimens to a central facility (“batching laboratory”) or the State’s QC laboratory. Periodically, the batching laboratory ship voucher specimens to the QC laboratory.
Under U.S. regulations, samples preserved in formalin are classified as “Dangerous Goods” and must be shipped according to hazardous material shipping requirements and regulations. Personnel receiving the shipment must be certified to handle hazardous material.
Because EPA initiates tracking procedures designed to recover any missing shipment, start the following login steps within 24 clock hours of receiving a delivery.
1. Report receipt of QC voucher samples (including digital images) in the NARS IM sample tracking
system (within 24 clock hours).
2. Inspect each QC voucher sample THE SAME DAY THEY ARE RECEIVED:
a. Verify that the sample IDs on the jar labels and the tag numbers in the shipment match
those recorded on the:
i. Chain of custody forms when the batching laboratory sends the samples to the QC
laboratory; or
ii. Sample tracking form if the field crew sends the shipment directly to the State QC
laboratory.
b. Verify that all jars for each sample are included in the shipment (i.e., there may be cases
where multiple jars are required to properly preserve specimens collected at a site).
c. Complete the Condition Code for each sample:
i. OK: Sample is in good condition
ii. C: Sample container was cracked
iii. L: Sample container is leaking

2013‐2014 National Rivers & Streams Assessment Laboratory Operations Manual
Version 1.3, May 2014 Page 76 of 224
76
FISH
VOUCHER
SPEC
IMEN
S
iv. ML: Sample label is missing
v. NP: Sample is not or insufficiently preserved
vi. S: Sample shipping problem
vii. Q: Other quality concerns, not identified above
d. A few samples may be preserved with ethanol or isopropyl alcohol rather than formalin. If
the crew used either of these, replace the preservative with formalin.
3. Store preserved samples at room temperature until identification begins.
4. Maintain the chain of custody or sample tracking forms with the samples.
5. Transfer any photovoucher images included in the shipment to a suitable office computer for
viewing.
a. Organize image files by site ID and then by file sequence.
b. The computer should have the graphics capability to view images in high‐resolution, and
regularly scheduled backup of files.
6. If necessary to support the identifications, request site information (e.g., site coordinates, state,
and river) for the samples from the NARS IM staff. You should receive a tabular file with this
information.
Table 6.1 Fish voucher: required data elements – login
FIELD FORMAT DESCRIPTION
LAB ID text Name or abbreviation for QC laboratory
DATE RECEIVED MMDDYY Date sample was received by lab
SITE ID text NRSA site id as used on sample label
VISIT NUMBER numeric Sequential visits to site (1 or 2)
SAMPLE ID numeric Sample id as used on field sheet (and on sample label)
TAG NUMBER numeric Tag number as used on field sheet (and on sample label)
DATE COLLECTED MMDDYY Date sample was collected
CONDITION CODE text Condition codes describing the condition of the sample upon arrival at the laboratory.
Flag Definition
OK Sample is in good condition
C Sample container is cracked
L Sample or container is leaking
ML Sample label is missing
NP Sample is not or insufficiently preserved
S Sample shipping problem (explain in QA_COMMENTS field)
Q Other quality concerns, not identified above
6.5 QCIdentification
The QC taxonomist identifies the common name at the lowest practical level, of the fish voucher specimens, or photovouchers, as described in the following steps. For each sample, the QC taxonomist will record the identifications on the bench sheet or in an electronic spreadsheet file. Figure 6.1 provides an example of a bench sheet that may be used. Before submitting the results to EPA, the laboratory staff must provide the required information using EPA’s data template (required codes are provided in Table 6.2). The steps are described below:

2013‐2014 National Rivers & Streams Assessment Laboratory Operations Manual
Version 1.3, May 2014 Page 77 of 224
77
FISH
VOUCHER
SPEC
IMEN
S
1. Process the QC voucher sample by voucher tag.
2. For preserved specimens:
a. Remove a bag of specimens from the jar. Record the voucher specimen tag number on the
bench sheet. Transfer the specimens from the bag to a dissecting tray. Arrange specimens
by size and/or potential taxon (if you think the tagged lot includes more than one taxon).
b. View each specimen to identify necessary diagnostic characters using:
i. Well‐lighted conditions; and
ii. A dissecting microscope, magnification 3.5X to 12X (larger fish may not require
magnification).
c. Vary lighting (reflected or transmitted) and specimen conditions (wet or dry), as needed, to
maximize the ability to observe different characters.
d. Dissect the specimen, if necessary, to observe internal characters. For example:
i. Remove pharyngeal teeth; or
ii. Incise abdomen to observe peritoneum or viscera.
3. For photovouchers:
a. For images of whole fish, examine size, color, and external characters. Use zoom feature to
enlarge specific areas of the image if necessary.
b. Some specimens may have multiple images that include close‐ups of specific morphological
features (e.g., mouthparts, fins, etc.).
c. Each image of a whole fish should have some kind of measurement scale reference (e.g.,
ruler). Use dividers to estimate proportional measurements based on the scale represented
in the image.
4. Unless thoroughly familiar with all regional species in the family (or genus), select appropriate
taxonomic literature to use as references in identifying the specimens based upon the
characters observed in the preceding steps. Appropriate references (see Walsh and Meador
[1998] for examples) include:
a. Keys or descriptions in up‐to‐date, regional faunal works (including online resources), such
as the references provided in Section 6.9 as examples;
b. Keys or descriptions in the most recent, accepted taxonomic revisions of individual groups;
c. Descriptions in other taxonomic studies, especially original descriptions.
d. Comparison with museum collections, if expert taxonomists consider the museum’s
identifications to be reliable.
e. If controversy exists for a particular taxon in the scientific literature, use the identification
consistent with recent publications.
5. Use the written descriptions and illustrations in determining the taxon. For example, consider if
the specimen has:
a. Diagnostic and other characters consistent with known characters for the taxon.
b. Size within known size ranges.
c. Site information data (e.g., geographic coordinates, drainage basin, stream or river name)
indicate the collecting locality that falls within the known range of the taxon.

2013‐2014 National Rivers & Streams Assessment Laboratory Operations Manual
Version 1.3, May 2014 Page 78 of 224
78
FISH
VOUCHER
SPEC
IMEN
S
6. If identifications are problematic or difficult (e.g., specimens or images do not contain fully
diagnostic characters), even after consulting the references in Step 4, consider the following
aspects:
a. Mature males in breeding condition present colors and/or tuberculation that can be used to
identify the taxon. Assume that their taxon identification applies to non‐breeding male and
female specimens with similar characters.
b. Mature specimens that have a more developed morphology can be used to identify the
taxon. Assume that their taxon identification applies to less developed specimens with
similar characters.
c. Location can be used as the basis of identification if the taxon is well‐studied or allopatric
(e.g., speciation that occurs when populations of the same species become isolated from
each other such that they do not occur in any one place together.)
d. Hybrids are typically detected by presence of diagnostic characters of two closely related
taxa.
e. Commonly‐stocked hybrids, such as muskellunge x northern pike (tiger muskie), or striped
bass x white bass (wiper), are diagnosed in many keys.
f. Backcrosses (i.e., progeny of crosses of hybrids and a parent species) may not be
distinguishable from the parent species on the basis of visual and partially dissected
characters. Because the evidence is consistent with non‐hybrid characters, assume that the
specimen is not a hybrid.
7. If you cannot confidently identify a specimen, consult with another taxonomist who specializes
in the group. If necessary, provide them with the specimen(s) and associated information.
8. Record the final identification(s) on the bench sheet or data submission worksheet.
a. Use common or scientific names from the NRSA master taxa list (APPENDIX D: OTHER
PERTINENT ATTACHMENTS).
b. For taxa that are not included on the master taxa list, provide the accepted name. Use the
common name if available and well‐recognized, scientific name if a common name is not
available or if it is less likely to be confused with other taxa. Provide the taxonomic
reference for the reported name in the Citation column of the submission worksheet e.g.,
Nelson et al. (2004), FishBase.org).
c. For hybrids that do not have accepted standard names (see 6.d.i above), record the
common name of both taxa (e.g., green sunfish x bluegill, cutthroat trout x rainbow trout).
Avoid using non‐specific terms.
9. If a tagged lot from the field turns out to include multiple taxa (assuming multiple individuals
were provided):
a. Record the name and count for one taxon on the current line of the bench sheet or
submission worksheet
b. Record the revised name for the second taxon as a new line on the bench sheet or the
submission worksheet.
i. Record the original existing specimen tag number on the next available blank line of the
submission worksheet.
ii. Mark as New Taxon. Record the new name.

2013‐2014 National Rivers & Streams Assessment Laboratory Operations Manual
Version 1.3, May 2014 Page 79 of 224
79
FISH
VOUCHER
SPEC
IMEN
S
c. Provide a comment for any taxa that could not definitively be identified using the list
provided by EPA. Here are examples of situations that require comments:
i. Specimen cannot be identified to the lowest level provided in the master taxa list
because:
1) State of preservation prevented observation of diagnostic characters (e.g., loss of
diagnostic characters prior to preservation).
2) Inconsistencies among or between diagnostic characters and other aspects (e.g.,
other characters, size, range, habitat).
3) Incomplete taxonomic or faunal knowledge for group in generally accepted
references (keys).
4) Other factors, explained in Comments column.
ii. Identification is tentative and based upon:
1) Review of digital images (this qualifier is only necessary if the digital image did not
provide enough information to make a definitive identification).
2) Identification was based upon other specimens (e.g., breeding males) in the sample
with similar characters.
3) Location or habitat information provided from NARS IM staff.
10. Check and correct the final common (or scientific) names recorded on the bench sheet or
submission worksheet for the following common problems.
a. Abbreviations
b. Extra information identifiers (e.g., sp., spp., , nr., cf., species A)
c. Extra characters (e.g., “?”)
d. Extraneous words (e.g., “probably”, “prob”, “may be”)
e. Common misspellings
f. Names not in the master list. Provide a taxonomic reference for these.
g. Incorrect citation or old name
11. Return the specimens to the bag along with the voucher tag. Place the bag back into the sample
jar. See Section 6.7 for retention requirements.
12. Select another bag and repeat Steps 1‐10.
13. If using bench sheets, transfer the information to the data submission worksheet file that EPA
has provided. The worksheet can be found at https://nars.sharefile.com/ in the NRSA 2013‐
2014/Data Templates folder. Table 6.2 identifies the contents and formats used by EPA’s file.
14. Save the submission worksheet file using the following convention: Taxonomist
name+affliation‐abbreviation+submission date (yyyymmdd).xlsx (e.g.,
JSmith_ABCfirm_20130615.xlsx).
15. Prepare a list of primary and secondary technical literature used in completing the
identifications (Step 4). Provide complete citations in bibliographic format, including authors’
names, date of publication, title of document, name of journal or publisher, volume and page
numbers, or ISBN number, as appropriate. If using on‐line resource, include a screen capture of
the URL/data source. Keep the references on file, and provide to EPA if requested.

2013‐2014 National Rivers & Streams Assessment Laboratory Operations Manual
Version 1.3, May 2014 Page 80 of 224
80
FISH
VOUCHER
SPEC
IMEN
S
Table 6.2 Fish voucher: required data elements – data submission worksheet
FIELD FORMAT DESCRIPTION
LAB ID text Name or abbreviation for QC laboratory
DATE RECEIVED text Date sample was received by lab
SITE ID text NRSA site ID code as recorded on sample label or tracking form
VISIT NUMBER numeric Sequential visits to site (1 or 2)
SAMPLE ID numeric 6‐digit Sample ID number as recorded on sample jar or tracking form
TAG NUMBER text Voucher tag number (01, 02, etc.) included with tagged lot (bag in sample jar) or digital image
DATE COLLECTED MMDDYY Date sample was collected
TAXONOMIST NAME text Name of QC taxonomist
DATE IDENTIFIED MMDDYY Date first specimen identified in sample
NEW TAXON Text (Y/blank) Indicates a new taxon identified from multiple taxon presented in a single tagged lot in the sample. This may or may not represent a new taxon to the NRSA master taxa list.
COMMON OR SCIENTIFIC NAME
text Unique common name from NRSA master taxa list (Appendix D). For taxa not included on the NRSA master taxa list, record the common or scientific name (whichever is more widely recognized and/or less ambiguous). Provide a citation for the reported name in the Citation column.
NUMBER OF INDIVIDUALS
numeric The number of individuals of taxa noted
CONDITION CODE text Condition codes associated with the condition of the sample upon arrival at the laboratory.
Flag Definition
OK Sample is in good condition
C Sample container is cracked
L Sample or container is leaking
ML Sample label is missing
NP Sample is not or insufficiently preserved
S Sample shipping problem (explain in QA_COMMENTS field)
UN Unknown. Specimen has been sent to expert taxonomist for definitive identification.
Q Other quality concerns, not identified above
DATA FLAG (if appropriate)
text Data qualifier codes associated with specific identifications of voucher samples. These codes provide more information that those used when reporting receipt of samples. A QC taxonomist may use alternative or additional qualifiers if definitions are provided to the external QC Coordinator as part of the submitted data package (e.g., as a separate worksheet page of the data submission file).
Flag Definition
CF Tentative identification due to inconsistent characters; no comprehensive reference for genus; etc. (explain in COMMENTS field)
DD Damaged Specimen
IM Young‐of year or too young/small to identify
L Identification based upon location
NP Not enough preservative used

2013‐2014 National Rivers & Streams Assessment Laboratory Operations Manual
Version 1.3, May 2014 Page 81 of 224
81
FISH
VOUCHER
SPEC
IMEN
S
UN Specimen/ or tagged lot could not be positively identified, even after consultations with other taxonomic specialists
Q Other quality concerns, not identified above
COMMENTS text Explanation for data flag(s) (if needed) or other comments regarding the taxon lot.
CITATION text Citation for reference used to identify organism, if taxon not present in
NRSA list of fish names (APPENDIX D: OTHER PERTINENT ATTACHMENTS)
6.6 AssistanceVisits
The External QC Officer may arrange for an assistance visit to one or more QC taxonomists. Assistance visits are intended to familiarize EPA with actual procedures being implemented by different QC taxonomists; and to ensure a clear and consistent understanding of procedures and activities by both EPA and QC taxonomists. If EPA decides to conduct an assistance visit, a qualified EPA scientist or contractor will administer a checklist based upon the steps described in this chapter. A checklist will be developed and attached to the LOM before conducting an assistance visit.
6.7 SampleandRecordRetention
The laboratory shall retain:
1. The sample materials for a minimum of 3 years from the date the EPA publishes the final report.
During this time, the laboratory shall store the materials in a cool location away from sunlight.
The laboratory shall periodically check the sample materials for degradation and refill jars with
preservative if necessary.
2. Original records, including laboratory notebooks and the reference library, for a minimum of 10
years from the date that EPA publishes the final report.
After the stated time periods, the laboratory shall follow its internal protocols for disposal.
6.8 SummaryofQCRequirementsforFishVoucherSpecimens
Percent taxonomic disagreement (PTD): measure of taxonomic precision comparing the number of agreements (positive comparisons, comppos) of the field taxonomist and QC taxonomist. In the following equation, N is the total number of specimens in the larger of the two counts. PTD should be ≤15%.
1001
N
compPTD pos
Table 6.3 Fish voucher: measurement data quality objectives
Variable or Measurement Precision Accuracy Completeness
Identification 85% a 85% a 99%a As measured by (100%‐PTD)
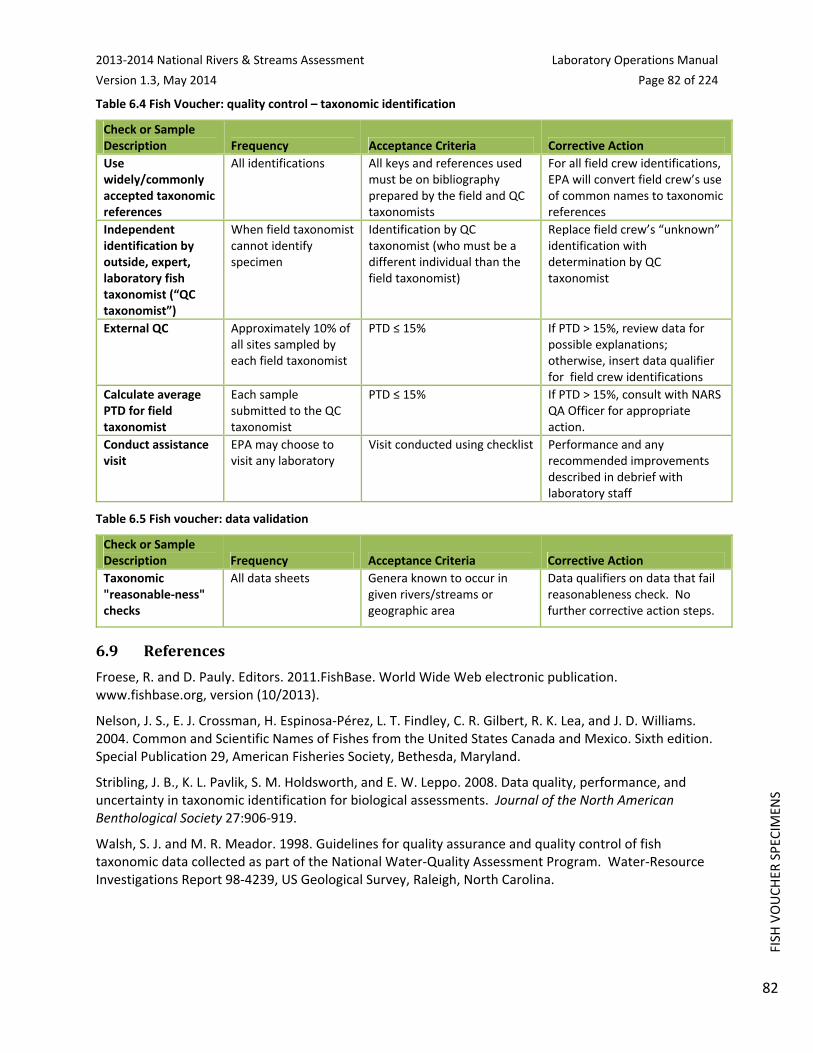
2013‐2014 National Rivers & Streams Assessment Laboratory Operations Manual
Version 1.3, May 2014 Page 82 of 224
82
FISH
VOUCHER
SPEC
IMEN
S
Table 6.4 Fish Voucher: quality control – taxonomic identification
Check or Sample Description Frequency Acceptance Criteria Corrective Action
Use widely/commonly accepted taxonomic references
All identifications All keys and references used must be on bibliography prepared by the field and QC taxonomists
For all field crew identifications, EPA will convert field crew’s use of common names to taxonomic references
Independent identification by outside, expert, laboratory fish taxonomist (“QC taxonomist”)
When field taxonomist cannot identify specimen
Identification by QC taxonomist (who must be a different individual than the field taxonomist)
Replace field crew’s “unknown” identification with determination by QC taxonomist
External QC Approximately 10% of all sites sampled by each field taxonomist
PTD ≤ 15% If PTD > 15%, review data for possible explanations; otherwise, insert data qualifier for field crew identifications
Calculate average PTD for field taxonomist
Each sample submitted to the QC taxonomist
PTD ≤ 15% If PTD > 15%, consult with NARS QA Officer for appropriate action.
Conduct assistance visit
EPA may choose to visit any laboratory
Visit conducted using checklist Performance and any recommended improvements described in debrief with laboratory staff
Table 6.5 Fish voucher: data validation
Check or Sample Description Frequency Acceptance Criteria Corrective Action
Taxonomic "reasonable‐ness" checks
All data sheets Genera known to occur in given rivers/streams or geographic area
Data qualifiers on data that fail reasonableness check. No further corrective action steps.
6.9 References
Froese, R. and D. Pauly. Editors. 2011.FishBase. World Wide Web electronic publication. www.fishbase.org, version (10/2013).
Nelson, J. S., E. J. Crossman, H. Espinosa‐Pérez, L. T. Findley, C. R. Gilbert, R. K. Lea, and J. D. Williams. 2004. Common and Scientific Names of Fishes from the United States Canada and Mexico. Sixth edition. Special Publication 29, American Fisheries Society, Bethesda, Maryland.
Stribling, J. B., K. L. Pavlik, S. M. Holdsworth, and E. W. Leppo. 2008. Data quality, performance, and uncertainty in taxonomic identification for biological assessments. Journal of the North American Benthological Society 27:906‐919.
Walsh, S. J. and M. R. Meador. 1998. Guidelines for quality assurance and quality control of fish taxonomic data collected as part of the National Water‐Quality Assessment Program. Water‐Resource Investigations Report 98‐4239, US Geological Survey, Raleigh, North Carolina.
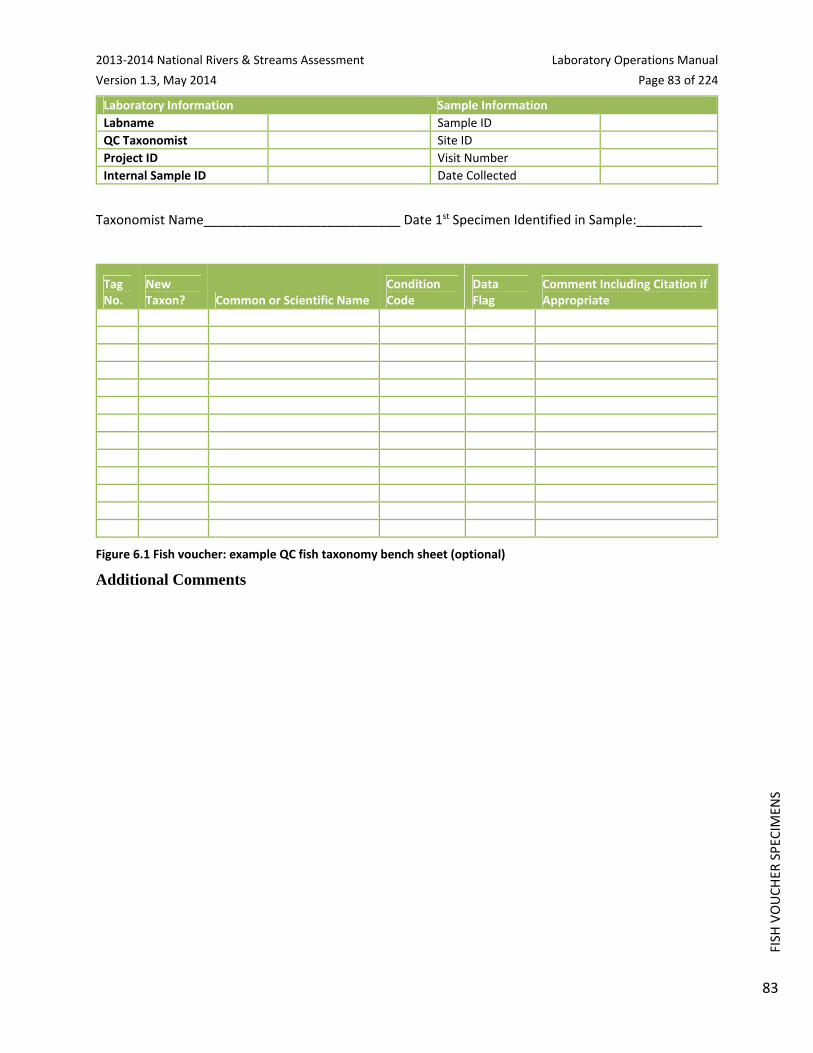
2013‐2014 National Rivers & Streams Assessment Laboratory Operations Manual
Version 1.3, May 2014 Page 83 of 224
83
FISH
VOUCHER
SPEC
IMEN
S
Laboratory Information Sample Information
Labname Sample ID
QC Taxonomist Site ID
Project ID Visit Number
Internal Sample ID Date Collected
Taxonomist Name___________________________ Date 1st Specimen Identified in Sample:_________
Tag No.
New Taxon? Common or Scientific Name
Condition Code
Data Flag
Comment Including Citation if Appropriate
Figure 6.1 Fish voucher: example QC fish taxonomy bench sheet (optional)
Additional Comments

2013‐2014 National Rivers & Streams Assessment Laboratory Operations Manual
Version 1.3, May 2014 Page 84 of 224
84
FISH
TISSU
E FILLET
(Whole Fish Collection)
7.0 FISHTISSUEFILLET(WHOLEFISHCOLLECTION)Laboratory Methods incorporated in OST Manuals.

2013‐2014 National Rivers & Streams Assessment Laboratory Operations Manual
Version 1.3, May 2014 Page 85 of 224
85
FISH
TISSU
E PLU
G
8.0 FISHTISSUEPLUGThis procedure is applicable to the analysis of mercury in fish tissue plugs. The method is performance based. Laboratories may use any method that meets the requirements below to analyze the fish tissue samples (for example, EPA Method 1631). Example SOPs are provided in APPENDIX F: EXAMPLE SOPs FOR MERCURY IN FISH TISSUE PLUG ANALYSES.
Table 8.1 Fish tissue plug: measurement data quality objectives
Variable or Measurement MDL Quantitation Limit
Mercury 0.47 ng/g 5.0 ng/g
Table 8.2 Fish tissue plug: quality control
Activity Evaluation/Acceptance Criteria Corrective Action
Demonstrate competency for analyzing fish samples to meet the performance measures
Demonstration of past experience with fish tissue samples in applying the laboratory SOP in achieving the method detection limit
EPA will not approve any laboratory for NRSA sample processing if the laboratory cannot demonstrate competency. In other words, EPA will select another laboratory that can demonstrate competency for its NRSA samples.
Check condition of sample when it arrives.
Sample issues, such as punctures or rips in wrapping; missing label; temperature; adherence to holding time requirements; sufficient volume for test. All samples should arrive at the laboratory frozen.
Assign appropriate condition code identified in Appendix 3.
Store sample appropriately. While stored at the laboratory, the sample must be kept at a maximum temperature of ‐20o C.
Check the temperature of the freezer per laboratory’s standard operating procedures.
Record temperature of sample upon arrival at the laboratory. If at any other time, samples are warmer than required, note temperature and duration in comment field.
Analyze sample within holding time
The test must be completed within the holding time (i.e., 1 year). If the original test fails, then the retest also must be conducted within the holding time.
Perform test, but note reason for performing test outside holding time. EPA expects that the laboratory will exercise every effort to perform tests before the holding time expires.
Maintain quality control specifications from selected method/SOP (that meets the measurement data quality objectives)
Data meet all QC specifications in the selected method/SOP.
If data do not meet all QC requirements, rerun sample or qualify data. If the lab believes the data are to be qualified without rerunning sample, the lab must consult with the EPA Survey QA Lead before proceeding.
Maintain the required MDL Evaluate for each sample If MDL could not be achieved, then provide dilution factor or QC code and explanation in the comment field.
Use consistent units for QC samples and field samples
Verify that all units are provided in wet weight units and consistently
If it is not possible to provide the results in the same units as most other analyses, then assign a QC code and describe the reason for different units in the comments field of the database.

2013‐2014 National Rivers & Streams Assessment Laboratory Operations Manual
Version 1.3, May 2014 Page 86 of 224
86
FISH
TISSU
E PLU
G
Maintain completeness Completeness objective is 95% for all parameters.
Contact the EPA Survey QA Lead immediately if issues affect laboratory’s ability to meet completeness objective.

2013‐2014 National Rivers & Streams Assessment Laboratory Operations Manual
Version 1.3, May 2014 Page 87 of 224
87
PER
IPHYTON
9.0 PERIPHYTONThis procedure is applicable to the analysis of the diatom and soft algal components of algal samples collected for the National Rivers and Streams Assessment (NRSA) 2013‐2014. NRSA field crews collect composite samples of the algae present on benthic and vegetative surfaces; preserve samples with formalin to obtain a pH of 7; and ship the samples to a central holding facility or directly to a state laboratory. Each 50mL composite sample contains both diatoms and soft algae from benthic and vegetative surfaces. This procedure describes the steps for identifying and enumerating periphyton organisms in the samples and has been adapted from Protocols for the analysis of algal samples collected as part of the U.S. Geological Survey National Water‐Quality Assessment program (Charles et al., 2002).
In the following discussion, Sections 9.1, 9.2, and 9.3 summarize the procedure; health and safety concerns; and required resources. Section 9.4 provides the steps for acknowledging sample receipt. Section 9.5 provides the steps for subsampling and preparing the vials for the diatom and soft algal analyses. Section 9.6 provides the steps for the diatom cleaning and slide mounting. Section 9.7 describes the steps for diatom and all algal analyses. Sections 9.8 and 9.9 provide the steps for the data entry, and sample and record retention. Section 9.10 describes EPA’s external quality control evaluation. Section 9.11 identifies references used in developing the procedure. The Attachment summarizes the quality control measures.
9.1 SummaryofProcedure
The procedure describes the extraction and separate analysis of the two subsamples of: 1) diatoms and 2) composite algae consisting of soft algae and diatoms. Figure 9.1 provides a graphical summary of the procedure.
As described in Section 9.5, laboratory personnel subsample the liquid portion by volume and separate the heavier material that is difficult to suspend by mass. This step removes (oxidizes) organic matter from the siliceous frustules of diatoms and other material such as the soft algae in the subsample. Removing the organic matter is necessary so that all details of diatom structures essential to taxonomic identification are clearly visible.
As described in Section 9.6, laboratory personnel prepare slides by cleaning and mounting materials for identification and enumeration of diatoms. The laboratory technician mounts the cleaned material between a microscope slide and coverslip using a mounting medium with a high refractive index. With slides prepared with the mounting medium, the features of diatom frustules or valves are clearly visible at high magnification. The distribution of specimens on the final mounted coverslips will represent the samples contained within the cleaned material vials.
Also as described in Section 9.6, taxonomists spend a maximum of 8 hours to perform the diatom subsample analysis to estimate the proportion of diatom taxa found in a count of 600 valves (i.e., one‐half of an individual diatom cell). For each observed species in the diatom subsample analysis, the taxonomist must verify that the laboratory’s NRSA library includes the average biovolume measurement and a photograph.
As described in Section 9.7, the taxonomists identify, count, document, and measure all algae. Often this protocol is referred to as the soft‐algal count because of the emphasis on identification of non‐diatom algae. For this reason, this document refers to “soft algae” instead of “all algae.” The procedure is designed to provide data on algal densities and amount of algal biovolume. It is the same procedure used by NRSA in 2008‐2009.

2013‐2014 National Rivers & Streams Assessment Laboratory Operations Manual
Version 1.3, May 2014 Page 88 of 224
88
PER
IPHYTON
Figure 9.1 Periphyton: summary of procedure for identifying soft algae and diatoms
9.2 HealthandSafetyWarnings
In addition to the laboratory’s usual requirements, personnel must implement the following health and safety procedures for this procedure:
1. Wear or apply proper personal protection clothing and equipment (e.g. lab coat, protective
eyewear, gloves).
2. When working with potential hazardous chemicals (e.g. a mounting medium with a high
refractive index such as Naphrax™) or biological agents (algae and sediments), avoid inhalation,
skin contact, eye contact, or ingestion. If skin contact occurs, remove clothing immediately,
wash, and rinse the affected skin areas thoroughly with large amounts of soap and water.
Palmer‐Maloney Prep (soft algae)

2013‐2014 National Rivers & Streams Assessment Laboratory Operations Manual
Version 1.3, May 2014 Page 89 of 224
89
PER
IPHYTON
9.3 DefinitionsandRequiredResources(Laboratory,Personnel,andEquipment)
This section provides definitions and required resources for using this procedure. Section 9.3.1 defines the terms used throughout the procedure. Section 9.3.2 describes the expertise required for each laboratory using the procedure. Section 9.3.3 describes the roles and responsibilities of the personnel involved in the procedure. Section 9.3.4 identifies the equipment necessary to apply the procedure in preparing, sorting, and identifying algal samples.
9.3.1 Definitions
The procedure uses the following terms:
ANC: Academy of Natural Sciences
Biovolume: refers to the volume of algal cells.
Burn Mount: Rarely used. Refers to a procedure where a known portion of the untreated sample is dripped onto a coverslip and allowed to dry at room temperature and then placed on hot plate.
DCF: Dilution/Concentration Factor.
Digestion refers to the solubilization of organic material by strong acid oxidation.
Frustules are the siliceous, inorganic component (SiO2) of diatom cells. Each diatom cell is composed of a frustule and organic cytoplasm. The frustule is composed of two valves. The taxonomist uses the features of the frustule to identify the taxon.
NARS: National Aquatic Resource Surveys. The National Rivers and Streams Assessment (NRSA) is part of the NARS program.
NARS Information Management (IM) System: The NARS IM system established to support all surveys, including NRSA, in the NARS program. The NARS IM system is used to track the samples from field collection to the laboratory.
Natural counting unit. Algae grow unicellularly or in multicellular filaments and colonies. Each natural grouping of algae (i.e., each individual filament, colony, or isolated cell) is defined as a natural counting unit. Diatoms are an exception; each diatom cell is always considered a natural counting unit, even if attached to other cells. The main purpose of using ‘natural counting units’ is to prevent a colonial or filamentous form from dominating a count. It also facilitates the counting of algal forms which have linked cells that may be hard to distinguish.
NRSA: National Rivers and Streams Assessment. The samples were collected during the field stage of NRSA.
Organic matter: Material that is capable of decay or the product of decay (e.g., leaves, sticks, algae).
Palmer‐Maloney Fraction. A diluted or concentrated sample derived from the original sub‐sample and used for the Palmer‐Maloney count described in Section 9.7.
Reverse Osmosis (RO) is a membrane‐technology filtration method that removes many types of large molecules and ions from solutions by applying pressure to the solution when it is on one side of a selective membrane.
Percent Difference (PctDiff) is a measure for soft algae that compares the enumerations for the taxa within a sample, as reported by the primary taxonomist (a) and secondary taxonomist (b) as follows:
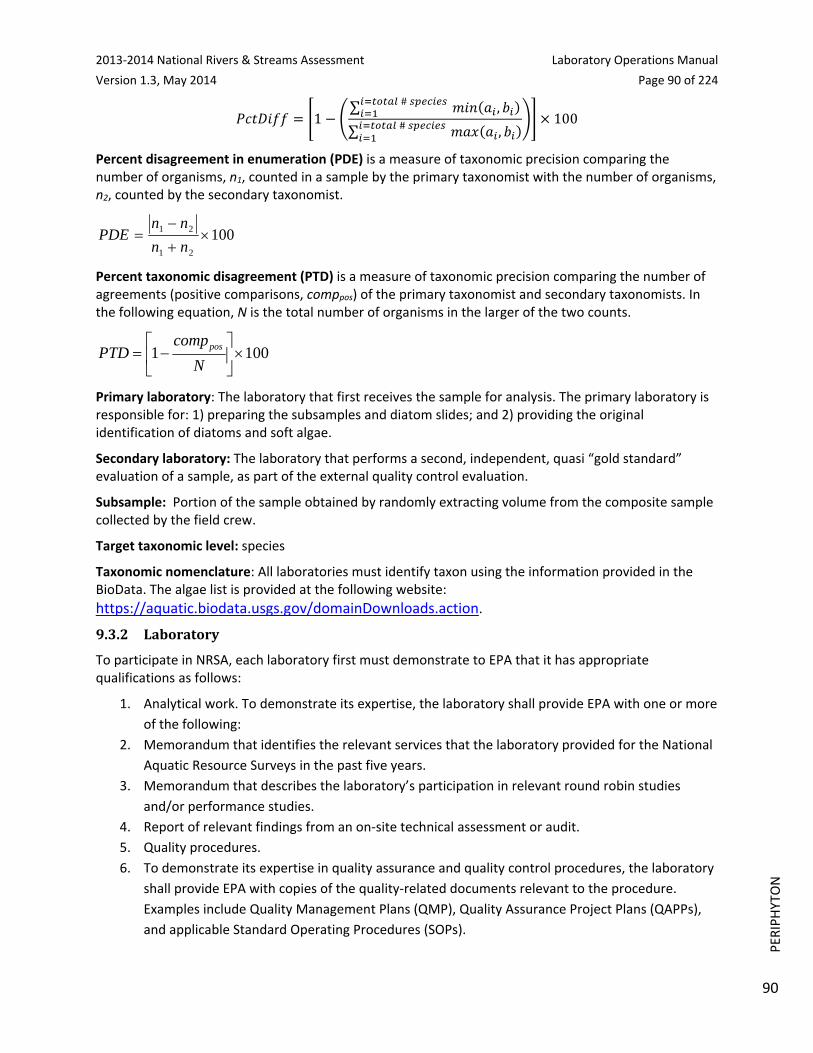
2013‐2014 National Rivers & Streams Assessment Laboratory Operations Manual
Version 1.3, May 2014 Page 90 of 224
90
PER
IPHYTON
1∑ ,#
∑ ,# 100
Percent disagreement in enumeration (PDE) is a measure of taxonomic precision comparing the number of organisms, n1, counted in a sample by the primary taxonomist with the number of organisms, n2, counted by the secondary taxonomist.
10021
21
nn
nnPDE
Percent taxonomic disagreement (PTD) is a measure of taxonomic precision comparing the number of agreements (positive comparisons, comppos) of the primary taxonomist and secondary taxonomists. In the following equation, N is the total number of organisms in the larger of the two counts.
1001
N
compPTD pos
Primary laboratory: The laboratory that first receives the sample for analysis. The primary laboratory is responsible for: 1) preparing the subsamples and diatom slides; and 2) providing the original identification of diatoms and soft algae.
Secondary laboratory: The laboratory that performs a second, independent, quasi “gold standard” evaluation of a sample, as part of the external quality control evaluation.
Subsample: Portion of the sample obtained by randomly extracting volume from the composite sample collected by the field crew.
Target taxonomic level: species
Taxonomic nomenclature: All laboratories must identify taxon using the information provided in the BioData. The algae list is provided at the following website:
https://aquatic.biodata.usgs.gov/domainDownloads.action.
9.3.2 Laboratory
To participate in NRSA, each laboratory first must demonstrate to EPA that it has appropriate qualifications as follows:
1. Analytical work. To demonstrate its expertise, the laboratory shall provide EPA with one or more
of the following:
2. Memorandum that identifies the relevant services that the laboratory provided for the National
Aquatic Resource Surveys in the past five years.
3. Memorandum that describes the laboratory’s participation in relevant round robin studies
and/or performance studies.
4. Report of relevant findings from an on‐site technical assessment or audit.
5. Quality procedures.
6. To demonstrate its expertise in quality assurance and quality control procedures, the laboratory
shall provide EPA with copies of the quality‐related documents relevant to the procedure.
Examples include Quality Management Plans (QMP), Quality Assurance Project Plans (QAPPs),
and applicable Standard Operating Procedures (SOPs).

2013‐2014 National Rivers & Streams Assessment Laboratory Operations Manual
Version 1.3, May 2014 Page 91 of 224
91
PER
IPHYTON
7. To demonstrate its ongoing commitment, the person in charge of quality issues for the
laboratory shall sign the NRSA QAPP Certification Page.
8. Reporting standardized data.
9. To demonstrate its expertise, the laboratory shall provide EPA with a memorandum that
confirms that the laboratory has a computerized Laboratory Information Management System
(LIMS) that is routinely used to track samples and record laboratory results.
10. To demonstrate its ongoing commitment to use LIMS, the memorandum also shall confirm that
the laboratory will use LIMS to record and report results from the procedure.
9.3.3 LabPersonnel
Any person who has received training in processing and identification of algae may use the procedure; however, the work is generally parsed out to several personnel:
Quality Control (QC) Officers provide oversight of daily operations, sample processing, monitors QC activities to determine conformance, and conducts performance and systems audits of the procedures. The procedure has separate responsibilities for the:
Internal QC Taxonomist is a senior taxonomist at the laboratory who has at least 10 years of
experience in analyzing algal samples.
External QC Coordinator is an EPA staff person who manages the QC contractor. Because the
assigned duties are primarily administrative in nature, the External QC Coordinator is not
required to have laboratory experience, although such experience would be preferable.
Taxonomists are trained, and have considerable experience, in identifying algae, i.e., taxonomy. It is also important that the taxonomist maintains contact with other taxonomists through professional societies and other interactions, and keeps up with the pertinent literature, since systematics and species identifications change over time. Each laboratory must submit the resume or curriculum vitae for the taxonomists who analyze NRSA samples.
Algal Analysts are taxonomists who specialize in the identification of algal specimens.
Diatom Analysts, or diatomists, are taxonomists who specialize in the identification of diatoms.
Lab Technicians are technicians who have basic training in laboratory procedures.
9.3.4 Equipment/Materials
The procedure requires the following equipment and materials for sample preparation (subsampling) and taxonomic identifications:
9.3.4.1 SubsamplingEquipment/Materials(Section9.5)
Distilled (DW) or reverse osmosis (RO) water
Dispenser bottle for DW or RO water
Beakers
Beaker holding box (24 slots)
Graduated cylinders
Vials with 1 mL intervals marked on it for measuring volumes
Positive‐draw fume hood

2013‐2014 National Rivers & Streams Assessment Laboratory Operations Manual
Version 1.3, May 2014 Page 92 of 224
92
PER
IPHYTON
Screen cloth (210‐um mesh)
Screening apparatus
Large plastic disposable weighing boats
Analytical balance, capacity to 500 g, 0.2 g accuracy
Spatulas
Plastic disposable pipettes (tips of plastic pipettes can be cut)
Small turkey baster
9.3.4.2 Diatoms
9.3.4.2.1 CleaningEquipment/Materials(Section9.6DiatomCleaningandMounting)See equipment and materials identified in ANS Protocol P‐13‐42 “Diatom Cleaning by Nitric Acid
Digestion with a Microwave Apparatus” (http://diatom.ansp.org/nawqa/pdfs/P‐13‐42.pdf)
9.3.4.2.2 PreparationofDiatomSlides(Section9.6) Corning ceramic‐top hot plate with temperature control
Positive‐draw chemical hood
Aluminum drying plate (25.5 x 20.0 x 0.5 cm, solid aluminum; lines forming 48 squares, each 3.2
cm on a side, are etched on the surface. Each square is etched with an identifying number)
Glass microscope slides (1 x 3 inches; 2.5 x 7.5 cm)
Glass coverslips (18 mm x 18 mm or 22 mm x 22 mm) ‐ No. 1 thickness, stored in covered glass
jar filled with 100 % ethanol.
Mounting medium with a high refractive index (e.g., Zrax, Naphrax)
Diamond scribe
Disposable plastic pipettes
Adjustable pipettor (0 ‐ 250μl); adjustable pipettor (200 ‐ 1000μl)
Pipette tips for adjustable pipettors
Round‐style tooth picks
Forceps
Polished, rounded wooden splints
Wash bottle filled with distilled (DW) or reverse osmosis (RO) water
Single‐edged razor blades
Ethanol, 70%
Acetone
Tissues (e.g., Kimwipe®)
Slide labels
Wax (the kind commonly used for candle making and canning foods)
10% HCl
9.3.4.2.3 AnalysisofDiatoms(Section9.7AnalysisofDiatomsandSoftAlgae) Compound microscope with transmitted light including:
o Objective lenses of at minimum (10x, 40x, 100x)
o Oil immersion objective (100x) with a minimum numerical aperture of 1.3

2013‐2014 National Rivers & Streams Assessment Laboratory Operations Manual
Version 1.3, May 2014 Page 93 of 224
93
PER
IPHYTON
o Substage condenser lens with a minimum numerical aperture of 1.3
o Ocular lenses of 10‐15x
o DIC (differential interference contrast) illumination
o Diamond objective marker mounted on the objective turret
o 100 watt halogen illumination, or equivalent
o Digital camera
9.3.4.3 Softalgae(Section9.7)
Compound microscope with 20x objective for a total system magnification of 200x and 40‐45x
objectives for a total system magnification of 400‐450x.
Glass microscope coverslips, rectangular, 26 x 60 mm, #1 thickness.
Glass, wide‐bore pipettes > 1 mm inside diameter, or eye‐dropper.
Two Palmer‐Maloney Counting Cells with ceramic chamber (chamber depth of 0.4 mm; volume
of 0.1 mL) or metal chambers
Glass Pasteur pipettes, 5.25 inch, ≤ 1 mm diameter.
Glycerin
Digital camera
9.4 SampleReceipt
Under U.S. regulations, shippers must classify samples preserved in formalin as “Dangerous Goods” and handle according to hazardous material shipping requirements. At the laboratory, only personnel certified to handle hazardous material can receive the hazardous samples. Because EPA initiates tracking procedures designed to recover any missing shipment, the laboratory personnel start the following login steps within 24 clock hours of receiving a delivery.
1. Record receipt of samples in the NARS IM system (within 24 clock hours) and the Laboratory’s
Information Management System (LIMS). Assign the appropriate chronological bench number to
each sample.
2. Inspect each jar THE SAME DAY THEY ARE RECEIVED:
a. Verify that the site identification and sample number on the label also appear on the chain
of custody form in the shipment.
b. Notify the NARS IM team if any jars were broken and/or if there are discrepancies between
the custody form and the 50 mL bottles.
c. Verify that the bottles contain enough formalin. If not, then:
i. Add 2 mL of a 10% formalin solution
ii. Continue to add, if necessary, increments of 2 mL of the solution. Check after each
addition to determine if additional solution is required.
iii. Record the amount of solution added to the bottle in the Comments_Arrival field of
the Login spreadsheet (Table 9.1).
3. Maintain the chain‐of‐custody form with the samples; it will be needed if the samples are
transported to any other location (e.g., for taxonomic identification, external QC evaluation).
4. Verify that the login information includes the required data elements in Table 9.1. After
completing all required elements, provide the information to the data entry personnel.

2013‐2014 National Rivers & Streams Assessment Laboratory Operations Manual
Version 1.3, May 2014 Page 94 of 224
94
PER
IPHYTON
Table 9.1 Periphyton: required data elements – login
FIELD FORMAT DESCRIPTION
LAB_ID text Name or abbreviation for QC laboratory
DATE_RECEIVED MMDDYY Date sample was received by lab
SITE_ID text NRSA site id as used on sample label
VISIT_NUMBER numeric Sequential visits to site (1 or 2)
SAMPLE_ID numeric Sample id as used on field sheet (on sample label)
DATE_COLLECTED MMDDYY Date sample was collected
CONDITION_CODE text Condition codes describing the condition of the sample upon arrival at the laboratory.
CODE Definition
OK Sample is in good condition
C Sample container is cracked
HM Sample contains heavy amounts of sand, silt, or other heavy material that may interfere with the algal analysis
L Sample or container is leaking
TL Too little sample left for the procedure
ML Sample label is missing
PA Preservative added, add amount in comments field
Q Other quality concerns, not identified above
FORMALIN_ADDED numeric If the laboratory added formalin to the bottle, provide the amount in milliliters. If no formalin was added, then the value should be zero or blank.
COMMENTS_ARRIVAL text Any comments about the condition of the sample upon arrival.
9.5 SamplePreparation(Subsampling)
This section describes the steps to prepare subsamples from samples that have relatively small amounts of sand, silt, or other heavy material. EPA modified the following steps from ANS Protocol P‐13‐48 “Subsampling Procedures for USGS NAWQA Program Periphyton Samples” (http://diatom.ansp.org/nawqa/pdfs/P‐13‐48.pdf). If a sample contains large amounts of sand, silt, or other heavy material that the technicians determines could interfere with algal analysis, the technician should consult ANS P‐13‐48 for additional guidance (see Step 7.5).
In preparing the subsamples, the laboratory technician shall:
1. Abide by the following Safety Precautions:
a. Wear safety glasses, protective gloves and lab coats at all times when handling concentrated
samples with formalin.
b. Use a positive‐draw fume hood at all times to avoid exposure to formalin.
2. Keep the laboratory room and bench surfaces as clean as possible and free of debris to avoid
cross‐contamination of samples.
3. Verify that all necessary supplies and equipment are available. See Section 9.3.4 for
recommended supplies and equipment.
4. Examine the condition of the sample. If it leaked in transit, and thus, the bottle contains less
than the required 50 mL:
a. If more than 20 mL remains:

2013‐2014 National Rivers & Streams Assessment Laboratory Operations Manual
Version 1.3, May 2014 Page 95 of 224
95
PER
IPHYTON
i. Reduce the volume sub‐sampled for soft algal analysis as required. The minimum for
any sub‐sample, either for diatom side preparation of soft algae analysis, is 10 mL.
ii. Advise the algae analyst of any reductions in sample volume on handover of the
samples.
b. Otherwise, report the sample as ‘lost’ at login (Section 9.4).
5. Decide how much to subsample for soft algae and diatoms. This is somewhat of a judgment call,
but, generally, for:
a. Diatoms: Subsample at least 20 mL.
b. Soft algae: Subsample at least 10 mL for soft algae. If the sample is very silty, it will be better
to subsample a minimum of 10 mL for soft algae, whereas if the sample looks clear, at least
20 mL is recommended
c. Always save a small portion of the initial sample, even for soft algae, in case the taxonomist
needs a “burn mount” as described in Section 9.6.
d. Record the volumes in the vials.
6. Select graduated cylinders of appropriate size for measuring subsamples. Verify that:
a. the desired subsample volume will be at least one‐third the capacity of the graduated
cylinder; and
b. the units of the graduated cylinder will allow estimation to the nearest milliliter.
7. Separate the sample into 2 subsamples as follows:
a. Suspend the algal material by shaking or swirling the sample
b. Obtain two subsamples by selecting a method that allows a representative subsample. Two
possible methods include:
i. Carefully pour the determined amount of subsample into a graduated cylinder.
Ensure the sample stays well mixed during subsampling.
ii. Use a wide‐bore pipette or turkey baster, which allows pumping the pipette or
baster to mix the sample, while withdrawing an aliquot of sample. Take multiple
aliquots with the turkey baster to ensure a representative draw. Filaments and
debris will block pipettes with small openings. Careful pouring or turkey basters may
be more appropriate.
1. Transfer each subsample to a vial. Label each of the two vials (i.e., one for diatoms and the other
for soft algae) with a different Vial ID# using the sample number plus a “D” or “S.” For each vial,
record the Vial ID, subsample volume, and intended analysis (i.e., diatom or soft algae).
2. If the laboratory intends to ship any vial to another location, pack it carefully for shipping and
include the appropriate custody forms.
Verify that the subsampling information includes the required data elements in

2013‐2014 National Rivers & Streams Assessment Laboratory Operations Manual
Version 1.3, May 2014 Page 96 of 224
96
PER
IPHYTON
Table 9.2. After completing all required elements, provide the information to the data entry personnel.

2013‐2014 National Rivers & Streams Assessment Laboratory Operations Manual
Version 1.3, May 2014 Page 97 of 224
97
PER
IPHYTON
Table 9.2 Periphyton: required data elements – subsampling
FIELD FORMAT DESCRIPTION
LAB_ID text Name or abbreviation for QC laboratory
SITE_ID text NRSA site id as used on sample label
VISIT_NUMBER numeric sequential visits to site (1 or 2)
SAMPLE_ID numeric sample id as used on field sheet (on sample label)
VIAL_ID numeric or text Laboratory assigned ID to the vial holding the subsample
SAMPLE_VOLUME numeric Total volume of sample before any processing (from the sample label)
SUBSAMPLE_VOLUME numeric Volume of subsample in the vial
PURPOSE D/S Codes indicating whether the vial will be used for the diatom or soft algal analyses .
CODE Definition
D Diatom Analysis
S Soft Algal Analysis
DESTINATION text Name of the receiving laboratory (i.e., if the vial will be shipped to another location)
COMMENTS_SUBSAMPLE text any comments about the subsampling
9.6 DiatomCleaningandMounting
The diatom cleaning steps remove both extracellular and intracellular organic material by digesting it with nitric acid. After removing the organic matter, all details of diatom structures essential to taxonomic identification should be clearly visible. To clean the diatoms, the laboratory technician may follow the cleaning steps in ANS Protocol P‐13‐42 “Diatom Cleaning by Nitric Acid Digestion with a Microwave Apparatus” (http://diatom.ansp.org/nawqa/pdfs/P‐13‐42.pdf) or the following nitric acid cleaning method:
1. Place the subsample of material for diatoms in a 250 mL beaker.
2. Place the beaker in a positive draw hood. Carefully add 50 mL of concentrated nitric acid.
3. Simmer on a hot plate or warmer for about 3 hours or until organic matter has dissolved. If small
bits of coarser debris remain after acid‐cleaning, they can be rinsed and removed at a later time
with forceps.
4. Rinse the diatoms in the cleaned sample repeatedly to remove the nitric acid by repeatedly
adding deionized water to the cleaned diatom sample to fill the beaker, letting the diatoms
settle to the bottom, and then siphoning the water from the beaker before refilling again. This
method is similar to instructions by ANSP, but draw from center of the water column, not the
top. Also gently spin beakers and sprinkler water on the surface with a squirt bottle about
midway through settling to dislodge diatoms adsorbed onto the water surface and sides of
beakers (remember surface tension). We recommend using 1200 mL tall beakers.
5. Let samples in these beakers settle for a total of 8 hours or more.
6. After settling and no additional disturbance of the diatoms on the bottom of the beaker, slowly
and carefully siphon water with a fine tip glass pipette, like a Pasteur pipette. Usually, 20 mL
should be left above the settled diatoms in a 1200 mL tall beaker to minimize siphoning and
discarding diatoms that were adsorbed to the beaker sides or bottom, or even the water
surface. Be certain to avoid siphoning diatoms from the bottom. Watch for diatoms to move

2013‐2014 National Rivers & Streams Assessment Laboratory Operations Manual
Version 1.3, May 2014 Page 98 of 224
98
PER
IPHYTON
from the water surface, sides or bottom of the beaker toward the pipette tip. Quickly remove
the pipette from the water if clouds of suspended diatoms move toward the pipette tip. Rinse
the pipette with a squirt bottle between samples.
7. Concentrate the cleaned diatom suspension to a volume appropriate for mounting on slides by
settling into smaller and smaller containers.
After cleaning the materials, the laboratory technician produces high‐quality diatom mounted slides from the cleaned diatom material. EPA modified the following cleaning steps in ANS Protocol P‐13‐49 “Preparation of Diatom Slides Using NaphraxTM Mounting Medium” (http://diatom.ansp.org/nawqa/pdfs/P‐13‐49.pdf).
To produce the slides, the laboratory technician shall:
1. Abide by the following Safety Precautions:
a. Wear safety glasses, protective gloves and lab coats at all times when handling liquid and/or
solidified mounting medium. For example, Naphraxb is a hazardous substance because it contains toluene, which volatilizes readily when heated.
b. Use a positive‐draw fume hood at all times for heating of the mounting medium.
c. Use extreme care when manipulating slides on the hot plate and when working close to the
hot plate. Hot plate temperatures required for this procedure are high enough to cause
severe burning of exposed skin.
2. Follow lab practices similar to those used for sterile experiments (bacteriological plating, etc.) to
reduce the risk of cross contamination of samples. At a minimum:
a. Keep the laboratory room and bench surfaces as clean as possible and free of debris.
b. Use disposable pipettes, stirrers, etc. where feasible.
c. Rinse glass (non‐disposable) pipettes, stirrers, etc. in DW or RO water at least three times
after each sample. (Explanatory note: at times, tap water, because of algal blooms and use
of diatomaceous earth filters, may contain diatoms.)
d. Dry all equipment before storing it. This step prevents growth of algae and fungi.
3. Verify that all necessary equipment is available. See Section 9.3.4 for recommended supplies.
4. Determine if the vial’s contents will produce satisfactory slides. Consider the following:
a. The ideal density to be achieved on the final mount is somewhat subjective and is based on
the amount of debris in the sample, the preferences of the slide analyst, and the way in
which the slide is to be used (e.g., counting, documentation).
b. Generally, between 10 and 20 diatom valves or frustules should be present in a single high
power microscope field (1000X).
c. The number of specimens per field will need to be reduced if samples contain considerable
amounts of silt.
d. In many cases, analysts will request both a “heavy” slide (~40 cells/field at 400 – 450x
magnification) and a “light” slide (~30 cells/field at 400 – 450x magnification).
b Naphrax™ is a commercially‐available toluene‐based mounting medium with high refractive index.

2013‐2014 National Rivers & Streams Assessment Laboratory Operations Manual
Version 1.3, May 2014 Page 99 of 224
99
PER
IPHYTON
5. If the vial’s contents will not produce satisfactory slides, because the number of diatoms is too
sparse (this could be the result of too few diatoms in the sample and/or the sampled habitat),
then:
a. Determine (i.e., judgement call) if concentrating the vial’s contents 2‐5 times will be
sufficient to produce satisfactory slides. If yes, then increase the concentration of cleaned
diatom material by two to five times as follows:
i. Allow the vial to settle for approximately 4 hours.
ii. Spin the vial carefully while still resting on the tabletop. This step dissociates
diatoms that have adsorbed onto the side of the vial so they will settle.
iii. Allow the vial to settle for approximately 4 more hours (total of approximately 8
hours)
iv. Use a micropipettor to remove the required amount of water from the vial of
material. Keep track of volume removed from the vial.
v. Record the SUBSAMPLE_DCF (i.e, subsample dilution/concentration factor).
b. If a concentration of cleaned material greater than two to five times is required, then re‐
subsample the original sample following the steps in Section 9.5. Use the entire remaining
sample only if necessary. Digest the subsample as described previously (i.e., using ANS
Protocol P‐13‐42).
c. If the concentration is still not sufficient, then combine two vials of cleaned subsample
materials and concentrate as described in the previous two steps. Also revise the amount
recorded for SUBSAMPLE_VOLUME.
d. If, after following the steps above to concentrate the cleaned material, the density of
diatoms on a coverslip still does not meet the criteria of 30 to 40 cells per field at 400 ‐ 450x
magnification, proceed to make the densest slide possible and consult with a diatom analyst
to determine whether it is practical to analyze the sample. This evaluation includes the
following steps:
i. Scan the slide in its entirety under 100x magnification, and estimate the total
number of individuals on the slide.
ii. Determine if the slide is countable (i.e., 100 specimens or more can be counted
within 4 hours), considering factors such as:
1) Density of diatoms.
2) Evidence of dissolution
3) Amount of debris (silt, clay, broken remains of diatoms and other siliceous
organisms) that would make it difficult to identify specimens accurately.
iii. Determine if evidence suggests that lightly silicified diatoms in the sample may not
have survived the digestion process in ANS Protocol P‐13‐42. If so, prepare a “burn
mount” to view later to determine whether diatoms existed in the original sample
and can be identified. (Burn mounts are seldom necessary.)
1) If necessary, prepare a burn mount using the 1973 EPA procedure (USEPA
1973). It contains the following steps:
a) Drip a known portion of the untreated sample onto a coverslip.
b) Dry the coverslip at room temperature.

2013‐2014 National Rivers & Streams Assessment Laboratory Operations Manual
Version 1.3, May 2014 Page 100 of 224
100
PER
IPHYTON
c) When the sample is dry, place the coverslip onto a hot plate for about 30
min at approximately 570°C.
6. Deposit cleaned material on coverslip as follows:
a. Use forceps to remove single coverslips from the storage container.
b. Carefully clean each by wiping with a tissue (e.g., Kimwipe®c). c. Place each coverslip on a marked space. (Be sure this space is clean and dry to avoid cross‐
contamination.)
d. Add enough diatom suspension to cover the entire surface of the coverslip, including the
extreme edges. Usually, 1.0 mL is about right for a 22 x 22 mm coverglass. Add 10% HCl to
the cleared slurry (diatom suspension) (2 drops per 20mL of material in vial) to achieve a
more even distribution on the coverslip. Calculate and record the DRIP_DCF. Note:
i. If the intended drip count will be less than sufficient to cover the coverslip because
the sample is dense (e.g., 1.0 mL of distilled water diatom suspension on a 22 x 22
mm coverslip or 600 µL of acidified suspension), then:
1) Drip an amount of distilled water onto the coverslip with a disposable pipette
that will be sufficient to form a thin layer of water over the entire coverslip
when the diatom suspension is added.
2) Agitate the sample vial to homogenize the diatom suspension.
3) Using an adjustable pipettor, quickly withdraw the required amount from near
the central portion of the sample.
4) Eject this material smoothly and carefully into the layer of distilled water
already on the coverslip.
5) Repeat until achieving a homogeneous suspension on the coverslip.
6) Record the subsample amount ejected.
ii. In the case where more than1.0 mL of original sample is required, eject and mix the
sample directly on the coverslip (i.e., the addition of distilled water is not
necessary).
iii. If the coverslip overflows, discard the coverslip, wipe the drying area, and repeat
the procedure with a freshly cleaned coverslip.
iv. Discard the pipette tip when finished with each vial.
e. Once the marked space is loaded with coverslip preparations, do not disturb until the
coverslips are dry.
f. Dry the coverslips as follows:
i. Leave them undisturbed at room temperature for several hours;
OR
ii. Use gentle heat (warm to the touch only) to hasten evaporation using a:
1) Crook‐neck lamp with incandescent light bulb placed 15 ‐ 30 cm over the
coverslips;
2) Slide maker that provides heat;
c Kimwipe® is a commercially‐available product.

2013‐2014 National Rivers & Streams Assessment Laboratory Operations Manual
Version 1.3, May 2014 Page 101 of 224
101
PER
IPHYTON
3) Or some other device that will gently dry the slides. Avoid any device that will
rapidly evaporate the suspension. Rapid evaporation could produce strong
patterns of diatoms settling on coverslips.
iii. Once completely dry, put the coverslips on the hot plate preheated to 250 to 300ºF.
iv. Leave coverslips on hot plate for 3 ‐ 5 minutes. Verify that:
1) Heat has driven nearly all water from the material on the coverslips; and
2) Diatom frustules adhere to the surface of the glass.
v. Remove the coverslips from the hotplate and inspect them. Consider:
1) If the pattern of diatoms distributed on any coverslip is not even and smooth,
discard and prepare a new coverslip.
2) If coverslip distributions are still unsatisfactory after repeated attempts, consult
an algal analyst.
7. Mount coverslip on slide in a POSITIVE‐DRAW FUME HOOD using the following steps.
a. Use a rounded wooden splint or disposable pipette to transfer a small amount of the
mounting medium (volume equivalent to two to four drops of water) to the central portion
of the etched side of the microscope slide.
b. Remove the appropriate coverslip from the aluminum plate with forceps, being careful to
handle the coverslip only at the extreme corners.
c. Invert the coverslip and place it gently on the portion of the slide covered with the mounting
medium so the diatoms are in the medium between the coverslip and the microscope slide.
d. Place the slide (coverslip up) on the hotplate and apply gentle heat until the evolution of
bubbles resulting from the evaporation of the toluene solvent first occurs, and then
significantly diminishes. Heating the slide will allow the mounting medium to flow under the
coverslip in a later step.
e. Remove the slide from the hot plate.
f. Gently position the coverslip using the rounded toothpicks.
g. Bring the edges of the coverslip parallel to the edges of the microscope slide.
h. Press the coverslip to form a uniform, thin layer of mounting medium beneath the entire
coverslip that spreads to the edges of the coverslip. Take care at this stage to press gently to
prevent breakage, warping of the coverslip, or dislodging diatoms. As this procedure is
taking place, the mounting medium is “setting up” (becoming hard), and the ability to move
the coverslip will diminish rapidly.
i. Set aside the mount to finish cooling.
1. Use a single‐edge razor blade to carefully trim any excess mounting medium which has been
squeezed out from beneath the coverslip. Take great care to avoid “lifting” the coverslip by
inadvertently allowing the edge of the blade to move between the coverslip and the microscope
slide.
2. After removing and discarding most of the excess mounting medium, and while still working
under the hood, place the mount in successive baths of acetone, and then ethanol for no more
than 10 or 15 seconds each.
3. Wipe the mount clean with a tissue (e.g., Kimwipe®).
4. Add a paper label to slides before analyzing the slides.
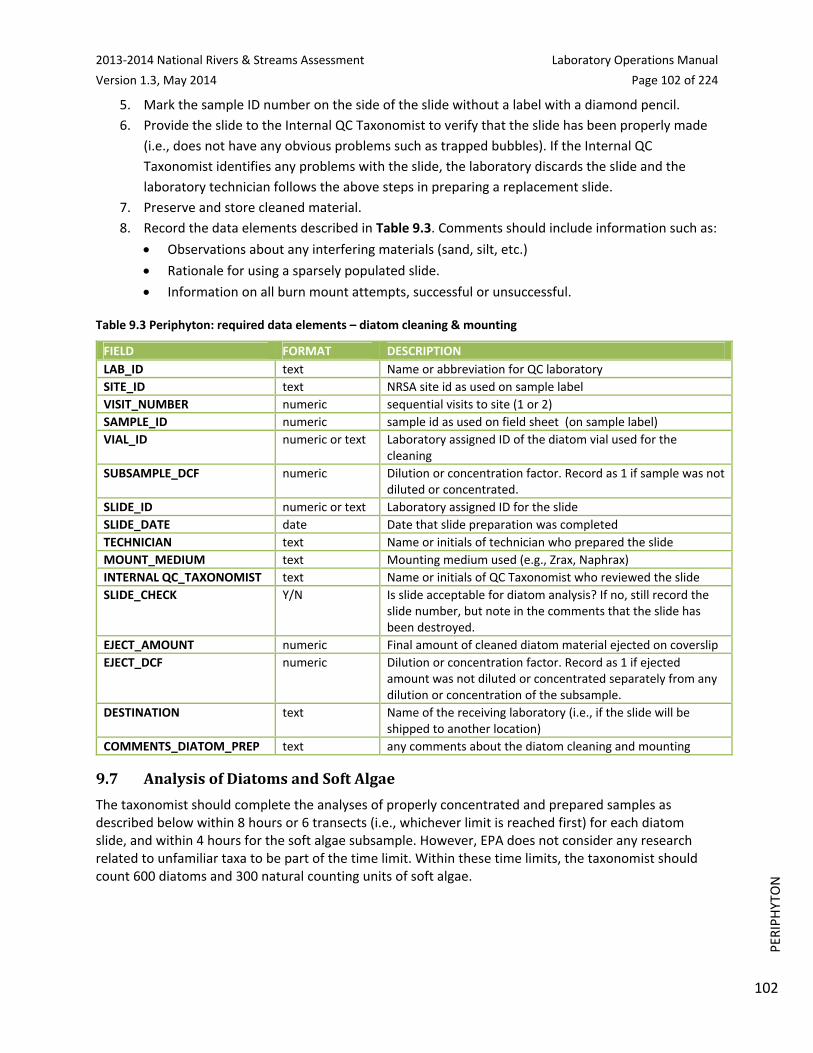
2013‐2014 National Rivers & Streams Assessment Laboratory Operations Manual
Version 1.3, May 2014 Page 102 of 224
102
PER
IPHYTON
5. Mark the sample ID number on the side of the slide without a label with a diamond pencil.
6. Provide the slide to the Internal QC Taxonomist to verify that the slide has been properly made
(i.e., does not have any obvious problems such as trapped bubbles). If the Internal QC
Taxonomist identifies any problems with the slide, the laboratory discards the slide and the
laboratory technician follows the above steps in preparing a replacement slide.
7. Preserve and store cleaned material.
8. Record the data elements described in Table 9.3. Comments should include information such as:
Observations about any interfering materials (sand, silt, etc.)
Rationale for using a sparsely populated slide.
Information on all burn mount attempts, successful or unsuccessful.
Table 9.3 Periphyton: required data elements – diatom cleaning & mounting
FIELD FORMAT DESCRIPTION
LAB_ID text Name or abbreviation for QC laboratory
SITE_ID text NRSA site id as used on sample label
VISIT_NUMBER numeric sequential visits to site (1 or 2)
SAMPLE_ID numeric sample id as used on field sheet (on sample label)
VIAL_ID numeric or text Laboratory assigned ID of the diatom vial used for the cleaning
SUBSAMPLE_DCF numeric Dilution or concentration factor. Record as 1 if sample was not diluted or concentrated.
SLIDE_ID numeric or text Laboratory assigned ID for the slide
SLIDE_DATE date Date that slide preparation was completed
TECHNICIAN text Name or initials of technician who prepared the slide
MOUNT_MEDIUM text Mounting medium used (e.g., Zrax, Naphrax)
INTERNAL QC_TAXONOMIST text Name or initials of QC Taxonomist who reviewed the slide
SLIDE_CHECK Y/N Is slide acceptable for diatom analysis? If no, still record the slide number, but note in the comments that the slide has been destroyed.
EJECT_AMOUNT numeric Final amount of cleaned diatom material ejected on coverslip
EJECT_DCF numeric Dilution or concentration factor. Record as 1 if ejected amount was not diluted or concentrated separately from any dilution or concentration of the subsample.
DESTINATION text Name of the receiving laboratory (i.e., if the slide will be shipped to another location)
COMMENTS_DIATOM_PREP text any comments about the diatom cleaning and mounting
9.7 AnalysisofDiatomsandSoftAlgae
The taxonomist should complete the analyses of properly concentrated and prepared samples as described below within 8 hours or 6 transects (i.e., whichever limit is reached first) for each diatom slide, and within 4 hours for the soft algae subsample. However, EPA does not consider any research related to unfamiliar taxa to be part of the time limit. Within these time limits, the taxonomist should count 600 diatoms and 300 natural counting units of soft algae.

2013‐2014 National Rivers & Streams Assessment Laboratory Operations Manual
Version 1.3, May 2014 Page 103 of 224
103
PER
IPHYTON
9.7.1 TaxonomicNomenclatureandPhotographicSpecifications
For both analyses of diatoms and soft algae for NRSA, EPA requires that all laboratories use the same sources for taxon names. EPA also requires photographs of each unique taxon. The following steps provide EPA’s specifications:
1. Identify the species (i.e., the target level). Where it is not possible to identify the species, then
identify the specimen to the lowest practical taxon level:
a. If the species/taxon is included in BioData
(https://aquatic.biodata.usgs.gov/domainDownloads.action), then select the records
corresponding to “Current” in TaxonConceptState and record:
i. NADED_ID for the taxon identification number
ii. BiodataTaxonName for the taxon name
iii. BenchTaxonNameReferenceCode, if provided in BioData. Otherwise, cite the
reference used to identify the specimen. The reference only needs to be cited once
for each taxon.
b. If the species/taxon is not included in BioData, then record:
i. LAB_TAXON_ID: an identifier assigned by the laboratory to provide a unique
number for each taxon identified for NRSA
ii. LAB_TAXON_NAME: taxon name
iii. LAB_REFERENCE: reference used to identify the specimen. The laboratory only
needs to cite a reference for the first identification of the taxon.
c. Photograph each species/taxon one or more times for the laboratory’s NRSA library. The
image must demonstrate the diagnostic feature(s) of the species/taxon so that they are
distinguishable and clear to an algal taxonomist. The image should be:
i. Positioned vertically
ii. Tightly cropped
iii. Scaled with a 10 µm scale bar in the lower right corner of the image
iv. Saved with a tiff format
v. Have a filename of following elements in the order listed below:
NRSA2 (for the second NRSA conducted in 2013‐2014)
Laboratory name (or abbreviation)
Sample number
Taxon name
NADED_ID (from BioData) or Laboratory’s ID number for the taxon
Date (format YYYYMMDD) that the photograph was taken.
Last character is ‘e’ for an edited version of the photograph
For example, on September 8, 2013, laboratory ABC identified the specimen in
sample 1234 to be a Homoeothrix janthina, for which the laboratory ID code is
HJ0001, and took a digital photograph at a resolution of 40x, with a 10 µm scale
bar present, and then cropped the photograph to eliminate extraneous
material. The filenames of the original and edited photographs would be:

2013‐2014 National Rivers & Streams Assessment Laboratory Operations Manual
Version 1.3, May 2014 Page 104 of 224
104
PER
IPHYTON
NRSA2_ABC_1234_ homoeothrix janthina_HJ0001_40x_20130908.tiff and
NRSA2_ABC_1234_ homoeothrix janthina_HJ0001_40x_20130908e.tiff.
9.7.2 AnalysisofDiatoms
This section describes the diatom subsample analysis used to estimate the proportion of diatom taxa found in a count of 600 valves (one‐half of an individual diatom cell). The diatom analysis also includes biovolume measurements and imaging of all taxa encountered, including unknown taxon. In developing this section, EPA modified and expanded upon the steps on ANS Protocol P‐13‐39 “Analysis of Diatoms on Microscope Slides Prepared from USGS NAWQA Program Algae Samples” (http://diatom.ansp.org/nawqa/pdfs/P‐13‐39.pdf).
To analyze the diatoms, the taxonomist shall:
1. Verify that all necessary equipment is available. See Section 9.3.4 for recommended supplies.
2. Verify that the slides can be used for diatom analysis:
a. Review comments from the subsampling, cleaning, and mounting steps for any deviations
that may affect the outcome of diatom analysis.
b. Scan slides at low to medium magnification (100x to 450x) to confirm that diatoms are:
i. Evenly distributed on the coverslip.
ii. Present at a density appropriate for efficient counting. At high magnification
(1000x), each field should have 5‐10 diatoms.
1) If diatoms on the slides are very sparse, refer to procedures in Section 9.6 for
handling low‐density samples.
c. If there are problems with dispersion or density that would compromise the quality and
accuracy of the analysis, have new slides made. Always save any count data generated for a
sample, even if the number of valves or frustules is low (e.g., <100).
3. Create the transect and count the diatoms as follows:
a. Secure the slide in the mechanical stage and use the microscope’s diamond scribe to etch a
horizontal or vertical line (depending on personal preference) on the coverslip to mark the
edge of the first row to be counted. Clearly demarcate the areas of a slide scanned during a
count. This is an important step because another taxonomist may need to recount the slide
for QA/QC purposes.
i. If etching the slide before counting:
a) Etch at least three lines on the diatom slide.
b) Locate a starting point near one end of the etched line and make a circle with
the scribe. This denotes the starting point of the count.
ii. If etching during the count:
a) Etch a line for each row counted. Rows are narrow rectangular areas (strips) of
the slide adjacent to the scribed line, with width equal to the field of view. Start
rows far enough from the coverslip edge to avoid optical distortion, and end
them near the opposite coverslip edge where diatoms are no longer clearly
visible (see diagram below).
b) Etch a circle around the last field counted in the first row and at the start and
end of all other rows.

2013‐2014 National Rivers & Streams Assessment Laboratory Operations Manual
Version 1.3, May 2014 Page 105 of 224
105
PER
IPHYTON
iii. Verify that the etching is clearly visible so that another taxonomist can easily locate
the circles and lines.
b. Focus the first field under oil immersion.
c. On a bench sheet and the upper right hand corner of the coverslip, record in mm the
transect start coordinates from the microscope stage. Transects are narrow rectangular
areas (strips) of the slide with width equal to the field of view. The transect width should be
the maximum width common to all participating taxonomists (at least 90 microns).
d. For each species/taxon, count diatom valves along the transect using the following rules:
i. One valve is:
a) A complete valve; or
b) A partial valve that is more than 50% of the valve. The valve must extend at
least halfway into the transect (i.e., the center of the valve must be in the
transect).
ii. Avoid counting valves in any disrupted areas of the mount, particularly edges that
have optical aberrations.
iii. Identify and count 600 valves or as many as possible to complete the entire analysis
within 8 hours or 6 transects (i.e., whichever limit is reached first).
e. Record the level of magnification used to view the diatoms.
f. Verify that photographs of the valves for the species/taxon exist in the NRSA library. If the
valve is the first occurrence of the species/taxon or the valve is particularly notable, take a
photograph following the specifications in Section 9.7.1.
g. On a bench sheet, record the transect end coordinates from the microscope stage.
4. Calculate the total transect length and width (units are mm) evaluated for the sample. Record as
TRANS_LENGTH and TRANS_WIDTH in the database.
5. For each species (or lowest practicable taxon), estimate the average biovolume for the
species/taxon using information from one of the following sources:
a. Preferably, measurements reported in:
i. NRSA 2008‐2009;
ii. Well‐respected literature;
iii. Previous laboratory analyses for which the taxonomist is relatively confident provides a
good estimate of the average biovolume for the taxon; or
iv. Databases with known sources.
b. When no other reasonable source is readily available, base the taxon’s average biovolume
on the measurements of the cells on the slide. Perform the following steps: i. Determine the number of cells to measure:
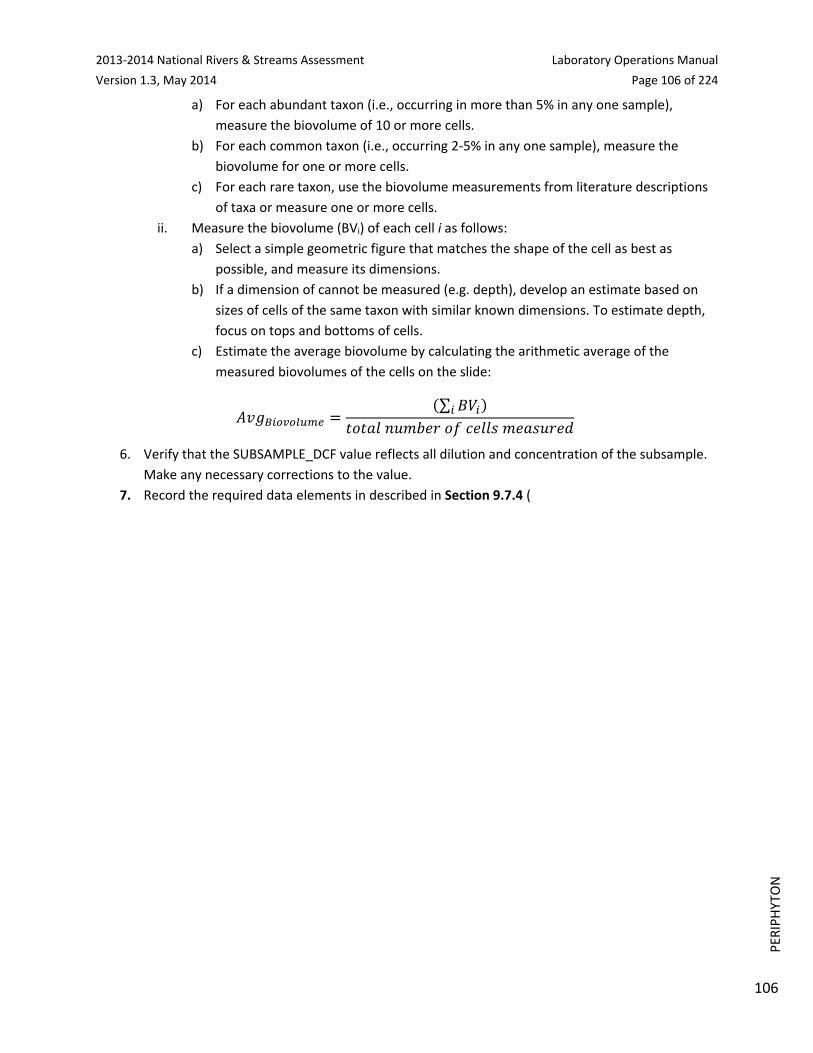
2013‐2014 National Rivers & Streams Assessment Laboratory Operations Manual
Version 1.3, May 2014 Page 106 of 224
106
PER
IPHYTON
a) For each abundant taxon (i.e., occurring in more than 5% in any one sample),
measure the biovolume of 10 or more cells.
b) For each common taxon (i.e., occurring 2‐5% in any one sample), measure the
biovolume for one or more cells.
c) For each rare taxon, use the biovolume measurements from literature descriptions
of taxa or measure one or more cells.
ii. Measure the biovolume (BVi) of each cell i as follows:
a) Select a simple geometric figure that matches the shape of the cell as best as
possible, and measure its dimensions.
b) If a dimension of cannot be measured (e.g. depth), develop an estimate based on
sizes of cells of the same taxon with similar known dimensions. To estimate depth,
focus on tops and bottoms of cells.
c) Estimate the average biovolume by calculating the arithmetic average of the
measured biovolumes of the cells on the slide:
∑
6. Verify that the SUBSAMPLE_DCF value reflects all dilution and concentration of the subsample.
Make any necessary corrections to the value.
7. Record the required data elements in described in Section 9.7.4 (

2013‐2014 National Rivers & Streams Assessment Laboratory Operations Manual
Version 1.3, May 2014 Page 107 of 224
107
PER
IPHYTON
8. Table 9.4).
9.7.3 AnalysisofSoftAlgae
This section describes the steps for identifying, counting, documenting, and measuring soft algae using the Palmer‐Maloney counting cell method. The steps include re‐processing a small portion of the subsample using final dilution/concentration factors. EPA adapted the steps from ANS Protocol P‐13‐50 “Preparation of USGS NAWQA Program Algal Samples for Analysis Using Palmer‐Maloney Cells”
(http://diatom.acnatsci.org/nawqa/pdfs/P‐13‐50.pdf) and ANS Protocol P‐13‐52 “Analysis of USGS NAWQA Program Phytoplankton Samples” (http://diatom.ansp.org/nawqa/pdfs/P‐13‐52.pdf).
In analyzing the soft algae, the taxonomist shall:
1. Follow lab practices similar to those used for sterile experiments (bacteriological plating, etc.) to
reduce the risk of cross contamination of samples. At a minimum:
a. Keep the laboratory room and bench surfaces as clean as possible and free of debris.
b. Use disposable pipettes, stirrers, etc. where feasible.
c. Rinse glass (non‐disposable) pipettes, stirrers, etc. in DW or RO water at least three times
after each sample. (Explanatory note: at times, tap water, because of algal blooms and use
of diatomaceous earth filters, may contain diatoms.)
d. Dry all equipment before storing it. This step prevents growth of algae and fungi.
2. Verify that all necessary equipment is available. See Section 9.3.4 for recommended supplies.
3. Prior to taking a small portion of the subsample from the vial, verify that the sample is
thoroughly mixed. If there are visible macro forms in the soft‐algae subsample (i.e., visible
filaments or colonies), break them up using scissors or small blender. This does not include
maceration or grinding. The purpose of this step is to suspend algae so that fractions will have
proportions of algal taxa equal to those in the original sample.
4. Concentrate the sample, if necessary. The original sample should usually be concentrated prior
to adding to a Palmer‐Maloney cell. The initial concentration should be approximately 5‐10
times the original whole‐water, leaving about 20 mL of concentrate for analysis. Concentrate the
sample as follows:
a. Only concentrate/dilute a portion (10 mL or less) of the original subsample (i.e., from the
vial).
b. Settle and decant (settle for at least 2 days) or use centrifugation (1000 g for 20 min)
c. Revise the subsample DCF using the original and final volumes, before and after
concentration.
5. For samples with high amounts of sand and/or silt, dilute the sample if necessary, but do not
dilute any sample to more than 20 % of its original volume. This step is valid ONLY for samples
with large amounts of inorganic sand and silt. No settling should occur with samples that
contain organic detritus or at any time during the dilution process.
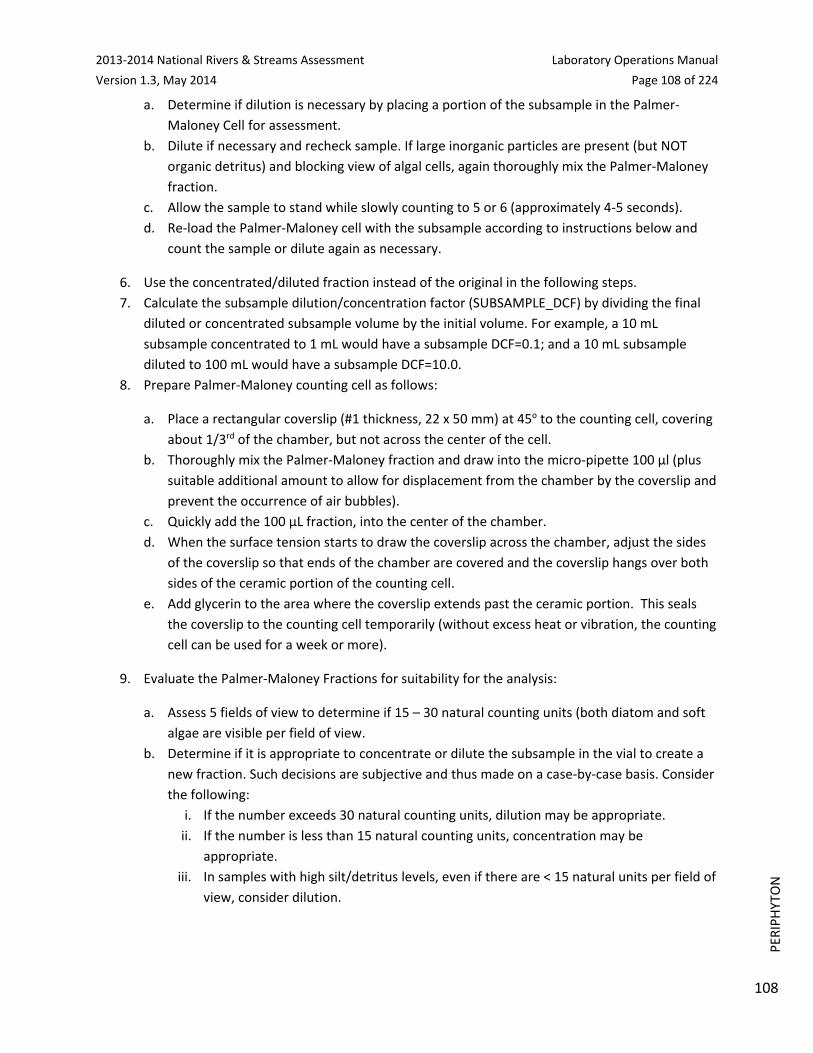
2013‐2014 National Rivers & Streams Assessment Laboratory Operations Manual
Version 1.3, May 2014 Page 108 of 224
108
PER
IPHYTON
a. Determine if dilution is necessary by placing a portion of the subsample in the Palmer‐
Maloney Cell for assessment.
b. Dilute if necessary and recheck sample. If large inorganic particles are present (but NOT
organic detritus) and blocking view of algal cells, again thoroughly mix the Palmer‐Maloney
fraction.
c. Allow the sample to stand while slowly counting to 5 or 6 (approximately 4‐5 seconds).
d. Re‐load the Palmer‐Maloney cell with the subsample according to instructions below and
count the sample or dilute again as necessary.
6. Use the concentrated/diluted fraction instead of the original in the following steps.
7. Calculate the subsample dilution/concentration factor (SUBSAMPLE_DCF) by dividing the final
diluted or concentrated subsample volume by the initial volume. For example, a 10 mL
subsample concentrated to 1 mL would have a subsample DCF=0.1; and a 10 mL subsample
diluted to 100 mL would have a subsample DCF=10.0.
8. Prepare Palmer‐Maloney counting cell as follows:
a. Place a rectangular coverslip (#1 thickness, 22 x 50 mm) at 45o to the counting cell, covering
about 1/3rd of the chamber, but not across the center of the cell.
b. Thoroughly mix the Palmer‐Maloney fraction and draw into the micro‐pipette 100 µl (plus
suitable additional amount to allow for displacement from the chamber by the coverslip and
prevent the occurrence of air bubbles).
c. Quickly add the 100 µL fraction, into the center of the chamber.
d. When the surface tension starts to draw the coverslip across the chamber, adjust the sides
of the coverslip so that ends of the chamber are covered and the coverslip hangs over both
sides of the ceramic portion of the counting cell.
e. Add glycerin to the area where the coverslip extends past the ceramic portion. This seals
the coverslip to the counting cell temporarily (without excess heat or vibration, the counting
cell can be used for a week or more).
9. Evaluate the Palmer‐Maloney Fractions for suitability for the analysis:
a. Assess 5 fields of view to determine if 15 – 30 natural counting units (both diatom and soft
algae are visible per field of view.
b. Determine if it is appropriate to concentrate or dilute the subsample in the vial to create a
new fraction. Such decisions are subjective and thus made on a case‐by‐case basis. Consider
the following:
i. If the number exceeds 30 natural counting units, dilution may be appropriate.
ii. If the number is less than 15 natural counting units, concentration may be
appropriate.
iii. In samples with high silt/detritus levels, even if there are < 15 natural units per field of
view, consider dilution.

2013‐2014 National Rivers & Streams Assessment Laboratory Operations Manual
Version 1.3, May 2014 Page 109 of 224
109
PER
IPHYTON
iv. Avoid concentrating samples were the silt/detritus level would be raised to a level too
high to complete a successful count. Include a comment in the database (see Table
9.4) if the silt/detritus levels prohibit concentration or lead to a dilution.
c. Once the Palmer‐Maloney cell is prepared, allow chamber to stand for up to 10 minutes to
allow contents to settle.
d. Revise the SUBSAMPLE_DCF if any step in this section required additional concentration or
dilutions of the subsample. Because EPA will use the SUBSAMPLE_DCF in estimating whole
sample values, it is extremely important that the recorded value for SUBSAMPLE_DCF
reflects all of the dilution and concentration steps.
10. Use transects of varying length to enumerate 300 natural counting units.
a. Position the microscope stage so that the first field of view is in the top left hand area of the
Palmer‐Maloney cell at, but not overlapping, the cell edge.
b. Use transects, of varying length, with a width of 0.54 mm (or width of the field of view) scan
up to, but not exceeding, a total transect length of 115.7 mm (or equivalent). Every other
transect, moving down the Palmer‐Maloney cell, is to be enumerated, i.e. each transect
enumerated should be separated by a width of one field of view. This will prevent field of
view overlap. For microscopes where the 40x field of view differs from 0.54 mm calculate
the maximum transect length required. The full length of each transect should be scanned
for algal enumeration. Record the start and end coordinates for each transect for the
purpose of total transect length calculation on the Soft Algae Bench Sheet.
c. Identify and enumerate all soft algal forms within the field of view.
d. Record the level of magnification used to view the algal forms.
11. Enumerate 300 natural algal units and identify to species (or, if not possible, then the lowest
practicable taxonomic level) as follows:
a. Using the pattern developed in the previous step, move the microscope stage to a new
position in the pattern. Make all movements of the microscope stage without looking
through the objectives.
b. Identify and enumerate all algal forms in the field of view: Enumerate algal forms using
natural counting units. Natural counting units are defined as one for each colony, filament,
diatom cell (regardless if colonial or filamentous) or unicell.
c. Differentiate diatoms as “living” or “dead” at type of collection. If there is any protoplast
material in the frustules, consider the diatom to have been living when collected.
i. Identify all non‐diatom taxa to species (or, if not possible, then the lowest practicable
taxonomic level).
ii. Group all diatoms into one category – undifferentiated diatoms – instead of
identifying their taxa.
d. Count the number of algal cells (living and dead) comprising each multicellular counting unit
until reaching 300 natural algal units. Only “living” diatoms are part of the required 300
natural algal units.

2013‐2014 National Rivers & Streams Assessment Laboratory Operations Manual
Version 1.3, May 2014 Page 110 of 224
110
PER
IPHYTON
e. Record the number field or total transect length used for counting, the species
identifications, and number of natural cells for each species.
f. For the undifferentiated diatoms, record their count and label the species “Dead diatoms”
and leave all other taxonomic fields blank.
12. Enumerate larger, rarer taxa. There is an additional required procedure that can be used for
samples with low concentrations (less than five natural counting units) of large cells or colonies
(maximum dimension greater than 100 um). Using a low‐power objective (10‐15x), scan 20
fields or 4 transects. Count the larger, rarer taxa. Enumerate as natural units and estimate the
number of cells in each. Record the counts of each of the taxa, noting the scan area (i.e., total
area for the 20 microscope fields or 4 transects). Multiply the number of larger, rarer taxa by the
ratio of the total area scanned in the regular count to the area scanned in this count. Record
that number as the total count for that taxon.
13. Calculate and record the estimated number of cells within a ‘typical’ natural unit. (This need
only be a rough estimate.)
14. Verify that photographs exist in the NRSA library for the species/taxon. If this species/taxon is
the first occurrence or particularly notable, take a photograph following the specifications in
Section 9.7.1.
15. For each species (or lowest practicable taxon), estimate the average biovolume for the
species/taxon using information from one of the following sources:
a. Preferably, measurements reported in:
i. NRSA 2008‐2009;
ii. Well‐respected literature;
iii. Previous laboratory analyses for which the taxonomist is relatively confident provides
a good estimate of the average biovolume for the taxon; or
iv. Databases with known sources.
16. When no other reasonable source is readily available, base the taxon’s average biovolume on
the measurements of the cells. Perform the following steps:
a. Determine the number of cells to measure:
i. For each abundant taxon (i.e., occurring in more than 5% in any one sample), measure
the biovolume of 10 or more cells.
ii. For each common taxon (i.e., occurring 2‐5% in any one sample), measure the
biovolume for one or more cells.
iii. For each rare taxon, use the biovolume measurements from literature descriptions of
taxa or measure one or more cells.
b. Measure the biovolume (BVi) of each cell i as follows:
i. Select a simple geometric figure that matches the shape of the cell as best as possible,
and measure its dimensions. When length within a filament cannot be determined,
then use a standard length of 10 µm per cell. Note in the comments field (Table 9.4)
when this standard length is applied.

2013‐2014 National Rivers & Streams Assessment Laboratory Operations Manual
Version 1.3, May 2014 Page 111 of 224
111
PER
IPHYTON
ii. If a dimension of cannot be measured (e.g. depth), develop an estimate based on sizes
of cells of the same taxon with similar known dimensions. To estimate depth, focus on
tops and bottoms of cells.
iii. Estimate the average biovolume by calculating the arithmetic average of the
measured biovolumes of the cells on the slide:
∑
17. Verify that the SUBSAMPLE_DCF value reflects all dilution and concentration of the subsample.
Make any necessary corrections to the value.
9.7.4 InternalQualityControl
For each sample, the laboratory must perform internal quality control evaluations. The Internal QC Taxonomist must randomly select 10% of the diatom slides and 10% of the soft algae subsamples for an independent count and identification. Calculate the PctDiff, PDE, and PTD using the equations in Section 9.3. If any samples do not meet the QA requirements listed in the Attachment, perform a third count and reidentification for the sample.
9.7.5 RequiredDataElementsforDiatomandSoftAlgaeAnalyses
Table 9.3 identifies the required data elements for the analyses described in Section 9.7.2 (diatom) and Section 9.7.3 (soft algae).

2013‐2014 National Rivers & Streams Assessment Laboratory Operations Manual
Version 1.3, May 2014 Page 112 of 224
112
PER
IPHYTON
Table 9.4 Periphyton: required data elements – analysis
FIELD FORMAT DESCRIPTION
LAB ID text Name or abbreviation for QC laboratory
SITE ID text NRSA site id as used on sample label
VISIT_NUMBER numeric sequential visits to site (1 or 2)
SAMPLE_ID numeric sample id as used on field sheet (on sample label)
SAMPLE_VOLUME numeric Original sample volume measured during subsampling step in Section 9.5. This value is used for both diatoms and soft algae analyses.
VIAL_ID numeric or text Laboratory assigned ID of the diatom vial
SUBSAMPLE_VOLUME numeric Volume of the subsample in the vial
SLIDE_ID numeric or text Laboratory assigned ID for the slide
TAXONOMIST text Name or initials of taxonomist or Internal QC Taxonomist analyzing the sample.
QC_CHECK Y/N Y if results were provided by the Internal QC Taxonomist for a sample selected for the 10% QC check.
ANALYSIS DIA/SFT Type of analysis: DIA=Diatoms; SFT=Soft Algae
DATE_ANALYSIS date Date when the analysis was completed
NADED_ID numeric BioData’s identification number for the taxon
LAB_TAXON_ID numeric or text An identifier assigned by the laboratory to provide a unique number for each taxon identified for NRSA. If NADED_ID is available, this field is optional.
BiodataTaxonName text BioData’s taxon name
LAB_TAXON_NAME text Taxon name. If BiodataTaxonName is available, this field is optional.
BenchTaxonNameReferenceCode text BioData’s reference for the taxon. Identify the reference in BenchTaxonNameReferenceCode or LAB_REFERENCE the first time the lab identifies the taxon. Otherwise, this field is optional.
LAB_REFERENCE text Identify the reference in BenchTaxonNameReferenceCode or LAB_REFERENCE the first time the lab identifies the taxon. Otherwise, this field is optional.
MAGNIFICATION numeric Identify the magnification used to identify the taxon.
CLASS text taxonomic class
ORDER text taxonomic order
FAMILY text taxonomic family
GENUS text taxonomic genus
SPECIES text taxonomic species. For soft algae, label undifferentiated diatoms as “Dead diatoms” and leave other taxonomic fields blank.
TRANSECTS_COUNTED numeric Number of transects counted
TRANS_LENGTH numeric Length (mm) of transects counted
TRANS_WIDTH numeric Width (mm) of transects counted
CHAMBER_AREA numeric Chamber area in mm2
CHAMBER_VOLUME numeric Volume of the chamber
COUNT numeric Number of valves (diatoms) or natural counting units (soft algal) identified for the taxon

2013‐2014 National Rivers & Streams Assessment Laboratory Operations Manual
Version 1.3, May 2014 Page 113 of 224
113
PER
IPHYTON
COUNT_CENSORED text Code for a sample for which the taxonomist counted fewer than 600 valves (diatoms) or 300 natural counting units (soft algal)
CODE Definition
TL Time limit reached
SS Sparse sample
OT Other. Identify other reason in COMMENT_ANALYSIS
AVG_BIOVOLUME numeric Average biovolume for the species/taxon
BIOVOLUME_AVG_SOURCE text Source of the biovolume average value:
CODE Definition
NR8 From NRSA 2008‐2009
REF Cited in literature
SS Sparse sample (i.e., fewer than 600 organisms in the sample)
OT Other. Identify other reason in COMMENT_ANALYSIS
BIOVOLUME_REFERENCE text Identify the reference that provided the average biovolume value the first time the lab identifies the taxon. Otherwise, this field is optional. Leave blank if the laboratory estimated the biovolume from measuring the cells.
LAB_REFERENCE text The laboratory reference used to identify the taxon. Identify the reference in BenchTaxonNameReferenceCode or LAB_REFERENCE the first time the lab identifies the taxon. Otherwise, this field is optional.
PHOTOGRAPH text Filename of relevant photograph in the NRSA library. The filename is required the first time the lab identifies the taxon. Otherwise, this field is optional.
COMMENTS_ ANALYSIS text any comments about the analysis
BV1 numeric Biovolume of organism 1 (before measuring the biovolume, consider if the average biovolume is available from NRSA 2008‐2009 or some other reliable source)
BV2 numeric Biovolume of organism 2
BV3 numeric Biovolume of organism 3
BV4 numeric Biovolume of organism 4
BV5 numeric Biovolume of organism 5
BV6 numeric Biovolume of organism 6
BV7 numeric Biovolume of organism 7
BV8 numeric Biovolume of organism 8
BV9 numeric Biovolume of organism 9
BV10 numeric Biovolume of organism 10
BV11 numeric Biovolume of organism 11
BV12 numeric Biovolume of organism 12
BV13 numeric Biovolume of organism 13
BV14 numeric Biovolume of organism 14
BV15 numeric Biovolume of organism 15

2013‐2014 National Rivers & Streams Assessment Laboratory Operations Manual
Version 1.3, May 2014 Page 114 of 224
114
PER
IPHYTON
9.8 DataEntry
Table 9.1,

2013‐2014 National Rivers & Streams Assessment Laboratory Operations Manual
Version 1.3, May 2014 Page 115 of 224
115
PER
IPHYTON
Table 9.2 and Table 9.3 identify the required data elements that the laboratories must provide to EPA, in EPA’s data template, available separately from EPA.

2013‐2014 National Rivers & Streams Assessment Laboratory Operations Manual
Version 1.3, May 2014 Page 116 of 224
116
PER
IPHYTON
Table 9.4 provides a consolidated list of required data elements. In addition to the database, the laboratory must provide the resume or curriculum vitae for each taxonomist who performs the diatoms and algal analyses for the NRSA samples. The resume or cv for each taxonomist is submitted once to EPA’s External QC Coordinator.
Table 9.5 Periphyton: required data elements – all
RECORDED DURING: FIELD FORMAT DESCRIPTION
LOGIN LAB_ID text Name or abbreviation for QC laboratory
DATE_RECEIVED MMDDYY date sample was received by lab
SITE_ID text NRSA site id as used on sample label
VISIT_NUMBER numeric sequential visits to site (1 or 2)
SAMPLE_ID numeric sample id as used on field sheet (on sample label)
DATE_COLLECTED MMDDYY date sample was collected
CONDITION_CODE text Condition codes describing the condition of the sample upon arrival at the laboratory.
CODE Definition
OK Sample is in good condition
C Sample container is cracked
HM Sample contains heavy amounts of sand, silt, or other heavy material that may interfere with the algal analysis
L Sample or container is leaking
TL Too little sample left for theprocedure
ML Sample label is missing
PA Preservative added, add amount in comments field
Q Other quality concerns, not identified above
FORMALIN_ADDED numeric If the laboratory added formalin to the bottle, provide the amount in milliliters. If no formalin was added, then the value should be zero or blank.
COMMENTS_ARRIVAL text any comments about the condition of the sample upon arrival.
SUB‐SAMPLING VIAL_ID numeric or text
Laboratory assigned ID to the vial holding the subsample
SAMPLE_VOLUME numeric Total volume of sample before any processing (from the sample label)
SUBSAMPLE_VOLUME numeric Volume of subsample in the vial
PURPOSE D/S Codes indicating whether the vial will be used for the diatom or soft algal analyses .
CODE Definition
D Diatom Analysis
S Soft Algal Analysis

2013‐2014 National Rivers & Streams Assessment Laboratory Operations Manual
Version 1.3, May 2014 Page 117 of 224
117
PER
IPHYTON
DESTINATION text Name of the receiving laboratory (i.e., if the vial will be shipped to another location)
COMMENTS_SUBSAMPLE text any comments about the subsampling
DIATOM CLEANING AND MOUNTING
SUBSAMPLE_DCF numeric Dilution or concentration factor. Record as 1 if sample was not diluted or concentrated.
SLIDE_ID numeric or text
Laboratory assigned ID for the slide
SLIDE_DATE date Date that slide preparation was completed
TECHNICIAN text Name or initials of technician who prepared the slide
MOUNT_MEDIUM text Mounting medium used (e.g., Zrax, Naphrax)
INTERNAL QC_TAXONOMIST text Name or initials of QC Taxonomist who reviewed the slide
SLIDE_CHECK Y/N Is slide acceptable for diatom analysis? If no, still record the slide number, but note in the comments that the slide has been destroyed.
EJECT_AMOUNT numeric Final amount of cleaned diatom material ejected on coverslip
EJECT_DCF numeric Dilution or concentration factor. Record as 1 if ejected amount was not diluted or concentrated separately from any dilution or concentration of the subsample.
DESTINATION text Name of the receiving laboratory (i.e., if the slide will be shipped to another location)
COMMENTS_DIATOM_PREP text any comments about the diatom cleaning and mounting
ANALYSIS TAXONOMIST text Name or initials of taxonomist or Internal QC Taxonomist analyzing the sample.
QC_CHECK Y/N Y if results were provided by the Internal QC Taxonomist for a sample selected for the 10% QC check.
ANALYSIS DIA/SFT Type of analysis: DIA=Diatoms; SFT=Soft Algae
DATE_ANALYSIS date Date when the analysis was completed
NADED_ID numeric BioData’s identification number for the taxon
LAB_TAXON_ID numeric or text
An identifier assigned by the laboratory to provide a unique number for each taxon identified for NRSA. If NADED_ID is available, this field is optional.
BiodataTaxonName text BioData’s taxon name
LAB_TAXON_NAME text Taxon name. If BiodataTaxonName is available, this field is optional.

2013‐2014 National Rivers & Streams Assessment Laboratory Operations Manual
Version 1.3, May 2014 Page 118 of 224
118
PER
IPHYTON
BenchTaxonNameReferenceCode
text BioData’s reference for the taxon. Identify the reference in BenchTaxonNameReferenceCode or LAB_REFERENCE the first time the lab identifies the taxon. Otherwise, this field is optional.
LAB_REFERENCE text Identify the reference in BenchTaxonNameReferenceCode or LAB_REFERENCE the first time the lab identifies the taxon. Otherwise, this field is optional.
MAGNIFICATION numeric Identify the magnification used to identify the taxon.
CLASS text taxonomic class
ORDER text taxonomic order
FAMILY text taxonomic family
GENUS text taxonomic genus
SPECIES text taxonomic species. For soft algae, label undifferentiated diatoms as “Dead diatoms” and leave other taxonomic fields blank.
TRANSECTS_COUNTED numeric Number of transects counted
TRANS_LENGTH numeric Length (mm) of transects counted
TRANS_WIDTH numeric Width (mm) of transects counted
CHAMBER_AREA numeric Chamber area in mm2
CHAMBER_VOLUME numeric Volume of the chamber
COUNT numeric Number of valves (diatoms) or natural counting units (soft algal) identified for the taxon
COUNT_CENSORED text Code for a sample for which the taxonomist counted fewer than 600 valves (diatoms) or 300 natural counting units (soft algal)
CODE Definition
TL Time limit reached
SS Sparse sample
OT Other. Identify other reason in COMMENT_ANALYSIS
EST_CELLS_IN_NAT_UNIT numeric Estimated number of cells in a ‘typical’ natural counting unit for the species/taxon (soft algae only)
AVG_BIOVOLUME numeric Average biovolume for the species/taxon
BIOVOLUME_AVG_SOURCE text Source of the biovolume average value:
CODE Definition
NR8 From NRSA 2008‐2009
REF Cited in literature
SS Sparse sample (i.e., fewer than 600 organisms in the sample)
OT Other. Identify other reason in COMMENT_ANALYSIS

2013‐2014 National Rivers & Streams Assessment Laboratory Operations Manual
Version 1.3, May 2014 Page 119 of 224
119
PER
IPHYTON
BIOVOLUME_REFERENCE text Identify the reference that provided the average biovolume value the first time the lab identifies the taxon. Otherwise, this field is optional. Leave blank if the laboratory estimated the biovolume from measuring the cells.
LAB_REFERENCE text The laboratory reference used to identify the taxon. Identify the reference in BenchTaxonNameReferenceCode or LAB_REFERENCE the first time the lab identifies the taxon. Otherwise, this field is optional.
PHOTOGRAPH text Filename of relevant photograph in the NRSA library. The filename is required the first time the lab identifies the taxon. Otherwise, this field is optional.
COMMENTS_ ANALYSIS text any comments about the analysis
BV1 numeric Biovolume of organism 1 (before measuring the biovolume, consider if the average biovolume is available from NRSA 2008‐2009 or some other reliable source)
BV2 numeric Biovolume of organism 2
BV3 numeric Biovolume of organism 3
BV4 numeric Biovolume of organism 4
BV5 numeric Biovolume of organism 5
BV6 numeric Biovolume of organism 6
BV7 numeric Biovolume of organism 7
BV8 numeric Biovolume of organism 8
BV9 numeric Biovolume of organism 9
BV10 numeric Biovolume of organism 10
BV11 numeric Biovolume of organism 11
BV12 numeric Biovolume of organism 12
BV13 numeric Biovolume of organism 13
BV14 numeric Biovolume of organism 14
BV15 numeric Biovolume of organism 15
9.9 SampleandRecordRetention
After the taxonomist analyzes the vials for a sample, retain the vials for possible selection into the external quality control evaluation. When the external evaluation is complete, process the vials containing the remaining acid‐cleaned material for long‐term storage. The lab technician shall:
1. Work under a fume hood to add two to four drops of 100% buffered formalin to each vial.
2. Add glass beads to the vials to help preserve the diatoms.
3. Tightly cap the vials and seal them by immersing the top 1/3 of the vial in melted wax.
4. Transfer the vials to long‐term storage.
The laboratory shall retain:

2013‐2014 National Rivers & Streams Assessment Laboratory Operations Manual
Version 1.3, May 2014 Page 120 of 224
120
PER
IPHYTON
1. The sample materials, including vials and slides, for a minimum of 3 years from the date the EPA
publishes the final report. During this time, the laboratory shall store the materials in a cool
location away from sunlight. The laboratory shall periodically check the sample materials for
degradation and refill jars and vials with formalin if necessary.
2. Original records, including laboratory notebooks and the reference library, for a minimum of 10
years from the date that EPA publishes the final report.
After the stated time periods, the laboratory shall follow its internal protocols for disposal.
9.10 ExternalTaxonomicQualityControlEvaluation
EPA requires that all NRSA laboratories (“primary laboratories”) participate in the External Taxonomic Quality Control Evaluation. Each taxonomist must participate in the QC evaluation, even if the taxonomist is under subcontract with, or consulting for, another firm.
In contrast to the internal QC evaluation in the earlier sections that verify adherence to the procedures and ensures in‐laboratory consistency between taxonomists, the purpose of the external QC evaluation is to ensure consistency between laboratories and taxonomists. To achieve this objective, EPA compares the primary laboratory results to those from a second laboratory, considered a quasi “gold standard” for taxonomic evaluations.
The External QC Coordinator, who is an EPA staff member, is responsible for selecting and managing the “QC contractor.” To eliminate the appearance of any inherent bias, the QC contractor must be dedicated to QA/QC functions, and thus, must not be a primary laboratory or a field sampling contractor for NRSA. The QC contractor is responsible for complying with instructions from the External QC Coordinator; obtaining and managing the secondary laboratory; coordinating and paying for shipments of the QC samples between locations; comparing sample identifications by different laboratories; facilitating reconciliation teleconferences; and preparing brief summary reports.
The External QC Coordinator will arrange for the QC contractor to conduct a minimum of two QC evaluations in 2014. To the extent practicable, the External QC Coordinator and QC contractor will schedule batch evaluations evenly throughout the project period.
Each QC evaluation consists of the following steps:
1. In consultation with the QC contractor, the External QC Coordinator determines an appropriate
time to conduct the evaluation based upon the total number of samples assigned to the
laboratory, the delivery schedule, processing schedule, and the following constraints:
a. Availability of samples from other laboratories. For example, if three state laboratories are
each processing less than 30, the External QC Coordinator might combine their samples into
one batch for the QC evaluation.
b. If a primary laboratory is responsible for processing 100 samples or more for the NRSA, the
External QC Coordinator will split their samples into several batches (e.g., each 50 to 100
samples) so that EPA can evaluate and correct performance on an ongoing basis.
2. The External QC Coordinator provides the QC contractor with a list of laboratories and
processed samples. Sample identification includes the site identification code, sample number,
and taxonomist who performed the identifications.
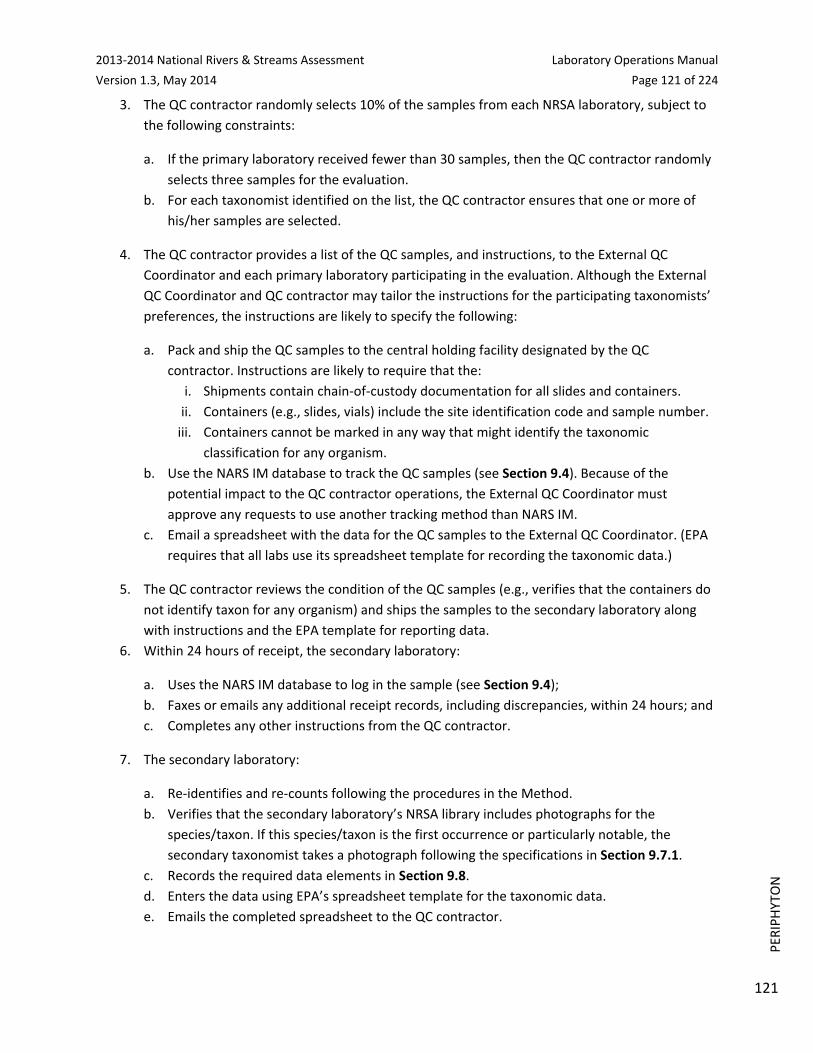
2013‐2014 National Rivers & Streams Assessment Laboratory Operations Manual
Version 1.3, May 2014 Page 121 of 224
121
PER
IPHYTON
3. The QC contractor randomly selects 10% of the samples from each NRSA laboratory, subject to
the following constraints:
a. If the primary laboratory received fewer than 30 samples, then the QC contractor randomly
selects three samples for the evaluation.
b. For each taxonomist identified on the list, the QC contractor ensures that one or more of
his/her samples are selected.
4. The QC contractor provides a list of the QC samples, and instructions, to the External QC
Coordinator and each primary laboratory participating in the evaluation. Although the External
QC Coordinator and QC contractor may tailor the instructions for the participating taxonomists’
preferences, the instructions are likely to specify the following:
a. Pack and ship the QC samples to the central holding facility designated by the QC
contractor. Instructions are likely to require that the:
i. Shipments contain chain‐of‐custody documentation for all slides and containers.
ii. Containers (e.g., slides, vials) include the site identification code and sample number.
iii. Containers cannot be marked in any way that might identify the taxonomic
classification for any organism.
b. Use the NARS IM database to track the QC samples (see Section 9.4). Because of the
potential impact to the QC contractor operations, the External QC Coordinator must
approve any requests to use another tracking method than NARS IM.
c. Email a spreadsheet with the data for the QC samples to the External QC Coordinator. (EPA
requires that all labs use its spreadsheet template for recording the taxonomic data.)
5. The QC contractor reviews the condition of the QC samples (e.g., verifies that the containers do
not identify taxon for any organism) and ships the samples to the secondary laboratory along
with instructions and the EPA template for reporting data.
6. Within 24 hours of receipt, the secondary laboratory:
a. Uses the NARS IM database to log in the sample (see Section 9.4);
b. Faxes or emails any additional receipt records, including discrepancies, within 24 hours; and
c. Completes any other instructions from the QC contractor.
7. The secondary laboratory:
a. Re‐identifies and re‐counts following the procedures in the Method.
b. Verifies that the secondary laboratory’s NRSA library includes photographs for the
species/taxon. If this species/taxon is the first occurrence or particularly notable, the
secondary taxonomist takes a photograph following the specifications in Section 9.7.1.
c. Records the required data elements in Section 9.8.
d. Enters the data using EPA’s spreadsheet template for the taxonomic data.
e. Emails the completed spreadsheet to the QC contractor.

2013‐2014 National Rivers & Streams Assessment Laboratory Operations Manual
Version 1.3, May 2014 Page 122 of 224
122
PER
IPHYTON
8. The QC contractor compares the original taxonomic results (i.e., data) generated by the primary
laboratory to the taxonomic results generated by the secondary laboratory for each sample. As
part of this evaluation, the QC contractor calculates PctDiff, PDE, and PTD using the equations in
Section 9.3 and compares their values to the QC requirements in the Attachment.
9. If any samples exceed the PctDiff, PDE, or PTD limits in the QAPP, the QC contractor consults
with the External QC Coordinator to determine if reconciliation calls are necessary to resolve
differences. The External QC Coordinator may decide that a reconciliation call is unnecessary if
there appears to be an obvious explanation for differences, few samples are affected, or other
reasons.
10. The QC contractor schedules and facilitates reconciliation teleconferences with EPA and the
laboratories.
a. In preparation for the teleconferences:
i. The QC contractor provides the participants with a spreadsheet that includes:
ii. List of samples and taxon identifications for discussion;
iii. Relevant data from the primary and secondary laboratories; and
iv. PctDiff, PDE, and PTD values.
v. The primary and secondary laboratories provide participants with the relevant
reference (or citation) and photograph for each taxonomic identification for the
discussion.
vi. The QC contractor emails a meeting announcement for a convenient time for all
participants. The email identifies instructions for accessing the External QC
Coordinator’s toll‐free teleconference line.
b. Within a week after the teleconference, the QC contractor sends an email to the External
QC Coordinator and other teleconference participants that summarizes:
i. Agreements to use common nomenclature for discrepancies;
ii. Commitments to reevaluate identifications by reexamining samples;
iii. Application of changes that are appropriate for all samples, not just the QC samples
(e.g., common nomenclature)
iv. Items that will not be resolved for some reason (e.g., sample degraded during
shipment).
11. After completing the reconciliation calls, the participants complete the following steps:
a. Secondary laboratory:
i. Reexamines samples as deemed necessary during the reconciliation call
ii. Updates its database with changes to:
1) QC samples per reexamination and other items in the QC contractor email; and
2) Non‐QC samples as appropriate (e.g., nomenclature changes apply to all
samples, not just QC samples).
iii. Provides database to QC contractor.
b. QC contractor confirms that the secondary laboratory (i.e., its subcontractor) completed its
assignments before allowing the secondary laboratory to move to the next step.

2013‐2014 National Rivers & Streams Assessment Laboratory Operations Manual
Version 1.3, May 2014 Page 123 of 224
123
PER
IPHYTON
c. Secondary laboratory stores its original records, including laboratory notebooks and the
reference library, for a minimum of 10 years from the date that EPA publishes the final
report.
d. Secondary laboratory and QC contractor follow steps 4 and 5 above to return the samples to
the primary laboratory.
e. After receiving the samples (and tracking per step 4), the primary laboratory:
i. Reexamines samples as deemed necessary during the reconciliation call;
ii. Updates its database with changes to:
1) QC samples per reexamination and other items in the QC contractor email; and
2) Non‐QC samples as appropriate (e.g., nomenclature changes apply to all
samples, not just QC samples)
iii. Provides the revised database to the External QC Coordinator (not the QC contractor).
It also confirms that it has completed all relevant items identified in the QC
contractor’s email summary of the teleconferences (from Step 10.b).
f. QC contractor provides EPA with a report or memorandum that:
i. Identifies the participating laboratories, with the following information about each
laboratory:
1) Laboratory name
2) Address
3) Contact person (name, telephone, and email)
ii. Quantifies the taxonomic precision (PctDiff, PDE, and PTD) as they were prior to the
reconciliation call;
iii. Assesses data acceptability;
iv. Highlights taxonomic problem areas;
v. Identifies any discrepancies for which the External QC Coordinator determined that a
reconciliation teleconference was not necessary;
vi. Identifies primary and secondary laboratory commitments to change its identifications
or provide additional review of any organisms; and
vii. Provides recommendations for improving precision for other samples not included in
the QC evaluation.
12. After review, the External QC Coordinator:
a. Submits the report, and draft technical direction with next steps for the laboratory, to the
EPA staff managing or coordinating with the primary laboratory.
b. Determines if significant differences within the batch of QC samples warrant re‐
identification of samples by the primary laboratory and a second QC evaluation by the
secondary laboratory. If deemed necessary, EPA will instruct the primary laboratory to
include the samples for review with the next batch of QC samples.
As an additional verification on the generation of the data, EPA may conduct assistance visits at the laboratories. If EPA decides to conduct an assistance visit, a qualified EPA scientist or contractor will

2013‐2014 National Rivers & Streams Assessment Laboratory Operations Manual
Version 1.3, May 2014 Page 124 of 224
124
PER
IPHYTON
administer a checklist based upon the steps described in this chapter. EPA will develop the checklist and append it to the LOM prior to conducting assistance visits. The objective of the visit would be to:
Confirm the laboratory is properly implementing the steps in the method.
Assist with questions from laboratory personnel.
Suggest corrections if any errors are made.
9.11 References
Acker, F., B. Russell, and E. Hagan. 2002. Protocols for the analysis of algal samples collected as part of the U.S. Geological Survey National Water‐Quality Assessment Program: P‐13‐42 Diatom Cleaning by Nitric Acid Digestion with a Microwave Apparatus. The Academy of Natural Sciences. Report No. 02‐06. Retrieved December 2, 2013, from http://diatom.ansp.org/nawqa/pdfs/P‐13‐42.pdf.
Charles, D. F., C. Knowles, and R. Davis. 2002. Protocols for the analysis of algal samples collected as part of the U.S. Geological Survey National Water‐Quality Assessment Program. Patrick Center for Environmental Research Report No. 02–06. Patrick Center for Environmental Research, The Academy of Natural Sciences, Philadelphia, Pennsylvania. Retrieved December 2, 2013, from http://water.usgs.gov/nawqa/protocols/algprotocol/algprotocol.pdf.
Moulton, S.R., II, J.G. Kennen, R.M. Goldstein, J.A. Hambrook. 2002. Revised protocols for sampling algal, invertebrate, and fish communities in the National Water‐Quality Assessment program, U.S. Geological Survey Open‐File Report 02‐150. Retrieved December 2, 2013, from http://pubs.usgs.gov/of/2002/ofr‐02‐150/pdf/ofr02‐150.pdf.
PCER, ANSP. 2002. Analysis of Diatoms in USGS NAWQA Program Quantitative Targeted‐Habitat (RTH and DTH) Samples. Protocol No. P‐13‐39. Retrieved December 2, 2013, from http://diatom.ansp.org/nawqa/pdfs/P‐13‐39.pdf.
PCER, ANSP. 2002. Analysis of Soft Algae and Enumeration of Total Number of Diatoms in USGS NAWQA Program Quantitative Targeted‐habitat (RTH and DTH) Samples. Protocol P‐13‐63. Retrieved December 2, 2013, from http://diatom.ansp.org/nawqa/pdfs/P‐13‐63.pdf.
PCER, ANSP. 2002. Analysis of USGS NAWQA Program Phytoplankton Samples. Protocol No. P‐13‐52. Retrieved December 2, 2013, from http://diatom.ansp.org/nawqa/pdfs/P‐13‐52.pdf.
PCER, ANSP. 2002. Diatom Cleaning by Nitric Acid Digestion with a Microwave Apparatus. Protocol No. P‐13‐42. Retrieved December 2, 2013, from http://diatom.ansp.org/nawqa/pdfs/P‐13‐42.pdf.
PCER, ANSP. 2002. Preparation of Diatom Slides Using Naphrax™ Mounting Medium. Protocol No. P‐13‐49. Retrieved December 2, 2013, from http://diatom.ansp.org/nawqa/pdfs/P‐13‐49.pdf.
PCER, ANSP. 2002. Preparation of USGS NAWQA Program Algal Samples for Analysis Using Palmer‐Maloney Cells. Protocol No. P‐13‐50. Retrieved December 2, 2013, from http://diatom.ansp.org/nawqa/pdfs/P‐13‐50.pdf.
PCER, ANSP. 2002. Subsampling Procedures for USGS NAWQA Program Periphyton Samples. Protocol No. P‐13‐48. Retrieved December 2, 2013, from http://diatom.ansp.org/nawqa/pdfs/P‐13‐48.pdf.
USEPA. 1973. Biological Field and Laboratory Methods for Measuring the Quality of Surface Waters and Effluents. EPA‐670/4‐73‐001. US. EPA Office of Research and Development. Cincinnati, OH.
USEPA. 2009. National Rivers and Streams Assessment: Laboratory Methods Manual. EPA 841‐B‐07‐010. Retrieved December 2, 2013, from

2013‐2014 National Rivers & Streams Assessment Laboratory Operations Manual
Version 1.3, May 2014 Page 125 of 224
125
PER
IPHYTON
http://water.epa.gov/type/rsl/monitoring/riverssurvey/upload/NRSA200809_LabMethodsManual_20091229_2_web.pdf.
USGS. 2013. BioData‐Aquatic Bioassessment Data for the National available at http://aquatic.biodata.usgs.gov . Version 3.1.2. Accessed 12/20/2013

2013‐2014 National Rivers & Streams Assessment Laboratory Operations Manual
Version 1.3, May 2014 Page 126 of 224
126
PER
IPHYTON
Attachment: Summary of QC Requirements Percent disagreement in enumeration (PDE): measure of taxonomic precision for diatoms comparing the number of organisms, n1, counted in a sample by the primary taxonomist with the number of organisms, n2, counted by the secondary taxonomist.
10021
21
nn
nnPDE
Percent taxonomic disagreement (PTD): measure of taxonomic precision for diatoms comparing the number of agreements (positive comparisons, comppos) of the primary taxonomist and internal or external QC taxonomists. In the following equation, N is the total number of organisms in the larger of the two counts.
1001
N
compPTD pos
Percent Difference (PctDiff): measure of difference for soft algae that compares the enumerations for the taxa within a sample, as reported by the primary taxonomist (a) and secondary laboratory (b), as follows:
1∑ ,#
∑ ,# 100
Table 9.6 Periphyton: measurement data quality objectives – diatoms
Variable or Measurement Precision Accuracy Completeness
Enumeration 75% a 85% b 99%
Identification 75% a 85% b 99%
a As measured by (100%‐PTD); b As measured by (100%‐PDE)
Table 9.7 Periphyton: measurement data quality objectives – soft bodied algae
Variable or Measurement Precision Accuracy Completeness
Identification 50%a 50%b 99%
a As measured by PctDiff
Table 9.8 Periphyton: quality control – all activities
Check or Sample Description Frequency Acceptance Criteria Corrective Action
Internal QC Taxonomist verifies that diatom slide is appropriate for diatom analysis
All samples No obvious problems such as bubbles under the coverslip
Slide is discarded and replaced with a new slide
Duplicate identification by Internal QC Taxonomists
1 in 10 samples per taxonomist, with a minimum of 1 NRSA sample
PctDiff≤50% (soft algae)PDE ≤ 15% (diatoms) PTD ≤ 25% (diatoms)
If any criterion is exceeded, perform a third count and reidentification for the sample.
Independent identification by
All uncertain taxa Uncertain identifications to be confirmed by expert in particular taxa
Record both tentative and independent IDs

2013‐2014 National Rivers & Streams Assessment Laboratory Operations Manual
Version 1.3, May 2014 Page 127 of 224
127
PER
IPHYTON
outside, expert, taxonomist
External QC 10% of all samples completed per laboratory
PctDiff≤50% (soft algae)PDE ≤ 15% (diatoms) PTD ≤ 25% (diatoms)
Attempt to reconcile results during a conference call with EPA and the two laboratories. Document unresolved disagreements for the data analyst to determine if lowest practical level (e.g., species) is appropriate, or if identification should be to the level that both labs found (e.g., class)
Use of widely/commonly accepted taxonomic references by all NRSA labs
For all identifications All keys and references used by each lab must be on bibliography prepared by one or more additional NRSA labs or in BioData (see Section 9.7 for retrieval instructions). This requirement demonstrates the general acceptance of the references by the scientific community.
If a lab proposes to use other references, the lab must identify them in the database.
Prepare reference collection
Each new taxon per laboratory
Complete reference collection to be maintained by each individual laboratory
Internal Taxonomy QC Officer periodically reviews data and reference collection to ensure reference collection is complete and identifications are accurate
Table 9.9 Periphyton: data validation
Check or Sample Description Frequency Acceptance Criteria Corrective Action
Taxonomic "reasonable‐ness" checks
All data Taxa known to occur in given rivers or streams or geographic area
Second or third identification by expert in that taxon

2013‐2014 National Rivers & Streams Assessment Laboratory Operations Manual
Version 1.3, May 2014 Page 128 of 224
128
PER
IPHYTON M
ETA‐GEN
OMICS (Pilot Research Effort)
10.0 PERIPHYTONMETA‐GENOMICS(PILOTRESEARCHEFFORT)Laboratory methods incorporated in an ORD Quality Assurance Project Plan.

2013‐2014 National Rivers & Streams Assessment Laboratory Operations Manual
Version 1.3, May 2014 Page 129 of 224
129
WATER CHEM
ISTR
Y and CHLO
ROPHYLL A
11.0 WATERCHEMISTRYANDCHLOROPHYLLA
11.1 AnalyticalParameters
A total of 18 parameters are determined from each bulk water chemistry sample collected (Table 11.1). In addition, chlorophyll‐a is determined from a separate, discrete sample following the same performance‐based methods approach as proposed for water chemistry analytes.
Table 11.1 Water chemistry: NRSA 2013/14 parameters
Analyte Units Comments
Conductivity S/cm at 25˚C
pH (laboratory) Standard (Std) Units
Turbidity Nephelometric Turbidity Units (NTU)
Dissolved Organic Carbon (DOC)
mg C/L
Ammonium (NH4) mg N/L
Nitrate‐Nitrite (NO3‐NO2) mg N/L
Total Nitrogen (TN) mg/L
Total Phosphorus (TP) µg P/L
Sulfate (SO4) mg SO4/L
Chloride (Cl) mg Cl/L
Nitrate (NO3) mg N/L
Calcium (Ca) mg Ca/L
Magnesium (Mg) mg Mg/L
Sodium (Na) mg Na/L
Potassium (K) mg K/L
Silica (SiO2) mg SiO2/L
Total Suspended Solids (TSS) mg/L
True Color PCU
Chlorophyll a g/L (in extract)
11.2 SampleProcessingandPreservation
Due to the short holding time of these samples, samples will be shipped overnight by the field crews and must be preserved by close of business (COB) the day after sample collection. If expected samples do not arrive or arrive after the acceptable time frame (24 hours after the samples were collected), labs must notify the NARS IM Center (see APPENDIX A: CONTACT INFORMATION).
Upon receipt of samples, the assigned lab personnel inspects each sample and review the tracking form that was included with the samples. The assigned lab personnel will flag samples damaged during the shipping process in NARS IM upon receipt and inspection. The lab personnel then store samples at 4°C in darkness until aliquots are ready to be prepared. If possible, the lab will prepare aliquots the same day as samples are received, but no later than 48 hours after receipt. Labs should be familiar with and ensure that samples meet all defined target holding times. Any sample that does not meet holding time requirements is flagged and evaluated to determine if the exceedance impacts either sample integrity or any potential end uses of the data (USEPA 2002). The NRSA team and water chemistry analysts do not

2013‐2014 National Rivers & Streams Assessment Laboratory Operations Manual
Version 1.3, May 2014 Page 130 of 224
130
WATER CHEM
ISTR
Y and CHLO
ROPHYLL A
reject results from samples that exceeded target holding times outright; the team will review the data and holding times and make a decision about whether EPA will use the data in the NRSA assessment.
11.2.1 WaterChemistrySamples
Figure 11.1 Water chemistry: sample processing procedures
Figure 11.1 illustrates sample preparation processing for the water chemistry indicators, including filtering and acidifying, for the various analytes.
1. Use 0.4μm pore size polycarbonate filters for all filtration. 2. Rinse vacuum filter funnel units thoroughly with reverse‐osmosis (RO) or de‐ionized (DI) water
(ASTM Type II reagent water) five times before each use and in between samples. After placing a filter in the funnel unit, run approximately 100 mL of RO or DI water through the filter, with vacuum pressure, to rinse the filter. Discard the rinse water.
Sample Receipt 4 L Bulk Sample
• Inspect samples and complete tracking form
• Store at 4°C in darkness
Process Sample
Filtration (0.4µm) Not
HDPE bottle Acid washed Preserve with
HDPE bottle Not acid washed Store at 4 °C in
HDPE bottle Acid washed Preserve with
HDPE bottle Acid washed Preser
HDPE bottle Not acid washed Store at 4 °C in
Analyses Calcium (180 days) Magnesium (180 days) Sodium (180
Analyses Chloride (28 days) Nitrate (7 days) Sulfate (28 days) Silica (28 days) Nit t Nit it
AnalysesAmmonia (28 days) Dissolved Organic Carbon (28 days) Nitrate-Nitrite (28 days)
AnalysesTotal Phosphorus (28 days)
AnalysespH (3 days) ANC (7 days) Conductivity (28 days) TSS (7 days) Turbidity (3 days)

2013‐2014 National Rivers & Streams Assessment Laboratory Operations Manual
Version 1.3, May 2014 Page 131 of 224
131
WATER CHEM
ISTR
Y and CHLO
ROPHYLL A
3. Place the appropriate sample bottle under the funnel unit and filter sample directly into the bottle. If a new filter is needed, remove the sample bottle, and rinse the new filter with 100 mL of RO or DI water before continuing.
4. After all filtered and unfiltered aliquots are collected, add ultra‐pure acid (HNO3 or H2SO4, depending on the analyte, see Table 11.2) to the sample in the aliquot container. Cap tightly and invert the bottle several times to mix.
5. Store all aliquots except the cation aliquot (filtered, acidified with HNO3) in a refrigerator at 4°C.
Table 11.2 Water chemistry: acid preservatives added for various analytes
Preservatives
H2SO4 HNO3
DOC Ca
NH4 Mg
Total N Na
Total P K
NO2‐NO3
11.2.2 Chlorophyll‐aSamples
Chlorophyll‐a samples are filtered in the field, placed in a labeled centrifuge tube in a dark cooler, and stored on ice until arrival at the laboratory. Store the filter in the centrifuge tube in the freezer at –20 ± 2°C for no more than thirty days before analysis.
11.3 Performance‐basedMethods
As an alternative to specifying laboratory methods for sample analysis, a performance‐based approach that defines a set of laboratory method performance requirements for data quality is utilized for this survey. Method performance requirements for this project identify lower reporting limit (LRL), precision, and bias objectives for each parameter (Table 11.4). The LRL is the lowest value that needs to be quantified (as opposed to just detected), and represents the value of the lowest non‐zero calibration standard used. It is set to double the long‐term method detection limit (LT‐MDL), following guidance presented in Oblinger, Childress et al. (1999).
Precision and bias objectives are expressed in both absolute and relative terms following Hunt and Wilson (1986). The transition value is the value at which performance objectives for precision and bias switch from absolute (≤ transition value) to relative (> transition value). For pH, the objectives are established for samples with higher and lower pH levels.
For duplicate samples, precision is estimated as the pooled standard deviation (calculated as the root‐mean square) of all samples at the lower concentration range, and as the pooled percent relative standard deviation of all samples at the higher concentration range. For standard samples (of known concentration), precision is estimated as the standard deviation of repeated measurements across batches at the lower concentration range, and as percent relative standard deviation of repeated measurements across batches at the higher concentration range. Bias (i.e., systematic error) is estimated as the difference between the mean measured value and the target value of a performance evaluation and/or internal reference samples at the lower concentration range measured across sample batches, and as the percent difference at the higher concentration range.
Analytical methods used at the central laboratory (EPA ORD‐Corvallis) are summarized in Table 11.3. Participating laboratories may use alternative analytical methods for each target analyte as long as they can satisfactorily demonstrate the alternative method is able to achieve the performance requirements

2013‐2014 National Rivers & Streams Assessment Laboratory Operations Manual
Version 1.3, May 2014 Page 132 of 224
132
WATER CHEM
ISTR
Y and CHLO
ROPHYLL A
as listed in Table 11.4. Information is provided by the lab to the NRSA Quality Team. The team reviews the information to determine whether the labs meet the necessary requirements. The information from this process is maintained in the NRSA 2012 QA files by the EPA HQ NARS QA Lead.
Table 11.3 Water chemistry: NRSA 2013/14 analytical methods (Central Laboratory, EPA ORD‐Corvallis)
Analyte
Summary of Methodd Referencese
WRS SOPf
pH (lab) Automated, using ManSci PC‐Titrate w/ Titra‐Sip autotitrator and Ross combination pH electrode. Initial pH determination for ANC titration
EPA 150.6 (modified) WRS 16A.0 (April 2011)
Specific conductance @ 25°C
Electrolytic, Man‐Tech TitraSip automated analysis
OR manual analysis, electrolytic
EPA 120.6 WRS 16A.0 (April 2011)
WRS 11A.4 (April 2011)
Acid neutralizing capacity (ANC)
Automated acidimetric titration to pH<3.5, with modified Gran plot analysis
U.S. EPA (1987) WRS 16A.0 (April 2011)
Turbidity Nephelometric; Man‐Tech TitraSip automated analysis,
OR
Manual analysis using Hach turbidimeter (high turbidity samples)
APHA 214 A, EPA 180.1 U.S. EPA (1987)
WRS 16A.0 (April 2011)
WRS 13A.3 (April 2011)
Total suspended solids (TSS)
Gravimetric, dried at 104 °C EPA 160.2; APHA 209‐C WRS 14B.4 (February 2011)
True color (Hach Kit) Visual comparison to calibrated glass color disk. APHA 204 A (modified), EPA 110.2 (modified), U.S. EPA (1987)
WRS 15A.3 (April 2011)
Dissolved Organic Carbon (DOC)g
UV promoted persulfate oxidation to CO2 with infrared detection
APHA 5310‐C
U.S. EPA (1987)
WRS 21A.4 (May 2011)
Nitrate+Nitrite, as N (fresh waters)
Ion Chromatography
OR
FIA automated colorimetric (cadmium reduction)
EPA 300.6; SW‐846 9056A; APHA 4110B
EPA 353.2
APHA 4500‐NO3‐N‐E
Lachat 10‐107‐04‐1‐C
WRS 36A.0 (April 2011
WRS 40A.5 (May 2011)
Ammonia, as N (fresh waters)
FIA automated colorimetric (salicylate, dichloroisocyanurate)
Lachat 10‐107‐06‐3‐D WRS 30A.4 (April 2011)
Silica, dissolved (SiO2)
Fresh waters
FIA automated colorimetric (molybdate, stannous chloride)
EPA366.0,APHA 425 C
Lachat 10‐114‐27‐1‐B
WRS 32A.5 (February 2010)
Total nitrogen (TN) Persulfate Digestion; FIA Automated Colorimetric Analysis (Cadmium Reduction, sulfanilamide)
EPA353.2 (modified)
APHA 4500‐N‐C (modified)
ASTM WK31786
U.S. EPA (1987)
Lachat 10‐107‐04‐1‐C (modified)
WRS 34A.5 (April 2011)
d FIA=Flow injection analysis. AAS=Atomic Absorption Spectrometry
e U.S. EPA, 1987. Handbook of Methods for Acid Deposition Studies: Laboratory Analyses for Surface Water Chemistry. EPA/600/4‐87/026. U.S. Environmental Protection Agency, Office of Research and Development, Washington D.C. APHA= American Public Health Association (Standard Methods). ASTM=American Society of Testing and Materials.
f WRS= Willamette Research Station. References are to laboratory SOP being used at central laboratory. Available upon request. (contact the Project Lead)
g For DOC, "dissolved" is defined as that portion passing through a 0.45 μm nominal pore size filter. For other analytes, "dissolved" is defined as that portion passing through a 0.4 μm pore size filter (Nucleopore or equivalent).
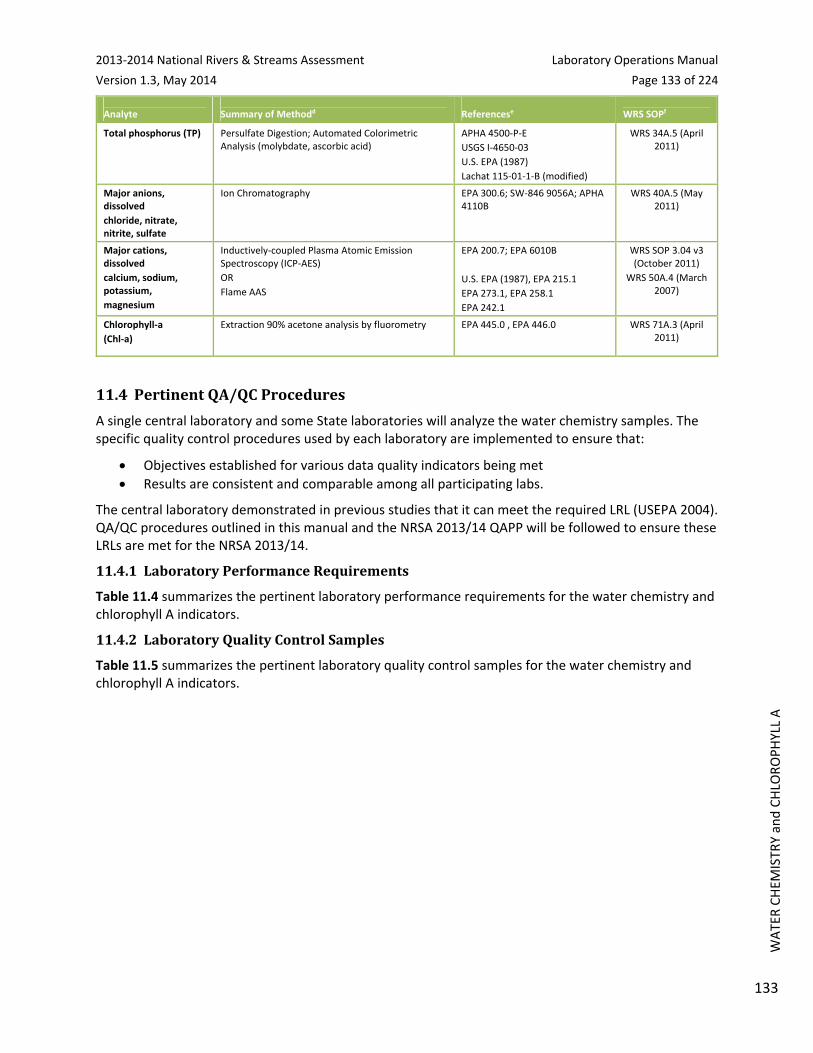
2013‐2014 National Rivers & Streams Assessment Laboratory Operations Manual
Version 1.3, May 2014 Page 133 of 224
133
WATER CHEM
ISTR
Y and CHLO
ROPHYLL A
Analyte
Summary of Methodd Referencese
WRS SOPf
Total phosphorus (TP) Persulfate Digestion; Automated Colorimetric Analysis (molybdate, ascorbic acid)
APHA 4500‐P‐E
USGS I‐4650‐03
U.S. EPA (1987)
Lachat 115‐01‐1‐B (modified)
WRS 34A.5 (April 2011)
Major anions, dissolved
chloride, nitrate, nitrite, sulfate
Ion Chromatography EPA 300.6; SW‐846 9056A; APHA 4110B
WRS 40A.5 (May 2011)
Major cations, dissolved
calcium, sodium, potassium,
magnesium
Inductively‐coupled Plasma Atomic Emission Spectroscopy (ICP‐AES)
OR
Flame AAS
EPA 200.7; EPA 6010B
U.S. EPA (1987), EPA 215.1
EPA 273.1, EPA 258.1
EPA 242.1
WRS SOP 3.04 v3 (October 2011)
WRS 50A.4 (March 2007)
Chlorophyll‐a
(Chl‐a)
Extraction 90% acetone analysis by fluorometry EPA 445.0 , EPA 446.0 WRS 71A.3 (April 2011)
11.4 PertinentQA/QCProcedures
A single central laboratory and some State laboratories will analyze the water chemistry samples. The specific quality control procedures used by each laboratory are implemented to ensure that:
Objectives established for various data quality indicators being met
Results are consistent and comparable among all participating labs.
The central laboratory demonstrated in previous studies that it can meet the required LRL (USEPA 2004). QA/QC procedures outlined in this manual and the NRSA 2013/14 QAPP will be followed to ensure these LRLs are met for the NRSA 2013/14.
11.4.1 LaboratoryPerformanceRequirements
Table 11.4 summarizes the pertinent laboratory performance requirements for the water chemistry and chlorophyll A indicators.
11.4.2 LaboratoryQualityControlSamples
Table 11.5 summarizes the pertinent laboratory quality control samples for the water chemistry and chlorophyll A indicators.

2013‐2014 National Rivers & Streams Assessment Laboratory Operations Manual
Version 1.3, May 2014 Page 134 of 224
134
WATER CHEM
ISTR
Y and CHLO
ROPHYLL A
Table 11.4 Water chemistry & chlorophyll‐a: laboratory method performance requirements
Analyte Units
Potential Range of Samplesh
Lower Reporting Limiti
Transition Valuej
Precision Objectivek
Bias Objectivel
Conductivity S/cm at 25˚C 1 to 15,000 2.0 20 ± 2 or ±10% ± 2 or 5%
pH (laboratory) Std Units 3.5 to 10 N/A 5.75 >5.75= ±0.15
≤5.75 =±0.07
>5.75 = ±0.05
≤5.75 = ±0.15
Turbidity Nephelometric Turbidity Units (NTU)
0 to 44,000 2.0 20 ± 2 or ±10% ± 2 or ±10%
Dissolved Organic Carbon (DOC)
mg C/L 0.1 to 109 0.20 1 > 1
± 0.10 or ±10%
± 0.10 or ±10%
Ammonium (NH4)
mg N/L 0 to 17 0.02 (1.4 µeq/L)
0.10 ± 0.01 or ±10%
± 0.01 or ±10%
Nitrate‐Nitrite (NO3‐NO2)
mg N/L 0 to 360 (as nitrate)
0.02 0.10 ± 0.01 or ±10%
± 0.01 or ±10%
Total Nitrogen (TN)
mg/L 0.1 to 90 0.02 0.10 ± 0.01 or ±10%
± 0.01 or ±10%
Total Phosphorus (TP)
µg P/L 0 to 22,000 4 20 ± 2 or ±10% ± 2 or ±10%
h Estimated from samples analyzed at the WED‐Corvallis laboratory between 1999 and 2005 for TIME, EMAP‐West, and WSA streams from across the U.S.
i The lower reporting limit is the lowest value that needs to be quantified (as opposed to just detected), and represents the value of the lowest nonzero calibration standard used. It is set to 2 times the long‐term method detection limit, following USGS Open File Report 99‐193 New Reporting Procedures Based on Long‐Term Method Detection Levels and Some Considerations for Interpretations of Water‐Quality Data Provided by the U.S. Geological Survey National Water Quality Laboratory.
j Value at which performance objectives for precision and bias switch from absolute ( transition value) to relative > transition value). Two‐tiered approach based on Hunt, D.T.E. and A.L. Wilson. 1986. The Chemical Analysis of Water: General Principles and Techniques. 2nd ed. Royal Society of Chemistry, London, England.
k For standard samples, precision is estimated as the standard deviation of repeated measurements across batches at the lower concentration range, and as percent relative standard deviation of repeated measurements across batches at the higher concentration range.
For pH precision, the looser criteria applies to more highly alkaline samples. For NRSA, that is less of a concern than the ability to measure acidic samples accurately and precisely.
l Bias (systematic error) is estimated as the difference between the mean measured value and the target value of a performance evaluation and/or internal reference samples at the lower concentration range measured across sample batches, and as the percent difference at the higher concentration range.

2013‐2014 National Rivers & Streams Assessment Laboratory Operations Manual
Version 1.3, May 2014 Page 135 of 224
135
WATER CHEM
ISTR
Y and CHLO
ROPHYLL A
Analyte Units
Potential Range of Samplesh
Lower Reporting Limiti
Transition Valuej
Precision Objectivek
Bias Objectivel
Sulfate (SO4) mg SO4/L 0 to 5,000 0.50 (10 µeq/L)
2.5 ± 0.25 or ±10%
± 0.25 or ±10%
Chloride (Cl) mg Cl/L 0 to 5,000 0.20 (6 µeq/L)
1 ± 0.10 or ±10%
± 0.10 or ±10%
Nitrate (NO3) mg N/L 0 to 360 0.02 (4 µeq/L)
0.1 ± 0.01 or ±10%
± 0.01 ±10%
Calcium (Ca) mg Ca/L 0.04 to 5,000
0.10 (5 µeq/L)
0.5 ± 0.05 or ±10%
± 0.05 or ±10%
Magnesium (Mg)
mg Mg/L 0.1 to 350 0.10 (8 µeq/L)
0.5 ± 0.05 or ±10%
± 0.05 or ±10%
Sodium (Na) mg Na/L 0.08 to 3,500
0.10 (4 µeq/L)
0.5 ± 0.05 or ±10%
± 0.05 or ±10%
Potassium (K) mg K/L 0.01 to 120 0.10 (2 µeq/L)
0.5 ± 0.05 or ±10%
± 0.05 or ±10%
Silica (SiO2) mg SiO2/L 0.01 to 100 0.10 0.5 ± 0.05 or ±10%
± 0.05 or ±10%
Total Suspended Solids (TSS)
mg/L 0 to 27,000 2 10 ± 1 or ±10% ± 1 or ±10%
True Color PCU 0 to 350 5 50 ±5 or ±10% ±5 or ±10%
Chlorophyll a g/L (in extract) 0.7 to 11,000
0.5 15 ± 1.5 or ±10% ± 1.5 or ±10%
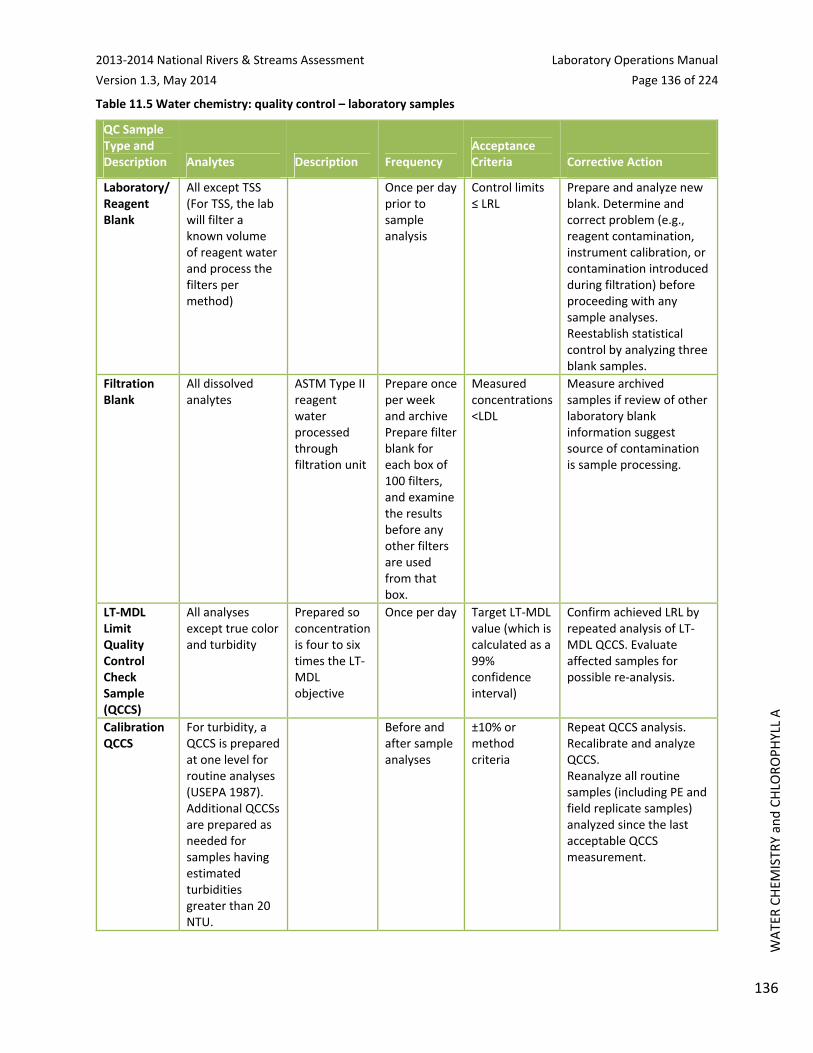
2013‐2014 National Rivers & Streams Assessment Laboratory Operations Manual
Version 1.3, May 2014 Page 136 of 224
136
WATER CHEM
ISTR
Y and CHLO
ROPHYLL A
Table 11.5 Water chemistry: quality control – laboratory samples
QC Sample Type and Description Analytes Description Frequency
Acceptance Criteria Corrective Action
Laboratory/ Reagent Blank
All except TSS (For TSS, the lab will filter a known volume of reagent water and process the filters per method)
Once per day prior to sample analysis
Control limits ≤ LRL
Prepare and analyze new blank. Determine and correct problem (e.g., reagent contamination, instrument calibration, or contamination introduced during filtration) before proceeding with any sample analyses. Reestablish statistical control by analyzing three blank samples.
Filtration Blank
All dissolved analytes
ASTM Type II reagent water processed through filtration unit
Prepare once per week and archive Prepare filter blank for each box of 100 filters, and examine the results before any other filters are used from that box.
Measured concentrations <LDL
Measure archived samples if review of other laboratory blank information suggest source of contamination is sample processing.
LT‐MDL Limit Quality Control Check Sample (QCCS)
All analyses except true color and turbidity
Prepared so concentration is four to six times the LT‐MDL objective
Once per day Target LT‐MDL value (which is calculated as a 99% confidence interval)
Confirm achieved LRL by repeated analysis of LT‐MDL QCCS. Evaluate affected samples for possible re‐analysis.
Calibration QCCS
For turbidity, a QCCS is prepared at one level for routine analyses (USEPA 1987). Additional QCCSs are prepared as needed for samples having estimated turbidities greater than 20 NTU.
Before and after sample analyses
±10% or method criteria
Repeat QCCS analysis.Recalibrate and analyze QCCS. Reanalyze all routine samples (including PE and field replicate samples) analyzed since the last acceptable QCCS measurement.

2013‐2014 National Rivers & Streams Assessment Laboratory Operations Manual
Version 1.3, May 2014 Page 137 of 224
137
WATER CHEM
ISTR
Y and CHLO
ROPHYLL A
QC Sample Type and Description Analytes Description Frequency
Acceptance Criteria Corrective Action
Laboratory Duplicate Sample
All analyses One per batch
Control limits < precision objective
If results are below LRL:Prepare and analyze split from different sample (volume permitting). Review precision of QCCS measurements for batch. Check preparation of split sample. Qualify all samples in batch for possible reanalysis.
Standard Reference Material (SRM)
When available for a particular analyte
One analysis in a minimum of five separate batches
Manufacturers certified range
Analyze standard in next batch to confirm suspected imprecision or bias. Evaluate calibration and QCCS solutions and standards for contamination and preparation error. Correct before any further analyses of routine samples are conducted. Reestablish control by three successive reference standard measurements that are acceptable. Qualify all sample batches analyzed since the last acceptable reference standard measurement for possible reanalysis.
Matrix Spike Samples
Only prepared when samples with potential for matrix interferences are encountered
One per batch
Control limits for recovery cannot exceed 100±20%
Select two additional samples and prepare fortified subsamples. Reanalyze all suspected samples in batch by the method of standard additions. Prepare three subsamples (unfortified, fortified with solution approximately equal to the endogenous concentration, and fortified with solution approximately twice the endogenous concentration).

2013‐2014 National Rivers & Streams Assessment Laboratory Operations Manual
Version 1.3, May 2014 Page 138 of 224
138
WATER CHEM
ISTR
Y and CHLO
ROPHYLL A
11.4.3 DataReporting,Review,andManagement
Checks made of the data in the process of review and verification are summarized in Table 11.6. Data reporting units and significant figures are given in Table 11.7. The NRSA 2013/14 Project QA Officer is ultimately responsible for ensuring the validity of the data, although performance of the specific checks may be delegated to other staff members.
Table 11.6 Water chemistry: quality control – data validation
Activity or Procedure Requirements and Corrective Action
Range checks, summary statistics, and/or exploratory data analysis (e.g., box and whisker plots)
Correct reporting errors or qualify as suspect or invalid.
Review holding times Qualify value for additional review
Ion balance: Calculate percent ion balance difference (%IBD) using data from cations, anions, pH, and ANC.
If total ionic strength ≤100 eq/L ▬ %IBD ≤ ±25%.
If total ionic strength > 100 eq/L ▬ %IBD ≤±10%.
Determine which analytes, if any, are the largest contributors to the ion imbalance. Review suspect analytes for analytical error and reanalyze. ▬ Flag = unacceptable %IBD
If analytical error is not indicated, qualify sample to attribute imbalance to unmeasured ions. Reanalysis is not required. ▬ Flag = %IBD outside acceptance criteria due to unmeasured ions
Conductivity check: Compare measured conductivity of each sample to a calculated conductivity based on the equivalent conductance of major ions in solution (Hillman et al., 1987).
If measured conductivity ≤ 25 S/cm,
▬ ([measured � calculated] measured) ≤ ±25%.
If measured conductivity > 25 S/cm,
▬ ([measured � calculated] measured) ≤ ±15%.
Determine which analytes, if any, are the largest contributors to the difference between calculated and measured conductivity.
Review suspect analytes for analytical error and reanalyze. If analytical error is not indicated, qualify sample to attribute conductivity difference to unmeasured ions. Reanalysis is not required.
Review data from QA samples (laboratory PE samples, and inter‐laboratory comparison samples)
Indicator QC Coordinator determines impact and possible limitations on overall usability of data based on the specific issue.
Table 11.7 Water chemistry: data reporting criteria
Measurement Units No. Significant Figures
Maximum No. Decimal Places
DO mg/L 2 1
Temperature °C 2 1
pH pH units 3 2
Carbon, total & dissolved organic mg/L 3 1
ANC eq/L 3 1
Conductivity S/cm at 25 °C 3 1

2013‐2014 National Rivers & Streams Assessment Laboratory Operations Manual
Version 1.3, May 2014 Page 139 of 224
139
WATER CHEM
ISTR
Y and CHLO
ROPHYLL A
Measurement Units No. Significant Figures
Maximum No. Decimal Places
Calcium, magnesium, sodium, potassium, ammonium, chloride, nitrate, and sulfate
eq/L 3 1
Silica mg/L 3 2
Total phosphorus g/L 3 0
Total nitrogen mg/L 3 2
Nitrate‐Nitrite mg/L 3 2
Ammonium mg/L 3 2
Turbidity NTU 3 0
True color PCU 2 0
TSS mg/L 3 1
Chlorophyll a ug/l 3 2
The ion balance for each sample is computed using the results for major cations, anions, and the measured acid neutralizing capacity. The percent ion difference (%IBD) for a sample is calculated as:
Equation 11.1 Percent ion difference (%IBD)
HcationsanionsANC
ANCanionscationsIBD
2%
where ANC is the acid neutralization capacity; cations are the concentrations of calcium, magnesium,
sodium, potassium, and ammonium (converted from mg/L to eq/L); anions are the concentrations of chloride, nitrate, and sulfate (converted from mg/L to eq/L), and H+ is the hydrogen ion concentration
calculated from the antilog of the sample pH. Factors to convert major ions from mg/L to eq/L are presented in Table 11.8. For the conductivity check, equivalent conductivities for major ions are presented in Table 11.9.
Table 11.8 Water chemistry: constants for converting major ion concentration from mg/L to µeq/L
Analyte Conversion from mg/L to eq/Lm
Calcium 49.9
Magnesium 82.3
Potassium 25.6
Sodium 43.5
Ammonium 55.4
Chloride 28.2
Nitrate 16.1
Sulfate 20.8
m Measured values are multiplied by the conversion factor.

2013‐2014 National Rivers & Streams Assessment Laboratory Operations Manual
Version 1.3, May 2014 Page 140 of 224
140
WATER CHEM
ISTR
Y and CHLO
ROPHYLL A
Table 11.9 Water chemistry: factors to calculate equivalent conductivities of major ions.n
Ion
Equivalent Conductance per mg/L
(S/cm at 25 °C) Ion
Equivalent Conductance per
mg/L (S/cm at 25 °C)
Calcium 2.60 Nitrate 1.15
Magnesium 3.82 Sulfate 1.54
Potassium 1.84 Hydrogen 3.5 x 10⁵ o
Sodium 2.13 Hydroxide 1.92 x 10⁵
Ammonium 4.13 Bicarbonate 0.715
Chloride 2.14 Carbonate 2.82
11.5 LiteratureCited
Hunt, D.T.E. and A.L. Wilson. 1986. The Chemical Analysis of Water: General Principles and Techniques. 2nd ed.. Royal Society of Chemistry, London, England.
Youden, W.J. 1969. Ranking laboratories by round‐robin tests. In Precision Measurement and Calibration. H.H. Ku, ed. NBS Special Publication 300, Vol. 1. U.S. GPO Washington, D.C.
n From Hillman et al. (1987).
o Specific conductance per mole/L, rather than per mg/L.

2013‐2014 National Rivers & Streams Assessment Laboratory Operations Manual
Version 1.3, May 2014 Page 141 of 224
141
APPEN
DIX A: C
ONTA
CT INFO
RMATION
APPENDIXA:CONTACTINFORMATION
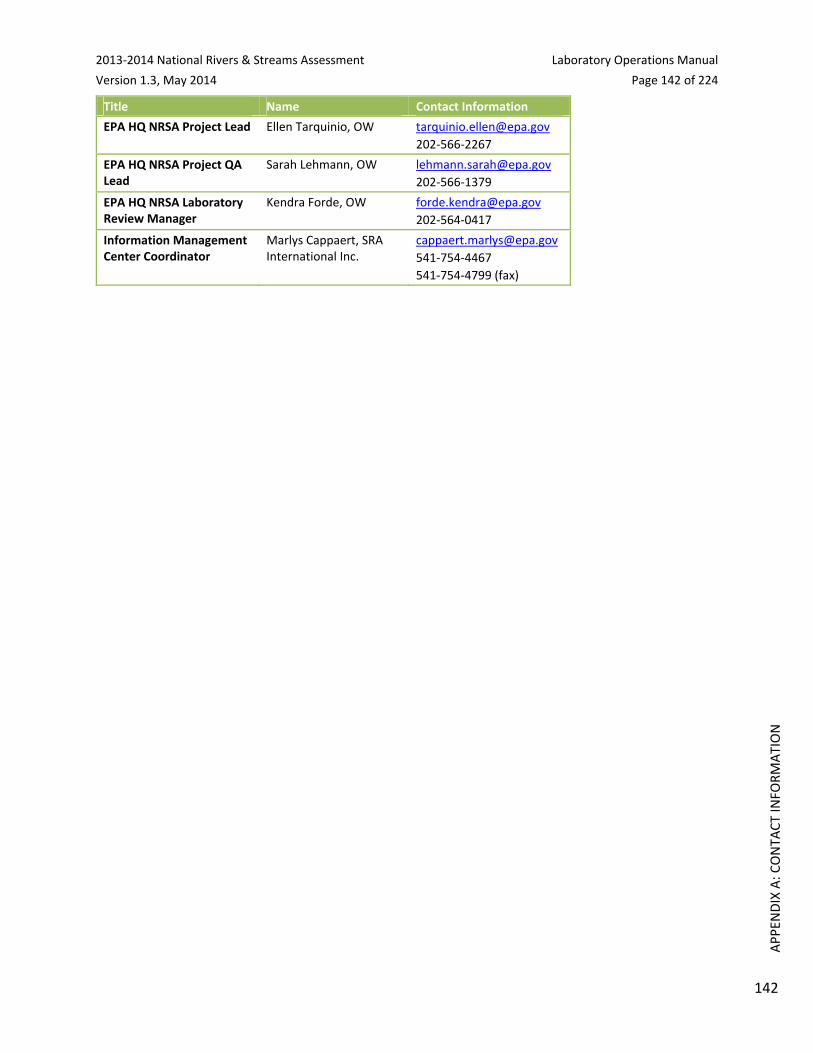
2013‐2014 National Rivers & Streams Assessment Laboratory Operations Manual
Version 1.3, May 2014 Page 142 of 224
142
APPEN
DIX A: C
ONTA
CT INFO
RMATION
Title Name Contact Information
EPA HQ NRSA Project Lead Ellen Tarquinio, OW [email protected]
202‐566‐2267
EPA HQ NRSA Project QA Lead
Sarah Lehmann, OW [email protected]
202‐566‐1379
EPA HQ NRSA Laboratory Review Manager
Kendra Forde, OW [email protected]
202‐564‐0417
Information Management Center Coordinator
Marlys Cappaert, SRA International Inc.
541‐754‐4467
541‐754‐4799 (fax)

2013‐2014 National Rivers & Streams Assessment Laboratory Operations Manual
Version 1.3, May 2014 Page 143 of 224
143
APPEN
DIX B: LABORATO
RY REM
OTE
EVALU
ATION FORMS
APPENDIXB:LABORATORYREMOTEEVALUATIONFORMS

2013‐2014 National Rivers & Streams Assessment Laboratory Operations Manual
Version 1.3, May 2014 Page 144 of 224
144
APPEN
DIX B: LABORATO
RY REM
OTE
EVALU
ATION FORMS
NRSA2013‐2014DocumentRequestForm–ChemistryLabsEPA and its state and tribal partners will conduct a survey of the nation's rivers and streams. This National River and Streams Assessment (NRSA), is designed to provide statistically valid regional and national estimates of the condition of rivers and streams. Consistent sampling and analytical procedures ensure that the results can be compared across the country.
As part of the 2013‐2014 NRSA, the Quality Assurance Team has been requested to conduct a technical assessment to verify quality control practices in your laboratory and its ability to perform chemistry analyses under this project. Our review will be assessing your laboratory’s ability to receive, store, prepare, analyze, and report sample data generated under EPA’s 2013‐2014 NRSA.
The first step of this assessment process will involve the review of your laboratory’s certification and/or documentation. Subsequent actions may include (if needed): reconciliation exercises and/or a site visit. All labs will need to complete the following forms:
All labs will be required to complete the following forms and check the specific parameter in which your lab will be conducting an analysis for the 2013‐2014 NRSA:
Water Chemistry, chlorophyll a, and Ash Free Dry Mass (AFDM) (all of the analytes identified in
the LOM and QAPP)
Microcystin
Fish Tissue Plugs
If your lab has been previously approved within the last 5 years for the water chemistry indicator:
A signature on the attached Lab Signature Form indicates that your lab will follow the quality
assurance protocols required for chemistry labs conducting analyses for the 2013‐2014 NRSA.
A signature on the Quality Assurance Project Plan (QAPP) and the Laboratory Operations
Manual (LOM) Signature Form indicates that you will follow both the QAPP and the LOM.
If you have not been approved within the last 5 years through the lab verification process for the water chemistry indicator, in order for us to determine your ability to participate as a lab in the NRSA, we are requesting that you submit the following documents (if available) for review:
Documentation of a successful quality assurance audit from a prior National Aquatic Resource
Survey (NARS) that occurred within the last 5 years (if you need assistance with this please
contact the individual listed below).
Documentation showing participation in a previous NARS for Water Chemistry for the same
parameters/methods.
Additionally, we request that all labs provide the following information in support of your
capabilities, (these materials are required if neither of the two items above are provided):
A copy of your Laboratory’s accreditations and certifications if applicable (i.e. NELAC, ISO, state
certifications, NABS, etc.).
An updated copy of your Laboratory’s QAPP.
Standard Operating Procedures (SOPs) for your lab for each analysis to be performed (if not
covered in 2013‐2014 NRSA LOM).

2013‐2014 National Rivers & Streams Assessment Laboratory Operations Manual
Version 1.3, May 2014 Page 145 of 224
145
APPEN
DIX B: LABORATO
RY REM
OTE
EVALU
ATION FORMS
Documentation attesting to experience running all analytes for the 2013‐2014 NRSA, including
chloraphyll a and Ash Free Dry Mass (AFDM).
This documentation may be submitted electronically via e‐mail to [email protected] with a cc: to
[email protected] and [email protected]. Questions concerning this request can be
submitted [email protected] (202‐566‐0417) or [email protected] (202‐566‐2267).
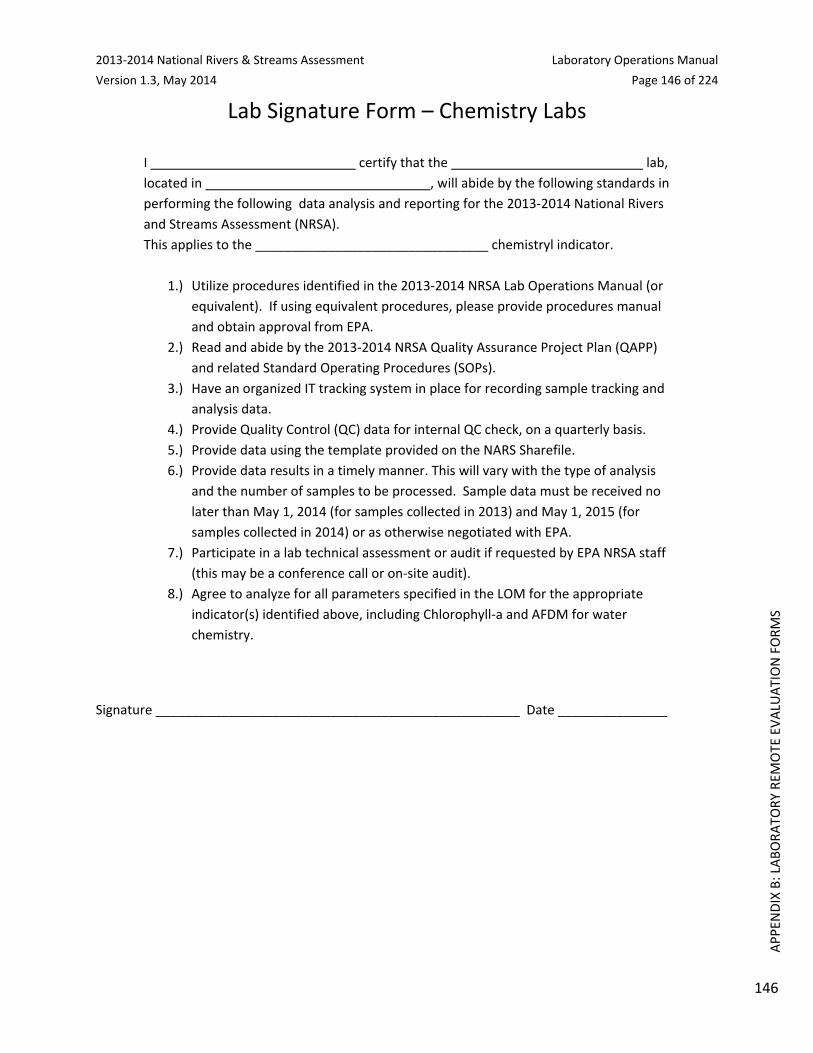
2013‐2014 National Rivers & Streams Assessment Laboratory Operations Manual
Version 1.3, May 2014 Page 146 of 224
146
APPEN
DIX B: LABORATO
RY REM
OTE
EVALU
ATION FORMS
Lab Signature Form – Chemistry Labs
I certify that the lab,
located in , will abide by the following standards in
performing the following data analysis and reporting for the 2013‐2014 National Rivers
and Streams Assessment (NRSA).
This applies to the ________________________________ chemistryl indicator.
1.) Utilize procedures identified in the 2013‐2014 NRSA Lab Operations Manual (or
equivalent). If using equivalent procedures, please provide procedures manual
and obtain approval from EPA.
2.) Read and abide by the 2013‐2014 NRSA Quality Assurance Project Plan (QAPP)
and related Standard Operating Procedures (SOPs).
3.) Have an organized IT tracking system in place for recording sample tracking and
analysis data.
4.) Provide Quality Control (QC) data for internal QC check, on a quarterly basis.
5.) Provide data using the template provided on the NARS Sharefile.
6.) Provide data results in a timely manner. This will vary with the type of analysis
and the number of samples to be processed. Sample data must be received no
later than May 1, 2014 (for samples collected in 2013) and May 1, 2015 (for
samples collected in 2014) or as otherwise negotiated with EPA.
7.) Participate in a lab technical assessment or audit if requested by EPA NRSA staff
(this may be a conference call or on‐site audit).
8.) Agree to analyze for all parameters specified in the LOM for the appropriate
indicator(s) identified above, including Chlorophyll‐a and AFDM for water
chemistry.
Signature __________________________________________________ Date _______________

2013‐2014 National Rivers & Streams Assessment Laboratory Operations Manual
Version 1.3, May 2014 Page 147 of 224
147
APPEN
DIX B: LABORATO
RY REM
OTE
EVALU
ATION FORMS
NRSA2013‐2014DocumentRequestForm‐BiologyLabsEPA and its state and tribal partners will conduct a survey of the nation's rivers and streams. This National River and Streams Assessment (NRSA), is designed to provide statistically valid regional and national estimates of the condition of rivers and streams. Consistent sampling and analytical procedures ensure that the results can be compared across the country.
As part of the 2013‐2014 NRSA, the Quality Assurance Team has been requested to conduct a technical assessment to verify quality control practices in your laboratory and its ability to perform biology analyses under this project. Our review will be assessing your laboratory’s ability to receive, store, prepare, analyze, and report sample data generated under EPA’s 2013‐2014 NRSA.
The first step of this assessment process will involve the review of your laboratory’s certification and/or documentation. Subsequent actions may include (if needed): reconciliation exercises and/or a site visit.
All labs will be required to complete the following forms and check the specific parameter in which your lab will be conducting an analysis for the 2013‐2014 NRSA:
Fish Voucher
Benthic Macroinvertabrates
Periphyton
If your lab has been previously approved within the last 5 years for the specific parameters:
A signature on the attached Lab Signature Form indicates that your lab will follow the quality
assurance protocols required for biology labs conducting analyses for the 2013‐2014 NRSA.
A signature on the Quality Assurance Project Plan (QAPP) and the Laboratory Operations
Manual (LOM) Signature Form indicates you will follow both the QAPP and the LOM.
If you have not been approved within the last 5 years through the lab verification process for the specific parameters, in order for us to determine your ability to participate as a lab in the NRSA, we are requesting that you submit the following documents (if available) for review:
Documentation of a successful quality assurance audit from a prior National Aquatic Resource
Survey (NARS) that occurred within the last 5 years (if you need assistance with this please
contact the individual listed below).
Documentation showing participation in previous NARS for this particular indicator.
Additionally, we request that all labs provide the following information in support of your capabilities, (these materials are required if neither of the two items above are provided):
A copy of your Laboratory’s accreditations and certifications if applicable (i.e. NELAC, ISO, state
certifications, NABS, etc.).
Documentation of NABS (or other) certification for the taxonomists performing analyses (if
applicable).
An updated copy of your Laboratory’s QAPP.
Standard Operating Procedures (SOPs) for your lab for each analysis to be performed (if not
covered in 2013‐2014 NRSA LOM).
Resume of independent fish taxonomist who will verify fish vouchers (if applicable)

2013‐2014 National Rivers & Streams Assessment Laboratory Operations Manual
Version 1.3, May 2014 Page 148 of 224
148
APPEN
DIX B: LABORATO
RY REM
OTE
EVALU
ATION FORMS
This documentation may be submitted electronically via e‐mail to [email protected] with a cc: to [email protected] and [email protected]. Questions concerning this request can be submitted [email protected] (202‐566‐0417) or [email protected] (202‐566‐2267).

2013‐2014 National Rivers & Streams Assessment Laboratory Operations Manual
Version 1.3, May 2014 Page 149 of 224
149
Lab Signature Form – Biology Labs
I certify that the lab,
located in , will abide by the following standards in
performing biology data analysis and reporting for the 2013‐2014 National Rivers and
Streams Assessment (NRSA).
This applies to the ________________________________ biological indicator.
9.) Utilize procedures identified in the 2013‐2014 NRSA Lab Operations Manual (or
equivalent). If using equivalent procedures, please provide procedures manual
and obtain approval from EPA.
10.) Read and abide by the 2013‐2014 NRSA Quality Assurance Project Plan (QAPP)
and related Standard Operating Procedures (SOPs).
11.) Have an organized IT tracking system in place for recording sample tracking and
analysis data.
12.) Use taxonomic standards outlined in the 2013‐2014 NRSA Lab Manual.
13.) Participate in taxonomic reconciliation exercises during the field and data
analysis season, which include conference calls and other lab reviews.
14.) Provide Quality Control (QC) data for internal QC check, including for sorting, on
a monthly basis.
15.) Provide data using the template provided on the NARS Sharefile.
16.) Provide data results in a timely manner. This will vary with the type of analysis
and the number of samples to be processed. Sample data must be received no
later than May 1, 2014 (for samples collected in 2013) and May 1, 2015 (for
samples collected in 2014) or as otherwise negotiated with EPA. Samples results
for independent taxonomic QC described in the LOM and QAPP must be
provided to EPA prior to final datasets (fall and winter) to allow for
reconciliation to take place.
17.) Participate in a lab technical assessment or audit if requested by EPA NRSA staff
(this may be a conference call or on‐site audit).
18.) Agree to utilize taxonomic nomenclature and hierarchical established for NRSA
2013‐2014.
Signature __________________________________________________ Date _______________

2013‐2014 National Rivers & Streams Assessment Laboratory Operations Manual
Version 1.3, May 2014 Page 150 of 224
150
APPEN
DIX C: SAMPLE LABORATO
RY FO
RMS
APPENDIXC:SAMPLELABORATORYFORMS
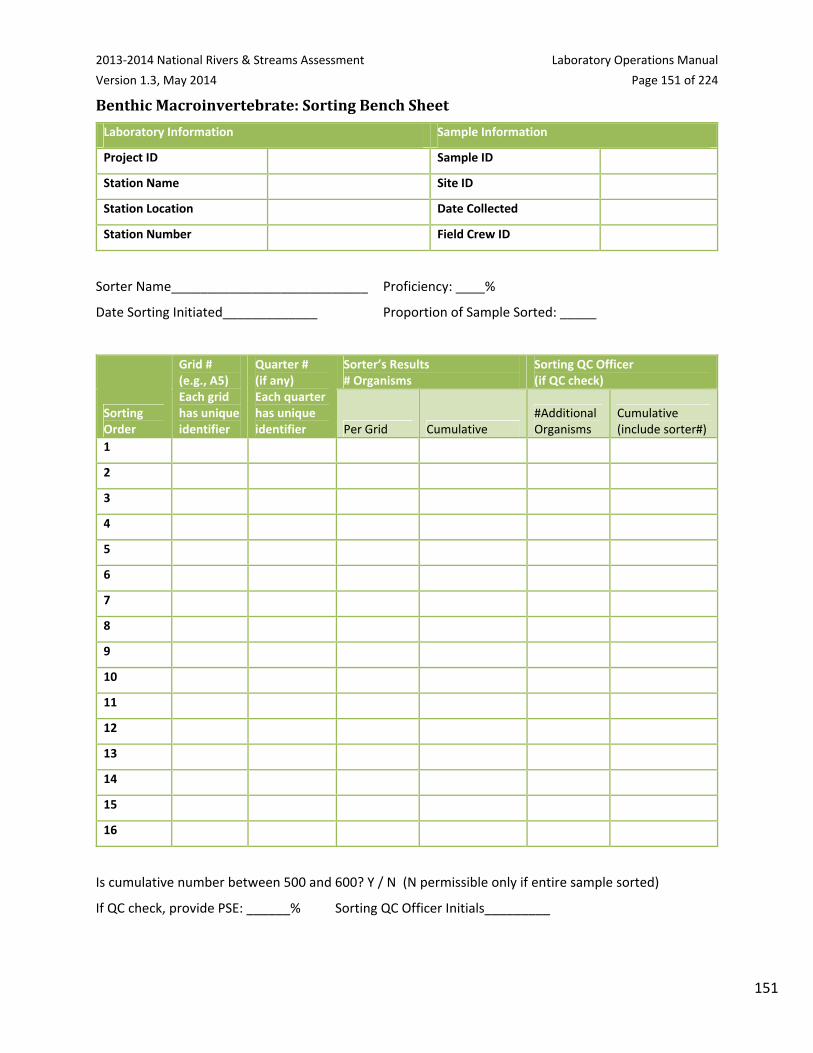
2013‐2014 National Rivers & Streams Assessment Laboratory Operations Manual
Version 1.3, May 2014 Page 151 of 224
151
BenthicMacroinvertebrate:SortingBenchSheet
Laboratory Information Sample Information
Project ID Sample ID
Station Name Site ID
Station Location Date Collected
Station Number Field Crew ID
Sorter Name___________________________ Proficiency: ____%
Date Sorting Initiated_____________ Proportion of Sample Sorted: _____
Sorting Order
Grid # (e.g., A5) Each grid has unique identifier
Quarter # (if any) Each quarter has unique identifier
Sorter’s Results# Organisms
Sorting QC Officer (if QC check)
Per Grid Cumulative #Additional Organisms
Cumulative (include sorter#)
1
2
3
4
5
6
7
8
9
10
11
12
13
14
15
16
Is cumulative number between 500 and 600? Y / N (N permissible only if entire sample sorted)
If QC check, provide PSE: ______% Sorting QC Officer Initials_________

2013‐2014 National Rivers & Streams Assessment Laboratory Operations Manual
Version 1.3, May 2014 Page 152 of 224
152
BenthicMacroinvertebrates:TaxonomyBenchSheet(optional)
Laboratory Information Sample Information
Project ID Sample ID
Station Name Site ID
Station Location Date Collected
Station Number Field Crew ID
Taxonomist Name_________________________
Date 1st Organism Identified in Sample:_________ QC Check? Y / N
TSN (Use # in UniqueIdentifier from WQX)
Taxon (see target taxon in Table 3)
Distinct(Y/N)
Counts of Organisms in the Taxon: Cumulative
Number of Organisms in Sample
Data Qualifier (Codes in Table 4)
Total(any stage) Larvae Pupae Adults
Is cumulative number of organisms ≥ 500? If not, unless the sample was completed sorted, obtain more sorted sample.
Comments:

2013‐2014 National Rivers & Streams Assessment Laboratory Operations Manual
Version 1.3, May 2014 Page 153 of 224
153
Enterrococci(EPAMethod1606)LaboratoryBenchSheet
Site ID ________________ Sample ID_______________ Date_________
Purified DNA Extracts
Batch Sample #
Sample ID #
QA/QC Qual Code
Sample Vol (mL) Filtered
Vol. SAE Buffer Added (µL)
Color of Filter
25X Dilution Needed? Comments

2013‐2014 National Rivers & Streams Assessment Laboratory Operations Manual
Version 1.3, May 2014 Page 154 of 224
154
FishVoucher:TaxonomyBenchSheet(optional)
Laboratory Information Sample Information
Labname Sample ID
QC Taxonomist Site ID
Project ID Visit Number
Internal Sample ID Date Collected
Taxonomist Name: ___________________________
Date 1st Specimen Identified in Sample: _________
Tag No.
New Taxon? Common or Scientific Name
Condition Code
Data Flag
Comment Including Citation if Appropriate
Additional Comments

2013‐2014 National Rivers & Streams Assessment Laboratory Operations Manual
Version 1.3, May 2014 Page 155 of 224
155
APPEN
DIX D: O
THER
PER
TINEN
T ATTACHMEN
TS
APPENDIXD:OTHERPERTINENTATTACHMENTS
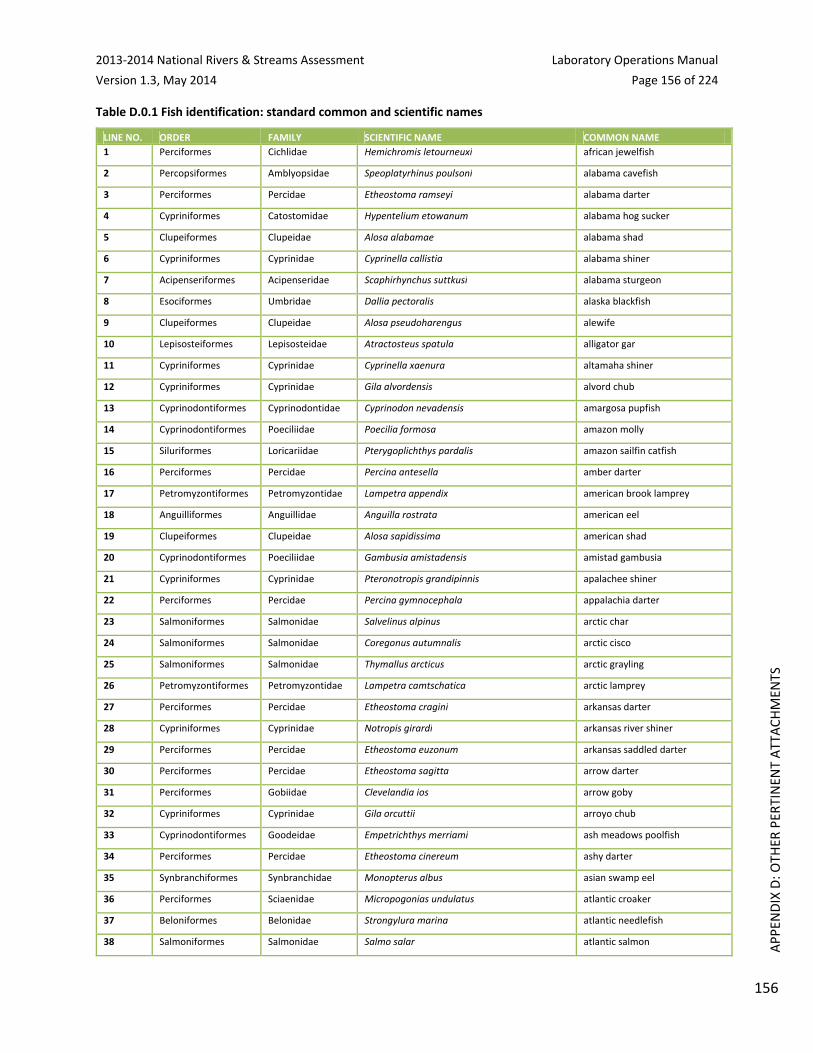
2013‐2014 National Rivers & Streams Assessment Laboratory Operations Manual
Version 1.3, May 2014 Page 156 of 224
156
APPEN
DIX D: O
THER
PER
TINEN
T ATTACHMEN
TS
Table D.0.1 Fish identification: standard common and scientific names
LINE NO. ORDER FAMILY SCIENTIFIC NAME COMMON NAME
1 Perciformes Cichlidae Hemichromis letourneuxi african jewelfish
2 Percopsiformes Amblyopsidae Speoplatyrhinus poulsoni alabama cavefish
3 Perciformes Percidae Etheostoma ramseyi alabama darter
4 Cypriniformes Catostomidae Hypentelium etowanum alabama hog sucker
5 Clupeiformes Clupeidae Alosa alabamae alabama shad
6 Cypriniformes Cyprinidae Cyprinella callistia alabama shiner
7 Acipenseriformes Acipenseridae Scaphirhynchus suttkusi alabama sturgeon
8 Esociformes Umbridae Dallia pectoralis alaska blackfish
9 Clupeiformes Clupeidae Alosa pseudoharengus alewife
10 Lepisosteiformes Lepisosteidae Atractosteus spatula alligator gar
11 Cypriniformes Cyprinidae Cyprinella xaenura altamaha shiner
12 Cypriniformes Cyprinidae Gila alvordensis alvord chub
13 Cyprinodontiformes Cyprinodontidae Cyprinodon nevadensis amargosa pupfish
14 Cyprinodontiformes Poeciliidae Poecilia formosa amazon molly
15 Siluriformes Loricariidae Pterygoplichthys pardalis amazon sailfin catfish
16 Perciformes Percidae Percina antesella amber darter
17 Petromyzontiformes Petromyzontidae Lampetra appendix american brook lamprey
18 Anguilliformes Anguillidae Anguilla rostrata american eel
19 Clupeiformes Clupeidae Alosa sapidissima american shad
20 Cyprinodontiformes Poeciliidae Gambusia amistadensis amistad gambusia
21 Cypriniformes Cyprinidae Pteronotropis grandipinnis apalachee shiner
22 Perciformes Percidae Percina gymnocephala appalachia darter
23 Salmoniformes Salmonidae Salvelinus alpinus arctic char
24 Salmoniformes Salmonidae Coregonus autumnalis arctic cisco
25 Salmoniformes Salmonidae Thymallus arcticus arctic grayling
26 Petromyzontiformes Petromyzontidae Lampetra camtschatica arctic lamprey
27 Perciformes Percidae Etheostoma cragini arkansas darter
28 Cypriniformes Cyprinidae Notropis girardi arkansas river shiner
29 Perciformes Percidae Etheostoma euzonum arkansas saddled darter
30 Perciformes Percidae Etheostoma sagitta arrow darter
31 Perciformes Gobiidae Clevelandia ios arrow goby
32 Cypriniformes Cyprinidae Gila orcuttii arroyo chub
33 Cyprinodontiformes Goodeidae Empetrichthys merriami ash meadows poolfish
34 Perciformes Percidae Etheostoma cinereum ashy darter
35 Synbranchiformes Synbranchidae Monopterus albus asian swamp eel
36 Perciformes Sciaenidae Micropogonias undulatus atlantic croaker
37 Beloniformes Belonidae Strongylura marina atlantic needlefish
38 Salmoniformes Salmonidae Salmo salar atlantic salmon

2013‐2014 National Rivers & Streams Assessment Laboratory Operations Manual
Version 1.3, May 2014 Page 157 of 224
157
APPEN
DIX D: O
THER
PER
TINEN
T ATTACHMEN
TS
LINE NO. ORDER FAMILY SCIENTIFIC NAME COMMON NAME
39 Myliobatiformes Dasyatidae Dasyatis sabina atlantic stingray
40 Acipenseriformes Acipenseridae Acipenser oxyrinchus atlantic sturgeon
41 Clupeiformes Clupeidae Opisthonema oglinum atlantic thread herring
42 Gadiformes Gadidae Microgadus tomcod atlantic tomcod
43 Perciformes Percidae Etheostoma zonifer backwater darter
44 Perciformes Sciaenidae Bairdiella icistia bairdiella
45 Perciformes Cichlidae Heros severus banded cichlid
46 Perciformes Percidae Etheostoma zonale banded darter
47 Cyprinodontiformes Fundulidae Fundulus diaphanus banded killifish
48 Perciformes Elassomatidae Elassoma zonatum banded pygmy sunfish
49 Scorpaeniformes Cottidae Cottus carolinae banded sculpin
50 Perciformes Centrarchidae Enneacanthus obesus banded sunfish
51 Cyprinodontiformes Fundulidae Fundulus cingulatus banded topminnow
52 Perciformes Percidae Etheostoma zonistium bandfin darter
53 Cypriniformes Cyprinidae Luxilus zonistius bandfin shiner
54 Cypriniformes Cyprinidae Cyprinella leedsi bannerfin shiner
55 Perciformes Centrarchidae Lepomis symmetricus bantam sunfish
56 Perciformes Percidae Etheostoma obeyense barcheek darter
57 Perciformes Percidae Etheostoma forbesi barrens darter
58 Cyprinodontiformes Fundulidae Fundulus julisia barrens topminnow
59 Clupeiformes Engraulidae Anchoa mitchilli bay anchovy
60 Pleuronectiformes Paralichthyidae Citharichthys spilopterus bay whiff
61 Perciformes Percidae Etheostoma rubrum bayou darter
62 Cyprinodontiformes Fundulidae Fundulus pulvereus bayou killifish
63 Cyprinodontiformes Fundulidae Fundulus nottii bayou topminnow
64 Scorpaeniformes Cottidae Cottus extensus bear lake sculpin
65 Salmoniformes Salmonidae Prosopium abyssicola bear lake whitefish
66 Cypriniformes Cyprinidae Cyprinella formosa beautiful shiner
67 Cypriniformes Cyprinidae Notropis rupestris bedrock shiner
68 Salmoniformes Salmonidae Coregonus laurettae bering cisco
69 Cyprinodontiformes Poeciliidae Gambusia gaigei big bend gambusia
70 Cypriniformes Cyprinidae Hybopsis amblops bigeye chub
71 Cypriniformes Catostomidae Moxostoma ariommum bigeye jumprock
72 Cypriniformes Cyprinidae Notropis boops bigeye shiner
73 Cypriniformes Cyprinidae Hypophthalmichthys nobilis bighead carp
74 Cypriniformes Catostomidae Ictiobus cyprinellus bigmouth buffalo
75 Cypriniformes Cyprinidae Nocomis platyrhynchus bigmouth chub
76 Cypriniformes Cyprinidae Notropis dorsalis bigmouth shiner
77 Perciformes Eleotridae Gobiomorus dormitor bigmouth sleeper

2013‐2014 National Rivers & Streams Assessment Laboratory Operations Manual
Version 1.3, May 2014 Page 158 of 224
158
APPEN
DIX D: O
THER
PER
TINEN
T ATTACHMEN
TS
LINE NO. ORDER FAMILY SCIENTIFIC NAME COMMON NAME
78 Perciformes Percidae Percina macrolepida bigscale logperch
79 Cypriniformes Cyprinidae Rhodeus sericeus bitterling
80 Perciformes Cichlidae Cichlasoma bimaculatum black acara
81 Cypriniformes Catostomidae Ictiobus niger black buffalo
82 Siluriformes Ictaluridae Ameiurus melas black bullhead
83 Perciformes Centrarchidae Pomoxis nigromaculatus black crappie
84 Siluriformes Ictaluridae Noturus funebris black madtom
85 Cypriniformes Catostomidae Moxostoma duquesnei black redhorse
86 Scorpaeniformes Cottidae Cottus baileyi black sculpin
87 Perciformes Percidae Percina nigrofasciata blackbanded darter
88 Perciformes Centrarchidae Enneacanthus chaetodon blackbanded sunfish
89 Cypriniformes Cyprinidae Notropis heterodon blackchin shiner
90 Perciformes Cichlidae Sarotherodon melanotheron blackchin tilapia
91 Salmoniformes Salmonidae Coregonus nigripinnis blackfin cisco
92 Perciformes Percidae Etheostoma nigripinne blackfin darter
93 Cypriniformes Catostomidae Thoburnia atripinnis blackfin sucker
94 Cypriniformes Cyprinidae Notropis melanostomus blackmouth shiner
95 Cypriniformes Cyprinidae Notropis heterolepis blacknose shiner
96 Cypriniformes Cyprinidae Phoxinus cumberlandensis blackside dace
97 Perciformes Percidae Percina maculata blackside darter
98 Perciformes Percidae Etheostoma duryi blackside snubnose darter
99 Cypriniformes Cyprinidae Notropis atrocaudalis blackspot shiner
100 Cyprinodontiformes Fundulidae Fundulus olivaceus blackspotted topminnow
101 Cyprinodontiformes Fundulidae Fundulus notatus blackstripe topminnow
102 Cypriniformes Catostomidae Moxostoma poecilurum blacktail redhorse
103 Cypriniformes Cyprinidae Cyprinella venusta blacktail shiner
104 Cypriniformes Catostomidae Moxostoma cervinum blacktip jumprock
105 Cypriniformes Cyprinidae Lythrurus atrapiculus blacktip shiner
106 Cypriniformes Cyprinidae Luxilus zonatus bleeding shiner
107 Perciformes Percidae Etheostoma blennius blenny darter
108 Salmoniformes Salmonidae Coregonus hoyi bloater
109 Perciformes Percidae Etheostoma sanguifluum bloodfin darter
110 Perciformes Gobiidae Ctenogobius fasciatus blotchcheek goby
111 Cypriniformes Cyprinidae Erimystax insignis blotched chub
112 Cyprinodontiformes Poeciliidae Gambusia senilis blotched gambusia
113 Perciformes Percidae Percina burtoni blotchside logperch
114 Siluriformes Ictaluridae Ictalurus furcatus blue catfish
115 Cypriniformes Cyprinidae Gila coerulea blue chub
116 Scorpaeniformes Cottidae Cottus caeruleomentum blue ridge sculpin

2013‐2014 National Rivers & Streams Assessment Laboratory Operations Manual
Version 1.3, May 2014 Page 159 of 224
159
APPEN
DIX D: O
THER
PER
TINEN
T ATTACHMEN
TS
LINE NO. ORDER FAMILY SCIENTIFIC NAME COMMON NAME
117 Cypriniformes Cyprinidae Cyprinella caerulea blue shiner
118 Cypriniformes Catostomidae Cycleptus elongatus blue sucker
119 Perciformes Cichlidae Oreochromis aureus blue tilapia
120 Clupeiformes Clupeidae Alosa aestivalis blueback herring
121 Perciformes Elassomatidae Elassoma okatie bluebarred pygmy sunfish
122 Perciformes Percidae Etheostoma camurum bluebreast darter
123 Cyprinodontiformes Fundulidae Lucania goodei bluefin killifish
124 Cypriniformes Cyprinidae Campostoma pauciradii bluefin stoneroller
125 Perciformes Centrarchidae Lepomis macrochirus bluegill
126 Cypriniformes Cyprinidae Nocomis leptocephalus bluehead chub
127 Cypriniformes Cyprinidae Pteronotropis hubbsi bluehead shiner
128 Cypriniformes Catostomidae Catostomus discobolus bluehead sucker
129 Cypriniformes Cyprinidae Pteronotropis welaka bluenose shiner
130 Perciformes Percidae Etheostoma jessiae blueside darter
131 Perciformes Centrarchidae Enneacanthus gloriosus bluespotted sunfish
132 Perciformes Percidae Percina cymatotaenia bluestripe darter
133 Cypriniformes Cyprinidae Cyprinella callitaenia bluestripe shiner
134 Cypriniformes Cyprinidae Cyprinella camura bluntface shiner
135 Perciformes Percidae Etheostoma chlorosoma bluntnose darter
136 Cypriniformes Cyprinidae Pimephales notatus bluntnose minnow
137 Cypriniformes Cyprinidae Notropis simus bluntnose shiner
138 Salmoniformes Salmonidae Prosopium gemmifer bonneville cisco
139 Salmoniformes Salmonidae Prosopium spilonotus bonneville whitefish
140 Cypriniformes Cyprinidae Gila elegans bonytail
141 Cypriniformes Cyprinidae Gila boraxobius borax lake chub
142 Perciformes Percidae Etheostoma wapiti boulder darter
143 Amiiformes Amiidae Amia calva bowfin
144 Cypriniformes Cyprinidae Hybognathus hankinsoni brassy minnow
145 Cypriniformes Catostomidae Catostomus columbianus bridgelip sucker
146 Cypriniformes Cyprinidae Notropis bifrenatus bridle shiner
147 Perciformes Percidae Etheostoma lynceum brighteye darter
148 Siluriformes Ictaluridae Noturus miurus brindled madtom
149 Salmoniformes Salmonidae Coregonus nasus broad whitefish
150 Cypriniformes Cyprinidae Pteronotropis euryzonus broadstripe shiner
151 Cyprinodontiformes Fundulidae Fundulus euryzonus broadstripe topminnow
152 Perciformes Percidae Percina palmaris bronze darter
153 Perciformes Percidae Etheostoma burri brook darter
154 Atheriniformes Atherinopsidae Labidesthes sicculus brook silverside
155 Gasterosteiformes Gasterosteidae Culaea inconstans brook stickleback

2013‐2014 National Rivers & Streams Assessment Laboratory Operations Manual
Version 1.3, May 2014 Page 160 of 224
160
APPEN
DIX D: O
THER
PER
TINEN
T ATTACHMEN
TS
LINE NO. ORDER FAMILY SCIENTIFIC NAME COMMON NAME
156 Salmoniformes Salmonidae Salvelinus fontinalis brook trout
157 Siluriformes Ictaluridae Ameiurus nebulosus brown bullhead
158 Perciformes Percidae Etheostoma edwini brown darter
159 Siluriformes Callichthyidae Hoplosternum littorale brown hoplo
160 Siluriformes Ictaluridae Noturus phaeus brown madtom
161 Salmoniformes Salmonidae Salmo trutta brown trout
162 Perciformes Percidae Etheostoma bison buffalo darter
163 Cypriniformes Cyprinidae Nocomis raneyi bull chub
164 Carcharhiniformes Carcharhinidae Carcharhinus leucas bull shark
165 Salmoniformes Salmonidae Salvelinus confluentus bull trout
166 Cypriniformes Cyprinidae Pimephales vigilax bullhead minnow
167 Perciformes Channidae Channa marulius bullseye snakehead
168 Gadiformes Gadidae Lota lota burbot
169 Cypriniformes Cyprinidae Macrhybopsis marconis burrhead chub
170 Cypriniformes Cyprinidae Notropis asperifrons burrhead shiner
171 Perciformes Cichlidae Cichla ocellaris butterfly peacock bass
172 Siluriformes Ictaluridae Noturus taylori caddo madtom
173 Cypriniformes Cyprinidae Notropis cahabae cahaba shiner
174 Cypriniformes Cyprinidae Hesperoleucus symmetricus california roach
175 Perciformes Percidae Etheostoma osburni candy darter
176 Cypriniformes Cyprinidae Notropis mekistocholas cape fear shiner
177 Cypriniformes Cyprinidae Luxilus cardinalis cardinal shiner
178 Cypriniformes Cyprinidae Notropis percobromus carmine shiner
179 Perciformes Percidae Etheostoma collis carolina darter
180 Siluriformes Ictaluridae Noturus furiosus carolina madtom
181 Perciformes Elassomatidae Elassoma boehlkei carolina pygmy sunfish
182 Esociformes Umbridae Umbra limi central mudminnow
183 Cypriniformes Cyprinidae Campostoma anomalum central stoneroller
184 Esociformes Esocidae Esox niger chain pickerel
185 Perciformes Percidae Percina nevisense chainback darter
186 Siluriformes Ictaluridae Ictalurus punctatus channel catfish
187 Perciformes Percidae Percina copelandi channel darter
188 Cypriniformes Cyprinidae Notropis wickliffi channel shiner
189 Siluriformes Ictaluridae Noturus flavater checkered madtom
190 Perciformes Percidae Etheostoma scotti cherokee darter
191 Perciformes Percidae Etheostoma etnieri cherry darter
192 Cypriniformes Cyprinidae Lythrurus roseipinnis cherryfin shiner
193 Petromyzontiformes Petromyzontidae Ichthyomyzon castaneus chestnut lamprey
194 Perciformes Percidae Etheostoma cervus chickasaw darter

2013‐2014 National Rivers & Streams Assessment Laboratory Operations Manual
Version 1.3, May 2014 Page 161 of 224
161
APPEN
DIX D: O
THER
PER
TINEN
T ATTACHMEN
TS
LINE NO. ORDER FAMILY SCIENTIFIC NAME COMMON NAME
195 Cypriniformes Cyprinidae Gila nigrescens chihuahua chub
196 Cypriniformes Cyprinidae Notropis chihuahua chihuahua shiner
197 Salmoniformes Salmonidae Oncorhynchus tshawytscha chinook salmon
198 Cypriniformes Cyprinidae Acrocheilus alutaceus chiselmouth
199 Perciformes Percidae Etheostoma davisoni choctawhatchee darter
200 Perciformes Percidae Etheostoma hopkinsi christmas darter
201 Cypriniformes Cyprinidae Notropis potteri chub shiner
202 Salmoniformes Salmonidae Oncorhynchus keta chum salmon
203 Salmoniformes Salmonidae Coregonus artedi cisco
204 Cypriniformes Cyprinidae Hybopsis winchelli clear chub
205 Cyprinodontiformes Poeciliidae Gambusia heterochir clear creek gambusia
206 Cypriniformes Cyprinidae Pogonichthys ciscoides clear lake splittail
207 Perciformes Gobiidae Microgobius gulosus clown goby
208 Osteoglossiformes Notopteridae Chitala ornata clown knifefish
209 Perciformes Percidae Percina brevicauda coal darter
210 Perciformes Percidae Etheostoma colorosum coastal darter
211 Cypriniformes Cyprinidae Notropis petersoni coastal shiner
212 Scorpaeniformes Cottidae Cottus aleuticus coastrange sculpin
213 Salmoniformes Salmonidae Oncorhynchus kisutch coho salmon
214 Perciformes Percidae Etheostoma ditrema coldwater darter
215 Cypriniformes Cyprinidae Ptychocheilus lucius colorado pikeminnow
216 Scorpaeniformes Cottidae Cottus hubbsi columbia sculpin
217 Cyprinodontiformes Cyprinodontidae Cyprinodon elegans comanche springs pupfish
218 Cypriniformes Cyprinidae Notropis amoenus comely shiner
219 Cypriniformes Cyprinidae Cyprinus carpio common carp
220 Cypriniformes Cyprinidae Luxilus cornutus common shiner
221 Perciformes Centropomidae Centropomus undecimalis common snook
222 Perciformes Percidae Percina jenkinsi conasauga logperch
223 Cyprinodontiformes Cyprinodontidae Cyprinodon eximius conchos pupfish
224 Perciformes Cichlidae Cichlasoma nigrofasciatum convict cichlid
225 Perciformes Percidae Etheostoma coosae coosa darter
226 Cypriniformes Cyprinidae Notropis xaenocephalus coosa shiner
227 Perciformes Percidae Etheostoma aquali coppercheek darter
228 Perciformes Percidae Etheostoma basilare corrugated darter
229 Cypriniformes Cyprinidae Semotilus atromaculatus creek chub
230 Cypriniformes Catostomidae Erimyzon oblongus creek chubsucker
231 Perciformes Percidae Etheostoma collettei creole darter
232 Cypriniformes Cyprinidae Luxilus cerasinus crescent shiner
233 Perciformes Gobiidae Lophogobius cyprinoides crested goby

2013‐2014 National Rivers & Streams Assessment Laboratory Operations Manual
Version 1.3, May 2014 Page 162 of 224
162
APPEN
DIX D: O
THER
PER
TINEN
T ATTACHMEN
TS
LINE NO. ORDER FAMILY SCIENTIFIC NAME COMMON NAME
234 Perciformes Belontiidae Trichopsis vittata croaking gourami
235 Perciformes Percidae Etheostoma corona crown darter
236 Perciformes Percidae Crystallaria asprella crystal darter
237 Cypriniformes Catostomidae Chasmistes cujus cui‐ui
238 Perciformes Percidae Etheostoma susanae cumberland darter
239 Perciformes Percidae Etheostoma uniporum current darter
240 Cypriniformes Cyprinidae Exoglossum maxillingua cutlip minnow
241 Salmoniformes Salmonidae Oncorhynchus clarkii cutthroat trout
242 Perciformes Percidae Etheostoma proeliare cypress darter
243 Cypriniformes Cyprinidae Hybognathus hayi cypress minnow
244 Perciformes Gobiidae Ctenogobius boleosoma darter goby
245 Salmoniformes Salmonidae Coregonus johannae deepwater cisco
246 Scorpaeniformes Cottidae Myoxocephalus thompsonii deepwater sculpin
247 Salmoniformes Osmeridae Hypomesus transpacificus delta smelt
248 Cypriniformes Cyprinidae Eremichthys acros desert dace
249 Cyprinodontiformes Cyprinodontidae Cyprinodon macularius desert pupfish
250 Cypriniformes Catostomidae Catostomus clarkii desert sucker
251 Cyprinodontiformes Cyprinodontidae Cyprinodon diabolis devils hole pupfish
252 Cypriniformes Cyprinidae Dionda diaboli devils river minnow
253 Cypriniformes Cyprinidae Semotilus thoreauianus dixie chub
254 Perciformes Centrarchidae Lepomis marginatus dollar sunfish
255 Salmoniformes Salmonidae Salvelinus malma dolly varden
256 Perciformes Percidae Percina sciera dusky darter
257 Cypriniformes Cyprinidae Notropis cummingsae dusky shiner
258 Cypriniformes Cyprinidae Luxilus pilsbryi duskystripe shiner
259 Perciformes Percidae Etheostoma percnurum duskytail darter
260 Cypriniformes Cyprinidae Rhinichthys atratulus eastern blacknose dace
261 Cyprinodontiformes Poeciliidae Gambusia holbrooki eastern mosquitofish
262 Esociformes Umbridae Umbra pygmaea eastern mudminnow
263 Perciformes Percidae Ammocrypta pellucida eastern sand darter
264 Cypriniformes Cyprinidae Hybognathus regius eastern silvery minnow
265 Perciformes Percidae Etheostoma pseudovulatum egg‐mimic darter
266 Siluriformes Ictaluridae Noturus elegans elegant madtom
267 Perciformes Percidae Etheostoma baileyi emerald darter
268 Cypriniformes Cyprinidae Notropis atherinoides emerald shiner
269 Gasterosteiformes Gasterosteidae Gasterosteus aculeatus espinocho
270 Perciformes Percidae Etheostoma etowahae etowah darter
271 Salmoniformes Osmeridae Thaleichthys pacificus eulachon
272 Perciformes Elassomatidae Elassoma evergladei everglades pygmy sunfish

2013‐2014 National Rivers & Streams Assessment Laboratory Operations Manual
Version 1.3, May 2014 Page 163 of 224
163
APPEN
DIX D: O
THER
PER
TINEN
T ATTACHMEN
TS
LINE NO. ORDER FAMILY SCIENTIFIC NAME COMMON NAME
273 Cypriniformes Cyprinidae Semotilus corporalis fallfish
274 Perciformes Percidae Etheostoma flabellare fantail darter
275 Perciformes Eleotridae Dormitator maculatus fat sleeper
276 Cypriniformes Cyprinidae Pimephales promelas fathead minnow
277 Cypriniformes Cyprinidae Phenacobius crassilabrum fatlips minnow
278 Cypriniformes Cyprinidae Cyprinella pyrrhomelas fieryblack shiner
279 Cypriniformes Cyprinidae Phoxinus neogaeus finescale dace
280 Perciformes Percidae Etheostoma pyrrhogaster firebelly darter
281 Perciformes Cichlidae Cichlasoma meeki firemouth cichlid
282 Cypriniformes Cyprinidae Pteronotropis signipinnis flagfin shiner
283 Cyprinodontiformes Cyprinodontidae Jordanella floridae flagfish
284 Cypriniformes Cyprinidae Hemitremia flammea flame chub
285 Cypriniformes Catostomidae Catostomus latipinnis flannelmouth sucker
286 Siluriformes Ictaluridae Ameiurus platycephalus flat bullhead
287 Siluriformes Ictaluridae Pylodictis olivaris flathead catfish
288 Cypriniformes Cyprinidae Platygobio gracilis flathead chub
289 Perciformes Centrarchidae Centrarchus macropterus flier
290 Lepisosteiformes Lepisosteidae Lepisosteus platyrhincus florida gar
291 Perciformes Percidae Ammocrypta bifascia florida sand darter
292 Cypriniformes Cyprinidae Notropis edwardraneyi fluvial shiner
293 Perciformes Percidae Etheostoma fonticola fountain darter
294 Scorpaeniformes Cottidae Myoxocephalus quadricornis fourhorn sculpin
295 Gasterosteiformes Gasterosteidae Apeltes quadracus fourspine stickleback
296 Perciformes Percidae Percina stictogaster frecklebelly darter
297 Siluriformes Ictaluridae Noturus munitus frecklebelly madtom
298 Perciformes Percidae Percina lenticula freckled darter
299 Siluriformes Ictaluridae Noturus nocturnus freckled madtom
300 Perciformes Sciaenidae Aplodinotus grunniens freshwater drum
301 Perciformes Gobiidae Ctenogobius shufeldti freshwater goby
302 Perciformes Percidae Etheostoma crossopterum fringed darter
303 Cypriniformes Cyprinidae Notropis buchanani ghost shiner
304 Cyprinodontiformes Aplocheilidae Rivulus hartii giant rivulus
305 Cypriniformes Cyprinidae Gila intermedia gila chub
306 Cyprinodontiformes Poeciliidae Poeciliopsis occidentalis gila topminnow
307 Salmoniformes Salmonidae Oncorhynchus gilae gila trout
308 Perciformes Percidae Percina evides gilt darter
309 Clupeiformes Clupeidae Dorosoma cepedianum gizzard shad
310 Perciformes Percidae Etheostoma vitreum glassy darter
311 Perciformes Percidae Etheostoma denoncourti golden darter

2013‐2014 National Rivers & Streams Assessment Laboratory Operations Manual
Version 1.3, May 2014 Page 164 of 224
164
APPEN
DIX D: O
THER
PER
TINEN
T ATTACHMEN
TS
LINE NO. ORDER FAMILY SCIENTIFIC NAME COMMON NAME
312 Cypriniformes Catostomidae Moxostoma erythrurum golden redhorse
313 Cypriniformes Cyprinidae Notemigonus crysoleucas golden shiner
314 Cyprinodontiformes Fundulidae Fundulus chrysotus golden topminnow
315 Hiodontiformes Hiodontidae Hiodon alosoides goldeye
316 Cypriniformes Cyprinidae Carassius auratus goldfish
317 Perciformes Percidae Percina aurolineata goldline darter
318 Perciformes Percidae Etheostoma parvipinne goldstripe darter
319 Cypriniformes Cyprinidae Ctenopharyngodon idella grass carp
320 Cypriniformes Cyprinidae Erimystax x‐punctatus gravel chub
321 Cypriniformes Catostomidae Moxostoma congestum gray redhorse
322 Perciformes Lutjanidae Lutjanus griseus gray snapper
323 Cypriniformes Catostomidae Moxostoma lachneri greater jumprock
324 Cypriniformes Catostomidae Moxostoma valenciennesi greater redhorse
325 Acipenseriformes Acipenseridae Acipenser medirostris green sturgeon
326 Perciformes Centrarchidae Lepomis cyanellus green sunfish
327 Cyprinodontiformes Poeciliidae Xiphophorus hellerii green swordtail
328 Perciformes Percidae Etheostoma jordani greenbreast darter
329 Perciformes Percidae Etheostoma chlorobranchium greenfin darter
330 Cypriniformes Cyprinidae Cyprinella chloristia greenfin shiner
331 Cypriniformes Cyprinidae Notropis chlorocephalus greenhead shiner
332 Perciformes Percidae Etheostoma blennioides greenside darter
333 Perciformes Percidae Etheostoma lepidum greenthroat darter
334 Perciformes Centrarchidae Micropterus treculii guadalupe bass
335 Cyprinodontiformes Fundulidae Fundulus parvipinnis guadalupe cardinalfish
336 Cypriniformes Cyprinidae Dionda nigrotaeniata guadalupe roundnose minnow
337 Perciformes Percidae Etheostoma oophylax guardian darter
338 Perciformes Eleotridae Guavina guavina guavina
339 Perciformes Percidae Etheostoma swaini gulf darter
340 Cyprinodontiformes Fundulidae Fundulus grandis gulf killifish
341 Perciformes Percidae Percina suttkusi gulf logperch
342 Gasterosteiformes Syngnathidae Syngnathus scovelli gulf pipefish
343 Cyprinodontiformes Poeciliidae Poecilia reticulata guppy
344 Cypriniformes Cyprinidae Mylopharodon conocephalus hardhead
345 Siluriformes Ariidae Ariopsis felis hardhead catfish
346 Cypriniformes Catostomidae Moxostoma lacerum harelip sucker
347 Perciformes Percidae Etheostoma histrio harlequin darter
348 Siluriformes Ictaluridae Ictalurus lupus headwater catfish
349 Cypriniformes Cyprinidae Gila nigra headwater chub
350 Perciformes Percidae Etheostoma lawrencei headwater darter

2013‐2014 National Rivers & Streams Assessment Laboratory Operations Manual
Version 1.3, May 2014 Page 165 of 224
165
APPEN
DIX D: O
THER
PER
TINEN
T ATTACHMEN
TS
LINE NO. ORDER FAMILY SCIENTIFIC NAME COMMON NAME
351 Clupeiformes Clupeidae Alosa mediocris hickory shad
352 Cypriniformes Cyprinidae Hybopsis hypsinotus highback chub
353 Cypriniformes Catostomidae Carpiodes velifer highfin carpsucker
354 Cypriniformes Cyprinidae Notropis altipinnis highfin shiner
355 Perciformes Percidae Etheostoma kantuckeense highland rim darter
356 Cypriniformes Cyprinidae Notropis micropteryx highland shiner
357 Cypriniformes Cyprinidae Notropis hypsilepis highscale shiner
358 Cypriniformes Cyprinidae Lavinia exilicauda hitch
359 Pleuronectiformes Achiridae Trinectes maculatus hogchoker
360 Perciformes Percidae Etheostoma brevirostrum holiday darter
361 Cypriniformes Cyprinidae Nocomis biguttatus hornyhead chub
362 Cypriniformes Cyprinidae Gila cypha humpback chub
363 Salmoniformes Salmonidae Coregonus pidschian humpback whitefish
364 Cypriniformes Cyprinidae Leuciscus idus ide
365 Salmoniformes Salmonidae Stenodus leucichthys inconnu
366 Atheriniformes Atherinopsidae Menidia beryllina inland silverside
367 Perciformes Percidae Etheostoma exile iowa darter
368 Perciformes Gerreidae Diapterus auratus irish pompano
369 Cypriniformes Cyprinidae Notropis chalybaeus ironcolor shiner
370 Perciformes Cichlidae Cichlasoma octofasciatum jack dempsey
371 Perciformes Cichlidae Cichlasoma managuense jaguar guapote
372 Perciformes Percidae Etheostoma nigrum johnny darter
373 Cypriniformes Catostomidae Chasmistes liorus june sucker
374 Perciformes Percidae Etheostoma kanawhae kanawha darter
375 Cypriniformes Cyprinidae Phenacobius teretulus kanawha minnow
376 Perciformes Percidae Etheostoma rafinesquei kentucky darter
377 Petromyzontiformes Petromyzontidae Lampetra hubbsi kern brook lamprey
378 Cypriniformes Cyprinidae Notropis ortenburgeri kiamichi shiner
379 Salmoniformes Salmonidae Coregonus kiyi kiyi
380 Scorpaeniformes Cottidae Cottus princeps klamath lake sculpin
381 Petromyzontiformes Petromyzontidae Lampetra similis klamath lamprey
382 Cypriniformes Catostomidae Catostomus snyderi klamath largescale sucker
383 Cypriniformes Catostomidae Catostomus rimiculus klamath smallscale sucker
384 Elopiformes Elopidae Elops saurus ladyfish
385 Cypriniformes Cyprinidae Richardsonius egregius lahontan redside
386 Cypriniformes Cyprinidae Couesius plumbeus lake chub
387 Cypriniformes Catostomidae Erimyzon sucetta lake chubsucker
388 Acipenseriformes Acipenseridae Acipenser fulvescens lake sturgeon
389 Salmoniformes Salmonidae Salvelinus namaycush lake trout

2013‐2014 National Rivers & Streams Assessment Laboratory Operations Manual
Version 1.3, May 2014 Page 166 of 224
166
APPEN
DIX D: O
THER
PER
TINEN
T ATTACHMEN
TS
LINE NO. ORDER FAMILY SCIENTIFIC NAME COMMON NAME
390 Salmoniformes Salmonidae Coregonus clupeaformis lake whitefish
391 Perciformes Centrarchidae Micropterus salmoides largemouth bass
392 Cypriniformes Cyprinidae Campostoma oligolepis largescale stoneroller
393 Cypriniformes Catostomidae Catostomus macrocheilus largescale sucker
394 Perciformes Eleotridae Eleotris amblyopsis largescaled spinycheek
395 Cyprinodontiformes Poeciliidae Gambusia geiseri largespring gambusia
396 Cypriniformes Cyprinidae Rhinichthys deaconi las vegas dace
397 Cypriniformes Cyprinidae Phoxinus saylori laurel dace
398 Petromyzontiformes Petromyzontidae Lampetra aepyptera least brook lamprey
399 Cypriniformes Cyprinidae Iotichthys phlegethontis least chub
400 Salmoniformes Salmonidae Coregonus sardinella least cisco
401 Perciformes Percidae Etheostoma microperca least darter
402 Cyprinodontiformes Poeciliidae Heterandria formosa least killifish
403 Siluriformes Ictaluridae Noturus hildebrandi least madtom
404 Cypriniformes Cyprinidae Snyderichthys copei leatherside chub
405 Cyprinodontiformes Cyprinodontidae Cyprinodon bovinus leon springs pupfish
406 Cypriniformes Cyprinidae Rhinichthys falcatus leopard dace
407 Perciformes Percidae Percina pantherina leopard darter
408 Cypriniformes Cyprinidae Hybopsis lineapunctata lined chub
409 Cyprinodontiformes Fundulidae Fundulus lineolatus lined topminnow
410 Perciformes Percidae Etheostoma chuckwachatte lipstick darter
411 Cypriniformes Cyprinidae Lepidomeda vittata little colorado spinedace
412 Cypriniformes Cyprinidae Rhinichthys cobitis loach minnow
413 Perciformes Percidae Percina caprodes logperch
414 Perciformes Percidae Etheostoma neopterum lollypop darter
415 Perciformes Centrarchidae Lepomis megalotis longear sunfish
416 Cypriniformes Cyprinidae Agosia chrysogaster longfin dace
417 Perciformes Percidae Etheostoma longimanum longfin darter
418 Salmoniformes Osmeridae Spirinchus thaleichthys longfin smelt
419 Perciformes Percidae Percina macrocephala longhead darter
420 Perciformes Gobiidae Gillichthys mirabilis longjaw mudsucker
421 Cypriniformes Cyprinidae Rhinichthys cataractae longnose dace
422 Perciformes Percidae Percina nasuta longnose darter
423 Lepisosteiformes Lepisosteidae Lepisosteus osseus longnose gar
424 Cypriniformes Cyprinidae Notropis longirostris longnose shiner
425 Cypriniformes Catostomidae Catostomus catostomus longnose sucker
426 Cypriniformes Catostomidae Deltistes luxatus lost river sucker
427 Elopiformes Elopidae Elops affinis machete
428 Scorpaeniformes Cottidae Cottus bendirei malheur sculpin

2013‐2014 National Rivers & Streams Assessment Laboratory Operations Manual
Version 1.3, May 2014 Page 167 of 224
167
APPEN
DIX D: O
THER
PER
TINEN
T ATTACHMEN
TS
LINE NO. ORDER FAMILY SCIENTIFIC NAME COMMON NAME
429 Cypriniformes Cyprinidae Dionda argentosa manantial roundnose minnow
430 Cyprinodontiformes Poeciliidae Gambusia rhizophorae mangrove gambusia
431 Cyprinodontiformes Aplocheilidae Rivulus marmoratus mangrove rivulus
432 Scorpaeniformes Cottidae Cottus klamathensis marbled sculpin
433 Siluriformes Ictaluridae Noturus insignis margined madtom
434 Scorpaeniformes Cottidae Cottus marginatus margined sculpin
435 Cyprinodontiformes Fundulidae Fundulus confluentus marsh killifish
436 Perciformes Percidae Etheostoma sellare maryland darter
437 Perciformes Cichlidae Cichlasoma urophthalmus mayan cichlid
438 Perciformes Gobiidae Ctenogobius claytonii mexican goby
439 Cyprinodontiformes Poeciliidae Poecilia sphenops mexican molly
440 Cypriniformes Catostomidae Moxostoma austrinum mexican redhorse
441 Cypriniformes Cyprinidae Campostoma ornatum mexican stoneroller
442 Characiformes Characidae Astyanax mexicanus mexican tetra
443 Perciformes Cichlidae Cichlasoma citrinellum midas cichlid
444 Petromyzontiformes Petromyzontidae Lampetra minima miller lake lamprey
445 Cypriniformes Cyprinidae Notropis volucellus mimic shiner
446 Cypriniformes Cyprinidae Notropis spectrunculus mirror shiner
447 Atheriniformes Atherinopsidae Menidia audens mississippi silverside
448 Cypriniformes Cyprinidae Hybognathus nuchalis mississippi silvery minnow
449 Perciformes Percidae Etheostoma tetrazonum missouri saddled darter
450 Cypriniformes Cyprinidae Moapa coriacea moapa dace
451 Perciformes Percidae Percina kathae mobile logperch
452 Cypriniformes Catostomidae Catostomus microps modoc sucker
453 Hiodontiformes Hiodontidae Hiodon tergisus mooneye
454 Scorpaeniformes Cottidae Cottus bairdii mottled sculpin
455 Petromyzontiformes Petromyzontidae Ichthyomyzon greeleyi mountain brook lamprey
456 Siluriformes Ictaluridae Noturus eleutherus mountain madtom
457 Mugiliformes Mugilidae Agonostomus monticola mountain mullet
458 Cypriniformes Cyprinidae Phoxinus oreas mountain redbelly dace
459 Cypriniformes Cyprinidae Lythrurus lirus mountain shiner
460 Cypriniformes Catostomidae Catostomus platyrhynchus mountain sucker
461 Salmoniformes Salmonidae Prosopium williamsoni mountain whitefish
462 Perciformes Cichlidae Oreochromis mossambicus mozambique tilapia
463 Perciformes Percidae Etheostoma asprigene mud darter
464 Perciformes Centrarchidae Acantharchus pomotis mud sunfish
465 Cyprinodontiformes Fundulidae Fundulus heteroclitus mummichog
466 Esociformes Esocidae Esox masquinongy muskellunge
467 Perciformes Gobiidae Gobiosoma bosc naked goby
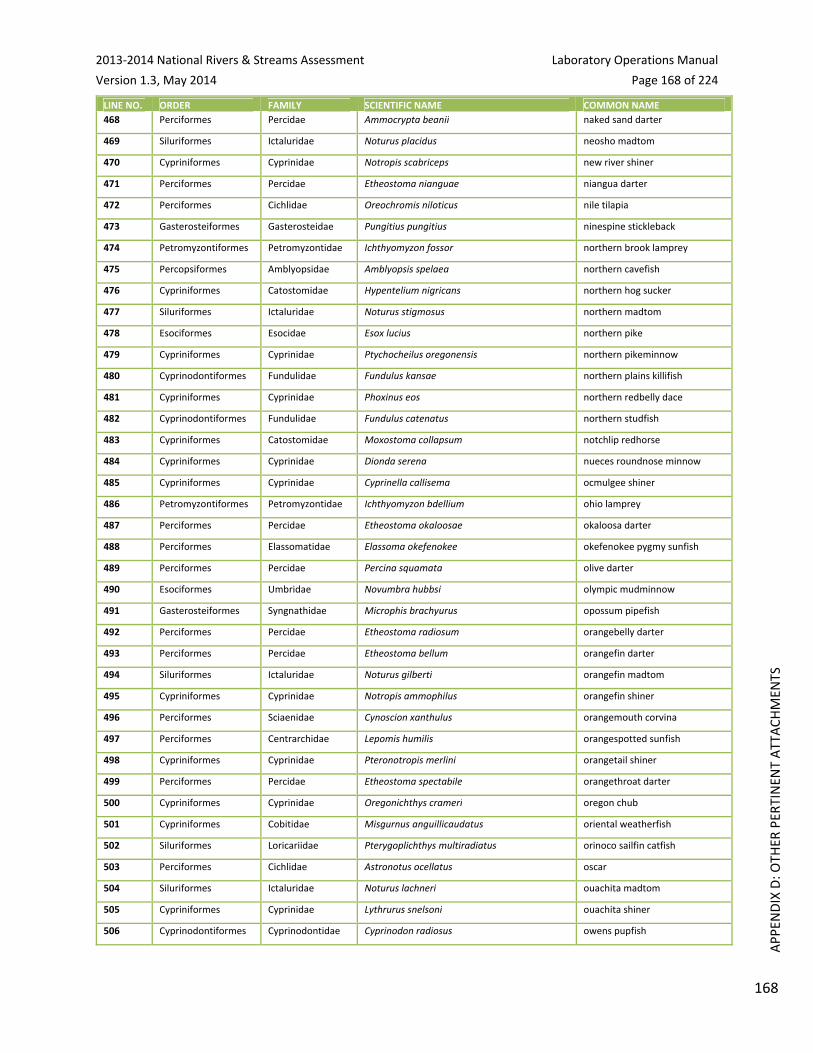
2013‐2014 National Rivers & Streams Assessment Laboratory Operations Manual
Version 1.3, May 2014 Page 168 of 224
168
APPEN
DIX D: O
THER
PER
TINEN
T ATTACHMEN
TS
LINE NO. ORDER FAMILY SCIENTIFIC NAME COMMON NAME
468 Perciformes Percidae Ammocrypta beanii naked sand darter
469 Siluriformes Ictaluridae Noturus placidus neosho madtom
470 Cypriniformes Cyprinidae Notropis scabriceps new river shiner
471 Perciformes Percidae Etheostoma nianguae niangua darter
472 Perciformes Cichlidae Oreochromis niloticus nile tilapia
473 Gasterosteiformes Gasterosteidae Pungitius pungitius ninespine stickleback
474 Petromyzontiformes Petromyzontidae Ichthyomyzon fossor northern brook lamprey
475 Percopsiformes Amblyopsidae Amblyopsis spelaea northern cavefish
476 Cypriniformes Catostomidae Hypentelium nigricans northern hog sucker
477 Siluriformes Ictaluridae Noturus stigmosus northern madtom
478 Esociformes Esocidae Esox lucius northern pike
479 Cypriniformes Cyprinidae Ptychocheilus oregonensis northern pikeminnow
480 Cyprinodontiformes Fundulidae Fundulus kansae northern plains killifish
481 Cypriniformes Cyprinidae Phoxinus eos northern redbelly dace
482 Cyprinodontiformes Fundulidae Fundulus catenatus northern studfish
483 Cypriniformes Catostomidae Moxostoma collapsum notchlip redhorse
484 Cypriniformes Cyprinidae Dionda serena nueces roundnose minnow
485 Cypriniformes Cyprinidae Cyprinella callisema ocmulgee shiner
486 Petromyzontiformes Petromyzontidae Ichthyomyzon bdellium ohio lamprey
487 Perciformes Percidae Etheostoma okaloosae okaloosa darter
488 Perciformes Elassomatidae Elassoma okefenokee okefenokee pygmy sunfish
489 Perciformes Percidae Percina squamata olive darter
490 Esociformes Umbridae Novumbra hubbsi olympic mudminnow
491 Gasterosteiformes Syngnathidae Microphis brachyurus opossum pipefish
492 Perciformes Percidae Etheostoma radiosum orangebelly darter
493 Perciformes Percidae Etheostoma bellum orangefin darter
494 Siluriformes Ictaluridae Noturus gilberti orangefin madtom
495 Cypriniformes Cyprinidae Notropis ammophilus orangefin shiner
496 Perciformes Sciaenidae Cynoscion xanthulus orangemouth corvina
497 Perciformes Centrarchidae Lepomis humilis orangespotted sunfish
498 Cypriniformes Cyprinidae Pteronotropis merlini orangetail shiner
499 Perciformes Percidae Etheostoma spectabile orangethroat darter
500 Cypriniformes Cyprinidae Oregonichthys crameri oregon chub
501 Cypriniformes Cobitidae Misgurnus anguillicaudatus oriental weatherfish
502 Siluriformes Loricariidae Pterygoplichthys multiradiatus orinoco sailfin catfish
503 Perciformes Cichlidae Astronotus ocellatus oscar
504 Siluriformes Ictaluridae Noturus lachneri ouachita madtom
505 Cypriniformes Cyprinidae Lythrurus snelsoni ouachita shiner
506 Cyprinodontiformes Cyprinodontidae Cyprinodon radiosus owens pupfish

2013‐2014 National Rivers & Streams Assessment Laboratory Operations Manual
Version 1.3, May 2014 Page 169 of 224
169
APPEN
DIX D: O
THER
PER
TINEN
T ATTACHMEN
TS
LINE NO. ORDER FAMILY SCIENTIFIC NAME COMMON NAME
507 Cypriniformes Catostomidae Catostomus fumeiventris owens sucker
508 Perciformes Centrarchidae Ambloplites constellatus ozark bass
509 Percopsiformes Amblyopsidae Amblyopsis rosae ozark cavefish
510 Cypriniformes Cyprinidae Erimystax harryi ozark chub
511 Perciformes Percidae Percina fulvitaenia ozark logperch
512 Siluriformes Ictaluridae Noturus albater ozark madtom
513 Cypriniformes Cyprinidae Notropis nubilus ozark minnow
514 Scorpaeniformes Cottidae Cottus hypselurus ozark sculpin
515 Cypriniformes Cyprinidae Notropis ozarcanus ozark shiner
516 Petromyzontiformes Petromyzontidae Lampetra tridentata pacific lamprey
517 Scorpaeniformes Cottidae Leptocottus armatus pacific staghorn sculpin
518 Acipenseriformes Polyodontidae Polyodon spathula paddlefish
519 Cypriniformes Cyprinidae Lepidomeda altivelis pahranagat spinedace
520 Cyprinodontiformes Goodeidae Empetrichthys latos pahrump poolfish
521 Scorpaeniformes Cottidae Cottus beldingii paiute sculpin
522 Perciformes Percidae Etheostoma pallididorsum paleback darter
523 Cypriniformes Cyprinidae Notropis albizonatus palezone shiner
524 Cypriniformes Cyprinidae Hybopsis amnis pallid shiner
525 Acipenseriformes Acipenseridae Scaphirhynchus albus pallid sturgeon
526 Cypriniformes Catostomidae Moxostoma pisolabrum pealip redhorse
527 Cypriniformes Cyprinidae Mylocheilus caurinus peamouth
528 Cypriniformes Cyprinidae Margariscus margarita pearl dace
529 Perciformes Percidae Percina aurora pearl darter
530 Cyprinodontiformes Poeciliidae Gambusia nobilis pecos gambusia
531 Cyprinodontiformes Cyprinodontidae Cyprinodon pecosensis pecos pupfish
532 Cypriniformes Cyprinidae Macrhybopsis tetranema peppered chub
533 Cypriniformes Cyprinidae Notropis perpallidus peppered shiner
534 Cypriniformes Cyprinidae Notropis orca phantom shiner
535 Perciformes Percidae Percina crassa piedmont darter
536 Perciformes Haemulidae Orthopristis chrysoptera pigfish
537 Cyprinodontiformes Poeciliidae Belonesox belizanus pike killifish
538 Perciformes Percidae Etheostoma mariae pinewoods darter
539 Cypriniformes Cyprinidae Lythrurus matutinus pinewoods shiner
540 Perciformes Sparidae Lagodon rhomboides pinfish
541 Salmoniformes Salmonidae Oncorhynchus gorbuscha pink salmon
542 Percopsiformes Aphredoderidae Aphredoderus sayanus pirate perch
543 Scorpaeniformes Cottidae Cottus pitensis pit sculpin
544 Petromyzontiformes Petromyzontidae Lampetra lethophaga pit‐klamath brook lamprey
545 Cyprinodontiformes Fundulidae Fundulus zebrinus plains killifish

2013‐2014 National Rivers & Streams Assessment Laboratory Operations Manual
Version 1.3, May 2014 Page 170 of 224
170
APPEN
DIX D: O
THER
PER
TINEN
T ATTACHMEN
TS
LINE NO. ORDER FAMILY SCIENTIFIC NAME COMMON NAME
546 Cypriniformes Cyprinidae Hybognathus placitus plains minnow
547 Cyprinodontiformes Fundulidae Fundulus sciadicus plains topminnow
548 Cypriniformes Cyprinidae Cyprinella lepida plateau shiner
549 Salmoniformes Osmeridae Hypomesus olidus pond smelt
550 Cypriniformes Cyprinidae Notropis ariommus popeye shiner
551 Cyprinodontiformes Poeciliidae Poeciliopsis gracilis porthole livebearer
552 Scorpaeniformes Cottidae Cottus girardi potomac sculpin
553 Cypriniformes Cyprinidae Macrhybopsis australis prairie chub
554 Cypriniformes Cyprinidae Lythrurus bellus pretty shiner
555 Scorpaeniformes Cottidae Cottus asper prickly sculpin
556 Cypriniformes Cyprinidae Cyprinella proserpina proserpine shiner
557 Cypriniformes Cyprinidae Opsopoeodus emiliae pugnose minnow
558 Cypriniformes Cyprinidae Notropis anogenus pugnose shiner
559 Perciformes Centrarchidae Lepomis gibbosus pumpkinseed
560 Cyprinodontiformes Fundulidae Leptolucania ommata pygmy killifish
561 Siluriformes Ictaluridae Noturus stanauli pygmy madtom
562 Scorpaeniformes Cottidae Cottus paulus pygmy sculpin
563 Salmoniformes Salmonidae Prosopium coulterii pygmy whitefish
564 Cypriniformes Catostomidae Carpiodes cyprinus quillback
565 Cyprinodontiformes Goodeidae Crenichthys nevadae railroad valley springfish
566 Perciformes Percidae Etheostoma caeruleum rainbow darter
567 Cypriniformes Cyprinidae Notropis chrosomus rainbow shiner
568 Salmoniformes Osmeridae Osmerus mordax rainbow smelt
569 Salmoniformes Salmonidae Oncorhynchus mykiss rainbow trout
570 Cyprinodontiformes Fundulidae Lucania parva rainwater killifish
571 Cypriniformes Catostomidae Xyrauchen texanus razorback sucker
572 Perciformes Sciaenidae Sciaenops ocellatus red drum
573 Cyprinodontiformes Cyprinodontidae Cyprinodon rubrofluviatilis red river pupfish
574 Cypriniformes Cyprinidae Notropis bairdi red river shiner
575 Cypriniformes Cyprinidae Cyprinella lutrensis red shiner
576 Perciformes Percidae Etheostoma luteovinctum redband darter
577 Perciformes Cichlidae Tilapia zillii redbelly tilapia
578 Perciformes Centrarchidae Lepomis auritus redbreast sunfish
579 Perciformes Centrarchidae Lepomis microlophus redear sunfish
580 Perciformes Centrarchidae Micropterus coosae redeye bass
581 Cypriniformes Cyprinidae Notropis harperi redeye chub
582 Cyprinodontiformes Fundulidae Fundulus rubrifrons redface topminnow
583 Perciformes Percidae Etheostoma whipplei redfin darter
584 Esociformes Esocidae Esox americanus redfin pickerel
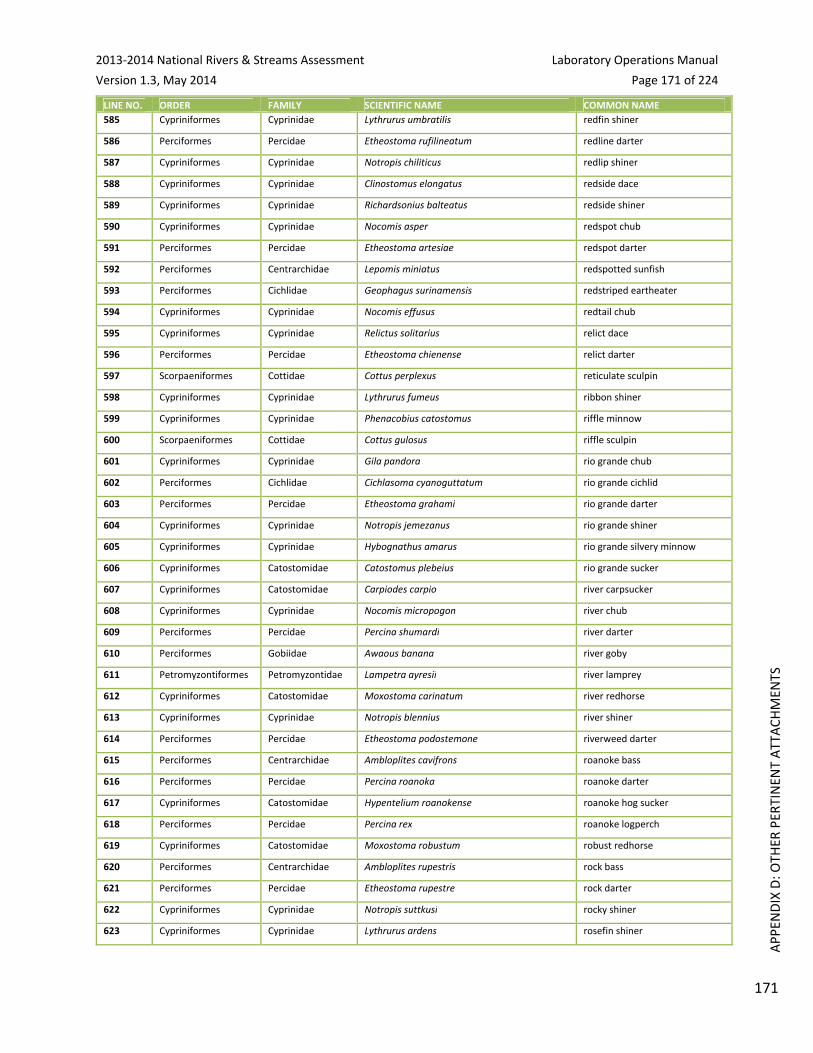
2013‐2014 National Rivers & Streams Assessment Laboratory Operations Manual
Version 1.3, May 2014 Page 171 of 224
171
APPEN
DIX D: O
THER
PER
TINEN
T ATTACHMEN
TS
LINE NO. ORDER FAMILY SCIENTIFIC NAME COMMON NAME
585 Cypriniformes Cyprinidae Lythrurus umbratilis redfin shiner
586 Perciformes Percidae Etheostoma rufilineatum redline darter
587 Cypriniformes Cyprinidae Notropis chiliticus redlip shiner
588 Cypriniformes Cyprinidae Clinostomus elongatus redside dace
589 Cypriniformes Cyprinidae Richardsonius balteatus redside shiner
590 Cypriniformes Cyprinidae Nocomis asper redspot chub
591 Perciformes Percidae Etheostoma artesiae redspot darter
592 Perciformes Centrarchidae Lepomis miniatus redspotted sunfish
593 Perciformes Cichlidae Geophagus surinamensis redstriped eartheater
594 Cypriniformes Cyprinidae Nocomis effusus redtail chub
595 Cypriniformes Cyprinidae Relictus solitarius relict dace
596 Perciformes Percidae Etheostoma chienense relict darter
597 Scorpaeniformes Cottidae Cottus perplexus reticulate sculpin
598 Cypriniformes Cyprinidae Lythrurus fumeus ribbon shiner
599 Cypriniformes Cyprinidae Phenacobius catostomus riffle minnow
600 Scorpaeniformes Cottidae Cottus gulosus riffle sculpin
601 Cypriniformes Cyprinidae Gila pandora rio grande chub
602 Perciformes Cichlidae Cichlasoma cyanoguttatum rio grande cichlid
603 Perciformes Percidae Etheostoma grahami rio grande darter
604 Cypriniformes Cyprinidae Notropis jemezanus rio grande shiner
605 Cypriniformes Cyprinidae Hybognathus amarus rio grande silvery minnow
606 Cypriniformes Catostomidae Catostomus plebeius rio grande sucker
607 Cypriniformes Catostomidae Carpiodes carpio river carpsucker
608 Cypriniformes Cyprinidae Nocomis micropogon river chub
609 Perciformes Percidae Percina shumardi river darter
610 Perciformes Gobiidae Awaous banana river goby
611 Petromyzontiformes Petromyzontidae Lampetra ayresii river lamprey
612 Cypriniformes Catostomidae Moxostoma carinatum river redhorse
613 Cypriniformes Cyprinidae Notropis blennius river shiner
614 Perciformes Percidae Etheostoma podostemone riverweed darter
615 Perciformes Centrarchidae Ambloplites cavifrons roanoke bass
616 Perciformes Percidae Percina roanoka roanoke darter
617 Cypriniformes Catostomidae Hypentelium roanokense roanoke hog sucker
618 Perciformes Percidae Percina rex roanoke logperch
619 Cypriniformes Catostomidae Moxostoma robustum robust redhorse
620 Perciformes Centrarchidae Ambloplites rupestris rock bass
621 Perciformes Percidae Etheostoma rupestre rock darter
622 Cypriniformes Cyprinidae Notropis suttkusi rocky shiner
623 Cypriniformes Cyprinidae Lythrurus ardens rosefin shiner
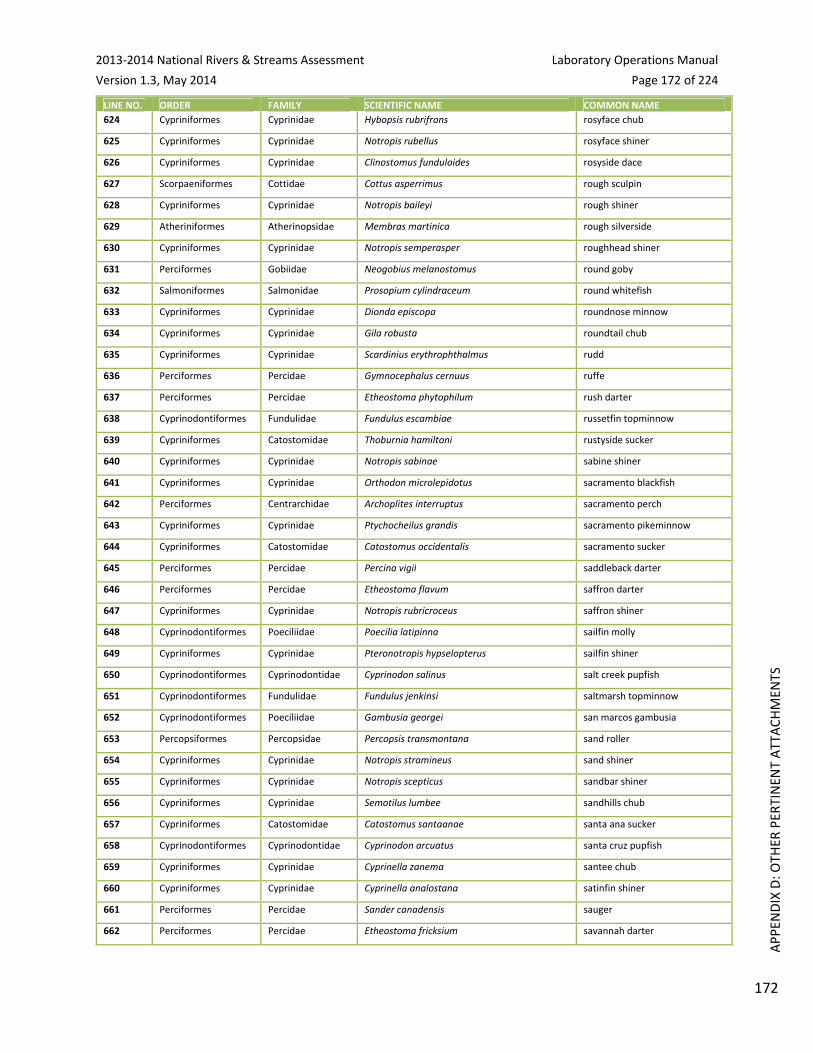
2013‐2014 National Rivers & Streams Assessment Laboratory Operations Manual
Version 1.3, May 2014 Page 172 of 224
172
APPEN
DIX D: O
THER
PER
TINEN
T ATTACHMEN
TS
LINE NO. ORDER FAMILY SCIENTIFIC NAME COMMON NAME
624 Cypriniformes Cyprinidae Hybopsis rubrifrons rosyface chub
625 Cypriniformes Cyprinidae Notropis rubellus rosyface shiner
626 Cypriniformes Cyprinidae Clinostomus funduloides rosyside dace
627 Scorpaeniformes Cottidae Cottus asperrimus rough sculpin
628 Cypriniformes Cyprinidae Notropis baileyi rough shiner
629 Atheriniformes Atherinopsidae Membras martinica rough silverside
630 Cypriniformes Cyprinidae Notropis semperasper roughhead shiner
631 Perciformes Gobiidae Neogobius melanostomus round goby
632 Salmoniformes Salmonidae Prosopium cylindraceum round whitefish
633 Cypriniformes Cyprinidae Dionda episcopa roundnose minnow
634 Cypriniformes Cyprinidae Gila robusta roundtail chub
635 Cypriniformes Cyprinidae Scardinius erythrophthalmus rudd
636 Perciformes Percidae Gymnocephalus cernuus ruffe
637 Perciformes Percidae Etheostoma phytophilum rush darter
638 Cyprinodontiformes Fundulidae Fundulus escambiae russetfin topminnow
639 Cypriniformes Catostomidae Thoburnia hamiltoni rustyside sucker
640 Cypriniformes Cyprinidae Notropis sabinae sabine shiner
641 Cypriniformes Cyprinidae Orthodon microlepidotus sacramento blackfish
642 Perciformes Centrarchidae Archoplites interruptus sacramento perch
643 Cypriniformes Cyprinidae Ptychocheilus grandis sacramento pikeminnow
644 Cypriniformes Catostomidae Catostomus occidentalis sacramento sucker
645 Perciformes Percidae Percina vigil saddleback darter
646 Perciformes Percidae Etheostoma flavum saffron darter
647 Cypriniformes Cyprinidae Notropis rubricroceus saffron shiner
648 Cyprinodontiformes Poeciliidae Poecilia latipinna sailfin molly
649 Cypriniformes Cyprinidae Pteronotropis hypselopterus sailfin shiner
650 Cyprinodontiformes Cyprinodontidae Cyprinodon salinus salt creek pupfish
651 Cyprinodontiformes Fundulidae Fundulus jenkinsi saltmarsh topminnow
652 Cyprinodontiformes Poeciliidae Gambusia georgei san marcos gambusia
653 Percopsiformes Percopsidae Percopsis transmontana sand roller
654 Cypriniformes Cyprinidae Notropis stramineus sand shiner
655 Cypriniformes Cyprinidae Notropis scepticus sandbar shiner
656 Cypriniformes Cyprinidae Semotilus lumbee sandhills chub
657 Cypriniformes Catostomidae Catostomus santaanae santa ana sucker
658 Cyprinodontiformes Cyprinodontidae Cyprinodon arcuatus santa cruz pupfish
659 Cypriniformes Cyprinidae Cyprinella zanema santee chub
660 Cypriniformes Cyprinidae Cyprinella analostana satinfin shiner
661 Perciformes Percidae Sander canadensis sauger
662 Perciformes Percidae Etheostoma fricksium savannah darter

2013‐2014 National Rivers & Streams Assessment Laboratory Operations Manual
Version 1.3, May 2014 Page 173 of 224
173
APPEN
DIX D: O
THER
PER
TINEN
T ATTACHMEN
TS
LINE NO. ORDER FAMILY SCIENTIFIC NAME COMMON NAME
663 Perciformes Percidae Etheostoma serrifer sawcheek darter
664 Clupeiformes Clupeidae Harengula jaguana scaled sardine
665 Perciformes Percidae Ammocrypta vivax scaly sand darter
666 Cypriniformes Cyprinidae Lythrurus fasciolaris scarlet shiner
667 Siluriformes Ictaluridae Noturus trautmani scioto madtom
668 Petromyzontiformes Petromyzontidae Petromyzon marinus sea lamprey
669 Perciformes Percidae Etheostoma thalassinum seagreen darter
670 Cyprinodontiformes Fundulidae Fundulus seminolis seminole killifish
671 Perciformes Centrarchidae Ambloplites ariommus shadow bass
672 Cypriniformes Catostomidae Erimyzon tenuis sharpfin chubsucker
673 Perciformes Percidae Etheostoma acuticeps sharphead darter
674 Perciformes Percidae Percina oxyrhynchus sharpnose darter
675 Scorpaeniformes Cottidae Clinocottus acuticeps sharpnose sculpin
676 Cypriniformes Cyprinidae Notropis oxyrhynchus sharpnose shiner
677 Perciformes Percidae Etheostoma tecumsehi shawnee darter
678 Perciformes Sparidae Archosargus probatocephalus sheepshead
679 Cyprinodontiformes Cyprinodontidae Cyprinodon variegatus sheepshead minnow
680 Perciformes Percidae Percina peltata shield darter
681 Perciformes Gobiidae Tridentiger bifasciatus shimofuri goby
682 Perciformes Embiotocidae Cymatogaster aggregata shiner perch
683 Perciformes Centrarchidae Micropterus cataractae shoal bass
684 Cypriniformes Cyprinidae Macrhybopsis hyostoma shoal chub
685 Perciformes Gobiidae Tridentiger barbatus shokihaze goby
686 Cyprinodontiformes Poeciliidae Poecilia mexicana shortfin molly
687 Cypriniformes Catostomidae Moxostoma macrolepidotum shorthead redhorse
688 Scorpaeniformes Cottidae Cottus confusus shorthead sculpin
689 Salmoniformes Salmonidae Coregonus zenithicus shortjaw cisco
690 Salmoniformes Salmonidae Coregonus reighardi shortnose cisco
691 Lepisosteiformes Lepisosteidae Lepisosteus platostomus shortnose gar
692 Acipenseriformes Acipenseridae Acipenser brevirostrum shortnose sturgeon
693 Cypriniformes Catostomidae Chasmistes brevirostris shortnose sucker
694 Scorpaeniformes Cottidae Cottus greenei shoshone sculpin
695 Acipenseriformes Acipenseridae Scaphirhynchus platorynchus shovelnose sturgeon
696 Cypriniformes Cyprinidae Macrhybopsis meeki sicklefin chub
697 Cypriniformes Cyprinidae Hypophthalmichthys molitrix silver carp
698 Cypriniformes Cyprinidae Macrhybopsis storeriana silver chub
699 Petromyzontiformes Petromyzontidae Ichthyomyzon unicuspis silver lamprey
700 Perciformes Sciaenidae Bairdiella chrysoura silver perch
701 Cypriniformes Catostomidae Moxostoma anisurum silver redhorse

2013‐2014 National Rivers & Streams Assessment Laboratory Operations Manual
Version 1.3, May 2014 Page 174 of 224
174
APPEN
DIX D: O
THER
PER
TINEN
T ATTACHMEN
TS
LINE NO. ORDER FAMILY SCIENTIFIC NAME COMMON NAME
702 Cypriniformes Cyprinidae Notropis photogenis silver shiner
703 Cypriniformes Cyprinidae Notropis shumardi silverband shiner
704 Cypriniformes Cyprinidae Notropis buccatus silverjaw minnow
705 Cypriniformes Cyprinidae Notropis candidus silverside shiner
706 Cypriniformes Cyprinidae Notropis stilbius silverstripe shiner
707 Clupeiformes Clupeidae Alosa chrysochloris skipjack herring
708 Cypriniformes Cyprinidae Notropis uranoscopus skygazer shiner
709 Perciformes Percidae Etheostoma smithi slabrock darter
710 Perciformes Percidae Etheostoma boschungi slackwater darter
711 Perciformes Gobiidae Ctenogobius pseudofasciatus slashcheek goby
712 Cypriniformes Cyprinidae Erimystax cahni slender chub
713 Siluriformes Ictaluridae Noturus exilis slender madtom
714 Scorpaeniformes Cottidae Cottus tenuis slender sculpin
715 Perciformes Percidae Percina phoxocephala slenderhead darter
716 Cypriniformes Cyprinidae Pimephales tenellus slim minnow
717 Scorpaeniformes Cottidae Cottus cognatus slimy sculpin
718 Perciformes Percidae Etheostoma gracile slough darter
719 Cypriniformes Cyprinidae Notropis buccula smalleye shiner
720 Perciformes Centrarchidae Micropterus dolomieu smallmouth bass
721 Cypriniformes Catostomidae Ictiobus bubalus smallmouth buffalo
722 Cypriniformes Catostomidae Moxostoma breviceps smallmouth redhorse
723 Perciformes Percidae Etheostoma microlepidum smallscale darter
724 Perciformes Centropomidae Centropomus parallelus smallscale fat snook
725 Perciformes Eleotridae Eleotris perniger smallscaled spinycheek
726 Pristiformes Pristidae Pristis pectinata smalltooth sawfish
727 Siluriformes Ictaluridae Noturus baileyi smoky madtom
728 Siluriformes Ictaluridae Ameiurus brunneus snail bullhead
729 Perciformes Percidae Percina tanasi snail darter
730 Cypriniformes Catostomidae Chasmistes muriei snake river sucker
731 Perciformes Percidae Etheostoma simoterum snubnose darter
732 Salmoniformes Salmonidae Oncorhynchus nerka sockeye salmon
733 Cypriniformes Cyprinidae Gila ditaenia sonora chub
734 Cypriniformes Catostomidae Catostomus insignis sonora sucker
735 Cyprinodontiformes Cyprinodontidae Cyprinodon eremus sonoyta pupfish
736 Perciformes Percidae Etheostoma olivaceum sooty darter
737 Cypriniformes Catostomidae Cycleptus meridionalis southeastern blue sucker
738 Petromyzontiformes Petromyzontidae Ichthyomyzon gagei southern brook lamprey
739 Percopsiformes Amblyopsidae Typhlichthys subterraneus southern cavefish
740 Pleuronectiformes Paralichthyidae Paralichthys lethostigma southern flounder

2013‐2014 National Rivers & Streams Assessment Laboratory Operations Manual
Version 1.3, May 2014 Page 175 of 224
175
APPEN
DIX D: O
THER
PER
TINEN
T ATTACHMEN
TS
LINE NO. ORDER FAMILY SCIENTIFIC NAME COMMON NAME
741 Perciformes Percidae Percina austroperca southern logperch
742 Cyprinodontiformes Poeciliidae Xiphophorus maculatus southern platyfish
743 Cypriniformes Cyprinidae Phoxinus erythrogaster southern redbelly dace
744 Siluriformes Loricariidae Pterygoplichthys anisitsi southern sailfin catfish
745 Perciformes Percidae Ammocrypta meridiana southern sand darter
746 Siluriformes Doradidae Platydoras armatulus southern striped raphael
747 Cyprinodontiformes Fundulidae Fundulus stellifer southern studfish
748 Cypriniformes Cyprinidae Macrhybopsis aestivalis speckled chub
749 Cypriniformes Cyprinidae Rhinichthys osculus speckled dace
750 Perciformes Percidae Etheostoma stigmaeum speckled darter
751 Cyprinodontiformes Fundulidae Fundulus rathbuni speckled killifish
752 Siluriformes Ictaluridae Noturus leptacanthus speckled madtom
753 Cypriniformes Cyprinidae Meda fulgida spikedace
754 Perciformes Percidae Etheostoma barrenense splendid darter
755 Cypriniformes Cyprinidae Pogonichthys macrolepidotus splittail
756 Scorpaeniformes Cottidae Cottus ricei spoonhead sculpin
757 Perciformes Sciaenidae Leiostomus xanthurus spot
758 Cypriniformes Cyprinidae Erimonax monachus spotfin chub
759 Cyprinodontiformes Fundulidae Fundulus luciae spotfin killifish
760 Cypriniformes Cyprinidae Cyprinella spiloptera spotfin shiner
761 Perciformes Percidae Etheostoma squamiceps spottail darter
762 Cypriniformes Cyprinidae Notropis hudsonius spottail shiner
763 Perciformes Centrarchidae Micropterus punctulatus spotted bass
764 Siluriformes Ictaluridae Ameiurus serracanthus spotted bullhead
765 Perciformes Percidae Etheostoma maculatum spotted darter
766 Lepisosteiformes Lepisosteidae Lepisosteus oculatus spotted gar
767 Perciformes Sciaenidae Cynoscion nebulosus spotted seatrout
768 Perciformes Eleotridae Eleotris picta spotted sleeper
769 Cypriniformes Catostomidae Minytrema melanops spotted sucker
770 Perciformes Centrarchidae Lepomis punctatus spotted sunfish
771 Perciformes Cichlidae Tilapia mariae spotted tilapia
772 Percopsiformes Amblyopsidae Forbesichthys agassizii spring cavefish
773 Perciformes Elassomatidae Elassoma alabamae spring pygmy sunfish
774 Perciformes Percidae Percina uranidea stargazing darter
775 Cypriniformes Cyprinidae Phenacobius uranops stargazing minnow
776 Cyprinodontiformes Fundulidae Fundulus dispar starhead topminnow
777 Pleuronectiformes Pleuronectidae Platichthys stellatus starry flounder
778 Cypriniformes Cyprinidae Cyprinella whipplei steelcolor shiner
779 Perciformes Percidae Etheostoma punctulatum stippled darter

2013‐2014 National Rivers & Streams Assessment Laboratory Operations Manual
Version 1.3, May 2014 Page 176 of 224
176
APPEN
DIX D: O
THER
PER
TINEN
T ATTACHMEN
TS
LINE NO. ORDER FAMILY SCIENTIFIC NAME COMMON NAME
780 Cyprinodontiformes Fundulidae Fundulus bifax stippled studfish
781 Perciformes Percidae Etheostoma derivativum stone darter
782 Siluriformes Ictaluridae Noturus flavus stonecat
783 Perciformes Percidae Etheostoma fragi strawberry darter
784 Cypriniformes Cyprinidae Erimystax dissimilis streamline chub
785 Perciformes Percidae Etheostoma striatulum striated darter
786 Perciformes Percidae Percina notogramma stripeback darter
787 Perciformes Moronidae Morone saxatilis striped bass
788 Perciformes Percidae Etheostoma virgatum striped darter
789 Cypriniformes Catostomidae Moxostoma rupiscartes striped jumprock
790 Perciformes Gerreidae Eugerres plumieri striped mojarra
791 Mugiliformes Mugilidae Mugil cephalus striped mullet
792 Cypriniformes Cyprinidae Luxilus chrysocephalus striped shiner
793 Perciformes Percidae Etheostoma kennicotti stripetail darter
794 Cypriniformes Cyprinidae Macrhybopsis gelida sturgeon chub
795 Siluriformes Loricariidae Hypostomus plecostomus suckermouth catfish
796 Cypriniformes Cyprinidae Phenacobius mirabilis suckermouth minnow
797 Salmoniformes Osmeridae Hypomesus pretiosus surf smelt
798 Perciformes Centrarchidae Micropterus notius suwannee bass
799 Cypriniformes Cyprinidae Notropis procne swallowtail shiner
800 Perciformes Percidae Etheostoma fusiforme swamp darter
801 Percopsiformes Amblyopsidae Chologaster cornuta swampfish
802 Perciformes Percidae Etheostoma swannanoa swannanoa darter
803 Perciformes Centropomidae Centropomus ensiferus swordspine snook
804 Siluriformes Ictaluridae Noturus gyrinus tadpole madtom
805 Cypriniformes Catostomidae Catostomus tahoensis tahoe sucker
806 Cypriniformes Cyprinidae Notropis maculatus taillight shiner
807 Perciformes Percidae Etheostoma tallapoosae tallapoosa darter
808 Cypriniformes Cyprinidae Cyprinella gibbsi tallapoosa shiner
809 Cypriniformes Cyprinidae Notropis braytoni tamaulipas shiner
810 Perciformes Percidae Percina aurantiaca tangerine darter
811 Elopiformes Megalopidae Megalops atlanticus tarpon
812 Perciformes Centropomidae Centropomus pectinatus tarpon snook
813 Perciformes Percidae Etheostoma barbouri teardrop darter
814 Cypriniformes Cyprinidae Notropis telescopus telescope shiner
815 Cypriniformes Cyprinidae Tinca tinca tench
816 Cypriniformes Cyprinidae Phoxinus tennesseensis tennessee dace
817 Cypriniformes Cyprinidae Notropis leuciodus tennessee shiner
818 Perciformes Percidae Etheostoma olmstedi tessellated darter

2013‐2014 National Rivers & Streams Assessment Laboratory Operations Manual
Version 1.3, May 2014 Page 177 of 224
177
APPEN
DIX D: O
THER
PER
TINEN
T ATTACHMEN
TS
LINE NO. ORDER FAMILY SCIENTIFIC NAME COMMON NAME
819 Perciformes Percidae Percina carbonaria texas logperch
820 Cypriniformes Cyprinidae Notropis amabilis texas shiner
821 Cyprinodontiformes Poeciliidae Gambusia speciosa tex‐mex gambusia
822 Cypriniformes Cyprinidae Cyprinella labrosa thicklip chub
823 Cypriniformes Cyprinidae Gila crassicauda thicktail chub
824 Clupeiformes Clupeidae Dorosoma petenense threadfin shad
825 Perciformes Gobiidae Eucyclogobius newberryi tidewater goby
826 Perciformes Gerreidae Eucinostomus harengulus tidewater mojarra
827 Perciformes Percidae Etheostoma tippecanoe tippecanoe darter
828 Perciformes Percidae Etheostoma lachneri tombigbee darter
829 Cypriniformes Cyprinidae Exoglossum laurae tonguetied minnow
830 Siluriformes Ictaluridae Trogloglanis pattersoni toothless blindcat
831 Cypriniformes Cyprinidae Notropis topeka topeka shiner
832 Scorpaeniformes Cottidae Cottus rhotheus torrent sculpin
833 Cypriniformes Catostomidae Thoburnia rhothoeca torrent sucker
834 Cypriniformes Cyprinidae Cyprinella trichroistia tricolor shiner
835 Perciformes Percidae Etheostoma trisella trispot darter
836 Percopsiformes Percopsidae Percopsis omiscomaycus trout‐perch
837 Perciformes Gobiidae Proterorhinus marmoratus tubenose goby
838 Perciformes Percidae Etheostoma gutselli tuckasegee darter
839 Cypriniformes Cyprinidae Gila bicolor tui chub
840 Perciformes Embiotocidae Hysterocarpus traskii tule perch
841 Perciformes Percidae Etheostoma inscriptum turquoise darter
842 Perciformes Percidae Etheostoma tuscumbia tuscumbia darter
843 Perciformes Percidae Etheostoma douglasi tuskaloosa darter
844 Cypriniformes Cyprinidae Rhinichthys umatilla umatilla dace
845 Cypriniformes Cyprinidae Oregonichthys kalawatseti umpqua chub
846 Cypriniformes Cyprinidae Rhinichthys evermanni umpqua dace
847 Cypriniformes Cyprinidae Ptychocheilus umpquae umpqua pikeminnow
848 Cypriniformes Cyprinidae Gila atraria utah chub
849 Scorpaeniformes Cottidae Cottus echinatus utah lake sculpin
850 Cypriniformes Catostomidae Catostomus ardens utah sucker
851 Cyprinodontiformes Poeciliidae Xiphophorus variatus variable platyfish
852 Perciformes Percidae Etheostoma variatum variegate darter
853 Siluriformes Loricariidae Pterygoplichthys disjunctivus vermiculated sailfin catfish
854 Perciformes Percidae Etheostoma chermocki vermilion darter
855 Perciformes Gobiidae Gobioides broussonetii violet goby
856 Cypriniformes Cyprinidae Gila seminuda virgin chub
857 Cypriniformes Cyprinidae Lepidomeda mollispinis virgin spinedace

2013‐2014 National Rivers & Streams Assessment Laboratory Operations Manual
Version 1.3, May 2014 Page 178 of 224
178
APPEN
DIX D: O
THER
PER
TINEN
T ATTACHMEN
TS
LINE NO. ORDER FAMILY SCIENTIFIC NAME COMMON NAME
858 Cypriniformes Catostomidae Moxostoma pappillosum v‐lip redhorse
859 Perciformes Percidae Etheostoma perlongum waccamaw darter
860 Cyprinodontiformes Fundulidae Fundulus waccamensis waccamaw killifish
861 Atheriniformes Atherinopsidae Menidia extensa waccamaw silverside
862 Salmoniformes Osmeridae Hypomesus nipponensis wakasagi
863 Siluriformes Clariidae Clarias batrachus walking catfish
864 Perciformes Percidae Sander vitreus walleye
865 Perciformes Cichlidae Oreochromis urolepis wami tilapia
866 Perciformes Centrarchidae Lepomis gulosus warmouth
867 Cypriniformes Catostomidae Catostomus warnerensis warner sucker
868 Cypriniformes Cyprinidae Luxilus coccogenis warpaint shiner
869 Perciformes Percidae Etheostoma bellator warrior darter
870 Cypriniformes Cyprinidae Lythrurus alegnotus warrior shiner
871 Perciformes Percidae Etheostoma nuchale watercress darter
872 Cypriniformes Cyprinidae Notropis greenei wedgespot shiner
873 Cypriniformes Cyprinidae Notropis texanus weed shiner
874 Cypriniformes Cyprinidae Rhinichthys obtusus western blacknose dace
875 Petromyzontiformes Petromyzontidae Lampetra richardsoni western brook lamprey
876 Cyprinodontiformes Poeciliidae Gambusia affinis western mosquitofish
877 Perciformes Percidae Ammocrypta clara western sand darter
878 Cypriniformes Cyprinidae Hybognathus argyritis western silvery minnow
879 Cyprinodontiformes Fundulidae Fundulus blairae western starhead topminnow
880 Perciformes Moronidae Morone chrysops white bass
881 Siluriformes Ictaluridae Ameiurus catus white catfish
882 Perciformes Centrarchidae Pomoxis annularis white crappie
883 Mugiliformes Mugilidae Mugil curema white mullet
884 Perciformes Moronidae Morone americana white perch
885 Cypriniformes Cyprinidae Lepidomeda albivallis white river spinedace
886 Cyprinodontiformes Goodeidae Crenichthys baileyi white river springfish
887 Cyprinodontiformes Cyprinodontidae Cyprinodon tularosa white sands pupfish
888 Cypriniformes Cyprinidae Luxilus albeolus white shiner
889 Acipenseriformes Acipenseridae Acipenser transmontanus white sturgeon
890 Cypriniformes Catostomidae Catostomus commersonii white sucker
891 Cypriniformes Cyprinidae Cyprinella nivea whitefin shiner
892 Cyprinodontiformes Fundulidae Fundulus albolineatus whiteline topminnow
893 Cypriniformes Cyprinidae Notropis alborus whitemouth shiner
894 Cypriniformes Cyprinidae Cyprinella galactura whitetail shiner
895 Siluriformes Ictaluridae Satan eurystomus widemouth blindcat
896 Scorpaeniformes Cottidae Cottus leiopomus wood river sculpin

2013‐2014 National Rivers & Streams Assessment Laboratory Operations Manual
Version 1.3, May 2014 Page 179 of 224
179
APPEN
DIX D: O
THER
PER
TINEN
T ATTACHMEN
TS
LINE NO. ORDER FAMILY SCIENTIFIC NAME COMMON NAME
897 Perciformes Percidae Etheostoma vulneratum wounded darter
898 Cypriniformes Cyprinidae Plagopterus argentissimus woundfin
899 Siluriformes Ictaluridae Ictalurus pricei yaqui catfish
900 Cypriniformes Cyprinidae Gila purpurea yaqui chub
901 Cypriniformes Catostomidae Catostomus bernardini yaqui sucker
902 Perciformes Percidae Etheostoma raneyi yazoo darter
903 Cypriniformes Cyprinidae Notropis rafinesquei yazoo shiner
904 Perciformes Moronidae Morone mississippiensis yellow bass
905 Siluriformes Ictaluridae Ameiurus natalis yellow bullhead
906 Perciformes Percidae Perca flavescens yellow perch
907 Perciformes Cichlidae Cichlasoma salvini yellowbelly cichlid
908 Perciformes Percidae Etheostoma moorei yellowcheek darter
909 Perciformes Gobiidae Acanthogobius flavimanus yellowfin goby
910 Siluriformes Ictaluridae Noturus flavipinnis yellowfin madtom
911 Cypriniformes Cyprinidae Notropis lutipinnis yellowfin shiner
912 Perciformes Percidae Etheostoma juliae yoke darter
913 Perciformes Percidae Sander lucioperca zander
914 Cypriniformes Catostomidae Moxostoma cf. poecilurum apalachicola redhorse
915 Salmoniformes Salmonidae Salmo salar atlantic salmon juvenile
916 Atheriniformes Atherinopsidae Menidia menidia atlantic silverside
917 Cypriniformes Cyprinidae Hypophthalmichthys nobilis bighead carp
918 Cypriniformes Cyprinidae Mylopharyngodon piceus black carp
919 Perciformes Pomatomidae Pomatomus saltatrix bluefish
920 Perciformes Percidae Etheostoma meadiae bluespar darter
921 Salmoniformes Salmonidae Oncorhynchus clarkii utah bonneville cutthroat trout
922 Cypriniformes Catostomidae Moxostoma cf. lachneri brassy jumprock
923 Anura Ranidae Rana catesbeiana bullfrog
924 Anura Ranidae Rana catesbeiana bullfrog tadpole
925 Scorpaeniformes Cottidae Cottus chattahoochee chattahoochee sculpin
926 Salmoniformes Salmonidae Oncorhynchus tshawytscha chinook salmon (yoy)
927 Scorpaeniformes Cottidae Cottus cf. broadband sculpin clinch sculpin
928 Salmoniformes Salmonidae Oncorhynchus clarkii clarkii coastal cutthroat trout
929 Salmoniformes Salmonidae Oncorhynchus clarkii pleuriticus colorado river cutthroat trout
930 Anguilliformes Congridae Conger oceanicus conger eel
931 Cypriniformes Cyprinidae Macrhybopsis cf. aestivalis coosa chub
932 Cypriniformes Cyprinidae Semotilus X Luxilus atromaculatus x chrysocephalus
creek chub x striped shiner
933 Salmoniformes Salmonidae Oncorhynchus clarkii x mykiss cutbow
934 Perciformes Percidae Etheostoma planasaxatile duck darter
935 Perciformes Percidae Etheostoma orientale eastrim darter

2013‐2014 National Rivers & Streams Assessment Laboratory Operations Manual
Version 1.3, May 2014 Page 180 of 224
180
APPEN
DIX D: O
THER
PER
TINEN
T ATTACHMEN
TS
LINE NO. ORDER FAMILY SCIENTIFIC NAME COMMON NAME
936 Perciformes Centropomidae Centropomus parallelus fat snook
937 Esociformes Esocidae Esox americanus vermiculatus grass pickerel
938 Clupeiformes Clupeidae Brevoortia patronus gulf menhaden
939 Scorpaeniformes Cottidae Cottus kanawhae kanawha sculpin
940 Salmoniformes Salmonidae Oncorhynchus clarkii henshawi lahontan cutthroat trout
941 Cypriniformes Catostomidae Pantosteus lahontan lahontan sucker
942 Perciformes Centrarchidae Micropterus salmoides largemouth bass (yoy)
943 Perciformes Eleotridae Eleotris amblyopsis largescaled spinycheek sleeper
944 Cypriniformes Catostomidae Catostomus cf. latipinnis little colorado river sucker
945 Cypriniformes Cyprinidae Notropis amplamala longjaw minnow
946 Cypriniformes Cyprinidae Pteronotropis stonei lowland shiner
947 Cypriniformes Cyprinidae Cyprinus carpio mirror carp
948 Caudata Ambystomatidae Dicamptodon tenebrosus pacific giant salamander
949 Salmoniformes Salmonidae Oncorhynchus mykiss rainbow trout (steelhead)
950 Anura Ranidae Rana aurora red‐legged frog
951 Salmoniformes Salmonidae Oncorhynchus mykiss gairdneri redband rainbow trout
952 Caudata Salamandridae Taricha granulosa rough‐skinned newt
953 Siluriformes Ictaluridae Noturus fasciatus saddled madtom
954 Perciformes Percidae Sander canadensis x vitreus saugeye
955 Cypriniformes Cyprinidae Notropis cf. spectrunculus sawfin shiner
956 Cypriniformes Cyprinidae Hypophthalmichthys molitrix silver carp
957 Cypriniformes Catostomidae Moxostoma robustum smallfin redhorse
958 Perciformes Channidae Channa argus snakehead
959 Anguilliformes Ophichthidae Myrophis punctatus speckled worm eel
960 Anura Ascaphidae Ascaphus truei tailed frog
961 Anura Ascaphidae Ascaphus truei tailed frog (tadpole)
962 Scorpaeniformes Cottidae Cottus tallapoosae tallapoosa sculpin
963 Perciformes Percidae Etheostoma tennesseense tennessee darter
964 Cypriniformes Cyprinidae Cyprinella cf. zanema thinlip chub
965 Gasterosteiformes Gasterosteidae Gasterosteus aculeatus threespine stickleback
966 Esociformes Esocidae Esox lucius x masquinongy tiger muskellunge
967 Salmoniformes Salmonidae Salmo X Salvelinus trutta x fontinalis tiger trout
968 Anura Bufonidae Bufo boreas western toad
969 Perciformes Percidae Etheostoma occidentale westrim darter
970 Salmoniformes Salmonidae Oncorhynchus clarkii lewisi westslope cutthroat trout
971 Perciformes Moronidae Morone na wiper
972 Perciformes Gerreidae Gerres cinereus yellowfin mojarra
973 Perciformes Percidae Percina burtoni blotchside darter
974 Anura Pipidae Xenopus laevis african clawed frog

2013‐2014 National Rivers & Streams Assessment Laboratory Operations Manual
Version 1.3, May 2014 Page 181 of 224
181
APPEN
DIX D: O
THER
PER
TINEN
T ATTACHMEN
TS
LINE NO. ORDER FAMILY SCIENTIFIC NAME COMMON NAME
975 Salmoniformes Salmonidae Oncorhynchus apache x mykiss apache x rainbow trout
976 Anura Bufonidae Bufo microscaphus arizona toad
977 Anura Hylidae Pseudacris maculata boreal chorus frog
978 Caudata Ambystomatidae Dicamptodon ensatus california giant salamander
979 Caudata Salamandridae Taricha torosa california newt
980 Anura Hylidae Pseudacris cadaverina california treefrog
981 Anura Bufonidae Bufo hemiophrys canadian toad
982 Anura Hylidae Hyla arenicolor canyon treefrog
983 Anura Ranidae Rana cascadae cascade frog
984 Anura Ranidae Rana luteiventris columbia spotted frog
985 Caudata Rhyacotritonidae Rhyacotriton kezeri columbia torrent salamander
986 Anura Ranidae Rana boylii foothill yellow‐legged frog
987 Salmoniformes Salmonidae Oncorhynchus aguabonita golden trout
988 Anura Ranidae Rana clamitans green frog
989 Caudata Ambystomatidae Dicamptodon aterrimus idaho giant salamander
990 Petromyzontiformes Petromyzontidae Lampetra similis klamath river lamprey
991 Anura Ranidae Lithobates pipiens leopard frog
992 Caudata Ambystomatidae Ambystoma macrodactylum longtoed salamander
993 Anura Ranidae Rana yavapaiensis lowland leopard frog
994 Anura Ranidae Rana muscosa mountain yellow‐legged frog
995 Anura Hylidae Pseudacris regilla pacific tree frog
996 Anura Ranidae Lithobates blairi plains leopard frog
997 Salmoniformes Salmonidae Oncorhynchus mykiss x aguabonita rainbow x golden trout
998 Anura Bufonidae Bufo punctatus red‐spotted toad
999 Cypriniformes Cyprinidae Richardsonius X Rhinichthys balteatus x osculus redside shiner x speckled dace
1000 Anura Ranidae Rana pretiosa spotted frog
1001 Anura Ranidae Rana sylvatica wood frog
1002 Anura Bufonidae Bufo woodhousii woodhouse's toad
1003 Anura Ranidae Lithobates chiricahuensis chiricahua leopard frog

2013‐2014 National Rivers & Streams Assessment Laboratory Operations Manual
Version 1.3, May 2014 Page 182 of 224
182
APPEN
DIX E: REPORTING TEM
PLATES
APPENDIXE:REPORTINGTEMPLATES

2013‐2014 National Rivers & Streams Assessment Laboratory Operations Manual
Version 1.3, May 2014 Page 183 of 224
183
APPEN
DIX E: REPORTING TEM
PLATES
Templates will be provided on the NARS Sharefile.

2013‐2014 National Rivers & Streams Assessment Laboratory Operations Manual
Version 1.3, May 2014 Page 184 of 224
184
APPENDIXF:EXAMPLESOPSFORMERCURYINFISHTISSUEPLUGANALYSES