national security - vivekananda international foundation
TRANSCRIPT

NATIONAL SECURITY A VIF Publication
Instructions for authors
Potential of Geospatial Technologies as a Cognitive and Spatio-visual tool for Mapping the Past
M B Rajani & Shalini Dixit
Rajani, M B and Shalini Dixit. “ Potential of Geospatial Technologies as a Cognitive and
Spatio-visual tool for Mapping the Past” National Security, Vivekananda International
Foundation Vol.IV (1) (2021) pp- 63-80.
https://www.vifindia.org/sites/default/files/national-security-vol-4-issue-1-article-mrajani&sdixit.pdf
• This article may be used for research, teaching and private study purposes. Any substantial or systematic reproduction, re-distribution, re-selling, loan or sub-licensing, systematic supply or distribution in any form to anyone is expressly forbidden.
• Viewsexpressedarethoseoftheauthor(s)anddonotnecessarilyreflecttheviews of the VIF.
• Theauthorcertifiesthatthearticle/paperisoriginalincontent,unpublishedandithasnotbeensubmittedforpublication/webuploadelsewhereandthatthefactsandfiguresquotedaredulyreferenced,asneeded,andarebelievedtobecorrect.

National Security Vol. IV Issue I | ISSN 2581-9658 (O) | 63
Article
Potential of Geospatial Technologies as a Cognitive and Spatio-visual tool for Mapping the Past
M B Rajani & Shalini Dixit
Abstract
A major challenge in understanding the past is that it is not available for exploration
at present. The sections of history that deal with geographical associates of human
endeavours also pose a challenge to the readers and learners about the scale and
experience of a past landscape. Despite the cognitive and reasoning capabilities of
individuals, views of an entire landscape cannot be achieved by normal eye view.
Geospatial technologies provide immense potential for accessing historical landscape
and past realities. The tools are helpful in twin ways. Firstly, they enable learners to
understand the existing information about landscape by providing synoptic and 3D
views through interactive visualisation tools. Secondly, they enable researchers to look
for clues to the past settlements in a landscape in ways that are not otherwise possible,
i.e. “see” through infrared lens and integrate evidence gained from observations made
across different times. The present paper discusses some of these advantages that we
gain by applying gospatial technologies to normal human perceptions.
Dr M B Rajani is an Associate Professor in the School of Humanities, National Institute of Advanced Studies, Bengaluru.
Dr Shalini Dixit is an Assistant Professor in the School of Social Sciences, National Institute of Advanced Studies, Bengaluru.
History is about understanding past events, their conditions and causes. Understanding realities of the past requires appreciation of the accounts and explanations of the
ways and sequences through which the present came to be about. It requires findingand explaining commonalities and differences across time to understand the patterns.Appreciating the geographical and spatial conditions is a crucial aspect of engaging with the history, as they are linked with the cultural, economic and political activities of the past. The landscape influenced thewaypeoplenavigated their space, constructed structures,
Potential of Geospatial Technologies as a Cognitive and Spatio-visual tool for Mapping the Past
National Security Vol. IV Issue I | ISSN 2581-9658 (O) | 64
resided and traded therein. History and geography are thus inseparable and fundamentally interdependent.1
The patterns in the historical phenomena have several physical and climatic conditions which indicate continuity and change in the events of history. The lasting social structures and the ones which have diminished may be related to the natural resources available for those societies. For example, why a specific region has been occupied byhumansoverhistoricalintervals?Whywerecertainregionsdifficulttowinover?Whydidcertainregionsneverflourish?Allthesequestionsandtheiranswersindicategeographicalconditionsof terrains thathaveaffected thecourseofhistory.However, thedescriptionof such geographical features is not easily grasped owing to the limitations of our mental structures.RemotesensingimagesandGIStechniquesprovideanaugmentedperceptionofsuchpatternsandassisttheunderstandingofthesameinaneffectiveway.
Satellite and aerial images have been used for understanding varied forms of built cultural heritage in many parts of the world.2 One of the earliest applications of remote sensing to archaeology was the accidental discovery of the remains of ancient Samarra in Mesopotamia by Lieutenant-Colonel G A Beazeley (British Soldier during WWI) while conducting aerial reconnaissance in 1916.3 In the 1980s, Earth Observation satellites began producingimagesthatenabledtheidentificationofancientrivercourses(e.g.,SarasvatiinNW India4), and riverine topography under the Sahara desert was revealed by radar images from Shuttle Radar Terrain Mission (SRTM).5 More recent applications include space-based infrared imaging to identify the foundation of a previously unknown pyramid in Egypt6 and aerial LiDAR scanning to identify Mayan remains under a thick tree canopy in the forests at Caracol in western Belize7 and in deep jungles of Angkor in Cambodia8. In India, too, satellite imagery has provided new insights on many sites, including Nalanda9 and Mahabalipuram10.
Remote sensing and GIS as a cognitive-visual tool to visualise the past
Perception of landscape is not as simple as perception of smaller surfaces. The surfaces that we see with the naked eye can be viewed from a point in a single gaze. The biggerlandscapesaredifferentfromtheobjectsofourday-to-dayperception,inthattheydo not render themselves to human visualization. Unlike the small-scale perceptions, one hastocombinedifferentcognitiveprocessestofathomthelarge-scalelandscapereality.Spatial knowledge requires retrieval of information and representation of the same.11
It requiresmemory, reasoning and/or use ofminiature replicas of the same to cognisethe spatio-temporal reality. The information such as, texture, terrain, turns, landmarks, mountain, hills, buildings, can be memorised and retrieved when desired. However, the representation of the same into a cognitive structure may not always correspond to reality.
M B Rajani & Shalini Dixit
National Security Vol. IV Issue I | ISSN 2581-9658 (O) | 65
For example, when we take records and notes of the landscape by indicating directions, verbally or by handmovements, it could be understood differently by different people.Even if the person is recording by himself, we cannot trust our memories of such a large set of information, as they tend to be subject to selective remembering.12 For this purpose, theuseofvisualmeanssuchasmaps,datachartsandotherrepresentationtechniques13
and simple textual description14 have proven to be a helpful aid. The dual coding theory inPsychology isparticularlyhelpful inexplainingthebenefitsofvisual representationofspatialinformation.Thetheoryproposesthattherearetwodifferentsystemsofcognitiveprocessing--one deals with verbal information processing and the other deals with non-verbal images. As per the studies done by A. Paivio15, and replicated later, processing of any information entails activation of neural networks of both kinds, visual and audio. It implies that information which is processed at both the levels have better retention, mental representationandeffectiveretrieval.
The tools available under the larger umbrella of geospatial technologies goes farther than just providing visual images. They provide detailed cartographic representation and diverse visualisations of the landscape. They can help a person not just visualise a region or landscape but allows him to navigate the terrain virtually. By allowing the visualisation and virtual navigation of the space it reduces the cognitive load on human beings in understanding and developing new knowledge about the same. There are many more sophisticated functions performed by geospatial technology which are not possible by bare human means. We provide instances of such educational and knowledge-building potential of geospatial tools in the remaining sections of this paper.
Investigating historical sites using remote sensing and GIS
Ever since humankind has evolved from being nomads and cave dwellers and moved towards building settled habitation, we have constantly scarred our environment by making dents on the earth’s surface – for agricultural activities, building structures, layingouttowns/cities,creatingsettlementsandexploitingnaturalresources(particularlywater) for our sustenance. We can, therefore, trace the past of a landscape by studying the impacts of such human actions upon the environment. Space technology can be used to detect the impact of such activities that are not always visible to the naked eye or from the ground. This is because images taken from aerial and space platforms display a perspective of landscapes which cannot be perceived from the ground.
Conventionally we have learnt about locations of historical sites or their spatial expanse from sources such as inscriptions, writings, records, literature, or art and architectural remnants at the site. But, with the advent of new technologies, historical sites

Potential of Geospatial Technologies as a Cognitive and Spatio-visual tool for Mapping the Past
National Security Vol. IV Issue I | ISSN 2581-9658 (O) | 66
renderthemselvesforanalysisusingvarioustechniquesavailableunderthelargeumbrellaof geospatial technologies. This is because of the nature of such heritage. Structure(s) were necessarily built in particular geographical and cultural settings, originally based on appropriate site selection in order to suitably locate the structure(s) and its components. Furthermore, the initiallyplanned layoutandsubsequentadditionswouldhaveaspatialspread,togetherwiththesubsequentchangesinthelanduse(agricultural,settlementoraffectedbydisasterslikefloods),whicharealsospatialinnature.Thesefactorscombinedwith the locational permanence of the structure(s) make built heritage well-disposed for geospatial analysis.
Advanced remote sensing technologies allow detecting subtle landscape features by sensing “light” that is invisible to humans (infrared, microwave, etc.). This non-invasive technology is most suitable for archaeology since it leaves sites unscathed. Remote sensing image data, along with other spatial data (maps, plans) regarding archaeological sites can be integrated into a database for storage, retrieval and analysis, through GIS technology. Even historical narratives pertaining to past landscape conditions can be revisited and understood better using 3D visualization. The set of technologies that include remote sensing, GIS, 3D visualization together with sat-nav for positioning and ground truthing can collectively be called Geospatial Technology.
Four distinct ways of enhancing perception of the past:
Images taken from aerial and space platforms, enable four distinct ways of enhancing perception which is not otherwise possible: (i) they provide a synoptic view of larger landscape; (ii) they allow viewing of landscapes in the “light” invisible to humans (e.g. infrared, microwave); (iii) they facilitate visualising virtual 3-D models of the terrain; and (iv) they allow integrated visualisation of information from multiple sources - such as maps, plans and satellite imagery of various dates, seasons and technologies, as well as non-spatialdata(suchasdatafromfieldandexcavationreports).
We elaborate each of these advantages with examples in the following section.
(i) Synoptic view: It was only with the advent of aviation that archaeologists had access to an entirely new perspective of a site under study, the synoptic view. Observations from aerial and, more recently, space platforms provide an overall view of a site. When viewed from an elevated platform, seemingly scattered features can sometimes be recognized as part of overall patterns, which we do not see from the eye-level view. As we are walking on a countryside road, all we can see is the immediate surrounding, the vegetation, texture, colour of the soil and humps on the road. In simple terms, we can view the eye
M B Rajani & Shalini Dixit
National Security Vol. IV Issue I | ISSN 2581-9658 (O) | 67
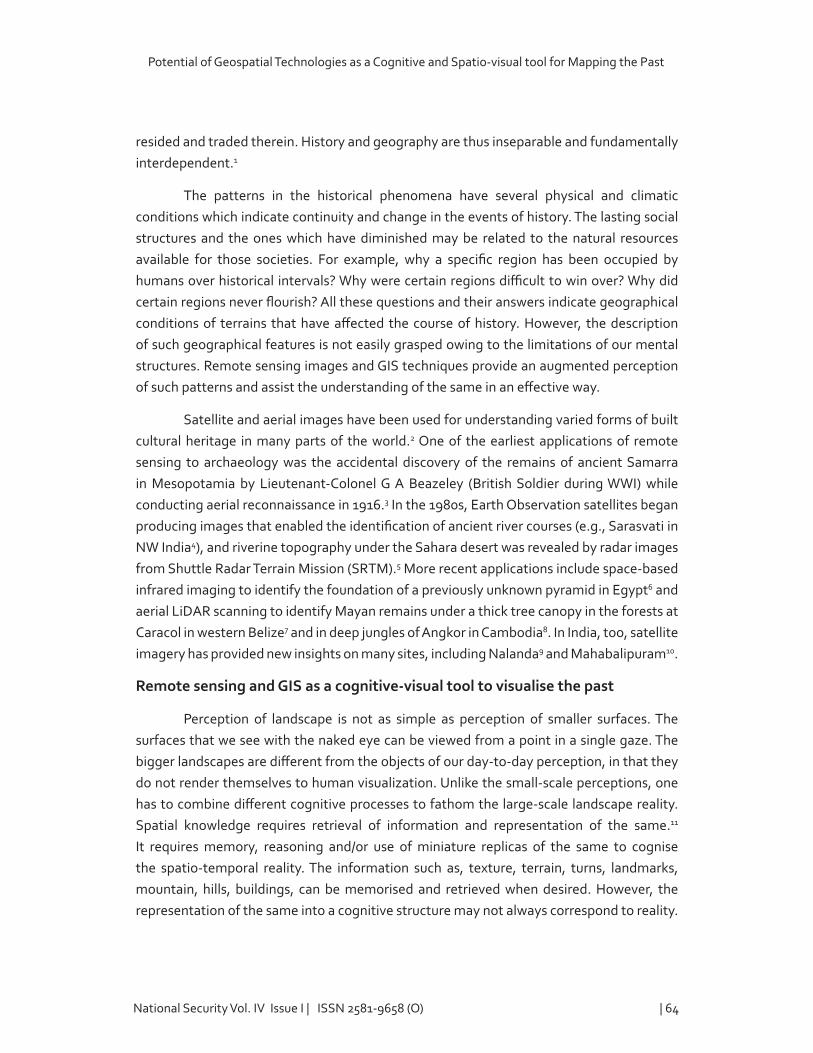
levelperspective.Theeye-levelperspectiveallowsustoorganiseourperceptioninaunifiedway, ignoring the details. Psychologically, it can be called a Gestalt view.16 It means that we impose completeness in an image or view, even if they are in parts. Thus, if there are differentformationsinthelandstructureorvegetation,wedonotnoticeitwiththenormalvision because of our tendency to see complete pictures. However, the same principle of Gestalt psychology allows humans to see the unifiedwhole in the scattered landscapewhen viewed from above. For example, the picture below shows the view of the historical site of Nalanda (Fig.1).
The picture shows the archaeological remains of the site of Nalanda monastery, situated to the southwest of the town of Bihar Sharif in the State of Bihar. What we can see are some structures. However, viewed with a satellite image we can see the overall landscapeatdifferentscalesasshownintheFigures2and3.
Figure 1: Photographs from ground of some of the structures at Nalanda

Potential of Geospatial Technologies as a Cognitive and Spatio-visual tool for Mapping the Past
National Security Vol. IV Issue I | ISSN 2581-9658 (O) | 68
Figure 2 shows views from Landsat satellite which produces images of spatial resolution 30m per pixel. Landsat Viewer is an online interface for viewing Landsat images in natural colour. A careful examination of these shows a series of water bodies surrounding Nalanda. South Bihar has several scattered water bodies, but the ones clustered around Nalanda form a pattern that was not seen elsewhere in the vicinity (see Fig.2). As we zoom in (Fig.3b), we observe something further: most of these water bodies are rectangular and their sides face the cardinal directions, which suggests that they are man-made tanks. They frame not only the area protected by the Archaeological Survey of India (ASI), but a larger expanse extending much farther to the north and a bit to the south. Therefore, these tanks mark the full extent of Nalanda, and this corroborates the textual evidence stating Nalanda to have been a Mahavihara, a large monastery. While most of the water bodies in the cluster are compactly framing the area around the site, there is one odd-looking tank stretching far out to the east (see the tank ‘Dighi’ in Fig 3b). This tank was laid out stretching so far to the east to connect to a palaeo-channel that once drew water from a nearby river. This channel is now dry, but its scars are still visible (Fig 3a).
Figure 2: An image showing a large swathe of south Bihar (image date Landsat 08 Feb 2009) together with the cluster of waterbodies around Nalanda

M B Rajani & Shalini Dixit
National Security Vol. IV Issue I | ISSN 2581-9658 (O) | 69
In this way, synoptic views at various scales from a variety of satellite imagery can renderdifferentkindsof informationfor,firstly,understandingthe long-standing legendthat Nalanda was the site of a large monastery, and secondly, developing the historical knowledge about the site further by enabling us to see the size, shape, and arrangement of the water bodies and the palaeo-channel in the context of the site. We are well aware of the painstaking ways maps were created in earlier days. Even if we keep recording while we walk through the space, we may not be sure if we end up representing the landscape with the samespatialaccuracy.Ittakesahugeamountoftimeandeffort,asourperceptiveabilitiesare not programmed to take such cognitive load. Nevertheless, geospatial technologies provide a view that enables such perceptions.
Synoptic view can also aid in visualising buried features. Most buried features are of two types: thosecreatedby scarring theearth’s surface (i.e., removalof surface/sub-surface soil for making ditches, pits, canals, moats, tanks, ponds, etc.), and those where foundations are laid to support larger structures above. In both cases, the buried features
Figure 3: (a) Regional view of environs of Nalanda showing the palaeo-channel; (b) The larger landscape around protected site showing the cluster of past and present water bodies; (c) The excavated site of Nalanda showing the large structures (6 Temples and 11 Monasteries)
together with boundary of area protected by ASI

Potential of Geospatial Technologies as a Cognitive and Spatio-visual tool for Mapping the Past
National Security Vol. IV Issue I | ISSN 2581-9658 (O) | 70
have typical shapes, they are linked/aligned to the rest of the settlement and themainwatersources.Oncethesestructuresfall intodisuse,theyareaffectedbydecay(naturaldecay and deterioration from exposure to the elements, and anthropogenic decay caused by the removal of building material for reuse or clearance). This decay can reduce structures to ruins, thereby transforming their surface appearance. Such scattered vestiges can sometimesonlybeidentifiedsynoptically.Asettlement’souterdefences(moatsandfortwalls) can often be identified in thismanner.When fortwalls collapse, theirmaterial isoften deposited into their surrounding moats. Source of water to moats may also dry up forvariousreasons,andtheremainsmaybedifficulttorecognizeatgroundlevel.However,insynopticviewsfromsatelliteimages,excesswater/moistureisusuallypresentinareaswhere the moat existed. This is either detectable directly, or indirectly when it is covered by comparatively healthy vegetation, in tell-tale patterns (circular, oval, rectangular, etc.). Figure4illustratestwoofthemanydifferentwaysinwhichapairoftypicalarchaeologicalfeatures (a fort with a surrounding moat) could manifest.
Fig.4 is a diagram, where (a) illustrates a typical fort and adjacent moat as they would have existed when in use. Note the cross-section indicating the subsurface – the moathasachannelfilledwithwater,andtheforthasatightlypackedfoundation;and(b)illustratesasubsequentconditionwherethedisusedmoatisfilledwithsiltandthefortis
Figure 4: Diagram showing two ways in which a pair of typical archaeological features (a fort with a surrounding moat) could decay.

M B Rajani & Shalini Dixit
National Security Vol. IV Issue I | ISSN 2581-9658 (O) | 71
dilapidated, parts of which have collapsed (due to natural decay, human destruction during conflicts,orduetoremovalofmaterialforreuse/clearance).
Beyondthisstage,thelandscapecanundergodifferentkindsoftransformationdependingonsubsequentactivitiesinthelandscape.Twopossibilitiesareexplainedhere.17
a. Soil Marks (Fig.4c1): Arid lands with little or no plant cover normally show bare soil withuniformcolour.However,sometimessoildoesshowdifferentcolourmarksinanotherwisehomogeneouslandparcel.Suchvariationsarecausedbydifferencesinthemineralandorganiccontentofthesoil.Inaddition,buriedditchfillingscansometimesshowdistinctmarksbecauseofdifferencesinmoisturecontent.
b. Cropmarks(Fig.4c2):Cropmarksaredifferenceintone/shadeinvegetationcoverfrom its immediate surroundings creating an observable pattern. Negative crop marks indicate that the vegetation is stressed, in contrast to surrounding growth that is healthier. At such places, there is a possibility of buried structures that preventrootsofsurfacevegetationfromreachingwaterandnutrientsadequately.These clearly manifest as lighter tones. Positive crop marks correspond to areas with richersoilsand/orenhancedmoisturecontent,whichallowsvegetationtoprosper.
Taking example of the colour and texture of vegetation, if we are viewing from the ground, we may see vegetation as a continuous stretch. If a large space is covered with vegetation,wemaynot see thedifference fromacloseproximity.Anaerialviewallowsswift recognition of such changes in the patterns.
Ability to detect such features across large swaths of land facilitates exploration of large area with less cost and labour and enables pinpointing at the most promising locations for visiting on ground for further study. Therefore, these technologies help in optimising time,effortandcostforsurveyoflargeareas.
(ii) “See” with light invisible to humans: People have a tendency to perceive the views of their surroundings in a predisposed way. As a result of inherent and learnt predispositions, peopleattendtocertainsensorystimulationsandfilterothersfromtheirperceptualfield.It is an example of top-down processing of information, which proposes that people’s past experiences and expectations guide the understanding of information presented to them.18 Inthecaseofperceivingvisualfields,itmaybevisibleinformsofcamouflagedpatterns.For example, if we see Figure 5b, the picture shows the settlement of Belur in Karnataka. The town and surrounding vegetation seem as a continuous formation as seen with normal colours or wavelengths visible to the human eye. However, as we see in the infrared image in Figure 5c, it highlights a circular formation of the vegetation which was not visible with

Potential of Geospatial Technologies as a Cognitive and Spatio-visual tool for Mapping the Past
National Security Vol. IV Issue I | ISSN 2581-9658 (O) | 72
the normal wavelength or at eye-level view as in Figure 5a. The circular pattern seen as a cropmark is more conspicuous in the false colour infrared image in Fig.5c than in the higher-resolution natural colour image from Google Earth Fig.5b19. The addition of the infrared image here has a crucial role in perceiving beyond human limitations. It allows us to break the normal perceptual set and trace the untraceable.
Remote sensing satellites carry a variety of sensors (including infrared and microwave) thathavehelpedrevealunique informationabouthistorical sitesorpartsofsites.20 For instance, the effect of buried archaeological remains are very subtle on thesurface, often not distinguishable even in satellite images of the natural colour and are nearly indistinguishableon theground. Images from infrared (havinghigher reflectancefrom vegetation) sensors, can display patterns in vegetation growth following the lines of the buried features, revealing their plan and layout.
Although more variation in the shades of vegetation can be seen in infrared imagery, patternsindicatingsubsurfacehistoricalremainsmaybevisibleonlyundercertainweather/moisture conditions. Therefore, vegetation cover should be analysed across seasons in order to isolate all potential archaeological features, which should then be analysed in the context of the layout of known archaeological remains. Satellites can also take stereoscopic images which are helpful in producing 3D models of archaeological landscapes.21
Figure 5: (a) A ground photo of a portion of what was the moat surrounding the settlement of Belur; (b) Google Earth image showing the Chennakeshava temple complex in the centre of the settlement of Belur; (c) the circular moat is more
visible in the multispectral image from IRS P6 LISS-4
M B Rajani & Shalini Dixit
National Security Vol. IV Issue I | ISSN 2581-9658 (O) | 73
(iii) 3-D models of the terrain : Toanalyseandappreciatehistoricalsituationseffectively,historians as well as the readers of history take the help of imagination. Historians imagine people and events in the past along with geographical settings that provide the backdrop for such graphical imagination, while readers imagine the minds of historians as well as the narration. As E H Carr writes, the “past is dead but it is still alive in the minds of historians. He must re-enact the thought that might have gone in the minds of people in the past, and the reader in turn must re-enact what goes in the mind of historian.”22 To get a feel of the past historians have to traverse the time between themselves and the past. Most of the time, historiansgetprimarysourcesunexplainedandrawpartialfacts.Theyrequirethehumaninterface, interpretations and explanations of the stories around them. For example, for centuries before the early 19th century the structural remains of Nalanda were just some ruins, in fact, large portions of the site was used as a free source of bricks for constructing houses and paving roads in neighbouring villages.23 The first English translations of theaccounts of the Chinese monk Xuanzang (596-664 AD), who had visited Nalanda24, provided impetus to the growing interest in the discovery of Indian historical places among British explorers.Aidedbythetranslation,AlexanderCunninghamidentifiedtheremainsastheruins of the famous Nalanda that Xuanzang had visited.25 Following this, later historians and archaeologists have explored the site further.
It requireshistorianstoweavetheshredsofevidencealongwiththeformulatednarratives about the place. Without this attempt to evoke the past and refurbish it for present consumption the structures are dead. They are waiting for a historian to visualise the conditions and possibilities of the happenings in the past to rebuild the narratives about it. At such times imagination is a part and parcel of the historical investigation, not only because the primary sources are to be explained but also for visualising all the happenings, their causes and the minds of the people involved. Historians and readers of history have to compileandorganizefacts.Veryfrequently,thehistoricalnarrativesincludedescriptionsofthelandscapeofthepastandthesubsequentchangesinthem,asitdidalsoinestablishingthe location of Nalanda using descriptions of its context among other known places like Rajgir in the south and Patna in the north. Narratives entail intertwining and describing the possible human conditions and navigation of spaces in past. In doing so, it is crucial toenvisageandunderstandthespace intermsofdistancesandterrains. Italsorequiresperceiving the depth in the given pictures (if available). All these perceptions of geographies and landscapes that had to previously depend on imagination can now be evocatively studied and presented using objective geospatial data and analysis.
The brain processes pictures to form the 3D image from a 2D image. Research has confirmedthatpresenting3Dimageseasesthespeedandaccuracyoftheobjectandspace
Potential of Geospatial Technologies as a Cognitive and Spatio-visual tool for Mapping the Past
National Security Vol. IV Issue I | ISSN 2581-9658 (O) | 74
perception.26 3D models allow a landscape to be perceived in much more detail than paper maps due to the three dimensionality of the data layers. When a landscape is visualized in aninteractivemodemovingthrougha3Dmodel,differentperspectivesofthelandscapeare presented.27 Virtual 3D models are especially helpful when complementing rather than replacingarchaeologicalfieldworkastheyhelpinplanningfieldworkandalsoallowcertaindetails of the study region to be reviewed during analysis back in the laboratory. They can become a starting point for a GIS-based analysis of spatial patterns and relations.28 At the same time, their visual attractiveness makes virtual 3D models a valuable means of presenting results of historical and archaeological research to a wider public.
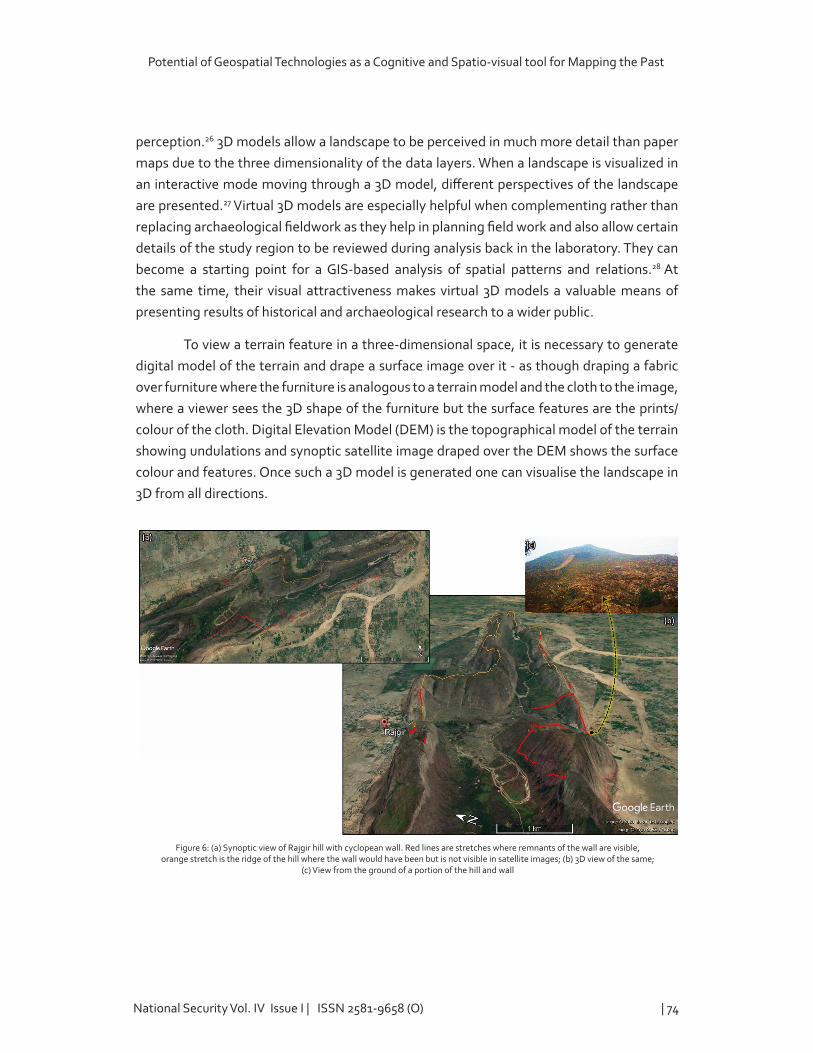
To view a terrain feature in a three-dimensional space, it is necessary to generate digital model of the terrain and drape a surface image over it - as though draping a fabric over furniture where the furniture is analogous to a terrain model and the cloth to the image, whereaviewerseesthe3Dshapeofthefurniturebutthesurfacefeaturesaretheprints/colour of the cloth. Digital Elevation Model (DEM) is the topographical model of the terrain showing undulations and synoptic satellite image draped over the DEM shows the surface colour and features. Once such a 3D model is generated one can visualise the landscape in 3D from all directions.
Figure 6: (a) Synoptic view of Rajgir hill with cyclopean wall. Red lines are stretches where remnants of the wall are visible, orange stretch is the ridge of the hill where the wall would have been but is not visible in satellite images; (b) 3D view of the same;
(c) View from the ground of a portion of the hill and wall

M B Rajani & Shalini Dixit
National Security Vol. IV Issue I | ISSN 2581-9658 (O) | 75
Figure 6a shows the Rajgir hill in synoptic view and Fig.6b shows a virtual 3D model of the same. The Rajgir hills, also known as “Rajghara” hills, is near the city of Rajgir in Bihar. These hills form two parallel ridges—southern one stretching around 60 km and northern one about 35 km—and other smaller hills forming folds in between them. The ridges provided naturalfortificationforthecentralareaandhencehasbeenastrategiclocationhistorically.Between these two ridges lie a number of places of historical importance, dating from the period of Gautam Buddha, Mahavira, the Mauryas and the Guptas.
There are many occasions in historical analysis where historians need to take the help of imagination. One such case is for drawing inferences, for understanding the mental frame of the people in the past and for understanding the values and ethos of the then societies. It could be as simple as getting the feel of the space that a person or group of people used in the past. Why did they choose a location? How did they choose it? What purpose did it serve? How long did the place serve that purpose? It is not easy for us to recollectourownthoughtsandexperiencesandconsequentdecisionswemadeacoupleofdecades ago. At the most, what one can do is to recollect certain behaviour and prominent feelings of the time. Nevertheless, the 3D visualizations facilitated by geospatial technology enable a virtual entry to historical landscapes from various heights and angles. We can see that Figure 6.b is more impactful than Figure 6a in giving a feel to the viewer almost like physically being above the Rajgir hills and looking down at the Cyclopean Wall and estimatingtheeffortitcouldtaketonavigatethroughit.Whilephysicallymovingaroundamong the hills on ground, one can easily lose the sense of direction and feel lost. But byvirtuallynavigatingthehillsfromaboveandfromdifferentdirectionsweseewhythislocation was chosen, what advantages the hills provided and how a wall could augment the existing natural setting to protect the interiors. The Cyclopean Wall of Rajgir is among the world’s oldest specimens of cyclopean masonry. It was a stone wall that encircled the entire ancient city of Rajgriha. It is believed to be around 40 km long. Figure 6a shows portions ofthewallthatcanbeidentifiedusingsatelliteimagery;Fig.6bisa3Dviewshowinghowthe wall traces the summit of the ridge. By allowing such historical imagination through 3D visualization, geospatial analyses bring immense value to historical pursuits.
(iv) Incorporating multiple layers of spatial information: GIS is a software system that provides a framework for gathering, integrating, managing, and analysing spatial data. It is often useful to look at multiple satellite images for a given site. These could be images taken by the same sensor on different dates, or fromdifferent sensors.This is becausesome parts of the target area may be visible in natural colour images, while other parts may be traceable through images of infrared or other wavelengths. There could be further variations in visibility of features in images taken at different times of the year due to

Potential of Geospatial Technologies as a Cognitive and Spatio-visual tool for Mapping the Past
National Security Vol. IV Issue I | ISSN 2581-9658 (O) | 76
seasonaldifferencesinlandcover(forexample,postrainfalltherecouldbelushvegetationgrowth; in contrast, in summer it could be relatively barren). It is also possible that some features representing a historical layout were visible decades ago and the subsequentland use changes have made them obscure in images taken recently. Hence considering images taken a few decades ago is also important. To represent the entire historical landscape, all the sources are combined to make the complete picture. An example of such a representation is given in Figure 7. GIS organizes information into layers based on geospatial location, allowing the analyst to integrate data from multiple images, as well as spatialdatafromothersourcessuchasgroundtruthing,fieldobservations,oldmapsandother historical spatial records. In order to integrate spatial data, it is necessary to ensure that all this data is georeferenced so that features in one layer are as accurately aligned as possible to their footprint in other layers. GIS allows such an integration of images to be placed on its respective latitude and longitude. It allows an analyst to pin his selected narratives – textual as in the case of reports or accounts, or graphical as in the case of maps or images – of the landscape to its appropriate location (georeference) and visualise the resultingpicture,therebyrepresentinghis/heranalysisinaconcreteandholisticform.
Figure7showssynopticviewsofthelandscapeofthefortifiedsettlementofHalebiduinKarnataka, which was the 12th century Capital of Hoysala dynasty. It shows the locations of the fort wall and moat that bound the settlement. The whole perimeter of the fort wall
Figure 7: Map of fort wall and moat surrounding the Hoysala capital Halebidu made from multiple layers; (a) Corona satellite image of 1978; (b) Multispectral (with infrared band) satellite image from World View 2 of 2013; (c) A map made by Colin Mackenzie in 1806; (d) Natural
colour Google Earth image of 2016; 1 and 2 are ground photos of location marked on the map with respective numbers

M B Rajani & Shalini Dixit
National Security Vol. IV Issue I | ISSN 2581-9658 (O) | 77
andmoatwasnotidentifiableinanyoneimage.AsFigure7illustrates,fourdifferentlayersof spatial data were used to identify various portions of the fort wall and the moat, which could be overlaid using GIS to map the overall extent of these features and the ruins that could be seen on ground could be accordingly contextualised. The land cover within the fort is predominantly agricultural – except for the settlement on the northeastern corner. When the northern portion is visualised with recent images (for example Google Earth image of 2016)itshowsasequenceofseveral landparcelsthatrevealthecurvilinearshapeofthemoat, even though almost no structural material of the fort survives there at present29 but when we use Corona image of 1978 we do see ruins and traces of the fort on the north too (Fig. 7a).
Summary
Identifying and knowing the impressions of past settlements in the present landscape can immensely enhance our understanding of historical sites and their landscapes. The past has a strong connection with space and location. For people who study the history of regions and locations, geospatial tools provide them an evocative access to those spaces. Surpassing the human capacities and range, remote sensing and GIS technologies enable visualisation and navigation of present and past historical sites. By allowing virtual access to the past, with several visualisations and navigation tools, these technologies create a unique cognitive experience in learning about the past.The close approximation of thepast through such technological tools also enables sharing it objectively with others. They enable cognition, comprehension and knowledge generation about the same. In the above sections we have illustrated that geospatial technologies can enhance our perception of the pastvisuallyinatleastfourdifferentways.Therecouldbemanymoreapplicationsofeachof these kinds of visual perceptions than what we have listed in this paper. These enhanced means of seeing the past not only assist a historian to impart the history of a landscape he has been able to imagine, but also to see realities of landscapes that are blocked or not perceivablebylimitationsandbiasesofhis/herimagination.
References
1. Meinig, D. W. The Shaping of America: A Geographical Perspective on 500 Years of History,
Volume1:AtlanticAmerica1492-1800.YaleUniversityPress,1986.http://www.jstor.org/
stable/j.ctt32bqpx.
2. Wiseman, James, and Farouk El-Baz. Remote Sensing in Archaeology. New York: Springer,
2007.; Parcak, Sarah H. Satellite Remote Sensing for Archaeology. 1st ed. London:
Routledge, 2009.; Lasaponara, Rosa, and Nicola Masini. Satellite Remote Sensing: A
New Tool for Archaeology. Dordrecht: Springer, 2012.; Johnson, Jay K., Marco Giardano,
Potential of Geospatial Technologies as a Cognitive and Spatio-visual tool for Mapping the Past
National Security Vol. IV Issue I | ISSN 2581-9658 (O) | 78
Kenneth L. Kvamme, R. Berle. Clay, Thomas J. Green, Rinita A. Dalan, Michael L. Hargrave,
Bryan S. Haley, Jami J. Lockhart, Lewis Somers, and Lawrence B. Conyers. Remote Sensing
in Archaeology: An Explicitly North American Perspective. Tuscaloosa: University of
Alabama Press, 2009.
3. Deuel, Leo. Flights into Yesterday: The Story of Aerial Archaeology. Middlesex: Pelican,
1969.
4. Ghose, Bimal, Amal Kar, and Zahid Husain. “The Lost Courses of the Saraswati River in the
Great Indian Desert: New Evidence from Landsat Imagery.” The Geographical Journal 145,
no.3(1979):446.doi:10.2307/633213.
5. McCauley, J. F., G. G. Schaber, C. S. Breed, M. J. Grolier, C. V. Haynes, B. Issawi, C. Elachi,
and R. Blom. “Subsurface Valleys and Geoarcheology of the Eastern Sahara Revealed by
ShuttleRadar.”Science218,no.4576(1982):1004-020.AccessedJanuary7,2021.http://
www.jstor.org/stable/1688710.
6. Pringle, Heather. “Satellite Imagery Uncovers Up to 17 Lost Egyptian Pyramids.” Science.
May27,2011.http://www.sciencemag.org/news/2011/05/satellite-imagery-uncovers-17-
lost-egyptian-pyramids.
7. Chase, Arlen F., Diane Z. Chase, and John F. Weishampel. “Lasers in the
Jungle.”Archaeology,July/August2010.https://archive.archaeology.org/1007/etc/caracol.
html.
8. Lawrie, Ben. “Beyond Angkor: How Lasers Revealed a Lost City.” BBC News. September 23,
2014.http://www.bbc.com/news/magazine-29245289.
9. Rajani, M. B. “The Expanse of Archaeological Remains at Nalanda: A Study Using Remote
SensingandGIS.”ArchivesofAsianArt66,no.1(2016):1-23.doi:10.1353/aaa.2016.0010.
10. Rajani, M. B., and K. Kasturirangan. “Sea-Level Changes and Its Impact on Coastal
Archaeological Monuments: Seven Pagodas of Mahabalipuram, a Case Study.” Journal of
theIndianSocietyofRemoteSensing41,no.2(2012):461-68.doi:10.1007/s12524-012-
0210-y.
11. Berthoz, A., I. Israel, P. Georges-Francois, R. Grasso, and T. Tsuzuku. “Spatial Memory of
Body Linear Displacement: What Is Being Stored?” Science 269, no. 5220 (1995): 95-98.
doi:10.1126/science.7604286.
12. Loftus, Elizabeth F., and John C. Palmer. “Reconstruction of Automobile Destruction: An
Example of the Interaction between Language and Memory.” Journal of Verbal Learning
andVerbalBehavior13,no.5(1974):585-89.doi:10.1016/s0022-5371(74)80011-3.

M B Rajani & Shalini Dixit
National Security Vol. IV Issue I | ISSN 2581-9658 (O) | 79
13. Head, C. Grant. “Mapping as Language or Semiotic System: Review and
Comment.” Cognitive and Linguistic Aspects of Geographic Space, 1991, 237-62.
doi:10.1007/978-94-011-2606-9_14.
14. Taylor, Holly A., and Barbara Tversky. “Spatial Mental Models Derived from Survey
and Route Descriptions.” Journal of Memory and Language 31, no. 2 (1992): 261-92.
doi:10.1016/0749-596x(92)90014-o.
15. Paivio, Allan Mental Representations: A Dual Coding Approach. New York (N.Y.): Oxford
University Press, 1986.
16. Koffka,K.PrinciplesOfGestaltPsychology.Vol.44.Routledge,2013.;Wertheimer,Max.
“Laws of Organization in Perceptual Forms.” A Source Book of Gestalt Psychology.: 71-88.
doi:10.1037/11496-005.
17. Rajani, M. B. “Introduction.” In Patterns in Past Settlements: Geospatial Analysis of
ImprintsofCulturalHeritageonLandscapesSpringerRemoteSensing/Photogrammetry,
2021,1-8.doi:10.1007/978-981-15-7466-5_2.
18. Vernon, M. D. “The Functions of Schemata in Perceiving.” Psychological Review 62, no. 3
(1955):180-92.doi:10.1037/h0042425.
19. Rajani, M. B., and K. Kasturirangan. “Multispectral Remote Sensing Data Analysis and
Application for Detecting Moats Around Medieval Settlements in South India.” Journal
oftheIndianSocietyofRemoteSensing42,no.3(2014):651-57.doi:10.1007/s12524-013-
0346-4.
20. Rajani, M. B. “Bangalore from above: An archaeological overview.” Current Science 93
(2007): 1352-1353, pp.168-175; Rajani, M.B. and S. Settar (2009) “Application of
multispectral remote sensing imagery in detection of ancient forts in South India.” In
StefanoCampana,MaurizioForteandClaudiaLiuzza(Eds.),BAR�S2118,2010Space,
Time, Place Third International Conference on Remote Sensing in Archaeology, 17th-21st
August, Tiruchirappalli, Tamil Nadu, India, ISBN 978 1 4073 0659 9, pp.123-127; Rajani,
M.B., and A.S. Rajawat. “Potential of Satellite Based Sensors for Studying Distribution
of Archaeological Sites along Palaeo Channels: Harappan Sites a Case Study.” Journal of
ArchaeologicalScience38,no.9(2011):2010-016.doi:10.1016/j.jas.2010.08.008.;Rajani,
Mandyam B., Satadru Bhattacharya, and A. S. Rajawat. “Synergistic Application of Optical
and Radar Data for Archaeological Exploration in the Talakadu Region, Karnataka.” Journal
oftheIndianSocietyofRemoteSensing39,no.4(2011):519-27.doi:10.1007/s12524-011-
0102-6.
Potential of Geospatial Technologies as a Cognitive and Spatio-visual tool for Mapping the Past
National Security Vol. IV Issue I | ISSN 2581-9658 (O) | 80
21. Rajani, M. B. “The Expanse of Archaeological Remains at Nalanda: A Study Using
RemoteSensingandGIS.”ArchivesofAsianArt66,no.1(2016):1-23.doi:10.1353/
aaa.2016.0010.; Rajani, Mandyam B., Sumanta K. Patra, and Mamta Verma. “Space
Observation for Generating 3D Perspective Views and Its Implication to the Study of
the Archaeological Site of Badami in India.” Journal of Cultural Heritage 10 (2009).
doi:10.1016/j.culher.2009.08.003.;Rajani,M.B.,andK.Kasturirangan.“Sea-LevelChanges
and Its Impact on Coastal Archaeological Monuments: Seven Pagodas of Mahabalipuram,
a Case Study.” Journal of the Indian Society of Remote Sensing 41, no. 2 (2012): 461-
68.doi:10.1007/s12524-012-0210-y.;Nalini,N.S.andRajani,M.B.“Stonefortressof
Chitledroog: visualizing old landscape of Chitradurga by integrating spatial information
from multiple sources.” Current Science 103, No. 4, 25 August 2012, pp.381-387.
22. Carr, Edward Hallett, and Richard J. Evans. What Is History? New York: Vintage, 1961. p. 23
23. Jackson, V.H. (ed.) “Journal of Francis Buchanan (Patna and Gaya Districts).” The Journal of
the Bihar and Orissa Research Society 8, pt. 3–4 (1922): 2271
24. Xuanzang, and Samuel Beal. Si-yu-ki: Buddhist Records of the Western World. Vols. 1&2.
London,1884.http://archive.org/details/siyukibuddhistr00bealgoog,;Hui-Li,andSamuel
Beal.TheLifeofHiuen-Tsiang:BytheShamanHwuiLi.London,1914.http://archive.org/
details/lifeofhiuentsian030569mbp,
25. Cunningham, Alexander. Archaeological Survey of India: Four Reports Made during the
Years 1862-63-64-65. Simla, 1871.
26. Pizlo, Zygmunt. “Human Perception of 3D Shapes.” Computer Analysis of Images and
PatternsLectureNotesinComputerScience:1-12.doi:10.1007/978-3-540-74272-2_1.
27. Campana, Stefano and Maurizio Forte, eds. 2006. From space to place: Proceedings of
the 2nd International Conference on Remote Sensing in Archaeology, CNR, Rome, Italy,
December 4-7, 2006. Oxford: Archaeopress, 2006
28. Lock, Gary R. Beyond the Map Archaeology and Spatial Technologies. Oxford, Eng.: IOS
Press,2000.;David.“SpatialTechnologyandArchaeology.”2013.doi:10.1201/b12806.
29. Das, S., Rajani, M.B. “A Geospatial Study of Archaeological Remains at Halebidu: An
Integrative Approach to Identify Unexplored Features.” Journal of the Indian Society of
RemoteSensing(2020).https://doi.org/10.1007/s12524-020-01272-8