national seminar role of der in the eu and current status in the baltic states 6 march 2007 current...
TRANSCRIPT

National Seminar Role of DER in the EU and Current Status in the Baltic States
6 March 2007
Current Status of Energy Policy on Development of Distributed Generation in
Estonia
Estonia Dr. Ülo RudiTallinn University of Technology

6 March 2007 Role of DER in EU and in the Baltic States Ylo Rudi 2
CONTENTSCONTENTS•The Main Economic Indices•The present situation of the Estonian energy sector•The development conditions for the distributed generation.•Supporting measures for the distributed generation•The main targets for the lager use of distributed generation.•Conclusions.

6 March 2007 Role of DER in EU and in the Baltic States Ylo Rudi 3
The Main Economic IndicesThe Main Economic Indices
INDEX 2000 2002 2003 2004 2005GDP at current prices, billion EUR 6.10 7.76 8.49 9.37 11.06GDP at 2000 constant prices, billion EUR 6.10 7.10 7.60 8.21 9.07GDP at 2000 constant prices per capita, thousand EUR 4.45 5.22 5.61 6.09 6.74
GDP change at constant prices, % 7.9 8.0 7.1 8.1 10.5Change of consumer price index, % 4.0 3.6 1.3 3.0 4.1Foreign trade balance / exports, % -29.3 -39.4 -42.8 -40.6 -31.9Current account / GDP, % -5.6 -11.0 -12.1 -13.0 -11.0Growth of average monthly gross wages and salaries , % 10.5 11.5 9.4 8.4 10.8
Unemployment rate, % 13.6 10.3 10.0 9.7 7.9Total primary energy supply (TPES), TWh 53.0 53.9 58.6 60.3 58.9
TPES ratio to GDP, kWh/EEK’2000 0.57 0.51 0.52 0.49 0.42Source: Statistical Office of Estonia, Bank of Estonia

6 March 2007 Role of DER in EU and in the Baltic States Ylo Rudi 4
TPES ratio to GDPTPES ratio to GDP
0
1000
2000
3000
4000
5000
6000
7000
8000
9000
Years
0
2
4
6
8
10
12
14
kWh/
EUR
TPES,PJ
0
50
100
150
200
250
300
350
400
450
GDP,milj.EUR
TPES / GDP, kWh / EUR2000
GDP EUR2000
TPES, PJ
1993 1994 1995 1996 1997 1998 1999 2000 2001 2002 2003 2004 2005

6 March 2007 Role of DER in EU and in the Baltic States Ylo Rudi 5
BALTIC GENERATION MIX 2005BALTIC GENERATION MIX 2005
Nuclear34%
Oil Shale33%
Natural Gas19%
Hydro14%
Lithuania 70% Estonia 91%
Latvia 66%
Latvia 33% Lithuania 23%
Estonia 5%
Source: Statistical Office of Estonia, Latvia,Lithuania
6 March 2007 Role of DER in EU and in the Baltic States Ylo Rudi 6
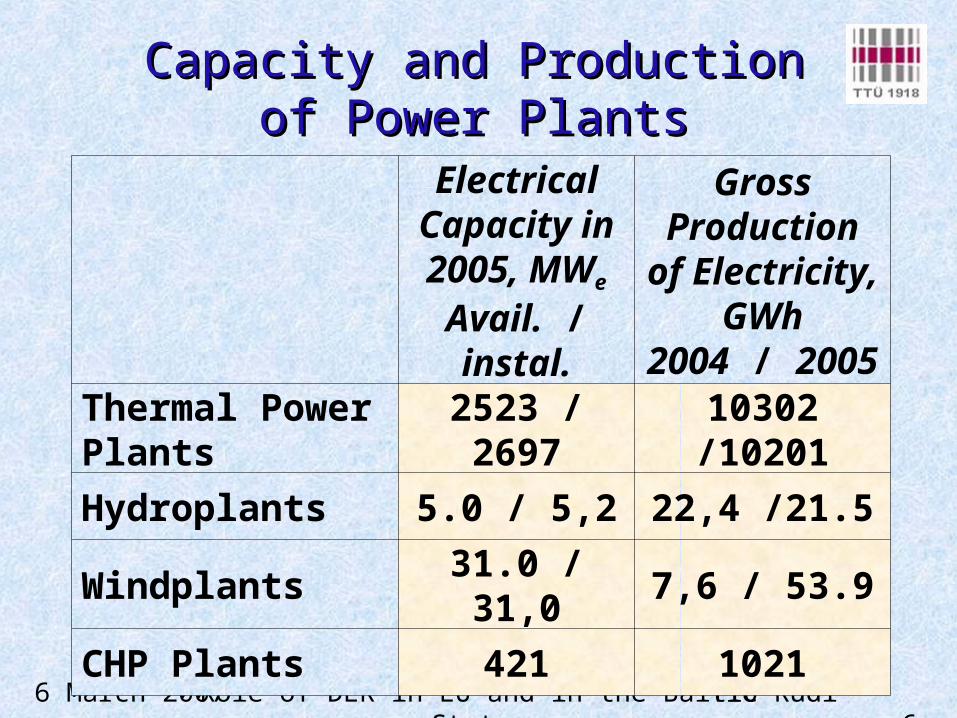
Capacity and ProductionCapacity and Productionof Power Plantsof Power Plants
Electrical Capacity in 2005, MWe
Avail. / instal.
Gross Production
of Electricity,GWh
2004 / 2005Thermal Power Plants
2523 / 2697 10302 /10201
Hydroplants 5.0 / 5,2 22,4 /21.5
Windplants 31.0 / 31,0 7,6 / 53.9
CHP Plants 421 1021

6 March 2007 Role of DER in EU and in the Baltic States Ylo Rudi 7
Used Resources for the Electricity Used Resources for the Electricity ProductionProduction 20052005
Oil shale 91.06%
Peat 0.14% Biofuel
0.32%
Wind 0.53%
Hydro0.21%
Natural gas 5.34%
Shale oil gas and shale oil
2.40% Total Gross Electricity Production 10201 GWh
Source: Statistical Office of Estonia
6 March 2007 Role of DER in EU and in the Baltic States Ylo Rudi 8
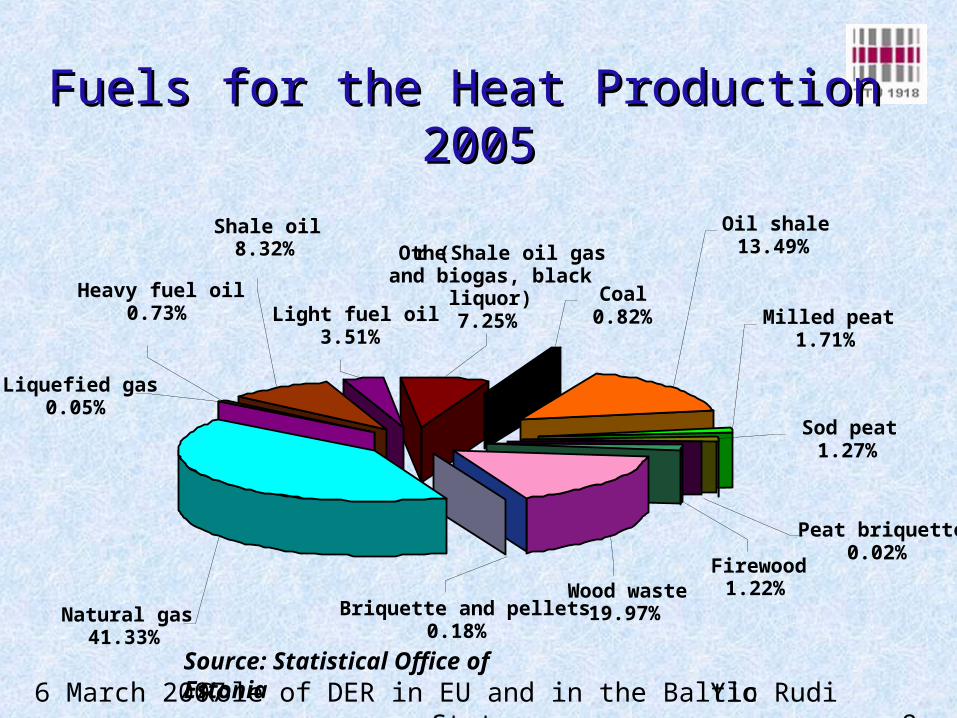
FuelFuelss for the for the Heat Production Heat Production 2005 2005
Natural gas 41.33%
Wood waste 19.97% Briquette and pellets
0.18%
Sod peat 1.27%
Firewood 1.22%
Milled peat 1.71%
Peat briquette 0.02%
Oil shale 13.49%
Coal 0.82%
Other (Shale oil gas and biogas, black
liquor) 7.25%
Shale oil 8.32%
Liquefied gas 0.05%
Light fuel oil 3.51%
Heavy fuel oil 0.73%
Source: Statistical Office of Estonia

6 March 2007 Role of DER in EU and in the Baltic States Ylo Rudi 9
The biggest problems of the oil The biggest problems of the oil shale energy areshale energy are
• The oil shale energy sector is the biggest polluter in Estonia
• The big pollution charge• EU Directive 2001/81/EEC • Too low efficiency• The concentrated electricity production
6 March 2007 Role of DER in EU and in the Baltic States Ylo Rudi 10
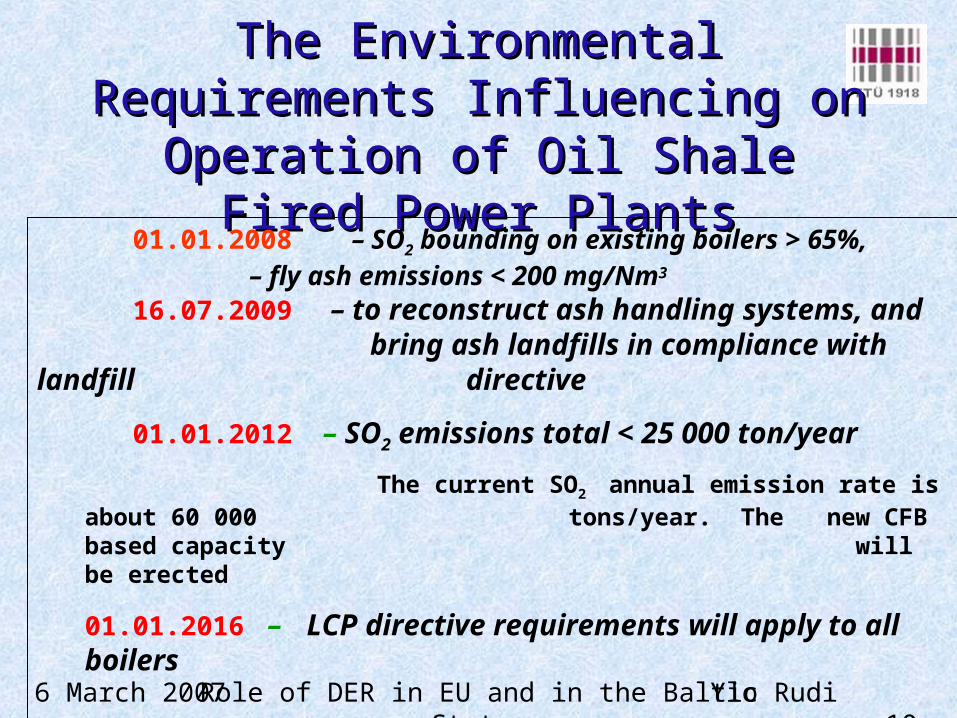
The Environmental The Environmental Requirements Influencing on Requirements Influencing on Operation of Oil Shale Fired Operation of Oil Shale Fired
Power PlantsPower Plants 01.01.2008 – SO2 bounding on existing boilers > 65%,
– fly ash emissions < 200 mg/Nm3
16.07.2009 – to reconstruct ash handling systems, and bring ash landfills in compliance with landfill directive
01.01.2012 – SO2 emissions total < 25 000 ton/year
The current SO2 annual emission rate is about 60 000 tons/year. The new CFB based capacity will be erected
01.01.2016 – LCP directive requirements will apply to all boilers

6 March 2007 Role of DER in EU and in the Baltic States Ylo Rudi 11
• Self-sufficiency– Ability to cover domestic electricity needs
any time by producers located in Estonia.• Increase in the use of renewables
– Indicative target 5,1% of power by 2010 (2001-0,1%; 2005-1,1%).
– Main emphasise on the biofuels based CHP generation and windpower.
StrategicStrategic Energy Policy Energy Policy Objectives (1)Objectives (1)

6 March 2007 Role of DER in EU and in the Baltic States Ylo Rudi 12
• Increase in the use of CHP-s– Indicative objective 20% of power from
CHP-s by 2020 (today 10%).• Efficiency Improvements:
– Primary Energy Consumption shall not exceed until 2010 the level of 2003.
StrategicStrategic Energy Policy Energy Policy Objectives (2)Objectives (2)

6 March 2007 Role of DER in EU and in the Baltic States Ylo Rudi 13
Estonian Energy prospectiveEstonian Energy prospectiveEnergy Development PlanEnergy Development Plan
2015 (2030)2015 (2030) 2000 2010
Primary energy supply, PJ 189 220 – 250Oil Shale consumption, 106 t 13.2 11 – 13Share of renewables in energy supply, % 10.5 13 – 15Share of RES in production of electricity, % 0.1 5.1Final consumption of electricity, TWh 5.4 6.5 – 8.0Required net capacity of power plants, MW 1980 2400 – 2650Share of CHP in generation of electricity, % 12 – 14 20Opening of electricity market, % 10 35 – 40Heat consumption, TWh 8.5 8 – 9Share of CHP in heat production, % 33 35 – 40Emission, share of limit for 2008, %
SO2 181 90 – 100CO2 48 50 – 55

6 March 2007 Role of DER in EU and in the Baltic States Ylo Rudi 14
Share of electricity from RES to gross electricity consumption
0
10
20
30
40
50
60
Estonia Lithuania Latvia EU27
%
RES Share 2005
Rest of target 2010
4,03,1
0,9
6,8
48,4
14,23,91,1
Source: Eurostat

6 March 2007 Role of DER in EU and in the Baltic States Ylo Rudi 15
Instruments for supporting Instruments for supporting
renewable energy sourcesrenewable energy sources •Renewable energy sources – hydropower, solar energy, wave energy, tidal energy, geothermal energy, landfill gas, wastewater treatment gas, biogas and biomass •A network operator is obliged to buy electricity produced from renewables within the network, which he owns or possesses•A network operator pays the price for renewables based electricity 5.17 euro cents per kWh. (Planed 7.34 euro cents per kWh since 01July 2007)

6 March 2007 Role of DER in EU and in the Baltic States Ylo Rudi 16
Production of hydro- and wind Production of hydro- and wind energyenergy
Hydro
Wind
02000 2001 2002 2003 2004
GWh
2005
5101520253035404550
6 March 2007 Role of DER in EU and in the Baltic States Ylo Rudi 17
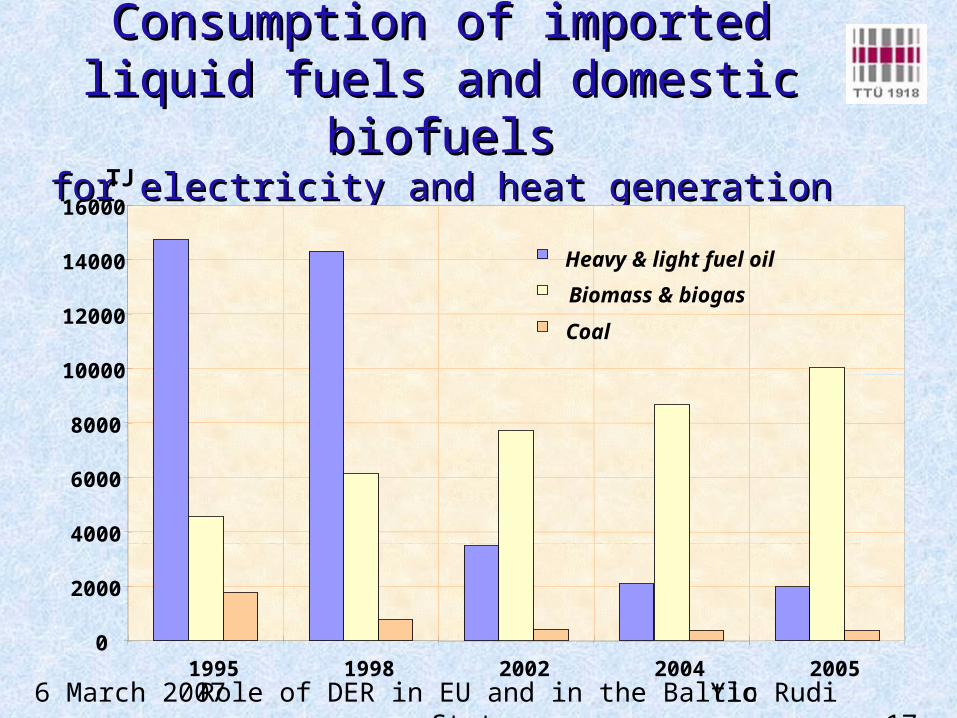
Consumption of Consumption of imported imported liquid liquid fuels fuels and and domestic domestic biofuelsbiofuelsfor electricity and heat generationfor electricity and heat generation
0
2000
4000
6000
8000
10000
12000
14000
16000TJ
Heavy & light fuel oil
Biomass & biogas
Coal
1995 1998 2002 2004 2005

6 March 2007 Role of DER in EU and in the Baltic States Ylo Rudi 18
CONCLUSIONS CONCLUSIONS
• In Estonia wind and biomass resources are significant. If the "right" policies were in place, wind and CHP with biomass could make an important contribution to Estonia's energy supplies.
• The development of distributed generation needs the renovation of the transmission and distribution grids.
• The change of electricity generation technology needs a good level research.
6 March 2007 Role of DER in EU and in the Baltic States Ylo Rudi 19
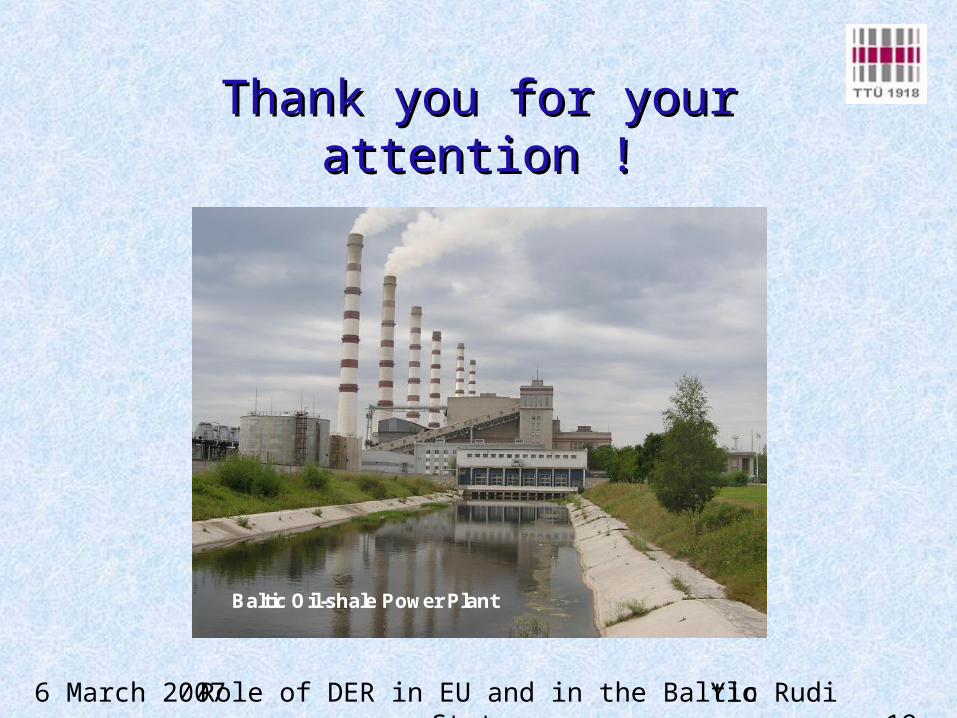
Thank you for your attention !Thank you for your attention !
CENERG 3rd TEMATIC WORKSHOP, Katowice, Poland Ülo RUDI 3715. November 2004Baltic Oil-shale Power Plant