national service scheme national green corps climate education and water conservation
TRANSCRIPT

Agenda
• Climate Change• Climate Projects on Water Conservation• Preparation of Action Plan• Presentation of Action Plan

Climate Change• Scorching summers• Heat waves• Flooding rivers• Drought & lack of
rainfall• Hurricanes• Cold winters
Climate Projects on Water Conservation
• Hard changes / Easy changes
• Water Conservation in consumption
• Water budget for educational institutions
• Diverting stagnant water to plants and drains

Water Conservation• Understanding Water• A.1. Flow of Water• A.2. Usage of Water• A.3. Quality of Water• A.4. Rainwater Harvesting Potential • B.1. Build a Rain Gauge• B.2. Compare Water Demand• B.3. Design Rainwater Harvesting System

Water Around Us
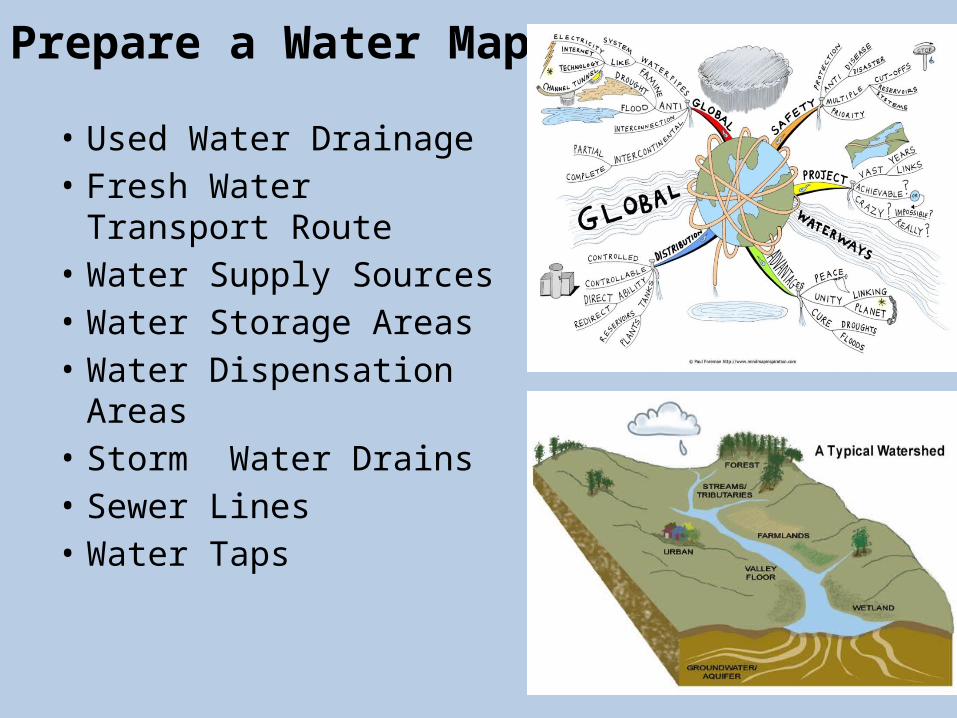
Prepare a Water Map
• Used Water Drainage • Fresh Water Transport
Route• Water Supply Sources • Water Storage Areas• Water Dispensation Areas• Storm Water Drains• Sewer Lines• Water Taps


Water Supplies
• Water Tank Filling: Supply Schedule• Water Tank Cleaning: Cleaning
Schedule• Water Tank Refilling: Schedule• Water Tank & Tap Leakage Mending• Who is in charge of log book• Which Route• Monitoring


What is Water Conservation?Water conservation is a practice in which
people, companies, and governments attempt to reduce their water usage.

Water Consumption
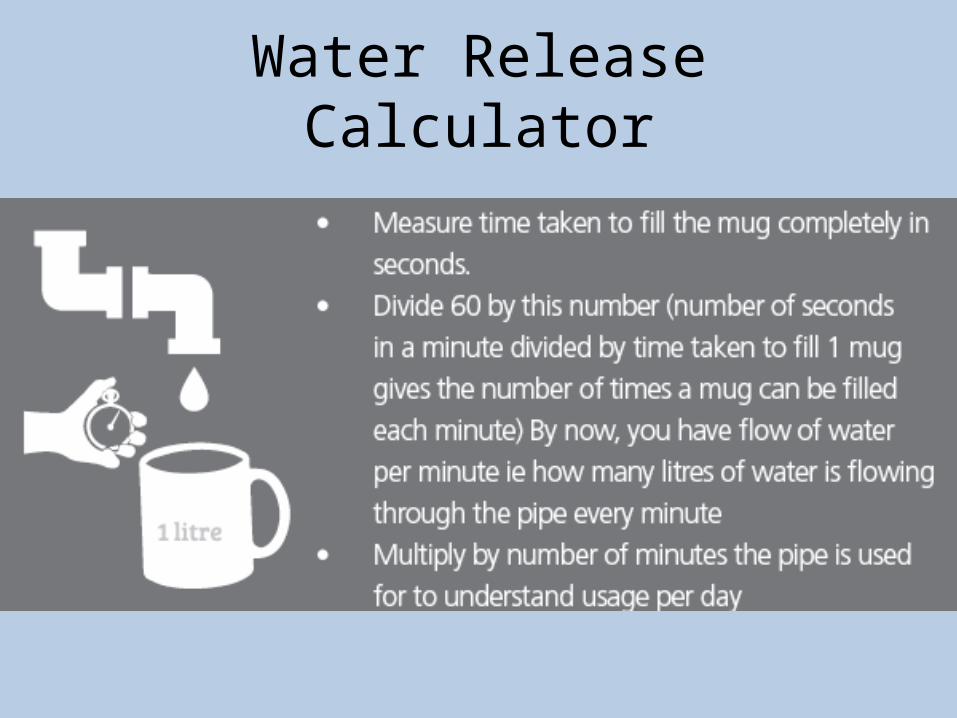
Water Release Calculator


Water Quality

Rain Water Harvesting
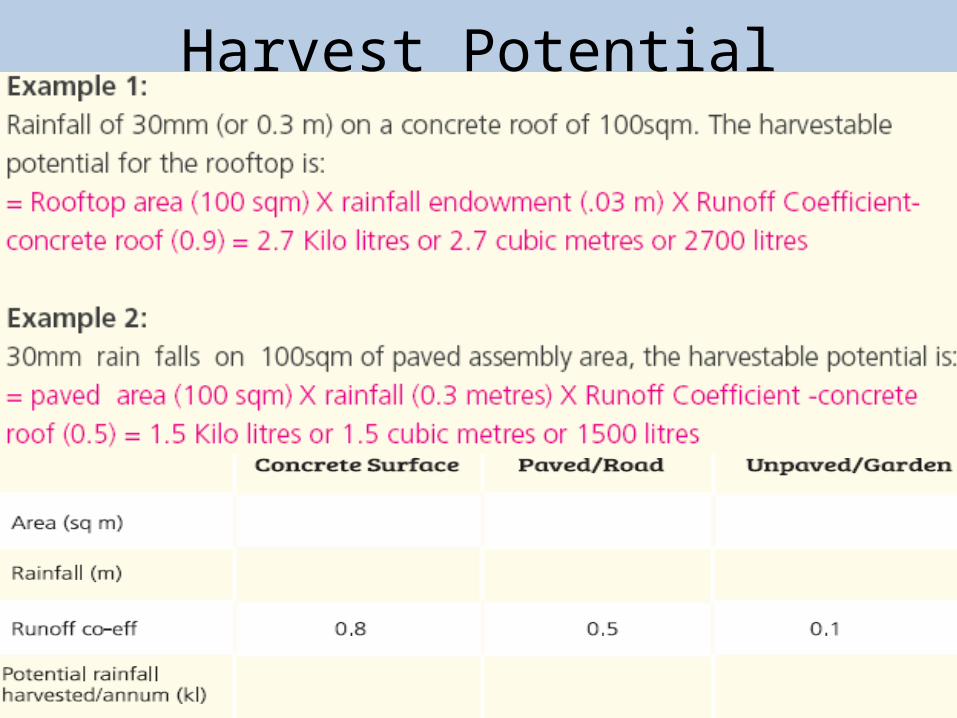
Harvest Potential

Make and Measure with Rain Gauge
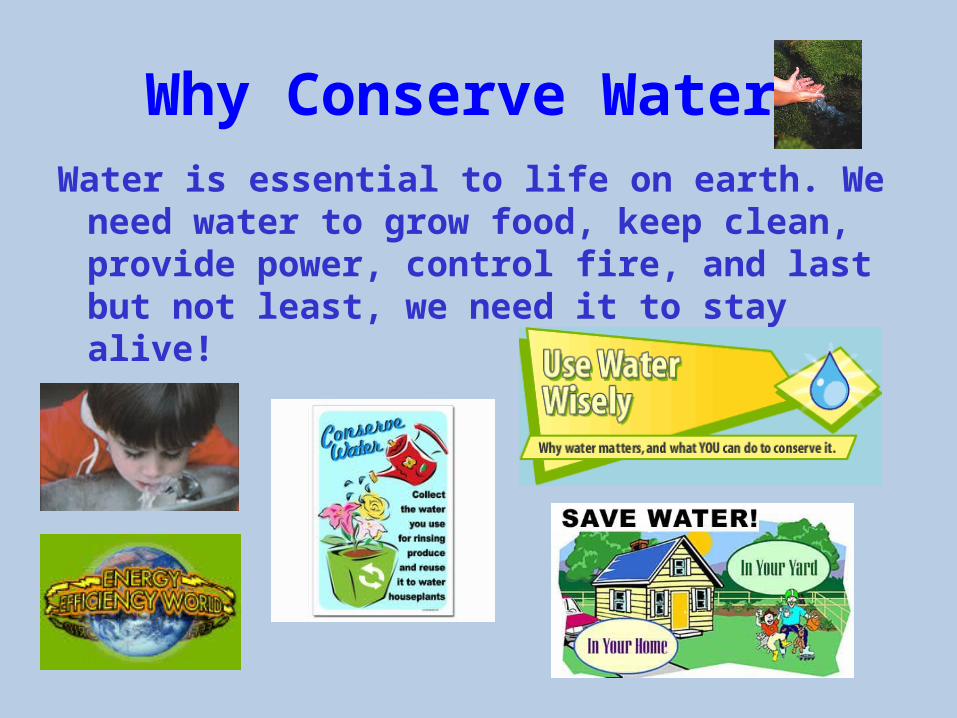
Why Conserve Water?Water is essential to life on earth. We need
water to grow food, keep clean, provide power, control fire, and last but not least, we need it to stay alive!

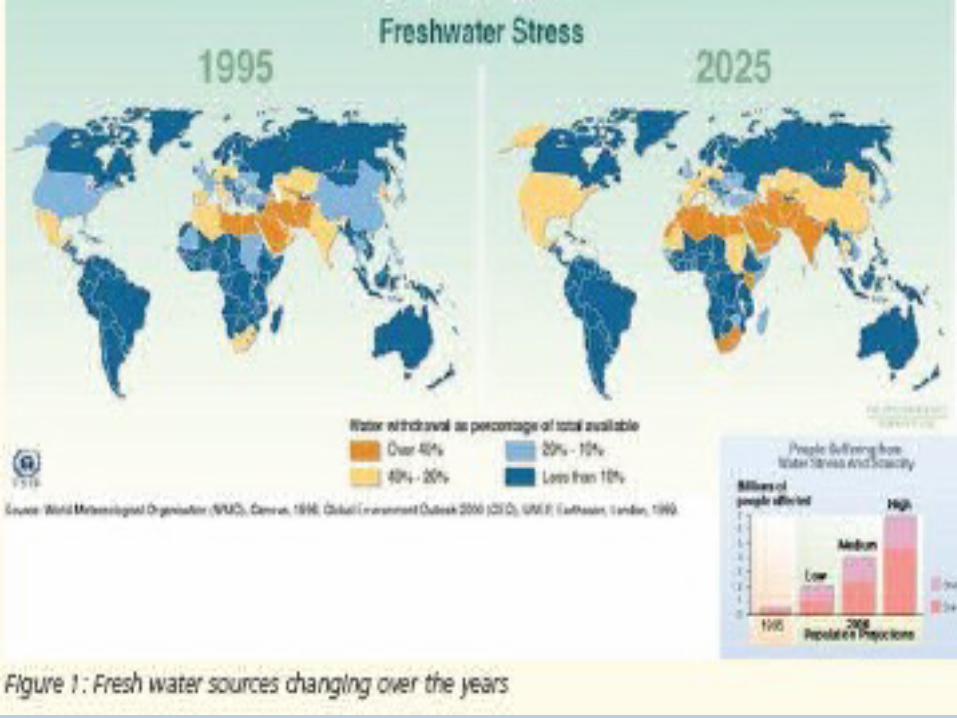
If water is constantly being cleaned and recycled through the earth’s water cycle, why do we need to conserve it?
The answer is that people use up our planet’s fresh water faster than it can naturally be replenished.

Climate Projects on Water Conservation
• Water Foot Print• Hard Changes / Easy
Changes• Water Conservation &
Consumption• Water Budget• Diverting Stagnant Water
to Plants and Drains


Water Footprint
Amount of fresh water utilized in production or supply of the goods and services used by a particular person or group

[Hoekstra & Chapagain, 2008]
Food► 1300 kg of grains
(wheat, oats, barley, corn, dry peas, soybean, etc)► 7200 kg of roughages
(pasture, dry hay, silage, etc)
Water► 24000 litres for drinking► 7000 litres for servicing.
The water footprint of a cow
99%
1%


Water Footprint
► WF is an indicator of water use that looks at both direct and indirect water use of a consumer or producer.
► Measured in terms of water volumes consumed (evaporated or otherwise not returned) or polluted per unit of time.
► Space and Time indicator.
► Calculated for a process, a product, a consumer, group of consumers (e.g. municipality, province, state or nation) or a producer (e.g. a public organization, private enterprise).

Direct water footprint Indirect water footprint
Green water footprint Green water footprint
Blue water footprint Blue water footprint
Grey water footprint Grey water footprint
Water
consumption
Water
pollution
Return flow
Water withdrawl
Traditionalstatisticson water use
Water Footprint Components

Water footprint sustainability assessment
Water footprint accounting
Water footprint response formulation
Setting goalsand scope
Phase 1 Phase 2 Phase 3 Phase 4
Water Footprint Assessment

Water Footprint Unit
• WF of a process: water volume per unit of time.When divided over the quantity of product that results from the process, it can also be expressed as water volume per product unit.
• WF of a product: water volume per product unit.
o water volume per unit of mass
o water volume per unit of money
o water volume per piece
o water volume per unit of energy (food products, fuels)
• WF of a consumer or business and WF within an area: water volume per unit of time. The water footprint of a community of consumers can also be expressed in terms of water volume per unit of time per capita.

Net virtual water import (Gm3/yr)-100 - -50-50 - -25-25 - -10-10 - -5-5 - 00 - 55 - 2525 - 5050 - 100No Data
National Virtual Water Balances

WFP(m3/cap/yr)600 - 800800 - 10001000 - 12001200 - 13001300 - 15001500 - 18001800 - 21002100 - 2500No Data
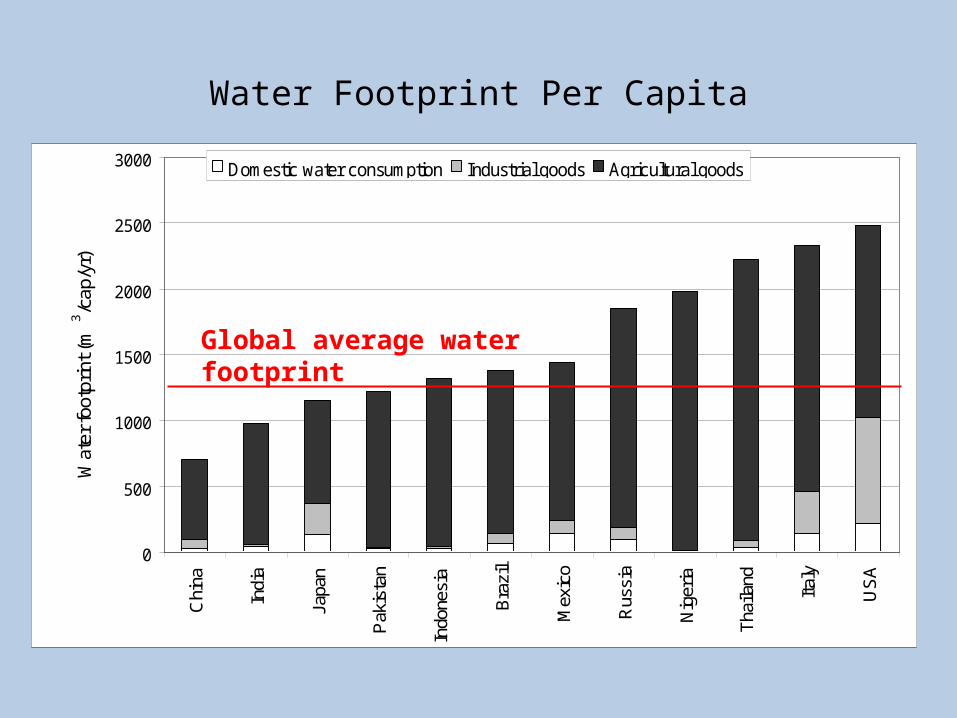
Water Footprint Per Capita
0
500
1000
1500
2000
2500
3000
Chi
na
Indi
a
Japa
n
Paki
stan
Indo
nesi
a
Braz
il
Mex
ico
Rus
sia
Nig
eria
Thai
land
Italy
USA
Wat
er fo
otpr
int (
m3 /c
ap/y
r)
Domestic water consumption Industrial goods Agricultural goods
Water Footprint Per Capita
Global average water footprint


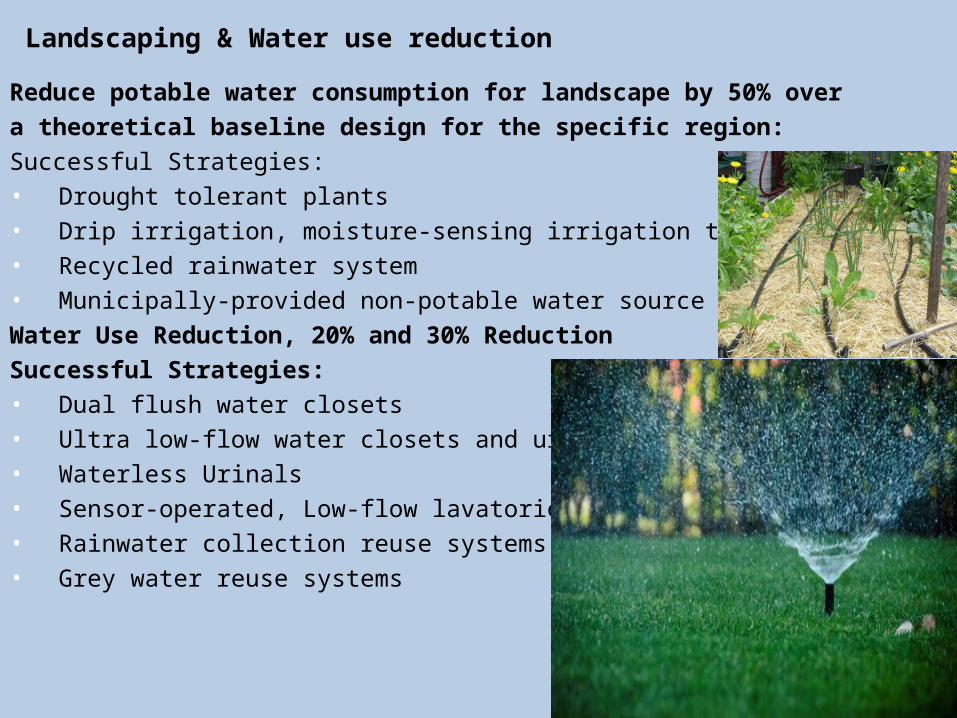
Reduce potable water consumption for landscape by 50% over a theoretical baseline design for the specific region:Successful Strategies:• Drought tolerant plants • Drip irrigation, moisture-sensing irrigation technologies • Recycled rainwater system • Municipally-provided non-potable water source use Water Use Reduction, 20% and 30% ReductionSuccessful Strategies:• Dual flush water closets • Ultra low-flow water closets and urinals • Waterless Urinals • Sensor-operated, Low-flow lavatories • Rainwater collection reuse systems • Grey water reuse systems
Landscaping & Water use reduction
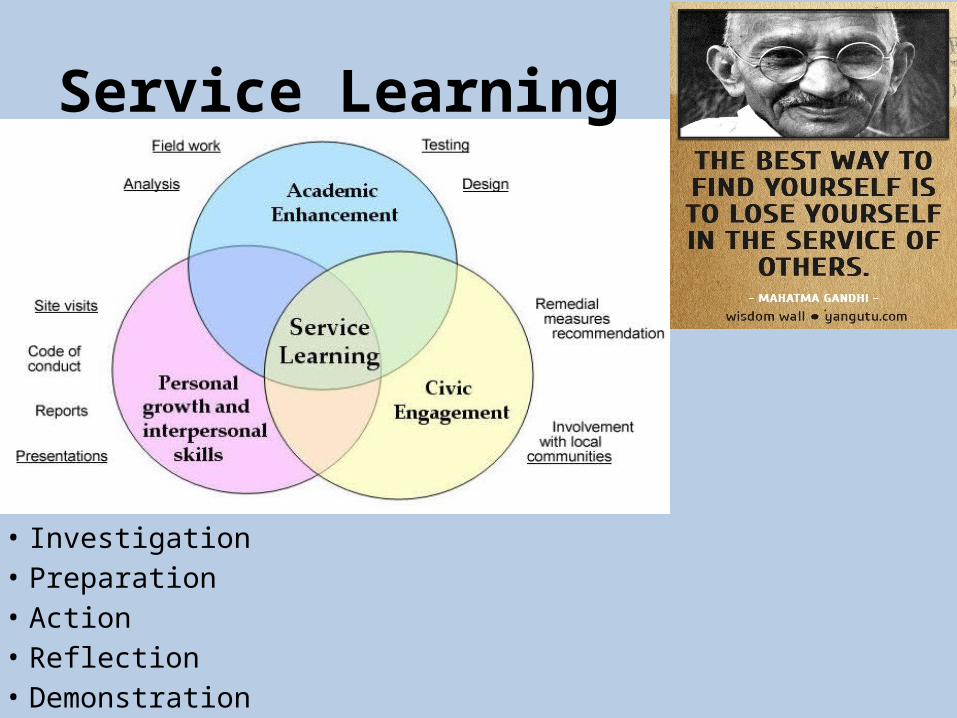
Service Learning
• Investigation• Preparation• Action• Reflection• Demonstration

Investigate
• Create Inventory of your skills and talents• What community needs inspire you List Out:
media, interviews, surveys, observation and experience
• Form groups to discuss: People, plants, animals, weather, land, water health and food
• Check three needs worth addressing

Prepare
• Brainstorm• Draw a map• Check water bill• Interview adults• Interact with an expert
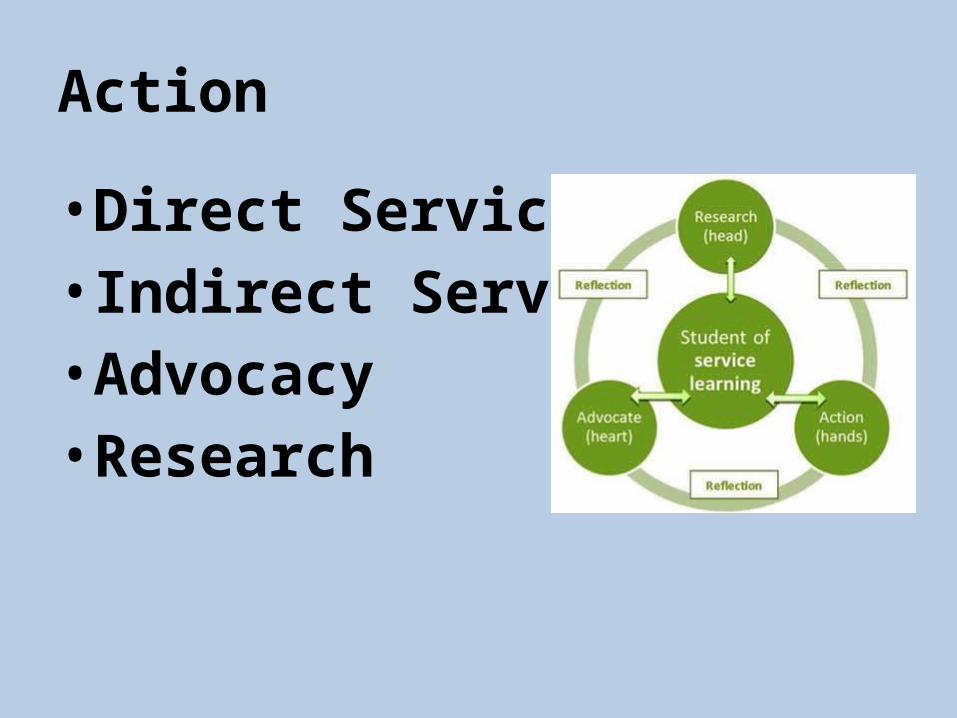
Action
• Direct Service• Indirect Service• Advocacy • Research

Reflection• What is that you
want to remember
New idea that you have learnt now
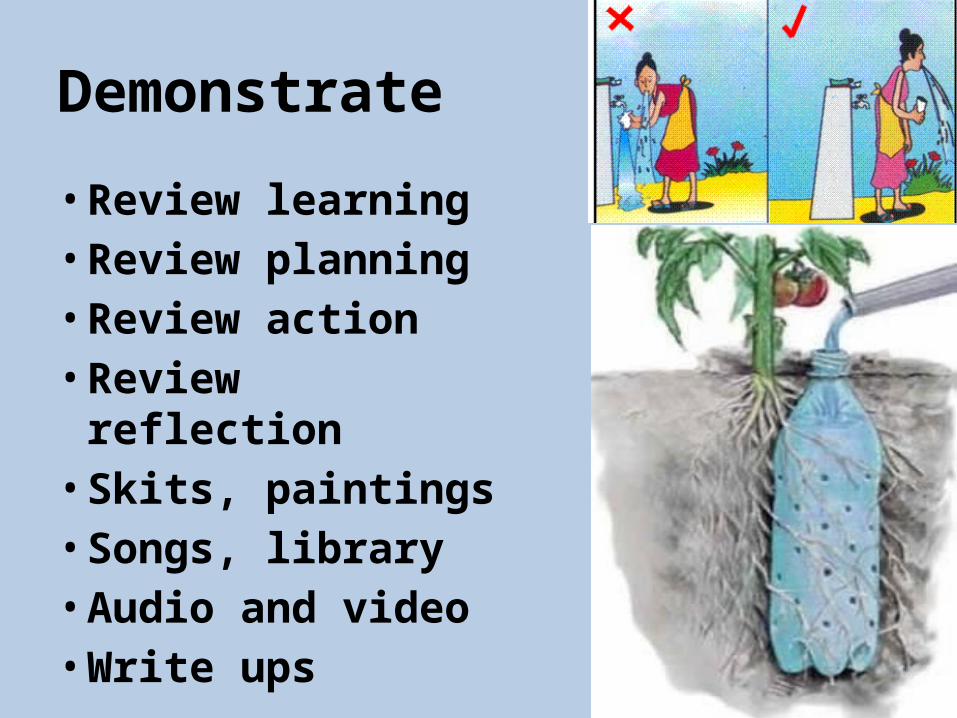
Demonstrate
• Review learning• Review planning• Review action• Review reflection • Skits, paintings• Songs, library• Audio and video• Write ups