national survey on distracted driving attitudes and
TRANSCRIPT

National Survey on Distracted Driving Attitudes and Behaviors ndash 2015
Disclaimer This publication is distributed by the US Department of Transportation National Highway Traffic Safety Administration in the interest of information exchange The opinions findings and conclusions expressed in this publication are those of the authors and not necessarily those of the Department of Transportation or the National Highway Traffic Safety Administration The United States Government assumes no liability for its content or use thereof If trade or manufacturersrsquo names or products are mentioned it is because they are considered essential to the object of the publication and should not be construed as an endorsement The United States Government does not endorse products or manufacturers
Suggested APA Format Citation
Schroeder P Wilbur M amp Pentildea R (2018 March) National survey on distracted driving attitudes and behaviors - 2015 (Report No DOT HS 812 461) Washington DC National Highway Traffic Safety Administration
Technical Report Documentation Page
1 Report No
DOT HS 812 461 2 Government Accession No 3 Recipientrsquos Catalog No
4 Title and Subtitle
National Survey on Distracted Driving Attitudes and Behaviors - 2015 5 Report Date
March 2018 6 Performing Organization Code
7 Author(s)
Paul Schroeder Melanie Wilbur and Reyna Pentildea 8 Performing Organization Report No
9 Performing Organization Name and Address
Abt SRBI Inc 8405 Colesville Road Suite 300 Silver Spring Maryland 20910
10 Work Unit No (TRAIS)
11 Contract or Grant No
DTNH22-11-F-00355 12 Sponsoring Agency Name and Address
National Highway Traffic Safety Administration Office of Behavioral Safety Research 1200 New Jersey Avenue SE Washington DC 20590
13 Type of Report and Period Covered
Final Report
14 Sponsoring Agency Code
15 Supplementary Notes
Kristie Johnson PhD served as the Contracting Officerrsquos Representative (COR) 16 Abstract
The 2015 National Survey on Distracted Driving Attitudes and Behaviors (NSDDAB) is the third in a series of telephone surveys on distracted driving providing data to help further the understanding of driving behavior and to contribute to the development of countermeasures and interventions to reduce distracted driving on the nationrsquos roadways Specifically the 2015 NSDDAB assessed the extent to which drivers are distracted by various activities demographic and typological descriptions of drivers prone to distractions the extent and frequency of cell phone use texting and use of mobile device ldquoappsrdquo while driving attitudes and perceptions about distracted driving knowledge of and attitudes toward measures to deter distracted driving perceptions about the danger of distracted driving exposure to the consequences of distracted driving willingness to intervene when someone is distracted while driving and changes and trends in distracted driving behaviors and attitudes since 2010 Like the previous studies conducted in 2010 and 2012 this survey yields national estimates of behaviors and attitudes toward distracted driving in the United States The present study used a driver typology based on the pattern of responses across multiple distracted driving behavior questions The cluster analysis identified two distinct groups of drivers with similar overall behavioral tendencies and among those categorized 42 are distraction-prone and 58 are distraction-averse Driver type is a powerful predictor of norms and attitudes towards distracted driving behavior and sanctions for distracted driving 17 Key Words
Unsafe driving distraction cell phone use texting inattention driving behavior phone apps driver typology
18 Distribution Statement
Document is available to the public from the National Technical Information Service wwwntisgov
19 Security Classif (of this report)
Unclassified 20 Security Classif (of this page)
Unclassified 21 No of Pages
194 22 Price
i
TABLE OF CONTENTS
Executive Summary 1
Chapter 1 Introduction 7
Chapter 2 Description of Respondent Population 10
Chapter 3 Phone-Related Distracted Driving 12
Chapter 4 Perceptions of Safety of Distracted Driving 37
Chapter 5 Changes in Cell-Phone-Related Distracted Driving 43
Chapter 6 Distracted Driving Laws and Stopped for Distracted Driving 45
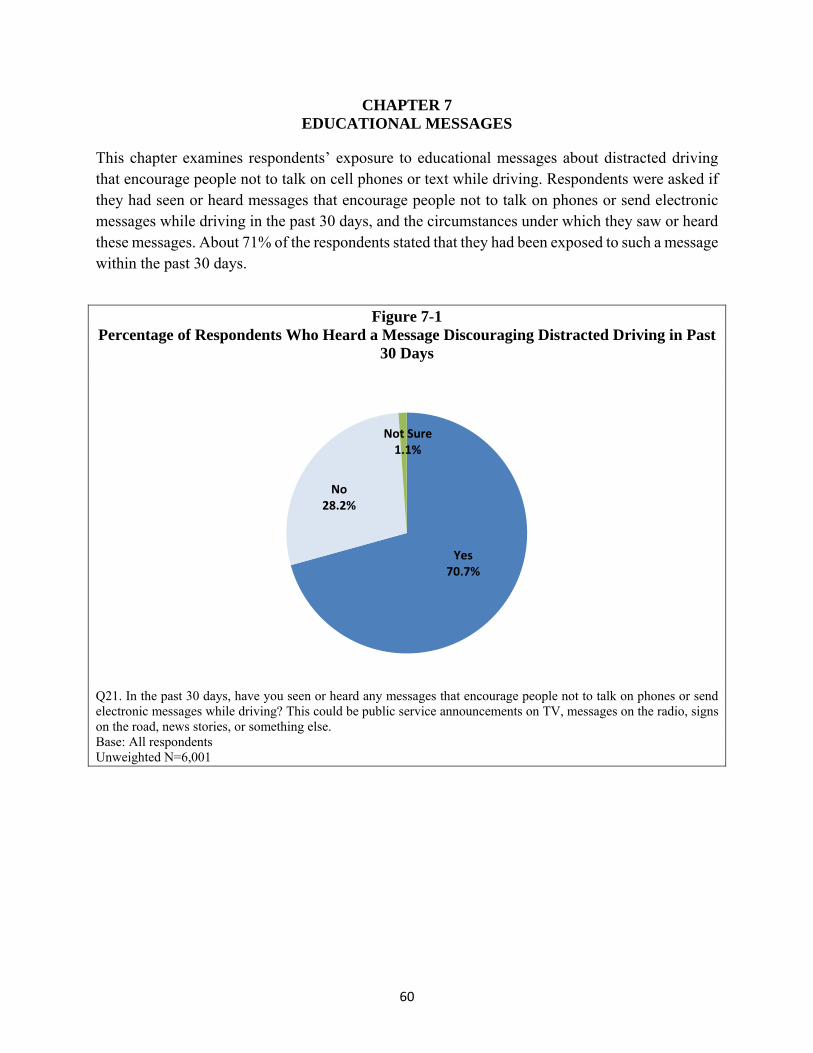
Chapter 7 Educational Messages 60
Chapter 8 Distracted Driving Crashes and Near-Crashes 70
Chapter 9 Perceptions of and Responses to Distracted Driving 75
Chapter 10 Distracted Driving Behavior by Driver Type 79
Chapter 11 Trend Analysis 110
Conclusion 122
Appendices
Appendix A Questionnaire A1
Appendix B Methodology B1
Appendix C Output for Raking With Trimming Weight by Individual and Global Cap Value Method C1
ii
LIST OF FIGURES
Figure 3-1 Cell Phone Ownership by Frequency of Driving 13
Figure 3-2 Answer Phone While Driving 14
Figure 3-3 How Phone Calls Are Answered While Driving 15
Figure 3-4 Make Phone Calls While Driving 16
Figure 3-5 Method of Dialing Phone Number While Driving 17
Figure 3-6 Answer or Make Calls While Driving by Age and Gender
( at Least Sometimes) 19
Figure 3-7 Send or Read Text Messages or E-Mails While Driving 22
Figure 3-8 Send or Read Text Messages or E-Mails While Driving By Age and Gender
( at Least Sometimes) 23
Figure 3-9 How Text Messages or E-Mails Are Sent While Driving 25
Figure 3-10 Use Smartphone Apps While Driving 27
Figure 3-11 Use Smartphone Apps While Driving by Age and Gender
( at Least Sometimes) 28
Figure 3-12 How Smartphone Apps Are Used While Driving 30
Figure 4-1 Respondents Who Feel Safe When Driver Is TalkingInteracting with
Children in the Vehicle by Number of Children in the Household 38
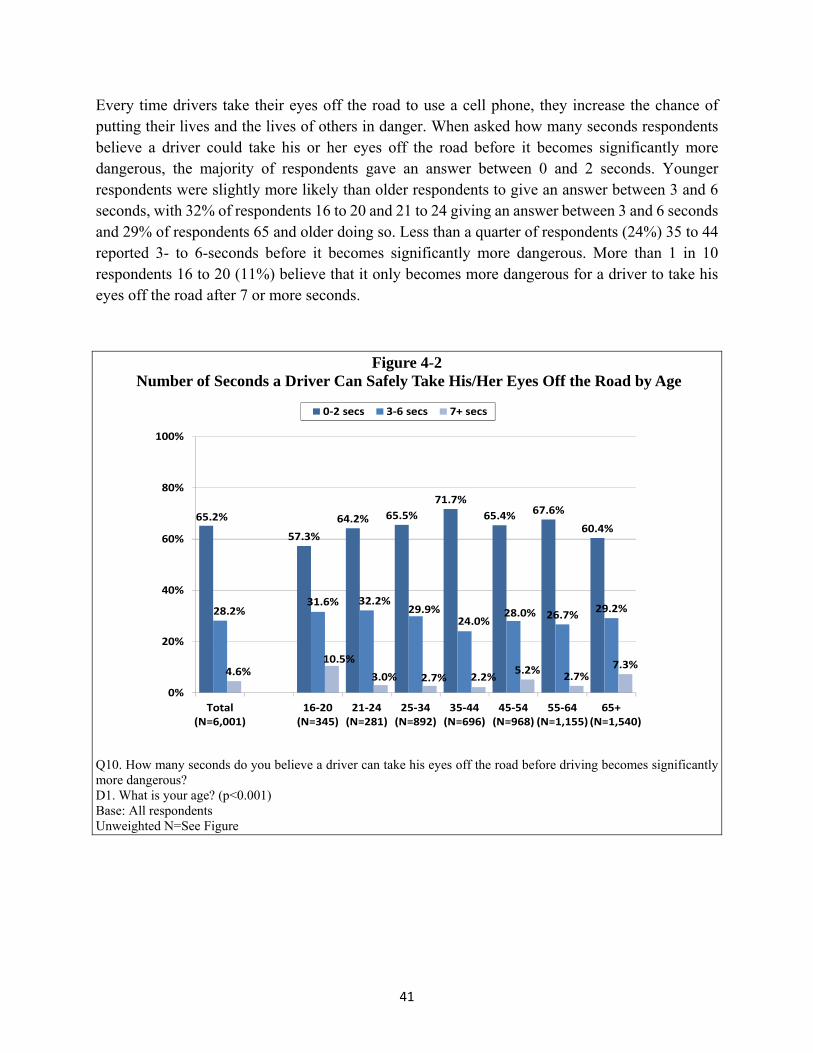
Figure 4-2 Number of Seconds a Driver Can Safely Take HisHer Eyes
Off the Road by Age 41
Figure 4-3 Number of Seconds a Driver Can Safely Take HisHer Eyes
Off the Road by Gender 42
Figure 5-1 Has Your Frequency of Cell Phone Use While Driving Increased
Decreased or Stayed the Same 43
Figure 6-1 Does Your State Have a Law Banning Talking on a Handheld Cell
Phone While Driving 45
Figure 6-2 Does Your State Have a Law Banning Talking on a Handheld Cell
Phone While Driving by Actual State Law 46
Figure 6-3 Likelihood of Ticket for Talking on a Cell Phone While Driving 47
Figure 6-4 Likelihood of Ticket for Talking on a Cell Phone While Driving
by Highest Level of School Completed 48
Figure 6-5 Do You Support a Law Banning Talking on a Handheld Cell Phone
While Driving 49
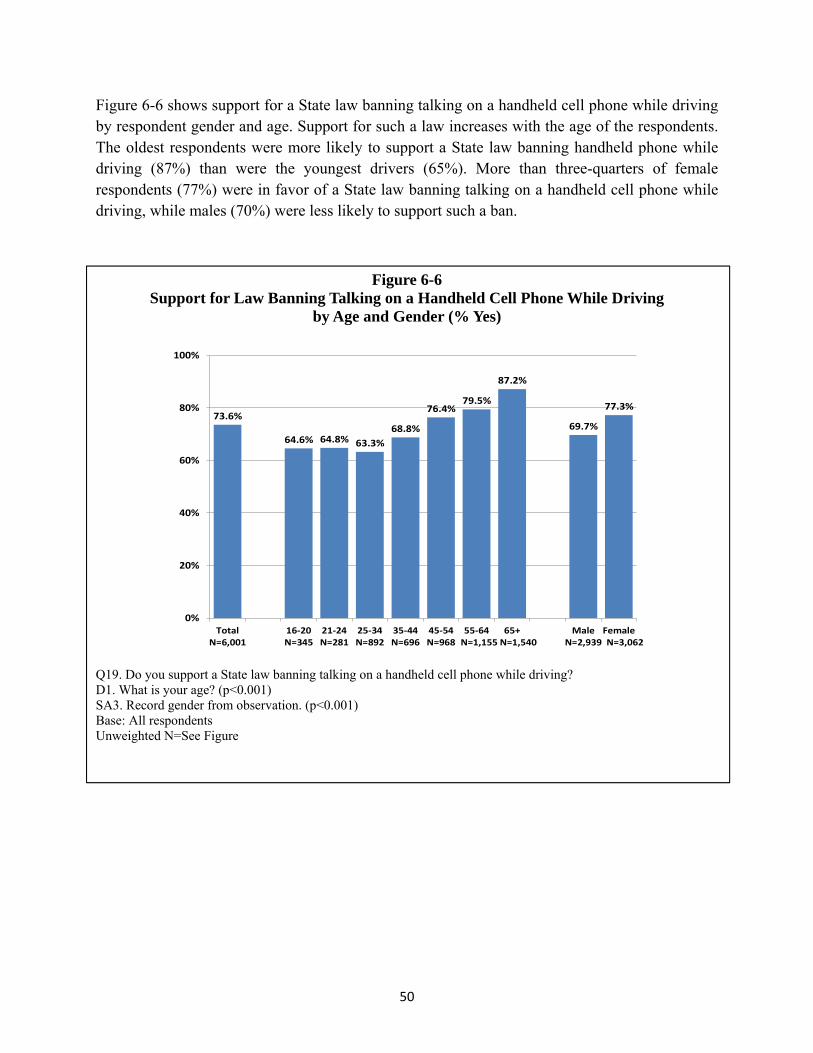
Figure 6-6 Support for Law Banning Talking on a Handheld Cell Phone While
Driving by Age and Gender ( Yes) 50
Figure 6-7 Average Fine for Talking on Handheld Cell Phone While Driving
by Age and Gender 51
Figure 6-8 Does Your State Have a Law Banning Texting or E-Mailing
While Driving 52
iii
Figure 6-9 Does Your State Have a Law That Bans Sending Electronic Messages
While Driving by Actual State Law 53
Figure 6-10 Likelihood of Ticket for Sending Text Messages or E-Mails
While Driving 54
Figure 6-11 Likelihood of Ticket for Sending Text Messages or E-Mails
While Driving by Highest Level of School Completed 55
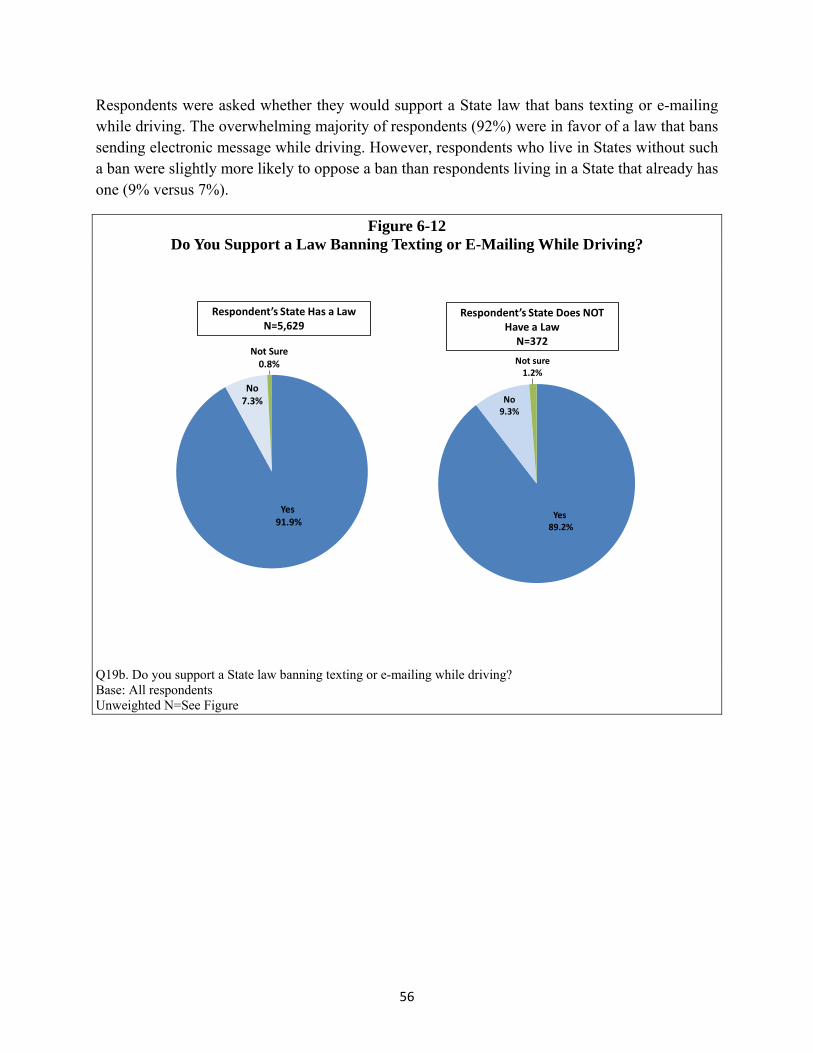
Figure 6-12 Do You Support a Law Banning Texting or E-Mailing
While Driving 56
Figure 6-13 Support for Law Banning Texting or E-Mailing While Driving
by Age and Gender ( Yes) 57
Figure 6-14 Average Fine for Sending Text Messages or E-Mails While Driving
by Age and Gender 58
Figure 6-15 Ever Stopped by Police for Using Phone While Driving by Age and
Gender 59
Figure 7-1 Percentage of Respondents Who Heard a Message Discouraging
Distracted Driving in Past 30 Days 60
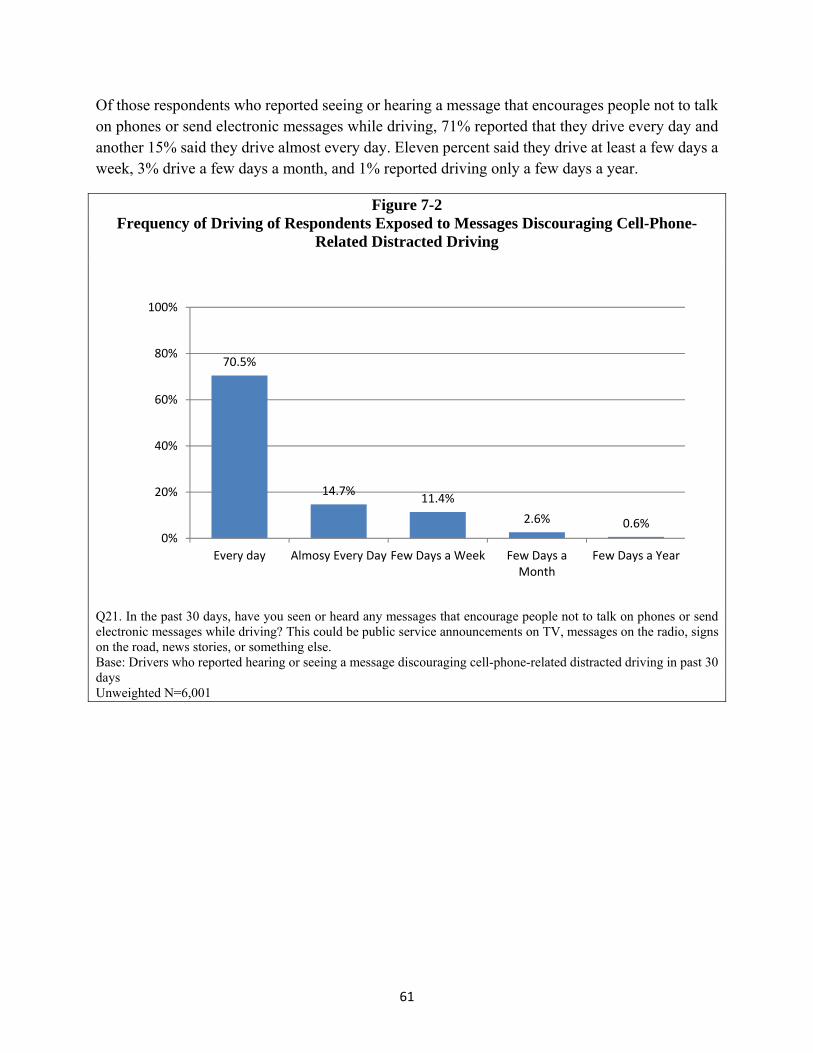
Figure 7-2 Frequency of Driving Among Respondents Exposed to Messages
Discouraging Cell-Phone-Related Distracted Driving 61
Figure 7-3 Source of Messages Discouraging Cell-Phone-Related Distracted Driving 63
Figure 7-4 Source of Messages Discouraging Cell-Phone-Related Distracted Driving
by Age 64
Figure 7-5 Source of Messages Discouraging Cell-Phone-Related Distracted Driving
by Gender 65
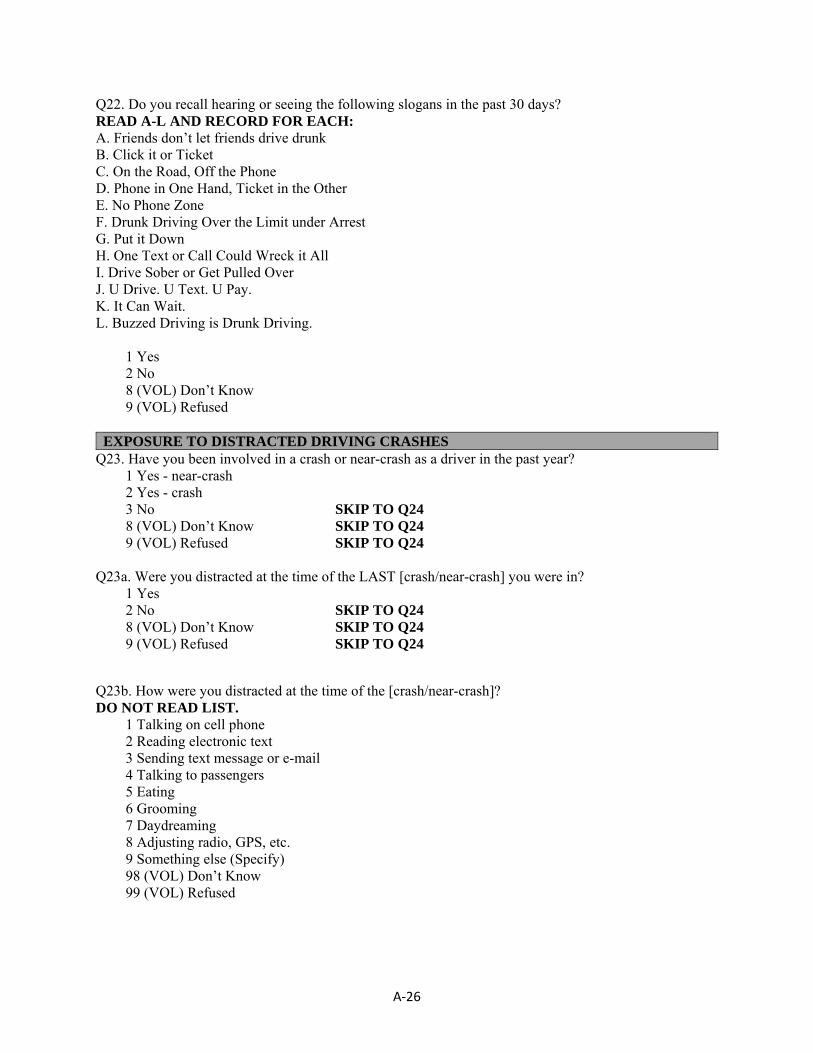
Figure 7-6 Heard Slogans in Past 30 Days 66
Figure 7-7 Number of Slogans Heard in Past 30 Days 67
Figure 7-8 Number of Distracted Driving Slogans Heard in Past 30 Days by Age 68
Figure 7-9 Number of Distracted Driving Slogans Heard in Past 30 Days by Gender 69
Figure 8-1 Had a Crash or Near-Crash in Past Year 70
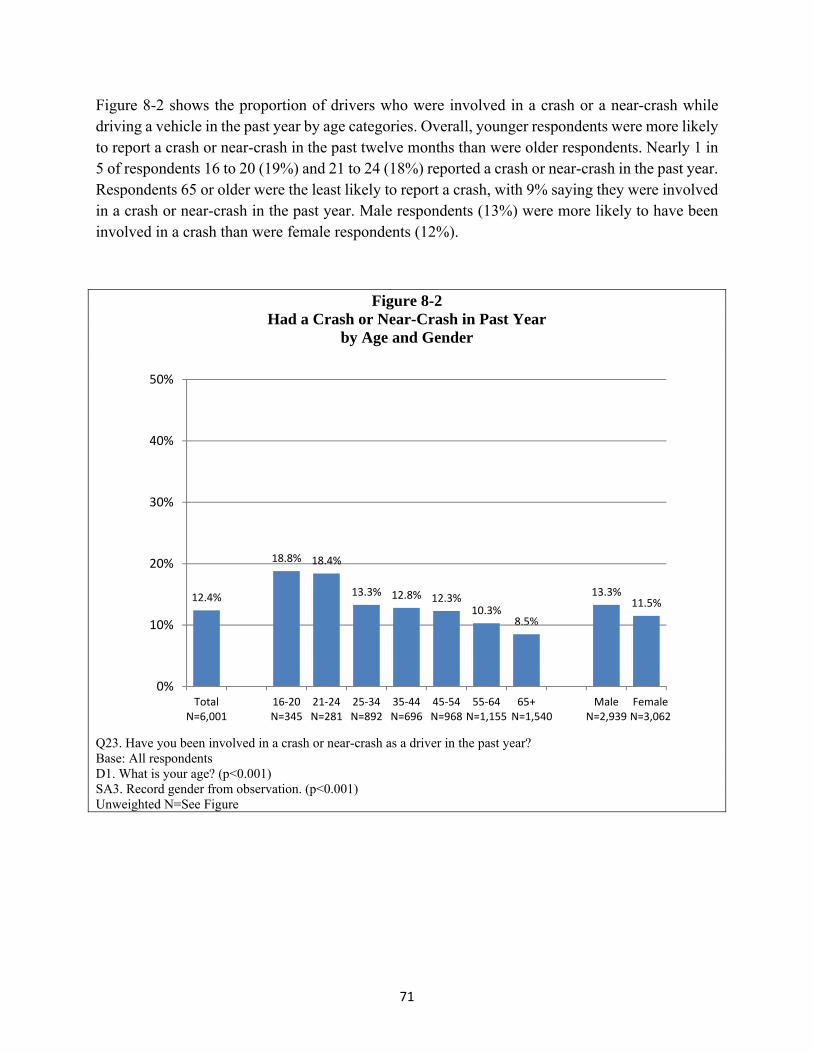
Figure 8-2 Had a Crash or Near-Crash in Past Year by Age and Gender 71
Figure 8-3 Was the Respondent Distracted During the Last Crash or Near-Crash 72
Figure 8-4 Was Distracted During Last Crash or Near-Crash Experience
by Age and Gender 73
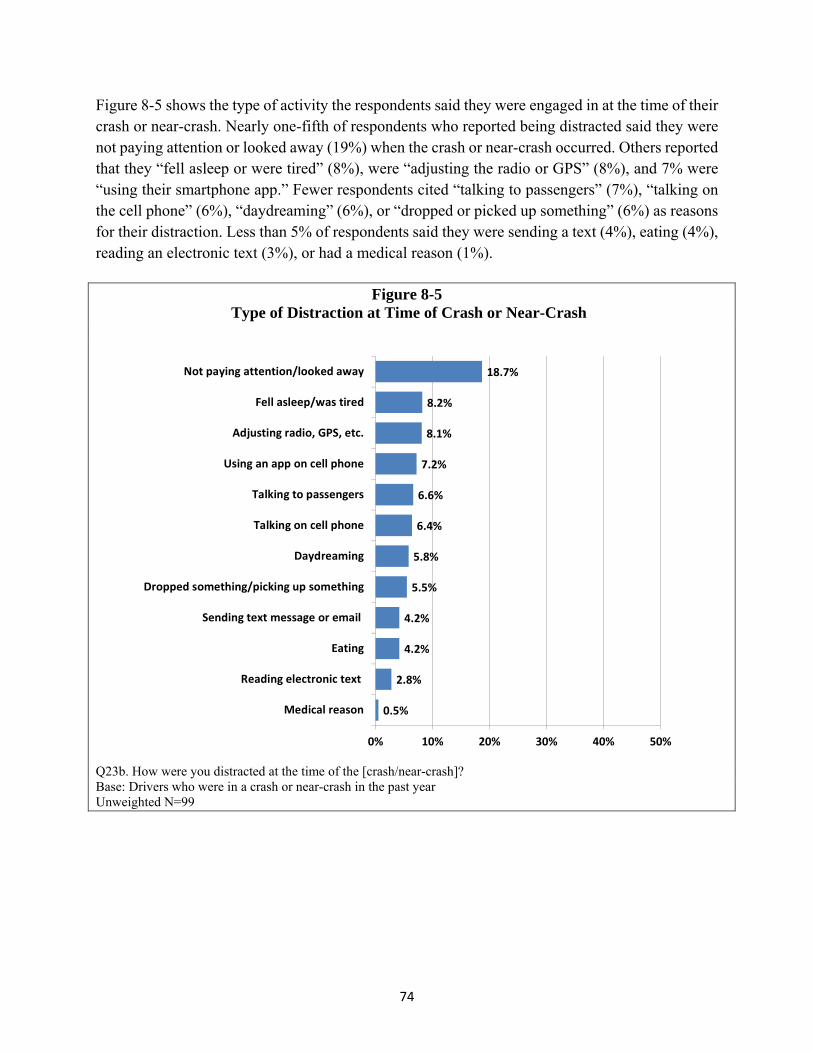
Figure 8-5 Type of Distraction at Time of Crash or Near-Crash 74
Figure 9-1 Perception of Proportion of Drivers Talking on PhoneTexting
While Driving 75
Figure 9-2 Safer to Use Hands-Free or Handheld Phone While Driving 76
Figure 9-3 Safer to Use Hands-Free or Handheld Phone While Driving
by Age and Gender 77
Figure 9-4 Would Use App to Block Calls and Texts While Driving ( Yes) 78
Figure 10-1 Driver Type by Age and Gender 83
Figure 10-2 Driver Type by Highest Level of School Completed 84
iv
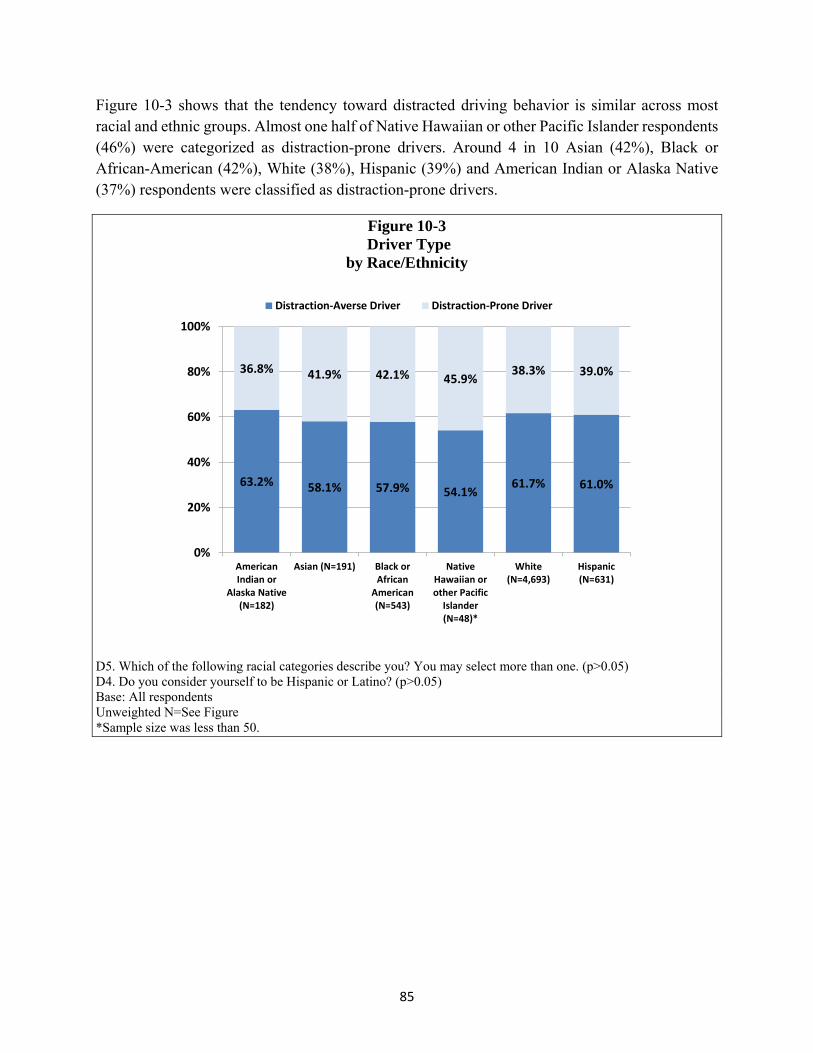
Figure 10-3 Driver Type by RaceEthnicity 85
Figure 10-4 Driver Type by Income 86
Figure 10-5 Driver Type by Frequency of Driving 87
Figure 10-6 Driver Type by Car Type 88
Figure 10-7 Cell Phone Ownership by Driver Type 89
Figure 10-8 Proportion of Distraction-Prone Drivers by NHTSA Region 90
Figure 10-9 Perception of Safety by Driver Type Driver Is Talking to Other Passengers 91
Figure 10-10 Perception of Safety by Driver Type Driver Is Talking on Cell Phone
While Holding Phone 92
Figure 10-11 How Likely Are You to Intervene if the Driver Is Talking on a Cell
Phone While Holding the Phone by Driver Type 93
Figure 10-12 Perception of Safety Driver Is Sending Text Messages or E-Mails by
Driver Type 94
Figure 10-13 How Likely Are You to Intervene if Driver Is Sending Text Messages or
E-Mails by Driver Type 95
Figure 10-14 Perception of Safety Driver Is Reading Text Messages or E-Mails
by Driver Type 96
Figure 10-15 Number of Seconds a Driver Can Safely Take HisHer Eyes
Off the Road Messages by Driver Type 97
Figure 10-16 Has Your Frequency of Answering Phone Calls While Driving
Increased Decreased or Stayed the Same by Driver Type 98
Figure 10-17 Likelihood of Ticket for Talking on a Cell Phone While Driving
by Driver Type 99
Figure 10-18 Support for Law Banning Talking on a Handheld Cell Phone
While Driving by Driver Type 100
Figure 10-19 Likelihood of Ticket for Sending Text Messages or E-Mails
While Driving by Driver Type 101
Figure 10-20 Average Fine for Cell Phone Use While Driving by Driver Type 102
Figure 10-21 Ever Stopped by Police for Using Phone While Driving by Driver
Type ( Yes) 103
Figure 10-22 Respondents Exposed to Messages Discouraging Cell Phone
Distracted Driving by Driver Type 104
Figure 10-23 Source of Messaging by Driver Type 105
Figure 10-24 Had a Crash or Near-Crash in Past Year by Driver Type 106
Figure 10-25 Was Distracted During Last Crash or Near-Crash Experience
by Driver Type 107
Figure 10-26 Safer to Use Hands-Free or Handheld Phone While Driving
by Driver Type 108
Figure 10-27 Would Use App to Block Calls and Texts While Driving
by Driver Type 109
v
Figure 11-1 Answering and Making Phone Calls While Driving ( AlwaysAll Trips) 112
Figure 11-2 Do You Send Text Messages or E-Mails While Driving
( at Least Sometimes) 113
Figure 11-3 Has Your Frequency of Sending and Receiving Text Messages or E-Mails
While Driving Increased Decreased or Stayed the Same 114
Figure 11-4 Reasons for Decrease in Sending and Receiving Text Messages
While Driving 115
Figure 11-5 Perceived Safety as a Passenger ( Safe) 116
Figure 11-6 Likelihood of Intervening if Driver Is Using a Cell Phone While Driving 117
Figure 11-7 Do You Support a Law Banning Talking on a Handheld Cell Phone While
Driving or a Law Banning Texting or E-Mailing While Driving ( Yes) 118
Figure 11-8 Likelihood of Ticket for Using Cell Phone While Driving
( VerySomewhat Likely) 119
Figure 11-9 Was Respondent Stopped by Police for Using a Handheld Cell Phone
While Driving Percentage of Respondents Exposed to Messages
Discouraging Distracted Driving - Past 30 Days ( Yes) 120
Figure 11-10 Exposure to Distracted Driving Crash 121
vi
LIST OF TABLES
Table 2-1 Demographics by Sample Type ndash Unweighted 10
Table 3-1 Ownership of Electronic Devices and Connectivity 12
Table 3-2 Location of Phone in Vehicle and Method of Answering 18
Table 3-3 Answer Calls While Driving by Age and Gender 20
Table 3-4 Make Calls While Driving by Age and Gender 20
Table 3-5 Reasons For Answering and Making Phone Calls While Driving 21
Table 3-6 Send Text Messages or E-Mails While Driving by Age and Gender 24
Table 3-7 Read Text Messages or E-Mails While Driving by Age and Gender 24
Table 3-8 Reasons for Sending Text Messages or E-Mails While Driving 26
Table 3-9 Use Smartphone Apps While Driving by Age and Gender 29
Table 3-10 Smartphone Apps Used While Driving 31
Table 3-11 Reasons For Using Apps While Driving 32 Table 3-12 Perceived Difference in Driving When Talking on a Cell Phone TextE-Mail
Messaging and Using Apps 34 Table 3-13 Behavior Differences in Vehicle When Talking on a Cell Phone TextE-Mail
Messaging and Using Apps 35 Table 3-14 Driving Situations Respondent Not Likely to Talk on Phone TextE-Mail
Message or Use Apps 36
Table 4-1 Perceived Safety as Passenger 37 Table 4-2 How Likely Are You to Intervene if the Driver Is Talking on a Cell Phone
While Holding the Phone by Age and Gender 39 Table 4-3 How Likely Are You to Intervene if the Driver Is Sending Text Messages or
E-Mails While Driving by Age and Gender 40
Table 5-1 Reasons for Decrease in Using Cell Phone While Driving 44
Table 7-1 Source of Messages Discouraging Cell-Phone-Related Distracted Driving 62
Table 10-1 Distracting Behavior Frequency (Used in Cluster Analysis) 80
Table 10-2 Distracted Driving Behaviors by Driver Type 81
Table 11-1 Engaging in Distracted Driving Activities (Always or All Trips) 111
Table B-1 Expected Population and Sample Distribution by Age Based on 2013
Census Bureau Estimates B-3
Table B-2 Sample Size by Type and Age B-5
Table B-3 Landline Cross-Section Final Disposition Report B-6
Table B-4 Cell Phone Final Disposition Report B-7
Table B-5 Landline Oversample Final Disposition Report B-8
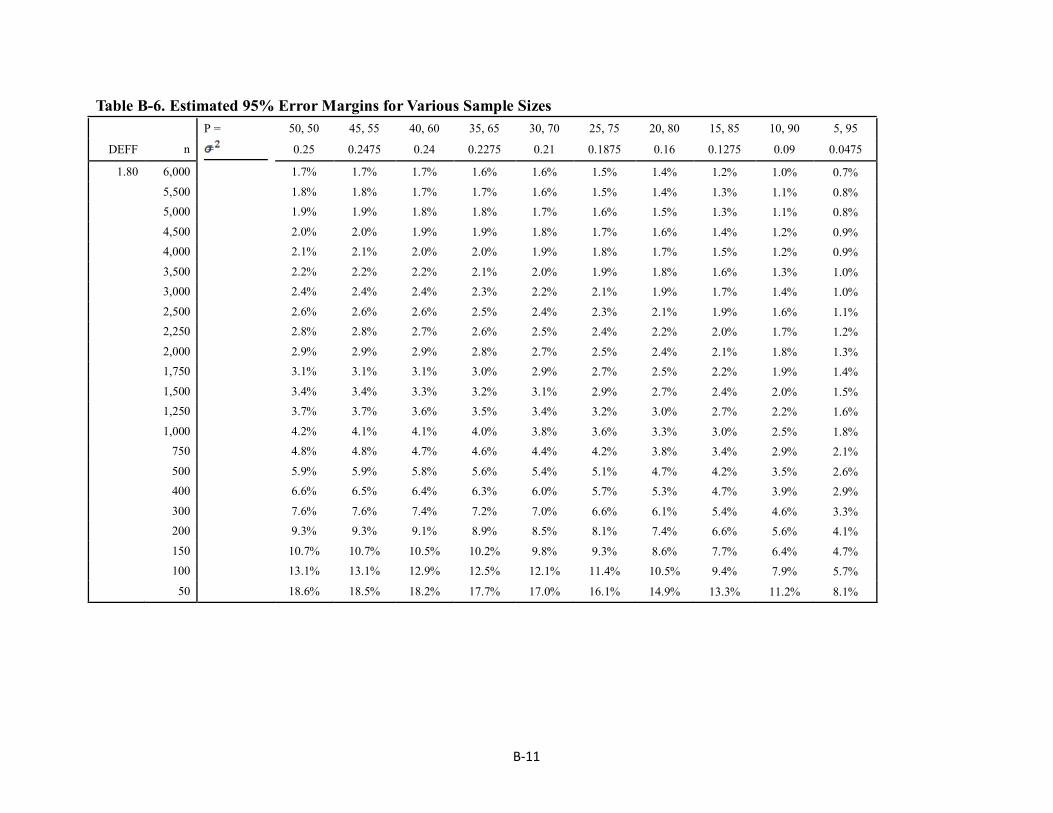
Table B-6 Estimated 95 Error Margins for Various Sample Sizes B-11
Table B-7 Estimated 95 Error Margins For the Difference Between Two Subgroups B-12
vii
Table B-8 Base Sampling Weights by Sample Component B-15
Table B-9 Control Variables Used in the Raking B-18
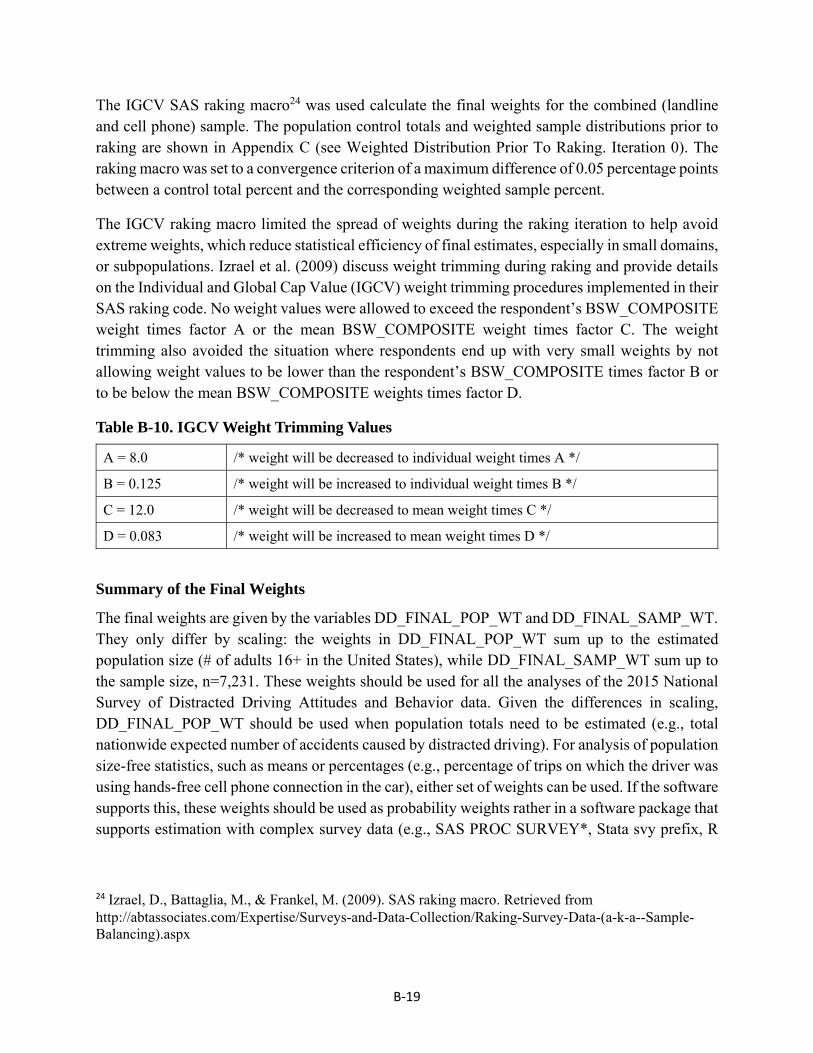
Table B-10 IGCV Weight Trimming Values B-19
Table B-11 Summary of Final Weights B-20
Table C-1 Raking Results C-2
viii
EXECUTIVE SUMMARY
The 2015 National Survey on Distracted Driving Attitudes and Behavior (NSDDAB) is the third telephone survey conducted by NHTSA to assess attitudes and self-reported behaviors related to distracted driving cell phone use and texting The first NSDDAB was conducted in 2010 and the second was conducted in 2012 The 2015 survey was administered by Abt SRBI a national survey research organization The survey employed a partial overlapping dual-frame sample design of households with landline telephones as well as households that relied on cell phones and collected data from drivers 16 and older Because younger respondents tend to be underrepresented in landline telephone surveys the survey included a landline telephone oversample of drivers 16 to 34 Interviewing began on January 20 2015 and ended on April 14 2015
This report presents the survey findings from the 2015 NSDDAB The data is weighted to yield national estimates Readers are cautioned that some subgroup analyses are based on a smaller number of cases A full description of the survey methodology and the questionnaire are presented in the appendices to this report
Driver Characteristics
Driving Frequency More than 4 in 5 respondents (83) drive every day or almost every day Thirteen percent report driving a few days a week while 4 drive a few days a month or less often
Vehicle Type The majority of drivers (57) report they most often drive a passenger car Nineteen percent of respondents report driving an SUV 15 report driving a pickup truck and 7 report driving a van or a minivan most often
Driver Type A driver typology based on the pattern of responses across 15 questions concerned with distracted driving classified all respondents into two distinct groups of drivers with similar overall behavioral tendencies Of those respondents categorized 42 were classified as distraction-prone drivers and 58 were classified as distraction-averse drivers
Phone-Related Distracted Driving
Cell Phone Ownership Overall 90 of respondents report owning some type of cell phone and 94 of respondents who report driving every day state that they currently own a cell phone
Talking on Cell Phone While Driving About 4 in 10 (42) drivers report answering their cell phones when driving at least some of the time Nearly 4 in 10 drivers (37) report never answering their phones while driving More than half of drivers (56) who answer their phones while driving continue to drive while completing the conversation Seventeen
1
percent report handing the phone to a passenger in the car 14 of drivers inform the caller they will call them back and 7 pull over to a safe location to continue the conversation The majority of drivers who report accepting calls while driving indicated that the frequency with which they use cell phones when driving has not changed in the past 30 days (81) 15 report a decrease and 3 report an increase in their frequency of cell phone use Of those who reported a decrease 21 cited an increased awareness of safety as the reason for the change One-third of drivers (34) report that they are at least sometimes willing to make cell phone calls while driving More than 4 in 10 respondents report that they are never willing to initiate a cell phone call while driving (44)
Sending and Reading Text Messages and E-Mails While Driving Almost 1 in 10 respondents (9) reported sending text messages or e-mails while driving at least sometimes while 80 of respondents stated that they never do so An additional 11 of respondents reported sending text messages or e-mails on rare occasions Reading text messages or e-mails while driving was slightly more common with 12 of respondents stating that they do so at least some of the time and three quarters (75) stating that they never do so Of drivers who send text messages or e-mails 44 state that they wait until they reach a red light or stop sign to send the message About 1 in 5 drivers (19) report using a voice command feature to send a text message Fourteen percent of drivers continue to drive when sending text messages Less frequently drivers report handing the phone to a passenger (11) or pulling over to the side of the road (8) The majority of drivers (71) reported no changes in the frequency of sending text messages in the past 30 days 25 reported a decrease and 3 reported an increase Reasons given by those who reported a decrease included an increased awareness of safety (26) less use of cell phone or less people text them (19) and driving less (9)
Using a Smartphone App While Driving About 1 in 12 respondents (8) stated they used apps at least sometimes while driving not including navigation apps Musicradio apps (eg Pandora) (41) Facebook (12) and Internet search engines (eg Chrome Safari) (7) were the most frequently cited apps Respondents said that they were more likely to use a smartphone app while driving when they are in need of directions or other information (21) for musicentertainment (12) or when they are bored (11) Nearly 6 in 10 respondents who use apps while driving (56) believe that using a smartphone app while driving has no negative influence on their driving
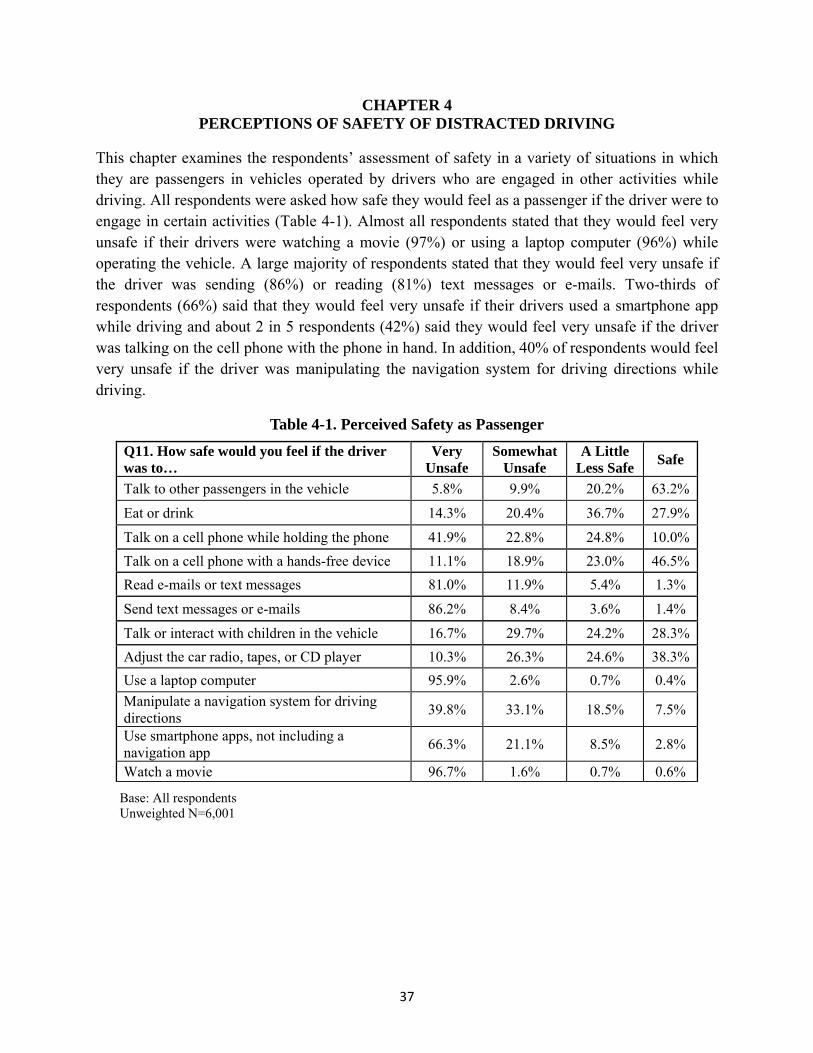
Perceptions of Safety
Perception of Safety When Driver Is Engaged in Distracting Activities When asked about their feelings concerning safety if they were a passenger in a car driven by a driver who was also doing various activities while driving most respondents indicated they would feel very unsafe if the driver was watching a movie (97) using a laptop computer (96)
2
or sending text messages or e-mails (86) A majority also reported that they would feel very unsafe if their drivers were reading e-mails or text messages (81) Distraction-averse respondents were more likely than distraction-prone respondents to report feeling unsafe as passengers if their drivers were reading or sending text messages Almost all distraction-averse drivers reported they would feel very unsafe as passengers if their drivers were reading (90) or sending (93) text messages compared to 69 and 76 respectively of respondents classified as distraction-prone drivers Sixty-three percent of respondents stated they would feel safe if the driver was talking to other passengers in the vehicle Nearly half of respondents (47) reported that they would feel safe if their drivers were talking on a cell phone with a hands-free device
Likelihood of Saying Something to Drivers if They Are Engaged in Distracting Activities Respondents were asked how likely they would be to intervene if their drivers were engaged in a series of other activities while driving Overall 67 of respondents stated that they were at least somewhat likely to intervene if they were passengers in a car in which the driver was talking on a cell phone and holding the phone while driving Respondents who were classified as distraction-averse were more likely to intervene than respondents classified as distraction-prone Among those classified as distraction-averse 53 stated they would very likely intervene compared to 37 of respondents who were classified as distractionndashprone drivers Overall 87 of respondents indicated that they were at least somewhat likely to intervene if they were passengers in a car in which the driver was sending e-mails or text messages There was almost no difference in the proportion of distraction-prone and distraction-averse drivers at least somewhat likely to intervene if a driver was sending e-mails or text messages
Likelihood of Using Smartphone Apps That Disable Texting and Incoming Calls When Driving Nearly half of the respondents (46) said that they would use an app to block phone calls and text messaging while driving Female drivers (50) and drivers 45shy54 (52) were the most likely to say that they would use an app that blocks phone calls and text messaging while driving Drivers 21 to 24 were the most likely to state that they already use an app to block incoming calls and texts (3)
Distracted Driving Laws and Educational Messages
Awareness of State Law Banning Talking and Texting on a Handheld Cell Phone While Driving Overall more than half of respondents (57) reported that their States have or probably have a law banning talking on a cell phone while driving while 16 of respondents were unsure if their States have such a law Regarding a texting ban 76 reported that their States have or probably have a law banning texting or e-mailing on a cell phone while driving Fourteen percent of respondents were unsure if their States have such a law In States with laws banning cell phone use while driving 83 of drivers were
3
aware of the law and 4 thought their States had no such law In States without laws banning cell phone use while driving 39 of drivers accurately stated that their States did not have a law banning cell phone use while 29 incorrectly thought their States had such a law when it did not In States that ban sending or reading text messages and e-mails while driving 64 of drivers knew about the law and 8 thought their States did not have a law In States without laws that ban sending and receiving text messages and e-mails while driving 25 were aware that their States did not have such a law and 36 incorrectly thought their States had such a law when it did not
Chances of Receiving a Ticket for Distracted Driving Overall slightly more than half of respondents in States with laws banning some form of cell phone use while driving thought a driver who regularly talks on a cell phone (54) or frequently sends text messages or e-mails (56) while driving was likely to get a ticket in the next 6 months More than 4 in 10 respondents stated that it was unlikely that a driver would be ticketed for talking on a cell phone (43) or sending text messages (42) while driving Distraction-averse drivers were more likely to report that a driver who regularly talks on a cell phone or sends text messages or e-mails was very likely to be ticketed Drivers with less formal education were more likely to believe that the driver would be ticketed while those with more formal education were more likely to believe that the driver would not be ticketed
Support of a Law Banning Talking on a Handheld Cell Phone and Texting or E-Mailing While Driving Three out of 4 drivers support State laws banning talking on a handheld cell phone while driving (74) An overwhelming majority (92) support State laws that ban texting or e-mailing while driving
Educational Messages Of all respondents 71 had seen or heard a message discouraging distracted driving in the past 30 days Drivers who drove every day were more likely than those who drove less frequently to report having seen or heard these messages Respondents who were classified as distraction-prone (75) were more likely than distraction-averse (67) respondents to report hearing or seeing these messages The most common sources of messages discouraging distracted driving were TV print media and radio with some respondents reporting seeing messages in more than one medium More than half of respondents (68) reported TV as a source of the message Billboards were reported by 36 of respondents and 26 of respondents stated that the radio was a source of the message
Safe Driving Slogans More than half of respondents (51) had heard or seen ldquoIt Can Waitrdquo in the past 30 days Over one quarter of respondents had heard ldquoU Drive U Text U Payrdquo (28) or ldquoOne Text or Call Could Wreck It Allrdquo (28) within the past month
4
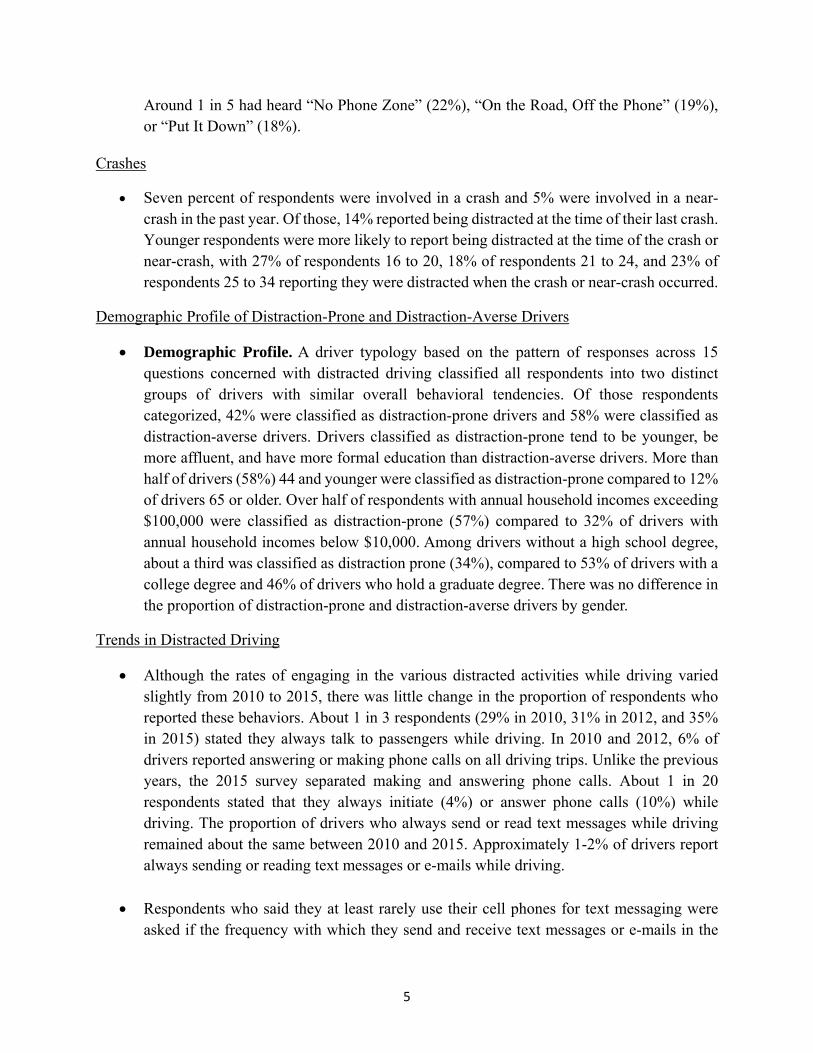
Around 1 in 5 had heard ldquoNo Phone Zonerdquo (22) ldquoOn the Road Off the Phonerdquo (19) or ldquoPut It Downrdquo (18)
Crashes
Seven percent of respondents were involved in a crash and 5 were involved in a near-crash in the past year Of those 14 reported being distracted at the time of their last crash Younger respondents were more likely to report being distracted at the time of the crash or near-crash with 27 of respondents 16 to 20 18 of respondents 21 to 24 and 23 of respondents 25 to 34 reporting they were distracted when the crash or near-crash occurred
Demographic Profile of Distraction-Prone and Distraction-Averse Drivers
Demographic Profile A driver typology based on the pattern of responses across 15 questions concerned with distracted driving classified all respondents into two distinct groups of drivers with similar overall behavioral tendencies Of those respondents categorized 42 were classified as distraction-prone drivers and 58 were classified as distraction-averse drivers Drivers classified as distraction-prone tend to be younger be more affluent and have more formal education than distraction-averse drivers More than half of drivers (58) 44 and younger were classified as distraction-prone compared to 12 of drivers 65 or older Over half of respondents with annual household incomes exceeding $100000 were classified as distraction-prone (57) compared to 32 of drivers with annual household incomes below $10000 Among drivers without a high school degree about a third was classified as distraction prone (34) compared to 53 of drivers with a college degree and 46 of drivers who hold a graduate degree There was no difference in the proportion of distraction-prone and distraction-averse drivers by gender
Trends in Distracted Driving
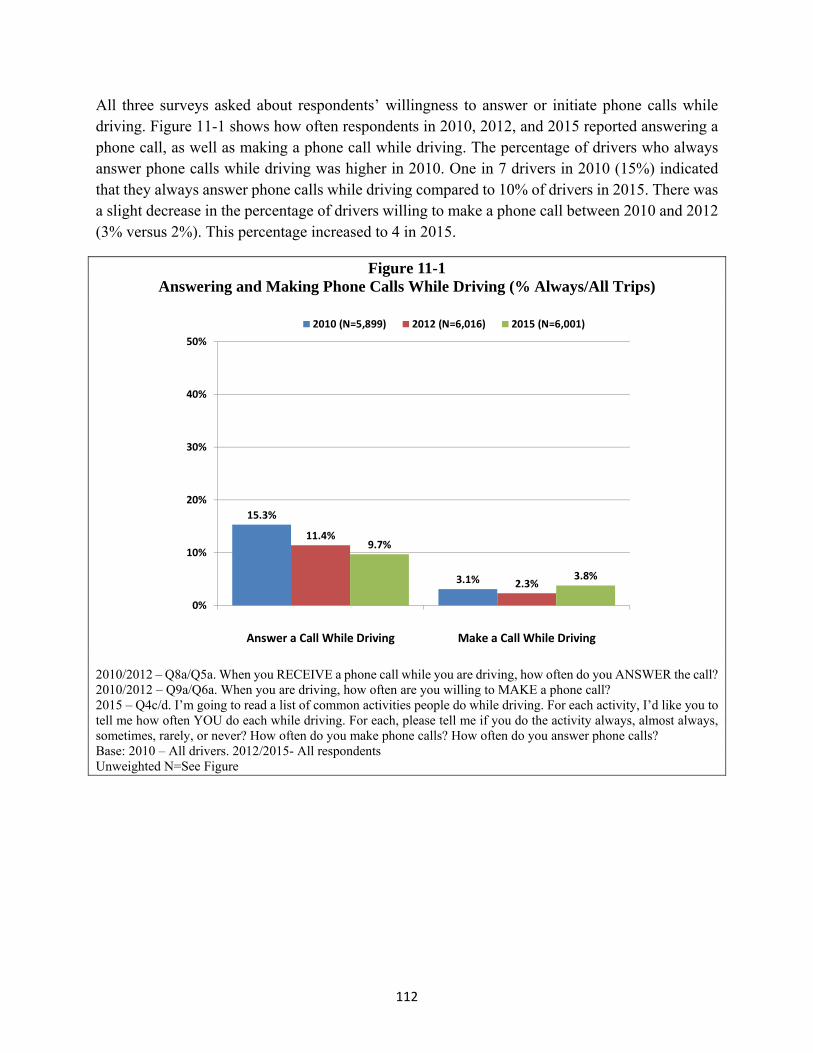
Although the rates of engaging in the various distracted activities while driving varied slightly from 2010 to 2015 there was little change in the proportion of respondents who reported these behaviors About 1 in 3 respondents (29 in 2010 31 in 2012 and 35 in 2015) stated they always talk to passengers while driving In 2010 and 2012 6 of drivers reported answering or making phone calls on all driving trips Unlike the previous years the 2015 survey separated making and answering phone calls About 1 in 20 respondents stated that they always initiate (4) or answer phone calls (10) while driving The proportion of drivers who always send or read text messages while driving remained about the same between 2010 and 2015 Approximately 1-2 of drivers report always sending or reading text messages or e-mails while driving
Respondents who said they at least rarely use their cell phones for text messaging were asked if the frequency with which they send and receive text messages or e-mails in the
5
past 30 days had changed In all three surveys most respondents reported that the rate at which they send electronic messages had stayed the same over the last 30 days (64 in 2010 67 in 2012 and 71 in 2015) In 2010 31 of respondents reported a decrease in the rate at which they send electronic messages In 2012 and 2015 fewer respondents reported a decrease (27 and 25 respectively) The percentage of respondents who reported an increase was 4 in 2010 5 in 2012 and 3 in 2015
In all three surveys respondents who reported sending or receiving fewer electronic messages while driving in the past 30 days were asked what caused this decrease The most common answer from respondents in all three surveys was an increased awareness of safety (32 in 2010 38 in 2012 and 26 in 2015) followed by a law that bans cell phone use (6 in 2010 8 in 2012 and 4 in 2015)
The proportion of respondents who said they would feel safe if their drivers were talking on a handheld cell phone while driving has decreased considerably between 2010 and 2015 In 2010 nearly one quarter of respondents (23) said they would feel safe in this driving situation while only 12 of respondents in 2012 and 10 of respondents in 2015 said they would feel safe if the driver was engaged in a phone conversation while holding a cell phone Conversely the proportion of respondents who would feel safe in a car operated by a driver using a hands-free device has increased over the years Nearly one half of respondents in 2015 (47) would feel safe if their drivers were using hands-free devices to make or answer phone calls while driving compared to 40 of respondents in 2012 and 23 of respondents in 2010
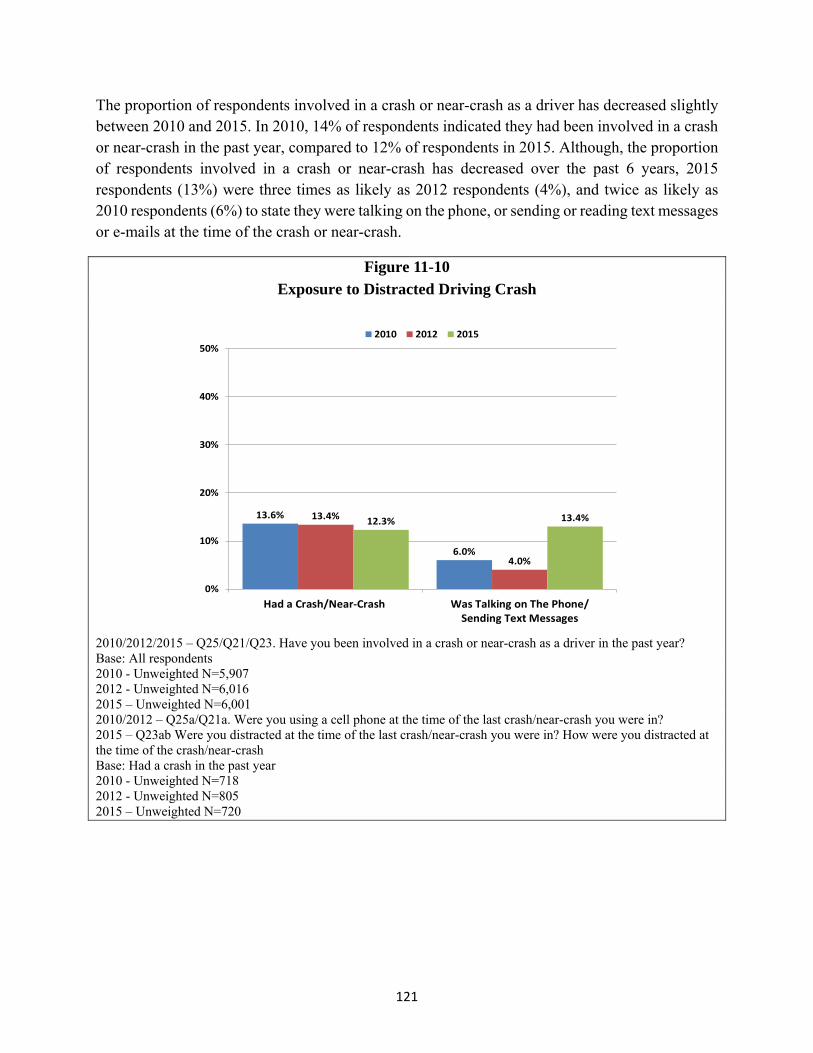
The proportion of respondents involved in a crash or near-crash as a driver has decreased slightly between 2010 and 2015 In 2010 14 of respondents indicated they had been involved in a crash or near-crash in the past year compared to 12 of respondents in 2015 Although the proportion of respondents involved in a crash or near-crash has decreased over the past 5 years 2015 respondents (13) were about three times as likely as 2012 respondents (4) and about twice as likely as 2010 respondents (6) to say they were talking on the phone sending or reading text messages or e-mails at the time of the crash or near-crash
6
CHAPTER 1 INTRODUCTION
Background
NHTSArsquos mission is to save lives prevent injuries and reduce traffic-related health care and other economic costs This includes promoting issues surrounding improved safety and responsible behavior among drivers The increase in cell phone ownership and usage combined with the widespread availability of many other devices that can easily divert driversrsquo attention from the task of driving an automobile have made information on driversrsquo behaviors and attitudes toward distracted driving important to the safety of Americarsquos roadways
Common activities that drivers engage in while driving include talking with other passengers adjusting the car radio making and receiving cell phone calls and using a smartphone for driving directions1 In 2012 more than one quarter of drivers in the United States reported always or almost always answering a phone call while they driving (28) and 6 said they always or almost always make a phone call while driving2
The use of technological devices while driving has become a focus of distracted driving research In particular use of cell phones while driving has been of increasing interest in the past decade Initially it was thought that using hands-free devices would be safer than handling and manipulating the phone because this would eliminate a biomechanical (physical) distraction However studies comparing use of handheld and hands-free phones while driving indicate that the cognitive distraction of talking on the phone has a large effect on driving outcomes and thus hands-free devices are no safer than handheld devices3 Even portable hands-free and vehicle-integrated hands-free cell phone use involved visual-manual tasks at least half of the time which is associated with a greater crash risk4
Driver distraction contributes to crash-related fatalities and injuries particularly among drivers
1 Schroeder P Meyers M amp Kostyniuk L (2013) National survey on distracted driving attitudes and behaviors ndash 2012 (Report No DOT HS 811 729) Washington DC National Highway Traffic Safety Administration Available at wwwnhtsagovstaticfilesntipdf811729pdf 2 Schroeder P Meyers M amp Kostyniuk L (2013) National survey on distracted driving attitudes and behaviors ndash 2012 (Report No DOT HS 811 729) Washington DC National Highway Traffic Safety Administration Available at wwwnhtsagovstaticfilesntipdf811729pdf 3 Young K amp Regan M (2007) Driver distraction A review of the literature In I J Faulks M Regan M Stevenson J Brown A Porter amp J D Irwin (Eds) Distracted driving (pp 379-405) Sydney New South Wales Australia Australasian College of Road Safety 4 Fitch G A Soccolich S A Guo F McClafferty J Fang Y Olson R L hellip amp Dingus T A (2013 April) The impact of handheld and hands-free cell phone use on driving performance and safety-critical event risk (Report No DOT HS 811 757) Washington DC National Highway Traffic Safety Administration
7
under 30 who are overrepresented in distraction-affected fatal crashes5 A distraction-affected crash is any crash in which a driver was identified as distracted at the time of the crash Overall 10 of fatal crashes in the United States in 2015 involved driver distraction and 14 of these fatal crashes involved reports of a cell phone as a distraction A recent study suggested that the number of deaths from motor vehicle crashes in which the driver was texting or talking on the phone is underreported6 The underreporting of driver cell phone use andor texting in crashes makes the distracted driving issue appear less significant than it actually is and impedes efforts to make tougher distracted driving laws
To better understand the attitudes and self-reported behaviors related to cell phone use texting and distracted driving NHTSA conducted the National Survey on Distracted Driving Attitudes and Behaviors in 2010 2012 and again in 2015 This report presents findings from the 2015 National Survey on Distracted Driving Specifically the 2015 NSDDAB assessed the extent to which drivers are distracted by various activities demographic and typological descriptions of drivers prone to distractions the extent and frequency of using cell phones and texting while driving attitudes and perceptions about distracted driving knowledge of and attitudes toward measures to deter distracted driving perceptions about the danger of distracted driving exposure to the consequences of distracted driving willingness to intervene when someone is distracted while driving and changes and trends in distracted driving behavior and attitudes since 2010
Methodology
A total of 6001 interviews were conducted among a nationally representative telephone sample of people 16 or older who had driven a motor vehicle To account for the current shift to cell phone use and the underrepresentation of younger people in samples using landline telephones a partial overlapping dual sampling frame of households with landline phones and households that relied only or mostly on cell phones together with a landline phone oversample of people 16 to 34 years old was used In all 3372 interviews were completed with people from landline households 2128 interviews with people from cell-phone-only or cell-phone-mostly households and an additional 501 interviews of people 16 to 34 were completed from the landline phone oversample The samples were combined and weighted to produce national estimates of the target population within specified limits of expected sampling variability from which valid generalizations can be made to the general population of drivers in the United States
The interviews were conducted from January 20 2015 to April 14 2015 Appendix B contains the complete description of the methodology and sample dispositions including information on the computation of weights
5 National Center for Statistics and Analysis (2017 March) Distracted driving 2015 (Traffic Safety Facts Research Note Report No DOT HS 812 381) Washington DC National Highway Traffic Safety Administration Available at httpscrashstatsnhtsadotgovApiPublicViewPublication812381 6 The National Safety Council (2013) Crashes involving cell phones Challenges of collecting and reporting reliable crash data Itasca IL Author Available at wwwnscorgDistractedDrivingDocumentsNSC-Under-Reporting-White-Paperpdf
8
The percentages presented in this report are weighted to accurately reflect the national population 16 or older Unweighted sample sizes (Ns) are included so that readers know the exact number of respondents answering a given question allowing them to estimate sampling precision
Percentages for some items may not add to 100 due to rounding or because the question allowed for more than one response In addition the number of cases involved in subgroup analyses may not sum to the grand total who responded to the primary questionnaire item being analyzed Reasons for this include some form of non-response on the grouping variable (eg ldquoDonrsquot Knowrdquo or ldquoRefusedrdquo) or use of only selected subgroups in the analysis
All tests for statistical significance were performed using the chi-square test An observed relationship is called statistically significant when the p-value for a chi-square test is less than or equal to 005
For rounding purposes all variables are rounded based on two decimal places Any value that had a decimal of 50 or greater was rounded up and any value that had a decimal below 50 was rounded down ldquoDonrsquot knowrdquo and ldquoRefusedrdquo answers were coded as valid answers but were not reported in the figures and tables of this report unless the sample size was greater than 50
9
CHAPTER 2 DESCRIPTION OF RESPONDENT POPULATION
To capture a sample of respondents representative of drivers 16 and older in the United States a landline cross section sample a landline oversample of respondents 16 to 34 and a cell phone sample were used (see Table 2-1) Of the 6001 survey respondents 3372 (56) were sampled from the landline cross section sample 501 from the landline oversample (8) and 2128 from the cell phone sample (35) The cell phone sample captured several groups often unreachable by landline phones Drivers 20 and younger comprise 12 of the cell phone sample and 22 of the cell phone sample are under 25 By contrast 3 of respondents in the landline cross section sample are under 25 The landline oversample captured more respondents in the younger age groups with 43 of respondents in the landline oversample being under 25
Table 2-1 Demographics by Sample Type ndash Unweighted
Cell Phone Sample
(N=2128)
Landline Cross Section
(N=3372)
Landline Oversample
(N=5017)
Total Sample (N=6001)
Gender Female 443 567 563 502 Male 557 433 437 498
Age Mean 3821 5643 2541 4595 16 to 20 124 18 300 82 21 to 24 97 10 126 59 25 to 34 260 40 553 170 35 to 44 180 147 00 159 45 to 54 144 233 00 179 55 to 64 109 229 00 159 65 or older 71 303 00 173
2014 Household Income Less than $10000 75 38 111 59 $10000 to $14999 55 39 95 49 $15000 to $24999 77 74 100 77 $25000 to $49999 208 189 174 198 $50000 to $99999 278 283 242 279 $100000 to$149999 112 134 63 120 $150000 to $199999 41 47 21 43 $200000 or more 43 46 32 44
7 There were 518 total respondents who completed the oversample survey but 17 reported that they were older than 34 Those respondents older than 34 are not included in the analysis
10
Table 2-1 Demographics by Sample Type ndash Unweighted (Continued)
Cell Phone Sample (N=2128)
Landline Cross Section
(N=3372)
Landline Oversample
(N=501)
Total Sample (N=6001)
Education No HS Degree 143 89 259 122 HS Graduate 253 268 270 260 Some College 328 312 291 320 College Graduate 156 165 101 159 Some Graduate School 17 14 16 15 Graduate Degree 96 138 58 114
Number of Children 15 or Younger in Household 0 599 731 405 652 1 to 3 370 245 553 319 4 or More 23 16 32 20
Ethnicity Hispanic 155 84 311 128 Not Hispanic 838 907 679 864
RaceEthnicity White 697 796 584 738 Black 119 92 126 107 Asian 55 41 44 48 American IndianAlaska Native
20 11 42 17
Native Hawaiian or other Pacific Islander
16 05 15 11
(VOL) Hispanic 100 45 195 78 Other 04 02 00 03
Homeowner Status Own 582 849 558 701 Rent 336 112 295 234 Some Other Arrangement 69 25 121 51
Frequency of Driving Everyday 730 617 683 678 Almost Everyday 122 183 122 149 Few Days a Week 108 162 138 133 Few Days a Month 26 31 42 29 Few Days a Year 12 05 16 09
Primary Type of Vehicle Car 570 561 574 566 VanMini-Van 58 89 137 74 SUV 188 190 132 187 Pickup Truck 160 148 142 154 Other Truck 15 06 11 11 Motorcycle 04 01 00 02 Other 05 04 11 05
For the remainder of this report all percentages that appear in figures and tables are based on the weighted data unless otherwise noted
11
CHAPTER 3 PHONE-RELATED DISTRACTED DRIVING
This chapter examines the use of cell phones for initiating and receiving calls texting and eshymailing messages and using smartphone applications The reasons respondents gave for engaging in this behavior is also explored Table 3-1 shows the proportion of respondents who own various devices that can distract drivers when operated while driving Among these ownership of cell phones is the highest at 908
Table 3-1 Ownership of Electronic Devices and Connectivity
Q3 Do you currently own any of the following Percent Yes
A cell phone (any cell phone including smartphone) 903
A lsquosmartphonersquo such as a Droid iPhone or Blackberry 664
A portable music player such as a CD player iPod or Zune 350
A portable navigation system such as TomTom or Garmin 320
A navigation system built into the vehicle such as Onstar or Sync 207 A Bluetooth or other hands-free device for your cell phone such as one that plugs into the phone works wirelessly or works through your vehiclersquos car stereo 500
Q3a1 Is the vehicle you drive most often equipped with built-in hands-free Bluetooth capability 283 Q3a2 Have you paired or ldquoconnectedrdquo your phone with the vehicle via Bluetooth 243
Base All respondents Unweighted N =6001 Only asked of respondents who reported owning a cell phone or smartphone Only asked of respondents who reported owning a Bluetooth or other hands-free device for their cell
phones
8 While 903 of respondents reported that they own ldquoA cell phonerdquo that percentage increases to 906 when respondents who reported owning ldquoA lsquosmartphonersquo such as a Droid iPhone or Blackberryrdquo are included
12
Figure 3-1 shows the proportion of respondents who own cell phones by their frequency of driving There was a statistically significant relationship between cell phone ownership and frequency of driving a vehicle where more frequent drivers were more likely to own cell phones Respondents who drove every day or almost every day are more likely to own cell phones than respondents who drove less frequently except for those who drove only a few days each year Ownership of cell phones is 94 among those who drove every day and 86 among those who drove almost every day Cell phone ownership for those driving a few days a week is 79 For those driving no more than a few days a month cell ownership is 77 Among those who drove least frequently (a few days a year) 9 in 10 owned a cell phone (89)
Figure 3-1 Cell Phone Ownership
by Frequency of Driving
937 857
790 774
893
0
20
40
60
80
100
Every Day Almost Every Few Days a Few Days a Few Days a (N=3913) Day Week Month Year
(N=971) (N=854) (N=193) (N=58)
Q1 How often do you drive a motor vehicle regardless of whether it is for work or for personal use Every day almost every day a few days a week a few days a month a few days a year or do you never drive Q3 Do you CURRENTLY own any of the following devices (plt0001) Base All respondents Unweighted N=See Figure
13
100
80
60
40
20
0
97 56
268
212
366
Always Almost Always Sometimes Rarely Never
When asked how often they answer an incoming cell phone call when driving 15 of respondents reported that they always or almost always answer the phone and 27 reported that they sometimes answer an incoming call while driving More than half (58) of respondents said that they rarely (21) or never (37) answer the phone while driving
Figure 3-2 Answer Phone While Driving
Q4d Irsquom going to read a list of common activities people do while driving For each activity Irsquod like you to tell me how often YOU do each while driving For each please tell me if you do the activity always almost always sometimes rarely or never How often do you answer phone calls Base All respondents Unweighted N=6001
14
100
80
60 562
40
20 166 137
69 48
0 Answer and Hand the Phone Answer and Answer and Pull Over to a Safe
Continue to Drive to a Passenger to Inform the Caller Promptly Pull Location First and While Completing Answer if You You will Call Back Over to a Safe then Speak to the the Conversation Have One Later Location Caller
More than half (56) of respondents who reported answering an incoming phone call while driving stated that they usually continue to drive while completing the conversation One in 7 (14) drivers usually informs the callers they will call them back later and 17 usually hand the phone to a passenger in the car Only 7 of respondents state that they pull over to a safe location after answering the phone while 5 report that they first pull over to a safe location and then answer the call
Figure 3-3 How Phone Calls Are Answered While Driving
Q5c When you answer a call while driving do you USUALLYhellip Base Respondents answering calls while driving at least rarely Unweighted N=3704
15
100
80
60
444
40
254 220
20
38 44
0 Always Almost Always Sometimes Rarely Never
When asked how often respondents make a phone call while driving nearly half of them (44) stated that they never make a phone call when driving Few respondents indicated that they always (4) or almost always (4) make a call while driving One-quarter (25) indicated that they sometimes make calls More than 1 in 5 (22) stated that they rarely do so
Figure 3-4 Make Phone Calls While Driving
Q4c Irsquom going to read a list of common activities people do while driving For each activity Irsquod like you to tell me how often YOU do each while driving For each please tell me if you do the activity always almost always sometimes rarely or never How often do you make phone calls Base All respondents Unweighted N=6001
16
100
80
60 513
449
40 329
288
206 20
0 Voice‐Dial Speed Dial or Scroll Through Manual Dialing Varies
(Speaking a Name Favorites Saved Numbers or Phone Number) and Select
When asked how they make a call while driving 51 of respondents report that they use voice dialing by saying the number or personrsquos name aloud into the microphone of the cell phone or their in-vehicle system (eg Sync Uconnect) About half mentioned using speed dial or the ldquofavoritesrdquo function on their phones (45) 33 mention selecting the number by scrolling through saved numbers and 29 mention manual dialing About 1 in 5 (21) said that their method of dialing varies
Figure 3-5 Method of Dialing Phone Number While Driving
Q6a Which of the following ways do you usually MAKE a call while driving Please answer Yes or No after I read each item Base Respondents making calls while driving at least rarely Unweighted N=3168 Respondents offering more than one response Unweighted N =1574
17
As shown in Table 3-2 the most commonly mentioned location for keeping a cell phone in the vehicle while driving was the pocket or purse mentioned by nearly half of respondents owning a cell or smartphone (44) Cup holder or tray was the second most cited location (25) The passenger seat (8) and built-in enclosed storage spaces (7) were mentioned by less than 1 in 10 respondents
Use of the cellrsquos speakerphone feature was cited most often (33) as the method used to make or receive calls while driving followed by use of a built-in car system (31) or holding the phone in onersquos hand (29) Another 1 in 5 mentioned using a hands-free earpiece such as a Bluetooth earpiece device (20) Thirteen percent reported their usual method varied Only 5 mentioned squeezing the phone between the ear and shoulder
Table 3-2 Location of Phone in Vehicle and Method of Answering
Q5 When not in use where do you put your cell phone while driving 9
Percent Yes
Pocket or purse 444
Cup holder or tray 245
Passenger seat 77
Built-in enclosed storage space 74
Console 61
Mount on dashboard 40
Lap 32
Attach to beltwaistband 18
Glovebox 17
Backseat 04
In hand 01
Q5a Which of the following do you usually do when making or receiving a call while driving
Percent Yes
Use the cell phonersquos speakerphone feature 325
Use a built-in car system (OnStar Sync built-in Bluetooth) 311
Hold the phone in your hand 292
Use a hands-free earpiece 197
It varies 131
Squeeze the phone between your ear and your shoulder 49 Base (Q5) Respondents owning a cell phone or smartphone Unweighted N=5593 Respondents offering more than one response Unweighted N=302 Base (Q5a) Respondents making or answering calls while driving at least rarely Unweighted N=3865 Respondents offering more than one response N=752
9 Respondents volunteered the answers to this question and were not read any answer options
18
Answer Calls Make Calls
334
338
99
250
359
495
473
405
327
336
404
439
199
366
429
547
568
495
397
421
Female (N=3062)
Male (N=2939)
65+ (N=1540)
55 to 64 (N=1155)
45 to 54 (N=968)
35 to 44 (N=696)
25 to 34 (N=892)
21 to 24 (N=281)
16 to 20 (N=345)
Total (N=6001)
0 20 40 60 80 100
Overall more than a third of respondents said they at least sometimes answer (42) or make (34) calls while driving Examining reports of answering and making calls while driving by shows that drivers 21 to 24 25 to 34 and 35 to 44 were more likely to indicate that they answer or make phone calls while driving More than half of respondents 25 to 34 (57) and 35 to 44 (55) stated that they answer calls while driving These two groups were also the most likely to at least sometimes make phone calls while driving (47 and 50 respectively) Among older drivers nearly 1 in 5 drivers 65 and older said they at least sometimes answer calls (20) while driving and 1 in 10 older drivers at least sometimes make calls (10) while driving While male and female drivers were equally likely to say they at least sometimes make phone calls while driving male drivers (44) were more likely to report answering phone calls when driving a vehicle than were female drivers (40)
Figure 3-6 Answer or Make Phone Calls While Driving by Age and Gender ( at Least Sometimes)
Q4cQ4d Irsquom going to read a list of common activities people do while driving For each activity Irsquod like you to tell me how often YOU do each while driving For each please tell me if you do the activity always almost always sometimes rarely or never Q4d How often do you take calls D1 What is your age (plt0001) SA3 Record gender from observation (p=0048)
Q4c How often do you make phone calls D1 What is your age (plt0001) SA3 Record gender from observation (p=0008) Base All respondents Unweighted N=See Figure
19
As mentioned in Figure 3-6 significant gender and age differences were found in making or answering calls while driving Tables 3-3 and 3-4 below provide age breakdowns by frequency of answering and making calls while driving Drivers in the 21-to-24 (20) 25-to-34 (22) and 35shyto-44 (21) age categories were more likely to always or almost always answer calls while driving than were drivers 55 to 64 (12) and 65 and older (7) The proportion of drivers indicating that they never make (75) or answer (61) calls is higher among 65+ year olds
Table 3-3 Answer Calls While Driving by Age and Gender
Q4d How often do you ANSWER calls while drivinghellip
N Always Almost Always
Sometimes Rarely Never
Total Respondents 6001 97 56 268 212 366 by Age Category
16- to 20-Year-Old Drivers 345 121 36 240 251 352 21- to 24-Year-Old Drivers 281 91 107 297 255 250 25- to 34-Year-Old Drivers 892 136 85 347 200 233 35- to 44-Year-Old Drivers 696 124 89 334 218 232 45- to 54-Year-Old Drivers 968 96 41 292 216 355 55- to 64-Year-Old Drivers 1155 77 39 250 209 423 65+-Year-Old Drivers 1540 46 27 126 187 612
by Gender Male Drivers 2939 106 59 274 211 349 Female Drivers 3062 88 54 262 213 382
D1 What is your age (plt0001) SA3Record gender from observation (p=0048) Base All respondents Unweighted N=See Table
Table 3-4 Make Calls While Driving by Age and Gender
Q4c How often do you MAKE calls while drivinghellip
N Always Almost Always
Sometimes Rarely Never
Total Respondents 6001 38 44 254 220 444 by Age Category
16- to 20-Year-Old Drivers 345 22 30 275 269 405 21- to 24-Year-Old Drivers 281 44 61 300 306 289 25- to 34-Year-Old Drivers 892 61 73 339 243 284 35- to 44-Year-Old Drivers 696 58 65 372 223 282 45- to 54-Year-Old Drivers 968 51 41 267 222 419 55- to 64-Year-Old Drivers 1155 22 29 199 203 546 65+-Year-Old Drivers 1540 06 15 78 155 746
by Gender Male Drivers 2939 45 41 252 232 430 Female Drivers 3062 32 46 256 207 459
D1 What is your age (plt0001) SA3 Record gender from observation (p=0008) Base All respondents Unweighted N=See Table
20
Table 3-5 lists the reasons why respondents are likely to answer an incoming call while driving The most common reason given is the identity of the person calling (36) followed by how important they think the call is (17) More than 1 in 10 drivers are likely to answer the phone if it is work-related (14) or in an emergency situation (14) while 9 state that they answer all calls received while driving Smaller percentages of drivers reported that they are likely to answer if the call is from someone they know (8) the call is personal or social (7) or the call is routine or expected (4) The next column in the table shows the reasons respondents gave for making calls on their cell phones while driving Almost one-third of respondents (28) stated that they are willing to make phone calls if they think it is important or urgent and 13 are willing to initiate a phone call if it is work related Almost 1 in 7 respondents stated that they are willing to make calls if they need directions or other information (13) to report a traffic crashemergency (12) or if itrsquos a personal or social call (11) Other reasons for making calls while driving included reporting a medical emergency (5) and whom the respondent was calling (6)
Table 3-5 Reasons for Answering and Making Phone Calls While Driving
Q5bQ6What are the reasons you are more likely to ANSWERMAKE a call while driving
Q5b ANSWER
Percent
Q6 MAKE Percent
Who isI am calling 364 62
How important I think the call is 172 278
Call is work-related 144 130
Urgentemergency situation 139 --
Report a traffic crashemergency -- 122
Report a medical emergency -- 48
I answer all calls 89 --
Call is from someone I know 80 --
Call is personal or social 72 113
Call is routine or expected 38 --
When Bluetoothhands-free technology is available 21 --
Related to scheduleplanslocation 08 69
Non-stressful traffic conditions 07 03
In need of directions or other information 06 134
Boredom 04 21
Call is unexpected 03 --
Call is from a number I dont recognize 03 --
Time of day 02 04
Personal safety 02 09
I think itrsquos safe to call -- 05
Base Q5bQ6 Respondents answeringmaking calls while driving at least rarely Unweighted N =37043168
21
Figure 3-7
Send or Read Text Messages or E-Mails While Driving
Send Read
100
800 80 748
60
40
20 137
113 86
63 10 16 12 14
0 Always Almost Always Sometimes Rarely Never
Figure 3-7 shows the respondentrsquos frequency of sending or reading text messages or e-mails when driving An overwhelming majority of respondents (80) said that they never send text messages or e-mails when they are driving a vehicle Two percent of respondents stated that they always or almost always do A sizable number of respondents occasionally send text messages or e-mails with 6 of respondents who reported they sometimes do and 11 who said they rarely send any messages while driving Reading text messages or e-mails while driving was slightly more common with 12 of respondents stating that they do at least some of the time and three quarters (75) stating that they never do so
Irsquom going to read a list of common activities people do while driving For each activity Irsquod like you to tell me how often YOU do each while driving For each please tell me if you do the activity always almost always sometimes rarely or never Q4f How often do you SEND text or e-mail messages Q4e How often do you READ text or e-mail messages Base All respondents Unweighted N=6001
22
Send Read
50
40
30 264
211 188 20 170
60
14 08
34 13
167 156
139 132 124 116 97 98
85 76 10 74
0 Total 16 to 20 21 to 24 25 to 34 35 to 44 45 to 54 55 to 64 65+ Male Female
(N=6001) (N=345) (N=281) (N=892) (N=696) (N=968) (N=1155) (N=1540) (N=2939) (N=3062)
Overall 1 in 10 (9) respondents send text messages or e-mails at least sometimes while driving Younger drivers were more likely to indicate that they at least sometimes send messages while operating a vehicle Drivers 21 to 34 (17) were the most likely to report sending text messages andor e-mails while driving More than 1 in 10 respondents 16 to 20 (14) and 35 to 44 (12) state that they have sent messages while operating a vehicle Among older drivers only 1 of those 55 or older indicated that they send messages while driving Male drivers were more likely than female drivers to say that they text or send e-mails while driving (10 versus 7) In regards to reading text messages younger drivers were the most likely to indicate that they at least sometimes read text messages while driving One quarter of those 21 to 24 (26) and 1 in 5 of those 16 to 20 (19) and 25-34 (21) indicated reading text messages at least sometimes while driving
Figure 3-8 Send or Read Text Messages or E-Mails While Driving
by Age and Gender ( at Least Sometimes)
Irsquom going to read a list of common activities people do while driving For each activity Irsquod like you to tell me how often YOU do each while driving For each please tell me if you do the activity always almost always sometimes rarely or never Q4f How often do you SEND text messages or e-mails D1 What is your age (plt0001) SA3 Record gender from observation (plt0001)
Q4e How often do you READ text messages or e-mails D1 What is your age (plt0001) SA3 Record gender from observation (plt0001) Base All respondents Unweighted N=See Figure
23
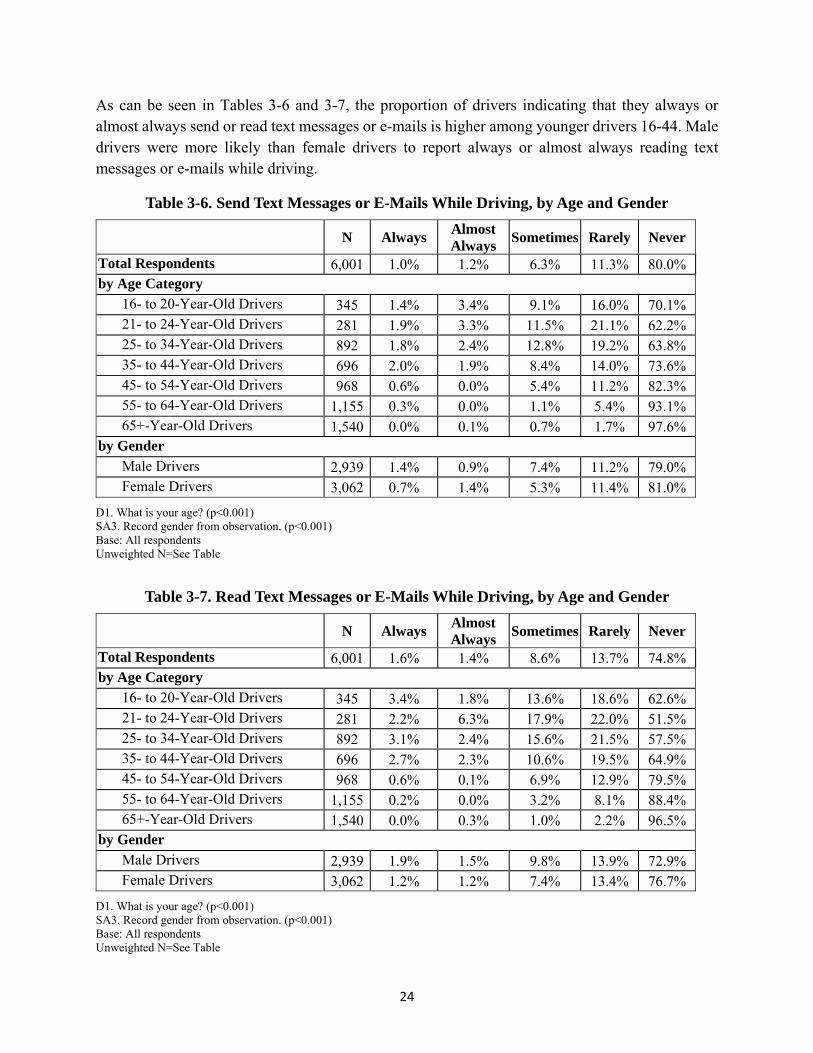
As can be seen in Tables 3-6 and 3-7 the proportion of drivers indicating that they always or almost always send or read text messages or e-mails is higher among younger drivers 16-44 Male drivers were more likely than female drivers to report always or almost always reading text messages or e-mails while driving
Table 3-6 Send Text Messages or E-Mails While Driving by Age and Gender
N Always Almost Always
Sometimes Rarely Never
Total Respondents 6001 10 12 63 113 800 by Age Category
16- to 20-Year-Old Drivers 345 14 34 91 160 701 21- to 24-Year-Old Drivers 281 19 33 115 211 622 25- to 34-Year-Old Drivers 892 18 24 128 192 638 35- to 44-Year-Old Drivers 696 20 19 84 140 736 45- to 54-Year-Old Drivers 968 06 00 54 112 823 55- to 64-Year-Old Drivers 1155 03 00 11 54 931 65+-Year-Old Drivers 1540 00 01 07 17 976
by Gender
Male Drivers 2939 14 09 74 112 790 Female Drivers 3062 07 14 53 114 810
D1 What is your age (plt0001) SA3 Record gender from observation (plt0001) Base All respondents Unweighted N=See Table
Table 3-7 Read Text Messages or E-Mails While Driving by Age and Gender
N Always Almost Always
Sometimes Rarely Never
Total Respondents 6001 16 14 86 137 748 by Age Category
16- to 20-Year-Old Drivers 345 34 18 136 186 626 21- to 24-Year-Old Drivers 281 22 63 179 220 515 25- to 34-Year-Old Drivers 892 31 24 156 215 575 35- to 44-Year-Old Drivers 696 27 23 106 195 649 45- to 54-Year-Old Drivers 968 06 01 69 129 795 55- to 64-Year-Old Drivers 1155 02 00 32 81 884 65+-Year-Old Drivers 1540 00 03 10 22 965
by Gender
Male Drivers 2939 19 15 98 139 729 Female Drivers 3062 12 12 74 134 767
D1 What is your age (plt0001) SA3 Record gender from observation (plt0001) Base All respondents Unweighted N=See Table
24
100
80
60
438
40
193 20 138
106 80
0 Wait Until You Use a Voice Continue to Drive Hand the Phone Pull Over to a Safe
Reach a Red Light Command Feature While Completing to a Passenger to Location to Send or Stop Sign to (Speech Dictation) the Message Do Your the Message
Send the Message Messaging
When asked how they send texts and e-mails while driving 44 of respondents stated that they wait until they arrive at a red light or stop sign About 1 in 5 (19) reported using a voice command feature and another 11 reported handing the phone to a passenger to send the text or e-mail About 1 in 6 (14) stated they continued to drive while sending the text or e-mail The least cited method for sending a text or e-mail when driving was pulling over to a safe location and then sending the message (8)
Figure 3-9 How Text Messages or E-Mails Are Sent While Driving
Q8 When you SEND a text message or e-mail while driving do you USUALLYhellip Base Respondents sending text messages or e-mails while driving at least rarely Unweighted N=1044
25
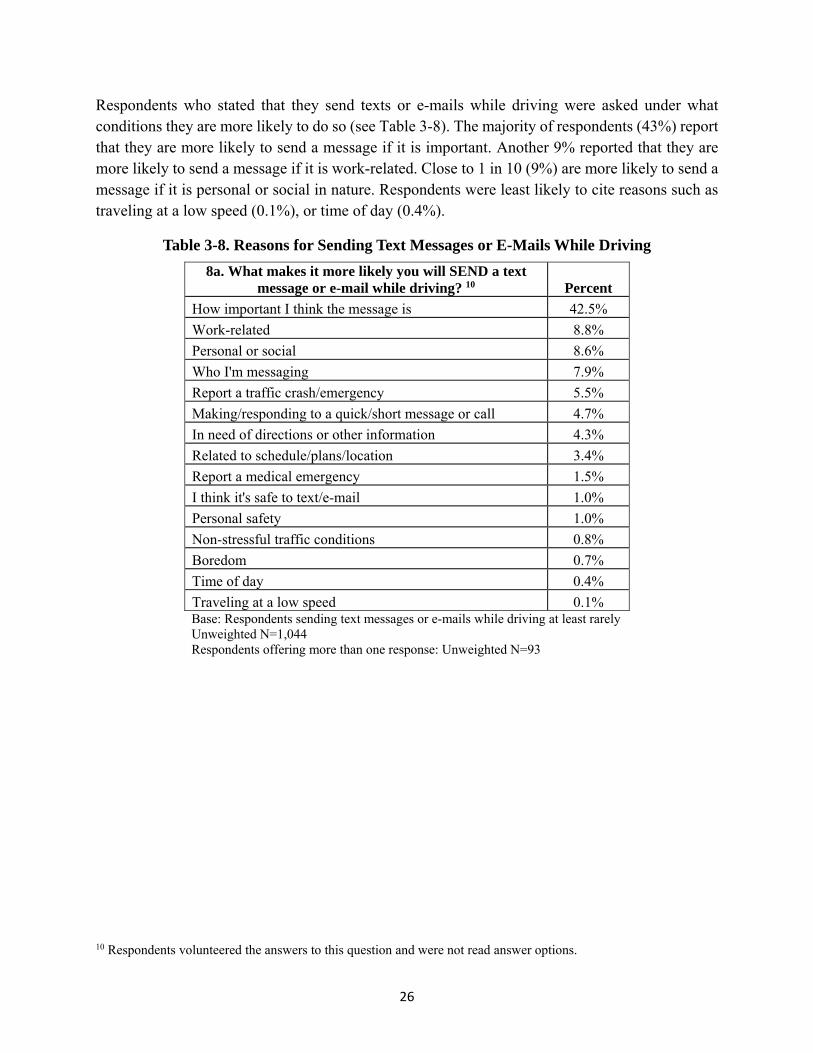
Respondents who stated that they send texts or e-mails while driving were asked under what conditions they are more likely to do so (see Table 3-8) The majority of respondents (43) report that they are more likely to send a message if it is important Another 9 reported that they are more likely to send a message if it is work-related Close to 1 in 10 (9) are more likely to send a message if it is personal or social in nature Respondents were least likely to cite reasons such as traveling at a low speed (01) or time of day (04)
Table 3-8 Reasons for Sending Text Messages or E-Mails While Driving
8a What makes it more likely you will SEND a text message or e-mail while driving 10 Percent
How important I think the message is 425
Work-related 88
Personal or social 86
Who Im messaging 79
Report a traffic crashemergency 55
Makingresponding to a quickshort message or call 47
In need of directions or other information 43
Related to scheduleplanslocation 34
Report a medical emergency 15
I think its safe to texte-mail 10
Personal safety 10
Non-stressful traffic conditions 08
Boredom 07
Time of day 04
Traveling at a low speed 01 Base Respondents sending text messages or e-mails while driving at least rarely Unweighted N=1044 Respondents offering more than one response Unweighted N=93
10 Respondents volunteered the answers to this question and were not read answer options
26
16 06
62 73
841
0
20
40
60
80
100
Always Almost Always Sometimes Rarely Never
When respondents were first asked about smartphone app usage while driving 8 stated they used apps at least sometimes while driving not including navigation apps (Respondents were later asked about which apps they used and how they used these apps while driving See Q9 Table 3shy10) Very few respondents reported always or almost always using smartphone apps when driving (2) Six percent reported they sometimes do and another 7 said rarely
Figure 3-10 Use Smartphone Apps While Driving
Q4n Irsquom going to read a list of common activities people do while driving For each activity Irsquod like you to tell me how often YOU do each while driving For each please tell me if you do the activity always almost always sometimes rarely or never How often do you use smartphone apps not including a navigation app Base All respondents Unweighted N=6001
27
50
40
30
20
10
0 Total 16 to 20 21 to 24 25 to 34 35 to 44 45 to 54 55 to 64 65+ Male Female
(N=6001) (N=345) (N=281) (N=892) (N=696) (N=968) (N=1155) (N=1540) (N=2939) (N=3062)
85 121 116
141 113
84
35 26
105
64
Examining reports of smartphone app use excluding navigation apps while driving by age and gender shows that younger drivers were more likely to indicate that they at least sometimes use apps while operating a vehicle More than 1 in 10 respondents (12) 16 to 20 and 21 to 24 and 14 of respondents 25 to 34 stated that they at least sometimes use apps while driving Eight percent of those in the 45-to-54 age group report that they at least sometimes use apps while driving Among older drivers only 4 of those 55 to 64 indicated that they at least sometimes use apps while driving Overall 9 of drivers reported using non-navigation apps at least sometimes while driving Males were more likely to report using apps at least sometimes while driving (11) than females (6)
Figure 3-11 Use Smartphone Apps While Driving
by Age and Gender ( at Least Sometimes)
Q4n Irsquom going to read a list of common activities people do while driving For each activity Irsquod like you to tell me how often YOU do each while driving For each please tell me if you do the activity always almost always sometimes rarely or never How often do you use smartphone apps not including a navigation app D1 What is your age (plt0001) SA3 Record gender from observation (plt0001) Base All respondents Unweighted N=See Figure
28
Examining differences in smartphone app use by age categories and gender reveals patterns similar to those found among drivers who text and send e-mails while driving Respondents in the 16- toshy20 (4) 21-to-24 (3) and 25-to-34 (4) categories were the most likely to state they always or almost always use apps while driving while almost all respondents over 55 reported they did not use apps while driving Male drivers (3) were more likely than female drivers (2) to say that they always or almost use smartphone apps while driving
Table 3-9 Use Smartphone Apps While Driving by Age and Gender
Q4n How often do you use Smartphone Apps while Drivinghellip
N Always Almost Always
Sometimes Rarely Never
Total Respondents 6001 16 06 62 73 841 by Age Category
16- to 20-Year-Old Drivers 345 30 10 81 95 781 21- to 24-Year-Old Drivers 281 17 17 82 127 758 25- to 34-Year-Old Drivers 892 31 09 101 109 746 35- to 44-Year-Old Drivers 696 23 13 76 101 787 45- to 54-Year-Old Drivers 968 14 01 69 69 847 55- to 64-Year-Old Drivers 1155 03 05 26 40 923 65+-Year-Old Drivers 1540 03 01 22 25 948
by Gender Male Drivers 2939 21 07 77 88 805 Female Drivers 3062 12 06 47 57 877
D1 What is your age (plt0001) SA3 Record gender from observation (plt0001) Base All respondents Unweighted N=See Table
29
100
80
60
40
20
0
361 351
100 71 62
Wait Until You Continue to Drive Hand Phone to a Pull Over to a Safe Use a Voice Reach a Red Light While Using the Passenger to Use Location to Use Command Feature or Stop Sign to App the App the App (Speech Diction)
Use App
When asked how they use apps while driving 36 of respondents mentioned waiting until they came to a red light or stop sign before using the app More than 1 in 3 (35) respondents stated that they continue to drive while using the app Using a voice command feature was the least cited method (6)
Figure 3-12 How Smartphone Apps Are Used While Driving
Q9a When you USE smartphone apps while driving do you USUALLYhellip Base Respondents using smartphone apps while driving at least rarely Unweighted N=460
30
Respondents were asked which apps they used when driving One-quarter (25) of respondents stated they use Pandora and 16 used other music or radio apps or podcasts Facebook was cited by 12 of respondents followed by Internet search engines (eg Internet Explorer Chrome Safari Google) (7) Instagram (7) and Snapchat (5) More than 1 in 5 respondents who use apps while driving cited multiple apps they typically use when driving
Table 3-10 Smartphone Apps Used While Driving
Q9 Other than navigation apps what smartphone apps do you typically use while driving
Percent
Pandora 249
Music apppodcastradio app 163
Facebook 123
InternetChromeSafariGoogle 72
Instagram 69
Snapchat 52
Twitter 40
Voice memotexting 39
Gas locationGas Buddy 38
Traffic alertsupdates apps 38
Weather related apps 38
E-MailGmaile-mail apps 37
YouTube 25
Game apps 21
News apps 19
Facebook Messenger 14
Shazam 07
Networking connecting with friendsfamily 06
LinkedIn 02
Skype 02
Other mentions (eg banking apps virtual assistant apps) 130
Base Respondents using smartphone apps while driving at least rarely Unweighted N =460 Respondents offering more than one response Unweighted N=102
31
Respondents who stated that they use apps while driving were asked under what conditions they are more likely to do so Just over one fifth of these respondents (21) report that they are more likely to use apps if they need directions or other information Another 12 reported they are likely to use an app for musicentertainment while 11 said boredom made it more likely they will use an app
Table 3-11 Reasons For Using Apps While Driving
9b What makes it more likely you will USE smartphone apps while driving 11 Percent
In need of directions or other information 212
For musicentertainment 122
Boredom 112
Personal or social 96
How important it isif urgent 90
Length of drive 56
Work-related 45
Non-stressful traffic conditions 53
Report a traffic crashemergency 21
Good weather conditions 12
Interaction not requiredvoice-activated 13
Time of day 12
Convenience 11
If no police officers are in sight 06
Traveling at a low speed 06
Report a medical emergency 21
Tired (using apps keeps me awake) 03
Personal Safety 01
Other 79
Base Respondents using smartphone apps while driving at least rarely Unweighted N=460 Respondents offering more than one response Unweighted N=28
11 Respondents volunteered the answers to this question and were not read answer options
32
Talking on the Phone Respondents were asked if their driving is any different when they are talking on a cell phone Overall nearly 6 in 10 respondents (57) believe that talking on the phone has no negative influence on their driving with 53 of respondents reporting that there is no difference in their driving and 4 who said that talking on the phone helps them be more focused or pay more attention on the road (Table 3-12) One in 5 respondents (20) indicated that talking on a cell phone while driving distracted them or made them not as aware of things Almost 1 in 8 respondents (12) reported that they drove more slowly when they were on the phone A small percentage noted that they may drift out of the lane or roadway (1) while on the phone
Sending Text Messages Respondents who sent text messages or e-mails while driving were asked how their driving was different when they were sending messages from their normal driving Overall one-third of respondents (36) think that sending text messages while driving has no negative influence on their driving with 31 of respondents reporting that they do not notice any difference and 4 who believe that texting helps them be more focused or pay more attention on the road (Table 3-12) One in 3 respondents (34) indicated that texting while driving distracts them or makes them not as aware of things About 1 in 8 (13) said they drive more slowly and 4 reported that they drift out of the roadway or lane while messaging
Using Apps Respondents who used apps while driving were asked how their driving was different when they were doing so A total of 56 of respondents think that using apps while driving has no negative influence on their driving 53 of drivers said that there is no difference in their driving and 3 stated that they are more focused or pay more attention to the road when they are using a smartphone app (Table 3-12) One in 5 respondents (21) indicated that using apps while driving distracts them or makes them not as aware of things About 1 in 12 drivers (8) said they drive more slowly while using apps
33
Table 3-12 Perceived Difference in Driving When Talking on a Cell Phone TextE-Mail Messaging and Using Apps
Q7Q8bQ9c How if at all would you say your driving is different when you are TALKING on the phone TEXTINGUSING APPS12
Q7 TALK Percent
Q8b TEXT
Percent
Q9c USE APPS
Percent
No difference 526 313 525
DistractedNot as aware of things 201 338 209
Drive slower 124 126 78
More focusedpay more attention 43 44 32
Drift out of the lane or roadway 12 42 34
Drive erraticallyless carefully 10 19 00
Look in your rear or side view mirrors more frequently 05 02 00
Drive faster 04 01 00
Change lanes less frequently 04 05 03
Avoid changing lanes altogether 03 02 05
Increase distance from lead vehicle 02 01 00
Look in your rear or side view mirrors less frequently 02 02 00
Apply the brakes suddenly 01 04 00
Change lanes more frequently 01 00 07
Use turn signals less frequently 01 01 00
Follow lead vehicle more closely 00 01 00
Base (Q7) Respondents making or answering calls while driving at least rarely Unweighted N =3865 Respondents offering more than one response Unweighted N=111 Base (Q8b) Respondents sending text messages or e-mails while driving at least rarely Unweighted N=1044 Respondents offering more than one response Unweighted N=45 Base (Q9c) Respondents using smartphone apps while driving at least rarely Unweighted N=460 Respondents offering more than one response Unweighted N=1
12 Respondents volunteered the answers to these questions and were not read answer options
34
Respondents were asked how their driving behavior was different when talking on a cell phone sending a message or using apps When talking on a cell phone two-thirds (64) reported turning down the radio while two-fifths reported asking others in the vehicle to be quiet (40) andor driving with one hand on the wheel (40) ldquoTurn the radiomusic downrdquo and ldquoask others in the vehicle to be quietrdquo were two behaviors most frequently cited together when respondents are trying to answer or make a phone call while driving Of those drivers who send messages while driving more than half of them (55) report driving with one hand on the wheel and 39 put down their food or drink so they can send messages Nearly half of those using smartphone apps while driving will drive with one hand on the wheel (45) while close to a third (30) will put down food or drink to do so ldquoTurn the radiomusic downrdquo and ldquodrive with one hand on the wheelrdquo were the two behaviors most frequently cited together when respondents use apps while driving
Table 3-13 Behavior Differences in Vehicle When Talking on a Cell Phone TextE-Mail Messaging and Using Apps
Q7aQ8cQ9d How if at all does TALKINGTEXTINGUSING APPS change your behavior in the vehicle13
Q7a TALK Percent
Q8c TEXT
Percent
Q9d USE APPS
Percent
Turn the radiomusic down 638 259 236
Ask others in the vehicle to be quiet 403 155 135
Drive with one hand on the wheel 404 553 452
Put down food or drink 368 391 295
No differencesmy behavior doesnrsquot change 155 166 268
Drive with only your knee on the wheel 37 60 50
Base (Q7a) Respondents making or answering calls while driving at least rarely Unweighted N=3865 Respondents offering more than one response Unweighted N=1959 Base (Q8c) Respondents sending text messages or e-mails while driving at least rarely Unweighted N=1044 Respondents offering more than one response Unweighted N=391 Base (Q9d) Respondents using smartphone apps while driving at least rarely Unweighted N=460 Respondents offering more than one response Unweighted N=135
13 Respondents volunteered the answers to these questions and were not read answer options
35
Respondents were asked if there were any driving situations in which they would never talk on the phone send a text or e-mail message or use a smartphone app while driving Bad weather was the most commonly cited reason for not using a phone while driving About 4 in 10 drivers said they would never talk on the phone (40) send text messages or e-mails (39) or use apps (34) when they are driving in bad weather The second most commonly cited driving situation for all three cell phone usages was bumper to bumper traffic About 1 in 5 drivers said they wouldnrsquot talk on the phone (20) or text (20) if they are driving in bumper to bumper traffic and 15 said that they would not use apps in this situation
Table 3-14 Driving Situations Respondent Not Likely to Talk on Phone TextE-Mail Message or Use Apps
Q7bQ8dQ9e Is there any driving situation in which you would NEVER TALKTEXTUSE APPS while driving
Q7b TALK Percent
Q8d TEXT
Percent
Q9e USE APPS
Percent
Bad weather 403 392 343
Bumper to bumper traffic 196 197 148
Fast moving traffic (freeway) 173 185 137
When I see a police officer 60 78 74
No timeI always use my cell when I want to 49 30 103
When moving (not at stop signs or stop lights) 46 123 62
Driving in unfamiliar arearoads 40 32 24
Marked construction zones 40 26 21
Accidentemergency vehicles around 39 22 19
Driving at nighttime 24 31 35
With a baby or child on board 22 47 24
Merging with traffic 21 21 07
With other adult passengers in the car 16 23 39
Marked school zones 13 22 12
Windingcurving roads 09 12 05
Driving in a familiar route 08 06 03
On long trips 05 02 00
When driving in a place where it is prohibited 03 03 08
On an empty roadway 02 01 01
Residential streets 02 01 03
On short trips 01 00 13
Parking lots 01 00 00
Base (Q7b) Respondents making or answering calls while driving at least rarely - Unweighted N=3865 Respondents offering more than one response Unweighted N=942 Base (Q8d) Respondents sending text messages or e-mails while driving at least rarely - Unweighted N=1044 Respondents offering more than one response Unweighted N=267 Base (Q9e) Respondents using smartphone apps while driving at least rarely - Unweighted N=460 Respondents offering more than one response Unweighted N=108
36
CHAPTER 4 PERCEPTIONS OF SAFETY OF DISTRACTED DRIVING
This chapter examines the respondentsrsquo assessment of safety in a variety of situations in which they are passengers in vehicles operated by drivers who are engaged in other activities while driving All respondents were asked how safe they would feel as a passenger if the driver were to engage in certain activities (Table 4-1) Almost all respondents stated that they would feel very unsafe if their drivers were watching a movie (97) or using a laptop computer (96) while operating the vehicle A large majority of respondents stated that they would feel very unsafe if the driver was sending (86) or reading (81) text messages or e-mails Two-thirds of respondents (66) said that they would feel very unsafe if their drivers used a smartphone app while driving and about 2 in 5 respondents (42) said they would feel very unsafe if the driver was talking on the cell phone with the phone in hand In addition 40 of respondents would feel very unsafe if the driver was manipulating the navigation system for driving directions while driving
Table 4-1 Perceived Safety as Passenger
Q11 How safe would you feel if the driver was tohellip
Very Unsafe
Somewhat Unsafe
A Little Less Safe
Safe
Talk to other passengers in the vehicle 58 99 202 632
Eat or drink 143 204 367 279
Talk on a cell phone while holding the phone 419 228 248 100
Talk on a cell phone with a hands-free device 111 189 230 465
Read e-mails or text messages 810 119 54 13
Send text messages or e-mails 862 84 36 14
Talk or interact with children in the vehicle 167 297 242 283
Adjust the car radio tapes or CD player 103 263 246 383
Use a laptop computer 959 26 07 04
Manipulate a navigation system for driving directions
398 331 185 75
Use smartphone apps not including a navigation app
663 211 85 28
Watch a movie 967 16 07 06
Base All respondents Unweighted N=6001
37
50
40 370
358
30
237
20
10
0 0 1 to 3 4 or more
(N=4114) (N=1706) (N=122)
Figure 4-1 shows that respondents who have children under 16 in the household are more likely than those without children of that age in the household to feel safe in a car when the driver is interacting with children in the vehicle Among respondents with one to three children under 16 37 indicated that they would feel safe while those with four or more children were slightly less likely to feel safe (36) Among those without any children under 16 in the household 24 indicated they would feel safe in a car if the driver was interacting with children in the vehicle
Figure 4-1 Respondents Who Feel Safe When Driver Is TalkingInteracting to Children in the Vehicle
by Number of Children in the Household
Q11g Now Irsquom going to read a list of things people sometimes do while driving Tell me how safe you would feel if you were a passenger riding in a car while your driver was doing the following For each please tell me if you would feel very unsafe somewhat unsafe a little less safe or safe ndash no problem ndash would not pay any more attention g Talking or interacting with children in the vehicle D3 How many children 15 or younger are living in your household at least half of the time or consider it their primary residence (plt0001) Base All respondents Unweighted N=See Figure
38
Each respondent was asked whether they would intervene if their driver was talking on a handheld cell phone while driving When looking at the results it is apparent that the likelihood of intervening varies depending on age and gender Younger drivers tend to be less likely to intervene if a driver is talking on the phone with 37 of 16- to 24-year-olds saying that it would be very likely they would intervene Conversely half of all drivers over 45 reported they would very likely intervene in this situation In regards to gender males are less likely to intervene than females with 42 of males indicating they would very likely do so compared to 51 of females
Table 4-2 How Likely Are You to Intervene if the Driver Is Talking on a Cell Phone While Holding the Phone by Age and Gender
How likely are you to intervene ifhellip
N Very
Likely Somewhat
Likely Somewhat Unlikely
Very Unlikely
Never Would
Intervene Total Respondents 6001 466 201 127 114 85
by Age Category
16- to 20-Year-Old Drivers 345 372 267 119 103 139
21- to 24-Year-Old Drivers 281 365 209 170 135 121
25- to 34-Year-Old Drivers 892 419 202 146 123 107
35- to 44-Year-Old Drivers 696 447 201 136 117 95
45- to 54-Year-Old Drivers 968 505 192 126 109 61
55- to 64-Year-Old Drivers 1155 552 175 96 116 54
65+-Year-Old Drivers 1540 489 199 122 108 69 by Gender
Male 2939 422 199 137 137 95
Female 3062 510 201 118 92 75
Q12 How likely are you to do or say something to your driver if theyrsquore TALKING on a handheld cell phone while driving D1 What is your age (plt0001) SA3 Record gender from observation (plt0001) Base All respondents Unweighted N=See Table
39
Table 4-3 shows the likelihood of intervention by age and gender if they are passengers in a vehicle in which the driver is sending text messages or e-mails while driving Overall 87 of respondents stated that they were at least somewhat likely to intervene if they were sending e-mails or text messages Like the previous results younger drivers tend to be less likely to intervene if a driver is sending text messages while driving with 66 of drivers 16 to 20 and 63 of those 21 to 24 saying that they would be very likely to intervene compared to 81 of 45- to 54-year-olds and 85 percent of 55- to 64-year-olds In regards to gender males are less likely to intervene than females with 71 of males indicating they would compared to 79 of females
Table 4-3 How Likely Are You to Intervene if the Driver Is Sending Text Messages or E-Mails While Driving by Age and Gender
How likely are you to intervene ifhellip N Very
Likely Somewhat
Likely Somewhat Unlikely
Very Unlikely
Never Would
Intervene Total Respondents 6001 752 122 47 43 28 by Age Category
16- to 20-Year-Old Drivers 345 656 180 85 12 67
21- to 24-Year-Old Drivers 281 625 179 107 50 39
25- to 34-Year-Old Drivers 892 674 194 56 43 32
35- to 44-Year-Old Drivers 696 753 125 48 48 21
45- to 54-Year-Old Drivers 968 807 106 27 33 23
55- to 64-Year-Old Drivers 1155 853 61 20 44 13
65+-Year-Old Drivers 1540 774 79 45 59 28 by Gender
Male 2939 714 133 59 52 35
Female 3062 791 111 36 35 22
Q13 How likely are you to do or say something to your driver if theyrsquore SENDING TEXT MESSAGES OR E-MAILS OR USING SMARTPHONE APPS while driving D1 What is your age (plt0001) SA3 Record gender from observation (plt0001) Base All respondents Unweighted N=See Table
40
100
80
60
40
20
0
652
573
642 655 717
654 676
604
282 316 322
299 240
280 267 292
46 105
30 27 22 52
27 73
0‐2 secs 3‐6 secs 7+ secs
Total 16‐20 21‐24 25‐34 35‐44 45‐54 55‐64 65+ (N=6001) (N=345) (N=281) (N=892) (N=696) (N=968) (N=1155) (N=1540)
Every time drivers take their eyes off the road to use a cell phone they increase the chance of putting their lives and the lives of others in danger When asked how many seconds respondents believe a driver could take his or her eyes off the road before it becomes significantly more dangerous the majority of respondents gave an answer between 0 and 2 seconds Younger respondents were slightly more likely than older respondents to give an answer between 3 and 6 seconds with 32 of respondents 16 to 20 and 21 to 24 giving an answer between 3 and 6 seconds and 29 of respondents 65 and older doing so Less than a quarter of respondents (24) 35 to 44 reported 3- to 6-seconds before it becomes significantly more dangerous More than 1 in 10 respondents 16 to 20 (11) believe that it only becomes more dangerous for a driver to take his eyes off the road after 7 or more seconds
Figure 4-2 Number of Seconds a Driver Can Safely Take HisHer Eyes Off the Road by Age
Q10 How many seconds do you believe a driver can take his eyes off the road before driving becomes significantly more dangerous D1 What is your age (plt0001) Base All respondents Unweighted N=See Figure
41
0‐2 secs 3‐6 secs 7+ secs
100
80
677652
625 60
40
299
20
54
0
282 265
46 38
Total Male Female (N=6001) (N=2939) (N=3062)
There are slight differences between male and female drivers regarding how long they think a driver can take hisher eyes off the road before the situation becomes significantly more dangerous Females are more likely than males to report a longer amount of time that can be considered safe with 30 of females saying 3 to 6 seconds and another 5 saying more than 7 seconds while 27 of males report 3 to 6 seconds and 4 report 7 or more seconds
Figure 4-3 Number of Seconds a Driver Can Safely Take HisHer Eyes Off the Road
by Gender
Q10 How many seconds do you believe a driver can take his eyes off the road before driving becomes significantly more dangerous QSA3 Record gender from observation (plt0001) Base All respondents Unweighted N=See Figure
42
Answering Calls Making Calls Texting
100
813 782 80
710
60
40
246
173 20 151
25 27 31
0 Increased Decreased Stayed the Same
CHAPTER 5 CHANGES IN CELL PHONE-RELATED DISTRACTED DRIVING
To assess whether driversrsquo cell-phone-related distracted driving behavior is changing over time respondents were asked if the frequency with which they make or receive calls or send text messages or e-mails while driving has changed in the past 30 days The vast majority of respondents stated that the frequency with which they receive (81) or make (78) calls or text (71) is the same now as it was in the past 30 days Fewer than 1 in 30 respondents (3) said that they are making receiving calls or texting more often One quarter of respondents (25) reported texting less often Respondents who had sent a text message or e-mail while driving reported a comparatively larger decrease in the frequency with which they had done so in the past 30 days than respondents who have placed or received a call while driving reported in the past 30 days
Figure 5-1 Has Your Frequency of Cell Phone Use While Driving
Increased Decreased or Stayed the Same
Q15 In the past 30 days has your frequency of answering phone calls while driving increased decreased or stayed the same Base Respondents who accept phone calls while driving - Unweighted N=3649 Q14 In the past 30 days has your frequency of making phone calls while driving increased decreased or stayed the same Base Respondents That Make Phone Calls While Driving Unweighted N=3168 Q16 In the past 30 days has the frequency with which you send and receive text messages or e-mails while driving increased decreased or stayed the same Base Respondents That Send Text Messages or E-Mails While Driving Unweighted N=965
43
Table 5-1 lists the reasons for the decrease in using a cell phone while driving given by respondents who reported a decrease in cell phone use while driving in the past 30 days Overall the most frequent reasons given for answering their cell phones less often while driving were they were not receiving as many calls as before (22) and an increased awareness of safety (21) An increased awareness of safety (22) was also the most often cited reason for making fewer phone calls while driving Similarly more than 1 in 4 respondents (26) cited an increased awareness of safety for texting less often while driving One in 5 (19) mentioned not being as busy
Table 5-1 Reasons for Decrease in Using Cell Phone While Driving
Q14a15a16a Why did your frequency of answeringmaking phone callssendingreceiving text messages or e-mails while driving decrease14
Answering Calls
Making Calls
Texting
Less usebusyless people calltexthave number 217 190 187
Increased awareness of safety 212 221 263
Driving lessnot on the road as much 108 128 90
The weather 88 83 59
Phone issues (all mentions) 50 34 42
Law that bans cell phone use 45 45 39
Familychildren in the car 34 38 26
Job related (work lesslost jobdont get as many work calls) 31 28 27
Less use due to familyrelationship changes 18 22 43
Was in a crash 16 16 03
Dont want to get a ticket 10 03 04
Influencepressure from others 09 14 16
Nothingno specific reason 05 07 07
Driving faster 02 01 04
Other reasons 62 71 84
Answering calls Base Respondents whose frequency of answering phone in vehicle decreased Unweighted N=539 Making calls Base Respondents whose frequency of making phone calls in vehicle decreased Unweighted N=542 Texting Base Respondents whose use of texte-mail in vehicle has decreased Unweighted N=247
14 Respondents volunteered the answers to these questions and were not read answer options
44
Yes 460
Yes probably 106
Not Sure 156
CHAPTER 6 DISTRACTED DRIVING LAWS AND STOPPED FOR DISTRACTED DRIVING
Respondents were asked a series of questions about their knowledge and support of laws banning cell phone use or sending and reading text messages and e-mails while driving They were also asked about their perception of the likelihood of receiving a ticket for talking on a cell phone or sending text messages or e-mails while driving
Overall 57 of respondents reported that their State has a law banning talking on a handheld cell phone while driving with 46 of respondents stating that their State has such a law and 11 stating that their State ldquoprobablyrdquo has such a law More than 1 in 4 respondents (28) stated that their State has no such law while an additional 16 were not sure
Figure 6-1 Does Your State Have a Law Banning Talking on a Handheld Cell Phone While Driving
No 278
Q17 Does [STATE] have a law banning talking on a handheld cell phone while driving Base All respondents Unweighted N=6001
45
Yes 832
Yes probably 80
No 37
Not Sure 50
Yes 286
Yes probably 118
No 390
Not Sure 205
Respondentrsquos State Has a Law N=1878
Respondentrsquos State Does NOT Have a Law N=4123
Examining the responses for States with and without laws banning talking on handheld cell phones while driving Figure 6-2 shows that in States with such laws 83 of respondents are aware of the law 8 think the State probably has such a law 4 report that the State does not have the law and 5 are not sure
In States without laws banning talking on handheld cell phones while driving 39 of respondents are aware that their State does not have such a law Nearly one-third (29) stated that the State had a law 12 think that the State probably has such a law and 21 are not sure
Figure 6-2 Does Your State Have a Law Banning Talking on a Handheld Cell Phone While Driving
by Actual State Law
Q17 Does [STATE] have a law banning talking on a handheld cell phone while driving Base All respondents Unweighted N=See Figure States that had handheld cell phone bans at the time of survey CA CT DE DC HI IL MD NV NJ NY OR VT WA WV
46
50
40
30 270 265
224 209
20
10
31
0 Very Likely Somewhat Likely Somewhat Very Unlikely Not Sure
Unlikely
Respondents who believed they lived in States with laws banning handheld use of cell phones while driving were asked about their perceived likelihood of a driver who frequently uses hisher cell phone receiving a ticket for this infraction in the next 6 months Overall 54 of respondents thought that the driver was likely to get a ticket and 43 stated that it was unlikely that the driver would be ticketed Nearly 3 in 10 respondents (27) thought it was very likely and 27 of respondents thought it was somewhat likely that the driver would be ticketed More than 1 in 5 respondents thought it was very unlikely (22) or somewhat unlikely (21) that the driver would be ticketed A small percentage of respondents (3) were not sure
Figure 6-3 Likelihood of Ticket for Talking on a Cell Phone While Driving
Q17a Assume that over the next 6 months someone frequently TALKS on a handheld cell phone while driving How likely do you think that person would be to receive a ticket for talking on a cell phone while driving Base Respondents that live in a State that bans talking on a cell phone while driving Unweighted N=4383
47
100
80
60
40
20
0
401
170
292
211 269
230 203
239 191 176 169
283
No HS Degree (N=399) High School Graduate (N=1194) Some College (N=1088) College Graduate (N=859) Some Graduate School (N=95) Graduate Degree (N=699)
Very Likely Very Unlikely
Respondentsrsquo perceptions of the likelihood of a frequent cell phone user receiving a ticket in the next 6 months in States with laws banning handheld cell phone use were examined by the education level of respondents Figure 6-4 shows a clear pattern where respondents with less formal education are more likely to believe that the driver will receive a ticket and respondents with more formal education are more likely to state that the driver will not receive a ticket Two out of 5 respondents (40) with no high school degree believe that the driver is very likely to receive a ticket compared with 17 with a graduate degree Conversely only 17 of respondents without a high school degree believe that the driver is very unlikely to be ticketed compared with 28 of respondents with graduate degrees
Figure 6-4 Likelihood of Ticket for Talking on a Cell Phone While Driving by Highest Level of School
Completed
Q17a Assume that over the next 6 months someone frequently TALKS on a handheld cell phone while driving How likely do you think that person would be to receive a ticket for talking on a cell phone while driving D6 What is the highest grade of year of regular school you have completed (plt0001) Base Respondents who reported living in a State that bans talking on a cell phone while driving Unweighted N=See Figure
48
Yes 872
No 118
Dont know 10
Yes 672
No 298
Dont know 28
Respondentrsquos State Has a Law N=1878
Respondentrsquos State Does NOT Have a Law N=4123
All respondents were asked whether they support a State law that bans talking on a handheld cell phone while driving The majority of respondents (74) were in favor of such a law regardless of whether their State had a ban However respondents who live in States that do not have a ban on talking on a handheld cell phone while driving were more likely to oppose a ban than respondents living in States that already have a ban (30 versus 12)
Figure 6-5 Do You Support a Law Banning Talking on a Handheld Cell Phone While Driving
Q19 Do you support a State law banning talking on a handheld cell phone while driving Base All respondents Unweighted N=See Figure
49
100
80
60
40
20
0
736
646 648 633 688
764 795
872
697
773
Total 16‐20 21‐24 25‐34 35‐44 45‐54 55‐64 65+ Male Female N=6001 N=345 N=281 N=892 N=696 N=968 N=1155 N=1540 N=2939 N=3062
Figure 6-6 shows support for a State law banning talking on a handheld cell phone while driving by respondent gender and age Support for such a law increases with the age of the respondents The oldest respondents were more likely to support a State law banning handheld phone while driving (87) than were the youngest drivers (65) More than three-quarters of female respondents (77) were in favor of a State law banning talking on a handheld cell phone while driving while males (70) were less likely to support such a ban
Figure 6-6 Support for Law Banning Talking on a Handheld Cell Phone While Driving
by Age and Gender ( Yes)
Q19 Do you support a State law banning talking on a handheld cell phone while driving D1 What is your age (plt0001) SA3 Record gender from observation (plt0001) Base All respondents Unweighted N=See Figure
50
Respondents who stated that they supported a ban on talking on a handheld cell phone while driving or who were unsure whether they supported such a ban were asked how much they thought the fine should be for talking on a handheld cell phone while driving Older respondents were more likely to favor higher fines than were younger respondents Respondents 16 to 20 had the lowest mean amount with $201 while respondents 45 to 54 had the highest mean amount with $273 Male respondents ($232) had a lower mean amount than female respondents ($254)
Figure 6-7 Average Fine for Talking on Handheld Cell Phone While Driving
by Age and Gender
$24369
$20107 $21381
$25291 $23890
$27345
$25420
$22731 $23241
$25415
$0
$50
$100
$150
$200
$250
$300
Total 16‐20 21‐24 25‐34 35‐44 45‐54 55‐64 65+ Male Female N=3994 N=212 N=171 N=547 N=450 N=633 N=808 N=1112 N=1869 N=2125
Q19a What do you think the fine should be for talking on a handheld cell phone while driving D1 What is your age SA3 Record gender from observation Base Respondents who support a ban on talking on a cell phone while driving Unweighted N=See Figure
51
Respondents were asked whether their State has a law that bans sending text messages or e-mails while driving More than half of respondents (62) reported that their State has such a law 14 percent thought their State probably has such a law and 9 percent stated that their State does not have a law that bans sending electronic messages while driving Fourteen percent of respondents were unsure if their State has such a law
Figure 6-8 Does Your State Have a Law Banning Texting or E-Mailing While Driving
Yes 624
Yes probably 138
No 93
Not Sure 144
Q18 Does [STATE] have a law banning TEXTING OR E-MAILING while driving Base All respondents Unweighted N=6001
52
Yes 643
Yes probably 137
No 82
Not Sure 137
Yes 362
Yes probably 148
No 245
Not Sure 243
Respondentrsquos State Has a Law N=5629
Respondentrsquos State Does NOT Have a Law
N=372
Figure 6-9 Does Your State Have a Law That Bans Sending Electronic Messages While Driving
by Actual State Law
Q18 Does [STATE] have a law banning TEXTING OR E-MAILING while driving Base All respondents Unweighted N=See Figure (plt0001) States that didnrsquot have a texting ban for all drivers at the time of survey AZ MO MS MT OK
Figure 6-9 shows driverrsquos awareness of State laws banning texting or e-mailing while driving by whether or not their State has such a law at the time of the survey 45 States and the District of Columbia had a law banning texting or e-mailing while driving for all drivers In States with laws banning texting or e-mailing 64 of respondents knew about the law 14 thought that the State probably had such a law 14 were not sure and 8 stated that their State did not have such a law
In States without a law banning texting or e-mailing while driving 25 of respondents were aware that there was no such law many believed that their State had (36) or probably had (15) such a law and 24 were not sure
53
295
263
201 217
24
0
10
20
30
40
50
Very Likely Somewhat Likely Somewhat Very Unlikely Not Sure Unlikely
Respondents who reported living in a State with laws banning texting or e-mailing while driving were asked about their perception of the likelihood of a driver receiving a ticket for this infraction in the next 6 months Slightly more respondents believe it is likely that the driver would receive a ticket (56) while 42 think it would be somewhat (20) or very (22) unlikely
Figure 6-10 Likelihood of Ticket for Sending Text Messages or E-Mails While Driving
Q18a Assume that over the next 6 months someone frequently sends text messages or e-mails while driving How likely do you think that person would be to receive a ticket for sending text messages or e-mails while driving Base Respondents who report living in a State that bans sending messages while driving Unweighted N=5458
54
100
80
60
40
20
0
479
165
328
194
289
211 205 248
200 200182
273
No HS Degree (N=460) High School Graduate (N=1463) Some College (N=1350) College Graduate (N=1126) Some Graduate School (N=119) Graduate Degree (N=876)
Very Likely Very Unlikely
Nearly one half of respondents (48) with no high school degree believe that a driver is very likely to receive a ticket if they frequently send text messages while driving compared with 18 with a graduate degree Conversely only 17 of respondents without a high school degree believe that the driver is very unlikely to be ticketed compared with 27 of respondents with graduate degrees
Figure 6-11 Likelihood of Ticket for Sending Text Messages or E-Mails While Driving
by Highest Level of School Completed
Q18a Assume that over the next 6 months someone frequently SENDS TEXT MESSAGES OR E-MAILS while driving How likely do you think that person would be to receive a ticket for talking on a cell phone while driving D6 What is the highest grade of year of regular school you have completed (plt0001) Base Respondents who reported living in a State that bans sending messages while driving Unweighted N=See Figure
55
Yes 919
No 73
Not Sure 08
Yes 892
No 93
Not sure 12
Respondentrsquos State Has a Law N=5629
Respondentrsquos State Does NOT Have a Law N=372
Respondents were asked whether they would support a State law that bans texting or e-mailing while driving The overwhelming majority of respondents (92) were in favor of a law that bans sending electronic message while driving However respondents who live in States without such a ban were slightly more likely to oppose a ban than respondents living in a State that already has one (9 versus 7)
Figure 6-12 Do You Support a Law Banning Texting or E-Mailing While Driving
Q19b Do you support a State law banning texting or e-mailing while driving Base All respondents Unweighted N=See Figure
56
Figure 6-13 Support for Law Banning Texting or E-Mailing While Driving by Age and Gender ( Yes)
917 870 879 888 895
932 900
933 961 949100
80
60
40
20
0 Total 16‐20 21‐24 25‐34 35‐44 45‐54 55‐64 65+ Male Female
N=6001 N=345 N=281 N=892 N=696 N=968 N=1155 N=1540 N=2939 N=3062
Figure 6-13 shows support for a State law banning text or e-mail messaging or using smartphone apps while driving by respondent gender and age Support for such a law increases with the age of the respondents The oldest respondents were more likely to support a State law banning texting while driving (96-95) than were the youngest drivers (87) Female respondents (93) were slightly more likely than male respondents (90) to be in favor of a State law
Q19b Do you support a State law banning text or e-mail messaging or using smartphone apps while driving D1 What is your age (plt0001) SA3 Record gender from observation (plt0001) Base All respondents Unweighted N=See Figure
57
$30205 $27816
$24358
$28001 $29555
$36605
$32892
$29951 $28492
$31876
$0
$50
$100
$150
$200
$250
$300
$350
$400
Total 16 to 20 21 to 24 25 to 34 35 to 44 45 to 54 55 to 64 65+ Male Female N=4937 N=283 N=233 N=744 N=576 N=799 N=979 N=1248 N=2398 N=2539
Respondents who supported a ban on sending text messages or e-mails while driving or who were unsure whether they supported such a ban were asked what the average fine should be for sending text messages or e-mails while driving Overall younger respondents favored lower average fines than older respondents Respondents 21 to 24 suggested the lowest average fine at $244 and respondents 45 to 54 suggested the highest at $366 Male respondents ($285) had a lower mean amount than female respondents ($319)
Figure 6-14 Average Fine for Sending Text Messages or E-Mails While Driving
by Age and Gender
Q19c What do you think the fine should be for sending text messages or e-mails while driving Base Respondents who support a ban on sending messages while driving D1 What is your age SA3 Record gender from observation Unweighted N=See Figure
58
25
20
15
10
5
0
36
14
44
80
39 32
21 13
41 31
Total 16 to 20 21 to 24 25 to 34 35 to 44 45 to 54 55 to 64 65+ Male Female N=6001 N=345 N=281 N=892 N=696 N=968 N=1155 N=1540 N=2939 N=3062
When examining the proportion of respondents who have been personally stopped by the police for using a handheld cell phone while driving by and gender younger drivers were more likely to say they had been pulled over for talking on their cell phones than were older drivers Respondents 25 to 34 were the most likely to have been pulled over at 8 while the least likely were 16- to 20shyyear-olds (1) and those over 65 (1) Four percent of male drivers and 3 of female drivers have been pulled over for using their cell phones while driving
Figure 6-15 Ever Stopped by Police for Using Phone While Driving
by Age and Gender
Q20 Have you ever been personally stopped by the police for using a handheld cell phone while driving D1 What is your age (Plt0001) SA3 Record gender from observation (Pgt005) Base All respondents Unweighted N=See Figure
59
Yes 707
No 282
Not Sure 11
CHAPTER 7 EDUCATIONAL MESSAGES
This chapter examines respondentsrsquo exposure to educational messages about distracted driving that encourage people not to talk on cell phones or text while driving Respondents were asked if they had seen or heard messages that encourage people not to talk on phones or send electronic messages while driving in the past 30 days and the circumstances under which they saw or heard these messages About 71 of the respondents stated that they had been exposed to such a message within the past 30 days
Figure 7-1 Percentage of Respondents Who Heard a Message Discouraging Distracted Driving in Past
30 Days
Q21 In the past 30 days have you seen or heard any messages that encourage people not to talk on phones or send electronic messages while driving This could be public service announcements on TV messages on the radio signs on the road news stories or something else Base All respondents Unweighted N=6001
60
705
147 114
26 06 0
20
40
60
80
100
Every day Almosy Every Day Few Days a Week Few Days a Month
Few Days a Year
61
Of those respondents who reported seeing or hearing a message that encourages people not to talk on phones or send electronic messages while driving 71 reported that they drive every day and another 15 said they drive almost every day Eleven percent said they drive at least a few days a week 3 drive a few days a month and 1 reported driving only a few days a year
Figure 7-2 Frequency of Driving of Respondents Exposed to Messages Discouraging Cell-Phone-
Related Distracted Driving
Q21 In the past 30 days have you seen or heard any messages that encourage people not to talk on phones or send electronic messages while driving This could be public service announcements on TV messages on the radio signs on the road news stories or something else Base Drivers who reported hearing or seeing a message discouraging cell-phone-related distracted driving in past 30 days Unweighted N=6001
Respondents who reported that they heard or saw messages that encourage drivers not to talk on cell phones or send electronic messages while driving in the past 30 days were asked where they heard or saw the message More than one source could be given A little more than half (53) of these respondents had seen such a message on a TV advertisement or public service announcement 12 saw it on TV news and 3 on a TV show storyline More than a third (36) had seen such a message on a billboard or sign About a quarter (23) had heard the message on a radio public service announcement while 3 heard a radio news segment featuring the message A small number of respondents saw or heard the message in an Internet ad or banner (6) on a social networking website (2) in a newspaper or magazine (2) on the road (2) or on an educational program (1)
Table 7-1 Source of Messages Discouraging Cell-Phone-Related Distracted Driving
Q21a Where did you see or hear those messages Percent
TV - advertisementpublic service announcement 526 Billboardsigns 363 Radio - advertisementpublic service announcement 227 TV - news 122 Internet adbanner 56 Radio - news 34 TV show storyline 29 Social networking website (Facebook MySpace Twitter) 23 Newspapermagazine 22 Personal observationon the road 20 Educational program 13 Friendrelative 08 School zonesaroundfrom school 06 Online newsblog 02 Online video (YouTube Google Video) 02 Other 56
Base Respondents who heard messages encouraging drivers not to talk on phone or send messages while driving Unweighted N=4175
62
100
80
679
60
385 40
261
20
96 84
0 TV Print Media Radio Internet Other
Figure 7-3 shows the distribution of media sources that delivered messages to those respondents who reported having heard or seen the message in the past 30 days The most frequent sources of the messages discouraging cell-phone-related distracted driving were television programming print media and radio programming Close to 7 in 10 respondents (68) listed some form of television programming as their source of the message Another 39 reported some type of print media like billboards or newspapers while 26 reported hearing the message on the radio Exposure to the message via the Internet was reported by 8 of respondents while 10 mentioned sources such as conversations with friends or an educational program
Figure 7-3 Source of Messages Discouraging Cell-Phone-Related Distracted Driving
Q21a Where did you see or hear these messages Base Respondent saw a message discouraging distracted driving in past 30 days Unweighted N=4175
63
Internet
Radio
Print Media
TV
804
266
175
19
735
374
263
62
675
423
264
59
651
393
267
108
594
456
320
96
549
448
349
114
652
348
219
199
0 20 40 60 80 100
16‐20 (N=249) 21‐24 (N=203) 25‐34 (N=643) 35‐44 (N=515) 45‐54 (N=688) 55‐64(N=857) 65+ (N=960)
The source by which respondents were exposed to messages discouraging cell phone distracted driving in the past 30 days was examined further by age (Figure 7-4) The most common sources of the message across all ages were TV print media and radio Only a few respondents mentioned the Internet
However there are some correlations between respondent age and message source Across most age groups it was increasingly likely that older respondents would mention the TV as a source of exposure to such messages ranging from 55 of respondents 21 to 24 mentioning TV to 80 of respondents 65 and older While differences by age were less systematic when examining the percentage of respondents who mentioned print media or radio respondents 25 to 34 were the most likely to mention print media (which includes newspapers magazines and billboards) with 46 of respondents mentioning print media as their source of message The 21-to-24 group was the most likely to mention radio with 35 stating that they heard the message on the radio Younger respondents were more likely than older respondents to list the Internet as their source One-fifth of respondents 16 to 20 (20) and one-tenth of those 21 to 24 (11) 25 to 34 (10) and 35 to 44 (11) mentioned the Internet while only 2 of respondents 65 and older mentioned the Internet
Figure 7-4 Source of Messages Discouraging Cell-Phone-Related Distracted Driving
by Age
Q21a Where did you see or hear these messages Base Respondent who saw a message discouraging distracted driving in past 30 days D1 What is your age (plt0001) Unweighted N=See Figure
64
676
398
295
69
681
372
228
99
0
20
40
60
80
100
TV Print Media Radio Internet
Male (N=2085) Female (N=2080)
When examining the source of messages discouraging distracted driving by gender male and female drivers were equally likely to list the TV (68) as their source of exposure to messages discouraging the use of cell phone while driving However male drivers were slightly more likely to mention print media (40) and radio (30) as their source than were female drivers (37 and 23 respectively) Female drivers (10) were more likely than male drivers (7) to have seen messages discouraging cell phone distracted driving on the Internet
Figure 7-5 Source of Messages Discouraging Cell-Phone-Related Distracted Driving by Gender
Q21a Where did you see or hear these messages Base Respondents who saw a message discouraging distracted driving in past 30 days SA3 Record gender from observation (plt0001) Unweighted N=See Figure
65
Click It or Ticket
Friends Donrsquot Let Friends Drive Drunk
Buzzed Driving is Drunk Driving
Drive Sober or Get Pulled Over
It Can Wait
Drunk Driving Over the Limit under Arrest
U Drive U Text U Pay
One Text or Call Could Wreck it All
No Phone Zone
On the Road Off the Phone
Put it Down
Phone in One Hand Ticket in the Other
736
632
614
589
513
462
284
275
216
191
182
125
0 20 40 60 80
Figure 7-6 shows the percentage of respondents who reported having heard certain slogans in the past 30 days Those slogans with an asterisk () in the figure are applicable to cell-phone-related distracted driving
More than half of respondents (51) had heard ldquoIt Can Waitrdquo in the past 30 days by far the most recognized cell phone slogan of those listed More than one quarter of respondents had heard ldquoU Drive U Text U Payrdquo (28) or ldquoOne Text or Call Could Wreck It Allrdquo (28) within the past month About 1 in 5 had heard ldquoNo Phone Zonerdquo (22) ldquoOn the Road Off the Phonerdquo (19) or ldquoPut It Downrdquo (18)
Figure 7-6 Heard Slogans in Past 30 Days
Q22 Do you recall hearing or seeing the following slogans in the past 30 days Base All respondents Unweighted N=6001 Distracted Driving slogans
66
Q22 Do you recall hearing or seeing the following slogans in the past 30 days Base All respondents Unweighted N=6001 All highway safety messages=12 Distracted driving messages=7
All Highway Safety Messages Distracted Driving Messages
50
40
30 274 252
19420 175
135 130 127117112 93 95
81 63
10
0
70 44
21 18
0 1 2 3 4 5 6 7 8‐12
Figure 7-7 shows the total number of different safe driving slogans that respondents reported having heard in the past 30 days More than a third (36) reported hearing between 6 and 10 highway safety slogans and more than a quarter (27) of respondents reported hearing 4 or 5 Eleven percent recognized three slogans 9 recognized two and 7 reported hearing only one Only 3 reported hearing more than 10 slogans and about 6 reported hearing none When examining the number of distracted driving slogans heard or seen by respondents in the past 30 days more than a quarter of respondents (27) indicated that they hadnrsquot heard any messages in the past 30 days One fifth reported having heard or seen two slogans (20) Two percent of respondents recalled having heard or seen 7 distracted driving messages in the past 30 days
Figure 7-7 Number of Slogans Heard in Past 30 Days
67
0 1 2 3 4 5 6 7
16‐20 (N=345) 125 202 152 160 190 107 42 24 21‐24 (N=281) 176 262 220 165 80 55 25 17 25‐34 (N=892) 162 260 236 144 105 48 24 23
35‐44 (N=696) 223 292 219 133 62 30 16 24 45‐54 (N=968) 259 247 213 106 81 65 17 12 55‐64 (N=1155) 373 250 175 93 56 19 15 19 65+ (N=1540) 444 234 144 80 45 25 18 10
0
10
20
30
40
50
60
Figure 7-8 shows the number of distracted driving slogans that respondents reported hearing in the last 30 days by categories Younger drivers were more likely to have heard 4 or more slogans in the past 30 days More than half of those in the 16 to 20 category (52) said they recognized more than 3 slogans compared to those in the 55-64 (20) and 65 and older (18) categories More than 4 in 10 respondents 65 and older (44) indicated that they had not heard any slogans in the past 30 days
Figure 7-8 Number of Distracted Driving Slogans Heard in Past 30 Days by Age
Q22 Do you recall hearing or seeing the following slogans in the past 30 days Base All respondents D1 What is your age (plt0001) Unweighted N=6001
68
Male (N=2939) Female (N=3062)
50
40
304 30
272 243
232
199 189 20
121 114
78 83 10
46 43 22 19 2016
0 0 1 2 3 4 5 6 7
Figure 7-9 shows the number of distracted driving slogans that respondents reported hearing in the last 30 days by gender Female respondents reported hearing fewer slogans in the past 30 days than did the male respondents About half of the men recognized 2 or more distracted driving slogans (49) compared to 46 of women More women than men (30 versus 24) reported seeing no slogans
Figure 7-9 Number of Distracted Driving Slogans Heard in Past 30 Days
by Gender
Q22 Do you recall hearing or seeing the following slogans in the past 30 days Base All respondents SA3 Record gender from observation (plt0001) Unweighted N=6001
69
Yes near‐crash 53
Yes crash 70
No 876
CHAPTER 8 DISTRACTED DRIVING CRASHES AND NEAR-CRASHES
Figure 8-1 shows the proportion of drivers by their involvement in vehicle crashes and near-crashes while driving in the past year A large majority (88) of drivers reported that they were not involved in any crash or near-crash events in the past year However 5 of drivers reported a near-crash involvement and 7 reported involvement in a crash
Figure 8-1 Had a Crash or Near-Crash in Past Year
Q23 Have you been involved in a crash or near-crash as a driver in the past year Base All respondents Unweighted N=6001
70
50
40
30
188 18420
133 133128124 123 115103
8510
0 Total 16‐20 21‐24 25‐34 35‐44 45‐54 55‐64 65+ Male Female
N=6001 N=345 N=281 N=892 N=696 N=968 N=1155 N=1540 N=2939 N=3062
Figure 8-2 shows the proportion of drivers who were involved in a crash or a near-crash while driving a vehicle in the past year by age categories Overall younger respondents were more likely to report a crash or near-crash in the past twelve months than were older respondents Nearly 1 in 5 of respondents 16 to 20 (19) and 21 to 24 (18) reported a crash or near-crash in the past year Respondents 65 or older were the least likely to report a crash with 9 saying they were involved in a crash or near-crash in the past year Male respondents (13) were more likely to have been involved in a crash than were female respondents (12)
Figure 8-2 Had a Crash or Near-Crash in Past Year
by Age and Gender
Q23 Have you been involved in a crash or near-crash as a driver in the past year Base All respondents D1 What is your age (plt0001) SA3 Record gender from observation (plt0001) Unweighted N=See Figure
71
Figure 8-3 shows the proportion of respondents who said they were distracted at the time of the last crashnear-crash they were in Nearly 1 in 7 respondents (14) said they were distracted when the crash or near-crash occurred
Figure 8-3 Was the Respondent Distracted During the Last Crash or Near-Crash
Yes 136
No 859
Q23a Were you distracted at the time of the LAST [crashnear-crash] you were in Base Drivers who were in a crash or near-crash in the past year Unweighted N=724
72
50
40
30 274
229
179
151
20
138 121
108
10 80 81
0
34
Total 16‐20 21‐24 25‐34 35‐44 45‐54 55‐64 65+ Male Female N=724 N=72 N=49 N=124 N=94 N=130 N=125 N=122 N=382 N=342
Figure 8-4 shows the proportion of respondents who said they were distracted at the time of their last crashnear-crash by age and gender categories Younger respondents were more likely to report being distracted at the time of the crash or near-crash with 27 of respondents 16 to 20 18 of respondents 21 to 24 and 23 of respondents 25-34 who said they were distracted when the crash or near-crash occurred Respondents 65 and older were the least likely to say they were distracted at the time of their last crash or near-crash (3) Fifteen percent of male respondents and 12 of female respondents reported that they were distracted when the crash or near-crash occurred
Figure 8-4 Was Distracted During Last Crash or Near-Crash Experience
by Age and Gender
Q23a Were you distracted at the time of the LAST [crashnear-crash] you were in Base Drivers who were in a crash or near-crash in the past year D1 What is your age (plt0001) SA3 Record gender from observation (pgt005) Unweighted N=See Figure
73
Not paying attentionlooked away
Fell asleepwas tired
Adjusting radio GPS etc
Using an app on cell phone
Talking to passengers
Talking on cell phone
Daydreaming
Dropped somethingpicking up something
Sending text message or email
Eating
Reading electronic text
Medical reason 05
28
42
42
55
58
64
66
72
81
82
187
0 10 20 30 40 50
Figure 8-5 shows the type of activity the respondents said they were engaged in at the time of their crash or near-crash Nearly one-fifth of respondents who reported being distracted said they were not paying attention or looked away (19) when the crash or near-crash occurred Others reported that they ldquofell asleep or were tiredrdquo (8) were ldquoadjusting the radio or GPSrdquo (8) and 7 were ldquousing their smartphone apprdquo Fewer respondents cited ldquotalking to passengersrdquo (7) ldquotalking on the cell phonerdquo (6) ldquodaydreamingrdquo (6) or ldquodropped or picked up somethingrdquo (6) as reasons for their distraction Less than 5 of respondents said they were sending a text (4) eating (4) reading an electronic text (3) or had a medical reason (1)
Figure 8-5 Type of Distraction at Time of Crash or Near-Crash
Q23b How were you distracted at the time of the [crashnear-crash] Base Drivers who were in a crash or near-crash in the past year Unweighted N=99
74
Talk on the Phone While Driving Send Text Messages While Driving
Percep
tion
of P
ropo
rtion of D
rivers
who
Talk on a Ce
llPh
one or S
end
Text M
essages While
Driving
91‐100
81‐90
71‐80
61‐70
51‐60
41‐50
31‐40
21‐30
11‐20
0‐10 45
48
93
75
213
88
72
169
94
60
25
27
48
44
133
65
81
242
173
132
0 10 20 30 40 50 Percent of Respondents that Indicated the Proportion
CHAPTER 9 PERCEPTIONS OF AND RESPONSES TO DISTRACTED DRIVING
Respondents were asked what percentage of drivers they believe talk on a cell phone or send text messages or e-mails at least occasionally while driving Nearly 7 in 10 respondents (69) believe that more than half of drivers talk on cell phones at least occasionally with 30 of respondents believing that more than 80 of drivers do so When examining the respondentsrsquo perception on the proportion of drivers sending texts or e-mails at least occasionally while driving nearly half of respondents (48) think that more than half of drivers send electronic messages while driving
Figure 9-1 Perception of Proportion of Drivers Talking on PhoneTexting While Driving
Q24 What percentage of drivers do you believe at least occasionally TALK on a cell phone while driving Q24a What percentage of drivers do you believe at least occasionally SEND TEXT MESSAGES OR E-MAILS on a cell phone while driving Base All respondents Unweighted N=6001
75
100
855
80
60
40
20
77 28 23
0 Hands‐free Hand‐held Same Neither
Respondents were asked which phone call method they perceive as safer while driving They were asked to choose between a hands-free device and a handheld cell phone Hands-free devices such as Bluetooth earpieces or vehicle-provided interfaces such as Sync allow an individual to answer and make calls without ever touching the cell phone but they still typically require some manual manipulation such as pressing a button on the steering wheel to answer a call Almost all respondents (86) cited a hands-free cell phone as the safer option A sizeable number of respondents (8) indicated that neither method was safer than the other
Figure 9-2 Safer to Use Hands-Free or Handheld Phone While Driving
Q24b Which is safer using a [hands-free cell phone or using a handheld cell phone] Base All respondents Unweighted N=6001
76
0
20
40
60
80
Hands‐Free Hand‐Held Same Neither
Total (N=6001) 855 28 23 77 16‐20 (N=345) 917 48 26 10
21‐24 (N=281) 854 55 16 58 25‐34 (N=892) 877 28 35 49
35‐44 (N=696) 911 14 15 54 45‐54 (N=968) 856 28 27 78 55‐64 (N=1155) 836 26 24 93 65+ (N=1540) 784 26 15 143 Male (N=2939) 856 28 23 76 Female (N=3062) 854 28 22 78
Figure 9-3 shows which phone call method is perceived as safer by respondent gender and age Drivers 16 to 20 and 35 to 44 were the most likely to think that using a hands-free device was safer than holding a cell phone when driving (92 and 91 respectively) while drivers aged 65 or more were the least likely to say so (78) Only 1 of drivers 16 to 20 said that neither method was safer In contrast 14 of drivers 65 and more said that neither method was safer than the other There was no difference between male and female drivers
Figure 9-3 Safer to Use Hands-Free or Handheld Phone by Age and Gender
100
Q24b Which is safer using a hands-free cell phone or using a handheld cell phone Base All respondents D1 What is your age (plt0001) SA3 Record gender from observation (pgt005) Unweighted N=See Figure
77
Cell phone providers and other app developers have developed apps that automatically disable texting and incoming calls when a vehicle is in operation Figure 9-4 shows respondentsrsquo attitudes toward the use of apps that prevent texting and making phone calls when driving by age and gender Overall nearly half of the respondents (46) said that they would use an app to block phone calls and text messaging while driving Female drivers (50) and drivers 45 to 54 years old (52) were the most likely to say that they would use an app that blocks phone calls and text messaging while driving Drivers 21 to 24 were the most likely to State that they already use an app to block incoming calls and texts (3) More than half of those in the 25-to-34 (53) 21-toshy24 (52) and 16-to-20 (50) age categories said they would not use any apps that prevent texting and making phone calls while driving A small number of older respondents did not have a definite answer with 5 of those 55 to 64 and 4 of respondents 45 to 54 and 65+ saying that it would depend
Figure 9-4 Would Use App to Block Calls and Texts While Driving ( Yes)
Yes No It Depends I Already Have
One
Total (N=6001) 464 468 36 12 16‐20 (N=345) 463 503 20 14 21‐24 (N=281) 424 521 22 25
25‐34 (N=892) 409 530 29 20
35‐44 (N=696) 461 478 34 17
45‐54 (N=968) 519 416 43 06
55‐64 (N=1155) 476 433 48 11
65+ (N=1540) 477 449 40 00
Male (N=2939) 425 510 35 09
0
20
40
60
80
Female (N=3062) 502 426 37 14
100
Q24c There are phone apps available to block phone calls and text messaging while driving Would you use such an app Base All respondents D1 What is your age (plt0001) SA3 Record gender from observation (plt0001) Unweighted N=6001
78
CHAPTER 10 DISTRACTED DRIVING BEHAVIOR BY DRIVER TYPE
In examining driversrsquo attitudes and self-reported distracted behaviors it is useful to group drivers by their distracted driving tendencies Rather than rely on any single indicator of general distracted driving or assumptions about appropriate categories of drivers this study developed a typology of drivers using cluster analysis of responses to 15 questions about the frequency of distracted driving behaviors Cluster analysis allowed the identification of discrete types of drivers based on the overall pattern of responses across all 15 distracted driving behavior questions Biplot and factor analyses were conducted to explore the patterns of covariation of distracted driving behaviors Three factors were identified interaction with other passengers (items q4a and q4g) addressing onersquos personal needs (items q4i q4b and q4j) and cell phone use (all other items) Ultimately the k-means method was applied to identify two clusters on the scree plot of explained variance Distracted driving behavior questions asked in 2015 differed slightly from 2012 In 2012 respondents were asked about the frequency with which they ldquomake or accept phone callsrdquo while driving In 2015 this item was split into two separate items Items about reading (paper or electronically) personal grooming and listening to portable music players with headphones were dropped Three items were added in 2015 relating to taking pictures with onersquos phone looking up information on the Internet and using smartphone apps (not including navigation apps) while driving The 15 questions used in the 2015 cluster analysis reflect the current 2015 questionnaire and thus differ from the 2012 cluster analysis
79
Table 10-1 shows the 15 distracted driving items used in the 2015 cluster analysis and the response distributions for each Talking to passengers in the vehicle is the activity drivers most often engage in while driving with 53 reporting they always or almost always do so while driving This was followed by always or almost always adjusting the car radio (35) and interacting with children in the vehicle (21) Activities in which drivers are the least likely to engage while driving include taking pictures with their phone with 89 of drivers saying they never do so followed by looking up information on the Internet (86) using smartphone apps not including a navigation app (84) and sending text messages or e-mails (80)
Table 10-1 Distracting Behavior Frequency (Used in Cluster Analysis)
How often do youhellip N Always Almost Always
Sometimes Rarely Never
Q4a Talk to passengers in the vehicle 6001 348 181 291 120 57
Q4b Eat or drink 6001 56 64 355 264 260
Q4c Make phone calls 6001 38 44 254 220 444
Q4d Answer phone calls 6001 97 56 268 212 366
Q4e READ text or e-mail messages 6001 16 14 86 137 748
Q4f SEND text or e-mail messages 6001 10 12 63 113 800
Q4g Talk or interact with children in the vehicle
6001 141 70 204 161 422
Q4h Use portable music player including a smartphone with external speakers or with the carrsquos speakers
6001 109 59 128 68 635
Q4i Adjust the car radio 6001 220 126 330 164 157
Q4j Change CDs DVDs or tapes 6001 24 15 130 185 646
Q4k Use smartphone for driving directions 6001 54 45 261 129 512
Q4l Use a navigation system for driving directions
6001 50 37 274 148 489
Q4m Take pictures with your phone 6001 08 05 33 67 887
Q4n Use smartphone apps not including a navigation app
6001 16 06 62 73 841
Q4o Look up information on the Internet 6001 14 06 52 73 855
80
Cluster analysis was able to classify all of the respondents into one of two distinct groups based on their responses to the 15 questions The core characteristic of each of the two groups identified in the cluster analysis was determined by examining how each group scored on each distracted driving behavior variable As can be seen in Table 10-2 one group was composed of drivers who consistently reported engaging in distracted driving behaviors and the other group was composed of drivers who reported distracted driving behaviors less often The groups were named distraction-prone and distraction-averse respectively for the purposes of this report Of those respondents categorized 42 are distraction-prone drivers (N=2301) and 58 are distraction-averse drivers (N=3700)
Table 10-2 Distracted Driving Behaviors by Driver Type
How often do youhellip N Always Almost Always
Sometimes Rarely Never
Talk to other passengers in the vehicle
Distraction-Prone Drivers 2301 602 210 148 32 07
Distraction-Averse Drivers 3700 164 161 394 184 93
Eat or drink Distraction-Prone Drivers 2301 110 106 514 196 73
Distraction-Averse Drivers 3700 16 34 239 313 396
Make phone calls Distraction-Prone Drivers 2301 80 93 429 232 166
Distraction-Averse Drivers 3700 08 08 128 211 645
Answer phone calls Distraction-Prone Drivers 2301 182 103 393 188 132
Distraction-Averse Drivers 3700 35 23 178 229 535
Read text or e-mails messages Distraction-Prone Drivers 2301 37 31 193 246 492
Distraction-Averse Drivers 3700 00 01 08 57 933
Send text or e-mails messages Distraction-Prone Drivers 2301 25 27 145 223 580
Distraction-Averse Drivers 3700 00 01 04 33 959
Talk or interact with children in the vehicle Distraction-Prone Drivers 2301 292 119 213 141 234
Distraction-Averse Drivers 3700 33 35 197 175 557
Use a portable music player including a smartphone with external speakers or with the carrsquos speakers
Distraction-Prone Drivers 2301 193 76 183 87 461 Distraction-Averse Drivers 3700 48 47 89 54 760
81
Table 10-2 Distracted Driving Behaviors by Driver Type (Continued)
How often do youhellip N Always Almost Always
Sometimes Rarely Never
Adjust the car radio
Distraction-Prone Drivers 2301 439 197 268 62 31
Distraction-Averse Drivers 3700 62 75 374 238 248
Change CDs DVDs or Tapes Distraction-Prone Drivers 2301 51 31 187 222 509
Distraction-Averse Drivers 3700 04 04 90 158 744
Use a smartphone for driving directions
Distraction-Prone Drivers 2301 104 73 399 152 271
Distraction-Averse Drivers 3700 17 24 161 112 685
Use a navigation system for driving directions Distraction-Prone Drivers 2301 65 59 342 158 374
Distraction-Averse Drivers 3700 39 22 224 141 572
Take pictures with your phone Distraction-Prone Drivers 2301 17 12 65 119 788
Distraction-Averse Drivers 3700 01 01 09 30 960
Use smartphone apps not including a navigation app Distraction-Prone Drivers 2301 34 13 115 137 700
Distraction-Averse Drivers 3700 04 01 24 26 943
Look up information on the Internet Distraction-Prone Drivers 2301 30 11 103 145 710
Distraction-Averse Drivers 3700 03 01 15 21 960
82
581 437 426 395 442
564
729 884
578 583
419
563
574 605 558
436 271 116
422 417
0
20
40
60
80
100
Total N=6001
16 to 20 N=345
21 to 24 N=281
25 to 34 N=892
35 to 44 N=696
45 to 54 N=968
55 to 64 N=1155
65+ N=1540
Male N=2939
Female N=3062
Figure 10-1 shows a clear age effect on distracted driving tendency Distraction-averse drivers tend to be older while distraction-prone drivers are more likely to be younger The proportion of distraction-prone drivers decreases with advancing age with the majority of those in the younger age categories 16 to 20 (56) 21 to 24 (57) 25 to 34 (61) and 35 to 44 (56) categorized as distraction-prone drivers and less than one quarter of drivers 55 and older (27 for 55-64 and 12 for 65 and older) categorized as distraction-prone drivers Males and females were equally likely to be classified as distraction-prone drivers (42)
Figure 10-1 Driver Type
by Age and Gender
Distraction‐Averse Driver Distraction‐Prone Driver
D1 What is your age (plt0001) SA3 Record gender from observation Base All respondents Unweighted N=See Figure
83
665 659 558
470 463 544
335 341 442
530 537 456
0
20
40
60
80
100
No HS Degree (N=505)
High School Grad
(N=1613)
Some College (N=1470)
College Grad (N=1241)
Some Grad School (N=135)
Grad Degree (N=970)
Figure 10-2 examines the relationship between distracted driving tendency and the highest level of education completed Respondents with some graduate school education and college graduates had the largest percentage of distraction-prone drivers (53-54) compared to respondents without a high school degree (34) or who only graduated high school (34) Overall drivers with some college and more education are more likely to be classified as distraction-prone
Figure 10-2 Driver Type
by Highest Level of School Completed
Distraction‐Averse Driver Distraction‐Prone Driver
D6 What is highest grade or year of regular school you have completed (plt0001) Base All respondents Unweighted N=See Figure
84
Distraction‐Averse Driver Distraction‐Prone Driver
632 581 579 541 617 610
368 419 421 459 383 390
0
20
40
60
80
100
American Asian (N=191) Black or Native White Hispanic Indian or African Hawaiian or (N=4693) (N=631)
Alaska Native American other Pacific (N=182) (N=543) Islander
(N=48)
Figure 10-3 shows that the tendency toward distracted driving behavior is similar across most racial and ethnic groups Almost one half of Native Hawaiian or other Pacific Islander respondents (46) were categorized as distraction-prone drivers Around 4 in 10 Asian (42) Black or African-American (42) White (38) Hispanic (39) and American Indian or Alaska Native (37) respondents were classified as distraction-prone drivers
Figure 10-3 Driver Type
by RaceEthnicity
D5 Which of the following racial categories describe you You may select more than one (pgt005) D4 Do you consider yourself to be Hispanic or Latino (pgt005) Base All respondents Unweighted N=See Figure Sample size was less than 50
85
Distraction‐Averse Driver Distraction‐Prone Driver
684 693 690 625
537 453
385 421
316 307 310 375
463 547
615 579
0
20
40
60
80
100
Less than $10000 to $15000 to $25000 to $50000 to $100000 $150000 $200000+ $10000 $14999 $24999 $49999 $99999 to to (N=299) (N=320) (N=281) (N=488) (N=1201) (N=1581) $149999 $199999
(N=728) (N=257)
Figure 10-4 shows a relationship between income and distracted driving tendency Overall as annual household income increases drivers were more likely to be classified as distraction-prone In the highest household income groups ($150000+) about 6 in 10 drivers coming from households earning $150000 to $199999 (62) and more than $200000 (58) were categorized as distraction-prone In contrast in each of the three lowest household income groups (lt$10000 $10000 to $14999 and $15000 to $24999) fewer than a third were classified as distraction-prone
Figure 10-4 Driver Type by Income
D11 What is your approximate household income (plt0001) Base All respondents Unweighted N=See Figure
86
Distraction‐Averse Driver Distraction‐Prone Driver
510 640
799 859 768
490 360
201 141 232
0
20
40
60
80
100
Every Day Almost Every Few Days a Few Days a Few Days a (N=3913) Day Week Month Year
(N=971) (N=854) (N=193) (N=58)
Figure 10-5 shows the tendency toward distracted driving by respondentsrsquo frequency of driving The highest proportion of distraction-prone drivers is among respondents who drove every day with nearly half of respondents (49) classified as such The lowest proportion of distraction-prone drivers is among respondents who drove only a few days a month (14)
Figure 10-5 Driver Type
by Frequency of Driving
Q1 How often do you drive a motor vehicle regardless of whether it is for work or for personal use Every day almost every day a few days a week a few days a month a few days a year or do you never drive (plt0001) Base All respondents Unweighted N=See Figure
87
Distraction‐Averse Driver Distraction‐Prone Driver
589 598
800
589 536 554
690
410 402
200
411 464 446 310
0
20
40
60
80
100
Car Van or Motorcycle Pickup SUV Other Truck Other (N=3393) Minivan (N=15) Truck (N=1175) (N=51) (N=25)
(N=449) (N=885)
Figure 10-6 shows the relationship between vehicle type and driver type Those who drive a SUV (46) or some other kind of truck (eg medium truck heavy truck not a pickup) (45) are among the most likely to be distraction-prone
Figure 10-6 Driver Type by Car Type
Q1a Is the vehicle you drive most often a car van motorcycle sport utility vehicle pickup truck or other type of truck Base Respondents assigned a driver type (plt0001) Unweighted N=See Figure Sample size was less than 50
88
980100
848
80
60
40
20
0 Distraction‐Averse Driver Distraction‐Prone Driver
(N=3700) (N=2301)
Figure 10-7 shows cell phone ownership by driver type Distraction-prone drivers (98) were more likely than distraction-averse drivers (85) to own a cell phone The vast majority of respondents owned a cell phone so these results should be interpreted with this fact in mind
Figure 10-7 Cell Phone Ownership
by Driver Type
Q3 Do you CURRENTLY own any of the following devices A cell phone (plt0001) Base All respondents Unweighted N=See Figure
89
Figure 10-8
Proportion of Distraction-Prone Drivers by NHTSA Region
Figure 10-8 shows the percentage of distraction-prone drivers by NHTSA region There was a statistically significant relationship between distracted driving behaviors and NHTSA region however it is important to note that there is not a large difference in the proportion of distracted drivers between the NHTSA regions Drivers who live in Region 2 (63) were more likely to be categorized as distraction-prone drivers than were drivers in Region 8 (51) or Region 3 (54)
(plt0001) N=6001 Note During the survey Connecticut was in Region 1 and has subsequently been moved into Region 2
90
Distraction‐Averse Driver (N=3700) Distraction‐Prone Driver (N=2301)
100
76980
60 533
40
241
20 127
87 59
18 0
149
Very Unsafe Somewhat Unsafe A Little Less Safe Safe
When certain behaviors are broken out by driver type distraction-prone drivers tend to be less likely to feel unsafe as a passenger when the driver engages in those distracted behaviors Figure 10-9 shows the perceptions of safety by driver type of respondents who are passengers in a vehicle in which the driver is talking to other passengers while driving Slightly more than half of respondents classified as distraction-averse drivers (53) compared to more than three-quarters of distraction-prone drivers (77) stated that they would feel safe if the driver was conversing with others in the car while driving More than 1 in 5 respondents classified as distraction-averse drivers (21) compared to 8 of respondents classified as distraction-prone reported they would feel very or somewhat unsafe
Figure 10-9 Perception of Safety by Driver Type Driver Is Talking to Other Passengers
Q11a Now Irsquom going to read a list of things people sometimes do while driving Tell me how safe you would feel if you were a passenger riding in a car while your driver was doing the following For each please tell me if you would feel very unsafe somewhat unsafe a little less safe or safe ndash no problem ndash would not pay any more attention a Talking to other passengers in the vehicle (plt0001) Base All respondents assigned a driver type Unweighted N=See Figure
91
Distraction‐Averse Driver (N=3700) Distraction‐Prone Driver (N=2301)
100
80
60 563
40 348
259 221 205
176 168 20
50
0 Very unsafe Somewhat unsafe A little less safe Safe
Figure 10-10 compares the perceptions of safety among distraction-averse and distraction-prone people when their drivers are talking on a cell phone while holding the phone Overall distraction-averse people were much more likely to feel very unsafe than the distraction-prone people More than half of the individuals classified as distraction-averse drivers (56) reported that they would feel very unsafe in this situation while only 22 of individuals classified as distraction-prone stated they would feel very unsafe Conversely 17 of distraction-prone individuals and only 5 of distraction-averse individuals said they would feel safe if the driver was talking on the phone while holding it
Figure 10-10 Perception of Safety by Driver Type
Driver Is Talking on Cell Phone While Holding Phone
Q11-c Now Irsquom going to read a list of things people sometimes do while driving Tell me how safe you would feel if you were a passenger riding in a car while your driver was doing the following For each please tell me if you would feel very unsafe somewhat unsafe a little less safe or safe ndash no problem ndash would not pay any more attention c Talking on a cell phone while holding the phone (plt0001) Base All respondents Unweighted N=See Figure
92
Distraction‐Averse Driver (N=3700) Distraction‐Prone Driver (N=2301)
100
90
80
70
60 534
50
40 372
30 215
190 165 20
136 108100 99
68
0
10
Very Likely Somewhat Somewhat Very Unlikely Never would Likely Unlikely intervene
Respondents were asked how likely they were to intervene if they were passengers in a vehicle in which the driver was talking on a cell phone while holding the phone and driving Individuals classified as distraction-prone drivers were less likely than those classified as distraction-averse drivers to report that they would intervene if their drivers were talking on a phone while driving While 53 of distraction-averse drivers say they are very likely to intervene 37 of distraction-prone drivers said that they would do so Almost one-quarter of distraction-prone drivers (24) and 17 of distraction-averse drivers said they were very unlikely or would never intervene
Figure 10-11 How Likely Are You to Intervene if the Driver Is Talking on a
Cell Phone While Holding the Phone by Driver Type
Q12 How likely are you to do or say something to your driver if theyrsquore TALKING on a handheld cell phone while driving (plt0001) Base All respondents Unweighted N=See Figure
93
934
42 13 06
763
142
68 25
0
20
40
60
80
100
Very Unsafe Somewhat Unsafe A Little Less Safe Safe
Distraction‐Averse Driver (N=3700) Distraction‐Prone Driver (N=2301)
Figure 10-12 compares the perceptions regarding safety of distraction-prone and distraction-averse people when the driver is sending text messages or e-mails while driving The overwhelming majority of distraction-averse individuals (93) and three-quarters (76) of distraction-prone individuals reported that they would feel very unsafe if the driver was engaged in this behavior while driving One in 5 (21) distraction-prone drivers reported that they would feel somewhat unsafe or a little less safe in this situation only 5 of distracted-averse drivers reported feeling this way Very few distraction-averse (1) and distraction-prone (3) individuals indicated that they would feel safe if their drivers were sending e-mails or text messages while driving
Figure 10-12 Perception of Safety Driver Is Sending Text Messages or E-Mails
by Driver Type
Q11-f Now Irsquom going to read a list of things people sometimes do while driving Tell me how safe you would feel if you were a passenger riding in a car while your driver was doing the following For each please tell me if you would feel very unsafe somewhat unsafe a little less safe or safe ndash no problem ndash would not pay any more attention f Sending text messages or e-mails (plt0001) Base All respondents Unweighted N=See Figure
94
Distraction‐Averse Driver (N=3700) Distraction‐Prone Driver (N=2301)
100
80
60
40
20
0
793
697
89
167
37 61 45 41 26 31
Very Likely Somewhat Somewhat Very Unlikely Never Would Likely Unlikely Intervene
Overall 88 of respondents stated that they were at least somewhat likely to intervene if they were passengers in a vehicle when a driver was sending e-mails or text messages Figure 10-13 shows the likelihood of intervention by people classified as distraction-prone and distraction-averse if they are passengers in a vehicle in which the driver is sending e-mails or text messages while driving The majority of distraction-averse (79) and distraction-prone (70) drivers were very likely to intervene Very few respondents indicated that they never would intervene
Figure 10-13 How Likely Are You to Intervene if Driver Is Sending Text Messages or E-Mails
by Driver Type
Q13 How likely are you to do or say something to your driver if theyrsquore SENDING TEXT MESSAGES OR E-MAILS OR USING SMARTPHONE APPS while driving (plt0001) Base All respondents Unweighted N=See Figure
95
895
66 27 08
693
193
91
21 0
20
40
60
80
100
Very Unsafe Somewhat Unsafe A Little Less Safe Safe
Distraction‐Averse Driver (N=3700) Distraction‐Prone Driver (N=2301)
Figure 10-14 compares the perception of safety among distraction-prone and distraction-averse people when the driver is reading e-mails or text messages while driving Nine in 10 distraction-averse individuals (90) and 69 of distraction-prone individuals reported that they would feel very unsafe if the driver was engaged in this behavior while driving More than a quarter (28) of distraction-prone drivers and nearly 1 in 10 (9) of distraction-averse drivers reported that they would feel somewhat unsafe or a little less safe in this situation Very few distraction-averse (1) and distraction-prone (2) individuals indicated that they would feel safe if their drivers were reading e-mails or text messages while driving
Figure 10-14 Perception of Safety Driver Is Reading Text Messages or E-Mails
by Driver Type
Q11-e Now Irsquom going to r ead a list of things people sometimes do wh ile driving Tell me how safe you would f eel if you were a passenger riding in a car while your driver was doing the following For each please tell me if you would feel very unsafe somewhat unsafe a little less safe or safe ndash no problem ndash would not pay any more attention e Reading e-mails or text messages (plt0001) Base All respondents Unweighted N=See Figure
96
0‐2 secs 3‐6 secs 7+ secs 100
80
662 637
60
40 315
20
53 36
0 Distraction‐Averse Driver Distraction‐Prone Driver
(N=3700) (N=2301)
258
Figure 10-15 compares the number of seconds a respondent believes drivers can safely take their eyes off the road by driver type While more than 6 in 10 distraction-averse and distraction-prone drivers provided an answer that was between 0 and 2 seconds distraction-prone drivers (35) were more likely to believe that a driver can take hisher eyes off the road for 3 or more seconds than were distraction-averse drivers (31)
Figure 10-15 Number of Seconds a Driver Can Safely Take HisHer Eyes Off the Road
by Driver Type
Q10 How many seconds do you believe a driver can take his eyes off the road before driving becomes significantly more dangerous (plt0001) Base All respondents Unweighted N=See Figure
97
16
166
797
32
140
825
100
Distraction‐Averse Driver (N=1663) Distraction‐Prone Driver (N=1986)
80
60
40
20
0 Increased Decreased Stayed the Same
Figure 10-16 shows the frequency with which respondents reported making and receiving phone calls while driving by driver type Regardless of driver type most respondents report no changes in the frequency with which they make calls within the past 30 days Very few distraction-averse drivers (2) as well as distraction-prone drivers (3) stated that the frequency of making and receiving phone calls increased in the past 30 days while 17 of distraction-averse drivers and 14 of distraction-prone drivers stated that they are making calls less often Eight in 10 distraction-averse drivers (80) and distraction-prone drivers (83) reported that the frequency with which they make calls remained the same
Figure 10-16 Has Your Frequency of Answering Phone Calls
While Driving Increased Decreased or Stayed the Same by Driver Type
Q15 In the past 30 days has your frequency of answering phone calls while driving increased decreased or stayed the same Base Respondents who accept phone calls while driving (plt0001) Unweighted N=See Figure
98
Distraction‐Averse Drivers (n=2806) Distraction‐Prone Drivers (n=1577)
50
40
306 297 30
243 241 224 224 215
188 20
10
37 22
0 Very Likely Somewhat Somewhat Very Unlikely Not Sure
Likely Unlikely
Figure 10-17 shows a moderate difference in respondentsrsquo perception of the likelihood that a driver talking on a cell phone would receive a ticket by driver type Among distraction-averse drivers 31 indicated that it was very likely and 24 stated that it was somewhat likely that the driver would get a ticket Among distraction-prone drivers 22 stated it was very likely that the driver would receive a ticket and 30 stated that it was somewhat likely
Figure 10-17 Likelihood of Ticket for Talking on a Cell Phone While Driving
by Driver Type
Q17a Assume that over the next 6 months someone frequently TALKS on a handheld cell phone while driving How likely do you think that person would be to receive a ticket for talking on a cell phone while driving Base Respondents who reported living in a State which bans talking on a cell phone while driving (plt0001) Unweighted N=See Figure
99
Distraction‐Averse Drivers (n=3700) Distraction‐Prone Drivers (n=2301)
100
822 80
616 60
40 356
20 158
27
0 Yes No Not Sure
19
Figure 10-18 shows respondentsrsquo support for a State law banning talking on a handheld cell phone while driving by driver type Distraction-averse drivers were more likely to support such a law while distraction-prone drivers were more likely to oppose such a law More than 8 in 10 distraction-averse drivers (82) and 62 of distraction-prone drivers stated that they support a law banning talking on a cell phone while driving One in 6 (16) distraction-averse drivers and 36 of distraction-prone drivers are opposed to such a law
Figure 10-18 Support for Law Banning Talking on a Handheld Cell Phone While Driving
by Driver Type
Q19 Do you support a State law banning talking on a handheld cell phone while driving (plt0001) Base All respondents Unweighted N=See Figure
100
50
Distraction‐Averse Drivers (n=3380) Distraction‐Prone Drivers (n=2078)
40
327
30 267 260 250
238 229 208
20
10
29 16
0
175
Very Likely Somewhat Somewhat Very Unlikely Not Sure Likely Unlikely
Figure 10-19 shows respondentsrsquo perception of the likelihood that a driver sending electronic messages while driving would receive a ticket by driver type More than half of distraction-averse drivers (59) as well as distraction-prone drivers (52) thought that it was at least somewhat likely that the driver would be ticketed
Distraction-averse drivers were more likely to state that the driver was very likely to receive a ticket while distraction-prone drivers more often reported the driver was only somewhat likely or not likely to receive a ticket with 33 of distraction-averse drivers and 25 of distraction-prone drivers stating that the driver was very likely to receive a ticket Conversely distraction-prone drivers were more likely than distraction-averse drivers to state that a driver who frequently sends text messages or e-mails was somewhat unlikely (24 versus 18) or very unlikely (23 versus 21) to receive a ticket
Figure 10-19 Likelihood of Ticket for Sending Text Messages or E-Mails While Driving
by Driver Type
Q18a Assume that over the next 6 months someone frequently sends text messages or e-mails while driving How likely do you think that person would be to receive a ticket for sending text messages or e-mails while driving Base Respondents who report living in a State that bans sending messages while driving (plt0001) Unweighted N=See Figure
101
$400
$350 $32829
$300 $26388 $26487
$250
$20917 $200
$150
$100
$50
$0 Distraction‐ Distraction‐ Distraction‐ Distraction‐Averse Driver Prone Driver Averse Driver Prone Driver
N=2633 N=1361 N=3034 N=1903
Average Fine for Talking on a Handheld Cell Phone While Driving
Average Fine for Sending Text Messages or E‐Mails While Driving
Of those who support a State law banning talking on a handheld cell phone while driving the average fine suggested by distraction-averse drivers for talking on a handheld cell phone while driving was higher than the average fine suggested by distraction-prone drivers ($264 versus $209) Distraction-averse drivers who supported bans on sending electronic messages while driving also suggested higher average fines for sending text messages while driving than distraction-prone drivers ($328 versus $265)
Figure 10-20 Average Fine for Cell Phone Use While Driving
by Driver Type
Q19a What do you think the fine should be for talking on a handheld cell phone while driving Base Respondents who support a ban on talking on a cell phone while driving (plt0001) Q19c What do you think the fine should be for sending text messages or e-mails while driving Base Respondents who support a ban on sending messages while driving (plt0001) Unweighted N=See Figure
102
50
40
30
20
10 61 36
18
0 Total Distraction‐Averse Driver Distraction‐Prone Driver
(N=6001) (N=3700) (N=2301)
The proportion of drivers stopped by the police for using a phone while driving is fairly low (4) However distraction-prone drivers are more likely to be stopped by police as opposed to distraction-averse drivers Indeed 6 of distraction-prone drivers have been pulled over by the police for using their cell phones while driving while only 2 of distraction-averse drivers reported being pulled over
Figure 10-21 Ever Stopped by Police for Using Phone While Driving
by Driver Type ( Yes)
Q20 Have you ever been personally stopped by the police for using a handheld cell phone while driving (plt0001) Base All respondents Unweighted N=See Figure
103
100
80 752
674
60
40
20
0 Distraction‐Averse Driver Distraction‐Prone Driver
(N=3700) (N=2301)
When asked whether the respondents had seen or heard any messages that encourage people not to talk on phones or send electronic messages while driving 67 of distraction-averse drivers and 75 of distraction-prone drivers reported seeing or hearing messages that encourage people not to talk on the phone or send messages while driving
Figure 10-22 Respondents Exposed to Messages Discouraging Cell Phone Distracted Driving
by Driver Type
Q21 In the past 30 days have you seen or heard any messages that encourage people not to talk on phones or send electronic messages while driving This could be public service announcements on TV messages on the radio signs on the road news stories or something else (plt0001) Base All respondents assigned a driver type Unweighted N=See Figure
104
Distraction‐Averse Driver (N=2458) Distraction‐Prone Driver (N=1706)
100
80
60 565
444
40
291 249
20 127
92 6039
0 TV Print Media Radio Internet
Figure 10-23 shows the sources of messages discouraging cell phone distracted driving as reported by distraction-prone and distraction-averse drivers who saw or heard messages Distraction-averse drivers (57) were more likely than distraction-prone (44) drivers to list television programming as a source of the message Distraction-prone drivers (29) are more likely than distraction-averse drivers (25) to mention print media which includes newspapers and billboards Nearly 1 in 8 distraction-prone drivers (13) and 9 of distraction-averse drivers mentioned the radio as a source of the message they heard Fewer than 1 in 10 distraction-prone drivers (6) mentioned the Internet as a source as did 4 of distraction-averse drivers
Figure 10-23 Source of Messaging
by Driver Type
Q21a Where did you see or hear these messages (plt0001) Base Has seenheard messages in the past 30 days Unweighted N=See Figure
105
50
40
30
20
10
0 Distraction‐Averse Driver Distraction‐Prone Driver
(N=3700) (N=2301)
107
147
Figure 10-24 shows the proportion of drivers who were involved in a crash or a near-crash while driving a vehicle in the past year by driver type Distraction-prone drivers (15) were more likely than distraction-averse drivers (11) to report a crash or near-crash in the past twelve months
Figure 10-24 Had a Crash or Near-Crash in Past Year
by Driver Type
Q23 Have you been involved in a crash or near-crash as a driver in the past year (plt0001) Base All respondents Unweighted N=See Figure
106
50
40
30
20
10
0 Distraction‐Averse Driver Distraction‐Prone Driver
(N=382) (N=342)
182
92
Figure 10-25 shows the proportion of respondents who were distracted at the time of their last crash or near-crash by driver type Distraction-prone drivers (18) were twice as likely as distraction-averse drivers (9) to say they were distracted at the time of their last crash or near-crash
Figure 10-25 Was Distracted During Last Crash or Near-Crash Experience
by Driver Type
Q23a Were you distracted at the time of the LAST [crashnear-crash] you were in (plt0001) Base Drivers who were in a crash or near-crash in the past year Unweighted N=See Figure
107
Distraction‐Averse Drivers (N=3700) Distraction‐Prone Drivers (N=2301)
100
905
820 80
60
40
20 113
27
0 Hands‐free Hand‐held Same Neither
25 33 24 22
Figure 10-26 shows which phone call method is perceived as safer by driver type Distraction-prone drivers are more likely than distraction-averse drivers to say that using a hands-free cell phone while driving is safer than using a handheld cell phone (91 versus 82) While very few distraction-prone drivers (3) thought that neither method was safer more than 1 in 10 distraction-averse drivers (11) indicated that neither method was safer than the other
Figure 10-26 Safer to Use Hands-Free or Handheld Phone While Driving
by Driver Type
Q24b Which is safer using a [hands-free cell phone or using a handheld cell phone] (plt0001) Base All respondents Unweighted N=See Figure
108
510
417
36 09
400
537
35 15 0
20
40
60
80
100
Yes No Depends Already have one
Distraction‐Averse Drivers (N=3700) Distraction‐Prone Drivers (N=2301)
Figure 10-27 shows respondentsrsquo attitudes toward the use of apps that prevent texting and making phone calls while driving by driver type Distraction-averse drivers were more likely than distraction-prone drivers to say that they would use a blocking app while driving (51 vs 40) A small percentage of respondents (1 of distraction-averse and 2 of distraction-prone) already have a smartphone app that blocks calls and texting while driving
Figure 10-27 Would Use App to Block Calls and Texts While Driving
by Driver Type
Q24c There are phone apps available to block phone calls and text messaging while driving Would you use such an app (plt0001) Base All respondents Unweighted N=See Figure
109
CHAPTER 11 TREND ANALYSIS
As noted earlier this document presents the results of the third NHTSA National Survey on Distracted Driving Attitudes and Behaviors The first such study was conducted in 2010 and the second was conducted in 2012 Comparing responses to questions that appeared in 2010 2012 and 2015 provides insight into how distracted driving behaviors and attitudes have changed in the past 6 years All three surveys asked respondents how often they engage in a set of specific activities while driving Several activities that were not asked in 2010 and 2012 were added in 2015 while some others were removed from the 2015 survey instrument Overall respondents reported always engaging in these activities at similar rates from 2010 to 2015 In all three surveys about 1 in 3 respondents (29 in 2010 31 in 2012 and 35 in 2015) stated that they talk to other passengers in the vehicle while driving In 2010 6 of respondents reported eating or drinking when driving while this percentage was 5 in 2012 and 6 in 2015 In 2010 and 2012 6 of drivers reported making or answering phone calls on all driving trips Unlike the previous years the 2015 survey separated making and answering phone calls About 1 in 20 respondents stated that they always initiate a phone call (4) and 10 stated that they always answer phone calls while driving The percentage of respondents that adjust their car radios increased from 17 in 2010 to 22 in 2015 Respondents in 2015 (5) were more than twice as likely as respondents in 2012 (2) and 2010 (1) to use a smartphone for driving directions
110
Table 11-1 Engaging in Distracted Driving Activities (Always or All Trips)
2010 (N=5907)
2012 (N=6016)
2015 (N=6001)
a Talk to other passengers in the vehicle 286 308 348
b Eat or drink 56 50 56
Make or accept phone calls 57 63 -shy
c Make phone calls -shy -shy 38
d Answer phone calls -shy -shy 97
Read such as a book newspaper iPad or Kindle 02 04 -shy
e Read text or e-mail messages 12 14 16
f Send text or e-mail messages 08 10 10
Do personal grooming 09 10 -shy
g Talk or interact with children in the vehicle 62 90 141
h Use a portable music player including a smartphone with external speakers or with the carrsquos speakers
-shy -shy 109
Use a portable music player with headphones on 02 08 -shy
Use a portable music player with external speakers 72 64 -shy
i Adjust the car radio 172 158 220
j Change CDs DVDs or tapes 29 32 24
k Use a smartphone for driving directions 09 24 54
l Use a navigation system for driving directions 38 44 50
m Take pictures with your phone -shy -shy 08
n Use smartphone apps not including a navigation app -shy -shy 16
o Look up information on the Internet -shy -shy 14
2010 ndash Q5 Irsquom going to read a list of activities and for each Irsquod like you to tell me how often YOU do each while driving For each please tell me if you do the activity on all driving trips on most driving trips on some driving trips rarely never How often do youhellip 2012 ndash Q4 Irsquom going to read a list of activities and for each Irsquod like you to tell me how often YOU do each while driving For each please tell me if you do the activity always almost always sometimes rarely or never How often do youhellip 2015 ndash Q4 Irsquom going to read a list of common activities people do while driving For each activity Irsquod like you to tell me how often YOU do each while driving For each please tell me if you do the activity always almost always sometimes rarely or never How often do youhellip 2010 Base Respondents who drive at least a few times a year 20122015 Base All respondents Items that are no longer used in 2015 survey
111
2010 (N=5899) 2012 (N=6016) 2015 (N=6001)
50
40
30
20
10
0
153
114 97
31 23 38
Answer a Call While Driving Make a Call While Driving
All three surveys asked about respondentsrsquo willingness to answer or initiate phone calls while driving Figure 11-1 shows how often respondents in 2010 2012 and 2015 reported answering a phone call as well as making a phone call while driving The percentage of drivers who always answer phone calls while driving was higher in 2010 One in 7 drivers in 2010 (15) indicated that they always answer phone calls while driving compared to 10 of drivers in 2015 There was a slight decrease in the percentage of drivers willing to make a phone call between 2010 and 2012 (3 versus 2) This percentage increased to 4 in 2015
Figure 11-1 Answering and Making Phone Calls While Driving ( AlwaysAll Trips)
20102012 ndash Q8aQ5a When yo u RECEIVE a phone call while you are driving how often do you ANSWER the call 20102012 ndash Q9aQ6a When you are driving how often are you willing to MAKE a phone call 2015 ndash Q4cd Irsquom going to read a list of common activities people do while driving For each activity Irsquod like you to tell me how often YOU do each while driving For each please tell me if you do the activity always almost always sometimes rarely or never How often do you make phone calls How often do you answer phone calls Base 2010 ndash All drivers 20122015- All respondents Unweighted N=See Figure
112
25
20
15
10
5
0 2010 2012 2015
N=5907 N=6016 N=6001
103
60
86
There was a small increase in the proportion of drivers at least sometimes sending text messages or e-mails when driving since 2010 When asked the frequency of sending text messages or eshymails while driving 6 of respondents in 2010 10 of respondents in 2012 and 9 in 2015 reported at least sometimes sending texts or e-mails while driving
Figure 11-2 Do You Send Text Messages or E-Mails While Driving ( at Least Sometimes)
2010 ndash Q5F 2012 ndash Q4F Irsquom going to read a list of activities and for each Irsquod like you to tell me how often YOU do each while driving For each please tell me if you do the activity on all driving trips on most driving trips on some driving trips rarely or never How often do you send text messages or e-mails 2015 - Q4f Irsquom going to read a list of common activities people do while driving For each activity Irsquod like you to tell me how often YOU do each while driving For each please tell me if you do the activity always almost always sometimes rarely or never How often do you send text messages or e-mails Base All respondents Unweighted N=See Figure
113
2010 (N=510) 2012 (N=838) 2015 (N=799)
100
80 710
674 644
60
40 311
266 246
20
51 39 31
0 Increased Decreased Stayed the Same
Respondents who said they at least rarely use their cell phones for text messaging were asked if the frequency with which they send and receive text messages or e-mails in the past 30 days had changed In all three surveys most respondents reported that the rate at which they send electronic messages had stayed the same This rate has slightly increased over the years (64 in 2010 67 in 2012 and 71 in 2015) In 2010 31 of respondents reported a decrease in the rate at which they send electronic messages compared to 27 and 25 respectively in 2012 and 2015 The percentage of respondents who reported an increase was 4 in 2010 5 in 2012 and 3 in 2015
Figure 11-3 Has Your Frequency of Sending and Receiving Text Messages or E-Mails
While Driving Increased Decreased or Stayed the Same
2010 ndash Q19b In the past 30 days has the frequency with which you send and receive text messages or e-mails while driving increased decreased or stayed the same 2012 ndash Q15b In the past 30 days has the frequency with which you send and receive text messages or e-mails while driving increased decreased or stayed the same 2015 ndash Q16 In the past 30 days has the frequency with which you send and receive text messages or e-mails while driving increased decreased or stayed the same Base Respondents who have ever sent or received a text message or e-mail while driving Unweighted N=See Figure
114
2010 (N=153) 2012 (N=230) 2015 (N=191)
50
40 377
322
30 263
20
10 76 64 67 38 39
11 04 09 08 03 06 16
0 Increased Law that Dont Want Was in a Influence Awareness Bans Cell to Get a Crash Pressure of Safety Phone Use Ticket From Others
In all three surveys respondents who reported sending or receiving fewer electronic messages while driving in the past 30 days were asked what caused this decrease The most common answer from respondents in all three surveys was an increased awareness of safety (32 in 2010 38 in 2012 and 26 in 2015) followed by a law that bans cell phone use (6 in 2010 8 in 2012 and 4 in 2015) Influence of others increased from 1 in 2010 to 7 in 2012 but it declined to 2 in 2015
Figure 11-4 Reasons for Decrease in Sending and Receiving Text Messages While Driving
2010 ndash Q19c What caused the frequency with which you send and receive text messages or e-mails while driving to decrease 2012 ndash Q15c What caused the frequency with which you send and receive text messages or e-mails while driving to decrease 2015 ndash Q16a Why did your frequency of sending and receiving text messages or e-mails while driving decrease Base Respondents who report a decrease in the frequency with which they send or receive text messages or e-mails while driving in the last 30 days Unweighted N=See Figure
115
2010 (N=5907) 2012 (N=6016) 2015 (N=6001)
100
80
60
40
20
0
401 465
231 234
117 100
08 09 13 09 07 14
Talking on a Talking on a Reading Text Sending Text Cell Phone While Cell Phone With a Messages Messages Holding the Phone Hands‐Free Device or Emails or Emails
Each respondent was asked to judge how safe they would feel as a passenger if their driver was involved in a variety of situations The proportion of respondents who said they would feel safe if their drivers were talking on a handheld cell phone while driving has decreased considerably between 2010 and 2015 In 2010 nearly one quarter of respondents (23) said they would feel safe in this situation while only 12 of respondents in 2012 and 10 of respondents in 2015 said they would feel safe if the driver was engaged in a phone conversation while holding their cell phone Conversely the proportion of respondents who would feel safe in a car operated by a driver using a hands-free device has increased over the years Nearly one half of respondents in 2015 (47) would feel safe if their drivers were using a hands-free device to make or answer a phone call while driving compared to 40 of respondents in 2012 and 23 of respondents in 2010 The proportion of respondents who said they would feel safe if their drivers were reading or sending text messages while driving hasnrsquot changed over the past 5 years
Figure 11-5 Perceived Safety as a Passenger ( Safe)
2010 - Q18 Now Irsquom going to read a list of things people sometimes do while driving Tell me how safe you would feel if you were a passenger riding in a car while your driver was doing the following 20122015 - Q14Q11 Now Irsquom going to read a list of things people sometimes do while driving Tell me how safe you would feel if you were a passenger riding in a car while your driver was doing the following For each please tell me if you would feel very unsafe somewhat unsafe a little less safe or safe ndash no problem ndash would not pay any more attention Base All respondents Unweighted N=See Figure
116
2010 (N=5907) 2012 (N=6016) 2015 (N=6001)
640
890
664
867
666
875
0
20
40
60
80
100
Driver is Talking on a Cell Phone Driver is Sending Text Messages or Emails
In all three surveys most respondents reported that they would be very or somewhat likely to say something if their drivers were sending messages or talking on a handheld cell phone while driving Across all 3 years nearly 9 in 10 respondents would be very likely or somewhat likely to do or say something to the driver if their drivers were sending text messages or e-mails In 2015 respondents (67) were slightly more likely to say that they would intervene if their drivers were talking on the phone while driving than were respondents (64) in 2010
Figure 11-6 Likelihood of Intervening if Driver Is Using a Cell Phone While Driving
201020122015 ndash Q31bxQ14bQ12 How likely are you to do or say something to your driver if theyrsquore TALKING on a handheld cell phone while driving 20102012015 ndash Q31Q14cQ13 How likely are you to do or say something to your driver if theyrsquore SENDING MESSAGES while driving Base All respondents Unweighted N=See Figure
117
2010 (N=5907) 2012 (N=6016) 2015 (N=6001)
677
930
739
935
735
917
0
20
40
60
80
100
Support a Law Banning Talking on Hand‐ Support a Law Banning Texting or Held Cell Phone While Driving Emailing While Driving
The three surveys asked respondents if they support a law banning talking on a handheld cell phone while driving Support for such laws increased slightly from 2010 (68) to 2012 and 2015 (74) In all three surveys an overwhelming majority of respondents supported laws banning texting or e-mailing while driving with 93 of respondents in 2010 94 in 2012 and 92 in 2015 supporting such laws
Figure 11-7
Do You Support a Law Banning Talking on a Handheld Cell Phone While Driving or a Law Banning Texting or E-Mailing While Driving ( Yes)
201020122015 ndash Q21Q17Q19 Do you support a State law banning talking on a handheld cell phone while driving 201020122015 ndash Q21bQ17bQ19b Do you support a State law banning texting or e-mailing while driving Base All respondents Unweighted N=See Figure
118
2010 2012 2015
100
80
60
40
20
0
470 490 523 530 535 558
Talking on a Hand‐Held Cell Phone Sending Text Messages
Those who reported living in a State that bans talking on a handheld cell phone andor sending text messages while driving were further asked how likely one would be to get ticketed for such infractions Figure 11-8 shows the perceptions of enforcement for infractions related to talking on a handheld cell phone and textinge-mailing while driving More than half of the respondents in 2012 and 2015 said they were very likely or somewhat likely to be ticketed if they used a handheld phone or texted or e-mailed while driving
Figure 11-8 Likelihood of Ticket for Using Cell Phone While Driving
( VerySomewhat Likely)
201020122015 ndash Q20bQ16aQ17a Assume that over the next 6 months someone frequently talks on a handheld cell phone while driving How likely do you think that person would be to receive a ticket for taking on a cell phone while driving 2010 - Unweighted N=1760 2012 - Unweighted N=4158 2015 ndash Unweighted N=4383 Base Respondents that report living in a State that bans talking on a handheld cell phone while driving 201020122015 ndash Q20fQ16cQ17b Assume that over the next 6 months someone frequently sends text messages or e-mails or [uses apps] while driving How likely do you think that person would be to receive a ticket for talking on a cell phone while driving Base Respondents that report living in a State that bans sending text messages and e-mails while driving 2010 - Unweighted N=2400 2012 - Unweighted N=5173 2015 ndash Unweighted N=5458
119
2010 (N=5907) 2012 (N=6016) 2015 (N=6001) 100
80 707
631 596
60
40
20
36 02 03
0
Stopped for Using Hand‐Held Cell Saw a Message in Past 30 Days Phone
In all three surveys the respondents were asked whether they had been stopped by police for using a cell phone while driving and whether they had seen or heard an educational message that discourages cell-phone-related distracted driving in the past month In both 2010 and 2012 fewer than 1 of respondents reported being stopped by police in the past 30 days for using a handheld cell phone while driving In 2015 nearly 4 of respondents reported having been stopped by the police for using a handheld phone while driving
There was a steady increase over the three surveys of the proportion of respondents who had seen a message in the past 30 days that discourages drivers from talking on phones or sending electronic messages while driving including 60 of respondents in 2010 63 in 2012 and 71 in 2015
Figure 11-9
Was Respondent Stopped by Police for Using a Handheld Cell Phone While Driving Percentage of Respondents Exposed to Messages Discouraging Distracted Driving -
Past 30 Days ( Yes)
20102012 ndash Q22bQ18b Were you personally stopped by police for using a handheld cell phone while driving in the past 30 days 2015 ndash Q20 Have you ever been personally stopped by the police for using a handheld cell phone while driving 201020122015 ndash Q23Q19Q21 Now I would like to ask you a few questions about educational or other types of activities In the past 30 days have you seen or heard any messages that encourage people not to talk on phones or send electronic messages while driving This could be public service announcements on TV messages on the radio signs on the road news stories or something else Base All respondents Unweighted N=See Figure
120
2010 2012 2015 50
40
30
20
10
0
136 134 123
60 40
134
Had a CrashNear‐Crash Was Talking on The Phone Sending Text Messages
The proportion of respondents involved in a crash or near-crash as a driver has decreased slightly between 2010 and 2015 In 2010 14 of respondents indicated they had been involved in a crash or near-crash in the past year compared to 12 of respondents in 2015 Although the proportion of respondents involved in a crash or near-crash has decreased over the past 6 years 2015 respondents (13) were three times as likely as 2012 respondents (4) and twice as likely as 2010 respondents (6) to state they were talking on the phone or sending or reading text messages or e-mails at the time of the crash or near-crash
Figure 11-10 Exposure to Distracted Driving Crash
201020122015 ndash Q25Q21Q23 Have you been involved in a crash or near-crash as a driver in the past year Base All respondents 2010 - Unweighted N=5907 2012 - Unweighted N=6016 2015 ndash Unweighted N=6001 20102012 ndash Q25aQ21a Were you using a cell phone at the time of the last crashnear-crash you were in 2015 ndash Q23ab Were you distracted at the time of the last crashnear-crash you were in How were you distracted at the time of the crashnear-crash Base Had a crash in the past year 2010 - Unweighted N=718 2012 - Unweighted N=805 2015 ndash Unweighted N=720
121
CONCLUSION
The 2015 National Survey on Distracted Driving Attitudes and Behaviors is the third in a series of national studies conducted by NHTSA to assess the attitudes and behaviors toward distracted driving in the United States and to increase the understanding of this behavior to inform the development of effective countermeasures and interventions Telephone interviews were conducted with 6001 drivers across the United States and the responses were weighted to represent the driving population of the United States
Overall 90 of respondents own cell phones Cell phone use while driving is widespread Forty-two percent of drivers answer their cell phones at least some of the time when driving and 56 of surveyed drivers continue to drive as they engage in the phone conversation One-third of drivers (34) are willing to make phone calls at least some of the time when driving Of these drivers many have to take their eyes off the road at least momentarily to initiate the call because 29 of them enter the phone number manually and 33 scroll through saved numbers to make a selection
A large portion of drivers do not believe that their driving performance is affected by cell phone use More than half (53) of drivers who talk on cell phones while driving believe that there is no difference in their driving while on versus off the cell phone On the other hand some drivers do notice deterioration in their driving performance Twelve percent state that they tend to drive more slowly when using cell phones 20 say that they are more distracted and not as aware and 1 say that they drift out of their lane or drive erratically (1) Interestingly 4 of drivers believe that they are more focused and pay more attention to driving when they are on the phone
Respondentsrsquo perceptions of the safety of cell phone-distracted driving are different when they are not drivers but rather passengers in a car driven by someone who is talking on a cell phone Overall 65 of respondents would feel very or somewhat unsafe if their drivers were talking on a handheld cell phone while driving Distraction-averse people (56) were much more likely to feel very unsafe than the distraction-prone people (22) in this driving situation Two-thirds (67) of respondents stated that they would be very or somewhat likely to do or say something to the driver if heshe was talking on a cell phone
Sending text messages or e-mails is not as widespread among drivers as talking on the cell phone while driving Four out of 5 (80) respondents stated that they never send text messages or eshymails while driving while 9 reported that they send text messages at least sometimes and 11 reported that they rarely do Of drivers who do send electronic messages 44 stated that they wait until they reach a stop light or stop sign to send the text message and 14 continue to drive while they write the message One-third of drivers (31) who send text messages or e-mails while driving believe that there is no difference in their driving compared to times when they are not texting However 34 reported they are distracted and not as aware 13 reported that they drive more slowly and 4 reported that they tend to drift out of their lane of travel
A large majority of respondents reported that they would feel very unsafe if their drivers were sending e-mails or text messages (86) or reading e-mails or text messages (81) Overall 87
122
of respondents indicated that they were at least somewhat likely to intervene if they were passengers in a vehicle in which the driver was sending text messages or e-mails
About 1 in 12 respondents (8) stated they used apps at least sometimes while driving not including navigation apps Musicradio apps (eg Pandora) (42) Facebook (13) and Internet search engines (eg Chrome Safari) (7) were the most frequently cited apps Respondents said that they were more likely to use a smartphone app while driving when they are in need of directions or other information (23) for musicentertainment (14) or when they are bored (13)
Few respondents reported involvement in crashes or near-crashes in the past year In all 7 of drivers reported a crash and 5 reported a near-crash in the past year Of these events 14 of drivers were distracted when the crash or near-crash occurred Distraction-prone drivers (18) were twice as likely as distraction-averse drivers (9) to say they were distracted at the time of their last crash or near-crash
Respondents perceived distracted driving behaviors like talking on a cell phone while driving to be fairly prevalent with 69 of respondents estimating that more than half of drivers talk on the cell phone at least occasionally However respondents perceived texting while driving to be a less frequent occurrence with 48 of respondents estimating that more than half of drivers send electronic messages at least occasionally while driving
The majority of respondents support laws banning talking on handheld cell phones and texting or e-mailing while driving Almost three-quarters of respondents (74) support a ban on cell phone use while driving and 92 support a law banning texting or e-mailing while driving Distraction-averse drivers were more likely to support a State law banning talking on a handheld cell (82) while distraction-prone drivers were more likely to oppose such law (36)
Respondents are generally aware of laws that ban talking on cell phones or texting while driving in their State when the State in which the respondent is located has a law but respondent perceptions are less accurate when asked about such laws when there is no such law in the State In States with laws that ban handheld cell phone use while driving 83 of drivers were aware of the law and an additional 9 thought their State probably had such a law while only 4 incorrectly thought their State did not have such a law In States without laws that ban talking on cell phones while driving 39 knew that their State did not have such a law while 29 incorrectly thought that their State had such a law and an additional 12 thought the State probably had such a law when it did not
In States that ban sending or reading text messages and e-mails while driving 64 of drivers knew about the law and an additional 14 thought the State probably had such a law while only 8 incorrectly thought their State did not have such a law In States without laws that ban sending and receiving text messages and e-mails while driving 29 were aware that their State did not have such a law while 33 incorrectly thought that their State had a law and an additional 14 thought the State probably had such a law when it did not
123
Although 14 States and the District of Columbia have laws banning the use of handheld cell phones while driving most respondents who reside in these States were not aware of any special enforcement efforts and respondents were about equally split on whether offenders of the law will be ticketed
Overall 54 of respondents thought a driver who regularly talks on a cell phone while driving was likely to get a ticket in the next 6 months while 43 stated that it was unlikely that the driver would be ticketed Drivers with less formal education were more likely to believe that the driver would be ticketed while those with more formal education were more likely to believe that the driver would not be ticketed
More than half of respondents (56) believed that it was at least somewhat likely that drivers who frequently send text messages or e-mails while driving would get a ticket for this infraction in the next 6 months 42 think it is somewhat or very unlikely
Safe driving messages are reaching drivers with 71 reporting that they had seen or heard a message discouraging distracted driving in the past 30 days Drivers who drove every day were more likely than those who drove less frequently to report having seen or heard these messages The media sources for these messages were TV reported as the source by 68 of respondents billboards as reported by 36 of respondents and radio as reported by 26 of respondents
Although 94 of respondents reported having heard or seen at least one safe driving slogan in the past 30 days most of the messages associated with cell phone distracted driving are reaching far fewer drivers Approximately 51 of respondents reported hearing or seeing ldquoit can waitrdquo while just over a quarter of drivers have heard ldquoU Drive U Text U Payrdquo (28) or ldquoOne Text or Call Could Wreck It Allrdquo (28) About 1 in 5 drivers have heard ldquoNo Phone Zonerdquo (22) ldquoOn the Road Off the Phonerdquo (19) and ldquoPut It Downrdquo (18) in the past 30 days
The percentage of drivers who send text messages while driving has remained the same over the years with 1 of respondents reporting they always send text messages or emails and 1-2 say they always read their texts while driving
The proportion of respondents who said they would feel safe if their drivers were talking on a handheld cell phone while driving has decreased considerably between 2010 and 2015 from 23 in 2010 to 10 in 2015 Conversely the proportion of respondents who would feel safe in a car operated by a driver using a hands-free device has increased over the years Nearly one half of respondents in 2015 (47) would feel safe if their drivers were using a hands-free device to make or answer a phone call while driving compared to 40 of respondents in 2012 and 23 of respondents in 2010
Support for laws banning handheld cell phone use increased from 68 in 2010 to 74 in 2012 and stayed the same (74) in 2015 Support for laws banning texting or e-mailing while driving has remained about the same over the 6-year period with 93 of respondents in 2010 some 94 of respondents in 2012 and 92 of respondents in 2015 supporting such a law
124
There was a significant increase in the proportion of respondents reporting that they had been stopped by police for talking on a cell phone from 2010 to 2015 with less than 1 of respondents in 2010 (02) and 2012 (03) and 4 of respondents in 2015
Finally although the proportion of respondents involved in a crash or near-crash has decreased slightly between 2010 and 2015 cell-phone-related motor vehicle crashes have increased considerably over the past 5 years The proportion of respondents stating that they were talking on the phone sending or reading text messages or e-mails at the time of the crash has doubled between 2012 (6) and 2015 (13)
125
Appendix A
Questionnaire
A‐1
5939 NHTSA Distracted Driving Abt SRBI V111
2015 National Survey of Distracted Driving Attitudes and Behaviors Questionnaire
Sample Read-ins State [sampstat] Metro Status Telephone number
INTRODUCTION ndash SCREENING QUESTIONS
QLAN WHICH LANGUAGE INTERVIEW CONDUCTED IN
1 English 2 Spanish
5939C CELL SAMPLE SC1 Hello I am _____ calling on behalf of the US Department of Transportation We are conducting a national study of Americans driving habits and attitudes
[IF NEEDED Any answers you give are kept strictly private A federal agency may not conduct or sponsor and a person is not required to respond to nor shall a person be subject to a penalty for failure to comply with a collection of information subject to the requirements of the Paperwork Reduction Act unless that collection of information displays a current valid OMB Control Number The OMB number for this solicitation is 2127-0665 and it expires on November 30 2017]
Are you currently driving 1 Yes THANK amp END CALLBACK 2 No 9 Refused THANK AND END
SC1a Are you in a safe and suitable place to talk right now 1 Yes 2 No call me later SCHEDULE CALLBACK 3 No CB on land-line RECORD NUMBER schedule call back 4 Cell phone for business only THANK amp END - BUSINESS 9 Refused THANK AND END
A‐2
SC2 As I mentioned I am calling on behalf of the Department of Transportation This collection of information is VOLUNTARY and will be used for statistical purposes only so that we may develop and evaluate programs designed to reduce the number of traffic-related injuries and deaths The interview will take approximately 20 minutes Your participation is anonymous and we will not collect any personal information that would allow anyone to identify you Are you 16 years old or older
[IF NEEDED If you would like to learn more about the survey you can call our toll-free number at 1-800shy244-4135 or visit the DOT website at wwwdistractiongov The OMB number for this solicitation is 2127shy0665 and it expires on November 30 2017]
1 Yes 2 Yes no time SCHEDULE CALLBACK 3 No SCREEN OUT 9 Refused THANK AND END
Qualified Level 1
SC2a How many people 16 and older live in your household [ENTER NUMBER 1-10] 10 10 or more 98 NONE SCREEN OUT SKIP TO SCR1 99 Donrsquot knowRefused THANK AND END
SC3Not counting (thisthese) cell phone(s) do you also have a regular landline phone at home 1 Cell is only phone SKIP TO SA3 2 Has regular phone at home 9 Donrsquot knowRefused THANK AND END
SC4Of all the telephone calls that you or your family receives are READ LIST 1 All or almost all calls received on cell phones 2 Some received on cell phones and some on regular phones (SCRN OUT NOT CELL MOSTLY) SKIP TO SCR1 3 Very few or none on cell phones (SCRN OUT NOT CELL MOSTLY) SKIP TO SCR1 8 (VOL) Donrsquot know (SCRN OUT NOT CELL MOSTLY) SKIP TO SCR1 9 (VOL) Refused (SCRN OUT NOT CELL MOSTLY) SKIP TO SCR1
SC5 Thinking about just your LANDLINE home phone NOT your cell phone if that telephone rang when someone was home under normal circumstances how likely is it that the phone would be answered Would you say it is hellip READ LIST 1Very likely the landline phone would be answered 2 Somewhat likely 3 Somewhat unlikely 4 Very Unlikely or 5 Not at all likely the landline phone would be answered 8 (VOL) Donrsquot know 9 (VOL) Refused
A‐3
5939L LANDLINE SAMPLE SL1 Hello I am _____ calling on behalf of the US Department of Transportation We are conducting a national study of Americans driving habits and attitudes This collection of information is VOLUNTARY and will be used for statistical purposes only so that we may develop and evaluate programs designed to reduce the number of traffic-related injuries and deaths The interview will take approximately 20 minutes Your participation is anonymous and we will not collect any personal information that would allow anyone to identify you
[IF NEEDED If you would like to learn more about the survey you can call our toll-free number at 800shy244-4135 or visit the DOT website at wwwdistractiongov A federal agency may not conduct or sponsor and a person is not required to respond to nor shall a person be subject to a penalty for failure to comply with a collection of information subject to the requirements of the Paperwork Reduction Act unless that collection of information displays a current valid OMB Control Number The OMB number for this solicitation is 2127-0665 and it expires on November 30 2017]
How many people 16 and older live in this household [ENTER NUMBER 1-10] 10 10 or more 98 NONE SCREEN OUT 99 Donrsquot knowRefused THANK AND END
Qualified Level 1
ASK IF SL1=1 SL1a May I speak with that person
1 Rspn on line SKIP TO SA3 2 Rspn called to phone GO TO SL1c 3 Rspn unavailable SCHEDULE CALLBACK 9 Refused THANK AND END
ASK IF SL1gt1 SL1b In order to select just one person to interview may I please speak to the person in your household 16 or older who (RANDOMIZE has had the most recentwill have the next) birthday
1 Rspn on line GO TO SA3 2 Rspn called to phone 3 Rspn unavailable SCHEDULE CALLBACK 9 Refused THANK AND END
A‐4
SL1c Hello I am _____ calling on behalf of the US Department of Transportation We are conducting a national study of Americans driving habits and attitudes This collection of information is VOLUNTARY and will be used for statistical purposes only so that we may develop and evaluate programs designed to reduce the number of traffic-related injuries and deaths The interview will take approximately 20 minutes Your participation is anonymous and we will not collect any personal information that would allow anyone to identify you
[IF NEEDED If you would like to learn more about the survey you can call our toll-free number at 1-800shy244-4135 or visit the DOT website at wwwdistractiongov A federal agency may not conduct or sponsor and a person is not required to respond to nor shall a person be subject to a penalty for failure to comply with a collection of information subject to the requirements of the Paperwork Reduction Act unless that collection of information displays a current valid OMB Control Number The OMB number for this solicitation is 2127-0665 and it expires on November 30 2017]
Could I please confirm that you are a household member 16 or older 1 Yes 2 No 9 Refused
SCHEDULE CALLBACK THANK AND END ndash Soft Refusal
SKIP TO SA3
A‐5
5939O LANDLINE OVERSAMPLE SO1 Hello I am _____ calling on behalf of the US Department of Transportation We are conducting a national study of Americans driving habits and attitudes This collection of information is VOLUNTARY and will be used for statistical purposes only so that we may develop and evaluate programs designed to reduce the number of traffic-related injuries and deaths The interview will take approximately 20 minutes Your participation is anonymous and we will not collect any personal information that would allow anyone to identify you
[IF NEEDED If you would like to learn more about the survey you can call our toll-free number at 1-800shy244-4135 or visit the DOT website at wwwdistractiongov A federal agency may not conduct or sponsor and a person is not required to respond to nor shall a person be subject to a penalty for failure to comply with a collection of information subject to the requirements of the Paperwork Reduction Act unless that collection of information displays a current valid OMB Control Number The OMB number for this solicitation is 2127-0665 and it expires on November 30 2017]
How many people 16 to 34 live in this household [ENTER NUMBER 1-10] 10 10 or more 98 NONE SCREEN OUT 99Donrsquot knowRefused THANK AND END
Qualified Level 1
ASK IF SO1=1 SO1a May I speak with that person 1 Rspn on line SKIP TO SA3 2 Rspn called to phone GO TO SO1c 3 Rspn unavailable SCHEDULE CALLBACK 9 Refused THANK AND END
ASK IF SO1gt1 SO1b In order to select just one person to interview may I please speak to the person in your household 16 to 34 who (has had the most recentwill have the next) birthday 1 Rspn on line GO TO SA3 2 Rspn called to phone 3 Rspn unavailable SCHEDULE CALLBACK 9 Refused THANK AND END
A‐6
SO1c SO1d Hello I am _____ calling on behalf of the US Department of Transportation We are conducting a national study of Americans driving habits and attitudes This collection of information is VOLUNTARY and will be used for statistical purposes only so that we may develop and evaluate programs designed to reduce the number of traffic-related injuries and deaths The interview will take approximately 20 minutes Your participation is anonymous and we will not collect any personal information that would allow anyone to identify you
[IF NEEDED If you would like to learn more about the survey you can call our toll-free number at 1-800shy244-4135 or visit the DOT website at wwwdistractiongov A federal agency may not conduct or sponsor and a person is not required to respond to nor shall a person be subject to a penalty for failure to comply with a collection of information subject to the requirements of the Paperwork Reduction Act unless that collection of information displays a current valid OMB Control Number The OMB number for this solicitation is 2127-0665 and it expires on November 30 2017]
Could I please confirm that you are a household member 16 to 34 1 Yes 2 No SCHEDULE CALLBACK 9 Refused THANK AND END
SA3 Record gender from observation (Ask only if Necessary) 1 Male 2 Female
Qualified Level 2
GENERAL DRIVING INFORMATION
Q1 How often do you drive a motor vehicle regardless of whether it is for work or for personal use Every day almost every day a few days a week a few days a month a few days a year or do you never drive DO NOT READ LIST
1 Every day 2 Almost every day 3 Few days a week 4 Few days a month 5 Few days a year 6 Never SKIP TO D1 [SCREEN OUT ndash DEMOS ONLY] 7 (VOL) Other (SPECIFY) 8 (VOL) Donrsquot know SKIP TO D1 [SCREEN OUT ndash DEMOS ONLY] 9 (VOL) Refused SKIP TO D1 [SCREEN OUT ndash DEMOS ONLY]
A‐7
Q1a Is the vehicle you drive most often a car van motorcycle sport utility vehicle pickup truck or other type of truck [NOTE IF RESPONDENT DRIVES MORE THAN ONE VEHICLE OFTEN ASK] ldquoWhat kind of vehicle did you LAST driverdquo
1 Car 2 Van or minivan 3 Motorcycle 4 Pickup truck 5 Sport Utility Vehicle 6 Other truck (SPECIFY) 7 (VOL) Other (SPECIFY) 8 (VOL) Donrsquot know 9 (VOL) Refused
Q1bWhat model year is that vehicle RECORD 4 DIGIT YEAR [Range 1900-2015] 9998=Donrsquot Know 9999=Refused
PERCEPTIONS OF ENFORCEMENT
Q2 When you pass a driver stopped by the police IN THE DAYTIME what do you think the stop was most likely for DO NOT READ LIST MULTIPLE RECORD
1 Speeding 2 Seat Belt Violation 3 Drunk Driving 4 Reckless Driving 5 Cell phone use 6 Texting or sending e-mails while driving 7 Registration Violation 8 Other (SPECIFY) 98 (VOL) Donrsquot know 99 (VOL) Refused
Q2aWhen you pass a driver stopped by the police IN THE NIGHTTIME what do you think the stop was for DO NOT READ LIST MULTIPLE RECORD
1 Speeding 2 Seat Belt Violation 3 Drunk Driving 4 Reckless Driving 5 Cell phone use 6 Texting or sending e-mails while driving 7 Registration Violation 8 Other (SPECIFY) 98 (VOL) Donrsquot know 99 (VOL) Refused
A‐8
OWNERSHIP OF MOBILE ELECTRONICS
Q3 Do you CURRENTLY own any of the following devices READ A-G AND CODE FOR EACH A A cell phone [Code 1 (Yes) if mentions any cell phone including a smartphone] B A lsquosmartphonersquo such as a Droid iPhone or Blackberry C A portable music player such as a CD player or iPod apart from a smartphone D A portable navigation system such as TomTom or Garmin apart from a smartphone E A navigation system built into the vehicle such as OnStar or Sync F [ASK IF 3A OR 3B=1] A Bluetooth or other hands-free device for your cell phone such as one that plugs into the phone works wirelessly or works through your vehiclersquos car stereo
1 Yes 2 No 3 MixedShared Use 8 (VOL) Donrsquot know 9 (VOL) Refused
ASK IF Q3F=1 Q3a1 Is the vehicle that you drive most often equipped with built-in hands-free Bluetooth capability
1 Yes 2 No SKIP TO Q4 8 (VOL) Donrsquot know SKIP TO Q4 9 (VOL) Refused SKIP TO Q4
Q3a2 Have you paired or ldquoconnectedrdquo your phone with the vehicle via Bluetooth 1 Yes 2 No 8 (VOL) Donrsquot know 9 (VOL) Refused
A‐9
FREQUENCY OF DISTRACTED DRIVING
Q4 Irsquom going to read a list of common activities people do while driving For each activity Irsquod like you to tell me how often YOU do each while driving For each please tell me if you do the activity always almost always sometimes rarely or never How often do youhellip READ A-O AND CODE FOR EACH A Talk to passengers in the vehicle B Eat or drink C Make phone calls D Answer phone calls E READ text or e-mail messages F SEND text or e-mail messages G Talk or interact with children in the vehicle H Use a portable music player including a smartphone with external speakers or with the carrsquos speakers I Adjust the car radio J Change CDs DVDs or tapes K Use a Smartphone for driving directions L Use a navigation system for driving directions M Take pictures with your phone N Use smartphone apps not including a navigation app O Look up information on the Internet
1 Always 2 Almost always 3 Sometimes 4 Rarely 5 Never 8 (VOL) Donrsquot know 9 (VOL) Refuse
ANSWERING AND MAKING CELL PHONE CALLS WHILE DRIVING
ASK Q5 IF Q3a=1 OR Q3b=1 Q5 When not in use where do you put your cell phone while driving DO NOT READ LIST MULTIPLE RECORD
1 Pocket or Purse 2 Cup holder or tray 3 Lap 4 Passenger seat 5 Mount on dashboard 6 In hand 7 Backseat 8 Glove box 9 Built-in enclosed storage space (other than glove box) 10 Other (specify) 98 (VOL) Donrsquot know 99 (VOL) Refuse
A‐10
IF Q4C=5 AND Q4D=5 SKIP TO Q8 Q5a Which of the following do you USUALLY do when making or receiving a call while driving MULTIPLE RECORD
1 Hold the phone in your hand 2 Squeeze the phone between your ear and shoulder 3 Use a hands-free earpiece 4 Use a built-in-car system (OnStar Sync built-in Bluetooth) 5 Use the cell phonersquos speakerphone feature 6 Does it vary 8 (VOL) Donrsquot know 9 (VOL) Refuse
IF Q4D=5 SKIP TO Q6 Q5b What are the reasons you are more likely to ANSWER a call while driving DO NOT READ LIST MULTIPLE RECORD
1 Who is calling 2 How important I think the call is 3 Call is work-related 4 I answer all calls 5 Call is from someone I know 6 Call is personal or social 7 Call is routine or expected 8 Urgentemergency situation 9 Non-stressful traffic conditions 10 Bluetooth or hands-free available 11 Availability of the phone 12 In need of directions or other information 13 Call is unexpected 14 Personal safety 15 Boredom 16 Traveling at a low speed 17 Call is from a number I donrsquot recognize 18 Time of day 19 Good weather conditions 20 Tired (talking keeps me awake) 21 If State law allows 22 No police officers in sight 23 Other (SPECIFY) 98 (VOL) Donrsquot know 99 (VOL) Refuse
Q5c When you answer a call while driving do you USUALLYhellip READ LIST
1 Answer and continue to drive while completing the conversation 2 Answer and promptly pull over to a safe location 3 Answer and inform the caller you will call back later 4 Pull over to a safe location first and then speak to the caller 5 Hand the phone to a passenger to answer if you have one 7 (VOL) I donrsquot answer calls while driving 8 (VOL) Donrsquot know 9 (VOL) Refuse
A‐11
IF Q4C=5 SKIP TO Q7 Q6 What are the reasons you are more likely to MAKE a call while driving DO NOT READ LIST MULTIPLE RECORD
1 How importanturgent I think the call is 2 Work-related 3 Personal or social 4 In need of directions or other information 5 Who Irsquom calling 6 Report a traffic crashemergency 7 Boredom 8 Report a medical emergency 9 Availability of the phone 10 Non-stressful traffic conditions 11 Personal Safety 12 I think itrsquos safe to call 13 Time of day 14 Traveling at a low speed 15 Tired (talking keeps me awake) 16 Good weather conditions 17 No police officers in sight 18 If State law permits 19 Other (SPECIFY) 98 (VOL) Donrsquot know 99 (VOL) Refuse
Q6a How do you MAKE a call while driving Please answer Yes or No after I read each item READ LIST MULTIPLE RECORD
1 Manual dialing 2 Voice-dial (speaking a name or phone number) 3 Speed dial or favorites 4 Scroll through saved numbers and select 5 Does it vary 8 (VOL) Donrsquot know 9 (VOL) Refuse
A‐12
Q7 How if at all would you say your driving behavior is different when you are TALKING on the phone DO NOT READ LIST MULTIPLE RECORD
1 No difference 2 Drive slower 3 Drift out of the lane or roadway 4 Change lanes less frequently 5 Avoid changing lanes altogether 6 Drive faster 7 Look in your rear or side view mirrors more frequently 8 Apply the brakes suddenly 9 Look in your rear or side view mirrors less frequently 10 Increase distance from lead vehicle 11 Follow lead vehicle more closely 12 Change lanes more frequently 13 Use turn signal less regularly 14 Use turn signal more regularly 15 Other [SPECIFY] 98 (VOL) Donrsquot Know 99 (VOL) Refused
Q7a How if at all does TALKING on the phone change your behavior IN THE VEHICLE READ LIST MULTIPLE RECORD
1 Turn the radiomusic down 2 Ask others in the vehicle to be quiet 3 Put down food or drink 4 Drive with one hand on the wheel 5 Drive with only your knee on the wheel 6 Some other way (OTHER SPECIFY) 7 (VOL) No differencemy behavior doesnrsquot change 8 (VOL) Donrsquot Know 9 (VOL) Refused
A‐13
Q7b Is there any driving situation in which you would NEVER TALK on a phone while driving DO NOT READ MULTIPLE RECORD
1 When moving (not at stop signs or stop lights) 2 On long trips 3 On short trips 4 Fast moving traffic (freeway) 5 Bumper to bumper traffic 6 On an empty roadway 7 Merging with traffic 8 Bad weather 9 Driving a familiar route 10 Driving in unfamiliar arearoads 11 Driving at nighttime 12 Marked school zones 13 Residential streets 14 Parking lots 15 With other adult passengers in the car 16 With a baby or child on board 17 Windingcurving roads 18 Marked construction zones 19 When I see a police officer 20 When driving in a place where it is prohibited 21 Other [SPECIFY] 98 (VOL) Donrsquot Know 99 (VOL) Refused
TEXTING OR E-MAILING WHILE DRIVING
IF Q4F=5 SKIP TO Q9 Q8 When you SEND a text message or e-mail while driving do you USUALLYhellip READ LIST
1 Continue to drive while completing the message 2 Pull over to a safe location to send the message 3 Hand the phone to a passenger to do your messaging 4 Use a Voice Command feature (speech dictation) 5 Wait until you reach a red light or stop sign to send the message 7 (VOL) I do not send text messages or e-mail while driving 8 (VOL) Donrsquot know 9 (VOL) Refuse
A‐14
Q8a What makes it more likely you will SEND a text message or e-mail while driving DO NOT READ LIST MULTIPLE RECORD
1 How important I think the message is 2 Who Irsquom messaging 3 Work-related 4 Personal or social 5 In need of directions or other information 6 Non-stressful traffic conditions 7 Boredom 8 Time of day 9 I think itrsquos safe to send a text message or an e-mail 10 Personal Safety 11 Report a traffic crashemergency 12 Traveling at a low speed 13 Report a medical emergency 14 Good weather conditions 15 If State law permits 16 If no police officers are in sight 17 Other (SPECIFY) 98 (VOL) Donrsquot know 99 (VOL) Refuse
Q8b How if at all would you say your driving behavior is different when you are SENDING TEXT OR E-MAIL MESSAGES while driving DO NOT READ LIST MULTIPLE RECORD
1 No difference 2 Drive slower 3 Drift out of the lane or roadway 4 Change lanes less frequently 5 Avoid changing lanes altogether 6 Drive faster 7 Look in your rear or side view mirrors more frequently 8 Apply the brakes suddenly 9 Look in your rear or side view mirrors less frequently 10 Increase distance from lead vehicle 11 Follow lead vehicle more closely 12 Change lanes more frequently 13 Use turn signal less regularly 14 Use turn signal more regularly 15 Other [SPECIFY] 98 (VOL) Donrsquot Know 99 (VOL) Refused
A‐15
Q8c How if at all does SENDING TEXT OR E-MAIL MESSAGES while driving change your behavior IN THE VEHICLE READ LIST MULTIPLE RECORD
1 Turn the radiomusic down 2 Ask others in the vehicle to be quiet 3 Put down food or drink 4 Drive with one hand on the wheel 5 Drive with only your knee on the wheel 6 Some other way (OTHER SPECIFY) 7 (VOL) No differencemy behavior doesnrsquot change 8 (VOL) Donrsquot Know 9 (VOL) Refused
Q8d Is there any driving situation in which you would NEVER SEND a text or e-mail message while driving DO NOT READ LIST MULTIPLE RECORD
1 When moving (not at stop signs or stop lights) 2 On long trips 3 On short trips 4 Fast moving traffic (freeway) 5 Bumper to bumper traffic 6 On an empty roadway 7 Merging with traffic 8 Bad weather 9 Driving a familiar route 10 Driving in unfamiliar arearoads 11 Driving at nighttime 12 Marked school zones 13 Residential streets 14 Parking lots 15 With other adult passengers in the car 16 With a baby or child on board 17 Windingcurving roads 18 Marked construction zones 19 When I see a police officer 20 When driving in a place where it is prohibited 21 Other [SPECIFY] 98 (VOL) Donrsquot Know 99 (VOL) Refused
A‐16
USING APPS WHILE DRIVING
IF Q4N=5 SKIP TO Q10 Q9 Other than navigation apps what smartphone apps do you typically use while driving DO NOT READ LIST MULTIPLE RECORD
1 Facebook 2 Facebook Messenger 3 LinkedIn 4 Skype 5 Twitter 6 YouTube 7 Instagram 8 Pandora 9 News apps 10 Games apps 11 (VOL) Other (specify) 12 Donrsquot use SKIP TO Q10 98 (VOL) Donrsquot Know 99 (VOL) Refused
Q9a When you USE smartphone apps while driving do you USUALLYhellip READ LIST
1 Continue to drive while using the app 2 Pull over to a safe location to use the app 3 Hand the phone to a passenger to use the app 4 Use a Voice Command feature (speech dictation) 5 Wait until you reach a red light or stop sign to use the app 7 (VOL) I donrsquot use smartphone apps while driving 8 (VOL) Donrsquot know 9 (VOL) Refuse
Q9b What makes it more likely you will USE smartphone apps while driving DO NOT READ LIST MULTIPLE RECORD
1 Work-related 2 Personal or social 3 In need of directions or other information 4 Non-stressful traffic conditions 5 Boredom 6 Time of day 7 Personal Safety 8 Report a traffic crashemergency 9 Traveling at a low speed 10 Report a medical emergency 11 Good weather conditions 12 If State law permits 13 If no police officers are in sight 14 Tired (using apps keeps me awake) 15 Other (SPECIFY) 98 (VOL) Donrsquot know 99 (VOL) Refuse
A‐17
Q9c How if at all would you say your driving behavior is different when you USE smartphone apps while driving DO NOT READ LIST MULTIPLE RECORD
1 No difference 2 Drive slower 3 Drift out of the lane or roadway 4 Drive faster 5 Avoid changing lanes altogether 6 Change lanes more frequently 7 Follow lead vehicle more closely 8 Apply the brakes suddenly 9 Change lanes less frequently 10 Increase distance from lead vehicle 11 Look in your rear or side view mirrors more frequently 12 Look in your rear or side view mirrors less frequently 13 Use turn signal less regularly 14 Use turn signal more regularly 15 Other [SPECIFY] 98 (VOL) Donrsquot Know 99 (VOL) Refused
Q9d How if at all does using smartphone apps while driving change your behavior IN THE VEHICLE READ LIST MULTIPLE RECORD
1 Turn the radiomusic down 2 Ask others in the vehicle to be quiet 3 Put down food or drink 4 Drive with one hand on the wheel 5 Drive with only your knee on the wheel 6 Some other way (OTHER SPECIFY) 7 (VOL) No differencemy behavior doesnrsquot change 8 (VOL) Donrsquot Know 9 (VOL) Refused
A‐18
Q9e Is there any driving situation in which you would NEVER use smartphone apps while driving DO NOT READ LIST MULTIPLE RECORD
1 Bad weather 2 Bumper to bumper traffic 3 Fast moving traffic (freeway) 4 When moving (not at stop signs or stop lights) 5 When I see a police officer 6 Marked construction zones 7 With a baby or child on board 8 Driving in unfamiliar arearoads 9 Merging with traffic 10 Marked school zones 11 Driving at nighttime 12 With other adult passengers in the car 13 Windingcurving roads 14 Parking lots 15 On long trips 16 On short trips 17 On an empty roadway 18 Driving a familiar route 19 Residential streets 20 When driving in a place where it is prohibited 21 Other [SPECIFY] 98 (VOL) Donrsquot Know 99 (VOL) Refused
PERCEPTIONS ABOUT DANGER OF DISTRACTIONS
Q10 How many seconds do you believe a driver can take his or her eyes off the road before driving becomes significantly more dangerous
ENTER VALUE _____ 11 11 seconds or more 98 (VOL) Donrsquot know 99 (VOL) Refuse
A‐19
Q11 Now Irsquom going to read a list of things people sometimes do while driving Tell me how safe you would feel if you were a passenger riding in a car while your driver was doing the following For each please tell me if you would feel very unsafe somewhat unsafe a little less safe or safe ndash no problem ndash would not pay any more attention READ A-L AND RECORD FOR EACH
A Talking to other passengers in the vehicle B Eating or drinking C Talking on a cell phone while holding the phone D Talking on a cell phone with a hands-free device E Reading text or e-mail messages F Sending text or e-mail messages G Talking or interacting with children in the vehicle H Adjusting the car radio tape or CD player I Using a laptop computer J Manipulating a navigation system for driving directions K Use smartphone apps not including a navigation app L Watching a movie
1 Very unsafe 2 Somewhat unsafe 3 A little less safe 4 Safe no problem would not pay any more attention 8 (VOL) Donrsquot know 9 (VOL) Refuse
Q12 How likely are you to do or say something to your driver if theyrsquore TALKING on a handheld cell phone while driving READ LIST
1 Very likely 2 Somewhat likely 3 Somewhat unlikely SKIP TO Q13 4 Very unlikely SKIP TO Q13 5 Never would intervene SKIP TO Q13 8 (VOL) Donrsquot know SKIP TO Q13 9 (VOL) Refused SKIP TO Q13
Q12a What would you say (SPECIFY) PROBE Anything Else
A‐20
Q13 How likely are you to do or say something to your driver if theyrsquore SENDING TEXT MESSAGES OR E-MAILS OR USING SMARTPHONE APPS while driving READ LIST
1 Very likely 2 Somewhat likely 3 Somewhat unlikely SKIP TO Q14 4 Very unlikely SKIP TO Q14 5 Never would intervene SKIP TO Q14 8 (VOL) Donrsquot know SKIP TO Q14 9 (VOL) Refused SKIP TO Q14
Q13a What would you say (SPECIFY) PROBE Anything Else
CHANGES IN DISTRACTED DRIVING
IF Q4C=5 SKIP TO Q15
Q14 In the past 30 days has your frequency of making phone calls while driving increased decreased or stayed the same
1 Increased SKIP TO Q15 2 Decreased 3 Stayed the same SKIP TO Q15 4 New Driver SKIP TO Q15 5 Never used a phone while driving SKIP TO Q16 8 (VOL) Donrsquot know SKIP TO Q15 9 (VOL) Refuse SKIP TO Q15
Q14a Why did your frequency of making phone calls while driving decrease DO NOT READ LIST MULTIPLE RECORD
1 Increased awareness of safety 2 Law That bans cell phone use 3 Donrsquot want to get a ticket 4 Was in a crash 5 Influencepressure from others 6 More long distance driving 7 The weather 8 Driving faster 9 Other (SPECIFY) 98 (VOL) Donrsquot know 99 (VOL) Refused
A‐21
IF Q4D=5 SKIP TO Q16 Q15 In the past 30 days has your frequency of answering phone calls while driving increased decreased or stayed the same
1 Increased SKIP TO Q16 2 Decreased 3 Stayed the same SKIP TO Q16 4 New Driver SKIP TO Q16 5 Never used a phone while driving SKIP TO Q16 8 (VOL) Donrsquot know SKIP TO Q16 9 (VOL) Refuse SKIP TO Q16
Q15a Why did your frequency of answering phone calls while driving decrease DO NOT READ LIST MULTIPLE RECORD
1 Increased awareness of safety 2 Law That bans cell phone use 3 Donrsquot want to get a ticket 4 Was in a crash 5 Influencepressure from others 6 More long distance driving 7 The weather 8 Driving faster 9 Other (SPECIFY) 98 (VOL) Donrsquot know 99 (VOL) Refused
IF Q4E=5 OR Q4F=5 SKIP TO Q17
Q16 In the past 30 days has the frequency with which you send and receive text messages or e-mails while driving increased decreased or stayed the same
1 Increased SKIP TO Q17 2 Decreased 3 Stayed the same SKIP TO Q17 4 New Driver SKIP TO Q17 5 Never used a phone while driving SKIP TO Q17 8 (VOL) Donrsquot know SKIP TO Q17 9 (VOL) Refused SKIP TO Q17
Q16a Why did your frequency of sending and receiving text messages or e-mails while driving decrease DO NOT READ LIST MULTIPLE RECORD
1 Increased awareness of safety 2 Law That bans textinge-mailing 3 Donrsquot want to get a ticket 4 Was in a crash 5 Influencepressure from others 6 More long distance driving 7 The weather 8 Driving faster 9 Other (SPECIFY) 98 (VOL) Donrsquot know 99 (VOL) Refused
A‐22
DISTRACTED DRIVING LAWS
Q17 Does [SAMPSTAT] have a law banning talking on a handheld cell phone while driving DO NOT READ LIST
1 Yes 2 Yes probably 3 No SKIP TO Q18 8 (VOL) Donrsquot Know 9 (VOL) Refused SKIP TO Q18
Q17a Assume that over the next 6 months someone frequently TALKS on a handheld cell phone while driving How likely do you think that person would be to receive a ticket for talking on a cell phone while driving READ LIST
1 Very likely 2 Somewhat likely 3 Somewhat unlikely 4 Very unlikely 8 (VOL) Donrsquot know 9 (VOL) Refused
Q18 Does [SAMPSTAT] have a law banning TEXTING E-MAILING or using APPS while driving DO NOT READ LIST
1 Yes 2 Yes probably 3 No SKIP TO Q19 8 (VOL) Donrsquot Know 9 (VOL) Refused SKIP TO Q19
Q18a Assume that over the next 6 months someone frequently sends text messages or e-mails or uses apps while driving How likely do you think that person would be to receive a ticket for this behavior READ LIST
1 Very likely 2 Somewhat likely 3 Somewhat unlikely 4 Very unlikely 8 (VOL) Donrsquot know 9 (VOL) Refused
Q19 Do you support a State law banning talking on a handheld cell phone while driving 1 Yes 2 No SKIP TO Q19b 8 (VOL) Donrsquot Know 9 (VOL) Refused SKIP TO Q19b
Q19a What do you think the fine should be for talking on a handheld cell phone while driving RECORD VALUE 0 No fine 997 $997 or more 998 (VOL) Donrsquot know 999 (VOL) Refuse
A‐23
Q19b Do you support a State law banning text or e-mail messaging or using smartphone apps while driving
1 Yes 2 No SKIP TO Q20 8 (VOL) Donrsquot Know 9 (VOL) Refused SKIP TO Q20
Q19c What do you think the fine should be for sending text or e-mail messages or using smartphone apps while driving
RECORD VALUE 0 No fine 997 $997 or more 998 (VOL) Donrsquot know 999 (VOL) Refuse
PROGRAM AWARENESS
Q20 Have you ever been personally stopped by the police for using a handheld cell phone while driving 1 Yes 2 No SKIP TO Q21 8 (VOL) Donrsquot Know SKIP TO Q21 9 (VOL) Refused SKIP TO Q21
Q20a How long ago were you stopped ENTER YEARS or MONTHS
1 Gave answer in Years SKIP TO Q20a1 2 Gave answer in Months SKIP TO Q20a2 8 (VOL) Donrsquot Know SKIP TO Q20b 9 (VOL) Refused SKIP TO Q20b
Q20a1 Enter Number of Years RANGE 1-15 98 (VOL) Donrsquot know 99 (VOL) Refused
Q20a2 Enter Number of Months RANGE 1-30 98 (VOL) Donrsquot know 99 (VOL) Refused
Q20b Did you receive a ticket or warning 1 Yes - ticket for talking on a cell phone 2 Yes - warning for talking on a cell phone 3 Yes - ticket for texting or sending an e-mail 4 Yes - warning for texting or sending an e-mail 5 No 8 (VOL) Donrsquot Know 9 (VOL) Refused
A‐24
OTHER EDUCATIONAL MESSAGES
Q21 Now I would like to ask you a few questions about educational or other types of activities In the past 30 days have you seen or heard any messages that encourage people not to talk on phones or send electronic messages while driving This could be public service announcements on TV messages on the radio signs on the road news stories or something else
1 Yes 2 No SKIP TO Q22 8 (VOL) Donrsquot Know SKIP TO Q22 9 (VOL) Refused SKIP TO Q22
Q21a Where did you see or hear these messages DO NOT READ LIST MULTIPLE RECORD
1 TV - advertisementpublic service announcement 2 TV ndash news 3 TV show storyline 4 Billboardsigns 5 Radio - advertisementpublic service announcement 6 Radio - news 7 Newspapermagazine 8 Internet adbanner 9 Personal observationon the road 10 Friendrelative 11 Educational program 12 Social networking website (Facebook MySpace Twitter) 13 Online newsblog 14 Online video (YouTube Google Video) 15 Irsquom a police officerjudge 16 Direct contact by police officer 17 Internet game 18 Other (SPECIFY) 98 (VOL) Donrsquot know 99 (VOL) Refused
A‐25
Q22 Do you recall hearing or seeing the following slogans in the past 30 days READ A-L AND RECORD FOR EACH A Friends donrsquot let friends drive drunk B Click it or Ticket C On the Road Off the Phone D Phone in One Hand Ticket in the Other E No Phone Zone F Drunk Driving Over the Limit under Arrest G Put it Down H One Text or Call Could Wreck it All I Drive Sober or Get Pulled Over J U Drive U Text U Pay K It Can Wait L Buzzed Driving is Drunk Driving
1 Yes 2 No 8 (VOL) Donrsquot Know 9 (VOL) Refused
EXPOSURE TO DISTRACTED DRIVING CRASHES Q23 Have you been involved in a crash or near-crash as a driver in the past year
1 Yes - near-crash 2 Yes - crash 3 No SKIP TO Q24 8 (VOL) Donrsquot Know SKIP TO Q24 9 (VOL) Refused SKIP TO Q24
Q23a Were you distracted at the time of the LAST [crashnear-crash] you were in 1 Yes 2 No SKIP TO Q24 8 (VOL) Donrsquot Know SKIP TO Q24 9 (VOL) Refused SKIP TO Q24
Q23b How were you distracted at the time of the [crashnear-crash] DO NOT READ LIST
1 Talking on cell phone 2 Reading electronic text 3 Sending text message or e-mail 4 Talking to passengers 5 Eating 6 Grooming 7 Daydreaming 8 Adjusting radio GPS etc 9 Something else (Specify) 98 (VOL) Donrsquot Know 99 (VOL) Refused
A‐26
PERCEPTIONS OF AND RESPONSES TO OTHER DISTRACTED DRIVERS Q24 What percentage of drivers do you believe at least occasionally TALK on a cell phone while driving
RECORD VALUE 998 (VOL) Donrsquot know 999 (VOL) Refuse
Q24a What percentage of drivers do you believe at least occasionally SEND TEXT OR E-MAIL MESSAGES OR USE SMARTPHONE APPS while driving
RECORD VALUE 998 (VOL) Donrsquot know 999 (VOL) Refuse
Q24b Which is safer using a [hands-free cell phone or using a handheld cell phone] ROTATE ORDER 1 Hands-free 2 Handheld 3 Same 4 Neither 8 (VOL) Donrsquot Know 9 (VOL) Refused
Q24c There are phone apps available to block phone calls and text messaging while driving Would you use such an app
1 Yes 2 No 3 Depends 4 Already have one 8 (VOL) Donrsquot Know 9 (VOL) Refused
DEMOGRAPHIC QUESTIONS
Now I need to ask you some basic information about you and your household Again this information is confidential and will not be used to identify you personally
D1 What is your age RECORD VALUE
RANGE 16-101998999 101 101 or older 998 (VOL) Donrsquot know 999 (VOL) Refuse
A‐27
IF (SAMPLE=LANDLINE X-SECTION OR CELL) SKIP TO D3 D2 Including yourself how many people 16 or older are living in your household at least half of the time or consider it their primary residence RECORD VALUE
RANGE 0-11998999 11 11 or more 998 (VOL) Donrsquot know 999 (VOL) Refuse
D3 How many children 15 or younger are living in your household at least half of the time or consider it their primary residence RECORD VALUE
RANGE 0-11998999 11 11 or more 998 (VOL) Donrsquot know 999 (VOL) Refuse
D4 Do you consider yourself to be Hispanic or Latino 1 Yes 2 No 8 (VOL) Donrsquot Know 9 (VOL) Refused
D5 Which of the following racial categories describe you You may select more than one READ LIST MULTIPLE RECORD
1 American Indian or Alaska Native 2 Asian 3 Black or African American 4 Native Hawaiian or other Pacific Islander 5 White 6 (VOL) Hispanic 7 (VOL) Other (SPECIFY) 9 (VOL) Refused
D6What is highest grade or year of regular school you have completed DO NOT READ
1 No formal schooling 2 First through 7th grade 3 8th grade 4 Some high school 5 High school graduate 6 Some college 7 Four-year college graduate 8 Some graduate school 9 Graduate degree 99 (VOL) Refused
A‐28
D7Do you own or rent your home 1 Own 2 Rent 3 Some other arrangement 8 (VOL) Donrsquot Know 9 (VOL) Refused
D8How many landline telephone numbers do you have in your household RECORD VALUE RANGE 0-979899 97 97 or more 98 (VOL) Donrsquot know 99 (VOL) Refuse
ASK IF SAMPLE=LL or LL OVERSAMPLE D9 Of all the telephone calls that you or your family receives are READ LIST
1 All or almost all calls received on cell phones 2 Some received on cell phones and some on regular phones 3 Very few or none on cell phones 8 (VOL) Donrsquot know 9 (VOL) Refused
D11 What is your approximate household income READ LIST
1 Less than $10000 2 $10000 but less than $15000 3 $15000 but less than $25000 4 $25000 but less than $50000 5 $50000 but less than $100000 6 $100000 but less than $150000 7 $150000 but less than $200000 8 $200000 or more 98 (VOL) Donrsquot Know 99 (VOL) Refused
D13 May I please have your zip code ENTER 5-DIGIT ZIP CODE 99998 (VOL) Donrsquot Know 99999 (VOL) Refused
That completes the survey Thank you very much for your time and cooperation If you would like information about traffic safety please visit wwwnhtsagov
SCR1 I am sorry but you are not eligible to participate in the survey today Thank you for your cooperation and I hope you have a pleasant evening
A‐29
Appendix B
Methodology
B‐1
Survey Methodology for the 2015 National Survey on Distracted Driving Attitudes and Behaviors
The goal of the 2015 National Survey on Distracted Driving Attitudes and Behavior was to obtain a snapshot of the attitudes and behaviors about distracted driving activities of drivers 16 and older in the United States Only surveys based on probability samples can be used to create mathematically sound statistical inferences about a larger target population Most statistical formulas for specifying the sampling precision (estimates of sampling variance) given particular sample sizes are premised on simple random sampling However random sampling requires an enumeration of all of the elements in the population Since no enumeration of the total population of the United States (or its subdivisions) is available all surveys of the general public are based upon complex sample designs that may employ stratification and two or more stages of sampling
A sampling design using geographic stratification (NHTSA Region) an oversample of young drivers sampling frames of households with landlines and cell phones together with an overall sample size of 6001 was developed and implemented for this survey The final sample consisted of 3372 landline respondents (562) 2128 cell phone respondents (355) and an oversample of 501 drivers 16 to 34 years old (83) Weights were developed to yield national estimates of the target population within specified limits of expected sampling variability This appendix describes the methods of sample construction and survey administration and shows the sample disposition and computation of weights
Sample Construction
Strata - The initial stage in the construction of this sample required the development of a national probability sample of the non-institutionalized population of the United States 16 and older Stratification (ie the division of the population into collectively exhaustive and mutually exclusive homogenous groups) an efficient way of achieving high statistical precision with a smaller overall sample size was employed The United States was stratified into 10 strata each consisting of the States within NHTSArsquos 10 regions15
The estimated distribution of the target population by stratum was calculated on the basis of the 2013 American Community Survey conducted by the US Census Bureau The population estimates were taken for the population 16 and older Based on these Census estimates of the geographic distribution of the target population the total sample was proportionately allocated by stratum
Oversample of respondents 16-34 - Given NHTSArsquos interest in the driving behaviors of young drivers it was very important that the subsample of drivers 16 to 34 years old in this survey be large enough for meaningful statistical analysis However the population prevalence of this age group is not large enough to generate the desired subsample size with a total sample of 6000 cases To resolve this an oversample was used to achieve an adequate sample size of people 16 to 34
15 Region 1 Connecticut Maine Massachusetts New Hampshire Rhode Island Vermont Region 2 New Jersey New York Pennsylvania Puerto Rico and the Virgin Islands Region 3 Delaware District of Columbia Kentucky Maryland North Carolina Virginia West Virginia Region 4 Alabama Florida Georgia South Carolina Tennessee Region 5 Illinois Indiana Michigan Minnesota Ohio Wisconsin Region 6 Indian Nations Louisiana Mississippi New Mexico Oklahoma Texas Region 7 Arkansas Iowa Kansas Missouri Nebraska Region 8 Colorado Nevada North Dakota South Dakota Utah Wyoming Region 9 Arizona California Hawaii Pacific Territories Region 10 Alaska Idaho Montana Oregon Washington
B‐2
Based on 2013 ACS estimates of the civilian non-institutionalized population we estimated that in a population based sample about 34 of drivers should be 16-34 Our experience with recent telephone surveys using only conventional random-digit dialing (RDD) of landline households indicates that the subsample of respondents 16 to 34 obtained by this method would fall short of the population proportion Indeed the RDD landline cross-section sample from the 2012 NSDDAB which was conducted 3 years prior to the current survey respondents 16-34 made up only 100 of the landline cross-section sample
Table B-1 shows the national population figures and projected sample distribution by age for the total target sample of 6000 respondents The fourth column shows the desired sample from a population-based sample and the last two columns show what could be expected from a conventional RDD landline approach such as that used in the 2012 NSDDAB
Table B-1 Expected Population and Sample Distribution by Age Based on 2013 Census Bureau Estimates
Target Population
Sample Distribution
Population Based
Expected Distribution Based on 2012 NSDDAB Response
(N in 1000s) n n
Total (16+)
16-24
25-34
35-44
45-64
65+
250739
39829
42626
40608
83011
44663
100
159
170
162
331
178
6000
954
1020
972
1986
1068
6000
163
439
817
2785
1796
100
27
73
136
464
300
Source US Census Bureau 2013 American Community Survey httpfactfindercensusgovfacestableservicesjsfpagesproductviewxhtmlpid=ACS_13_1YR_DP0 5ampprodType=table
The reasons for this discrepancy include a lower response rate among younger adults (typical of current landline telephone surveys) a higher proportion of those 16 to 34 living in group quarters (eg dormitories) and a higher proportion of this age group living in cell phone only households Hence a simple proportionate sample of the adult driver population based on RDD landline methodology alone would not meet the needs of this study design Consequently an oversample of 501 respondents 16 to 34 was designed to be included in the sample at the start of the study
Landline and Cell Phone RDD samples - As noted above RDD landline telephone sampling has been the conventional approach for conducting surveys of the United States household population for the past few decades However households are increasingly turning to cell phones and some households have abandoned landline phones altogether For example the second half of 2014 the percentage of cell phone only households (households with no landline but accessible by cell
B‐3
phone) was estimated to be 454 according to the National Health Interview Survey (NHIS)16
Current RDD landline sampling procedures exclude telephone exchanges and banks of telephone numbers used exclusively for cell phones This makes it difficult to reach people in subpopulations with high cell phone only usage For example more than 8 in 10 (813) adults living with unrelated roommates and close to 7 in 10 (692) adults 25 to 29 live in cell phone only households These are some of the same groups that are increasingly under-represented in conventional RDD landline telephone surveys As the percentage of cell phone only households continues to grow the conventional RDD landline sampling model can no longer reliably provide adequate population coverage required for sampling the United States household population To overcome this challenge and to account for drivers that rely solely or mostly on cell phones this survey used both a RDD sample of landline phones and a RDD sample of cell phones
Cell Phone Households - A stratified random sample of cellular phone numbers was drawn and used to contact potential respondents This was feasible because the 10 strata used in this study are defined in terms of States and cellular phone area codes are also defined by States However cell phones are portable and some respondents could be living in States other than that indicated by their cell phones area code To address this possible scenario all cell phone respondents were asked their current zip code to confirm their location of residence
Two types of cell phone households were identified through screening cell phone only households and cell phone mostly households Cell phone only households do not have a landline phone Cell phone mostly households have both landline and cellular telephone service (dual service) but the landline is not often used for receiving calls and therefore the probability of reaching such a household through the landline sample is greatly diminished Because cell phone mostly households are also included in the sample frame of landline households the estimation procedures that account for the overlapping dual service sample are more complicated than those that use non overlapping (mutually exclusive) samples of cell phone only households and landline households (with or without cell phone) However it was important to include the cell phone mostly households in the study sample for the representativeness of the population and to capture respondents in the critical age group of 16 to 34 years old
Cell phones were treated as personal devices and only the person who owned the cell phone was screened for eligibility The number of interviews to be achieved for these groups was derived using Cochranrsquos formula for the optimal allocation to strata when unit costs differ between the strata17
Landline Households - A stratified sample of landline telephone numbers was drawn and potential respondents were contacted using conventional RDD methods The households were screened for eligibility and an eligible driver was selected for the interview A total of 3873 interviews were conducted with respondents from the landline sample This includes the oversample of 501 respondents 16 to 34
Table B-2 shows the number of interviews from each sample type by age Age quotas were not used during data collection except for the landline oversample for the 16- to 34-year-old group
16Blumberg S J amp Luke J V (2015) Wireless substitution Early release of estimates from the National Health Interview Survey July ndash December 2014 Retrieved from the CDC website at wwwcdcgovnchsdatanhisearlyreleasewireless201506pdf 17 Cochran W G (1977) Sampling techniques (3rd ed) New York John Wiley amp Sons
B‐4
Table B-2 Sample Size by Type and Age
Age Landline Landline
Oversample Cell Phone
Sample TOTAL
16-34 235 501 790 1526
35+ 3055 0 1304 4359
Not Reported 82 0 34 116
TOTAL 3372 501 2128 6001
Survey Administration
The objective of survey administration is to conduct the data collection portion of the survey in a systematic uniform and consistent manner Survey administration includes survey procedures monitoring of the interviews and tracking of the sample disposition
Calling Protocol
The calling protocol used in this study consisted of a maximum of 13 attempts for the landline sample including the oversample of drivers 16 to 34 If someone in the household was contacted on one of these attempts then the overall maximum attempts for that household was 23 For the cell phone sample the maximum number of attempts to reach someone was 5 If contact was made with someone then the maximum number of attempts was set at 10 If a person selected for the sample politely refused (also known as a ldquosoft refusalrdquo) to participate in the survey he or she was re-contacted approximately one to two weeks after the initial refusal giving them a ldquocooling offrdquo period before the re-contact For quality control the telephone interviews were monitored by field supervisory staff using a silent line and screen monitoring
Answering Machines
The strategy for handling answering machines while maintaining a 13-call protocol has to balance the objectives of reaching the household and avoiding annoyance of the household Thus messages were left on the answering machine or voice mail on the fifth seventh and ninth calls if an answering machine or voice mail was encountered on those attempts The answering machine message explained that the household had been selected as part of a US DOT study of American driving habits and attitudes and asked the respondent to call Abt SRBIrsquos toll-free number to schedule an interview
For cell phones voice messages were left on the first call if a voice mailbox was reached The rationale behind this is that respondents would see the number of the call center not recognize it and therefore be more likely to screen the call and not answer their cell phones Leaving a message early on let the respondent know who was calling and the purpose of the call When we call back and the same number appears the respondent may be more likely to take the call since there is additional information pertaining to the number
Sample Dispositions
The final dispositions for each of the three independent samples are given in the following tables Table B-3 Landline Cross-Section Table B-4 Cell Sample and Table B-5 Landline Oversample
B‐5
Table B-3 Landline Cross-Section Final Disposition Report Estimated Estimated
Original Qualified Response Count Household Eligible^
T1 TOTAL 110264
A NON-Usable Numbers 81577 A1 NISDISChangeIntercepts 69952 A2 Non-residential 5976 A3 ComputerFax tone 3427 A4 Line problem 2222
T2 Total Usable Numbers 28687 B UNKNOWN ELIGIBLE HOUSEHOLD^ 13737 3574 2799 B1 Probable unassigned number 6090 B2 No answerBusy 3073 B3 Answering machine 4574
C NOT ELIGIBLE RESPONDENT^ 1288 1288 1009 C1 Language barrier 319 C2 HealthDeaf 894 C3 Respondent away for duration 75
D UNKNOWN ELIGIBLE RESPONDENT^ 8608 6741 D1 Callback 5534 D2 Spanish Callback not screened 54 D3 Refusals not screened 3020
E CONTACTS SCREENED 1682 E1 Qualified callback 287 287 E2 Refusals ndash Qualified 299 299 E3 Terminates 0 0 E4 Screen-outs 1096
F COMPLETE 3372 3372
A ESTIMATED ELIGIBLE HH RATE =T2T1 2602 B ELIGIBLE RESPONSE RATE = E+F-E4(E+F) 7831 C SUM RESPONSE ELIGIBLE COUNT 14507 D RESPONSE RATE = FC 2324 Estimated Qualified HH=Original Count A
^Response Eligible = Qualified Household Count B
B‐6
Table B-4 Cell Phone Final Disposition Report
T1 TOTAL
Original Count
43750
Estimated Qualified
Household
Estimated Response Eligible^
A
A1
A2
A3
A4
NON-Usable Numbers
NISDISChangeIntercepts
Non-residential
ComputerFax tone
Line problem
14382 11515
1284 42
1541
T2
B
B1
B2
B3
Total Usable Numbers
UNKNOWN ELIGIBLE HOUSEHOLD^
Probable unassigned number
No answerBusy
Answering machine
29368 14755
76 4793 9886
9905 5449
C
C1
C2
C3
NOT ELIGIBLE RESPONDENT^
Language barrier
HealthDeaf
Respondent away for duration
990 621 297 72
990 545
D
D1
D2
D3
UNKNOWN ELIGIBLE RESPONDENT^
Callback
Spanish Callback not screened
Refusals not screened
8797 6199
262 2336
4840
E
E1
E2
E3
E4
CONTACTS SCREENED
Qualified callback
Refusals ndash Qualified
Terminates
Screen-outs
2698 307 220
0 2171
307 220
0
F COMPLETE 2128 2128
A ESTIMATED ELIGIBLE HH RATE =T2T1
B ELIGIBLE RESPONSE RATE = E+F-E4(E+F)
C SUM RESPONSE ELIGIBLE COUNT
D RESPONSE RATE = FC
Estimated Qualified HH=Original Count A
^Response Eligible = Qualified Household Count B
6713 5501
1578 13488
B‐7
Estimated Estimated Original Qualified Response Count Household Eligible^
T1 TOTAL 175210 A NON-Usable Numbers 128883 A1 NISDISChangeIntercepts 111111 A2 Non-residential 8983 A3 ComputerFax tone 5399 A4 Line problem 3390 T2 Total Usable Numbers 46327 B UNKNOWN ELIGIBLE HOUSEHOLD^ 21719 5743 242B1 Probable unassigned number 9992 B2 No answerBusy 4339 B3 Answering machine 7388 C NOT ELIGIBLE RESPONDENT^ 550 550 23C1 Language barrier 282 C2 HealthDeaf 232 C3 Respondent away for duration 36 D UNKNOWN ELIGIBLE RESPONDENT^ 6112 257D1 Callback 4626 D2 Spanish Callback not screened 77 D3 Refusals not screened 1409 E CONTACTS SCREENED 17445 E1 Qualified callback 154 154E2 Refusals ndash Qualified 100 100E3 Terminates 0 0 E4 Screen-outs 17191 F COMPLETE 501 501 A ESTIMATED ELIGIBLE HH RATE =T2T1 2644 B ELIGIBLE RESPONSE RATE = E+F-E4(E+F) 421 C SUM RESPONSE ELIGIBLE COUNT 1277D RESPONSE RATE = FC 3924
Estimated Qualified HH=Original Count A
^Response Eligible = Qualified Household Count B
Table B-5 Landline Oversample Final Disposition Report
B‐8
Precision of Sample Estimates
The confidence interval for an estimate derived from the distracted driver survey sample is
ሺݕොሻ ݎඥfraslݕො േ ଵఈ ଶݖ
ො = an estimate of the population proportionݕ andݕොof18 = is the simple random sampling variance ሺݕොሻ ݎ
where
fraslଵఈ ଶݖ = ሺ1 െ frasl2 ߙ ሻth percentile of the standard normal distribution (95 ݖ 005 = ߙ = (1645 = ݖ 010 = ߙ 90 196
For best results data users should use statistical software such as SAS SPSS STATA or SUDAAN to calculate the confidence intervals for a complex sampling design However data users can use the tables that follow to approximate the confidence interval based on a simple formula
Sampling Error The sampling variance for an estimate is a measure of uncertainty that reflects the fact that the estimate is derived from a sample drawn from the population If one were to draw a second sample in the exact same manner the estimate would be different from the first simply due to the fact that our sample contains different members of the population A third sample would be different from the first two and so on The sampling variance measures how different the estimates would be had we drawn different samples
The sampling error for a complex survey depends on three things
௬ଶ ൌThe population variance for the characteristic the sampling variance is higher whenߪ 1there is a lot of variability in the population (large ߪ௬ଶ) and lower when there is little variability in the population
2 n = The sample size the sampling variance is higher when the sample size is small and lower when the sample size is large The sampling variance for estimates of subgroups is based on the sample size for those subgroups
3 DEFF = The design effect19 Sampling design features such as stratification clustering dual-frame sampling and survey weighting all contribute to the sampling variability The design effect is a measure of inefficiency (or efficiency) of the complex sample relative to a simple
ሺݕොሻ srsݎfraslሺݕොሻ ݎ ൌ ܨܨܧܦ random sample calculated as
ൌሻݕොሺݎ Using this relationship we can write the sampling variance of the complex design as fraslଶ௬ൌൈ ܦܧܨܨ ߪ ൈܧܨܨ ݎොሺsrsݕሻܦ Therefore one can calculate the sampling variance with the
population variance (or an estimate of the population variance) the sample size and the design effect See Table B-6 for 95 error estimates by various sample sizes
18 A simple random sample is a sample on n units drawn directly from a population of N units 19 Kish L (1965) Survey Sampling New York John Wiley amp Sons
B‐9
sumሺݕ െ തሻଶ In the caseݕ
Estimating the Population Variance ଵൌଶݏThe population variance is often estimated from the survey data
of percentages the population variance
௬ଶ = Ptimes(1-P) and can be estimated from the surveyߪ An alternative is to use the variance estimates based on the percentages ൌ ൈ ሺ1 െ estimateݏሻ ଶ
presented in Table B1 Rounding the estimated percentage up to the nearest 5 percentage points (eg 17 to 20 34 to 35) is a conservative estimate of the population variance The variance for a percentage is low when a small percentage of the population has the characteristic (or a large percentage of the population has the characteristic) and high when the percentage of the population with the characteristic is equal (5050)
Estimating Design Effects The sampling design impacts the variance for each data item differently Therefore the design effect for one survey estimate might be higher or lower than the design effect of another survey estimate The design effect will also vary for different subpopulations represented in the sample such as males and females Using a conventional definition of the unequal weighting effect the design effect (increase of variance compared to the SRS design) due to unequal weights is DEFFUWE = 1 + (Coefficient of Variation)2 = 1 + (08951)2 = 180
Testing for Statistical Differences Sampling error is also used to determine whether two population subgroups (or domains) are significantly different with respect to a certain statistic that is the difference in the sampled subgroup estimates is large enough that it would be unlikely to randomly occur if the statistics were the same for the subgroups Consider the hypothesis test for comparing two domains
H0 Y1 = Y2 or Y1 ndash Y2 = 0
H1 Y1 ne Y2 or Y1 ndash Y2 ne 0
One method to test whether Y1 is different from Y2 is to calculate a confidence interval around the difference in the sample estimates20 ሺݕොଵ െ ଵఈ ଶ If the interval does notሻଶെݖොଶሻേݕ fraslඥݎ ොݕො ଵሺݕ
is different from Y2 ndashthe observed difference in the sample contain 0 we conclude that Y1
estimates is not likely to randomly occur if Y1 was equal to Y2 therefore there is evidence to indicate a difference in the population statistics If the interval contains 0 we cannot conclude that Y1 is different from Y2 ndash there is insufficient evidence to indicate a difference in the population
is the sum of the variances for two population ሻଶሻ ሺݕො ଵݕොሺݎൌ ሻଶെ statisticsݎොሺݕො ଵݕsubgroups The subgroup variances are estimated as described above Table B-6 includes the estimated 95 error margins for various sample sizes Table B-7 includes the estimated 95 error margins for the differences between subgroups of various sizes If the observed difference is less than or equal to the error margin the difference is not statistically significant at the α = 005 significance level If it is greater than the error margin the difference is statistically significant at the α = 005 significance level
20 This method should only be used for large sample sizes One rule of thumb is n1 and n2 both greater than 30
B‐10
Table B-6 Estimated 95 Error Margins for Various Sample Sizes
DEFF n
180 6000
5500 5000
4500 4000
3500 3000
2500 2250
2000 1750
1500 1250
1000 750
500 400
300 200
150 100
50
P =
=
50 50
025
45 55
02475
40 60
024
35 65
02275
30 70
021
25 75
01875
20 80
016
15 85
01275
10 90
009
5 95
00475
17
18 19
20 21
22 24
26 28
29 31
34 37
42 48
59 66
76 93
107 131
186
17
18 19
20 21
22 24
26 28
29 31
34 37
41 48
59 65
76 93
107 131
185
17
17 18
19 20
22 24
26 27
29 31
33 36
41 47
58 64
74 91
105 129
182
16
17 18
19 20
21 23
25 26
28 30
32 35
40 46
56 63
72 89
102 125
177
16
16 17
18 19
20 22
24 25
27 29
31 34
38 44
54 60
70 85
98 121
170
15
15 16
17 18
19 21
23 24
25 27
29 32
36 42
51 57
66 81
93 114
161
14
14 15
16 17
18 19
21 22
24 25
27 30
33 38
47 53
61 74
86 105
149
12
13 13
14 15
16 17
19 20
21 22
24 27
30 34
42 47
54 66
77 94
133
10
11 11
12 12
13 14
16 17
18 19
20 22
25 29
35 39
46 56
64 79
112
07
08 08
09 09
10 10
11 12
13 14
15 16
18 21
26 29
33 41
47 57
81
B-11
Table B-7 Estimated 95 Error Margins for the Difference Between Two Subgroups DEFF n1 P n2 = 6000 5000 4000 3000 2000 1500 1000 500 400 300 200 100 50 180 6000 5050 24 25 27 29 34 38 45 61 68 78 95 133 187
4060 24 25 26 29 33 37 44 60 67 76 93 130 183 3070 22 23 25 27 31 35 41 56 62 71 87 122 171 2080 19 20 21 24 27 30 36 49 54 62 76 106 149 1090 14 15 16 18 20 23 27 37 41 47 57 80 112
5000 5050 25 26 28 30 35 39 46 62 68 78 95 133 187 4060 25 26 27 30 34 38 45 60 67 77 93 130 183 3070 23 24 26 28 32 35 42 57 63 72 87 122 171 2080 20 21 22 24 28 31 36 49 55 63 76 106 149 1090 15 16 17 18 21 23 27 37 41 47 57 80 112
4000 5050 27 28 29 32 36 40 46 62 69 79 95 133 187 4060 26 27 29 31 35 39 46 61 68 77 93 130 183 3070 25 26 27 29 33 36 43 57 63 72 87 122 171 2080 21 22 24 25 29 32 37 50 55 63 76 106 150 1090 16 17 18 19 22 24 28 37 41 47 57 80 112
3000 5050 29 30 32 34 38 42 48 64 70 80 96 134 187 4060 29 30 31 33 37 41 47 62 69 78 94 131 184 3070 27 28 29 31 35 38 44 58 64 73 88 122 172 2080 24 24 25 27 30 33 38 51 56 64 77 107 150 1090 18 18 19 20 23 25 29 38 42 48 58 80 112
2000 5050 34 35 36 38 42 45 51 66 72 81 98 135 188 4060 33 34 35 37 41 44 50 64 71 80 96 132 184 3070 31 32 33 35 38 41 47 60 66 75 89 123 173 2080 27 28 29 30 33 36 41 53 58 65 78 108 151 1090 20 21 22 23 25 27 31 39 43 49 59 81 113
1500 5050 38 39 40 42 45 48 54 68 74 83 99 136 189 4060 37 38 39 41 44 47 53 67 72 81 97 133 185 3070 35 35 36 38 41 44 49 62 68 76 91 124 173 2080 30 31 32 33 36 38 43 54 59 67 79 109 151 1090 23 23 24 25 27 29 32 41 44 50 59 81 113
B-12
Table B-7 Estimated 95 Error Margins for the Difference Between Two Subgroups (Continued) DEFF n1 P n2 = 6000 5000 4000 3000 2000 1500 1000 500 400 300 200 100 50 180 1000 5050 45 46 46 48 51 54 59 72 78 87 102 138 191
4060 44 45 46 47 50 53 58 71 76 85 100 135 187 3070 41 42 43 44 47 49 54 66 71 79 93 126 175 2080 36 36 37 38 41 43 47 58 62 69 81 110 152 1090 27 27 28 29 31 32 35 43 47 52 61 83 114
500 5050 61 62 62 64 66 68 72 83 88 96 110 144 195 4060 60 60 61 62 64 67 71 81 86 94 108 141 191 3070 56 57 57 58 60 62 66 76 81 88 101 132 179 2080 49 49 50 51 53 54 58 67 71 77 88 115 156 1090 37 37 37 38 39 41 43 50 53 58 66 86 117
400 5050 68 68 69 70 72 74 78 88 93 100 114 147 197 4060 67 67 68 69 71 72 76 86 91 98 112 144 193 3070 62 63 63 64 66 68 71 81 85 92 104 135 181 2080 54 55 55 56 58 59 62 71 74 80 91 118 158 1090 41 41 41 42 43 44 47 53 56 60 68 88 118
300 5050 78 78 79 80 81 83 87 96 100 107 120 152 201 4060 76 77 77 78 80 81 85 94 98 105 118 149 197 3070 71 72 72 73 75 76 79 88 92 98 110 139 184 2080 62 63 63 64 65 67 69 77 80 86 96 121 161 1090 47 47 47 48 49 50 52 58 60 64 72 91 121
200 5050 95 95 95 96 98 99 102 110 114 120 131 161 208 4060 93 93 93 94 96 97 100 108 112 118 129 158 204 3070 87 87 87 88 89 91 93 101 104 110 121 148 191 2080 76 76 76 77 78 79 81 88 91 96 105 129 166 1090 57 57 57 58 59 59 61 66 68 72 79 97 125
100 5050 133 133 133 134 135 136 138 144 147 152 161 186 228 4060 130 130 130 131 132 133 135 141 144 149 158 182 223 3070 122 122 122 122 123 124 126 132 135 139 148 170 209 2080 106 106 106 107 108 109 110 115 118 121 129 149 182 1090 80 80 80 80 81 81 83 86 88 91 97 112 137
B-13
Table B-7 Estimated 95 Error Margins for the Difference Between Two Subgroups (Continued) DEFF n1 P n2 = 6000 5000 4000 3000 2000 1500 1000 500 400 300 200 100 50
180 50 5050 4060
187 187 187 187 188 189 191 195 183 183 183 184 184 185 187 191
197 193
201 197
208 204
228 223
263 258
3070 171 171 171 172 173 173 175 179 181 184 191 209 241 2080 149 149 150 150 151 151 152 156 158 161 166 182 210 1090 112 112 112 112 113 113 114 117 118 121 125 137 158
B-14
WEIGHTING METHODOLOGY
Weights were calculated for the 7231 completed (n=6001) and screened-out (n=1231) interviews with people 16 and older residing in households in the 50 States and the District of Columbia The population weights (DD_FINAL_POP_WT) sum to the 2013 American Community Survey population estimate of 247014747 people 16 and older in the civilian noninstitutionalized population of the United States A sample weight (DD_FINAL_SAMP_WT) was also created The sample weights sum to 7231 completed and screened out interviews
Base Sampling Weight
The overall random-digit-dialing sample consisted of three components (identified by FPROJ variable) The first component (Landline Sample) was a NHTSA Region-stratified sample of landline telephone numbers One person 16 or older was randomly selected from each household The second component (Landline Screening Sample) was a NHTSA Region-stratified screening sample of landline telephone numbers One person 16 to 34 years old was randomly selected from the households with one or more age-eligible people The third component (Cellular Sample) was a NHTSA Region-stratified sample of cellular telephone numbers The cellular telephone was treated as a personal communication device and therefore an interview was attempted if the person answering was 16 or older To be eligible for the interview the person also needed to be classified as cell-only individual or a cell-mostly individual Cell-mostly individuals were defined as also having a landline telephone but ldquoall or almost all calls are received on cell phonesrdquo Dual users who are not cell-mostly individuals had to be reached on a landline to participate in the study
For each sample component a base sampling weight (BSW) was calculated for each NHTSA Region (regions were identified by NHTSAREG variable) The base sampling weight equals the population count of telephone numbers in the NHTSA Region divided by the sample size of telephone numbers drawn from that NHTSA Region and released for interview attempts (see Table B-8)
Table B-8 Base Sampling Weights (BSW) by Sample Component
NHTSA Region (NHTSAREG)
Landline Sample Landline Screening
Sample Cellular Sample
1 261794 164364 1021063 2 260130 162661 1036850 3 259703 162470 1031571 4 260238 163218 1045315 5 258877 162604 1063449 6 260098 163672 1096991 7 262470 164338 1108332 8 262719 165646 1074469 9 259303 165568 1072767
10 260454 166732 1092981
The two landline sample components result in an oversampling of people 16 to 34 relative to people 35 and older This was accounted for in the weight calculations by adjusting downwards the weights of people 16 to 34 The sum of the base sampling weights of all people 16 to 34 in the landline sample was calculated (775011) The sum of the base sampling weights of all people 16 to 34 in the landline sample and the landline screening sample was also calculated (1757722)
B‐15
The base sampling weights of people 16 to 34 in the two landline sample components were multiplied by the resulting ratio of 044092 to form the adjusted base sampling weight (BSW_ADJ) The adjusted base sampling weight for cell phone sample people and for landline sample people 35 and older equals the base sampling weight
Landline sample and landline screening sample people residing in households with two or more landline telephone numbers have a higher probability of selection compared to people living in households with one landline telephone number The adjusted base sampling weight was divided by two if the person reported that their household had two landline telephone numbers and was divided by 3 if three or more landline telephone numbers were reported (D8) to form the base sampling weight adjusted for multiple landline telephones (BSW_NUMPHONE) For landline and landline screening sample people with one landline telephone number and for cell phone sample people the base sampling weight adjusted for multiple landline telephones equals the adjusted base sampling weight
The final step in the base sampling weight calculation process was to account for the random selection of one person 16 and older (QSL1) from the landline sample and one person 16 to 34 (QSO1) from the landline screening sample The base sampling weight adjusted for multiple landline telephones was multiplied by the number of eligible people in the household capped at four to form the base sampling weight adjusted for within household sampling (BSW_NUMADULT) For people in the cell phone sample the base sampling weight adjusted for within household sampling equals the base sampling weight adjusted for multiple landline telephones
A nonresponse adjustment was not performed In 2012 most of the values of nonresponse adjustment factors were between 12 and 14 (see Table B-10 of the 2012 report) Our experience in developing nonresponse adjustments in other projects is that the ranges of values are usually much greater (eg a difference by a factor of 30 or 50) The information contained in the nonresponse adjustment factors is additionally used in the raking step where both the 10 NHTSA regions and phone use are incorporated as raking targets We thus concluded that it is possible to simplify the weighting procedure and omit the nonresponse adjustment step as performed in 2012
Combining the Two Landline Samples With the Cell Phone Sample
All respondents were classified into 1 of 5 telephone service categories
1 Cell-only 2 Landline only 3 Cell phone sample dual user cell-mostly 4 Landline samples dual user cell-mostly 5 Landline samples dual user not cell-mostly
The two landline samples cannot be simply combined with the cell phone sample because dual user (landline and cell phone) people who are classified as cell-mostly can be sampled through the two landline samples or through the cell phone sample This is referred to as a partial overlap dual frame design because dual user people who are not cell-mostly were sampled just through the two landline samples
B‐16
The samples were combined by compositing the cell-mostly people from the landline samples with the cell-mostly respondents from the cell phone sample A compositing factor λ of 05 was selected to adjust for some respondents who can be reached through both frames The selection of 05 as the compositing factor arithmetically addresses the possibility of being selected in the 2 frames For the two cell-mostly telephone service groups the composite weight (BSW_COMPOSITE) equals within household adjusted base sampling weight times the compositing factor For the other three telephone service groups the composite weight equals the within household adjusted base sampling weight
Raking to Population Control Totals
A survey sample may cover segments of the target population in proportions that do not match the proportions of those segments in the population itself The differences may arise for example from sampling fluctuations from nonresponse because the sampling design sampled different segments of populations at different rates (eg the cell-only population was sampled at a lower rate than the landline user population for cost reasons) or because the sample design was not able to cover the entire target population In such situations one can often improve the relation between the sample and the population by adjusting the sampling weights of the cases in the sample so that the marginal totals of the adjusted weights on specified characteristics referred to as control variables agree with the corresponding totals for the population This operation is known as raking ratio estimation raking or sample-balancing and the population totals are usually referred to as control totals Raking is most often used to reduce biases from nonresponse and noncoverage in sample surveys
Raking usually proceeds one variable at a time applying a proportional adjustment to the weights of the cases that belong to the same category of the control variable The initial design weights in the raking process are often equal to the inverse of the selection probabilities and may have undergone some adjustments for unit nonresponse and noncoverage The weights from the raking process are used in estimation and analysis
The adjustment to control totals is sometimes achieved by creating a cross-classification of the categorical control variables (eg age categories times gender times race times household-income categories) and then matching the total of the weights in each cell to the control total This approach however can spread the sample thinly over a large number of adjustment cells It also requires control totals for all cells of the cross-classification Often this is not feasible (eg control totals may be available for age times gender times race but not when those cells are subdivided by household income) The use of raking with marginal control totals for single variables (ie each margin involves only one control variable) often avoids many of these difficulties
The procedure known as raking adjusts a set of data so that its marginal totals match control totals on a specified set of variables The term ldquorakingrdquo suggests an analogy with the process of smoothing the soil in a garden plot by alternately working it back and forth with a rake in two perpendicular directions
In a simple 2-variable example the marginal totals in various categories for the two control variables are known from the entire population but the joint distribution of the two variables is known only from a sample In the cross-classification of the sample arranged in rows and columns one might begin with the rows taking each row in turn and multiplying each entry in the row by
B‐17
the ratio of the population total to the weighted sample total for that category so that the row totals of the adjusted data agree with the population totals for that variable The weighted column totals of the adjusted data however may not yet agree with the population totals for the column variable Thus the next step taking each column in turn multiplies each entry in the column by the ratio of the population total to the current total for that category Now the weighted column totals of the adjusted data agree with the population totals for that variable but the new weighted row totals may no longer match the corresponding population totals
This process continues alternating between the rows and the columns and close agreement on both rows and columns is usually achieved after a small number of iterations The result is a tabulation for the population that reflects the relation of the two control variables in the sample Raking can also adjust a set of data to control totals on three or more variables In such situations the control totals often involve single variables but they may involve two or more variables
Ideally one should rake on variables that exhibit an association with the key survey outcome variables and that are related to nonresponse andor noncoverage This strategy will reduce bias in the key outcome variables In practice other considerations may enter A variable such as gender may not be strongly related to key outcome variables or to nonresponse but raking on it may be desirable to preserve the ldquoface validityrdquo of the sample21 22 Eight control variables were used in the raking (see Table B-9)
Table B-9 Control Variables Used in the Raking
Variable Label Name Telephone service using 4 categories TELEPHONE_STATUS_R NHTSA Region XREGION Number of people 16 and older in the household NUM_16PLUS_R Number of people 0 to 15 in the household D3_R Home ownership status D7_R Education D6_R Raceethnicity RACE_ETHNICITY_R Age group by gender D1_QSA3_R
The control totals were obtained for people 16 and older living in households from the 2013 American Community Survey PUMS The telephone service control totals were constructed from information published by the National Center for Health Statistics23
21 Battaglia M Izrael D Hoaglin D amp Frankel M (2009) Practical considerations in raking Survey data Survey Practice 2(5) Retrieved from wwwsurveypracticeorgindexphpSurveyPracticearticleview176html 22 Kolenikov S (2014) Calibrating survey data using iterative proportional fitting (raking) Stata Journal 14 22-59 23 Blumberg S J amp Luke J V (2015) Wireless substitution Early release of estimates from the National Health Interview Survey July ndash December 2014 Retrieved from the CDC website at wwwcdcgovnchsdatanhisearlyreleasewireless201506pdf
B‐18
The IGCV SAS raking macro24 was used calculate the final weights for the combined (landline and cell phone) sample The population control totals and weighted sample distributions prior to raking are shown in Appendix C (see Weighted Distribution Prior To Raking Iteration 0) The raking macro was set to a convergence criterion of a maximum difference of 005 percentage points between a control total percent and the corresponding weighted sample percent
The IGCV raking macro limited the spread of weights during the raking iteration to help avoid extreme weights which reduce statistical efficiency of final estimates especially in small domains or subpopulations Izrael et al (2009) discuss weight trimming during raking and provide details on the Individual and Global Cap Value (IGCV) weight trimming procedures implemented in their SAS raking code No weight values were allowed to exceed the respondentrsquos BSW_COMPOSITE weight times factor A or the mean BSW_COMPOSITE weight times factor C The weight trimming also avoided the situation where respondents end up with very small weights by not allowing weight values to be lower than the respondentrsquos BSW_COMPOSITE times factor B or to be below the mean BSW_COMPOSITE weights times factor D
Table B-10 IGCV Weight Trimming Values
A = 80 weight will be decreased to individual weight times A
B = 0125 weight will be increased to individual weight times B
C = 120 weight will be decreased to mean weight times C
D = 0083 weight will be increased to mean weight times D
Summary of the Final Weights
The final weights are given by the variables DD_FINAL_POP_WT and DD_FINAL_SAMP_WT They only differ by scaling the weights in DD_FINAL_POP_WT sum up to the estimated population size ( of adults 16+ in the United States) while DD_FINAL_SAMP_WT sum up to the sample size n=7231 These weights should be used for all the analyses of the 2015 National Survey of Distracted Driving Attitudes and Behavior data Given the differences in scaling DD_FINAL_POP_WT should be used when population totals need to be estimated (eg total nationwide expected number of accidents caused by distracted driving) For analysis of population size-free statistics such as means or percentages (eg percentage of trips on which the driver was using hands-free cell phone connection in the car) either set of weights can be used If the software supports this these weights should be used as probability weights rather in a software package that supports estimation with complex survey data (eg SAS PROC SURVEY Stata svy prefix R
24 Izrael D Battaglia M amp Frankel M (2009) SAS raking macro Retrieved from httpabtassociatescomExpertiseSurveys-and-Data-CollectionRaking-Survey-Data-(a-k-a--SampleshyBalancing)aspx
B‐19
survey package SPSS Complex Samples module) than frequency weights (as they are interpreted in SPSS without the Complex Samples module or SAS procedures without SURVEY prefix)
Table B-11 Summary of Final Weights
Weight Variable N Sum Minimum Maximum Mean Coeff of Variation
BSW_COMPOSITE 7231 41071659 119533 11083 567994 06380
DD_FINAL_POP_WT 7231 247014747 283532 318645 3416052 08951
DD_FINAL_SAMP_WT 7231 7231 0083 9328 1 08951
Using a conventional definition of the unequal weighting effect the design effect (increase of variance compared to the SRS design) due to unequal weights DEFFUWE = 1 + CV2 = 180 The magnitude of the final DEFF is split between the unequal baseline weights produced the design effect of 140 and different response rates in the different demographic groups that are implicitly accounted for by the raking procedures
B‐20
Appendix C
Output for Raking With Trimming Weight by Individual and Global Cap Value Method
C‐1
The raking output is shown in Table C-1 Raking Results
Table C-1 Raking Results
RAKING WITH TRIMMING WEIGHT BY INDIVIDUAL AND GLOBAL CAP VALUE (IGCV) METHOD
Sample size of completed interviews 7231
Raking input weight (adjusted to population total) BSW_COMPOSITE_ATPT
Minimum value of raking input weight 7189
Maximum value of raking input weight 666577
Coefficient of variation of raking input weight 064
Global low weight cap value factor Mean input weight times - (D) 0083
Global high weight cap value factor Mean input weight times - (C) 12
Individual low weight cap value (ILCV) factor Respondents weight times shy(B)
0125
Individual high weight cap value (IHCV) factor Respondents weight times shy(A)
8
C‐2
WEIGHTED DISTRIBUTION PRIOR TO RAKING (ITERATION 0)
Telephone status Input Weight
Sum of Weights25 Population
Total26
Sum of Weights
Difference27
of Input Weights28
Population 29
Difference in 30
1 Cell only user 1308998668 109305294 215945732 52993 44251 8742
2 Landline only user 708103404 17752600 -106715658 2867 7187 -432
3 Dual user cell mostly - celllandline sample 2954661922 42099023 -125524034 11961 17043 -5082
4 Dual user not cell mostly - landline sample only
7948722695 77857831 162939601 32179 3152 066
NHTSA region Input Weight
Sum of Weights Population
Total
Sum of Weights
Difference
of Input Weights
Population Difference
in
1 NHTSA Region 1 1229698036 11794622 50235836 4978 4775 0203
2 NHTSA Region 2 3218375177 32898311 -71455923 13029 13318 -0289
3 NHTSA Region 3 2642108582 25055504 136558182 10696 10143 0553
4 NHTSA Region 4 3548787416 36002824 -51494984 14367 14575 -0208
5 NHTSA Region 5 4530623879 40741097 456514179 18342 16493 1848
6 NHTSA Region 6 3032710295 30183360 14374295 12277 12219 0058
7 NHTSA Region 7 1518536872 13032118 215325072 6148 5276 0872
8 NHTSA Region 8 1050868558 10018964 48972158 4254 4056 0198
9 NHTSA Region 9 2857707093 36079042 -750197107 11569 14606 -3037
10 NHTSA Region 10 1072058791 11208905 -48831709 434 4538 -0198
Number of People 16+ in Household (HH) Input Weight
Sum of Weights Population
Total
Sum of Weights
Difference
of Input Weights
Population Difference
in
1 1 Person 16+ in HH 7149110913 41358674 3013243513 28942 16743 12199
2 2 People 16+ in HH 1072719064 116304877 -903297059 43427 47084 -3657
3 3 People 16+ in HH 3839234508 50449212 -120568669 15543 20424 -4881
4 4+ People 16+ in HH 2985938638 38901984 -904259762 12088 15749 -3661
Note Footnotes apply to each respective column heading in this section
25 Weighted count of adults based on BSW_COMPOSITE adjusted to population total 26 Population count of adults based on American Community Survey 27 Input weight sum of weights minus population total 28 Weighted percent of adults based on BSW_COMPOSITE 29 Population percent of adults based on American Community Survey 30 of input weights minus population
C‐3
Number of People in HH under 16 Input Weight
Sum of Weights Population
Total
Sum of Weights
Difference
of Input Weights
Population Difference
in
1 0 Children under 16 in HH 1700532532 165093166 496008725 68843 66835 2008
2 1 Child under 16 in HH 3360312936 37773679 -417054964 13604 15292 -1688
3 2 Children under 16 in HH 266342826 28257559 -16232764 10782 1144 -0657
4 3+ Children under 16 in HH 1672408179 15890343 83373879 677 6433 0338
Tenure Input Weight
Sum of Weights Population
Total
Sum of Weights
Difference
of Input Weights
Population Difference
in
1 Own 1495844343 162397537 -128131027 60557 65744 -5187
2 Rent 9743031274 84617210 1281310274 39443 34256 5187
Education Input Weight
Sum of Weights Population
Total
Sum of Weights
Difference
of Input Weights
Population Difference
in
1 Less than HS 29574445 39473916 -9899471 11973 1598 -4008
2 HSGED 7234949693 66924310 542518693 2929 27093 2196
3 Some college 5922998251 75310772 -160807895 23978 30488 -651
4 College graduate 8586082255 65305749 2055507355 34759 26438 8321
Race-ethnicity Input Weight
Sum of Weights Population
Total
Sum of Weights
Difference
of Input Weights
Population Difference
in
1 Hispanic 3586599033 37498626 -163263567 1452 15181 -0661
2 White Non-Hispanic 165879344 161512193 436715103 67154 65386 1768
3 Black Non-Hispanic 2245206292 28865584 -641352108 9089 11686 -2596
4 AsianNHOPI Non-Hispanic 850357984 13190879 -468729916 3443 534 -1898
5 AIAN Non-Hispanic 320045582 1526907 167354882 1296 0618 0678
6 OtherMultiracial Non-Hispanic 1111331405 4420558 669275605 4499 179 2709
C‐4
Age group by gender Input Weight
Sum of Weights Population
Total
Sum of Weights
Difference
of Input Weights
Population Difference
in
11 16-24 Male 1774055575 20051714 -231115825 7182 8118 -0936
12 16-24 Female 1242473377 19387175 -696244123 503 7849 -2819
21 25-29 Male 94176272 10474745 -10571178 3813 4241 -0428
22 25-29 Female 752965759 10515811 -298615341 3048 4257 -1209
31 30-34 Male 1181952847 10281237 153829147 4785 4162 0623
32 30-34 Female 673925149 10501810 -376255851 2728 4251 -1523
41 35-39 Male 923582276 9611576 -37575324 3739 3891 -0152
42 35-39 Female 717097388 9909101 -273812712 2903 4012 -1108
51 40-49 Male 2042105191 20420984 6791 8267 8267 0
52 40-49 Female 1931045193 21229852 -191940007 7818 8595 -0777
61 50-59 Male 2354636585 20928245 261812085 9532 8472 106
62 50-59 Female 2388368196 22225386 165829596 9669 8998 0671
71 60-69 Male 2001812908 15453706 456442308 8104 6256 1848
72 60-69 Female 231440501 17140934 60031161 937 6939 243
81 70+ Male 144945147 12339012 21555027 5868 4995 0873
82 70+ Female 2011835055 16543459 357489155 8145 6697 1447
Program terminated at iteration 5 because all current percentage differ from target percentage by less than 005
C‐5
WEIGHTED DISTRIBUTION AFTER RAKING
Telephone status Output Weight
Sum of Weights31 Population
Total32
Sum of Weights
Difference33
of Output
Weights34
Population 35
Difference in 36
1 Cell only user 1091880077 109305294 -11728588 44203 44251 -0047
2 Landline only user 1774333759 17752600 -92623 7183 7187 -0004
3 Dual user cell mostly - celllandline sample 4214532358 42099023 4630099 17062 17043 0019
4 Dual user not cell mostly - landline sample only
7793807812 77857831 8024718 31552 3152 0032
NHTSA region Output Weight
Sum of Weights37 Population
Total38
Sum of Weights
Difference39
of Output
Weights40
Population 41
Difference in 42
1 NHTSA Region 1 1179632569 11794622 170369 4776 4775 0001
2 NHTSA Region 2 3288798266 32898311 -1032834 13314 13318 -0004
3 NHTSA Region 3 2508412508 25055504 2862108 10155 10143 0012
4 NHTSA Region 4 3602234669 36002824 1952269 14583 14575 0008
5 NHTSA Region 5 4078884777 40741097 4775077 16513 16493 0019
6 NHTSA Region 6 3015910421 30183360 -2425579 12209 12219 -001
7 NHTSA Region 7 1304950072 13032118 1738272 5283 5276 0007
8 NHTSA Region 8 1002278294 10018964 381894 4058 4056 0002
9 NHTSA Region 9 3600443025 36079042 -7461175 14576 14606 -003
10 NHTSA Region 10 1119930098 11208905 -960402 4534 4538 -0004
Note Footnotes apply to each respective column heading in this section
31 Weighted count of adults based on raked (output) weight 32 Population count of adults based on American Community Survey 33 Output weight sum of weights minus population total 34 Weighted percent of adults based on raked (output) weight 35 Population percent of adults based on American Community Survey 36 of output weights minus population 37 Weighted count of adults based on raked (output) weight 38 Population count of adults based on American Community Survey 39 Output weight sum of weights minus population total 40 Weighted percent of adults based on raked (output) weight 41 Population percent of adults based on American Community Survey 42 of output weights minus population
C‐6
Number of People 16+ in HH Output Weight Sum of Weights
Population Total
Sum of Weights
Difference
of Output Weights
Population Difference
in
1 1 Person 16+ in HH 4136691078 41358674 823678 16747 16743 0003
2 2 People 16+ in HH 116349235 116304877 4435796 47102 47084 0018
3 3 People 16+ in HH 5043977599 50449212 -943601 2042 20424 -0004
4 4+ People 16+ in HH 3885882526 38901984 -4315874 15731 15749 -0017
Number of People in HH under 16 Output Weight Sum of Weights
Population Total
Sum of Weights
Difference
of Output Weights
Population Difference
in
1 0 Children under 16 in HH 1649764893 165093166 -11667665 66788 66835 -0047
2 1 Child under 16 in HH 3781383846 37773679 4015946 15308 15292 0016
3 2 Children under 16 in HH 2832396223 28257559 6640323 11467 1144 0027
4 3+ Children under 16 in HH 1590045696 15890343 1011396 6437 6433 0004
Tenure Output Weight Sum of Weights
Population Total
Sum of Weights
Difference
of Output Weights
Population Difference
in
1 Own 1622854236 162397537 -11211341 65699 65744 -0045
2 Rent 8472932341 84617210 11211341 34301 34256 0045
Education Output Weight Sum of Weights
Population Total
Sum of Weights
Difference
of Output Weights
Population Difference
in
1 Less than HS 3943858738 39473916 -3532862 15966 1598 -0014
2 HSGED 6692151297 66924310 -279703 27092 27093 -0001
3 Some college 7535109003 75310772 4031803 30505 30488 0016
4 College graduate 6530355661 65305749 -219239 26437 26438 -0001
C‐7
Race-ethnicity Output Weight Sum of Weights
Population Total
Sum of Weights
Difference
of Output Weights
Population Difference
in
1 Hispanic 3755875398 37498626 6012798 15205 15181 0024
2 White Non-Hispanic 1614156247 161512193 -9656834 65347 65386 -0039
3 Black Non-Hispanic 2887486208 28865584 927808 1169 11686 0004
4 AsianNHOPI Non-Hispanic 1321484655 13190879 2396755 535 534 001
5 AIAN Non-Hispanic 152768028 1526907 77328 0618 0618 0
6 OtherMultiracial Non-Hispanic 442297945 4420558 242145 1791 179 0001
Age group by gender Output Weight Sum of Weights
Population Total
Sum of Weights
Difference
of Output Weights
Population Difference
in
11 16-24 Male 20051714 20051714 0 8118 8118 0
12 16-24 Female 19387175 19387175 0 7849 7849 0
21 25-29 Male 10474745 10474745 0 4241 4241 0
22 25-29 Female 10515811 10515811 0 4257 4257 0
31 30-34 Male 10281237 10281237 0 4162 4162 0
32 30-34 Female 10501810 10501810 0 4251 4251 0
41 35-39 Male 9611576 9611576 0 3891 3891 0
42 35-39 Female 9909101 9909101 0 4012 4012 0
51 40-49 Male 20420984 20420984 0 8267 8267 0
52 40-49 Female 21229852 21229852 0 8595 8595 0
61 50-59 Male 20928245 20928245 0 8472 8472 0
62 50-59 Female 22225386 22225386 0 8998 8998 0
71 60-69 Male 15453706 15453706 0 6256 6256 0
72 60-69 Female 17140934 17140934 0 6939 6939 0
81 70+ Male 12339012 12339012 0 4995 4995 0
82 70+ Female 16543459 16543459 0 6697 6697 0
C‐8
Number of Respondents Who Had Their Weights Decreased by the Trimming 7
Number of Respondents Who Had Their Weights Increased by the Trimming 317
Raking output weight DD_FINAL_POP_WT
Weight Variable N Sum Minimum Maximum Mean Coefficient of
Variation
BSW_COMPOSITE 7231 4107165921 1195335196 1108332 567994 0637972168
DD_FINAL_POP_WT 7231 247014747 283532 31864548 3416052 0895132802
DD_FINAL_SAMP_WT 7231 7231 0083 93278864 1 0895132802
C‐9
DOT HS 812 461 March 2018
13123-031418-v5

Disclaimer This publication is distributed by the US Department of Transportation National Highway Traffic Safety Administration in the interest of information exchange The opinions findings and conclusions expressed in this publication are those of the authors and not necessarily those of the Department of Transportation or the National Highway Traffic Safety Administration The United States Government assumes no liability for its content or use thereof If trade or manufacturersrsquo names or products are mentioned it is because they are considered essential to the object of the publication and should not be construed as an endorsement The United States Government does not endorse products or manufacturers
Suggested APA Format Citation
Schroeder P Wilbur M amp Pentildea R (2018 March) National survey on distracted driving attitudes and behaviors - 2015 (Report No DOT HS 812 461) Washington DC National Highway Traffic Safety Administration
Technical Report Documentation Page
1 Report No
DOT HS 812 461 2 Government Accession No 3 Recipientrsquos Catalog No
4 Title and Subtitle
National Survey on Distracted Driving Attitudes and Behaviors - 2015 5 Report Date
March 2018 6 Performing Organization Code
7 Author(s)
Paul Schroeder Melanie Wilbur and Reyna Pentildea 8 Performing Organization Report No
9 Performing Organization Name and Address
Abt SRBI Inc 8405 Colesville Road Suite 300 Silver Spring Maryland 20910
10 Work Unit No (TRAIS)
11 Contract or Grant No
DTNH22-11-F-00355 12 Sponsoring Agency Name and Address
National Highway Traffic Safety Administration Office of Behavioral Safety Research 1200 New Jersey Avenue SE Washington DC 20590
13 Type of Report and Period Covered
Final Report
14 Sponsoring Agency Code
15 Supplementary Notes
Kristie Johnson PhD served as the Contracting Officerrsquos Representative (COR) 16 Abstract
The 2015 National Survey on Distracted Driving Attitudes and Behaviors (NSDDAB) is the third in a series of telephone surveys on distracted driving providing data to help further the understanding of driving behavior and to contribute to the development of countermeasures and interventions to reduce distracted driving on the nationrsquos roadways Specifically the 2015 NSDDAB assessed the extent to which drivers are distracted by various activities demographic and typological descriptions of drivers prone to distractions the extent and frequency of cell phone use texting and use of mobile device ldquoappsrdquo while driving attitudes and perceptions about distracted driving knowledge of and attitudes toward measures to deter distracted driving perceptions about the danger of distracted driving exposure to the consequences of distracted driving willingness to intervene when someone is distracted while driving and changes and trends in distracted driving behaviors and attitudes since 2010 Like the previous studies conducted in 2010 and 2012 this survey yields national estimates of behaviors and attitudes toward distracted driving in the United States The present study used a driver typology based on the pattern of responses across multiple distracted driving behavior questions The cluster analysis identified two distinct groups of drivers with similar overall behavioral tendencies and among those categorized 42 are distraction-prone and 58 are distraction-averse Driver type is a powerful predictor of norms and attitudes towards distracted driving behavior and sanctions for distracted driving 17 Key Words
Unsafe driving distraction cell phone use texting inattention driving behavior phone apps driver typology
18 Distribution Statement
Document is available to the public from the National Technical Information Service wwwntisgov
19 Security Classif (of this report)
Unclassified 20 Security Classif (of this page)
Unclassified 21 No of Pages
194 22 Price
i
TABLE OF CONTENTS
Executive Summary 1
Chapter 1 Introduction 7
Chapter 2 Description of Respondent Population 10
Chapter 3 Phone-Related Distracted Driving 12
Chapter 4 Perceptions of Safety of Distracted Driving 37
Chapter 5 Changes in Cell-Phone-Related Distracted Driving 43
Chapter 6 Distracted Driving Laws and Stopped for Distracted Driving 45
Chapter 7 Educational Messages 60
Chapter 8 Distracted Driving Crashes and Near-Crashes 70
Chapter 9 Perceptions of and Responses to Distracted Driving 75
Chapter 10 Distracted Driving Behavior by Driver Type 79
Chapter 11 Trend Analysis 110
Conclusion 122
Appendices
Appendix A Questionnaire A1
Appendix B Methodology B1
Appendix C Output for Raking With Trimming Weight by Individual and Global Cap Value Method C1
ii
LIST OF FIGURES
Figure 3-1 Cell Phone Ownership by Frequency of Driving 13
Figure 3-2 Answer Phone While Driving 14
Figure 3-3 How Phone Calls Are Answered While Driving 15
Figure 3-4 Make Phone Calls While Driving 16
Figure 3-5 Method of Dialing Phone Number While Driving 17
Figure 3-6 Answer or Make Calls While Driving by Age and Gender
( at Least Sometimes) 19
Figure 3-7 Send or Read Text Messages or E-Mails While Driving 22
Figure 3-8 Send or Read Text Messages or E-Mails While Driving By Age and Gender
( at Least Sometimes) 23
Figure 3-9 How Text Messages or E-Mails Are Sent While Driving 25
Figure 3-10 Use Smartphone Apps While Driving 27
Figure 3-11 Use Smartphone Apps While Driving by Age and Gender
( at Least Sometimes) 28
Figure 3-12 How Smartphone Apps Are Used While Driving 30
Figure 4-1 Respondents Who Feel Safe When Driver Is TalkingInteracting with
Children in the Vehicle by Number of Children in the Household 38
Figure 4-2 Number of Seconds a Driver Can Safely Take HisHer Eyes
Off the Road by Age 41
Figure 4-3 Number of Seconds a Driver Can Safely Take HisHer Eyes
Off the Road by Gender 42
Figure 5-1 Has Your Frequency of Cell Phone Use While Driving Increased
Decreased or Stayed the Same 43
Figure 6-1 Does Your State Have a Law Banning Talking on a Handheld Cell
Phone While Driving 45
Figure 6-2 Does Your State Have a Law Banning Talking on a Handheld Cell
Phone While Driving by Actual State Law 46
Figure 6-3 Likelihood of Ticket for Talking on a Cell Phone While Driving 47
Figure 6-4 Likelihood of Ticket for Talking on a Cell Phone While Driving
by Highest Level of School Completed 48
Figure 6-5 Do You Support a Law Banning Talking on a Handheld Cell Phone
While Driving 49
Figure 6-6 Support for Law Banning Talking on a Handheld Cell Phone While
Driving by Age and Gender ( Yes) 50
Figure 6-7 Average Fine for Talking on Handheld Cell Phone While Driving
by Age and Gender 51
Figure 6-8 Does Your State Have a Law Banning Texting or E-Mailing
While Driving 52
iii
Figure 6-9 Does Your State Have a Law That Bans Sending Electronic Messages
While Driving by Actual State Law 53
Figure 6-10 Likelihood of Ticket for Sending Text Messages or E-Mails
While Driving 54
Figure 6-11 Likelihood of Ticket for Sending Text Messages or E-Mails
While Driving by Highest Level of School Completed 55
Figure 6-12 Do You Support a Law Banning Texting or E-Mailing
While Driving 56
Figure 6-13 Support for Law Banning Texting or E-Mailing While Driving
by Age and Gender ( Yes) 57
Figure 6-14 Average Fine for Sending Text Messages or E-Mails While Driving
by Age and Gender 58
Figure 6-15 Ever Stopped by Police for Using Phone While Driving by Age and
Gender 59
Figure 7-1 Percentage of Respondents Who Heard a Message Discouraging
Distracted Driving in Past 30 Days 60
Figure 7-2 Frequency of Driving Among Respondents Exposed to Messages
Discouraging Cell-Phone-Related Distracted Driving 61
Figure 7-3 Source of Messages Discouraging Cell-Phone-Related Distracted Driving 63
Figure 7-4 Source of Messages Discouraging Cell-Phone-Related Distracted Driving
by Age 64
Figure 7-5 Source of Messages Discouraging Cell-Phone-Related Distracted Driving
by Gender 65
Figure 7-6 Heard Slogans in Past 30 Days 66
Figure 7-7 Number of Slogans Heard in Past 30 Days 67
Figure 7-8 Number of Distracted Driving Slogans Heard in Past 30 Days by Age 68
Figure 7-9 Number of Distracted Driving Slogans Heard in Past 30 Days by Gender 69
Figure 8-1 Had a Crash or Near-Crash in Past Year 70
Figure 8-2 Had a Crash or Near-Crash in Past Year by Age and Gender 71
Figure 8-3 Was the Respondent Distracted During the Last Crash or Near-Crash 72
Figure 8-4 Was Distracted During Last Crash or Near-Crash Experience
by Age and Gender 73
Figure 8-5 Type of Distraction at Time of Crash or Near-Crash 74
Figure 9-1 Perception of Proportion of Drivers Talking on PhoneTexting
While Driving 75
Figure 9-2 Safer to Use Hands-Free or Handheld Phone While Driving 76
Figure 9-3 Safer to Use Hands-Free or Handheld Phone While Driving
by Age and Gender 77
Figure 9-4 Would Use App to Block Calls and Texts While Driving ( Yes) 78
Figure 10-1 Driver Type by Age and Gender 83
Figure 10-2 Driver Type by Highest Level of School Completed 84
iv
Figure 10-3 Driver Type by RaceEthnicity 85
Figure 10-4 Driver Type by Income 86
Figure 10-5 Driver Type by Frequency of Driving 87
Figure 10-6 Driver Type by Car Type 88
Figure 10-7 Cell Phone Ownership by Driver Type 89
Figure 10-8 Proportion of Distraction-Prone Drivers by NHTSA Region 90
Figure 10-9 Perception of Safety by Driver Type Driver Is Talking to Other Passengers 91
Figure 10-10 Perception of Safety by Driver Type Driver Is Talking on Cell Phone
While Holding Phone 92
Figure 10-11 How Likely Are You to Intervene if the Driver Is Talking on a Cell
Phone While Holding the Phone by Driver Type 93
Figure 10-12 Perception of Safety Driver Is Sending Text Messages or E-Mails by
Driver Type 94
Figure 10-13 How Likely Are You to Intervene if Driver Is Sending Text Messages or
E-Mails by Driver Type 95
Figure 10-14 Perception of Safety Driver Is Reading Text Messages or E-Mails
by Driver Type 96
Figure 10-15 Number of Seconds a Driver Can Safely Take HisHer Eyes
Off the Road Messages by Driver Type 97
Figure 10-16 Has Your Frequency of Answering Phone Calls While Driving
Increased Decreased or Stayed the Same by Driver Type 98
Figure 10-17 Likelihood of Ticket for Talking on a Cell Phone While Driving
by Driver Type 99
Figure 10-18 Support for Law Banning Talking on a Handheld Cell Phone
While Driving by Driver Type 100
Figure 10-19 Likelihood of Ticket for Sending Text Messages or E-Mails
While Driving by Driver Type 101
Figure 10-20 Average Fine for Cell Phone Use While Driving by Driver Type 102
Figure 10-21 Ever Stopped by Police for Using Phone While Driving by Driver
Type ( Yes) 103
Figure 10-22 Respondents Exposed to Messages Discouraging Cell Phone
Distracted Driving by Driver Type 104
Figure 10-23 Source of Messaging by Driver Type 105
Figure 10-24 Had a Crash or Near-Crash in Past Year by Driver Type 106
Figure 10-25 Was Distracted During Last Crash or Near-Crash Experience
by Driver Type 107
Figure 10-26 Safer to Use Hands-Free or Handheld Phone While Driving
by Driver Type 108
Figure 10-27 Would Use App to Block Calls and Texts While Driving
by Driver Type 109
v
Figure 11-1 Answering and Making Phone Calls While Driving ( AlwaysAll Trips) 112
Figure 11-2 Do You Send Text Messages or E-Mails While Driving
( at Least Sometimes) 113
Figure 11-3 Has Your Frequency of Sending and Receiving Text Messages or E-Mails
While Driving Increased Decreased or Stayed the Same 114
Figure 11-4 Reasons for Decrease in Sending and Receiving Text Messages
While Driving 115
Figure 11-5 Perceived Safety as a Passenger ( Safe) 116
Figure 11-6 Likelihood of Intervening if Driver Is Using a Cell Phone While Driving 117
Figure 11-7 Do You Support a Law Banning Talking on a Handheld Cell Phone While
Driving or a Law Banning Texting or E-Mailing While Driving ( Yes) 118
Figure 11-8 Likelihood of Ticket for Using Cell Phone While Driving
( VerySomewhat Likely) 119
Figure 11-9 Was Respondent Stopped by Police for Using a Handheld Cell Phone
While Driving Percentage of Respondents Exposed to Messages
Discouraging Distracted Driving - Past 30 Days ( Yes) 120
Figure 11-10 Exposure to Distracted Driving Crash 121
vi
LIST OF TABLES
Table 2-1 Demographics by Sample Type ndash Unweighted 10
Table 3-1 Ownership of Electronic Devices and Connectivity 12
Table 3-2 Location of Phone in Vehicle and Method of Answering 18
Table 3-3 Answer Calls While Driving by Age and Gender 20
Table 3-4 Make Calls While Driving by Age and Gender 20
Table 3-5 Reasons For Answering and Making Phone Calls While Driving 21
Table 3-6 Send Text Messages or E-Mails While Driving by Age and Gender 24
Table 3-7 Read Text Messages or E-Mails While Driving by Age and Gender 24
Table 3-8 Reasons for Sending Text Messages or E-Mails While Driving 26
Table 3-9 Use Smartphone Apps While Driving by Age and Gender 29
Table 3-10 Smartphone Apps Used While Driving 31
Table 3-11 Reasons For Using Apps While Driving 32 Table 3-12 Perceived Difference in Driving When Talking on a Cell Phone TextE-Mail
Messaging and Using Apps 34 Table 3-13 Behavior Differences in Vehicle When Talking on a Cell Phone TextE-Mail
Messaging and Using Apps 35 Table 3-14 Driving Situations Respondent Not Likely to Talk on Phone TextE-Mail
Message or Use Apps 36
Table 4-1 Perceived Safety as Passenger 37 Table 4-2 How Likely Are You to Intervene if the Driver Is Talking on a Cell Phone
While Holding the Phone by Age and Gender 39 Table 4-3 How Likely Are You to Intervene if the Driver Is Sending Text Messages or
E-Mails While Driving by Age and Gender 40
Table 5-1 Reasons for Decrease in Using Cell Phone While Driving 44
Table 7-1 Source of Messages Discouraging Cell-Phone-Related Distracted Driving 62
Table 10-1 Distracting Behavior Frequency (Used in Cluster Analysis) 80
Table 10-2 Distracted Driving Behaviors by Driver Type 81
Table 11-1 Engaging in Distracted Driving Activities (Always or All Trips) 111
Table B-1 Expected Population and Sample Distribution by Age Based on 2013
Census Bureau Estimates B-3
Table B-2 Sample Size by Type and Age B-5
Table B-3 Landline Cross-Section Final Disposition Report B-6
Table B-4 Cell Phone Final Disposition Report B-7
Table B-5 Landline Oversample Final Disposition Report B-8
Table B-6 Estimated 95 Error Margins for Various Sample Sizes B-11
Table B-7 Estimated 95 Error Margins For the Difference Between Two Subgroups B-12
vii
Table B-8 Base Sampling Weights by Sample Component B-15
Table B-9 Control Variables Used in the Raking B-18
Table B-10 IGCV Weight Trimming Values B-19
Table B-11 Summary of Final Weights B-20
Table C-1 Raking Results C-2
viii
EXECUTIVE SUMMARY
The 2015 National Survey on Distracted Driving Attitudes and Behavior (NSDDAB) is the third telephone survey conducted by NHTSA to assess attitudes and self-reported behaviors related to distracted driving cell phone use and texting The first NSDDAB was conducted in 2010 and the second was conducted in 2012 The 2015 survey was administered by Abt SRBI a national survey research organization The survey employed a partial overlapping dual-frame sample design of households with landline telephones as well as households that relied on cell phones and collected data from drivers 16 and older Because younger respondents tend to be underrepresented in landline telephone surveys the survey included a landline telephone oversample of drivers 16 to 34 Interviewing began on January 20 2015 and ended on April 14 2015
This report presents the survey findings from the 2015 NSDDAB The data is weighted to yield national estimates Readers are cautioned that some subgroup analyses are based on a smaller number of cases A full description of the survey methodology and the questionnaire are presented in the appendices to this report
Driver Characteristics
Driving Frequency More than 4 in 5 respondents (83) drive every day or almost every day Thirteen percent report driving a few days a week while 4 drive a few days a month or less often
Vehicle Type The majority of drivers (57) report they most often drive a passenger car Nineteen percent of respondents report driving an SUV 15 report driving a pickup truck and 7 report driving a van or a minivan most often
Driver Type A driver typology based on the pattern of responses across 15 questions concerned with distracted driving classified all respondents into two distinct groups of drivers with similar overall behavioral tendencies Of those respondents categorized 42 were classified as distraction-prone drivers and 58 were classified as distraction-averse drivers
Phone-Related Distracted Driving
Cell Phone Ownership Overall 90 of respondents report owning some type of cell phone and 94 of respondents who report driving every day state that they currently own a cell phone
Talking on Cell Phone While Driving About 4 in 10 (42) drivers report answering their cell phones when driving at least some of the time Nearly 4 in 10 drivers (37) report never answering their phones while driving More than half of drivers (56) who answer their phones while driving continue to drive while completing the conversation Seventeen
1
percent report handing the phone to a passenger in the car 14 of drivers inform the caller they will call them back and 7 pull over to a safe location to continue the conversation The majority of drivers who report accepting calls while driving indicated that the frequency with which they use cell phones when driving has not changed in the past 30 days (81) 15 report a decrease and 3 report an increase in their frequency of cell phone use Of those who reported a decrease 21 cited an increased awareness of safety as the reason for the change One-third of drivers (34) report that they are at least sometimes willing to make cell phone calls while driving More than 4 in 10 respondents report that they are never willing to initiate a cell phone call while driving (44)
Sending and Reading Text Messages and E-Mails While Driving Almost 1 in 10 respondents (9) reported sending text messages or e-mails while driving at least sometimes while 80 of respondents stated that they never do so An additional 11 of respondents reported sending text messages or e-mails on rare occasions Reading text messages or e-mails while driving was slightly more common with 12 of respondents stating that they do so at least some of the time and three quarters (75) stating that they never do so Of drivers who send text messages or e-mails 44 state that they wait until they reach a red light or stop sign to send the message About 1 in 5 drivers (19) report using a voice command feature to send a text message Fourteen percent of drivers continue to drive when sending text messages Less frequently drivers report handing the phone to a passenger (11) or pulling over to the side of the road (8) The majority of drivers (71) reported no changes in the frequency of sending text messages in the past 30 days 25 reported a decrease and 3 reported an increase Reasons given by those who reported a decrease included an increased awareness of safety (26) less use of cell phone or less people text them (19) and driving less (9)
Using a Smartphone App While Driving About 1 in 12 respondents (8) stated they used apps at least sometimes while driving not including navigation apps Musicradio apps (eg Pandora) (41) Facebook (12) and Internet search engines (eg Chrome Safari) (7) were the most frequently cited apps Respondents said that they were more likely to use a smartphone app while driving when they are in need of directions or other information (21) for musicentertainment (12) or when they are bored (11) Nearly 6 in 10 respondents who use apps while driving (56) believe that using a smartphone app while driving has no negative influence on their driving
Perceptions of Safety
Perception of Safety When Driver Is Engaged in Distracting Activities When asked about their feelings concerning safety if they were a passenger in a car driven by a driver who was also doing various activities while driving most respondents indicated they would feel very unsafe if the driver was watching a movie (97) using a laptop computer (96)
2
or sending text messages or e-mails (86) A majority also reported that they would feel very unsafe if their drivers were reading e-mails or text messages (81) Distraction-averse respondents were more likely than distraction-prone respondents to report feeling unsafe as passengers if their drivers were reading or sending text messages Almost all distraction-averse drivers reported they would feel very unsafe as passengers if their drivers were reading (90) or sending (93) text messages compared to 69 and 76 respectively of respondents classified as distraction-prone drivers Sixty-three percent of respondents stated they would feel safe if the driver was talking to other passengers in the vehicle Nearly half of respondents (47) reported that they would feel safe if their drivers were talking on a cell phone with a hands-free device
Likelihood of Saying Something to Drivers if They Are Engaged in Distracting Activities Respondents were asked how likely they would be to intervene if their drivers were engaged in a series of other activities while driving Overall 67 of respondents stated that they were at least somewhat likely to intervene if they were passengers in a car in which the driver was talking on a cell phone and holding the phone while driving Respondents who were classified as distraction-averse were more likely to intervene than respondents classified as distraction-prone Among those classified as distraction-averse 53 stated they would very likely intervene compared to 37 of respondents who were classified as distractionndashprone drivers Overall 87 of respondents indicated that they were at least somewhat likely to intervene if they were passengers in a car in which the driver was sending e-mails or text messages There was almost no difference in the proportion of distraction-prone and distraction-averse drivers at least somewhat likely to intervene if a driver was sending e-mails or text messages
Likelihood of Using Smartphone Apps That Disable Texting and Incoming Calls When Driving Nearly half of the respondents (46) said that they would use an app to block phone calls and text messaging while driving Female drivers (50) and drivers 45shy54 (52) were the most likely to say that they would use an app that blocks phone calls and text messaging while driving Drivers 21 to 24 were the most likely to state that they already use an app to block incoming calls and texts (3)
Distracted Driving Laws and Educational Messages
Awareness of State Law Banning Talking and Texting on a Handheld Cell Phone While Driving Overall more than half of respondents (57) reported that their States have or probably have a law banning talking on a cell phone while driving while 16 of respondents were unsure if their States have such a law Regarding a texting ban 76 reported that their States have or probably have a law banning texting or e-mailing on a cell phone while driving Fourteen percent of respondents were unsure if their States have such a law In States with laws banning cell phone use while driving 83 of drivers were
3
aware of the law and 4 thought their States had no such law In States without laws banning cell phone use while driving 39 of drivers accurately stated that their States did not have a law banning cell phone use while 29 incorrectly thought their States had such a law when it did not In States that ban sending or reading text messages and e-mails while driving 64 of drivers knew about the law and 8 thought their States did not have a law In States without laws that ban sending and receiving text messages and e-mails while driving 25 were aware that their States did not have such a law and 36 incorrectly thought their States had such a law when it did not
Chances of Receiving a Ticket for Distracted Driving Overall slightly more than half of respondents in States with laws banning some form of cell phone use while driving thought a driver who regularly talks on a cell phone (54) or frequently sends text messages or e-mails (56) while driving was likely to get a ticket in the next 6 months More than 4 in 10 respondents stated that it was unlikely that a driver would be ticketed for talking on a cell phone (43) or sending text messages (42) while driving Distraction-averse drivers were more likely to report that a driver who regularly talks on a cell phone or sends text messages or e-mails was very likely to be ticketed Drivers with less formal education were more likely to believe that the driver would be ticketed while those with more formal education were more likely to believe that the driver would not be ticketed
Support of a Law Banning Talking on a Handheld Cell Phone and Texting or E-Mailing While Driving Three out of 4 drivers support State laws banning talking on a handheld cell phone while driving (74) An overwhelming majority (92) support State laws that ban texting or e-mailing while driving
Educational Messages Of all respondents 71 had seen or heard a message discouraging distracted driving in the past 30 days Drivers who drove every day were more likely than those who drove less frequently to report having seen or heard these messages Respondents who were classified as distraction-prone (75) were more likely than distraction-averse (67) respondents to report hearing or seeing these messages The most common sources of messages discouraging distracted driving were TV print media and radio with some respondents reporting seeing messages in more than one medium More than half of respondents (68) reported TV as a source of the message Billboards were reported by 36 of respondents and 26 of respondents stated that the radio was a source of the message
Safe Driving Slogans More than half of respondents (51) had heard or seen ldquoIt Can Waitrdquo in the past 30 days Over one quarter of respondents had heard ldquoU Drive U Text U Payrdquo (28) or ldquoOne Text or Call Could Wreck It Allrdquo (28) within the past month
4
Around 1 in 5 had heard ldquoNo Phone Zonerdquo (22) ldquoOn the Road Off the Phonerdquo (19) or ldquoPut It Downrdquo (18)
Crashes
Seven percent of respondents were involved in a crash and 5 were involved in a near-crash in the past year Of those 14 reported being distracted at the time of their last crash Younger respondents were more likely to report being distracted at the time of the crash or near-crash with 27 of respondents 16 to 20 18 of respondents 21 to 24 and 23 of respondents 25 to 34 reporting they were distracted when the crash or near-crash occurred
Demographic Profile of Distraction-Prone and Distraction-Averse Drivers
Demographic Profile A driver typology based on the pattern of responses across 15 questions concerned with distracted driving classified all respondents into two distinct groups of drivers with similar overall behavioral tendencies Of those respondents categorized 42 were classified as distraction-prone drivers and 58 were classified as distraction-averse drivers Drivers classified as distraction-prone tend to be younger be more affluent and have more formal education than distraction-averse drivers More than half of drivers (58) 44 and younger were classified as distraction-prone compared to 12 of drivers 65 or older Over half of respondents with annual household incomes exceeding $100000 were classified as distraction-prone (57) compared to 32 of drivers with annual household incomes below $10000 Among drivers without a high school degree about a third was classified as distraction prone (34) compared to 53 of drivers with a college degree and 46 of drivers who hold a graduate degree There was no difference in the proportion of distraction-prone and distraction-averse drivers by gender
Trends in Distracted Driving
Although the rates of engaging in the various distracted activities while driving varied slightly from 2010 to 2015 there was little change in the proportion of respondents who reported these behaviors About 1 in 3 respondents (29 in 2010 31 in 2012 and 35 in 2015) stated they always talk to passengers while driving In 2010 and 2012 6 of drivers reported answering or making phone calls on all driving trips Unlike the previous years the 2015 survey separated making and answering phone calls About 1 in 20 respondents stated that they always initiate (4) or answer phone calls (10) while driving The proportion of drivers who always send or read text messages while driving remained about the same between 2010 and 2015 Approximately 1-2 of drivers report always sending or reading text messages or e-mails while driving
Respondents who said they at least rarely use their cell phones for text messaging were asked if the frequency with which they send and receive text messages or e-mails in the
5
past 30 days had changed In all three surveys most respondents reported that the rate at which they send electronic messages had stayed the same over the last 30 days (64 in 2010 67 in 2012 and 71 in 2015) In 2010 31 of respondents reported a decrease in the rate at which they send electronic messages In 2012 and 2015 fewer respondents reported a decrease (27 and 25 respectively) The percentage of respondents who reported an increase was 4 in 2010 5 in 2012 and 3 in 2015
In all three surveys respondents who reported sending or receiving fewer electronic messages while driving in the past 30 days were asked what caused this decrease The most common answer from respondents in all three surveys was an increased awareness of safety (32 in 2010 38 in 2012 and 26 in 2015) followed by a law that bans cell phone use (6 in 2010 8 in 2012 and 4 in 2015)
The proportion of respondents who said they would feel safe if their drivers were talking on a handheld cell phone while driving has decreased considerably between 2010 and 2015 In 2010 nearly one quarter of respondents (23) said they would feel safe in this driving situation while only 12 of respondents in 2012 and 10 of respondents in 2015 said they would feel safe if the driver was engaged in a phone conversation while holding a cell phone Conversely the proportion of respondents who would feel safe in a car operated by a driver using a hands-free device has increased over the years Nearly one half of respondents in 2015 (47) would feel safe if their drivers were using hands-free devices to make or answer phone calls while driving compared to 40 of respondents in 2012 and 23 of respondents in 2010
The proportion of respondents involved in a crash or near-crash as a driver has decreased slightly between 2010 and 2015 In 2010 14 of respondents indicated they had been involved in a crash or near-crash in the past year compared to 12 of respondents in 2015 Although the proportion of respondents involved in a crash or near-crash has decreased over the past 5 years 2015 respondents (13) were about three times as likely as 2012 respondents (4) and about twice as likely as 2010 respondents (6) to say they were talking on the phone sending or reading text messages or e-mails at the time of the crash or near-crash
6
CHAPTER 1 INTRODUCTION
Background
NHTSArsquos mission is to save lives prevent injuries and reduce traffic-related health care and other economic costs This includes promoting issues surrounding improved safety and responsible behavior among drivers The increase in cell phone ownership and usage combined with the widespread availability of many other devices that can easily divert driversrsquo attention from the task of driving an automobile have made information on driversrsquo behaviors and attitudes toward distracted driving important to the safety of Americarsquos roadways
Common activities that drivers engage in while driving include talking with other passengers adjusting the car radio making and receiving cell phone calls and using a smartphone for driving directions1 In 2012 more than one quarter of drivers in the United States reported always or almost always answering a phone call while they driving (28) and 6 said they always or almost always make a phone call while driving2
The use of technological devices while driving has become a focus of distracted driving research In particular use of cell phones while driving has been of increasing interest in the past decade Initially it was thought that using hands-free devices would be safer than handling and manipulating the phone because this would eliminate a biomechanical (physical) distraction However studies comparing use of handheld and hands-free phones while driving indicate that the cognitive distraction of talking on the phone has a large effect on driving outcomes and thus hands-free devices are no safer than handheld devices3 Even portable hands-free and vehicle-integrated hands-free cell phone use involved visual-manual tasks at least half of the time which is associated with a greater crash risk4
Driver distraction contributes to crash-related fatalities and injuries particularly among drivers
1 Schroeder P Meyers M amp Kostyniuk L (2013) National survey on distracted driving attitudes and behaviors ndash 2012 (Report No DOT HS 811 729) Washington DC National Highway Traffic Safety Administration Available at wwwnhtsagovstaticfilesntipdf811729pdf 2 Schroeder P Meyers M amp Kostyniuk L (2013) National survey on distracted driving attitudes and behaviors ndash 2012 (Report No DOT HS 811 729) Washington DC National Highway Traffic Safety Administration Available at wwwnhtsagovstaticfilesntipdf811729pdf 3 Young K amp Regan M (2007) Driver distraction A review of the literature In I J Faulks M Regan M Stevenson J Brown A Porter amp J D Irwin (Eds) Distracted driving (pp 379-405) Sydney New South Wales Australia Australasian College of Road Safety 4 Fitch G A Soccolich S A Guo F McClafferty J Fang Y Olson R L hellip amp Dingus T A (2013 April) The impact of handheld and hands-free cell phone use on driving performance and safety-critical event risk (Report No DOT HS 811 757) Washington DC National Highway Traffic Safety Administration
7
under 30 who are overrepresented in distraction-affected fatal crashes5 A distraction-affected crash is any crash in which a driver was identified as distracted at the time of the crash Overall 10 of fatal crashes in the United States in 2015 involved driver distraction and 14 of these fatal crashes involved reports of a cell phone as a distraction A recent study suggested that the number of deaths from motor vehicle crashes in which the driver was texting or talking on the phone is underreported6 The underreporting of driver cell phone use andor texting in crashes makes the distracted driving issue appear less significant than it actually is and impedes efforts to make tougher distracted driving laws
To better understand the attitudes and self-reported behaviors related to cell phone use texting and distracted driving NHTSA conducted the National Survey on Distracted Driving Attitudes and Behaviors in 2010 2012 and again in 2015 This report presents findings from the 2015 National Survey on Distracted Driving Specifically the 2015 NSDDAB assessed the extent to which drivers are distracted by various activities demographic and typological descriptions of drivers prone to distractions the extent and frequency of using cell phones and texting while driving attitudes and perceptions about distracted driving knowledge of and attitudes toward measures to deter distracted driving perceptions about the danger of distracted driving exposure to the consequences of distracted driving willingness to intervene when someone is distracted while driving and changes and trends in distracted driving behavior and attitudes since 2010
Methodology
A total of 6001 interviews were conducted among a nationally representative telephone sample of people 16 or older who had driven a motor vehicle To account for the current shift to cell phone use and the underrepresentation of younger people in samples using landline telephones a partial overlapping dual sampling frame of households with landline phones and households that relied only or mostly on cell phones together with a landline phone oversample of people 16 to 34 years old was used In all 3372 interviews were completed with people from landline households 2128 interviews with people from cell-phone-only or cell-phone-mostly households and an additional 501 interviews of people 16 to 34 were completed from the landline phone oversample The samples were combined and weighted to produce national estimates of the target population within specified limits of expected sampling variability from which valid generalizations can be made to the general population of drivers in the United States
The interviews were conducted from January 20 2015 to April 14 2015 Appendix B contains the complete description of the methodology and sample dispositions including information on the computation of weights
5 National Center for Statistics and Analysis (2017 March) Distracted driving 2015 (Traffic Safety Facts Research Note Report No DOT HS 812 381) Washington DC National Highway Traffic Safety Administration Available at httpscrashstatsnhtsadotgovApiPublicViewPublication812381 6 The National Safety Council (2013) Crashes involving cell phones Challenges of collecting and reporting reliable crash data Itasca IL Author Available at wwwnscorgDistractedDrivingDocumentsNSC-Under-Reporting-White-Paperpdf
8
The percentages presented in this report are weighted to accurately reflect the national population 16 or older Unweighted sample sizes (Ns) are included so that readers know the exact number of respondents answering a given question allowing them to estimate sampling precision
Percentages for some items may not add to 100 due to rounding or because the question allowed for more than one response In addition the number of cases involved in subgroup analyses may not sum to the grand total who responded to the primary questionnaire item being analyzed Reasons for this include some form of non-response on the grouping variable (eg ldquoDonrsquot Knowrdquo or ldquoRefusedrdquo) or use of only selected subgroups in the analysis
All tests for statistical significance were performed using the chi-square test An observed relationship is called statistically significant when the p-value for a chi-square test is less than or equal to 005
For rounding purposes all variables are rounded based on two decimal places Any value that had a decimal of 50 or greater was rounded up and any value that had a decimal below 50 was rounded down ldquoDonrsquot knowrdquo and ldquoRefusedrdquo answers were coded as valid answers but were not reported in the figures and tables of this report unless the sample size was greater than 50
9
CHAPTER 2 DESCRIPTION OF RESPONDENT POPULATION
To capture a sample of respondents representative of drivers 16 and older in the United States a landline cross section sample a landline oversample of respondents 16 to 34 and a cell phone sample were used (see Table 2-1) Of the 6001 survey respondents 3372 (56) were sampled from the landline cross section sample 501 from the landline oversample (8) and 2128 from the cell phone sample (35) The cell phone sample captured several groups often unreachable by landline phones Drivers 20 and younger comprise 12 of the cell phone sample and 22 of the cell phone sample are under 25 By contrast 3 of respondents in the landline cross section sample are under 25 The landline oversample captured more respondents in the younger age groups with 43 of respondents in the landline oversample being under 25
Table 2-1 Demographics by Sample Type ndash Unweighted
Cell Phone Sample
(N=2128)
Landline Cross Section
(N=3372)
Landline Oversample
(N=5017)
Total Sample (N=6001)
Gender Female 443 567 563 502 Male 557 433 437 498
Age Mean 3821 5643 2541 4595 16 to 20 124 18 300 82 21 to 24 97 10 126 59 25 to 34 260 40 553 170 35 to 44 180 147 00 159 45 to 54 144 233 00 179 55 to 64 109 229 00 159 65 or older 71 303 00 173
2014 Household Income Less than $10000 75 38 111 59 $10000 to $14999 55 39 95 49 $15000 to $24999 77 74 100 77 $25000 to $49999 208 189 174 198 $50000 to $99999 278 283 242 279 $100000 to$149999 112 134 63 120 $150000 to $199999 41 47 21 43 $200000 or more 43 46 32 44
7 There were 518 total respondents who completed the oversample survey but 17 reported that they were older than 34 Those respondents older than 34 are not included in the analysis
10
Table 2-1 Demographics by Sample Type ndash Unweighted (Continued)
Cell Phone Sample (N=2128)
Landline Cross Section
(N=3372)
Landline Oversample
(N=501)
Total Sample (N=6001)
Education No HS Degree 143 89 259 122 HS Graduate 253 268 270 260 Some College 328 312 291 320 College Graduate 156 165 101 159 Some Graduate School 17 14 16 15 Graduate Degree 96 138 58 114
Number of Children 15 or Younger in Household 0 599 731 405 652 1 to 3 370 245 553 319 4 or More 23 16 32 20
Ethnicity Hispanic 155 84 311 128 Not Hispanic 838 907 679 864
RaceEthnicity White 697 796 584 738 Black 119 92 126 107 Asian 55 41 44 48 American IndianAlaska Native
20 11 42 17
Native Hawaiian or other Pacific Islander
16 05 15 11
(VOL) Hispanic 100 45 195 78 Other 04 02 00 03
Homeowner Status Own 582 849 558 701 Rent 336 112 295 234 Some Other Arrangement 69 25 121 51
Frequency of Driving Everyday 730 617 683 678 Almost Everyday 122 183 122 149 Few Days a Week 108 162 138 133 Few Days a Month 26 31 42 29 Few Days a Year 12 05 16 09
Primary Type of Vehicle Car 570 561 574 566 VanMini-Van 58 89 137 74 SUV 188 190 132 187 Pickup Truck 160 148 142 154 Other Truck 15 06 11 11 Motorcycle 04 01 00 02 Other 05 04 11 05
For the remainder of this report all percentages that appear in figures and tables are based on the weighted data unless otherwise noted
11
CHAPTER 3 PHONE-RELATED DISTRACTED DRIVING
This chapter examines the use of cell phones for initiating and receiving calls texting and eshymailing messages and using smartphone applications The reasons respondents gave for engaging in this behavior is also explored Table 3-1 shows the proportion of respondents who own various devices that can distract drivers when operated while driving Among these ownership of cell phones is the highest at 908
Table 3-1 Ownership of Electronic Devices and Connectivity
Q3 Do you currently own any of the following Percent Yes
A cell phone (any cell phone including smartphone) 903
A lsquosmartphonersquo such as a Droid iPhone or Blackberry 664
A portable music player such as a CD player iPod or Zune 350
A portable navigation system such as TomTom or Garmin 320
A navigation system built into the vehicle such as Onstar or Sync 207 A Bluetooth or other hands-free device for your cell phone such as one that plugs into the phone works wirelessly or works through your vehiclersquos car stereo 500
Q3a1 Is the vehicle you drive most often equipped with built-in hands-free Bluetooth capability 283 Q3a2 Have you paired or ldquoconnectedrdquo your phone with the vehicle via Bluetooth 243
Base All respondents Unweighted N =6001 Only asked of respondents who reported owning a cell phone or smartphone Only asked of respondents who reported owning a Bluetooth or other hands-free device for their cell
phones
8 While 903 of respondents reported that they own ldquoA cell phonerdquo that percentage increases to 906 when respondents who reported owning ldquoA lsquosmartphonersquo such as a Droid iPhone or Blackberryrdquo are included
12
Figure 3-1 shows the proportion of respondents who own cell phones by their frequency of driving There was a statistically significant relationship between cell phone ownership and frequency of driving a vehicle where more frequent drivers were more likely to own cell phones Respondents who drove every day or almost every day are more likely to own cell phones than respondents who drove less frequently except for those who drove only a few days each year Ownership of cell phones is 94 among those who drove every day and 86 among those who drove almost every day Cell phone ownership for those driving a few days a week is 79 For those driving no more than a few days a month cell ownership is 77 Among those who drove least frequently (a few days a year) 9 in 10 owned a cell phone (89)
Figure 3-1 Cell Phone Ownership
by Frequency of Driving
937 857
790 774
893
0
20
40
60
80
100
Every Day Almost Every Few Days a Few Days a Few Days a (N=3913) Day Week Month Year
(N=971) (N=854) (N=193) (N=58)
Q1 How often do you drive a motor vehicle regardless of whether it is for work or for personal use Every day almost every day a few days a week a few days a month a few days a year or do you never drive Q3 Do you CURRENTLY own any of the following devices (plt0001) Base All respondents Unweighted N=See Figure
13
100
80
60
40
20
0
97 56
268
212
366
Always Almost Always Sometimes Rarely Never
When asked how often they answer an incoming cell phone call when driving 15 of respondents reported that they always or almost always answer the phone and 27 reported that they sometimes answer an incoming call while driving More than half (58) of respondents said that they rarely (21) or never (37) answer the phone while driving
Figure 3-2 Answer Phone While Driving
Q4d Irsquom going to read a list of common activities people do while driving For each activity Irsquod like you to tell me how often YOU do each while driving For each please tell me if you do the activity always almost always sometimes rarely or never How often do you answer phone calls Base All respondents Unweighted N=6001
14
100
80
60 562
40
20 166 137
69 48
0 Answer and Hand the Phone Answer and Answer and Pull Over to a Safe
Continue to Drive to a Passenger to Inform the Caller Promptly Pull Location First and While Completing Answer if You You will Call Back Over to a Safe then Speak to the the Conversation Have One Later Location Caller
More than half (56) of respondents who reported answering an incoming phone call while driving stated that they usually continue to drive while completing the conversation One in 7 (14) drivers usually informs the callers they will call them back later and 17 usually hand the phone to a passenger in the car Only 7 of respondents state that they pull over to a safe location after answering the phone while 5 report that they first pull over to a safe location and then answer the call
Figure 3-3 How Phone Calls Are Answered While Driving
Q5c When you answer a call while driving do you USUALLYhellip Base Respondents answering calls while driving at least rarely Unweighted N=3704
15
100
80
60
444
40
254 220
20
38 44
0 Always Almost Always Sometimes Rarely Never
When asked how often respondents make a phone call while driving nearly half of them (44) stated that they never make a phone call when driving Few respondents indicated that they always (4) or almost always (4) make a call while driving One-quarter (25) indicated that they sometimes make calls More than 1 in 5 (22) stated that they rarely do so
Figure 3-4 Make Phone Calls While Driving
Q4c Irsquom going to read a list of common activities people do while driving For each activity Irsquod like you to tell me how often YOU do each while driving For each please tell me if you do the activity always almost always sometimes rarely or never How often do you make phone calls Base All respondents Unweighted N=6001
16
100
80
60 513
449
40 329
288
206 20
0 Voice‐Dial Speed Dial or Scroll Through Manual Dialing Varies
(Speaking a Name Favorites Saved Numbers or Phone Number) and Select
When asked how they make a call while driving 51 of respondents report that they use voice dialing by saying the number or personrsquos name aloud into the microphone of the cell phone or their in-vehicle system (eg Sync Uconnect) About half mentioned using speed dial or the ldquofavoritesrdquo function on their phones (45) 33 mention selecting the number by scrolling through saved numbers and 29 mention manual dialing About 1 in 5 (21) said that their method of dialing varies
Figure 3-5 Method of Dialing Phone Number While Driving
Q6a Which of the following ways do you usually MAKE a call while driving Please answer Yes or No after I read each item Base Respondents making calls while driving at least rarely Unweighted N=3168 Respondents offering more than one response Unweighted N =1574
17
As shown in Table 3-2 the most commonly mentioned location for keeping a cell phone in the vehicle while driving was the pocket or purse mentioned by nearly half of respondents owning a cell or smartphone (44) Cup holder or tray was the second most cited location (25) The passenger seat (8) and built-in enclosed storage spaces (7) were mentioned by less than 1 in 10 respondents
Use of the cellrsquos speakerphone feature was cited most often (33) as the method used to make or receive calls while driving followed by use of a built-in car system (31) or holding the phone in onersquos hand (29) Another 1 in 5 mentioned using a hands-free earpiece such as a Bluetooth earpiece device (20) Thirteen percent reported their usual method varied Only 5 mentioned squeezing the phone between the ear and shoulder
Table 3-2 Location of Phone in Vehicle and Method of Answering
Q5 When not in use where do you put your cell phone while driving 9
Percent Yes
Pocket or purse 444
Cup holder or tray 245
Passenger seat 77
Built-in enclosed storage space 74
Console 61
Mount on dashboard 40
Lap 32
Attach to beltwaistband 18
Glovebox 17
Backseat 04
In hand 01
Q5a Which of the following do you usually do when making or receiving a call while driving
Percent Yes
Use the cell phonersquos speakerphone feature 325
Use a built-in car system (OnStar Sync built-in Bluetooth) 311
Hold the phone in your hand 292
Use a hands-free earpiece 197
It varies 131
Squeeze the phone between your ear and your shoulder 49 Base (Q5) Respondents owning a cell phone or smartphone Unweighted N=5593 Respondents offering more than one response Unweighted N=302 Base (Q5a) Respondents making or answering calls while driving at least rarely Unweighted N=3865 Respondents offering more than one response N=752
9 Respondents volunteered the answers to this question and were not read any answer options
18
Answer Calls Make Calls
334
338
99
250
359
495
473
405
327
336
404
439
199
366
429
547
568
495
397
421
Female (N=3062)
Male (N=2939)
65+ (N=1540)
55 to 64 (N=1155)
45 to 54 (N=968)
35 to 44 (N=696)
25 to 34 (N=892)
21 to 24 (N=281)
16 to 20 (N=345)
Total (N=6001)
0 20 40 60 80 100
Overall more than a third of respondents said they at least sometimes answer (42) or make (34) calls while driving Examining reports of answering and making calls while driving by shows that drivers 21 to 24 25 to 34 and 35 to 44 were more likely to indicate that they answer or make phone calls while driving More than half of respondents 25 to 34 (57) and 35 to 44 (55) stated that they answer calls while driving These two groups were also the most likely to at least sometimes make phone calls while driving (47 and 50 respectively) Among older drivers nearly 1 in 5 drivers 65 and older said they at least sometimes answer calls (20) while driving and 1 in 10 older drivers at least sometimes make calls (10) while driving While male and female drivers were equally likely to say they at least sometimes make phone calls while driving male drivers (44) were more likely to report answering phone calls when driving a vehicle than were female drivers (40)
Figure 3-6 Answer or Make Phone Calls While Driving by Age and Gender ( at Least Sometimes)
Q4cQ4d Irsquom going to read a list of common activities people do while driving For each activity Irsquod like you to tell me how often YOU do each while driving For each please tell me if you do the activity always almost always sometimes rarely or never Q4d How often do you take calls D1 What is your age (plt0001) SA3 Record gender from observation (p=0048)
Q4c How often do you make phone calls D1 What is your age (plt0001) SA3 Record gender from observation (p=0008) Base All respondents Unweighted N=See Figure
19
As mentioned in Figure 3-6 significant gender and age differences were found in making or answering calls while driving Tables 3-3 and 3-4 below provide age breakdowns by frequency of answering and making calls while driving Drivers in the 21-to-24 (20) 25-to-34 (22) and 35shyto-44 (21) age categories were more likely to always or almost always answer calls while driving than were drivers 55 to 64 (12) and 65 and older (7) The proportion of drivers indicating that they never make (75) or answer (61) calls is higher among 65+ year olds
Table 3-3 Answer Calls While Driving by Age and Gender
Q4d How often do you ANSWER calls while drivinghellip
N Always Almost Always
Sometimes Rarely Never
Total Respondents 6001 97 56 268 212 366 by Age Category
16- to 20-Year-Old Drivers 345 121 36 240 251 352 21- to 24-Year-Old Drivers 281 91 107 297 255 250 25- to 34-Year-Old Drivers 892 136 85 347 200 233 35- to 44-Year-Old Drivers 696 124 89 334 218 232 45- to 54-Year-Old Drivers 968 96 41 292 216 355 55- to 64-Year-Old Drivers 1155 77 39 250 209 423 65+-Year-Old Drivers 1540 46 27 126 187 612
by Gender Male Drivers 2939 106 59 274 211 349 Female Drivers 3062 88 54 262 213 382
D1 What is your age (plt0001) SA3Record gender from observation (p=0048) Base All respondents Unweighted N=See Table
Table 3-4 Make Calls While Driving by Age and Gender
Q4c How often do you MAKE calls while drivinghellip
N Always Almost Always
Sometimes Rarely Never
Total Respondents 6001 38 44 254 220 444 by Age Category
16- to 20-Year-Old Drivers 345 22 30 275 269 405 21- to 24-Year-Old Drivers 281 44 61 300 306 289 25- to 34-Year-Old Drivers 892 61 73 339 243 284 35- to 44-Year-Old Drivers 696 58 65 372 223 282 45- to 54-Year-Old Drivers 968 51 41 267 222 419 55- to 64-Year-Old Drivers 1155 22 29 199 203 546 65+-Year-Old Drivers 1540 06 15 78 155 746
by Gender Male Drivers 2939 45 41 252 232 430 Female Drivers 3062 32 46 256 207 459
D1 What is your age (plt0001) SA3 Record gender from observation (p=0008) Base All respondents Unweighted N=See Table
20
Table 3-5 lists the reasons why respondents are likely to answer an incoming call while driving The most common reason given is the identity of the person calling (36) followed by how important they think the call is (17) More than 1 in 10 drivers are likely to answer the phone if it is work-related (14) or in an emergency situation (14) while 9 state that they answer all calls received while driving Smaller percentages of drivers reported that they are likely to answer if the call is from someone they know (8) the call is personal or social (7) or the call is routine or expected (4) The next column in the table shows the reasons respondents gave for making calls on their cell phones while driving Almost one-third of respondents (28) stated that they are willing to make phone calls if they think it is important or urgent and 13 are willing to initiate a phone call if it is work related Almost 1 in 7 respondents stated that they are willing to make calls if they need directions or other information (13) to report a traffic crashemergency (12) or if itrsquos a personal or social call (11) Other reasons for making calls while driving included reporting a medical emergency (5) and whom the respondent was calling (6)
Table 3-5 Reasons for Answering and Making Phone Calls While Driving
Q5bQ6What are the reasons you are more likely to ANSWERMAKE a call while driving
Q5b ANSWER
Percent
Q6 MAKE Percent
Who isI am calling 364 62
How important I think the call is 172 278
Call is work-related 144 130
Urgentemergency situation 139 --
Report a traffic crashemergency -- 122
Report a medical emergency -- 48
I answer all calls 89 --
Call is from someone I know 80 --
Call is personal or social 72 113
Call is routine or expected 38 --
When Bluetoothhands-free technology is available 21 --
Related to scheduleplanslocation 08 69
Non-stressful traffic conditions 07 03
In need of directions or other information 06 134
Boredom 04 21
Call is unexpected 03 --
Call is from a number I dont recognize 03 --
Time of day 02 04
Personal safety 02 09
I think itrsquos safe to call -- 05
Base Q5bQ6 Respondents answeringmaking calls while driving at least rarely Unweighted N =37043168
21
Figure 3-7
Send or Read Text Messages or E-Mails While Driving
Send Read
100
800 80 748
60
40
20 137
113 86
63 10 16 12 14
0 Always Almost Always Sometimes Rarely Never
Figure 3-7 shows the respondentrsquos frequency of sending or reading text messages or e-mails when driving An overwhelming majority of respondents (80) said that they never send text messages or e-mails when they are driving a vehicle Two percent of respondents stated that they always or almost always do A sizable number of respondents occasionally send text messages or e-mails with 6 of respondents who reported they sometimes do and 11 who said they rarely send any messages while driving Reading text messages or e-mails while driving was slightly more common with 12 of respondents stating that they do at least some of the time and three quarters (75) stating that they never do so
Irsquom going to read a list of common activities people do while driving For each activity Irsquod like you to tell me how often YOU do each while driving For each please tell me if you do the activity always almost always sometimes rarely or never Q4f How often do you SEND text or e-mail messages Q4e How often do you READ text or e-mail messages Base All respondents Unweighted N=6001
22
Send Read
50
40
30 264
211 188 20 170
60
14 08
34 13
167 156
139 132 124 116 97 98
85 76 10 74
0 Total 16 to 20 21 to 24 25 to 34 35 to 44 45 to 54 55 to 64 65+ Male Female
(N=6001) (N=345) (N=281) (N=892) (N=696) (N=968) (N=1155) (N=1540) (N=2939) (N=3062)
Overall 1 in 10 (9) respondents send text messages or e-mails at least sometimes while driving Younger drivers were more likely to indicate that they at least sometimes send messages while operating a vehicle Drivers 21 to 34 (17) were the most likely to report sending text messages andor e-mails while driving More than 1 in 10 respondents 16 to 20 (14) and 35 to 44 (12) state that they have sent messages while operating a vehicle Among older drivers only 1 of those 55 or older indicated that they send messages while driving Male drivers were more likely than female drivers to say that they text or send e-mails while driving (10 versus 7) In regards to reading text messages younger drivers were the most likely to indicate that they at least sometimes read text messages while driving One quarter of those 21 to 24 (26) and 1 in 5 of those 16 to 20 (19) and 25-34 (21) indicated reading text messages at least sometimes while driving
Figure 3-8 Send or Read Text Messages or E-Mails While Driving
by Age and Gender ( at Least Sometimes)
Irsquom going to read a list of common activities people do while driving For each activity Irsquod like you to tell me how often YOU do each while driving For each please tell me if you do the activity always almost always sometimes rarely or never Q4f How often do you SEND text messages or e-mails D1 What is your age (plt0001) SA3 Record gender from observation (plt0001)
Q4e How often do you READ text messages or e-mails D1 What is your age (plt0001) SA3 Record gender from observation (plt0001) Base All respondents Unweighted N=See Figure
23
As can be seen in Tables 3-6 and 3-7 the proportion of drivers indicating that they always or almost always send or read text messages or e-mails is higher among younger drivers 16-44 Male drivers were more likely than female drivers to report always or almost always reading text messages or e-mails while driving
Table 3-6 Send Text Messages or E-Mails While Driving by Age and Gender
N Always Almost Always
Sometimes Rarely Never
Total Respondents 6001 10 12 63 113 800 by Age Category
16- to 20-Year-Old Drivers 345 14 34 91 160 701 21- to 24-Year-Old Drivers 281 19 33 115 211 622 25- to 34-Year-Old Drivers 892 18 24 128 192 638 35- to 44-Year-Old Drivers 696 20 19 84 140 736 45- to 54-Year-Old Drivers 968 06 00 54 112 823 55- to 64-Year-Old Drivers 1155 03 00 11 54 931 65+-Year-Old Drivers 1540 00 01 07 17 976
by Gender
Male Drivers 2939 14 09 74 112 790 Female Drivers 3062 07 14 53 114 810
D1 What is your age (plt0001) SA3 Record gender from observation (plt0001) Base All respondents Unweighted N=See Table
Table 3-7 Read Text Messages or E-Mails While Driving by Age and Gender
N Always Almost Always
Sometimes Rarely Never
Total Respondents 6001 16 14 86 137 748 by Age Category
16- to 20-Year-Old Drivers 345 34 18 136 186 626 21- to 24-Year-Old Drivers 281 22 63 179 220 515 25- to 34-Year-Old Drivers 892 31 24 156 215 575 35- to 44-Year-Old Drivers 696 27 23 106 195 649 45- to 54-Year-Old Drivers 968 06 01 69 129 795 55- to 64-Year-Old Drivers 1155 02 00 32 81 884 65+-Year-Old Drivers 1540 00 03 10 22 965
by Gender
Male Drivers 2939 19 15 98 139 729 Female Drivers 3062 12 12 74 134 767
D1 What is your age (plt0001) SA3 Record gender from observation (plt0001) Base All respondents Unweighted N=See Table
24
100
80
60
438
40
193 20 138
106 80
0 Wait Until You Use a Voice Continue to Drive Hand the Phone Pull Over to a Safe
Reach a Red Light Command Feature While Completing to a Passenger to Location to Send or Stop Sign to (Speech Dictation) the Message Do Your the Message
Send the Message Messaging
When asked how they send texts and e-mails while driving 44 of respondents stated that they wait until they arrive at a red light or stop sign About 1 in 5 (19) reported using a voice command feature and another 11 reported handing the phone to a passenger to send the text or e-mail About 1 in 6 (14) stated they continued to drive while sending the text or e-mail The least cited method for sending a text or e-mail when driving was pulling over to a safe location and then sending the message (8)
Figure 3-9 How Text Messages or E-Mails Are Sent While Driving
Q8 When you SEND a text message or e-mail while driving do you USUALLYhellip Base Respondents sending text messages or e-mails while driving at least rarely Unweighted N=1044
25
Respondents who stated that they send texts or e-mails while driving were asked under what conditions they are more likely to do so (see Table 3-8) The majority of respondents (43) report that they are more likely to send a message if it is important Another 9 reported that they are more likely to send a message if it is work-related Close to 1 in 10 (9) are more likely to send a message if it is personal or social in nature Respondents were least likely to cite reasons such as traveling at a low speed (01) or time of day (04)
Table 3-8 Reasons for Sending Text Messages or E-Mails While Driving
8a What makes it more likely you will SEND a text message or e-mail while driving 10 Percent
How important I think the message is 425
Work-related 88
Personal or social 86
Who Im messaging 79
Report a traffic crashemergency 55
Makingresponding to a quickshort message or call 47
In need of directions or other information 43
Related to scheduleplanslocation 34
Report a medical emergency 15
I think its safe to texte-mail 10
Personal safety 10
Non-stressful traffic conditions 08
Boredom 07
Time of day 04
Traveling at a low speed 01 Base Respondents sending text messages or e-mails while driving at least rarely Unweighted N=1044 Respondents offering more than one response Unweighted N=93
10 Respondents volunteered the answers to this question and were not read answer options
26
16 06
62 73
841
0
20
40
60
80
100
Always Almost Always Sometimes Rarely Never
When respondents were first asked about smartphone app usage while driving 8 stated they used apps at least sometimes while driving not including navigation apps (Respondents were later asked about which apps they used and how they used these apps while driving See Q9 Table 3shy10) Very few respondents reported always or almost always using smartphone apps when driving (2) Six percent reported they sometimes do and another 7 said rarely
Figure 3-10 Use Smartphone Apps While Driving
Q4n Irsquom going to read a list of common activities people do while driving For each activity Irsquod like you to tell me how often YOU do each while driving For each please tell me if you do the activity always almost always sometimes rarely or never How often do you use smartphone apps not including a navigation app Base All respondents Unweighted N=6001
27
50
40
30
20
10
0 Total 16 to 20 21 to 24 25 to 34 35 to 44 45 to 54 55 to 64 65+ Male Female
(N=6001) (N=345) (N=281) (N=892) (N=696) (N=968) (N=1155) (N=1540) (N=2939) (N=3062)
85 121 116
141 113
84
35 26
105
64
Examining reports of smartphone app use excluding navigation apps while driving by age and gender shows that younger drivers were more likely to indicate that they at least sometimes use apps while operating a vehicle More than 1 in 10 respondents (12) 16 to 20 and 21 to 24 and 14 of respondents 25 to 34 stated that they at least sometimes use apps while driving Eight percent of those in the 45-to-54 age group report that they at least sometimes use apps while driving Among older drivers only 4 of those 55 to 64 indicated that they at least sometimes use apps while driving Overall 9 of drivers reported using non-navigation apps at least sometimes while driving Males were more likely to report using apps at least sometimes while driving (11) than females (6)
Figure 3-11 Use Smartphone Apps While Driving
by Age and Gender ( at Least Sometimes)
Q4n Irsquom going to read a list of common activities people do while driving For each activity Irsquod like you to tell me how often YOU do each while driving For each please tell me if you do the activity always almost always sometimes rarely or never How often do you use smartphone apps not including a navigation app D1 What is your age (plt0001) SA3 Record gender from observation (plt0001) Base All respondents Unweighted N=See Figure
28
Examining differences in smartphone app use by age categories and gender reveals patterns similar to those found among drivers who text and send e-mails while driving Respondents in the 16- toshy20 (4) 21-to-24 (3) and 25-to-34 (4) categories were the most likely to state they always or almost always use apps while driving while almost all respondents over 55 reported they did not use apps while driving Male drivers (3) were more likely than female drivers (2) to say that they always or almost use smartphone apps while driving
Table 3-9 Use Smartphone Apps While Driving by Age and Gender
Q4n How often do you use Smartphone Apps while Drivinghellip
N Always Almost Always
Sometimes Rarely Never
Total Respondents 6001 16 06 62 73 841 by Age Category
16- to 20-Year-Old Drivers 345 30 10 81 95 781 21- to 24-Year-Old Drivers 281 17 17 82 127 758 25- to 34-Year-Old Drivers 892 31 09 101 109 746 35- to 44-Year-Old Drivers 696 23 13 76 101 787 45- to 54-Year-Old Drivers 968 14 01 69 69 847 55- to 64-Year-Old Drivers 1155 03 05 26 40 923 65+-Year-Old Drivers 1540 03 01 22 25 948
by Gender Male Drivers 2939 21 07 77 88 805 Female Drivers 3062 12 06 47 57 877
D1 What is your age (plt0001) SA3 Record gender from observation (plt0001) Base All respondents Unweighted N=See Table
29
100
80
60
40
20
0
361 351
100 71 62
Wait Until You Continue to Drive Hand Phone to a Pull Over to a Safe Use a Voice Reach a Red Light While Using the Passenger to Use Location to Use Command Feature or Stop Sign to App the App the App (Speech Diction)
Use App
When asked how they use apps while driving 36 of respondents mentioned waiting until they came to a red light or stop sign before using the app More than 1 in 3 (35) respondents stated that they continue to drive while using the app Using a voice command feature was the least cited method (6)
Figure 3-12 How Smartphone Apps Are Used While Driving
Q9a When you USE smartphone apps while driving do you USUALLYhellip Base Respondents using smartphone apps while driving at least rarely Unweighted N=460
30
Respondents were asked which apps they used when driving One-quarter (25) of respondents stated they use Pandora and 16 used other music or radio apps or podcasts Facebook was cited by 12 of respondents followed by Internet search engines (eg Internet Explorer Chrome Safari Google) (7) Instagram (7) and Snapchat (5) More than 1 in 5 respondents who use apps while driving cited multiple apps they typically use when driving
Table 3-10 Smartphone Apps Used While Driving
Q9 Other than navigation apps what smartphone apps do you typically use while driving
Percent
Pandora 249
Music apppodcastradio app 163
Facebook 123
InternetChromeSafariGoogle 72
Instagram 69
Snapchat 52
Twitter 40
Voice memotexting 39
Gas locationGas Buddy 38
Traffic alertsupdates apps 38
Weather related apps 38
E-MailGmaile-mail apps 37
YouTube 25
Game apps 21
News apps 19
Facebook Messenger 14
Shazam 07
Networking connecting with friendsfamily 06
LinkedIn 02
Skype 02
Other mentions (eg banking apps virtual assistant apps) 130
Base Respondents using smartphone apps while driving at least rarely Unweighted N =460 Respondents offering more than one response Unweighted N=102
31
Respondents who stated that they use apps while driving were asked under what conditions they are more likely to do so Just over one fifth of these respondents (21) report that they are more likely to use apps if they need directions or other information Another 12 reported they are likely to use an app for musicentertainment while 11 said boredom made it more likely they will use an app
Table 3-11 Reasons For Using Apps While Driving
9b What makes it more likely you will USE smartphone apps while driving 11 Percent
In need of directions or other information 212
For musicentertainment 122
Boredom 112
Personal or social 96
How important it isif urgent 90
Length of drive 56
Work-related 45
Non-stressful traffic conditions 53
Report a traffic crashemergency 21
Good weather conditions 12
Interaction not requiredvoice-activated 13
Time of day 12
Convenience 11
If no police officers are in sight 06
Traveling at a low speed 06
Report a medical emergency 21
Tired (using apps keeps me awake) 03
Personal Safety 01
Other 79
Base Respondents using smartphone apps while driving at least rarely Unweighted N=460 Respondents offering more than one response Unweighted N=28
11 Respondents volunteered the answers to this question and were not read answer options
32
Talking on the Phone Respondents were asked if their driving is any different when they are talking on a cell phone Overall nearly 6 in 10 respondents (57) believe that talking on the phone has no negative influence on their driving with 53 of respondents reporting that there is no difference in their driving and 4 who said that talking on the phone helps them be more focused or pay more attention on the road (Table 3-12) One in 5 respondents (20) indicated that talking on a cell phone while driving distracted them or made them not as aware of things Almost 1 in 8 respondents (12) reported that they drove more slowly when they were on the phone A small percentage noted that they may drift out of the lane or roadway (1) while on the phone
Sending Text Messages Respondents who sent text messages or e-mails while driving were asked how their driving was different when they were sending messages from their normal driving Overall one-third of respondents (36) think that sending text messages while driving has no negative influence on their driving with 31 of respondents reporting that they do not notice any difference and 4 who believe that texting helps them be more focused or pay more attention on the road (Table 3-12) One in 3 respondents (34) indicated that texting while driving distracts them or makes them not as aware of things About 1 in 8 (13) said they drive more slowly and 4 reported that they drift out of the roadway or lane while messaging
Using Apps Respondents who used apps while driving were asked how their driving was different when they were doing so A total of 56 of respondents think that using apps while driving has no negative influence on their driving 53 of drivers said that there is no difference in their driving and 3 stated that they are more focused or pay more attention to the road when they are using a smartphone app (Table 3-12) One in 5 respondents (21) indicated that using apps while driving distracts them or makes them not as aware of things About 1 in 12 drivers (8) said they drive more slowly while using apps
33
Table 3-12 Perceived Difference in Driving When Talking on a Cell Phone TextE-Mail Messaging and Using Apps
Q7Q8bQ9c How if at all would you say your driving is different when you are TALKING on the phone TEXTINGUSING APPS12
Q7 TALK Percent
Q8b TEXT
Percent
Q9c USE APPS
Percent
No difference 526 313 525
DistractedNot as aware of things 201 338 209
Drive slower 124 126 78
More focusedpay more attention 43 44 32
Drift out of the lane or roadway 12 42 34
Drive erraticallyless carefully 10 19 00
Look in your rear or side view mirrors more frequently 05 02 00
Drive faster 04 01 00
Change lanes less frequently 04 05 03
Avoid changing lanes altogether 03 02 05
Increase distance from lead vehicle 02 01 00
Look in your rear or side view mirrors less frequently 02 02 00
Apply the brakes suddenly 01 04 00
Change lanes more frequently 01 00 07
Use turn signals less frequently 01 01 00
Follow lead vehicle more closely 00 01 00
Base (Q7) Respondents making or answering calls while driving at least rarely Unweighted N =3865 Respondents offering more than one response Unweighted N=111 Base (Q8b) Respondents sending text messages or e-mails while driving at least rarely Unweighted N=1044 Respondents offering more than one response Unweighted N=45 Base (Q9c) Respondents using smartphone apps while driving at least rarely Unweighted N=460 Respondents offering more than one response Unweighted N=1
12 Respondents volunteered the answers to these questions and were not read answer options
34
Respondents were asked how their driving behavior was different when talking on a cell phone sending a message or using apps When talking on a cell phone two-thirds (64) reported turning down the radio while two-fifths reported asking others in the vehicle to be quiet (40) andor driving with one hand on the wheel (40) ldquoTurn the radiomusic downrdquo and ldquoask others in the vehicle to be quietrdquo were two behaviors most frequently cited together when respondents are trying to answer or make a phone call while driving Of those drivers who send messages while driving more than half of them (55) report driving with one hand on the wheel and 39 put down their food or drink so they can send messages Nearly half of those using smartphone apps while driving will drive with one hand on the wheel (45) while close to a third (30) will put down food or drink to do so ldquoTurn the radiomusic downrdquo and ldquodrive with one hand on the wheelrdquo were the two behaviors most frequently cited together when respondents use apps while driving
Table 3-13 Behavior Differences in Vehicle When Talking on a Cell Phone TextE-Mail Messaging and Using Apps
Q7aQ8cQ9d How if at all does TALKINGTEXTINGUSING APPS change your behavior in the vehicle13
Q7a TALK Percent
Q8c TEXT
Percent
Q9d USE APPS
Percent
Turn the radiomusic down 638 259 236
Ask others in the vehicle to be quiet 403 155 135
Drive with one hand on the wheel 404 553 452
Put down food or drink 368 391 295
No differencesmy behavior doesnrsquot change 155 166 268
Drive with only your knee on the wheel 37 60 50
Base (Q7a) Respondents making or answering calls while driving at least rarely Unweighted N=3865 Respondents offering more than one response Unweighted N=1959 Base (Q8c) Respondents sending text messages or e-mails while driving at least rarely Unweighted N=1044 Respondents offering more than one response Unweighted N=391 Base (Q9d) Respondents using smartphone apps while driving at least rarely Unweighted N=460 Respondents offering more than one response Unweighted N=135
13 Respondents volunteered the answers to these questions and were not read answer options
35
Respondents were asked if there were any driving situations in which they would never talk on the phone send a text or e-mail message or use a smartphone app while driving Bad weather was the most commonly cited reason for not using a phone while driving About 4 in 10 drivers said they would never talk on the phone (40) send text messages or e-mails (39) or use apps (34) when they are driving in bad weather The second most commonly cited driving situation for all three cell phone usages was bumper to bumper traffic About 1 in 5 drivers said they wouldnrsquot talk on the phone (20) or text (20) if they are driving in bumper to bumper traffic and 15 said that they would not use apps in this situation
Table 3-14 Driving Situations Respondent Not Likely to Talk on Phone TextE-Mail Message or Use Apps
Q7bQ8dQ9e Is there any driving situation in which you would NEVER TALKTEXTUSE APPS while driving
Q7b TALK Percent
Q8d TEXT
Percent
Q9e USE APPS
Percent
Bad weather 403 392 343
Bumper to bumper traffic 196 197 148
Fast moving traffic (freeway) 173 185 137
When I see a police officer 60 78 74
No timeI always use my cell when I want to 49 30 103
When moving (not at stop signs or stop lights) 46 123 62
Driving in unfamiliar arearoads 40 32 24
Marked construction zones 40 26 21
Accidentemergency vehicles around 39 22 19
Driving at nighttime 24 31 35
With a baby or child on board 22 47 24
Merging with traffic 21 21 07
With other adult passengers in the car 16 23 39
Marked school zones 13 22 12
Windingcurving roads 09 12 05
Driving in a familiar route 08 06 03
On long trips 05 02 00
When driving in a place where it is prohibited 03 03 08
On an empty roadway 02 01 01
Residential streets 02 01 03
On short trips 01 00 13
Parking lots 01 00 00
Base (Q7b) Respondents making or answering calls while driving at least rarely - Unweighted N=3865 Respondents offering more than one response Unweighted N=942 Base (Q8d) Respondents sending text messages or e-mails while driving at least rarely - Unweighted N=1044 Respondents offering more than one response Unweighted N=267 Base (Q9e) Respondents using smartphone apps while driving at least rarely - Unweighted N=460 Respondents offering more than one response Unweighted N=108
36
CHAPTER 4 PERCEPTIONS OF SAFETY OF DISTRACTED DRIVING
This chapter examines the respondentsrsquo assessment of safety in a variety of situations in which they are passengers in vehicles operated by drivers who are engaged in other activities while driving All respondents were asked how safe they would feel as a passenger if the driver were to engage in certain activities (Table 4-1) Almost all respondents stated that they would feel very unsafe if their drivers were watching a movie (97) or using a laptop computer (96) while operating the vehicle A large majority of respondents stated that they would feel very unsafe if the driver was sending (86) or reading (81) text messages or e-mails Two-thirds of respondents (66) said that they would feel very unsafe if their drivers used a smartphone app while driving and about 2 in 5 respondents (42) said they would feel very unsafe if the driver was talking on the cell phone with the phone in hand In addition 40 of respondents would feel very unsafe if the driver was manipulating the navigation system for driving directions while driving
Table 4-1 Perceived Safety as Passenger
Q11 How safe would you feel if the driver was tohellip
Very Unsafe
Somewhat Unsafe
A Little Less Safe
Safe
Talk to other passengers in the vehicle 58 99 202 632
Eat or drink 143 204 367 279
Talk on a cell phone while holding the phone 419 228 248 100
Talk on a cell phone with a hands-free device 111 189 230 465
Read e-mails or text messages 810 119 54 13
Send text messages or e-mails 862 84 36 14
Talk or interact with children in the vehicle 167 297 242 283
Adjust the car radio tapes or CD player 103 263 246 383
Use a laptop computer 959 26 07 04
Manipulate a navigation system for driving directions
398 331 185 75
Use smartphone apps not including a navigation app
663 211 85 28
Watch a movie 967 16 07 06
Base All respondents Unweighted N=6001
37
50
40 370
358
30
237
20
10
0 0 1 to 3 4 or more
(N=4114) (N=1706) (N=122)
Figure 4-1 shows that respondents who have children under 16 in the household are more likely than those without children of that age in the household to feel safe in a car when the driver is interacting with children in the vehicle Among respondents with one to three children under 16 37 indicated that they would feel safe while those with four or more children were slightly less likely to feel safe (36) Among those without any children under 16 in the household 24 indicated they would feel safe in a car if the driver was interacting with children in the vehicle
Figure 4-1 Respondents Who Feel Safe When Driver Is TalkingInteracting to Children in the Vehicle
by Number of Children in the Household
Q11g Now Irsquom going to read a list of things people sometimes do while driving Tell me how safe you would feel if you were a passenger riding in a car while your driver was doing the following For each please tell me if you would feel very unsafe somewhat unsafe a little less safe or safe ndash no problem ndash would not pay any more attention g Talking or interacting with children in the vehicle D3 How many children 15 or younger are living in your household at least half of the time or consider it their primary residence (plt0001) Base All respondents Unweighted N=See Figure
38
Each respondent was asked whether they would intervene if their driver was talking on a handheld cell phone while driving When looking at the results it is apparent that the likelihood of intervening varies depending on age and gender Younger drivers tend to be less likely to intervene if a driver is talking on the phone with 37 of 16- to 24-year-olds saying that it would be very likely they would intervene Conversely half of all drivers over 45 reported they would very likely intervene in this situation In regards to gender males are less likely to intervene than females with 42 of males indicating they would very likely do so compared to 51 of females
Table 4-2 How Likely Are You to Intervene if the Driver Is Talking on a Cell Phone While Holding the Phone by Age and Gender
How likely are you to intervene ifhellip
N Very
Likely Somewhat
Likely Somewhat Unlikely
Very Unlikely
Never Would
Intervene Total Respondents 6001 466 201 127 114 85
by Age Category
16- to 20-Year-Old Drivers 345 372 267 119 103 139
21- to 24-Year-Old Drivers 281 365 209 170 135 121
25- to 34-Year-Old Drivers 892 419 202 146 123 107
35- to 44-Year-Old Drivers 696 447 201 136 117 95
45- to 54-Year-Old Drivers 968 505 192 126 109 61
55- to 64-Year-Old Drivers 1155 552 175 96 116 54
65+-Year-Old Drivers 1540 489 199 122 108 69 by Gender
Male 2939 422 199 137 137 95
Female 3062 510 201 118 92 75
Q12 How likely are you to do or say something to your driver if theyrsquore TALKING on a handheld cell phone while driving D1 What is your age (plt0001) SA3 Record gender from observation (plt0001) Base All respondents Unweighted N=See Table
39
Table 4-3 shows the likelihood of intervention by age and gender if they are passengers in a vehicle in which the driver is sending text messages or e-mails while driving Overall 87 of respondents stated that they were at least somewhat likely to intervene if they were sending e-mails or text messages Like the previous results younger drivers tend to be less likely to intervene if a driver is sending text messages while driving with 66 of drivers 16 to 20 and 63 of those 21 to 24 saying that they would be very likely to intervene compared to 81 of 45- to 54-year-olds and 85 percent of 55- to 64-year-olds In regards to gender males are less likely to intervene than females with 71 of males indicating they would compared to 79 of females
Table 4-3 How Likely Are You to Intervene if the Driver Is Sending Text Messages or E-Mails While Driving by Age and Gender
How likely are you to intervene ifhellip N Very
Likely Somewhat
Likely Somewhat Unlikely
Very Unlikely
Never Would
Intervene Total Respondents 6001 752 122 47 43 28 by Age Category
16- to 20-Year-Old Drivers 345 656 180 85 12 67
21- to 24-Year-Old Drivers 281 625 179 107 50 39
25- to 34-Year-Old Drivers 892 674 194 56 43 32
35- to 44-Year-Old Drivers 696 753 125 48 48 21
45- to 54-Year-Old Drivers 968 807 106 27 33 23
55- to 64-Year-Old Drivers 1155 853 61 20 44 13
65+-Year-Old Drivers 1540 774 79 45 59 28 by Gender
Male 2939 714 133 59 52 35
Female 3062 791 111 36 35 22
Q13 How likely are you to do or say something to your driver if theyrsquore SENDING TEXT MESSAGES OR E-MAILS OR USING SMARTPHONE APPS while driving D1 What is your age (plt0001) SA3 Record gender from observation (plt0001) Base All respondents Unweighted N=See Table
40
100
80
60
40
20
0
652
573
642 655 717
654 676
604
282 316 322
299 240
280 267 292
46 105
30 27 22 52
27 73
0‐2 secs 3‐6 secs 7+ secs
Total 16‐20 21‐24 25‐34 35‐44 45‐54 55‐64 65+ (N=6001) (N=345) (N=281) (N=892) (N=696) (N=968) (N=1155) (N=1540)
Every time drivers take their eyes off the road to use a cell phone they increase the chance of putting their lives and the lives of others in danger When asked how many seconds respondents believe a driver could take his or her eyes off the road before it becomes significantly more dangerous the majority of respondents gave an answer between 0 and 2 seconds Younger respondents were slightly more likely than older respondents to give an answer between 3 and 6 seconds with 32 of respondents 16 to 20 and 21 to 24 giving an answer between 3 and 6 seconds and 29 of respondents 65 and older doing so Less than a quarter of respondents (24) 35 to 44 reported 3- to 6-seconds before it becomes significantly more dangerous More than 1 in 10 respondents 16 to 20 (11) believe that it only becomes more dangerous for a driver to take his eyes off the road after 7 or more seconds
Figure 4-2 Number of Seconds a Driver Can Safely Take HisHer Eyes Off the Road by Age
Q10 How many seconds do you believe a driver can take his eyes off the road before driving becomes significantly more dangerous D1 What is your age (plt0001) Base All respondents Unweighted N=See Figure
41
0‐2 secs 3‐6 secs 7+ secs
100
80
677652
625 60
40
299
20
54
0
282 265
46 38
Total Male Female (N=6001) (N=2939) (N=3062)
There are slight differences between male and female drivers regarding how long they think a driver can take hisher eyes off the road before the situation becomes significantly more dangerous Females are more likely than males to report a longer amount of time that can be considered safe with 30 of females saying 3 to 6 seconds and another 5 saying more than 7 seconds while 27 of males report 3 to 6 seconds and 4 report 7 or more seconds
Figure 4-3 Number of Seconds a Driver Can Safely Take HisHer Eyes Off the Road
by Gender
Q10 How many seconds do you believe a driver can take his eyes off the road before driving becomes significantly more dangerous QSA3 Record gender from observation (plt0001) Base All respondents Unweighted N=See Figure
42
Answering Calls Making Calls Texting
100
813 782 80
710
60
40
246
173 20 151
25 27 31
0 Increased Decreased Stayed the Same
CHAPTER 5 CHANGES IN CELL PHONE-RELATED DISTRACTED DRIVING
To assess whether driversrsquo cell-phone-related distracted driving behavior is changing over time respondents were asked if the frequency with which they make or receive calls or send text messages or e-mails while driving has changed in the past 30 days The vast majority of respondents stated that the frequency with which they receive (81) or make (78) calls or text (71) is the same now as it was in the past 30 days Fewer than 1 in 30 respondents (3) said that they are making receiving calls or texting more often One quarter of respondents (25) reported texting less often Respondents who had sent a text message or e-mail while driving reported a comparatively larger decrease in the frequency with which they had done so in the past 30 days than respondents who have placed or received a call while driving reported in the past 30 days
Figure 5-1 Has Your Frequency of Cell Phone Use While Driving
Increased Decreased or Stayed the Same
Q15 In the past 30 days has your frequency of answering phone calls while driving increased decreased or stayed the same Base Respondents who accept phone calls while driving - Unweighted N=3649 Q14 In the past 30 days has your frequency of making phone calls while driving increased decreased or stayed the same Base Respondents That Make Phone Calls While Driving Unweighted N=3168 Q16 In the past 30 days has the frequency with which you send and receive text messages or e-mails while driving increased decreased or stayed the same Base Respondents That Send Text Messages or E-Mails While Driving Unweighted N=965
43
Table 5-1 lists the reasons for the decrease in using a cell phone while driving given by respondents who reported a decrease in cell phone use while driving in the past 30 days Overall the most frequent reasons given for answering their cell phones less often while driving were they were not receiving as many calls as before (22) and an increased awareness of safety (21) An increased awareness of safety (22) was also the most often cited reason for making fewer phone calls while driving Similarly more than 1 in 4 respondents (26) cited an increased awareness of safety for texting less often while driving One in 5 (19) mentioned not being as busy
Table 5-1 Reasons for Decrease in Using Cell Phone While Driving
Q14a15a16a Why did your frequency of answeringmaking phone callssendingreceiving text messages or e-mails while driving decrease14
Answering Calls
Making Calls
Texting
Less usebusyless people calltexthave number 217 190 187
Increased awareness of safety 212 221 263
Driving lessnot on the road as much 108 128 90
The weather 88 83 59
Phone issues (all mentions) 50 34 42
Law that bans cell phone use 45 45 39
Familychildren in the car 34 38 26
Job related (work lesslost jobdont get as many work calls) 31 28 27
Less use due to familyrelationship changes 18 22 43
Was in a crash 16 16 03
Dont want to get a ticket 10 03 04
Influencepressure from others 09 14 16
Nothingno specific reason 05 07 07
Driving faster 02 01 04
Other reasons 62 71 84
Answering calls Base Respondents whose frequency of answering phone in vehicle decreased Unweighted N=539 Making calls Base Respondents whose frequency of making phone calls in vehicle decreased Unweighted N=542 Texting Base Respondents whose use of texte-mail in vehicle has decreased Unweighted N=247
14 Respondents volunteered the answers to these questions and were not read answer options
44
Yes 460
Yes probably 106
Not Sure 156
CHAPTER 6 DISTRACTED DRIVING LAWS AND STOPPED FOR DISTRACTED DRIVING
Respondents were asked a series of questions about their knowledge and support of laws banning cell phone use or sending and reading text messages and e-mails while driving They were also asked about their perception of the likelihood of receiving a ticket for talking on a cell phone or sending text messages or e-mails while driving
Overall 57 of respondents reported that their State has a law banning talking on a handheld cell phone while driving with 46 of respondents stating that their State has such a law and 11 stating that their State ldquoprobablyrdquo has such a law More than 1 in 4 respondents (28) stated that their State has no such law while an additional 16 were not sure
Figure 6-1 Does Your State Have a Law Banning Talking on a Handheld Cell Phone While Driving
No 278
Q17 Does [STATE] have a law banning talking on a handheld cell phone while driving Base All respondents Unweighted N=6001
45
Yes 832
Yes probably 80
No 37
Not Sure 50
Yes 286
Yes probably 118
No 390
Not Sure 205
Respondentrsquos State Has a Law N=1878
Respondentrsquos State Does NOT Have a Law N=4123
Examining the responses for States with and without laws banning talking on handheld cell phones while driving Figure 6-2 shows that in States with such laws 83 of respondents are aware of the law 8 think the State probably has such a law 4 report that the State does not have the law and 5 are not sure
In States without laws banning talking on handheld cell phones while driving 39 of respondents are aware that their State does not have such a law Nearly one-third (29) stated that the State had a law 12 think that the State probably has such a law and 21 are not sure
Figure 6-2 Does Your State Have a Law Banning Talking on a Handheld Cell Phone While Driving
by Actual State Law
Q17 Does [STATE] have a law banning talking on a handheld cell phone while driving Base All respondents Unweighted N=See Figure States that had handheld cell phone bans at the time of survey CA CT DE DC HI IL MD NV NJ NY OR VT WA WV
46
50
40
30 270 265
224 209
20
10
31
0 Very Likely Somewhat Likely Somewhat Very Unlikely Not Sure
Unlikely
Respondents who believed they lived in States with laws banning handheld use of cell phones while driving were asked about their perceived likelihood of a driver who frequently uses hisher cell phone receiving a ticket for this infraction in the next 6 months Overall 54 of respondents thought that the driver was likely to get a ticket and 43 stated that it was unlikely that the driver would be ticketed Nearly 3 in 10 respondents (27) thought it was very likely and 27 of respondents thought it was somewhat likely that the driver would be ticketed More than 1 in 5 respondents thought it was very unlikely (22) or somewhat unlikely (21) that the driver would be ticketed A small percentage of respondents (3) were not sure
Figure 6-3 Likelihood of Ticket for Talking on a Cell Phone While Driving
Q17a Assume that over the next 6 months someone frequently TALKS on a handheld cell phone while driving How likely do you think that person would be to receive a ticket for talking on a cell phone while driving Base Respondents that live in a State that bans talking on a cell phone while driving Unweighted N=4383
47
100
80
60
40
20
0
401
170
292
211 269
230 203
239 191 176 169
283
No HS Degree (N=399) High School Graduate (N=1194) Some College (N=1088) College Graduate (N=859) Some Graduate School (N=95) Graduate Degree (N=699)
Very Likely Very Unlikely
Respondentsrsquo perceptions of the likelihood of a frequent cell phone user receiving a ticket in the next 6 months in States with laws banning handheld cell phone use were examined by the education level of respondents Figure 6-4 shows a clear pattern where respondents with less formal education are more likely to believe that the driver will receive a ticket and respondents with more formal education are more likely to state that the driver will not receive a ticket Two out of 5 respondents (40) with no high school degree believe that the driver is very likely to receive a ticket compared with 17 with a graduate degree Conversely only 17 of respondents without a high school degree believe that the driver is very unlikely to be ticketed compared with 28 of respondents with graduate degrees
Figure 6-4 Likelihood of Ticket for Talking on a Cell Phone While Driving by Highest Level of School
Completed
Q17a Assume that over the next 6 months someone frequently TALKS on a handheld cell phone while driving How likely do you think that person would be to receive a ticket for talking on a cell phone while driving D6 What is the highest grade of year of regular school you have completed (plt0001) Base Respondents who reported living in a State that bans talking on a cell phone while driving Unweighted N=See Figure
48
Yes 872
No 118
Dont know 10
Yes 672
No 298
Dont know 28
Respondentrsquos State Has a Law N=1878
Respondentrsquos State Does NOT Have a Law N=4123
All respondents were asked whether they support a State law that bans talking on a handheld cell phone while driving The majority of respondents (74) were in favor of such a law regardless of whether their State had a ban However respondents who live in States that do not have a ban on talking on a handheld cell phone while driving were more likely to oppose a ban than respondents living in States that already have a ban (30 versus 12)
Figure 6-5 Do You Support a Law Banning Talking on a Handheld Cell Phone While Driving
Q19 Do you support a State law banning talking on a handheld cell phone while driving Base All respondents Unweighted N=See Figure
49
100
80
60
40
20
0
736
646 648 633 688
764 795
872
697
773
Total 16‐20 21‐24 25‐34 35‐44 45‐54 55‐64 65+ Male Female N=6001 N=345 N=281 N=892 N=696 N=968 N=1155 N=1540 N=2939 N=3062
Figure 6-6 shows support for a State law banning talking on a handheld cell phone while driving by respondent gender and age Support for such a law increases with the age of the respondents The oldest respondents were more likely to support a State law banning handheld phone while driving (87) than were the youngest drivers (65) More than three-quarters of female respondents (77) were in favor of a State law banning talking on a handheld cell phone while driving while males (70) were less likely to support such a ban
Figure 6-6 Support for Law Banning Talking on a Handheld Cell Phone While Driving
by Age and Gender ( Yes)
Q19 Do you support a State law banning talking on a handheld cell phone while driving D1 What is your age (plt0001) SA3 Record gender from observation (plt0001) Base All respondents Unweighted N=See Figure
50
Respondents who stated that they supported a ban on talking on a handheld cell phone while driving or who were unsure whether they supported such a ban were asked how much they thought the fine should be for talking on a handheld cell phone while driving Older respondents were more likely to favor higher fines than were younger respondents Respondents 16 to 20 had the lowest mean amount with $201 while respondents 45 to 54 had the highest mean amount with $273 Male respondents ($232) had a lower mean amount than female respondents ($254)
Figure 6-7 Average Fine for Talking on Handheld Cell Phone While Driving
by Age and Gender
$24369
$20107 $21381
$25291 $23890
$27345
$25420
$22731 $23241
$25415
$0
$50
$100
$150
$200
$250
$300
Total 16‐20 21‐24 25‐34 35‐44 45‐54 55‐64 65+ Male Female N=3994 N=212 N=171 N=547 N=450 N=633 N=808 N=1112 N=1869 N=2125
Q19a What do you think the fine should be for talking on a handheld cell phone while driving D1 What is your age SA3 Record gender from observation Base Respondents who support a ban on talking on a cell phone while driving Unweighted N=See Figure
51
Respondents were asked whether their State has a law that bans sending text messages or e-mails while driving More than half of respondents (62) reported that their State has such a law 14 percent thought their State probably has such a law and 9 percent stated that their State does not have a law that bans sending electronic messages while driving Fourteen percent of respondents were unsure if their State has such a law
Figure 6-8 Does Your State Have a Law Banning Texting or E-Mailing While Driving
Yes 624
Yes probably 138
No 93
Not Sure 144
Q18 Does [STATE] have a law banning TEXTING OR E-MAILING while driving Base All respondents Unweighted N=6001
52
Yes 643
Yes probably 137
No 82
Not Sure 137
Yes 362
Yes probably 148
No 245
Not Sure 243
Respondentrsquos State Has a Law N=5629
Respondentrsquos State Does NOT Have a Law
N=372
Figure 6-9 Does Your State Have a Law That Bans Sending Electronic Messages While Driving
by Actual State Law
Q18 Does [STATE] have a law banning TEXTING OR E-MAILING while driving Base All respondents Unweighted N=See Figure (plt0001) States that didnrsquot have a texting ban for all drivers at the time of survey AZ MO MS MT OK
Figure 6-9 shows driverrsquos awareness of State laws banning texting or e-mailing while driving by whether or not their State has such a law at the time of the survey 45 States and the District of Columbia had a law banning texting or e-mailing while driving for all drivers In States with laws banning texting or e-mailing 64 of respondents knew about the law 14 thought that the State probably had such a law 14 were not sure and 8 stated that their State did not have such a law
In States without a law banning texting or e-mailing while driving 25 of respondents were aware that there was no such law many believed that their State had (36) or probably had (15) such a law and 24 were not sure
53
295
263
201 217
24
0
10
20
30
40
50
Very Likely Somewhat Likely Somewhat Very Unlikely Not Sure Unlikely
Respondents who reported living in a State with laws banning texting or e-mailing while driving were asked about their perception of the likelihood of a driver receiving a ticket for this infraction in the next 6 months Slightly more respondents believe it is likely that the driver would receive a ticket (56) while 42 think it would be somewhat (20) or very (22) unlikely
Figure 6-10 Likelihood of Ticket for Sending Text Messages or E-Mails While Driving
Q18a Assume that over the next 6 months someone frequently sends text messages or e-mails while driving How likely do you think that person would be to receive a ticket for sending text messages or e-mails while driving Base Respondents who report living in a State that bans sending messages while driving Unweighted N=5458
54
100
80
60
40
20
0
479
165
328
194
289
211 205 248
200 200182
273
No HS Degree (N=460) High School Graduate (N=1463) Some College (N=1350) College Graduate (N=1126) Some Graduate School (N=119) Graduate Degree (N=876)
Very Likely Very Unlikely
Nearly one half of respondents (48) with no high school degree believe that a driver is very likely to receive a ticket if they frequently send text messages while driving compared with 18 with a graduate degree Conversely only 17 of respondents without a high school degree believe that the driver is very unlikely to be ticketed compared with 27 of respondents with graduate degrees
Figure 6-11 Likelihood of Ticket for Sending Text Messages or E-Mails While Driving
by Highest Level of School Completed
Q18a Assume that over the next 6 months someone frequently SENDS TEXT MESSAGES OR E-MAILS while driving How likely do you think that person would be to receive a ticket for talking on a cell phone while driving D6 What is the highest grade of year of regular school you have completed (plt0001) Base Respondents who reported living in a State that bans sending messages while driving Unweighted N=See Figure
55
Yes 919
No 73
Not Sure 08
Yes 892
No 93
Not sure 12
Respondentrsquos State Has a Law N=5629
Respondentrsquos State Does NOT Have a Law N=372
Respondents were asked whether they would support a State law that bans texting or e-mailing while driving The overwhelming majority of respondents (92) were in favor of a law that bans sending electronic message while driving However respondents who live in States without such a ban were slightly more likely to oppose a ban than respondents living in a State that already has one (9 versus 7)
Figure 6-12 Do You Support a Law Banning Texting or E-Mailing While Driving
Q19b Do you support a State law banning texting or e-mailing while driving Base All respondents Unweighted N=See Figure
56
Figure 6-13 Support for Law Banning Texting or E-Mailing While Driving by Age and Gender ( Yes)
917 870 879 888 895
932 900
933 961 949100
80
60
40
20
0 Total 16‐20 21‐24 25‐34 35‐44 45‐54 55‐64 65+ Male Female
N=6001 N=345 N=281 N=892 N=696 N=968 N=1155 N=1540 N=2939 N=3062
Figure 6-13 shows support for a State law banning text or e-mail messaging or using smartphone apps while driving by respondent gender and age Support for such a law increases with the age of the respondents The oldest respondents were more likely to support a State law banning texting while driving (96-95) than were the youngest drivers (87) Female respondents (93) were slightly more likely than male respondents (90) to be in favor of a State law
Q19b Do you support a State law banning text or e-mail messaging or using smartphone apps while driving D1 What is your age (plt0001) SA3 Record gender from observation (plt0001) Base All respondents Unweighted N=See Figure
57
$30205 $27816
$24358
$28001 $29555
$36605
$32892
$29951 $28492
$31876
$0
$50
$100
$150
$200
$250
$300
$350
$400
Total 16 to 20 21 to 24 25 to 34 35 to 44 45 to 54 55 to 64 65+ Male Female N=4937 N=283 N=233 N=744 N=576 N=799 N=979 N=1248 N=2398 N=2539
Respondents who supported a ban on sending text messages or e-mails while driving or who were unsure whether they supported such a ban were asked what the average fine should be for sending text messages or e-mails while driving Overall younger respondents favored lower average fines than older respondents Respondents 21 to 24 suggested the lowest average fine at $244 and respondents 45 to 54 suggested the highest at $366 Male respondents ($285) had a lower mean amount than female respondents ($319)
Figure 6-14 Average Fine for Sending Text Messages or E-Mails While Driving
by Age and Gender
Q19c What do you think the fine should be for sending text messages or e-mails while driving Base Respondents who support a ban on sending messages while driving D1 What is your age SA3 Record gender from observation Unweighted N=See Figure
58
25
20
15
10
5
0
36
14
44
80
39 32
21 13
41 31
Total 16 to 20 21 to 24 25 to 34 35 to 44 45 to 54 55 to 64 65+ Male Female N=6001 N=345 N=281 N=892 N=696 N=968 N=1155 N=1540 N=2939 N=3062
When examining the proportion of respondents who have been personally stopped by the police for using a handheld cell phone while driving by and gender younger drivers were more likely to say they had been pulled over for talking on their cell phones than were older drivers Respondents 25 to 34 were the most likely to have been pulled over at 8 while the least likely were 16- to 20shyyear-olds (1) and those over 65 (1) Four percent of male drivers and 3 of female drivers have been pulled over for using their cell phones while driving
Figure 6-15 Ever Stopped by Police for Using Phone While Driving
by Age and Gender
Q20 Have you ever been personally stopped by the police for using a handheld cell phone while driving D1 What is your age (Plt0001) SA3 Record gender from observation (Pgt005) Base All respondents Unweighted N=See Figure
59
Yes 707
No 282
Not Sure 11
CHAPTER 7 EDUCATIONAL MESSAGES
This chapter examines respondentsrsquo exposure to educational messages about distracted driving that encourage people not to talk on cell phones or text while driving Respondents were asked if they had seen or heard messages that encourage people not to talk on phones or send electronic messages while driving in the past 30 days and the circumstances under which they saw or heard these messages About 71 of the respondents stated that they had been exposed to such a message within the past 30 days
Figure 7-1 Percentage of Respondents Who Heard a Message Discouraging Distracted Driving in Past
30 Days
Q21 In the past 30 days have you seen or heard any messages that encourage people not to talk on phones or send electronic messages while driving This could be public service announcements on TV messages on the radio signs on the road news stories or something else Base All respondents Unweighted N=6001
60
705
147 114
26 06 0
20
40
60
80
100
Every day Almosy Every Day Few Days a Week Few Days a Month
Few Days a Year
61
Of those respondents who reported seeing or hearing a message that encourages people not to talk on phones or send electronic messages while driving 71 reported that they drive every day and another 15 said they drive almost every day Eleven percent said they drive at least a few days a week 3 drive a few days a month and 1 reported driving only a few days a year
Figure 7-2 Frequency of Driving of Respondents Exposed to Messages Discouraging Cell-Phone-
Related Distracted Driving
Q21 In the past 30 days have you seen or heard any messages that encourage people not to talk on phones or send electronic messages while driving This could be public service announcements on TV messages on the radio signs on the road news stories or something else Base Drivers who reported hearing or seeing a message discouraging cell-phone-related distracted driving in past 30 days Unweighted N=6001
Respondents who reported that they heard or saw messages that encourage drivers not to talk on cell phones or send electronic messages while driving in the past 30 days were asked where they heard or saw the message More than one source could be given A little more than half (53) of these respondents had seen such a message on a TV advertisement or public service announcement 12 saw it on TV news and 3 on a TV show storyline More than a third (36) had seen such a message on a billboard or sign About a quarter (23) had heard the message on a radio public service announcement while 3 heard a radio news segment featuring the message A small number of respondents saw or heard the message in an Internet ad or banner (6) on a social networking website (2) in a newspaper or magazine (2) on the road (2) or on an educational program (1)
Table 7-1 Source of Messages Discouraging Cell-Phone-Related Distracted Driving
Q21a Where did you see or hear those messages Percent
TV - advertisementpublic service announcement 526 Billboardsigns 363 Radio - advertisementpublic service announcement 227 TV - news 122 Internet adbanner 56 Radio - news 34 TV show storyline 29 Social networking website (Facebook MySpace Twitter) 23 Newspapermagazine 22 Personal observationon the road 20 Educational program 13 Friendrelative 08 School zonesaroundfrom school 06 Online newsblog 02 Online video (YouTube Google Video) 02 Other 56
Base Respondents who heard messages encouraging drivers not to talk on phone or send messages while driving Unweighted N=4175
62
100
80
679
60
385 40
261
20
96 84
0 TV Print Media Radio Internet Other
Figure 7-3 shows the distribution of media sources that delivered messages to those respondents who reported having heard or seen the message in the past 30 days The most frequent sources of the messages discouraging cell-phone-related distracted driving were television programming print media and radio programming Close to 7 in 10 respondents (68) listed some form of television programming as their source of the message Another 39 reported some type of print media like billboards or newspapers while 26 reported hearing the message on the radio Exposure to the message via the Internet was reported by 8 of respondents while 10 mentioned sources such as conversations with friends or an educational program
Figure 7-3 Source of Messages Discouraging Cell-Phone-Related Distracted Driving
Q21a Where did you see or hear these messages Base Respondent saw a message discouraging distracted driving in past 30 days Unweighted N=4175
63
Internet
Radio
Print Media
TV
804
266
175
19
735
374
263
62
675
423
264
59
651
393
267
108
594
456
320
96
549
448
349
114
652
348
219
199
0 20 40 60 80 100
16‐20 (N=249) 21‐24 (N=203) 25‐34 (N=643) 35‐44 (N=515) 45‐54 (N=688) 55‐64(N=857) 65+ (N=960)
The source by which respondents were exposed to messages discouraging cell phone distracted driving in the past 30 days was examined further by age (Figure 7-4) The most common sources of the message across all ages were TV print media and radio Only a few respondents mentioned the Internet
However there are some correlations between respondent age and message source Across most age groups it was increasingly likely that older respondents would mention the TV as a source of exposure to such messages ranging from 55 of respondents 21 to 24 mentioning TV to 80 of respondents 65 and older While differences by age were less systematic when examining the percentage of respondents who mentioned print media or radio respondents 25 to 34 were the most likely to mention print media (which includes newspapers magazines and billboards) with 46 of respondents mentioning print media as their source of message The 21-to-24 group was the most likely to mention radio with 35 stating that they heard the message on the radio Younger respondents were more likely than older respondents to list the Internet as their source One-fifth of respondents 16 to 20 (20) and one-tenth of those 21 to 24 (11) 25 to 34 (10) and 35 to 44 (11) mentioned the Internet while only 2 of respondents 65 and older mentioned the Internet
Figure 7-4 Source of Messages Discouraging Cell-Phone-Related Distracted Driving
by Age
Q21a Where did you see or hear these messages Base Respondent who saw a message discouraging distracted driving in past 30 days D1 What is your age (plt0001) Unweighted N=See Figure
64
676
398
295
69
681
372
228
99
0
20
40
60
80
100
TV Print Media Radio Internet
Male (N=2085) Female (N=2080)
When examining the source of messages discouraging distracted driving by gender male and female drivers were equally likely to list the TV (68) as their source of exposure to messages discouraging the use of cell phone while driving However male drivers were slightly more likely to mention print media (40) and radio (30) as their source than were female drivers (37 and 23 respectively) Female drivers (10) were more likely than male drivers (7) to have seen messages discouraging cell phone distracted driving on the Internet
Figure 7-5 Source of Messages Discouraging Cell-Phone-Related Distracted Driving by Gender
Q21a Where did you see or hear these messages Base Respondents who saw a message discouraging distracted driving in past 30 days SA3 Record gender from observation (plt0001) Unweighted N=See Figure
65
Click It or Ticket
Friends Donrsquot Let Friends Drive Drunk
Buzzed Driving is Drunk Driving
Drive Sober or Get Pulled Over
It Can Wait
Drunk Driving Over the Limit under Arrest
U Drive U Text U Pay
One Text or Call Could Wreck it All
No Phone Zone
On the Road Off the Phone
Put it Down
Phone in One Hand Ticket in the Other
736
632
614
589
513
462
284
275
216
191
182
125
0 20 40 60 80
Figure 7-6 shows the percentage of respondents who reported having heard certain slogans in the past 30 days Those slogans with an asterisk () in the figure are applicable to cell-phone-related distracted driving
More than half of respondents (51) had heard ldquoIt Can Waitrdquo in the past 30 days by far the most recognized cell phone slogan of those listed More than one quarter of respondents had heard ldquoU Drive U Text U Payrdquo (28) or ldquoOne Text or Call Could Wreck It Allrdquo (28) within the past month About 1 in 5 had heard ldquoNo Phone Zonerdquo (22) ldquoOn the Road Off the Phonerdquo (19) or ldquoPut It Downrdquo (18)
Figure 7-6 Heard Slogans in Past 30 Days
Q22 Do you recall hearing or seeing the following slogans in the past 30 days Base All respondents Unweighted N=6001 Distracted Driving slogans
66
Q22 Do you recall hearing or seeing the following slogans in the past 30 days Base All respondents Unweighted N=6001 All highway safety messages=12 Distracted driving messages=7
All Highway Safety Messages Distracted Driving Messages
50
40
30 274 252
19420 175
135 130 127117112 93 95
81 63
10
0
70 44
21 18
0 1 2 3 4 5 6 7 8‐12
Figure 7-7 shows the total number of different safe driving slogans that respondents reported having heard in the past 30 days More than a third (36) reported hearing between 6 and 10 highway safety slogans and more than a quarter (27) of respondents reported hearing 4 or 5 Eleven percent recognized three slogans 9 recognized two and 7 reported hearing only one Only 3 reported hearing more than 10 slogans and about 6 reported hearing none When examining the number of distracted driving slogans heard or seen by respondents in the past 30 days more than a quarter of respondents (27) indicated that they hadnrsquot heard any messages in the past 30 days One fifth reported having heard or seen two slogans (20) Two percent of respondents recalled having heard or seen 7 distracted driving messages in the past 30 days
Figure 7-7 Number of Slogans Heard in Past 30 Days
67
0 1 2 3 4 5 6 7
16‐20 (N=345) 125 202 152 160 190 107 42 24 21‐24 (N=281) 176 262 220 165 80 55 25 17 25‐34 (N=892) 162 260 236 144 105 48 24 23
35‐44 (N=696) 223 292 219 133 62 30 16 24 45‐54 (N=968) 259 247 213 106 81 65 17 12 55‐64 (N=1155) 373 250 175 93 56 19 15 19 65+ (N=1540) 444 234 144 80 45 25 18 10
0
10
20
30
40
50
60
Figure 7-8 shows the number of distracted driving slogans that respondents reported hearing in the last 30 days by categories Younger drivers were more likely to have heard 4 or more slogans in the past 30 days More than half of those in the 16 to 20 category (52) said they recognized more than 3 slogans compared to those in the 55-64 (20) and 65 and older (18) categories More than 4 in 10 respondents 65 and older (44) indicated that they had not heard any slogans in the past 30 days
Figure 7-8 Number of Distracted Driving Slogans Heard in Past 30 Days by Age
Q22 Do you recall hearing or seeing the following slogans in the past 30 days Base All respondents D1 What is your age (plt0001) Unweighted N=6001
68
Male (N=2939) Female (N=3062)
50
40
304 30
272 243
232
199 189 20
121 114
78 83 10
46 43 22 19 2016
0 0 1 2 3 4 5 6 7
Figure 7-9 shows the number of distracted driving slogans that respondents reported hearing in the last 30 days by gender Female respondents reported hearing fewer slogans in the past 30 days than did the male respondents About half of the men recognized 2 or more distracted driving slogans (49) compared to 46 of women More women than men (30 versus 24) reported seeing no slogans
Figure 7-9 Number of Distracted Driving Slogans Heard in Past 30 Days
by Gender
Q22 Do you recall hearing or seeing the following slogans in the past 30 days Base All respondents SA3 Record gender from observation (plt0001) Unweighted N=6001
69
Yes near‐crash 53
Yes crash 70
No 876
CHAPTER 8 DISTRACTED DRIVING CRASHES AND NEAR-CRASHES
Figure 8-1 shows the proportion of drivers by their involvement in vehicle crashes and near-crashes while driving in the past year A large majority (88) of drivers reported that they were not involved in any crash or near-crash events in the past year However 5 of drivers reported a near-crash involvement and 7 reported involvement in a crash
Figure 8-1 Had a Crash or Near-Crash in Past Year
Q23 Have you been involved in a crash or near-crash as a driver in the past year Base All respondents Unweighted N=6001
70
50
40
30
188 18420
133 133128124 123 115103
8510
0 Total 16‐20 21‐24 25‐34 35‐44 45‐54 55‐64 65+ Male Female
N=6001 N=345 N=281 N=892 N=696 N=968 N=1155 N=1540 N=2939 N=3062
Figure 8-2 shows the proportion of drivers who were involved in a crash or a near-crash while driving a vehicle in the past year by age categories Overall younger respondents were more likely to report a crash or near-crash in the past twelve months than were older respondents Nearly 1 in 5 of respondents 16 to 20 (19) and 21 to 24 (18) reported a crash or near-crash in the past year Respondents 65 or older were the least likely to report a crash with 9 saying they were involved in a crash or near-crash in the past year Male respondents (13) were more likely to have been involved in a crash than were female respondents (12)
Figure 8-2 Had a Crash or Near-Crash in Past Year
by Age and Gender
Q23 Have you been involved in a crash or near-crash as a driver in the past year Base All respondents D1 What is your age (plt0001) SA3 Record gender from observation (plt0001) Unweighted N=See Figure
71
Figure 8-3 shows the proportion of respondents who said they were distracted at the time of the last crashnear-crash they were in Nearly 1 in 7 respondents (14) said they were distracted when the crash or near-crash occurred
Figure 8-3 Was the Respondent Distracted During the Last Crash or Near-Crash
Yes 136
No 859
Q23a Were you distracted at the time of the LAST [crashnear-crash] you were in Base Drivers who were in a crash or near-crash in the past year Unweighted N=724
72
50
40
30 274
229
179
151
20
138 121
108
10 80 81
0
34
Total 16‐20 21‐24 25‐34 35‐44 45‐54 55‐64 65+ Male Female N=724 N=72 N=49 N=124 N=94 N=130 N=125 N=122 N=382 N=342
Figure 8-4 shows the proportion of respondents who said they were distracted at the time of their last crashnear-crash by age and gender categories Younger respondents were more likely to report being distracted at the time of the crash or near-crash with 27 of respondents 16 to 20 18 of respondents 21 to 24 and 23 of respondents 25-34 who said they were distracted when the crash or near-crash occurred Respondents 65 and older were the least likely to say they were distracted at the time of their last crash or near-crash (3) Fifteen percent of male respondents and 12 of female respondents reported that they were distracted when the crash or near-crash occurred
Figure 8-4 Was Distracted During Last Crash or Near-Crash Experience
by Age and Gender
Q23a Were you distracted at the time of the LAST [crashnear-crash] you were in Base Drivers who were in a crash or near-crash in the past year D1 What is your age (plt0001) SA3 Record gender from observation (pgt005) Unweighted N=See Figure
73
Not paying attentionlooked away
Fell asleepwas tired
Adjusting radio GPS etc
Using an app on cell phone
Talking to passengers
Talking on cell phone
Daydreaming
Dropped somethingpicking up something
Sending text message or email
Eating
Reading electronic text
Medical reason 05
28
42
42
55
58
64
66
72
81
82
187
0 10 20 30 40 50
Figure 8-5 shows the type of activity the respondents said they were engaged in at the time of their crash or near-crash Nearly one-fifth of respondents who reported being distracted said they were not paying attention or looked away (19) when the crash or near-crash occurred Others reported that they ldquofell asleep or were tiredrdquo (8) were ldquoadjusting the radio or GPSrdquo (8) and 7 were ldquousing their smartphone apprdquo Fewer respondents cited ldquotalking to passengersrdquo (7) ldquotalking on the cell phonerdquo (6) ldquodaydreamingrdquo (6) or ldquodropped or picked up somethingrdquo (6) as reasons for their distraction Less than 5 of respondents said they were sending a text (4) eating (4) reading an electronic text (3) or had a medical reason (1)
Figure 8-5 Type of Distraction at Time of Crash or Near-Crash
Q23b How were you distracted at the time of the [crashnear-crash] Base Drivers who were in a crash or near-crash in the past year Unweighted N=99
74
Talk on the Phone While Driving Send Text Messages While Driving
Percep
tion
of P
ropo
rtion of D
rivers
who
Talk on a Ce
llPh
one or S
end
Text M
essages While
Driving
91‐100
81‐90
71‐80
61‐70
51‐60
41‐50
31‐40
21‐30
11‐20
0‐10 45
48
93
75
213
88
72
169
94
60
25
27
48
44
133
65
81
242
173
132
0 10 20 30 40 50 Percent of Respondents that Indicated the Proportion
CHAPTER 9 PERCEPTIONS OF AND RESPONSES TO DISTRACTED DRIVING
Respondents were asked what percentage of drivers they believe talk on a cell phone or send text messages or e-mails at least occasionally while driving Nearly 7 in 10 respondents (69) believe that more than half of drivers talk on cell phones at least occasionally with 30 of respondents believing that more than 80 of drivers do so When examining the respondentsrsquo perception on the proportion of drivers sending texts or e-mails at least occasionally while driving nearly half of respondents (48) think that more than half of drivers send electronic messages while driving
Figure 9-1 Perception of Proportion of Drivers Talking on PhoneTexting While Driving
Q24 What percentage of drivers do you believe at least occasionally TALK on a cell phone while driving Q24a What percentage of drivers do you believe at least occasionally SEND TEXT MESSAGES OR E-MAILS on a cell phone while driving Base All respondents Unweighted N=6001
75
100
855
80
60
40
20
77 28 23
0 Hands‐free Hand‐held Same Neither
Respondents were asked which phone call method they perceive as safer while driving They were asked to choose between a hands-free device and a handheld cell phone Hands-free devices such as Bluetooth earpieces or vehicle-provided interfaces such as Sync allow an individual to answer and make calls without ever touching the cell phone but they still typically require some manual manipulation such as pressing a button on the steering wheel to answer a call Almost all respondents (86) cited a hands-free cell phone as the safer option A sizeable number of respondents (8) indicated that neither method was safer than the other
Figure 9-2 Safer to Use Hands-Free or Handheld Phone While Driving
Q24b Which is safer using a [hands-free cell phone or using a handheld cell phone] Base All respondents Unweighted N=6001
76
0
20
40
60
80
Hands‐Free Hand‐Held Same Neither
Total (N=6001) 855 28 23 77 16‐20 (N=345) 917 48 26 10
21‐24 (N=281) 854 55 16 58 25‐34 (N=892) 877 28 35 49
35‐44 (N=696) 911 14 15 54 45‐54 (N=968) 856 28 27 78 55‐64 (N=1155) 836 26 24 93 65+ (N=1540) 784 26 15 143 Male (N=2939) 856 28 23 76 Female (N=3062) 854 28 22 78
Figure 9-3 shows which phone call method is perceived as safer by respondent gender and age Drivers 16 to 20 and 35 to 44 were the most likely to think that using a hands-free device was safer than holding a cell phone when driving (92 and 91 respectively) while drivers aged 65 or more were the least likely to say so (78) Only 1 of drivers 16 to 20 said that neither method was safer In contrast 14 of drivers 65 and more said that neither method was safer than the other There was no difference between male and female drivers
Figure 9-3 Safer to Use Hands-Free or Handheld Phone by Age and Gender
100
Q24b Which is safer using a hands-free cell phone or using a handheld cell phone Base All respondents D1 What is your age (plt0001) SA3 Record gender from observation (pgt005) Unweighted N=See Figure
77
Cell phone providers and other app developers have developed apps that automatically disable texting and incoming calls when a vehicle is in operation Figure 9-4 shows respondentsrsquo attitudes toward the use of apps that prevent texting and making phone calls when driving by age and gender Overall nearly half of the respondents (46) said that they would use an app to block phone calls and text messaging while driving Female drivers (50) and drivers 45 to 54 years old (52) were the most likely to say that they would use an app that blocks phone calls and text messaging while driving Drivers 21 to 24 were the most likely to State that they already use an app to block incoming calls and texts (3) More than half of those in the 25-to-34 (53) 21-toshy24 (52) and 16-to-20 (50) age categories said they would not use any apps that prevent texting and making phone calls while driving A small number of older respondents did not have a definite answer with 5 of those 55 to 64 and 4 of respondents 45 to 54 and 65+ saying that it would depend
Figure 9-4 Would Use App to Block Calls and Texts While Driving ( Yes)
Yes No It Depends I Already Have
One
Total (N=6001) 464 468 36 12 16‐20 (N=345) 463 503 20 14 21‐24 (N=281) 424 521 22 25
25‐34 (N=892) 409 530 29 20
35‐44 (N=696) 461 478 34 17
45‐54 (N=968) 519 416 43 06
55‐64 (N=1155) 476 433 48 11
65+ (N=1540) 477 449 40 00
Male (N=2939) 425 510 35 09
0
20
40
60
80
Female (N=3062) 502 426 37 14
100
Q24c There are phone apps available to block phone calls and text messaging while driving Would you use such an app Base All respondents D1 What is your age (plt0001) SA3 Record gender from observation (plt0001) Unweighted N=6001
78
CHAPTER 10 DISTRACTED DRIVING BEHAVIOR BY DRIVER TYPE
In examining driversrsquo attitudes and self-reported distracted behaviors it is useful to group drivers by their distracted driving tendencies Rather than rely on any single indicator of general distracted driving or assumptions about appropriate categories of drivers this study developed a typology of drivers using cluster analysis of responses to 15 questions about the frequency of distracted driving behaviors Cluster analysis allowed the identification of discrete types of drivers based on the overall pattern of responses across all 15 distracted driving behavior questions Biplot and factor analyses were conducted to explore the patterns of covariation of distracted driving behaviors Three factors were identified interaction with other passengers (items q4a and q4g) addressing onersquos personal needs (items q4i q4b and q4j) and cell phone use (all other items) Ultimately the k-means method was applied to identify two clusters on the scree plot of explained variance Distracted driving behavior questions asked in 2015 differed slightly from 2012 In 2012 respondents were asked about the frequency with which they ldquomake or accept phone callsrdquo while driving In 2015 this item was split into two separate items Items about reading (paper or electronically) personal grooming and listening to portable music players with headphones were dropped Three items were added in 2015 relating to taking pictures with onersquos phone looking up information on the Internet and using smartphone apps (not including navigation apps) while driving The 15 questions used in the 2015 cluster analysis reflect the current 2015 questionnaire and thus differ from the 2012 cluster analysis
79
Table 10-1 shows the 15 distracted driving items used in the 2015 cluster analysis and the response distributions for each Talking to passengers in the vehicle is the activity drivers most often engage in while driving with 53 reporting they always or almost always do so while driving This was followed by always or almost always adjusting the car radio (35) and interacting with children in the vehicle (21) Activities in which drivers are the least likely to engage while driving include taking pictures with their phone with 89 of drivers saying they never do so followed by looking up information on the Internet (86) using smartphone apps not including a navigation app (84) and sending text messages or e-mails (80)
Table 10-1 Distracting Behavior Frequency (Used in Cluster Analysis)
How often do youhellip N Always Almost Always
Sometimes Rarely Never
Q4a Talk to passengers in the vehicle 6001 348 181 291 120 57
Q4b Eat or drink 6001 56 64 355 264 260
Q4c Make phone calls 6001 38 44 254 220 444
Q4d Answer phone calls 6001 97 56 268 212 366
Q4e READ text or e-mail messages 6001 16 14 86 137 748
Q4f SEND text or e-mail messages 6001 10 12 63 113 800
Q4g Talk or interact with children in the vehicle
6001 141 70 204 161 422
Q4h Use portable music player including a smartphone with external speakers or with the carrsquos speakers
6001 109 59 128 68 635
Q4i Adjust the car radio 6001 220 126 330 164 157
Q4j Change CDs DVDs or tapes 6001 24 15 130 185 646
Q4k Use smartphone for driving directions 6001 54 45 261 129 512
Q4l Use a navigation system for driving directions
6001 50 37 274 148 489
Q4m Take pictures with your phone 6001 08 05 33 67 887
Q4n Use smartphone apps not including a navigation app
6001 16 06 62 73 841
Q4o Look up information on the Internet 6001 14 06 52 73 855
80
Cluster analysis was able to classify all of the respondents into one of two distinct groups based on their responses to the 15 questions The core characteristic of each of the two groups identified in the cluster analysis was determined by examining how each group scored on each distracted driving behavior variable As can be seen in Table 10-2 one group was composed of drivers who consistently reported engaging in distracted driving behaviors and the other group was composed of drivers who reported distracted driving behaviors less often The groups were named distraction-prone and distraction-averse respectively for the purposes of this report Of those respondents categorized 42 are distraction-prone drivers (N=2301) and 58 are distraction-averse drivers (N=3700)
Table 10-2 Distracted Driving Behaviors by Driver Type
How often do youhellip N Always Almost Always
Sometimes Rarely Never
Talk to other passengers in the vehicle
Distraction-Prone Drivers 2301 602 210 148 32 07
Distraction-Averse Drivers 3700 164 161 394 184 93
Eat or drink Distraction-Prone Drivers 2301 110 106 514 196 73
Distraction-Averse Drivers 3700 16 34 239 313 396
Make phone calls Distraction-Prone Drivers 2301 80 93 429 232 166
Distraction-Averse Drivers 3700 08 08 128 211 645
Answer phone calls Distraction-Prone Drivers 2301 182 103 393 188 132
Distraction-Averse Drivers 3700 35 23 178 229 535
Read text or e-mails messages Distraction-Prone Drivers 2301 37 31 193 246 492
Distraction-Averse Drivers 3700 00 01 08 57 933
Send text or e-mails messages Distraction-Prone Drivers 2301 25 27 145 223 580
Distraction-Averse Drivers 3700 00 01 04 33 959
Talk or interact with children in the vehicle Distraction-Prone Drivers 2301 292 119 213 141 234
Distraction-Averse Drivers 3700 33 35 197 175 557
Use a portable music player including a smartphone with external speakers or with the carrsquos speakers
Distraction-Prone Drivers 2301 193 76 183 87 461 Distraction-Averse Drivers 3700 48 47 89 54 760
81
Table 10-2 Distracted Driving Behaviors by Driver Type (Continued)
How often do youhellip N Always Almost Always
Sometimes Rarely Never
Adjust the car radio
Distraction-Prone Drivers 2301 439 197 268 62 31
Distraction-Averse Drivers 3700 62 75 374 238 248
Change CDs DVDs or Tapes Distraction-Prone Drivers 2301 51 31 187 222 509
Distraction-Averse Drivers 3700 04 04 90 158 744
Use a smartphone for driving directions
Distraction-Prone Drivers 2301 104 73 399 152 271
Distraction-Averse Drivers 3700 17 24 161 112 685
Use a navigation system for driving directions Distraction-Prone Drivers 2301 65 59 342 158 374
Distraction-Averse Drivers 3700 39 22 224 141 572
Take pictures with your phone Distraction-Prone Drivers 2301 17 12 65 119 788
Distraction-Averse Drivers 3700 01 01 09 30 960
Use smartphone apps not including a navigation app Distraction-Prone Drivers 2301 34 13 115 137 700
Distraction-Averse Drivers 3700 04 01 24 26 943
Look up information on the Internet Distraction-Prone Drivers 2301 30 11 103 145 710
Distraction-Averse Drivers 3700 03 01 15 21 960
82
581 437 426 395 442
564
729 884
578 583
419
563
574 605 558
436 271 116
422 417
0
20
40
60
80
100
Total N=6001
16 to 20 N=345
21 to 24 N=281
25 to 34 N=892
35 to 44 N=696
45 to 54 N=968
55 to 64 N=1155
65+ N=1540
Male N=2939
Female N=3062
Figure 10-1 shows a clear age effect on distracted driving tendency Distraction-averse drivers tend to be older while distraction-prone drivers are more likely to be younger The proportion of distraction-prone drivers decreases with advancing age with the majority of those in the younger age categories 16 to 20 (56) 21 to 24 (57) 25 to 34 (61) and 35 to 44 (56) categorized as distraction-prone drivers and less than one quarter of drivers 55 and older (27 for 55-64 and 12 for 65 and older) categorized as distraction-prone drivers Males and females were equally likely to be classified as distraction-prone drivers (42)
Figure 10-1 Driver Type
by Age and Gender
Distraction‐Averse Driver Distraction‐Prone Driver
D1 What is your age (plt0001) SA3 Record gender from observation Base All respondents Unweighted N=See Figure
83
665 659 558
470 463 544
335 341 442
530 537 456
0
20
40
60
80
100
No HS Degree (N=505)
High School Grad
(N=1613)
Some College (N=1470)
College Grad (N=1241)
Some Grad School (N=135)
Grad Degree (N=970)
Figure 10-2 examines the relationship between distracted driving tendency and the highest level of education completed Respondents with some graduate school education and college graduates had the largest percentage of distraction-prone drivers (53-54) compared to respondents without a high school degree (34) or who only graduated high school (34) Overall drivers with some college and more education are more likely to be classified as distraction-prone
Figure 10-2 Driver Type
by Highest Level of School Completed
Distraction‐Averse Driver Distraction‐Prone Driver
D6 What is highest grade or year of regular school you have completed (plt0001) Base All respondents Unweighted N=See Figure
84
Distraction‐Averse Driver Distraction‐Prone Driver
632 581 579 541 617 610
368 419 421 459 383 390
0
20
40
60
80
100
American Asian (N=191) Black or Native White Hispanic Indian or African Hawaiian or (N=4693) (N=631)
Alaska Native American other Pacific (N=182) (N=543) Islander
(N=48)
Figure 10-3 shows that the tendency toward distracted driving behavior is similar across most racial and ethnic groups Almost one half of Native Hawaiian or other Pacific Islander respondents (46) were categorized as distraction-prone drivers Around 4 in 10 Asian (42) Black or African-American (42) White (38) Hispanic (39) and American Indian or Alaska Native (37) respondents were classified as distraction-prone drivers
Figure 10-3 Driver Type
by RaceEthnicity
D5 Which of the following racial categories describe you You may select more than one (pgt005) D4 Do you consider yourself to be Hispanic or Latino (pgt005) Base All respondents Unweighted N=See Figure Sample size was less than 50
85
Distraction‐Averse Driver Distraction‐Prone Driver
684 693 690 625
537 453
385 421
316 307 310 375
463 547
615 579
0
20
40
60
80
100
Less than $10000 to $15000 to $25000 to $50000 to $100000 $150000 $200000+ $10000 $14999 $24999 $49999 $99999 to to (N=299) (N=320) (N=281) (N=488) (N=1201) (N=1581) $149999 $199999
(N=728) (N=257)
Figure 10-4 shows a relationship between income and distracted driving tendency Overall as annual household income increases drivers were more likely to be classified as distraction-prone In the highest household income groups ($150000+) about 6 in 10 drivers coming from households earning $150000 to $199999 (62) and more than $200000 (58) were categorized as distraction-prone In contrast in each of the three lowest household income groups (lt$10000 $10000 to $14999 and $15000 to $24999) fewer than a third were classified as distraction-prone
Figure 10-4 Driver Type by Income
D11 What is your approximate household income (plt0001) Base All respondents Unweighted N=See Figure
86
Distraction‐Averse Driver Distraction‐Prone Driver
510 640
799 859 768
490 360
201 141 232
0
20
40
60
80
100
Every Day Almost Every Few Days a Few Days a Few Days a (N=3913) Day Week Month Year
(N=971) (N=854) (N=193) (N=58)
Figure 10-5 shows the tendency toward distracted driving by respondentsrsquo frequency of driving The highest proportion of distraction-prone drivers is among respondents who drove every day with nearly half of respondents (49) classified as such The lowest proportion of distraction-prone drivers is among respondents who drove only a few days a month (14)
Figure 10-5 Driver Type
by Frequency of Driving
Q1 How often do you drive a motor vehicle regardless of whether it is for work or for personal use Every day almost every day a few days a week a few days a month a few days a year or do you never drive (plt0001) Base All respondents Unweighted N=See Figure
87
Distraction‐Averse Driver Distraction‐Prone Driver
589 598
800
589 536 554
690
410 402
200
411 464 446 310
0
20
40
60
80
100
Car Van or Motorcycle Pickup SUV Other Truck Other (N=3393) Minivan (N=15) Truck (N=1175) (N=51) (N=25)
(N=449) (N=885)
Figure 10-6 shows the relationship between vehicle type and driver type Those who drive a SUV (46) or some other kind of truck (eg medium truck heavy truck not a pickup) (45) are among the most likely to be distraction-prone
Figure 10-6 Driver Type by Car Type
Q1a Is the vehicle you drive most often a car van motorcycle sport utility vehicle pickup truck or other type of truck Base Respondents assigned a driver type (plt0001) Unweighted N=See Figure Sample size was less than 50
88
980100
848
80
60
40
20
0 Distraction‐Averse Driver Distraction‐Prone Driver
(N=3700) (N=2301)
Figure 10-7 shows cell phone ownership by driver type Distraction-prone drivers (98) were more likely than distraction-averse drivers (85) to own a cell phone The vast majority of respondents owned a cell phone so these results should be interpreted with this fact in mind
Figure 10-7 Cell Phone Ownership
by Driver Type
Q3 Do you CURRENTLY own any of the following devices A cell phone (plt0001) Base All respondents Unweighted N=See Figure
89
Figure 10-8
Proportion of Distraction-Prone Drivers by NHTSA Region
Figure 10-8 shows the percentage of distraction-prone drivers by NHTSA region There was a statistically significant relationship between distracted driving behaviors and NHTSA region however it is important to note that there is not a large difference in the proportion of distracted drivers between the NHTSA regions Drivers who live in Region 2 (63) were more likely to be categorized as distraction-prone drivers than were drivers in Region 8 (51) or Region 3 (54)
(plt0001) N=6001 Note During the survey Connecticut was in Region 1 and has subsequently been moved into Region 2
90
Distraction‐Averse Driver (N=3700) Distraction‐Prone Driver (N=2301)
100
76980
60 533
40
241
20 127
87 59
18 0
149
Very Unsafe Somewhat Unsafe A Little Less Safe Safe
When certain behaviors are broken out by driver type distraction-prone drivers tend to be less likely to feel unsafe as a passenger when the driver engages in those distracted behaviors Figure 10-9 shows the perceptions of safety by driver type of respondents who are passengers in a vehicle in which the driver is talking to other passengers while driving Slightly more than half of respondents classified as distraction-averse drivers (53) compared to more than three-quarters of distraction-prone drivers (77) stated that they would feel safe if the driver was conversing with others in the car while driving More than 1 in 5 respondents classified as distraction-averse drivers (21) compared to 8 of respondents classified as distraction-prone reported they would feel very or somewhat unsafe
Figure 10-9 Perception of Safety by Driver Type Driver Is Talking to Other Passengers
Q11a Now Irsquom going to read a list of things people sometimes do while driving Tell me how safe you would feel if you were a passenger riding in a car while your driver was doing the following For each please tell me if you would feel very unsafe somewhat unsafe a little less safe or safe ndash no problem ndash would not pay any more attention a Talking to other passengers in the vehicle (plt0001) Base All respondents assigned a driver type Unweighted N=See Figure
91
Distraction‐Averse Driver (N=3700) Distraction‐Prone Driver (N=2301)
100
80
60 563
40 348
259 221 205
176 168 20
50
0 Very unsafe Somewhat unsafe A little less safe Safe
Figure 10-10 compares the perceptions of safety among distraction-averse and distraction-prone people when their drivers are talking on a cell phone while holding the phone Overall distraction-averse people were much more likely to feel very unsafe than the distraction-prone people More than half of the individuals classified as distraction-averse drivers (56) reported that they would feel very unsafe in this situation while only 22 of individuals classified as distraction-prone stated they would feel very unsafe Conversely 17 of distraction-prone individuals and only 5 of distraction-averse individuals said they would feel safe if the driver was talking on the phone while holding it
Figure 10-10 Perception of Safety by Driver Type
Driver Is Talking on Cell Phone While Holding Phone
Q11-c Now Irsquom going to read a list of things people sometimes do while driving Tell me how safe you would feel if you were a passenger riding in a car while your driver was doing the following For each please tell me if you would feel very unsafe somewhat unsafe a little less safe or safe ndash no problem ndash would not pay any more attention c Talking on a cell phone while holding the phone (plt0001) Base All respondents Unweighted N=See Figure
92
Distraction‐Averse Driver (N=3700) Distraction‐Prone Driver (N=2301)
100
90
80
70
60 534
50
40 372
30 215
190 165 20
136 108100 99
68
0
10
Very Likely Somewhat Somewhat Very Unlikely Never would Likely Unlikely intervene
Respondents were asked how likely they were to intervene if they were passengers in a vehicle in which the driver was talking on a cell phone while holding the phone and driving Individuals classified as distraction-prone drivers were less likely than those classified as distraction-averse drivers to report that they would intervene if their drivers were talking on a phone while driving While 53 of distraction-averse drivers say they are very likely to intervene 37 of distraction-prone drivers said that they would do so Almost one-quarter of distraction-prone drivers (24) and 17 of distraction-averse drivers said they were very unlikely or would never intervene
Figure 10-11 How Likely Are You to Intervene if the Driver Is Talking on a
Cell Phone While Holding the Phone by Driver Type
Q12 How likely are you to do or say something to your driver if theyrsquore TALKING on a handheld cell phone while driving (plt0001) Base All respondents Unweighted N=See Figure
93
934
42 13 06
763
142
68 25
0
20
40
60
80
100
Very Unsafe Somewhat Unsafe A Little Less Safe Safe
Distraction‐Averse Driver (N=3700) Distraction‐Prone Driver (N=2301)
Figure 10-12 compares the perceptions regarding safety of distraction-prone and distraction-averse people when the driver is sending text messages or e-mails while driving The overwhelming majority of distraction-averse individuals (93) and three-quarters (76) of distraction-prone individuals reported that they would feel very unsafe if the driver was engaged in this behavior while driving One in 5 (21) distraction-prone drivers reported that they would feel somewhat unsafe or a little less safe in this situation only 5 of distracted-averse drivers reported feeling this way Very few distraction-averse (1) and distraction-prone (3) individuals indicated that they would feel safe if their drivers were sending e-mails or text messages while driving
Figure 10-12 Perception of Safety Driver Is Sending Text Messages or E-Mails
by Driver Type
Q11-f Now Irsquom going to read a list of things people sometimes do while driving Tell me how safe you would feel if you were a passenger riding in a car while your driver was doing the following For each please tell me if you would feel very unsafe somewhat unsafe a little less safe or safe ndash no problem ndash would not pay any more attention f Sending text messages or e-mails (plt0001) Base All respondents Unweighted N=See Figure
94
Distraction‐Averse Driver (N=3700) Distraction‐Prone Driver (N=2301)
100
80
60
40
20
0
793
697
89
167
37 61 45 41 26 31
Very Likely Somewhat Somewhat Very Unlikely Never Would Likely Unlikely Intervene
Overall 88 of respondents stated that they were at least somewhat likely to intervene if they were passengers in a vehicle when a driver was sending e-mails or text messages Figure 10-13 shows the likelihood of intervention by people classified as distraction-prone and distraction-averse if they are passengers in a vehicle in which the driver is sending e-mails or text messages while driving The majority of distraction-averse (79) and distraction-prone (70) drivers were very likely to intervene Very few respondents indicated that they never would intervene
Figure 10-13 How Likely Are You to Intervene if Driver Is Sending Text Messages or E-Mails
by Driver Type
Q13 How likely are you to do or say something to your driver if theyrsquore SENDING TEXT MESSAGES OR E-MAILS OR USING SMARTPHONE APPS while driving (plt0001) Base All respondents Unweighted N=See Figure
95
895
66 27 08
693
193
91
21 0
20
40
60
80
100
Very Unsafe Somewhat Unsafe A Little Less Safe Safe
Distraction‐Averse Driver (N=3700) Distraction‐Prone Driver (N=2301)
Figure 10-14 compares the perception of safety among distraction-prone and distraction-averse people when the driver is reading e-mails or text messages while driving Nine in 10 distraction-averse individuals (90) and 69 of distraction-prone individuals reported that they would feel very unsafe if the driver was engaged in this behavior while driving More than a quarter (28) of distraction-prone drivers and nearly 1 in 10 (9) of distraction-averse drivers reported that they would feel somewhat unsafe or a little less safe in this situation Very few distraction-averse (1) and distraction-prone (2) individuals indicated that they would feel safe if their drivers were reading e-mails or text messages while driving
Figure 10-14 Perception of Safety Driver Is Reading Text Messages or E-Mails
by Driver Type
Q11-e Now Irsquom going to r ead a list of things people sometimes do wh ile driving Tell me how safe you would f eel if you were a passenger riding in a car while your driver was doing the following For each please tell me if you would feel very unsafe somewhat unsafe a little less safe or safe ndash no problem ndash would not pay any more attention e Reading e-mails or text messages (plt0001) Base All respondents Unweighted N=See Figure
96
0‐2 secs 3‐6 secs 7+ secs 100
80
662 637
60
40 315
20
53 36
0 Distraction‐Averse Driver Distraction‐Prone Driver
(N=3700) (N=2301)
258
Figure 10-15 compares the number of seconds a respondent believes drivers can safely take their eyes off the road by driver type While more than 6 in 10 distraction-averse and distraction-prone drivers provided an answer that was between 0 and 2 seconds distraction-prone drivers (35) were more likely to believe that a driver can take hisher eyes off the road for 3 or more seconds than were distraction-averse drivers (31)
Figure 10-15 Number of Seconds a Driver Can Safely Take HisHer Eyes Off the Road
by Driver Type
Q10 How many seconds do you believe a driver can take his eyes off the road before driving becomes significantly more dangerous (plt0001) Base All respondents Unweighted N=See Figure
97
16
166
797
32
140
825
100
Distraction‐Averse Driver (N=1663) Distraction‐Prone Driver (N=1986)
80
60
40
20
0 Increased Decreased Stayed the Same
Figure 10-16 shows the frequency with which respondents reported making and receiving phone calls while driving by driver type Regardless of driver type most respondents report no changes in the frequency with which they make calls within the past 30 days Very few distraction-averse drivers (2) as well as distraction-prone drivers (3) stated that the frequency of making and receiving phone calls increased in the past 30 days while 17 of distraction-averse drivers and 14 of distraction-prone drivers stated that they are making calls less often Eight in 10 distraction-averse drivers (80) and distraction-prone drivers (83) reported that the frequency with which they make calls remained the same
Figure 10-16 Has Your Frequency of Answering Phone Calls
While Driving Increased Decreased or Stayed the Same by Driver Type
Q15 In the past 30 days has your frequency of answering phone calls while driving increased decreased or stayed the same Base Respondents who accept phone calls while driving (plt0001) Unweighted N=See Figure
98
Distraction‐Averse Drivers (n=2806) Distraction‐Prone Drivers (n=1577)
50
40
306 297 30
243 241 224 224 215
188 20
10
37 22
0 Very Likely Somewhat Somewhat Very Unlikely Not Sure
Likely Unlikely
Figure 10-17 shows a moderate difference in respondentsrsquo perception of the likelihood that a driver talking on a cell phone would receive a ticket by driver type Among distraction-averse drivers 31 indicated that it was very likely and 24 stated that it was somewhat likely that the driver would get a ticket Among distraction-prone drivers 22 stated it was very likely that the driver would receive a ticket and 30 stated that it was somewhat likely
Figure 10-17 Likelihood of Ticket for Talking on a Cell Phone While Driving
by Driver Type
Q17a Assume that over the next 6 months someone frequently TALKS on a handheld cell phone while driving How likely do you think that person would be to receive a ticket for talking on a cell phone while driving Base Respondents who reported living in a State which bans talking on a cell phone while driving (plt0001) Unweighted N=See Figure
99
Distraction‐Averse Drivers (n=3700) Distraction‐Prone Drivers (n=2301)
100
822 80
616 60
40 356
20 158
27
0 Yes No Not Sure
19
Figure 10-18 shows respondentsrsquo support for a State law banning talking on a handheld cell phone while driving by driver type Distraction-averse drivers were more likely to support such a law while distraction-prone drivers were more likely to oppose such a law More than 8 in 10 distraction-averse drivers (82) and 62 of distraction-prone drivers stated that they support a law banning talking on a cell phone while driving One in 6 (16) distraction-averse drivers and 36 of distraction-prone drivers are opposed to such a law
Figure 10-18 Support for Law Banning Talking on a Handheld Cell Phone While Driving
by Driver Type
Q19 Do you support a State law banning talking on a handheld cell phone while driving (plt0001) Base All respondents Unweighted N=See Figure
100
50
Distraction‐Averse Drivers (n=3380) Distraction‐Prone Drivers (n=2078)
40
327
30 267 260 250
238 229 208
20
10
29 16
0
175
Very Likely Somewhat Somewhat Very Unlikely Not Sure Likely Unlikely
Figure 10-19 shows respondentsrsquo perception of the likelihood that a driver sending electronic messages while driving would receive a ticket by driver type More than half of distraction-averse drivers (59) as well as distraction-prone drivers (52) thought that it was at least somewhat likely that the driver would be ticketed
Distraction-averse drivers were more likely to state that the driver was very likely to receive a ticket while distraction-prone drivers more often reported the driver was only somewhat likely or not likely to receive a ticket with 33 of distraction-averse drivers and 25 of distraction-prone drivers stating that the driver was very likely to receive a ticket Conversely distraction-prone drivers were more likely than distraction-averse drivers to state that a driver who frequently sends text messages or e-mails was somewhat unlikely (24 versus 18) or very unlikely (23 versus 21) to receive a ticket
Figure 10-19 Likelihood of Ticket for Sending Text Messages or E-Mails While Driving
by Driver Type
Q18a Assume that over the next 6 months someone frequently sends text messages or e-mails while driving How likely do you think that person would be to receive a ticket for sending text messages or e-mails while driving Base Respondents who report living in a State that bans sending messages while driving (plt0001) Unweighted N=See Figure
101
$400
$350 $32829
$300 $26388 $26487
$250
$20917 $200
$150
$100
$50
$0 Distraction‐ Distraction‐ Distraction‐ Distraction‐Averse Driver Prone Driver Averse Driver Prone Driver
N=2633 N=1361 N=3034 N=1903
Average Fine for Talking on a Handheld Cell Phone While Driving
Average Fine for Sending Text Messages or E‐Mails While Driving
Of those who support a State law banning talking on a handheld cell phone while driving the average fine suggested by distraction-averse drivers for talking on a handheld cell phone while driving was higher than the average fine suggested by distraction-prone drivers ($264 versus $209) Distraction-averse drivers who supported bans on sending electronic messages while driving also suggested higher average fines for sending text messages while driving than distraction-prone drivers ($328 versus $265)
Figure 10-20 Average Fine for Cell Phone Use While Driving
by Driver Type
Q19a What do you think the fine should be for talking on a handheld cell phone while driving Base Respondents who support a ban on talking on a cell phone while driving (plt0001) Q19c What do you think the fine should be for sending text messages or e-mails while driving Base Respondents who support a ban on sending messages while driving (plt0001) Unweighted N=See Figure
102
50
40
30
20
10 61 36
18
0 Total Distraction‐Averse Driver Distraction‐Prone Driver
(N=6001) (N=3700) (N=2301)
The proportion of drivers stopped by the police for using a phone while driving is fairly low (4) However distraction-prone drivers are more likely to be stopped by police as opposed to distraction-averse drivers Indeed 6 of distraction-prone drivers have been pulled over by the police for using their cell phones while driving while only 2 of distraction-averse drivers reported being pulled over
Figure 10-21 Ever Stopped by Police for Using Phone While Driving
by Driver Type ( Yes)
Q20 Have you ever been personally stopped by the police for using a handheld cell phone while driving (plt0001) Base All respondents Unweighted N=See Figure
103
100
80 752
674
60
40
20
0 Distraction‐Averse Driver Distraction‐Prone Driver
(N=3700) (N=2301)
When asked whether the respondents had seen or heard any messages that encourage people not to talk on phones or send electronic messages while driving 67 of distraction-averse drivers and 75 of distraction-prone drivers reported seeing or hearing messages that encourage people not to talk on the phone or send messages while driving
Figure 10-22 Respondents Exposed to Messages Discouraging Cell Phone Distracted Driving
by Driver Type
Q21 In the past 30 days have you seen or heard any messages that encourage people not to talk on phones or send electronic messages while driving This could be public service announcements on TV messages on the radio signs on the road news stories or something else (plt0001) Base All respondents assigned a driver type Unweighted N=See Figure
104
Distraction‐Averse Driver (N=2458) Distraction‐Prone Driver (N=1706)
100
80
60 565
444
40
291 249
20 127
92 6039
0 TV Print Media Radio Internet
Figure 10-23 shows the sources of messages discouraging cell phone distracted driving as reported by distraction-prone and distraction-averse drivers who saw or heard messages Distraction-averse drivers (57) were more likely than distraction-prone (44) drivers to list television programming as a source of the message Distraction-prone drivers (29) are more likely than distraction-averse drivers (25) to mention print media which includes newspapers and billboards Nearly 1 in 8 distraction-prone drivers (13) and 9 of distraction-averse drivers mentioned the radio as a source of the message they heard Fewer than 1 in 10 distraction-prone drivers (6) mentioned the Internet as a source as did 4 of distraction-averse drivers
Figure 10-23 Source of Messaging
by Driver Type
Q21a Where did you see or hear these messages (plt0001) Base Has seenheard messages in the past 30 days Unweighted N=See Figure
105
50
40
30
20
10
0 Distraction‐Averse Driver Distraction‐Prone Driver
(N=3700) (N=2301)
107
147
Figure 10-24 shows the proportion of drivers who were involved in a crash or a near-crash while driving a vehicle in the past year by driver type Distraction-prone drivers (15) were more likely than distraction-averse drivers (11) to report a crash or near-crash in the past twelve months
Figure 10-24 Had a Crash or Near-Crash in Past Year
by Driver Type
Q23 Have you been involved in a crash or near-crash as a driver in the past year (plt0001) Base All respondents Unweighted N=See Figure
106
50
40
30
20
10
0 Distraction‐Averse Driver Distraction‐Prone Driver
(N=382) (N=342)
182
92
Figure 10-25 shows the proportion of respondents who were distracted at the time of their last crash or near-crash by driver type Distraction-prone drivers (18) were twice as likely as distraction-averse drivers (9) to say they were distracted at the time of their last crash or near-crash
Figure 10-25 Was Distracted During Last Crash or Near-Crash Experience
by Driver Type
Q23a Were you distracted at the time of the LAST [crashnear-crash] you were in (plt0001) Base Drivers who were in a crash or near-crash in the past year Unweighted N=See Figure
107
Distraction‐Averse Drivers (N=3700) Distraction‐Prone Drivers (N=2301)
100
905
820 80
60
40
20 113
27
0 Hands‐free Hand‐held Same Neither
25 33 24 22
Figure 10-26 shows which phone call method is perceived as safer by driver type Distraction-prone drivers are more likely than distraction-averse drivers to say that using a hands-free cell phone while driving is safer than using a handheld cell phone (91 versus 82) While very few distraction-prone drivers (3) thought that neither method was safer more than 1 in 10 distraction-averse drivers (11) indicated that neither method was safer than the other
Figure 10-26 Safer to Use Hands-Free or Handheld Phone While Driving
by Driver Type
Q24b Which is safer using a [hands-free cell phone or using a handheld cell phone] (plt0001) Base All respondents Unweighted N=See Figure
108
510
417
36 09
400
537
35 15 0
20
40
60
80
100
Yes No Depends Already have one
Distraction‐Averse Drivers (N=3700) Distraction‐Prone Drivers (N=2301)
Figure 10-27 shows respondentsrsquo attitudes toward the use of apps that prevent texting and making phone calls while driving by driver type Distraction-averse drivers were more likely than distraction-prone drivers to say that they would use a blocking app while driving (51 vs 40) A small percentage of respondents (1 of distraction-averse and 2 of distraction-prone) already have a smartphone app that blocks calls and texting while driving
Figure 10-27 Would Use App to Block Calls and Texts While Driving
by Driver Type
Q24c There are phone apps available to block phone calls and text messaging while driving Would you use such an app (plt0001) Base All respondents Unweighted N=See Figure
109
CHAPTER 11 TREND ANALYSIS
As noted earlier this document presents the results of the third NHTSA National Survey on Distracted Driving Attitudes and Behaviors The first such study was conducted in 2010 and the second was conducted in 2012 Comparing responses to questions that appeared in 2010 2012 and 2015 provides insight into how distracted driving behaviors and attitudes have changed in the past 6 years All three surveys asked respondents how often they engage in a set of specific activities while driving Several activities that were not asked in 2010 and 2012 were added in 2015 while some others were removed from the 2015 survey instrument Overall respondents reported always engaging in these activities at similar rates from 2010 to 2015 In all three surveys about 1 in 3 respondents (29 in 2010 31 in 2012 and 35 in 2015) stated that they talk to other passengers in the vehicle while driving In 2010 6 of respondents reported eating or drinking when driving while this percentage was 5 in 2012 and 6 in 2015 In 2010 and 2012 6 of drivers reported making or answering phone calls on all driving trips Unlike the previous years the 2015 survey separated making and answering phone calls About 1 in 20 respondents stated that they always initiate a phone call (4) and 10 stated that they always answer phone calls while driving The percentage of respondents that adjust their car radios increased from 17 in 2010 to 22 in 2015 Respondents in 2015 (5) were more than twice as likely as respondents in 2012 (2) and 2010 (1) to use a smartphone for driving directions
110
Table 11-1 Engaging in Distracted Driving Activities (Always or All Trips)
2010 (N=5907)
2012 (N=6016)
2015 (N=6001)
a Talk to other passengers in the vehicle 286 308 348
b Eat or drink 56 50 56
Make or accept phone calls 57 63 -shy
c Make phone calls -shy -shy 38
d Answer phone calls -shy -shy 97
Read such as a book newspaper iPad or Kindle 02 04 -shy
e Read text or e-mail messages 12 14 16
f Send text or e-mail messages 08 10 10
Do personal grooming 09 10 -shy
g Talk or interact with children in the vehicle 62 90 141
h Use a portable music player including a smartphone with external speakers or with the carrsquos speakers
-shy -shy 109
Use a portable music player with headphones on 02 08 -shy
Use a portable music player with external speakers 72 64 -shy
i Adjust the car radio 172 158 220
j Change CDs DVDs or tapes 29 32 24
k Use a smartphone for driving directions 09 24 54
l Use a navigation system for driving directions 38 44 50
m Take pictures with your phone -shy -shy 08
n Use smartphone apps not including a navigation app -shy -shy 16
o Look up information on the Internet -shy -shy 14
2010 ndash Q5 Irsquom going to read a list of activities and for each Irsquod like you to tell me how often YOU do each while driving For each please tell me if you do the activity on all driving trips on most driving trips on some driving trips rarely never How often do youhellip 2012 ndash Q4 Irsquom going to read a list of activities and for each Irsquod like you to tell me how often YOU do each while driving For each please tell me if you do the activity always almost always sometimes rarely or never How often do youhellip 2015 ndash Q4 Irsquom going to read a list of common activities people do while driving For each activity Irsquod like you to tell me how often YOU do each while driving For each please tell me if you do the activity always almost always sometimes rarely or never How often do youhellip 2010 Base Respondents who drive at least a few times a year 20122015 Base All respondents Items that are no longer used in 2015 survey
111
2010 (N=5899) 2012 (N=6016) 2015 (N=6001)
50
40
30
20
10
0
153
114 97
31 23 38
Answer a Call While Driving Make a Call While Driving
All three surveys asked about respondentsrsquo willingness to answer or initiate phone calls while driving Figure 11-1 shows how often respondents in 2010 2012 and 2015 reported answering a phone call as well as making a phone call while driving The percentage of drivers who always answer phone calls while driving was higher in 2010 One in 7 drivers in 2010 (15) indicated that they always answer phone calls while driving compared to 10 of drivers in 2015 There was a slight decrease in the percentage of drivers willing to make a phone call between 2010 and 2012 (3 versus 2) This percentage increased to 4 in 2015
Figure 11-1 Answering and Making Phone Calls While Driving ( AlwaysAll Trips)
20102012 ndash Q8aQ5a When yo u RECEIVE a phone call while you are driving how often do you ANSWER the call 20102012 ndash Q9aQ6a When you are driving how often are you willing to MAKE a phone call 2015 ndash Q4cd Irsquom going to read a list of common activities people do while driving For each activity Irsquod like you to tell me how often YOU do each while driving For each please tell me if you do the activity always almost always sometimes rarely or never How often do you make phone calls How often do you answer phone calls Base 2010 ndash All drivers 20122015- All respondents Unweighted N=See Figure
112
25
20
15
10
5
0 2010 2012 2015
N=5907 N=6016 N=6001
103
60
86
There was a small increase in the proportion of drivers at least sometimes sending text messages or e-mails when driving since 2010 When asked the frequency of sending text messages or eshymails while driving 6 of respondents in 2010 10 of respondents in 2012 and 9 in 2015 reported at least sometimes sending texts or e-mails while driving
Figure 11-2 Do You Send Text Messages or E-Mails While Driving ( at Least Sometimes)
2010 ndash Q5F 2012 ndash Q4F Irsquom going to read a list of activities and for each Irsquod like you to tell me how often YOU do each while driving For each please tell me if you do the activity on all driving trips on most driving trips on some driving trips rarely or never How often do you send text messages or e-mails 2015 - Q4f Irsquom going to read a list of common activities people do while driving For each activity Irsquod like you to tell me how often YOU do each while driving For each please tell me if you do the activity always almost always sometimes rarely or never How often do you send text messages or e-mails Base All respondents Unweighted N=See Figure
113
2010 (N=510) 2012 (N=838) 2015 (N=799)
100
80 710
674 644
60
40 311
266 246
20
51 39 31
0 Increased Decreased Stayed the Same
Respondents who said they at least rarely use their cell phones for text messaging were asked if the frequency with which they send and receive text messages or e-mails in the past 30 days had changed In all three surveys most respondents reported that the rate at which they send electronic messages had stayed the same This rate has slightly increased over the years (64 in 2010 67 in 2012 and 71 in 2015) In 2010 31 of respondents reported a decrease in the rate at which they send electronic messages compared to 27 and 25 respectively in 2012 and 2015 The percentage of respondents who reported an increase was 4 in 2010 5 in 2012 and 3 in 2015
Figure 11-3 Has Your Frequency of Sending and Receiving Text Messages or E-Mails
While Driving Increased Decreased or Stayed the Same
2010 ndash Q19b In the past 30 days has the frequency with which you send and receive text messages or e-mails while driving increased decreased or stayed the same 2012 ndash Q15b In the past 30 days has the frequency with which you send and receive text messages or e-mails while driving increased decreased or stayed the same 2015 ndash Q16 In the past 30 days has the frequency with which you send and receive text messages or e-mails while driving increased decreased or stayed the same Base Respondents who have ever sent or received a text message or e-mail while driving Unweighted N=See Figure
114
2010 (N=153) 2012 (N=230) 2015 (N=191)
50
40 377
322
30 263
20
10 76 64 67 38 39
11 04 09 08 03 06 16
0 Increased Law that Dont Want Was in a Influence Awareness Bans Cell to Get a Crash Pressure of Safety Phone Use Ticket From Others
In all three surveys respondents who reported sending or receiving fewer electronic messages while driving in the past 30 days were asked what caused this decrease The most common answer from respondents in all three surveys was an increased awareness of safety (32 in 2010 38 in 2012 and 26 in 2015) followed by a law that bans cell phone use (6 in 2010 8 in 2012 and 4 in 2015) Influence of others increased from 1 in 2010 to 7 in 2012 but it declined to 2 in 2015
Figure 11-4 Reasons for Decrease in Sending and Receiving Text Messages While Driving
2010 ndash Q19c What caused the frequency with which you send and receive text messages or e-mails while driving to decrease 2012 ndash Q15c What caused the frequency with which you send and receive text messages or e-mails while driving to decrease 2015 ndash Q16a Why did your frequency of sending and receiving text messages or e-mails while driving decrease Base Respondents who report a decrease in the frequency with which they send or receive text messages or e-mails while driving in the last 30 days Unweighted N=See Figure
115
2010 (N=5907) 2012 (N=6016) 2015 (N=6001)
100
80
60
40
20
0
401 465
231 234
117 100
08 09 13 09 07 14
Talking on a Talking on a Reading Text Sending Text Cell Phone While Cell Phone With a Messages Messages Holding the Phone Hands‐Free Device or Emails or Emails
Each respondent was asked to judge how safe they would feel as a passenger if their driver was involved in a variety of situations The proportion of respondents who said they would feel safe if their drivers were talking on a handheld cell phone while driving has decreased considerably between 2010 and 2015 In 2010 nearly one quarter of respondents (23) said they would feel safe in this situation while only 12 of respondents in 2012 and 10 of respondents in 2015 said they would feel safe if the driver was engaged in a phone conversation while holding their cell phone Conversely the proportion of respondents who would feel safe in a car operated by a driver using a hands-free device has increased over the years Nearly one half of respondents in 2015 (47) would feel safe if their drivers were using a hands-free device to make or answer a phone call while driving compared to 40 of respondents in 2012 and 23 of respondents in 2010 The proportion of respondents who said they would feel safe if their drivers were reading or sending text messages while driving hasnrsquot changed over the past 5 years
Figure 11-5 Perceived Safety as a Passenger ( Safe)
2010 - Q18 Now Irsquom going to read a list of things people sometimes do while driving Tell me how safe you would feel if you were a passenger riding in a car while your driver was doing the following 20122015 - Q14Q11 Now Irsquom going to read a list of things people sometimes do while driving Tell me how safe you would feel if you were a passenger riding in a car while your driver was doing the following For each please tell me if you would feel very unsafe somewhat unsafe a little less safe or safe ndash no problem ndash would not pay any more attention Base All respondents Unweighted N=See Figure
116
2010 (N=5907) 2012 (N=6016) 2015 (N=6001)
640
890
664
867
666
875
0
20
40
60
80
100
Driver is Talking on a Cell Phone Driver is Sending Text Messages or Emails
In all three surveys most respondents reported that they would be very or somewhat likely to say something if their drivers were sending messages or talking on a handheld cell phone while driving Across all 3 years nearly 9 in 10 respondents would be very likely or somewhat likely to do or say something to the driver if their drivers were sending text messages or e-mails In 2015 respondents (67) were slightly more likely to say that they would intervene if their drivers were talking on the phone while driving than were respondents (64) in 2010
Figure 11-6 Likelihood of Intervening if Driver Is Using a Cell Phone While Driving
201020122015 ndash Q31bxQ14bQ12 How likely are you to do or say something to your driver if theyrsquore TALKING on a handheld cell phone while driving 20102012015 ndash Q31Q14cQ13 How likely are you to do or say something to your driver if theyrsquore SENDING MESSAGES while driving Base All respondents Unweighted N=See Figure
117
2010 (N=5907) 2012 (N=6016) 2015 (N=6001)
677
930
739
935
735
917
0
20
40
60
80
100
Support a Law Banning Talking on Hand‐ Support a Law Banning Texting or Held Cell Phone While Driving Emailing While Driving
The three surveys asked respondents if they support a law banning talking on a handheld cell phone while driving Support for such laws increased slightly from 2010 (68) to 2012 and 2015 (74) In all three surveys an overwhelming majority of respondents supported laws banning texting or e-mailing while driving with 93 of respondents in 2010 94 in 2012 and 92 in 2015 supporting such laws
Figure 11-7
Do You Support a Law Banning Talking on a Handheld Cell Phone While Driving or a Law Banning Texting or E-Mailing While Driving ( Yes)
201020122015 ndash Q21Q17Q19 Do you support a State law banning talking on a handheld cell phone while driving 201020122015 ndash Q21bQ17bQ19b Do you support a State law banning texting or e-mailing while driving Base All respondents Unweighted N=See Figure
118
2010 2012 2015
100
80
60
40
20
0
470 490 523 530 535 558
Talking on a Hand‐Held Cell Phone Sending Text Messages
Those who reported living in a State that bans talking on a handheld cell phone andor sending text messages while driving were further asked how likely one would be to get ticketed for such infractions Figure 11-8 shows the perceptions of enforcement for infractions related to talking on a handheld cell phone and textinge-mailing while driving More than half of the respondents in 2012 and 2015 said they were very likely or somewhat likely to be ticketed if they used a handheld phone or texted or e-mailed while driving
Figure 11-8 Likelihood of Ticket for Using Cell Phone While Driving
( VerySomewhat Likely)
201020122015 ndash Q20bQ16aQ17a Assume that over the next 6 months someone frequently talks on a handheld cell phone while driving How likely do you think that person would be to receive a ticket for taking on a cell phone while driving 2010 - Unweighted N=1760 2012 - Unweighted N=4158 2015 ndash Unweighted N=4383 Base Respondents that report living in a State that bans talking on a handheld cell phone while driving 201020122015 ndash Q20fQ16cQ17b Assume that over the next 6 months someone frequently sends text messages or e-mails or [uses apps] while driving How likely do you think that person would be to receive a ticket for talking on a cell phone while driving Base Respondents that report living in a State that bans sending text messages and e-mails while driving 2010 - Unweighted N=2400 2012 - Unweighted N=5173 2015 ndash Unweighted N=5458
119
2010 (N=5907) 2012 (N=6016) 2015 (N=6001) 100
80 707
631 596
60
40
20
36 02 03
0
Stopped for Using Hand‐Held Cell Saw a Message in Past 30 Days Phone
In all three surveys the respondents were asked whether they had been stopped by police for using a cell phone while driving and whether they had seen or heard an educational message that discourages cell-phone-related distracted driving in the past month In both 2010 and 2012 fewer than 1 of respondents reported being stopped by police in the past 30 days for using a handheld cell phone while driving In 2015 nearly 4 of respondents reported having been stopped by the police for using a handheld phone while driving
There was a steady increase over the three surveys of the proportion of respondents who had seen a message in the past 30 days that discourages drivers from talking on phones or sending electronic messages while driving including 60 of respondents in 2010 63 in 2012 and 71 in 2015
Figure 11-9
Was Respondent Stopped by Police for Using a Handheld Cell Phone While Driving Percentage of Respondents Exposed to Messages Discouraging Distracted Driving -
Past 30 Days ( Yes)
20102012 ndash Q22bQ18b Were you personally stopped by police for using a handheld cell phone while driving in the past 30 days 2015 ndash Q20 Have you ever been personally stopped by the police for using a handheld cell phone while driving 201020122015 ndash Q23Q19Q21 Now I would like to ask you a few questions about educational or other types of activities In the past 30 days have you seen or heard any messages that encourage people not to talk on phones or send electronic messages while driving This could be public service announcements on TV messages on the radio signs on the road news stories or something else Base All respondents Unweighted N=See Figure
120
2010 2012 2015 50
40
30
20
10
0
136 134 123
60 40
134
Had a CrashNear‐Crash Was Talking on The Phone Sending Text Messages
The proportion of respondents involved in a crash or near-crash as a driver has decreased slightly between 2010 and 2015 In 2010 14 of respondents indicated they had been involved in a crash or near-crash in the past year compared to 12 of respondents in 2015 Although the proportion of respondents involved in a crash or near-crash has decreased over the past 6 years 2015 respondents (13) were three times as likely as 2012 respondents (4) and twice as likely as 2010 respondents (6) to state they were talking on the phone or sending or reading text messages or e-mails at the time of the crash or near-crash
Figure 11-10 Exposure to Distracted Driving Crash
201020122015 ndash Q25Q21Q23 Have you been involved in a crash or near-crash as a driver in the past year Base All respondents 2010 - Unweighted N=5907 2012 - Unweighted N=6016 2015 ndash Unweighted N=6001 20102012 ndash Q25aQ21a Were you using a cell phone at the time of the last crashnear-crash you were in 2015 ndash Q23ab Were you distracted at the time of the last crashnear-crash you were in How were you distracted at the time of the crashnear-crash Base Had a crash in the past year 2010 - Unweighted N=718 2012 - Unweighted N=805 2015 ndash Unweighted N=720
121
CONCLUSION
The 2015 National Survey on Distracted Driving Attitudes and Behaviors is the third in a series of national studies conducted by NHTSA to assess the attitudes and behaviors toward distracted driving in the United States and to increase the understanding of this behavior to inform the development of effective countermeasures and interventions Telephone interviews were conducted with 6001 drivers across the United States and the responses were weighted to represent the driving population of the United States
Overall 90 of respondents own cell phones Cell phone use while driving is widespread Forty-two percent of drivers answer their cell phones at least some of the time when driving and 56 of surveyed drivers continue to drive as they engage in the phone conversation One-third of drivers (34) are willing to make phone calls at least some of the time when driving Of these drivers many have to take their eyes off the road at least momentarily to initiate the call because 29 of them enter the phone number manually and 33 scroll through saved numbers to make a selection
A large portion of drivers do not believe that their driving performance is affected by cell phone use More than half (53) of drivers who talk on cell phones while driving believe that there is no difference in their driving while on versus off the cell phone On the other hand some drivers do notice deterioration in their driving performance Twelve percent state that they tend to drive more slowly when using cell phones 20 say that they are more distracted and not as aware and 1 say that they drift out of their lane or drive erratically (1) Interestingly 4 of drivers believe that they are more focused and pay more attention to driving when they are on the phone
Respondentsrsquo perceptions of the safety of cell phone-distracted driving are different when they are not drivers but rather passengers in a car driven by someone who is talking on a cell phone Overall 65 of respondents would feel very or somewhat unsafe if their drivers were talking on a handheld cell phone while driving Distraction-averse people (56) were much more likely to feel very unsafe than the distraction-prone people (22) in this driving situation Two-thirds (67) of respondents stated that they would be very or somewhat likely to do or say something to the driver if heshe was talking on a cell phone
Sending text messages or e-mails is not as widespread among drivers as talking on the cell phone while driving Four out of 5 (80) respondents stated that they never send text messages or eshymails while driving while 9 reported that they send text messages at least sometimes and 11 reported that they rarely do Of drivers who do send electronic messages 44 stated that they wait until they reach a stop light or stop sign to send the text message and 14 continue to drive while they write the message One-third of drivers (31) who send text messages or e-mails while driving believe that there is no difference in their driving compared to times when they are not texting However 34 reported they are distracted and not as aware 13 reported that they drive more slowly and 4 reported that they tend to drift out of their lane of travel
A large majority of respondents reported that they would feel very unsafe if their drivers were sending e-mails or text messages (86) or reading e-mails or text messages (81) Overall 87
122
of respondents indicated that they were at least somewhat likely to intervene if they were passengers in a vehicle in which the driver was sending text messages or e-mails
About 1 in 12 respondents (8) stated they used apps at least sometimes while driving not including navigation apps Musicradio apps (eg Pandora) (42) Facebook (13) and Internet search engines (eg Chrome Safari) (7) were the most frequently cited apps Respondents said that they were more likely to use a smartphone app while driving when they are in need of directions or other information (23) for musicentertainment (14) or when they are bored (13)
Few respondents reported involvement in crashes or near-crashes in the past year In all 7 of drivers reported a crash and 5 reported a near-crash in the past year Of these events 14 of drivers were distracted when the crash or near-crash occurred Distraction-prone drivers (18) were twice as likely as distraction-averse drivers (9) to say they were distracted at the time of their last crash or near-crash
Respondents perceived distracted driving behaviors like talking on a cell phone while driving to be fairly prevalent with 69 of respondents estimating that more than half of drivers talk on the cell phone at least occasionally However respondents perceived texting while driving to be a less frequent occurrence with 48 of respondents estimating that more than half of drivers send electronic messages at least occasionally while driving
The majority of respondents support laws banning talking on handheld cell phones and texting or e-mailing while driving Almost three-quarters of respondents (74) support a ban on cell phone use while driving and 92 support a law banning texting or e-mailing while driving Distraction-averse drivers were more likely to support a State law banning talking on a handheld cell (82) while distraction-prone drivers were more likely to oppose such law (36)
Respondents are generally aware of laws that ban talking on cell phones or texting while driving in their State when the State in which the respondent is located has a law but respondent perceptions are less accurate when asked about such laws when there is no such law in the State In States with laws that ban handheld cell phone use while driving 83 of drivers were aware of the law and an additional 9 thought their State probably had such a law while only 4 incorrectly thought their State did not have such a law In States without laws that ban talking on cell phones while driving 39 knew that their State did not have such a law while 29 incorrectly thought that their State had such a law and an additional 12 thought the State probably had such a law when it did not
In States that ban sending or reading text messages and e-mails while driving 64 of drivers knew about the law and an additional 14 thought the State probably had such a law while only 8 incorrectly thought their State did not have such a law In States without laws that ban sending and receiving text messages and e-mails while driving 29 were aware that their State did not have such a law while 33 incorrectly thought that their State had a law and an additional 14 thought the State probably had such a law when it did not
123
Although 14 States and the District of Columbia have laws banning the use of handheld cell phones while driving most respondents who reside in these States were not aware of any special enforcement efforts and respondents were about equally split on whether offenders of the law will be ticketed
Overall 54 of respondents thought a driver who regularly talks on a cell phone while driving was likely to get a ticket in the next 6 months while 43 stated that it was unlikely that the driver would be ticketed Drivers with less formal education were more likely to believe that the driver would be ticketed while those with more formal education were more likely to believe that the driver would not be ticketed
More than half of respondents (56) believed that it was at least somewhat likely that drivers who frequently send text messages or e-mails while driving would get a ticket for this infraction in the next 6 months 42 think it is somewhat or very unlikely
Safe driving messages are reaching drivers with 71 reporting that they had seen or heard a message discouraging distracted driving in the past 30 days Drivers who drove every day were more likely than those who drove less frequently to report having seen or heard these messages The media sources for these messages were TV reported as the source by 68 of respondents billboards as reported by 36 of respondents and radio as reported by 26 of respondents
Although 94 of respondents reported having heard or seen at least one safe driving slogan in the past 30 days most of the messages associated with cell phone distracted driving are reaching far fewer drivers Approximately 51 of respondents reported hearing or seeing ldquoit can waitrdquo while just over a quarter of drivers have heard ldquoU Drive U Text U Payrdquo (28) or ldquoOne Text or Call Could Wreck It Allrdquo (28) About 1 in 5 drivers have heard ldquoNo Phone Zonerdquo (22) ldquoOn the Road Off the Phonerdquo (19) and ldquoPut It Downrdquo (18) in the past 30 days
The percentage of drivers who send text messages while driving has remained the same over the years with 1 of respondents reporting they always send text messages or emails and 1-2 say they always read their texts while driving
The proportion of respondents who said they would feel safe if their drivers were talking on a handheld cell phone while driving has decreased considerably between 2010 and 2015 from 23 in 2010 to 10 in 2015 Conversely the proportion of respondents who would feel safe in a car operated by a driver using a hands-free device has increased over the years Nearly one half of respondents in 2015 (47) would feel safe if their drivers were using a hands-free device to make or answer a phone call while driving compared to 40 of respondents in 2012 and 23 of respondents in 2010
Support for laws banning handheld cell phone use increased from 68 in 2010 to 74 in 2012 and stayed the same (74) in 2015 Support for laws banning texting or e-mailing while driving has remained about the same over the 6-year period with 93 of respondents in 2010 some 94 of respondents in 2012 and 92 of respondents in 2015 supporting such a law
124
There was a significant increase in the proportion of respondents reporting that they had been stopped by police for talking on a cell phone from 2010 to 2015 with less than 1 of respondents in 2010 (02) and 2012 (03) and 4 of respondents in 2015
Finally although the proportion of respondents involved in a crash or near-crash has decreased slightly between 2010 and 2015 cell-phone-related motor vehicle crashes have increased considerably over the past 5 years The proportion of respondents stating that they were talking on the phone sending or reading text messages or e-mails at the time of the crash has doubled between 2012 (6) and 2015 (13)
125
Appendix A
Questionnaire
A‐1
5939 NHTSA Distracted Driving Abt SRBI V111
2015 National Survey of Distracted Driving Attitudes and Behaviors Questionnaire
Sample Read-ins State [sampstat] Metro Status Telephone number
INTRODUCTION ndash SCREENING QUESTIONS
QLAN WHICH LANGUAGE INTERVIEW CONDUCTED IN
1 English 2 Spanish
5939C CELL SAMPLE SC1 Hello I am _____ calling on behalf of the US Department of Transportation We are conducting a national study of Americans driving habits and attitudes
[IF NEEDED Any answers you give are kept strictly private A federal agency may not conduct or sponsor and a person is not required to respond to nor shall a person be subject to a penalty for failure to comply with a collection of information subject to the requirements of the Paperwork Reduction Act unless that collection of information displays a current valid OMB Control Number The OMB number for this solicitation is 2127-0665 and it expires on November 30 2017]
Are you currently driving 1 Yes THANK amp END CALLBACK 2 No 9 Refused THANK AND END
SC1a Are you in a safe and suitable place to talk right now 1 Yes 2 No call me later SCHEDULE CALLBACK 3 No CB on land-line RECORD NUMBER schedule call back 4 Cell phone for business only THANK amp END - BUSINESS 9 Refused THANK AND END
A‐2
SC2 As I mentioned I am calling on behalf of the Department of Transportation This collection of information is VOLUNTARY and will be used for statistical purposes only so that we may develop and evaluate programs designed to reduce the number of traffic-related injuries and deaths The interview will take approximately 20 minutes Your participation is anonymous and we will not collect any personal information that would allow anyone to identify you Are you 16 years old or older
[IF NEEDED If you would like to learn more about the survey you can call our toll-free number at 1-800shy244-4135 or visit the DOT website at wwwdistractiongov The OMB number for this solicitation is 2127shy0665 and it expires on November 30 2017]
1 Yes 2 Yes no time SCHEDULE CALLBACK 3 No SCREEN OUT 9 Refused THANK AND END
Qualified Level 1
SC2a How many people 16 and older live in your household [ENTER NUMBER 1-10] 10 10 or more 98 NONE SCREEN OUT SKIP TO SCR1 99 Donrsquot knowRefused THANK AND END
SC3Not counting (thisthese) cell phone(s) do you also have a regular landline phone at home 1 Cell is only phone SKIP TO SA3 2 Has regular phone at home 9 Donrsquot knowRefused THANK AND END
SC4Of all the telephone calls that you or your family receives are READ LIST 1 All or almost all calls received on cell phones 2 Some received on cell phones and some on regular phones (SCRN OUT NOT CELL MOSTLY) SKIP TO SCR1 3 Very few or none on cell phones (SCRN OUT NOT CELL MOSTLY) SKIP TO SCR1 8 (VOL) Donrsquot know (SCRN OUT NOT CELL MOSTLY) SKIP TO SCR1 9 (VOL) Refused (SCRN OUT NOT CELL MOSTLY) SKIP TO SCR1
SC5 Thinking about just your LANDLINE home phone NOT your cell phone if that telephone rang when someone was home under normal circumstances how likely is it that the phone would be answered Would you say it is hellip READ LIST 1Very likely the landline phone would be answered 2 Somewhat likely 3 Somewhat unlikely 4 Very Unlikely or 5 Not at all likely the landline phone would be answered 8 (VOL) Donrsquot know 9 (VOL) Refused
A‐3
5939L LANDLINE SAMPLE SL1 Hello I am _____ calling on behalf of the US Department of Transportation We are conducting a national study of Americans driving habits and attitudes This collection of information is VOLUNTARY and will be used for statistical purposes only so that we may develop and evaluate programs designed to reduce the number of traffic-related injuries and deaths The interview will take approximately 20 minutes Your participation is anonymous and we will not collect any personal information that would allow anyone to identify you
[IF NEEDED If you would like to learn more about the survey you can call our toll-free number at 800shy244-4135 or visit the DOT website at wwwdistractiongov A federal agency may not conduct or sponsor and a person is not required to respond to nor shall a person be subject to a penalty for failure to comply with a collection of information subject to the requirements of the Paperwork Reduction Act unless that collection of information displays a current valid OMB Control Number The OMB number for this solicitation is 2127-0665 and it expires on November 30 2017]
How many people 16 and older live in this household [ENTER NUMBER 1-10] 10 10 or more 98 NONE SCREEN OUT 99 Donrsquot knowRefused THANK AND END
Qualified Level 1
ASK IF SL1=1 SL1a May I speak with that person
1 Rspn on line SKIP TO SA3 2 Rspn called to phone GO TO SL1c 3 Rspn unavailable SCHEDULE CALLBACK 9 Refused THANK AND END
ASK IF SL1gt1 SL1b In order to select just one person to interview may I please speak to the person in your household 16 or older who (RANDOMIZE has had the most recentwill have the next) birthday
1 Rspn on line GO TO SA3 2 Rspn called to phone 3 Rspn unavailable SCHEDULE CALLBACK 9 Refused THANK AND END
A‐4
SL1c Hello I am _____ calling on behalf of the US Department of Transportation We are conducting a national study of Americans driving habits and attitudes This collection of information is VOLUNTARY and will be used for statistical purposes only so that we may develop and evaluate programs designed to reduce the number of traffic-related injuries and deaths The interview will take approximately 20 minutes Your participation is anonymous and we will not collect any personal information that would allow anyone to identify you
[IF NEEDED If you would like to learn more about the survey you can call our toll-free number at 1-800shy244-4135 or visit the DOT website at wwwdistractiongov A federal agency may not conduct or sponsor and a person is not required to respond to nor shall a person be subject to a penalty for failure to comply with a collection of information subject to the requirements of the Paperwork Reduction Act unless that collection of information displays a current valid OMB Control Number The OMB number for this solicitation is 2127-0665 and it expires on November 30 2017]
Could I please confirm that you are a household member 16 or older 1 Yes 2 No 9 Refused
SCHEDULE CALLBACK THANK AND END ndash Soft Refusal
SKIP TO SA3
A‐5
5939O LANDLINE OVERSAMPLE SO1 Hello I am _____ calling on behalf of the US Department of Transportation We are conducting a national study of Americans driving habits and attitudes This collection of information is VOLUNTARY and will be used for statistical purposes only so that we may develop and evaluate programs designed to reduce the number of traffic-related injuries and deaths The interview will take approximately 20 minutes Your participation is anonymous and we will not collect any personal information that would allow anyone to identify you
[IF NEEDED If you would like to learn more about the survey you can call our toll-free number at 1-800shy244-4135 or visit the DOT website at wwwdistractiongov A federal agency may not conduct or sponsor and a person is not required to respond to nor shall a person be subject to a penalty for failure to comply with a collection of information subject to the requirements of the Paperwork Reduction Act unless that collection of information displays a current valid OMB Control Number The OMB number for this solicitation is 2127-0665 and it expires on November 30 2017]
How many people 16 to 34 live in this household [ENTER NUMBER 1-10] 10 10 or more 98 NONE SCREEN OUT 99Donrsquot knowRefused THANK AND END
Qualified Level 1
ASK IF SO1=1 SO1a May I speak with that person 1 Rspn on line SKIP TO SA3 2 Rspn called to phone GO TO SO1c 3 Rspn unavailable SCHEDULE CALLBACK 9 Refused THANK AND END
ASK IF SO1gt1 SO1b In order to select just one person to interview may I please speak to the person in your household 16 to 34 who (has had the most recentwill have the next) birthday 1 Rspn on line GO TO SA3 2 Rspn called to phone 3 Rspn unavailable SCHEDULE CALLBACK 9 Refused THANK AND END
A‐6
SO1c SO1d Hello I am _____ calling on behalf of the US Department of Transportation We are conducting a national study of Americans driving habits and attitudes This collection of information is VOLUNTARY and will be used for statistical purposes only so that we may develop and evaluate programs designed to reduce the number of traffic-related injuries and deaths The interview will take approximately 20 minutes Your participation is anonymous and we will not collect any personal information that would allow anyone to identify you
[IF NEEDED If you would like to learn more about the survey you can call our toll-free number at 1-800shy244-4135 or visit the DOT website at wwwdistractiongov A federal agency may not conduct or sponsor and a person is not required to respond to nor shall a person be subject to a penalty for failure to comply with a collection of information subject to the requirements of the Paperwork Reduction Act unless that collection of information displays a current valid OMB Control Number The OMB number for this solicitation is 2127-0665 and it expires on November 30 2017]
Could I please confirm that you are a household member 16 to 34 1 Yes 2 No SCHEDULE CALLBACK 9 Refused THANK AND END
SA3 Record gender from observation (Ask only if Necessary) 1 Male 2 Female
Qualified Level 2
GENERAL DRIVING INFORMATION
Q1 How often do you drive a motor vehicle regardless of whether it is for work or for personal use Every day almost every day a few days a week a few days a month a few days a year or do you never drive DO NOT READ LIST
1 Every day 2 Almost every day 3 Few days a week 4 Few days a month 5 Few days a year 6 Never SKIP TO D1 [SCREEN OUT ndash DEMOS ONLY] 7 (VOL) Other (SPECIFY) 8 (VOL) Donrsquot know SKIP TO D1 [SCREEN OUT ndash DEMOS ONLY] 9 (VOL) Refused SKIP TO D1 [SCREEN OUT ndash DEMOS ONLY]
A‐7
Q1a Is the vehicle you drive most often a car van motorcycle sport utility vehicle pickup truck or other type of truck [NOTE IF RESPONDENT DRIVES MORE THAN ONE VEHICLE OFTEN ASK] ldquoWhat kind of vehicle did you LAST driverdquo
1 Car 2 Van or minivan 3 Motorcycle 4 Pickup truck 5 Sport Utility Vehicle 6 Other truck (SPECIFY) 7 (VOL) Other (SPECIFY) 8 (VOL) Donrsquot know 9 (VOL) Refused
Q1bWhat model year is that vehicle RECORD 4 DIGIT YEAR [Range 1900-2015] 9998=Donrsquot Know 9999=Refused
PERCEPTIONS OF ENFORCEMENT
Q2 When you pass a driver stopped by the police IN THE DAYTIME what do you think the stop was most likely for DO NOT READ LIST MULTIPLE RECORD
1 Speeding 2 Seat Belt Violation 3 Drunk Driving 4 Reckless Driving 5 Cell phone use 6 Texting or sending e-mails while driving 7 Registration Violation 8 Other (SPECIFY) 98 (VOL) Donrsquot know 99 (VOL) Refused
Q2aWhen you pass a driver stopped by the police IN THE NIGHTTIME what do you think the stop was for DO NOT READ LIST MULTIPLE RECORD
1 Speeding 2 Seat Belt Violation 3 Drunk Driving 4 Reckless Driving 5 Cell phone use 6 Texting or sending e-mails while driving 7 Registration Violation 8 Other (SPECIFY) 98 (VOL) Donrsquot know 99 (VOL) Refused
A‐8
OWNERSHIP OF MOBILE ELECTRONICS
Q3 Do you CURRENTLY own any of the following devices READ A-G AND CODE FOR EACH A A cell phone [Code 1 (Yes) if mentions any cell phone including a smartphone] B A lsquosmartphonersquo such as a Droid iPhone or Blackberry C A portable music player such as a CD player or iPod apart from a smartphone D A portable navigation system such as TomTom or Garmin apart from a smartphone E A navigation system built into the vehicle such as OnStar or Sync F [ASK IF 3A OR 3B=1] A Bluetooth or other hands-free device for your cell phone such as one that plugs into the phone works wirelessly or works through your vehiclersquos car stereo
1 Yes 2 No 3 MixedShared Use 8 (VOL) Donrsquot know 9 (VOL) Refused
ASK IF Q3F=1 Q3a1 Is the vehicle that you drive most often equipped with built-in hands-free Bluetooth capability
1 Yes 2 No SKIP TO Q4 8 (VOL) Donrsquot know SKIP TO Q4 9 (VOL) Refused SKIP TO Q4
Q3a2 Have you paired or ldquoconnectedrdquo your phone with the vehicle via Bluetooth 1 Yes 2 No 8 (VOL) Donrsquot know 9 (VOL) Refused
A‐9
FREQUENCY OF DISTRACTED DRIVING
Q4 Irsquom going to read a list of common activities people do while driving For each activity Irsquod like you to tell me how often YOU do each while driving For each please tell me if you do the activity always almost always sometimes rarely or never How often do youhellip READ A-O AND CODE FOR EACH A Talk to passengers in the vehicle B Eat or drink C Make phone calls D Answer phone calls E READ text or e-mail messages F SEND text or e-mail messages G Talk or interact with children in the vehicle H Use a portable music player including a smartphone with external speakers or with the carrsquos speakers I Adjust the car radio J Change CDs DVDs or tapes K Use a Smartphone for driving directions L Use a navigation system for driving directions M Take pictures with your phone N Use smartphone apps not including a navigation app O Look up information on the Internet
1 Always 2 Almost always 3 Sometimes 4 Rarely 5 Never 8 (VOL) Donrsquot know 9 (VOL) Refuse
ANSWERING AND MAKING CELL PHONE CALLS WHILE DRIVING
ASK Q5 IF Q3a=1 OR Q3b=1 Q5 When not in use where do you put your cell phone while driving DO NOT READ LIST MULTIPLE RECORD
1 Pocket or Purse 2 Cup holder or tray 3 Lap 4 Passenger seat 5 Mount on dashboard 6 In hand 7 Backseat 8 Glove box 9 Built-in enclosed storage space (other than glove box) 10 Other (specify) 98 (VOL) Donrsquot know 99 (VOL) Refuse
A‐10
IF Q4C=5 AND Q4D=5 SKIP TO Q8 Q5a Which of the following do you USUALLY do when making or receiving a call while driving MULTIPLE RECORD
1 Hold the phone in your hand 2 Squeeze the phone between your ear and shoulder 3 Use a hands-free earpiece 4 Use a built-in-car system (OnStar Sync built-in Bluetooth) 5 Use the cell phonersquos speakerphone feature 6 Does it vary 8 (VOL) Donrsquot know 9 (VOL) Refuse
IF Q4D=5 SKIP TO Q6 Q5b What are the reasons you are more likely to ANSWER a call while driving DO NOT READ LIST MULTIPLE RECORD
1 Who is calling 2 How important I think the call is 3 Call is work-related 4 I answer all calls 5 Call is from someone I know 6 Call is personal or social 7 Call is routine or expected 8 Urgentemergency situation 9 Non-stressful traffic conditions 10 Bluetooth or hands-free available 11 Availability of the phone 12 In need of directions or other information 13 Call is unexpected 14 Personal safety 15 Boredom 16 Traveling at a low speed 17 Call is from a number I donrsquot recognize 18 Time of day 19 Good weather conditions 20 Tired (talking keeps me awake) 21 If State law allows 22 No police officers in sight 23 Other (SPECIFY) 98 (VOL) Donrsquot know 99 (VOL) Refuse
Q5c When you answer a call while driving do you USUALLYhellip READ LIST
1 Answer and continue to drive while completing the conversation 2 Answer and promptly pull over to a safe location 3 Answer and inform the caller you will call back later 4 Pull over to a safe location first and then speak to the caller 5 Hand the phone to a passenger to answer if you have one 7 (VOL) I donrsquot answer calls while driving 8 (VOL) Donrsquot know 9 (VOL) Refuse
A‐11
IF Q4C=5 SKIP TO Q7 Q6 What are the reasons you are more likely to MAKE a call while driving DO NOT READ LIST MULTIPLE RECORD
1 How importanturgent I think the call is 2 Work-related 3 Personal or social 4 In need of directions or other information 5 Who Irsquom calling 6 Report a traffic crashemergency 7 Boredom 8 Report a medical emergency 9 Availability of the phone 10 Non-stressful traffic conditions 11 Personal Safety 12 I think itrsquos safe to call 13 Time of day 14 Traveling at a low speed 15 Tired (talking keeps me awake) 16 Good weather conditions 17 No police officers in sight 18 If State law permits 19 Other (SPECIFY) 98 (VOL) Donrsquot know 99 (VOL) Refuse
Q6a How do you MAKE a call while driving Please answer Yes or No after I read each item READ LIST MULTIPLE RECORD
1 Manual dialing 2 Voice-dial (speaking a name or phone number) 3 Speed dial or favorites 4 Scroll through saved numbers and select 5 Does it vary 8 (VOL) Donrsquot know 9 (VOL) Refuse
A‐12
Q7 How if at all would you say your driving behavior is different when you are TALKING on the phone DO NOT READ LIST MULTIPLE RECORD
1 No difference 2 Drive slower 3 Drift out of the lane or roadway 4 Change lanes less frequently 5 Avoid changing lanes altogether 6 Drive faster 7 Look in your rear or side view mirrors more frequently 8 Apply the brakes suddenly 9 Look in your rear or side view mirrors less frequently 10 Increase distance from lead vehicle 11 Follow lead vehicle more closely 12 Change lanes more frequently 13 Use turn signal less regularly 14 Use turn signal more regularly 15 Other [SPECIFY] 98 (VOL) Donrsquot Know 99 (VOL) Refused
Q7a How if at all does TALKING on the phone change your behavior IN THE VEHICLE READ LIST MULTIPLE RECORD
1 Turn the radiomusic down 2 Ask others in the vehicle to be quiet 3 Put down food or drink 4 Drive with one hand on the wheel 5 Drive with only your knee on the wheel 6 Some other way (OTHER SPECIFY) 7 (VOL) No differencemy behavior doesnrsquot change 8 (VOL) Donrsquot Know 9 (VOL) Refused
A‐13
Q7b Is there any driving situation in which you would NEVER TALK on a phone while driving DO NOT READ MULTIPLE RECORD
1 When moving (not at stop signs or stop lights) 2 On long trips 3 On short trips 4 Fast moving traffic (freeway) 5 Bumper to bumper traffic 6 On an empty roadway 7 Merging with traffic 8 Bad weather 9 Driving a familiar route 10 Driving in unfamiliar arearoads 11 Driving at nighttime 12 Marked school zones 13 Residential streets 14 Parking lots 15 With other adult passengers in the car 16 With a baby or child on board 17 Windingcurving roads 18 Marked construction zones 19 When I see a police officer 20 When driving in a place where it is prohibited 21 Other [SPECIFY] 98 (VOL) Donrsquot Know 99 (VOL) Refused
TEXTING OR E-MAILING WHILE DRIVING
IF Q4F=5 SKIP TO Q9 Q8 When you SEND a text message or e-mail while driving do you USUALLYhellip READ LIST
1 Continue to drive while completing the message 2 Pull over to a safe location to send the message 3 Hand the phone to a passenger to do your messaging 4 Use a Voice Command feature (speech dictation) 5 Wait until you reach a red light or stop sign to send the message 7 (VOL) I do not send text messages or e-mail while driving 8 (VOL) Donrsquot know 9 (VOL) Refuse
A‐14
Q8a What makes it more likely you will SEND a text message or e-mail while driving DO NOT READ LIST MULTIPLE RECORD
1 How important I think the message is 2 Who Irsquom messaging 3 Work-related 4 Personal or social 5 In need of directions or other information 6 Non-stressful traffic conditions 7 Boredom 8 Time of day 9 I think itrsquos safe to send a text message or an e-mail 10 Personal Safety 11 Report a traffic crashemergency 12 Traveling at a low speed 13 Report a medical emergency 14 Good weather conditions 15 If State law permits 16 If no police officers are in sight 17 Other (SPECIFY) 98 (VOL) Donrsquot know 99 (VOL) Refuse
Q8b How if at all would you say your driving behavior is different when you are SENDING TEXT OR E-MAIL MESSAGES while driving DO NOT READ LIST MULTIPLE RECORD
1 No difference 2 Drive slower 3 Drift out of the lane or roadway 4 Change lanes less frequently 5 Avoid changing lanes altogether 6 Drive faster 7 Look in your rear or side view mirrors more frequently 8 Apply the brakes suddenly 9 Look in your rear or side view mirrors less frequently 10 Increase distance from lead vehicle 11 Follow lead vehicle more closely 12 Change lanes more frequently 13 Use turn signal less regularly 14 Use turn signal more regularly 15 Other [SPECIFY] 98 (VOL) Donrsquot Know 99 (VOL) Refused
A‐15
Q8c How if at all does SENDING TEXT OR E-MAIL MESSAGES while driving change your behavior IN THE VEHICLE READ LIST MULTIPLE RECORD
1 Turn the radiomusic down 2 Ask others in the vehicle to be quiet 3 Put down food or drink 4 Drive with one hand on the wheel 5 Drive with only your knee on the wheel 6 Some other way (OTHER SPECIFY) 7 (VOL) No differencemy behavior doesnrsquot change 8 (VOL) Donrsquot Know 9 (VOL) Refused
Q8d Is there any driving situation in which you would NEVER SEND a text or e-mail message while driving DO NOT READ LIST MULTIPLE RECORD
1 When moving (not at stop signs or stop lights) 2 On long trips 3 On short trips 4 Fast moving traffic (freeway) 5 Bumper to bumper traffic 6 On an empty roadway 7 Merging with traffic 8 Bad weather 9 Driving a familiar route 10 Driving in unfamiliar arearoads 11 Driving at nighttime 12 Marked school zones 13 Residential streets 14 Parking lots 15 With other adult passengers in the car 16 With a baby or child on board 17 Windingcurving roads 18 Marked construction zones 19 When I see a police officer 20 When driving in a place where it is prohibited 21 Other [SPECIFY] 98 (VOL) Donrsquot Know 99 (VOL) Refused
A‐16
USING APPS WHILE DRIVING
IF Q4N=5 SKIP TO Q10 Q9 Other than navigation apps what smartphone apps do you typically use while driving DO NOT READ LIST MULTIPLE RECORD
1 Facebook 2 Facebook Messenger 3 LinkedIn 4 Skype 5 Twitter 6 YouTube 7 Instagram 8 Pandora 9 News apps 10 Games apps 11 (VOL) Other (specify) 12 Donrsquot use SKIP TO Q10 98 (VOL) Donrsquot Know 99 (VOL) Refused
Q9a When you USE smartphone apps while driving do you USUALLYhellip READ LIST
1 Continue to drive while using the app 2 Pull over to a safe location to use the app 3 Hand the phone to a passenger to use the app 4 Use a Voice Command feature (speech dictation) 5 Wait until you reach a red light or stop sign to use the app 7 (VOL) I donrsquot use smartphone apps while driving 8 (VOL) Donrsquot know 9 (VOL) Refuse
Q9b What makes it more likely you will USE smartphone apps while driving DO NOT READ LIST MULTIPLE RECORD
1 Work-related 2 Personal or social 3 In need of directions or other information 4 Non-stressful traffic conditions 5 Boredom 6 Time of day 7 Personal Safety 8 Report a traffic crashemergency 9 Traveling at a low speed 10 Report a medical emergency 11 Good weather conditions 12 If State law permits 13 If no police officers are in sight 14 Tired (using apps keeps me awake) 15 Other (SPECIFY) 98 (VOL) Donrsquot know 99 (VOL) Refuse
A‐17
Q9c How if at all would you say your driving behavior is different when you USE smartphone apps while driving DO NOT READ LIST MULTIPLE RECORD
1 No difference 2 Drive slower 3 Drift out of the lane or roadway 4 Drive faster 5 Avoid changing lanes altogether 6 Change lanes more frequently 7 Follow lead vehicle more closely 8 Apply the brakes suddenly 9 Change lanes less frequently 10 Increase distance from lead vehicle 11 Look in your rear or side view mirrors more frequently 12 Look in your rear or side view mirrors less frequently 13 Use turn signal less regularly 14 Use turn signal more regularly 15 Other [SPECIFY] 98 (VOL) Donrsquot Know 99 (VOL) Refused
Q9d How if at all does using smartphone apps while driving change your behavior IN THE VEHICLE READ LIST MULTIPLE RECORD
1 Turn the radiomusic down 2 Ask others in the vehicle to be quiet 3 Put down food or drink 4 Drive with one hand on the wheel 5 Drive with only your knee on the wheel 6 Some other way (OTHER SPECIFY) 7 (VOL) No differencemy behavior doesnrsquot change 8 (VOL) Donrsquot Know 9 (VOL) Refused
A‐18
Q9e Is there any driving situation in which you would NEVER use smartphone apps while driving DO NOT READ LIST MULTIPLE RECORD
1 Bad weather 2 Bumper to bumper traffic 3 Fast moving traffic (freeway) 4 When moving (not at stop signs or stop lights) 5 When I see a police officer 6 Marked construction zones 7 With a baby or child on board 8 Driving in unfamiliar arearoads 9 Merging with traffic 10 Marked school zones 11 Driving at nighttime 12 With other adult passengers in the car 13 Windingcurving roads 14 Parking lots 15 On long trips 16 On short trips 17 On an empty roadway 18 Driving a familiar route 19 Residential streets 20 When driving in a place where it is prohibited 21 Other [SPECIFY] 98 (VOL) Donrsquot Know 99 (VOL) Refused
PERCEPTIONS ABOUT DANGER OF DISTRACTIONS
Q10 How many seconds do you believe a driver can take his or her eyes off the road before driving becomes significantly more dangerous
ENTER VALUE _____ 11 11 seconds or more 98 (VOL) Donrsquot know 99 (VOL) Refuse
A‐19
Q11 Now Irsquom going to read a list of things people sometimes do while driving Tell me how safe you would feel if you were a passenger riding in a car while your driver was doing the following For each please tell me if you would feel very unsafe somewhat unsafe a little less safe or safe ndash no problem ndash would not pay any more attention READ A-L AND RECORD FOR EACH
A Talking to other passengers in the vehicle B Eating or drinking C Talking on a cell phone while holding the phone D Talking on a cell phone with a hands-free device E Reading text or e-mail messages F Sending text or e-mail messages G Talking or interacting with children in the vehicle H Adjusting the car radio tape or CD player I Using a laptop computer J Manipulating a navigation system for driving directions K Use smartphone apps not including a navigation app L Watching a movie
1 Very unsafe 2 Somewhat unsafe 3 A little less safe 4 Safe no problem would not pay any more attention 8 (VOL) Donrsquot know 9 (VOL) Refuse
Q12 How likely are you to do or say something to your driver if theyrsquore TALKING on a handheld cell phone while driving READ LIST
1 Very likely 2 Somewhat likely 3 Somewhat unlikely SKIP TO Q13 4 Very unlikely SKIP TO Q13 5 Never would intervene SKIP TO Q13 8 (VOL) Donrsquot know SKIP TO Q13 9 (VOL) Refused SKIP TO Q13
Q12a What would you say (SPECIFY) PROBE Anything Else
A‐20
Q13 How likely are you to do or say something to your driver if theyrsquore SENDING TEXT MESSAGES OR E-MAILS OR USING SMARTPHONE APPS while driving READ LIST
1 Very likely 2 Somewhat likely 3 Somewhat unlikely SKIP TO Q14 4 Very unlikely SKIP TO Q14 5 Never would intervene SKIP TO Q14 8 (VOL) Donrsquot know SKIP TO Q14 9 (VOL) Refused SKIP TO Q14
Q13a What would you say (SPECIFY) PROBE Anything Else
CHANGES IN DISTRACTED DRIVING
IF Q4C=5 SKIP TO Q15
Q14 In the past 30 days has your frequency of making phone calls while driving increased decreased or stayed the same
1 Increased SKIP TO Q15 2 Decreased 3 Stayed the same SKIP TO Q15 4 New Driver SKIP TO Q15 5 Never used a phone while driving SKIP TO Q16 8 (VOL) Donrsquot know SKIP TO Q15 9 (VOL) Refuse SKIP TO Q15
Q14a Why did your frequency of making phone calls while driving decrease DO NOT READ LIST MULTIPLE RECORD
1 Increased awareness of safety 2 Law That bans cell phone use 3 Donrsquot want to get a ticket 4 Was in a crash 5 Influencepressure from others 6 More long distance driving 7 The weather 8 Driving faster 9 Other (SPECIFY) 98 (VOL) Donrsquot know 99 (VOL) Refused
A‐21
IF Q4D=5 SKIP TO Q16 Q15 In the past 30 days has your frequency of answering phone calls while driving increased decreased or stayed the same
1 Increased SKIP TO Q16 2 Decreased 3 Stayed the same SKIP TO Q16 4 New Driver SKIP TO Q16 5 Never used a phone while driving SKIP TO Q16 8 (VOL) Donrsquot know SKIP TO Q16 9 (VOL) Refuse SKIP TO Q16
Q15a Why did your frequency of answering phone calls while driving decrease DO NOT READ LIST MULTIPLE RECORD
1 Increased awareness of safety 2 Law That bans cell phone use 3 Donrsquot want to get a ticket 4 Was in a crash 5 Influencepressure from others 6 More long distance driving 7 The weather 8 Driving faster 9 Other (SPECIFY) 98 (VOL) Donrsquot know 99 (VOL) Refused
IF Q4E=5 OR Q4F=5 SKIP TO Q17
Q16 In the past 30 days has the frequency with which you send and receive text messages or e-mails while driving increased decreased or stayed the same
1 Increased SKIP TO Q17 2 Decreased 3 Stayed the same SKIP TO Q17 4 New Driver SKIP TO Q17 5 Never used a phone while driving SKIP TO Q17 8 (VOL) Donrsquot know SKIP TO Q17 9 (VOL) Refused SKIP TO Q17
Q16a Why did your frequency of sending and receiving text messages or e-mails while driving decrease DO NOT READ LIST MULTIPLE RECORD
1 Increased awareness of safety 2 Law That bans textinge-mailing 3 Donrsquot want to get a ticket 4 Was in a crash 5 Influencepressure from others 6 More long distance driving 7 The weather 8 Driving faster 9 Other (SPECIFY) 98 (VOL) Donrsquot know 99 (VOL) Refused
A‐22
DISTRACTED DRIVING LAWS
Q17 Does [SAMPSTAT] have a law banning talking on a handheld cell phone while driving DO NOT READ LIST
1 Yes 2 Yes probably 3 No SKIP TO Q18 8 (VOL) Donrsquot Know 9 (VOL) Refused SKIP TO Q18
Q17a Assume that over the next 6 months someone frequently TALKS on a handheld cell phone while driving How likely do you think that person would be to receive a ticket for talking on a cell phone while driving READ LIST
1 Very likely 2 Somewhat likely 3 Somewhat unlikely 4 Very unlikely 8 (VOL) Donrsquot know 9 (VOL) Refused
Q18 Does [SAMPSTAT] have a law banning TEXTING E-MAILING or using APPS while driving DO NOT READ LIST
1 Yes 2 Yes probably 3 No SKIP TO Q19 8 (VOL) Donrsquot Know 9 (VOL) Refused SKIP TO Q19
Q18a Assume that over the next 6 months someone frequently sends text messages or e-mails or uses apps while driving How likely do you think that person would be to receive a ticket for this behavior READ LIST
1 Very likely 2 Somewhat likely 3 Somewhat unlikely 4 Very unlikely 8 (VOL) Donrsquot know 9 (VOL) Refused
Q19 Do you support a State law banning talking on a handheld cell phone while driving 1 Yes 2 No SKIP TO Q19b 8 (VOL) Donrsquot Know 9 (VOL) Refused SKIP TO Q19b
Q19a What do you think the fine should be for talking on a handheld cell phone while driving RECORD VALUE 0 No fine 997 $997 or more 998 (VOL) Donrsquot know 999 (VOL) Refuse
A‐23
Q19b Do you support a State law banning text or e-mail messaging or using smartphone apps while driving
1 Yes 2 No SKIP TO Q20 8 (VOL) Donrsquot Know 9 (VOL) Refused SKIP TO Q20
Q19c What do you think the fine should be for sending text or e-mail messages or using smartphone apps while driving
RECORD VALUE 0 No fine 997 $997 or more 998 (VOL) Donrsquot know 999 (VOL) Refuse
PROGRAM AWARENESS
Q20 Have you ever been personally stopped by the police for using a handheld cell phone while driving 1 Yes 2 No SKIP TO Q21 8 (VOL) Donrsquot Know SKIP TO Q21 9 (VOL) Refused SKIP TO Q21
Q20a How long ago were you stopped ENTER YEARS or MONTHS
1 Gave answer in Years SKIP TO Q20a1 2 Gave answer in Months SKIP TO Q20a2 8 (VOL) Donrsquot Know SKIP TO Q20b 9 (VOL) Refused SKIP TO Q20b
Q20a1 Enter Number of Years RANGE 1-15 98 (VOL) Donrsquot know 99 (VOL) Refused
Q20a2 Enter Number of Months RANGE 1-30 98 (VOL) Donrsquot know 99 (VOL) Refused
Q20b Did you receive a ticket or warning 1 Yes - ticket for talking on a cell phone 2 Yes - warning for talking on a cell phone 3 Yes - ticket for texting or sending an e-mail 4 Yes - warning for texting or sending an e-mail 5 No 8 (VOL) Donrsquot Know 9 (VOL) Refused
A‐24
OTHER EDUCATIONAL MESSAGES
Q21 Now I would like to ask you a few questions about educational or other types of activities In the past 30 days have you seen or heard any messages that encourage people not to talk on phones or send electronic messages while driving This could be public service announcements on TV messages on the radio signs on the road news stories or something else
1 Yes 2 No SKIP TO Q22 8 (VOL) Donrsquot Know SKIP TO Q22 9 (VOL) Refused SKIP TO Q22
Q21a Where did you see or hear these messages DO NOT READ LIST MULTIPLE RECORD
1 TV - advertisementpublic service announcement 2 TV ndash news 3 TV show storyline 4 Billboardsigns 5 Radio - advertisementpublic service announcement 6 Radio - news 7 Newspapermagazine 8 Internet adbanner 9 Personal observationon the road 10 Friendrelative 11 Educational program 12 Social networking website (Facebook MySpace Twitter) 13 Online newsblog 14 Online video (YouTube Google Video) 15 Irsquom a police officerjudge 16 Direct contact by police officer 17 Internet game 18 Other (SPECIFY) 98 (VOL) Donrsquot know 99 (VOL) Refused
A‐25
Q22 Do you recall hearing or seeing the following slogans in the past 30 days READ A-L AND RECORD FOR EACH A Friends donrsquot let friends drive drunk B Click it or Ticket C On the Road Off the Phone D Phone in One Hand Ticket in the Other E No Phone Zone F Drunk Driving Over the Limit under Arrest G Put it Down H One Text or Call Could Wreck it All I Drive Sober or Get Pulled Over J U Drive U Text U Pay K It Can Wait L Buzzed Driving is Drunk Driving
1 Yes 2 No 8 (VOL) Donrsquot Know 9 (VOL) Refused
EXPOSURE TO DISTRACTED DRIVING CRASHES Q23 Have you been involved in a crash or near-crash as a driver in the past year
1 Yes - near-crash 2 Yes - crash 3 No SKIP TO Q24 8 (VOL) Donrsquot Know SKIP TO Q24 9 (VOL) Refused SKIP TO Q24
Q23a Were you distracted at the time of the LAST [crashnear-crash] you were in 1 Yes 2 No SKIP TO Q24 8 (VOL) Donrsquot Know SKIP TO Q24 9 (VOL) Refused SKIP TO Q24
Q23b How were you distracted at the time of the [crashnear-crash] DO NOT READ LIST
1 Talking on cell phone 2 Reading electronic text 3 Sending text message or e-mail 4 Talking to passengers 5 Eating 6 Grooming 7 Daydreaming 8 Adjusting radio GPS etc 9 Something else (Specify) 98 (VOL) Donrsquot Know 99 (VOL) Refused
A‐26
PERCEPTIONS OF AND RESPONSES TO OTHER DISTRACTED DRIVERS Q24 What percentage of drivers do you believe at least occasionally TALK on a cell phone while driving
RECORD VALUE 998 (VOL) Donrsquot know 999 (VOL) Refuse
Q24a What percentage of drivers do you believe at least occasionally SEND TEXT OR E-MAIL MESSAGES OR USE SMARTPHONE APPS while driving
RECORD VALUE 998 (VOL) Donrsquot know 999 (VOL) Refuse
Q24b Which is safer using a [hands-free cell phone or using a handheld cell phone] ROTATE ORDER 1 Hands-free 2 Handheld 3 Same 4 Neither 8 (VOL) Donrsquot Know 9 (VOL) Refused
Q24c There are phone apps available to block phone calls and text messaging while driving Would you use such an app
1 Yes 2 No 3 Depends 4 Already have one 8 (VOL) Donrsquot Know 9 (VOL) Refused
DEMOGRAPHIC QUESTIONS
Now I need to ask you some basic information about you and your household Again this information is confidential and will not be used to identify you personally
D1 What is your age RECORD VALUE
RANGE 16-101998999 101 101 or older 998 (VOL) Donrsquot know 999 (VOL) Refuse
A‐27
IF (SAMPLE=LANDLINE X-SECTION OR CELL) SKIP TO D3 D2 Including yourself how many people 16 or older are living in your household at least half of the time or consider it their primary residence RECORD VALUE
RANGE 0-11998999 11 11 or more 998 (VOL) Donrsquot know 999 (VOL) Refuse
D3 How many children 15 or younger are living in your household at least half of the time or consider it their primary residence RECORD VALUE
RANGE 0-11998999 11 11 or more 998 (VOL) Donrsquot know 999 (VOL) Refuse
D4 Do you consider yourself to be Hispanic or Latino 1 Yes 2 No 8 (VOL) Donrsquot Know 9 (VOL) Refused
D5 Which of the following racial categories describe you You may select more than one READ LIST MULTIPLE RECORD
1 American Indian or Alaska Native 2 Asian 3 Black or African American 4 Native Hawaiian or other Pacific Islander 5 White 6 (VOL) Hispanic 7 (VOL) Other (SPECIFY) 9 (VOL) Refused
D6What is highest grade or year of regular school you have completed DO NOT READ
1 No formal schooling 2 First through 7th grade 3 8th grade 4 Some high school 5 High school graduate 6 Some college 7 Four-year college graduate 8 Some graduate school 9 Graduate degree 99 (VOL) Refused
A‐28
D7Do you own or rent your home 1 Own 2 Rent 3 Some other arrangement 8 (VOL) Donrsquot Know 9 (VOL) Refused
D8How many landline telephone numbers do you have in your household RECORD VALUE RANGE 0-979899 97 97 or more 98 (VOL) Donrsquot know 99 (VOL) Refuse
ASK IF SAMPLE=LL or LL OVERSAMPLE D9 Of all the telephone calls that you or your family receives are READ LIST
1 All or almost all calls received on cell phones 2 Some received on cell phones and some on regular phones 3 Very few or none on cell phones 8 (VOL) Donrsquot know 9 (VOL) Refused
D11 What is your approximate household income READ LIST
1 Less than $10000 2 $10000 but less than $15000 3 $15000 but less than $25000 4 $25000 but less than $50000 5 $50000 but less than $100000 6 $100000 but less than $150000 7 $150000 but less than $200000 8 $200000 or more 98 (VOL) Donrsquot Know 99 (VOL) Refused
D13 May I please have your zip code ENTER 5-DIGIT ZIP CODE 99998 (VOL) Donrsquot Know 99999 (VOL) Refused
That completes the survey Thank you very much for your time and cooperation If you would like information about traffic safety please visit wwwnhtsagov
SCR1 I am sorry but you are not eligible to participate in the survey today Thank you for your cooperation and I hope you have a pleasant evening
A‐29
Appendix B
Methodology
B‐1
Survey Methodology for the 2015 National Survey on Distracted Driving Attitudes and Behaviors
The goal of the 2015 National Survey on Distracted Driving Attitudes and Behavior was to obtain a snapshot of the attitudes and behaviors about distracted driving activities of drivers 16 and older in the United States Only surveys based on probability samples can be used to create mathematically sound statistical inferences about a larger target population Most statistical formulas for specifying the sampling precision (estimates of sampling variance) given particular sample sizes are premised on simple random sampling However random sampling requires an enumeration of all of the elements in the population Since no enumeration of the total population of the United States (or its subdivisions) is available all surveys of the general public are based upon complex sample designs that may employ stratification and two or more stages of sampling
A sampling design using geographic stratification (NHTSA Region) an oversample of young drivers sampling frames of households with landlines and cell phones together with an overall sample size of 6001 was developed and implemented for this survey The final sample consisted of 3372 landline respondents (562) 2128 cell phone respondents (355) and an oversample of 501 drivers 16 to 34 years old (83) Weights were developed to yield national estimates of the target population within specified limits of expected sampling variability This appendix describes the methods of sample construction and survey administration and shows the sample disposition and computation of weights
Sample Construction
Strata - The initial stage in the construction of this sample required the development of a national probability sample of the non-institutionalized population of the United States 16 and older Stratification (ie the division of the population into collectively exhaustive and mutually exclusive homogenous groups) an efficient way of achieving high statistical precision with a smaller overall sample size was employed The United States was stratified into 10 strata each consisting of the States within NHTSArsquos 10 regions15
The estimated distribution of the target population by stratum was calculated on the basis of the 2013 American Community Survey conducted by the US Census Bureau The population estimates were taken for the population 16 and older Based on these Census estimates of the geographic distribution of the target population the total sample was proportionately allocated by stratum
Oversample of respondents 16-34 - Given NHTSArsquos interest in the driving behaviors of young drivers it was very important that the subsample of drivers 16 to 34 years old in this survey be large enough for meaningful statistical analysis However the population prevalence of this age group is not large enough to generate the desired subsample size with a total sample of 6000 cases To resolve this an oversample was used to achieve an adequate sample size of people 16 to 34
15 Region 1 Connecticut Maine Massachusetts New Hampshire Rhode Island Vermont Region 2 New Jersey New York Pennsylvania Puerto Rico and the Virgin Islands Region 3 Delaware District of Columbia Kentucky Maryland North Carolina Virginia West Virginia Region 4 Alabama Florida Georgia South Carolina Tennessee Region 5 Illinois Indiana Michigan Minnesota Ohio Wisconsin Region 6 Indian Nations Louisiana Mississippi New Mexico Oklahoma Texas Region 7 Arkansas Iowa Kansas Missouri Nebraska Region 8 Colorado Nevada North Dakota South Dakota Utah Wyoming Region 9 Arizona California Hawaii Pacific Territories Region 10 Alaska Idaho Montana Oregon Washington
B‐2
Based on 2013 ACS estimates of the civilian non-institutionalized population we estimated that in a population based sample about 34 of drivers should be 16-34 Our experience with recent telephone surveys using only conventional random-digit dialing (RDD) of landline households indicates that the subsample of respondents 16 to 34 obtained by this method would fall short of the population proportion Indeed the RDD landline cross-section sample from the 2012 NSDDAB which was conducted 3 years prior to the current survey respondents 16-34 made up only 100 of the landline cross-section sample
Table B-1 shows the national population figures and projected sample distribution by age for the total target sample of 6000 respondents The fourth column shows the desired sample from a population-based sample and the last two columns show what could be expected from a conventional RDD landline approach such as that used in the 2012 NSDDAB
Table B-1 Expected Population and Sample Distribution by Age Based on 2013 Census Bureau Estimates
Target Population
Sample Distribution
Population Based
Expected Distribution Based on 2012 NSDDAB Response
(N in 1000s) n n
Total (16+)
16-24
25-34
35-44
45-64
65+
250739
39829
42626
40608
83011
44663
100
159
170
162
331
178
6000
954
1020
972
1986
1068
6000
163
439
817
2785
1796
100
27
73
136
464
300
Source US Census Bureau 2013 American Community Survey httpfactfindercensusgovfacestableservicesjsfpagesproductviewxhtmlpid=ACS_13_1YR_DP0 5ampprodType=table
The reasons for this discrepancy include a lower response rate among younger adults (typical of current landline telephone surveys) a higher proportion of those 16 to 34 living in group quarters (eg dormitories) and a higher proportion of this age group living in cell phone only households Hence a simple proportionate sample of the adult driver population based on RDD landline methodology alone would not meet the needs of this study design Consequently an oversample of 501 respondents 16 to 34 was designed to be included in the sample at the start of the study
Landline and Cell Phone RDD samples - As noted above RDD landline telephone sampling has been the conventional approach for conducting surveys of the United States household population for the past few decades However households are increasingly turning to cell phones and some households have abandoned landline phones altogether For example the second half of 2014 the percentage of cell phone only households (households with no landline but accessible by cell
B‐3
phone) was estimated to be 454 according to the National Health Interview Survey (NHIS)16
Current RDD landline sampling procedures exclude telephone exchanges and banks of telephone numbers used exclusively for cell phones This makes it difficult to reach people in subpopulations with high cell phone only usage For example more than 8 in 10 (813) adults living with unrelated roommates and close to 7 in 10 (692) adults 25 to 29 live in cell phone only households These are some of the same groups that are increasingly under-represented in conventional RDD landline telephone surveys As the percentage of cell phone only households continues to grow the conventional RDD landline sampling model can no longer reliably provide adequate population coverage required for sampling the United States household population To overcome this challenge and to account for drivers that rely solely or mostly on cell phones this survey used both a RDD sample of landline phones and a RDD sample of cell phones
Cell Phone Households - A stratified random sample of cellular phone numbers was drawn and used to contact potential respondents This was feasible because the 10 strata used in this study are defined in terms of States and cellular phone area codes are also defined by States However cell phones are portable and some respondents could be living in States other than that indicated by their cell phones area code To address this possible scenario all cell phone respondents were asked their current zip code to confirm their location of residence
Two types of cell phone households were identified through screening cell phone only households and cell phone mostly households Cell phone only households do not have a landline phone Cell phone mostly households have both landline and cellular telephone service (dual service) but the landline is not often used for receiving calls and therefore the probability of reaching such a household through the landline sample is greatly diminished Because cell phone mostly households are also included in the sample frame of landline households the estimation procedures that account for the overlapping dual service sample are more complicated than those that use non overlapping (mutually exclusive) samples of cell phone only households and landline households (with or without cell phone) However it was important to include the cell phone mostly households in the study sample for the representativeness of the population and to capture respondents in the critical age group of 16 to 34 years old
Cell phones were treated as personal devices and only the person who owned the cell phone was screened for eligibility The number of interviews to be achieved for these groups was derived using Cochranrsquos formula for the optimal allocation to strata when unit costs differ between the strata17
Landline Households - A stratified sample of landline telephone numbers was drawn and potential respondents were contacted using conventional RDD methods The households were screened for eligibility and an eligible driver was selected for the interview A total of 3873 interviews were conducted with respondents from the landline sample This includes the oversample of 501 respondents 16 to 34
Table B-2 shows the number of interviews from each sample type by age Age quotas were not used during data collection except for the landline oversample for the 16- to 34-year-old group
16Blumberg S J amp Luke J V (2015) Wireless substitution Early release of estimates from the National Health Interview Survey July ndash December 2014 Retrieved from the CDC website at wwwcdcgovnchsdatanhisearlyreleasewireless201506pdf 17 Cochran W G (1977) Sampling techniques (3rd ed) New York John Wiley amp Sons
B‐4
Table B-2 Sample Size by Type and Age
Age Landline Landline
Oversample Cell Phone
Sample TOTAL
16-34 235 501 790 1526
35+ 3055 0 1304 4359
Not Reported 82 0 34 116
TOTAL 3372 501 2128 6001
Survey Administration
The objective of survey administration is to conduct the data collection portion of the survey in a systematic uniform and consistent manner Survey administration includes survey procedures monitoring of the interviews and tracking of the sample disposition
Calling Protocol
The calling protocol used in this study consisted of a maximum of 13 attempts for the landline sample including the oversample of drivers 16 to 34 If someone in the household was contacted on one of these attempts then the overall maximum attempts for that household was 23 For the cell phone sample the maximum number of attempts to reach someone was 5 If contact was made with someone then the maximum number of attempts was set at 10 If a person selected for the sample politely refused (also known as a ldquosoft refusalrdquo) to participate in the survey he or she was re-contacted approximately one to two weeks after the initial refusal giving them a ldquocooling offrdquo period before the re-contact For quality control the telephone interviews were monitored by field supervisory staff using a silent line and screen monitoring
Answering Machines
The strategy for handling answering machines while maintaining a 13-call protocol has to balance the objectives of reaching the household and avoiding annoyance of the household Thus messages were left on the answering machine or voice mail on the fifth seventh and ninth calls if an answering machine or voice mail was encountered on those attempts The answering machine message explained that the household had been selected as part of a US DOT study of American driving habits and attitudes and asked the respondent to call Abt SRBIrsquos toll-free number to schedule an interview
For cell phones voice messages were left on the first call if a voice mailbox was reached The rationale behind this is that respondents would see the number of the call center not recognize it and therefore be more likely to screen the call and not answer their cell phones Leaving a message early on let the respondent know who was calling and the purpose of the call When we call back and the same number appears the respondent may be more likely to take the call since there is additional information pertaining to the number
Sample Dispositions
The final dispositions for each of the three independent samples are given in the following tables Table B-3 Landline Cross-Section Table B-4 Cell Sample and Table B-5 Landline Oversample
B‐5
Table B-3 Landline Cross-Section Final Disposition Report Estimated Estimated
Original Qualified Response Count Household Eligible^
T1 TOTAL 110264
A NON-Usable Numbers 81577 A1 NISDISChangeIntercepts 69952 A2 Non-residential 5976 A3 ComputerFax tone 3427 A4 Line problem 2222
T2 Total Usable Numbers 28687 B UNKNOWN ELIGIBLE HOUSEHOLD^ 13737 3574 2799 B1 Probable unassigned number 6090 B2 No answerBusy 3073 B3 Answering machine 4574
C NOT ELIGIBLE RESPONDENT^ 1288 1288 1009 C1 Language barrier 319 C2 HealthDeaf 894 C3 Respondent away for duration 75
D UNKNOWN ELIGIBLE RESPONDENT^ 8608 6741 D1 Callback 5534 D2 Spanish Callback not screened 54 D3 Refusals not screened 3020
E CONTACTS SCREENED 1682 E1 Qualified callback 287 287 E2 Refusals ndash Qualified 299 299 E3 Terminates 0 0 E4 Screen-outs 1096
F COMPLETE 3372 3372
A ESTIMATED ELIGIBLE HH RATE =T2T1 2602 B ELIGIBLE RESPONSE RATE = E+F-E4(E+F) 7831 C SUM RESPONSE ELIGIBLE COUNT 14507 D RESPONSE RATE = FC 2324 Estimated Qualified HH=Original Count A
^Response Eligible = Qualified Household Count B
B‐6
Table B-4 Cell Phone Final Disposition Report
T1 TOTAL
Original Count
43750
Estimated Qualified
Household
Estimated Response Eligible^
A
A1
A2
A3
A4
NON-Usable Numbers
NISDISChangeIntercepts
Non-residential
ComputerFax tone
Line problem
14382 11515
1284 42
1541
T2
B
B1
B2
B3
Total Usable Numbers
UNKNOWN ELIGIBLE HOUSEHOLD^
Probable unassigned number
No answerBusy
Answering machine
29368 14755
76 4793 9886
9905 5449
C
C1
C2
C3
NOT ELIGIBLE RESPONDENT^
Language barrier
HealthDeaf
Respondent away for duration
990 621 297 72
990 545
D
D1
D2
D3
UNKNOWN ELIGIBLE RESPONDENT^
Callback
Spanish Callback not screened
Refusals not screened
8797 6199
262 2336
4840
E
E1
E2
E3
E4
CONTACTS SCREENED
Qualified callback
Refusals ndash Qualified
Terminates
Screen-outs
2698 307 220
0 2171
307 220
0
F COMPLETE 2128 2128
A ESTIMATED ELIGIBLE HH RATE =T2T1
B ELIGIBLE RESPONSE RATE = E+F-E4(E+F)
C SUM RESPONSE ELIGIBLE COUNT
D RESPONSE RATE = FC
Estimated Qualified HH=Original Count A
^Response Eligible = Qualified Household Count B
6713 5501
1578 13488
B‐7
Estimated Estimated Original Qualified Response Count Household Eligible^
T1 TOTAL 175210 A NON-Usable Numbers 128883 A1 NISDISChangeIntercepts 111111 A2 Non-residential 8983 A3 ComputerFax tone 5399 A4 Line problem 3390 T2 Total Usable Numbers 46327 B UNKNOWN ELIGIBLE HOUSEHOLD^ 21719 5743 242B1 Probable unassigned number 9992 B2 No answerBusy 4339 B3 Answering machine 7388 C NOT ELIGIBLE RESPONDENT^ 550 550 23C1 Language barrier 282 C2 HealthDeaf 232 C3 Respondent away for duration 36 D UNKNOWN ELIGIBLE RESPONDENT^ 6112 257D1 Callback 4626 D2 Spanish Callback not screened 77 D3 Refusals not screened 1409 E CONTACTS SCREENED 17445 E1 Qualified callback 154 154E2 Refusals ndash Qualified 100 100E3 Terminates 0 0 E4 Screen-outs 17191 F COMPLETE 501 501 A ESTIMATED ELIGIBLE HH RATE =T2T1 2644 B ELIGIBLE RESPONSE RATE = E+F-E4(E+F) 421 C SUM RESPONSE ELIGIBLE COUNT 1277D RESPONSE RATE = FC 3924
Estimated Qualified HH=Original Count A
^Response Eligible = Qualified Household Count B
Table B-5 Landline Oversample Final Disposition Report
B‐8
Precision of Sample Estimates
The confidence interval for an estimate derived from the distracted driver survey sample is
ሺݕොሻ ݎඥfraslݕො േ ଵఈ ଶݖ
ො = an estimate of the population proportionݕ andݕොof18 = is the simple random sampling variance ሺݕොሻ ݎ
where
fraslଵఈ ଶݖ = ሺ1 െ frasl2 ߙ ሻth percentile of the standard normal distribution (95 ݖ 005 = ߙ = (1645 = ݖ 010 = ߙ 90 196
For best results data users should use statistical software such as SAS SPSS STATA or SUDAAN to calculate the confidence intervals for a complex sampling design However data users can use the tables that follow to approximate the confidence interval based on a simple formula
Sampling Error The sampling variance for an estimate is a measure of uncertainty that reflects the fact that the estimate is derived from a sample drawn from the population If one were to draw a second sample in the exact same manner the estimate would be different from the first simply due to the fact that our sample contains different members of the population A third sample would be different from the first two and so on The sampling variance measures how different the estimates would be had we drawn different samples
The sampling error for a complex survey depends on three things
௬ଶ ൌThe population variance for the characteristic the sampling variance is higher whenߪ 1there is a lot of variability in the population (large ߪ௬ଶ) and lower when there is little variability in the population
2 n = The sample size the sampling variance is higher when the sample size is small and lower when the sample size is large The sampling variance for estimates of subgroups is based on the sample size for those subgroups
3 DEFF = The design effect19 Sampling design features such as stratification clustering dual-frame sampling and survey weighting all contribute to the sampling variability The design effect is a measure of inefficiency (or efficiency) of the complex sample relative to a simple
ሺݕොሻ srsݎfraslሺݕොሻ ݎ ൌ ܨܨܧܦ random sample calculated as
ൌሻݕොሺݎ Using this relationship we can write the sampling variance of the complex design as fraslଶ௬ൌൈ ܦܧܨܨ ߪ ൈܧܨܨ ݎොሺsrsݕሻܦ Therefore one can calculate the sampling variance with the
population variance (or an estimate of the population variance) the sample size and the design effect See Table B-6 for 95 error estimates by various sample sizes
18 A simple random sample is a sample on n units drawn directly from a population of N units 19 Kish L (1965) Survey Sampling New York John Wiley amp Sons
B‐9
sumሺݕ െ തሻଶ In the caseݕ
Estimating the Population Variance ଵൌଶݏThe population variance is often estimated from the survey data
of percentages the population variance
௬ଶ = Ptimes(1-P) and can be estimated from the surveyߪ An alternative is to use the variance estimates based on the percentages ൌ ൈ ሺ1 െ estimateݏሻ ଶ
presented in Table B1 Rounding the estimated percentage up to the nearest 5 percentage points (eg 17 to 20 34 to 35) is a conservative estimate of the population variance The variance for a percentage is low when a small percentage of the population has the characteristic (or a large percentage of the population has the characteristic) and high when the percentage of the population with the characteristic is equal (5050)
Estimating Design Effects The sampling design impacts the variance for each data item differently Therefore the design effect for one survey estimate might be higher or lower than the design effect of another survey estimate The design effect will also vary for different subpopulations represented in the sample such as males and females Using a conventional definition of the unequal weighting effect the design effect (increase of variance compared to the SRS design) due to unequal weights is DEFFUWE = 1 + (Coefficient of Variation)2 = 1 + (08951)2 = 180
Testing for Statistical Differences Sampling error is also used to determine whether two population subgroups (or domains) are significantly different with respect to a certain statistic that is the difference in the sampled subgroup estimates is large enough that it would be unlikely to randomly occur if the statistics were the same for the subgroups Consider the hypothesis test for comparing two domains
H0 Y1 = Y2 or Y1 ndash Y2 = 0
H1 Y1 ne Y2 or Y1 ndash Y2 ne 0
One method to test whether Y1 is different from Y2 is to calculate a confidence interval around the difference in the sample estimates20 ሺݕොଵ െ ଵఈ ଶ If the interval does notሻଶെݖොଶሻേݕ fraslඥݎ ොݕො ଵሺݕ
is different from Y2 ndashthe observed difference in the sample contain 0 we conclude that Y1
estimates is not likely to randomly occur if Y1 was equal to Y2 therefore there is evidence to indicate a difference in the population statistics If the interval contains 0 we cannot conclude that Y1 is different from Y2 ndash there is insufficient evidence to indicate a difference in the population
is the sum of the variances for two population ሻଶሻ ሺݕො ଵݕොሺݎൌ ሻଶെ statisticsݎොሺݕො ଵݕsubgroups The subgroup variances are estimated as described above Table B-6 includes the estimated 95 error margins for various sample sizes Table B-7 includes the estimated 95 error margins for the differences between subgroups of various sizes If the observed difference is less than or equal to the error margin the difference is not statistically significant at the α = 005 significance level If it is greater than the error margin the difference is statistically significant at the α = 005 significance level
20 This method should only be used for large sample sizes One rule of thumb is n1 and n2 both greater than 30
B‐10
Table B-6 Estimated 95 Error Margins for Various Sample Sizes
DEFF n
180 6000
5500 5000
4500 4000
3500 3000
2500 2250
2000 1750
1500 1250
1000 750
500 400
300 200
150 100
50
P =
=
50 50
025
45 55
02475
40 60
024
35 65
02275
30 70
021
25 75
01875
20 80
016
15 85
01275
10 90
009
5 95
00475
17
18 19
20 21
22 24
26 28
29 31
34 37
42 48
59 66
76 93
107 131
186
17
18 19
20 21
22 24
26 28
29 31
34 37
41 48
59 65
76 93
107 131
185
17
17 18
19 20
22 24
26 27
29 31
33 36
41 47
58 64
74 91
105 129
182
16
17 18
19 20
21 23
25 26
28 30
32 35
40 46
56 63
72 89
102 125
177
16
16 17
18 19
20 22
24 25
27 29
31 34
38 44
54 60
70 85
98 121
170
15
15 16
17 18
19 21
23 24
25 27
29 32
36 42
51 57
66 81
93 114
161
14
14 15
16 17
18 19
21 22
24 25
27 30
33 38
47 53
61 74
86 105
149
12
13 13
14 15
16 17
19 20
21 22
24 27
30 34
42 47
54 66
77 94
133
10
11 11
12 12
13 14
16 17
18 19
20 22
25 29
35 39
46 56
64 79
112
07
08 08
09 09
10 10
11 12
13 14
15 16
18 21
26 29
33 41
47 57
81
B-11
Table B-7 Estimated 95 Error Margins for the Difference Between Two Subgroups DEFF n1 P n2 = 6000 5000 4000 3000 2000 1500 1000 500 400 300 200 100 50 180 6000 5050 24 25 27 29 34 38 45 61 68 78 95 133 187
4060 24 25 26 29 33 37 44 60 67 76 93 130 183 3070 22 23 25 27 31 35 41 56 62 71 87 122 171 2080 19 20 21 24 27 30 36 49 54 62 76 106 149 1090 14 15 16 18 20 23 27 37 41 47 57 80 112
5000 5050 25 26 28 30 35 39 46 62 68 78 95 133 187 4060 25 26 27 30 34 38 45 60 67 77 93 130 183 3070 23 24 26 28 32 35 42 57 63 72 87 122 171 2080 20 21 22 24 28 31 36 49 55 63 76 106 149 1090 15 16 17 18 21 23 27 37 41 47 57 80 112
4000 5050 27 28 29 32 36 40 46 62 69 79 95 133 187 4060 26 27 29 31 35 39 46 61 68 77 93 130 183 3070 25 26 27 29 33 36 43 57 63 72 87 122 171 2080 21 22 24 25 29 32 37 50 55 63 76 106 150 1090 16 17 18 19 22 24 28 37 41 47 57 80 112
3000 5050 29 30 32 34 38 42 48 64 70 80 96 134 187 4060 29 30 31 33 37 41 47 62 69 78 94 131 184 3070 27 28 29 31 35 38 44 58 64 73 88 122 172 2080 24 24 25 27 30 33 38 51 56 64 77 107 150 1090 18 18 19 20 23 25 29 38 42 48 58 80 112
2000 5050 34 35 36 38 42 45 51 66 72 81 98 135 188 4060 33 34 35 37 41 44 50 64 71 80 96 132 184 3070 31 32 33 35 38 41 47 60 66 75 89 123 173 2080 27 28 29 30 33 36 41 53 58 65 78 108 151 1090 20 21 22 23 25 27 31 39 43 49 59 81 113
1500 5050 38 39 40 42 45 48 54 68 74 83 99 136 189 4060 37 38 39 41 44 47 53 67 72 81 97 133 185 3070 35 35 36 38 41 44 49 62 68 76 91 124 173 2080 30 31 32 33 36 38 43 54 59 67 79 109 151 1090 23 23 24 25 27 29 32 41 44 50 59 81 113
B-12
Table B-7 Estimated 95 Error Margins for the Difference Between Two Subgroups (Continued) DEFF n1 P n2 = 6000 5000 4000 3000 2000 1500 1000 500 400 300 200 100 50 180 1000 5050 45 46 46 48 51 54 59 72 78 87 102 138 191
4060 44 45 46 47 50 53 58 71 76 85 100 135 187 3070 41 42 43 44 47 49 54 66 71 79 93 126 175 2080 36 36 37 38 41 43 47 58 62 69 81 110 152 1090 27 27 28 29 31 32 35 43 47 52 61 83 114
500 5050 61 62 62 64 66 68 72 83 88 96 110 144 195 4060 60 60 61 62 64 67 71 81 86 94 108 141 191 3070 56 57 57 58 60 62 66 76 81 88 101 132 179 2080 49 49 50 51 53 54 58 67 71 77 88 115 156 1090 37 37 37 38 39 41 43 50 53 58 66 86 117
400 5050 68 68 69 70 72 74 78 88 93 100 114 147 197 4060 67 67 68 69 71 72 76 86 91 98 112 144 193 3070 62 63 63 64 66 68 71 81 85 92 104 135 181 2080 54 55 55 56 58 59 62 71 74 80 91 118 158 1090 41 41 41 42 43 44 47 53 56 60 68 88 118
300 5050 78 78 79 80 81 83 87 96 100 107 120 152 201 4060 76 77 77 78 80 81 85 94 98 105 118 149 197 3070 71 72 72 73 75 76 79 88 92 98 110 139 184 2080 62 63 63 64 65 67 69 77 80 86 96 121 161 1090 47 47 47 48 49 50 52 58 60 64 72 91 121
200 5050 95 95 95 96 98 99 102 110 114 120 131 161 208 4060 93 93 93 94 96 97 100 108 112 118 129 158 204 3070 87 87 87 88 89 91 93 101 104 110 121 148 191 2080 76 76 76 77 78 79 81 88 91 96 105 129 166 1090 57 57 57 58 59 59 61 66 68 72 79 97 125
100 5050 133 133 133 134 135 136 138 144 147 152 161 186 228 4060 130 130 130 131 132 133 135 141 144 149 158 182 223 3070 122 122 122 122 123 124 126 132 135 139 148 170 209 2080 106 106 106 107 108 109 110 115 118 121 129 149 182 1090 80 80 80 80 81 81 83 86 88 91 97 112 137
B-13
Table B-7 Estimated 95 Error Margins for the Difference Between Two Subgroups (Continued) DEFF n1 P n2 = 6000 5000 4000 3000 2000 1500 1000 500 400 300 200 100 50
180 50 5050 4060
187 187 187 187 188 189 191 195 183 183 183 184 184 185 187 191
197 193
201 197
208 204
228 223
263 258
3070 171 171 171 172 173 173 175 179 181 184 191 209 241 2080 149 149 150 150 151 151 152 156 158 161 166 182 210 1090 112 112 112 112 113 113 114 117 118 121 125 137 158
B-14
WEIGHTING METHODOLOGY
Weights were calculated for the 7231 completed (n=6001) and screened-out (n=1231) interviews with people 16 and older residing in households in the 50 States and the District of Columbia The population weights (DD_FINAL_POP_WT) sum to the 2013 American Community Survey population estimate of 247014747 people 16 and older in the civilian noninstitutionalized population of the United States A sample weight (DD_FINAL_SAMP_WT) was also created The sample weights sum to 7231 completed and screened out interviews
Base Sampling Weight
The overall random-digit-dialing sample consisted of three components (identified by FPROJ variable) The first component (Landline Sample) was a NHTSA Region-stratified sample of landline telephone numbers One person 16 or older was randomly selected from each household The second component (Landline Screening Sample) was a NHTSA Region-stratified screening sample of landline telephone numbers One person 16 to 34 years old was randomly selected from the households with one or more age-eligible people The third component (Cellular Sample) was a NHTSA Region-stratified sample of cellular telephone numbers The cellular telephone was treated as a personal communication device and therefore an interview was attempted if the person answering was 16 or older To be eligible for the interview the person also needed to be classified as cell-only individual or a cell-mostly individual Cell-mostly individuals were defined as also having a landline telephone but ldquoall or almost all calls are received on cell phonesrdquo Dual users who are not cell-mostly individuals had to be reached on a landline to participate in the study
For each sample component a base sampling weight (BSW) was calculated for each NHTSA Region (regions were identified by NHTSAREG variable) The base sampling weight equals the population count of telephone numbers in the NHTSA Region divided by the sample size of telephone numbers drawn from that NHTSA Region and released for interview attempts (see Table B-8)
Table B-8 Base Sampling Weights (BSW) by Sample Component
NHTSA Region (NHTSAREG)
Landline Sample Landline Screening
Sample Cellular Sample
1 261794 164364 1021063 2 260130 162661 1036850 3 259703 162470 1031571 4 260238 163218 1045315 5 258877 162604 1063449 6 260098 163672 1096991 7 262470 164338 1108332 8 262719 165646 1074469 9 259303 165568 1072767
10 260454 166732 1092981
The two landline sample components result in an oversampling of people 16 to 34 relative to people 35 and older This was accounted for in the weight calculations by adjusting downwards the weights of people 16 to 34 The sum of the base sampling weights of all people 16 to 34 in the landline sample was calculated (775011) The sum of the base sampling weights of all people 16 to 34 in the landline sample and the landline screening sample was also calculated (1757722)
B‐15
The base sampling weights of people 16 to 34 in the two landline sample components were multiplied by the resulting ratio of 044092 to form the adjusted base sampling weight (BSW_ADJ) The adjusted base sampling weight for cell phone sample people and for landline sample people 35 and older equals the base sampling weight
Landline sample and landline screening sample people residing in households with two or more landline telephone numbers have a higher probability of selection compared to people living in households with one landline telephone number The adjusted base sampling weight was divided by two if the person reported that their household had two landline telephone numbers and was divided by 3 if three or more landline telephone numbers were reported (D8) to form the base sampling weight adjusted for multiple landline telephones (BSW_NUMPHONE) For landline and landline screening sample people with one landline telephone number and for cell phone sample people the base sampling weight adjusted for multiple landline telephones equals the adjusted base sampling weight
The final step in the base sampling weight calculation process was to account for the random selection of one person 16 and older (QSL1) from the landline sample and one person 16 to 34 (QSO1) from the landline screening sample The base sampling weight adjusted for multiple landline telephones was multiplied by the number of eligible people in the household capped at four to form the base sampling weight adjusted for within household sampling (BSW_NUMADULT) For people in the cell phone sample the base sampling weight adjusted for within household sampling equals the base sampling weight adjusted for multiple landline telephones
A nonresponse adjustment was not performed In 2012 most of the values of nonresponse adjustment factors were between 12 and 14 (see Table B-10 of the 2012 report) Our experience in developing nonresponse adjustments in other projects is that the ranges of values are usually much greater (eg a difference by a factor of 30 or 50) The information contained in the nonresponse adjustment factors is additionally used in the raking step where both the 10 NHTSA regions and phone use are incorporated as raking targets We thus concluded that it is possible to simplify the weighting procedure and omit the nonresponse adjustment step as performed in 2012
Combining the Two Landline Samples With the Cell Phone Sample
All respondents were classified into 1 of 5 telephone service categories
1 Cell-only 2 Landline only 3 Cell phone sample dual user cell-mostly 4 Landline samples dual user cell-mostly 5 Landline samples dual user not cell-mostly
The two landline samples cannot be simply combined with the cell phone sample because dual user (landline and cell phone) people who are classified as cell-mostly can be sampled through the two landline samples or through the cell phone sample This is referred to as a partial overlap dual frame design because dual user people who are not cell-mostly were sampled just through the two landline samples
B‐16
The samples were combined by compositing the cell-mostly people from the landline samples with the cell-mostly respondents from the cell phone sample A compositing factor λ of 05 was selected to adjust for some respondents who can be reached through both frames The selection of 05 as the compositing factor arithmetically addresses the possibility of being selected in the 2 frames For the two cell-mostly telephone service groups the composite weight (BSW_COMPOSITE) equals within household adjusted base sampling weight times the compositing factor For the other three telephone service groups the composite weight equals the within household adjusted base sampling weight
Raking to Population Control Totals
A survey sample may cover segments of the target population in proportions that do not match the proportions of those segments in the population itself The differences may arise for example from sampling fluctuations from nonresponse because the sampling design sampled different segments of populations at different rates (eg the cell-only population was sampled at a lower rate than the landline user population for cost reasons) or because the sample design was not able to cover the entire target population In such situations one can often improve the relation between the sample and the population by adjusting the sampling weights of the cases in the sample so that the marginal totals of the adjusted weights on specified characteristics referred to as control variables agree with the corresponding totals for the population This operation is known as raking ratio estimation raking or sample-balancing and the population totals are usually referred to as control totals Raking is most often used to reduce biases from nonresponse and noncoverage in sample surveys
Raking usually proceeds one variable at a time applying a proportional adjustment to the weights of the cases that belong to the same category of the control variable The initial design weights in the raking process are often equal to the inverse of the selection probabilities and may have undergone some adjustments for unit nonresponse and noncoverage The weights from the raking process are used in estimation and analysis
The adjustment to control totals is sometimes achieved by creating a cross-classification of the categorical control variables (eg age categories times gender times race times household-income categories) and then matching the total of the weights in each cell to the control total This approach however can spread the sample thinly over a large number of adjustment cells It also requires control totals for all cells of the cross-classification Often this is not feasible (eg control totals may be available for age times gender times race but not when those cells are subdivided by household income) The use of raking with marginal control totals for single variables (ie each margin involves only one control variable) often avoids many of these difficulties
The procedure known as raking adjusts a set of data so that its marginal totals match control totals on a specified set of variables The term ldquorakingrdquo suggests an analogy with the process of smoothing the soil in a garden plot by alternately working it back and forth with a rake in two perpendicular directions
In a simple 2-variable example the marginal totals in various categories for the two control variables are known from the entire population but the joint distribution of the two variables is known only from a sample In the cross-classification of the sample arranged in rows and columns one might begin with the rows taking each row in turn and multiplying each entry in the row by
B‐17
the ratio of the population total to the weighted sample total for that category so that the row totals of the adjusted data agree with the population totals for that variable The weighted column totals of the adjusted data however may not yet agree with the population totals for the column variable Thus the next step taking each column in turn multiplies each entry in the column by the ratio of the population total to the current total for that category Now the weighted column totals of the adjusted data agree with the population totals for that variable but the new weighted row totals may no longer match the corresponding population totals
This process continues alternating between the rows and the columns and close agreement on both rows and columns is usually achieved after a small number of iterations The result is a tabulation for the population that reflects the relation of the two control variables in the sample Raking can also adjust a set of data to control totals on three or more variables In such situations the control totals often involve single variables but they may involve two or more variables
Ideally one should rake on variables that exhibit an association with the key survey outcome variables and that are related to nonresponse andor noncoverage This strategy will reduce bias in the key outcome variables In practice other considerations may enter A variable such as gender may not be strongly related to key outcome variables or to nonresponse but raking on it may be desirable to preserve the ldquoface validityrdquo of the sample21 22 Eight control variables were used in the raking (see Table B-9)
Table B-9 Control Variables Used in the Raking
Variable Label Name Telephone service using 4 categories TELEPHONE_STATUS_R NHTSA Region XREGION Number of people 16 and older in the household NUM_16PLUS_R Number of people 0 to 15 in the household D3_R Home ownership status D7_R Education D6_R Raceethnicity RACE_ETHNICITY_R Age group by gender D1_QSA3_R
The control totals were obtained for people 16 and older living in households from the 2013 American Community Survey PUMS The telephone service control totals were constructed from information published by the National Center for Health Statistics23
21 Battaglia M Izrael D Hoaglin D amp Frankel M (2009) Practical considerations in raking Survey data Survey Practice 2(5) Retrieved from wwwsurveypracticeorgindexphpSurveyPracticearticleview176html 22 Kolenikov S (2014) Calibrating survey data using iterative proportional fitting (raking) Stata Journal 14 22-59 23 Blumberg S J amp Luke J V (2015) Wireless substitution Early release of estimates from the National Health Interview Survey July ndash December 2014 Retrieved from the CDC website at wwwcdcgovnchsdatanhisearlyreleasewireless201506pdf
B‐18
The IGCV SAS raking macro24 was used calculate the final weights for the combined (landline and cell phone) sample The population control totals and weighted sample distributions prior to raking are shown in Appendix C (see Weighted Distribution Prior To Raking Iteration 0) The raking macro was set to a convergence criterion of a maximum difference of 005 percentage points between a control total percent and the corresponding weighted sample percent
The IGCV raking macro limited the spread of weights during the raking iteration to help avoid extreme weights which reduce statistical efficiency of final estimates especially in small domains or subpopulations Izrael et al (2009) discuss weight trimming during raking and provide details on the Individual and Global Cap Value (IGCV) weight trimming procedures implemented in their SAS raking code No weight values were allowed to exceed the respondentrsquos BSW_COMPOSITE weight times factor A or the mean BSW_COMPOSITE weight times factor C The weight trimming also avoided the situation where respondents end up with very small weights by not allowing weight values to be lower than the respondentrsquos BSW_COMPOSITE times factor B or to be below the mean BSW_COMPOSITE weights times factor D
Table B-10 IGCV Weight Trimming Values
A = 80 weight will be decreased to individual weight times A
B = 0125 weight will be increased to individual weight times B
C = 120 weight will be decreased to mean weight times C
D = 0083 weight will be increased to mean weight times D
Summary of the Final Weights
The final weights are given by the variables DD_FINAL_POP_WT and DD_FINAL_SAMP_WT They only differ by scaling the weights in DD_FINAL_POP_WT sum up to the estimated population size ( of adults 16+ in the United States) while DD_FINAL_SAMP_WT sum up to the sample size n=7231 These weights should be used for all the analyses of the 2015 National Survey of Distracted Driving Attitudes and Behavior data Given the differences in scaling DD_FINAL_POP_WT should be used when population totals need to be estimated (eg total nationwide expected number of accidents caused by distracted driving) For analysis of population size-free statistics such as means or percentages (eg percentage of trips on which the driver was using hands-free cell phone connection in the car) either set of weights can be used If the software supports this these weights should be used as probability weights rather in a software package that supports estimation with complex survey data (eg SAS PROC SURVEY Stata svy prefix R
24 Izrael D Battaglia M amp Frankel M (2009) SAS raking macro Retrieved from httpabtassociatescomExpertiseSurveys-and-Data-CollectionRaking-Survey-Data-(a-k-a--SampleshyBalancing)aspx
B‐19
survey package SPSS Complex Samples module) than frequency weights (as they are interpreted in SPSS without the Complex Samples module or SAS procedures without SURVEY prefix)
Table B-11 Summary of Final Weights
Weight Variable N Sum Minimum Maximum Mean Coeff of Variation
BSW_COMPOSITE 7231 41071659 119533 11083 567994 06380
DD_FINAL_POP_WT 7231 247014747 283532 318645 3416052 08951
DD_FINAL_SAMP_WT 7231 7231 0083 9328 1 08951
Using a conventional definition of the unequal weighting effect the design effect (increase of variance compared to the SRS design) due to unequal weights DEFFUWE = 1 + CV2 = 180 The magnitude of the final DEFF is split between the unequal baseline weights produced the design effect of 140 and different response rates in the different demographic groups that are implicitly accounted for by the raking procedures
B‐20
Appendix C
Output for Raking With Trimming Weight by Individual and Global Cap Value Method
C‐1
The raking output is shown in Table C-1 Raking Results
Table C-1 Raking Results
RAKING WITH TRIMMING WEIGHT BY INDIVIDUAL AND GLOBAL CAP VALUE (IGCV) METHOD
Sample size of completed interviews 7231
Raking input weight (adjusted to population total) BSW_COMPOSITE_ATPT
Minimum value of raking input weight 7189
Maximum value of raking input weight 666577
Coefficient of variation of raking input weight 064
Global low weight cap value factor Mean input weight times - (D) 0083
Global high weight cap value factor Mean input weight times - (C) 12
Individual low weight cap value (ILCV) factor Respondents weight times shy(B)
0125
Individual high weight cap value (IHCV) factor Respondents weight times shy(A)
8
C‐2
WEIGHTED DISTRIBUTION PRIOR TO RAKING (ITERATION 0)
Telephone status Input Weight
Sum of Weights25 Population
Total26
Sum of Weights
Difference27
of Input Weights28
Population 29
Difference in 30
1 Cell only user 1308998668 109305294 215945732 52993 44251 8742
2 Landline only user 708103404 17752600 -106715658 2867 7187 -432
3 Dual user cell mostly - celllandline sample 2954661922 42099023 -125524034 11961 17043 -5082
4 Dual user not cell mostly - landline sample only
7948722695 77857831 162939601 32179 3152 066
NHTSA region Input Weight
Sum of Weights Population
Total
Sum of Weights
Difference
of Input Weights
Population Difference
in
1 NHTSA Region 1 1229698036 11794622 50235836 4978 4775 0203
2 NHTSA Region 2 3218375177 32898311 -71455923 13029 13318 -0289
3 NHTSA Region 3 2642108582 25055504 136558182 10696 10143 0553
4 NHTSA Region 4 3548787416 36002824 -51494984 14367 14575 -0208
5 NHTSA Region 5 4530623879 40741097 456514179 18342 16493 1848
6 NHTSA Region 6 3032710295 30183360 14374295 12277 12219 0058
7 NHTSA Region 7 1518536872 13032118 215325072 6148 5276 0872
8 NHTSA Region 8 1050868558 10018964 48972158 4254 4056 0198
9 NHTSA Region 9 2857707093 36079042 -750197107 11569 14606 -3037
10 NHTSA Region 10 1072058791 11208905 -48831709 434 4538 -0198
Number of People 16+ in Household (HH) Input Weight
Sum of Weights Population
Total
Sum of Weights
Difference
of Input Weights
Population Difference
in
1 1 Person 16+ in HH 7149110913 41358674 3013243513 28942 16743 12199
2 2 People 16+ in HH 1072719064 116304877 -903297059 43427 47084 -3657
3 3 People 16+ in HH 3839234508 50449212 -120568669 15543 20424 -4881
4 4+ People 16+ in HH 2985938638 38901984 -904259762 12088 15749 -3661
Note Footnotes apply to each respective column heading in this section
25 Weighted count of adults based on BSW_COMPOSITE adjusted to population total 26 Population count of adults based on American Community Survey 27 Input weight sum of weights minus population total 28 Weighted percent of adults based on BSW_COMPOSITE 29 Population percent of adults based on American Community Survey 30 of input weights minus population
C‐3
Number of People in HH under 16 Input Weight
Sum of Weights Population
Total
Sum of Weights
Difference
of Input Weights
Population Difference
in
1 0 Children under 16 in HH 1700532532 165093166 496008725 68843 66835 2008
2 1 Child under 16 in HH 3360312936 37773679 -417054964 13604 15292 -1688
3 2 Children under 16 in HH 266342826 28257559 -16232764 10782 1144 -0657
4 3+ Children under 16 in HH 1672408179 15890343 83373879 677 6433 0338
Tenure Input Weight
Sum of Weights Population
Total
Sum of Weights
Difference
of Input Weights
Population Difference
in
1 Own 1495844343 162397537 -128131027 60557 65744 -5187
2 Rent 9743031274 84617210 1281310274 39443 34256 5187
Education Input Weight
Sum of Weights Population
Total
Sum of Weights
Difference
of Input Weights
Population Difference
in
1 Less than HS 29574445 39473916 -9899471 11973 1598 -4008
2 HSGED 7234949693 66924310 542518693 2929 27093 2196
3 Some college 5922998251 75310772 -160807895 23978 30488 -651
4 College graduate 8586082255 65305749 2055507355 34759 26438 8321
Race-ethnicity Input Weight
Sum of Weights Population
Total
Sum of Weights
Difference
of Input Weights
Population Difference
in
1 Hispanic 3586599033 37498626 -163263567 1452 15181 -0661
2 White Non-Hispanic 165879344 161512193 436715103 67154 65386 1768
3 Black Non-Hispanic 2245206292 28865584 -641352108 9089 11686 -2596
4 AsianNHOPI Non-Hispanic 850357984 13190879 -468729916 3443 534 -1898
5 AIAN Non-Hispanic 320045582 1526907 167354882 1296 0618 0678
6 OtherMultiracial Non-Hispanic 1111331405 4420558 669275605 4499 179 2709
C‐4
Age group by gender Input Weight
Sum of Weights Population
Total
Sum of Weights
Difference
of Input Weights
Population Difference
in
11 16-24 Male 1774055575 20051714 -231115825 7182 8118 -0936
12 16-24 Female 1242473377 19387175 -696244123 503 7849 -2819
21 25-29 Male 94176272 10474745 -10571178 3813 4241 -0428
22 25-29 Female 752965759 10515811 -298615341 3048 4257 -1209
31 30-34 Male 1181952847 10281237 153829147 4785 4162 0623
32 30-34 Female 673925149 10501810 -376255851 2728 4251 -1523
41 35-39 Male 923582276 9611576 -37575324 3739 3891 -0152
42 35-39 Female 717097388 9909101 -273812712 2903 4012 -1108
51 40-49 Male 2042105191 20420984 6791 8267 8267 0
52 40-49 Female 1931045193 21229852 -191940007 7818 8595 -0777
61 50-59 Male 2354636585 20928245 261812085 9532 8472 106
62 50-59 Female 2388368196 22225386 165829596 9669 8998 0671
71 60-69 Male 2001812908 15453706 456442308 8104 6256 1848
72 60-69 Female 231440501 17140934 60031161 937 6939 243
81 70+ Male 144945147 12339012 21555027 5868 4995 0873
82 70+ Female 2011835055 16543459 357489155 8145 6697 1447
Program terminated at iteration 5 because all current percentage differ from target percentage by less than 005
C‐5
WEIGHTED DISTRIBUTION AFTER RAKING
Telephone status Output Weight
Sum of Weights31 Population
Total32
Sum of Weights
Difference33
of Output
Weights34
Population 35
Difference in 36
1 Cell only user 1091880077 109305294 -11728588 44203 44251 -0047
2 Landline only user 1774333759 17752600 -92623 7183 7187 -0004
3 Dual user cell mostly - celllandline sample 4214532358 42099023 4630099 17062 17043 0019
4 Dual user not cell mostly - landline sample only
7793807812 77857831 8024718 31552 3152 0032
NHTSA region Output Weight
Sum of Weights37 Population
Total38
Sum of Weights
Difference39
of Output
Weights40
Population 41
Difference in 42
1 NHTSA Region 1 1179632569 11794622 170369 4776 4775 0001
2 NHTSA Region 2 3288798266 32898311 -1032834 13314 13318 -0004
3 NHTSA Region 3 2508412508 25055504 2862108 10155 10143 0012
4 NHTSA Region 4 3602234669 36002824 1952269 14583 14575 0008
5 NHTSA Region 5 4078884777 40741097 4775077 16513 16493 0019
6 NHTSA Region 6 3015910421 30183360 -2425579 12209 12219 -001
7 NHTSA Region 7 1304950072 13032118 1738272 5283 5276 0007
8 NHTSA Region 8 1002278294 10018964 381894 4058 4056 0002
9 NHTSA Region 9 3600443025 36079042 -7461175 14576 14606 -003
10 NHTSA Region 10 1119930098 11208905 -960402 4534 4538 -0004
Note Footnotes apply to each respective column heading in this section
31 Weighted count of adults based on raked (output) weight 32 Population count of adults based on American Community Survey 33 Output weight sum of weights minus population total 34 Weighted percent of adults based on raked (output) weight 35 Population percent of adults based on American Community Survey 36 of output weights minus population 37 Weighted count of adults based on raked (output) weight 38 Population count of adults based on American Community Survey 39 Output weight sum of weights minus population total 40 Weighted percent of adults based on raked (output) weight 41 Population percent of adults based on American Community Survey 42 of output weights minus population
C‐6
Number of People 16+ in HH Output Weight Sum of Weights
Population Total
Sum of Weights
Difference
of Output Weights
Population Difference
in
1 1 Person 16+ in HH 4136691078 41358674 823678 16747 16743 0003
2 2 People 16+ in HH 116349235 116304877 4435796 47102 47084 0018
3 3 People 16+ in HH 5043977599 50449212 -943601 2042 20424 -0004
4 4+ People 16+ in HH 3885882526 38901984 -4315874 15731 15749 -0017
Number of People in HH under 16 Output Weight Sum of Weights
Population Total
Sum of Weights
Difference
of Output Weights
Population Difference
in
1 0 Children under 16 in HH 1649764893 165093166 -11667665 66788 66835 -0047
2 1 Child under 16 in HH 3781383846 37773679 4015946 15308 15292 0016
3 2 Children under 16 in HH 2832396223 28257559 6640323 11467 1144 0027
4 3+ Children under 16 in HH 1590045696 15890343 1011396 6437 6433 0004
Tenure Output Weight Sum of Weights
Population Total
Sum of Weights
Difference
of Output Weights
Population Difference
in
1 Own 1622854236 162397537 -11211341 65699 65744 -0045
2 Rent 8472932341 84617210 11211341 34301 34256 0045
Education Output Weight Sum of Weights
Population Total
Sum of Weights
Difference
of Output Weights
Population Difference
in
1 Less than HS 3943858738 39473916 -3532862 15966 1598 -0014
2 HSGED 6692151297 66924310 -279703 27092 27093 -0001
3 Some college 7535109003 75310772 4031803 30505 30488 0016
4 College graduate 6530355661 65305749 -219239 26437 26438 -0001
C‐7
Race-ethnicity Output Weight Sum of Weights
Population Total
Sum of Weights
Difference
of Output Weights
Population Difference
in
1 Hispanic 3755875398 37498626 6012798 15205 15181 0024
2 White Non-Hispanic 1614156247 161512193 -9656834 65347 65386 -0039
3 Black Non-Hispanic 2887486208 28865584 927808 1169 11686 0004
4 AsianNHOPI Non-Hispanic 1321484655 13190879 2396755 535 534 001
5 AIAN Non-Hispanic 152768028 1526907 77328 0618 0618 0
6 OtherMultiracial Non-Hispanic 442297945 4420558 242145 1791 179 0001
Age group by gender Output Weight Sum of Weights
Population Total
Sum of Weights
Difference
of Output Weights
Population Difference
in
11 16-24 Male 20051714 20051714 0 8118 8118 0
12 16-24 Female 19387175 19387175 0 7849 7849 0
21 25-29 Male 10474745 10474745 0 4241 4241 0
22 25-29 Female 10515811 10515811 0 4257 4257 0
31 30-34 Male 10281237 10281237 0 4162 4162 0
32 30-34 Female 10501810 10501810 0 4251 4251 0
41 35-39 Male 9611576 9611576 0 3891 3891 0
42 35-39 Female 9909101 9909101 0 4012 4012 0
51 40-49 Male 20420984 20420984 0 8267 8267 0
52 40-49 Female 21229852 21229852 0 8595 8595 0
61 50-59 Male 20928245 20928245 0 8472 8472 0
62 50-59 Female 22225386 22225386 0 8998 8998 0
71 60-69 Male 15453706 15453706 0 6256 6256 0
72 60-69 Female 17140934 17140934 0 6939 6939 0
81 70+ Male 12339012 12339012 0 4995 4995 0
82 70+ Female 16543459 16543459 0 6697 6697 0
C‐8
Number of Respondents Who Had Their Weights Decreased by the Trimming 7
Number of Respondents Who Had Their Weights Increased by the Trimming 317
Raking output weight DD_FINAL_POP_WT
Weight Variable N Sum Minimum Maximum Mean Coefficient of
Variation
BSW_COMPOSITE 7231 4107165921 1195335196 1108332 567994 0637972168
DD_FINAL_POP_WT 7231 247014747 283532 31864548 3416052 0895132802
DD_FINAL_SAMP_WT 7231 7231 0083 93278864 1 0895132802
C‐9
DOT HS 812 461 March 2018
13123-031418-v5