national vector borne disease control programme dr. avdhesh kumar additional director national...
TRANSCRIPT

National Vector Borne Disease Control
Programme
Dr. Avdhesh Kumar Additional Director
National Vector Borne Disease Control Programme
Directorate General of Health ServicesMinistry of Health and Family Welfare,
Government of India

2
• 1953-54 Started as - National Malaria Control Programme (NMCP) dealing with malaria control only
• 1958-59 renamed as NMEP• 1971 – Urban Malaria Scheme launched • 1975 – National Filaria Control Programme (NFCP) which was in
operation since 1955 under NICD was divided and operational part was brought to NMEP while retaining training part with NICD.
• 1977 – Modified Plan of Operation (MPO) launched to reduce morbidity and mortality and also to sustain the gains achieved.
• 1991 – 92 Kala-azar Control Programme was launched under NMEP with separate budget head.
• 1998-99 1998-99 renamed as National Anti-Malaria Programme renamed as National Anti-Malaria Programme (NAMP)(NAMP)• 2003-04 2003-04 renamed as renamed as NVBDCPNVBDCP with a view to converge Dengue, JE and 3 with a view to converge Dengue, JE and 3
ongoing centrally sponsored schemes : NAMP,NFCP, Kala azarongoing centrally sponsored schemes : NAMP,NFCP, Kala azar• In 2006, Chikungunya re-emerged and brought under NVBDCP.In 2006, Chikungunya re-emerged and brought under NVBDCP.
About NVBDCP

Generic strategy for Prevention & Control of VBDs
Early diagnosis and complete treatment
(No specific drugs against Dengue, Chikungunya and JE)
Integrated Vector Management (IRS, LLIN, larvivorous fish,
chemical and bio-larvicide, source reduction)
Supportive intervention: Vaccination only against JE
Annual MDA using DEC and Albendazole for LFE
Behaviour Change Communication

Kala-Azar
4 States; 54 Districts; 130 million population
6 distt.,11.0 mil
4 districtsPop: 6.7 mil
33 distt., 62.3 mil
11 districtsPop. – 50 mil
•Exists in several countries•About 500 000 cases occur annually. •Five countries (India, Sudan, Nepal, Bangladesh and Brazil account for 90% of the global cases.
•In the SEA Region, KA occurs in111 districts).
•45 districts of Bangladesh, •54 districts of India and •12 districts of Nepal•Endemic in Bihar, West Bengal, Assam, Tamil Nadu during pre DDT era
•Re-appeared during seventies •A centrally sponsored VL control Programme launched in 1990-91
•Exists in several countries•About 500 000 cases occur annually. •Five countries (India, Sudan, Nepal, Bangladesh and Brazil account for 90% of the global cases.
•In the SEA Region, KA occurs in111 districts).
•45 districts of Bangladesh, •54 districts of India and •12 districts of Nepal•Endemic in Bihar, West Bengal, Assam, Tamil Nadu during pre DDT era
•Re-appeared during seventies •A centrally sponsored VL control Programme launched in 1990-91 • > 80% of all cases reported from Bihar
• 9 Dist in Bihar contribute 65-70% of cases

Lymphatic Filariasis - Disease Burden in India
•40% of Global Burden•Endemic in 20 States/UT-250 Dist.•600 million “at risk”•509 million targeted for MDA
2004 : > 1% Mf rate 174 Districts2012 : > 1% Mf rate 64 Districts Lymphoedema – 877,594 Hydrocele – 407,307 Hydrocele Operation– 110,842

1991
Geographical spread of Dengue in last 2 decades
2013
Dengue Cases/per district
1996

Spatial distribution of Chikungunya since 2006
Kolkata -1963
Vishakhapatnam – 1964
Kakinada -1965
Rajahmundry -1965
Chennai - 1964
Pondicherry - 1964
Nagpur 1965 1977
Barsi - !973,
Sagar - 1965
Chikungunya outbreaks in 1960s-70s
RAJASTHAN
ORISSA
GUJARAT
MAHARASHTRA
MADHYA PRADESH
BIHAR
UTTAR PRADESH
KARNATAKA
ANDHRA PRADESH
JAMMU & KASHMIR
ASSAM
TAMIL NADU
CHHATTISGARH
PUNJAB
JHARKHANDWEST BENGAL
ARUNACHAL PR.HARYANA
KERALA
UTTARAKHAND
HIMACHAL PRADESH
MANIPUR
MIZORAM
MEGHALAYANAGALAND
TRIPURA
SIKKIM
GOA
A&N ISLANDS
DELHI
D&N HAVELI
PONDICHERRY
LAKSHADWEEP
CHANDIGARH
DAMAN & DIU
N
EW
S
SONITPUR
TINSUKHIA
JORHAT
DHEMAJI
DIBRUGARH
GOLAGHATBARPETA
LAKHIMPUR
SIBSAGAR
UDALGURI
ASSAM
GAYA
PATNA
SARAN
ARARIASIWAN
NAWADA
CHAMPARAN WEST
NALANDA
CHAMPARAN EAST
VAISHALI
DARBHANGAMUZAFFARPUR
SAMASTIPUR
GOPALGANJ
JEHANABAD
BIHAR
VILLUPURAM
MADURAI
KARURTHANJAVUR
THIRUVARUR
TAMIL NADU
SAMASTIPUR
BIHAR
KHERI
HARDOISITAPUR
GONDA
BASTI
BAHRAICH
BALLIA
MAUAZAMGARH
DEORIA
SAHARANPUR
RAEBARELI
BALRAMPUR
KUSHINAGAR
GORAKHPUR
SRAWASTI
KANPUR(DEHAT)
MAHARAJGANJ
SANT KABIR NAGAR
SIDDHARTHNAGAR
UTTAR PRADESH
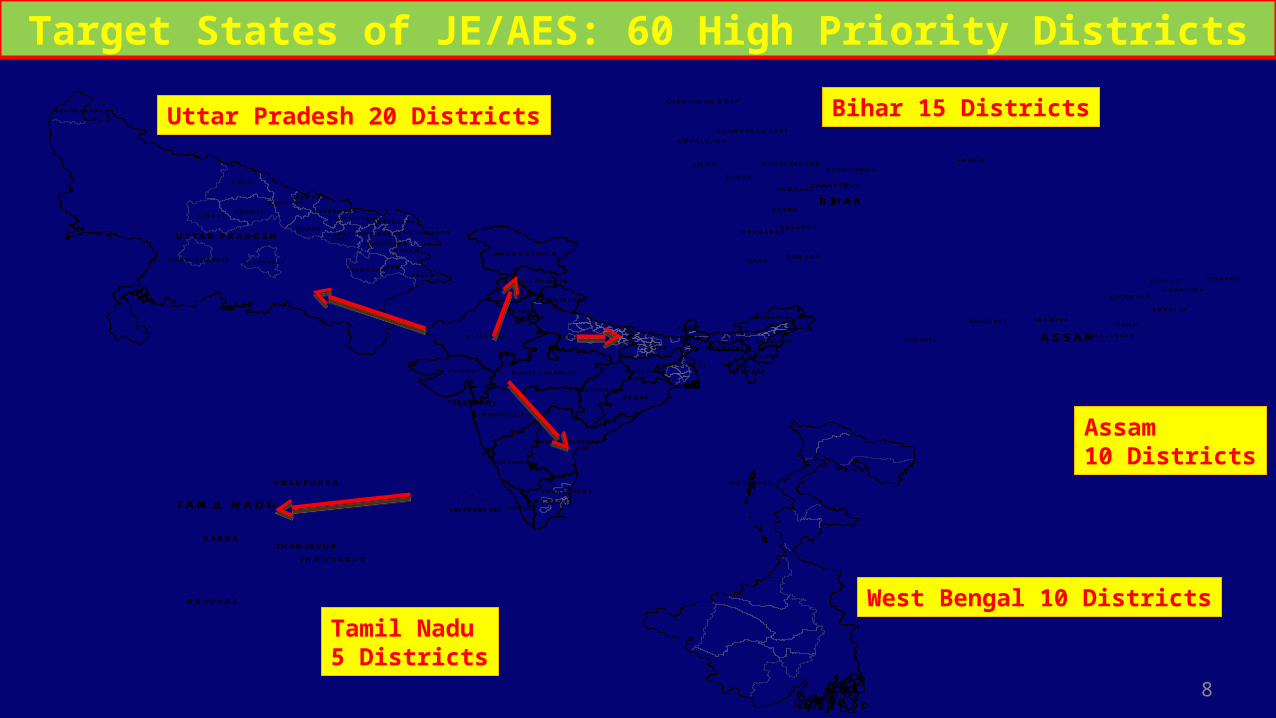
Target States of JE/AES: 60 High Priority Districts
Assam 10 Districts
Bihar 15 Districts
West Bengal 10 DistrictsTamil Nadu 5 Districts
Uttar Pradesh 20 Districts
8

Reported* Global SEARO IndiaAs per WMR* India is at• 18th position- total malaria• 21st position deaths.
India contributed to world malaria*•1.7% of malaria cases • 4.6% of Pv cases•1.1 % of Pf cases •0.3% of malaria deaths
Malaria cases 94.30 Mil. 4.44 Mil 1.59 Mil
Pv cases 16.40. Mil. 3.3 Mil 0.76 Mil
Pf cases 77.90 Mil. 1.1 Mil 0.83 Mil
Malaria deaths 3,45,960 2,426 1,018Estimated
Malaria deaths6,55,000 38,000 20,000
Malaria Cases & Deaths: Global vs India Scenario
*Source: World Malaria Report 2011
7 NE and 9 Other States –Odisha, Jharkhand, Chhattisgarh, MP, Andhra, Maharashtra, Gujarat, Karnataka & W Bengal contribute countries' 54% Population, >80% Total Malaria, >90% Pf. Cases and >90% deaths due to malaria
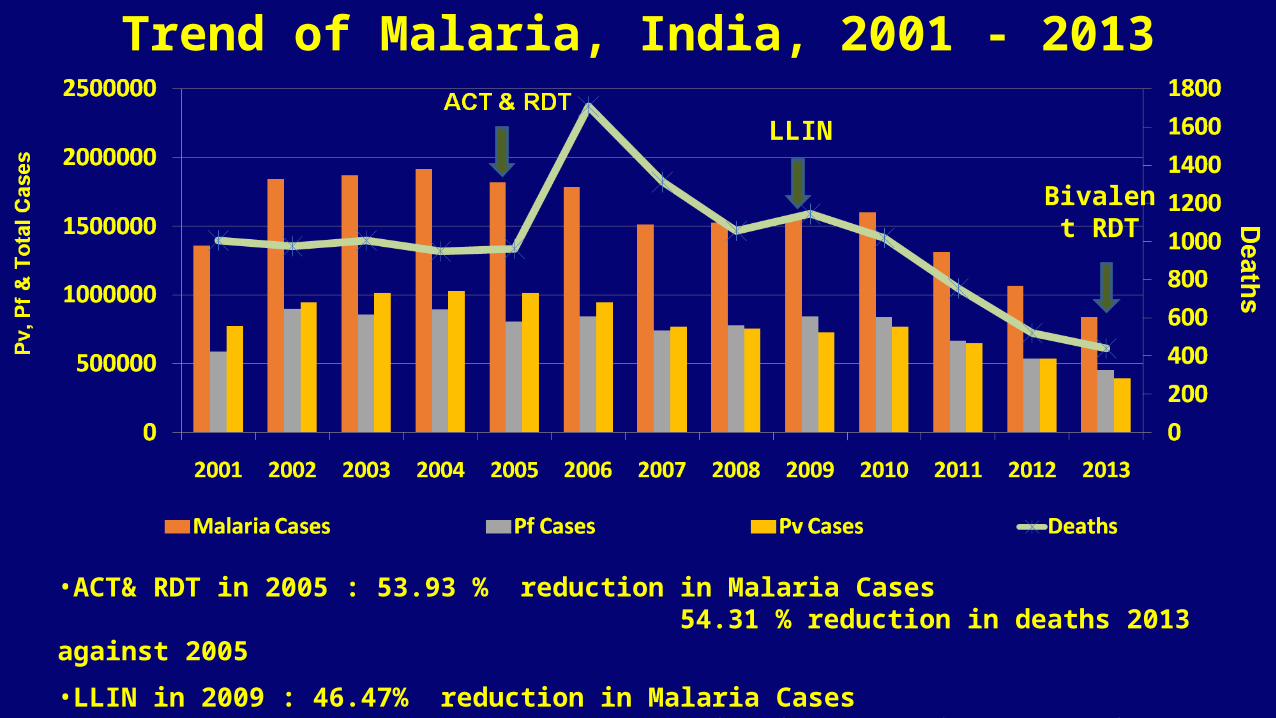
Trend of Malaria, India, 2001 - 2013
•ACT& RDT in 2005 : 53.93 % reduction in Malaria Cases 54.31 % reduction in deaths 2013 against 2005
•LLIN in 2009 : 46.47% reduction in Malaria Cases• 61.54% reduction in deaths in 2013 against 2009
LLIN
Bivalent RDT

MALARIA ENDEMIC AREAS
**Orissa, Jharkhand, Chhattisgarh, MP, Andhra Pradesh, Maharashtra Gujarat, Orissa, Jharkhand, Chhattisgarh, MP, Andhra Pradesh, Maharashtra Gujarat, Karnataka & West BengalKarnataka & West Bengal
PERCENTAGE CONTRIBUTION OF POPULATION, MALARIA CASES, PF CASES AND DEATHS in 2010
(Compared to the country total)
States%
Population
% Malaria cases
%Pf
cases% Death
N.E. States
4 11 16 21
Other high endemic states*
42 71 79 70
Other 54 18 5 9
API - 20100-1>1-2>2-5>5-10>10
Erstwhile World Bank Project(Rs.1000 Crore: 2008-2013)
GFATM: R-9 (Rs.417 Crore : 2010-2015)

Shrinking – Malaria Map- India
Stratification of Districts based on API
API2000 2012
No. % No: %
>10 59 10 32 4.9
>5-10 22 3.7 29 4.4
>2-5 65 11.14 48 7.3
1-2 72 12.2 58 8.8
<1 370 63 492 74.7
2013- (Prv) - 515 Districts recorded API<1 - 23 States recorded API<1
2013
Malaria Situation –India (2000-2013)
Year Cases Deaths
2000 19,42,318 959
2013 8,81,730 440

Prevention and Control strategy• Disease Management (for reducing the load of Morbidity & Mortality)
• Early case detection and complete treatment, • Strengthening of referral services, • Epidemic preparedness and rapid response.
• Integrated Vector Management (For Transmission Risk Reduction) • Indoor Residual Spraying in selected high risk areas, • use of Insecticide treated bed nets (ITN/LLINs), • use of Larvivorous fish, • anti larval measures in urban areas like source reduction and minor environmental engineering
• Supportive Interventions (for strengthening technical & social inputs)• Behaviour Change Communication (BCC), • Public Private Partnership, • Inter-sectoral convergence, • Human Resource Development through capacity building, • Operational research including studies on drug resistance and insecticide susceptibility,• Monitoring & evaluation through periodic reviews/field visits

API Stratification for Malaria Pre-EliminationNo. Category Definition
1. Category 1 States with API less than one, and all the districts in the state with API less than one
2. Category 2 States with API less than one and few districts reporting API more than one
3. Category 3 States with API more than one and either all the districts with API more than one or few districts with API less than one and few with API more than one
Strategies to be Adopted for various categories of API:•Epidemiological Surveillance and Disease Management for reducing parasite load in the community•Integrated Vector Management for reducing mosquitoes density•Supportive Interventions
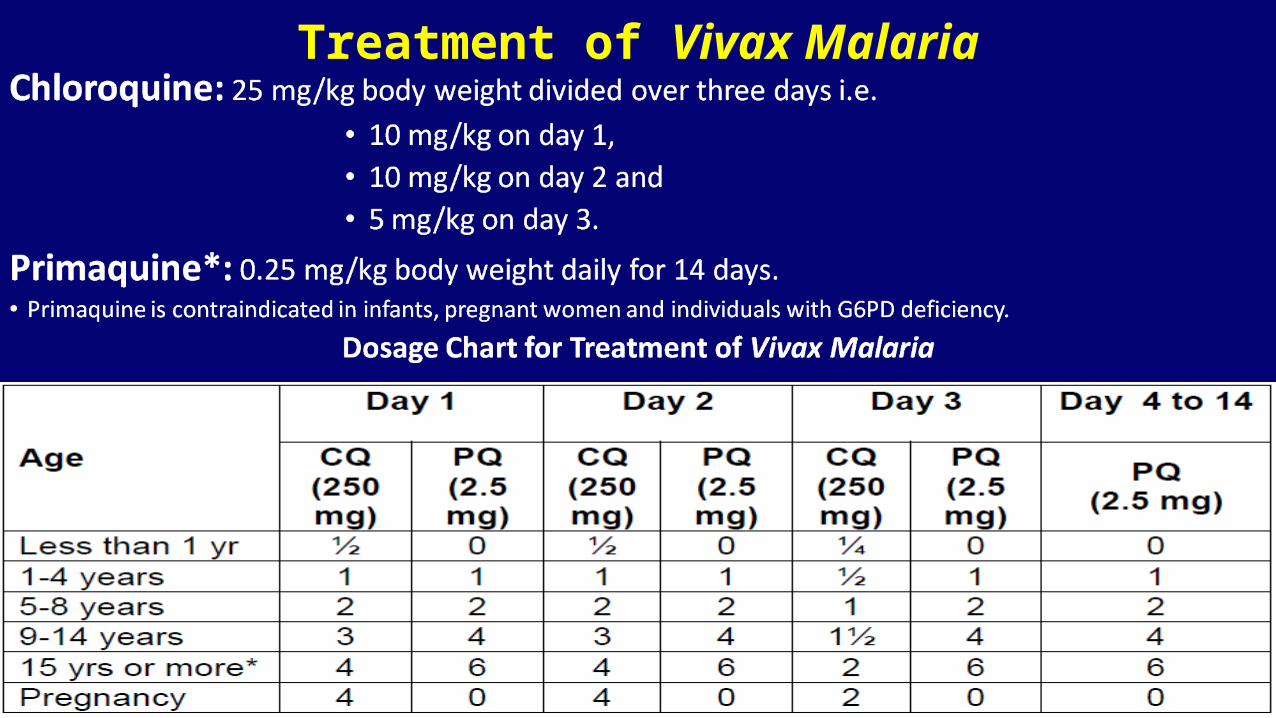
Treatment of Vivax Malaria

Treatment of Falciparum Malaria: NE States• ACT-AL Co-formulated tablet of ARTEMETHER (20 mg) - LUMEFANTRINE (120 mg) (Not
recommended during 1st trimester of pregnancy and for children weighing < 5 kg)
Dosage Chart for Treatment of falciparum Malaria with ACT-AL
Primaquine: 0.75 mg/kg body weight on day 2.
15 - < 25 Kg5 - <15 Kg 25 - <35 Kg ≥ 35 Kg

Treatment of Falciparum Malaria: other than NE States
• Artemisinin based Combination Therapy (ACT-SP)*• Artesunate 4 mg/kg body weight daily for 3 days Plus Sulfadoxine (25 mg/kg body weight) – Pyrimethamine
(1.25 mg/kg body weight)on first day.* ACT not to be given in 1st trimester of pregnancy.• Primaquine: 0.75 mg/kg body weight on day 2.
Dosage Chart for Treatment of falciparum Malaria with ACT-SP

IMA Initiative…– To strengthen the Programme:
–Elimination,
–Eradication
– Newer interventions: to increase the coverage
– Strengthening surveillance: all cases to be detected to achieve National goal for these diseases
– Standard diagnosis & treatment guidelines

Role of IMA in Vector Borne Diseases • Aligning Diagnosis & Treatment as per National Policy
(monotherapy banned)• All suspected cases to be tested for Malaria• Diagnosis by Good Quality Ag detecting Bivalent RDTs• Microscopy still the Gold Standard for diagnosis of malaria• Species specific treatment of Malaria to be given• Complete treatment be given• Reporting of cases through District Malaria Officers• IEC to Community

Way Forward…
Saturation of malaria endemic population with effective preventive measure (LLIN)
Quality coverage of high-risk population with IRS and provision of EDCT Sustaining incidence of malaria in areas with API<1 Bring Down malaria incidence in areas having API>1 Conducting Technical, Operational and Financial feasibility studies for
planning malaria elimination programme Pave way for elimination of malaria in subsequent years
Ensuring complete reporting of all VBDs including from private sectors

Thank You
IMAWHO, India