national water forum 2014 - mywp.org.my · akashah hj. majizat/ nurliyana abdul rahaman perbadanan...
TRANSCRIPT

Akashah Hj. Majizat/ Nurliyana Abdul Rahaman Perbadanan Putrajaya [email protected]
1
*Roles of Wetlands
+Presented at the National Water Forum, 9-10 June 2014 1 EDFSB
NATIONAL WATER FORUM 2014
2
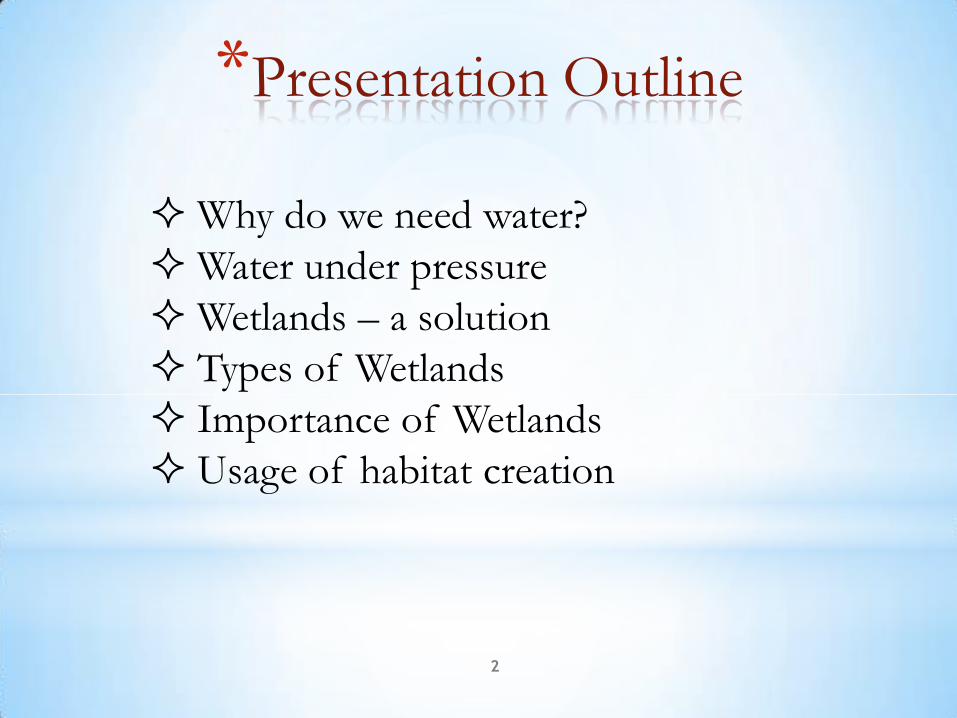
*Presentation Outline
Why do we need water?
Water under pressure
Wetlands – a solution
Types of Wetlands
Importance of Wetlands
Usage of habitat creation

Potable Water
Domestic Use
Agriculture
Industry
Power Generation
Aquaculture
Transportation
Tourism/ Recreation
Ecological Functions
Culture/ Religion
Commerce
Sanitation/ Health
3 EDFSB
*Why do we need water?

Supply of Water Resources
Freshwater Readily accessible freshwater
Biota 0.0001%
Rivers 0.0001%
Atmospheric water vapor
0.0001%
Lakes 0.0007%
Soil moisture 0.0005%
Groundwater 0.592%
Ice caps and glaciers
0.592%
0.014%
4 EDFSB

Malaysian Water Vision
Malaysian Water Vision “In support of Wawasan 2020 (towards achieving developed nation status), Malaysia will conserve and manage its water resources to ensure adequate and safe water for all (including the environment)”
Water for People Water for Food and Rural
Development
Water for Economic
Development
Water for the Environment
Water for Energy
From Vision to Mission (developed into the National Water Resources Policy, 2012)
5 EDFSB

6
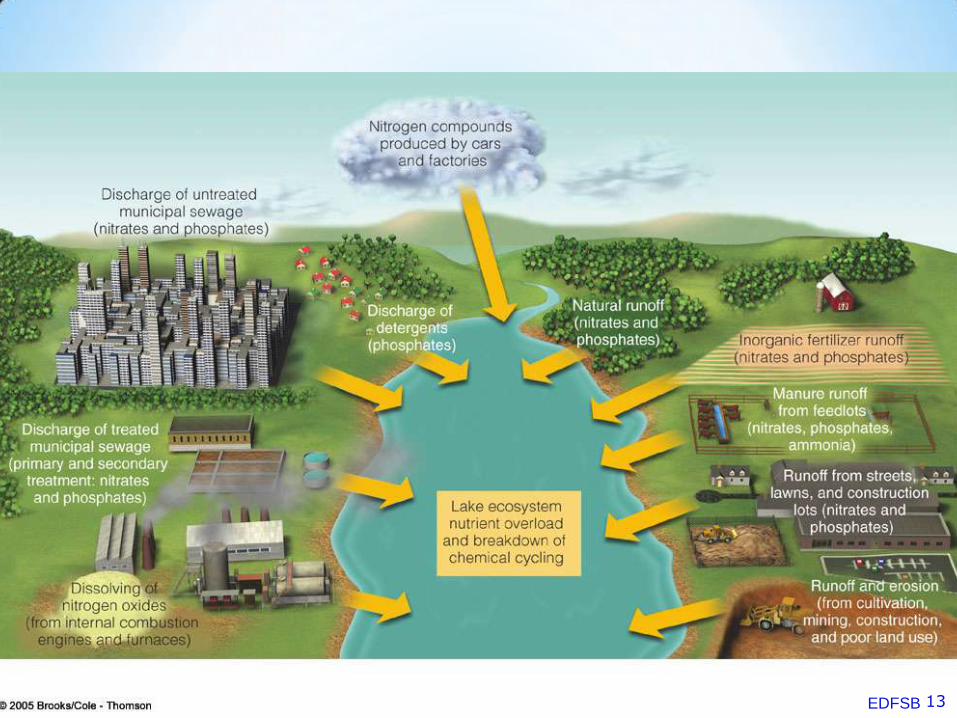
*Water under pressure

Pollution - Point and Nonpoint Sources
NONPOINT SOURCES
Urban streets
Suburban development
Wastewater treatment plant
Rural homes
Cropland
Factory
Animal feedlot
POINT SOURCES
7 EDFSB
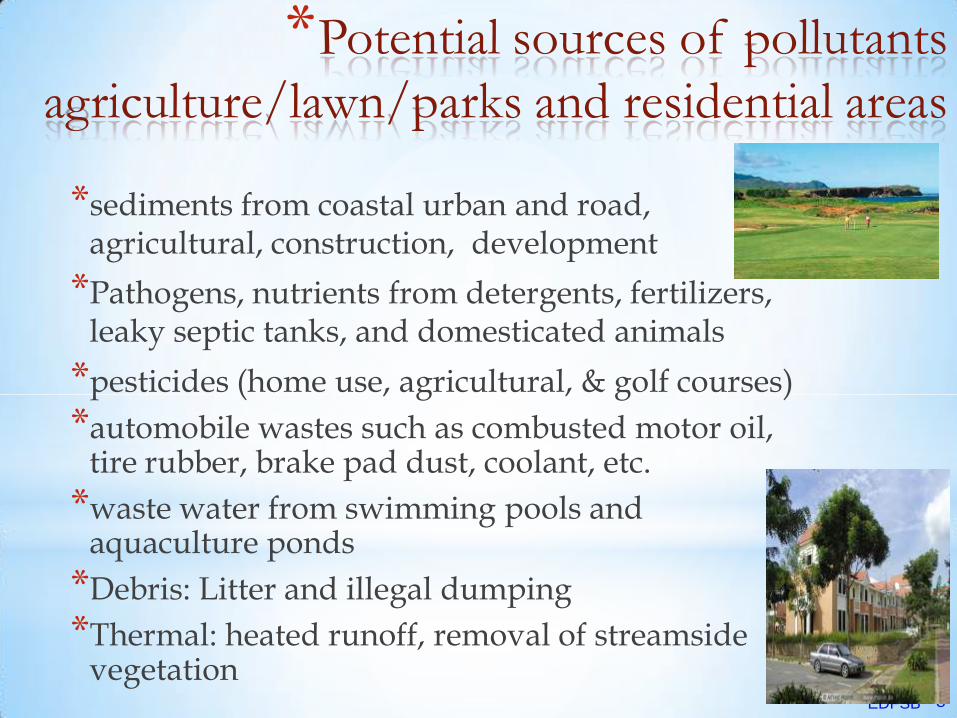
*Potential sources of pollutants
agriculture/lawn/parks and residential areas
*sediments from coastal urban and road,
agricultural, construction, development
*Pathogens, nutrients from detergents, fertilizers, leaky septic tanks, and domesticated animals
*pesticides (home use, agricultural, & golf courses)
*automobile wastes such as combusted motor oil, tire rubber, brake pad dust, coolant, etc.
*waste water from swimming pools and aquaculture ponds
*Debris: Litter and illegal dumping
*Thermal: heated runoff, removal of streamside vegetation
8 EDFSB

Pollutant Transport Mechanisms
NPS pollutants build up on land surfaces during dry weather
Atmospheric deposition
Fertilizer applications
Animal waste
Automotive exhaust/fluid leaks
Pollutants are washed off land surfaces during precipitation events (stormwater runoff)
Stormwater runoff will flow to wetlands lakes and streams

Pollutant Source
Solids Nutrients Pathogens DO Demands
Metals Oils Synthetic Organics
Soil Erosion √ √ √ √
Cleared Land √ √ √
Fertilisers √ √
Human Waste √ √ √ √
Animal Waste √ √ √ √ √
Vehicle Fuels and Fluids
√ √ √ √
Pesticides √ √ √
Stormwater Facilities
√ √ √ √ √
*Typical Urban Runoff Pollutant
Sources

Source: Brown, R.R and Wong, T.H.F (1995) Retrofitting a small urban catchment for stormwater polulution control, Proceedings of the 2nd International Symposium on Urban Stormwater management , melbourne, Australia July, pp. 381-386.
*Typical Urban Runoff Pollutant
Sources Pollutant
Source Solids Nutrients Pathogens DO
Demands Metals Oils Synthetic
Organics
Fuel Combustion
√ √ √
Vehicle Wear √ √
Insdustrial and Household Chemicals
√ √ √ √
√
Insdustrial Processes
√ √ √ √ √
Paint and Preservatives
√ √
Pesticides √ √ √
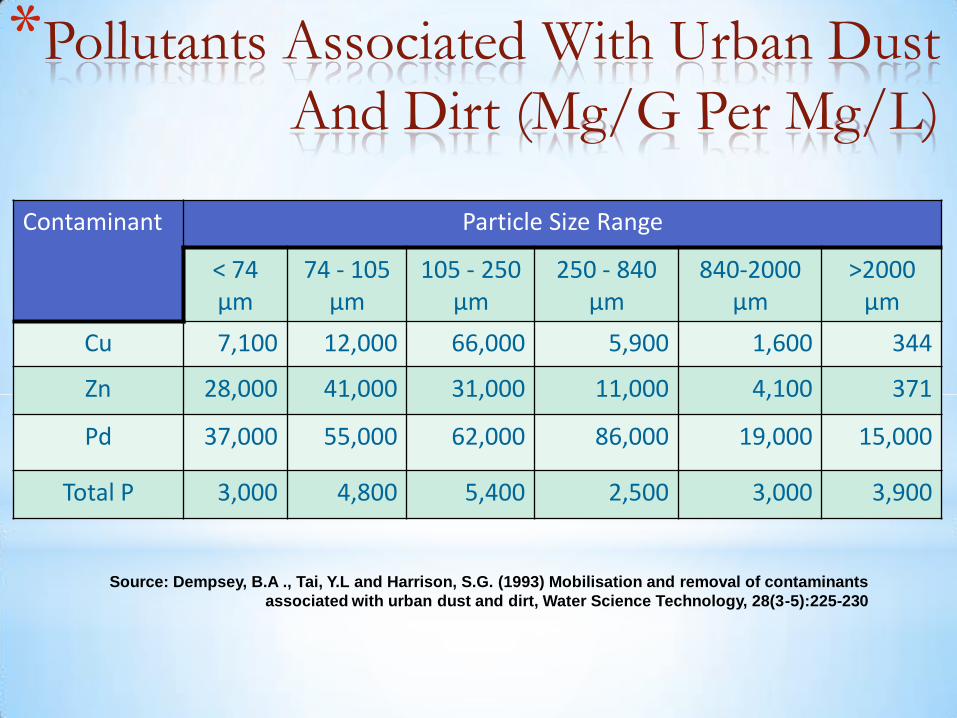
*Pollutants Associated With Urban Dust
And Dirt (Mg/G Per Mg/L)
Contaminant Particle Size Range
< 74 µm
74 - 105 µm
105 - 250 µm
250 - 840 µm
840-2000 µm
>2000 µm
Cu 7,100 12,000 66,000 5,900 1,600 344
Zn 28,000 41,000 31,000 11,000 4,100 371
Pd 37,000 55,000 62,000 86,000 19,000 15,000
Total P 3,000 4,800 5,400 2,500 3,000 3,900
Source: Dempsey, B.A ., Tai, Y.L and Harrison, S.G. (1993) Mobilisation and removal of contaminants associated with urban dust and dirt, Water Science Technology, 28(3-5):225-230
*
13 EDFSB

Nutrients and Algae Growth
14 EDFSB

15 EDFSB

Microcystis -A toxic blue-green alga
16 EDFSB

Eutrophication is apparent as increased turbidity in the northern part of the Caspian Sea, imaged from orbit

The eutrophication of the Potomac River is evident from its bright green water, caused by a dense bloom of cyanobacteria
18 EDFSB

*Controlling Measures
– Kaedah Kawalan

Wetlands – a solution
*Wetlands – lands
covered with water all or
part of a year

* Wetland = tanah lembap atau tanah bencah
* Kawasan berair sama ada buatan manusia atau semulajadi, bersifat kekal atau sementara, sama ada air tawar, payau atau air masin, yang mana kedalamannya tidak melebihi 6 meter semasa air surut.
(Definisi Wetland mengikut Persidangan Ramsar di Iran tahun 1971)

• Home to ~33% of nation’s threatened and endangered species;
• Statistics— 50% loss since 1900 in US; cities on filled wetlands; rising sea level;
• Mitigation banking—National Academy: ~half of attempts to build a wetland fail.
• More than 500 wetland restoration banks in the US
22 EDFSB
Wetlands – a solution

*
*Mostly by draining for development or farming.
*To ‘reclaim’ land along coastlines
23 EDFSB
Wetlands – a solution

*
BOG
MARSH
SWAMP
PRAIRIE POT HOLES
VERNAL POOLS
SLOUGH
FEN
MANGROVES
PEAT SWAMP FORESTS

*
Major Categories General Location Wetland types
Coastal Wetlands:
Marine (undiluted salt water) Open coast Shrub wetland, salt marsh, mangrove swamp
Estuarine (salt/freshwater mix)
Estuaries (deltas, lagoons)
Brackish marsh, shrub wetland, salt marsh, mangrove swamp
Inland Wetlands:
Riverine (associated w/ rivers and streams)
River channels and floodplains
Bottomlands, freshwater marsh, delta marsh
Lacustrine (associated w/ lakes)
Lakes and deltas Freshwater marsh, shrub and forest wetlands
Palustrine (shallow ponds, misc. freshwater wetlands)
Ponds, peatlands, uplands, ground water seeps
Ephemeral ponds, tundra peatland, ground water spring oasis, bogs

Bogs serve an important ecological function in preventing downstream flooding by absorbing precipitation. Bogs support some of the most interesting plants in the United States (like the carnivorous sundew), and provide habitat to animals threatened by human encroachment.
carnivorous sundew
The northern pitcher plant (Sarracenia purpurea) overcomes the nutrient deficiencies of bog life by capturing insects in pools of water in its leaves and digesting them with the help of some local bacteria.
*Current
*Herbaceous plants
*Mild acid/base
*No floating soil
*
*

*Current
*Woody plants
*More acid/base
*No floating soil
Swamps are forested wetlands. Like marshes, they are often found near rivers or lakes and have mineral soil that drains very slowly. Unlike marshes, they have trees and bushes. They may have water in them for the whole year or for only part of the year. Swamps vary in size and type. Some swamps have soil that is nutrient rich, other swamps have nutrient poor soil. Swamps are often classified by the types of trees that grow in them.
*Vernal pools are seasonal depressional wetlands that occur under the Mediterranean climate conditions of the West Coast. They are covered by shallow water for variable periods from winter to spring, but may be completely dry for most of the summer and fall. These wetlands range in size from small puddles to shallow lakes and are usually found in a gently sloping plain of grassland.
*
*

*Fens, like bogs, are peatlands, but because they are fed by groundwater they are not so acidic as bogs.
~77,000 sq km; 3 sub-basins
Thin sheet of water 40-60 miles wide
Formed ~5000 yrs ago--how
Human influences:
o late 1880’s—first dredging
o 1907 and 1928: canals—saltwater; draining south of Lake O.
o 1961-1971: Kissimee River channelized 65% now drained
Plants and animals depend on water level timing—seriously disturbed
Number of species of wading birds—dropped 95% since 1947
*
29
*
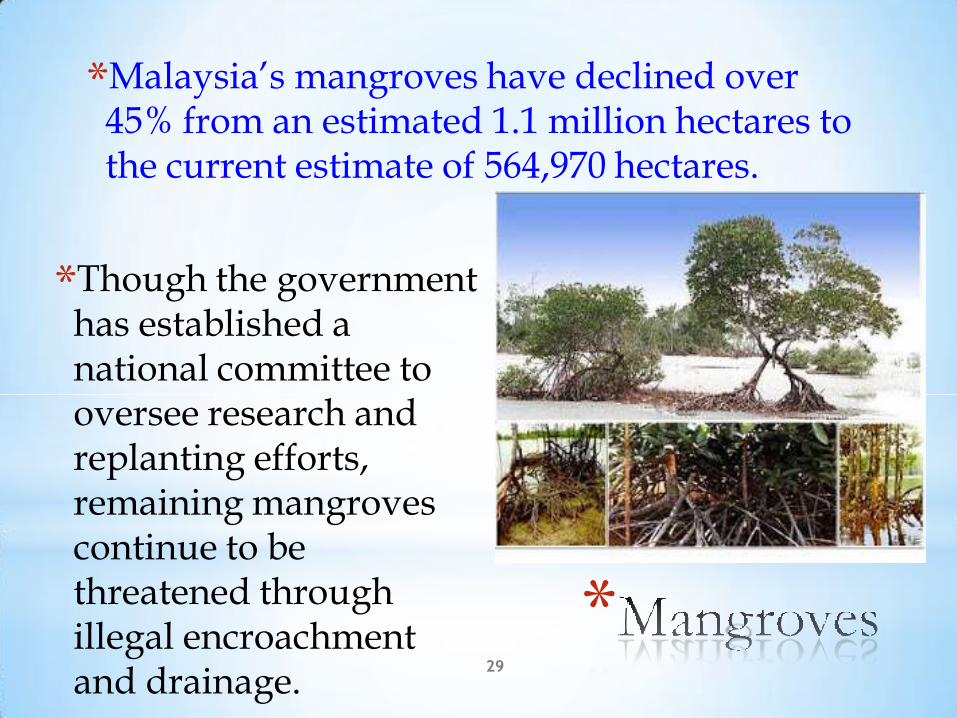
*Malaysia’s mangroves have declined over 45% from an estimated 1.1 million hectares to the current estimate of 564,970 hectares.
*Though the government has established a national committee to oversee research and replanting efforts, remaining mangroves continue to be threatened through illegal encroachment and drainage.
30
*
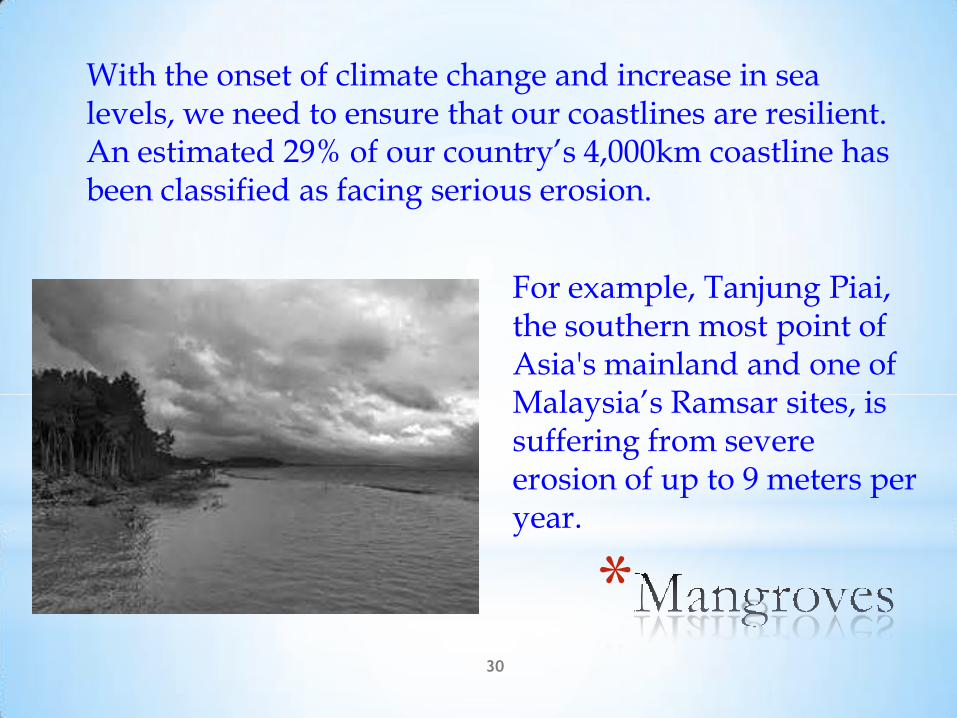
With the onset of climate change and increase in sea levels, we need to ensure that our coastlines are resilient. An estimated 29% of our country’s 4,000km coastline has been classified as facing serious erosion.
For example, Tanjung Piai, the southern most point of Asia's mainland and one of Malaysia’s Ramsar sites, is suffering from severe erosion of up to 9 meters per year.

31
*
While deforestation in non-peatland areas has declined, deforestation of tropical peatlands has increased over the last 20 years.
In 2005, 25% of all deforestation in Southeast Asia was on peatlands. Land use conversion and drainage of these valuable carbon stocks have led to fires on peatlands and large emissions of greenhouse gasses
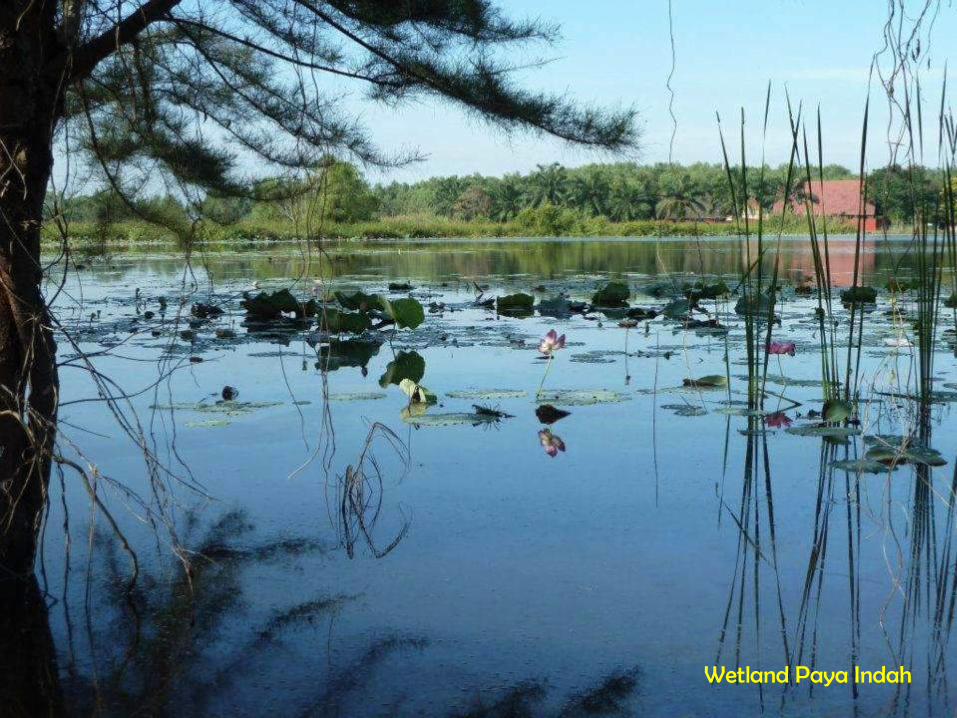
Wetland Paya Indah

*Wetland semulajadi vs wetland buatan
& kepentingannya
Wetland semulajadi = telah sedia ada
Wetland buatan = dibina untuk tujuan tertentu
*Ciri/contoh wetland semulajadi di Malaysia:
*Tasik (cth: Tasik Bera dan Tasik Chini),
*Sungai, Kuala (cth: Kuala Gula di Perak ),
*Paya gambut (cth: Paya Indah Wetlands di Selangor), serta
*Delta (seperti Delta Rajang di Sarawak, iaitu Sungai Rajang).
Contoh tanah bencah buatan:
- Kawasan empangan (empangan Kenyir): janakuasa tenaga hidro ,
- Kawasan sawah padi seperti di Kedah, Perak dan Selangor, serta
- Bekas tapak lombong
- Kawasan rekreasi air seperti Tasik dan Wetland Putrajaya
*Wetland semulajadi vs wetland buatan
& kepentingannya
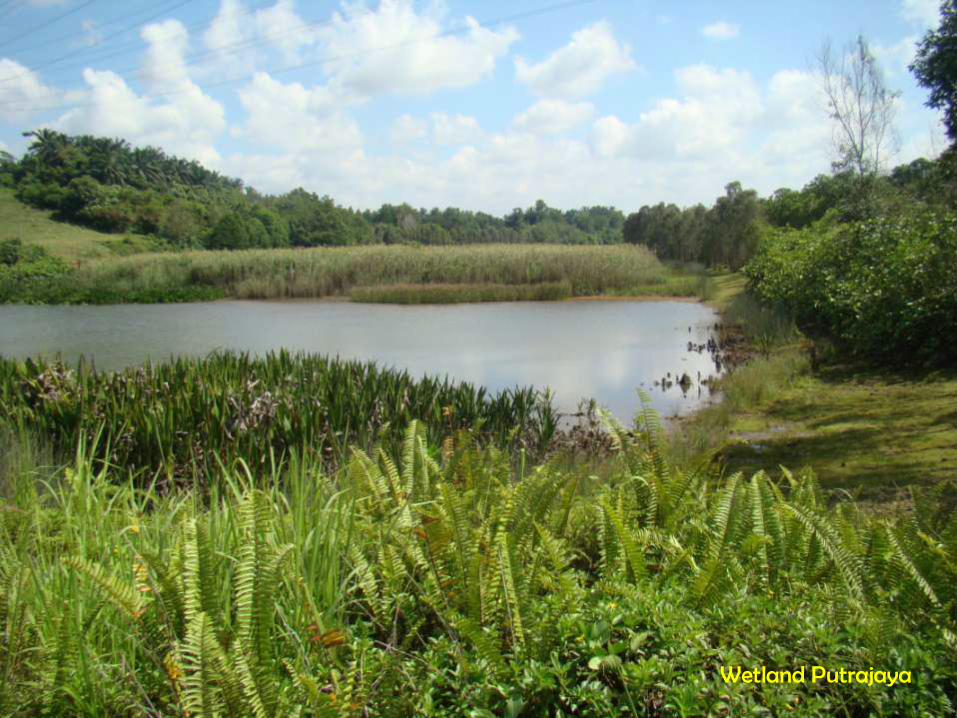
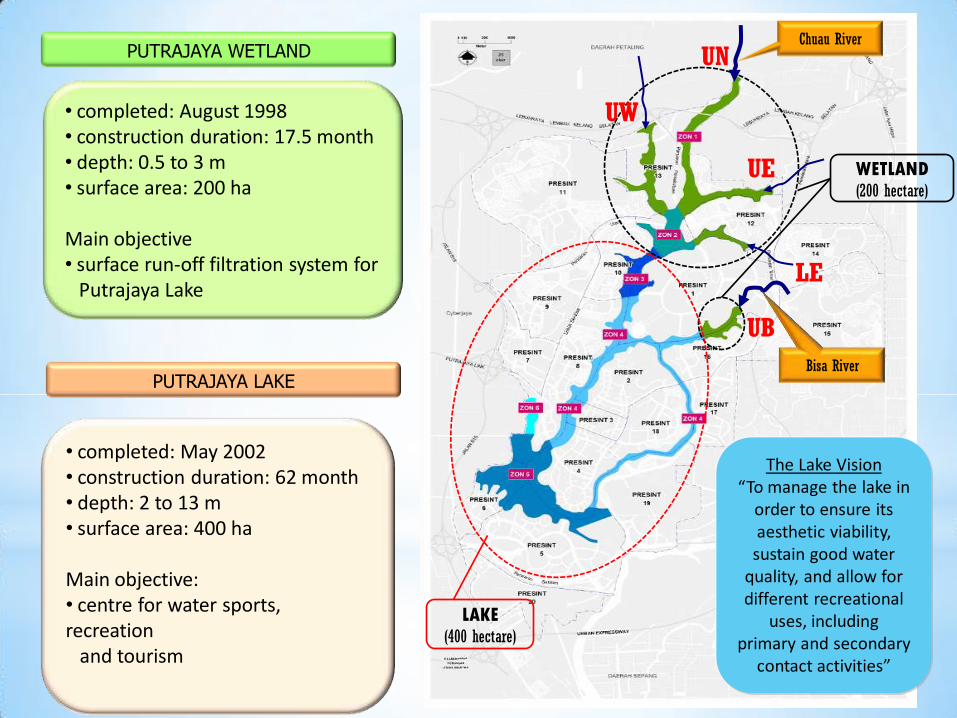
Wetland Putrajaya

LAKE (400 hectare)
Chuau River
Bisa River
WETLAND (200 hectare)
PUTRAJAYA LAKE
• completed: May 2002 • construction duration: 62 month • depth: 2 to 13 m • surface area: 400 ha Main objective: • centre for water sports, recreation and tourism
PUTRAJAYA WETLAND
• completed: August 1998 • construction duration: 17.5 month • depth: 0.5 to 3 m • surface area: 200 ha Main objective • surface run-off filtration system for Putrajaya Lake
The Lake Vision “To manage the lake in
order to ensure its aesthetic viability, sustain good water
quality, and allow for different recreational
uses, including primary and secondary
contact activities”

Upper North 6
Upper North 7
Upper North 5
Upper North 6a Pada 29 Dis 2012
Upper North 5 Pada 29 Dis 2012
Euglena bloom Wetland Cells - UN8, UN7, UN6, UN5 (2011-2012)
Wetlands

Euglena bloom Wetland cells UN8, UN7, UN6, UN5 (2011-2012)
Wetland_ Upper North 8 (Un8) 6 Dis 2012
Wetlands
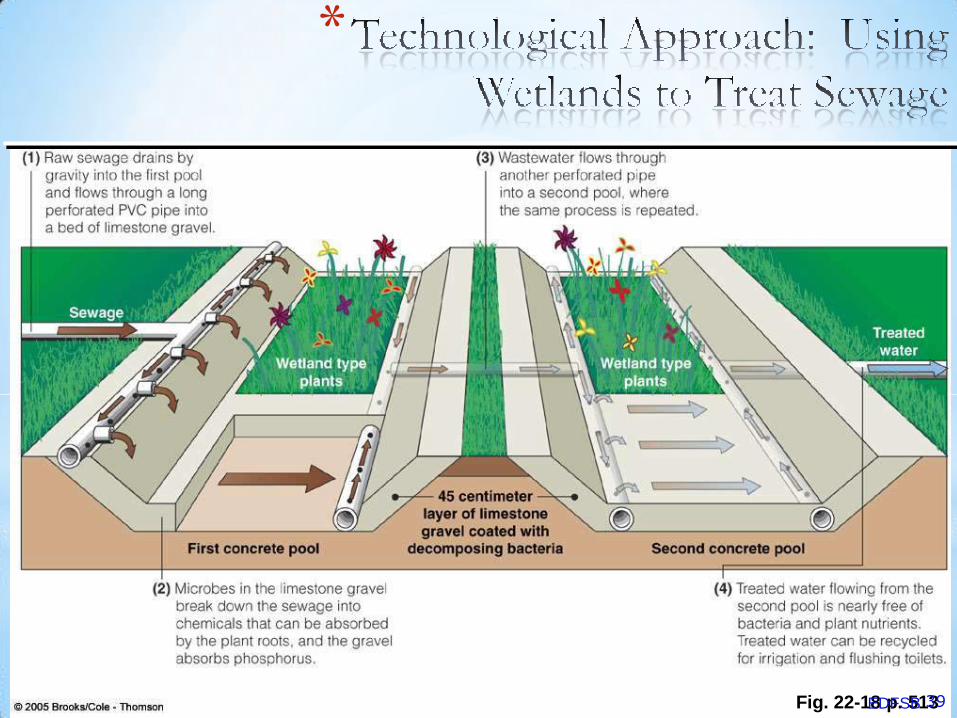
*
Fig. 22-18 p. 513 39 EDFSB

40
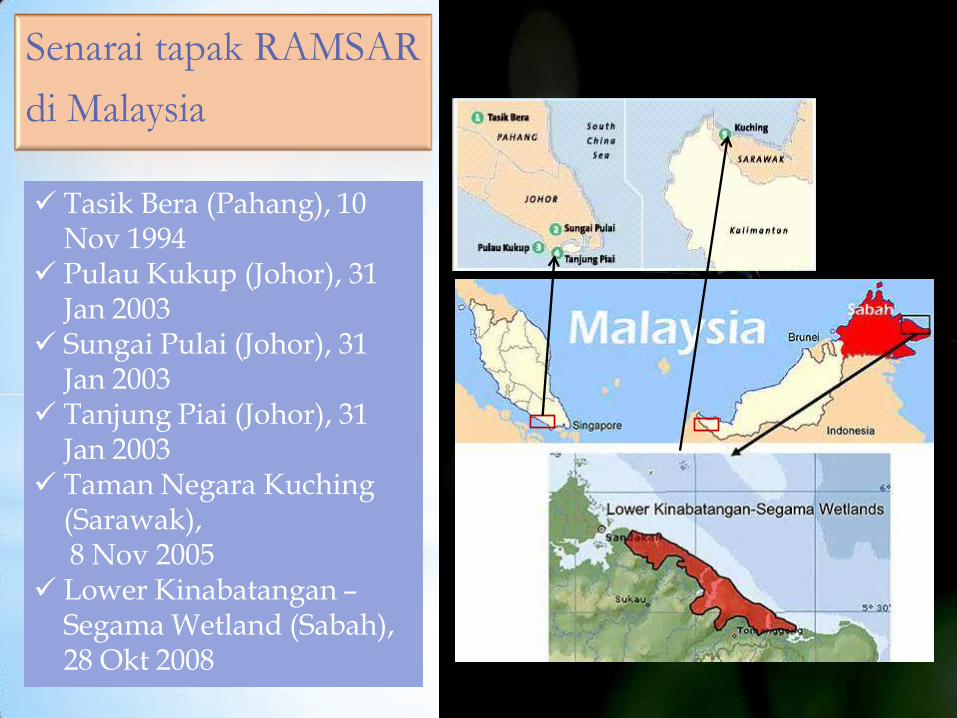
Senarai tapak RAMSAR
di Malaysia
Tasik Bera (Pahang), 10 Nov 1994
Pulau Kukup (Johor), 31 Jan 2003
Sungai Pulai (Johor), 31 Jan 2003
Tanjung Piai (Johor), 31 Jan 2003
Taman Negara Kuching (Sarawak),
8 Nov 2005 Lower Kinabatangan –
Segama Wetland (Sabah), 28 Okt 2008
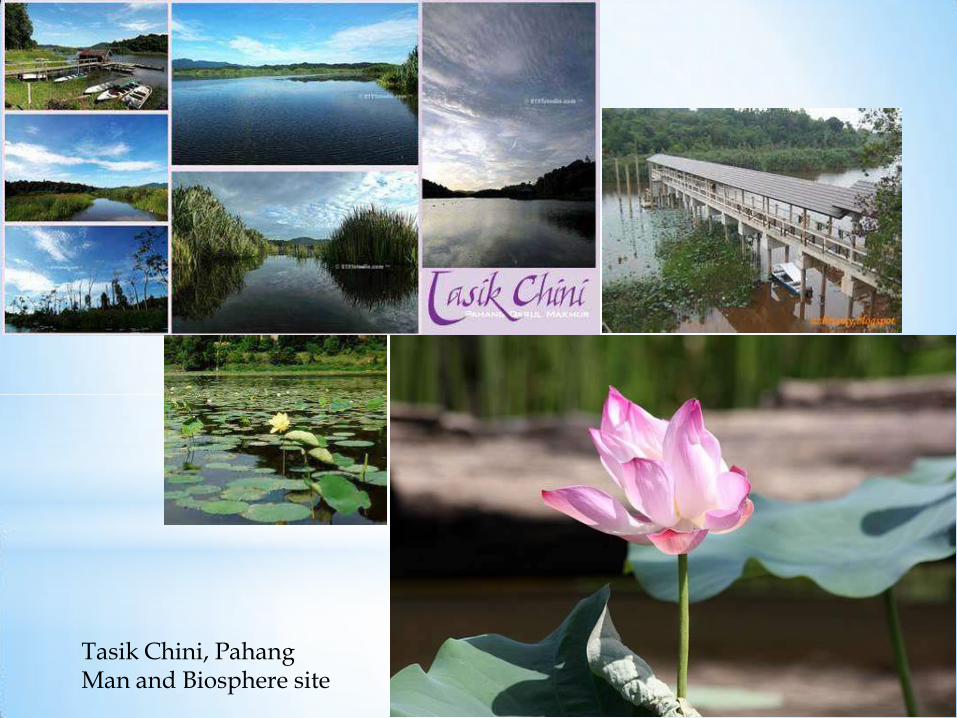
Tasik Chini, Pahang Man and Biosphere site
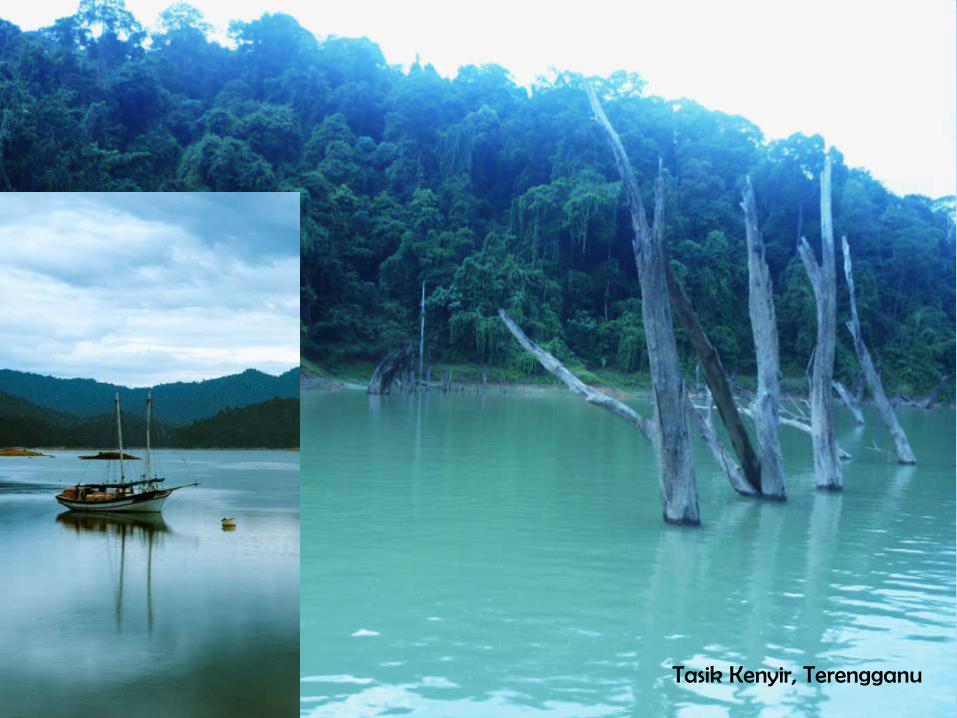
Tasik Kenyir, Terengganu

Sungai Kinabatangan


46
Why do we need water?
Water under pressure
Wetlands – a solution
Types of Wetlands
Importance of Wetlands
Usage of habitat creation
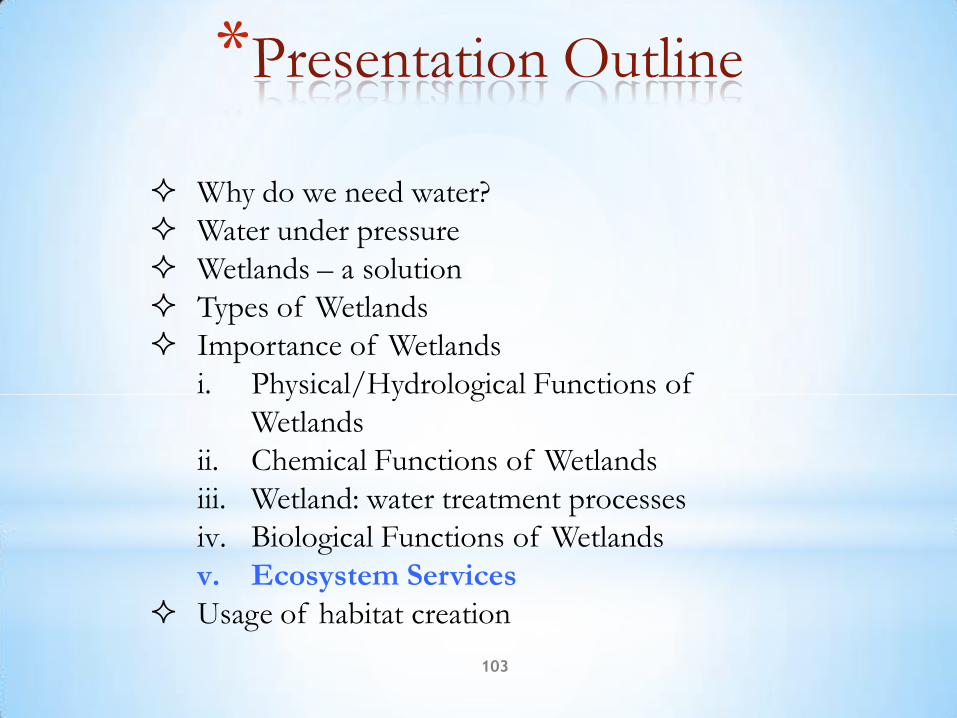
*Presentation Outline

*Importance Of
Wetlands 47
Why Are Wetlands Valuable?
i. Physical/Hydrological Functions of
Wetlands
ii. Chemical Functions of Wetlands
iii. Wetland: water treatment processes
iv. Biological Functions of Wetlands
v. Ecosystem Services

*
* Flood Control
*Correlation between wetland loss and downstream flooding
* can capture, store and slowly release water over a period of time
* Storm Water Control/Floodflow alteration
*Coastal and Slope Protection
* Serve as storm buffers –erosion control
*Ground Water Recharge
*Water has more time to percolate through the soil
* Surface and Groundwater Protection/ recharge and discharge
*Natural filter - Sediment Traps
*Wetland plants help to remove sediment from flowing water
* sediment stabilization /toxicant retention/removal
*Atmospheric Equilibrium
*Can act as ‘sinks’ for excess carbon and sulfur
*Can return N back to the atmosphere (denitrification)

Kawalan Banjir - Flood and Storm
Water Control
• Correlation between wetland loss and downstream flooding
• can capture, store, and slowly release water over a period of time
Kawalan Banjir - Flood and Storm
Water Control
Tanah bencah sebenarnya mampu memerangkap air sewaktu banjir dan membantu melindungi kawasan rendah daripada dilanda banjir. Oleh kerana tanah bencah merupakan kawasan yang rendah maka tahap takungan airnya tinggi.
Walaupun sudah berair...banyak tempat tanah bencah sekadar mempunyai air yang minimum sahaja dan mampu menampung air pada waktu hujan lebat.

Paya bakau merupakan penambak laut semulajadi. Sedimen serta kelodak yang terperangkap bertahun-tahun lamanya membolehkannya saiz tanah daratan bertambah luas.
Penambak laut Serve as storm buffers

Tanah bencah melindungi pinggir pantai daripada mengalami proses hakisan yang serius. Malahan tanah bencah juga merupakan penebat tenaga angin untuk menyerap tenaga angin ketika berlakunya ribut di pinggir pantai. Malahan dikatakan jika sepanjang pantai di Banda Acheh tanah bencahnya tidak diganggu untuk pembangunan, tanah bencah yang dipenuhi dengan pokok bakau mampu menyerap hentaman tsunami sebanyak 30%.
Pelindungan Pinggir Pantai
(zon penampan)

Natural filter –
sediment
stabilization
/toxicant retention
*Sediment
Runoff
Tanah bencah berfungsi seolah-olah sebagai penuras yang boleh memerangkap sedimen seperti kelodak yang melaluinya sebelum menuju ke laut.
Cth: Di Wetland Putrajaya, tumbuhan wetland ditanam khusus untuk berfungsi menyerap serta menapis bahan pencemar. Dengan yang demikian, air yang melaluinya akan dapat ditambahbaik kualiti.
Memerangkap sedimen
Wetland plants help to remove sediment from flowing water
*
*Pollution Interception
*Nutrient uptake by plants
*Settle in anaerobic soil and become reduced
*Processed by bacterial action
*Toxic Residue Processing
*Buried and neutralized in soils, taken up by plants, reduced through ion exchange
*Large-scale / long-term additions can exceed a wetland’s capacity

57

Wetlands for Water Quality
*Wetland: water treatment processes
*Major water treatment processes in wetland
*Attachment
*Sedimentation
*Die-off
*Nutrient uptake
*Microbial degradation of organics
*Aquatic macrophytes create an enabling environment

*
*Reclamation of wastewater provides
*An alternative water source for Irrigation
*Parks, Medians, schools and
*Golf Courses
*Water Treatment
*Secondary Wastewater
*Backwash Water from WW Treatment Plant
*Stormwater Runoff
*Riparian Habitat for
Migratory birds
*Production of
New Problems
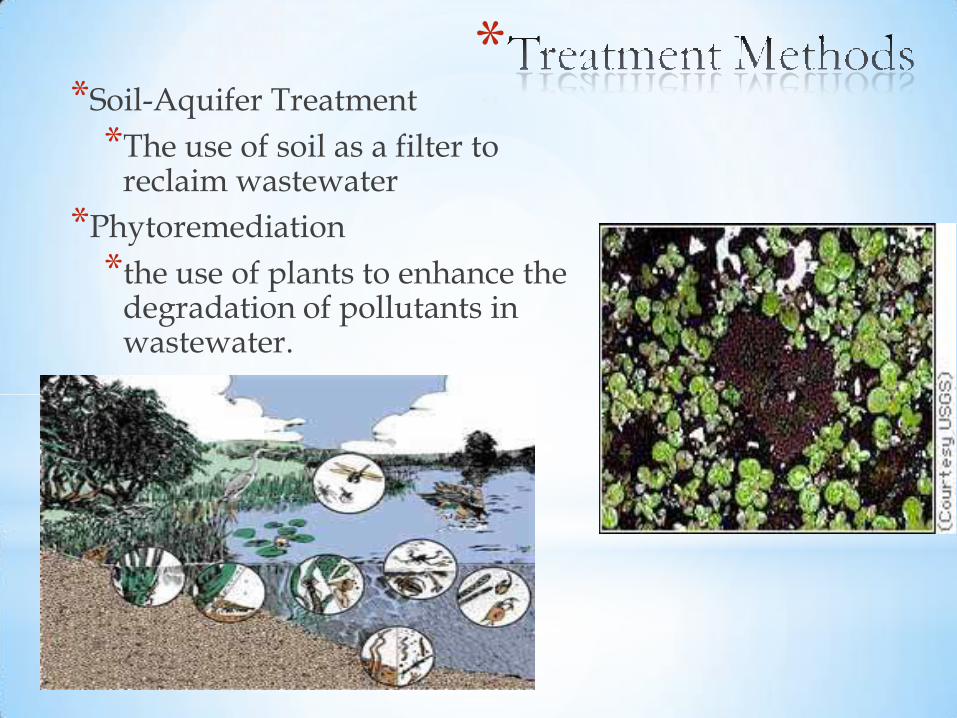
**Soil-Aquifer Treatment
*The use of soil as a filter to reclaim wastewater
*Phytoremediation
*the use of plants to enhance the degradation of pollutants in wastewater.
*
*Reduction-Oxidation in oxygenated Rhizosphere (toxic trace metals)
*Accumulation of excess nutrients (N,P) into plant tissue
*S, Fe, Cu, Se

*
The use of plants to degrade a variety of pollutants present in wastewater.
Heavy Metals
Trace metals
Nutrients
Organics
Pathogens
Diagram courtesy USEPA Office of Solid Waste http://clu-in.org/download/citizens/citphyto.pdf

*
Phytoextraction or Phytoconcentration
contaminant is concentrated in roots, stem and leaves
Phytodegradation breakdown of the contaminant molecule by plant enzymes which act as to help catalyze
Rhizosphere Biodegradation
plant roots release nutrients to microorganisms which are active in biodegradation of the contaminant molecule
Volatilization transpiration of organics through leaves of the plant
Stabilization plant converts the contaminant into a form which is not bioavailable, or the plant prevents the spreading of a contaminant plume
Ekosistem wetland berupaya memerangkap nutrien dan mengawal kandungan nutrien di dalam air.
Cth: kawasan penanaman padi sawah di Delta Kedah dan Delta Kemubu Kelantan yang mempunyai tanih aluvium yang sangat subur untuk penanaman padi.
Kawalan nutrien dan
kawalan bahan
pencemaran

89.0 90.0
92.094.5 94.3 93.1 93.9 92.8 93.0 93.9 93.5
91.588.7
92.7
76.5
65.067.570.072.575.077.580.082.585.087.590.092.595.097.5
2001 2002 2003 2004 2005 2006 2007 2008 2009 2010 2011 2012 2013
WQ
I
Year
WQI (AVE) 2001-2013
WQI WQI Class I(>92.7) WQI Class II(76.5-92.7)
Putrajaya Lake water quality is monitored to ensure it is safe and suitable for body contact activities. Data collected since 2001 shows the quality has surpassed its target of minimum WQI = 76.5
Putrajaya Lake Water Quality

LAKE (400 hectare)
Chuau River
Bisa River
WETLAND (200 hectare)
PUTRAJAYA LAKE
• completed: May 2002 • construction duration: 62 month • depth: 2 to 13 m • surface area: 400 ha Main objective: • centre for water sports, recreation and tourism
PUTRAJAYA WETLAND
• completed: August 1998 • construction duration: 17.5 month • depth: 0.5 to 3 m • surface area: 200 ha Main objective • surface run-off filtration system for Putrajaya Lake
The Lake Vision “To manage the lake in
order to ensure its aesthetic viability, sustain good water
quality, and allow for different recreational
uses, including primary and secondary
contact activities”
UB
LE
UE
UN
UW

60
65
70
75
80
85
90
95
2001 2002 2003 2004 2005 2006 2007 2008 2009 2010 2011 2012 2013
LE
UB2
UE1
UN8
UW7
Tasik
Class II (76.5-92.7)
Station 2001 2002 2003 2004 2005 2006 2007 2008 2009 2010 2011 2012 2013
LE1 94.1 93.8 92.9 94.7 91.7 88.7 86.4 90.9 93.4 93.0 90.9 91.2 88.6
UB2 93.2 88.6 91.5 90.8 87.5 85.3 85.3 86.0 90.6 90.8 91.6 84.6 83.5
UE1 87.7 91.2 90.2 89.3 91.0 88.0 89.7 89.7 92.2 92.4 91.7 90.7 85.4
UN8 82.9 82.9 75.2 70.4 81.4 80.9 82.8 78.4 80.3 83.1 83.8 83.3 81.9
UW7 88.1 84.9 90.1 84.3 88.3 83.5 86.4 83.0 90.9 89.1 88.5 86.7 84.8
Tasik 89.0 90.0 92.0 94.5 94.3 93.1 93.9 92.8 93.0 93.9 93.5 91.5 88.7
Putrajaya Wetland and Lake
Water Quality Index (WQI)
LAKE (400 hectare)
Chuau River
Bisa River
WETLAND (200 hectare)
PUTRAJAYA LAKE
• completed: May 2002 • construction duration: 62 month • depth: 2 to 13 m • surface area: 400 ha Main objective: • centre for water sports, recreation and tourism
PUTRAJAYA WETLAND
• completed: August 1998 • construction duration: 17.5 month • depth: 0.5 to 3 m • surface area: 200 ha Main objective • surface run-off filtration system for Putrajaya Lake
The Lake Vision “To manage the lake in
order to ensure its aesthetic viability, sustain good water
quality, and allow for different recreational
uses, including primary and secondary
contact activities”
UB
LE
UE
UN
UW

69

*
*Biological Production
*6.4% of the Earth’s surface 24% of total global productivity
*Detritus based food webs
*Habitat
*80% of all breeding bird populations along with >50% of the protected migratory bird species rely on wetlands at some point in their life
*95% of all U.S. commercial fish and shellfish species depends on wetlands to some extent

Tanah bencah merupakan khazanah daripada tuhan yang sangat bernilai kepada kita semua. Banyak tanah bencah telah diubah suai atau ditebus guna untuk kegiatan ekonomi terutamanya.
Kawasan tanah bencah yang diwartakan sebagai tanah bencah simpan perlu supaya generasi akan datang dapat mengenali tanah bencah serta fungsinya di masa akan datang.
Sumber
Genetik/Khazanah
Biodiversiti

Cth: Orang asli suku Semelai menghuni Tasik Bera, manakala kaum asli suku Jakun mendiami Tasik Chini.
*Habitat Creation
Wetlands can treat surface run-off pollutants, as well as providing habitat for:
*Birds
*Mammals
*Reptiles and Amphibians
*Crustaceans
*Fish
*Human livelihood

*Advantages to Creating
Habitat
*Wildlife Habitat
*Migratory Birds
*Opportunities for variety of wildlife
Purple Heron in
Putrajaya Wetland

*
*Primary Production
*Wildlife Food
*Oxygen Production
*Shelter
*Protection from predation for small fish
*Fish Spawning
*Several fish attach eggs to aquatic macrophytes
*Some fish build nests in plant beds
*Water Treatment
*Wetland plants are very effective at removing nitrogen and phosphorous from polluted waters
Submerged macrophytes can provide shelter for young fish as well as house an abundant food supply.
Some fish will attach their eggs to aquatic vegetation.

Putrajaya - Diversity of Aquatic Life
Nota : EIA (1995) – not recorded
0
50
100
150
2006 2007 2008 2009 2010 2011 2012 2013
Phytoplankton
Zooplankton
Macrobenthos
Mayfly nymphs inhabit fast-flowing streams and shallow ponds with high levels of dissolved oxygen and low levels of pollutants. They serve as bioindicators of good water
quality.
Phytoplankton Zooplankton Macrobenthos
2006 (baseline)
2007 2008 2009 2010 2011 2012 2013 Inventory data up to 2013
Phytoplankton 100 125 105 106 140 120 130 105 195
Zooplankton 42 58 79 89 61 44 50 54 111
Macrobenthos 09 13 14 15 16 16 15 15 20

Putrajaya - Diversity of Fish
*EIA (1995) : 10 species of fish in riverine system **2008 onwards, fish monitoring in the lake done by Fisheries Department
This healthy 10.34 kg of Probarbus jullieni (Jullien’s Golden Carp/
Temoleh) had been donated to Fishery Department to be
induced for breeding
5
10
15
20
25
30
35
1995(EIA)
1997 2000 2008 2009 2010 2011 2012 2013
Bilanganspesies ikan
Year
1995 (EIA)
1997 2000 2008 2009 2010 2011 2012 2013 Inventory data up to 2013
No of species
10 21 33 17 18 16 16 15 18 51

*Wildlife
Birds
*Variety of migratory and non-migratory species
*Major food sources include submerged plants, plant seeds, grasses, fish, aquatic invertebrates, and terrestrial invertebrates that inhabit reeds and willows.
*Since many birds are migratory, the variety and number depends on the time of year.
Birders at the Sweetwater Wetlands locating waterfowl
http://www.azstarnet.com/dailystar/snmedia/18572
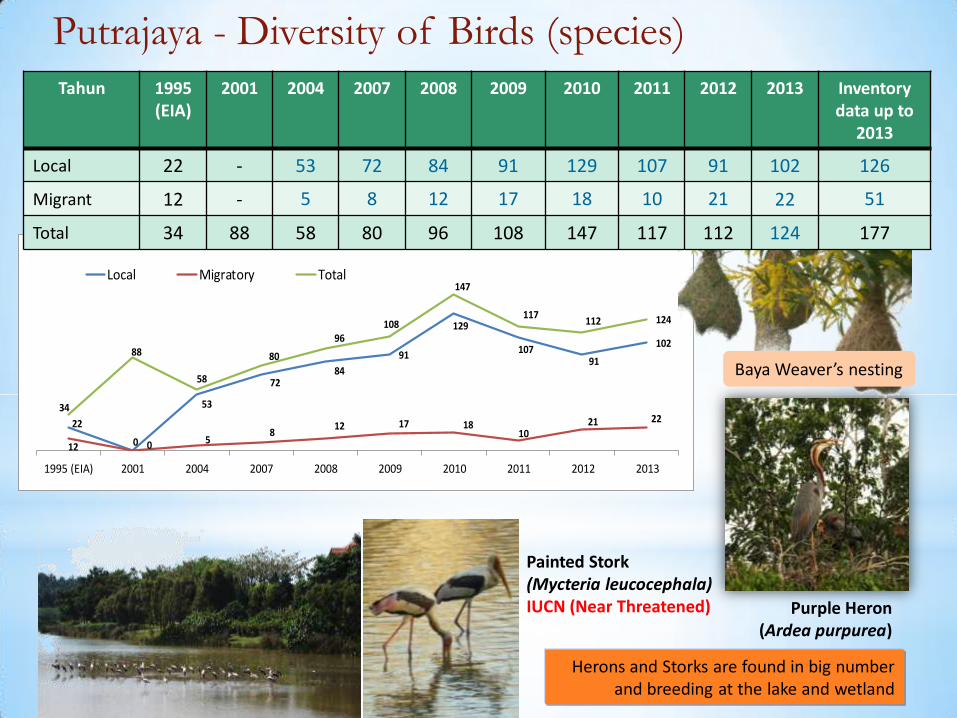
Putrajaya - Diversity of Birds (species)
Painted Stork (Mycteria leucocephala) IUCN (Near Threatened) Purple Heron
(Ardea purpurea)
Herons and Storks are found in big number and breeding at the lake and wetland
22
0
53
7284
91
129
10791
102
12 0 58
12 17 1810
21 2234
88
58
80
96108
147
117112 124
1995 (EIA) 2001 2004 2007 2008 2009 2010 2011 2012 2013
Local Migratory Total
Baya Weaver’s nesting
Tahun
1995 (EIA)
2001 2004 2007 2008 2009 2010 2011 2012 2013 Inventory data up to
2013
Local 22 - 53 72 84 91 129 107 91 102 126
Migrant 12 - 5 8 12 17 18 10 21 22 51
Total 34 88 58 80 96 108 147 117 112 124 177

79
Painted Stork resting in Central Wetland, Putrajaya
80
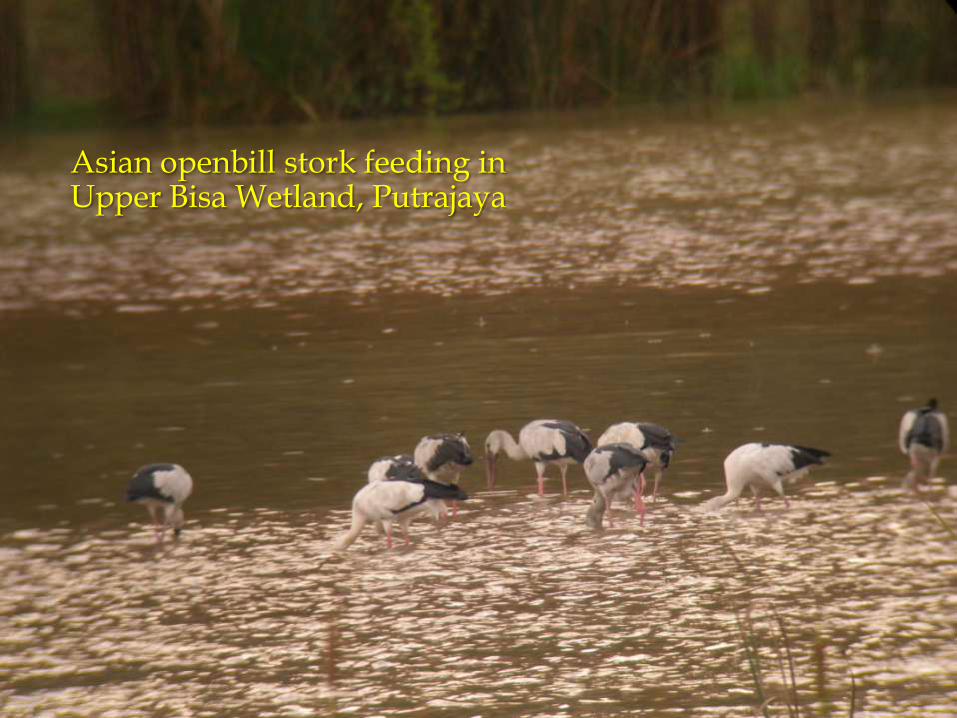
Asian openbill stork feeding in Upper Bisa Wetland, Putrajaya
81
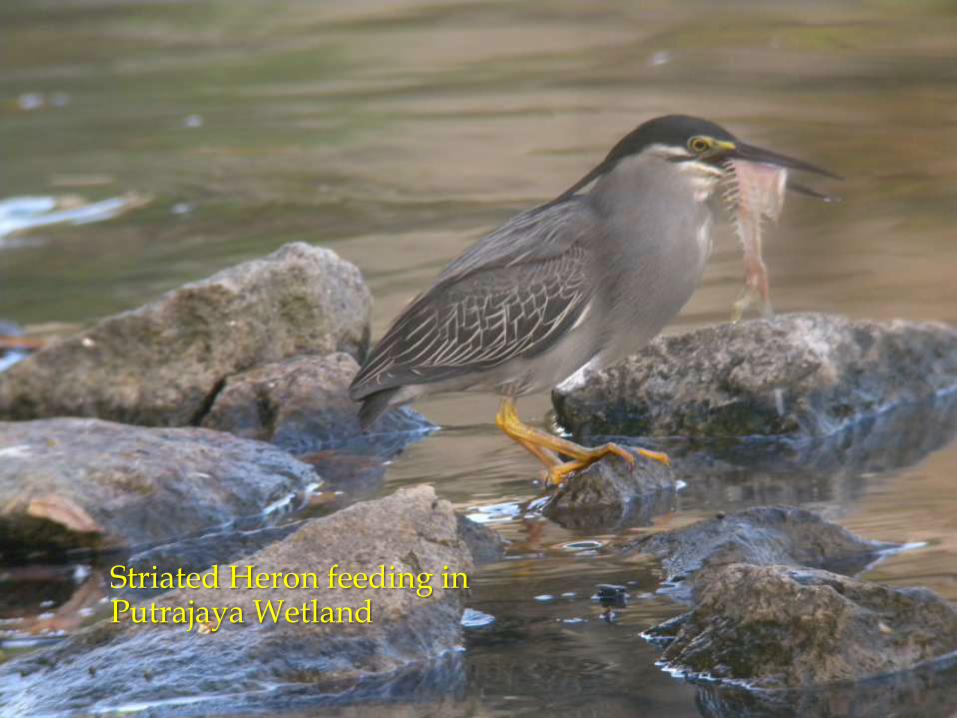
Striated Heron feeding in Putrajaya Wetland

82
Grey Heron nesting in Upper Bisa Wetland, Putrajaya
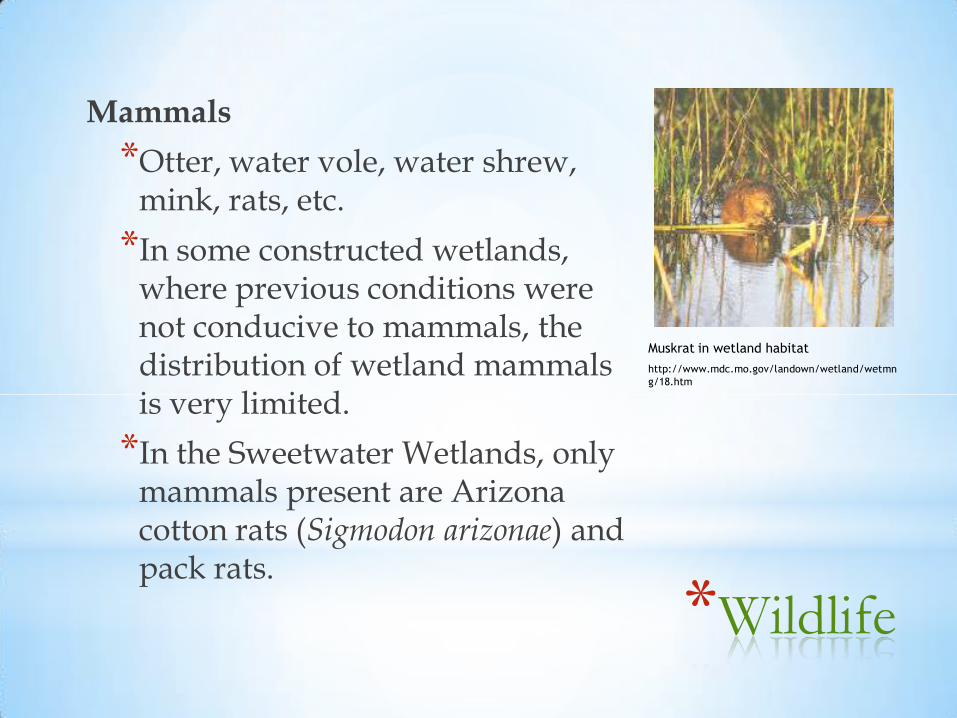
*Wildlife
Mammals
*Otter, water vole, water shrew, mink, rats, etc.
*In some constructed wetlands, where previous conditions were not conducive to mammals, the distribution of wetland mammals is very limited.
*In the Sweetwater Wetlands, only mammals present are Arizona cotton rats (Sigmodon arizonae) and pack rats.
Muskrat in wetland habitat
http://www.mdc.mo.gov/landown/wetland/wetmn
g/18.htm
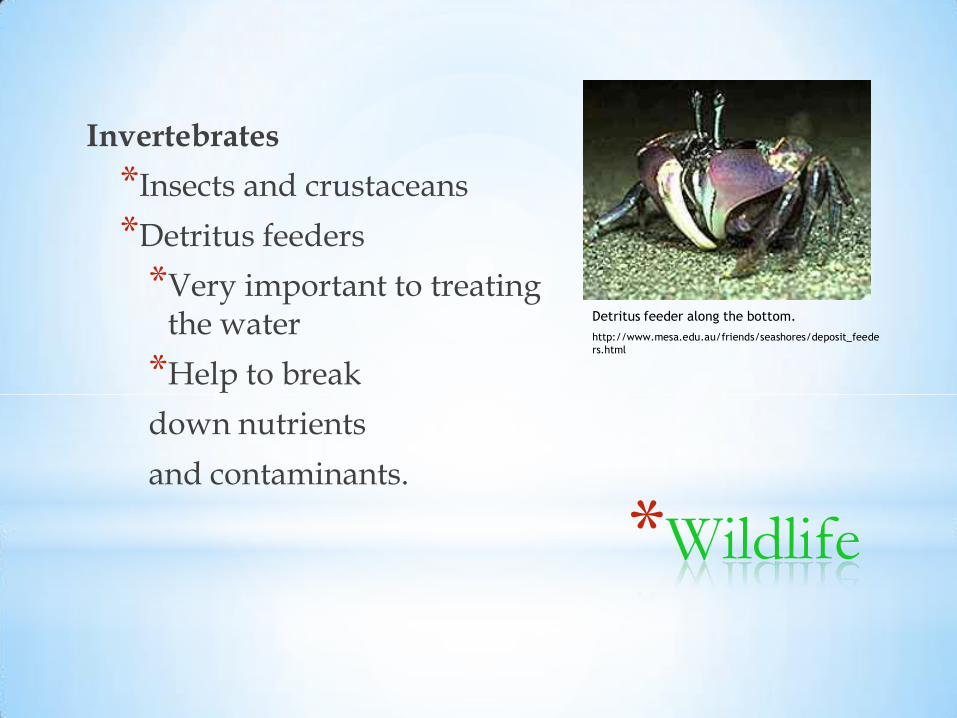
*Wildlife
Invertebrates
*Insects and crustaceans
*Detritus feeders
*Very important to treating the water
*Help to break
down nutrients
and contaminants.
Detritus feeder along the bottom.
http://www.mesa.edu.au/friends/seashores/deposit_feede
rs.html

Putrajaya - Diversity of Terrestrial Fauna
Odonata larvae rely on precise water temperature, good oxygen level and unpolluted water to survive. This sensitivity means that dragonflies and damselflies are important bio indicators of good water quality.
Fauna 1995 (EIA)
2007 (Baseline)
2010 2011 2012 2013
Inventory data up to
2013
Insects - 21 21 343 445 767 1124*
Amphibians - 2 5 5 8 13 13
Reptiles - 5 4 15 15 14 19
Mammals 24 7 5 8 11 9 11
*no of insect morphospecies

*
*Submergent – Plants that grow entirely under water. Most are rooted at the bottom and some may have flowers that extend above the water surface.
*Floating-leaved – Plants rooted to the bottom with leaves that float on the water surface. Flowers are normally above water.
*Free Floating – Plants not rooted to the bottom and float on the surface.
*Emergent – herbaceous or woody plants that have the majority of their vegetative parts above the surface of the water.

Water Hyacinths Eichhornia crassipes
Forage Kochia Kochia spp
Poplar Trees Populus spp
Willow Trees Salix spp
Alfalfa Medicago sativa
Cattail Typha latifolia
Coontail Ceratophyllum demersvm L
Bullrush Scirpus spp
Reed Phragmites spp.
American pondweed Potamogeton nodosus
Common Arrowhead Sagittaria latifolia
*

*
*“A major effect of [wastewater] treatment with plants was elimination of the disturbing smell …”
c
• Water Hyacinth – Heavy Metals
Cattail, Reed – Nitrogen, TSS, BOD, COD
Degradation
Releases

Hydrilla
Coontail
Parrotfeather

Floating-Leaved Plants

Free Floating Plants

Emergent Plants

Wetlands for Water Quality
*Cyperus papyrus commonly known papyrus

Wetlands for Water Quality
Miscanthidium violaceum
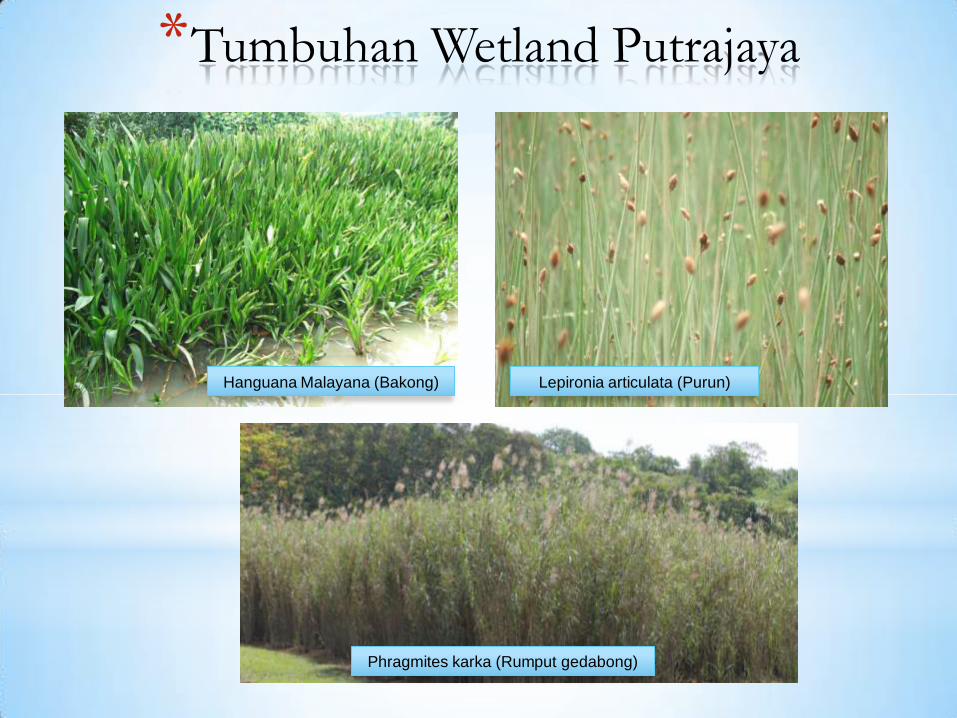
Hanguana Malayana (Bakong) Lepironia articulata (Purun)
Phragmites karka (Rumput gedabong)
*Tumbuhan Wetland Putrajaya

*Tumbuhan Wetland Putrajaya
Rhynchospora corymbosa (Rumput sendayan) Typha angustifolia (Lembang)
Eriocaulan longifolium (Rumput butang)
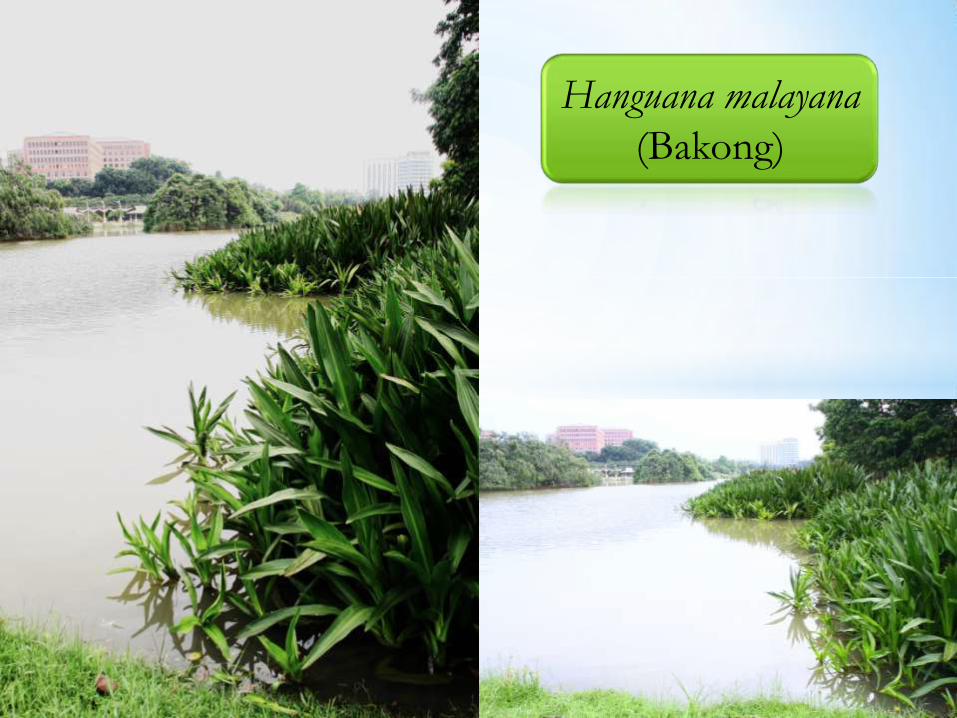
Hanguana malayana
(Bakong)

Lepironia articulata
(Purun)

Phragmites karka
(Rumput gedabong)

Special Adaptations

Biological
Parameter
2010 2011 2012 2013
Fitoplankton (H')
(J')
3.5 - 4.0
0.7 – 0.9 2.6 - 3.1 0.7 - 0.8
1.8 - 2.8 0.5 - 0.8
1.7 - 2.3 0.5 - 0.7
Zooplankton (H')
(J')
-
- 1.4 - 1.8 0.6 - 0.7
1.4 - 1.9 0.5 - 0.7
1.5 - 2.3 0.6 - 0.8
Bentos (H')
(J')
0.95 – 2.07
0.81 – 0.97 1.1 - 1.4 0.7 - 0.8
1.0 - 1.6 0.5 - 0.9
1.1 - 1.5 0.8 - 0.9
Serangga (H')
(J')
-
-
-
80% minima 0.5
4.9 – 5.5
0.96 – 0.97
5.4 – 5.9
0.96 – 0.97
Burung (H')
(J')
-
-
-
80% minima 0.5
1.8 -3.5
0.93 – 0.97
1.8 – 3.5
0.5 – 0.9
Reptilia (H')
(J')
-
-
-
80% minima 0.5
0.6 – 1.1
0.8 – 0.9
0.6 – 1.4
0.6 – 0.9
Amfibia (H')
(J')
-
-
-
80% minima 0.5
0.7 – 1.6
0.92 – 0.99
1.1 – 1.8
0.5 – 0.9
Mamalia (H')
(J')
-
-
-
80% minima 0.5
1.2 – 1.6
0.89 – 0.96
0.2 – 1.4
0.3 – 0.8
ZII Vegetation (H')
(J')
0.78 – 1.42
0.69 – 0.87
-
-
-
-
-
-
Wetland
Vegetation
(H')
(J')
0.05 – 0.48
0.09 – 0.48
-
-
-
-
-
-
Putrajaya - Diversity Index
H’ = Diversity Index J’ = Evenness

102
103
Why do we need water?
Water under pressure
Wetlands – a solution
Types of Wetlands
Importance of Wetlands
i. Physical/Hydrological Functions of
Wetlands
ii. Chemical Functions of Wetlands
iii. Wetland: water treatment processes
iv. Biological Functions of Wetlands
v. Ecosystem Services
Usage of habitat creation
*Presentation Outline
*Importance Of
Wetlands 104
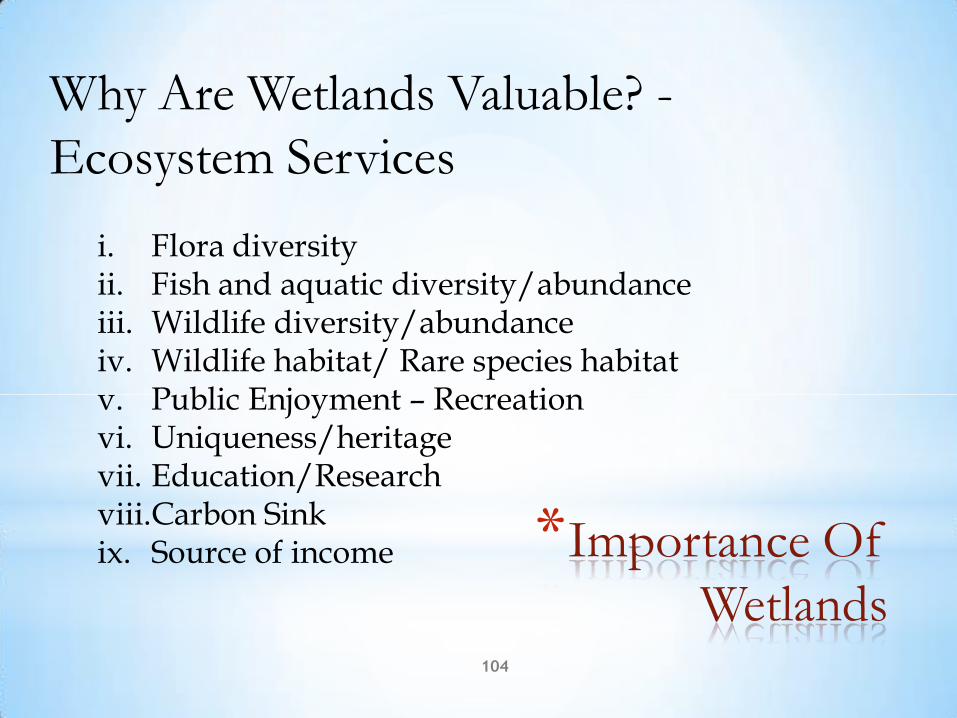
Why Are Wetlands Valuable? -
Ecosystem Services
i. Flora diversity ii. Fish and aquatic diversity/abundance iii. Wildlife diversity/abundance iv. Wildlife habitat/ Rare species habitat v. Public Enjoyment – Recreation vi. Uniqueness/heritage vii. Education/Research viii.Carbon Sink ix. Source of income

105
*

Ecosystem
services Economic values Social values
Ecological
values Recharge of
groundwater Fundamental function for the maintenance of all other
ecological
processes Prevention of
dust/salt transport
by wind
Protection of irrigation
schemes living conditions /
health
Maintenance of
biological
diversity
genetic reservoirs
(wild
ancestors / medicinal)
Many red listed /
threatened species
Fish spawning
/nursing fisheries and canning
plant survival aquatic
organisms. Pastures cattle raising
Reedlands processing industry
Water supply agriculture,
aquaculture
Muskrat,
waterfowl, Fur & meat industry
Local hunting
(meat /skins)
Liquorice and
other wood
resources
Liquorice roots for
export.
Dried plants for
fodder.
Fire and
construction
wood for local
use.

Regulating services: "benefits obtained from the regulation of ecosystem processes" [12]
• carbon sequestration and climate regulation
• waste decomposition and detoxification
• purification of water and air • crop pollination • pest and disease control
ECOLOGICAL VALUES
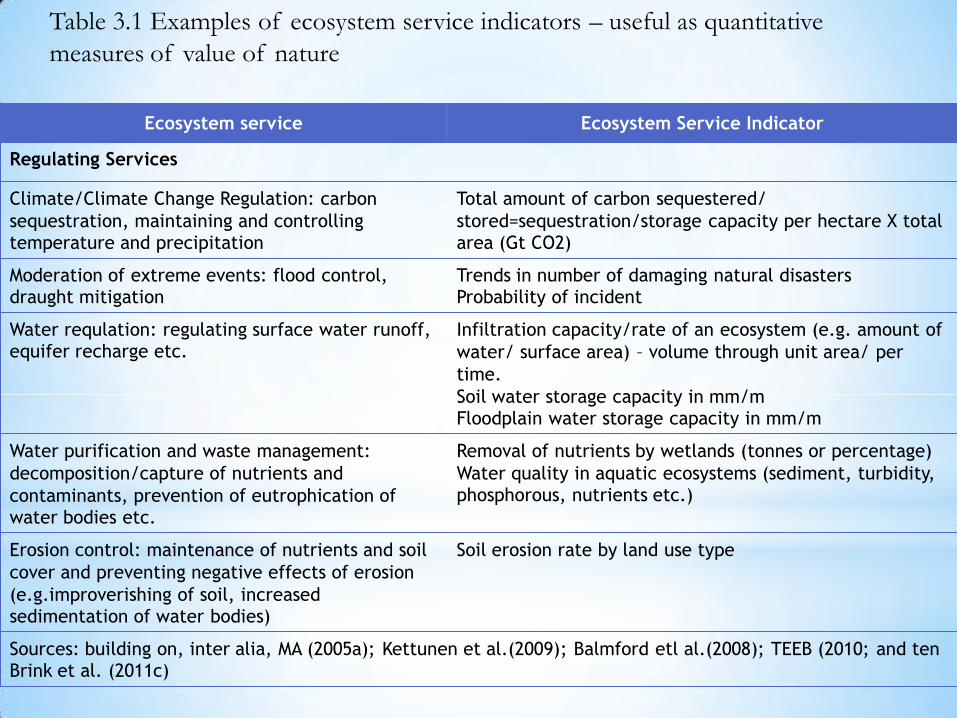
Ecosystem service Ecosystem Service Indicator
Regulating Services
Climate/Climate Change Regulation: carbon
sequestration, maintaining and controlling temperature and precipitation
Total amount of carbon sequestered/
stored=sequestration/storage capacity per hectare X total area (Gt CO2)
Moderation of extreme events: flood control, draught mitigation
Trends in number of damaging natural disasters Probability of incident
Water requlation: regulating surface water runoff, equifer recharge etc.
Infiltration capacity/rate of an ecosystem (e.g. amount of
water/ surface area) – volume through unit area/ per
time.
Soil water storage capacity in mm/m Floodplain water storage capacity in mm/m
Water purification and waste management:
decomposition/capture of nutrients and
contaminants, prevention of eutrophication of water bodies etc.
Removal of nutrients by wetlands (tonnes or percentage)
Water quality in aquatic ecosystems (sediment, turbidity, phosphorous, nutrients etc.)
Erosion control: maintenance of nutrients and soil
cover and preventing negative effects of erosion
(e.g.improverishing of soil, increased sedimentation of water bodies)
Soil erosion rate by land use type
Sources: building on, inter alia, MA (2005a); Kettunen et al.(2009); Balmford etl al.(2008); TEEB (2010; and ten Brink et al. (2011c)
Table 3.1 Examples of ecosystem service indicators – useful as quantitative
measures of value of nature

Cultural services: "nonmaterial benefits people obtain from ecosystems through spiritual enrichment, cognitive development, reflection, recreation, and aesthetic experiences" [12]
• cultural, intellectual and spiritual inspiration
• recreational experiences (including ecotourism)
• scientific discovery
SOCIAL VALUES

Ecosystem service Ecosystem Service Indicator
Cultural and Social Services
Landscape and amenity values: amenity of the
ecosystem, cultural diversity and identity,
spiritual values, cultural heritage values etc.
Changes in the number of residents and real
estate values
Number of visitors to sites per year
Amount of natur tourism
Total number of educational excursions at a
site
Number of Tv programmes, studies, books etc.
featuring sites and the suurounding area Number of scientific publications and patents
Ecotourism and recreation: hiking, camping,
nature walks, jogging, skiing, canoeing, rafting,
recreational fishing, diving, animal watching
etc.
Cultural values and inspirational services, e.g.
education, art and research
Sources: building on, inter alia, MA (2005a); Kettunen et al.(2009); Balmford etl al.(2008); TEEB (2010; and ten Brink et al. (2011c)
Table 3.1 Examples of ecosystem service indicators – useful as
quantitative measures of value of nature

• sightseeing via boat
• lake cruising • fishing • bird watching • walking • cycling • jogging
An attraction for recreational activities

Provisioning services: "products obtained from ecosystems" [12]
• food (including seafood and game), crops, wild foods, and spices
• water • minerals (including diatomite) • pharmaceuticals, biochemicals, and
industrial products • energy (hydropower, biomass fuels)
ECONOMIC VALUES
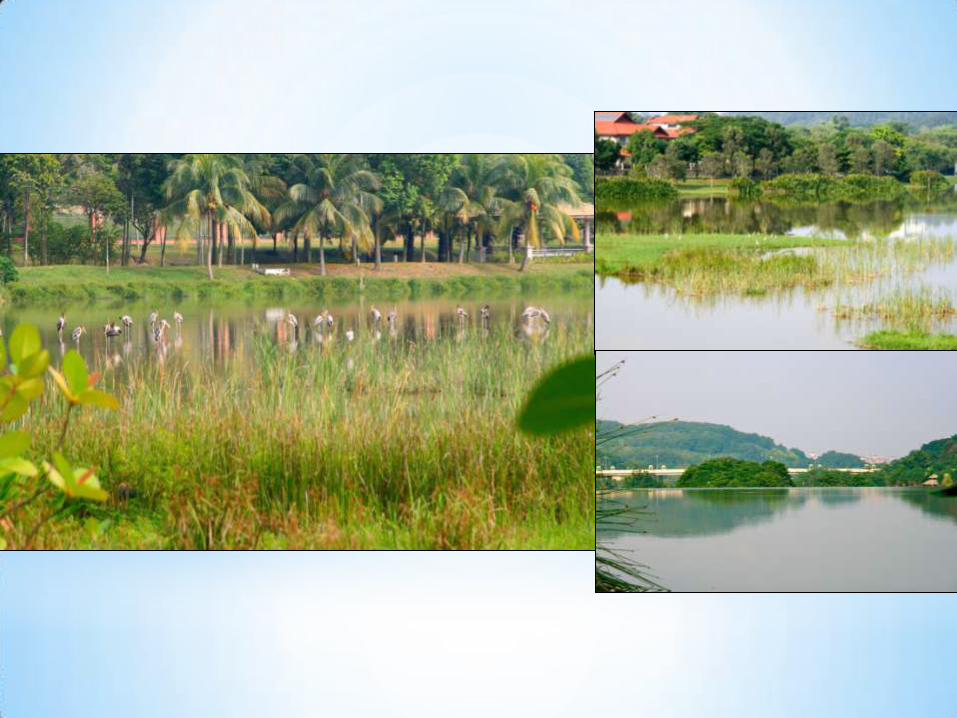
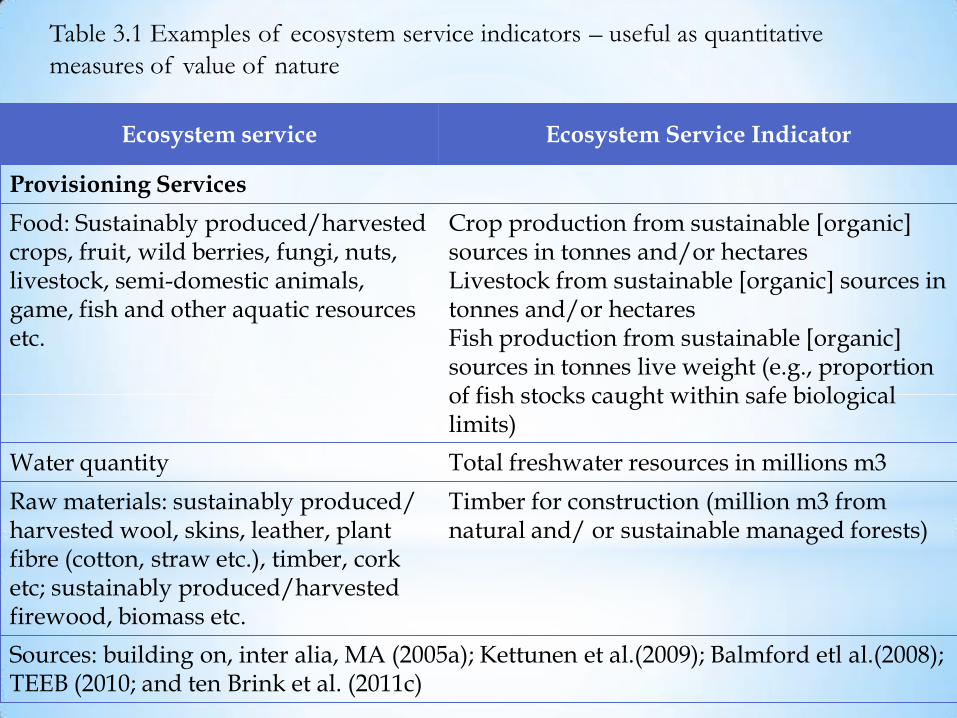
Table 3.1 Examples of ecosystem service indicators – useful as quantitative
measures of value of nature
Ecosystem service Ecosystem Service Indicator
Provisioning Services
Food: Sustainably produced/harvested crops, fruit, wild berries, fungi, nuts, livestock, semi-domestic animals, game, fish and other aquatic resources etc.
Crop production from sustainable [organic] sources in tonnes and/or hectares Livestock from sustainable [organic] sources in tonnes and/or hectares Fish production from sustainable [organic] sources in tonnes live weight (e.g., proportion of fish stocks caught within safe biological limits)
Water quantity Total freshwater resources in millions m3
Raw materials: sustainably produced/ harvested wool, skins, leather, plant fibre (cotton, straw etc.), timber, cork etc; sustainably produced/harvested firewood, biomass etc.
Timber for construction (million m3 from natural and/ or sustainable managed forests)
Sources: building on, inter alia, MA (2005a); Kettunen et al.(2009); Balmford etl al.(2008); TEEB (2010; and ten Brink et al. (2011c)
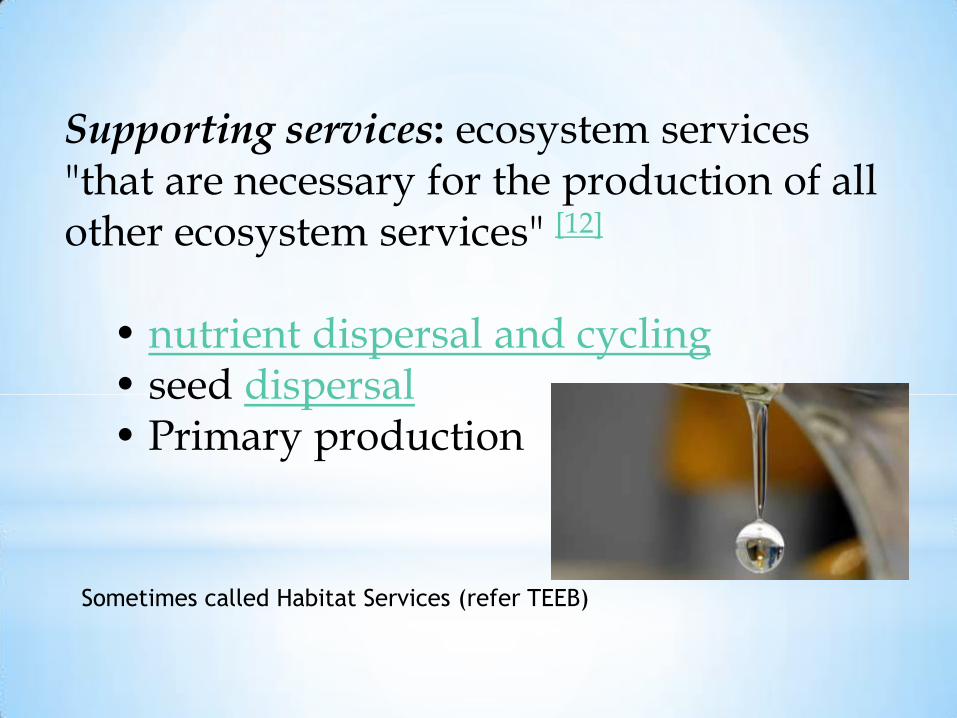
Supporting services: ecosystem services "that are necessary for the production of all other ecosystem services" [12]
• nutrient dispersal and cycling • seed dispersal • Primary production
Sometimes called Habitat Services (refer TEEB)

116
*

*Educational activities
*Education Outreach
*Schools, k-12 +
*Internships
*Research
*Recreation
*Walking Trail
*Birding
Upper West Wetland
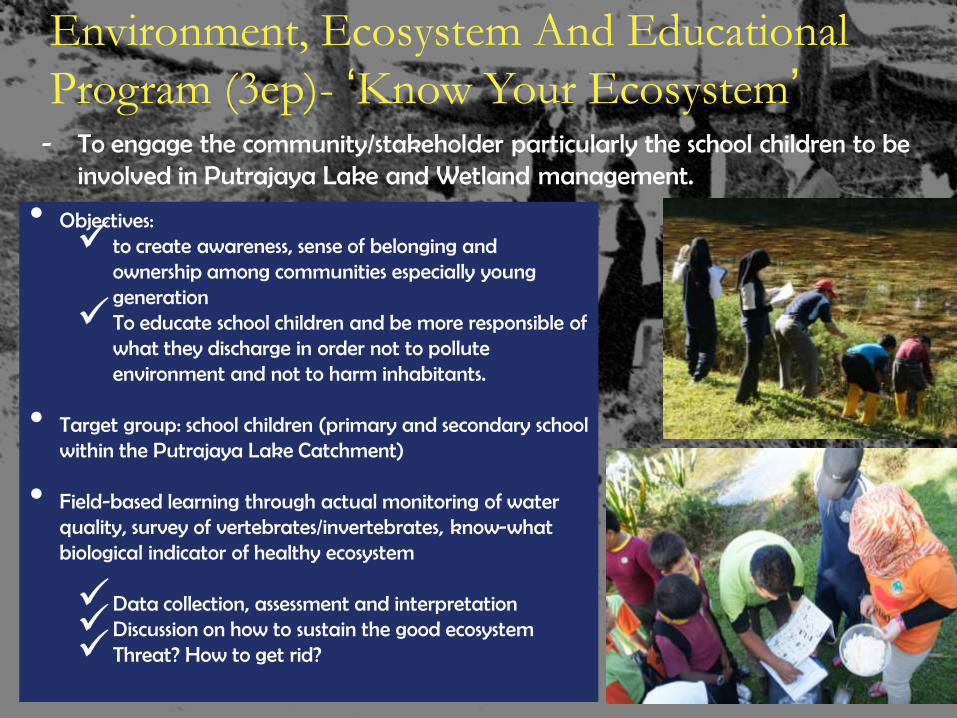
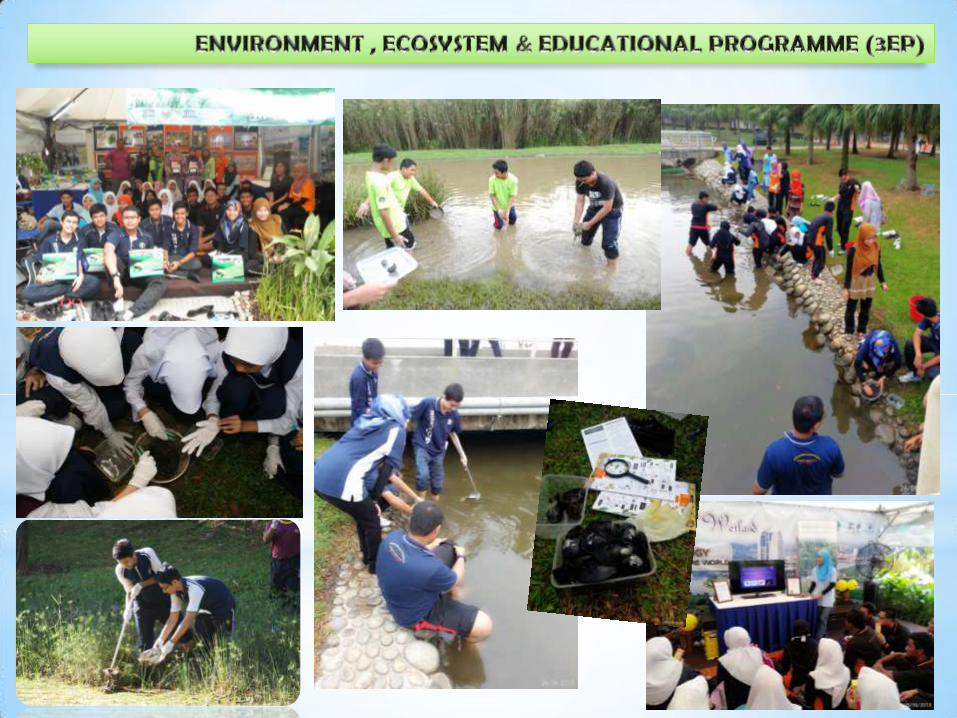
Environment, Ecosystem And Educational
Program (3ep)- ‘Know Your Ecosystem’
• Objectives: to create awareness, sense of belonging and
ownership among communities especially young generation
To educate school children and be more responsible of what they discharge in order not to pollute environment and not to harm inhabitants.
• Target group: school children (primary and secondary school
within the Putrajaya Lake Catchment) • Field-based learning through actual monitoring of water
quality, survey of vertebrates/invertebrates, know-what biological indicator of healthy ecosystem
Data collection, assessment and interpretation Discussion on how to sustain the good ecosystem Threat? How to get rid?
- To engage the community/stakeholder particularly the school children to be involved in Putrajaya Lake and Wetland management.


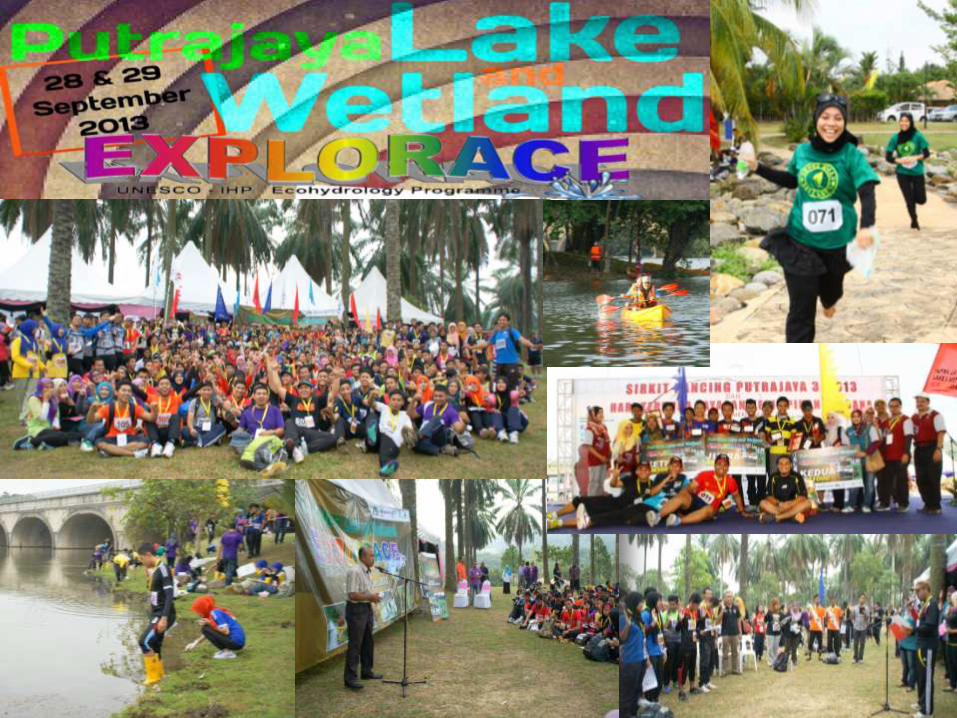

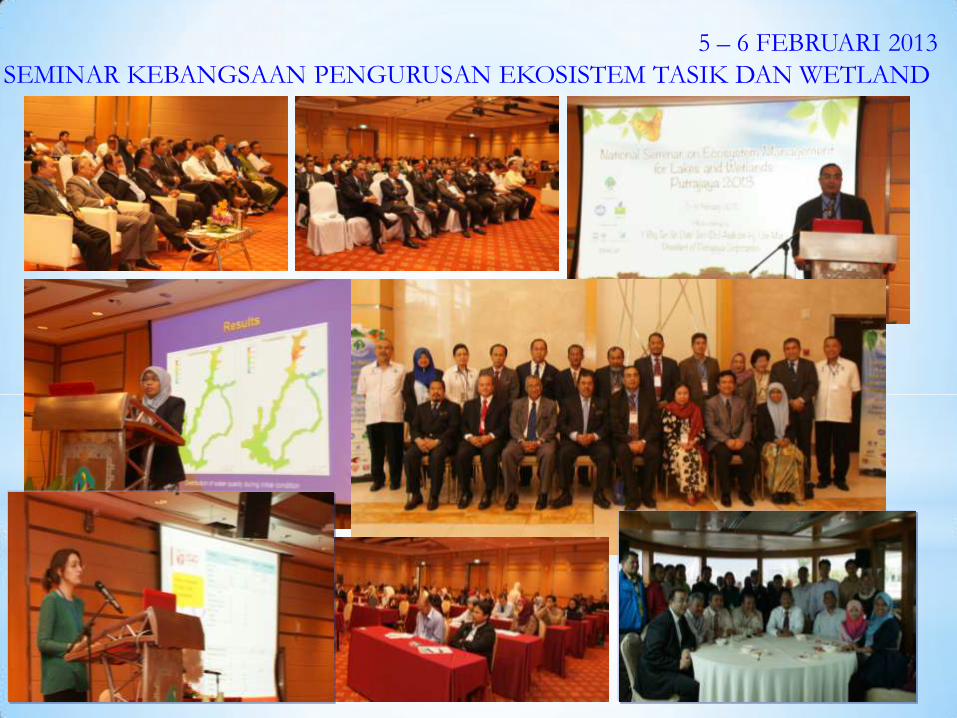
5 – 6 FEBRUARI 2013
SEMINAR KEBANGSAAN PENGURUSAN EKOSISTEM TASIK DAN WETLAND
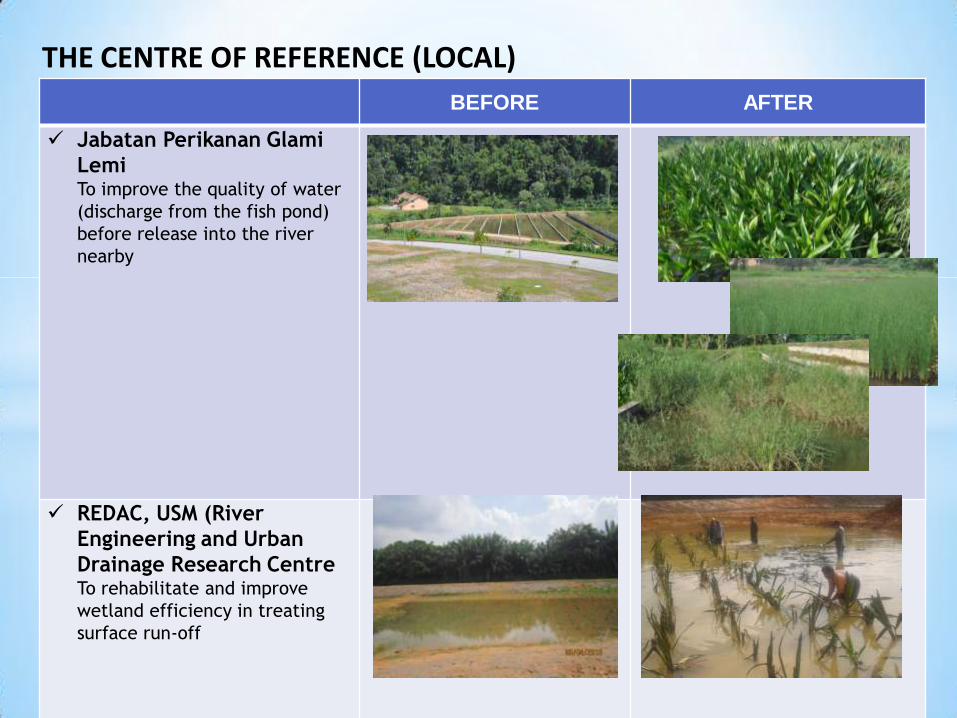
BEFORE AFTER
Jabatan Perikanan Glami
Lemi To improve the quality of water
(discharge from the fish pond)
before release into the river
nearby
REDAC, USM (River
Engineering and Urban
Drainage Research Centre To rehabilitate and improve
wetland efficiency in treating
surface run-off
-
THE CENTRE OF REFERENCE (LOCAL)
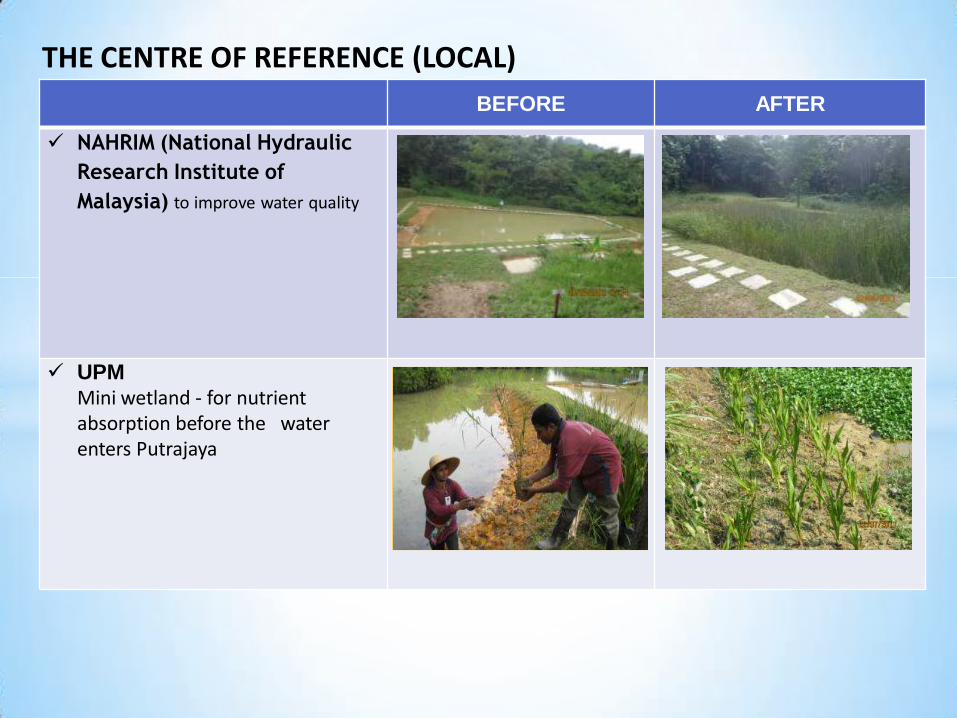
BEFORE AFTER
NAHRIM (National Hydraulic
Research Institute of
Malaysia) to improve water quality
UPM Mini wetland - for nutrient absorption before the water enters Putrajaya
THE CENTRE OF REFERENCE (LOCAL)

THE CENTRE OF REFERENCE (INTERNATIONAL)
King Soud University, Riyard, Kingdom of Saudi
Arabia, 2012 Long Term Ecological Research East Asia Pacific Region 2012 participants
University of Lubljana, Slovenia, 2012
Korea Water Resources Association
Public Utilities Board, Singapore, 2010
Delegations from Thailand
Suwon City Council, Korea, 2010
* Remember….
A conducive wetland
surrounding starts from..…
You!
TERIMA KASIH
THANK YOU